| For the month of: | August 2023 | Commission File Number: | 1-8481 | ||||||||
|
BCE Inc.
|
|||||
| By: | (signed) Glen LeBlanc | ||||
| Glen LeBlanc Executive Vice-President and Chief Financial Officer |
|||||
| Date: | August 3, 2023 | ||||
Exhibit 99.1
MD&A
Management’s discussion and analysis
Table of contents
| 1 |
Overview | 6 | ||||||
| 1.1 | Financial highlights | 6 | ||||||
| 1.2 | Key corporate and business developments | 8 | ||||||
| 1.3 | Assumptions | 9 | ||||||
| 2 |
Consolidated financial analysis | 10 | ||||||
| 2.1 | BCE consolidated income statements | 10 | ||||||
| 2.2 | Customer connections | 11 | ||||||
| 2.3 | Operating revenues | 12 | ||||||
| 2.4 | Operating costs | 13 | ||||||
| 2.5 | Net earnings | 14 | ||||||
| 2.6 | Adjusted EBITDA | 14 | ||||||
| 2.7 | Severance, acquisition and other costs | 15 | ||||||
| 2.8 | Depreciation and amortization | 15 | ||||||
| 2.9 | Finance costs | 15 | ||||||
| 2.10 | Impairment of assets | 15 | ||||||
| 2.11 | Other expense | 16 | ||||||
| 2.12 | Income taxes | 16 | ||||||
| 2.13 | Net earnings attributable to common shareholders and EPS | 16 | ||||||
| 3 |
Business segment analysis | 17 | ||||||
| 3.1 | Bell CTS | 17 | ||||||
| 3.2 | Bell Media | 24 | ||||||
| 4 |
Financial and capital management | 27 | ||||||
| 4.1 | Net debt | 27 | ||||||
| 4.2 | Outstanding share data | 27 | ||||||
| 4.3 | Cash flows | 28 | ||||||
| 4.4 | Post-employment benefit plans | 30 | ||||||
| 4.5 | Financial risk management | 31 | ||||||
| 4.6 | Credit ratings | 33 | ||||||
| 4.7 | Liquidity | 33 | ||||||
| 4.8 | Litigation | 33 | ||||||
| 5 |
Quarterly financial information | 34 | ||||||
| 6 |
Regulatory environment | 35 | ||||||
| 7 |
Accounting policies | 36 | ||||||
| 8 |
Non-GAAP financial measures, other financial measures and key performance indicators (KPIs) | 37 | ||||||
| 8.1 | Non-GAAP financial measures | 37 | ||||||
| 8.2 | Non-GAAP ratios | 40 | ||||||
| 8.3 | Total of segments measures | 40 | ||||||
| 8.4 | Capital management measures | 41 | ||||||
| 8.5 | Supplementary financial measures | 42 | ||||||
| 8.6 | KPIs | 42 | ||||||
| 9 |
Controls and procedures | 43 | ||||||
MD&A
Management’s discussion and analysis
In this management’s discussion and analysis (MD&A), we, us, our, BCE and the company mean, as the context may require, either BCE Inc. or, collectively, BCE Inc., Bell Canada, their subsidiaries, joint arrangements and associates. Bell means, as the context may require, either Bell Canada or, collectively, Bell Canada, its subsidiaries, joint arrangements and associates.
All amounts in this MD&A are in millions of Canadian dollars, except where noted. Please refer to section 8, Non-GAAP financial measures, other financial measures and key performance indicators (KPIs) for a list of defined non-GAAP financial measures, other financial measures and KPIs.
Please refer to BCE’s unaudited consolidated financial statements for the second quarter of 2023 (Q2 2023 Financial Statements) when reading this MD&A. We also encourage you to read BCE’s MD&A for the year ended December 31, 2022 dated March 2, 2023 (BCE 2022 Annual MD&A) as updated in BCE’s MD&A for the first quarter of 2023 dated May 3, 2023 (BCE 2023 First Quarter MD&A). In preparing this MD&A, we have taken into account information available to us up to August 2, 2023, the date of this MD&A, unless otherwise stated.
You will find additional information relating to BCE, including BCE’s annual information form for the year ended December 31, 2022 dated March 2, 2023 (BCE 2022 AIF) and recent financial reports, including the BCE 2022 Annual MD&A and the BCE 2023 First Quarter MD&A, on BCE’s website at BCE.ca, on SEDAR+ at sedarplus.ca and on EDGAR at sec.gov.
Documents and other information contained in BCE’s website or in any other site referred to in BCE’s website or in this MD&A are not part of this MD&A and are not incorporated by reference herein.
This MD&A comments on our business operations, performance, financial position and other matters for the three months (Q2) and six months (YTD) ended June 30, 2023 and 2022.
Caution regarding forward-looking statements
This MD&A and, in particular, but without limitation, section 1.2, Key corporate and business developments, the section and sub-sections entitled Assumptions and section 4.7, Liquidity, contain forward-looking statements. These forward-looking statements include, without limitation, statements relating to the expectation that our available liquidity, 2023 estimated cash flows from operations and capital markets financing will permit us to meet our cash requirements in 2023, our environmental, social and governance (ESG) objectives, including our plan to achieve our science-based target (SBT) for operational greenhouse gas (GHG) emissions (Scope 1 and 2) reduction by 2030, BCE’s business outlook, objectives, plans and strategic priorities, and other statements that do not refer to historical facts. A statement we make is forward-looking when it uses what we know and expect today to make a statement about the future. Forward-looking statements are typically identified by the words assumption, goal, guidance, objective, outlook, project, strategy, target, commitment and other similar expressions or future or conditional verbs such as aim, anticipate, believe, could, expect, intend, may, plan, seek, should, strive and will. All such forward-looking statements are made pursuant to the safe harbour provisions of applicable Canadian securities laws and of the United States (U.S.) Private Securities Litigation Reform Act of 1995.
Unless otherwise indicated by us, forward-looking statements in this MD&A describe our expectations as at August 2, 2023 and, accordingly, are subject to change after that date. Except as may be required by applicable securities laws, we do not undertake any obligation to update or revise any forward-looking statements, whether as a result of new information, future events or otherwise.
Forward-looking statements, by their very nature, are subject to inherent risks and uncertainties and are based on several assumptions, both general and specific, which give rise to the possibility that actual results or events could differ materially from our expectations expressed in, or implied by, such forward-looking statements and that our business outlook, objectives, plans and strategic priorities may not be achieved. These statements are not guarantees of future performance or events, and we caution you against relying on any of these forward-looking statements. Forward-looking statements are presented in this MD&A for the purpose of assisting investors and others in understanding our objectives, strategic priorities and business outlook as well as our anticipated operating environment. Readers are cautioned, however, that such information may not be appropriate for other purposes.
We have made certain economic, market, operational and other assumptions in preparing the forward-looking statements contained in this MD&A and, in particular, but without limitation, the forward-looking statements contained in the previously mentioned sections of this MD&A. These assumptions include, without limitation, the assumptions described in the section and sub-sections of this MD&A entitled Assumptions, which section and sub-sections are incorporated by reference in this cautionary statement. Subject to various factors including, without limitation, the future impacts of general economic conditions and of geopolitical events, which are difficult to predict, we believe that our assumptions were reasonable at August 2, 2023. If our assumptions turn out to be inaccurate, our actual results could be materially different from what we expect.
Important risk factors that could cause actual results or events to differ materially from those expressed in, or implied by, the previously-mentioned forward-looking statements and other forward-looking statements contained in this MD&A, include, but are not limited to: the negative effect of adverse economic conditions, including a potential recession, and related inflationary cost pressures, higher interest rates and financial and capital market volatility; the negative effect of adverse conditions associated with geopolitical events; a declining level of business and consumer spending, and the resulting negative impact on the demand for, and prices of, our products and services; regulatory initiatives, proceedings and decisions, government consultations and government positions that affect us and influence our business including, without limitation, concerning mandatory access to networks, spectrum auctions, the imposition of consumer-related codes of conduct, approval of acquisitions, broadcast and spectrum licensing, foreign ownership requirements, privacy and cybersecurity obligations and control of copyright piracy; the inability to implement enhanced compliance frameworks and to comply with legal and regulatory obligations; unfavourable resolution of legal proceedings; the intensity of competitive activity and the failure to effectively respond to evolving competitive dynamics; the combination of Rogers Communications Inc. and Shaw Communications Inc. creating a Canadian competitor with larger scale, and the acquisition of Freedom Mobile by Vidéotron Ltd. also increasing its scale with a likely change in competitive dynamics in several provinces; the level of technological substitution and the presence of alternative service providers contributing to disruptions and disintermediation in each of our business segments; changing customer behaviour and the expansion of cloud-based, over-the-top (OTT) and other alternative solutions; advertising market pressures from economic conditions, fragmentation and non-traditional/global digital services; rising content costs and challenges in our ability to acquire or develop key content; higher Canadian smartphone penetration and reduced or slower immigration flow; the inability to protect our physical and non-physical assets from events such as information security attacks, unauthorized access or entry, fire and natural disasters; the failure to implement effective data governance; the failure to evolve and transform our networks, systems and
| 4 | BCE INC. 2023 SECOND QUARTER SHAREHOLDER REPORT |
MD&A
operations using next-generation technologies while lowering our cost structure; the inability to drive a positive customer experience; the failure to attract, develop and retain a diverse and talented team capable of furthering our strategic imperatives; the failure to adequately manage health and safety concerns; labour disruptions and shortages; the failure to maintain operational networks; the risk that we may need to incur significant capital expenditures to provide additional capacity and reduce network congestion; the inability to maintain service consistency due to network failures or slowdowns, the failure of other infrastructure, or disruptions in the delivery of services; service interruptions or outages due to legacy infrastructure and the possibility of instability as we transition towards converged wireline and wireless networks and newer technologies; the failure by us, or by other telecommunications carriers on which we rely to provide services, to complete planned and sufficient testing, maintenance, replacement or upgrade of our or their networks, equipment and other facilities, which could disrupt our operations including through network or other infrastructure failures; events affecting the functionality of, and our ability to protect, test, maintain, replace and upgrade, our networks, information technology (IT) systems, equipment and other facilities; the complexity of our operations; the failure to implement or maintain highly effective processes and IT systems; in-orbit and other operational risks to which the satellites used to provide our satellite television (TV) services are subject; our dependence on third-party suppliers, outsourcers, and consultants to provide an uninterrupted supply of the products and services we need; the failure of our vendor selection, governance and oversight processes, including our management of supplier risk in the areas of security, data governance and responsible procurement; the quality of our products and services and the extent to which they may be subject to defects or fail to comply with applicable government regulations and standards; reputational risks and the inability to meaningfully integrate ESG considerations into our business strategy and operations; the failure to take appropriate actions to adapt to current and emerging environmental impacts, including climate change; pandemics, epidemics and other health risks, including health concerns about radio frequency emissions from wireless communications devices and equipment; the inability to adequately manage social issues; the failure to develop and implement strong corporate governance practices; various internal and external factors could challenge our ability to achieve our ESG targets including, without limitation, those related to GHG emissions reduction and diversity, equity, inclusion and belonging; the inability to access adequate sources of capital and generate sufficient cash flows from operating activities to meet our cash requirements, fund capital expenditures and provide for planned growth; uncertainty as to whether dividends will be declared by BCE’s board of directors or whether the dividend on common shares will be increased; the inability to manage various credit, liquidity and market risks; the failure to reduce costs, as well as unexpected increases in costs; the failure to evolve practices to effectively monitor and control fraudulent activities; new or higher taxes due to new tax laws or changes thereto or in the interpretation thereof, and the inability to predict the outcome of government audits; the impact on our financial statements and estimates from a number of factors; and pension obligation volatility and increased contributions to post-employment benefit plans.
We caution that the foregoing list of risk factors is not exhaustive and other factors could also materially adversely affect us. Please see section 9, Business risks of the BCE 2022 Annual MD&A for a more complete description of the above-mentioned and other risks, which section, and the other sections of the BCE 2022 Annual MD&A referred to therein, are incorporated by reference in this cautionary statement. In addition, please see section 4.8, Litigation in this MD&A for an update to the legal proceedings described in the BCE 2022 AIF, which section 4.8 is incorporated by reference in this cautionary statement. Please also see section 6, Regulatory environment in the BCE 2023 First Quarter MD&A and in this MD&A for an update to the regulatory initiatives and proceedings described in the BCE 2022 Annual MD&A, which sections 6 are incorporated by reference in this cautionary statement. Please also see section 7, Competitive environment in the BCE 2023 First Quarter MD&A for an update to the risk factors relating to our competitive environment described in the BCE 2022 Annual MD&A, which section 7 is incorporated by reference in this cautionary statement. Any of those risks could cause actual results or events to differ materially from our expectations expressed in, or implied by, the forward-looking statements set out in this MD&A. Except for the updates set out in section 6, Regulatory environment and in section 7, Competitive environment of the BCE 2023 First Quarter MD&A, as well as in section 4.8, Litigation and in section 6, Regulatory environment in this MD&A, the risks described in the BCE 2022 Annual MD&A remain substantially unchanged.
Forward-looking statements contained in this MD&A for periods beyond 2023 involve longer-term assumptions and estimates than forward-looking statements for 2023 and are consequently subject to greater uncertainty. In particular, our GHG emissions reduction targets are based on a number of assumptions including, without limitation, the following principal assumptions: implementation of various corporate and business initiatives to reduce our electricity and fuel consumption; no new corporate initiatives, business acquisitions, business divestitures or technologies that would materially change our anticipated levels of GHG emissions; our ability to purchase sufficient credible carbon credits and renewable energy certificates to offset or further reduce our GHG emissions, if and when required; no negative impact on the calculation of our GHG emissions from refinements in or modifications to international standards or the methodology we use for the calculation of such GHG emissions; and no required changes to our SBTs pursuant to the Science-Based Targets initiative (SBTi) methodology that would make the achievement of our updated SBTs more onerous or unachievable in light of business requirements.
Forward-looking statements for periods beyond 2023 further assume, unless otherwise indicated, that the risks described above and in section 9, Business risks of the BCE 2022 Annual MD&A will remain substantially unchanged during such periods, except for an assumed improvement in the risks related to the COVID-19 pandemic in future years.
Additional risks and uncertainties not currently known to us or that we currently deem to be immaterial may also have a material adverse effect on our business, financial condition, liquidity, financial results or reputation. We regularly consider potential acquisitions, dispositions, mergers, business combinations, investments, monetizations, joint ventures and other transactions, some of which may be significant. Except as otherwise indicated by us, forward-looking statements do not reflect the potential impact of any such transactions or of special items that may be announced or that may occur after August 2, 2023. The financial impact of these transactions and special items can be complex and depends on facts particular to each of them. We therefore cannot describe the expected impact in a meaningful way, or in the same way we present known risks affecting our business.
| 5 |
1 MD&A Overview
| 1 | Overview |
In 2022, we began modifying our internal and external reporting processes to align with organizational changes that were made to reflect an increasing strategic focus on multiproduct sales, the continually increasing technological convergence of our wireless and wireline telecommunications infrastructure and operations driven by the deployment of our Fifth Generation (5G) and fibre networks, and our digital transformation. These factors have made it increasingly difficult to distinguish between our wireless and wireline operations and resulted in changes in Q1 2023 to the financial information that is regularly provided to our chief operating decision maker to measure performance and allocate resources.
Effective with our Q1 2023 results, our previous Bell Wireless and Bell Wireline operating segments were combined to form a single reporting segment called Bell Communication and Technology Services (Bell CTS). Bell Media remains a distinct reportable segment and is unaffected. Our results are therefore reported in two segments: Bell CTS and Bell Media. As a result of our reporting changes, prior periods have been restated for comparative purposes.
| 1.1 | Financial highlights |
BCE Q2 2023 selected quarterly information
| Operating revenues | Net earnings | Adjusted EBITDA (1) | ||
| $6,066 | $397 | $2,645 | ||
| million | million | million | ||
| 3.5% vs. Q2 2022 | (39.3%) vs. Q2 2022 | 2.1% vs. Q2 2022 | ||
| Net earnings attributable | Adjusted net earnings (1) | Cash flows from | Free cash flow (1) | |||
| to common shareholders | operating activities | |||||
| $329 | $722 | $2,365 | $1,016 | |||
| million | million | million | million | |||
| (44.8%) vs. Q2 2022 | (8.7%) vs. Q2 2022 | (8.9%) vs. Q2 2022 | (23.8%) vs. Q2 2022 | |||
| BCE customer connections | ||||||
| Total mobile phones (3) | Retail high-speed | Retail TV (2) (5) | Retail residential network | |||
| Internet (2) (4) (5) | access services (NAS) lines (2) (5) | |||||
| +4.4% | +9.1% | — | (4.8%) | |||
| 10.0 million subscribers | 4.3 million subscribers | 2.7 million subscribers | 2.1 million subscribers | |||
| at June 30, 2023 | at June 30, 2023 | at June 30, 2023 | at June 30, 2023 | |||
| (1) | Adjusted EBITDA is a total of segments measure, and adjusted net earnings and free cash flow are non-GAAP financial measures. See section 8.3, Total of segments measures and section 8.1, Non-GAAP financial measures in this MD&A for more information on these measures. |
| (2) | In Q2 2023, our retail high-speed Internet, retail Internet protocol television (IPTV) and retail residential NAS lines subscriber bases increased by 35,080, 243 and 7,458 subscribers, respectively, as a result of small acquisitions. |
| (3) | In Q1 2023, we adjusted our mobile phone postpaid subscriber base to remove older non-revenue generating business subscribers of 73,229. |
| (4) | In Q1 2023, subsequent to a review of customer account records, our retail high-speed Internet subscriber base was reduced by 7,347 subscribers. |
| (5) | In Q4 2022, as a result of the acquisition of Distributel Communications Limited (Distributel), our retail high-speed Internet, retail IPTV and retail residential NAS lines subscriber bases increased by 128,065, 2,315 and 64,498 subscribers, respectively. |
| 6 | BCE INC. 2023 SECOND QUARTER SHAREHOLDER REPORT |
1 MD&A Overview
BCE income statements – selected information
| Q2 2023 | Q2 2022 | $ change | % change | YTD 2023 | YTD 2022 | $ change | % change | |||||||||||||||||||||||||
| Operating revenues |
||||||||||||||||||||||||||||||||
| Service |
5,303 | 5,233 | 70 | 1.3% | 10,525 | 10,410 | 115 | 1.1% | ||||||||||||||||||||||||
| Product |
763 | 628 | 135 | 21.5% | 1,595 | 1,301 | 294 | 22.6% | ||||||||||||||||||||||||
| Total operating revenues |
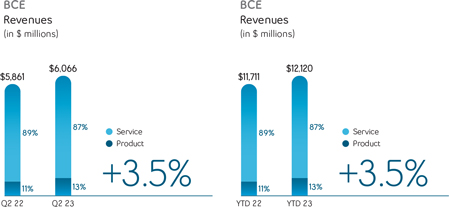
6,066 | 5,861 | 205 | 3.5% | 12,120 | 11,711 | 409 | 3.5% | ||||||||||||||||||||||||
| Operating costs |
(3,421 | ) | (3,271 | ) | (150 | ) | (4.6% | ) | (6,937 | ) | (6,537 | ) | (400 | ) | (6.1% | ) | ||||||||||||||||
| Adjusted EBITDA |
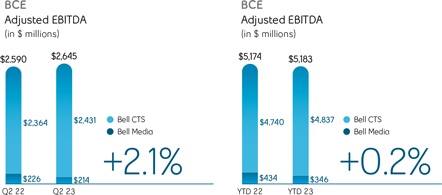
2,645 | 2,590 | 55 | 2.1% | 5,183 | 5,174 | 9 | 0.2% | ||||||||||||||||||||||||
| Adjusted EBITDA margin (1) |
43.6% | 44.2% | (0.6) pts | 42.8% | 44.2% | (1.4) pts | ||||||||||||||||||||||||||
| Net earnings attributable to: |
||||||||||||||||||||||||||||||||
| Common shareholders |
329 | 596 | (267 | ) | (44.8% | ) | 1,054 | 1,473 | (419 | ) | (28.4% | ) | ||||||||||||||||||||
| Preferred shareholders |
46 | 35 | 11 | 31.4% | 92 | 69 | 23 | 33.3% | ||||||||||||||||||||||||
|
Non-controlling interest |
22 | 23 | (1 | ) | (4.3% | ) | 39 | 46 | (7 | ) | (15.2% | ) | ||||||||||||||||||||
| Net earnings |
397 | 654 | (257 | ) | (39.3% | ) | 1,185 | 1,588 | (403 | ) | (25.4% | ) | ||||||||||||||||||||
| Adjusted net earnings |
722 | 791 | (69 | ) | (8.7% | ) | 1,494 | 1,602 | (108 | ) | (6.7% | ) | ||||||||||||||||||||
| Net earnings per common share (EPS) |
0.37 | 0.66 | (0.29 | ) | (43.9% | ) | 1.16 | 1.62 | (0.46 | ) | (28.4% | ) | ||||||||||||||||||||
| Adjusted EPS (2) |
0.79 | 0.87 | (0.08 | ) | (9.2% | ) | 1.64 | 1.76 | (0.12 | ) | (6.8% | ) | ||||||||||||||||||||
| (1) | Adjusted EBITDA margin is defined as adjusted EBITDA divided by operating revenues. |
| (2) | Adjusted EPS is a non-GAAP ratio. Refer to section 8.2, Non-GAAP ratios in this MD&A for more information on this measure. |
BCE statements of cash flows – selected information
| Q2 2023 | Q2 2022 | $ change | % change | YTD 2023 | YTD 2022 | $ change | % change | |||||||||||||||||||||||||
| Cash flows from operating activities |
2,365 | 2,597 | (232 | ) | (8.9% | ) | 3,612 | 4,313 | (701 | ) | (16.3% | ) | ||||||||||||||||||||
| Capital expenditures |
(1,307 | ) | (1,219 | ) | (88 | ) | (7.2% | ) | (2,393 | ) | (2,178 | ) | (215 | ) | (9.9% | ) | ||||||||||||||||
| Free cash flow |
1,016 | 1,333 | (317 | ) | (23.8% | ) | 1,101 | 2,049 | (948 | ) | (46.3% | ) | ||||||||||||||||||||
Q2 2023 financial highlights
BCE operating revenues grew by 3.5% in Q2 2023, compared to the same period last year, driven by higher product and service revenues of 21.5% and 1.3%, respectively. The increase in product revenues reflected higher wireless product revenues coupled with strong wireline product sales to large business customers. The growth in service revenues was led by higher wireless and Internet revenues, along with the contribution from various small acquisitions and greater media subscriber revenues, partly offset by ongoing erosion in voice and satellite TV revenues, as well as reduced media advertising revenues, as a result of the current economic uncertainty.
Net earnings and net earnings attributable to common shareholders in the second quarter of 2023 decreased by $257 million and $267 million, respectively, compared to the same period last year, mainly due to higher other expense, higher interest expense, higher severance, acquisition and other costs and higher income taxes, partly offset by lower impairment of assets and higher adjusted EBITDA.
BCE’s adjusted EBITDA increased by 2.1% in the quarter, compared to the same period last year, due to growth from our Bell CTS segment, moderated by a decline in our Bell Media segment. The year-over-year growth in adjusted EBITDA was attributable to greater operating revenues, partly offset by higher operating expenses, mainly from increased cost of goods sold and expenses related to the small acquisitions. This resulted in a corresponding adjusted EBITDA margin of 43.6% in Q2 2023, down 0.6 pts over the same period last year, due to a higher proportion of low-margin product sales in our total revenue base, along with increased operating costs, partly offset by service revenue flow-through.
BCE’s EPS of $0.37 in Q2 2023 decreased by $0.29 compared to the same period last year.
In the second quarter of 2023, adjusted net earnings, which excludes the impact of severance, acquisition and other costs, net mark-to-market gains (losses) on derivatives used to economically hedge equity settled share-based compensation plans, net equity gains (losses) on investments in associates and joint ventures, net gains (losses) on investments, early debt redemption costs and impairment of assets, net of tax and NCI, was $722 million, or $0.79 per common share, compared to $791 million, or $0.87 per common share, for the same period last year.
Cash flows from operating activities in the second quarter of 2023 decreased by $232 million, compared to the same period last year, mainly due to lower cash from working capital due in part to timing of supplier payments, higher interest paid and higher income taxes paid, partly offset by higher adjusted EBITDA.
Free cash flow in Q2 2023 decreased by $317 million, compared to the same period last year, due to lower cash flows from operating activities, excluding cash from acquisition and other costs paid, and higher capital expenditures.
| 7 |
1 MD&A Overview
| 1.2 | Key corporate and business developments |
This section contains forward-looking statements, including relating to our ESG objectives. Refer to the section Caution regarding forward-looking statements at the beginning of this MD&A.
Curtis Millen to become Chief Financial Officer
On May 4, 2023, BCE announced that Glen LeBlanc, Executive Vice President and Chief Financial Officer of BCE and Bell Canada will retire as Chief Financial Officer (CFO) effective September 1, 2023. Curtis Millen, currently Senior Vice President (SVP), Corporate Strategy and Treasurer, will be promoted to CFO of BCE and Bell Canada. Curtis Millen joined Bell in 2008 as Director, Corporate Strategy and M&A and held successively senior positions, most recently as SVP, Corporate Strategy and Treasurer, head of Bell Ventures and President of Bimcor Inc., a wholly-owned subsidiary of Bell that is one of the largest private sector pension fund management companies in Canada. Curtis Millen will continue to be based at Bell’s headquarters in Montréal. Glen LeBlanc will maintain his position as Vice-Chair, Atlantic, Chair of Northwestel Inc., and as Board member and Chair of the Audit Committee for Maple Leaf Sports & Entertainment Ltd. He will also provide leadership and direction to ensure a smooth transition on BCE’s financial operations until the end of December 2023.
Public debt offering
On May 11, 2023, Bell Canada completed a public offering in the United States of US $850 million (Cdn $1,138 million) of notes in one series (the Notes). The US $850 million Series US-8 Notes will mature on May 11, 2033 and carry an annual interest rate of 5.100%. The Notes are fully and unconditionally guaranteed by BCE Inc. The net proceeds of the offering were used to repay short-term debt and for general corporate purposes.
Inaugural Sustainability-Linked Derivatives
Bell entered into its first Sustainability-Linked Derivatives (SLDs), leveraging Bell’s key performance indicators designed to measure performance on ESG targets and underscoring Bell’s commitment to ESG standards. The SLDs introduce a pricing adjustment that increases the derivatives’ cost based on Bell’s performance towards its SBT to reduce its operational GHG emissions (Scope 1 and 2) 58% by 2030 from a 2020 base year (1).
BCE ranked as one of Canada’s Best 50 Corporate Citizens
In June 2023, BCE was once again named to the Canada’s Best 50 Corporate Citizens list compiled by Corporate Knights, a sustainable-economy media and research company, ranking 20th overall. The annual ranking is based on a set of 25 ESG indicators that compares Canadian companies with a gross revenue of at least $1 billion (2). Driven by Bell’s sustainable investments, diversity and equity initiatives and sustainability pay link (senior executive compensation based on sustainability performance), our commitment to ESG standards has enabled BCE to retain a strong position on this year’s list.
In addition, for the seventh consecutive year, Bell was recognized as one of Canada’s Greenest Employers (3) by Canada’s Top Employers, an editorial competition organized by Mediacorp Canada Inc., a publisher of employment periodicals, in recognition of our ongoing environmental leadership.
| (1) | Our SBTs have been recalculated to reflect restated GHG emissions for our 2020 base year, in line with SBTi criteria and recommendations. The SBTi has approved our targets in 2022, prior to the recalculation. The recalculated targets will be submitted to SBTi later in 2023 for approval. The SBTi requires that targets be recalculated (following the most recent applicable SBTi criteria and recommendations) at least every five years, or more often if significant changes occur (e.g., business acquisitions/divestments). As a result, our SBTs may need to be adjusted again in the future. |
| (2) | All companies are scored on up to 25 key performance indicators covering resource management, employee management, financial management, sustainable revenue & sustainable investment and supplier performance in comparison to their peer group, with 50% of each company’s score assigned to sustainable revenue and sustainable investment. |
| (3) | Winners were announced in April 2023 and were selected and evaluated in terms of: the unique environmental initiatives and programs they have developed; the extent to which they have been successful in reducing the organization’s own environmental footprint; the degree to which their employees are involved in these programs and whether they contribute any unique skills; and the extent to which these initiatives have become linked to the employer’s public identity, attracting new employees and clients to the organization. |
| 8 | BCE INC. 2023 SECOND QUARTER SHAREHOLDER REPORT |
1 MD&A Overview
| 1.3 | Assumptions |
As at the date of this MD&A, our forward-looking statements set out in the BCE 2022 Annual MD&A, as updated or supplemented in the BCE 2023 First Quarter MD&A and in this MD&A, are based on certain assumptions including, without limitation, the following assumptions as well as the various assumptions referred to under the sub-sections entitled Assumptions set out in section 3, Business segment analysis of this MD&A.
Assumptions about the Canadian economy
We have made certain assumptions concerning the Canadian economy. In particular, we have assumed:
| • | Moderating economic growth, given the Bank of Canada’s most recent estimated growth in Canadian gross domestic product of 1.8% in 2023, down from 3.4% in 2022 |
| • | Easing, but still elevated, consumer price index (CPI) inflation due to lower energy prices, improvements in global supply chains and the effects of higher interest rates moving through the economy |
| • | Ongoing tight labour market conditions, but with some easing as tighter monetary policy moderates the demand for labour |
| • | Slowing growth in household spending as demand for interest-rate-sensitive goods and services weakens and more households renew their mortgage at higher rates |
| • | Soft business investment growth due to slowing demand and high financing costs |
| • | Prevailing high interest rates expected to remain at or near current levels |
| • | Population growth resulting from strong immigration |
| • | Canadian dollar expected to remain near current levels. Further movements may be impacted by the degree of strength of the U.S. dollar, interest rates and changes in commodity prices |
Market assumptions
| • | A higher level of wireline and wireless competition in consumer, business and wholesale markets |
| • | Higher, but slowing, wireless industry penetration |
| • | A shrinking data and voice connectivity market as business customers migrate to lower-priced telecommunications solutions or alternative OTT competitors |
| • | The Canadian advertising market is experiencing a slowdown consistent with trends in the global advertising market, with improvement expected in the medium term, although visibility to the specific timing and pace of recovery is limited |
| • | Declines in broadcasting distribution undertaking (BDU) subscribers driven by increasing competition from the continued rollout of subscription video-on-demand (SVOD) streaming services together with further scaling of OTT aggregators |
Assumptions underlying expected reductions in 2023 annual contributions to our pension plans
| • | At the relevant time, our defined benefit (DB) pension plans will remain in funded positions with going concern surpluses and maintain solvency ratios that exceed the minimum legal requirements for a contribution holiday to be taken for applicable DB and defined contribution (DC) components |
| • | No significant declines in our DB pension plans’ financial position due to declines in investment returns or interest rates |
| • | No material experience losses from other events such as through litigation or changes in laws, regulations or actuarial standards |
| 9 |
2 MD&A Consolidated financial analysis
| 2 | Consolidated financial analysis |
This section provides detailed information and analysis about BCE’s performance in Q2 and YTD 2023 compared with Q2 and YTD 2022. It focuses on BCE’s consolidated operating results and provides financial information for our Bell CTS and Bell Media business segments. For further discussion and analysis of our business segments, refer to section 3, Business segment analysis.
| 2.1 | BCE consolidated income statements |
| Q2 2023 | Q2 2022 | $ change | % change | YTD 2023 | YTD 2022 | $ change | % change | |||||||||||||||||||||||||
| Operating revenues |
||||||||||||||||||||||||||||||||
| Service |
5,303 | 5,233 | 70 | 1.3% | 10,525 | 10,410 | 115 | 1.1% | ||||||||||||||||||||||||
| Product |
763 | 628 | 135 | 21.5% | 1,595 | 1,301 | 294 | 22.6% | ||||||||||||||||||||||||
| Total operating revenues |
6,066 | 5,861 | 205 | 3.5% | 12,120 | 11,711 | 409 | 3.5% | ||||||||||||||||||||||||
| Operating costs |
(3,421 | ) | (3,271 | ) | (150 | ) | (4.6% | ) | (6,937 | ) | (6,537 | ) | (400 | ) | (6.1% | ) | ||||||||||||||||
| Adjusted EBITDA |
2,645 | 2,590 | 55 | 2.1% | 5,183 | 5,174 | 9 | 0.2% | ||||||||||||||||||||||||
| Adjusted EBITDA margin |
43.6% | 44.2% | (0.6) pts | 42.8% | 44.2% | (1.4) pts | ||||||||||||||||||||||||||
| Severance, acquisition and other costs |
(100 | ) | (40 | ) | (60 | ) | n.m. | (149 | ) | (53 | ) | (96 | ) | n.m. | ||||||||||||||||||
| Depreciation |
(936 | ) | (933 | ) | (3 | ) | (0.3% | ) | (1,854 | ) | (1,824 | ) | (30 | ) | (1.6% | ) | ||||||||||||||||
| Amortization |
(296 | ) | (266 | ) | (30 | ) | (11.3% | ) | (579 | ) | (526 | ) | (53 | ) | (10.1% | ) | ||||||||||||||||
| Finance costs |
||||||||||||||||||||||||||||||||
| Interest expense |
(359 | ) | (269 | ) | (90 | ) | (33.5% | ) | (703 | ) | (529 | ) | (174 | ) | (32.9% | ) | ||||||||||||||||
| Net return on post-employment benefit plans |
27 | 7 | 20 | n.m. | 54 | 25 | 29 | n.m. | ||||||||||||||||||||||||
| Impairment of assets |
– | (106 | ) | 106 | 100.0% | (34 | ) | (108 | ) | 74 | 68.5% | |||||||||||||||||||||
| Other expense |
(311 | ) | (97 | ) | (214 | ) | n.m. | (190 | ) | (4 | ) | (186 | ) | n.m. | ||||||||||||||||||
| Income taxes |
(273 | ) | (232 | ) | (41 | ) | (17.7% | ) | (543 | ) | (567 | ) | 24 | 4.2% | ||||||||||||||||||
| Net earnings |
397 | 654 | (257 | ) | (39.3% | ) | 1,185 | 1,588 | (403 | ) | (25.4% | ) | ||||||||||||||||||||
| Net earnings attributable to: |
||||||||||||||||||||||||||||||||
| Common shareholders |
329 | 596 | (267 | ) | (44.8% | ) | 1,054 | 1,473 | (419 | ) | (28.4% | ) | ||||||||||||||||||||
| Preferred shareholders |
46 | 35 | 11 | 31.4% | 92 | 69 | 23 | 33.3% | ||||||||||||||||||||||||
|
Non-controlling interest |
22 | 23 | (1 | ) | (4.3% | ) | 39 | 46 | (7 | ) | (15.2% | ) | ||||||||||||||||||||
| Net earnings |
397 | 654 | (257 | ) | (39.3% | ) | 1,185 | 1,588 | (403 | ) | (25.4% | ) | ||||||||||||||||||||
| Adjusted net earnings |
722 | 791 | (69 | ) | (8.7% | ) | 1,494 | 1,602 | (108 | ) | (6.7% | ) | ||||||||||||||||||||
| EPS |
0.37 | 0.66 | (0.29 | ) | (43.9% | ) | 1.16 | 1.62 | (0.46 | ) | (28.4% | ) | ||||||||||||||||||||
| Adjusted EPS |
0.79 | 0.87 | (0.08 | ) | (9.2% | ) | 1.64 | 1.76 | (0.12 | ) | (6.8% | ) | ||||||||||||||||||||
n.m.: not meaningful
| 10 | BCE INC. 2023 SECOND QUARTER SHAREHOLDER REPORT |
2 MD&A Consolidated financial analysis
| 2.2 | Customer connections |
BCE net activations (losses)
| Q2 2023 | Q2 2022 | % change | YTD 2023 | YTD 2022 | % change | |||||||||||||||||||
| Mobile phone net subscriber activations (losses) |
125,539 | 110,761 | 13.3% | 152,174 | 142,937 | 6.5% | ||||||||||||||||||
| Postpaid |
111,282 | 83,197 | 33.8% | 154,571 | 117,427 | 31.6% | ||||||||||||||||||
| Prepaid |
14,257 | 27,564 | (48.3% | ) | (2,397 | ) | 25,510 | n.m. | ||||||||||||||||
| Mobile connected devices net subscriber activations |
79,537 | (344 | ) | n.m. | 150,279 | 48,533 | n.m. | |||||||||||||||||
| Retail high-speed Internet net subscriber activations |
24,934 | 22,620 | 10.2% | 52,208 | 48,644 | 7.3% | ||||||||||||||||||
| Retail TV net subscriber losses |
(14,404 | ) | (11,527 | ) | (25.0% | ) | (28,353 | ) | (19,888 | ) | (42.6% | ) | ||||||||||||
| Internet protocol television (IPTV) |
11,506 | 3,838 | n.m. | 22,405 | 16,098 | 39.2% | ||||||||||||||||||
| Satellite |
(25,910 | ) | (15,365 | ) | (68.6% | ) | (50,758 | ) | (35,986 | ) | (41.0% | ) | ||||||||||||
| Retail residential NAS lines net losses |
(49,608 | ) | (52,712 | ) | 5.9% | (96,489 | ) | (95,057 | ) | (1.5% | ) | |||||||||||||
| Total services net activations |
165,998 | 68,798 | n.m. | 229,819 | 125,169 | 83.6% | ||||||||||||||||||
|
n.m.: not meaningful
Total BCE customer connections
|
||||||||||||||||||||||||
| Q2 2023 | Q2 2022 | % change | ||||||||||||||||||||||
| Mobile phone subscribers (2) |
10,028,031 | 9,602,122 | 4.4% | |||||||||||||||||||||
| Postpaid (2) |
9,151,229 | 8,747,472 | 4.6% | |||||||||||||||||||||
| Prepaid |
876,802 | 854,650 | 2.6% | |||||||||||||||||||||
| Mobile connected devices subscribers (2) |
2,589,520 | 2,298,327 | 12.7% | |||||||||||||||||||||
| Retail high-speed Internet subscribers (1) (3) (4) |
4,338,511 | 3,977,387 | 9.1% | |||||||||||||||||||||
| Retail TV subscribers (1) (4) |
2,723,388 | 2,724,147 | – | |||||||||||||||||||||
| IPTV (1) (4) |
2,010,829 | 1,907,564 | 5.4% | |||||||||||||||||||||
| Satellite |
712,559 | 816,583 | (12.7% | ) | ||||||||||||||||||||
| Retail residential NAS lines (1) (4) |
2,101,740 | 2,207,004 | (4.8% | ) | ||||||||||||||||||||
| Total services subscribers |
21,781,190 | 20,808,987 | 4.7% | |||||||||||||||||||||
| (1) | In Q2 2023, our retail high-speed Internet, retail IPTV and retail residential NAS lines subscriber bases increased by 35,080, 243 and 7,458 subscribers, respectively, as a result of small acquisitions. |
| (2) | In Q1 2023, we adjusted our mobile phone postpaid and mobile connected device subscriber bases to remove older non-revenue generating business subscribers of 73,229 and 12,577, respectively. |
| (3) | In Q1 2023, subsequent to a review of customer account records, our retail high-speed Internet subscriber base was reduced by 7,347 subscribers. |
| (4) | In Q4 2022, as a result of the acquisition of Distributel, our retail high-speed Internet, retail IPTV and retail residential NAS lines subscriber bases increased by 128,065, 2,315 and 64,498 subscribers, respectively. |
BCE added 165,998 net retail subscriber activations in Q2 2023, up 97,200 compared to the same period last year. The net retail subscriber activations in Q2 2023 consisted of:
| • | 125,539 mobile phone net subscriber activations, along with 79,537 mobile connected device net subscriber activations |
| • | 24,934 retail high-speed Internet net subscriber activations |
| • | 14,404 retail TV net subscriber losses comprised of 25,910 retail satellite TV net subscriber losses, partly offset by 11,506 retail IPTV net subscriber activations |
| • | 49,608 retail residential NAS lines net losses |
In the first half of the year, BCE added 229,819 net retail subscriber activations, up 83.6% compared to the same period in 2022. The net retail subscriber activations in the first half of 2023 consisted of:
| • | 152,174 mobile phone net subscriber activations, along with 150,279 mobile connected device net subscriber activations |
| • | 52,208 retail high-speed Internet net subscriber activations |
| • | 28,353 retail TV net subscriber losses comprised of 50,758 retail satellite TV net subscriber losses, partly offset by 22,405 retail IPTV net subscriber activations |
| • | 96,489 retail residential NAS lines net losses |
At June 30, 2023, BCE’s retail subscriber connections totaled 21,781,190, up 4.7% year over year, and consisted of:
| • | 10,028,031 mobile phone subscribers, up 4.4% year over year, and 2,589,520 mobile connected device subscribers, up 12.7% year over year |
| • | 4,338,511 retail high-speed Internet subscribers, 9.1% higher year over year |
| • | 2,723,388 total retail TV subscribers, comprised of 2,010,829 retail IPTV subscribers, up 5.4% year over year, and 712,559 retail satellite TV subscribers, down 12.7% year over year |
| • | 2,101,740 retail residential NAS lines, down 4.8% year over year |
| 11 |
2 MD&A Consolidated financial analysis
| 2.3 | Operating revenues |
| Q2 2023 | Q2 2022 | $ change | % change | YTD 2023 | YTD 2022 | $ change | % change | |||||||||||||||||||||||||
| Bell CTS |
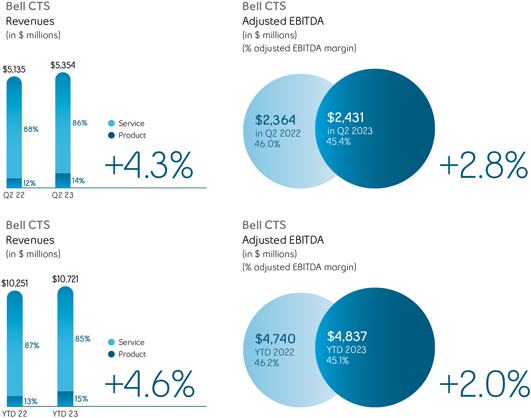
5,354 | 5,135 | 219 | 4.3% | 10,721 | 10,251 | 470 | 4.6% | ||||||||||||||||||||||||
| Bell Media |
805 | 821 | (16 | ) | (1.9% | ) | 1,585 | 1,646 | (61 | ) | (3.7% | ) | ||||||||||||||||||||
| Inter-segment eliminations |
(93 | ) | (95 | ) | 2 | 2.1% | (186 | ) | (186 | ) | – | – | ||||||||||||||||||||
| Total BCE operating revenues |
6,066 | 5,861 | 205 | 3.5% | 12,120 | 11,711 | 409 | 3.5% | ||||||||||||||||||||||||
BCE
BCE operating revenues increased by 3.5% in both the second quarter and the first six months of the year, compared to the same periods in 2022, driven by higher service and product revenues. Service revenues of $5,303 million in Q2 2023 and $10,525 million year to date, increased 1.3% and 1.1%, respectively. Product revenues of $763 million in Q2 2023 and $1,595 million year to date, increased by 21.5% and 22.6%, respectively. The growth in operating revenues was due to higher revenues from our Bell CTS segment, partly offset by a decline in our Bell Media segment. Bell CTS operating revenues grew by 4.3% in Q2 2023 and by 4.6% in the first half of the year, compared to the same periods last year, due to higher product revenues of 21.5% and 22.6%, respectively, and higher service revenues of 1.9% and 2.0%, respectively, attributable to ongoing growth in wireless revenues and wireline data revenues, moderated by continued erosion in wireline voice revenues. Bell Media operating revenues declined by 1.9% in Q2 2023 and by 3.7% in the first half of the year, compared to the same periods last year, primarily reflecting lower advertising revenues.
| 12 | BCE INC. 2023 SECOND QUARTER SHAREHOLDER REPORT |
2 MD&A Consolidated financial analysis
| 2.4 | Operating costs |
| Q2 2023 | Q2 2022 | $ change | % change | YTD 2023 | YTD 2022 | $ change | % change | |||||||||||||||||||||||||
| Bell CTS |
(2,923 | ) | (2,771 | ) | (152 | ) | (5.5%) | (5,884 | ) | (5,511 | ) | (373 | ) | (6.8%) | ||||||||||||||||||
| Bell Media |
(591 | ) | (595 | ) | 4 | 0.7% | (1,239 | ) | (1,212 | ) | (27 | ) | (2.2%) | |||||||||||||||||||
| Inter-segment eliminations |
93 | 95 | (2 | ) | (2.1%) | 186 | 186 | – | – | |||||||||||||||||||||||
| Total BCE operating costs |
(3,421 | ) | (3,271 | ) | (150 | ) | (4.6%) | (6,937 | ) | (6,537 | ) | (400 | ) | (6.1%) | ||||||||||||||||||
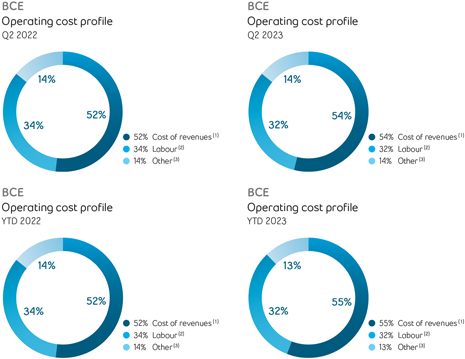
| (1) | Cost of revenues includes costs of wireless devices and other equipment sold, network and content costs, and payments to other carriers. |
| (2) | Labour costs (net of capitalized costs) include wages, salaries and related taxes and benefits, post-employment benefit plans service cost, and other labour costs, including contractor and outsourcing costs. |
| (3) | Other operating costs include marketing, advertising and sales commission costs, bad debt expense, taxes other than income taxes, IT costs, professional service fees and rent. |
BCE
BCE operating costs increased by 4.6% in Q2 2023 and by 6.1% in the first half of the year, compared to the same periods last year, driven by higher expenses in Bell CTS of 5.5% and 6.8%, respectively. Additionally, in the first six months of the year, operating costs were unfavourably impacted by higher year-over-year Bell Media expenses of 2.2%.
| 13 |
2 MD&A Consolidated financial analysis
| 2.5 | Net earnings |
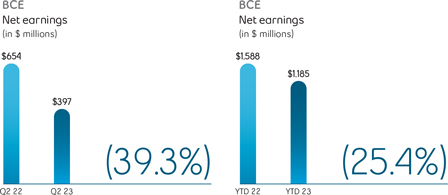
Net earnings in the second quarter of 2023 decreased by $257 million, compared to the same period last year, mainly due to higher other expense, higher interest expense, higher severance, acquisition and other costs and higher income taxes, partly offset by lower impairment of assets and higher adjusted EBITDA.
Net earnings on a year-to-date basis in 2023 decreased by $403 million, compared to the same period last year, mainly due to higher other expense, higher interest expense, higher severance, acquisition and other costs and higher depreciation and amortization, partly offset by lower impairment of assets.
| 2.6 | Adjusted EBITDA |
| Q2 2023 | Q2 2022 | $ change | % change | YTD 2023 | YTD 2022 | $ change | % change | |||||||||||||||||||||||||
| Bell CTS |
2,431 | 2,364 | 67 | 2.8% | 4,837 | 4,740 | 97 | 2.0% | ||||||||||||||||||||||||
| Bell Media |
214 | 226 | (12 | ) | (5.3%) | 346 | 434 | (88 | ) | (20.3%) | ||||||||||||||||||||||
| Total BCE adjusted EBITDA |
2,645 | 2,590 | 55 | 2.1% | 5,183 | 5,174 | 9 | 0.2% | ||||||||||||||||||||||||
BCE
BCE’s adjusted EBITDA grew by 2.1% in Q2 2023 and by 0.2% in the first half of the year, compared to the same periods last year, driven by an increase in Bell CTS of 2.8% and 2.0%, respectively, moderated by a decline in Bell Media of 5.3% and 20.3%, respectively. The increase in BCE’s adjusted EBITDA was driven by higher operating revenues, partly offset by greater operating expenses. Adjusted EBITDA margin of 43.6% in Q2 2023 and 42.8% year to date, decreased by 0.6 pts and 1.4 pts, respectively, over the same periods in 2022, due to a greater proportion of low-margin product sales in our total revenue base, coupled with greater operating costs, mitigated in part by service revenue flow-through.
| 14 | BCE INC. 2023 SECOND QUARTER SHAREHOLDER REPORT |
2 MD&A Consolidated financial analysis
| 2.7 | Severance, acquisition and other costs |
2023
Severance, acquisition and other costs of $100 million in the second quarter of 2023 and $149 million on a year-to-date basis included:
| • | Severance costs of $80 million in Q2 2023 and $109 million on a year-to-date basis related to involuntary and voluntary employee terminations |
| • | Acquisition and other costs of $20 million in Q2 2023 and $40 million on a year-to-date basis |
2022
Severance, acquisition and other costs of $40 million in the second quarter of 2022 and $53 million on a year-to-date basis included:
| • | Severance costs of $38 million in Q2 2022 and $56 million on a year-to-date basis related to involuntary and voluntary employee terminations |
| • | Acquisition and other costs of $2 million in Q2 2022 and a recovery of $3 million on a year-to-date basis |
| 2.8 | Depreciation and amortization |
Depreciation
Depreciation in the second quarter and on a year-to-date basis in 2023 increased by $3 million and $30 million, respectively, compared to the same periods in 2022, mainly due to a higher asset base as we continued to invest in our broadband and wireless networks.
Amortization
Amortization in the second quarter and on a year-to-date in 2023 increased by $30 million and $53 million, respectively, compared to the same periods in 2022, mainly due to a higher asset base.
| 2.9 | Finance costs |
Interest expense
Interest expense in the second quarter of 2023 increased by $90 million, compared to the same period last year, mainly due to higher average debt balances and higher interest rates.
Interest expense on a year-to-date basis in 2023 increased by $174 million, compared to the same period last year, mainly due to higher average debt balances and higher interest rates.
Net return on post-employment benefit plans
Net return on our post-employment benefit plans is based on market conditions that existed at the beginning of the year as well as the net post-employment benefit plan asset (liability). On January 1, 2023, the discount rate was 5.3% compared to 3.2% on January 1, 2022.
In the second quarter and on a year-to-date basis in 2023, net return on post-employment benefit increased by $20 million and $29 million, respectively, compared to the same periods last year, as a result of a higher discount rate in 2023 and a higher net asset position.
The impacts of changes in market conditions during the year are recognized in other comprehensive (loss) income (OCI).
| 2.10 | Impairment of assets |
Impairment charges for the second quarter and on a year-to-date basis in 2023 decreased by $106 million and $74 million, respectively, compared to the same periods last year and relate mainly to right-of-use assets for certain office spaces we ceased using as part of our real estate optimization strategy as a result of our hybrid work policy.
| 15 |
2 MD&A Consolidated financial analysis
| 2.11 | Other expense |
2023
Other expense of $311 million in the second quarter of 2023 included losses on our equity investments in associates and joint ventures which included a loss on BCE’s share of an obligation to repurchase at fair value the minority interest in one of BCE’s joint ventures, losses on retirements and disposals of property, plant and equipment and intangible assets, partly offset by gains on our investments as a result of the sale of our 63% ownership in certain production studios.
Other expense of $190 million on a year-to-date basis in 2023 included losses on our equity investments in associates and joint ventures which included a loss on BCE’s share of an obligation to repurchase at fair value the minority interest in one of BCE’s joint ventures, partly offset by gains on our investments as a result of the sale of our 63% ownership in certain production studios, gains on retirements and disposals of property, plant and equipment and intangible assets related to the sale of land as part of our real estate optimization strategy, higher interest income, income on operations from our equity investments and net mark-to-market gains on derivatives used to economically hedge equity settled share-based compensation plans.
2022
Other expense of $97 million in the second quarter of 2022 included net mark-to-market losses on derivatives used to economically hedge equity settled share-based compensation plans and losses on our equity investments which included a loss on BCE’s share of an obligation to repurchase at fair value the minority interest in one of BCE’s joint ventures, partly offset by a gain on investment related to an obligation to repurchase at fair value the minority interest in one of our subsidiaries.
Other expense of $4 million on a year-to-date basis in 2022 was due to losses on our equity investments which included a loss on BCE’s share of an obligation to repurchase at fair value the minority interest in one of BCE’s joint ventures and early debt redemption costs, partly offset by gains on investments related to the sale of our wholly-owned subsidiary, 6362222 Canada Inc. (Createch), and an obligation to repurchase at fair value the minority interest in one of our subsidiaries.
| 2.12 | Income taxes |
Income taxes in the second quarter of 2023 increased by $41 million compared to the same period in 2022, mainly due to higher taxable income.
Income taxes on a year-to-date basis in 2023 decreased by $24 million, compared to the same period in 2022, mainly due to lower taxable income.
| 2.13 | Net earnings attributable to common shareholders and EPS |
Net earnings attributable to common shareholders in the second quarter of 2023 of $329 million, decreased by $267 million, compared to the same period last year, mainly due to higher other expense, higher interest expense, higher severance, acquisition and other costs and higher income taxes, partly offset by lower impairment of assets and higher adjusted EBITDA.
Net earnings attributable to common shareholders on a year-to-date basis in 2023 of $1,054 million, decreased by $419 million due to higher other expense, higher interest expense, higher severance, acquisition and other costs and higher depreciation and amortization, partly offset by lower impairment of assets and lower income taxes.
BCE’s EPS of $0.37 in Q2 2023 decreased by $0.29 compared to the same period last year. BCE’s EPS of $1.16 on a year-to-date basis in 2023 decreased by $0.46 compared to the same period last year.
In the second quarter of 2023, adjusted net earnings, which excludes the impact of severance, acquisition and other costs, net mark-to-market gains (losses) on derivatives used to economically hedge equity settled share-based compensation plans, net equity gains (losses) on investments in associates and joint ventures, net gains (losses) on investments, early debt redemption costs and impairment of assets, net of tax and NCI, was $722 million, or $0.79 per common share, compared to $791 million, or $0.87 per common share, for the same period last year. Adjusted net earnings in the first half of 2023 was $1,494 million, or $1.64 per common share, compared to $1,602 million, or $1.76 per common share, for the first six months of 2022.
| 16 | BCE INC. 2023 SECOND QUARTER SHAREHOLDER REPORT |
3 MD&A Business segment analysis
| 3 | Business segment analysis |
| 3.1 | Bell CTS |
Key business developments
Acquisition of cloud-services company FX Innovation
On June 1, 2023, Bell acquired FX Innovation, a Montréal-based provider of cloud-focused managed and professional services and workflow automation solutions for business clients, for cash consideration of $157 million, of which $12 million is payable within two years, and an estimated $6 million of additional cash consideration contingent on the achievement of certain performance objectives. This contingent consideration is expected to be settled by 2027 and the maximum amount payable is $7 million. This acquisition combines FX Innovation’s agility, start-up culture, and cloud services expertise with Bell’s next-generation fibre and 5G networks, resources, and scale to deliver leading-edge technology solutions for Canadian businesses. The results of FX Innovation are included in our Bell CTS segment.
Virgin Plus brand repositioning and launch of unlimited and 5G wireless plans
Virgin Plus unveiled a fresh new look with more affordable service offerings for everyone, including those new to Canada, along with a new brand campaign and updated member benefits. The service offerings include the introduction of unlimited nationwide rate plans and access to 5G at an affordable price with no zones for members across Canada. These new offerings join the already-stacked lineup of affordable Virgin Plus service offerings including high speed internet and app-based TV service for members in Ontario and Québec.
Bell pure fibre ranked as Canada’s fastest Internet and Wi-Fi
Bell pure fibre Internet was awarded fastest in Canada in Ookla’s Q1-Q2 Speedtest Awards report (1), the biannual analysis of wireline and wireless performance across the country. Based on Speedtest results independently collected and analyzed by Ookla, the Q1-Q2 Speedtest Awards recognizes the best speed of Canada’s major providers. The report also ranks Bell pure fibre Wi-Fi as fastest in the country. With the addition of previous recognition won by Bell such as PCMag Best Major ISP for Gaming (2) and BrandSpark’s Most Trusted ISP (3), Bell is Canada’s most awarded Internet service provider (4).
| (1) | Based on analysis by Ookla, a web testing and network diagnostics company, of Speedtest Intelligence data for Q1-Q2 2023. Ookla compared 13,671,040 user-initiated tests that are taken on various Speedtest applications connected to a fixed network, including tests taken on mobile phones over a Wi-Fi connection. |
| (2) | PCMag delivers labs-based, independent reviews of the latest technology products and services. Bell was named the top ISP among Canada’s major providers for gaming for the second year in a row in PCMag’s Best Gaming ISPs Canada 2023 report based on PCMag’s Quality Index (speed, latency and jitter) comparing major Canadian ISPs from December 1, 2021, to December 5, 2022. |
| (3) | Bell was voted most trusted High Speed Internet Provider brand by Canadian shoppers based on the 2023 BrandSpark Canadian Trust Study conducted by BrandSpark, a research and consulting firm. Winners were determined by a national survey of 15,878 Canadian shoppers who gave their top-of-mind, unaided answers as to which brands they trust most and why in categories they have recently shopped. |
| (4) | Most awarded based on Bell competitive analysis. Bell awards include Ookla Q1-Q2 2023 Speedtest Awards, PCMag Best Major ISP for Gaming 2023, and BrandSpark Most Trusted ISP 2023. |
| 17 |
3 MD&A Business segment analysis
Financial performance analysis
Q2 2023 performance highlights
| Total mobile phone subscriber growth (2) |
Mobile phone postpaid net subscriber activations |
Mobile phone prepaid net subscriber activations |
Mobile phone postpaid churn in Q2 2023 |
Mobile phone blended average revenue per user (ARPU) (3) per month |
||||
| +4.4% | 111,282 | 14,257 | 0.94% | — | ||||
| Q2 2023 vs. Q2 2022 |
Increased 33.8% vs. Q2 2022 |
in Q2 2023 |
increased 0.19 pts vs. Q2 2022 |
Q2 2023: $59.16 |
||||
| Q2 2022: $59.17 |
| Retail high-speed Internet subscriber growth (1) (4) (5) | Retail high-speed Internet net subscriber activations in Q2 2023 |
Retail TV subscriber growth (1) (5) | ||
| +9.1% | 24,934 | — | ||
| Q2 2023 vs. Q2 2022 |
Increased 10.2% vs. Q2 2022 |
Q2 2023 vs. Q2 2022 |
| Retail IPTV net subscriber activations in Q2 2023 | Retail residential NAS lines subscriber decline (1) (5) | |
| 11,506 | (4.8%) | |
| Increased 7,668 vs. Q2 2022 |
Q2 2023 vs. Q2 2022 |
|
| (1) | In Q2 2023, our retail high-speed Internet, retail IPTV and retail residential NAS lines subscriber bases increased by 35,080, 243 and 7,458 subscribers, respectively, as a result of small acquisitions. |
| (2) | In Q1 2023, we adjusted our mobile phone postpaid subscriber base to remove older non-revenue generating business subscribers of 73,229. |
| (3) | Effective Q1 2023, as a result of the segment reporting changes impacting intersegment eliminations, ARPU has been updated and is defined as Bell CTS wireless external services revenues (previously wireless operating service revenues) divided by the average mobile phone subscriber base for the specified period, expressed as a dollar unit per month. |
| (4) | In Q1 2023, subsequent to a review of customer account records, our retail high-speed Internet subscriber base was reduced by 7,347 subscribers. |
| (5) | In Q4 2022, as a result of the acquisition of Distributel, our retail high-speed Internet, retail IPTV and retail residential NAS lines subscriber bases increased by 128,065, 2,315 and 64,498 subscribers, respectively. |
| 18 | BCE INC. 2023 SECOND QUARTER SHAREHOLDER REPORT |
3 MD&A Business segment analysis
Bell CTS results
Revenues
| Q2 2023 | Q2 2022 | $ change | % change | YTD 2023 | YTD 2022 | $ change | % change | |||||||||||||||||||||||||
| Wireless |
1,766 | 1,692 | 74 | 4.4% | 3,489 | 3,327 | 162 | 4.9% | ||||||||||||||||||||||||
| Wireline data |
2,021 | 1,974 | 47 | 2.4% | 4,022 | 3,927 | 95 | 2.4% | ||||||||||||||||||||||||
| Wireline voice |
722 | 756 | (34 | ) | (4.5% | ) | 1,448 | 1,527 | (79 | ) | (5.2% | ) | ||||||||||||||||||||
| Other wireline services |
75 | 78 | (3 | ) | (3.8% | ) | 153 | 155 | (2 | ) | (1.3% | ) | ||||||||||||||||||||
| External service revenues |
4,584 | 4,500 | 84 | 1.9% | 9,112 | 8,936 | 176 | 2.0% | ||||||||||||||||||||||||
| Inter-segment service revenues |
7 | 7 | – | – | 14 | 14 | – | – | ||||||||||||||||||||||||
| Operating service revenues |
4,591 | 4,507 | 84 | 1.9% | 9,126 | 8,950 | 176 | 2.0% | ||||||||||||||||||||||||
| Wireless |
626 | 542 | 84 | 15.5% | 1,252 | 1,105 | 147 | 13.3% | ||||||||||||||||||||||||
| Wireline |
137 | 86 | 51 | 59.3% | 343 | 196 | 147 | 75.0% | ||||||||||||||||||||||||
| External/Operating product revenues |
763 | 628 | 135 | 21.5% | 1,595 | 1,301 | 294 | 22.6% | ||||||||||||||||||||||||
| Total external revenues |
5,347 | 5,128 | 219 | 4.3% | 10,707 | 10,237 | 470 | 4.6% | ||||||||||||||||||||||||
| Total operating revenues |
5,354 | 5,135 | 219 | 4.3% | 10,721 | 10,251 | 470 | 4.6% | ||||||||||||||||||||||||
Bell CTS operating revenues increased by 4.3% in Q2 2023 and by 4.6% in the first half of the year, compared to the same periods last year, driven by growth in both product and service revenues. The increase in service revenues was primarily due to higher wireless revenues and wireline data revenues, moderated by ongoing erosion in wireline voice revenues.
Bell CTS operating service revenues increased by 1.9% in the quarter and by 2.0% in the first six months of the year, compared to the same periods in 2022.
| • | Wireless revenues increased by 4.4% in Q2 2023 and by 4.9% in the first six months of the year, compared to the same periods last year, driven by: |
| • | Continued growth in our mobile phone and connected device subscriber bases |
| • | Flow-through of rate increases |
| • | Higher roaming revenues due to increased international travel |
These factors were partly offset by:
| • | Impact of competitive pricing pressures |
| • | Lower data overages driven by greater customer adoption of monthly plans with higher data thresholds, including unlimited plans |
| • | Wireline data revenues grew by 2.4% in both Q2 2023 and the first six months of the year, compared to the same periods last year, driven by: |
| • | Higher retail Internet and IPTV subscriber bases, coupled with the flow-through of residential rate increases |
| • | The acquisitions of Distributel in December 2022 and FX Innovation in June 2023, and other small acquisitions made during the quarter |
These factors were partly offset by:
| • | Increased acquisition, retention and bundle discounts on residential services |
| • | Continued decline in our satellite TV subscriber base |
Additionally, in the first half of the year, compared to the same period last year, business solutions services revenues were unfavourably impacted by the sale of our wholly-owned subsidiary Createch in March 2022.
| • | Wireline voice revenues declined by 4.5% in Q2 2023 and by 5.2% in the first six months of the year, compared to the same periods last year, driven by: |
| • | Continued retail residential NAS line erosion, combined with business voice declines, driven by technological substitution to wireless and Internet-based services |
| • | Reduced sales of international wholesale long distance minutes |
These factors were partly offset by:
| • | Flow-through of residential rate increases |
| • | The acquisition of Distributel in December 2022 and other small acquisitions made during the quarter |
Bell CTS operating product revenues grew by 21.5% in Q2 2023 and by 22.6% in the first six months of the year, over the same periods last year.
| • | Wireless operating product revenues increased by 15.5% in Q2 2023 and by 13.3% in the first half of the year, compared to the same periods last year, due to greater sales mix of premium mobile phones and more disciplined pricing |
| • | Wireline operating product revenues grew by 59.3% in Q2 2023 and by 75.0% in the first half of the year, compared to the same periods in 2022, from strong sales to large business customers, reflecting alleviating year-over-year impact from global supply chain challenges |
| 19 |
3 MD&A Business segment analysis
Operating costs and adjusted EBITDA
| Q2 2023 | Q2 2022 | $ change | % change | YTD 2023 | YTD 2022 | $ change | % change | |||||||||||||||||||||||||
| Operating costs |
(2,923 | ) | (2,771 | ) | (152 | ) | (5.5% | ) | (5,884 | ) | (5,511 | ) | (373 | ) | (6.8% | ) | ||||||||||||||||
| Adjusted EBITDA |
2,431 | 2,364 | 67 | 2.8% | 4,837 | 4,740 | 97 | 2.0% | ||||||||||||||||||||||||
| Adjusted EBITDA margin |
45.4% | 46.0% | (0.6) pts | 45.1% | 46.2% | (1.1) pts | ||||||||||||||||||||||||||
Bell CTS operating costs increased by 5.5% in Q2 2023 and by 6.8% in the first half of the year, compared to the same periods in 2022, due to:
| • | Higher cost of goods sold associated with the higher revenues |
| • | Greater costs related to the acquisitions of Distributel in December 2022 and FX Innovation in June 2023, and other small acquisitions made during the quarter |
| • | Higher network operating costs including the continued deployment of our mobile 5G network |
These factors were partly offset by:
| • | Pension savings, driven by lower DB expense due to higher year-over-year discount rate |
| • | Reduced labour cost reflecting headcount reductions and vendor contract savings |
Additionally, during the first six months of the year, compared to the same period last year, operating costs were unfavourably impacted by higher year-over-year TV programming and content costs, along with increased labour expenses and inflationary cost pressures, which have subsided year over year in Q2 2023. This was partly offset by lower costs due to the sale of our wholly-owned subsidiary Createch in March 2022.
Bell CTS adjusted EBITDA increased by 2.8% in Q2 2023 and by 2.0% in the first half of the year, compared to the same periods last year, attributable to higher operating revenues, moderated by greater operating costs. Adjusted EBITDA margin of 45.4% in Q2 2023 and 45.1% in the first half of the year, decreased by 0.6 pts and 1.1pts, respectively, over the same periods in 2022, resulting from an increased proportion of low-margin product sales in our total revenue base, along with higher operating costs, partly offset by service revenue flow-through.
Bell CTS operating metrics
Wireless
| Q2 2023 | Q2 2022 | Change | % change | YTD 2023 | YTD 2022 | Change | % change | |||||||||||||||||||||||||
| Mobile phones |
||||||||||||||||||||||||||||||||
| Blended ARPU ($/month) |
59.16 | 59.17 | (0.01 | ) | – | 58.66 | 58.39 | 0.27 | 0.5% | |||||||||||||||||||||||
| Gross subscriber activations |
502,940 | 415,270 | 87,670 | 21.1% | 908,475 | 765,178 | 143,297 | 18.7% | ||||||||||||||||||||||||
| Postpaid |
347,746 | 266,600 | 81,146 | 30.4% | 620,355 | 497,313 | 123,042 | 24.7% | ||||||||||||||||||||||||
| Prepaid |
155,194 | 148,670 | 6,524 | 4.4% | 288,120 | 267,865 | 20,255 | 7.6% | ||||||||||||||||||||||||
| Net subscriber activations (losses) |
125,539 | 110,761 | 14,778 | 13.3% | 152,174 | 142,937 | 9,237 | 6.5% | ||||||||||||||||||||||||
| Postpaid |
111,282 | 83,197 | 28,085 | 33.8% | 154,571 | 117,427 | 37,144 | 31.6% | ||||||||||||||||||||||||
| Prepaid |
14,257 | 27,564 | (13,307 | ) | (48.3% | ) | (2,397 | ) | 25,510 | (27,907 | ) | n.m. | ||||||||||||||||||||
| Blended churn % (average per month) |
1.27% | 1.07% | (0.20) pts | 1.28% | 1.10% | (0.18) pts | ||||||||||||||||||||||||||
| Postpaid |
0.94% | 0.75% | (0.19) pts | 0.92% | 0.77% | (0.15) pts | ||||||||||||||||||||||||||
| Prepaid |
4.68% | 4.41% | (0.27) pts | 4.98% | 4.51% | (0.47) pts | ||||||||||||||||||||||||||
| Subscribers (1) |
10,028,031 | 9,602,122 | 425,909 | 4.4% | 10,028,031 | 9,602,122 | 425,909 | 4.4% | ||||||||||||||||||||||||
| Postpaid (1) |
9,151,229 | 8,747,472 | 403,757 | 4.6% | 9,151,229 | 8,747,472 | 403,757 | 4.6% | ||||||||||||||||||||||||
| Prepaid |
876,802 | 854,650 | 22,152 | 2.6% | 876,802 | 854,650 | 22,152 | 2.6% | ||||||||||||||||||||||||
| Mobile connected devices |
||||||||||||||||||||||||||||||||
| Net subscriber activations |
79,537 | (344 | ) | 79,881 | n.m. | 150,279 | 48,533 | 101,746 | n.m. | |||||||||||||||||||||||
| Subscribers (1) |
2,589,520 | 2,298,327 | 291,193 | 12.7% | 2,589,520 | 2,298,327 | 291,193 | 12.7% | ||||||||||||||||||||||||
n.m.: not meaningful
| (1) | In Q1 2023, we adjusted our mobile phone postpaid and mobile connected device subscriber bases to remove older non-revenue generating business subscribers of 73,229 and 12,577, respectively. |
Mobile phone blended ARPU of $59.16 in Q2 2023 was essentially stable year over year, decreasing by $0.01, compared to the same period last year, driven by:
| • | Impact of competitive pricing pressures |
| • | Lower data overages due to greater customer adoption of monthly plans with higher data thresholds, including unlimited plans |
These factors were partly offset by:
| • | Flow-through of rate increases |
| • | Higher roaming revenues due to increased international travel |
In the first half of the year, mobile phone blended ARPU of $58.66 increased by 0.5%, compared to the same period last year, as the rate increases and higher roaming revenues more than offset the competitive pricing pressures and lower data overages.
| 20 | BCE INC. 2023 SECOND QUARTER SHAREHOLDER REPORT |
3 MD&A Business segment analysis
Mobile phone gross subscriber activations grew by 21.1% in Q2 2023 and by 18.7% in the first half of the year, compared to the same periods last year, due to both higher postpaid and prepaid gross subscriber activations.
| • | Mobile phone postpaid gross subscriber activations increased by 30.4% in the second quarter and by 24.7%, in the first half of the year, compared to the same periods last year, driven by market growth primarily due to increased immigration, as well as reflecting continued 5G momentum and successful bundled service offerings |
| • | Mobile phone prepaid gross subscriber activations increased by 4.4% in Q2 2023 and by 7.6% in the first half of the year, compared to the same periods last year, due to increased market activity driven by higher immigration and travel to Canada |
Mobile phone net subscriber activations increased by 13.3% in Q2 2023 and by 6.5% in the first half of the year, compared to the same periods last year, due to higher postpaid net subscriber activations, partly offset by lower prepaid net subscriber activations.
| • | Mobile phone postpaid net subscriber activations increased by 33.8% in the second quarter and by 31.6% for the first half of the year, compared to the same periods last year, driven by higher gross activations and greater migrations from prepaid, partly offset by higher subscriber deactivations |
| • | Mobile phone prepaid net subscriber activations declined by 13,307 in Q2 2023 and by 27,907 in the first six months of the year, compared to the same periods last year, due to higher subscriber deactivations and greater migrations to postpaid, partly offset by higher gross activations |
Mobile phone blended churn of 1.27% in Q2 2023 and 1.28% year to date, increased by 0.20 pts and 0.18 pts, respectively, compared to the same periods last year.
| • | Mobile phone postpaid churn of 0.94% in the quarter and 0.92% in the first half of the year, increased by 0.19 pts and 0.15 pts, respectively, compared to the same periods last year, driven by greater promotional pricing offers in the market and higher market activity |
| • | Mobile phone prepaid churn of 4.68% in the quarter and 4.98% in the first half of the year, increased by 0.27 pts and 0.47 pts, respectively, compared to the same periods last year, due to greater market activity and more attractive promotional offers in the market on postpaid discount brands |
Mobile phone subscribers at June 30, 2023 totaled 10,028,031, an increase of 4.4%, from 9,602,122 subscribers reported at the end of Q2 2022. This consisted of 9,151,229 postpaid subscribers, an increase of 4.6% from 8,747,472 subscribers at the end of Q2 2022, and 876,802 prepaid subscribers, an increase of 2.6% from 854,650 subscribers at the end of Q2 2022.
Mobile connected device net subscriber activations increased by 79,881 in Q2 2023 and by 101,746 in the first six months of the year, compared to the same periods last year, due to higher business Internet of Things (IoT) net activations, higher connected car subscriptions and lower net losses from data devices, primarily fewer tablet deactivations.
Mobile connected device subscribers at June 30, 2023 totaled 2,589,520, an increase of 12.7% from 2,298,327 subscribers reported at the end of Q2 2022.
Wireline data
Retail high-speed Internet
| Q2 2023 | Q2 2022 | Change | % change | YTD 2023 | YTD 2022 | Change | % change | |||||||||||||||||||||||||
| Retail net subscriber activations |
24,934 | 22,620 | 2,314 | 10.2% | 52,208 | 48,644 | 3,564 | 7.3% | ||||||||||||||||||||||||
| Retail subscribers (1) (2) (3) |
4,338,511 | 3,977,387 | 361,124 | 9.1% | 4,338,511 | 3,977,387 | 361,124 | 9.1% | ||||||||||||||||||||||||
| (1) | In Q2 2023, our retail high-speed Internet subscriber base increased by 35,080 as a result of small acquisitions. |
| (2) | In Q1 2023, subsequent to a review of customer account records, our retail high-speed Internet subscriber base was reduced by 7,347 subscribers. |
| (3) | In Q4 2022, as a result of the acquisition of Distributel, our retail high-speed Internet subscriber base increased by 128,065. |
Retail high-speed Internet net subscriber activations increased by 10.2% in Q2 2023 and by 7.3% in the first half of the year, compared to the same periods in 2022, due to higher gross activations from the continued growth in our fibre-to-the-premise (FTTP) footprint, the contribution from Distributel and other small acquisitions made during the quarter, as well as successful bundled services offerings. This was partly offset by higher year-over-year competitive intensity, along with lower net activations in our non-FTTP service footprint.
Retail high-speed Internet subscribers totaled 4,338,511 at June 30, 2023, up 9.1% from 3,977,387 subscribers reported at the end of Q2 2022. In Q2 2023, our retail high-speed Internet subscriber base increased by 35,080 as a result of small acquisitions.
Retail TV
| Q2 2023 | Q2 2022 | Change | % change | YTD 2023 | YTD 2022 | Change | % change | |||||||||||||||||||||||||
| Retail net subscriber losses |
(14,404 | ) | (11,527 | ) | (2,877 | ) | (25.0% | ) | (28,353 | ) | (19,888 | ) | (8,465 | ) | (42.6% | ) | ||||||||||||||||
| IPTV |
11,506 | 3,838 | 7,668 | n.m. | 22,405 | 16,098 | 6,307 | 39.2% | ||||||||||||||||||||||||
| Satellite |
(25,910 | ) | (15,365 | ) | (10,545 | ) | (68.6% | ) | (50,758 | ) | (35,986 | ) | (14,772 | ) | (41.0% | ) | ||||||||||||||||
| Total retail subscribers (1) (2) |
2,723,388 | 2,724,147 | (759 | ) | – | 2,723,388 | 2,724,147 | (759 | ) | – | ||||||||||||||||||||||
| IPTV (1) (2) |
2,010,829 | 1,907,564 | 103,265 | 5.4% | 2,010,829 | 1,907,564 | 103,265 | 5.4% | ||||||||||||||||||||||||
| Satellite |
712,559 | 816,583 | (104,024 | ) | (12.7% | ) | 712,559 | 816,583 | (104,024 | ) | (12.7%) | |||||||||||||||||||||
n.m.: not meaningful
| (1) | In Q2 2023, our retail IPTV subscriber base increased by 243 as a result of small acquisitions. |
| (2) | In Q4 2022, as a result of the acquisition of Distributel, our retail IPTV base increased by 2,315 subscribers. |
| 21 |
3 MD&A Business segment analysis
Retail IPTV net subscriber activations increased by 7,668 in Q2 2023 and by 6,307 in the first half of the year, compared to the same periods last year, due to higher activations from richer bundled service offerings, combined with greater Internet pull-through, partly offset by higher deactivations resulting from an increased number of customers coming off of promotional offers, greater competitive intensity and higher substitution with OTT services.
Retail satellite TV net subscriber losses increased by 68.6% in Q2 2023 and by 41.0% in the first six months of the year, compared to the same periods in 2022, driven by aggressive offers from cable competitors, particularly in rural areas, as well as increased substitution with OTT services.
Total retail TV net subscriber losses (IPTV and satellite TV combined) increased by 25.0% in Q2 2023 and by 42.6% in the first six months of the year, compared to the same periods in 2022, driven by higher satellite TV net losses, partly offset by greater IPTV net activations.
Retail IPTV subscribers at June 30, 2023 totaled 2,010,829, up 5.4% from 1,907,564 subscribers reported at the end of Q2 2022. In Q2 2023, our retail IPTV subscriber base increased by 243 as a result of small acquisitions.
Retail satellite TV subscribers at June 30, 2023 totaled 712,559, down 12.7% from 816,583 subscribers at the end of Q2 2022.
Total retail TV subscribers (IPTV and satellite TV combined) at June 30, 2023 were 2,723,388 decreasing by 759 from 2,724,147 subscribers at the end of Q2 2022. In Q2 2023, our retail TV subscriber base increased by 243 as a result of small acquisitions.
Wireline voice
| Q2 2023 | Q2 2022 | Change | % change | YTD 2023 | YTD 2022 | Change | % change | |||||||||||||||||||||||||
| Retail residential NAS lines net losses |
(49,608 | ) | (52,712 | ) | 3,104 | 5.9% | (96,489 | ) | (95,057 | ) | (1,432 | ) | (1.5% | ) | ||||||||||||||||||
| Retail residential NAS lines (1) (2) |
2,101,740 | 2,207,004 | (105,264 | ) | (4.8% | ) | 2,101,740 | 2,207,004 | (105,264 | ) | (4.8% | ) | ||||||||||||||||||||
| (1) | In Q2 2023, our retail residential NAS lines subscriber base increased by 7,458 subscribers as a result of small acquisitions. |
| (2) | In Q4 2022, as a result of the acquisition of Distributel, our retail residential NAS lines subscriber base increased by 64,498 subscribers. |
Retail residential NAS lines net losses improved by 5.9% in Q2 2023, compared to Q2 2022, due to higher activations, reflecting successful bundled services offerings, partly offset by the unfavourable impact of ongoing substitution to wireless and Internet-based technologies. Conversely, during the first six months of the year, retail residential NAS lines net losses grew by 1.5%, compared to the same period in 2022, driven by higher year-over-year deactivations, mainly due to lower deactivations in Q1 2022 as a result of the COVID-19 pandemic, which more than offset the higher year-over-year gross activations.
Retail residential NAS lines at June 30, 2023 of 2,101,740 declined by 4.8% from 2,207,004 lines reported at the end of Q2 2022. This represented an improvement over the 7.3% rate of erosion experienced in Q2 2022, mainly from the impact of the acquisition of Distributel in Q4 2022, as well as other small acquisitions in Q2 2023, which increased our subscriber base by 7,458.
| 22 | BCE INC. 2023 SECOND QUARTER SHAREHOLDER REPORT |
3 MD&A Business segment analysis
Assumptions
As at the date of this MD&A, our forward-looking statements set out in the BCE 2022 Annual MD&A, as updated or supplemented in the BCE 2023 First Quarter MD&A and in this MD&A, are based on certain assumptions including, without limitation, the following assumptions and the assumptions referred to in the Bell Media business segment discussion set out in section 3.2, Bell Media, as well as the economic, market and other assumptions referred to in section 1.3, Assumptions, of this MD&A.
| • | Maintain our market share of national operators’ wireless postpaid mobile phone net additions and growth of our prepaid subscriber base |
| • | Increased competitive intensity and promotional activity across all regions and market segments |
| • | Ongoing expansion and deployment of 5G and 5G+ wireless networks, offering competitive coverage and quality |
| • | Continued diversification of our distribution strategy with a focus on expanding direct-to-consumer (DTC) and online transactions |
| • | Moderating growth in mobile phone blended ARPU, driven by growth in 5G subscriptions, and increased roaming revenue from the easing of travel restrictions implemented as a result of the COVID-19 pandemic, partly offset by reduced data overage revenue due, among others, to the continued adoption of unlimited plans |
| • | Accelerating business customer adoption of advanced 5G, 5G+ and IoT solutions |
| • | Improving wireless handset device availability in addition to stable device pricing and margins |
| • | Further deployment of direct fibre to more homes and businesses within our wireline footprint |
| • | Continued growth in retail Internet and IPTV subscribers |
| • | Increasing wireless and Internet-based technological substitution |
| • | Continued aggressive residential service bundle offers from cable TV competitors in our local wireline areas, moderated by growing our share of competitive residential service bundles |
| • | Continued large business customer migration to IP-based systems |
| • | Ongoing competitive repricing pressures in our business and wholesale markets |
| • | Continued competitive intensity in our small and medium-sized business markets as cable operators and other telecommunications competitors continue to intensify their focus on business customers |
| • | Traditional high-margin product categories challenged by large global cloud and OTT providers of business voice and data solutions expanding into Canada with on-demand services |
| • | Increasing customer adoption of OTT services resulting in downsizing of TV packages |
| • | Growing consumption of OTT TV services and on-demand video streaming, as well as the proliferation of devices, such as tablets, that consume large quantities of bandwidth, will require ongoing capital investment |
| • | Realization of cost savings related to operating efficiencies enabled by a growing direct fibre footprint, changes in consumer behaviour and product innovation, digital adoption, product and service enhancements, expanding self-serve capabilities, new call centre and digital investments, other improvements to the customer service experience, management workforce reductions including attrition and retirements, and lower contracted rates from our suppliers |
| • | No adverse material financial, operational or competitive consequences of changes in or implementation of regulations affecting our communication and technology services business |
| 23 |
3 MD&A Business segment analysis
| 3.2 | Bell Media |
Key business developments
Launch of new advertising solutions and data-enabled products
Bell Media unveiled new and expanded ad solutions, including Addressable TV, new upgrades to its Strategic Audience Management (SAM) tool, expanded inventory on its Bell demand-side platform (DSP), new attribution capabilities and Addressable Audio, accelerating advertising and media buying technology in Canada. Accessible through the Bell Marketing Platform, the suite of data-enabled products combines the innovation, content, and technology of Bell and Bell Media to build an integrated and automated future for Canadian marketers.
| • | Bell Media’s new Addressable TV offering allows advertisers to deliver tailored ads to specific households or devices, based on demographic and behavioural data across Video on Demand (VOD), livestreams, and linear content |
| • | New upgrades to SAM, Bell Media’s proprietary SAM tool, include faster optimization, better proposals, expanded user capabilities, and automation |
| • | Bell DSP, Bell Media’s world-class programmatic advertising marketplace, bolstered its offerings with Addressable Audio, as well as exclusive access to Addressable TV and exclusive Crave inventory. The Addressable Audio technology will come later this year and allows brands to insert digital audio ads in live radio broadcasts and podcasts, with audience targeting |
| • | Bell Analytics has expanded its capabilities by introducing new data sources that promote omni-channel buys, such as TV viewing retargeting, as well as improved scale to Bell Audience Manager, which allows advertisers to create and target custom Connected TV viewers, maximizing the return on their digital investments by layering precise targeting across all Connected TV inventory, including deals available on Bell DSP’s premium video catalogue. Also new to Bell Analytics is Bell Attribution Insights, an innovative capability that provides advertisers with interactive and comprehensive reporting on the effectiveness of their campaigns across Bell Media platforms |
Launch of ad-supported tiers on Crave
Crave expanded its DTC subscription offering with new ad-supported plan options. The new plans give customers a range of options to access Crave’s ever-growing lineup of award-winning premium content. Consumers can sign up for Crave Basic with Ads for $9.99/month, or Crave Standard with Ads for $14.99/month. The ad-free option remains available at $19.99/month as Crave Premium Ad-Free.
Content agreement with Warner Bros. Discovery
On May 2, 2023, Bell Media announced a long-term and exclusive licensing agreement with Warner Bros. Discovery. The agreement includes content from Warner Bros. Discovery’s vast portfolio including HBO Originals, Max Originals, Warner Bros. films, the DC universe, the Wizarding World of Harry Potter, new cable and library television series, and pay and post-pay window rights for Warner Bros. films and library films.
Financial performance analysis
Q2 2023 performance highlights
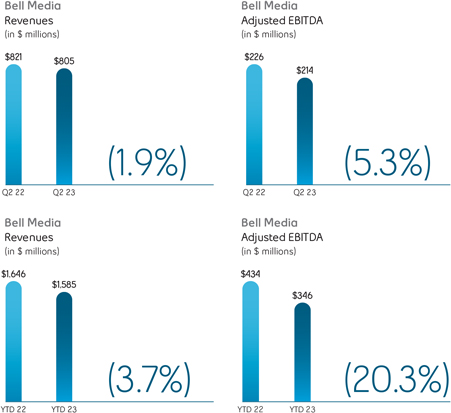
| 24 | BCE INC. 2023 SECOND QUARTER SHAREHOLDER REPORT |
3 MD&A Business segment analysis
Bell Media results
Revenues
| Q2 2023 | Q2 2022 | $ change | % change | YTD 2023 | YTD 2022 | $ change | % change | |||||||||||||||||||||||||
| External revenues |
719 | 733 | (14 | ) | (1.9% | ) | 1,413 | 1,474 | (61 | ) | (4.1% | ) | ||||||||||||||||||||
| Inter-segment revenues |
86 | 88 | (2 | ) | (2.3% | ) | 172 | 172 | – | – | ||||||||||||||||||||||
| Bell Media operating revenues |
805 | 821 | (16 | ) | (1.9% | ) | 1,585 | 1,646 | (61 | ) | (3.7% | ) | ||||||||||||||||||||
Bell Media operating revenues decreased by 1.9% in Q2 2023, compared to the same period last year, due to lower advertising revenues, partly offset by higher subscriber and other revenues. In the first half of the year, operating revenues decreased by 3.7%, compared to the same period last year, due to lower advertising, subscriber and other revenues. Operating revenues included growth from digital revenues (1) of 20% in Q2 2023 and 11% in the first six months of the year, compared to the same periods last year.
| • | Advertising revenues declined by 9.0% in Q2 2023 and by 6.9% in the first six months of the year, compared to the same periods last year, due to lower conventional TV, specialty TV and radio advertising revenues driven by lower demand from advertisers as a result of the current economic uncertainty |
| • | Subscriber revenues grew by 3.9% in Q2 2023, compared to the same period last year, due to the continued growth in Crave and sports streaming DTC subscribers. In the first six months of the year, subscriber revenues decreased by 0.4% year over year, attributable to the benefit last year from a retroactive adjustment related to a contract with a Canadian TV distributor, partly offset by the continued growth in Crave and sports streaming DTC subscribers. |
| • | Other revenues increased in Q2 2023, compared to Q2 2022, due to year-over-year growth from the Formula 1 Canadian Grand Prix. However, in the first six months of the year, this was more than offset by lower program sales. |
Operating costs and adjusted EBITDA
| Q2 2023 | Q2 2022 | $ change | % change | YTD 2023 | YTD 2022 | $ change | % change | |||||||||||||||||||||||||
| Operating costs |
(591 | ) | (595 | ) | 4 | 0.7% | (1,239 | ) | (1,212 | ) | (27 | ) | (2.2% | ) | ||||||||||||||||||
| Adjusted EBITDA |
214 | 226 | (12 | ) | (5.3% | ) | 346 | 434 | (88 | ) | (20.3% | ) | ||||||||||||||||||||
| Adjusted EBITDA margin |
26.6% | 27.5% | (0.9) pts | 21.8% | 26.4% | (4.6) pts | ||||||||||||||||||||||||||
Bell Media operating costs decreased by 0.7% in Q2 2023, compared to the same period last year, due to:
| • | Lower programming costs due to the normalization of the National Hockey League schedules in 2023 |
| • | Cessation of the Canadian Radio-television and Telecommunications Commission (CRTC) Part II broadcasting license fee at the beginning of the quarter |
Partly offset by:
| • | Continued contractual increases to premium content costs |
| • | Higher costs associated with the Formula 1 Canadian Grand Prix |
In the first half of the year, operating costs increased by 2.2% year over year, resulting from higher content and programming costs.
Bell Media adjusted EBITDA decreased by 5.3% in Q2 2023, compared to the same period last year, due to the decline in operating revenues, partly offset by the lower operating costs. Year-to-date adjusted EBITDA decreased by 20.3%, compared to the same period last year, due to lower operating revenues and higher operating costs.
Update to 2023 outlook
As of the date of the BCE 2022 Annual MD&A, we expected to generate positive Bell Media revenue growth in 2023. We now expect Bell Media’s 2023 revenue to be negatively impacted by economic uncertainty, including fears of a potential recession, and the slowdown being experienced in the Canadian advertising market, which is consistent with trends in the global advertising market, as well as due to the work stoppage of the WGA (Writers Guild of America) and SAG-AFTRA (Screen Actors Guild and the American Federation of Television and Radio Artists). Improvement is expected in the medium term, although visibility to the specific timing and pace of recovery is limited.
| (1) | Digital revenues are comprised of advertising revenue from digital platforms including web sites, mobile apps, connected TV apps and Out-of-home (OOH) digital assets/platforms, as well as advertising procured through Bell digital buying platforms and subscription revenue from DTC services and Video on Demand services. |
| 25 |
3 MD&A Business segment analysis
Assumptions
As at the date of this MD&A, our forward-looking statements set out in the BCE 2022 Annual MD&A, as updated or supplemented in the BCE 2023 First Quarter MD&A and in this MD&A, are based on certain assumptions including, without limitation, the following assumptions and the assumptions referred to in the Bell CTS business segment discussion set out in section 3.1, Bell CTS, as well as the economic, market and other assumptions referred to in section 1.3, Assumptions, of this MD&A.
| • | Overall digital revenue expected to reflect continued scaling of our SAM Management TV and DSP buying platforms, as well as DTC subscriber growth contributing towards the advancement of our digital-first media strategy |
| • | Continued escalation of media content costs to secure quality programming |
| • | Continued scaling of Crave through broader content offering, user experience improvements and expanded distribution |
| • | Continued investment in Noovo original programming to better serve our French-language customers with a wider array of content on their preferred platforms |
| • | Leveraging of first-party data to improve targeting, advertisement delivery and attribution |
| • | Ability to successfully acquire and produce highly-rated programming and differentiated content |
| • | Building and maintaining strategic supply arrangements for content across all screens and platforms |
| • | No adverse material financial, operational or competitive consequences of changes in or implementation of regulations affecting our media business |
| 26 | BCE INC. 2023 SECOND QUARTER SHAREHOLDER REPORT |
4 MD&A Financial and capital management
| 4 | Financial and capital management |
This section tells you how we manage our cash and capital resources to carry out our strategy and deliver financial results. It provides an analysis of our financial condition, cash flows and liquidity on a consolidated basis.
| 4.1 | Net debt (1) |
| June 30, 2023 | December 31, 2022 | $ change | % change | |||||||||||||
| Long-term debt |
28,314 | 27,783 | 531 | 1.9% | ||||||||||||
| Debt due within one year |
6,039 | 4,137 | 1,902 | 46.0% | ||||||||||||
| 50% of preferred shares (2) |
1,891 | 1,935 | (44 | ) | (2.3% | ) | ||||||||||
| Cash |
(450 | ) | (99 | ) | (351 | ) | n.m. | |||||||||
| Cash equivalents |
(450 | ) | (50 | ) | (400 | ) | n.m. | |||||||||
| Net debt |
35,344 | 33,706 | 1,638 | 4.9% | ||||||||||||
n.m. : not meaningful
| (1) | Net debt is a non-GAAP financial measure. See section 8.1, Non-GAAP financial measures in this MD&A for more information on this measure. |
| (2) | 50% of outstanding preferred shares of $3,781 million and $3,870 million at June 30, 2023 and December 31, 2022, respectively, are classified as debt consistent with the treatment by some credit rating agencies. |
The increase of $1,902 million in debt due within one year and the increase of $531 million in long-term debt were due to:
| • | the issuance by Bell Canada of Series M-58 Medium term note (MTN) debentures, with a total principal amount of $1,050 million |
| • | the issuance by Bell Canada of Series M-59 MTN debentures, with a total principal amount of $450 million |
| • | the issuance by Bell Canada of Series US-8 Notes, with a total principal amount of $850 million in U.S. dollars ($1,138 million in Canadian dollars) |
Partly offset by:
| • | a decrease in notes payable (net of repayments) of $184 million |
| • | a net decrease of $21 million due to lower lease liabilities and other debt |
| The | increase in cash and cash equivalents of $351 million and $400 million, respectively, was mainly due to: |
| • | $3,612 million of cash flows from operating activities |
| • | $2,703 million of issuance of long-term debt |
| • | $208 million from business dispositions |
Partly offset by:
| • | $2,393 million of capital expenditures |
| • | $1,721 million of dividends paid on BCE common shares |
| • | $645 million repayment of long-term debt |
| • | $221 million for business acquisitions |
| • | $184 million decrease in notes payable (net of repayments) |
| • | $156 million for the purchase of spectrum licences |
| • | $149 million repurchase of a financial liability |
| • | $135 million paid for the purchase on the open market of BCE common shares for the settlement of share-based payments |
| • | $101 million of dividends paid on preferred shares |
| 4.2 | Outstanding share data |
| Common shares outstanding | Number
of shares |
|||||||
| Outstanding, January 1, 2023 |
911,982,866 | |||||||
| Shares issued under deferred share plan |
562 | |||||||
| Shares issued under employee stock option plan |
306,139 | |||||||
| Outstanding, June 30, 2023 |
912,289,567 | |||||||
| Stock options outstanding | Number
of options |
Weighted average exercise price ($) |
||||||
| Outstanding, January 1, 2023 |
7,802,108 | 61 | ||||||
| Exercised (1) |
(306,139 | ) | 60 | |||||
| Forfeited or expired |
(11,408 | ) | 63 | |||||
| Outstanding and exercisable, June 30, 2023 |
7,484,561 | 61 | ||||||
| (1) | The weighted average market share price for options exercised during the six months ended June 30, 2023 was $63. |
| 27 |
4 MD&A Financial and capital management
| 4.3 | Cash flows |
| Q2 2023 | Q2 2022 | $ change | % change | YTD 2023 | YTD 2022 | $ change | % change | |||||||||||||||||||||||||
| Cash flows from operating activities |
2,365 | 2,597 | (232 | ) | (8.9% | ) | 3,612 | 4,313 | (701 | ) | (16.3% | ) | ||||||||||||||||||||
| Capital expenditures |
(1,307 | ) | (1,219 | ) | (88 | ) | (7.2% | ) | (2,393 | ) | (2,178 | ) | (215 | ) | (9.9% | ) | ||||||||||||||||
| Cash dividends paid on preferred shares |
(46 | ) | (34 | ) | (12 | ) | (35.3% | ) | (101 | ) | (67 | ) | (34 | ) | (50.7% | ) | ||||||||||||||||
| Cash dividends paid by subsidiaries to non-controlling interest |
(1 | ) | (14 | ) | 13 | 92.9% | (22 | ) | (25 | ) | 3 | 12.0% | ||||||||||||||||||||
| Acquisition and other costs paid |
5 | 3 | 2 | 66.7% | 5 | 6 | (1 | ) | (16.7% | ) | ||||||||||||||||||||||
| Free cash flow |
1,016 | 1,333 | (317 | ) | (23.8% | ) | 1,101 | 2,049 | (948 | ) | (46.3% | ) | ||||||||||||||||||||
| Business acquisitions |
(196 | ) | – | (196 | ) | n.m. | (221 | ) | (139 | ) | (82 | ) | (59.0% | ) | ||||||||||||||||||
| Business dispositions |
208 | 2 | 206 | n.m. | 208 | 54 | 154 | n.m. | ||||||||||||||||||||||||
| Acquisition and other costs paid |
(5 | ) | (3 | ) | (2 | ) | (66.7% | ) | (5 | ) | (6 | ) | 1 | 16.7% | ||||||||||||||||||
| Spectrum licences |
(145 | ) | – | (145 | ) | n.m. | (156 | ) | – | (156 | ) | n.m. | ||||||||||||||||||||
| Other investing activities |
(16 | ) | 27 | (43 | ) | n.m. | 15 | 17 | (2 | ) | (11.8% | ) | ||||||||||||||||||||
| (Decrease) increase in notes payable |
(101 | ) | 187 | (288 | ) | n.m. | (184 | ) | 656 | (840 | ) | n.m. | ||||||||||||||||||||
| Decrease in securitized receivables |
(500 | ) | – | (500 | ) | n.m. | – | – | – | – | ||||||||||||||||||||||
| Issue of long-term debt |
1,199 | – | 1,199 | n.m. | 2,703 | 945 | 1,758 | n.m. | ||||||||||||||||||||||||
| Repayment of long-term debt |
(346 | ) | (245 | ) | (101 | ) | (41.2% | ) | (645 | ) | (1,503 | ) | 858 | 57.1% | ||||||||||||||||||
| Repurchase of a financial liability |
– | – | – | – | (149 | ) | – | (149 | ) | n.m. | ||||||||||||||||||||||
| Issue of common shares |
8 | 7 | 1 | 14.3% | 18 | 168 | (150 | ) | (89.3% | ) | ||||||||||||||||||||||
| Purchase of shares for settlement of share-based payments |
(42 | ) | (51 | ) | 9 | 17.6% | (135 | ) | (157 | ) | 22 | 14.0% | ||||||||||||||||||||
| Repurchase of preferred shares |
(32 | ) | – | (32 | ) | n.m. | (63 | ) | (115 | ) | 52 | 45.2% | ||||||||||||||||||||
| Cash dividends paid on common shares |
(882 | ) | (839 | ) | (43 | ) | (5.1% | ) | (1,721 | ) | (1,634 | ) | (87 | ) | (5.3% | ) | ||||||||||||||||
| Other financing activities |
(7 | ) | – | (7 | ) | n.m. | (15 | ) | (28 | ) | 13 | 46.4% | ||||||||||||||||||||
| Net (decrease) increase in cash |
(201 | ) | 418 | (619 | ) | n.m. | 351 | 307 | 44 | 14.3% | ||||||||||||||||||||||
| Net increase in cash equivalents |
360 | – | 360 | n.m. | 400 | – | 400 | n.m. | ||||||||||||||||||||||||
n.m.: not meaningful
Cash flows from operating activities and free cash flow
Cash flows from operating activities in the second quarter of 2023 decreased by $232 million, compared to the same period last year, mainly due to lower cash from working capital due in part to timing of supplier payments, higher interest paid and higher income taxes paid, partly offset by higher adjusted EBITDA.
Cash flows from operating activities in the first half of 2023 decreased by $701 million, compared to the same period last year, mainly due to lower cash from working capital from timing of supplier payments, higher interest paid and higher income taxes paid, partly offset by lower contributions to post-employment benefit plans.
Free cash flow in the second quarter and first half of 2023 decreased by $317 million and $948 million, respectively, compared to the same periods last year, due to lower cash flows from operating activities, excluding cash from acquisition and other costs paid, and higher capital expenditures.
Capital expenditures
| Q2 2023 | Q2 2022 | $ change | % change | YTD 2023 | YTD 2022 | $ change | % change | |||||||||||||||||||||||||
| Bell CTS |
1,271 | 1,190 | (81 | ) | (6.8% | ) | 2,323 | 2,126 | (197 | ) | (9.3% | ) | ||||||||||||||||||||
| Capital intensity (1) |
23.7% | 23.2% | (0.5) pts | 21.7% | 20.7% | (1.0) pts | ||||||||||||||||||||||||||
| Bell Media |
36 | 29 | (7 | ) | (24.1% | ) | 70 | 52 | (18 | ) | (34.6% | ) | ||||||||||||||||||||
| Capital intensity |
4.5% | 3.5% | (1.0) pts | 4.4% | 3.2% | (1.2) pts | ||||||||||||||||||||||||||
| BCE |
1,307 | 1,219 | (88 | ) | (7.2% | ) | 2,393 | 2,178 | (215 | ) | (9.9% | ) | ||||||||||||||||||||
| Capital intensity |
21.5% | 20.8% | (0.7) pts | 19.7% | 18.6% | (1.1) pts | ||||||||||||||||||||||||||
| (1) | Capital intensity is defined as capital expenditures divided by operating revenues. |
BCE capital expenditures of $1,307 million in Q2 2023 and $2,393 million year to date, increased by 7.2% or $88 million and by 9.9% or $215 million, respectively, compared to the same periods last year. This corresponded to a capital intensity ratio of 21.5% in Q2 2023 and 19.7% in the first half of the year, up 0.7 pts and 1.1 pts, respectively, over the same periods last year. The year-over-year growth in capital expenditures reflected:
| • | Higher capital spending in Bell CTS of $81 million in Q2 2023 and $197 million in the first six months of the year, compared to the same periods last year, due to timing of capital spend to further expand our FTTP network and greater investment to support subscriber growth, partly offset by slower pace of spending on the rollout of our mobile 5G network |
| • | Higher capital expenditures at Bell Media of $7 million in Q2 2023 and $18 million in the first half of the year, compared to the same periods last year, mainly driven by investments to support digital growth. The year-over-year increase in the first six months of the year also reflected higher spending on studio expansions. |
| 28 | BCE INC. 2023 SECOND QUARTER SHAREHOLDER REPORT |
4 MD&A Financial and capital management
Business acquisitions
On June 1, 2023, Bell acquired FX Innovation, a Montréal-based provider of cloud-focused managed and professional services and workflow automation solutions for business clients, for cash consideration of $157 million, of which $12 million is payable within two years and an estimated $6 million of additional cash consideration contingent on the achievement of certain performance objectives. This contingent consideration is expected to be settled by 2027 and the maximum amount payable is $7 million. The acquisition of FX Innovation aims to position Bell as a technology services leader for our enterprise customers. The results of FX Innovation are included in our Bell CTS segment.
In February 2022, Bell acquired EBOX and other related companies, which provide Internet, telephone and TV services to consumers and businesses in Québec and parts of Ontario for cash consideration of $153 million ($139 million net of cash acquired).
Business dispositions
On May 3, 2023, we completed the previously announced sale of our 63% ownership in certain production studios, which were included in our Bell Media segment, for net cash proceeds of $211 million.
On March 1, 2022, we completed the sale of our wholly-owned subsidiary, Createch, for cash proceeds of $54 million.
Spectrum licences
On May 19, 2023, after approval from Innovation, Science and Economic Development Canada (ISED), Bell Mobility Inc. obtained the right to use, through subordination, certain of Xplore Inc.’s 3500 megahertz spectrum licences in Québec, for $145 million.
Debt instruments
2023
In the second quarter of 2023, we issued debt, net of repayments. This included:
| • | $1,199 million issuance of long-term debt comprised of the issuance of Series US-8 Notes with a total principal amount of $850 million in U.S. dollars ($1,138 million in Canadian dollars) and other debt of $62 million, partly offset by $1 million of discounts on our debt issuances |
Partly offset by:
| • | $500 million decrease in securitized receivables |
| • | $346 million repayment of long-term debt comprised of net payments of leases and other debt |
| • | $101 million repayment (net of issuances) of notes payable |
In the first half of 2023, we issued debt, net of repayments. This included:
| • | $2,703 million issuance of long-term debt comprised of the issuance of Series M-58 MTN debentures with a total principal amount of $1,050 million and series M-59 MTN Debentures with a total principal amount of $450 million, the issuance of Series US-8 Notes, with a total principal amount of $850 million in U.S. dollars ($1,138 million in Canadian dollars) and the issuance of other debt of $70 million, partly offset by $5 million of discounts on our debt issuances |
Partly offset by:
| • | $645 million repayment of long-term debt comprised of net payments of leases and other debt |
| • | $184 million repayment (net of issuances) of notes payable |
2022
In the second quarter of 2022, we repaid debt, net of issuances. This included:
| • | $245 million repayment of long-term debt comprised of net payments of leases and other debt |
Partly offset by:
| • | $187 million issuance (net of repayments) of notes payable |
In the first half of 2022, we issued debt, net of repayments. This included:
| • | $945 million issuance of long-term debt comprised of the issuance of Series US-7 Notes, with a total principal amount of $750 million in U.S. dollars ($954 million in Canadian dollars), partly offset by a $9 million discount on our debt issuance |
| • | $656 million issuance (net of repayments) of notes payable |
Partly offset by:
| • | $1,503 million repayment of long-term debt comprised of the early redemption of Series M-26 MTN debentures with a total principal amount of $1 billion in Canadian dollars and net payments of leases and other debt of $503 million |
Consolidation of MLSE ownership under BCE (Repurchase of a financial liability)
In January 2023, BCE repurchased the 9% interest held by the BCE Master Trust Fund (Master Trust Fund), a trust fund that holds pension fund investments serving the pension obligations of the BCE group pension plan participants, in Maple Leaf Sports & Entertainment Ltd. (MLSE) for a cash consideration of $149 million, as a result of BCE’s obligation to repurchase the Master Trust Fund’s interest in MLSE at that price.
| 29 |
4 MD&A Financial and capital management
Issuance of common shares
The issuance of common shares in the second quarter in 2023 increased by $1 million, compared to the same period in 2022, due to a higher number of exercised stock options.
The issuance of common shares on a year-to-date basis in 2023 decreased by $150 million, compared to the same period in 2022, due to a lower number of exercised stock options.
Repurchase of preferred shares
2023
For the three and six months ended June 30, 2023, BCE repurchased and canceled 1,848,950 and 3,560,950 First Preferred Shares with a stated capital of $46 million and $89 million for a total cost of $32 million and $63 million, respectively. The remaining $14 million and $26 million were recorded to contributed surplus for the three and six months ended June 30, 2023, respectively.
2022
In Q1 2022, BCE redeemed its 4,600,000 issued and outstanding Cumulative Redeemable First Preferred Shares, Series AO for a total cost of $115 million.
Cash dividends paid on common shares
In the second quarter of 2023, cash dividends paid on common shares increased by $43 million compared to Q2 2022, due to a higher dividend paid in Q2 2023 of $0.9675 per common share compared to $0.92 per common share in Q2 2022.
In the first half of 2023, cash dividends paid on common shares increased by $87 million compared to 2022, due to a higher dividend paid in the first half of 2023 of $1.8875 per common share compared to $1.7950 per common share for the same period last year.
| 4.4 | Post-employment benefit plans |
For the three months ended June 30, 2023, we recorded a decrease in our post-employment benefit plans and a loss, before taxes, in OCI of $187 million, due in part to a lower-than-expected return on plan assets of 0.8% partly offset by a decrease in the effect of the asset limit. The discount rate remained unchanged at 5.0% compared to March 31, 2023.
For the six months ended June 30, 2023, we recorded a decrease in our post-employment benefit plans and a loss, before taxes, in OCI of $361 million, due to a lower actual discount rate of 5.0% at June 30, 2023, as compared to 5.3% at December 31, 2022, partly offset by a higher-than-expected return on plan assets of 4.1% and a decrease in the effect of the asset limit.
For the three months ended June 30, 2022, we recorded an increase in our post-employment benefit plans and a gain, before taxes, in OCI of $354 million, due to a higher actual discount rate of 5.3% at June 30, 2022, compared to 4.3% at March 31, 2022, partly offset by a loss on plan assets and an increase in the effect of the asset limit.
For the six months ended June 30, 2022, we recorded an increase in our post-employment benefit plans and a gain, before taxes, in OCI of $1,233 million, due to a higher actual discount rate of 5.3% at June 30, 2022, as compared to 3.2% at December 31, 2021, partly offset by a loss on plan assets and an increase in the effect of the asset limit.
| 30 | BCE INC. 2023 SECOND QUARTER SHAREHOLDER REPORT |
4 MD&A Financial and capital management
| 4.5 | Financial risk management |
Fair value
The following table provides the fair value details of financial instruments measured at amortized cost in the consolidated statements of financial position.
| June 30, 2023 | December 31, 2022 | |||||||||||||||||||
| Classification | Fair value methodology | Carrying value |
Fair value |
Carrying value |
Fair value |
|||||||||||||||
| Debt securities |
Debt due within one year | Quoted market price of debt | 27,509 | 25,779 | 25,061 | 23,026 | ||||||||||||||
| and other debt |
and long-term debt | |||||||||||||||||||
The following table provides the fair value details of financial instruments measured at fair value in the consolidated statements of financial position.
| Fair value | ||||||||||||||||
| Classification | |
Carrying value of asset |
|
Quoted prices in active markets for identical assets (level 1) |
|
Observable market data (level 2) |
(1) |
|
Non-observable market inputs (level 3) |
(2) |
||||||
| June 30, 2023 |
||||||||||||||||
| Publicly-traded and privately-held investments (3) |
Other non-current assets | 225 | 8 | – | 217 | |||||||||||
| Derivative financial instruments |
Other current assets, trade payables and other liabilities, other non-current assets and liabilities | (157 | ) | – | (157 | ) | – | |||||||||
| Other |
Other non-current assets and liabilities | 122 | – | 198 | (76 | ) | ||||||||||
| December 31, 2022 |
||||||||||||||||
| Publicly-traded and privately-held investments (3) |
Other non-current assets | 215 | 9 | – | 206 | |||||||||||
| Derivative financial instruments |
Other current assets, trade payables and other liabilities, other non-current assets and liabilities | 72 | – | 72 | – | |||||||||||
| MLSE financial liability (4) |
Trade payables and other liabilities | (149 | ) | – | – | (149 | ) | |||||||||
| Other |
Other non-current assets and liabilities | 108 | – | 184 | (76 | ) | ||||||||||
| (1) | Observable market data such as equity prices, interest rates, swap rate curves and foreign currency exchange rates. |
| (2) | Non-observable market inputs such as discounted cash flows and earnings multiples. A reasonable change in our assumptions would not result in a significant increase (decrease) to our level 3 financial instruments. |
| (3) | Unrealized gains and losses are recorded in OCI in the statements of comprehensive income and are reclassified from Accumulated OCI to Deficit in the statements of financial position when realized. |
| (4) | Represented BCE’s obligation to repurchase the Master Trust Fund’s 9% interest in MLSE at a price not less than an agreed minimum price. In January 2023, BCE repurchased the interest held by the Master Trust Fund, a trust fund that holds pension fund investments serving the pension obligations of the BCE group pension plan participants, in MLSE for a cash consideration of $149 million. |
Market risk
Currency exposures
In Q2 2023, we entered into cross currency interest rate swaps with a notional amount of $850 million in U.S. dollars ($1,138 million in Canadian dollars) to hedge the U.S. currency exposure of our US-8 Notes maturing in 2033. The fair value of these cross currency interest rate swaps at June 30, 2023 was a net liability of $14 million recognized in Other current assets, Trade payables and other liabilities and Other non-current liabilities in the statements of financial position. See section 4.1, Net debt, in this MD&A for additional details.
A 10% depreciation (appreciation) in the value of the Canadian dollar relative to the U.S. dollar would result in a gain of $26 million (loss of $85 million) recognized in net earnings at June 30, 2023 and a gain of $122 million (loss of $95 million) recognized in OCI at June 30, 2023, with all other variables held constant.
A 10% depreciation (appreciation) in the value of the Canadian dollar relative to the Philippine peso would result in a gain (loss) of $8 million recognized in OCI at June 30, 2023, with all other variables held constant.
| 31 |
4 MD&A Financial and capital management
The following table provides further details on our outstanding foreign currency forward contracts and options as at June 30, 2023.
| Type of hedge | Buy currency |
Amount to receive |
Sell currency |
Amount to pay |
Maturity | Hedged item | ||||||||||||||||||
| Cash flow (1) |
USD | 1,217 | CAD | 1,608 | 2023 | Loans | ||||||||||||||||||
| Cash flow |
USD | 350 | CAD | 468 | 2023 | Commercial paper | ||||||||||||||||||
| Cash flow |
USD | 432 | CAD | 537 | 2023 | Anticipated purchases | ||||||||||||||||||
| Cash flow |
PHP | 1,538 | CAD | 36 | 2023 | Anticipated purchases | ||||||||||||||||||
| Cash flow |
USD | 824 | CAD | 1,046 | 2024 | Anticipated purchases | ||||||||||||||||||
| Cash flow |
PHP | 2,885 | CAD | 69 | 2024 | Anticipated purchases | ||||||||||||||||||
| Cash flow |
USD | 60 | CAD | 78 | 2025 | Anticipated purchases | ||||||||||||||||||
| Economic |
USD | 78 | CAD | 98 | 2023 | Anticipated purchases | ||||||||||||||||||
| Economic – call options |
CAD | 112 | USD | 78 | 2023 | Anticipated purchases | ||||||||||||||||||
| Economic – put options |
USD | 165 | CAD | 214 | 2023 | Anticipated purchases | ||||||||||||||||||
| Economic – call options |
USD | 116 | CAD | 155 | 2023 | Anticipated purchases | ||||||||||||||||||
| Economic |
USD | 130 | CAD | 171 | 2024 | Anticipated purchases | ||||||||||||||||||
| Economic – options (2) |
USD | 120 | CAD | 153 | 2024 | Anticipated purchases | ||||||||||||||||||
| Economic – call options |
USD | 244 | CAD | 327 | 2024 | Anticipated purchases | ||||||||||||||||||
| Economic – call options |
CAD | 225 | USD | 156 | 2024 | Anticipated purchases | ||||||||||||||||||
| Economic – put options |
USD | 519 | CAD | 675 | 2024 | Anticipated purchases | ||||||||||||||||||
| Economic – options (2) |
USD | 60 | CAD | 78 | 2025 | Anticipated purchases | ||||||||||||||||||
| Economic – call options |
USD | 540 | CAD | 694 | 2025 | Anticipated purchases | ||||||||||||||||||
| Economic – put options |
USD | 360 | CAD | 461 | 2025 | Anticipated purchases | ||||||||||||||||||
| (1) | Forward contracts to hedge loans secured by receivables under our securitization program. |
| (2) | Foreign currency options with a leverage provision and a profit cap limitation. |
Interest rate exposures
In Q2 2023, we sold interest rate swaptions with a notional amount of $375 million, for $3 million, to hedge economically the fair value of our Series M-52 MTN debentures. These swaptions were exercised in Q2 2023, giving rise to a loss of $1 million recognized in Other expense in the income statements. The resulting interest rate swaps with a notional amount of $375 million hedge the fair value of our Series M-52 MTN debentures maturing in 2030. The fair value of these interest rate swaps at June 30, 2023 is a liability of $5 million recognized in Trade payables and other liabilities and Other non-current liabilities in the statements of financial position.
In Q2 2023, we sold interest rate swaptions with a notional amount of $100 million maturing in Q4 2023, for $1 million, to hedge economically the fair value of our Series M-57 MTN debentures. The fair value of these swaptions at June 30, 2023 was a liability of $1 million recognized in Trade payables and other liabilities in the statements of financial position.
In Q2 2023, we entered into interest rate swaps with a notional amount of $200 million to hedge the fair value of our Series M-57 MTN debentures maturing in 2032. The fair value of these interest rate swaps at June 30, 2023 is a net asset of $2 million recognized in Other non-current assets and Trade payables and other liabilities in the statements of financial position.
In Q1 2023, we sold interest rate swaptions with a notional amount of $250 million, for $2 million, to hedge economically the fair value of our Series M-53 MTN debentures. In Q1 2023, we also sold interest rate swaptions with a notional amount of $425 million, for $2 million, to hedge economically the floating interest rate exposure relating to our Series M-53 MTN debentures. These swaptions matured unexercised in Q2 2023. A gain of $1 million and $4 million for the three and six months ended June 30, 2023, respectively, relating to these interest rate swaptions is recognized in Other expense in the income statements.
In 2022, we entered into interest rate swaps with a notional amount of $500 million to hedge the fair value of our Series M-53 MTN debentures maturing in 2027. The fair value of these interest rate swaps at June 30, 2023 and December 31, 2022 is a liability of $22 million and $14 million, respectively, recognized in Trade payables and other liabilities and Other non-current liabilities in the statements of financial position.
In 2022, we entered into cross currency basis rate swaps maturing in 2023 with a notional amount of $638 million to hedge economically the basis rate exposure on future debt issuances. In Q2 2023, the maturity of $318 million of these cross currency basis rate swaps was extended to 2024 resulting in an increase in their notional amount of $6 million for a total notional amount of $644 million at June 30, 2023. The fair value of these cross currency basis rate swaps at June 30, 2023 and December 31, 2022 was a liability of $27 million and $33 million, respectively, recognized in Trade payables and other liabilities and Other non-current liabilities in the statements of financial position. A loss of $7 million and a gain of $6 million for the three and six months ended June 30, 2023, respectively, relating to these basis rate swaps is recognized in Other expense in the income statements.
We use leveraged interest rate options to hedge economically the dividend rate resets on $582 million of our preferred shares which had varying reset dates in 2021 for the periods ending in 2026. The fair value of these leveraged interest rate options at June 30, 2023 and December 31, 2022 was nil and a liability of $1 million, respectively, recognized in Trade payables and other liabilities and Other non-current liabilities in the statements of financial position. A gain of $1 million for the three and six months ended June 30, 2023, relating to these leveraged interest rate options is recognized in Other expense in the income statements.
A 1% increase (decrease) in interest rates would result in a loss of $27 million (gain of $23 million) recognized in net earnings at June 30, 2023, with all other variables held constant.
A 0.1% increase (decrease) in cross currency basis swap rates would result in a gain (loss) of $9 million recognized in net earnings at June 30, 2023, with all other variables held constant.
| 32 | BCE INC. 2023 SECOND QUARTER SHAREHOLDER REPORT |
4 MD&A Financial and capital management
Equity price exposures
We use equity forward contracts on BCE’s common shares to hedge economically the cash flow exposure related to the settlement of equity settled share-based compensation plans. The fair value of our equity forward contracts at June 30, 2023 and December 31, 2022 was a net liability of $34 million and $48 million, respectively, recognized in Other current assets, Trade payables and other liabilities, Other non-current assets and Other non-current liabilities in the statements of financial position. A gain of $1 million and $19 million for the three and six months ended June 30, 2023, respectively, relating to these equity forward contracts is recognized in Other expense in the income statements.
A 5% increase (decrease) in the market price of BCE’s common shares would result in a gain (loss) of $33 million recognized in net earnings at June 30, 2023, with all other variables held constant.
| 4.6 | Credit ratings |
BCE’s and Bell Canada’s key credit ratings remain unchanged from those described in the BCE 2022 Annual MD&A.
| 4.7 | Liquidity |
This section contains forward-looking statements, including relating to the expectation that our available liquidity, 2023 estimated cash flows from operations and capital markets financing will permit us to meet our cash requirements in 2023. Refer to the section Caution regarding forward-looking statements at the beginning of this MD&A.
Available liquidity
Total available liquidity (1) at June 30, 2023 was $4.4 billion, comprised of $450 million in cash, $450 million in cash equivalents, $700 million available under our securitized receivables program and $2.8 billion available under our $3.5 billion committed revolving and expansion credit facilities (given $461 million of commercial paper outstanding and $199 million drawn bank advances).
We expect that our available liquidity, 2023 estimated cash flows from operations and capital markets financing will permit us to meet our cash requirements in 2023 for capital expenditures, post-employment benefit plans funding, dividend payments, the payment of contractual obligations, maturing debt, ongoing operations and other cash requirements.
We continuously monitor our operations, capital markets and the Canadian economy with the objective of maintaining adequate liquidity.
| 4.8 | Litigation |
Recent developments in legal proceedings
The following is an update to the legal proceedings described in the BCE 2022 AIF under section 8, Legal proceedings.
Class action concerning neighbourhood marketing practices
On July 4, 2023, the Québec Superior Court delivered its decision authorizing the class action for which an application for authorization to institute a class action was filed on November 24, 2021. Bell Canada has until August 11, 2023 to appeal the decision to the Court of Appeal.
| (1) | Available liquidity is a non-GAAP financial measure. Refer to section 8.1, Non-GAAP financial measures in this MD&A for more information on this measure. |
| 33 |
5 MD&A Quarterly financial information
| 5 | Quarterly financial information |
BCE’s Q2 2023 Financial Statements were prepared in accordance with International Financial Reporting Standards (IFRS), as issued by the International Accounting Standards Board (IASB), under International Accounting Standard (IAS) 34, Interim Financial Reporting and were approved by BCE’s board of directors on August 2, 2023.
The following table, which was also prepared in accordance with IFRS, shows selected consolidated financial data of BCE for the eight most recent completed quarters.
| 2023 | 2022 | 2021 | ||||||||||||||||||||||||||||||
| Q2 | Q1 | Q4 | Q3 | Q2 | Q1 | Q4 | Q3 | |||||||||||||||||||||||||
| Operating revenues |
||||||||||||||||||||||||||||||||
| Service |
5,303 | 5,222 | 5,353 | 5,193 | 5,233 | 5,177 | 5,243 | 5,099 | ||||||||||||||||||||||||
| Product |
763 | 832 | 1,086 | 831 | 628 | 673 | 966 | 737 | ||||||||||||||||||||||||
| Total operating revenues |
6,066 | 6,054 | 6,439 | 6,024 | 5,861 | 5,850 | 6,209 | 5,836 | ||||||||||||||||||||||||
| Adjusted EBITDA |
2,645 | 2,538 | 2,437 | 2,588 | 2,590 | 2,584 | 2,430 | 2,558 | ||||||||||||||||||||||||
| Severance, acquisition and other costs |
(100 | ) | (49 | ) | (19 | ) | (22 | ) | (40 | ) | (13 | ) | (63 | ) | (50 | ) | ||||||||||||||||
| Depreciation |
(936 | ) | (918 | ) | (922 | ) | (914 | ) | (933 | ) | (891 | ) | (925 | ) | (902 | ) | ||||||||||||||||
| Amortization |
(296 | ) | (283 | ) | (270 | ) | (267 | ) | (266 | ) | (260 | ) | (251 | ) | (245 | ) | ||||||||||||||||
| Net earnings |
397 | 788 | 567 | 771 | 654 | 934 | 658 | 813 | ||||||||||||||||||||||||
| Net earnings attributable to common shareholders |
329 | 725 | 528 | 715 | 596 | 877 | 625 | 757 | ||||||||||||||||||||||||
| EPS – basic and diluted |
0.37 | 0.79 | 0.58 | 0.78 | 0.66 | 0.96 | 0.69 | 0.83 | ||||||||||||||||||||||||
| Weighted average number of common shares outstanding – basic (millions) |
912.2 | 912.1 | 912.0 | 911.9 | 911.9 | 910.1 | 908.8 | 906.9 | ||||||||||||||||||||||||
| 34 | BCE INC. 2023 SECOND QUARTER SHAREHOLDER REPORT |
6 MD&A Regulatory environment
| 6 | Regulatory environment |
The following is an update to the regulatory initiatives and proceedings described in the BCE 2022 Annual MD&A under section 3.3, Principal business risks and section 8, Regulatory environment, as updated in the BCE 2023 First Quarter MD&A.
Telecommunications Act
Review of mobile wireless services
On July 13, 2023, the CRTC accepted a request from Quebecor Media Inc. (Quebecor) to initiate Final Offer Arbitration (FOA) in respect of rates for mobile virtual network operator (MVNO) access service from Bell Mobility Inc. The parties’ submissions in the FOA are expected to be completed in August with the CRTC’s decision expected to be released sometime following completion of the submissions.
The CRTC previously accepted a joint request for FOA from Rogers Communications Canada Inc. and Quebecor. On July 24, 2023, the CRTC issued its decision in that arbitration, selecting the rate proposed by Quebecor. In the decision, the CRTC made a number of findings or determinations that indicate a continued trend toward disregarding or downplaying the importance of recognizing and providing incentives for investment in telecommunications networks in Canada. Such adverse regulatory decisions, particularly if they directly implicate Bell, are expected to impact the specific nature, magnitude, location and timing of our future wireless and wireline investment decisions.
Review of the approach to rate setting for wholesale telecommunications services
In a decision released on July 7, 2023, the CRTC reaffirmed the use of its existing long run incremental costing approach (called Phase II) to setting wholesale rates. The key change in the decision is that the CRTC intends to take “market-level” information (e.g., stand-alone retail rates, promotional rates, and comparisons to rates for similar services in other countries) into account when setting rates. It is unclear how this will be implemented and appears designed to set rates that favour resellers with the risk that those rates will undermine our incentives for facilities-based investment. At this time, it is unclear what impact, if any, this decision will have on our business and financial results.
Broadcasting Act
Broadcasting Notice of Consultation 2023-138
On May 12, 2023, the CRTC issued Broadcasting Notice of Consultation 2023-138, The Path Forward – Working towards a modernized regulatory framework regarding the contributions to support Canadian and Indigenous content. This Notice represents the first of three steps to develop an updated regulatory framework for broadcasting undertakings, including online undertakings. A key part of this new framework is to establish the conditions under which online services would be required to make financial contributions, including initial base contributions, to support the creation and discoverability of Canadian and Indigenous content. It will also determine who the recipients of the initial base contributions will be. While the CRTC has not yet initiated its public consultations for Steps 2 and 3, these subsequent proceedings will focus on the overall framework for both traditional and online undertakings, with a focus on how to support the creation of Canadian and Indigenous content beyond financial contribution requirements, as well as diversity, inclusion and discoverability issues. In Step 3, the CRTC intends to finalize each undertaking’s or ownership group’s contribution requirements, presumably as part of our group licence renewal. The timing and outcome of all of these proceedings is unknown. Therefore, the impact that these regulatory changes could have on our business and financial results is unclear at this time.
Broadcasting Policy Direction
On June 8, 2023, the Government of Canada released its proposed Policy Direction, which directs the CRTC on how to implement the amendments to the Broadcasting Act (Bill C-11). As drafted, the Direction requires the CRTC to focus on ensuring strong support for Canadian and Indigenous programming, as well as to consider the importance of sustainable support for local and regional news by the Canadian broadcasting system. In addition, the proposed Direction also requires the CRTC to minimize the regulatory burden on the Canadian broadcasting system. A 45-day period for public comments ended on July 25, 2023 and the Direction will now be finalized and formally provided to the CRTC. At this time, it is unclear what impact, if any, the Direction could have on our business and financial results.
Other
Bill C-18, the Online News Act
On June 22, 2023, Bill C-18, An Act respecting online communications platforms that make news content available to persons in Canada (the Online News Act) received royal assent. The Act requires digital news intermediaries, such as Google and Meta, that share news content produced by other news outlets to negotiate commercial arrangements with those outlets, compensating them for the news content shared on digital platforms. The legislation entitles Bell Media’s general news services, such as CTV and Noovo, to compensation. The framework for those negotiations is set by the CRTC. The details of this compensation framework still need to be established in regulations as well as through the CRTC’s consultation processes as the CRTC is responsible for overseeing negotiations and potential mediations with respect to compensation under the Act. Moreover, it is unclear the level of compensation that may be established under the Act, particularly in light of the recent announcement of Meta to block links to Canadian news content altogether rather than being subject to the Act. In response, Bell Media (as well as other broadcasting and media companies and the Federal Government) have announced that they are pausing advertising on Meta’s Facebook and Instagram. Therefore, the impact that the legislative changes could have on our business and financial results is unknown at this time.
| 35 |
7 MD&A Accounting policies
| 7 | Accounting policies |
BCE’s Q2 2023 Financial Statements were prepared in accordance with IFRS, as issued by the IASB, under IAS 34 – Interim Financial Reporting and were approved by BCE’s board of directors on August 2, 2023. These financial statements were prepared using the same basis of presentation, accounting policies and methods of computation as outlined in Note 2, Significant accounting policies in BCE’s consolidated financial statements for the year ended December 31, 2022, except as noted below. BCE’s Q2 2023 Financial Statements do not include all of the notes required in the annual financial statements.
Adoption of amendments to accounting standards
As required, we adopted the following amendments to accounting standards issued by the IASB in May 2023.
| Standard | Description | Impact | ||||
| International Tax Reform – Pillar Two Model Rules – Amendments to IAS 12 – Income Taxes | These amendments require that entities apply IAS 12 to income taxes arising from tax law enacted or substantively enacted to implement the Pillar Two model rules published by the Organisation for Economic Co-operation and Development, including tax law that implements qualified domestic minimum top-up taxes described in those rules (Pillar Two). As an exception to the requirements in IAS 12, entities do not recognize or disclose information about deferred tax assets and liabilities related to Pillar Two. | In May 2023, we adopted the amendments to IAS 12 retrospectively. As required, we applied the exception and do not recognize or disclose information about deferred tax assets and liabilities related to Pillar Two.
The adoption of these amendments did not have a significant impact on our financial statements. |
||||
|
Future changes to accounting standards
The following amendments to accounting standards issued by the IASB have not yet been adopted by BCE.
|
||||||
| Standard | Description | Impact | Effective date | |||
| Disclosure of Accounting Policies – Amendments to IAS 1 – Presentation of Financial Statements | These amendments require that entities disclose material accounting policies, as defined, instead of significant accounting policies. | We are currently assessing the impact of these amendments on the disclosure of our accounting policies. | Effective for annual reporting periods beginning on or after January 1, 2023 and any changes will be reflected in our financial statements for the year ended December 31, 2023. | |||
| 36 | BCE INC. 2023 SECOND QUARTER SHAREHOLDER REPORT |
8 MD&A Non-GAAP financial measures, other financial measures and key performance indicators (KPIs)
| 8 | Non-GAAP financial measures, other financial measures and key performance indicators (KPIs) |
BCE uses various financial measures to assess its business performance. Certain of these measures are calculated in accordance with International Financial Reporting Standards (IFRS or GAAP) while certain other measures do not have a standardized meaning under GAAP. We believe that our GAAP financial measures, read together with adjusted non-GAAP and other financial measures, provide readers with a better understanding of how management assesses BCE’s performance.
National Instrument 52-112, Non-GAAP and Other Financial Measures Disclosure (NI 52-112), prescribes disclosure requirements that apply to the following specified financial measures:
| • | Non-GAAP financial measures; |
| • | Non-GAAP ratios; |
| • | Total of segments measures; |
| • | Capital management measures; and |
| • | Supplementary financial measures. |
This section provides a description and classification of the specified financial measures contemplated by NI 52-112 that we use to explain our financial results except that, for supplementary financial measures, an explanation of such measures is provided where they are first referred to if the supplementary financial measures’ labelling is not sufficiently descriptive.
| 8.1 | Non-GAAP financial measures |
A non-GAAP financial measure is a financial measure used to depict our historical or expected future financial performance, financial position or cash flow and, with respect to its composition, either excludes an amount that is included in, or includes an amount that is excluded from, the composition of the most directly comparable financial measure disclosed in BCE’s consolidated primary financial statements. We believe that non-GAAP financial measures are reflective of our on-going operating results and provide readers with an understanding of management’s perspective on and analysis of our performance.
Below are descriptions of the non-GAAP financial measures that we use to explain our results as well as reconciliations to the most directly comparable IFRS financial measures.
Adjusted net earnings
The term adjusted net earnings does not have any standardized meaning under IFRS. Therefore, it is unlikely to be comparable to similar measures presented by other issuers.
We define adjusted net earnings as net earnings attributable to common shareholders before severance, acquisition and other costs, net mark-to-market losses (gains) on derivatives used to economically hedge equity settled share-based compensation plans, net equity losses (gains) on investments in associates and joint ventures, net losses (gains) on investments, early debt redemption costs, impairment of assets and discontinued operations, net of tax and NCI.
We use adjusted net earnings and we believe that certain investors and analysts use this measure, among other ones, to assess the performance of our businesses without the effects of severance, acquisition and other costs, net mark-to-market losses (gains) on derivatives used to economically hedge equity settled share-based compensation plans, net equity losses (gains) on investments in associates and joint ventures, net losses (gains) on investments, early debt redemption costs, impairment of assets and discontinued operations, net of tax and NCI. We exclude these items because they affect the comparability of our financial results and could potentially distort the analysis of trends in business performance. Excluding these items does not imply they are non-recurring.
The most directly comparable IFRS financial measure is net earnings attributable to common shareholders.
The following table is a reconciliation of net earnings attributable to common shareholders to adjusted net earnings on a consolidated basis.
| Q2 2023 | Q2 2022 | YTD 2023 | YTD 2022 | |||||||||||||
| Net earnings attributable to common shareholders |
329 | 596 | 1,054 | 1,473 | ||||||||||||
| Reconciling items: |
||||||||||||||||
| Severance, acquisition and other costs |
100 | 40 | 149 | 53 | ||||||||||||
| Net mark-to-market (gains) losses on derivatives used to economically hedge equity settled share-based compensation plans |
(1 | ) | 81 | (19 | ) | 6 | ||||||||||
| Net equity losses on investments in associates and joint ventures |
377 | 42 | 377 | 42 | ||||||||||||
| Net gains on investments |
(79 | ) | (16 | ) | (79 | ) | (53 | ) | ||||||||
| Early debt redemption costs |
1 | – | 1 | 18 | ||||||||||||
| Impairment of assets |
– | 106 | 34 | 108 | ||||||||||||
| Income taxes for the above reconciling items |
(5 | ) | (62 | ) | (23 | ) | (49 | ) | ||||||||
| NCI for the above reconciling items |
– | 4 | – | 4 | ||||||||||||
| Adjusted net earnings |
722 | 791 | 1,494 | 1,602 | ||||||||||||
| 37 |
8 MD&A Non-GAAP financial measures, other financial measures and key performance indicators (KPIs)
Adjusted net interest expense
The term adjusted net interest expense does not have any standardized meaning under IFRS. Therefore, it is unlikely to be comparable to similar measures presented by other issuers.
We define adjusted net interest expense as twelve-month trailing net interest expense as shown in our consolidated statements of cash flows, plus 50% of twelve-month trailing net earnings attributable to preferred shareholders as shown in our consolidated income statements.
We use adjusted net interest expense as a component in the calculation of the adjusted EBITDA to adjusted net interest expense ratio, which is a capital management measure. For further details on the adjusted EBITDA to adjusted net interest expense ratio, see section 8.4, Capital management measures. We use, and believe that certain investors and analysts use, the adjusted EBITDA to adjusted net interest expense ratio, among other measures, to evaluate the financial health of the company.
The most directly comparable IFRS financial measure is net interest expense. The following table is a reconciliation of net interest expense to adjusted net interest expense on a consolidated basis.
| Q2 2023 | Q2 2022 | |||||||
| Net interest expense (six months ended June 30, 2023 and 2022, respectively) |
676 | 523 | ||||||
| Net interest expense (year ended December 31, 2022 and 2021, respectively) |
1,124 | 1,063 | ||||||
| Net interest expense (six months ended June 30, 2022 and 2021, respectively) |
(523 | ) | (526 | ) | ||||
|
12-month trailing net interest expense (ended June 30, 2023 and 2022, respectively) |
1,277 | 1,060 | ||||||
| 50% of net earnings attributable to preferred shareholders (six months ended June 30, 2023 and 2022, respectively) |
46 | 35 | ||||||
| 50% of net earnings attributable to preferred shareholders (year ended December 31, 2022 and 2021, respectively) |
76 | 66 | ||||||
| 50% of net earnings attributable to preferred shareholders (six months ended June 30, 2022 and 2021, respectively) |
(35 | ) | (32 | ) | ||||
| 50% of 12-month trailing net earnings attributable to preferred shareholders (ended June 30, 2023 and 2022, respectively) |
87 | 69 | ||||||
| Adjusted net interest expense for the twelve months ended June 30, 2023 and 2022, respectively |
1,364 | 1,129 | ||||||
Available liquidity
The term available liquidity does not have any standardized meaning under IFRS. Therefore, it is unlikely to be comparable to similar measures presented by other issuers.
We define available liquidity as cash, cash equivalents and amounts available under our securitized receivables program and our committed bank credit facilities, excluding credit facilities that are available exclusively for a pre-determined purpose.
We consider available liquidity to be an important indicator of the financial strength and performance of our businesses because it shows the funds available to meet our cash requirements, including for, but not limited to, capital expenditures, post-employment benefit plans funding, dividend payments, the payment of contractual obligations, maturing debt, on-going operations, the acquisition of spectrum, and other cash requirements. We believe that certain investors and analysts use available liquidity to evaluate the financial strength and performance of our businesses. The most directly comparable IFRS financial measure is cash.
The following table is a reconciliation of cash to available liquidity on a consolidated basis.
| June 30, 2023 | December 31, 2022 | |||||||
| Cash |
450 | 99 | ||||||
| Cash equivalents |
450 | 50 | ||||||
| Amounts available under our securitized receivables program (1) |
700 | 700 | ||||||
| Amounts available under our committed bank credit facilities (2) |
2,840 | 2,651 | ||||||
| Available liquidity |
4,440 | 3,500 | ||||||
| (1) | At June 30, 2023 and December 31, 2022, $700 million were available under our securitized receivables program, under which we borrowed $1,211 million in U.S. dollars ($1,603 million in Canadian dollars) and $1,173 million in U.S. dollars ($1,588 million in Canadian dollars) as at June 30, 2023 and December 31, 2022, respectively. Loans secured by receivables are included in Debt due within one year in our consolidated financial statements. |
| (2) | At June 30, 2023 and December 31, 2022, respectively, $2,840 million and $2,651 million were available under our committed bank credit facilities, given outstanding commercial paper of $348 million in U.S. dollars ($461 million in Canadian dollars) and $627 million in U.S. dollars ($849 million in Canadian dollars) and $199 million drawn bank advances and nil as at June 30, 2023 and December 31, 2022, respectively. Commercial paper outstanding is included in Debt due within one year in our consolidated financial statements. |
| 38 | BCE INC. 2023 SECOND QUARTER SHAREHOLDER REPORT |
8 MD&A Non-GAAP financial measures, other financial measures and key performance indicators (KPIs)
Free cash flow and excess free cash flow
The terms free cash flow and excess free cash flow do not have any standardized meaning under IFRS. Therefore, they are unlikely to be comparable to similar measures presented by other issuers.
We define free cash flow as cash flows from operating activities, excluding cash from discontinued operations, acquisition and other costs paid (which include significant litigation costs) and voluntary pension funding, less capital expenditures, preferred share dividends and dividends paid by subsidiaries to NCI. We exclude cash from discontinued operations, acquisition and other costs paid and voluntary pension funding because they affect the comparability of our financial results and could potentially distort the analysis of trends in business performance. Excluding these items does not imply they are non-recurring.
We define excess free cash flow as free cash flow less dividends paid on common shares.
We consider free cash flow and excess free cash flow to be important indicators of the financial strength and performance of our businesses. Free cash flow shows how much cash is available to pay dividends on common shares, repay debt and reinvest in our company. Excess free cash flow shows how much cash is available to repay debt and reinvest in our company, after the payment of dividends on common shares. We believe that certain investors and analysts use free cash flow and excess free cash flow to value a business and its underlying assets and to evaluate the financial strength and performance of our businesses. The most directly comparable IFRS financial measure is cash flows from operating activities.
The following table is a reconciliation of cash flows from operating activities to free cash flow and excess free cash flow on a consolidated basis.
| Q2 2023 | Q2 2022 | YTD 2023 | YTD 2022 | |||||||||||||
| Cash flows from operating activities |
2,365 | 2,597 | 3,612 | 4,313 | ||||||||||||
| Capital expenditures |
(1,307 | ) | (1,219 | ) | (2,393 | ) | (2,178 | ) | ||||||||
| Cash dividends paid on preferred shares |
(46 | ) | (34 | ) | (101 | ) | (67 | ) | ||||||||
| Cash dividends paid by subsidiaries to NCI |
(1 | ) | (14 | ) | (22 | ) | (25 | ) | ||||||||
| Acquisition and other costs paid |
5 | 3 | 5 | 6 | ||||||||||||
| Free cash flow |
1,016 | 1,333 | 1,101 | 2,049 | ||||||||||||
| Dividends paid on common shares |
(882 | ) | (839 | ) | (1,721 | ) | (1,634 | ) | ||||||||
| Excess free cash flow |
134 | 494 | (620 | ) | 415 | |||||||||||
Net debt
The term net debt does not have any standardized meaning under IFRS. Therefore, it is unlikely to be comparable to similar measures presented by other issuers.
We define net debt as debt due within one year plus long-term debt and 50% of preferred shares, less cash and cash equivalents, as shown in BCE’s consolidated statements of financial position. We include 50% of outstanding preferred shares in our net debt as it is consistent with the treatment by certain credit rating agencies.
We consider net debt to be an important indicator of the company’s financial leverage because it represents the amount of debt that is not covered by available cash and cash equivalents. We believe that certain investors and analysts use net debt to determine a company’s financial leverage.
Net debt is calculated using several asset and liability categories from the statements of financial position. The most directly comparable IFRS financial measure is long-term debt. The following table is a reconciliation of long-term debt to net debt on a consolidated basis.
| June 30, 2023 | December 31, 2022 | |||||||
| Long-term debt |
28,314 | 27,783 | ||||||
| Debt due within one year |
6,039 | 4,137 | ||||||
| 50% of preferred shares |
1,891 | 1,935 | ||||||
| Cash |
(450 | ) | (99 | ) | ||||
| Cash equivalents |
(450 | ) | (50 | ) | ||||
| Net debt |
35,344 | 33,706 | ||||||
| 39 |
8 MD&A Non-GAAP financial measures, other financial measures and key performance indicators (KPIs)
| 8.2 | Non-GAAP ratios |
A non-GAAP ratio is a financial measure disclosed in the form of a ratio, fraction, percentage or similar representation and that has a non-GAAP financial measure as one or more of its components.
Adjusted EPS
The term adjusted EPS does not have any standardized meaning under IFRS. Therefore, it is unlikely to be comparable to similar measures presented by other issuers.
We define adjusted EPS as adjusted net earnings per BCE common share. Adjusted net earnings is a non-GAAP financial measure. For further details on adjusted net earnings, see section 8.1, Non-GAAP financial measures.
We use adjusted EPS, and we believe that certain investors and analysts use this measure, among other ones, to assess the performance of our businesses without the effects of severance, acquisition and other costs, net mark-to-market losses (gains) on derivatives used to economically hedge equity settled share-based compensation plans, net equity losses (gains) on investments in associates and joint ventures, net losses (gains) on investments, early debt redemption costs, impairment of assets and discontinued operations, net of tax and NCI. We exclude these items because they affect the comparability of our financial results and could potentially distort the analysis of trends in business performance. Excluding these items does not imply they are non-recurring.
Dividend payout ratio
The term dividend payout ratio does not have any standardized meaning under IFRS. Therefore, it is unlikely to be comparable to similar measures presented by other issuers.
We define dividend payout ratio as dividends paid on common shares divided by free cash flow. Free cash flow is a non-GAAP financial measure. For further details on free cash flow, see section 8.1, Non-GAAP financial measures.
We consider dividend payout ratio to be an important indicator of the financial strength and performance of our businesses because it shows the sustainability of the company’s dividend payments.
| 8.3 | Total of segments measures |
A total of segments measure is a financial measure that is a subtotal or total of 2 or more reportable segments and is disclosed within the Notes to BCE’s consolidated primary financial statements.
Adjusted EBITDA
We define adjusted EBITDA as operating revenues less operating costs as shown in BCE’s consolidated income statements.
The most directly comparable IFRS financial measure is net earnings. The following table is a reconciliation of net earnings to adjusted EBITDA on a consolidated basis.
| YTD 2023 | Q2 2023 | Q1 2023 | ||||||||||
| Net earnings |
1,185 | 397 | 788 | |||||||||
| Severance, acquisition and other costs |
149 | 100 | 49 | |||||||||
| Depreciation |
1,854 | 936 | 918 | |||||||||
| Amortization |
579 | 296 | 283 | |||||||||
| Finance costs |
||||||||||||
| Interest expense |
703 | 359 | 344 | |||||||||
| Net return on post-employment benefit plans |
(54 | ) | (27 | ) | (27 | ) | ||||||
| Impairment of assets |
34 | – | 34 | |||||||||
| Other expense (income) |
190 | 311 | (121 | ) | ||||||||
| Income taxes |
543 | 273 | 270 | |||||||||
| Adjusted EBITDA |
5,183 | 2,645 | 2,538 | |||||||||
| 40 | BCE INC. 2023 SECOND QUARTER SHAREHOLDER REPORT |
8 MD&A Non-GAAP financial measures, other financial measures and key performance indicators (KPIs)
| Q4 2022 | Q3 2022 | YTD 2022 | Q2 2022 | Q1 2022 | ||||||||||||||||
| Net earnings |
567 | 771 | 1,588 | 654 | 934 | |||||||||||||||
| Severance, acquisition and other costs |
19 | 22 | 53 | 40 | 13 | |||||||||||||||
| Depreciation |
922 | 914 | 1,824 | 933 | 891 | |||||||||||||||
| Amortization |
270 | 267 | 526 | 266 | 260 | |||||||||||||||
| Finance costs |
||||||||||||||||||||
| Interest expense |
319 | 298 | 529 | 269 | 260 | |||||||||||||||
| Net return on post-employment benefit plans |
(13 | ) | (13 | ) | (25 | ) | (7 | ) | (18 | ) | ||||||||||
| Impairment of assets |
150 | 21 | 108 | 106 | 2 | |||||||||||||||
| Other (income) expense |
(19 | ) | 130 | 4 | 97 | (93 | ) | |||||||||||||
| Income taxes |
222 | 178 | 567 | 232 | 335 | |||||||||||||||
| Adjusted EBITDA |
2,437 | 2,588 | 5,174 | 2,590 | 2,584 | |||||||||||||||
| Q4 2021 | Q3 2021 | |||||||||||||||||||
| Net earnings |
658 | 813 | ||||||||||||||||||
| Severance, acquisition and other costs |
63 | 50 | ||||||||||||||||||
| Depreciation |
925 | 902 | ||||||||||||||||||
| Amortization |
251 | 245 | ||||||||||||||||||
| Finance costs |
||||||||||||||||||||
| Interest expense |
275 | 272 | ||||||||||||||||||
| Net interest on post-employment benefit plans |
5 | 5 | ||||||||||||||||||
| Impairment of assets |
30 | – | ||||||||||||||||||
| Other income |
(26 | ) | (35 | ) | ||||||||||||||||
| Income taxes |
249 | 306 | ||||||||||||||||||
| Adjusted EBITDA |
2,430 | 2,558 | ||||||||||||||||||
| 8.4 | Capital management measures |
A capital management measure is a financial measure that is intended to enable a reader to evaluate our objectives, policies and processes for managing our capital and is disclosed within the Notes to BCE’s consolidated financial statements.
The financial reporting framework used to prepare the financial statements requires disclosure that helps readers assess the company’s capital management objectives, policies, and processes, as set out in IFRS in IAS 1 – Presentation of Financial Statements. BCE has its own methods for managing capital and liquidity, and IFRS does not prescribe any particular calculation method.
Adjusted EBITDA to adjusted net interest expense ratio
The adjusted EBITDA to adjusted net interest expense ratio represents adjusted EBITDA divided by adjusted net interest expense. For the purposes of calculating our adjusted EBITDA to adjusted net interest expense ratio, adjusted EBITDA is twelve-month trailing adjusted EBITDA. Adjusted net interest expense used in the calculation of the adjusted EBITDA to adjusted net interest expense ratio is a non-GAAP financial measure defined as twelve-month trailing net interest expense as shown in our consolidated statements of cash flows, plus 50% of twelve-month trailing net earnings attributable to preferred shareholders as shown in our consolidated income statements. For further details on adjusted net interest expense, see section 8.1, Non-GAAP financial measures.
We use, and believe that certain investors and analysts use, the adjusted EBITDA to adjusted net interest expense ratio, among other measures, to evaluate the financial health of the company.
Net debt leverage ratio
The net debt leverage ratio represents net debt divided by adjusted EBITDA. Net debt used in the calculation of the net debt leverage ratio is a non-GAAP financial measure. For further details on net debt, see section 8.1, Non-GAAP financial measures. For the purposes of calculating our net debt leverage ratio, adjusted EBITDA is twelve-month trailing adjusted EBITDA.
We use, and believe that certain investors and analysts use, the net debt leverage ratio as a measure of financial leverage.
| 41 |
8 MD&A Non-GAAP financial measures, other financial measures and key performance indicators (KPIs)
| 8.5 | Supplementary financial measures |
A supplementary financial measure is a financial measure that is not reported in BCE’s consolidated financial statements, and is, or is intended to be, reported periodically to represent historical or expected future financial performance, financial position, or cash flows.
An explanation of such measures is provided where they are first referred to in this MD&A if the supplementary financial measures’ labelling is not sufficiently descriptive.
| 8.6 | KPIs |
In addition to the non-GAAP financial measures and other financial measures described previously, we use the following KPIs to measure the success of our strategic imperatives. These KPIs are not accounting measures and may not be comparable to similar measures presented by other issuers.
| KPI | Definition | |
| Adjusted EBITDA margin |
Adjusted EBITDA margin is defined as adjusted EBITDA divided by operating revenues. | |
| ARPU |
Effective Q1 2023, as a result of the segment reporting changes impacting intersegment eliminations, ARPU has been updated and is defined as Bell CTS wireless external services revenues (previously wireless operating service revenues) divided by the average mobile phone subscriber base for the specified period, expressed as a dollar unit per month. | |
| Capital intensity |
Capital intensity is defined as capital expenditures divided by operating revenues. | |
| Churn |
Mobile phone churn is the rate at which existing mobile phone subscribers cancel their services. It is a measure of our ability to retain our customers. Mobile phone churn is calculated by dividing the number of mobile phone deactivations during a given period by the average number of mobile phone subscribers in the base for the specified period and is expressed as a percentage per month. | |
| Subscriber unit |
Mobile phone subscriber unit is comprised of a recurring revenue generating portable unit (e.g. smartphones and feature phones) on an active service plan, that has access to our wireless networks and includes voice, text and/or data connectivity. We report mobile phone subscriber units in two categories: postpaid and prepaid. Prepaid mobile phone subscriber units are considered active for a period of 90 days following the expiry of the subscriber’s prepaid balance.
Mobile connected device subscriber unit is comprised of a recurring revenue generating portable unit (e.g. tablets, wearables, mobile Internet devices and IoT) on an active service plan, that has access to our wireless networks and is intended for limited or no cellular voice capability.
Wireline subscriber unit consists of an active revenue-generating unit with access to our services, including retail Internet, satellite TV, IPTV, and/or residential NAS. A subscriber is included in our subscriber base when the service has been installed and is operational at the customer premise and a billing relationship has been established.
• Retail Internet, IPTV and satellite TV subscribers have access to stand-alone services, and are primarily represented by a dwelling unit
• Retail residential NAS subscribers are based on a line count and are represented by a unique telephone number |
|
| 42 | BCE INC. 2023 SECOND QUARTER SHAREHOLDER REPORT |
9 MD&A Controls and procedures
| 9 | Controls and procedures |
Changes in internal control over financial reporting
No changes were made in our internal control over financial reporting during the quarter ended June 30, 2023 that have materially affected, or are reasonably likely to materially affect, our internal control over financial reporting.
| 43 |
Note 4 Business acquisitions and disposition |
|||||
Note 8 Other expense |
|||||
| FOR THE PERIOD ENDED JUNE 30 | THREE MONTHS | SIX MONTHS | ||||||||||||||||||
| (IN MILLIONS OF CANADIAN DOLLARS, EXCEPT SHARE AMOUNTS) (UNAUDITED) | NOTE | 2023 | 2022 | 2023 | 2022 | |||||||||||||||
| Operating revenues | 3 | 6,066 | 5,861 | 12,120 | 11,711 | |||||||||||||||
| Operating costs | 3, | 5 | (3,421) | (3,271) | (6,937) | (6,537) | ||||||||||||||
| Severance, acquisition and other costs | 6 | (100) | (40) | (149) | (53) | |||||||||||||||
| Depreciation | (936) | (933) | (1,854) | (1,824) | ||||||||||||||||
| Amortization | (296) | (266) | (579) | (526) | ||||||||||||||||
| Finance costs | ||||||||||||||||||||
| Interest expense | (359) | (269) | (703) | (529) | ||||||||||||||||
| Net return on post-employment benefit plans | 11 | 27 | 7 | 54 | 25 | |||||||||||||||
| Impairment of assets | 7 | — | (106) | (34) | (108) | |||||||||||||||
| Other expense | 8 | (311) | (97) | (190) | (4) | |||||||||||||||
| Income taxes | (273) | (232) | (543) | (567) | ||||||||||||||||
| Net earnings | 397 | 654 | 1,185 | 1,588 | ||||||||||||||||
| Net earnings attributable to: | ||||||||||||||||||||
| Common shareholders | 329 | 596 | 1,054 | 1,473 | ||||||||||||||||
| Preferred shareholders | 46 | 35 | 92 | 69 | ||||||||||||||||
| Non-controlling interest | 22 | 23 | 39 | 46 | ||||||||||||||||
| Net earnings | 397 | 654 | 1,185 | 1,588 | ||||||||||||||||
| Net earnings per common share - basic and diluted | 9 | 0.37 | 0.66 | 1.16 | 1.62 | |||||||||||||||
| Weighted average number of common shares outstanding - basic (millions) | 912.2 | 911.9 | 912.2 | 911.0 | ||||||||||||||||
| FOR THE PERIOD ENDED JUNE 30 | THREE MONTHS | SIX MONTHS | |||||||||||||||
| (IN MILLIONS OF CANADIAN DOLLARS) (UNAUDITED) | NOTE | 2023 | 2022 | 2023 | 2022 | ||||||||||||
| Net earnings | 397 | 654 | 1,185 | 1,588 | |||||||||||||
| Other comprehensive (loss) income, net of income taxes | |||||||||||||||||
| Items that will be subsequently reclassified to net earnings | |||||||||||||||||
Net change in value of derivatives designated as cash flow hedges, net of income taxes of $29 million for the three months ended June 30, 2023 and 2022, and $8 million and ($26) million for the six months ended June 30, 2023 and 2022, respectively |
(80) | (77) | (22) | 71 | |||||||||||||
| Items that will not be reclassified to net earnings | |||||||||||||||||
Actuarial (losses) gains on post-employment benefit plans, net of income taxes of $51 million and ($95) million for the three months ended June 30, 2023 and 2022, respectively, and $98 million and ($330) million for the six months ended June 30, 2023 and 2022, respectively(1) |
11 | (136) | 259 | (263) | 903 | ||||||||||||
Net change in value of publicly-traded and privately-held investments, net of income taxes of nil and ($14) million for the three months ended June 30, 2023 and 2022, respectively, and ($3) million and ($14) million for the six months ended June 30, 2023 and 2022, respectively |
(1) | (5) | 16 | (4) | |||||||||||||
Net change in value of derivatives designated as cash flow hedges, net of income taxes of $8 million and ($7) million for the three months ended June 30, 2023 and 2022, respectively and $6 million and ($4) million for the six months ended June 30, 2023 and 2022, respectively |
(23) | 19 | (17) | 11 | |||||||||||||
| Other comprehensive (loss) income | (240) | 196 | (286) | 981 | |||||||||||||
| Total comprehensive income | 157 | 850 | 899 | 2,569 | |||||||||||||
| Total comprehensive income attributable to: | |||||||||||||||||
| Common shareholders | 92 | 791 | 771 | 2,453 | |||||||||||||
| Preferred shareholders | 46 | 35 | 92 | 69 | |||||||||||||
| Non-controlling interest | 19 | 24 | 36 | 47 | |||||||||||||
| Total comprehensive income | 157 | 850 | 899 | 2,569 | |||||||||||||
| (IN MILLIONS OF CANADIAN DOLLARS) (UNAUDITED) | NOTE | JUNE 30, 2023 | DECEMBER 31, 2022 | |||||||||||
| ASSETS | ||||||||||||||
| Current assets | ||||||||||||||
| Cash | 450 | 99 | ||||||||||||
| Cash equivalents | 450 | 50 | ||||||||||||
| Trade and other receivables | 3,771 | 4,138 | ||||||||||||
| Inventory | 656 | 656 | ||||||||||||
| Contract assets | 403 | 436 | ||||||||||||
| Contract costs | 559 | 540 | ||||||||||||
| Prepaid expenses | 395 | 244 | ||||||||||||
| Other current assets | 282 | 324 | ||||||||||||
| Total current assets | 6,966 | 6,487 | ||||||||||||
| Non-current assets | ||||||||||||||
| Contract assets | 243 | 288 | ||||||||||||
| Contract costs | 683 | 603 | ||||||||||||
| Property, plant and equipment | 29,909 | 29,256 | ||||||||||||
| Intangible assets | 16,395 | 16,183 | ||||||||||||
| Deferred tax assets | 108 | 84 | ||||||||||||
| Investments in associates and joint ventures | 8 | 322 | 608 | |||||||||||
| Post-employment benefit assets | 11 | 3,207 | 3,559 | |||||||||||
| Other non-current assets | 1,194 | 1,355 | ||||||||||||
| Goodwill | 4 | 11,022 | 10,906 | |||||||||||
| Total non-current assets | 63,083 | 62,842 | ||||||||||||
| Total assets | 70,049 | 69,329 | ||||||||||||
| LIABILITIES | ||||||||||||||
| Current liabilities | ||||||||||||||
| Trade payables and other liabilities | 4,347 | 5,221 | ||||||||||||
| Contract liabilities | 793 | 857 | ||||||||||||
| Interest payable | 305 | 281 | ||||||||||||
| Dividends payable | 900 | 867 | ||||||||||||
| Current tax liabilities | 207 | 106 | ||||||||||||
| Debt due within one year | 10 | 6,039 | 4,137 | |||||||||||
| Total current liabilities | 12,591 | 11,469 | ||||||||||||
| Non-current liabilities | ||||||||||||||
| Contract liabilities | 257 | 228 | ||||||||||||
| Long-term debt | 10 | 28,314 | 27,783 | |||||||||||
| Deferred tax liabilities | 4,898 | 4,953 | ||||||||||||
| Post-employment benefit obligations | 11 | 1,339 | 1,311 | |||||||||||
| Other non-current liabilities | 1,201 | 1,070 | ||||||||||||
| Total non-current liabilities | 36,009 | 35,345 | ||||||||||||
| Total liabilities | 48,600 | 46,814 | ||||||||||||
| EQUITY | ||||||||||||||
| Equity attributable to BCE shareholders | ||||||||||||||
| Preferred shares | 13 | 3,781 | 3,870 | |||||||||||
| Common shares | 20,859 | 20,840 | ||||||||||||
| Contributed surplus | 13 | 1,204 | 1,172 | |||||||||||
| Accumulated other comprehensive loss | (105) | (55) | ||||||||||||
| Deficit | (4,618) | (3,649) | ||||||||||||
| Total equity attributable to BCE shareholders | 21,121 | 22,178 | ||||||||||||
| Non-controlling interest | 4 | 328 | 337 | |||||||||||
| Total equity | 21,449 | 22,515 | ||||||||||||
| Total liabilities and equity | 70,049 | 69,329 | ||||||||||||
| ATTRIBUTABLE TO BCE SHAREHOLDERS | |||||||||||||||||||||||||||||
| FOR THE PERIOD ENDED JUNE 30, 2023 (IN MILLIONS OF CANADIAN DOLLARS) (UNAUDITED) | NOTE | PREFERRED SHARES | COMMON SHARES | CONTRI-BUTED SURPLUS | ACCUM-ULATED OTHER COMPRE-HENSIVE LOSS | DEFICIT | TOTAL | NON-CONTROL-LING INTEREST | TOTAL EQUITY | ||||||||||||||||||||
| Balance at December 31, 2022 | 3,870 | 20,840 | 1,172 | (55) | (3,649) | 22,178 | 337 | 22,515 | |||||||||||||||||||||
| Net earnings | — | — | — | — | 1,146 | 1,146 | 39 | 1,185 | |||||||||||||||||||||
| Other comprehensive loss | — | — | — | (20) | (263) | (283) | (3) | (286) | |||||||||||||||||||||
| Total comprehensive (loss) income | — | — | — | (20) | 883 | 863 | 36 | 899 | |||||||||||||||||||||
| Common shares issued under employee stock option plan |
— | 19 | (1) | — | — | 18 | — | 18 | |||||||||||||||||||||
| Other share-based compensation | — | — | 7 | — | (12) | (5) | — | (5) | |||||||||||||||||||||
| Repurchase of preferred shares | 13 | (89) | — | 26 | — | — | (63) | — | (63) | ||||||||||||||||||||
| Dividends declared on BCE common and preferred shares |
— | — | — | — | (1,857) | (1,857) | — | (1,857) | |||||||||||||||||||||
| Dividends declared by subsidiaries to non-controlling interest |
— | — | — | — | — | — | (22) | (22) | |||||||||||||||||||||
| Settlement of cash flow hedges transferred to the cost basis of hedged items | — | — | — | (13) | — | (13) | — | (13) | |||||||||||||||||||||
| Disposition of production studios | 4 | — | — | — | — | — | — | (23) | (23) | ||||||||||||||||||||
| Other | — | — | — | (17) | 17 | — | — | — | |||||||||||||||||||||
| Balance at June 30, 2023 | 3,781 | 20,859 | 1,204 | (105) | (4,618) | 21,121 | 328 | 21,449 | |||||||||||||||||||||
| ATTRIBUTABLE TO BCE SHAREHOLDERS | |||||||||||||||||||||||||||||
| FOR THE PERIOD ENDED JUNE 30, 2022 (IN MILLIONS OF CANADIAN DOLLARS) (UNAUDITED) | NOTE | PREFERRED SHARES | COMMON SHARES | CONTRI-BUTED SURPLUS | ACCUM-ULATED OTHER COMPRE-HENSIVE INCOME | DEFICIT | TOTAL | NON-CONTROL-LING INTEREST | TOTAL EQUITY | ||||||||||||||||||||
| Balance at December 31, 2021 | 4,003 | 20,662 | 1,157 | 213 | (3,400) | 22,635 | 306 | 22,941 | |||||||||||||||||||||
| Net earnings | — | — | — | — | 1,542 | 1,542 | 46 | 1,588 | |||||||||||||||||||||
| Other comprehensive income | — | — | — | 78 | 902 | 980 | 1 | 981 | |||||||||||||||||||||
| Total comprehensive income | — | — | — | 78 | 2,444 | 2,522 | 47 | 2,569 | |||||||||||||||||||||
| Common shares issued under employee stock option plan |
— | 175 | (7) | — | — | 168 | — | 168 | |||||||||||||||||||||
| Other share-based compensation | — | — | (2) | — | (25) | (27) | — | (27) | |||||||||||||||||||||
| Repurchase of preferred shares | 13 | (118) | — | 3 | — | — | (115) | — | (115) | ||||||||||||||||||||
| Dividends declared on BCE common and preferred shares |
— | — | — | — | (1,747) | (1,747) | — | (1,747) | |||||||||||||||||||||
| Dividends declared by subsidiaries to non-controlling interest |
— | — | — | — | — | — | (25) | (25) | |||||||||||||||||||||
| Settlement of cash flow hedges transferred to the cost basis of hedged items |
— | — | — | 1 | — | 1 | — | 1 | |||||||||||||||||||||
| Other | — | — | — | (19) | 19 | — | — | — | |||||||||||||||||||||
| Balance at June 30, 2022 | 3,885 | 20,837 | 1,151 | 273 | (2,709) | 23,437 | 328 | 23,765 | |||||||||||||||||||||
| FOR THE PERIOD ENDED JUNE 30 | THREE MONTHS | SIX MONTHS | |||||||||||||||
| (IN MILLIONS OF CANADIAN DOLLARS) (UNAUDITED) | NOTE | 2023 | 2022 | 2023 | 2022 | ||||||||||||
| Cash flows from operating activities | |||||||||||||||||
| Net earnings | 397 | 654 | 1,185 | 1,588 | |||||||||||||
| Adjustments to reconcile net earnings to cash flows from operating activities | |||||||||||||||||
| Severance, acquisition and other costs | 6 | 100 | 40 | 149 | 53 | ||||||||||||
| Depreciation and amortization | 1,232 | 1,199 | 2,433 | 2,350 | |||||||||||||
| Post-employment benefit plans cost | 11 | 21 | 52 | 52 | 103 | ||||||||||||
| Net interest expense | 346 | 265 | 676 | 523 | |||||||||||||
| Impairment of assets | 7 | — | 106 | 34 | 108 | ||||||||||||
| Gains on investments | 8 | (79) | (16) | (79) | (53) | ||||||||||||
| Net equity losses from investments in associates and joint ventures | 8 | 377 | 42 | 377 | 42 | ||||||||||||
| Income taxes | 273 | 232 | 543 | 567 | |||||||||||||
| Contributions to post-employment benefit plans | (13) | (35) | (28) | (114) | |||||||||||||
| Payments under other post-employment benefit plans | (17) | (15) | (32) | (30) | |||||||||||||
| Severance and other costs paid | (39) | (30) | (64) | (58) | |||||||||||||
| Interest paid | (270) | (196) | (709) | (569) | |||||||||||||
| Income taxes paid (net of refunds) | (200) | (143) | (364) | (259) | |||||||||||||
| Acquisition and other costs paid | (5) | (3) | (5) | (6) | |||||||||||||
| Change in contract assets | 33 | 23 | 78 | 55 | |||||||||||||
| Change in wireless device financing plan receivables | 24 | 68 | 65 | 127 | |||||||||||||
| Net change in operating assets and liabilities | 185 | 354 | (699) | (114) | |||||||||||||
| Cash flows from operating activities | 2,365 | 2,597 | 3,612 | 4,313 | |||||||||||||
| Cash flows used in investing activities | |||||||||||||||||
| Capital expenditures | (1,307) | (1,219) | (2,393) | (2,178) | |||||||||||||
| Business acquisitions | 4 | (196) | — | (221) | (139) | ||||||||||||
| Business dispositions | 4 | 208 | 2 | 208 | 54 | ||||||||||||
| Spectrum licences | (145) | — | (156) | — | |||||||||||||
| Other investing activities | (16) | 27 | 15 | 17 | |||||||||||||
| Cash flows used in investing activities | (1,456) | (1,190) | (2,547) | (2,246) | |||||||||||||
| Cash flows used in financing activities | |||||||||||||||||
| (Decrease) increase in notes payable | (101) | 187 | (184) | 656 | |||||||||||||
| Decrease in securitized receivables | (500) | — | — | — | |||||||||||||
| Issue of long-term debt | 10 | 1,199 | — | 2,703 | 945 | ||||||||||||
| Repayment of long-term debt | (346) | (245) | (645) | (1,503) | |||||||||||||
| Repurchase of a financial liability | 12 | — | — | (149) | — | ||||||||||||
| Issue of common shares | 8 | 7 | 18 | 168 | |||||||||||||
| Purchase of shares for settlement of share-based payments | (42) | (51) | (135) | (157) | |||||||||||||
| Repurchase of preferred shares | 13 | (32) | — | (63) | (115) | ||||||||||||
| Cash dividends paid on common shares | (882) | (839) | (1,721) | (1,634) | |||||||||||||
| Cash dividends paid on preferred shares | (46) | (34) | (101) | (67) | |||||||||||||
| Cash dividends paid by subsidiaries to non-controlling interest | (1) | (14) | (22) | (25) | |||||||||||||
| Other financing activities | (7) | — | (15) | (28) | |||||||||||||
| Cash flows used in financing activities | (750) | (989) | (314) | (1,760) | |||||||||||||
| Net (decrease) increase in cash | (201) | 418 | 351 | 307 | |||||||||||||
| Cash at beginning of period | 651 | 178 | 99 | 289 | |||||||||||||
| Cash at end of period | 450 | 596 | 450 | 596 | |||||||||||||
| Net increase in cash equivalents | 360 | — | 400 | — | |||||||||||||
| Cash equivalents at beginning of period | 90 | — | 50 | — | |||||||||||||
| Cash equivalents at end of period | 450 | — | 450 | — | |||||||||||||
| Note 1 | Corporate information | ||||
| Note 2 | Basis of presentation and significant accounting policies | ||||
| Adoption of amendments to accounting standards | ||
| STANDARD | DESCRIPTION | IMPACT | ||||||
| International Tax Reform - Pillar Two Model Rules - Amendments to IAS 12 - Income Taxes | These amendments require that entities apply IAS 12 to income taxes arising from tax law enacted or substantively enacted to implement the Pillar Two model rules published by the Organisation for Economic Co-operation and Development, including tax law that implements qualified domestic minimum top-up taxes described in those rules (Pillar Two). As an exception to the requirements in IAS 12, entities do not recognize or disclose information about deferred tax assets and liabilities related to Pillar Two. | In May 2023, we adopted the amendments to IAS 12 retrospectively. As required, we applied the exception and do not recognize or disclose information about deferred tax assets and liabilities related to Pillar Two. The adoption of these amendments did not have a significant impact on our financial statements. |
||||||
| Future changes to accounting standards | ||
| STANDARD | DESCRIPTION | IMPACT | EFFECTIVE DATE | ||||||||
| Disclosure of Accounting Policies - Amendments to IAS 1 - Presentation of Financial Statements | These amendments require that entities disclose material accounting policies, as defined, instead of significant accounting policies. | We are currently assessing the impact of these amendments on the disclosure of our accounting policies. | Effective for annual reporting periods beginning on or after January 1, 2023 and any changes will be reflected in our financial statements for the year ended December 31, 2023. |
||||||||
| Note 3 | Segmented information | ||||
| FOR THE THREE MONTH PERIOD ENDED JUNE 30, 2023 | NOTE | BELL CTS |
BELL MEDIA |
INTER- SEGMENT ELIMINA- TIONS |
BCE | ||||||||||||
| Operating revenues | |||||||||||||||||
| External service revenues | 4,584 | 719 | — | 5,303 | |||||||||||||
| Inter-segment service revenues | 7 | 86 | (93) | — | |||||||||||||
| Operating service revenues | 4,591 | 805 | (93) | 5,303 | |||||||||||||
| External/Operating product revenues | 763 | — | — | 763 | |||||||||||||
| Total external revenues | 5,347 | 719 | — | 6,066 | |||||||||||||
| Total inter-segment revenues | 7 | 86 | (93) | — | |||||||||||||
| Total operating revenues | 5,354 | 805 | (93) | 6,066 | |||||||||||||
| Operating costs | 5 | (2,923) | (591) | 93 | (3,421) | ||||||||||||
Adjusted EBITDA (1) |
2,431 | 214 | — | 2,645 | |||||||||||||
| Severance, acquisition and other costs | 6 | (100) | |||||||||||||||
| Depreciation and amortization | (1,232) | ||||||||||||||||
| Finance costs | |||||||||||||||||
| Interest expense | (359) | ||||||||||||||||
| Net return on post-employment benefit plans | 11 | 27 | |||||||||||||||
| Impairment of assets | 7 | — | |||||||||||||||
| Other expense | 8 | (311) | |||||||||||||||
| Income taxes | (273) | ||||||||||||||||
| Net earnings | 397 | ||||||||||||||||
| FOR THE THREE MONTH PERIOD ENDED JUNE 30, 2022 | NOTE | BELL CTS |
BELL MEDIA |
INTER- SEGMENT ELIMINA- TIONS |
BCE | |||||||||||||||
| Operating revenues | ||||||||||||||||||||
| External service revenues | 4,500 | 733 | — | 5,233 | ||||||||||||||||
| Inter-segment service revenues | 7 | 88 | (95) | — | ||||||||||||||||
| Operating service revenues | 4,507 | 821 | (95) | 5,233 | ||||||||||||||||
| External/Operating product revenues | 628 | — | — | 628 | ||||||||||||||||
| Total external revenues | 5,128 | 733 | — | 5,861 | ||||||||||||||||
| Total inter-segment revenues | 7 | 88 | (95) | — | ||||||||||||||||
| Total operating revenues | 5,135 | 821 | (95) | 5,861 | ||||||||||||||||
| Operating costs | 5 | (2,771) | (595) | 95 | (3,271) | |||||||||||||||
Adjusted EBITDA (1) |
2,364 | 226 | — | 2,590 | ||||||||||||||||
| Severance, acquisition and other costs | 6 | (40) | ||||||||||||||||||
| Depreciation and amortization | (1,199) | |||||||||||||||||||
| Finance costs | ||||||||||||||||||||
| Interest expense | (269) | |||||||||||||||||||
| Net return on post-employment benefit plans | 11 | 7 | ||||||||||||||||||
| Impairment of assets | 7 | (106) | ||||||||||||||||||
| Other expense | 8 | (97) | ||||||||||||||||||
| Income taxes | (232) | |||||||||||||||||||
| Net earnings | 654 | |||||||||||||||||||
| FOR THE SIX MONTH PERIOD ENDED JUNE 30, 2023 | NOTE | BELL CTS |
BELL MEDIA |
INTER- SEGMENT ELIMINA- TIONS |
BCE | ||||||||||||
| Operating revenues | |||||||||||||||||
| External service revenues | 9,112 | 1,413 | — | 10,525 | |||||||||||||
| Inter-segment service revenues | 14 | 172 | (186) | — | |||||||||||||
| Operating service revenues | 9,126 | 1,585 | (186) | 10,525 | |||||||||||||
| External/Operating product revenues | 1,595 | — | — | 1,595 | |||||||||||||
| Total external revenues | 10,707 | 1,413 | — | 12,120 | |||||||||||||
| Total inter-segment revenues | 14 | 172 | (186) | — | |||||||||||||
| Total operating revenues | 10,721 | 1,585 | (186) | 12,120 | |||||||||||||
| Operating costs | 5 | (5,884) | (1,239) | 186 | (6,937) | ||||||||||||
Adjusted EBITDA (1) |
4,837 | 346 | — | 5,183 | |||||||||||||
| Severance, acquisition and other costs | 6 | (149) | |||||||||||||||
| Depreciation and amortization | (2,433) | ||||||||||||||||
| Finance costs | |||||||||||||||||
| Interest expense | (703) | ||||||||||||||||
| Net return on post-employment benefit plans | 11 | 54 | |||||||||||||||
| Impairment of assets | 7 | (34) | |||||||||||||||
| Other expense | 8 | (190) | |||||||||||||||
| Income taxes | (543) | ||||||||||||||||
| Net earnings | 1,185 | ||||||||||||||||
| FOR THE SIX MONTH PERIOD ENDED JUNE 30, 2022 | NOTE | BELL CTS |
BELL MEDIA |
INTER- SEGMENT ELIMINA- TIONS |
BCE | |||||||||||||||
| Operating revenues | ||||||||||||||||||||
| External service revenues | 8,936 | 1,474 | — | 10,410 | ||||||||||||||||
| Inter-segment service revenues | 14 | 172 | (186) | — | ||||||||||||||||
| Operating service revenues | 8,950 | 1,646 | (186) | 10,410 | ||||||||||||||||
| External/Operating product revenues | 1,301 | — | — | 1,301 | ||||||||||||||||
| Total external revenues | 10,237 | 1,474 | — | 11,711 | ||||||||||||||||
| Total inter-segment revenues | 14 | 172 | (186) | — | ||||||||||||||||
| Total operating revenues | 10,251 | 1,646 | (186) | 11,711 | ||||||||||||||||
| Operating costs | 5 | (5,511) | (1,212) | 186 | (6,537) | |||||||||||||||
Adjusted EBITDA (1) |
4,740 | 434 | — | 5,174 | ||||||||||||||||
| Severance, acquisition and other costs | 6 | (53) | ||||||||||||||||||
| Depreciation and amortization | (2,350) | |||||||||||||||||||
| Finance costs | ||||||||||||||||||||
| Interest expense | (529) | |||||||||||||||||||
| Net return on post-employment benefit plans | 11 | 25 | ||||||||||||||||||
| Impairment of assets | 7 | (108) | ||||||||||||||||||
| Other expense | 8 | (4) | ||||||||||||||||||
| Income taxes | (567) | |||||||||||||||||||
| Net earnings | 1,588 | |||||||||||||||||||
| THREE MONTHS | SIX MONTHS | |||||||||||||
| FOR THE PERIOD ENDED JUNE 30 | 2023 | 2022 | 2023 | 2022 | ||||||||||
Services(1) |
||||||||||||||
| Wireless | 1,766 | 1,692 | 3,489 | 3,327 | ||||||||||
| Wireline data | 2,021 | 1,974 | 4,022 | 3,927 | ||||||||||
| Wireline voice | 722 | 756 | 1,448 | 1,527 | ||||||||||
| Media | 719 | 733 | 1,413 | 1,474 | ||||||||||
| Other wireline services | 75 | 78 | 153 | 155 | ||||||||||
| Total services | 5,303 | 5,233 | 10,525 | 10,410 | ||||||||||
Products(2) |
||||||||||||||
| Wireless | 626 | 542 | 1,252 | 1,105 | ||||||||||
| Wireline | 137 | 86 | 343 | 196 | ||||||||||
| Total products | 763 | 628 | 1,595 | 1,301 | ||||||||||
| Total operating revenues | 6,066 | 5,861 | 12,120 | 11,711 | ||||||||||
| Note 4 | Business acquisitions and disposition | ||||
| 2023 | ||||||||
| Cash consideration paid | 145 | |||||||
| Cash consideration payable | 12 | |||||||
| Contingent consideration | 6 | |||||||
| Total cost to be allocated | 163 | |||||||
| Trade and other receivables | 23 | |||||||
| Prepaid expenses | 4 | |||||||
| Finite-life intangibles | 4 | |||||||
| Other non-current assets | 3 | |||||||
| Trade payables and other liabilities | (15) | |||||||
| Contract liabilities | (3) | |||||||
| Debt due within one year | (5) | |||||||
| 11 | ||||||||
| Cash and cash equivalents | 1 | |||||||
| Fair value of net assets acquired | 12 | |||||||
Goodwill (1) |
151 | |||||||
| Acquisition of EBOX and other related companies | ||
| Total | ||||||||
| Cash consideration | 153 | |||||||
| Total cost to be allocated | 153 | |||||||
| Other non-cash working capital | 5 | |||||||
| Property, plant and equipment | 5 | |||||||
Indefinite-life intangible assets (1) |
17 | |||||||
Finite-life intangible and other assets (2) |
15 | |||||||
| Trade payables and other liabilities | (17) | |||||||
| Contract liabilities | (5) | |||||||
| Deferred tax liabilities | (9) | |||||||
| 11 | ||||||||
| Cash and cash equivalents | 14 | |||||||
| Fair value of net assets acquired | 25 | |||||||
Goodwill (3) |
128 | |||||||
| 2023 | |||||
| Trade and other receivables | 1 | ||||
| Prepaid expenses | 1 | ||||
| Property, plant and equipment | 179 | ||||
| Intangible assets | 4 | ||||
| Goodwill | 76 | ||||
| Total assets | 261 | ||||
| Trade payables and other liabilities | 10 | ||||
| Contract liabilities | 3 | ||||
| Debt due within one year | 11 | ||||
| Long-term debt | 82 | ||||
| Deferred tax liabilities | 3 | ||||
| Total liabilities | 109 | ||||
| Non-controlling interest | 23 | ||||
| Net assets sold | 129 | ||||
| Note 5 | Operating costs | ||||
| THREE MONTHS | SIX MONTHS | |||||||||||||||||||
| FOR THE PERIOD ENDED JUNE 30 | NOTE | 2023 | 2022 | 2023 | 2022 | |||||||||||||||
| Labour costs | ||||||||||||||||||||
| Wages, salaries and related taxes and benefits | (1,116) | (1,085) | (2,218) | (2,125) | ||||||||||||||||
| Post-employment benefit plans service cost (net of capitalized amounts) | 11 | (48) | (59) | (106) | (128) | |||||||||||||||
Other labour costs (1) |
(265) | (247) | (524) | (484) | ||||||||||||||||
| Less: | ||||||||||||||||||||
| Capitalized labour | 324 | 283 | 627 | 543 | ||||||||||||||||
| Total labour costs | (1,105) | (1,108) | (2,221) | (2,194) | ||||||||||||||||
Cost of revenues (2) |
(1,836) | (1,694) | (3,790) | (3,422) | ||||||||||||||||
Other operating costs (3) |
(480) | (469) | (926) | (921) | ||||||||||||||||
| Total operating costs | (3,421) | (3,271) | (6,937) | (6,537) | ||||||||||||||||
| Note 6 | Severance, acquisition and other costs | ||||
| THREE MONTHS | SIX MONTHS | |||||||||||||
| FOR THE PERIOD ENDED JUNE 30 | 2023 | 2022 | 2023 | 2022 | ||||||||||
| Severance | (80) | (38) | (109) | (56) | ||||||||||
| Acquisition and other | (20) | (2) | (40) | 3 | ||||||||||
| Total severance, acquisition and other costs | (100) | (40) | (149) | (53) | ||||||||||
| Note 7 | Impairment of assets | ||||
| Note 8 | Other expense | ||||
| THREE MONTHS | SIX MONTHS | ||||||||||||||||
| FOR THE PERIOD ENDED JUNE 30 | 2023 | 2022 | 2023 | 2022 | |||||||||||||
| Net mark-to-market gains (losses) on derivatives used to economically hedge equity settled share-based compensation plans | 1 | (81) | 19 | (6) | |||||||||||||
| (Losses) gains on retirements and disposals of property, plant and equipment and intangible assets | (19) | 2 | 28 | (4) | |||||||||||||
| Equity (losses) income from investments in associates and joint ventures | |||||||||||||||||
| Loss on investment | (377) | (42) | (377) | (42) | |||||||||||||
| Operations | 8 | 12 | 26 | 3 | |||||||||||||
| Gains on investments | 79 | 16 | 79 | 53 | |||||||||||||
| Early debt redemption costs | (1) | — | (1) | (18) | |||||||||||||
| Other | (2) | (4) | 36 | 10 | |||||||||||||
| Total other expense | (311) | (97) | (190) | (4) | |||||||||||||
| Note 9 | Earnings per share | ||||
| THREE MONTHS | SIX MONTHS | ||||||||||||||||
| FOR THE PERIOD ENDED JUNE 30 | 2023 | 2022 | 2023 | 2022 | |||||||||||||
| Net earnings attributable to common shareholders - basic | 329 | 596 | 1,054 | 1,473 | |||||||||||||
| Dividends declared per common share (in dollars) | 0.9675 | 0.9200 | 1.9350 | 1.8400 | |||||||||||||
| Weighted average number of common shares outstanding (in millions) | |||||||||||||||||
| Weighted average number of common shares outstanding - basic | 912.2 | 911.9 | 912.2 | 911.0 | |||||||||||||
Assumed exercise of stock options (1) |
0.3 | 0.9 | 0.3 | 0.8 | |||||||||||||
| Weighted average number of common shares outstanding - diluted (in millions) | 912.5 | 912.8 | 912.5 | 911.8 | |||||||||||||
| Note 10 | Debt | ||||
| Note 11 | Post-employment benefit plans | ||||
| THREE MONTHS | SIX MONTHS | ||||||||||||||||
| FOR THE PERIOD ENDED JUNE 30 | 2023 | 2022 | 2023 | 2022 | |||||||||||||
| DB pension | (32) | (49) | (64) | (97) | |||||||||||||
| DC pension | (29) | (26) | (68) | (64) | |||||||||||||
| Less: | |||||||||||||||||
| Capitalized benefit plans cost | 13 | 16 | 26 | 33 | |||||||||||||
| Total post-employment benefit plans service cost | (48) | (59) | (106) | (128) | |||||||||||||
| THREE MONTHS | SIX MONTHS | ||||||||||||||||
| FOR THE PERIOD ENDED JUNE 30 | 2023 | 2022 | 2023 | 2022 | |||||||||||||
| DB pension | 37 | 16 | 74 | 42 | |||||||||||||
| OPEBs | (10) | (9) | (20) | (17) | |||||||||||||
| Total net return on post-employment benefit plans | 27 | 7 | 54 | 25 | |||||||||||||
| Note 12 | Financial assets and liabilities |
||||
| JUNE 30, 2023 | DECEMBER 31, 2022 | |||||||||||||||||||
| CLASSIFICATION | FAIR VALUE METHODOLOGY | CARRYING VALUE | FAIR VALUE | CARRYING VALUE | FAIR VALUE | |||||||||||||||
| Debt securities and other debt |
Debt due within one year and long-term debt | Quoted market price of debt | 27,509 | 25,779 | 25,061 | 23,026 | ||||||||||||||
| FAIR VALUE | |||||||||||||||||
| CLASSIFICATION | CARRYING VALUE OF ASSET (LIABILITY) | QUOTED PRICES IN ACTIVE MARKETS FOR IDENTICAL ASSETS (LEVEL 1) | OBSERVABLE MARKET DATA (LEVEL 2)(1) |
NON-OBSERVABLE MARKET INPUTS (LEVEL 3)(2) |
|||||||||||||
| June 30, 2023 | |||||||||||||||||
Publicly-traded and privately-held investments (3) |
Other non-current assets | 225 | 8 | — | 217 | ||||||||||||
| Derivative financial instruments | Other current assets, trade payables and other liabilities, other non-current assets and liabilities | (157) | — | (157) | — | ||||||||||||
| Other | Other non-current assets and liabilities | 122 | — | 198 | (76) | ||||||||||||
| December 31, 2022 | |||||||||||||||||
Publicly-traded and privately-held investments (3) |
Other non-current assets | 215 | 9 | — | 206 | ||||||||||||
| Derivative financial instruments | Other current assets, trade payables and other liabilities, other non-current assets and liabilities | 72 | — | 72 | — | ||||||||||||
Maple Leaf Sports & Entertainment Ltd. (MLSE) financial liability(4) |
Trade payables and other liabilities | (149) | — | — | (149) | ||||||||||||
| Other | Other non-current assets and liabilities | 108 | — | 184 | (76) | ||||||||||||
| TYPE OF HEDGE | BUY CURRENCY | AMOUNT TO RECEIVE | SELL CURRENCY | AMOUNT TO PAY | MATURITY | HEDGED ITEM | ||||||||||||||
Cash flow (1) |
USD | 1,217 | CAD | 1,608 | 2023 | Loans | ||||||||||||||
| Cash flow | USD | 350 | CAD | 468 | 2023 | Commercial paper | ||||||||||||||
| Cash flow | USD | 432 | CAD | 537 | 2023 | Anticipated purchases | ||||||||||||||
| Cash flow | PHP | 1,538 | CAD | 36 | 2023 | Anticipated purchases | ||||||||||||||
| Cash flow | USD | 824 | CAD | 1,046 | 2024 | Anticipated purchases | ||||||||||||||
| Cash flow | PHP | 2,885 | CAD | 69 | 2024 | Anticipated purchases | ||||||||||||||
| Cash flow | USD | 60 | CAD | 78 | 2025 | Anticipated purchases | ||||||||||||||
| Economic | USD | 78 | CAD | 98 | 2023 | Anticipated purchases | ||||||||||||||
| Economic - call options | CAD | 112 | USD | 78 | 2023 | Anticipated purchases | ||||||||||||||
| Economic - put options | USD | 165 | CAD | 214 | 2023 | Anticipated purchases | ||||||||||||||
| Economic - call options | USD | 116 | CAD | 155 | 2023 | Anticipated purchases | ||||||||||||||
| Economic | USD | 130 | CAD | 171 | 2024 | Anticipated purchases | ||||||||||||||
Economic - options (2) |
USD | 120 | CAD | 153 | 2024 | Anticipated purchases | ||||||||||||||
| Economic - call options | USD | 244 | CAD | 327 | 2024 | Anticipated purchases | ||||||||||||||
| Economic - call options | CAD | 225 | USD | 156 | 2024 | Anticipated purchases | ||||||||||||||
| Economic - put options | USD | 519 | CAD | 675 | 2024 | Anticipated purchases | ||||||||||||||
Economic - options (2) |
USD | 60 | CAD | 78 | 2025 | Anticipated purchases | ||||||||||||||
| Economic - call options | USD | 540 | CAD | 694 | 2025 | Anticipated purchases | ||||||||||||||
| Economic - put options | USD | 360 | CAD | 461 | 2025 | Anticipated purchases | ||||||||||||||
| Note 13 | Share capital | ||||
| Note 14 | Share-based payments | ||||
| THREE MONTHS | SIX MONTHS | |||||||||||||
| FOR THE PERIOD ENDED JUNE 30 | 2023 | 2022 | 2023 | 2022 | ||||||||||
| Employee savings plan | (7) | (6) | (15) | (14) | ||||||||||
| Restricted share units (RSUs) and performance share units (PSUs) | (10) | (21) | (44) | (46) | ||||||||||
Other (1) |
(1) | (2) | (2) | (3) | ||||||||||
| Total share-based payments | (18) | (29) | (61) | (63) | ||||||||||
| NUMBER OF RSUs/PSUs | |||||
| Outstanding, January 1, 2023 | 3,124,187 | ||||
| Granted | 1,064,191 | ||||
| Dividends credited | 96,425 | ||||
| Settled | (916,529) | ||||
| Forfeited | (52,222) | ||||
| Outstanding, June 30, 2023 | 3,316,052 | ||||
| NUMBER OF OPTIONS | WEIGHTED AVERAGE EXERCISE PRICE ($) | ||||||||||
| Outstanding, January 1, 2023 | 7,802,108 | 61 | |||||||||
Exercised(1) |
(306,139) | 60 | |||||||||
| Forfeited or expired | (11,408) | 63 | |||||||||
| Outstanding and exercisable, June 30, 2023 | 7,484,561 | 61 | |||||||||
Exhibit 99.3

|
||

|
Supplementary Financial Information
Second Quarter 2023 |
|
| BCE Investor Relations Thane Fotopoulos
514-870-4619 thane.fotopoulos@bell.ca |

|
|
BCE (1)
Consolidated Operational Data
| (In millions of Canadian dollars, except share amounts) (unaudited) |
Q2 2023 |
Q2 2022 |
$ change |
% change |
YTD 2023 |
YTD 2022 |
$ change |
% change | ||||||||||||||||||||||||||||
| Operating revenues |
||||||||||||||||||||||||||||||||||||
| Service |
5,303 | 5,233 | 70 | 1.3% | 10,525 | 10,410 | 115 | 1.1% | ||||||||||||||||||||||||||||
| Product |
763 | 628 | 135 | 21.5% | 1,595 | 1,301 | 294 | 22.6% | ||||||||||||||||||||||||||||
| Total operating revenues |
6,066 | 5,861 | 205 | 3.5% | 12,120 | 11,711 | 409 | 3.5% | ||||||||||||||||||||||||||||
| Operating costs |
(3,421 | ) | (3,271 | ) | (150 | ) | (4.6%) | (6,937 | ) | (6,537 | ) | (400 | ) | (6.1%) | ||||||||||||||||||||||
| Adjusted EBITDA (A) |
2,645 | 2,590 | 55 | 2.1% | 5,183 | 5,174 | 9 | 0.2% | ||||||||||||||||||||||||||||
| Adjusted EBITDA margin (B)(3) |
43.6% | 44.2% | (0.6) pts | 42.8% | 44.2% | (1.4) pts | ||||||||||||||||||||||||||||||
| Severance, acquisition and other costs |
(100 | ) | (40 | ) | (60 | ) | n.m. | (149 | ) | (53 | ) | (96 | ) | n.m. | ||||||||||||||||||||||
| Depreciation |
(936 | ) | (933 | ) | (3 | ) | (0.3%) | (1,854 | ) | (1,824 | ) | (30 | ) | (1.6%) | ||||||||||||||||||||||
| Amortization |
(296 | ) | (266 | ) | (30 | ) | (11.3%) | (579 | ) | (526 | ) | (53 | ) | (10.1%) | ||||||||||||||||||||||
| Finance costs |
||||||||||||||||||||||||||||||||||||
| Interest expense |
(359 | ) | (269 | ) | (90 | ) | (33.5%) | (703 | ) | (529 | ) | (174 | ) | (32.9%) | ||||||||||||||||||||||
| Net return on post-employment benefit plans |
27 | 7 | 20 | n.m. | 54 | 25 | 29 | n.m. | ||||||||||||||||||||||||||||
| Impairment of assets |
- | (106 | ) | 106 | 100.0% | (34 | ) | (108 | ) | 74 | 68.5% | |||||||||||||||||||||||||
| Other expense |
(311 | ) | (97 | ) | (214 | ) | n.m. | (190 | ) | (4 | ) | (186 | ) | n.m. | ||||||||||||||||||||||
| Income taxes |
(273 | ) | (232 | ) | (41 | ) | (17.7%) | (543 | ) | (567 | ) | 24 | 4.2% | |||||||||||||||||||||||
| Net earnings |
397 | 654 | (257 | ) | (39.3%) | 1,185 | 1,588 | (403 | ) | (25.4%) | ||||||||||||||||||||||||||
| Net earnings attributable to: |
||||||||||||||||||||||||||||||||||||
| Common shareholders |
329 | 596 | (267 | ) | (44.8%) | 1,054 | 1,473 | (419 | ) | (28.4%) | ||||||||||||||||||||||||||
| Preferred shareholders |
46 | 35 | 11 | 31.4% | 92 | 69 | 23 | 33.3% | ||||||||||||||||||||||||||||
| Non-controlling interest |
22 | 23 | (1 | ) | (4.3%) | 39 | 46 | (7 | ) | (15.2%) | ||||||||||||||||||||||||||
| Net earnings |
397 | 654 | (257 | ) | (39.3%) | 1,185 | 1,588 | (403 | ) | (25.4%) | ||||||||||||||||||||||||||
| Net earnings per common share - basic and diluted |
$ | 0.37 | $ | 0.66 | $ | (0.29 | ) | (43.9%) | $ | 1.16 | $ | 1.62 | $ | (0.46 | ) | (28.4%) | ||||||||||||||||||||
| Dividends per common share |
$ | 0.9675 | $ | 0.9200 | $ | 0.0475 | 5.2% | $ | 1.9350 | $ | 1.8400 | $ | 0.0950 | 5.2% | ||||||||||||||||||||||
| Weighted average number of common shares outstanding - basic (millions) |
912.2 | 911.9 | 912.2 | 911.0 | ||||||||||||||||||||||||||||||||
| Weighted average number of common shares outstanding - diluted (millions) |
912.5 | 912.8 | 912.5 | 911.8 | ||||||||||||||||||||||||||||||||
| Number of common shares outstanding (millions) |
912.3 | 911.9 | 912.3 | 911.9 | ||||||||||||||||||||||||||||||||
| Adjusted net earnings and adjusted EPS |
||||||||||||||||||||||||||||||||||||
| Net earnings attributable to common shareholders |
329 | 596 | (267 | ) | (44.8%) | 1,054 | 1,473 | (419 | ) | (28.4%) | ||||||||||||||||||||||||||
| Reconciling items: |
||||||||||||||||||||||||||||||||||||
| Severance, acquisition and other costs |
100 | 40 | 60 | n.m. | 149 | 53 | 96 | n.m. | ||||||||||||||||||||||||||||
| Net mark-to-market (gains) losses on derivatives used to economically hedge equity settled share-based compensation plans |
(1 | ) | 81 | (82 | ) | n.m. | (19 | ) | 6 | (25 | ) | n.m. | ||||||||||||||||||||||||
| Net equity losses on investment in associates and joint ventures |
377 | 42 | 335 | n.m. | 377 | 42 | 335 | n.m. | ||||||||||||||||||||||||||||
| Net gains on investments |
(79 | ) | (16 | ) | (63 | ) | n.m. | (79 | ) | (53 | ) | (26 | ) | (49.1%) | ||||||||||||||||||||||
| Early debt redemption costs |
1 | - | 1 | n.m. | 1 | 18 | (17 | ) | (94.4%) | |||||||||||||||||||||||||||
| Impairment of assets |
- | 106 | (106 | ) | (100.0%) | 34 | 108 | (74 | ) | (68.5%) | ||||||||||||||||||||||||||
| Income taxes for the above reconciling items |
(5 | ) | (62 | ) | 57 | 91.9% | (23 | ) | (49 | ) | 26 | 53.1% | ||||||||||||||||||||||||
| Non-controlling interest (NCI) for the above reconciling items |
- | 4 | (4 | ) | (100.0%) | - | 4 | (4 | ) | (100.0%) | ||||||||||||||||||||||||||
| Adjusted net earnings (A) |
722 | 791 | (69 | ) | (8.7%) | 1,494 | 1,602 | (108 | ) | (6.7%) | ||||||||||||||||||||||||||
| Adjusted EPS (A) |
$ | 0.79 | $ | 0.87 | $ | (0.08 | ) | (9.2%) | $ | 1.64 | $ | 1.76 | $ | (0.12 | ) | (6.8%) | ||||||||||||||||||||
n.m. : not meaningful
| (A) | Adjusted EBITDA is a total of segments measure, adjusted net earnings is a non-GAAP financial measure and adjusted EPS is a non-GAAP ratio. Refer to note 2.3, Total of segments measures, note 2.1, Non-GAAP financial measures and note 2.2, Non-GAAP ratios in the Accompanying Notes to this report for more information on these measures. |
| (B) | Adjusted EBITDA margin is defined as adjusted EBITDA divided by operating revenues. |
BCE Supplementary Financial Information - Second Quarter 2023 Page 2
BCE
Consolidated Operational Data - Historical Trend
|
(In millions of Canadian dollars, except share amounts) (unaudited) |
YTD 2023 |
Q2 23 |
Q1 23 |
TOTAL 2022 |
Q4 22 |
Q3 22 |
Q2 22 |
Q1 22 |
||||||||||||||||||||||||||||||
| Operating revenues |
||||||||||||||||||||||||||||||||||||||
| Service |
10,525 | 5,303 | 5,222 | 20,956 | 5,353 | 5,193 | 5,233 | 5,177 | ||||||||||||||||||||||||||||||
| Product |
1,595 | 763 | 832 | 3,218 | 1,086 | 831 | 628 | 673 | ||||||||||||||||||||||||||||||
| Total operating revenues |
12,120 | 6,066 | 6,054 | 24,174 | 6,439 | 6,024 | 5,861 | 5,850 | ||||||||||||||||||||||||||||||
| Operating costs |
(6,937 | ) | (3,421 | ) | (3,516 | ) | (13,975 | ) | (4,002 | ) | (3,436 | ) | (3,271 | ) | (3,266 | ) | ||||||||||||||||||||||
| Adjusted EBITDA |
5,183 | 2,645 | 2,538 | 10,199 | 2,437 | 2,588 | 2,590 | 2,584 | ||||||||||||||||||||||||||||||
| Adjusted EBITDA margin |
42.8% | 43.6% | 41.9% | 42.2% | 37.8% | 43.0% | 44.2% | 44.2% | ||||||||||||||||||||||||||||||
| Severance, acquisition and other costs |
(149 | ) | (100 | ) | (49 | ) | (94 | ) | (19 | ) | (22 | ) | (40 | ) | (13 | ) | ||||||||||||||||||||||
| Depreciation |
(1,854 | ) | (936 | ) | (918 | ) | (3,660 | ) | (922 | ) | (914 | ) | (933 | ) | (891 | ) | ||||||||||||||||||||||
| Amortization |
(579 | ) | (296 | ) | (283 | ) | (1,063 | ) | (270 | ) | (267 | ) | (266 | ) | (260 | ) | ||||||||||||||||||||||
| Finance costs |
||||||||||||||||||||||||||||||||||||||
| Interest expense |
(703 | ) | (359 | ) | (344 | ) | (1,146 | ) | (319 | ) | (298 | ) | (269 | ) | (260 | ) | ||||||||||||||||||||||
| Net return on post-employment benefit plans |
54 | 27 | 27 | 51 | 13 | 13 | 7 | 18 | ||||||||||||||||||||||||||||||
| Impairment of assets |
(34 | ) | - | (34 | ) | (279 | ) | (150 | ) | (21 | ) | (106 | ) | (2 | ) | |||||||||||||||||||||||
| Other (expense) income |
(190 | ) | (311 | ) | 121 | (115 | ) | 19 | (130 | ) | (97 | ) | 93 | |||||||||||||||||||||||||
| Income taxes |
(543 | ) | (273 | ) | (270 | ) | (967 | ) | (222 | ) | (178 | ) | (232 | ) | (335 | ) | ||||||||||||||||||||||
| Net earnings |
1,185 | 397 | 788 | 2,926 | 567 | 771 | 654 | 934 | ||||||||||||||||||||||||||||||
| Net earnings attributable to: |
||||||||||||||||||||||||||||||||||||||
| Common shareholders |
1,054 | 329 | 725 | 2,716 | 528 | 715 | 596 | 877 | ||||||||||||||||||||||||||||||
| Preferred shareholders |
92 | 46 | 46 | 152 | 44 | 39 | 35 | 34 | ||||||||||||||||||||||||||||||
| Non-controlling interest |
39 | 22 | 17 | 58 | (5 | ) | 17 | 23 | 23 | |||||||||||||||||||||||||||||
| Net earnings |
1,185 | 397 | 788 | 2,926 | 567 | 771 | 654 | 934 | ||||||||||||||||||||||||||||||
| Net earnings per common share - basic and diluted |
$ | 1.16 | $ | 0.37 | $ | 0.79 | $ | 2.98 | $ | 0.58 | $ | 0.78 | $ | 0.66 | $ | 0.96 | ||||||||||||||||||||||
| Dividends per common share |
$ | 1.9350 | $ | 0.9675 | $ | 0.9675 | $ | 3.6800 | $ | 0.9200 | $ | 0.9200 | $ | 0.9200 | $ | 0.9200 | ||||||||||||||||||||||
| Weighted average number of common shares outstanding - basic (millions) |
912.2 | 912.2 | 912.1 | 911.5 | 912.0 | 911.9 | 911.9 | 910.1 | ||||||||||||||||||||||||||||||
| Weighted average number of common shares outstanding - diluted (millions) |
912.5 | 912.5 | 912.3 | 912.0 | 912.2 | 912.3 | 912.8 | 910.8 | ||||||||||||||||||||||||||||||
| Number of common shares outstanding (millions) |
912.3 | 912.3 | 912.2 | 912.0 | 912.0 | 911.9 | 911.9 | 911.8 | ||||||||||||||||||||||||||||||
| Adjusted net earnings and adjusted EPS |
||||||||||||||||||||||||||||||||||||||
| Net earnings attributable to common shareholders |
1,054 | 329 | 725 | 2,716 | 528 | 715 | 596 | 877 | ||||||||||||||||||||||||||||||
| Reconciling items: |
||||||||||||||||||||||||||||||||||||||
| Severance, acquisition and other costs |
149 | 100 | 49 | 94 | 19 | 22 | 40 | 13 | ||||||||||||||||||||||||||||||
| Net mark-to-market (gains) losses on derivatives used to economically hedge equity settled share-based compensation plans |
(19 | ) | (1 | ) | (18 | ) | 53 | (27 | ) | 74 | 81 | (75 | ) | |||||||||||||||||||||||||
| Net equity losses on investments in associates and joint ventures |
377 | 377 | - | 42 | - | - | 42 | - | ||||||||||||||||||||||||||||||
| Net (gains) losses on investments |
(79 | ) | (79 | ) | - | (24 | ) | 29 | - | (16 | ) | (37 | ) | |||||||||||||||||||||||||
| Early debt redemption costs |
1 | 1 | - | 18 | - | - | - | 18 | ||||||||||||||||||||||||||||||
| Impairment of assets |
34 | - | 34 | 279 | 150 | 21 | 106 | 2 | ||||||||||||||||||||||||||||||
| Income taxes for the above reconciling items |
(23 | ) | (5 | ) | (18 | ) | (117 | ) | (37 | ) | (31 | ) | (62 | ) | 13 | |||||||||||||||||||||||
| NCI for the above reconciling items |
- | - | - | (4 | ) | (8 | ) | - | 4 | - | ||||||||||||||||||||||||||||
| Adjusted net earnings |
1,494 | 722 | 772 | 3,057 | 654 | 801 | 791 | 811 | ||||||||||||||||||||||||||||||
| Adjusted EPS |
$ | 1.64 | $ | 0.79 | $ | 0.85 | $ | 3.35 | $ | 0.71 | $ | 0.88 | $ | 0.87 | $ | 0.89 | ||||||||||||||||||||||
BCE Supplementary Financial Information - Second Quarter 2023 Page 3
BCE (1)
Segmented Data
|
(In millions of Canadian dollars, except where otherwise indicated) (unaudited) |
Q2 2023 |
Q2 2022 |
$ change |
% change |
YTD 2023 |
YTD 2022 |
$ change |
% change |
||||||||||||||||||||||||||||
| Operating revenues |
||||||||||||||||||||||||||||||||||||
| Bell Communication and Technology Services (Bell CTS) |
5,354 | 5,135 | 219 | 4.3% | 10,721 | 10,251 | 470 | 4.6% | ||||||||||||||||||||||||||||
| Bell Media |
805 | 821 | (16 | ) | (1.9%) | 1,585 | 1,646 | (61 | ) | (3.7%) | ||||||||||||||||||||||||||
| Inter-segment eliminations |
(93 | ) | (95 | ) | 2 | 2.1% | (186 | ) | (186 | ) | - | - | ||||||||||||||||||||||||
| Total |
6,066 | 5,861 | 205 | 3.5% | 12,120 | 11,711 | 409 | 3.5% | ||||||||||||||||||||||||||||
| Operating costs |
||||||||||||||||||||||||||||||||||||
| Bell CTS |
(2,923 | ) | (2,771 | ) | (152 | ) | (5.5%) | (5,884 | ) | (5,511 | ) | (373 | ) | (6.8%) | ||||||||||||||||||||||
| Bell Media |
(591 | ) | (595 | ) | 4 | 0.7% | (1,239 | ) | (1,212 | ) | (27 | ) | (2.2%) | |||||||||||||||||||||||
| Inter-segment eliminations |
93 | 95 | (2 | ) | (2.1%) | 186 | 186 | - | - | |||||||||||||||||||||||||||
| Total |
(3,421 | ) | (3,271 | ) | (150 | ) | (4.6%) | (6,937 | ) | (6,537 | ) | (400 | ) | (6.1%) | ||||||||||||||||||||||
| Adjusted EBITDA |
||||||||||||||||||||||||||||||||||||
| Bell CTS |
2,431 | 2,364 | 67 | 2.8% | 4,837 | 4,740 | 97 | 2.0% | ||||||||||||||||||||||||||||
| Margin |
45.4% | 46.0% | (0.6) pts | 45.1% | 46.2% | (1.1) pts | ||||||||||||||||||||||||||||||
| Bell Media |
214 | 226 | (12 | ) | (5.3%) | 346 | 434 | (88 | ) | (20.3%) | ||||||||||||||||||||||||||
| Margin |
26.6% | 27.5% | (0.9) pts | 21.8% | 26.4% | (4.6) pts | ||||||||||||||||||||||||||||||
| Total |
2,645 | 2,590 | 55 | 2.1% | 5,183 | 5,174 | 9 | 0.2% | ||||||||||||||||||||||||||||
| Margin |
43.6% | 44.2% | (0.6) pts | 42.8% | 44.2% | (1.4) pts | ||||||||||||||||||||||||||||||
| Capital expenditures |
||||||||||||||||||||||||||||||||||||
| Bell CTS |
1,271 | 1,190 | (81 | ) | (6.8%) | 2,323 | 2,126 | (197 | ) | (9.3%) | ||||||||||||||||||||||||||
| Capital intensity (A)(3) |
23.7% | 23.2% | (0.5) pts | 21.7% | 20.7% | (1.0) pts | ||||||||||||||||||||||||||||||
| Bell Media |
36 | 29 | (7 | ) | (24.1%) | 70 | 52 | (18 | ) | (34.6%) | ||||||||||||||||||||||||||
| Capital intensity |
4.5% | 3.5% | (1.0) pts | 4.4% | 3.2% | (1.2) pts | ||||||||||||||||||||||||||||||
| Total |
1,307 | 1,219 | (88 | ) | (7.2%) | 2,393 | 2,178 | (215 | ) | (9.9%) | ||||||||||||||||||||||||||
| Capital intensity |
21.5% | 20.8% | (0.7) pts | 19.7% | 18.6% | (1.1) pts | ||||||||||||||||||||||||||||||
| (A) | Capital intensity is defined as capital expenditures divided by operating revenues. |
BCE Supplementary Financial Information - Second Quarter 2023 Page 4
BCE
Segmented Data - Historical Trend
| (In millions of Canadian dollars, except where otherwise indicated) (unaudited) |
YTD 2023 |
Q2 23 |
Q1 23 |
TOTAL 2022 |
Q4 22 |
Q3 22 |
Q2 22 |
Q1 22 |
||||||||||||||||||||||||||||
|
|
|
|
|
|
|
|
|
|
|
|||||||||||||||||||||||||||
|
|
||||||||||||||||||||||||||||||||||||
| Operating revenues |
||||||||||||||||||||||||||||||||||||
| Bell CTS |
10,721 | 5,354 | 5,367 | 21,301 | 5,649 | 5,401 | 5,135 | 5,116 | ||||||||||||||||||||||||||||
| Bell Media |
1,585 | 805 | 780 | 3,254 | 889 | 719 | 821 | 825 | ||||||||||||||||||||||||||||
| Inter-segment eliminations |
(186) | (93 | ) | (93 | ) | (381 | ) | (99 | ) | (96 | ) | (95 | ) | (91 | ) | |||||||||||||||||||||
|
|
|
|
|
|
|
|
|
|
|
|
||||||||||||||||||||||||||
| Total |
12,120 | 6,066 | 6,054 | 24,174 | 6,439 | 6,024 | 5,861 | 5,850 | ||||||||||||||||||||||||||||
|
|
|
|
|
|
|
|
|
|
|
|
||||||||||||||||||||||||||
|
|
||||||||||||||||||||||||||||||||||||
| Operating costs |
||||||||||||||||||||||||||||||||||||
| Bell CTS |
(5,884) | (2,923 | ) | (2,961 | ) | (11,847 | ) | (3,341 | ) | (2,995 | ) | (2,771 | ) | (2,740 | ) | |||||||||||||||||||||
| Bell Media |
(1,239) | (591 | ) | (648 | ) | (2,509 | ) | (760 | ) | (537 | ) | (595 | ) | (617 | ) | |||||||||||||||||||||
| Inter-segment eliminations |
186 | 93 | 93 | 381 | 99 | 96 | 95 | 91 | ||||||||||||||||||||||||||||
|
|
|
|
|
|
|
|
|
|
|
|
||||||||||||||||||||||||||
| Total |
(6,937) | (3,421 | ) | (3,516 | ) | (13,975 | ) | (4,002 | ) | (3,436 | ) | (3,271 | ) | (3,266 | ) | |||||||||||||||||||||
|
|
|
|
|
|
|
|
|
|
|
|
||||||||||||||||||||||||||
|
|
||||||||||||||||||||||||||||||||||||
| Adjusted EBITDA |
||||||||||||||||||||||||||||||||||||
| Bell CTS |
4,837 | 2,431 | 2,406 | 9,454 | 2,308 | 2,406 | 2,364 | 2,376 | ||||||||||||||||||||||||||||
| Margin |
45.1% | 45.4% | 44.8% | 44.4% | 40.9% | 44.5% | 46.0% | 46.4% | ||||||||||||||||||||||||||||
| Bell Media |
346 | 214 | 132 | 745 | 129 | 182 | 226 | 208 | ||||||||||||||||||||||||||||
| Margin |
21.8% | 26.6% | 16.9% | 22.9% | 14.5% | 25.3% | 27.5% | 25.2% | ||||||||||||||||||||||||||||
|
|
|
|
|
|
|
|
|
|
|
|
||||||||||||||||||||||||||
| Total |
5,183 | 2,645 | 2,538 | 10,199 | 2,437 | 2,588 | 2,590 | 2,584 | ||||||||||||||||||||||||||||
|
|
|
|
|
|
|
|
|
|
|
|
||||||||||||||||||||||||||
| Margin |
42.8% | 43.6% | 41.9% | 42.2% | 37.8% | 43.0% | 44.2% | 44.2% | ||||||||||||||||||||||||||||
|
|
||||||||||||||||||||||||||||||||||||
| Capital expenditures |
||||||||||||||||||||||||||||||||||||
| Bell CTS |
2,323 | 1,271 | 1,052 | 4,971 | 1,559 | 1,286 | 1,190 | 936 | ||||||||||||||||||||||||||||
| Capital intensity |
21.7% | 23.7% | 19.6% | 23.3% | 27.6% | 23.8% | 23.2% | 18.3% | ||||||||||||||||||||||||||||
| Bell Media |
70 | 36 | 34 | 162 | 79 | 31 | 29 | 23 | ||||||||||||||||||||||||||||
| Capital intensity |
4.4% | 4.5% | 4.4% | 5.0% | 8.9% | 4.3% | 3.5% | 2.8% | ||||||||||||||||||||||||||||
|
|
|
|
|
|
|
|
|
|
|
|
||||||||||||||||||||||||||
| Total |
2,393 | 1,307 | 1,086 | 5,133 | 1,638 | 1,317 | 1,219 | 959 | ||||||||||||||||||||||||||||
|
|
|
|
|
|
|
|
|
|
|
|
||||||||||||||||||||||||||
| Capital intensity |
19.7% | 21.5% | 17.9% | 21.2% | 25.4% | 21.9% | 20.8% | 16.4% | ||||||||||||||||||||||||||||
BCE Supplementary Financial Information - Second Quarter 2023 Page 5
Bell CTS (1)
| (In millions of Canadian dollars, except where otherwise indicated) (unaudited) | Q2 2023 |
Q2 2022 |
% change |
YTD 2023 |
YTD 2022 |
% change |
||||||||||||||||||
| Bell CTS |
||||||||||||||||||||||||
| Operating revenues |
||||||||||||||||||||||||
| Wireless |
1,766 | 1,692 | 4.4% | 3,489 | 3,327 | 4.9% | ||||||||||||||||||
| Wireline data |
2,021 | 1,974 | 2.4% | 4,022 | 3,927 | 2.4% | ||||||||||||||||||
| Wireline voice |
722 | 756 | (4.5%) | 1,448 | 1,527 | (5.2%) | ||||||||||||||||||
| Other wireline services |
75 | 78 | (3.8%) | 153 | 155 | (1.3%) | ||||||||||||||||||
| External service revenues |
4,584 | 4,500 | 1.9% | 9,112 | 8,936 | 2.0% | ||||||||||||||||||
| Inter-segment service revenues |
7 | 7 | - | 14 | 14 | - | ||||||||||||||||||
| Operating service revenues |
4,591 | 4,507 | 1.9% | 9,126 | 8,950 | 2.0% | ||||||||||||||||||
| Wireless |
626 | 542 | 15.5% | 1,252 | 1,105 | 13.3% | ||||||||||||||||||
| Wireline |
137 | 86 | 59.3% | 343 | 196 | 75.0% | ||||||||||||||||||
| External/Operating product revenues |
763 | 628 | 21.5% | 1,595 | 1,301 | 22.6% | ||||||||||||||||||
| Total external revenues |
5,347 | 5,128 | 4.3% | 10,707 | 10,237 | 4.6% | ||||||||||||||||||
| Total operating revenues |
5,354 | 5,135 | 4.3% | 10,721 | 10,251 | 4.6% | ||||||||||||||||||
| Operating costs |
(2,923 | ) | (2,771 | ) | (5.5%) | (5,884 | ) | (5,511 | ) | (6.8%) | ||||||||||||||
| Adjusted EBITDA |
2,431 | 2,364 | 2.8% | 4,837 | 4,740 | 2.0% | ||||||||||||||||||
| Adjusted EBITDA margin |
45.4% | 46.0% | (0.6) pts | 45.1% | 46.2% | (1.1) pts | ||||||||||||||||||
| Capital expenditures |
1,271 | 1,190 | (6.8%) | 2,323 | 2,126 | (9.3%) | ||||||||||||||||||
| Capital intensity |
23.7% | 23.2% | (0.5) pts | 21.7% | 20.7% | (1.0) pts | ||||||||||||||||||
BCE Supplementary Financial Information - Second Quarter 2023 Page 6
Bell CTS - Historical Trend
| (In millions of Canadian dollars, except where otherwise indicated) (unaudited) |
YTD 2023 |
Q2 23 | Q1 23 | TOTAL 2022 |
Q4 22 | Q3 22 | Q2 22 | Q1 22 | ||||||||||||||||||||||||||||
| Bell CTS |
||||||||||||||||||||||||||||||||||||
| Operating revenues |
||||||||||||||||||||||||||||||||||||
| Wireless |
3,489 | 1,766 | 1,723 | 6,821 | 1,735 | 1,759 | 1,692 | 1,635 | ||||||||||||||||||||||||||||
| Wireline data |
4,022 | 2,021 | 2,001 | 7,920 | 2,006 | 1,987 | 1,974 | 1,953 | ||||||||||||||||||||||||||||
| Wireline voice |
1,448 | 722 | 726 | 3,002 | 736 | 739 | 756 | 771 | ||||||||||||||||||||||||||||
| Other wireline services |
153 | 75 | 78 | 309 | 77 | 77 | 78 | 77 | ||||||||||||||||||||||||||||
| External service revenues |
9,112 | 4,584 | 4,528 | 18,052 | 4,554 | 4,562 | 4,500 | 4,436 | ||||||||||||||||||||||||||||
| Inter-segment service revenues |
14 | 7 | 7 | 31 | 9 | 8 | 7 | 7 | ||||||||||||||||||||||||||||
| Operating service revenues |
9,126 | 4,591 | 4,535 | 18,083 | 4,563 | 4,570 | 4,507 | 4,443 | ||||||||||||||||||||||||||||
| Wireless |
1,252 | 626 | 626 | 2,714 | 917 | 692 | 542 | 563 | ||||||||||||||||||||||||||||
| Wireline |
343 | 137 | 206 | 504 | 169 | 139 | 86 | 110 | ||||||||||||||||||||||||||||
| External/Operating product revenues |
1,595 | 763 | 832 | 3,218 | 1,086 | 831 | 628 | 673 | ||||||||||||||||||||||||||||
| Total external revenues |
10,707 | 5,347 | 5,360 | 21,270 | 5,640 | 5,393 | 5,128 | 5,109 | ||||||||||||||||||||||||||||
| Total operating revenues |
10,721 | 5,354 | 5,367 | 21,301 | 5,649 | 5,401 | 5,135 | 5,116 | ||||||||||||||||||||||||||||
| Operating costs |
(5,884 | ) | (2,923 | ) | (2,961 | ) | (11,847 | ) | (3,341 | ) | (2,995 | ) | (2,771 | ) | (2,740 | ) | ||||||||||||||||||||
| Adjusted EBITDA |
4,837 | 2,431 | 2,406 | 9,454 | 2,308 | 2,406 | 2,364 | 2,376 | ||||||||||||||||||||||||||||
| Adjusted EBITDA margin |
45.1% | 45.4% | 44.8% | 44.4% | 40.9% | 44.5% | 46.0% | 46.4% | ||||||||||||||||||||||||||||
| Capital expenditures |
2,323 | 1,271 | 1,052 | 4,971 | 1,559 | 1,286 | 1,190 | 936 | ||||||||||||||||||||||||||||
| Capital intensity |
21.7% | 23.7% | 19.6% | 23.3% | 27.6% | 23.8% | 23.2% | 18.3% | ||||||||||||||||||||||||||||
BCE Supplementary Financial Information - Second Quarter 2023 Page 7
Bell CTS Metrics (1)
| Q2 | Q2 | YTD | YTD | |||||||||||||||||||||
| (In millions of Canadian dollars, except where otherwise indicated) (unaudited) | 2023 | 2022 | % change | 2023 | 2022 | % change | ||||||||||||||||||
| Mobile phone subscribers(3) |
||||||||||||||||||||||||
| Gross subscriber activations |
502,940 | 415,270 | 21.1% | 908,475 | 765,178 | 18.7% | ||||||||||||||||||
| Postpaid |
347,746 | 266,600 | 30.4% | 620,355 | 497,313 | 24.7% | ||||||||||||||||||
| Prepaid |
155,194 | 148,670 | 4.4% | 288,120 | 267,865 | 7.6% | ||||||||||||||||||
| Net subscriber activations (losses) |
125,539 | 110,761 | 13.3% | 152,174 | 142,937 | 6.5% | ||||||||||||||||||
| Postpaid |
111,282 | 83,197 | 33.8% | 154,571 | 117,427 | 31.6% | ||||||||||||||||||
| Prepaid |
14,257 | 27,564 | (48.3%) | (2,397 | ) | 25,510 | n.m. | |||||||||||||||||
| Subscribers end of period (EOP)(C) |
10,028,031 | 9,602,122 | 4.4% | 10,028,031 | 9,602,122 | 4.4% | ||||||||||||||||||
| Postpaid(C) |
9,151,229 | 8,747,472 | 4.6% | 9,151,229 | 8,747,472 | 4.6% | ||||||||||||||||||
| Prepaid |
876,802 | 854,650 | 2.6% | 876,802 | 854,650 | 2.6% | ||||||||||||||||||
| Blended average revenue per user (ARPU) ($/month)(B)(3) |
59.16 | 59.17 | - | 58.66 | 58.39 | 0.5% | ||||||||||||||||||
| Blended churn (%) (average per month)(3) |
1.27% | 1.07% | (0.20) pts | 1.28% | 1.10% | (0.18) pts | ||||||||||||||||||
| Postpaid |
0.94% | 0.75% | (0.19) pts | 0.92% | 0.77% | (0.15) pts | ||||||||||||||||||
| Prepaid |
4.68% | 4.41% | (0.27) pts | 4.98% | 4.51% | (0.47) pts | ||||||||||||||||||
| Mobile connected device subscribers(3) |
||||||||||||||||||||||||
| Net subscriber activations |
79,537 | (344 | ) | n.m. | 150,279 | 48,533 | n.m. | |||||||||||||||||
| Subscribers EOP(C) |
2,589,520 | 2,298,327 | 12.7% | 2,589,520 | 2,298,327 | 12.7% | ||||||||||||||||||
| Retail high-speed Internet subscribers(3) |
||||||||||||||||||||||||
| Retail net subscriber activations |
24,934 | 22,620 | 10.2% | 52,208 | 48,644 | 7.3% | ||||||||||||||||||
| Retail subscribers EOP(A)(D)(E) |
4,338,511 | 3,977,387 | 9.1% | 4,338,511 | 3,977,387 | 9.1% | ||||||||||||||||||
| Retail TV subscribers(3) |
||||||||||||||||||||||||
| Retail net subscriber losses |
(14,404 | ) | (11,527 | ) | (25.0%) | (28,353 | ) | (19,888 | ) | (42.6%) | ||||||||||||||
| Internet protocol television (IPTV) |
11,506 | 3,838 | n.m. | 22,405 | 16,098 | 39.2% | ||||||||||||||||||
| Satellite |
(25,910 | ) | (15,365 | ) | (68.6%) | (50,758 | ) | (35,986 | ) | (41.0%) | ||||||||||||||
| Total retail subscribers EOP(A)(E) |
2,723,388 | 2,724,147 | - | 2,723,388 | 2,724,147 | - | ||||||||||||||||||
| IPTV(A)(E) |
2,010,829 | 1,907,564 | 5.4% | 2,010,829 | 1,907,564 | 5.4% | ||||||||||||||||||
| Satellite |
712,559 | 816,583 | (12.7%) | 712,559 | 816,583 | (12.7%) | ||||||||||||||||||
| Retail residential network access services (NAS)(3) |
||||||||||||||||||||||||
| Retail residential NAS lines net losses |
(49,608 | ) | (52,712 | ) | 5.9% | (96,489 | ) | (95,057 | ) | (1.5%) | ||||||||||||||
| Retail residential NAS lines(A)(E) |
2,101,740 | 2,207,004 | (4.8%) | 2,101,740 | 2,207,004 | (4.8%) | ||||||||||||||||||
n.m. : not meaningful
| (A) | In Q2 2023, our retail high-speed Internet, retail IPTV and retail residential NAS lines subscriber bases increased by 35,080, 243 and 7,458 subscribers, respectively, as a result of small acquisitions. |
| (B) | Effective Q1 2023, as a result of the segment reporting changes impacting intersegment eliminations, ARPU has been updated and is defined as Bell CTS wireless external services revenues (previously wireless operating service revenues) divided by the average mobile phone subscriber base for the specified period, expressed as a dollar unit per month. |
| (C) | In Q1 2023, we adjusted our mobile phone postpaid and mobile connected device subscriber bases to remove older non-revenue generating business subscribers of 73,229 and 12,577, respectively. |
| (D) | In Q1 2023, subsequent to a review of customer account records, our retail high-speed Internet subscriber base was reduced by 7,347 subscribers. |
| (E) | In Q4 2022, as a result of the acquisition of Distributel Communications Limited (Distributel), our retail high-speed Internet, retail IPTV and retail residential NAS lines subscriber bases increased by 128,065, 2,315 and 64,498 subscribers, respectively. |
BCE Supplementary Financial Information - Second Quarter 2023 Page 8
Bell CTS Metrics - Historical Trend
| (In millions of Canadian dollars, except where otherwise indicated) (unaudited) |
YTD 2023 |
Q2 23 |
Q1 23 |
TOTAL 2022 |
Q4 22 |
Q3 22 |
Q2 22 |
Q1 22 |
||||||||||||||||||||||||||||||||||||
| Mobile phone subscribers |
||||||||||||||||||||||||||||||||||||||||||||
| Gross subscriber activations |
908,475 | 502,940 | 405,535 | 1,953,912 | 605,034 | 583,700 | 415,270 | 349,908 | ||||||||||||||||||||||||||||||||||||
| Postpaid |
620,355 | 347,746 | 272,609 | 1,355,772 | 467,294 | 391,165 | 266,600 | 230,713 | ||||||||||||||||||||||||||||||||||||
| Prepaid |
288,120 | 155,194 | 132,926 | 598,140 | 137,740 | 192,535 | 148,670 | 119,195 | ||||||||||||||||||||||||||||||||||||
| Net subscriber activations (losses) |
152,174 | 125,539 | 26,635 | 489,901 | 122,621 | 224,343 | 110,761 | 32,176 | ||||||||||||||||||||||||||||||||||||
| Postpaid |
154,571 | 111,282 | 43,289 | 439,842 | 154,617 | 167,798 | 83,197 | 34,230 | ||||||||||||||||||||||||||||||||||||
| Prepaid |
(2,397 | ) | 14,257 | (16,654 | ) | 50,059 | (31,996 | ) | 56,545 | 27,564 | (2,054 | ) | ||||||||||||||||||||||||||||||||
| Subscribers end of period (EOP)(C) |
10,028,031 | 10,028,031 | 9,902,492 | 9,949,086 | 9,949,086 | 9,826,465 | 9,602,122 | 9,491,361 | ||||||||||||||||||||||||||||||||||||
| Postpaid(C) |
9,151,229 | 9,151,229 | 9,039,947 | 9,069,887 | 9,069,887 | 8,915,270 | 8,747,472 | 8,664,275 | ||||||||||||||||||||||||||||||||||||
| Prepaid |
876,802 | 876,802 | 862,545 | 879,199 | 879,199 | 911,195 | 854,650 | 827,086 | ||||||||||||||||||||||||||||||||||||
| Blended ARPU ($/month)(B) |
58.66 | 59.16 | 58.15 | 58.92 | 58.49 | 60.39 | 59.17 | 57.61 | ||||||||||||||||||||||||||||||||||||
| Blended churn (%) (average per month) |
1.28% | 1.27% | 1.29% | 1.27% | 1.63% | 1.24% | 1.07% | 1.12% | ||||||||||||||||||||||||||||||||||||
| Postpaid |
0.92% | 0.94% | 0.90% | 0.92% | 1.22% | 0.90% | 0.75% | 0.79% | ||||||||||||||||||||||||||||||||||||
| Prepaid |
4.98% | 4.68% | 5.28% | 4.85% | 5.74% | 4.58% | 4.41% | 4.61% | ||||||||||||||||||||||||||||||||||||
| Mobile connected device subscribers |
||||||||||||||||||||||||||||||||||||||||||||
| Net subscriber activations |
150,279 | 79,537 | 70,742 | 202,024 | 104,447 | 49,044 | (344 | ) | 48,877 | |||||||||||||||||||||||||||||||||||
| Subscribers EOP(C) |
2,589,520 | 2,589,520 | 2,509,983 | 2,451,818 | 2,451,818 | 2,347,371 | 2,298,327 | 2,298,671 | ||||||||||||||||||||||||||||||||||||
| Retail high-speed Internet subscribers |
||||||||||||||||||||||||||||||||||||||||||||
| Retail net subscriber activations |
52,208 | 24,934 | 27,274 | 201,762 | 63,466 | 89,652 | 22,620 | 26,024 | ||||||||||||||||||||||||||||||||||||
| Retail subscribers EOP(A)(D)(E) |
4,338,511 | 4,338,511 | 4,278,497 | 4,258,570 | 4,258,570 | 4,067,039 | 3,977,387 | 3,954,767 | ||||||||||||||||||||||||||||||||||||
| Retail TV subscribers |
||||||||||||||||||||||||||||||||||||||||||||
| Retail net subscriber activations (losses) |
(28,353 | ) | (14,404 | ) | (13,949 | ) | 5,148 | 14,183 | 10,853 | (11,527 | ) | (8,361 | ) | |||||||||||||||||||||||||||||||
| IPTV |
22,405 | 11,506 | 10,899 | 94,400 | 40,209 | 38,093 | 3,838 | 12,260 | ||||||||||||||||||||||||||||||||||||
| Satellite |
(50,758 | ) | (25,910 | ) | (24,848 | ) | (89,252 | ) | (26,026 | ) | (27,240 | ) | (15,365 | ) | (20,621 | ) | ||||||||||||||||||||||||||||
| Total retail subscribers EOP(A)(E) |
2,723,388 | 2,723,388 | 2,737,549 | 2,751,498 | 2,751,498 | 2,735,000 | 2,724,147 | 2,735,674 | ||||||||||||||||||||||||||||||||||||
| IPTV(A)(E) |
2,010,829 | 2,010,829 | 1,999,080 | 1,988,181 | 1,988,181 | 1,945,657 | 1,907,564 | 1,903,726 | ||||||||||||||||||||||||||||||||||||
| Satellite |
712,559 | 712,559 | 738,469 | 763,317 | 763,317 | 789,343 | 816,583 | 831,948 | ||||||||||||||||||||||||||||||||||||
| Retail residential NAS |
||||||||||||||||||||||||||||||||||||||||||||
| Retail residential NAS lines net losses |
(96,489 | ) | (49,608 | ) | (46,881 | ) | (175,788 | ) | (37,878 | ) | (42,853 | ) | (52,712 | ) | (42,345 | ) | ||||||||||||||||||||||||||||
| Retail residential NAS lines(A)(E) |
2,101,740 | 2,101,740 | 2,143,890 | 2,190,771 | 2,190,771 | 2,164,151 | 2,207,004 | 2,259,716 | ||||||||||||||||||||||||||||||||||||
| (A) | In Q2 2023, our retail high-speed Internet, retail IPTV and retail residential NAS lines subscriber bases increased by 35,080, 243 and 7,458 subscribers, respectively, as a result of small acquisitions. |
| (B) | Effective Q1 2023, as a result of the segment reporting changes impacting intersegment eliminations, ARPU has been updated and is defined as Bell CTS wireless external services revenues (previously wireless operating service revenues) divided by the average mobile phone subscriber base for the specified period, expressed as a dollar unit per month. |
| (C) | In Q1 2023, we adjusted our mobile phone postpaid and mobile connected device subscriber bases to remove older non-revenue generating business subscribers of 73,229 and 12,577, respectively. |
| (D) | In Q1 2023, subsequent to a review of customer account records, our retail high-speed Internet subscriber base was reduced by 7,347 subscribers. |
| (E) | In Q4 2022, as a result of the acquisition of Distributel, our retail high-speed Internet, retail IPTV and retail residential NAS lines subscriber bases increased by 128,065, 2,315 and 64,498 subscribers, respectively. |
BCE Supplementary Financial Information - Second Quarter 2023 Page 9
BCE
Net debt and other information
| BCE - Net debt and preferred shares |
||||||||||||||||||||||||||||||||||
| (In millions of Canadian dollars, except where otherwise indicated) (unaudited) | ||||||||||||||||||||||||||||||||||
| June 30 | March 31 | December 31 | ||||||||||||||||||||||||||||||||
| 2023 | 2023 | 2022 | ||||||||||||||||||||||||||||||||
| Long-term debt |
28,314 | 27,456 | 27,783 | |||||||||||||||||||||||||||||||
| Debt due within one year |
6,039 | 6,347 | 4,137 | |||||||||||||||||||||||||||||||
| 50% of preferred shares |
1,891 | 1,914 | 1,935 | |||||||||||||||||||||||||||||||
| Cash |
(450 | ) | (651 | ) | (99 | ) | ||||||||||||||||||||||||||||
| Cash equivalents |
(450 | ) | (90 | ) | (50 | ) | ||||||||||||||||||||||||||||
| Net debt (A) |
35,344 | 34,976 | 33,706 | |||||||||||||||||||||||||||||||
| Net debt leverage ratio (A) |
3.46 | 3.44 | 3.30 | |||||||||||||||||||||||||||||||
| Adjusted EBITDA /adjusted net interest expense ratio (A) |
7.48 | 7.94 | 8.50 | |||||||||||||||||||||||||||||||
| Cash flow information |
||||||||||||||||||||||||||||||||||
| (In millions of Canadian dollars, except where otherwise indicated) (unaudited) | Q2 | Q2 | YTD | YTD | ||||||||||||||||||||||||||||||
| 2023 | 2022 | $ change | % change | 2023 | 2022 | $ change | % change | |||||||||||||||||||||||||||
| Free cash flow (FCF) (A) |
||||||||||||||||||||||||||||||||||
| Cash flows from operating activities |
2,365 | 2,597 | (232 | ) | (8.9% | ) | 3,612 | 4,313 | (701 | ) | (16.3% | ) | ||||||||||||||||||||||
| Capital expenditures |
(1,307 | ) | (1,219 | ) | (88 | ) | (7.2% | ) | (2,393 | ) | (2,178 | ) | (215 | ) | (9.9% | ) | ||||||||||||||||||
| Cash dividends paid on preferred shares |
(46 | ) | (34 | ) | (12 | ) | (35.3% | ) | (101 | ) | (67 | ) | (34 | ) | (50.7% | ) | ||||||||||||||||||
| Cash dividends paid by subsidiaries to non-controlling interest |
(1 | ) | (14 | ) | 13 | 92.9% | (22 | ) | (25 | ) | 3 | 12.0% | ||||||||||||||||||||||
| Acquisition and other costs paid |
5 | 3 | 2 | 66.7% | 5 | 6 | (1 | ) | (16.7% | ) | ||||||||||||||||||||||||
| FCF |
1,016 | 1,333 | (317 | ) | (23.8% | ) | 1,101 | 2,049 | (948 | ) | (46.3% | ) | ||||||||||||||||||||||
| Cash flow information - Historical trend |
||||||||||||||||||||||||||||||||||
| (In millions of Canadian dollars, except where otherwise indicated) (unaudited) | YTD | Q2 | Q1 | Total | Q4 | Q3 | Q2 | Q1 | ||||||||||||||||||||||||||
| 2023 | 2023 | 2023 | 2022 | 2022 | 2022 | 2022 | 2022 | |||||||||||||||||||||||||||
| FCF |
||||||||||||||||||||||||||||||||||
| Cash flows from operating activities |
3,612 | 2,365 | 1,247 | 8,365 | 2,056 | 1,996 | 2,597 | 1,716 | ||||||||||||||||||||||||||
| Capital expenditures |
(2,393 | ) | (1,307 | ) | (1,086 | ) | (5,133 | ) | (1,638 | ) | (1,317 | ) | (1,219 | ) | (959 | ) | ||||||||||||||||||
| Cash dividends paid on preferred shares |
(101 | ) | (46 | ) | (55 | ) | (136 | ) | (42 | ) | (27 | ) | (34 | ) | (33 | ) | ||||||||||||||||||
| Cash dividends paid by subsidiaries to non-controlling interest |
(22 | ) | (1 | ) | (21 | ) | (39 | ) | (3 | ) | (11 | ) | (14 | ) | (11 | ) | ||||||||||||||||||
| Acquisition and other costs paid |
5 | 5 | - | 10 | 3 | 1 | 3 | 3 | ||||||||||||||||||||||||||
| FCF |
1,101 | 1,016 | 85 | 3,067 | 376 | 642 | 1,333 | 716 | ||||||||||||||||||||||||||
| (A) | Net debt and free cash flow are non-GAAP financial measures and net debt leverage ratio and adjusted EBITDA to adjusted net interest expense ratio are capital management measures. Refer to note 2.1, Non-GAAP financial measures and note 2.4, Capital management measures in the Accompanying Notes to this report for more information on these measures. |
BCE Supplementary Financial Information - Second Quarter 2023 Page 10
BCE
Consolidated Statements of Financial Position
| (In millions of Canadian dollars, except where otherwise indicated) (unaudited) |
June 30 2023 |
March 31 2023 |
December 31 2022 |
|||||||||||||||
| ASSETS |
||||||||||||||||||
| Current assets |
||||||||||||||||||
| Cash |
450 | 651 | 99 | |||||||||||||||
| Cash equivalents |
450 | 90 | 50 | |||||||||||||||
| Trade and other receivables |
3,771 | 3,828 | 4,138 | |||||||||||||||
| Inventory |
656 | 673 | 656 | |||||||||||||||
| Contract assets |
403 | 419 | 436 | |||||||||||||||
| Contract costs |
559 | 538 | 540 | |||||||||||||||
| Prepaid expenses |
395 | 378 | 244 | |||||||||||||||
| Other current assets |
282 | 330 | 324 | |||||||||||||||
| Assets held for sale |
- | 260 | - | |||||||||||||||
| Total current assets |
6,966 | 7,167 | 6,487 | |||||||||||||||
| Non-current assets |
||||||||||||||||||
| Contract assets |
243 | 260 | 288 | |||||||||||||||
| Contract costs |
683 | 633 | 603 | |||||||||||||||
| Property, plant and equipment |
29,909 | 29,233 | 29,256 | |||||||||||||||
| Intangible assets |
16,395 | 16,338 | 16,183 | |||||||||||||||
| Deferred tax assets |
108 | 102 | 84 | |||||||||||||||
| Investments in associates and joint ventures |
322 | 664 | 608 | |||||||||||||||
| Post-employment benefit assets |
3,207 | 3,407 | 3,559 | |||||||||||||||
| Other non-current assets |
1,194 | 1,341 | 1,355 | |||||||||||||||
| Goodwill |
11,022 | 10,830 | 10,906 | |||||||||||||||
| Total non-current assets |
63,083 | 62,808 | 62,842 | |||||||||||||||
| Total assets |
70,049 | 69,975 | 69,329 | |||||||||||||||
| LIABILITIES |
||||||||||||||||||
| Current liabilities |
||||||||||||||||||
| Trade payables and other liabilities |
4,347 | 4,080 | 5,221 | |||||||||||||||
| Contract liabilities |
793 | 851 | 857 | |||||||||||||||
| Interest payable |
305 | 208 | 281 | |||||||||||||||
| Dividends payable |
900 | 900 | 867 | |||||||||||||||
| Current tax liabilities |
207 | 164 | 106 | |||||||||||||||
| Debt due within one year |
6,039 | 6,347 | 4,137 | |||||||||||||||
| Liabilities held for sale |
- | 109 | - | |||||||||||||||
| Total current liabilities |
12,591 | 12,659 | 11,469 | |||||||||||||||
| Non-current liabilities |
||||||||||||||||||
| Contract liabilities |
257 | 244 | 228 | |||||||||||||||
| Long-term debt |
28,314 | 27,456 | 27,783 | |||||||||||||||
| Deferred tax liabilities |
4,898 | 4,969 | 4,953 | |||||||||||||||
| Post-employment benefit obligations |
1,339 | 1,348 | 1,311 | |||||||||||||||
| Other non-current liabilities |
1,201 | 1,032 | 1,070 | |||||||||||||||
| Total non-current liabilities |
36,009 | 35,049 | 35,345 | |||||||||||||||
| Total liabilities |
48,600 | 47,708 | 46,814 | |||||||||||||||
| EQUITY |
||||||||||||||||||
| Equity attributable to BCE shareholders |
||||||||||||||||||
| Preferred shares |
3,781 | 3,827 | 3,870 | |||||||||||||||
| Common shares |
20,859 | 20,851 | 20,840 | |||||||||||||||
| Contributed surplus |
1,204 | 1,179 | 1,172 | |||||||||||||||
| Accumulated other comprehensive (loss) income |
(105 | ) | 3 | (55 | ) | |||||||||||||
| Deficit |
(4,618 | ) | (3,926 | ) | (3,649 | ) | ||||||||||||
| Total equity attributable to BCE shareholders |
21,121 | 21,934 | 22,178 | |||||||||||||||
| Non-controlling interest |
328 | 333 | 337 | |||||||||||||||
| Total equity |
21,449 | 22,267 | 22,515 | |||||||||||||||
| Total liabilities and equity |
70,049 | 69,975 | 69,329 | |||||||||||||||
| Number of common shares outstanding (millions) |
912.3 | 912.2 | 912.0 | |||||||||||||||
BCE Supplementary Financial Information - Second Quarter 2023 Page 11
BCE
Consolidated Cash Flow Data
| (In millions of Canadian dollars, except where otherwise indicated) (unaudited) | Q2 2023 |
Q2 2022 |
$ change | YTD 2023 |
YTD 2022 |
$ change | ||||||||||||||||||||||||||
| Net earnings |
397 | 654 | (257 | ) | 1,185 | 1,588 | (403 | ) | ||||||||||||||||||||||||
| Adjustments to reconcile net earnings to cash flows from operating activities |
||||||||||||||||||||||||||||||||
| Severance, acquisition and other costs |
100 | 40 | 60 | 149 | 53 | 96 | ||||||||||||||||||||||||||
| Depreciation and amortization |
1,232 | 1,199 | 33 | 2,433 | 2,350 | 83 | ||||||||||||||||||||||||||
| Post-employment benefit plans cost |
21 | 52 | (31 | ) | 52 | 103 | (51 | ) | ||||||||||||||||||||||||
| Net interest expense |
346 | 265 | 81 | 676 | 523 | 153 | ||||||||||||||||||||||||||
| Impairment of assets |
- | 106 | (106 | ) | 34 | 108 | (74 | ) | ||||||||||||||||||||||||
| Gains on investments |
(79 | ) | (16 | ) | (63 | ) | (79 | ) | (53 | ) | (26 | ) | ||||||||||||||||||||
| Net equity losses on investments in associates and joint ventures |
377 | 42 | 335 | 377 | 42 | 335 | ||||||||||||||||||||||||||
| Income taxes |
273 | 232 | 41 | 543 | 567 | (24 | ) | |||||||||||||||||||||||||
| Contributions to post-employment benefit plans |
(13 | ) | (35 | ) | 22 | (28 | ) | (114 | ) | 86 | ||||||||||||||||||||||
| Payments under other post-employment benefit plans |
(17 | ) | (15 | ) | (2 | ) | (32 | ) | (30 | ) | (2 | ) | ||||||||||||||||||||
| Severance and other costs paid |
(39 | ) | (30 | ) | (9 | ) | (64 | ) | (58 | ) | (6 | ) | ||||||||||||||||||||
| Interest paid |
(270 | ) | (196 | ) | (74 | ) | (709 | ) | (569 | ) | (140 | ) | ||||||||||||||||||||
| Income taxes paid (net of refunds) |
(200 | ) | (143 | ) | (57 | ) | (364 | ) | (259 | ) | (105 | ) | ||||||||||||||||||||
| Acquisition and other costs paid |
(5 | ) | (3 | ) | (2 | ) | (5 | ) | (6 | ) | 1 | |||||||||||||||||||||
| Change in contract assets |
33 | 23 | 10 | 78 | 55 | 23 | ||||||||||||||||||||||||||
| Change in wireless device financing plan receivables |
24 | 68 | (44 | ) | 65 | 127 | (62 | ) | ||||||||||||||||||||||||
| Net change in operating assets and liabilities |
185 | 354 | (169 | ) | (699 | ) | (114 | ) | (585 | ) | ||||||||||||||||||||||
| Cash flows from operating activities |
2,365 | 2,597 | (232 | ) | 3,612 | 4,313 | (701 | ) | ||||||||||||||||||||||||
| Capital expenditures |
(1,307 | ) | (1,219 | ) | (88 | ) | (2,393 | ) | (2,178 | ) | (215 | ) | ||||||||||||||||||||
| Cash dividends paid on preferred shares |
(46 | ) | (34 | ) | (12 | ) | (101 | ) | (67 | ) | (34 | ) | ||||||||||||||||||||
| Cash dividends paid by subsidiaries to non-controlling interest |
(1 | ) | (14 | ) | 13 | (22 | ) | (25 | ) | 3 | ||||||||||||||||||||||
| Acquisition and other costs paid |
5 | 3 | 2 | 5 | 6 | (1 | ) | |||||||||||||||||||||||||
| Free cash flow |
1,016 | 1,333 | (317 | ) | 1,101 | 2,049 | (948 | ) | ||||||||||||||||||||||||
| Business acquisitions |
(196 | ) | - | (196 | ) | (221 | ) | (139 | ) | (82 | ) | |||||||||||||||||||||
| Business dispositions |
208 | 2 | 206 | 208 | 54 | 154 | ||||||||||||||||||||||||||
| Acquisition and other costs paid |
(5 | ) | (3 | ) | (2 | ) | (5 | ) | (6 | ) | 1 | |||||||||||||||||||||
| Spectrum licences |
(145 | ) | - | (145 | ) | (156 | ) | - | (156 | ) | ||||||||||||||||||||||
| Other investing activities |
(16 | ) | 27 | (43 | ) | 15 | 17 | (2 | ) | |||||||||||||||||||||||
| (Decrease) increase in notes payable |
(101 | ) | 187 | (288 | ) | (184 | ) | 656 | (840 | ) | ||||||||||||||||||||||
| Decrease in securitized receivables |
(500 | ) | - | (500 | ) | - | - | - | ||||||||||||||||||||||||
| Issue of long-term debt |
1,199 | - | 1,199 | 2,703 | 945 | 1,758 | ||||||||||||||||||||||||||
| Repayment of long-term debt |
(346 | ) | (245 | ) | (101 | ) | (645 | ) | (1,503 | ) | 858 | |||||||||||||||||||||
| Repurchase of a financial liability |
- | - | - | (149 | ) | - | (149 | ) | ||||||||||||||||||||||||
| Issue of common shares |
8 | 7 | 1 | 18 | 168 | (150 | ) | |||||||||||||||||||||||||
| Purchase of shares for settlement of share-based payments |
(42 | ) | (51 | ) | 9 | (135 | ) | (157 | ) | 22 | ||||||||||||||||||||||
| Repurchase of preferred shares |
(32 | ) | - | (32 | ) | (63 | ) | (115 | ) | 52 | ||||||||||||||||||||||
| Cash dividends paid on common shares |
(882 | ) | (839 | ) | (43 | ) | (1,721 | ) | (1,634 | ) | (87 | ) | ||||||||||||||||||||
| Other financing activities |
(7 | ) | - | (7 | ) | (15 | ) | (28 | ) | 13 | ||||||||||||||||||||||
| (857 | ) | (915 | ) | 58 | (350 | ) | (1,742 | ) | 1,392 | |||||||||||||||||||||||
| Net (decrease) increase in cash |
(201 | ) | 418 | (619 | ) | 351 | 307 | 44 | ||||||||||||||||||||||||
| Cash at beginning of period |
651 | 178 | 473 | 99 | 289 | (190 | ) | |||||||||||||||||||||||||
| Cash at end of period |
450 | 596 | (146 | ) | 450 | 596 | (146 | ) | ||||||||||||||||||||||||
| Net increase in cash equivalents |
360 | - | 360 | 400 | - | 400 | ||||||||||||||||||||||||||
| Cash equivalents at beginning of period |
90 | - | 90 | 50 | - | 50 | ||||||||||||||||||||||||||
| Cash equivalents at end of period |
450 | - | 450 | 450 | - | 450 | ||||||||||||||||||||||||||
BCE Supplementary Financial Information - Second Quarter 2023 Page 12
BCE
Consolidated Cash Flow Data - Historical Trend
| (In millions of Canadian dollars, except where otherwise indicated) (unaudited) | YTD 2023 |
Q2 23 | Q1 23 | TOTAL 2022 |
Q4 22 | Q3 22 | Q2 22 | Q1 22 | ||||||||||||||||||||||||||||||
| Net earnings |
1,185 | 397 | 788 | 2,926 | 567 | 771 | 654 | 934 | ||||||||||||||||||||||||||||||
| Adjustments to reconcile net earnings to cash flows from operating activities |
||||||||||||||||||||||||||||||||||||||
| Severance, acquisition and other costs |
149 | 100 | 49 | 94 | 19 | 22 | 40 | 13 | ||||||||||||||||||||||||||||||
| Depreciation and amortization |
2,433 | 1,232 | 1,201 | 4,723 | 1,192 | 1,181 | 1,199 | 1,151 | ||||||||||||||||||||||||||||||
| Post-employment benefit plans cost |
52 | 21 | 31 | 198 | 47 | 48 | 52 | 51 | ||||||||||||||||||||||||||||||
| Net interest expense |
676 | 346 | 330 | 1,124 | 319 | 282 | 265 | 258 | ||||||||||||||||||||||||||||||
| Impairment of assets |
34 | - | 34 | 279 | 150 | 21 | 106 | 2 | ||||||||||||||||||||||||||||||
| (Gains) losses on investments |
(79 | ) | (79 | ) | - | (24 | ) | 29 | - | (16 | ) | (37 | ) | |||||||||||||||||||||||||
| Net equity losses on investments in associates and joint ventures |
377 | 377 | - | 42 | - | - | 42 | - | ||||||||||||||||||||||||||||||
| Income taxes |
543 | 273 | 270 | 967 | 222 | 178 | 232 | 335 | ||||||||||||||||||||||||||||||
| Contributions to post-employment benefit plans |
(28 | ) | (13 | ) | (15 | ) | (140 | ) | (12 | ) | (14 | ) | (35 | ) | (79 | ) | ||||||||||||||||||||||
| Payments under other post-employment benefit plans |
(32 | ) | (17 | ) | (15 | ) | (64 | ) | (17 | ) | (17 | ) | (15 | ) | (15 | ) | ||||||||||||||||||||||
| Severance and other costs paid |
(64 | ) | (39 | ) | (25 | ) | (129 | ) | (27 | ) | (44 | ) | (30 | ) | (28 | ) | ||||||||||||||||||||||
| Interest paid |
(709 | ) | (270 | ) | (439 | ) | (1,197 | ) | (243 | ) | (385 | ) | (196 | ) | (373 | ) | ||||||||||||||||||||||
| Income taxes paid (net of refunds) |
(364 | ) | (200 | ) | (164 | ) | (749 | ) | (340 | ) | (150 | ) | (143 | ) | (116 | ) | ||||||||||||||||||||||
| Acquisition and other costs paid |
(5 | ) | (5 | ) | - | (10 | ) | (3 | ) | (1 | ) | (3 | ) | (3 | ) | |||||||||||||||||||||||
| Change in contract assets |
78 | 33 | 45 | (59 | ) | (94 | ) | (20 | ) | 23 | 32 | |||||||||||||||||||||||||||
| Change in wireless device financing plan receivables |
65 | 24 | 41 | 22 | (99 | ) | (6 | ) | 68 | 59 | ||||||||||||||||||||||||||||
| Net change in operating assets and liabilities |
(699 | ) | 185 | (884 | ) | 362 | 346 | 130 | 354 | (468 | ) | |||||||||||||||||||||||||||
| Cash flows from operating activities |
3,612 | 2,365 | 1,247 | 8,365 | 2,056 | 1,996 | 2,597 | 1,716 | ||||||||||||||||||||||||||||||
| Capital expenditures |
(2,393 | ) | (1,307 | ) | (1,086 | ) | (5,133 | ) | (1,638 | ) | (1,317 | ) | (1,219 | ) | (959 | ) | ||||||||||||||||||||||
| Cash dividends paid on preferred shares |
(101 | ) | (46 | ) | (55 | ) | (136 | ) | (42 | ) | (27 | ) | (34 | ) | (33 | ) | ||||||||||||||||||||||
| Cash dividends paid by subsidiaries to non-controlling interest |
(22 | ) | (1 | ) | (21 | ) | (39 | ) | (3 | ) | (11 | ) | (14 | ) | (11 | ) | ||||||||||||||||||||||
| Acquisition and other costs paid |
5 | 5 | - | 10 | 3 | 1 | 3 | 3 | ||||||||||||||||||||||||||||||
| Free cash flow |
1,101 | 1,016 | 85 | 3,067 | 376 | 642 | 1,333 | 716 | ||||||||||||||||||||||||||||||
| Business acquisitions |
(221 | ) | (196 | ) | (25 | ) | (429 | ) | (287 | ) | (3 | ) | - | (139 | ) | |||||||||||||||||||||||
| Business dispositions |
208 | 208 | - | 52 | (1 | ) | (1 | ) | 2 | 52 | ||||||||||||||||||||||||||||
| Acquisition and other costs paid |
(5 | ) | (5 | ) | - | (10 | ) | (3 | ) | (1 | ) | (3 | ) | (3 | ) | |||||||||||||||||||||||
| Spectrum licences |
(156 | ) | (145 | ) | (11 | ) | (3 | ) | - | (3 | ) | - | - | |||||||||||||||||||||||||
| Other investing activities |
15 | (16 | ) | 31 | (4 | ) | (13 | ) | (8 | ) | 27 | (10 | ) | |||||||||||||||||||||||||
| (Decrease) increase in notes payable |
(184 | ) | (101 | ) | (83 | ) | 111 | (511 | ) | (34 | ) | 187 | 469 | |||||||||||||||||||||||||
| (Decrease) increase in securitized receivables |
- | (500 | ) | 500 | 700 | - | 700 | - | - | |||||||||||||||||||||||||||||
| Issue of long-term debt |
2,703 | 1,199 | 1,504 | 1,951 | 1,006 | - | - | 945 | ||||||||||||||||||||||||||||||
| Repayment of long-term debt |
(645 | ) | (346 | ) | (299 | ) | (2,023 | ) | (250 | ) | (270 | ) | (245 | ) | (1,258 | ) | ||||||||||||||||||||||
| Repurchase of a financial liability |
(149 | ) | - | (149 | ) | - | - | - | - | - | ||||||||||||||||||||||||||||
| Issue of common shares |
18 | 8 | 10 | 171 | 2 | 1 | 7 | 161 | ||||||||||||||||||||||||||||||
| Purchase of shares for settlement of share-based payments |
(135 | ) | (42 | ) | (93 | ) | (255 | ) | (49 | ) | (49 | ) | (51 | ) | (106 | ) | ||||||||||||||||||||||
| Repurchase of preferred shares |
(63 | ) | (32 | ) | (31 | ) | (125 | ) | (10 | ) | - | - | (115 | ) | ||||||||||||||||||||||||
| Cash dividends paid on common shares |
(1,721 | ) | (882 | ) | (839 | ) | (3,312 | ) | (839 | ) | (839 | ) | (839 | ) | (795 | ) | ||||||||||||||||||||||
| Other financing activities |
(15 | ) | (7 | ) | (8 | ) | (31 | ) | (5 | ) | 2 | - | (28 | ) | ||||||||||||||||||||||||
| (350 | ) | (857 | ) | 507 | (3,207 | ) | (960 | ) | (505 | ) | (915 | ) | (827 | ) | ||||||||||||||||||||||||
| Net increase (decrease) in cash |
351 | (201 | ) | 552 | (190 | ) | (484 | ) | (13 | ) | 418 | (111 | ) | |||||||||||||||||||||||||
| Cash at beginning of period |
99 | 651 | 99 | 289 | 583 | 596 | 178 | 289 | ||||||||||||||||||||||||||||||
| Cash at end of period |
450 | 450 | 651 | 99 | 99 | 583 | 596 | 178 | ||||||||||||||||||||||||||||||
| Net increase (decrease) in cash equivalents |
400 | 360 | 40 | 50 | (100 | ) | 150 | - | - | |||||||||||||||||||||||||||||
| Cash equivalents at beginning of period |
50 | 90 | 50 | - | 150 | - | - | - | ||||||||||||||||||||||||||||||
| Cash equivalents at end of period |
450 | 450 | 90 | 50 | 50 | 150 | - | - | ||||||||||||||||||||||||||||||
BCE Supplementary Financial Information - Second Quarter 2023 Page 13
Accompanying Notes
| (1) | Effective Q1 2023, our results are now reported in two segments: Bell CTS and Bell Media. |
In 2022, we began modifying our internal and external reporting processes to align with organizational changes that were made to reflect an increasing strategic focus on multiproduct sales, the continually increasing technological convergence of our wireless and wireline telecommunications infrastructure and operations driven by the deployment of our Fifth Generation (5G) and fibre networks, and our digital transformation. These factors have made it increasingly difficult to distinguish between our wireless and wireline operations and resulted in changes in Q1 2023 to the financial information that is regularly provided to our chief operating decision maker to measure performance and allocate resources.
Effective with our Q1 2023 results, our previous Bell Wireless and Bell Wireline operating segments were combined to form a single reporting segment called Bell Communication and Technology Services (Bell CTS). Bell Media remains a distinct reportable segment and is unaffected. Our results are therefore reported in two segments: Bell CTS and Bell Media. As a result of our reporting changes, prior periods have been restated for comparative purposes.
Our Bell CTS segment provides a wide range of communication products and services to consumers, businesses and government customers across Canada. Wireless products and services include mobile data and voice plans and devices and are available nationally. Wireline products and services comprise data (including Internet access, IPTV, cloud-based services and business solutions), voice, and other communication services and products, which are available to our residential, small and medium-sized business and large enterprise customers primarily in Ontario, Québec, the Atlantic provinces and Manitoba, while satellite TV service and connectivity to business customers are available nationally across Canada. In addition, this segment includes our wholesale business, which buys and sells local telephone, long distance, data and other services from or to resellers and other carriers, as well as the results of operations of our national consumer electronics retailer, The Source (Bell) Electronics Inc. (The Source).
Our Bell Media segment provides conventional TV, specialty TV, pay TV, streaming services, digital media services, radio broadcasting services and OOH and advanced advertising services to customers nationally across Canada.
Furthermore, effective Q1 2023, as a result of the segment reporting changes impacting intersegment eliminations, ARPU has been updated and is defined as Bell CTS wireless external services revenues (previously wireless operating service revenues) divided by the average mobile phone subscriber base for the specified period, expressed as a dollar unit per month.
Throughout this report, we, us, our, BCE and the company mean, as the context may require, either BCE Inc. or, collectively, BCE Inc., Bell Canada, their subsidiaries, joint arrangements and associates. Bell means, as the context may require, either Bell Canada or, collectively, Bell Canada, its subsidiaries, joint arrangements and associates.
| (2) | Non-GAAP and other financial measures |
BCE uses various financial measures to assess its business performance. Certain of these measures are calculated in accordance with International Financial Reporting Standards (IFRS or GAAP) while certain other measures do not have a standardized meaning under GAAP. We believe that our GAAP financial measures, read together with adjusted non-GAAP and other financial measures, provide readers with a better understanding of how management assesses BCE’s performance.
National Instrument 52-112, Non-GAAP and Other Financial Measures Disclosure (NI 52-112), prescribes disclosure requirements that apply to the following specified financial measures:
| ● | Non-GAAP financial measures; |
| ● | Non-GAAP ratios; |
BCE Supplementary Financial Information - Second Quarter 2023 Page 14
| ● | Total of segments measures; |
| ● | Capital management measures; and |
| ● | Supplementary financial measures. |
This section provides a description and classification of the specified financial measures contemplated by NI 52-112 that we use in this report to explain our financial results except that, for supplementary financial measures, an explanation of such measures is provided where they are first referred to in this report if the supplementary financial measures’ labelling is not sufficiently descriptive.
| (2.1) | Non-GAAP financial measures |
A non-GAAP financial measure is a financial measure used to depict our historical or expected future financial performance, financial position or cash flow and, with respect to its composition, either excludes an amount that is included in, or includes an amount that is excluded from, the composition of the most directly comparable financial measure disclosed in BCE’s consolidated primary financial statements. We believe that non-GAAP financial measures are reflective of our on-going operating results and provide readers with an understanding of management’s perspective on and analysis of our performance.
Below are descriptions of the non-GAAP financial measures that we use in this report to explain our results. Except for adjusted net interest expense, for which a reconciliation is provided below, reconciliations to the most directly comparable IFRS financial measures on a consolidated basis are set out earlier in this report.
Adjusted net earnings
The term adjusted net earnings does not have any standardized meaning under IFRS. Therefore, it is unlikely to be comparable to similar measures presented by other issuers.
We define adjusted net earnings as net earnings attributable to common shareholders before severance, acquisition and other costs, net mark-to-market losses (gains) on derivatives used to economically hedge equity settled share-based compensation plans, net equity losses (gains) on investments in associates and joint ventures, net losses (gains) on investments, early debt redemption costs, impairment of assets and discontinued operations, net of tax and NCI.
We use adjusted net earnings and we believe that certain investors and analysts use this measure, among other ones, to assess the performance of our businesses without the effects of severance, acquisition and other costs, net mark-to-market losses (gains) on derivatives used to economically hedge equity settled share-based compensation plans, net equity losses (gains) on investments in associates and joint ventures, net losses (gains) on investments, early debt redemption costs, impairment of assets and discontinued operations, net of tax and NCI. We exclude these items because they affect the comparability of our financial results and could potentially distort the analysis of trends in business performance. Excluding these items does not imply they are non-recurring.
The most directly comparable IFRS financial measure is net earnings attributable to common shareholders. Refer to pages 2 and 3 of this report for a reconciliation of net earnings attributable to common shareholders to adjusted net earnings on a consolidated basis.
Adjusted net interest expense
The term adjusted net interest expense does not have any standardized meaning under IFRS. Therefore, it is unlikely to be comparable to similar measures presented by other issuers.
We define adjusted net interest expense as twelve-month trailing net interest expense as shown in our consolidated statements of cash flows, plus 50% of twelve-month trailing net earnings attributable to preferred shareholders as shown in our consolidated income statements.
BCE Supplementary Financial Information - Second Quarter 2023 Page 15
We use adjusted net interest expense as a component in the calculation of the adjusted EBITDA to adjusted net interest expense ratio, which is a capital management measure. For further details on the adjusted EBITDA to adjusted net interest expense ratio, see note 2.4, Capital management measures below. We use and believe that certain investors and analysts use the adjusted EBITDA to adjusted net interest expense ratio, among other measures, to evaluate the financial health of the company.
The most directly comparable IFRS financial measure is net interest expense. The following tables provide reconciliations of net interest expense to adjusted net interest expense on a consolidated basis.
| Q2 2023 | ||||
| Net interest expense (six months ended June 30, 2023) |
676 | |||
| Net interest expense (year ended December 31, 2022) |
1,124 | |||
| Net interest expense (six months ended June 30, 2022) |
(523) | |||
| 12-month trailing net interest expense (ended June 30, 2023) |
1,277 | |||
| 50% of net earnings attributable to preferred shareholders (six months ended June 30, 2023) |
46 | |||
| 50% of net earnings attributable to preferred shareholders (year ended December 31, 2022) |
76 | |||
| 50% of net earnings attributable to preferred shareholders (six months ended June 30, 2022) |
(35) | |||
| 50% of 12-month trailing net earnings attributable to preferred shareholders (ended June 30, 2023) |
87 | |||
|
Adjusted net interest expense for the twelve months ended June 30, 2023 |
1,364 | |||
| Q1 2023 | ||||
| Net interest expense (three months ended March 31, 2023) |
330 | |||
| Net interest expense (year ended December 31, 2022) |
1,124 | |||
| Net interest expense (three months ended March 31, 2022) |
(258) | |||
| 12-month trailing net interest expense (ended March 31, 2023) |
1,196 | |||
| 50% of net earnings attributable to preferred shareholders (three months ended March 31, 2023) |
23 | |||
| 50% of net earnings attributable to preferred shareholders (year ended December 31, 2022) |
76 | |||
| 50% of net earnings attributable to preferred shareholders (three months ended March 31, 2022) |
(17) | |||
| 50% of 12-month trailing net earnings attributable to preferred shareholders (ended March 31, 2023) |
82 | |||
|
Adjusted net interest expense for the twelve months ended March 31, 2023 |
1,278 | |||
| Q4 2022 | ||||
| Net interest expense |
1,124 | |||
|
50% of net earnings attributable to preferred shareholders |
76 | |||
|
Adjusted net interest expense |
1,200 | |||
Free cash flow
The term free cash flow does not have any standardized meaning under IFRS. Therefore, it is unlikely to be comparable to similar measures presented by other issuers.
BCE Supplementary Financial Information - Second Quarter 2023 Page 16
We define free cash flow as cash flows from operating activities, excluding cash from discontinued operations, acquisition and other costs paid (which include significant litigation costs) and voluntary pension funding, less capital expenditures, preferred share dividends and dividends paid by subsidiaries to NCI. We exclude cash from discontinued operations, acquisition and other costs paid and voluntary pension funding because they affect the comparability of our financial results and could potentially distort the analysis of trends in business performance. Excluding these items does not imply they are non-recurring.
We consider free cash flow to be an important indicator of the financial strength and performance of our businesses. Free cash flow shows how much cash is available to pay dividends on common shares, repay debt and reinvest in our company. We believe that certain investors and analysts use free cash flow to value a business and its underlying assets and to evaluate the financial strength and performance of our businesses. The most directly comparable IFRS financial measure is cash flows from operating activities. Refer to pages 10, 12 and 13 of this report for a reconciliation of cash flows from operating activities to free cash flow on a consolidated basis.
Net debt
The term net debt does not have any standardized meaning under IFRS. Therefore, it is unlikely to be comparable to similar measures presented by other issuers.
We define net debt as debt due within one year plus long-term debt and 50% of preferred shares, less cash and cash equivalents, as shown in BCE’s consolidated statements of financial position. We include 50% of outstanding preferred shares in our net debt as it is consistent with the treatment by certain credit rating agencies.
We consider net debt to be an important indicator of the company’s financial leverage because it represents the amount of debt that is not covered by available cash and cash equivalents. We believe that certain investors and analysts use net debt to determine a company’s financial leverage.
Net debt is calculated using several asset and liability categories from the statements of financial position. The most directly comparable IFRS financial measure is long-term debt. Refer to page 10 of this report for a reconciliation of long-term debt to net debt on a consolidated basis.
| (2.2) | Non-GAAP ratios |
A non-GAAP ratio is a financial measure disclosed in the form of a ratio, fraction, percentage or similar representation and that has a non-GAAP financial measure as one or more of its components.
Adjusted EPS
The term adjusted EPS does not have any standardized meaning under IFRS. Therefore, it is unlikely to be comparable to similar measures presented by other issuers.
We define adjusted EPS as adjusted net earnings per BCE common share. Adjusted net earnings is a non-GAAP financial measure. For further details on adjusted net earnings, see note 2.1 – Non-GAAP financial measures above.
We use adjusted EPS, and we believe that certain investors and analysts use this measure, among other ones, to assess the performance of our businesses without the effects of severance, acquisition and other costs, net mark-to-market losses (gains) on derivatives used to economically hedge equity settled share-based compensation plans, net equity losses (gains) on investments in associates and joint ventures, net losses (gains) on investments, early debt redemption costs, impairment of assets and discontinued operations, net of tax and NCI. We exclude these items because they affect the comparability of our financial results and could potentially distort the analysis of trends in business performance. Excluding these items does not imply they are non-recurring.
BCE Supplementary Financial Information - Second Quarter 2023 Page 17
| (2.3) | Total of segments measures |
A total of segments measure is a financial measure that is a subtotal or total of 2 or more reportable segments and is disclosed within the Notes to BCE’s consolidated primary financial statements.
Adjusted EBITDA
We define adjusted EBITDA as operating revenues less operating costs as shown in BCE’s consolidated income statements.
The most directly comparable IFRS financial measure is net earnings. The following tables provide reconciliations of net earnings to adjusted EBITDA on a consolidated basis.
| YTD 2023 | Q2 2023 | Q1 2023 | Total 2022 | Q4 2022 | Q3 2022 | YTD 2022 | Q2 2022 | Q1 2022 | ||||||||||||||||||||||||||||
| Net earnings |
1,185 | 397 | 788 | 2,926 | 567 | 771 | 1,588 | 654 | 934 | |||||||||||||||||||||||||||
| Severance, acquisition and other costs |
149 | 100 | 49 | 94 | 19 | 22 | 53 | 40 | 13 | |||||||||||||||||||||||||||
| Depreciation |
1,854 | 936 | 918 | 3,660 | 922 | 914 | 1,824 | 933 | 891 | |||||||||||||||||||||||||||
| Amortization |
579 | 296 | 283 | 1,063 | 270 | 267 | 526 | 266 | 260 | |||||||||||||||||||||||||||
| Finance costs |
||||||||||||||||||||||||||||||||||||
| Interest expense |
703 | 359 | 344 | 1,146 | 319 | 298 | 529 | 269 | 260 | |||||||||||||||||||||||||||
| Net return on post-employment benefit plans |
(54 | ) | (27 | ) | (27 | ) | (51 | ) | (13 | ) | (13 | ) | (25 | ) | (7 | ) | (18 | ) | ||||||||||||||||||
| Impairment of assets |
34 | - | 34 | 279 | 150 | 21 | 108 | 106 | 2 | |||||||||||||||||||||||||||
| Other (income) expense |
190 | 311 | (121 | ) | 115 | (19 | ) | 130 | 4 | 97 | (93 | ) | ||||||||||||||||||||||||
| Income taxes |
543 | 273 | 270 | 967 | 222 | 178 | 567 | 232 | 335 | |||||||||||||||||||||||||||
|
Adjusted EBITDA |
5,183 | 2,645 | 2,538 | 10,199 | 2,437 | 2,588 | 5,174 | 2,590 | 2,584 | |||||||||||||||||||||||||||
| (2.4) | Capital management measures |
A capital management measure is a financial measure that is intended to enable a reader to evaluate our objectives, policies and processes for managing our capital and is disclosed within the Notes to BCE’s consolidated financial statements.
The financial reporting framework used to prepare the financial statements requires disclosure that helps readers assess the company’s capital management objectives, policies, and processes, as set out in IFRS in IAS 1 – Presentation of Financial Statements. BCE has its own methods for managing capital and liquidity, and IFRS does not prescribe any particular calculation method.
Adjusted EBITDA to adjusted net interest expense ratio
The adjusted EBITDA to adjusted net interest expense ratio represents adjusted EBITDA divided by adjusted net interest expense. For the purposes of calculating our adjusted EBITDA to adjusted net interest expense ratio, adjusted EBITDA is twelve-month trailing adjusted EBITDA. Adjusted net interest expense used in the calculation of the adjusted EBITDA to adjusted net interest expense ratio is a non-GAAP financial measure defined as twelve-month trailing net interest expense as shown in our consolidated statements of cash flows, plus 50% of twelve-month trailing net earnings attributable to preferred shareholders as shown in our consolidated income statements. For further details on adjusted net interest expense, see note 2.1, Non-GAAP financial measures above.
We use, and believe that certain investors and analysts use, the adjusted EBITDA to adjusted net interest expense ratio, among other measures, to evaluate the financial health of the company.
BCE Supplementary Financial Information - Second Quarter 2023 Page 18
Net debt leverage ratio
The net debt leverage ratio represents net debt divided by adjusted EBITDA. Net debt used in the calculation of the net debt leverage ratio is a non-GAAP financial measure. For further details on net debt, see note 2.1, Non-GAAP financial measures above. For the purposes of calculating our net debt leverage ratio, adjusted EBITDA is twelve-month trailing adjusted EBITDA.
We use, and believe that certain investors and analysts use, the net debt leverage ratio as a measure of financial leverage.
| (2.5) | Supplementary financial measures |
A supplementary financial measure is a financial measure that is not reported in BCE’s consolidated financial statements, and is, or is intended to be, reported periodically to represent historical or expected future financial performance, financial position, or cash flows.
An explanation of such measures is provided where they are first referred to in this report if the supplementary financial measures’ labelling is not sufficiently descriptive.
| (3) | Key performance indicators (KPIs) |
In addition to the non-GAAP financial measures and other financial measures described previously, we use the following KPIs to measure the success of our strategic imperatives. These KPIs are not accounting measures and may not be comparable to similar measures presented by other issuers.
Adjusted EBITDA margin is defined as adjusted EBITDA divided by operating revenues.
Capital intensity is defined as capital expenditures divided by operating revenues.
Mobile phone blended ARPU is defined as Bell CTS wireless external services revenues divided by the average mobile phone subscriber base for the specified period, expressed as a dollar unit per month.
Mobile phone churn is the rate at which existing mobile phone subscribers cancel their services. It is a measure of our ability to retain our customers. Mobile phone churn is calculated by dividing the number of mobile phone deactivations during a given period by the average number of mobile phone subscribers in the base for the specified period and is expressed as a percentage per month.
Mobile phone subscriber unit is comprised of a recurring revenue generating portable unit (e.g. smartphones and feature phones) on an active service plan, that has access to our wireless networks and includes voice, text and/or data connectivity. We report mobile phone subscriber units in two categories: postpaid and prepaid. Prepaid mobile phone subscriber units are considered active for a period of 90 days following the expiry of the subscriber’s prepaid balance.
Mobile connected device subscriber unit is comprised of a recurring revenue generating portable unit (e.g. tablets, wearables, mobile Internet devices and Internet of Things) on an active service plan, that has access to our wireless networks and is intended for limited or no cellular voice capability.
Wireline subscriber unit consists of an active revenue-generating unit with access to our services, including retail Internet, satellite TV, IPTV, and/or residential NAS. A subscriber is included in our subscriber base when the service has been installed and is operational at the customer premise and a billing relationship has been established.
| ● | Retail Internet, IPTV and satellite TV subscribers have access to stand-alone services, and are primarily represented by a dwelling unit |
| ● | Retail residential NAS subscribers are based on a line count and are represented by a unique telephone number |
BCE Supplementary Financial Information - Second Quarter 2023 Page 19
Exhibit 99.4

Form 52-109F2 – Certification of Interim Filings - Full Certificate
I, Mirko Bibic, President and Chief Executive Officer of BCE Inc., certify the following:
1. Review: I have reviewed the interim financial report and interim MD&A (together, the “interim filings”) of BCE Inc. (the “issuer”) for the interim period ended June 30, 2023.
2. No misrepresentations: Based on my knowledge, having exercised reasonable diligence, the interim filings do not contain any untrue statement of a material fact or omit to state a material fact required to be stated or that is necessary to make a statement not misleading in light of the circumstances under which it was made, with respect to the period covered by the interim filings.
3. Fair presentation: Based on my knowledge, having exercised reasonable diligence, the interim financial report together with the other financial information included in the interim filings fairly present in all material respects the financial condition, financial performance and cash flows of the issuer, as of the date of and for the periods presented in the interim filings.
4. Responsibility: The issuer’s other certifying officer(s) and I are responsible for establishing and maintaining disclosure controls and procedures (DC&P) and internal control over financial reporting (ICFR), as those terms are defined in National Instrument 52-109 Certification of Disclosure in Issuers’ Annual and Interim Filings, for the issuer.
5. Design: Subject to the limitations, if any, described in paragraphs 5.2 and 5.3, the issuer’s other certifying officer(s) and I have, as at the end of the period covered by the interim filings
| A. | designed DC&P, or caused it to be designed under our supervision, to provide reasonable assurance that |
| I. | material information relating to the issuer is made known to us by others, particularly during the period in which the interim filings are being prepared; and |
| II. | information required to be disclosed by the issuer in its annual filings, interim filings or other reports filed or submitted by it under securities legislation is recorded, processed, summarized and reported within the time periods specified in securities legislation; and |
| B. | designed ICFR, or caused it to be designed under our supervision, to provide reasonable assurance regarding the reliability of financial reporting and the preparation of financial statements for external purposes in accordance with the issuer’s GAAP. |
5.1 Control framework: The control framework the issuer’s other certifying officer(s) and I used to design the issuer’s ICFR is the Internal Control-Integrated Framework (2013) issued by the Committee of Sponsoring Organizations of the Treadway Commission (COSO).
5.2 N/A
5.3 N/A
6. Reporting changes in ICFR: The issuer has disclosed in its interim MD&A any change in the issuer’s ICFR that occurred during the period beginning on April 1, 2023 and ended on June 30, 2023 that has materially affected, or is reasonably likely to materially affect, the issuer’s ICFR.
Date: August 3, 2023
| (signed) Mirko Bibic | ||||
| Mirko Bibic | ||||
| President and Chief Executive Officer |
Form 52-109F2 – Certification of Interim Filings - Full Certificate
I, Glen LeBlanc, Executive Vice-President and Chief Financial Officer of BCE Inc., certify the following:
1. Review: I have reviewed the interim financial report and interim MD&A (together, the “interim filings”) of BCE Inc. (the “issuer”) for the interim period ended June 30, 2023.
2. No misrepresentations: Based on my knowledge, having exercised reasonable diligence, the interim filings do not contain any untrue statement of a material fact or omit to state a material fact required to be stated or that is necessary to make a statement not misleading in light of the circumstances under which it was made, with respect to the period covered by the interim filings.
3. Fair presentation: Based on my knowledge, having exercised reasonable diligence, the interim financial report together with the other financial information included in the interim filings fairly present in all material respects the financial condition, financial performance and cash flows of the issuer, as of the date of and for the periods presented in the interim filings.
4. Responsibility: The issuer’s other certifying officer(s) and I are responsible for establishing and maintaining disclosure controls and procedures (DC&P) and internal control over financial reporting (ICFR), as those terms are defined in National Instrument 52-109 Certification of Disclosure in Issuers’ Annual and Interim Filings, for the issuer.
5. Design: Subject to the limitations, if any, described in paragraphs 5.2 and 5.3, the issuer’s other certifying officer(s) and I have, as at the end of the period covered by the interim filings
| A. | designed DC&P, or caused it to be designed under our supervision, to provide reasonable assurance that |
| I. | material information relating to the issuer is made known to us by others, particularly during the period in which the interim filings are being prepared; and |
| II. | information required to be disclosed by the issuer in its annual filings, interim filings or other reports filed or submitted by it under securities legislation is recorded, processed, summarized and reported within the time periods specified in securities legislation; and |
| B. | designed ICFR, or caused it to be designed under our supervision, to provide reasonable assurance regarding the reliability of financial reporting and the preparation of financial statements for external purposes in accordance with the issuer’s GAAP. |
5.1 Control framework: The control framework the issuer’s other certifying officer(s) and I used to design the issuer’s ICFR is the Internal Control-Integrated Framework (2013) issued by the Committee of Sponsoring Organizations of the Treadway Commission (COSO).
5.2 N/A
5.3 N/A
6. Reporting changes in ICFR: The issuer has disclosed in its interim MD&A any change in the issuer’s ICFR that occurred during the period beginning on April 1, 2023 and ended on June 30, 2023 that has materially affected, or is reasonably likely to materially affect, the issuer’s ICFR.
Date: August 3, 2023
| (signed) Glen LeBlanc | ||||
| Glen LeBlanc | ||||
| Executive Vice-President and Chief Financial Officer |
Exhibit 99.5

|

|
This news release contains forward-looking statements. For a description of the related risk factors and assumptions, please see the section entitled “Caution Regarding Forward-Looking Statements” later in this news release. The information contained in this news release is unaudited.
BCE reports second quarter 2023 results
| ● | 241,516 total wireless mobile phone and mobile connected device, retail Internet and IPTV net activations, up 76.5% |
| ● | 3.5% consolidated revenue growth delivered 2.1% higher adjusted EBITDA1 |
| ● | Net earnings of $397 million down 39.3% with net earnings attributable to common shareholders of $329 million, or $0.37 per common share, down 44.8%; adjusted net earnings1 of $722 million yielded a 9.2% decrease in adjusted EPS1 to $0.79 |
| ● | Cash flows from operating activities down 8.9% to $2,365 million; free cash flow1 decreased to $1,016 million on timing of working capital and capital expenditures |
| ● | Wireless operating momentum continues: surpassed 10 million mobile phone subscribers; wireless service revenue grew 4.4% on highest Q2 postpaid net activations2 in 18 years, up 33.8% to 111,282 and 79,537 mobile connected device net activations, up 79,881 |
| ● | Best Q2 retail Internet net activations since 2007, up 10.2% to 24,934; 52,148 fibre net activations, up 38.2%, delivered strong 7% residential Internet revenue growth; on pace to complete 85% of planned broadband buildout program3 by end of 2023 |
| ● | Bell Media digital revenue4 up 20% as total media revenue and adjusted EBITDA declined 1.9% and 5.3% respectively, due to ongoing advertising recession |
| ● | Reconfirming all 2023 financial guidance targets |
MONTRÉAL, August 3, 2023 – BCE Inc. (TSX, NYSE: BCE) today reported results for the second quarter (Q2) of 2023.
“Bell’s Q2 results demonstrate that our consistent strong execution and delivering the compelling services that our customers want and value is a winning approach,” said Mirko Bibic, President and CEO of BCE and Bell Canada.
1 Adjusted EBITDA is a total of segments measure, adjusted net earnings and free cash flow are non-GAAP financial measures and adjusted EPS is a non-GAAP ratio. Refer to the Non-GAAP and Other Financial Measures section in this news release for more information on these measures.
2 Refer to the Key Performance Indicators (KPIs) section in this news release for more information on subscriber (or customer) units.
3 Baseline broadband buildout program based on planned coverage footprint of approximately 10 million residential and business locations.
4 Digital revenues are comprised of advertising revenue from digital platforms including web sites, mobile apps, connected TV apps and out-of-home (OOH) digital assets/platforms, as well as advertising procured through Bell digital buying platforms and subscription revenue from direct-to-consumer services and Video on Demand services.
1/17
“Over the past several years, we have been laser focused on building the best networks, investing in growing our fibre footprint and delivering ever-faster mobile and Internet speeds. Bell pure fibre was ranked the fastest Internet in Canada in the Ookla Speedtest Awards report for Q1-Q2 2023, as well as the fastest Wi-Fi. We added 52,148 new net fibre customers in Q2, up 38.2% over last year, and our retail Internet net activations were up 10.2% to 24,934, our best Q2 result in 16 years. We surpassed a milestone of 10 million mobile phone subscribers, with service revenue up 4.4% on our highest Q2 postpaid net activations in 18 years. And we achieved these results against the backdrop of declining prices, demonstrating that our industry is delivering the highest quality services at decreasing prices, despite persistent inflation.
Despite the continuing advertising recession across North America, our leading content and digital-first media strategy continues to pay off with Bell Media digital revenue up 20% over last year, and now comprising 33% of total Bell Media revenue.”
KEY BUSINESS DEVELOPMENTS
Award-winning network, new Virgin Plus plans
Bell became Canada’s most awarded Internet service provider5 after its pure fibre Internet was named the fastest Internet and fastest Wi-Fi in the country in the Ookla Q1-Q2 2023 Speedtest Awards report.6 In addition, Bell MTS was recognized as Employees’ Choice: Canada’s Top Broadband ISP for Work in PCMag’s first survey of Internet providers at work in Canada.7 Virgin Plus launched new unlimited nationwide and 5G wireless plans, along with a new brand campaign and updated Member benefits.
Accelerate cloud strategy for Canadian businesses
Bell completed the acquisition of FX Innovation, a Montréal-based IT services and consulting company providing business clients with cloud-focused managed and professional services and workflow automation solutions. This acquisition delivers leading-edge technology solutions for Canadian businesses and seeks to position Bell as a tech services leader.
Delivering the most compelling content
TSN, RDS, CTV and Noovo
delivered extensive coverage of the Formula 1 Canadian Grand Prix, which was Canada’s
most-watched F1 race on record, attracting
an average audience of 1.34 million viewers. The final round of the RBC Canadian Open attracted the highest audience on record for a Canadian Open final on TSN, with a 41% increase compared to the 2022 final round. A total of approximately
2.35 million Canadians tuned in to watch the final. Bell Media announced its 2023 – 2024 original content slate as part of Upfront 23 and Futur 23. Total English and French-language original programming includes 96 titles and 1,037 hours of content.
CTV celebrated 22 consecutive years as Canada’s most-watched network. On Crave, Billionaire Murders was the top Canadian series launch ever for first week streams and Survivor Québec was the most-watched program of the spring on Noovo. The finale was the week’s most watched show on French
Québec television and the most watched episode on Noovo since the network’s debut in 2020. Crave expanded its direct-to-consumer subscription offering with
the launch of ad-supported tiers. Bell Media also unveiled new advertising solutions accessible directly through the Bell Marketing Platform, which includes Addressable TV, new upgrades to its Strategic
Audience Management (SAM) tool, expanded inventory on its Bell demand-side platform (DSP) including Addressable Audio, and new attribution capabilities.
2/17
Bell for Better: Better World, Better Communities, Better Workplace
Bell entered into its first Sustainability-Linked Derivatives, designed to align financing costs with our performance on environmental, social and governance (ESG) targets. Continuing to support youth mental health, Bell Let’s Talk built on Bell’s longstanding partnership with The Montréal Children’s Hospital Foundation with a $500,000 donation toward increasing therapy resources available through the hospital’s Children’s Eating Disorders program. Bell team members also raised nearly $300,000 for the annual Walk So Kids Can Talk in support of Kids Help Phone and its Feel Out Loud movement to expand access to its e-mental health service across Canada. Bell’s commitment to ESG standards through sustainable investments and diversity and equity initiatives ensured another strong ranking on the Corporate Knights Best 50 Corporate Citizens list.8
5 Most awarded Internet based on Bell competitive analysis. Bell awards include Ookla Q1-Q2 2023 Speedtest Awards; PCMag Best Major ISP for Gaming 2023, based on PCMag’s Quality Index (speed, latency and jitter) comparing major Canadian ISPs from December 1, 2021 to December 5, 2022; and BrandSpark Most Trusted ISP 2023. BrandSpark is a research and consulting firm. Winners were determined by a national survey of 15,878 Canadian shoppers who gave their top-of-mind, unaided answers to which brands they trust most and why in categories they have recently shopped.
6 Based on analysis by Ookla, a web testing and network diagnostics company, of Speedtest Intelligence data for Q1-Q2 2023. Ookla compared 13,671,040 user-initiated tests that are taken on various Speedtest applications connected to a fixed network, including tests taken on mobile phones over a Wi-Fi connection.
7 Survey conducted by PCMag from April 3 – 24, 2023 with PCMag.com community members who were asked to rate products and services they actually use. PCMag delivers labs-based, independent reviews of the latest technology products and services. See more information on the survey methodology at https://www.pcmag.com/news/readers-choice-methodology.
8 According to Corporate Knights Inc. The annual ranking was released on June 28, 2023 and is based on a set of 25 ESG indicators that compares Canadian companies with a gross revenue of at least $1 billion. For more information: https://www.corporateknights.com/rankings/best-50-rankings/2023-best-50-rankings/these-are-canadas-top-corporate-citizens-of-2023/
BCE RESULTS
Financial Highlights
| ($ millions except per share amounts) (unaudited) | Q2 2023 | Q2 2022 | % change | |||||||||
| BCE |
||||||||||||
| Operating revenues |
6,066 | 5,861 | 3.5% | |||||||||
| Net earnings |
397 | 654 | (39.3%) | |||||||||
| Net earnings attributable to common shareholders |
329 | 596 | (44.8%) | |||||||||
| Adjusted net earnings |
722 | 791 | (8.7%) | |||||||||
| Adjusted EBITDA |
2,645 | 2,590 | 2.1% | |||||||||
| Net earnings per common share (EPS) |
0.37 | 0.66 | (43.9%) | |||||||||
| Adjusted EPS |
0.79 | 0.87 | (9.2%) | |||||||||
| Cash flows from operating activities |
2,365 | 2,597 | (8.9%) | |||||||||
| Capital expenditures |
(1,307) | (1,219) | (7.2%) | |||||||||
|
Free cash flow |
1,016 | 1,333 | (23.8%) | |||||||||
“In what has now become a hallmark for BCE, we delivered another quarter of consistent and focused execution that yielded strong consolidated revenue growth of 3.5% and 2.1% higher adjusted EBITDA. This performance was driven by a healthy 7% increase in residential Internet revenue and 4.4% higher wireless service revenue, fuelled on the back of some of the best Q2 mobile phone and retail Internet subscriber net activations we have seen in well over 15 years. This was achieved despite ongoing media advertising headwinds, increased competitive intensity and a B2B sector that has not yet fully recovered from the global supply chain disruptions experienced over the past several years,” said Glen LeBlanc, Chief Financial Officer of BCE and Bell Canada.
3/17
“With stronger projected adjusted EBITDA and free cash flow trajectories in the second half of the year that are underpinned by operating momentum across the business, game-changing broadband network investments, disciplined cost management and proven execution in a competitive marketplace, I am reconfirming all our guidance targets for 2023.”
| ● | BCE operating revenue increased 3.5% over Q2 2022 to $6,066 million. This was the result of 1.3% higher service revenue of $5,303 million and a 21.5% increase in product revenue to $763 million, driven by growth at Bell Communication and Technology Services (Bell CTS), partly offset by a year-over-year decline at Bell Media. |
| ● | Net earnings decreased 39.3% to $397 million and net earnings attributable to common shareholders totalled $329 million, or $0.37 per share, down 44.8% and 43.9% respectively. The year-over-year declines were due to higher other expense that included a $377 million non-cash loss on BCE’s share of an obligation to repurchase at fair value the minority interest in one of its joint venture equity investments, higher interest expense, higher severance, acquisition and other costs related mainly to a workforce reduction initiative, increased depreciation and amortization expense and higher income taxes. These factors were partly offset by higher adjusted EBITDA, lower impairment of assets as we recorded a charge in Q2 2022 related to office spaces we ceased using as part of our real estate optimization strategy due to Bell’s hybrid work policy, and a higher net return on post-employment benefit plans. Adjusted net earnings were down 8.7% to $722 million, resulting in a 9.2% decrease in adjusted EPS to $0.79. |
| ● | Adjusted EBITDA grew 2.1% to $2,645 million, reflecting a 2.8% increase at Bell CTS, partly offset by a 5.3% decrease at Bell Media. BCE’s consolidated adjusted EBITDA margin9 declined 0.6 percentage points to 43.6% from 44.2% in Q2 2022, due mainly to a higher year-over-year mix of low-margin product sales. |
| ● | BCE capital expenditures were $1,307 million, up 7.2% from $1,219 million last year, corresponding to a capital intensity10 of 21.5%, compared to 20.8% in Q2 2022. The year-over-year increase in capital spending was due to the timing of planned investment to further expand Bell’s pure fibre network and higher year-over-year spending to connect more homes and businesses to Bell Internet services. |
| ● | BCE cash flows from operating activities were $2,365 million, down 8.9% from Q2 2022, reflecting lower cash from working capital attributable largely to the timing of supplier payments, higher interest paid, and higher income taxes, partly offset by higher adjusted EBITDA and lower contributions to post-employment benefit plans. |
| ● | Free cash flow was $1,016 million, down 23.8% from $1,333 million in Q2 2022, due to decreased cash flows from operating activities, excluding acquisition and other costs paid, and higher capital expenditures. |
9 Adjusted EBITDA margin is defined as adjusted EBITDA divided by operating revenues. Refer to the Key Performance Indicators (KPIs) section in this news release for more information on adjusted EBITDA margin.
10 Capital intensity is defined as capital expenditures divided by operating revenues. Refer to the Key Performance Indicators (KPIs) section in this news release for more information on capital intensity.
4/17
OPERATING RESULTS BY SEGMENT
Bell Communication and Technology Services (Bell CTS)
| ● | Total Bell CTS operating revenue increased 4.3% to $5,354 million, driven by both higher service and product revenue. |
| ● | Service revenue grew 1.9% to $4,591 million, mainly the result of continued strong mobile phone, mobile connected device and retail Internet subscriber base growth, higher wireless roaming revenue, as well as the financial contribution from acquisitions made over the past year, including Distributel and FX Innovation. This was partly offset by ongoing declines in legacy voice, data and satellite TV services, greater acquisition, retention and bundle discounts on residential home services, as well as lower sales of international long distance minutes to wholesale customers. |
| ● | Product revenue was up 21.5% to $763 million, driven by higher telecom data equipment sales to large enterprise customers compared to more significant global supply chain disruptions experienced last year, as well as a greater sales mix of higher-value mobile phones. |
| ● | Bell CTS adjusted EBITDA was up 2.8% to $2,431 million. This was driven by the flow-through of higher year-over-year service revenue, despite a 5.5% increase in operating costs that contributed to a 0.6 percentage-point margin decline to 45.4% from 46.0% last year. The increase in operating costs this quarter was mainly the result of higher cost of goods sold from increased product sales, and the acquisitions of Distributel, FX Innovation and other small companies. |
| ● | Postpaid mobile phone net subscriber11 activations totaled 111,282, up 33.8% from 83,197 in Q2 2022, representing our best Q2 result in 18 years. The increase was driven by 30.4% higher gross subscriber activations, reflecting immigration growth, continued 5G and multi-product bundling momentum, increased penetration of second line customer subscriptions and effective promotions. This was partly offset by an increase in mobile phone postpaid customer churn10 to 0.94% from 0.75% in Q2 2022, reflecting greater overall market activity and promotional offer intensity compared to last year. |
| ● | Bell’s prepaid mobile phone customer11 net subscriber activations decreased to 14,257 from 27,564 in Q2 2022, despite a 4.4% increase in gross activations, due to higher customer churn, which increased to 4.68% from 4.41% last year. The year-over-year increase in churn was attributable to more customer deactivations due in part to attractive promotional offers on postpaid discount brands. |
| ● | Bell’s mobile phone customer base totalled 10,028,031 at the end of Q2 2023, a 4.4% increase over last year, comprised of 9,151,229 postpaid subscribers, up 4.6%, and 876,802 prepaid customers, up 2.6%. |
| ● | Mobile phone blended ARPU12 was essentially unchanged at $59.16 compared to $59.17 in Q2 2022. |
| ● | Mobile connected device net activations totaled 79,537 compared to a net loss of 344 in Q2 2022. The year-over-year increase was driven by stronger customer demand for Bell IoT services, including business solutions and connected car subscriptions, and fewer data device deactivations. At the end of Q2, mobile connected device subscribers11 totalled 2,589,520, a 12.7% increase over last year. |
| ● | Bell added 24,934 net new retail Internet subscribers,11 up 10.2% from 22,620 in Q2 2022, driven by the ongoing expansion of Bell’s fibre footprint and increased customer penetration of bundled service offerings. This was partly offset by higher customer deactivations in our copper service areas attributable to aggressive promotional offers by competitors offering cable, fixed wireless and satellite Internet services. Within Bell’s all-fibre footprint, retail |
5/17
| Internet net activations were 52,148, 38.2% higher than Q2 2022. Retail Internet subscribers totalled 4,338,511 at the end of Q2, a 9.1% increase from last year, which includes 35,080 customers gained from small acquisitions made in the quarter. |
| ● | Bell TV added 11,506 net new retail IPTV subscribers,11 up from 3,838 in Q2 2022, driven by higher customer activations from greater Internet pull-through and effective promotions. At the end of Q2, Bell served 2,010,829 retail IPTV subscribers, a 5.4% increase over last year, which includes 243 customers gained from small acquisitions made in the quarter. |
| ● | Retail satellite TV net subscriber11 losses were 25,910, up from 15,365 in Q2 2022, due to fewer gross activations and higher customer churn driven by increased competitor promotional offer intensity. Bell’s retail satellite TV customer base totalled 712,559 at the end of Q2, down 12.7% from last year. |
| ● | Retail residential NAS11 net losses improved by 5.9% to 49,608, reflecting our success in driving higher gross activations through bundled service offerings. Bell’s retail residential NAS customer base totalled 2,101,740 at the end of Q2, down 4.8% from last year, which includes 7,458 customers gained from small acquisitions made in the quarter. |
11 Refer to the Key Performance Indicators (KPIs) section in this news release for more information on churn and subscriber (or customer) units.
12 Effective Q1 2023, as a result of the segment reporting changes impacting intersegment eliminations, ARPU has been updated and is defined as Bell CTS wireless external services revenues (previously wireless operating service revenues) divided by the average mobile phone subscriber base for the specified period, expressed as a dollar unit per month. Refer to the Key Performance Indicators (KPIs) section in this news release for more information on blended ARPU.
Bell Media
| ● | Media operating revenue decreased 1.9% to $805 million as a result of lower year-over-year advertising revenue, partly offset by higher subscriber revenue. |
| ● | Advertising revenue was down 9.0%, as advertiser demand and spending across all traditional media platforms remained soft due to unfavourable macroeconomic conditions. This was partly offset by strong growth in digital advertising. |
| ● | Subscriber revenue increased 3.9%, driven mainly by Crave and sports direct-to-consumer streaming growth. |
| ● | Total digital revenues grew 20%, the result of continued Crave and sports streaming direct-to-consumer growth and increased advertising bookings from Bell Media’s strategic audience management (SAM) TV media sales tool. Total Crave subscriptions increased 5% from last year to approximately 3.2 million customers, which included a 27% increase in direct-to-consumer streaming subscribers. |
| ● | Adjusted EBITDA was down 5.3% to $214 million, yielding a 0.9 percentage-point margin decline to 26.6%, as a result of lower year-over-year operating revenue. Despite contractual increases for premium content, operating costs improved 0.7%, due to the normalization of hockey schedules in 2023 and cessation of CRTC Part II fees in April 2023. |
| ● | CTV remained Canada’s most-watched English-language conventional network for a 22nd consecutive year, leading in daytime, primetime and late night with total viewers and in all key demographics for the 2022/2023 season. Reaching over 15 million Canadians on average weekly, CTV’s lead over its closest competitor in the Spring broadcast season was approximately 30% in primetime among all viewers and in the key A25-54 demographic. |
| ● | Bell Media was ranked number one overall and in full-day viewership in the French-language entertainment and pay specialty market among adults aged 25-54 in Q2. RDS remained the top-ranked French-language non-news specialty channel, while full-day audiences among A25-54 for Noovo increased 17% in Q2 as the French-language conventional TV market declined 10% overall, driving a 5-point market share gain. |
6/17
COMMON SHARE DIVIDEND
BCE’s Board of Directors has declared a quarterly dividend of $0.9675 per common share, payable on October 16, 2023 to shareholders of record at the close of business on September 15, 2023.
OUTLOOK FOR 2023
BCE confirmed its financial guidance targets for 2023, as provided on February 2, 2023, as follows:
| 2022 Results | 2023 Guidance | |||||||
|
Revenue growth |
3.1% | 1% to 5% | ||||||
|
Adjusted EBITDA growth |
3.1% | 2% to 5% | ||||||
|
Capital intensity |
21.2% | 19% to 20% | ||||||
|
Adjusted EPS growth |
5.0% | (3%) to (7%) | ||||||
|
Free cash flow growth |
2.9% | 2% to 10% | ||||||
|
Annualized common dividend per share |
$3.68 | $3.87 | ||||||
For 2023, we expect lower tax adjustments, higher depreciation and amortization expense and increased interest expense to drive lower adjusted EPS compared to 2022. For 2023, we expect growth in adjusted EBITDA, a reduction in contributions to post-employment benefit plans and payments under other post-employment benefit plans, and lower capital expenditures will drive higher free cash flow.
Please see the section entitled “Caution Regarding Forward-Looking Statements” later in this news release for a description of the principal assumptions on which BCE’s 2023 financial guidance targets are based, as well as the principal related risk factors.
CALL WITH FINANCIAL ANALYSTS
BCE will hold a conference call for financial analysts to discuss Q2 2023 results on Thursday, August 3 at 8:00 am eastern. Media are welcome to participate on a listen-only basis. To participate, please dial toll-free 1-800-806-5484 or 416-340-2217 and enter passcode 5876835#. A replay will be available until midnight on August 31, 2023 by dialing 1-800-408-3053 or 905-694-9451 and entering passcode 4674564#. A live audio webcast of the conference call will be available on BCE’s website at BCE Q2-2023 conference call.
NON-GAAP AND OTHER FINANCIAL MEASURES
BCE uses various financial measures to assess its business performance. Certain of these measures are calculated in accordance with International Financial Reporting Standards (IFRS or GAAP) while certain other measures do not have a standardized meaning under GAAP. We believe that our GAAP financial measures, read together with adjusted non-GAAP and other financial measures, provide readers with a better understanding of how management assesses BCE’s performance.
7/17
National Instrument 52-112, Non-GAAP and Other Financial Measures Disclosure (NI 52-112), prescribes disclosure requirements that apply to the following specified financial measures:
| ● | Non-GAAP financial measures; |
| ● | Non-GAAP ratios; |
| ● | Total of segments measures; |
| ● | Capital management measures; and |
| ● | Supplementary financial measures. |
This section provides a description and classification of the specified financial measures contemplated by NI 52-112 that we use in this news release to explain our financial results except that, for supplementary financial measures, an explanation of such measures is provided where they are first referred to in this news release if the supplementary financial measures’ labelling is not sufficiently descriptive.
Non-GAAP Financial Measures
A non-GAAP financial measure is a financial measure used to depict our historical or expected future financial performance, financial position or cash flow and, with respect to its composition, either excludes an amount that is included in, or includes an amount that is excluded from, the composition of the most directly comparable financial measure disclosed in BCE’s consolidated primary financial statements. We believe that non-GAAP financial measures are reflective of our on-going operating results and provide readers with an understanding of management’s perspective on and analysis of our performance.
Below are descriptions of the non-GAAP financial measures that we use in this news release to explain our results as well as reconciliations to the most directly comparable IFRS financial measures.
Adjusted net earnings – Adjusted net earnings is a non-GAAP financial measure and it does not have any standardized meaning under IFRS. Therefore, it is unlikely to be comparable to similar measures presented by other issuers.
We define adjusted net earnings as net earnings attributable to common shareholders before severance, acquisition and other costs, net mark-to-market losses (gains) on derivatives used to economically hedge equity settled share-based compensation plans, net equity losses (gains) on investments in associates and joint ventures, net losses (gains) on investments, early debt redemption costs, impairment of assets and discontinued operations, net of tax and NCI.
We use adjusted net earnings and we believe that certain investors and analysts use this measure, among other ones, to assess the performance of our businesses without the effects of severance, acquisition and other costs, net mark-to-market losses (gains) on derivatives used to economically hedge equity settled share-based compensation plans, net equity losses (gains) on investments in associates and joint ventures, net losses (gains) on investments, early debt redemption costs, impairment of assets and discontinued operations, net of tax and NCI. We exclude these items because they affect the comparability of our financial results and could potentially distort the analysis of trends in business performance. Excluding these items does not imply they are non-recurring.
The most directly comparable IFRS financial measure is net earnings attributable to common shareholders.
8/17
The following table is a reconciliation of net earnings attributable to common shareholders to adjusted net earnings on a consolidated basis.
| ($ millions) | ||||||
| Q2 2023 | Q2 2022 | |||||
| Net earnings attributable to common shareholders |
329 | 596 | ||||
| Reconciling items: |
||||||
| Severance, acquisition and other costs |
100 | 40 | ||||
| Net mark-to-market (gains) losses on derivatives used to economically hedge equity settled |
(1) | 81 | ||||
| Net equity losses on investments in associates and joint ventures |
377 | 42 | ||||
| Net gains on investments |
(79) | (16) | ||||
| Early debt redemption costs |
1 | - | ||||
| Impairment of assets |
- | 106 | ||||
| Income taxes for above reconciling items |
(5) | (62) | ||||
| NCI for the above reconciling items |
- | 4 | ||||
| Adjusted net earnings |
722 | 791 | ||||
Free cash flow – Free cash flow is a non-GAAP financial measure and it does not have any standardized meaning under IFRS. Therefore, it is unlikely to be comparable to similar measures presented by other issuers.
We define free cash flow as cash flows from operating activities, excluding cash from discontinued operations, acquisition and other costs paid (which include significant litigation costs) and voluntary pension funding, less capital expenditures, preferred share dividends and dividends paid by subsidiaries to NCI. We exclude cash from discontinued operations, acquisition and other costs paid and voluntary pension funding because they affect the comparability of our financial results and could potentially distort the analysis of trends in business performance. Excluding these items does not imply they are non-recurring.
We consider free cash flow to be an important indicator of the financial strength and performance of our businesses. Free cash flow shows how much cash is available to pay dividends on common shares, repay debt and reinvest in our company. We believe that certain investors and analysts use free cash flow to value a business and its underlying assets and to evaluate the financial strength and performance of our businesses. The most directly comparable IFRS financial measure is cash flows from operating activities.
9/17
The following table is a reconciliation of cash flows from operating activities to free cash flow on a consolidated basis.
| ($ millions) | ||||||||||||
| Q2 2023 | Q2 2022 | |||||||||||
| Cash flows from operating activities |
2,365 | 2,597 | ||||||||||
| Capital expenditures |
(1,307 | ) | (1,219 | ) | ||||||||
| Cash dividends paid on preferred shares |
(46 | ) | (34 | ) | ||||||||
| Cash dividends paid by subsidiaries to NCI |
(1 | ) | (14 | ) | ||||||||
| Acquisition and other costs paid |
5 | 3 | ||||||||||
| Free cash flow |
1,016 | 1,333 | ||||||||||
Non-GAAP Ratios
A non-GAAP ratio is a financial measure disclosed in the form of a ratio, fraction, percentage or similar representation and that has a non-GAAP financial measure as one or more of its components.
Below is a description of the non-GAAP ratio that we use in this news release to explain our results.
Adjusted EPS – Adjusted EPS is a non-GAAP ratio and it does not have any standardized meaning under IFRS. Therefore, it is unlikely to be comparable to similar measures presented by other issuers.
We define adjusted EPS as adjusted net earnings per BCE common share. Adjusted net earnings is a non-GAAP financial measure. For further details on adjusted net earnings, refer to Non-GAAP Financial Measures above.
We use adjusted EPS, and we believe that certain investors and analysts use this measure, among other ones, to assess the performance of our businesses without the effects of severance, acquisition and other costs, net mark-to-market losses (gains) on derivatives used to economically hedge equity settled share-based compensation plans, net equity losses (gains) on investments in associates and joint ventures, net losses (gains) on investments, early debt redemption costs, impairment of assets and discontinued operations, net of tax and NCI. We exclude these items because they affect the comparability of our financial results and could potentially distort the analysis of trends in business performance. Excluding these items does not imply they are non-recurring.
Total of Segments Measures
A total of segments measure is a financial measure that is a subtotal or total of 2 or more reportable segments and is disclosed within the Notes to BCE’s consolidated primary financial statements.
10/17
Below is a description of the total of segments measure that we use in this news release to explain our results as well as a reconciliation to the most directly comparable IFRS financial measure.
Adjusted EBITDA – Adjusted EBITDA is a total of segments measure. We define adjusted EBITDA as operating revenues less operating costs as shown in BCE’s consolidated income statements.
The most directly comparable IFRS financial measure is net earnings. The following table is a reconciliation of net earnings to adjusted EBITDA on a consolidated basis.
($ millions)
| Q2 2023 | Q2 2022 | |||||||
| Net earnings |
397 | 654 | ||||||
| Severance, acquisition and other costs |
100 | 40 | ||||||
| Depreciation |
936 | 933 | ||||||
| Amortization |
296 | 266 | ||||||
| Finance costs |
||||||||
| Interest expense |
359 | 269 | ||||||
| Net return on post-employment benefit plans |
(27) | (7) | ||||||
| Impairment of assets |
- | 106 | ||||||
| Other expense |
311 | 97 | ||||||
|
Income taxes |
273 | 232 | ||||||
|
Adjusted EBITDA |
2,645 | 2,590 | ||||||
Supplementary Financial Measures
A supplementary financial measure is a financial measure that is not reported in BCE’s consolidated financial statements, and is, or is intended to be, reported periodically to represent historical or expected future financial performance, financial position, or cash flows.
An explanation of such measures is provided where they are first referred to in this news release if the supplementary financial measures’ labelling is not sufficiently descriptive.
KEY PERFORMANCE INDICATORS (KPIs)
We use adjusted EBITDA margin, blended ARPU, capital intensity, churn and subscriber (or customer or NAS) units to measure the success of our strategic imperatives. These key performance indicators are not accounting measures and may not be comparable to similar measures presented by other issuers.
CAUTION REGARDING FORWARD-LOOKING STATEMENTS
Certain statements made in this news release are forward-looking statements. These statements include, without limitation, statements relating to BCE’s financial guidance (including revenue, adjusted EBITDA, capital intensity, adjusted EPS and free cash flow), BCE’s 2023 annualized common share dividend, our network deployment plans and anticipated capital expenditures as well as the benefits expected to result therefrom, stronger projected BCE adjusted EBITDA and free cash flow trajectories in the second half of 2023, our ESG objectives, BCE’s business outlook, objectives, plans and strategic priorities, and other statements that are not historical facts.
11/17
Forward-looking statements are typically identified by the words assumption, goal, guidance, objective, outlook, project, strategy, target, commitment and other similar expressions or future or conditional verbs such as aim, anticipate, believe, could, expect, intend, may, plan, seek, should, strive and will. All such forward-looking statements are made pursuant to the ‘safe harbour’ provisions of applicable Canadian securities laws and of the United States Private Securities Litigation Reform Act of 1995.
Forward-looking statements, by their very nature, are subject to inherent risks and uncertainties and are based on several assumptions, both general and specific, which give rise to the possibility that actual results or events could differ materially from our expectations expressed in or implied by such forward-looking statements and that our business outlook, objectives, plans and strategic priorities may not be achieved. These statements are not guarantees of future performance or events, and we caution you against relying on any of these forward-looking statements. The forward-looking statements contained in this news release describe our expectations as of August 3, 2023 and, accordingly, are subject to change after such date. Except as may be required by applicable securities laws, we do not undertake any obligation to update or revise any forward-looking statements contained in this news release, whether as a result of new information, future events or otherwise. We regularly consider potential acquisitions, dispositions, mergers, business combinations, investments, monetizations, joint ventures and other transactions, some of which may be significant. Except as otherwise indicated by us, forward-looking statements do not reflect the potential impact of any such transactions or of special items that may be announced or that may occur after August 3, 2023. The financial impact of these transactions and special items can be complex and depends on the facts particular to each of them. We therefore cannot describe the expected impact in a meaningful way or in the same way we present known risks affecting our business. Forward-looking statements are presented in this news release for the purpose of assisting investors and others in understanding certain key elements of our expected financial results, as well as our objectives, strategic priorities and business outlook, and in obtaining a better understanding of our anticipated operating environment. Readers are cautioned that such information may not be appropriate for other purposes.
Material Assumptions
A number of economic, market, operational and financial assumptions were made by BCE in preparing its forward-looking statements contained in this news release, including, but not limited to the following:
Canadian Economic Assumptions
Our forward-looking statements are based on certain assumptions concerning the Canadian economy. In particular, we have assumed:
| ● | Moderating economic growth, given the Bank of Canada’s most recent estimated growth in Canadian gross domestic product of 1.8% in 2023, down from 3.4% in 2022 |
| ● | Easing, but still elevated, consumer price index (CPI) inflation due to lower energy prices, improvements in global supply chains and the effects of higher interest rates moving through the economy |
| ● | Ongoing tight labour market conditions, but with some easing as tighter monetary policy moderates the demand for labour |
| ● | Slowing growth in household spending as demand for interest-rate-sensitive goods and services weakens and more households renew their mortgage at higher rates |
| ● | Soft business investment growth due to slowing demand and high financing costs |
| ● | Prevailing high interest rates expected to remain at or near current levels |
12/17
| ● | Population growth resulting from strong immigration |
| ● | Canadian dollar expected to remain near current levels. Further movements may be impacted by the degree of strength of the U.S. dollar, interest rates and changes in commodity prices. |
Canadian Market Assumptions
Our forward-looking statements also reflect various Canadian market assumptions. In particular, we have made the following market assumptions:
| ● | A higher level of wireline and wireless competition in consumer, business and wholesale markets |
| ● | Higher, but slowing, wireless industry penetration |
| ● | A shrinking data and voice connectivity market as business customers migrate to lower-priced telecommunications solutions or alternative over-the-top (OTT) competitors |
| ● | The Canadian advertising market is experiencing a slowdown consistent with trends in the global advertising market, with improvement expected in the medium term, although visibility to the specific timing and pace of recovery is limited |
| ● | Declines in broadcasting distribution undertaking (BDU) subscribers driven by increasing competition from the continued rollout of subscription video-on-demand (SVOD) streaming services together with further scaling of OTT aggregators |
Assumptions Concerning our Bell CTS Segment
Our forward-looking statements are also based on the following internal operational assumptions with respect to our Bell CTS segment:
| ● | Maintain our market share of national operators’ wireless postpaid mobile phone net additions and growth of our prepaid subscriber base |
| ● | Increased competitive intensity and promotional activity across all regions and market segments |
| ● | Ongoing expansion and deployment of Fifth Generation (5G) and 5G+ wireless networks, offering competitive coverage and quality |
| ● | Continued diversification of our distribution strategy with a focus on expanding direct-to-consumer (DTC) and online transactions |
| ● | Moderating growth in mobile phone blended ARPU, driven by growth in 5G subscriptions, and increased roaming revenue from the easing of travel restrictions implemented as a result of the COVID-19 pandemic, partly offset by reduced data overage revenue due, among others, to the continued adoption of unlimited plans |
| ● | Accelerating business customer adoption of advanced 5G, 5G+ and Internet of Things (IoT) solutions |
| ● | Improving wireless handset device availability in addition to stable device pricing and margins |
| ● | Further deployment of direct fibre to more homes and businesses within our wireline footprint |
| ● | Continued growth in retail Internet and IPTV subscribers |
| ● | Increasing wireless and Internet-based technological substitution |
| ● | Continued aggressive residential service bundle offers from cable TV competitors in our local wireline areas, moderated by growing our share of competitive residential service bundles |
| ● | Continued large business customer migration to IP-based systems |
| ● | Ongoing competitive repricing pressures in our business and wholesale markets |
13/17
| ● | Continued competitive intensity in our small and medium-sized business markets as cable operators and other telecommunications competitors continue to intensify their focus on business customers |
| ● | Traditional high-margin product categories challenged by large global cloud and OTT providers of business voice and data solutions expanding into Canada with on-demand services |
| ● | Increasing customer adoption of OTT services resulting in downsizing of TV packages |
| ● | Growing consumption of OTT TV services and on-demand video streaming, as well as the proliferation of devices, such as tablets, that consume large quantities of bandwidth, will require ongoing capital investment |
| ● | Realization of cost savings related to operating efficiencies enabled by a growing direct fibre footprint, changes in consumer behaviour and product innovation, digital adoption, product and service enhancements, expanding self-serve capabilities, new call centre and digital investments, other improvements to the customer service experience, management workforce reductions including attrition and retirements, and lower contracted rates from our suppliers |
| ● | No adverse material financial, operational or competitive consequences of changes in or implementation of regulations affecting our communication and technology services business |
Assumptions Concerning our Bell Media Segment
Our forward-looking statements are also based on the following internal operational assumptions with respect to our Bell Media segment:
| ● | Overall digital revenue expected to reflect continued scaling of our Strategic Audience Management (SAM) TV and demand-side platform (DSP) buying platforms, as well as DTC subscriber growth contributing towards the advancement of our digital-first media strategy |
| ● | Continued escalation of media content costs to secure quality programming |
| ● | Continued scaling of Crave through broader content offering, user experience improvements and expanded distribution |
| ● | Continued investment in Noovo original programming to better serve our French-language customers with a wider array of content on their preferred platforms |
| ● | Leveraging of first-party data to improve targeting, advertisement delivery and attribution |
| ● | Ability to successfully acquire and produce highly-rated programming and differentiated content |
| ● | Building and maintaining strategic supply arrangements for content across all screens and platforms |
| ● | No adverse material financial, operational or competitive consequences of changes in or implementation of regulations affecting our media business |
Financial Assumptions Concerning BCE
Our forward-looking statements are also based on the following internal financial assumptions with respect to BCE for 2023:
| ● | An estimated post-employment benefit plans service cost of approximately $210 million |
| ● | An estimated net return on post-employment benefit plans of approximately $100 million |
| ● | Depreciation and amortization expense of approximately $4,900 million to $4,950 million |
| ● | Interest expense of approximately $1,425 million to $1,475 million, instead of $1,375 million to $1,425 million |
| ● | Interest paid of approximately $1,450 million to $1,500 million, instead of $1,400 million to $1,450 million |
| ● | An average effective tax rate of approximately 26% |
14/17
| ● | Non-controlling interest of approximately $65 million |
| ● | Contributions to post-employment benefit plans of approximately $60 million |
| ● | Payments under other post-employment benefit plans of approximately $75 million |
| ● | Income taxes paid (net of refunds) of approximately $800 million to $900 million |
| ● | Weighted average number of BCE common shares outstanding of approximately 914 million |
| ● | An annual common share dividend of $3.87 per share |
Assumptions underlying expected reductions in 2023 annual contributions to our pension plans
Our forward-looking statements are also based on the following principal assumptions underlying expected 2023 annual reductions in contributions to our pension plans:
| ● | At the relevant time, our defined benefit (DB) pension plans will remain in funded positions with going concern surpluses and maintain solvency ratios that exceed the minimum legal requirements for a contribution holiday to be taken for applicable DB and defined contribution (DC) components |
| ● | No significant declines in our DB pension plans’ financial position due to declines in investment returns or interest rates |
| ● | No material experience losses from other events such as through litigation or changes in laws, regulations or actuarial standards |
The foregoing assumptions, although considered reasonable by BCE on August 3, 2023, may prove to be inaccurate. Accordingly, our actual results could differ materially from our expectations as set forth in this news release.
Material Risks
Important risk factors that could cause our assumptions and estimates to be inaccurate and actual results or events to differ materially from those expressed in, or implied by, our forward-looking statements, including our 2023 financial guidance, are listed below. The realization of our forward-looking statements, including our ability to meet our 2023 financial guidance targets, essentially depends on our business performance, which, in turn, is subject to many risks. Accordingly, readers are cautioned that any of the following risks could have a material adverse effect on our forward-looking statements. These risks include, but are not limited to: the negative effect of adverse economic conditions, including a potential recession, and related inflationary cost pressures, higher interest rates and financial and capital market volatility; the negative effect of adverse conditions associated with geopolitical events; a declining level of business and consumer spending, and the resulting negative impact on the demand for, and prices of, our products and services; regulatory initiatives, proceedings and decisions, government consultations and government positions that affect us and influence our business including, without limitation, concerning mandatory access to networks, spectrum auctions, the imposition of consumer-related codes of conduct, approval of acquisitions, broadcast and spectrum licensing, foreign ownership requirements, privacy and cybersecurity obligations and control of copyright piracy; the inability to implement enhanced compliance frameworks and to comply with legal and regulatory obligations; unfavourable resolution of legal proceedings; the intensity of competitive activity and the failure to effectively respond to evolving competitive dynamics; the combination of Rogers Communications Inc. and Shaw Communications Inc. creating a Canadian competitor with larger scale, and the acquisition of Freedom Mobile by Vidéotron Ltd.
15/17
also increasing its scale with a likely change in competitive dynamics in several provinces; the level of technological substitution and the presence of alternative service providers contributing to disruptions and disintermediation in each of our business segments; changing customer behaviour and the expansion of cloud-based, OTT and other alternative solutions; advertising market pressures from economic conditions, fragmentation and non-traditional/global digital services; rising content costs and challenges in our ability to acquire or develop key content; higher Canadian smartphone penetration and reduced or slower immigration flow; the inability to protect our physical and non-physical assets from events such as information security attacks, unauthorized access or entry, fire and natural disasters; the failure to implement effective data governance; the failure to evolve and transform our networks, systems and operations using next-generation technologies while lowering our cost structure; the inability to drive a positive customer experience; the failure to attract, develop and retain a diverse and talented team capable of furthering our strategic imperatives; the failure to adequately manage health and safety concerns; labour disruptions and shortages; the failure to maintain operational networks; the risk that we may need to incur significant capital expenditures to provide additional capacity and reduce network congestion; the inability to maintain service consistency due to network failures or slowdowns, the failure of other infrastructure, or disruptions in the delivery of services; service interruptions or outages due to legacy infrastructure and the possibility of instability as we transition towards converged wireline and wireless networks and newer technologies; the failure by us, or by other telecommunications carriers on which we rely to provide services, to complete planned and sufficient testing, maintenance, replacement or upgrade of our or their networks, equipment and other facilities, which could disrupt our operations including through network or other infrastructure failures; events affecting the functionality of, and our ability to protect, test, maintain, replace and upgrade, our networks, information technology (IT) systems, equipment and other facilities; the complexity of our operations; the failure to implement or maintain highly effective processes and IT systems; in-orbit and other operational risks to which the satellites used to provide our satellite TV services are subject; our dependence on third-party suppliers, outsourcers, and consultants to provide an uninterrupted supply of the products and services we need; the failure of our vendor selection, governance and oversight processes, including our management of supplier risk in the areas of security, data governance and responsible procurement; the quality of our products and services and the extent to which they may be subject to defects or fail to comply with applicable government regulations and standards; reputational risks and the inability to meaningfully integrate ESG considerations into our business strategy and operations; the failure to take appropriate actions to adapt to current and emerging environmental impacts, including climate change; pandemics, epidemics and other health risks, including health concerns about radio frequency emissions from wireless communications devices and equipment; the inability to adequately manage social issues; the failure to develop and implement strong corporate governance practices; various internal and external factors could challenge our ability to achieve our ESG targets including, without limitation, those related to greenhouse gas (GHG) emissions reduction and diversity, equity, inclusion and belonging; the inability to access adequate sources of capital and generate sufficient cash flows from operating activities to meet our cash requirements, fund capital expenditures and provide for planned growth; uncertainty as to whether dividends will be declared by BCE’s board of directors or whether the dividend on common shares will be increased; the inability to manage various credit, liquidity and market risks; the failure to reduce costs, as well as unexpected increases in costs; the failure to evolve practices to effectively monitor and control fraudulent activities; new or higher taxes due to new tax laws or changes thereto or in the interpretation thereof, and the inability to predict the outcome of government audits; the impact on our financial statements and estimates from a number of factors; and pension obligation volatility and increased contributions to post-employment benefit plans.
16/17
We caution that the foregoing list of risk factors is not exhaustive and other factors could also adversely affect our results. We encourage investors to also read BCE’s 2022 Annual MD&A dated March 2, 2023 and BCE’s 2023 First and Second Quarter MD&As dated May 3, 2023 and August 2, 2023, respectively, for additional information with respect to certain of these and other assumptions and risks, filed by BCE with the Canadian provincial securities regulatory authorities (available at Sedarplus.ca) and with the U.S. Securities and Exchange Commission (available at SEC.gov). These documents are also available at BCE.ca.
About BCE
BCE is Canada’s largest communications company,13 providing advanced Bell broadband wireless, Internet, TV, media and business communications services. To learn more, please visit Bell.ca or BCE.ca.
Through Bell for Better, we are investing to create a better today and a better tomorrow by supporting the social and economic prosperity of our communities. This includes the Bell Let’s Talk initiative, which promotes Canadian mental health with national awareness and anti-stigma campaigns like Bell Let’s Talk Day and significant Bell funding of community care and access, research and workplace initiatives throughout the country. To learn more, please visit Bell.ca/LetsTalk.
13 Based on total revenue and total combined customer connections.
Media inquiries:
Ellen Murphy
Ellen.murphy@bell.ca
Investor inquiries:
Thane Fotopoulos
514-870-4619
thane.fotopoulos@bell.ca
17/17
Exhibit 99.6
NOTICE OF RELIANCE
SECTION 13.4 OF NATIONAL INSTRUMENT 51-102
CONTINUOUS DISCLOSURE OBLIGATIONS
| To: | Alberta Securities Commission |
British Columbia Securities Commission
Manitoba Securities Commission
Financial and Consumer Services Commission, New Brunswick
Office of the Superintendent of Securities, Newfoundland and Labrador
Nova Scotia Securities Commission
Ontario Securities Commission
Office of the Superintendent of Securities, Prince Edward Island
Autorité des marchés financiers
Financial and Consumer Affairs Authority of Saskatchewan
Toronto Stock Exchange
Notice is hereby given that Bell Canada relies on the continuous disclosure documents filed by BCE Inc. pursuant to the exemption from the requirements of National Instrument 51-102 – Continuous Disclosure Obligations (“NI 51-102”) provided in Section 13.4 of NI 51-102.
The continuous disclosure documents of BCE Inc. can be found for viewing in electronic format at www.sedarplus.ca.
Attached to this notice and forming part thereof is the consolidating summary financial information for BCE Inc. as required by Section 13.4 of NI 51-102.
Dated: August 3, 2023
| BELL CANADA | ||
| By: (signed) Thierry Chaumont | ||
| Name: Thierry Chaumont | ||
| Title: Senior Vice-President, Controller and Tax | ||

|
BELL CANADA
|
UNAUDITED SELECTED SUMMARY FINANCIAL INFORMATION(1)
For the periods ended June 30, 2023 and 2022
(in millions of Canadian dollars)
BCE Inc. fully and unconditionally guarantees the payment obligations of its 100% owned subsidiary Bell Canada under the public debt issued by Bell Canada. Accordingly, the following summary financial information is provided by Bell Canada in compliance with the requirements of section 13.4 of National Instrument 51-102 (Continuous Disclosure Obligations) providing for an exemption for certain credit support issuers. The tables below contain selected summary financial information for (i) BCE Inc. (as credit supporter), (ii) Bell Canada (as credit support issuer) on a consolidated basis, (iii) BCE Inc.’s subsidiaries, other than Bell Canada, on a combined basis, (iv) consolidating adjustments, and (v) BCE Inc. and all of its subsidiaries on a consolidated basis, in each case for the periods indicated. Such summary financial information for BCE Inc. and Bell Canada and all other subsidiaries is intended to provide investors with meaningful and comparable financial information about BCE Inc. and its subsidiaries. This summary financial information should be read in conjunction with BCE Inc.’s audited consolidated financial statements for the year ended December 31, 2022 and the unaudited consolidated interim financial report for the six months ended June 30, 2023.
For the periods ended June 30:
| BCE INC. | BELL CANADA CONSOLIDATED | SUBSIDIARIES OF BCE INC. | CONSOLIDATING | BCE INC. | ||||||||||||||||||||||||||||||||||||||||||||||||||||||||||||||||||||||||||||
| (“CREDIT SUPPORTER”)(2) | (“CREDIT SUPPORT ISSUER”) | OTHER THAN BELL CANADA(3) | ADJUSTMENTS(4) | CONSOLIDATED | ||||||||||||||||||||||||||||||||||||||||||||||||||||||||||||||||||||||||||||
| 2023 | 2022 | 2023 | 2022 | 2023 | 2022 | 2023 | 2022 | 2023 | 2022 | 2023 | 2022 | 2023 | 2022 | 2023 | 2022 | 2023 | 2022 | 2023 | 2022 | |||||||||||||||||||||||||||||||||||||||||||||||||||||||||||||
| Three | Three | Six | Six | Three | Three | Six | Six | Three | Three | Six | Six | Three | Three | Six | Six | Three | Three | Six | Six | |||||||||||||||||||||||||||||||||||||||||||||||||||||||||||||
| months | months | months | months | months | months | months | months | months | months | months | months | months | months | months | months | months | months | months | months | |||||||||||||||||||||||||||||||||||||||||||||||||||||||||||||
| Operating revenues |
– | – | – | – | 6,066 | 5,861 | 12,120 | 11,712 | – | – | – | – | – | – | – | (1 | ) | 6,066 | 5,861 | 12,120 | 11,711 | |||||||||||||||||||||||||||||||||||||||||||||||||||||||||||
| Net earnings from continuing operations attributable to owners |
375 | 631 | 1,146 | 1,542 | 748 | 671 | 1,506 | 1,599 | 43 | 55 | 90 | 92 | (791 | ) | (726 | ) | (1,596 | ) | (1,691 | ) | 375 | 631 | 1,146 | 1,542 | ||||||||||||||||||||||||||||||||||||||||||||||||||||||||
| Net earnings attributable to owners |
375 | 631 | 1,146 | 1,542 | 748 | 671 | 1,506 | 1,599 | 43 | 55 | 90 | 92 | (791 | ) | (726 | ) | (1,596 | ) | (1,691 | ) | 375 | 631 | 1,146 | 1,542 | ||||||||||||||||||||||||||||||||||||||||||||||||||||||||
As at June 30, 2023 and December 31, 2022, respectively:
| BCE INC. | BELL CANADA CONSOLIDATED | SUBSIDIARIES OF BCE INC. | CONSOLIDATING | BCE INC. | ||||||||||||||||||||||||||||||||||||||||||||||||||||||||||||||||
| (“CREDIT SUPPORTER”)(2) | (“CREDIT SUPPORT ISSUER”) | OTHER THAN BELL CANADA(3) | ADJUSTMENTS(4) | CONSOLIDATED | ||||||||||||||||||||||||||||||||||||||||||||||||||||||||||||||||
| June 30, | Dec. 31, | June 30, | Dec. 31, | June 30, | Dec. 31, | June 30, | Dec. 31, | June 30, | Dec. 31, | |||||||||||||||||||||||||||||||||||||||||||||||||||||||||||
| 2023 | 2022 | 2023 | 2022 | 2023 | 2022 | 2023 | 2022 | 2023 | 2022 | |||||||||||||||||||||||||||||||||||||||||||||||||||||||||||
| Total Current Assets |
758 | 744 | 8,912 | 7,865 | 563 | 473 | (3,267 | ) | (2,595 | ) | 6,966 | 6,487 | ||||||||||||||||||||||||||||||||||||||||||||||||||||||||
| Total Non-current Assets |
23,299 | 23,856 | 57,040 | 56,461 | 38 | 38 | (17,294 | ) | (17,513 | ) | 63,083 | 62,842 | ||||||||||||||||||||||||||||||||||||||||||||||||||||||||
| Total Current Liabilities |
2,881 | 2,401 | 12,896 | 11,583 | 81 | 81 | (3,267 | ) | (2,596 | ) | 12,591 | 11,469 | ||||||||||||||||||||||||||||||||||||||||||||||||||||||||
|
Total Non-current Liabilities |
54 | 21 | 35,380 | 34,746 | – | – | 575 | 578 | 36,009 | 35,345 | ||||||||||||||||||||||||||||||||||||||||||||||||||||||||||
| (1) | The summary financial information is prepared in accordance with International Financial Reporting Standards (IFRS) and is in accordance with generally accepted accounting principles issued by the Canadian Accounting Standards Board for publicly-accountable enterprises. |
| (2) | This column accounts for investments in all subsidiaries of BCE Inc. under the equity method. |
| (3) | This column accounts for investments in all subsidiaries of BCE Inc. (other than Bell Canada) on a consolidated basis. |
| (4) | This column includes the necessary amounts to eliminate the intercompany balances between BCE Inc., Bell Canada and other subsidiaries and other adjustments to arrive at the information for BCE Inc. on a consolidated basis. |
Exhibit 99.7
BCE Inc.
EXHIBIT TO 2023 SECOND QUARTER FINANCIAL STATEMENTS
EARNINGS COVERAGE
The following consolidated financial ratios are calculated for the twelve months ended June 30, 2023, give effect to the issuance and redemption of all long-term debt since July 1, 2022 as if these transactions occurred on July 1, 2022, and are based on unaudited financial information of BCE Inc.
| June 30, 2023 | ||
| Earnings coverage of interest on debt requirements based on net earnings attributable to owners of BCE Inc. before interest expense and income tax: | 3.0 times | |
| Earnings coverage of interest on debt requirements based on net earnings attributable to owners of BCE Inc. before interest expense, income tax and non-controlling interest: | 3.1 times | |
Exhibit 99.8

Code of Business Conduct
What we do is who we are

Our Moral Compass
Policy Contact: corporate.secretariat@bell.ca
© Bell Canada 2023. All Rights Reserved.
| Code of Business Conduct |
What’s Inside
|
If you have any question regarding this Code of Business Conduct, please e-mail corporate.secretariat@bell.ca or contact the Business Conduct Help Line available at clearviewconnects.com on a 24/7 basis or by calling 1 866 298 2942 (toll free).
|
|
Our goal:
Advancing how Canadians connect with each other and the world
Our 6 strategic imperatives:

| © Bell Canada 2023. All Rights Reserved. | P a g e | i |
| Code of Business Conduct |
A Message from our President and Chief Executive Officer
Building on Bell’s legacy of service while continuing to achieve our purpose of advancing how Canadians connect with each other and the world comes with tremendous responsibility to our stakeholders. We must all achieve the highest standards of ethical and professional conduct in our work, including understanding and abiding by the values and requirements set out in the Bell Code of Business Conduct.
The Bell Code of Business Conduct explains the laws and regulations that apply to our business and provides clear guidelines for ethical conduct related to interactions with customers, fellow team members, partners and the public;
confidentiality and safeguarding of information and assets; stock trading and other public company regulations; engaging on social media; and more.
All team members are required to complete training in the Code of Business Conduct when they join the company, affirm that they have reviewed the Code annually, and refresh their training in the Code every 2 years.
We understand that Bell’s continued leadership depends on the trust and support of all our stakeholders. Our Code of Conduct is a key part of that commitment, and I thank you for making it part of the way you work.

Mirko Bibic
President and Chief Executive Officer
BCE Inc. and Bell Canada
| © Bell Canada 2023. All Rights Reserved. | P a g e | ii |
| Code of Business Conduct |
| 1 | INTRODUCTION |
The Bell Canada Code of Business Conduct explains the fundamental values and standards of behaviour that are expected from us in all aspects of our business.
In our daily activities, we have a fundamental responsibility to address a broad spectrum of issues. These include: preventing conflicts of interest, protecting company assets, safeguarding privacy and confidentiality, treating customers and the broader public, shareholders, suppliers, our fellow team members and competitors with respect and honesty, fostering a diverse, safe and healthy workplace and protecting the environment.
Acting responsibly is central to achieving sustainable business success and essential to the pursuit of our corporate purpose: advancing how Canadians connect with each other and the world.
The Code provides various rules and guidelines for ethical behaviour based on Bell values, as well as applicable laws and regulations.
These values and standards reinforce our commitment to the highest levels of customer service, a working environment in which performance is recognized and people are respected and sensitivity to the needs of the community that Bell serves.
| 1.1 | Scope: Who Does the Code Apply To? |
The Code applies to everyone at Bell, including all directors, executives and employees of BCE Inc., Bell Canada and their subsidiaries. Throughout the Code, we will refer to these companies as Bell.
| 1.2 | Objectives |
Collectively, we undertake to:
| ● | perform our work duties and conduct our business relationships with integrity and in a dynamic, straightforward, honest and fair manner |
| ● | comply with laws that apply to us as well as with Bell policies and procedures |
| ● | avoid conflicts of interest |
| ● | foster a work environment based on mutual trust and respect and that encourages open communication |
| ● | maintain a safe, healthy and secure workplace |
| ● | protect the environment and use energy and other resources efficiently |
| ● | support a culture in which ethical conduct is recognized, valued and exemplified |
| ● | promptly report issues relating to the Code and potential violations, non-compliance with applicable laws, regulations or company policies or procedures and any other emergencies. |
| 1.3 | Reporting a Misconduct or Violation of the Code – The Business Conduct Help Line |
Individual responsibility does not mean you are on your own when facing an ethical issue. Don’t be reluctant to ask any questions you might have on the Code or raise issues.
As part of Bell’s commitment to the highest standards of ethics, employees are encouraged to promptly report any actual or potential misconduct, Code or other company policy violations, malpractice, fraud, misappropriation of business property or any other illegal or unethical act or behaviour, including accounting, internal accounting controls or auditing matters by an employee of Bell or by any business unit of Bell.
Any submission made by an employee regarding an unethical behaviour will be treated on a confidential and anonymous
basis, unless specifically permitted to be disclosed by the employee or unless required by law. Submissions will only be disclosed to those persons who have a need to know in order to properly carry out an investigation of the potential unethical behaviour.
Any employee who in good faith reports an unethical behaviour will be protected from threats of retaliation, discharge or other types of sanctions that are directly related to the disclosure of such unethical behaviour.
No employee will be penalized for inquiring, in good faith, about apparently unethical behaviour or for obtaining guidance on how to handle suspected illegal acts or policy violations. Further, Bell will not allow retaliation for reports made in good faith.
| © Bell Canada 2023. All Rights Reserved. | P a g e | 1 |
| Code of Business Conduct |
An unethical behaviour may be reported to your immediate manager. If this won’t meet your needs, is inappropriate, does not provide the necessary level of confidentiality or if you otherwise prefer, you can contact our confidential and anonymous Business Conduct Help Line at clearviewconnects.com on a 24/7 basis or by calling 1-866-298-2942 (toll free). You may also contact the Corporate Secretary or the Chair of the Audit Committee.
You can also consult the Complaint Procedures for Accounting and Auditing Matters on the Policies and ethics Bellnet site.
| 1.4 | Responsibilities of Managers & Executives |
We are all expected to perform our jobs with integrity and in a dynamic, straightforward, honest and fair manner. However, managers and executives have an enhanced role. This means:
| ● | setting an example by complying with the Code and all Bell policies at all times |
| ● | ensuring that all employees have access to the Code (on-line or in paper format), that they know, understand and comply with its provisions and that they complete the annual review and sign off process |
| ● | complying with security policies and the associated directives, procedures and standards |
| ● | fostering an environment that encourages open communication and upholds sustainable development, environmental protection, health & safety, labour and ethics principles in every business decision and actions |
| ● | immediately reporting violations of the Code or breaches of Bell policies and taking prompt and decisive disciplinary action when it has been established that the Code has been violated. |
| 1.5 | Penalties for Violations |
Disciplinary action up to and including dismissal will be taken should an employee, manager or executive:
| ● | violate the Code or a Bell policy, disregard proper procedures or ask others to violate the Code or a Bell policy |
| ● | deliberately fail to promptly report a violation or withhold relevant information concerning a violation |
| ● | fail to cooperate in the investigation of a known or suspected violation or |
| ● | take action against an employee who reports a violation or breach of the Code or other policy. |
| 1.6 | Annual Review and Sign Off |
To demonstrate our commitment to the shared values and standards described in the Code, all employees, managers, executives and members of the Board of Directors must certify annually that they have reviewed and follow the Code. A copy of these certifications can be found at Attachments 1A and 2A. All employees must also take the on-line course on the Code at least every two years.
| © Bell Canada 2023. All Rights Reserved. | P a g e | 2 |
| Code of Business Conduct |
| 2 | OUR PRINCIPLES OF ETHICAL CONDUCT |
| 2.1 | Human Rights |
Bell’s human rights policy is informed by internationally proclaimed human rights and is committed not to infringe on them in the course of its business operations.
These include, amongst others, the rights to equality, liberty, free expression and to a workplace free from discrimination. Thus, this policy supports internationally accepted standards in this regard as notably defined by the Universal Declaration of Human Rights, General Assembly resolution 217A (III) 1948, the UN Guiding Principles on Business and Human Rights, 2011, and the OECD Guidelines for Multinational Enterprises, 2011. Most notably, Bell upholds the human rights of workers, and is committed to treating them with dignity and respect, and to endorse internationally accepted standards as defined in the International Labour Organization (ILO) conventions and regional or national legislation governing working conditions.
For further information, please refer to Human Rights Bellnet site. For further information on how Bell protects personal information, please refer to the Privacy Policy, the Employee Privacy Policy and to the Privacy Bellnet site.
| 2.2 | Personal Integrity |
Ethical behaviour is an essential part of our job and is a personal responsibility we all share. It means performing our job fully and competently. It also means being accountable for our behaviour and for supporting the values, principles and standards upon which our reputation rests.
Many aspects of our business are governed by laws and regulations and compliance with such laws and regulations is basic to ethical conduct. Bell and its directors, executives, managers and other employees are expected to comply with the laws, rules and regulations of all countries in which we operate, as well as the expectations and requirements of our various regulators. These laws include, but are not limited to, telecommunications and broadcasting laws, securities laws, laws prohibiting the corruption of government officials, in Canada and abroad, as well as lobbying, competition, environmental, health and safety and employment legislation.
Ethical behaviour, however, goes beyond mere compliance with the law. It involves thinking through the possible impact of our decisions on all interested parties - customers, employees, unions, business partners, suppliers, investors, government as well as the communities and environment in which we live and work.
Although the Code lays out the fundamental principles of ethical and legal conduct, it cannot anticipate every ethical dilemma or situation we may encounter as we perform our jobs. This
would be impossible given the rapid evolution of the communications industry.
Consequently, we may often find ourselves caught in a situation or facing an ethical problem not explicitly covered in the Code. In this case, we must rely on our internal sense of what is right – our moral compass – to guide us in making the right decision.
When faced with a difficult or unclear situation, it may help to ask questions such as:
| ● | how would I feel if, rather than initiating this action, I was on the receiving end? |
| ● | how would my customer react if my customer knew I was breaking the rules or distorting the facts to make a sale? |
| ● | if I do this, how will I feel afterwards? Would I want my co-workers, friends or family to find out? |
| ● | if my actions became public, how would they be reported in the media? |
Assuming personal responsibility for our actions means we can’t blame someone else for our behaviour. Conversely, no one - not even a manager - can force us to commit an illegal or unethical act that may damage Bell’s reputation, or our own.
| © Bell Canada 2023. All Rights Reserved. | P a g e | 3 |
| Code of Business Conduct |
We have a duty to report illegal acts or violations of the Code or Bell policies. Turning a blind eye to wrongdoing - in effect condoning such behaviour - is itself unethical. See section 1.3 for ways that are available to you to report unethical conducts.
Any breach of the Code or Bell policies or evidence of illegal behaviour will be taken very seriously. Depending on the nature and severity of the case, employees who breach the Code, violate Bell policy or commit an illegal act will face immediate discipline, up to and including dismissal, as well as possible civil or criminal prosecution.
| 2.3 | Conflicts of Interest |
As employees, managers and executives, our business loyalty rests in placing Bell’s interests – including those of its customers and shareholders – before our personal interests and relationships.
A conflict of interest arises whenever we allow, or appear to allow, personal interests or relationships to impair our judgment and ability to make decisions with integrity and honesty. By thinking of ourselves or our relationships first, we may act in a way that is damaging, or potentially damaging, to Bell. We may also harm our personal reputation.
We must not use our position to influence or bypass Bell procedures, or improperly take advantage of information we have access to by virtue of our positon, for personal gain nor for the benefit of our family, friends, colleagues or anyone else.
How Can I Tell If I Am In a Conflict of Interest?
If you are not sure about a particular situation, obtain the guidance you need. Start by asking yourself the following questions:
| ● | Am I following proper Bell procedures? |
| ● | Do I stand to potentially gain personally from my actions? |
| ● | Can my actions potentially result in a financial or other advantage for myself, a near relative (which would include a spouse, sibling, parent, child, or in-law), friend or other relationship? |
| ● | Am I uncomfortable discussing this with my manager or fellow employees? |
| ● | Would I act differently if a friend or near relative or relationship weren’t involved? |
If you have any doubts about a possible conflict, raise the matter with your manager or contact the Business Conduct Help Line at www.clearviewconnects.com or by calling 1-866-298-2942 (toll free).
If there is an actual or potential conflict of interest, you must disclose it immediately to your leader and as part of the annual online review process.
| 2.3.1 | Conflicts of Interest Relating to Family and Personal Relationships |
Each of us has a variety of personal relationships involving family and friends and sometimes our work and personal lives intersect.
We must disclose this relationship if it compromises, or threatens to compromise, our ability to act in Bell’s best interest. Speak to your manager or contact the Business Conduct Help Line for further guidance. We should also be aware that bridging our personal and business lives may cause our competitors or
suppliers – as well as colleagues within Bell – to believe we are in a conflict of interest. To avoid a conflict of interest, or prevent a situation from developing into a conflict of interest, you must inform your manager if, for example:
| ● | you are considering hiring a near relative, friend or relationship |
| ● | you transact business on behalf of Bell with a near relative, friend or relationship |
| © Bell Canada 2023. All Rights Reserved. | P a g e | 4 |
| Code of Business Conduct |
| ● | you have been employed by a competitor within the last two years |
| ● | a near relative, friend or relationship works for a supplier or competitor or has a financial interest in or is a major shareholder of a supplier or competitor. |
If you are concerned that you may be in a conflict of interest, speak to your manager. You must also disclose the conflict at your next online annual review of the Code.
My partner has just become an executive sales manager for a company that services the computers in my department. Do I need to tell anyone about this?
| ● | Yes. Someone could claim that Bell is giving your partner business because you are a Bell employee. You should notify your manager and make sure you are not involved in any decisions regarding your partner’s company. This relationship should be disclosed in your annual online review of the Code. |
| 2.3.2 | Conflicts of Interest Relating to Supplier-Funded Incentive Programs |
Supplier-funded incentive programs, often offered to sales employees by suppliers seeking to sell their products, may only be arranged through an authorized program administrator who does not work with the eligible employees.
It’s up to the program administrator to ensure there is no conflict between Bell’s marketing strategy and the supplier’s incentive program. For further information, please refer to the Incentive & Recognition Programs Guidelines on the Human Resources Bellnet site.
| 2.3.3 | Conflicts of Interest Arising from Outside Employment and Similar Activities |
We all have a right to do what we want during our non-working hours. This could include holding another job in which we use the skills and experience acquired through our work at Bell. However, we must ensure that our outside employment or other activities do not conflict, or appear to conflict, with Bell’s business or with our ability to fulfill our duties as employees.
To avoid a conflict of interest, or even the appearance of such a conflict, you should discuss any planned outside business activities with your manager. As a general guideline, you may not:
| ● | work for an organization that competes with Bell or operate a business or promote a third party’s line of products or services that compete with those offered by Bell |
| ● | use Bell’s time, materials and facilities in paid or unpaid work for other organizations (for example, to support a charitable community project), unless specifically authorized by senior management (CP4 or higher). Where such authorization has been obtained, as per the Bell Community Investment policy, no company products or services (such as wireline telecommunication services, Internet services, handsets, etc.) may be provided in-kind |
| ● | accept outside employment or engage in any activity that may prevent you from performing your job at Bell fully and competently |
| ● | contribute to or support any political group or political activity on behalf of Bell, unless specifically authorized by the appropriate Bell department responsible for government relations. |
I am a Bell technician who installs circuitry for small and medium-sized business customers. With the growth of the Internet and other communications services, demand for my expertise is booming. Can I take advantage of this opportunity and start up an installation business on my own time?
| ● | No. You cannot engage in any outside activity that might take business away from Bell or any of its subsidiaries. Furthermore, as an employee, you are expected to contribute your energy and ideas to your job as an installer for Bell. |
| © Bell Canada 2023. All Rights Reserved. | P a g e | 5 |
| Code of Business Conduct |
As a customer service representative I happen to respond to my brother’s telephone call inquiring about a charge on his account for TV services. Can I respond to this call and make adjustments, if any, to my brother’s account?
| ● | No. Employees are not allowed to access or make changes to the billing accounts of their families and friends, including accessing their own or invoicing themselves. |
| 2.3.4 | Conflict of Interest Guidelines for Executives and External Directorships |
In addition to the conflict of interest guidelines and procedures noted above, in respect to all persons who are executives (i.e. Vice-President and above), a conflict of interest may also arise:
| ● | when there is an outside interest which materially encroaches on time or attention which should be devoted to Bell’s affairs or so affects the executive’s energies as to prevent the executive from devoting the executive’s full abilities to the performance of duties |
| ● | where an executive or any of the executive’s near relatives, friends or relationships has a direct or indirect interest in or relationship with any outsider, such as a supplier (whether of goods or services), customer, agent or competitor of Bell or its subsidiary and associated corporations, or with a person in a position to influence the actions of an outsider, which is inherently unethical or which might be implied or construed to: |
| ● | give rise to a possible personal gain or favour to the executive involved, or any of the executive’s near relatives, friends or relationships due to the executive’s actual or potential power to influence dealings between Bell and the outsider |
| ● | render the executive partial toward the outsider for personal reasons, or otherwise inhibit the impartiality of the executive’s business judgement or the executive’s desire to serve only Bell’s best interests in the performance of the executive functions |
| ● | place the executive or Bell in an equivocal, embarrassing |
| or ethically questionable position in the eyes of the public or any external monitoring body |
| ● | reflect unfavourably on the integrity of the executive or Bell. |
| ● | where an executive or any of the executive’s near relatives, friends or relationships makes use of any non-public information, such as information for internal use, or of a confidential nature, proprietary, insider, privileged or government classified nature or customer information, entrusted to or obtained by the executive in the conduct of Bell’s business to benefit the executive or any of the executive’s near relatives, by selling or making available such information to interests outside Bell, or uses the information in any other manner to further the executive’s interest(s), or the interest(s) of any of the executive’s near relatives |
| ● | where an executive or any of the executive’s near relatives, friends or relationships has any direct or indirect interest or relationship which is actually or potentially harmful or detrimental to Bell’s best interests. |
Executives are required to disclose any actual or potential conflicts of interest by providing written notice to the Corporate Secretary at corporate.secretariat@bell.ca. The Corporate Secretary is responsible for administering the Code and the Conflict of Interest Guidelines. If the Corporate Secretary is unable to resolve an existing or potential conflict of interest with the person involved, the matter will be discussed with the Chief Human Resources Officer and EVP, Corporate Services.
External Directorships
As a general rule, executives are allowed to be appointed to the board of directors of a company other than a Bell company provided that such appointment:
| ● | will not create conflicts of interest either for the executive or for any Bell company |
| ● | will contribute to the development of the executive or will benefit Bell either directly or indirectly |
| ● | will not be at the expense of the executive’s corporate responsibilities and will not impose an undue burden on the executive. |
| © Bell Canada 2023. All Rights Reserved. | P a g e | 6 |
| Code of Business Conduct |
Provided the above criteria are met, before accepting an external directorship appointment, an executive shall, through the executive’s superior, seek and obtain clearance from the President and Chief Executive Officer. If appointed, the executive must then disclose such fact to the Corporate Secretary’s Office promptly.
Executives should however understand that the BCE group companies’ D&O Insurance policy will not be applicable unless the executive’s appointment is made at the request of Bell.
| 2.4 | Loans, Gifts and Entertainment |
| 2.4.1 | Loans from Bell |
We do not accept, whether directly or indirectly, any loan or guarantee of obligations from Bell that are for our personal benefit.
| 2.4.2 | Business Gifts & Entertainment |
Under no circumstances are you to solicit, accept, offer or give bribes, kickbacks or facilitation payments, either directly or indirectly (including for example through a contractor or consultant acting on Bell’s behalf).
Do not solicit, accept, offer or give gifts, gratuities, favours or hospitality from or to suppliers or customers, which may compromise - or appear to compromise - our ability to make fair, objective, business decisions or may unfairly influence a business interaction.
Do not solicit or encourage gifts, hospitality, entertainment or any other thing for personal use.
Do not accept gifts having a monetary value; for example, gift certificates, cash, services, discounts or loans.
These guidelines do not change during traditional gift giving season.
We recognize, however, that building relationships with customers and suppliers is an integral part of doing business.
You may offer reasonable hospitality and entertainment to private sector suppliers or customers as described in this section. You should consult your manager or contact the Business Conduct Help Line when in doubt about the appropriateness of a particular situation.
You may accept and participate in unsolicited business hospitality or entertainment with private sector suppliers or customers depending on the function or services you perform for Bell and if the hospitality or entertainment is clearly intended to facilitate business goals and is reasonable.
You may sponsor events/activities for private sector customers or potential customers where the purpose is to strengthen business relationships; however it is your responsibility to inform yourself and be sensitive to the customer’s own code of conduct on these issues.
You may accept unsolicited, nominal value hospitality, gifts or mementos from private sector suppliers or customers that are customary or business related.
You may accept business entertainment from private sector suppliers or customers in the form of meals as long as it is modest, infrequent, and as far as possible on a reciprocal basis.
You may solicit modest gifts or prizes for Bell sponsored events from private sector suppliers or customers, which provide clear benefits to the sponsor and/or charitable organization, upon approval by your manager.
Note: All hospitality and entertainment offers using Bell company-owned tickets, including those made to domestic public officials, must be made in accordance with the Bell National Hosting Suites and Ticketing Policy.
Do not solicit, accept, offer or give gifts, gratuities, favours or hospitality from or to domestic public officials or sponsor public sector events/activities without first consulting with the Regulatory and Government Affairs Team, complying with any applicable process or policy, for example, the Bell National Hosting Suites and Ticketing Policy, in the case of hospitality requiring Bell company-owned tickets and obtaining their express prior consent where required. Questions should be
| © Bell Canada 2023. All Rights Reserved. | P a g e | 7 |
| Code of Business Conduct |
directed to the Regulatory and Government Affairs Team.
Do not solicit, accept, offer or give gifts, gratuities, favours or hospitality from or to foreign public officials, sponsor foreign
public sector events/activities or otherwise engage foreign public officials without obtaining the express prior consent of the Regulatory and Government Affairs Team.
Factors which you and your manager should consider when assessing the proper course of action include:
| ● | Is the public sector involved? |
| ● | Is Bell potentially involved in a major procurement activity with the company offered or offering the gift or entertainment? |
| ● | Would the gift or entertainment be considered appropriate or customary, taking into account the nature of the function or services you perform for Bell? |
| ● | Would it be perceived as insulting or damaging to the business relationship to return the gift or decline the hospitality? |
| ● | Can the gift or hospitality be applied to benefit all team members rather than certain individuals? |
| ● | Is the guest or guest’s organization a frequent recipient or provider of tickets or hospitality? |
| 2.5 | Political Activities |
| 2.5.1 | Political Contributions |
Political Contributions refer to any payment or donation, including provision of services at favourable rates, irrespective of format or location, made on behalf of Bell to a recipient involved in federal, provincial, territorial or municipal political process, such as a political party, an election or leadership candidate, a riding association or an elected official. Bell’s corporate policy prohibits political contributions without the express prior consent of the Chief Legal and Regulatory Officer. This policy does not apply to political contributions made by individuals within Bell on their own behalf. However, funds or assets being contributed must
originate with or belong to the individual making the contribution, and individuals making political contributions should be prepared to demonstrate ownership.
For further information, consult the Political Contributions Policy available from the Policies and ethics Bellnet site.
Beyond standard penalties for non-compliance with the Code which were previously outlined, Bell may refer the matter to the appropriate regulatory and legal authorities, which could lead to penalties, fines or imprisonment.
| 2.5.2 | Lobbying on Behalf of Bell |
Broadly speaking, lobbying involves reaching out to a public official in order to further Bell’s objectives, whether at the federal, provincial, municipal or other level of government. It is each employee’s own responsibility to know and ensure compliance with the rules, codes and guidelines applicable to the jurisdiction of the public official with whom the employee is meeting. Lobbying does not, however, include formal legal or regulatory submissions, communications in a public forum or responses to government Request for Proposals.
Lobbying public officials is a legitimate activity but the law sets certain boundaries around lobbying, as well as establishes some
disclosure requirements, to ensure that lobbying activities are transparent and ethical. The Regulatory and Government Affairs Team must be consulted before making representations to public officials. If you have any questions, you may consult the Regulatory and Government Affairs Team prior to the meeting.
Beyond standard penalties for non-compliance with the Code which were previously outlined, Bell may refer the matter to the appropriate regulatory and legal authorities, which could lead to penalties, fines or imprisonment.
| © Bell Canada 2023. All Rights Reserved. | P a g e | 8 |
| Code of Business Conduct |
| 2.5.3 | Considerations in Foreign Jurisdictions |
We are committed to complying with all applicable anti-bribery and anti-corruption laws, rules and regulations of every jurisdiction in which we operate.
It is illegal and prohibited for you, and those acting on Bell’s behalf (for example, a contractor or consultant), to directly or indirectly give, offer or agree to give or offer any form of advantage or benefit (including for example, gifts, gratuities, favours, money or hospitality) to a foreign public official in order to obtain an advantage in the course of business. The act of merely offering or agreeing to pay a bribe is an offence and prohibited, regardless of whether the foreign public official actually receives it. This includes
small or modest payment to government officials to expedite or ensure performance of a routine government action.
Any individual looking to engage with foreign governments must obtain the express prior consent of the Regulatory and Government Affairs Team.
If you wish to report any unethical or illegal behaviour by a Bell team member or someone acting on Bell’s behalf related to dealings in or with foreign jurisdictions, you may report the matter to your manager or use the Business Conduct Help Line at Clearviewconnects.com or by calling 1-866-298-2942 (toll free).
| 2.6 | Improper Influence on the Conduct of Audits |
Employees are prohibited from coercing, manipulating, misleading or fraudulently influencing Bell’s internal or external auditors at any time and especially when the employee knows or should know that the employee’s action, if successful, could result in rendering Bell’s financial statements misleading in any way.
| 2.7 | Trading in Securities |
| 2.7.1 | Insider Trading |
As a director or employee, you may become aware of undisclosed material information about Bell or any other company. Unless you are certain that the entirety of this information has been officially publicly disclosed, it is illegal for you to:
| ● | trade in securities of BCE Inc., Bell Canada or any company to which the information relates (securities include, without limitation, common and preferred shares, debt securities, options, share units as well as any related financial instruments) |
| ● | disclose such information (otherwise than in the necessary course of business and on a confidential basis) to another person – also known as “tipping” - even if the other person, the tippee, is related to you or is a friend. Trading or tipping by the tippee is also illegal. |
Undisclosed material information refers to information that, if disclosed, could have a significant effect on the market price of a company’s securities or is likely to be considered important by a reasonable investor in determining whether to buy, sell or hold such securities. Some examples of what could constitute undisclosed material information are financial results, key
financial and non-financial metrics, financial guidance and business plans before they are publicly announced, material planned business acquisitions or dispositions, significant new products and services before they are launched and cybersecurity incidents.
At law, severe penalties may be imposed against you personally as a result of unlawful trading and tipping.
Assuming you are not otherwise aware of undisclosed material information, the recommended time to purchase or sell BCE Inc. and Bell Canada securities is during the period beginning on the second business day following the day of announcement of BCE Inc.’s and Bell Canada’s quarterly financial results and ending 14 calendar days before the last day of the quarter during which the announcement is made (the “permissible trading window periods”). This will help minimize the risk of an unintentional violation of these prohibitions, and the appearance of a violation (intentional or not). All employees are required to keep accurate records of their securities transactions and may be asked to
| © Bell Canada 2023. All Rights Reserved. | P a g e | 9 |
| Code of Business Conduct |
report to Bell their holdings and investment transactions. Insiders who are subject to the Insider Trading and Reporting Guidelines are prohibited from trading in BCE Inc.’s or Bell Canada’s securities outside of the permissible trading window periods
Even after Bell has officially publicly released material information, it is important to be sure that sufficient time has elapsed to enable the information to be disseminated to investors. As a rule of thumb, you should not trade securities until the second business day following the public announcement. An employee must not attempt to “beat the market” by trading
simultaneously with, or shortly after, the official release of public information.
Should you have any doubt regarding your ability to legally trade in securities or whether any information can be disclosed, you must consult the Legal Team before trading or disclosing any information.
Members of the board of directors and executives should consult the BCE Inc. and Bell Canada Insider Trading and Reporting Guidelines for additional information. A copy of these guidelines can be obtained from the Corporate Secretary’s Office.
Can I use information I obtain by accident or overheard?
| ● | No. Even when you obtain undisclosed material information by accident, such as by overhearing a discussion of a planned acquisition, you are prohibited by law from trading in securities of BCE Inc., Bell Canada or the target company. In addition, you cannot suggest to a spouse, near relative or friend that they trade in shares of BCE Inc., Bell Canada or the target company while in possession of such information as this would be considered tantamount to divulging that information to someone outside Bell for personal gain or the gain of someone else. Such securities could only be traded on the second business day after Bell or the company being acquired issues a press release publicly announcing the planned acquisition. |
| 2.7.2 | Short Sales, Calls and Puts |
As a director or employee of Bell, you may not engage in the following activities with respect to BCE Inc.’s securities or the securities of any of its affiliates (such as Bell Canada): (a) short sale; (b) sale of a call option and (c) purchase of a put option.
“Short selling” means selling securities you do not currently own and borrowing a third party’s securities in order to make delivery, the whole in expectation that the securities will decrease in value when you will buy back the securities and return them to the owner. Such process may lead to undue speculation and abuse and is therefore prohibited.
Puts and calls may also lead to the same abuse and therefore similar restrictions apply to the sales of call options and purchases
of put options in respect of securities of BCE Inc. and its affiliates. For the purposes hereof, a “call” can be defined as an option to demand delivery of a specified number or amount of securities at a fixed price within a specified time but does not include an option or right to acquire securities of BCE Inc. or its affiliates where such were granted by BCE Inc. or its affiliates (such as pursuant to BCE Inc.’s Long-Term Incentive (stock option) Programs). A “put” can be defined as an option to deliver a specified number or amount of securities at a fixed price within a specified time.
In summary, you cannot sell short securities of BCE Inc. or its affiliates, and you may not sell call options or buy put options over the same securities. You must exercise great caution in your trading in order to avoid inadvertent breaches of these restrictions.
| 2.8 | Public Disclosure of Information |
Only authorized executives can decide the timing and content of public disclosures regarding Bell, such as the issuance of news
releases and the public filing of continuous disclosure documents with securities regulatory authorities.
| © Bell Canada 2023. All Rights Reserved. | P a g e | 10 |
| Code of Business Conduct |
If you are not an authorized designated spokesperson, you must not respond under any circumstances (including on a “no-name” or “off the record” basis) to inquiries from, or voluntarily provide information to, the investment community or the media, unless specifically asked to do so by an authorized designated spokesperson.
Any inquiries need to be immediately referred to Bell’s Communications Department or Investor Relations Department. The list of authorized designated spokespersons can be found in Bell’s Disclosure Policy available on the Policies and ethics Bellnet site.
| 2.9 | Confidentiality of Customer and Employee Information |
| 2.9.1 | Customer Privacy |
Bell has long been committed to maintaining the accuracy, confidentiality, security and privacy of customer information. It is essential that we protect the confidentiality of all non-public information entrusted to us by Bell or its customers, except when disclosure is authorized or legally mandated. Even seemingly mundane information might be of use to competitors, or harmful to Bell or its customers, if disclosed. Even unintentional disclosure can lead to identity theft or financial gain by third parties. Therefore, the best way to protect customer information is to limit access on a need-to-know basis. In addition, we must comply with the laws and regulations related to privacy that apply to Bell, including the Personal Information Protection and Electronic Documents Act and restrictions imposed by the CRTC.
Unless a customer provides explicit consent or disclosure is pursuant to a legal power such as a search warrant, all
information kept by Bell about its customers is confidential and cannot be disclosed or used, directly or indirectly, except for business purposes. We may only use this information for the purposes for which it was collected and that the customer would reasonably expect.
Recording, releasing or disclosing private customer information for personal gain or the benefit of another will result in immediate discipline up to and including dismissal, and may include civil or criminal prosecution. This may also expose Bell to substantive reputational harm and financial liability. Certain laws applicable to Bell require that customer privacy breaches be investigated, reported and recorded. If you suspect a breach of customer personal information, you must report it using the breach reporting tool or by emailing privacy@bell.ca.
Interception of Private Communications
Communications between Bell and a customer may be monitored for quality assurance purposes, with an appropriate advisory to the customer.
The unlawful interception of a private communication is prohibited under the Criminal Code. The content of a customer’s transmissions (including telephone and email) may not be monitored, nor may the content, nature and existence of telephone calls and data transmissions be released to third parties except as explicitly authorized by law.
Unintentional interceptions of a call may occur when providing service, doing repairs or when conducting quality control checks. In these instances, the employee must advise the persons on the call of the unintended interception and immediately disconnect from that call.
Business Customer or Supplier Information
Maintaining customer and supplier privacy is also crucial when dealing with contracts, proposals and quotations. We must be vigilant to not share business customer or supplier information - such as business plans, names of representatives or information of a sensitive nature - with other employees servicing a similar market segment (for example, the banking industry). By doing so,
we may inadvertently divulge information about a business customer or supplier to that customer’s or supplier’s competitor. Also, unless a business customer or supplier provides explicit consent, we do not share information about business customers or suppliers with other affiliates or
| © Bell Canada 2023. All Rights Reserved. | P a g e | 11 |
| Code of Business Conduct |
| partners, agents or subsidiaries of our group, except with those affiliate or partners or agents or subsidiaries of a group, who are | directly involved in the specific contract, proposals or quotations or a related transaction. |
I am a customer service representative for the residential market. A caller, self-identifying as the spouse of a wireless customer, requests billing details for the spouse’s account, indicating that the caller looks after bill payments for the family. Should I provide the information?
| ● | If the caller is not explicitly listed on the account as an authorized co-user, the information should not be provided. Account details, particularly for wireless accounts, can be very sensitive information and is often sought in the context of matrimonial disputes. Advise the caller to have the account holder of record contact Bell to have the spouse added to the account as an authorized co-user. This approach applies equally to all customer accounts, in all business units. |
| 2.9.2 | Employee Privacy |
Bell has also long been committed to protecting the personal information of its employees which is collected only for purposes relevant to managing the employment relationship. The obligations described in the Personal Information Protection and Electronic Documents Act also apply to the collection, use, disclosure and protection of personal employee information.
Personal information means information, in any format, about an identifiable individual, but does not include the name, title or business address or telephone number of an employee. Employee personal information refers to those records like the personnel files and other documents collected and used to provide services or support such as pay or benefits information. Personal health information is held separately by the Disability Management Group.
All personal information is protected by Logical and Physical security safeguards appropriate to the sensitivity of the information and may only be accessible and used for reasonable purposes relating to the management of the employment relationship or for other purposes as may be required by law. All employees holding personal employee information must handle it in accordance with privacy principles. Aside from applying normal safeguards (i.e. locked cabinets and desks), employees should avoid discussing personal employee information in public areas.
Notwithstanding the notion of employee personal information, there shall be no expectation of privacy for communications made through the use of Bell equipment or using Bell paid services or products (for example, e-mail, internet/intranet activities, voice mail, computer files, network), as well as workspaces (for example, desks, lockers, and vehicles).
Bell reserves the right to monitor or search any and all Bell property at any time, where it determines on reasonable grounds that this is required; for example:
| ● | to evaluate and measure service quality in the interests of the safety and protection of employees or Bell |
| ● | to search for specific business information |
| ● | to comply with legal warrants or other obligations |
| ● | to conduct security investigations such as in the event Bell suspects an employee of fraud, theft, undeclared conflict of interest, violation of this code or other situation which may cause prejudice to an employee or Bell or its reputation. |
Additional information is available through the Employee Privacy section of the Human Resources Bellnet site as well as in the Acceptable Use of Information Technology Resources Policy.
| 2.9.3 | Bell Privacy Policies |
To support our commitment to privacy we have developed policies and a formal privacy code - the Bell Privacy Policy and the Bell Employee Privacy Policy - which spell out the commitments of Bell, its employees and agents and the rights of customers and employees regarding personal information.
| © Bell Canada 2023. All Rights Reserved. | P a g e | 12 |
| Code of Business Conduct |
The Bell Privacy Ombudsman oversees compliance with these privacy policies and may be contacted at privacy@bell.ca.
The Bell Privacy Policy, the Bell Employee Privacy Policy and other privacy-related documents are available by following the “privacy” link on www.bell.ca or on the Bellnet policies page Corporate Policies & Ethics.
| 2.10 | Protecting Confidential Information |
One purpose of the Data Governance Policy, the Information Security Policy and related directives, and the Records Retention Schedule is to ensure that Bell’s information is properly classified so records are adequately protected, stored, shared and/or disposed of to comply with legal requirements and business needs. These policies apply to all forms of records regardless of who has prepared them, regardless of the medium used (paper, electronic or other) and whether or not they reside on Bell’s premises, servers and infrastructure.
Employees are responsible for:
| ● | ensuring compliance with business, legal and regulatory requirements with respect to record retention |
| ● | improving operational efficiencies, reducing space requirements and costs by eliminating unnecessary records |
| ● | ensuring the preservation and accessibility of relevant records to satisfy specific operating needs and in the event of potential or actual litigation or internal or external (including governmental) investigation |
| ● | ensuring information is kept for as long as required according to the Records Retention Schedule. |
Confidential information is information about our business that must not be made publicly available. Confidential information includes information classified as Internal Use or Confidential, as well as information that has not been explicitly classified as Public. Some examples of information which must be safeguarded from disclosure include:
| ● | employee or customer personal information |
| ● | contracts and agreements |
| ● | passwords and encryption keys |
| ● | undisclosed financial results |
| ● | marketing strategies, pricing, bids and proposals |
| ● | training material |
| ● | pictures or recordings of confidential information or discussions |
| ● | any video, picture or recording taken on work premise or of Bell premises, which are permitted only with director level management approval. Furthermore, it is strictly prohibited to record any identifiable individual without the person’s knowledge and consent, except if such recording is for investigation purposes and authorized by Corporate Security. |
Employees must also:
| ● | not send confidential information to personal email accounts |
| ● | not store company information on portable storage devices including USB keys or external hard drives |
| ● | ensure confidential information is securely stored at all times |
| ● | not store confidential information, including pictures, on personal devices that have not been registered through the BYOD (bring your own device) process |
| ● | avoid discussing such information in public places (including by phone in taxis, trains and airplanes), with family members or friends or with business colleagues when conversations might be overheard |
| ● | report immediately unauthorized disclosure, transmission, misappropriation or misuse of confidential information to Bell’s National Incident Centre (NIC) at 1-866-714-0911 or at cni-nic@bell.ca |
| © Bell Canada 2023. All Rights Reserved. | P a g e | 13 |
| Code of Business Conduct |
Post Employment Obligations
Your obligation to protect Bell’s confidential information continues after the employment relationship ends. Upon termination of employment or contract, or reassignment, all employees must:
| ● | return all copies of confidential information and documents, including electronic records, and all third party information entrusted to Bell |
| ● | return any equipment entrusted to them including mobile devices, laptops and external storage devices |
| ● | continue to uphold the confidentiality of Bell confidential information and not use or disseminate any such information. This continuing obligation is particularly important in the case of a departing employee who subsequently works for one of Bell’s competitors or suppliers. |
Preservation of Records under Legal Hold
| Records subject to preservation under a “legal hold” must not be disposed of until the hold is lifted. Where a “legal hold” is in place, all owners of records that are subject to it must take positive steps to ensure the preservation of such records. Those record owners must also, prior to taking any steps that might affect the disposal of such records, such as re-imaging their computers or being “evergreened” to a new device, contact the Legal Team (ediscovery.legal@bell.ca) to verify whether they can dispose of the records. Any employee unsure whether |
records are subject to a legal hold or unsure of the hold’s scope should contact the Legal Team at ediscovery.legal@bell.ca.
When an employee, who owns records that are subject to a legal hold leaves Bell, the employee’s manager and Human Resources Consultant must ensure that these records are preserved. |
How do I tell if a document (paper or electronic) is confidential if it is not marked as such?
| ● | You must begin by asking the person who issued the document (if known), as the originator is the person who must determine the security classification. If you can’t find the source of the information and the nature of the document does not make the classification obvious (such as information that has been made public), the document must be treated as confidential until the proper classification is determined. |
| 2.11 | Confidential Game or Event Information |
You may become aware of confidential information about a game or event due to your position with Bell. Some examples of this type of confidential information include:
| ● | a player’s availability for a game or event |
| ● | conditions that are material to a game or event, such as coaching decisions and matters related to a player’s health or personal life |
You must not use confidential information to, directly or indirectly, bet or wager money or anything of value on any game or event (including any exhibition, regular season or playoff game). This prohibition includes betting or wagering money or anything of value on:
| ● | an outcome, statistics, score |
| ● | player trades, coaches’ employment, draft pick selections, disciplinary matters |
This prohibition also applies to using confidential information when participating:
| ● | in fantasy leagues that award cash prizes or other things of value |
| ● | in anyone else’s betting activities, including fantasy leagues, or asking anyone to place bets on games or events on your behalf |
Note that “fantasy leagues” means contests in which participants assemble fictional teams of real-world players, with the winning teams determined by the statistics of those players.
| © Bell Canada 2023. All Rights Reserved. | P a g e | 14 |
| Code of Business Conduct |
You must also not disclose confidential information about a game or event to anyone
unless that person has a legitimate business need for the information.
| 2.12 | Dealing with Customers |
| We achieve an ongoing competitive advantage and long-term relationships with our customers by ensuring that our reputation for quality service, ethical behaviour and integrity remains intact. We compete vigorously but fairly, while complying with our legal and ethical obligations.
Customers and customer service are at the core of our business. To succeed, we have to be honest, courteous, and respectful when dealing with our customers and their property whether visiting their homes or place of business, or interacting in-store, or on the phone.
There is never a situation where ethical or legal obligations should be compromised to meet sales objectives. No one - not even a manager - can force us to commit an illegal or unethical act that may damage Bell’s reputation, or our own.
Our customers expect us to be ethical in our practices, to provide quality products and services, and to be truthful when discussing our advantages and benefits. |
To maintain that trust we must:
● offer customers only those services which they need or want ● promote our products, services, packages and pricing accurately even when up-selling and providing retention discounts ● ensure customers understand what they are ordering ● give customers the straight facts about their competitive choices ● not offer to waive charges, cut special deals or grant discounts that are not authorized ● never mislead customers or misrepresent facts or allow our judgment to be compromised ● report any unethical behaviour we witness ● demonstrate an unwavering respect for each customer’s uniqueness including, but not limited to: culture, ethnicity, gender, gender identity/expression, age, religion, disability, sexual orientation, education and experiences ● serve our Québec clients in the official language of their choice (French or English) |
You are trying to close a sale with a customer. There are conditions applicable to the offer you’ve described that may make the customer reluctant to subscribe. You know those conditions will be described in the confirmation email the customer will receive and in the contract. Can you leave those details out and let the customer read about them?
| ● | It is your responsibility to communicate our offers and prices accurately. You must advise the customer of all applicable conditions so that they can make an informed choice prior to purchasing. |
| 2.13 | Dealing with Suppliers and Competitors |
| 2.13.1 | Supplier Relations - Reciprocity |
Like many corporations, we purchase goods and services from thousands of suppliers, many of whom are also our customers.
While we quite naturally want to do business with our customers, and will take advantage of every opportunity to do so, we must keep in mind that this should not be done at the expense of price, quality and service. These criteria, rather than the simple fact a supplier is or is not our customer, should guide our purchasing decisions.
Reciprocity is an arrangement where a purchaser gives business to a supplier because that supplier is its customer for other products, in preference to another supplier. Reciprocity, whether it originates with the buyer or the seller, should be handled with utmost care for a number of financial, ethical and legal reasons.
For example, we may lose the opportunity to save money on our purchases if we choose suppliers solely because they are Bell customers and we may be accused of anti-competitive behaviour.
| © Bell Canada 2023. All Rights Reserved. | P a g e | 15 |
| Code of Business Conduct |
Under certain circumstances, we may, for strategic marketing reasons, develop and contract services exclusively with a given
supplier. The Law Department must be consulted before such arrangements are established.
Our department is organizing a meeting at a hotel. Due to the large size of our group, and the fact we don’t want to travel far, we’ve chosen a nearby hotel serviced by a competitor. Is this okay, or should we find a hotel that uses Bell services?
| ● | It is not Bell policy to prohibit employees on company business from dealing with organizations that do not use Bell’s services. While we actively encourage everyone at Bell to do business with our customers, we must ensure that this is not done at the expense of price, quality and service. |
| ● | Although the hotel you’ve chosen is not a Bell customer, you were right to choose it if, in your judgment, it best meets the price-quality-service criteria you are looking for: the hotel is located close to your office, it can easily accommodate all the members of your department and, as a result, will enable your group to save both time and traveling expenses. |
| 2.13.2 | Treating Competitors with Respect |
We welcome and encourage fair and open competition and we are committed to treating competitors with due respect. By doing so, we honour the competitive spirit that motivates us to perform at our best.
Behaving competitively means that we:
| ● | do not portray a competitor to the public or to a customer in an inaccurate, misleading, disparaging or unfair manner or in a way contrary to laws that govern competitive business practices |
| ● | do not state as a fact our understanding of a competitor’s |
| price information as that information may be out of date and incomplete |
| ● | exercise care when commenting publicly on such topics as a competitor’s financial situation, business practices, management, reliability or foreign ownership |
| ● | do not behave disrespectfully toward a customer who has decided to purchase a competitor’s products or services; rather we rigorously promote and provide high-quality service for any other product we may supply to this customer. |
| 2.13.3 | Obtaining Information about our Competitors |
We have every right to gather information about the marketplace in which we operate through legal and ethical means. This includes information about our competitors, their products and services, technology, prices, advertising, and so on.
However, we do not engage in industrial espionage, buy proprietary information or induce employees or former employees of our competitors to disclose proprietary or confidential information of the employee’s current or former employer.
If you become aware that confidential or proprietary information about a competitor is circulating through Bell, you must not use such information and must immediately report it as indicated below.
| © Bell Canada 2023. All Rights Reserved. | P a g e | 16 |
| Code of Business Conduct |
Our business unit recently hired someone who was employed with a competing radio station. This person has confidential information which would be very valuable to us. Can we ask the person to disclose this confidential information?
| ● | Absolutely not. The new employee has an obligation to protect the employee’s former company’s confidential or proprietary information, just as you would be obliged to protect Bell’s confidential or proprietary information if you were to leave Bell. You must respect the employee’s personal integrity as well as the employee’s obligation to the employee’s former employer. |
Inducing an employee to disclose such confidential information is a violation of the Code.
If I become aware that this person is disclosing a competitor’s confidential information to Bell employees, should I report it?
| ● | Yes you must report this fact to your immediate supervisor or through the Business Conduct Help Line at clearviewconnects.com or by calling 1-866-298-2942 – and you must not use such confidential information. Bell’s reputation could be significantly harmed by such disclosure and taking immediate steps to contain the confidential information is critical. Failure to report is a violation of the Code. |
| 2.13.4 | Agreements with Competitors |
In many cases, agreements between competitors that restrict i) the price at which competitors can sell their products or services to customers, ii) the customers to whom competitors can sell, or iii) quantities that competitors will produce or market, are criminal offences and thus prohibited. To be clear, this prohibition does not address cases where two competitors are simply entering into an agreement as buyer and seller of each other, as is for instance common in our wholesale division.
The law provides certain exceptions and we may, for strategic reasons, sometimes take advantage of these exceptions and
enter into specific agreements with competitors. For instance, the rules allow, under certain conditions, the submission of joint bids with competitors in response to requests for proposal, something which otherwise would appear to be a prohibited agreement on price. The Legal, Regulatory and Government Affairs Team must be consulted before arrangements with competitors are established.
| 2.13.5 | When a Competitor is a Customer |
When providing competitors with network facilities, broadcasting, access or other services, we cannot use information obtained as a result of that process in any manner which would give us an undue competitive advantage. This includes ensuring that this information is not made available to those within Bell or its affiliates who develop competitive service strategies. It also means that we must not disclose a customer’s choice of competitive carrier to anyone who does not clearly require the information to provide service to the customer.
| 2.14 | Safeguarding Bell Assets |
We all have a responsibility to be accountable for and safeguard Bell assets from loss, damage, theft, fraud, vandalism, sabotage or unauthorized use, copying, disclosure or disposal. The improper use and/or reporting of assets could seriously undermine Bell’s integrity, adversely affect our business strategies and decisions and weaken investor confidence. It may
lead to disciplinary action up to and including dismissal. It could also constitute a criminal offence.
Bell’s assets include but are not limited to, offices and office equipment, inventory, computers, art, telephone and video equipment, vehicles, tools, materials, buildings, people, property, information, funds, communication networks, information
| © Bell Canada 2023. All Rights Reserved. | P a g e | 17 |
| Code of Business Conduct |
systems, and intellectual property. The vehicle related policy and practice can be found on the Corporate Services Bellnet site and covers both the use of Bell-owned vehicles and the use of employee’s vehicle for Bell purposes.
Physical security controls are essential in protecting Bell sites, assets, personnel and business operations on a continuous basis and during events. All employees play a key role as a security partner in ensuring that physical security safeguards, designed to prevent, deny, delay or detect unauthorized access to our assets and activate appropriate response when needed, are not bypassed, circumvented or disabled.
Access to and use of these assets must be authorized, adequately controlled and based on business needs. We should not use Bell assets for personal purposes, except where this use has been authorized by your leader. Each of us must also take appropriate measures to prevent losses due to willful action
by others, both outside and within Bell, which may result in personal injury, property damage, theft, fraud, loss, abuse or unauthorized access to physical or logical assets, and intellectual property (including data).
Employees are expected to safeguard Bell assets and comply with Bell policies, including the Policy on Authorizations.
Bell policies, including the Policy on Authorizations, are available in the Policies and ethics Bellnet site.
To best safeguard the tools and equipment used as part of their functions, employees must consult the Bell Corporate Security policies, available on the Policies and ethics Bellnet site.
Loss or theft of Bell assets, property damage and malfunctioning doors and locks are to be reported to Bell’s National Incident Centre (NIC) at 1-866-714-0911 or at cni-nic@bell.ca.
| 2.14.1 | Visible ID |
All employees, consultants and contractors must wear a visible, valid, designated ID card at all times while on Bell premises. An ID card can only be used by the employee to whom it is issued. It cannot be shared or lent. Visitors must wear a visible, valid, designated visitor’s card while on Bell premises and must be escorted by a Bell team member at all times.
Employees must question anyone not wearing a valid ID card and escort them to the security desk or off site. If the situation escalates and poses a threat, 911 or local authorities must be contacted immediately. Once it is safe to do so, the incident must be reported to Bell’s National Incident Centre (NIC) at 1-866-714-0911.
| 2.14.2 | Prevention of Fraud |
What is Fraud?
| ● | Fraud is defined as an intentional deception, falsification or misrepresentation made for personal gain, or to damage or create loss for the organization, customers or individuals. This can include the misuse or misapplication of the organization’s resources or assets to conduct internal fraud. This can also include actions taken towards business partners such as clients and service providers as well as false or inflated insurance claims presented to Manulife or any other insurance provider. |
Successfully preventing fraud requires an ongoing commitment from all of us. This includes actively participating in the prevention, detection, and reporting of suspected fraud, whether committed by an internal or external party. As employees we will not engage, directly or indirectly, in account falsification, false claims, time fraud or any other fraudulent or corrupt business practices.
Fraudulent actions are not only unethical, but may also be a violation of domestic and international law and result in civil or criminal prosecution, Bell has a “zero tolerance” stance with regards to all confirmed fraud situations. If you are approached by anyone with an opportunity to engage in fraudulent activities, you must report the incident to your manager and Corporate Security or through the
| © Bell Canada 2023. All Rights Reserved. | P a g e | 18 |
| Code of Business Conduct |
confidential Employee Help Line available at clearviewconnects.com or by calling 1-866-298-2942 (toll free).
| 2.14.3 | Corporate Credit Cards and Bell Funds |
We are personally responsible for funds, cash, cheques, postage, etc., over which we have control. Corporate credit cards are not to be used for personal cash withdrawals or purchases and other charge cards are to be used only for business purposes. We must also ensure that all expense vouchers, benefit claims and invoices are accurate and properly authorized.
Corporate policy regarding the use of corporate credit cards and corporate travel is detailed on the Travel and Expenses Management Bellnet site. We should, unless unavailable, use the services of suppliers with whom Bell has negotiated agreements (e.g. travel agents, airlines, car-rental agencies, taxi companies, hotels).
| 2.14.4 | Hiring Consultants or Contractors |
Hiring of contractors, consultants or other external resources must follow the rules as outlined on the Contractors and Consultants Procurement Bellnet site and hiring of external resources must also comply with the principles and procedures of the Contractor Program Policy and the requirements of the relevant Bell Policies available on the Policies and ethics Bellnet site, including the Personnel Security Policy. In addition, all contractors performing high-risk work must be pre-qualified to ensure all workers are competent, trained and compliant with the health and safety requirements of Bell, prior to conducting any work for Bell, as outlined in the Directive on contractor safety and high-risk services.
| 2.14.5 | Electronic Procurement and Electronic Processing of Expense Reports |
Bell electronically processes much of its procurement needs including employee expense reports and accounting for corporate credit card payments. All employee expense reports and credit card payments must be approved by a leader one level above the employee submitting the reports.
| 2.14.6 | Business Books and Records |
Bell’s books and records contain information essential to effective and efficient operations. They form the basis upon which key decisions about Bell are made by our executives, financial analysts, shareholders, investors, and regulators.
Because they are so crucial to Bell meeting its legal, regulatory and financial obligations, we must ensure that all documents, reports, plans and records falling under our responsibility are accurate and complete. We must also ensure that all transactions are properly authorized.
In preparing and maintaining our books and records, we must:
| ● | adhere to all accepted accounting standards and practices, rules, regulations and controls applicable to us |
| ● | ensure that all entries are recorded accurately, on time, in the proper accounts, and are properly documented |
| ● | record all funds, assets and transactions; we may not establish any undisclosed or unrecorded fund or assets for any purpose |
| ● | keep books and records which reflect fairly, accurately and in reasonable detail Bell’s transactions, acquisitions and disposal of assets and other relevant activities |
| ● | sign only those documents we believe to be accurate and truthful |
| ● | restrict access to sensitive or confidential information (such as financial records and customer information) to ensure the information is not accidentally or intentionally disclosed, modified, misused or destroyed |
| ● | maintain internal control processes to ensure that Bell meets its book and record keeping obligations. |
| © Bell Canada 2023. All Rights Reserved. | P a g e | 19 |
| Code of Business Conduct |
| 2.14.7 | Standard Contracts and Agreements |
If you are in a position to develop or sign contracts, you must take necessary steps to protect the interests of Bell by ensuring that only Bell standard form template contracts are used and, in the case of purchase agreements, the Procurement Policy is followed. All contracts must be reviewed by appropriate departments such as, Legal, Regulatory and Government Affairs, Procurement, Corporate Security, Corporate Responsibility & Environment, Health, Safety and Workplace, Risk Advisory Services and Insurance. Standard contracts must not be modified without prior approval of the Legal Team.
| 2.14.8 | Information Security |
Computers and computer networks form the backbone of our business and operations infrastructure. For this reason, every effort must be made to protect Bell’s computer systems and associated software from the various threats to their security, such as accidental or deliberate destruction of data and equipment, interruption of service, disclosure of confidential information, theft and corruption.
To maintain security:
| ● | access to computer systems must only be granted to authorized users |
| ● | access codes and passwords must be kept confidential and cannot be shared with anyone including leaders, co-workers and support teams |
| ● | when traveling with mobile devices that access or contain company data, you must comply with applicable Bell policies |
| ● | comply with all Information Security Policies and Directives |
| ● | follow Bell rules regarding the purchase and use of computer software |
| ● | guard against computer viruses, malware and ransomware that may damage Bell’s computer systems |
| ● | report computer security incidents, virus or worms to the Bell Cyber Incident Response team at cirt@bell.ca |
| ● | pay close attention to emails containing the (EXT) tag in the subject line and the warning banner against external emails to protect against malicious attachments and links |
| ● | report phishing emails sent to your Bell office account as follows: |
Use Submit as Phish button
| 1. | Select email and click on the Submit as Phish button at top of email and wait for confirmation email. |

| 2. | Your email is automatically sent to phish@bell.ca and a copy will be moved to your junk email folder. |
Use the manual method
| 1. | From your email inbox, select the phishing email |
| 2. | Press the Ctrl + Alt + F or for Mac Ctrl + Cmd + J keys and forward the email to phish@bell.ca |
| 3. | Permanently delete the original and sent messages from Outlook. |
For further information and references, visit the Corporate Security Bellnet site.
| 2.14.9 | Intellectual Property |
Intellectual property such as patents, inventions, copyrights, trade-marks, domain names, industrial designs and trade secrets are strategic assets of Bell and must not be disclosed to or used by others without first ensuring that appropriate legal safeguards are in place. Failure to do so could result in Bell losing rights in its intellectual property.
Intellectual property rights also reside in and protect know-how, business methods and processes, computer software, written
materials (including paper or electronic form), graphics, photographs and audiovisual works, whether developed internally within Bell or obtained from others.
Every employee has a responsibility to preserve, protect and enhance the value of these assets.
Trade-marks, including Bell’s logo and its various trade names, are among Bell’s most valuable assets. When using them, employees must follow the Brand guidelines, and must immediately
| © Bell Canada 2023. All Rights Reserved. | P a g e | 20 |
| Code of Business Conduct |
report any infringement or misuse of such trade-marks or trade names to the Brand and Identity team by sending an email to info.branding@bell.ca. In addition to protecting Bell’s intellectual property, we also have a responsibility to avoid infringing intellectual property rights of others, as detailed in the Intellectual Property Policy referred to below.
All intellectual property conceived or made in the course of our employment with Bell or which are within the scope of Bell’s business interests, are rightly the exclusive property of
Bell. Each employee assigns to Bell the ownership of all such intellectual property and also waives in favour of Bell any moral rights they may have in such intellectual property. Employees are prohibited from applying for patents or other intellectual property registrations in regards to intellectual property that belongs to Bell, nor can Bell’s intellectual property be used for personal purposes or gain.
For additional information, please consult the Intellectual Property Policy.
| 2.14.10 | Proper Use of Bell-Provided Internet Access and Other IT Resources |
Access to the Internet is intended for business purposes, including employee development and awareness. Personal devices can be used on guest Wi-Fi networks to access the Internet; however, use of the Internet for personal purposes must not impede or reduce an employee’s ability to perform their duties, diminish productivity or effectiveness at work or negatively impact Bell in any way. Bell computers, devices and email addresses are to be used for Bell business purposes only; abuse may result in disciplinary action, up to and including dismissal. The use of Internet and e-mail to conduct illegal activities is strictly prohibited and will lead to dismissal.
The law strictly prohibits the unlicensed use of software on computers (including tablets and smart phones). To obtain
software licensed by Bell for business use visit the software page in My Telecom Warehouse. You must also verify and respect the manufacturer’s conditions of license or agreement under which the software was acquired. Copying software onto your Bell or personal computer may be a violation of the software company’s licensing agreement as well as copyright laws, and placing Bell at risk of prosecution for copyright infringement.
For further details, consult the Acceptable Use of Information Technology Resources Policy.
Any evidence of child pornography is to be immediately reported through the Internet child pornography reporting form.
My daughter has asked to use my company laptop to do some research on the internet for a school project. Should I lend my laptop to my daughter?
No. To protect our networks, we can’t let anyone, even family members, use Bell equipment.
| 2.15 | Social Media |
Social media includes any digital communication channel that allows individuals to create, share or comment on content. Bell team members must comply with our Social Media Guidelines. They’ve been created to empower employees to be Bell advocates while still protecting Bell’s reputation and ensuring compliance with applicable laws and regulations. As with all communications, employees engaged on social media must abide by the following general principles:
| ● | Any comment made must be true, genuine and not misleading |
| ● | Your online presence is a reflection of you, both personally and professionally, and Bell |
| ● | Always use common sense: be ethical, professional and treat others with respect. |
Please remember that any statement made online may be perceived as representative of Bell and may create unnecessary liability for the employee and the company. The Social Media Guidelines cover all social media other than LinkedIn. Separate guidelines for LinkedIn can be found here. In addition to following the Social Media Guidelines, team members are required to follow
| © Bell Canada 2023. All Rights Reserved. | P a g e | 21 |
| Code of Business Conduct |
the Bell Code of Business Conduct while participating on social media.
Guidelines
1. You can post and share approved Bell product and service online content (Bell and affiliates’ social posts or bell.ca web links) on your personal social media accounts, provided you explicitly identify yourself as a Bell employee
2. Do not rate or review Bell products or services on social media whether you’ve identified yourself as a team member or not. This includes ratings and reviews in an app store or on social networks. Doing so can result in legal ramifications for the company
3. You can ‘like’ official Bell social posts that are not related to products/services
4. You cannot create or design your own advertising/claims promoting Bell and its products and services (separate guidelines exist for LinkedIn)
5. You cannot offer advice relating to customer service from your personal social media accounts. Instead, employees can direct people to our Bell support channels or use the Bell Making it Right service
6. You can celebrate your professional accomplishments and positive work experiences at Bell. We encourage you to include
#TeamBell in these posts. We also encourage you to celebrate the causes Bell champions. For example, use #BellLetsTalk to demonstrate your support and participation in the Bell Let’s Talk mental health initiative and feel free to like, share or comment on Bell posts about these causes
Never assume that anything you say or post online is private. You have an obligation to continue to protect Bell’s Confidential and Internal Use information as defined in the Information Management Policy and may not post any comment that includes confidential information concerning our company, customers, suppliers or team members. As with any company policy, violations can result in disciplinary action, up to and including termination of employment. The Bell Social Media team provides authorization to certain Bell employees to socially engage via LinkedIn on product and services messaging. For these employees, specific guidelines apply. If you have any questions regarding Bell’s Social Media Guidelines, or are unsure if what you want to post is permissible, please reach out to the Social Media team at social.media@bell.ca.
A complete copy of the Bell’s Social Media Guidelines, with relevant examples, is available here and from the Policies and ethics Bellnet site. Additional related corporate policies, such as Bell’s Acceptable Use of Information Technology Resources Policy and Bell Media’s Social Media Policy for CTV News and on-air talent are available from the Policies and ethics Bellnet site.
| 2.16 | Workplace |
| 2.16.1 | Bell Workways program |
Bell has adopted a new way of working built around key principles that prioritize flexibility, business requirements, collaboration, and ongoing support for leaders and teams.
The program is designed to provide our employees with the opportunity to more effectively manage work, family and other life commitments by providing alternative approaches to where and when work gets done when possible, while ensuring we continue to meet Bell’s business objectives and deliver strong results. Offering employees flexible work options reflects Bell’s Strategic Imperative to Engage and Invest in Our People, contributing to a more inclusive, healthy and supportive workplace for the Bell team.
Every Bell team member is expected to read and adhere to the terms and conditions outlined in the Bell Workways Policy.
If employees are unable to adhere to these policies, rules and procedures, their flexible work arrangements or flexible work profiles may be modified. In some cases, breach or failure to comply with the Bell Workways Policy can also lead to disciplinary measures, up to and including termination of employment.
Employees are notably expected to:
| ● | maintain clear and ongoing communication with their leader and consult with them before making changes to a flexible work arrangement that varies from what has been agreed upon |
| ● | continue to work the required number of regular work hours and maintain adequate performance levels, including being connected, accessible, responsive to emails |
| © Bell Canada 2023. All Rights Reserved. | P a g e | 22 |
| Code of Business Conduct |
| and available for meetings when working remotely |
| ● | take special care to ensure no one can see, hear or access confidential information and that customer, supplier and employee privacy and confidentiality is protected at all times, including when working remotely |
| ● | ensure their home or remote working environment is a safe, private and secure space free from distraction and conducive to accomplishing their work tasks |
| ● | consult the Bellnet page on Office Ergonomics, the Health, Safety and Security Self-Assessment and ensure to adhere to the other Health and Safety programs and procedures available on the Bellnet Health & Safety webpage and make the necessary adjustments to their home workstation to ensure it is appropriate for the task and is adjusted to proper ergonomic positioning |
| ● | prevent unauthorized access to the company computer and other assets and ensure that any personal use follows the Acceptable use of information technology resources policy, including alerting corporate security if the company computer is stolen, hacked or if they suspect it has been accessed by someone |
| ● | adhere to health and safety protocols, including refraining from holding in person business meetings, including meetings with colleagues at their home |
| ● | use available technology when working remotely to keep in contact with their colleagues and leader |
Please refer to the Bellnet Workways page for additional information or consult the Bell Workways Policy.
| 2.16.2 | Mental Health |
At Bell, we believe that the mental health of our team members is essential to achieving personal and organizational success and we are committed to leading by example in our own workplace by promoting mental health and supporting team members with a mental illness.
We expect every member of the Bell organization to take primary responsibility for their own health. Every employee also has a responsibility to contribute towards a workplace that promotes mental wellbeing.
Bell is committed to:
| ● | supporting employees experiencing mental illness through our workplace practices |
| ● | understanding what factors contribute towards mental wellbeing at work by reviewing Bell’s mental health policy, employee feedback, government and legal requirements, and current best practices |
| ● | setting objectives that drive continuous improvement of our |
| workplace mental health strategy and regularly evaluating our approach |
| ● | implementing or adapting policies and practices that support mental health in the workplace within the context of our corporate priorities and the evolution of our industry |
| ● | providing resources and training to educate all team members about mental health |
| ● | encouraging employees to take part in activities that contribute to their own mental health in the workplace. |
To view the full policy statement, consult the Policies and ethics Bellnet site.
Additional information on Mental Health in the Workplace, training and resources is available on the Human Resources Bellnet site at Mental Health and Wellness.
You can also contact the Workplace Health team for more information at workplacehealth@bell.ca.
| 2.16.3 | Respect, Diversity, Inclusion and Employment Equity |
Bell is dedicated to supporting human rights and creating an inclusive and accessible workplace where all employees feel valued, respected and supported based on their skillset, unique values, and fairness to achieve their full potential, including support for reasonable workplace accommodations.
Respectful communications and timely conflict resolution are also key components to avoid escalations and prevent discrimination, harassment and violence. Resources to support awareness and resolution are available on our Respectful workplace, Human rights and Diversity, Equity and Inclusion websites.
| © Bell Canada 2023. All Rights Reserved. | P a g e | 23 |
| Code of Business Conduct |
Bell does not tolerate and condemns any form of discrimination, harassment or violence, whether directed against an individual or group, including employees, customers, suppliers and shareholders. This specifically includes discrimination based on race, national or ethnic origin, aboriginal or indigenous status, language spoken, religion, age, sex (including pregnancy or childbirth), gender identity /expression, sexual orientation, marital status, family status, veteran status, physical or mental disability and conviction for which a pardon has been granted.
All leaders are expected to champion a respectful, inclusive and supportive workplace.
All employees should therefore:
| ● | understand and abide by Bell’s human rights and accommodation policies |
| ● | follow and collaborate in the accommodation process by: |
| ● | communicating their needs clearly using the accommodation form; |
| ● | including sufficient information to enable understanding of the reason and requirements for the accommodation; |
| ● | collaborating with their leader to explore various accommodation options; |
| ● | follow the appropriate resolution steps in situations where they may be facing potential discrimination. |
Our Diversity, Equity and Inclusion (DEI) strategy complies with Canada’s legislated employment equity programs. Currently, the Employment Equity Act focuses on four designated groups: women, indigenous peoples, persons with disabilities and members of visible minorities. Through the implementation of workforce policies and leading practices, we ensure equity in the workplace for all qualified members of these designated groups.
Our DEI strategy also includes other equity deserving groups. Building a workforce that reflects the diversity of the communities in which we live and serve brings Bell closer to its customers. We foster equity in the workplace for a wide range of self-identifying groups by means of Bell’s internal DEI questionnaire. At this time, we have selected the following dimensions of diversity in the workplace:
| Ability | Experience | Race | ||
| Age | Gender & Sex | Relationship | ||
| Ancestry | Language | Religion | ||
| Culture | Origin | Sexuality | ||
Collecting self-identification data helps us to ensure workforce policies and leading practices for all equity deserving groups.
Employment Equity also makes business sense. Building a diverse workforce leads to a more inclusive, innovative and engaged workplace that serves better to our communities. By including diverse suppliers into our sourcing processes, Bell also gains access to competitive offerings, greater innovation, and culturally diverse business interactions.
Diversity, equity and inclusion training supports in advancing towards a work environment of excellence that celebrates diversity promotes inclusion. Respect and professionalism in the workplace training is available to help support a diverse, equitable and inclusive work environment. All employees are expected to champion workplace respect, diversity, equity and inclusion; and educate themselves and stay informed through our Human Rights website.
In a mindful effort to create an inclusive workplace for everyone, we expect all our employees to treat others with respect, be curious about differences, and value their uniqueness.
All employees should therefore:
| ● | complete the confidential diversity questionnaire available on Employee Self Serve |
| ● | take available diversity, equity and inclusion training, and engage in awareness events |
| ● | promote and foster an inclusive, equitable and accessible workplace |
Bell operates in both official languages, English and French, and complies with Québec laws requiring French to be the primary language used in workplaces in that province. Our Language Diversity Program provides training, tools and a language pairing program to support bilingualism throughout the organization. For more details, please see the Bell Language Policy.
| © Bell Canada 2023. All Rights Reserved. | P a g e | 24 |
| Code of Business Conduct |
| 2.16.4 | Preventing Workplace Harassment and Violence |
What is harassment and violence
Workplace harassment and violence means any action, conduct or comment, including of a sexual nature, that can be reasonably expected to cause offence, humiliation or other physical or psychological injury or illness to an employee.
Harassment and violence can take many shapes, vary in severity, occur as a single significant incident or as a series of inappropriate behaviors and can occur even where there is no specific intention to cause offence, humiliation or harm.
Bell is committed to fostering a safe, respectful, diverse and inclusive workplace, and preventing and resolving incidents of harassment and violence that may occur while also providing support to those who may have been involved in such incidents.
Roles and responsibilities in promoting a healthy work environment, preventing harassment and violence, and resolving incidents, if they occur, are described in our Workplace Harassment and Violence Prevention Policy, which also sets out examples of harassment and violence.
This policy applies anywhere work or work-related activities are conducted, whether inside or outside Bell premises, during or beyond regular work hours, or wherever/whenever there is a sufficient connection to the workplace.
Team members are responsible for complying with the Workplace Harassment and Violence Prevention Policy. Failure to do so may result in corrective or disciplinary actions, up to and including dismissal.
As such, all team members are expected to:
| ● | read the policy and understand what harassment and violence is |
| ● | complete all mandatory training, including the “Be Respectful” module |
| ● | refrain from committing harassment and violence |
| ● | recognize warning signs and act responsibly in situations of conflict or potential threat. In emergency situations, first call 911. When safe to do so, contact their leader or the National Incident Centre (NIC) at 1 866-714- 0911 or cni-nic@bell.ca to ensure appropriate protocols are followed. |
| ● | report harassment and/or violence as soon as possible to a |
| leader, a Human Resources team member, union representative or to Workplace Practices or Corporate Security. |
| ● | cooperate during resolution of matters involving alleged workplace harassment or violence by: |
| ● | following appropriate de-escalation measures or directives, as applicable |
| ● | providing their version of the facts and supporting evidence, where applicable |
| ● | safeguarding confidentiality during the process |
| ● | refraining from undue influence or retaliatory behavior against anyone who is or is believed to be involved in the resolution process and report any such acts if they occur. |
Leaders have additional responsibilities which include:
| ● | understand the impact of their behaviours, actions or inaction, model appropriate behavior and use authority in a fair and respectful manner |
| ● | address all inappropriate behavior and assist members with resolving conflicts and de-escalating tensions |
| ● | provide support to those who come forward and treat any report of harassment or violence seriously, in a sensitive and confidential manner and notify a Human Resources team member, Workplace Practices or Corporate Security as soon as a report of harassment or violence is made, whether verbally or in writing |
| ● | implement recommended measures to prevent or reduce risk, and apply appropriate corrective or disciplinary measures when needed. |
| © Bell Canada 2023. All Rights Reserved. | P a g e | 25 |
| Code of Business Conduct |
Please read the Workplace Harassment and Violence Prevention
| 2.16.5 | Health and Safety |
At Bell, the health and safety of our team members and external stakeholders, including contractors, customers and the general public, is an absolute priority. We also believe that a safe and healthy workplace is essential to achieving success, in all areas of our business.
Our Obligations
| ● | To provide a safe and healthy workplace which is essential to achieving success in all areas of our business |
| ● | Under the law, employees and leaders at all levels of the company are personally accountable to ensure proper health and safety practices are in place. |
Your Role
As a Bell team member, you assume the primary responsibility for your own health and safety and to uphold safe work practices at all times to prevent injuries. You have a role to play in supporting our Health and Safety Policy by:
| ● | Upholding safe work practices at all times to prevent injuries |
| ● | Identifying and reporting health & safety hazards and incidents via the established reporting processes and participating in associated investigations when required |
| ● | Actively participating in health and safety training |
| ● | Cooperating as required to meet or exceed health & safety laws and regulations that apply to us. |
Our Health & Safety Policy Statement
At Bell, the health and safety of our team members and external stakeholders, including contractors, customers, and the general public, is an absolute priority. We also believe
| 2.16.6 | Emergency Management |
Employees may encounter various emergency situations that can directly affect them or Bell. To this end, Bell is committed to a level of preparedness and planning that is designed to “protect life and property” and to ensure a rapid return to providing service to our customers.
Policy and refer to the Respectful workplace website for additional useful information.
that a safe and healthy workplace is essential to achieving organization success, in all areas of our business. To support our commitment to team members, Bell will:
| ● | ensure due diligence in its approach to meet or exceed all applicable workplace health & safety laws and regulations |
| ● | identify, analyze and address health & safety hazards |
| ● | establish processes and practices to support a safe workplace and prevent injuries |
| ● | investigate health & safety incidents |
| ● | provide employee training to ensure adequate health & safety knowledge and competency |
| ● | work in consultation with joint health & safety committees to uphold and evolve safe work practices and resolve any issues |
| ● | set objectives to continuously improve our safety performance |
| ● | regularly evaluate, monitor and report health & safety performance. |
In support of our commitment to external partners and stakeholders, Bell will:
| ● | require contractors, sub-contractors and third parties that access Bell sites to demonstrate due diligence at all times by having appropriate training, following contractual requirements, working safely and not exposing themselves or Bell employees to health & safety risks. |
| ● | cooperate with government and other stakeholders on health & safety matters. |
Additional information on Health and safety programs and procedures is available on the Health and Safety Bellnet site under Human Resources, Workplace and Safety.
You can also contact the Corporate Health and Safety team for more information at info.ss-hs@bell.ca.
Through the development and implementation of emergency response procedures and the “Be Ready” training modules, employees and business units will be ready to respond during emergencies. All employees must follow the “Be Ready” on line training every two years.
| © Bell Canada 2023. All Rights Reserved. | P a g e | 26 |
| Code of Business Conduct |
In the event of a life-threatening emergency first make sure you are safe, then call 911 (or local emergency service). All emergencies and emergency conditions including unplanned evacuations, or situations significantly impairing or potentially impacting service (such as but not limited to floods, major fires, power outages, health and safety emergencies) occurring on or in proximity to Bell facilities are to be reported to Bell’s National Incident Centre (NIC) at 1-866-714-0911 or cni-nic@bell.ca. For information on Bell’s Emergency Management procedures, consult the Corporate Security Bellnet site.
Evidence of serious criminal activity such as terrorism, found on Bell or customer premises or Bell systems, are to be reported to Bell’s National Incident Centre (NIC) at 1-866-714-0911, unless involving an imminent threat where 911 must be called.
Significant facility or utility interruptions, surveillance, control systems or any service failures that impact our network are to be reported to the National Network Operations Centre (NNOC) at 1-888-570-1091.
| 2.16.7 | Business Continuity |
Bell recognizes the importance of its infrastructure and services for its employees and customers. To that end, all business unit leaders and team members must ensure they have appropriate business continuity plans and disaster recovery plans in order to be ready to react to any type of events that may impair our activities.
| 2.16.8 | Alcohol, Drugs and Other Substances |
All employees are required to be fit for work and must not be impaired by the use of illicit drugs, recreational cannabis or alcohol in the workplace. The workplace includes all locations where company business is conducted, including employees’ home or remote work location during working hours.
Use, possession and trafficking of illicit drugs, recreational cannabis or alcohol is strictly prohibited in the workplace. Lawful possession of alcohol and recreational cannabis in employee’s home is however permitted.
Employees must not be impaired by medication or medical cannabis in the workplace. Employees are responsible for determining through their physician or pharmacist whether the use of medication might have an adverse effect on performance or put their or others’ health and safety at risk. If the use of medication
and/or medical cannabis can impair their ability to perform their job safely, efficiently or otherwise affect performance or attendance, the employee must proactively inform their leader. Intentional misuse of prescribed or over-the-counter medications or medical cannabis is strictly prohibited.
Employees are required to behave responsibly and maintain appropriate behavior during company-sponsored social and recreational events, including virtual social events, with regard for the safety and well-being of the individuals participating, the community, and the reputation of the company.
To review the full Drug and Alcohol Policy, consult the Human Resources Bellnet site.
| 2.16.9 | Involvement in a Legal Matter |
If you are involved in a legal matter or police case you must immediately inform your manager if this involvement has the potential to affect your ability to perform your job fully and competently. Loss of a driver’s license, for example, must be reported immediately if the affected employee is required to drive a Bell vehicle.
| 2.17 | Journalistic Independence |
Bell is committed to upholding principles of journalistic independence. The Journalistic Independence Policy governs editorial decisions made by applicable news divisions owned by Bell, including radio (collectively “Bell Media News”).
Bell Media News is solely responsible for all news reporting decisions and for ensuring the integrity of their news operations. Compliance with the Journalistic Independence Policy is mandatory for all Bell employees. Failure to
| © Bell Canada 2023. All Rights Reserved. | P a g e | 27 |
| Code of Business Conduct |
comply with the policy will be considered a breach of the Code of Conduct and may result in disciplinary action up to and including termination of employment.
An appropriate framework of independence between Bell Media News and Bell is a fundamental safeguard to ensure that news is covered in a fair, accurate, balanced and unbiased manner. Any interference, whether direct or indirect, actual or perceived, undermines the principles of news independence and can erode the credibility of Bell Media News, which is critical to maintaining the trust of audiences.
Bell fully endorses the independence of Bell Media News and requires that all employees execute their day-to-day job responsibilities in a manner that respects this core value.
From time to time, news stories directly or indirectly concerning Bell, or of commercial interest to Bell, will be reported by Bell Media News. The appropriate Bell Media News editorial team is solely responsible for determining how to cover any such story, with full discretion and control, and without interference. No Bell employee will take any action that will impact the standards of fairness, accuracy, balance and independence that must be applied to any such news story.
In the normal course of business, representatives of Bell may offer ideas for news coverage to the Bell Media News team, as they would with any other news organization. In any such instances, Bell representatives must recognize that the material offered must be considered newsworthy and relevant to the audience by the applicable Bell Media News division’s editorial team before receiving coverage. The news team will decide whether to proceed with a story, how it will be covered, and the extent of any coverage, with full and absolute discretion and control, and without direct or indirect interference in the decision making process.
At all times, this Code and other relevant BCE policies apply to Bell Media, including Bell Media News management and staff. As a result, in accordance with this Code and BCE’s Disclosure
Policy, BCE’s communications department is responsible for addressing all queries from other media outlets regarding Bell Media and its divisions and properties, including Bell Media News. Furthermore, (i) non-public BCE information of which Bell Media News management or staff have knowledge in a capacity other than Bell Media News reporting or (ii) information in the possession of Bell Media in its capacity as an employer, must remain confidential and be treated in accordance with the Code and Bell’s Information Management Policy.
All news editorial decision making resides with the Bell Media News team with absolute and final privilege belonging to, for CTV News, the Vice President responsible for CTV News and, for Noovo News, the Vice President responsible for Noovo News. The Bell Media News team will be responsible for the development of applicable editorial and reporting policies, including news policies on attribution, sources, and disclosure of conflicts.
If at any time the Vice President responsible for CTV News or the Vice President responsible for Noovo News has any concerns about journalistic independence or compliance with the Policy that cannot be resolved through normal functional reporting channels in line with the principles of the Policy, the Vice President responsible for CTV News or the Vice President responsible for Noovo News can address said matters with BCE’s Chief Executive Officer and/or the Chair of the BCE Audit Committee.
If you have any concerns regarding compliance with the Journalistic Independence Policy, such concerns shall be communicated to your immediate manager and/or the Vice President responsible for CTV News or the Vice President responsible for Noovo News, as applicable. However, if such reporting is either inappropriate, does not provide the necessary level of confidentiality, or as you otherwise prefer, the reportable activity should be reported to the Business Conduct Help Line or to the BCE Corporate Secretary.
To view the full Journalistic Independence Policy, consult the Policies and ethics Bellnet site.
| © Bell Canada 2023. All Rights Reserved. | P a g e | 28 |
| Code of Business Conduct |
You are a member of the Bell Media News team and you receive a request from the Bell Residential Services team to profile an item they believe is newsworthy. What should you do?
| ● | Remember that it is acceptable for Bell employees to suggest story ideas, with respect for the Bell Media News team’s full authority to decide on news coverage |
| ● | If you decide the item is not newsworthy, but they persist or escalate the matter, you should discuss it with your supervisor to confirm your position and obtain support |
| ● | Ultimately, you can engage the Vice President responsible for CTV News or the Vice President responsible for Noovo News, as applicable, who are the final arbiters in matters relating to independent news reporting and have the authority to take steps to ensure the situation is resolved in an appropriate manner in accordance with the Policy on Journalistic Independence |
| ● | Should you consider that the matter is not handled in accordance with the policy, you can report your concerns through the Business Conduct Help Line. |
The Business Conduct Help Line may be reached 24/7 by calling 1-866-298-2942 or by visiting clearviewconnects.com.
Members of the public should call Bell Canada’s Complaint and Concerns Line at 1-866-317-3382 with any concerns about Bell’s activities.
| 2.18 | Environmental Leadership |
Bell believes that environmental protection and energy efficiency are an integral part of doing business and is committed to minimize, through a continual improvement process, the impact that some of our activities, products or services may have on the environment.
In support of our commitment to environmental leadership, we will:
| ● | seek to meet or exceed the obligations of all applicable legislation and other requirements |
| ● | prevent, control and reduce releases into the environment |
| ● | reduce greenhouse gas emissions, mitigate and adapt to climate change related risks and transparently report on our results |
| ● | correct in a timely manner problem situations that could not be prevented |
| ● | adopt a series of corporate objectives, principles and procedures that apply to all employees in the course of their respective duties, and monitor the progress towards meeting our targets |
| ● | promote and support cost-effective resource and waste minimization initiatives |
| ● | deal with suppliers who seek to minimize their environmental |
| and energy consumption impacts, and practice social and ethical responsibility |
| ● | ensure availability of necessary resources to maintain and improve environmental and energy management systems |
| ● | develop and market telecommunications services that provide people and organizations with innovative solutions that take into account their environmental and energy challenges |
| ● | participate with governments, businesses, the public and relevant interest groups to advance environmental protection and efficient energy use |
| ● | communicate our environmental initiatives and performance to stakeholders on a regular basis |
| ● | ensure that employees adhere to the Environmental policy and understand their responsibilities for putting it into practice. |
The Corporate Responsibility & Environment (CR&E) team has developed a series of policies, programs, directives, management frameworks and procedures to support employees in their environmental duties. These documents are available on the Environmental leadership page on Bellnet.
| © Bell Canada 2023. All Rights Reserved. | P a g e | 29 |
| Code of Business Conduct |
Environmental training is mandatory for all employees directly involved in managing any of the following environmental issues, or whose activities may have an impact on the environment: incidents, manhole effluents, network impacts, residual materials (hazardous and non-hazardous), treated wood poles, energy consumption, petroleum products or ozone depleting substances. Training must be completed before the employee begins operational duties.
All environmental incidents, inspections and inquiries by authorized third parties must be reported without delay to the Enviro-line at 1-877-235-5368, available 24/7.
For inquiries, suggestions, concerns or for information about environmental training, contact your Environmental Coordinator or the CR&E team via the Contact Us form on the Environmental leadership page on Bellnet.
| © Bell Canada 2023. All Rights Reserved. | P a g e | 30 |
| Code of Business Conduct |
| 3 | ROLES AND RESPONSIBILITIES |
3.1 Business Unit Responsibility
Managers are required to ensure that all employees have access to the Code either on-line or in a paper format if required, and that they know, understand and comply with its provisions. To this end, they should ensure that all employees review the Code annually and comply with the annual review process outlined in this Code.
3.2 Board of Directors, Corporate Governance Committee and Audit Committee
The Board of Directors, with the recommendation of the Corporate Governance Committee, has the authority to approve this policy. In addition, the Corporate Secretary’s Office in conjunction with Internal Audit, report quarterly to the Audit Committee on the number and scope of issues brought via the Business Conduct Help Line.
3.3 Corporate Secretary’s Office
The Corporate Secretary’s Office has the responsibility of administering the Code and managing the Business Conduct Help Line, securing annual certification of all executives and members of the Board of Directors under the Code, addressing conflict of interest issues and ensuring compliance by all Business Units.
| © Bell Canada 2023. All Rights Reserved. | P a g e | 31 |
| Code of Business Conduct |
The Code of Business Conduct annual review is included in the annual performance process. These procedures are located in the Career Zone Bellnet site under Objective Performance.
|
Attachment 1A
|
Certification of Directors and Executives under the Code of Business Conduct
|
|||
|
Attachment 2A
|
Form BC 3684 – Employee Annual Record of Review
|
|||
|
Attachment 2B
|
Form BC 3684A – Disclosure of Conflict of Interest or Potential Conflict of Interest
|
|||
|
Attachment 3
|
Additional Resources
|
|||
| © Bell Canada 2023. All Rights Reserved. | P a g e | 32 |
| Code of Business Conduct |
Attachment 1A
CERTIFICATION OF DIRECTORS AND EXECUTIVES
UNDER THE CODE OF BUSINESS CONDUCT
The Boards of Directors of BCE Inc. and Bell Canada (in each case, the “Company”) and our shareholders, expect all Directors and executives of the Company to follow the highest possible standards of honest and ethical conduct and to encourage and promote a culture in which ethical business conduct is recognized, valued and exemplified.
Certification
I certify that I have reviewed, understand and follow the Bell Canada Code of Business Conduct (the “Code”).
In addition, I support the setting of standards needed to discourage wrongdoing and to promote:
| ● | honest and ethical conduct, including the ethical handling of actual or apparent conflicts of interest between personal and professional relationships, |
| ● | full, fair, accurate and timely disclosure in reports and documents that the Company files with, or submits to, securities regulators and in other public communications made by the Company, in accordance with the Disclosure Policy, |
| ● | compliance with laws, rules and regulations of federal, provincial, state or local governments, and other relevant private and public regulatory agencies in all jurisdictions in which the Company operates, |
| ● | prompt reporting of all material violations of the Code to the Chair of the Audit Committee of the Board of Directors of the Company. |
To the best of my knowledge and ability, I will act in good faith, responsibly, with due care, competence and diligence, without misrepresenting material facts or allowing my independent judgment to be compromised.
I acknowledge that I am accountable for following the Code and the responsibilities I have under it. I also acknowledge that complying with the Code is a condition of my employment. If I do not comply with it or applicable laws, rules or regulations, I may be subject to disciplinary measures, which could include dismissal from the Company.
| © Bell Canada 2023. All Rights Reserved. | P a g e | 33 |
| Code of Business Conduct |
| Attachment 2A | Form BC 3684 |
EMPLOYEE ANNUAL RECORD OF REVIEW
Note to immediate manager: If this form is completed in paper format, please file original in employee’s personnel file.
Policy on conflict of interest
Employees owe their first business allegiance to Bell, and therefore they must remain free of interests or relationships which are harmful or detrimental to Bell’s best interests. Employees should avoid not only a real conflict of interest, but also the appearance of one which could tarnish their own or Bell’s image. Even though it is not always possible to avoid relationships that could place you in a position of potential conflict, it is important to inform your manager and avoid actions or decisions that would conflict with Bell’s interests.
Conflict of interest can lead to disciplinary action, even to dismissal and/or prosecution. If you are in doubt, you should discuss your specific situation with your manager, who will then advise you as to the position of Bell with respect to the matter.
Annual certification
I have reviewed, fully understand and follow Bell Canada’s “Code of Business Conduct” including the section on Conflict of Interest. I have reported immediately to my manager and through the annual review process any relationship or other circumstances that do or could place me in conflict with the interests of Bell. Any new situations will be reported as they occur. I hereby certify that I have no real or potential conflict of interest, except what is disclosed through the annual review process.
| © Bell Canada 2023. All Rights Reserved. | P a g e | 34 |
| Code of Business Conduct |
| Attachment 2B | Form BC 3684A |
DISCLOSURE OF CONFLICT OF INTEREST
OR POTENTIAL CONFLICT OF INTEREST
Note to immediate manager: If this form is completed in paper format, please file original in employee’s personnel file. A copy should also be sent to the Corporate Secretary’s Office at: corporate.secretariat@bell.ca.
| Employee
|
||||
| Family name
|
Given names
|
Employee number
|
I am directly or indirectly involved in other business or employment, which may give rise to or is at present in conflict with, or potential conflict with, the best interests of Bell:
I have direct or indirect investment, business involvements or relationships, which may give rise to or is at present in conflict with, or potential conflict with, the best interests of Bell:
I have, in the past 2 years, been employed or otherwise commercially involved in endeavours or companies which are in competition with Bell Canada and its affiliated companies (e.g.: Rogers, Telus, Videotron, Cogeco, etc.):
I am currently or was recently bound by restrictive covenants such as non-competition or non-solicitation restrictions:
Other:
For employees who declare a conflict due to past employment by a competitor: I understand that in my previous employment or commercial involvement with a competitor of Bell Canada and its affiliated companies I may have become aware of or given access to undisclosed confidential or proprietary information of my previous employer. As such, unless this information has been publicly disclosed or otherwise available in the marketplace, I am not to share such information. I also acknowledge that I have returned to my previous employer all property belonging to my previous employer including any confidential or proprietary information and documents provided to me including any third party information that was entrusted to me.
| © Bell Canada 2023. All Rights Reserved. | P a g e | 35 |
| Code of Business Conduct |
Attachment 3
ADDITIONAL RESOURCES
If you have any questions regarding the issues raised in this document or any questions on the Code, speak to your manager or use the Business Conduct Help Line at clearviewconnects.com or by calling 1-866-298-2942 (toll free).
If you wish to report any unethical or illegal behaviour such as corporate fraud, or to raise any concerns regarding Bell’s accounting, internal accounting controls or auditing matters, you may report the matter to your manager or use the Business Conduct Help Line at clearviewconnects.com or by calling 1-866-298-2942 (toll free).
You may also use the following resources:
| ● | Human resources Bellnet site |
| ● | Corporate Security Bellnet site |
| ● | life-threatening emergencies: call 911 |
| ● | loss or theft of Bell assets, internal fraud, criminal activity, property damage, unauthorized disclosure of confidential information, known failures in security safeguards, malfunctioning doors and locks, emergency response system (non-life threatening emergencies), emergency conditions and service impacting situations are to be reported to Bell’s National Incident Centre (NIC) at 1-866-714-0911 or at cni-nic@bell.ca |
| ● | computer security incidents, virus, worms, spam or phishing using Bell’s name, any other computer or data network attacks, weaknesses in security systems, and unexplained systems changes are to be reported to 1-888-920-8888 |
| ● | significant facility or utility interruptions, surveillance, control systems or any service failures that impact our telecommunications networks are to be reported to 1-888-570-1091 |
| ● | Corporate Responsibility & Environment team via the online Contact form |
| ● | Bell Enviro-line (to report an environmental incident or inspection) at 1-877-235-5368 Branding at info.branding@bell.ca |
| ● | Corporate Secretary’s Office Bellnet site or at (514) 786-8424 |
| ● | Occupational Health, Safety and Workplace at (514) 870-5848 or at Info.ss-hs@bell.ca |
| ● | Bell Privacy Office for customer related privacy issues at privacy@bell.ca or for additional privacy related information, visit bell.ca |
| ● | Information on privacy in the workplace for employees is available on the Privacy Bellnet site or at: |
| ● | English: privacy.coordinator@bell.ca |
| ● | French: coord.rens.pers@bell.ca |
| © Bell Canada 2023. All Rights Reserved. | P a g e | 36 |
| Code of Business Conduct |
| Issuing BU | Law & Regulatory Department | |||
| Policy sponsor | Corporate Secretary | |||
| Policy owner | Corporate Secretary’s Office | |||
| Primary contact | Corporate Secretary’s Office | |||
| Required approvals | Board of Directors, Corporate Governance Committee, Corporate Secretary | |||
| First Release | 1995 | |||
| Review cycle | Annually | |||
Required Policy or Practice management elements checklist
| Monitoring compliance processes defined | Yes | |||
| Communication plan complete | Yes | |||
| Communication materials complete | Yes | |||
| Training plan complete | Yes | |||
Revision history
| Date | Change owner | Changed by | Description | |||||
|
August 2017 |
Michel Lalande |
Michel Lalande |
Annual Update |
|||||
|
August 2018 |
Michel Lalande |
Miguel Baz |
Annual Update |
|||||
|
October 2018 |
Michel Lalande |
Miguel Baz |
Update |
|||||
|
August 2019 |
Michel Lalande |
Miguel Baz |
Annual Review |
|||||
|
January 2020 |
Michel Lalande |
Miguel Baz |
Update |
|||||
|
August 2020 |
Michel Lalande |
Miguel Baz |
Annual Review |
|||||
|
January 2021 |
Martin Cossette |
Miguel Baz |
Update |
|||||
|
March 2021 |
Martin Cossette |
Miguel Baz |
Update |
|||||
|
August 2021 |
Martin Cossette |
Miguel Baz |
Annual Review |
|||||
|
September 2021 |
Martin Cossette |
Alexis Cloutier |
Update |
|||||
|
November 2021 |
Martin Cossette |
Alexis Cloutier |
Update |
|||||
|
August 2022 |
Martin Cossette |
Alexis Cloutier |
Annual Review |
|||||
|
August 2023 |
Martin Cossette |
Alexis Cloutier |
Annual Review |
|||||
| © Bell Canada 2023. All Rights Reserved. | P a g e | 37 |