UNITED STATES
SECURITIES AND EXCHANGE COMMISSION
Washington, D.C. 20549
FORM 8-K
CURRENT REPORT
Pursuant to Section 13 or 15(d)
of The Securities Exchange Act of 1934
Date of Report (Date of earliest event reported): July 31, 2023
Apollo Commercial Real Estate Finance, Inc.
(Exact name of registrant as specified in its charter)
| Maryland | 001-34452 | 27-0467113 | ||
| (State or other jurisdiction of incorporation) |
(Commission File Number) |
(IRS Employer Identification No.) |
| c/o Apollo Global Management, Inc. | ||
| 9 West 57th Street, 42nd Floor | ||
| New York, New York | 10019 | |
| (Address of principal executive offices) | (Zip Code) |
Registrant’s telephone number, including area code: (212) 515-3200
n/a
(Former name or former address, if changed since last report.)
Check the appropriate box below if the Form 8-K filing is intended to simultaneously satisfy the filing obligation of the registrant under any of the following provisions (see General Instruction A.2. below):
| ☐ | Written communications pursuant to Rule 425 under the Securities Act (17 CFR 230.425) |
| ☐ | Soliciting material pursuant to Rule 14a-12 under the Exchange Act (17 CFR 240.14a-12) |
| ☐ | Pre-commencement communications pursuant to Rule 14d-2(b) under the Exchange Act (17 CFR 240.14d-2(b)) |
| ☐ | Pre-commencement communications pursuant to Rule 13e-4(c) under the Exchange Act (17 CFR 240.13e-4(c)) |
Securities registered pursuant to Section 12(b) of the Act:
| Title of each class |
Trading |
Name of each exchange on which registered |
||
| Common Stock, $0.01 par value | ARI | New York Stock Exchange |
Indicate by check mark whether the registrant is an emerging growth company as defined in Rule 405 of the Securities Act of 1933 (§230.405 of this chapter) or Rule 12b-2 of the Securities Exchange Act of 1934 (§240.12b-2 of this chapter).
Emerging Growth Company ☐
If an emerging growth company, indicate by check mark if the registrant has elected not to use the extended transition period for complying with any new or revised financial accounting standards provided pursuant to Section 13(a) of the Exchange Act. ☐
| Item 2.02 | Results of Operations and Financial Condition. |
On July 31, 2023, Apollo Commercial Real Estate Finance, Inc. (the “Company”) issued a summary press release and a detailed presentation announcing its financial results for the quarter ended June 30, 2023. A copy of the summary press release and the detailed presentation are attached as Exhibit 99.1 and Exhibit 99.2, respectively, hereto and incorporated herein by reference.
The information in Item 2.02 of this Current Report, including Exhibits 99.1 and 99.2, is being furnished and shall not be deemed “filed” for purposes of Section 18 of the Securities Exchange Act of 1934, as amended, or otherwise subject to the liabilities of that Section. The information in this Current Report shall not be incorporated by reference into any registration statement or other document pursuant to the Securities Act of 1933, as amended, unless it is specifically incorporated by reference therein.
| Item 9.01 | Financial Statements and Exhibits. |
| (d) | Exhibits. |
| Exhibit No. |
Description |
|
| 99.1 | Summary press release dated July 31, 2023 | |
| 99.2 | Financial results presentation dated July 2023 | |
| 104 | Cover Page Interactive Data File (embedded within the Inline XBRL document) | |
SIGNATURES
Pursuant to the requirements of the Securities Exchange Act of 1934, the registrant has duly caused this report to be signed on its behalf by the undersigned hereunto duly authorized.
| Apollo Commercial Real Estate Finance, Inc. | ||
| By: | /s/ Stuart A. Rothstein |
|
| Name: | Stuart A. Rothstein | |
| Title: | President and Chief Executive Officer | |
Date: July 31, 2023
Exhibit 99.1

| CONTACT: | Hilary Ginsberg Investor Relations (212) 822-0767 |
APOLLO COMMERCIAL REAL ESTATE FINANCE, INC.
REPORTS SECOND QUARTER 2023 RESULTS
New York, NY, July 31, 2023 – Apollo Commercial Real Estate Finance, Inc. (the “Company” or “ARI”) (NYSE:ARI) today reported results for the three and six-month period ended June 30, 2023.
Net loss attributable to common stockholders per diluted share of common stock was ($0.62) for the quarter ended June 30, 2023. Distributable Earnings (a non-GAAP financial measure defined below) and Distributable Earnings prior to net realized loss on investments and realized gain on extinguishment of debt per share of common stock was ($0.11) and $0.46 for the quarter ended June 30, 2023, respectively.
“ARI’s floating rate portfolio continues to benefit from the higher interest rate environment, as the Company had another consistent quarter of distributable earnings, prior to net realized losses on investments, in excess of the common stock dividend,” said Stuart Rothstein, Chief Executive Officer and President of ARI.
ARI issued a detailed presentation of the Company’s quarter and six-month period ended June 30, 2023 results, which can be viewed at www.apollocref.com.
Conference Call and Webcast
The Company will hold a conference call to review second quarter results on August 1, 2023, at 10am ET. To register for the call, please use the following link:
https://register.vevent.com/register/BI5af38c23ae9f4b47b5b50748ec9bb1ea
After you register, you will receive a dial-in number and unique pin. The Company will also post a link in the Stockholders’ section on ARI’s website for a live webcast. For those unable to listen to the live call or webcast, there will be a webcast replay link posted in the Stockholders’ section on ARI’s website approximately two hours after the call.
Distributable Earnings
“Distributable Earnings”, a non-GAAP financial measure, is defined as net income available to common stockholders, computed in accordance with GAAP, adjusted for (i) equity-based compensation expense (a portion of which may become cash-based upon final vesting and settlement of awards should the holder elect net share settlement to satisfy income tax withholding), (ii) any unrealized gains or losses or other non-cash items (including depreciation and amortization related to real estate owned) included in net income available to common stockholders, (iii) unrealized income from unconsolidated joint ventures, (iv) foreign currency gains (losses), other than (a) realized gains/(losses) related to interest income, and (b) forward point gains/(losses) realized on the Company’s foreign currency hedges, (v) the non-cash amortization expense related to the reclassification of a portion of the Company’s convertible senior notes (the “Notes”) to stockholders’ equity in accordance with GAAP, and (vi) provision for loan losses.
The weighted-average diluted shares outstanding used for Distributable Earnings per weighted-average diluted share has been adjusted from weighted-average diluted shares under GAAP to exclude shares issued from a potential conversion of the Notes. Consistent with the treatment of other unrealized adjustments to Distributable Earnings, these potentially issuable shares are excluded until a conversion occurs, which the Company believes is a useful presentation for investors.
The Company believes that excluding shares issued in connection with a potential conversion of the Notes from its computation of Distributable Earnings per weighted-average diluted share is useful to investors for various reasons, including the following: (i) conversion of Notes to shares requires both the holder of a Note to elect to convert the Note and for the Company to elect to settle the conversion in the form of shares; (ii) future conversion decisions by Note holders will be based on the Company’s stock price in the future, which is presently not determinable; (iii) the exclusion of shares issued in connection with a potential conversion of the Notes from the computation of Distributable Earnings per weighted-average diluted share is consistent with how the Company treats other unrealized items in its computation of Distributable Earnings per weighted-average diluted share; and (iv) the Company believes that when evaluating its operating performance, investors and potential investors consider the Company’s Distributable Earnings relative to its actual distributions, which are based on shares outstanding and not shares that might be issued in the future.
As a REIT, U.S. federal income tax law generally requires the Company to distribute annually at least 90% of its REIT taxable income, without regard to the deduction for dividends paid and excluding net capital gains, and that the Company pay tax at regular corporate rates to the extent that it annually distributes less than 100% of its net taxable income. Given these requirements and the Company’s belief that dividends are generally one of the principal reasons shareholders invest in a REIT, the Company generally intends over time to pay dividends to its stockholders in an amount equal to its net taxable income, if and to the extent authorized by the Company’s board of directors. Distributable Earnings is a key factor considered by the Company’s board of directors in setting the dividend and as such the Company believes Distributable Earnings is useful to investors.
During the six months ended June 30, 2023, the Company recorded in the condensed consolidated statement of operations a realized loss on a subordinate loan secured by an ultra-luxury residential property and a realized loss related to the acquisition of a hotel property through a deed-in-lieu of foreclosure. The realized losses were partially offset by realized gains on extinguishment of debt related to our convertible notes.
The Company believes it is useful to its investors to also present Distributable Earnings prior to realized gains (losses) and impairments on real estate owned and investments to reflect its operating results because (i) the Company’s operating results are primarily comprised of earning interest income on its investments net of borrowing and administrative costs, which comprise the Company’s ongoing operations and (ii) it has been a useful factor related to the Company’s dividend per share because it is one of the considerations when a dividend is determined. The Company believes that its investors use Distributable Earnings and Distributable Earnings prior to realized gains (losses) and impairments on real estate owned and investments, or a comparable supplemental performance measure, to evaluate and compare the performance of the Company and its peers.
A significant limitation associated with Distributable Earnings as a measure of the Company’s financial performance over any period is that it excludes unrealized gains (losses) from investments. In addition, the Company’s presentation of Distributable Earnings may not be comparable to similarly-titled measures of other companies, that use different calculations. As a result, Distributable Earnings should not be considered as a substitute for the Company’s GAAP net income as a measure of its financial performance or any measure of its liquidity under GAAP. Distributable Earnings are reduced for realized losses on loans which include losses that management believes are near certain to be realized.
A reconciliation of Distributable Earnings, and Distributable Earnings prior to realized gains (losses) and impairments on real estate owned and investments, to GAAP net income (loss) available to common stockholders is included in the detailed presentation of the Company’s three and six months ended June 30, 2023 results, which can be viewed at www.apollocref.com.
About Apollo Commercial Real Estate Finance, Inc.
Apollo Commercial Real Estate Finance, Inc. (NYSE: ARI) is a real estate investment trust that primarily originates, acquires, invests in and manages performing commercial first mortgage loans, subordinate financings and other commercial real estate-related debt investments. The Company is externally managed and advised by ACREFI Management, LLC, a Delaware limited liability company and an indirect subsidiary of Apollo Global Management, Inc., a high-growth, global alternative asset manager with approximately $598 billion of assets under management at March 31, 2023.
Additional information can be found on the Company’s website at www.apollocref.com.
Forward-Looking Statements
Certain statements contained in this press release constitute forward-looking statements as such term is defined in Section 27A of the Securities Act of 1933, as amended, and Section 21E of the Securities Exchange Act of 1934, as amended, and such statements are intended to be covered by the safe harbor provided by the same. Forward-looking statements are subject to substantial risks and uncertainties, many of which are difficult to predict and are generally beyond the Company’s control. These forward-looking statements include information about possible or assumed future results of the Company’s business, financial condition, liquidity, results of operations, plans and objectives. When used in this release, the words believe, expect, anticipate, estimate, plan, continue, intend, should, may or similar expressions, are intended to identify forward-looking statements. Statements regarding the following subjects, among others, may be forward-looking: macro- and micro-economic impact of the COVID-19 pandemic, increasing interest rates and inflation; market trends in the Company’s industry, real estate values, the debt securities markets or the general economy; the timing and amounts of expected future fundings of unfunded commitments; the return on equity; the yield on investments; the ability to borrow to finance assets; the Company’s ability to deploy the proceeds of its capital raises or acquire its target assets; and risks associated with investing in real estate assets, including changes in business conditions and the general economy. For a further list and description of such risks and uncertainties, see the reports filed by the Company with the Securities and Exchange Commission. The forward-looking statements, and other risks, uncertainties and factors are based on the Company’s beliefs, assumptions and expectations of its future performance, taking into account all information currently available to the Company. Forward-looking statements are not predictions of future events. The Company disclaims any intention or obligation to update or revise any forward-looking statements, whether as a result of new information, future events or otherwise, except as required by law.

Exhibit 99.2 Q2 2023 Financial Results Apollo Commercial Real Estate Finance, Inc. July 2023 Unless otherwise noted, information as of June 30, 2023 It should not be assumed that investments made in the future will be profitable or will equal the performance of the investments shown in this document.

Forward Looking Statements and Other Disclosures This presentation may contain forward-looking statements that are within the meaning of Section 27A of the Securities Act of 1933, as amended, and Section 21E of the Securities Exchange Act of 1934, as amended, and such statements are intended to be covered by the safe harbor provided by the same. Forward-looking statements are subject to substantial risks and uncertainties, many of which are difficult to predict and are generally beyond management’s control. These forward-looking statements may include information about possible or assumed future results of Apollo Commercial Real Estate Finance, Inc.’s (the “Company,” “ARI,” “we,” “us” and “our”) business, financial condition, liquidity, results of operations, plans and objectives. When used in this presentation, the words “believe,” “expect,” “anticipate,” “estimate,” “plan,” “continue,” “intend,” “should,” “may” or similar expressions, are intended to identify forward-looking statements. Statements regarding the following subjects, among others, may be forward-looking: the macro- and micro-economic impact of the coronavirus (“COVID-19”) pandemic; increasing interest rates and inflation; market trends in our industry, real estate values, the debt securities markets or the general economy; ARI’s business and investment strategy; ARI’s operating results; ARI’s ability to obtain and maintain financing arrangements; the timing and amounts of expected future fundings of unfunded commitments; and the return on equity, the yield on investments and risks associated with investing in real estate assets including changes in business conditions and the general economy. The forward-looking statements are based on management’s beliefs, assumptions and expectations of future performance, taking into account all information currently available to ARI. Forward-looking statements are not predictions of future events. These beliefs, assumptions and expectations can change as a result of many possible events or factors, not all of which are known to ARI. Some of these factors are described under “Risk Factors,” and “Management’s Discussion and Analysis of Financial Condition and Results of Operations” included in ARI’s Annual Report on Form 10-K for the year ended December 31, 2022 and other filings with the Securities and Exchange Commission (“SEC”), which are accessible on the SEC’s website at www.sec.gov. If a change occurs, ARI’s business, financial condition, liquidity and results of operations may vary materially from those expressed in ARI’s forward-looking statements. Any forward-looking statement speaks only as of the date on which it is made. New risks and uncertainties arise over time, and it is not possible for management to predict those events or how they may affect ARI. Except as required by law, ARI is not obligated to, and does not intend to, update or revise any forward-looking statements, whether as a result of new information, future events or otherwise. This presentation contains information regarding ARI’s financial results that is calculated and presented on the basis of methodologies other than in accordance with accounting principles generally accepted in the United States (“GAAP”), including Distributable Earnings and Distributable Earnings per share. Please refer to page 21 for a definition of “Distributable Earnings” and the reconciliation of the applicable GAAP financial measures to non-GAAP financial measures set forth on page 20. This presentation may contain statistics and other data that in some cases has been obtained from or compiled from information made available by third-party service providers. ARI makes no representation or warranty, expressed or implied, with respect to the accuracy, reasonableness or completeness of such information. Past performance is not indicative nor a guarantee of future returns. Index performance and yield data are shown for illustrative purposes only and have limitations when used for comparison or for other purposes due to, among other matters, volatility, credit or other factors (such as number and types of securities). Indices are unmanaged, do not charge any fees or expenses, assume reinvestment of income and do not employ special investment techniques such as leveraging or short selling. No such index is indicative of the future results of any investment by ARI. Unless the context requires otherwise, references in this presentation to “Apollo” refer to Apollo Global Management, Inc., together with its subsidiaries, and references in this presentation to the “Manager” refer to ACREFI Management, LLC, an indirect subsidiary of Apollo Global Management, Inc. Private and Confidential 2
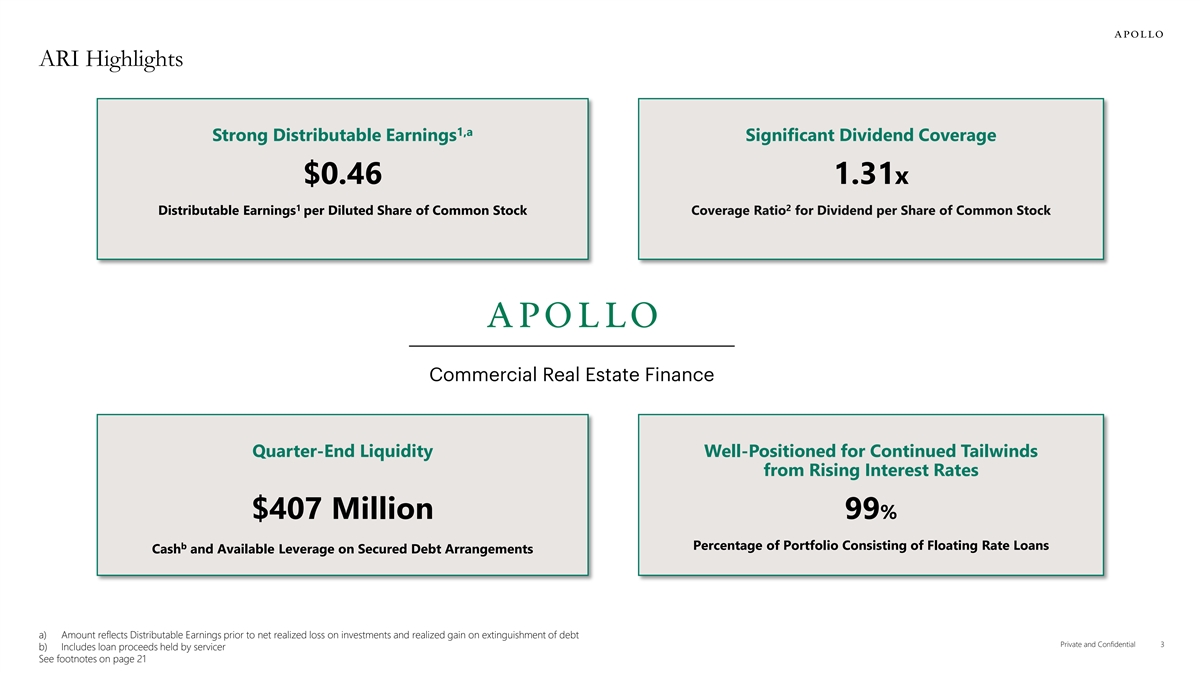
ARI Highlights 1,a Strong Distributable Earnings Significant Dividend Coverage $0.46 1.31x 1 2 Distributable Earnings per Diluted Share of Common Stock Coverage Ratio for Dividend per Share of Common Stock Quarter-End Liquidity Well-Positioned for Continued Tailwinds from Rising Interest Rates $407 Million 99% b Percentage of Portfolio Consisting of Floating Rate Loans Cash and Available Leverage on Secured Debt Arrangements a) Amount reflects Distributable Earnings prior to net realized loss on investments and realized gain on extinguishment of debt Private and Confidential 3 b) Includes loan proceeds held by servicer See footnotes on page 21

Summary Results Ø Net loss attributable to common stockholders of ($86) million, or ($0.62) per diluted share of common stock 1,a Ø Distributable Earnings of $66 million, or $0.46 per diluted share of common stock Q2 Financial Results 4 Ø Declared common stock dividends of $0.35 per share for Q2 2023, which implies a dividend yield of 11.8% Ø Recorded an increase to our Specific CECL allowance of $141 million in relation to an ultra-luxury residential property in Manhattan, NY; § Net $60 million increase to Specific CECL allowance after recognizing realized loss on investment of $82 million in relation to the same property 6,b Ø Total loan portfolio of $8.3 billion with w/a unlevered all-in yield of 8.6% – 94% first mortgages and 99% floating rate Ø Weighted-average risk rating of 3.1 Ø Funded $174 million year-to-date in connection with the refinancing of two floating rate first mortgage loans Loan Portfolio 5 Ø Gross add-on fundings of $245 million year-to-date, $131 million in Q2 Ø Received $595 million from loan repayments year-to-date, $243 million in Q2 Ø Includes $175 million year-to-date of proceeds from loans secured by offices Ø Received $140 million of proceeds from loan sales year-to-date Ø Closed a new secured credit facility with Churchill in Q2 with a total capacity of $130 million c Ø Ended quarter with total common equity book value of $2.1 billion Capitalization d Ø Ended quarter with $407 million of total liquidity Ø Repurchased $37 million of October 2023 Convertible Notes at a price of 99.3% Ø Received $20 million full repayment of a subordinate loan secured by a hotel property in Las Vegas, NV Subsequent Events Ø Received $9 million of net proceeds from a condo sale related to our loans secured by a residential-for-sale property in Manhattan, NY a) Amount reflects Distributable Earnings prior to net realized loss on investments and realized gain on extinguishment of debt b) Excludes benefit of forward points on currency hedges related to loans denominated in currencies other than USD c) Reflects book value per share (excluding General CECL Allowance and depreciation) of $14.80 multiplied by shares of common stock outstanding d) Includes cash, loan proceeds held by servicer, and available leverage on our secured debt arrangements Private and Confidential 4 See footnotes on page 21

Per Share Overview 1,a Distributable Earnings per Share $0.35 9 Book Value per Share 1,a 9 Book Value per Share Roll Forward General CECL BVPS excl. General CECL BVPS Allowance & Depreciation Allowance & Depreciation December 31, 2022 $15.54 ($0.24) $15.78 (+) Earnings in excess of dividends $0.27 - $0.27 (-) Net realized loss on investments ($0.61) - ($0.61) General CECL Allowance & Depreciation § b (-) Net loss on currency and interest hedges ($0.09) - ($0.09) BVPS Post-General CECL Allowance & Depreciation § (-) Change in General CECL Allowance & Depreciation ($0.09) ($0.09) - (-) Change in Specific CECL Allowance ($0.42) - ($0.42) (-) Vesting and delivery of RSUs ($0.14) - ($0.14) c (+) Other $0.01 - $0.01 8 Change during period ($1.07) ($0.09) ($0.98) June 30, 2023 $14.47 ($0.33) $14.80 a) Amount reflects Distributable Earnings, prior to net realized losses on investments and realized gain on extinguishment of debt b) Includes net unrealized loss on forward currency contracts and interest hedges, and realized gain on forward currency contracts related to principal outside impact of forward points Private and Confidential 5 c) Includes realized gain on extinguishment of convertible notes See footnotes on page 21
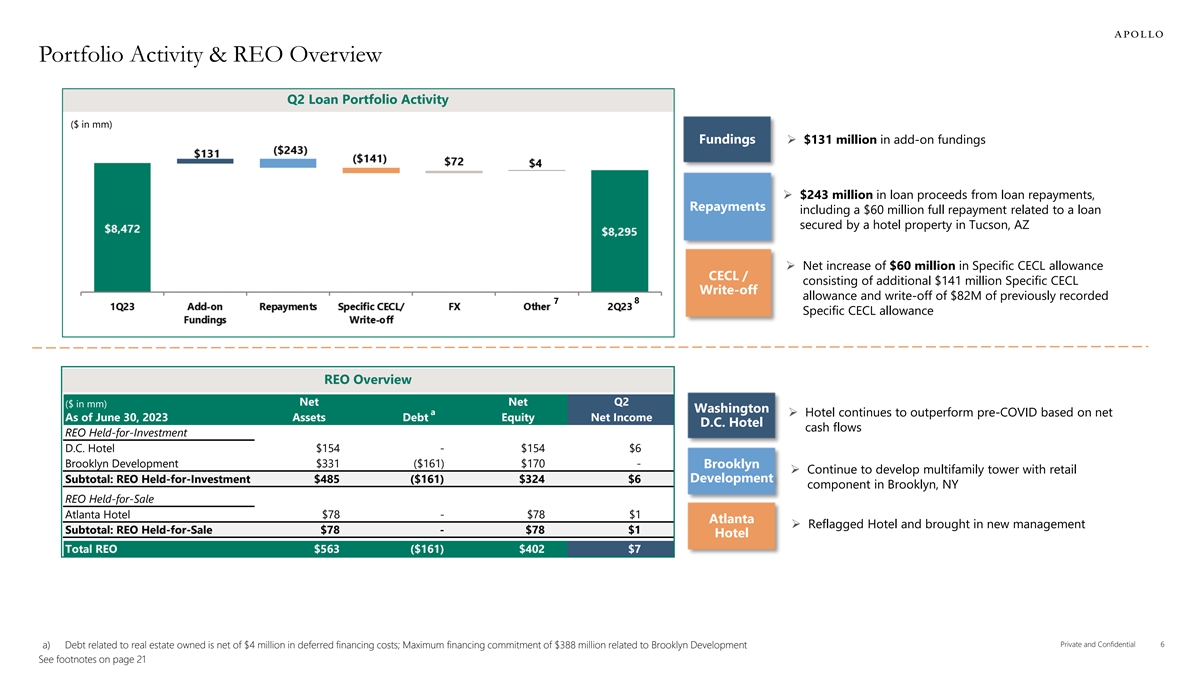
Portfolio Activity & REO Overview Q2 Loan Portfolio Activity ($ in mm) FundingsØ $131 million in add-on fundings Ø $243 million in loan proceeds from loan repayments, Repayments including a $60 million full repayment related to a loan secured by a hotel property in Tucson, AZ Ø Net increase of $60 million in Specific CECL allowance CECL / consisting of additional $141 million Specific CECL Write-off allowance and write-off of $82M of previously recorded 7 8 Specific CECL allowance REO Overview Net Net Q2 ($ in mm) Washington a Ø Hotel continues to outperform pre-COVID based on net As of June 30, 2023 Assets Debt Equity Net Income D.C. Hotel cash flows REO Held-for-Investment D.C. Hotel $154 - $154 $6 Brooklyn Development $331 ($161) $170 - Brooklyn Ø Continue to develop multifamily tower with retail Development Subtotal: REO Held-for-Investment $485 ($161) $324 $6 component in Brooklyn, NY REO Held-for-Sale Atlanta Hotel $78 - $78 $1 Atlanta Ø Reflagged Hotel and brought in new management Subtotal: REO Held-for-Sale $78 - $78 $1 Hotel Total REO $563 ($161) $402 $7 Private and Confidential 6 a) Debt related to real estate owned is net of $4 million in deferred financing costs; Maximum financing commitment of $388 million related to Brooklyn Development See footnotes on page 21

Capital Structure Overview Capital Structure Composition Conservative Capital Management Strategy ($ in mm) $857 Million of Unencumbered ~71% Weighted Average Available 3 e Real Estate Assets Advance Rate 10 11 a,b,c 2.9x Debt to Equity Ratio 1.5x Fixed Charge Coverage Secured Debt Obligations $5,379 (58%) Corporate Debt Maturities Debt Related to Real Estate Owned $165 (2%) Term Senior $1,273 Loan B Notes (13%) $773 (8%) $500 (5%) $186 (2%) Convertible Notes $169 (2%) Preferred Stock $2,092 (23%) d Common Equity Book Value a) Weighted-average rates of applicable benchmark rates and credit spread adjustments plus spreads of USD: +2.45% / GBP: +1.99% / EUR: +1.65% / SEK: +1.50% b) Our secured credit facilities do not contain capital markets-based mark-to-market provisions. c) Consists of nine secured credit facility counterparties, one revolving credit facility and one private securitization d) Reflects book value per share (excluding General CECL Allowance and depreciation) of $14.80 multiplied by shares of common stock outstanding Private and Confidential 7 e) Based on maximum available advance rates across secured debt counterparties See footnotes on page 21

Loan Portfolio Overview W/A Unlevered All-in Yield Number of Loans Carrying Value 6,12,a on Loan Portfolio 53 $8.3 billion 8.6% W/A Remaining Fully-Extended 12 12,b W/A Portfolio Risk Rating W/A Portfolio Loan-to-Value 12,15 Term 3.1 57% 2.6 Years 12 12 12 Collateral Diversification Origination Vintage Loan Position 13 c d a) Excludes benefit of forward points on currency hedges related to loans denominated in currencies other than USD b) Weighted average loan-to-value (“LTV”) reflects the LTV at the time the loan was originated; excludes risk-rated 5 loans c) Other property types include: Parking Garages (3%), Caravan Parks (2%), and Urban Predevelopment (1%) Private and Confidential 8 d) Retail property types include: Outlet Center (6%), Retail Distribution Warehouse (5%), Urban Retail (3%), and Lifestyle Center (3%) See footnotes on page 21
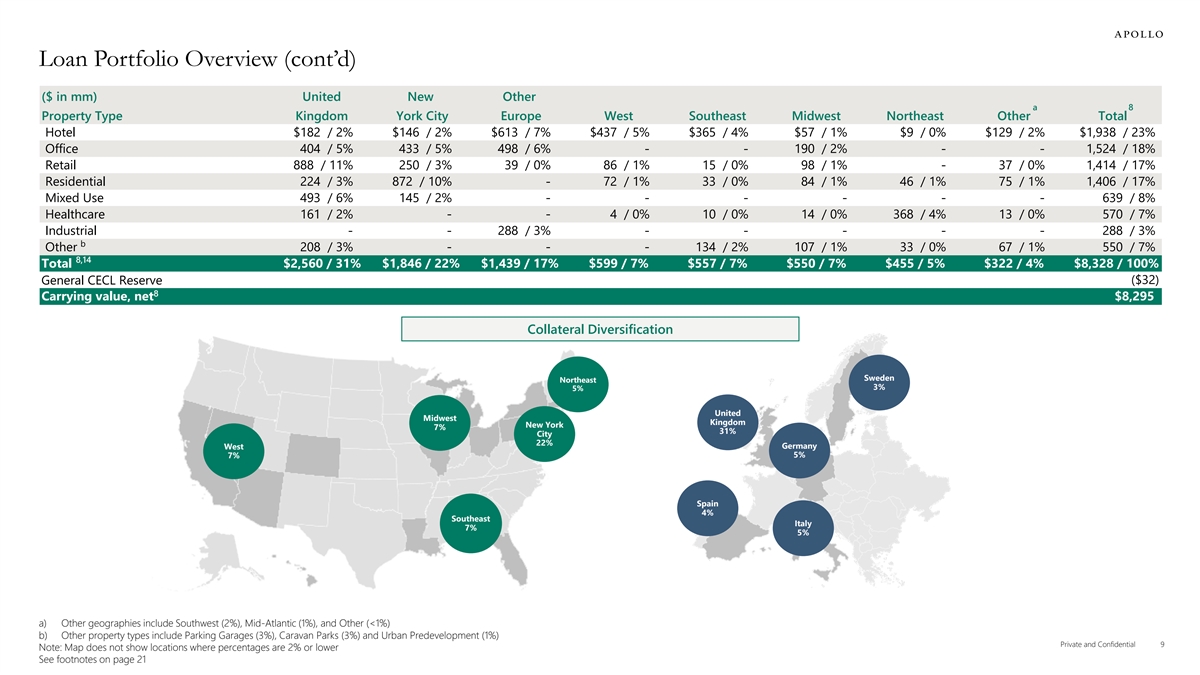
Loan Portfolio Overview (cont’d) ($ in mm) United New Other a 8 Property Type Kingdom York City Europe West Southeast Midwest Northeast Other Total Hotel $182 / 2% $146 / 2% $613 / 7% $437 / 5% $365 / 4% $57 / 1% $9 / 0% $129 / 2% $1,938 / 23% Office 404 / 5% 433 / 5% 498 / 6% - - 190 / 2% - - 1,524 / 18% Retail 888 / 11% 250 / 3% 39 / 0% 86 / 1% 15 / 0% 98 / 1% - 37 / 0% 1,414 / 17% Residential 224 / 3% 872 / 10% - 72 / 1% 33 / 0% 84 / 1% 46 / 1% 75 / 1% 1,406 / 17% Mixed Use 493 / 6% 145 / 2% - - - - - - 639 / 8% Healthcare 161 / 2% - - 4 / 0% 10 / 0% 14 / 0% 368 / 4% 13 / 0% 570 / 7% Industrial - - 288 / 3% - - - - - 288 / 3% b Other 208 / 3% - - - 134 / 2% 107 / 1% 33 / 0% 67 / 1% 550 / 7% 8,14 Total $2,560 / 31% $1,846 / 22% $1,439 / 17% $599 / 7% $557 / 7% $550 / 7% $455 / 5% $322 / 4% $8,328 / 100% ($32) General CECL Reserve 8 Carrying value, net $8,295 Collateral Diversification Sweden Northeast 3% 5% United Midwest Kingdom New York 7% 31% City 22% Germany West 5% 7% Spain 4% Southeast Italy 7% 5% a) Other geographies include Southwest (2%), Mid-Atlantic (1%), and Other (<1%) b) Other property types include Parking Garages (3%), Caravan Parks (3%) and Urban Predevelopment (1%) Private and Confidential 9 Note: Map does not show locations where percentages are 2% or lower See footnotes on page 21
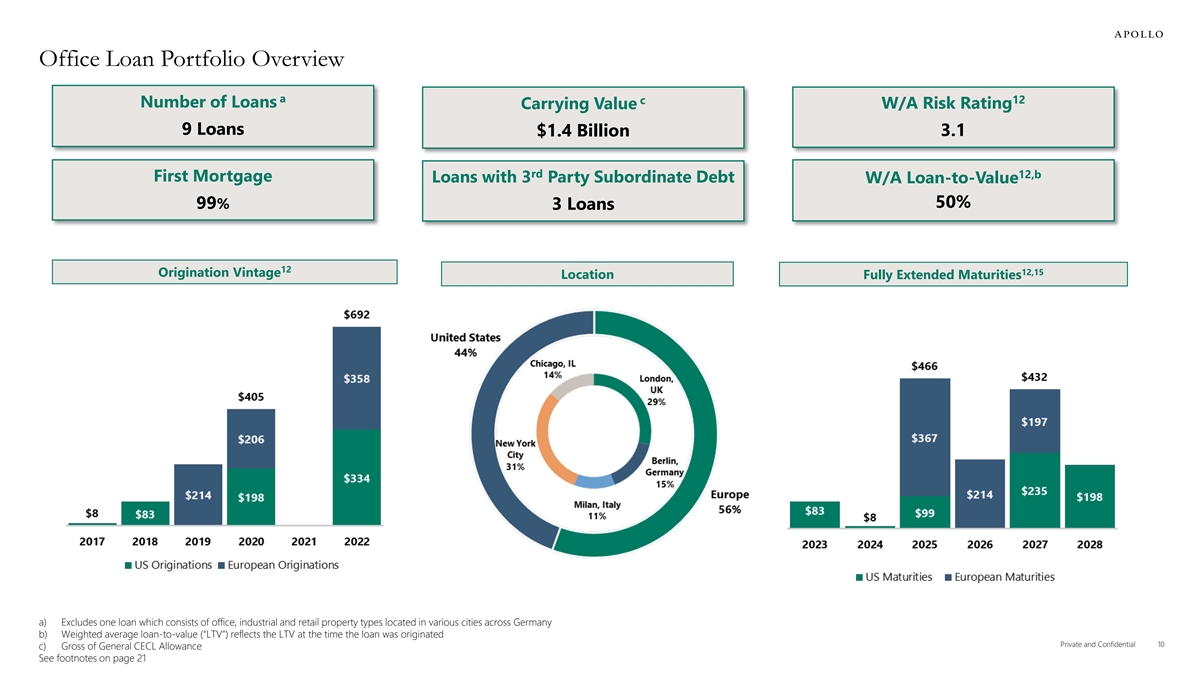
Office Loan Portfolio Overview a c 12 Number of Loans W/A Risk Rating Carrying Value 9 Loans $1.4 Billion 3.1 rd 12,b First Mortgage Loans with 3 Party Subordinate Debt W/A Loan-to-Value 50% 99% 3 Loans 12 12,15 Origination Vintage Location Fully Extended Maturities a) Excludes one loan which consists of office, industrial and retail property types located in various cities across Germany b) Weighted average loan-to-value (“LTV”) reflects the LTV at the time the loan was originated Private and Confidential 10 c) Gross of General CECL Allowance See footnotes on page 21

Mitigating Foreign Exchange Risk ARI proactively mitigates foreign exchange risk in our non-US loan portfolio and facilities Foreign Exchange Rate Change (Local/USD) % FX Change YoY GBP: 4% EUR: 4% SEK: (5%) Mitigating Foreign Exchange Risk Ø Secured debt arrangements are structured in local currency thereby reducing FX exposure to our net equity on foreign loans. As of June 30, 2023 the percentage of net equity to total foreign denominated carrying value was 29%, or $1.1 billion § 71% weighted average advance on total foreign loan portfolio a § 73% weighted average advance on foreign loans with secured debt financing Ø Net equity and net interest income of foreign loans are economically hedged through forward currency contracts § Forward point impact on forward currency contracts resulted in a $0.1 million realized gain in Q2 2023 Q2 Change in Unrealized Gain (Loss) on Net Equity ($ in mm) As of June 30, 2023 Q2 2023 Net ($ in mm) b c Carrying Value Unrealized Gain Currency Secured Debt Net Equity Offset by local currency GBP $2,553 ($1,794) $758 $21 denominated secured debt 71% arrangements EUR $1,196 ($855) $341 $2 SEK $237 ($191) $45 ($2) Hedged with forward currency 29% contracts Total $3,985 ($2,841) $1,144 $22 d d Change in unrealized gain (loss) on forward contracts ($16) a) Weighted average advance based on carrying value of first mortgage loans with secured debt financing b) Carrying value includes all commercial mortgage and subordinate loans denominated in foreign currencies with or without secured debt financing Private and Confidential 11 c) Represents change in unrealized gain (losses) on foreign loans of $22 million net of unrealized losses of ($16) million on respective foreign secured debt arrangements for the quarter ended June 30, 2023 d) Represents net change in unrealized gain (loss) on forward contracts for the quarter ended June 30 2023, excluding gains (losses) on forward currency contracts economically hedging foreign currency interest

Loan Maturities and Future Funding Profile 15,16,17 Fully-Extended Loan Maturities and Expected Future Fundings by Net Equity ($ in mm) a a 18,b Net Interest Income Sensitivity to Benchmark Rates Benchmark Rates Index Jun-30 Jul-28 SOFR 1M 5.14% 5.32% EURIBOR 3.58% 3.73% SONIA ON 4.93% 4.93% Note: Assumes future financing, in certain cases, against mortgages that are not currently financed. There is no assurance such future financing against mortgages that are not currently financed will occur a) Net of expected secured credit facility advances Private and Confidential 12 b) Reflects incremental increases in respective benchmark rates as of June 30, 2023 (SOFR 1 month: 5.14%, EURIBOR 3.58% and SONIA ON: 4.93% adjusted for compounding) See footnotes on page 21

Senior Loan Portfolio (1 of 3) ($ in mm) Origination Amortized Unfunded Construction 3rd Party Fully-extended 15 Location Hotel Date Cost Commitments Loan Subordinate Debt Maturity Various, Spain Loan 1 10/2019 $345 $26 Y 08/2024 Various, UK/Ireland Loan 2 11/2021 223 15 Y 11/2026 Napa Valley, CA Loan 3 05/2022 179 26 Y 06/2027 Loan 4 07/2021 169 10 08/2026 Various, US St. Thomas, USVI Loan 5 11/2021 164 - 12/2026 Manhattan, NY Loan 6 09/2015 146 - 06/2024 Honolulu, HI Loan 7 04/2018 137 - 04/2024 Puglia, Italy Loan 8 08/2019 131 - 08/2024 New Orleans, LA Loan 9 10/2021 100 - 11/2026 Rome, Italy Loan 10 06/2022 98 - 06/2025 Vail, CO Loan 11 11/2018 90 - 12/2023 Chicago, IL Loan 12 05/2019 46 - 12/2025 St. Thomas, USVI Loan 13 12/2015 42 - 08/2024 Pittsburgh, PA Loan 14 02/2018 27 - 11/2024 Subtotal - Hotel $1,897 $77 Office Manhattan, NY Loan 15 03/2022 $235 $31 Y 04/2027 Berlin, Germany Loan 16 06/2019 214 4 08/2026 London, UK Loan 17 02/2020 206 - 02/2025 Long Island City, NY Loan 18 01/2020 198 52 Y 03/2028 London, UK Loan 19 02/2022 197 385 Y 02/2027 Milan, Italy Loan 20 02/2022 160 - 06/2025 Chicago, IL Loan 21 11/2022 99 - 01/2025 a Chicago, IL Loan 22 03/2018 83 - Y 07/2023 Subtotal - Office $1,392 $472 a) Loan matured in July 2023. Execution of extension is currently in process. Private and Confidential 13 See footnotes on page 21
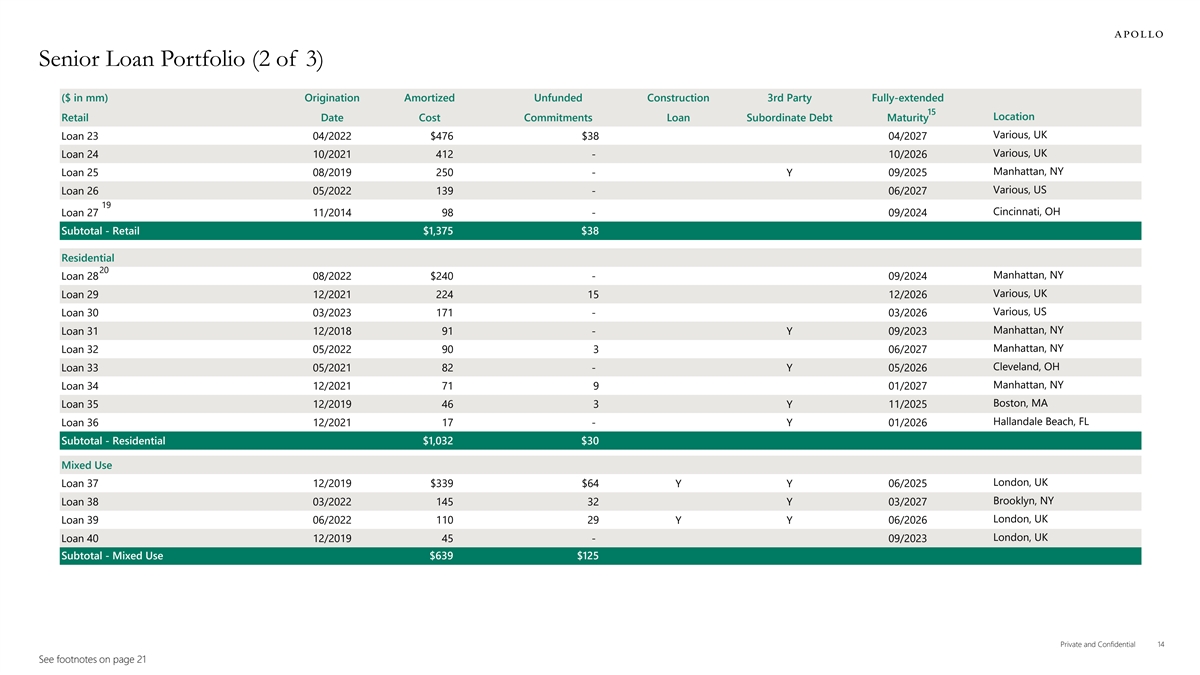
Senior Loan Portfolio (2 of 3) ($ in mm) Origination Amortized Unfunded Construction 3rd Party Fully-extended 15 Location Retail Date Cost Commitments Loan Subordinate Debt Maturity Various, UK Loan 23 04/2022 $476 $38 04/2027 Loan 24 10/2021 412 - 10/2026 Various, UK Manhattan, NY Loan 25 08/2019 250 - Y 09/2025 Various, US Loan 26 05/2022 139 - 06/2027 19 Cincinnati, OH Loan 27 11/2014 98 - 09/2024 Subtotal - Retail $1,375 $38 Residential 20 Manhattan, NY Loan 28 08/2022 $240 - 09/2024 Various, UK Loan 29 12/2021 224 15 12/2026 Various, US Loan 30 03/2023 171 - 03/2026 Manhattan, NY Loan 31 12/2018 91 - Y 09/2023 Manhattan, NY Loan 32 05/2022 90 3 06/2027 Cleveland, OH Loan 33 05/2021 82 - Y 05/2026 Manhattan, NY Loan 34 12/2021 71 9 01/2027 Boston, MA Loan 35 12/2019 46 3 Y 11/2025 Hallandale Beach, FL Loan 36 12/2021 17 - Y 01/2026 Subtotal - Residential $1,032 $30 Mixed Use London, UK Loan 37 12/2019 $339 $64 Y Y 06/2025 Brooklyn, NY Loan 38 03/2022 145 32 Y 03/2027 London, UK Loan 39 06/2022 110 29 Y Y 06/2026 London, UK Loan 40 12/2019 45 - 09/2023 Subtotal - Mixed Use $639 $125 Private and Confidential 14 See footnotes on page 21
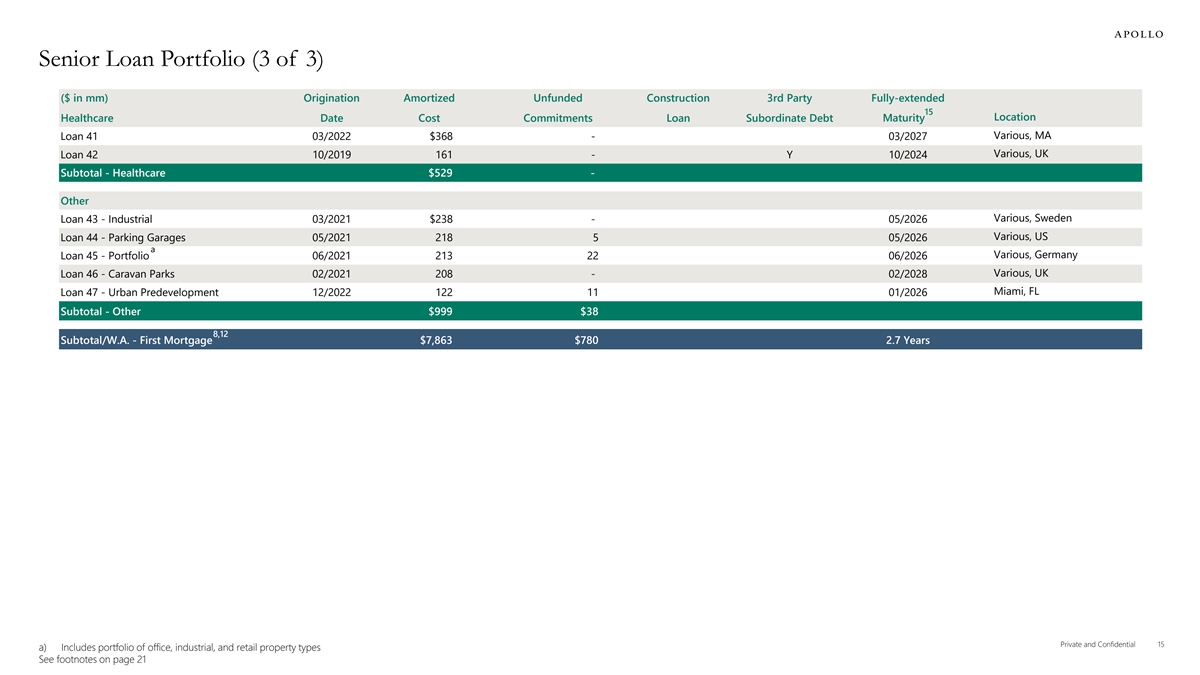
Senior Loan Portfolio (3 of 3) ($ in mm) Origination Amortized Unfunded Construction 3rd Party Fully-extended 15 Maturity Location Healthcare Date Cost Commitments Loan Subordinate Debt Various, MA Loan 41 03/2022 $368 - 03/2027 Various, UK Loan 42 10/2019 161 - Y 10/2024 Subtotal - Healthcare $529 - Other Various, Sweden Loan 43 - Industrial 03/2021 $238 - 05/2026 Various, US Loan 44 - Parking Garages 05/2021 218 5 05/2026 a Various, Germany Loan 45 - Portfolio 06/2021 213 22 06/2026 Various, UK Loan 46 - Caravan Parks 02/2021 208 - 02/2028 Miami, FL Loan 47 - Urban Predevelopment 12/2022 122 11 01/2026 Subtotal - Other $999 $38 8,12 Subtotal/W.A. - First Mortgage $7,863 $780 2.7 Years Private and Confidential 15 a) Includes portfolio of office, industrial, and retail property types See footnotes on page 21

Subordinate Loan Portfolio ($ in mm) Origination Amortized Unfunded Construction 3rd Party Fully-extended 15 Residential Date Cost Commitments Loan Subordinate Debt Maturity Location 20 Manhattan, NY Loan 48 - Residential 06/2015 $203 - 09/2024 19,20 Manhattan, NY Loan 49 - Residential 05/2020 170 - 09/2024 Subtotal - Residential $373 - Other a Various, US Loan 50 - Healthcare 07/2019 $41 - 06/2024 Phoenix, AZ Loan 51 - Hotel 06/2015 23 - 07/2025 Las Vegas, NV Loan 52 - Hotel 06/2018 20 - 08/2023 Troy, MI Loan 53 - Office 08/2017 8 - 09/2024 Subtotal - Other $92 - 8,12 Total/W.A. - Subordinate $465 - 1.2 Years 8,12,14 Total/W.A. - Portfolio $8,328 $780 2.6 Years General CECL Reserve ($32) 8 Total Carrying Value, Net $8,295 Private and Confidential 16 a) In the form of a single-asset, single-borrower CMBS See footnotes on page 21

Appendix - Consolidated Balance Sheets - Consolidated Statement of Operations - Reconciliation of GAAP Net Income to Distributable Earnings Private and Confidential 17

Consolidated Balance Sheets (in thousands - except share data) June 30, 2023 December 31, 2022 Assets: $308,052 $222,030 Cash and cash equivalents a,c 7,831,859 8,121,109 Commercial mortgage loans, net b,c 463,569 560,881 Subordinate loans and other lending assets, net 478,581 302,688 Real estate owned, held for investment, net 135,731 70,607 Other assets Assets related to real estate owned, held for sale 79,021 162,397 63,546 128,640 Derivative assets, net Total Assets $9,360,359 $9,568,352 Liabilities and Stockholders' Equity Liabilities: $5,365,427 $5,296,825 Secured debt arrangements, net 761,605 763,813 Senior secured term loan, net 495,238 494,844 Senior secured notes, net 185,869 229,361 Convertible senior notes, net d 165,473 227,360 Accounts payable, accrued expenses and other liabilities Debt related to real estate owned, held for investment, net 160,928 160,294 Participations sold - 25,130 Payable to related party 9,390 9,728 Liabilities related to real estate owned, held for sale 1,438 6,493 Total Liabilities $7,145,368 $7,213,848 Stockholders’ Equity: Preferred stock, $0.01 par value, 50,000,000 shares authorized, Series B-1, 6,770,393 shares issued and outstanding ($169,260 liquidation preference) in 2023 and 2022 $68 $68 Common stock, $0.01 par value, 450,000,000 shares authorized, 141,343,177 and 140,595,995 shares issued and outstanding in 2023 and 2022, respectively 1,413 1,406 Additional paid-in-capital 2,718,920 2,716,907 Accumulated deficit (505,410) (363,877) $2,214,991 $2,354,504 Total Stockholders’ Equity Total Liabilities and Stockholders’ Equity $9,360,359 $9,568,352 a) Includes $7,498,831 and $7,482,658 pledged as collateral under secured debt arrangements in 2023 and 2022, respectively. b) Includes $203,148 and $191,608 pledged as collateral under secured debt arrangements in 2023 and 2022, respectively. c) Net of $225,276 and $159,724 CECL Allowances in 2023 and 2022, respectively, comprised of $193,000 and $133,500 Specific CECL Allowance and $32,276 and $26,224 General CECL Allowance, respectively. d) Includes $4,834 and $4,347 of General CECL Allowance related to unfunded commitments on commercial mortgage loans, subordinate loans and other lending assets, net in 2023 and 2022, respectively. Private and Confidential 18 See footnotes on page 21
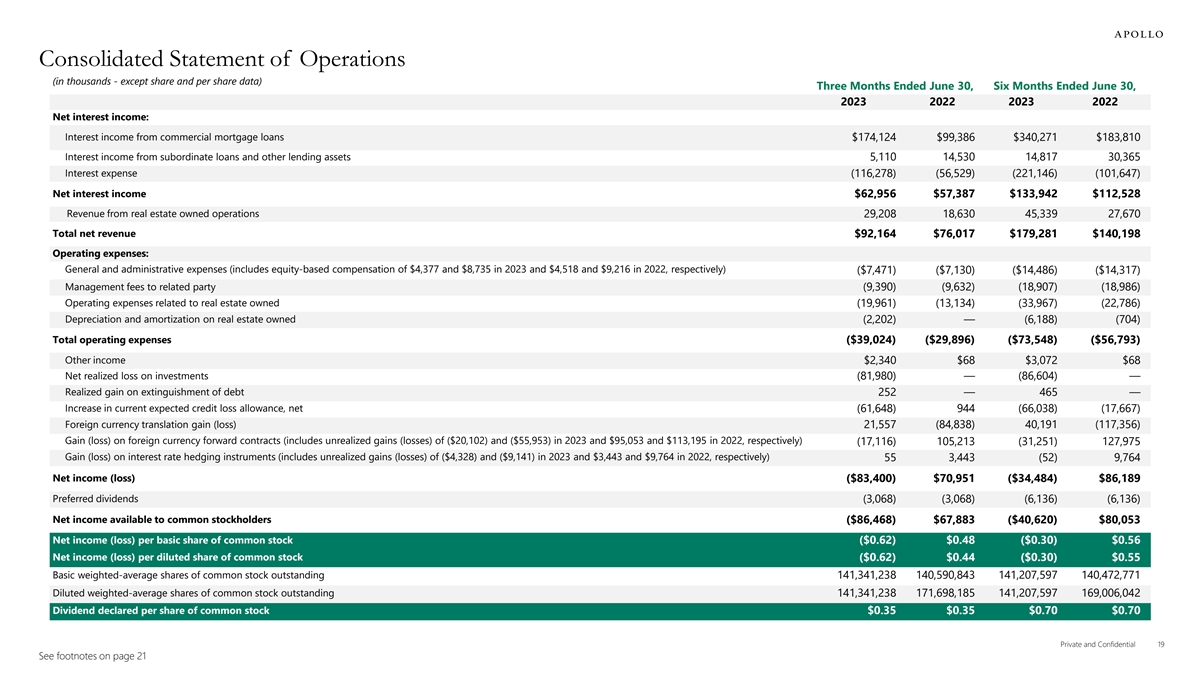
Consolidated Statement of Operations (in thousands - except share and per share data) Three Months Ended June 30, Six Months Ended June 30, 2023 2022 2023 2022 Net interest income: Interest income from commercial mortgage loans $174,124 $99,386 $340,271 $183,810 Interest income from subordinate loans and other lending assets 5,110 14,530 14,817 30,365 Interest expense (116,278) (56,529) (221,146) (101,647) Net interest income $62,956 $57,387 $133,942 $112,528 Revenue from real estate owned operations 29,208 18,630 45,339 27,670 Total net revenue $92,164 $76,017 $179,281 $140,198 Operating expenses: General and administrative expenses (includes equity-based compensation of $4,377 and $8,735 in 2023 and $4,518 and $9,216 in 2022, respectively) ($7,471) ($7,130) ($14,486) ($14,317) Management fees to related party (9,390) (9,632) (18,907) (18,986) Operating expenses related to real estate owned (19,961) (13,134) (33,967) (22,786) Depreciation and amortization on real estate owned (2,202) — (6,188) (704) Total operating expenses ($39,024) ($29,896) ($73,548) ($56,793) Other income $2,340 $68 $3,072 $68 Net realized loss on investments (81,980) — (86,604) — Realized gain on extinguishment of debt 252 — 465 — Increase in current expected credit loss allowance, net (61,648) 944 (66,038) (17,667) Foreign currency translation gain (loss) 21,557 (84,838) 40,191 (117,356) Gain (loss) on foreign currency forward contracts (includes unrealized gains (losses) of ($20,102) and ($55,953) in 2023 and $95,053 and $113,195 in 2022, respectively) (17,116) 105,213 (31,251) 127,975 Gain (loss) on interest rate hedging instruments (includes unrealized gains (losses) of ($4,328) and ($9,141) in 2023 and $3,443 and $9,764 in 2022, respectively) 55 3,443 (52) 9,764 Net income (loss) ($83,400) $70,951 ($34,484) $86,189 Preferred dividends (3,068) (3,068) (6,136) (6,136) Net income available to common stockholders ($86,468) $67,883 ($40,620) $80,053 Net income (loss) per basic share of common stock ($0.62) $0.48 ($0.30) $0.56 Net income (loss) per diluted share of common stock ($0.62) $0.44 ($0.30) $0.55 Basic weighted-average shares of common stock outstanding 141,341,238 140,590,843 141,207,597 140,472,771 Diluted weighted-average shares of common stock outstanding 141,341,238 171,698,185 141,207,597 169,006,042 Dividend declared per share of common stock $0.35 $0.35 $0.70 $0.70 Private and Confidential 19 See footnotes on page 21

1 Reconciliation of GAAP Net Income to Distributable Earnings (in thousands - except share and per share data) Three Months Ended June 30, Six Months Ended June 30, 1 Distributable Earnings : 2023 2022 2023 2022 Net income available to common stockholders: ($86,468) $67,883 ($40,620) $80,053 Adjustments: Equity-based compensation expense 4,377 4,518 8,735 9,216 Loss (gain) on foreign currency forwards 17,116 (105,213) 31,251 (127,975) Foreign currency (gain) loss, net (21,557) 84,838 (40,191) 117,356 Unrealized loss (gain) on interest rate cap 4,328 (3,443) 9,141 (9,764) Realized gains relating to interest income on foreign currency hedges, net 2,341 1,428 7,074 5,112 Realized gains relating to forward points on foreign currency hedges, net 76 394 5,677 6,623 Depreciation and amortization on real estate owned 2,202 — 6,188 704 Increase in current expected credit loss allowance, net 61,648 (944) 66,038 17,667 Realized gain on extinguishment of debt (252) — (465) — Net realized loss on investments 81,980 — 86,604 — Total adjustments 152,259 (18,422) 180,052 18,939 1 $65,791 $49,461 $139,432 $98,992 Distributable Earnings prior to net realized loss on investments and realized gain on extinguishment of debt Net realized loss on investments (81,980) — (86,604) — Realized gain on extinguishment of debt 252 — 465 — 1 Distributable Earnings ($15,937) $49,461 $53,293 $98,992 1 Weighted-average diluted shares – Distributable Earnings Weighted-average diluted shares – GAAP 141,341,238 171,698,185 141,207,597 169,006,042 Potential shares issued under conversion of the Convertible Notes — (28,533,271) — (28,533,271) Weighted-average unvested RSUs 2,849,286 — 3,034,394 2,738,424 1 Weighted-average diluted shares – Distributable Earnings 144,190,524 143,164,914 144,241,991 143,211,195 1 Diluted Distributable Earnings per share prior to net realized loss on investments and realized gain on $0.46 $0.35 $0.97 $0.69 extinguishment of debt 1 Diluted Distributable Earnings per share of common stock ($0.11) $0.35 $0.37 $0.69 Private and Confidential 20 See footnotes on page 21
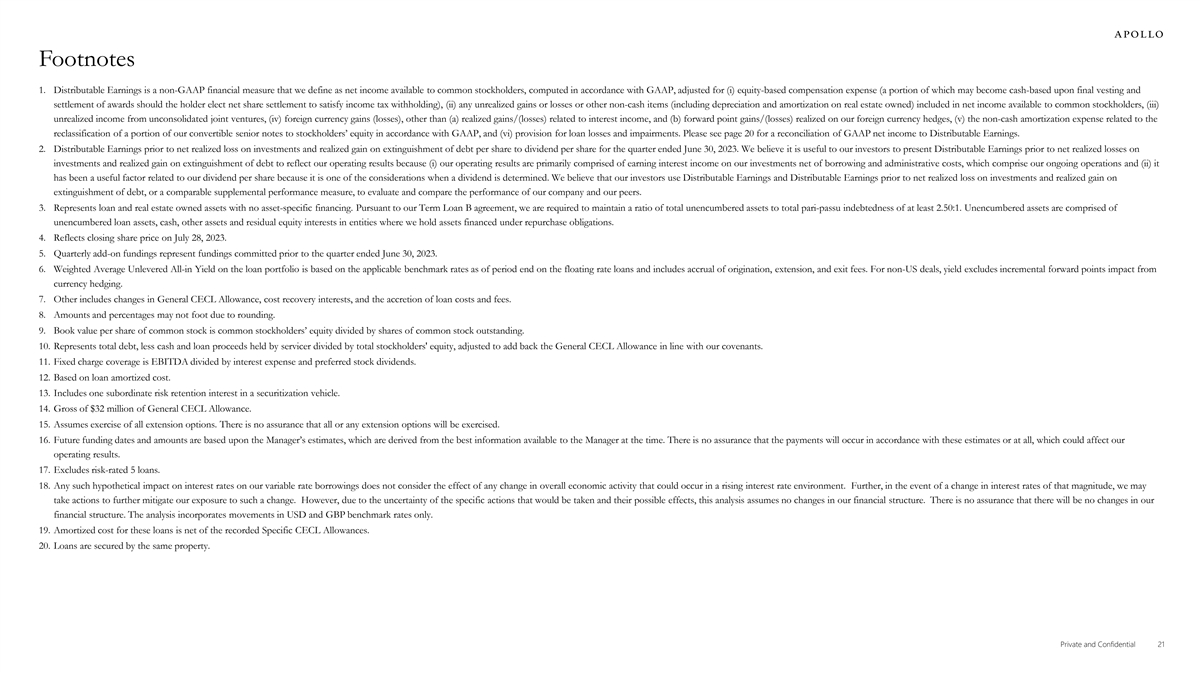
Footnotes 1. Distributable Earnings is a non-GAAP financial measure that we define as net income available to common stockholders, computed in accordance with GAAP, adjusted for (i) equity-based compensation expense (a portion of which may become cash-based upon final vesting and settlement of awards should the holder elect net share settlement to satisfy income tax withholding), (ii) any unrealized gains or losses or other non-cash items (including depreciation and amortization on real estate owned) included in net income available to common stockholders, (iii) unrealized income from unconsolidated joint ventures, (iv) foreign currency gains (losses), other than (a) realized gains/(losses) related to interest income, and (b) forward point gains/(losses) realized on our foreign currency hedges, (v) the non-cash amortization expense related to the reclassification of a portion of our convertible senior notes to stockholders’ equity in accordance with GAAP, and (vi) provision for loan losses and impairments. Please see page 20 for a reconciliation of GAAP net income to Distributable Earnings. 2. Distributable Earnings prior to net realized loss on investments and realized gain on extinguishment of debt per share to dividend per share for the quarter ended June 30, 2023. We believe it is useful to our investors to present Distributable Earnings prior to net realized losses on investments and realized gain on extinguishment of debt to reflect our operating results because (i) our operating results are primarily comprised of earning interest income on our investments net of borrowing and administrative costs, which comprise our ongoing operations and (ii) it has been a useful factor related to our dividend per share because it is one of the considerations when a dividend is determined. We believe that our investors use Distributable Earnings and Distributable Earnings prior to net realized loss on investments and realized gain on extinguishment of debt, or a comparable supplemental performance measure, to evaluate and compare the performance of our company and our peers. 3. Represents loan and real estate owned assets with no asset-specific financing. Pursuant to our Term Loan B agreement, we are required to maintain a ratio of total unencumbered assets to total pari-passu indebtedness of at least 2.50:1. Unencumbered assets are comprised of unencumbered loan assets, cash, other assets and residual equity interests in entities where we hold assets financed under repurchase obligations. 4. Reflects closing share price on July 28, 2023. 5. Quarterly add-on fundings represent fundings committed prior to the quarter ended June 30, 2023. 6. Weighted Average Unlevered All-in Yield on the loan portfolio is based on the applicable benchmark rates as of period end on the floating rate loans and includes accrual of origination, extension, and exit fees. For non-US deals, yield excludes incremental forward points impact from currency hedging. 7. Other includes changes in General CECL Allowance, cost recovery interests, and the accretion of loan costs and fees. 8. Amounts and percentages may not foot due to rounding. 9. Book value per share of common stock is common stockholders’ equity divided by shares of common stock outstanding. 10. Represents total debt, less cash and loan proceeds held by servicer divided by total stockholders' equity, adjusted to add back the General CECL Allowance in line with our covenants. 11. Fixed charge coverage is EBITDA divided by interest expense and preferred stock dividends. 12. Based on loan amortized cost. 13. Includes one subordinate risk retention interest in a securitization vehicle. 14. Gross of $32 million of General CECL Allowance. 15. Assumes exercise of all extension options. There is no assurance that all or any extension options will be exercised. 16. Future funding dates and amounts are based upon the Manager’s estimates, which are derived from the best information available to the Manager at the time. There is no assurance that the payments will occur in accordance with these estimates or at all, which could affect our operating results. 17. Excludes risk-rated 5 loans. 18. Any such hypothetical impact on interest rates on our variable rate borrowings does not consider the effect of any change in overall economic activity that could occur in a rising interest rate environment. Further, in the event of a change in interest rates of that magnitude, we may take actions to further mitigate our exposure to such a change. However, due to the uncertainty of the specific actions that would be taken and their possible effects, this analysis assumes no changes in our financial structure. There is no assurance that there will be no changes in our financial structure. The analysis incorporates movements in USD and GBP benchmark rates only. 19. Amortized cost for these loans is net of the recorded Specific CECL Allowances. 20. Loans are secured by the same property. Private and Confidential 21