UNITED STATES
SECURITIES AND EXCHANGE COMMISSION
Washington, D.C. 20549
Form 6-K
REPORT OF FOREIGN PRIVATE ISSUER
PURSUANT TO RULE 13a-16 OR 15d-16
UNDER THE SECURITIES EXCHANGE ACT OF 1934
June 21, 2023
BHP GROUP LIMITED
(ABN 49 004 028 077)
(Exact name of Registrant as specified in its charter)
VICTORIA, AUSTRALIA
(Jurisdiction of incorporation or organisation)
171 COLLINS STREET, MELBOURNE, VICTORIA 3000 AUSTRALIA
(Address of principal executive offices)
Indicate by check mark whether the registrant files or will file annual reports under cover of Form 20-F or Form 40-F: ☒ Form 20-F ☐ Form 40-F
Indicate by check mark if the registrant is submitting the Form 6-K in paper as permitted by Regulation S-T Rule 101(b)(1): ☐
Indicate by check mark if the registrant is submitting the Form 6-K in paper as permitted by Regulation S-T Rule 101(b)(7): ☐
Indicate by check mark whether the registrant by furnishing the information contained in this Form is also thereby furnishing the information to the Commission pursuant to Rule 12g3-2(b) under the Securities Exchange Act of 1934: ☐ Yes ☒ No
If “Yes” is marked, indicate below the file number assigned to the registrant in connection with Rule 12g3-2(b): n/a BHP will be hosting an investor presentation today to provide an update on our progress and plans to achieve our medium and long-term operational decarbonisation target and goal.

NEWS RELEASE
| Release Time | IMMEDIATE | |
| Date | 21 June 2023 | |
| Number | 12/23 | |
Operational Decarbonisation Investor Presentation
A copy of the presentation is attached.
The presentation slides and script will be available on BHP’s website at: https://www.bhp.com/investors/presentations-events/presentations-and-briefings
Further information on BHP can be found at: bhp.com
Authorised for lodgement by:
Stefanie Wilkinson
Group Company Secretary
| Media Relations | Investor Relations | |
| Email: media.relations@bhp.com | Email: investor.relations@bhp.com | |
| Australia and Asia | Australia and Asia | |
| Gabrielle Notley Tel: +61 3 9609 3830 Mobile: +61 411 071 715 |
John-Paul Santamaria Tel: +61 499 006 018 |
|
| Europe, Middle East and Africa | Europe, Middle East and Africa | |
| Neil Burrows Tel: +44 20 7802 7484 Mobile: +44 7786 661 683 |
James Bell Tel: +44 2078 027 144 Mobile: +44 7961 636 432 |
|
| Americas | Americas | |
| Renata Fernandez Tel: +56 9 8229 5357 |
Monica Nettleton Mobile: +1 416 518 6293 |
|
| BHP Group Limited ABN 49 004 028 077 LEI WZE1WSENV6JSZFK0JC28 Registered in Australia Registered Office: Level 18, 171 Collins Street Melbourne Victoria 3000 Australia Tel +61 1300 55 4757 Fax +61 3 9609 3015 |
||
| BHP Group is headquartered in Australia | ||
Operational decarbonisation 21 June 2023 Merredin Solar Farm, Western Australia
Disclaimer Forward-looking statements This presentation contains forward-looking statements, which may include, without limitation, statements regarding: (i) our strategy, our values and how we define success; (ii) our commitment to generating social value; (iii) our commitments under sustainability frameworks, standards and initiatives; (iv) our expectations, commitments and objectives with respect to sustainability, decarbonisation, natural resource management, climate change and portfolio resilience and timelines and plans to seek to achieve or implement such objectives, including our strategies, goals, targets, milestones and metrics to seek to reduce or support the reduction of greenhouse gas emissions, and related perceived costs, benefits and opportunities for BHP; (v) the assumptions, beliefs and conclusions in our climate change related statements and strategies, for example, in respect of future temperatures, energy consumption and greenhouse gas emissions, and climate-related impacts; (vi) trends in commodity prices and currency exchange rates; (vii) demand for commodities and our expectations of a competitive advantage for our business or certain products; (viii) reserves and resources and production forecasts; (ix) expectations, plans, strategies and objectives of management; (x) climate scenarios; (xi) assumed long-term scenarios; (xii) potential global responses to climate change; (xiii) the potential effect of possible future events on the value of the BHP portfolio; (xiv) approval of certain projects and consummation of certain transactions; (xv) closure or divestment of certain assets, operations or facilities (including associated costs); (xvi) anticipated production or construction commencement dates; (xvii) capital costs and scheduling; (xviii) operating costs and supply (including shortages) of materials and skilled employees; (xix) anticipated productive lives of projects, mines and facilities; (xx) provisions and contingent liabilities; and (xxi) tax and regulatory developments. Forward-looking statements may be identified by the use of terminology, including, but not limited to, ‘intend’, ‘aim’, ‘project’, ‘see’, ‘anticipate’, ‘estimate’, ‘plan’, ‘objective’, ‘believe’, ‘expect’, ‘commit’, ‘may’, ‘should’, ‘need’, ‘must’, ‘will’, ‘would’, ‘continue’, ‘annualised’, ‘forecast’, ‘guidance’, ‘outlook’, ‘prospect’, ‘target’, ‘goal’, ‘ambition’, ‘aspiration’, ‘trend’ or similar words. These statements discuss future expectations concerning the results of assets or financial conditions, or provide other forward-looking information. Forward-looking statements are based on management’s current expectations and reflect judgments, assumptions, estimates and other information available as at the date of this presentation and/or the date of BHP’s planning processes or scenario analysis processes. There are inherent limitations with scenario analysis and it is difficult to predict which, if any, of the scenarios might eventuate. Scenarios do not constitute definitive outcomes for us. Scenario analysis relies on assumptions that may or may not be, or prove to be, correct and may or may not eventuate, and scenarios may be impacted by additional factors to the assumptions disclosed. Additionally, forward-looking statements are not guarantees or predictions of future performance, and involve known and unknown risks, uncertainties and other factors, many of which are beyond our control, and which may cause actual results to differ materially from those expressed in the statements contained in this presentation. BHP cautions against reliance on any forward-looking statements or guidance, including in light of the current economic climate and the significant volatility, uncertainty and disruption arising in connection with the Ukrainian conflict and COVID-19. For example, our future revenues from our assets, projects or mines which may be described in this presentation will be based, in part, upon the market price of the minerals or metals produced, which may vary significantly from current levels. These variations, if materially adverse, may affect the timing or the feasibility of the development of a particular project, the expansion of certain facilities or mines, or the continuation of existing assets. Other factors that may affect the actual construction or production commencement dates, revenues, costs or production output and anticipated lives of assets, mines or facilities include (i) our ability to profitably produce and transport the minerals and/or metals extracted to applicable markets; (ii) the impact of foreign currency exchange rates on the market prices of the minerals and/or metals we produce; (iii) activities of government authorities in the countries where we sell our products and in the countries where we are exploring or developing projects, facilities or mines, including increases in taxes and the imposition of or increase in carbon pricing; (iv) changes in environmental and other regulations; (v) the duration and severity of the Ukrainian conflict and any resurgence of the COVID-19 pandemic and their impact on our business; (iv) political or geopolitical uncertainty; (viii) labour unrest; and (viii) other factors identified in the risk factors discussed in section 9.1 of BHP’s Annual Report for the year ended 30 June 2022. Except as required by applicable regulations or by law, BHP does not undertake to publicly update or review any forward-looking statements, whether as a result of new information or future events. Past performance cannot be relied on as a guide to future performance. Presentation of information and data Numbers presented may not add up precisely to the totals provided due to rounding. Due to the inherent uncertainty and limitations in measuring greenhouse gas (GHG) emissions and operational energy consumption under the calculation methodologies used in the preparation of such data, all GHG emissions and operational energy consumption data or references to GHG emissions and operational energy consumption volumes (including ratios or percentages) in this presentation are estimates. Emissions calculation and reporting methodologies may change or be progressively refined over time resulting in the need to restate previously reported data. There may also be differences in the manner that third parties calculate or report GHG emissions or operational energy consumption data compared to BHP, which means that third-party data may not be comparable to our data. For information on how we calculate our GHG emissions and operational energy consumption data, see our Methodology tab in our ESG Standards and Databook (for the applicable year), available at bhp.com. Unless expressly stated, information and data in this presentation does not reflect BHP’s acquisition of OZ Minerals Limited on 2 May 2023. No offer of securities Nothing in this presentation should be construed as either an offer or a solicitation of an offer to buy or sell any securities, or a solicitation of any vote or approval, in any jurisdiction, or be treated or relied upon as a recommendation or advice by BHP. No offer of securities shall be made in the United States absent registration under the U.S. Securities Act of 1933, as amended, or pursuant to an exemption from, or in a transaction not subject to, such registration requirements. Reliance on third party information The views expressed in this presentation contain information that has been derived from publicly available sources that have not been independently verified. No representation or warranty is made as to the accuracy, completeness or reliability of the information. This presentation should not be relied upon as a recommendation or forecast by BHP. BHP and its subsidiaries In this presentation, the terms ‘BHP’, the ‘Company’, the ‘Group’, ‘BHP Group’, ‘our business’, ‘organisation’, ‘we’, ‘us’ and ‘our’ refer to BHP Group Limited and, except where the context otherwise requires, our subsidiaries. Refer to note 28 ‘Subsidiaries’ of the Financial Statements in BHP’s Annual Report for the year ended 30 June 2022 for a list of our significant subsidiaries. Those terms do not include non-operated assets. Notwithstanding that this presentation may include production, financial and other information from non-operated assets, non-operated assets are not included in the Group and, as a result, statements regarding our operations, assets and values apply only to our operated assets unless otherwise stated. Operational decarbonisation 21 June 2023 2
Operational decarbonisation Overview Dr. Graham Winkelman Head of Carbon Management, Sustainability & Climate Change
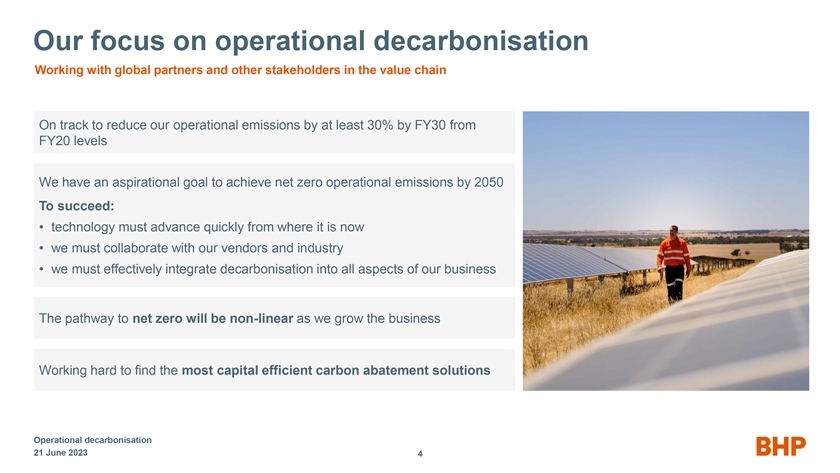
Our focus on operational decarbonisation Working with global partners and other stakeholders in the value chain On track to reduce our operational emissions by at least 30% by FY30 from FY20 levels We have an aspirational goal to achieve net zero operational emissions by 2050 To succeed: • technology must advance quickly from where it is now • we must collaborate with our vendors and industry • we must effectively integrate decarbonisation into all aspects of our business The pathway to net zero will be non-linear as we grow the business Working hard to find the most capital efficient carbon abatement solutions Operational decarbonisation 21 June 2023 4
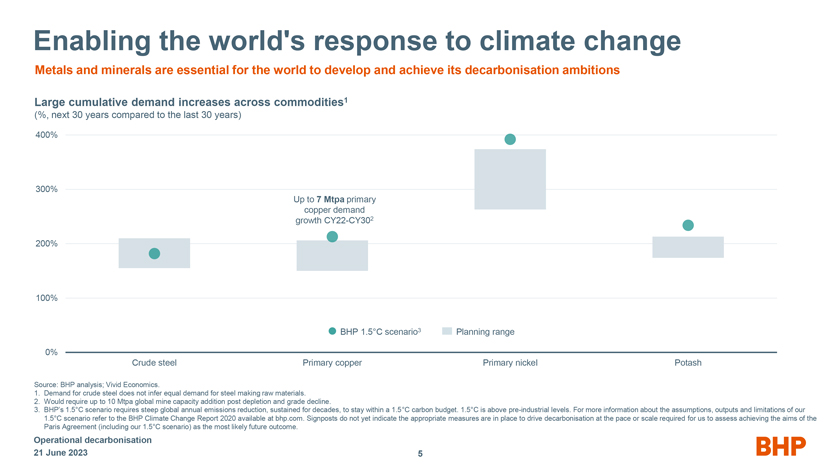
Enabling the world’s response to climate change Metals and minerals are essential for the world to develop and achieve its decarbonisation ambitions Large cumulative demand increases across commodities1 (%, next 30 years compared to the last 30 years) 400% 300% Up to 7 Mtpa primary copper demand growth CY22-CY302 200% 100% BHP 1.5°C scenario3 Planning range 0% Crude steel Primary copper Primary nickel Potash Source: BHP analysis; Vivid Economics. 1. Demand for crude steel does not infer equal demand for steel making raw materials. 2. Would require up to 10 Mtpa global mine capacity addition post depletion and grade decline. 3. BHP’s 1.5°C scenario requires steep global annual emissions reduction, sustained for decades, to stay within a 1.5°C carbon budget. 1.5°C is above pre-industrial levels. For more information about the assumptions, outputs and limitations of our 1.5°C scenario refer to the BHP Climate Change Report 2020 available at bhp.com. Signposts do not yet indicate the appropriate measures are in place to drive decarbonisation at the pace or scale required for us to assess achieving the aims of the Paris Agreement (including our 1.5°C scenario) as the most likely future outcome. Operational decarbonisation 21 June 2023 5
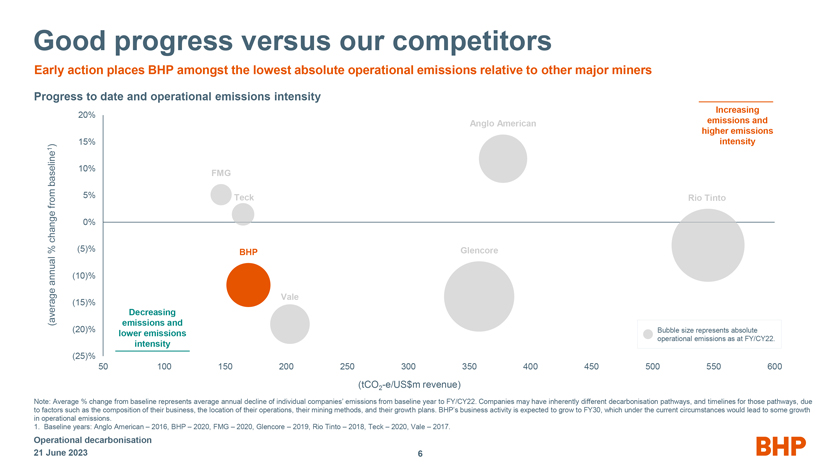
Good progress versus our competitors Early action places BHP amongst the lowest absolute operational emissions relative to other major miners Progress to date and operational emissions intensity Increasing 20% Anglo American emissions and higher emissions 15% intensity 1 ) 10% baseline FMG from 5% Teck Rio Tinto change 0% % (5)% BHP Glencore annual (10)% e Vale (15)% Decreasing (averag emissions and (20)% Bubble size represents absolute lower emissions operational emissions as at FY/CY22. intensity (25)% 50 100 150 200 250 300 350 400 450 500 550 600 (tCO2-e/US$m revenue) Note: Average % change from baseline represents average annual decline of individual companies’ emissions from baseline year to FY/CY22. Companies may have inherently different decarbonisation pathways, and timelines for those pathways, due to factors such as the composition of their business, the location of their operations, their mining methods, and their growth plans. BHP’s business activity is expected to grow to FY30, which under the current circumstances would lead to some growth in operational emissions. 1. Baseline years: Anglo American – 2016, BHP – 2020, FMG – 2020, Glencore – 2019, Rio Tinto – 2018, Teck – 2020, Vale – 2017. Operational decarbonisation 21 June 2023 6
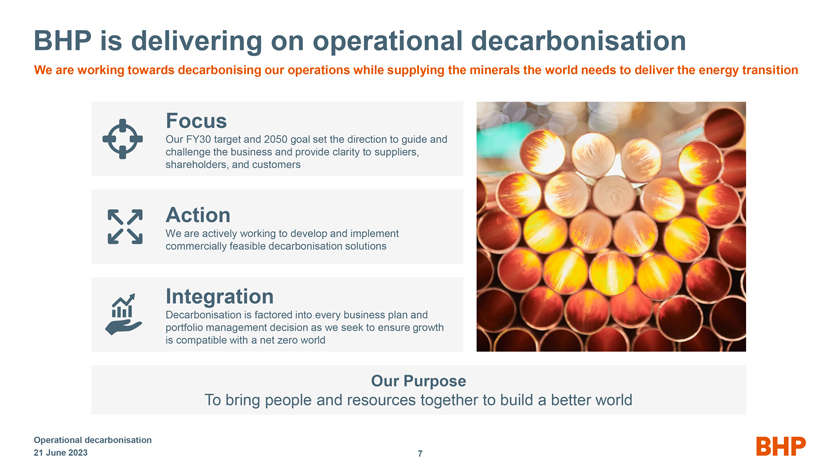
BHP is delivering on operational decarbonisation We are working towards decarbonising our operations while supplying the minerals the world needs to deliver the energy transition Focus Our FY30 target and 2050 goal set the direction to guide and challenge the business and provide clarity to suppliers, shareholders, and customers Action We are actively working to develop and implement commercially feasible decarbonisation solutions Integration Decarbonisation is factored into every business plan and portfolio management decision as we seek to ensure growth is compatible with a net zero world Our Purpose To bring people and resources together to build a better world Operational decarbonisation 21 June 2023 7
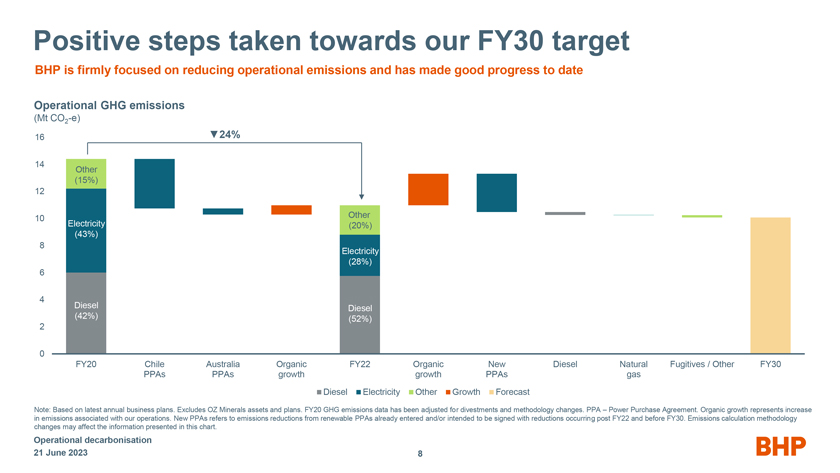
Positive steps taken towards our FY30 target BHP is firmly focused on reducing operational emissions and has made good progress to date Operational GHG emissions (Mt CO2-e) 16 24% 14 Other (15%) 12 10 Other Electricity (20%) (43%) 8 Electricity (28%) 6 4 Diesel Diesel (42%) (52%) 2 0 FY20 Chile Australia Organic FY22 Organic New Diesel Natural Fugitives / Other FY30 PPAs PPAs growth growth PPAs gas Diesel Electricity Other Growth Forecast Note: Based on latest annual business plans. Excludes OZ Minerals assets and plans. FY20 GHG emissions data has been adjusted for divestments and methodology changes. PPA – Power Purchase Agreement. Organic growth represents increase in emissions associated with our operations. New PPAs refers to emissions reductions from renewable PPAs already entered and/or intended to be signed with reductions occurring post FY22 and before FY30. Emissions calculation methodology changes may affect the information presented in this chart. Operational decarbonisation 21 June 2023 8
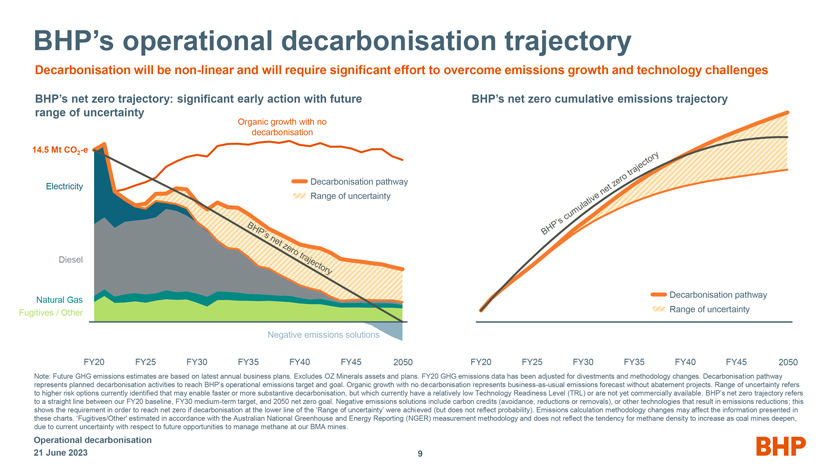
BHP’s operational decarbonisation trajectory Decarbonisation will be non-linear and will require significant effort to overcome emissions growth and technology challenges BHP’s net zero trajectory: significant early action with future BHP’s net zero cumulative emissions trajectory range of uncertainty Organic growth with no decarbonisation 14.5 Mt CO2-e Decarbonisation pathway Electricity Range of uncertainty Diesel Decarbonisation pathway Natural Gas Fugitives / Other Range of uncertainty Negative emissions solutions FY20 FY25 FY30 FY35 FY40 FY45 2050 FY20 FY25 FY30 FY35 FY40 FY45 2050 Note: Future GHG emissions estimates are based on latest annual business plans. Excludes OZ Minerals assets and plans. FY20 GHG emissions data has been adjusted for divestments and methodology changes. Decarbonisation pathway represents planned decarbonisation activities to reach BHP’s operational emissions target and goal. Organic growth with no decarbonisation represents business-as-usual emissions forecast without abatement projects. Range of uncertainty refers to higher risk options currently identified that may enable faster or more substantive decarbonisation, but which currently have a relatively low Technology Readiness Level (TRL) or are not yet commercially available. BHP’s net zero trajectory refers to a straight line between our FY20 baseline, FY30 medium-term target, and 2050 net zero goal. Negative emissions solutions include carbon credits (avoidance, reductions or removals), or other technologies that result in emissions reductions; this shows the requirement in order to reach net zero if decarbonisation at the lower line of the ‘Range of uncertainty’ were achieved (but does not reflect probability). Emissions calculation methodology changes may affect the information presented in these charts. ‘Fugitives/Other’ estimated in accordance with the Australian National Greenhouse and Energy Reporting (NGER) measurement methodology and does not reflect the tendency for methane density to increase as coal mines deepen, due to current uncertainty with respect to future opportunities to manage methane at our BMA mines. Operational decarbonisation 21 June 2023 9
Operational decarbonisation Minerals Americas Alejandro Tapia Vice President Planning and Technical Minerals Americas Escondida
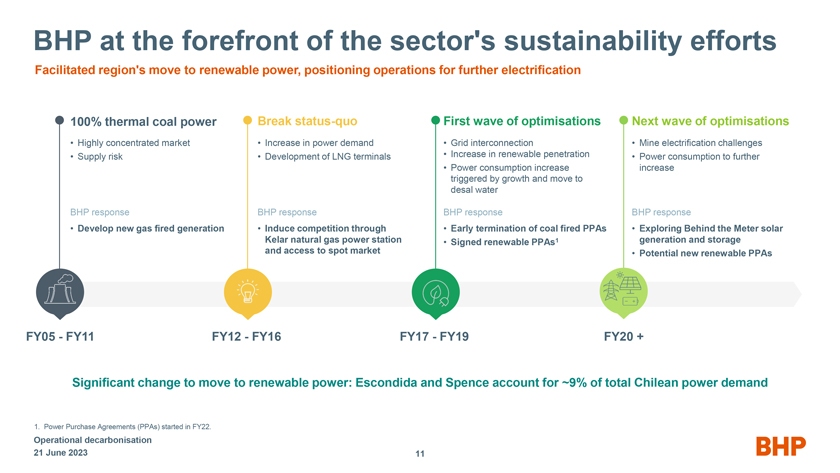
BHP at the forefront of the sector’s sustainability efforts Facilitated region’s move to renewable power, positioning operations for further electrification 100% thermal coal power Break status-quo First wave of optimisations Next wave of optimisations • Highly concentrated market • Increase in power demand • Grid interconnection • Mine electrification challenges • Supply risk • Development of LNG terminals • Increase in renewable penetration • Power consumption to further • Power consumption increase increase triggered by growth and move to desal water BHP response BHP response BHP response BHP response • Develop new gas fired generation • Induce competition through • Early termination of coal fired PPAs • Exploring Behind the Meter solar Kelar natural gas power station • Signed renewable PPAs1 generation and storage and access to spot market • Potential new renewable PPAs FY05 - FY11 FY12 - FY16 FY17 - FY19 FY20 + Significant change to move to renewable power: Escondida and Spence account for ~9% of total Chilean power demand 1. Power Purchase Agreements (PPAs) started in FY22. Operational decarbonisation 21 June 2023 11
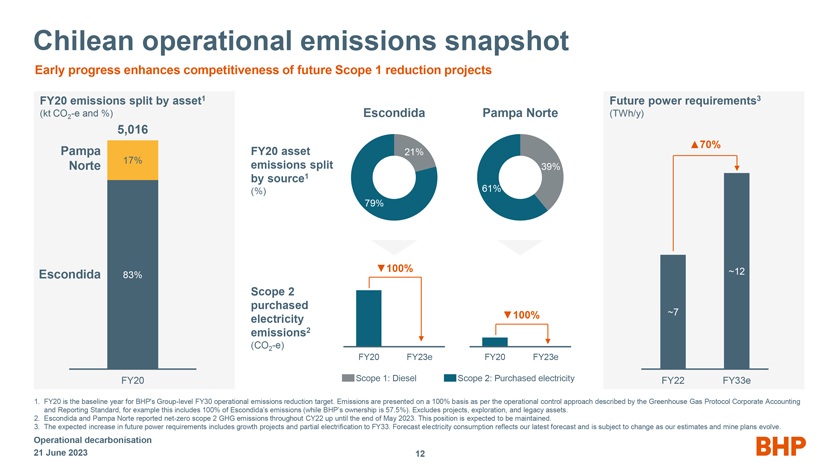
Chilean operational emissions snapshot Early progress enhances competitiveness of future Scope 1 reduction projects FY20 emissions split by asset1 Future power requirements3 (kt CO2-e and %) Escondida Pampa Norte (TWh/y) 5,016 70% Pampa 17% FY20 asset 21% Norte emissions split 39% by source1 (%) 61% 79% 100% ~12 Escondida 83% Scope 2 purchased 100% ~7 electricity emissions2 (CO2-e) FY20 FY23e FY20 FY23e FY20 Scope 1: Diesel Scope 2: Purchased electricity FY22 FY33e 1. FY20 is the baseline year for BHP’s Group-level FY30 operational emissions reduction target. Emissions are presented on a 100% basis as per the operational control approach described by the Greenhouse Gas Protocol Corporate Accounting and Reporting Standard, for example this includes 100% of Escondida’s emissions (while BHP’s ownership is 57.5%). Excludes projects, exploration, and legacy assets. 2. Escondida and Pampa Norte reported net-zero scope 2 GHG emissions throughout CY22 up until the end of May 2023. This position is expected to be maintained. 3. The expected increase in future power requirements includes growth projects and partial electrification to FY33. Forecast electricity consumption reflects our latest forecast and is subject to change as our estimates and mine plans evolve. Operational decarbonisation 21 June 2023 12
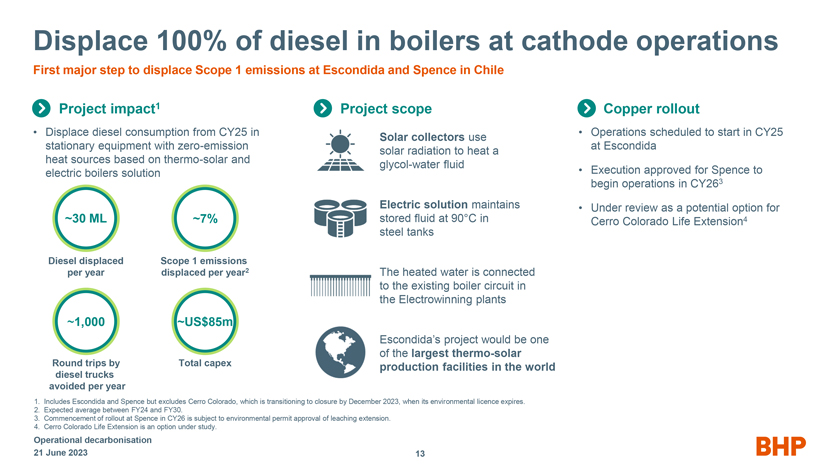
Displace 100% of diesel in boilers at cathode operations First major step to displace Scope 1 emissions at Escondida and Spence in Chile Project impact1 Project scope Copper rollout • Displace diesel consumption from CY25 in • Operations scheduled to start in CY25 Solar collectors use stationary equipment with zero-emission at Escondida solar radiation to heat a heat sources based on thermo-solar and glycol-water fluid electric boilers solution • Execution approved for Spence to begin operations in CY263 Electric solution maintains • Under review as a potential option for ~30 ML ~7% stored fluid at 90°C in Cerro Colorado Life Extension4 steel tanks Diesel displaced Scope 1 emissions per year displaced per year2 The heated water is connected to the existing boiler circuit in the Electrowinning plants ~1,000 ~US$85m Escondida’s project would be one of the largest thermo-solar Round trips by Total capex production facilities in the world diesel trucks avoided per year 1. Includes Escondida and Spence but excludes Cerro Colorado, which is transitioning to closure by December 2023, when its environmental licence expires. 2. Expected average between FY24 and FY30. 3. Commencement of rollout at Spence in CY26 is subject to environmental permit approval of leaching extension. 4. Cerro Colorado Life Extension is an option under study. Operational decarbonisation 21 June 2023 13
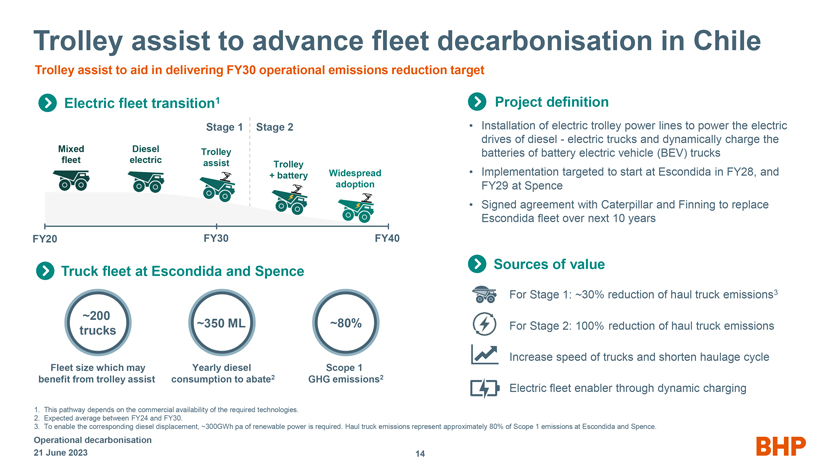
Trolley assist to advance fleet decarbonisation in Chile Trolley assist to aid in delivering FY30 operational emissions reduction target Electric fleet transition1 Project definition Stage 1 Stage 2 • Installation of electric trolley power lines to power the electric drives of diesel - electric trucks and dynamically charge the Mixed Diesel Trolley batteries of battery electric vehicle (BEV) trucks fleet electric assist Trolley + battery Widespread • Implementation targeted to start at Escondida in FY28, and adoption FY29 at Spence • Signed agreement with Caterpillar and Finning to replace Escondida fleet over next 10 years FY20 FY30 FY40 Sources of value Truck fleet at Escondida and Spence For Stage 1: ~30% reduction of haul truck emissions3 ~200 ~350 ML ~80% For Stage 2: 100% reduction of haul truck emissions trucks Increase speed of trucks and shorten haulage cycle Fleet size which may Yearly diesel Scope 1 benefit from trolley assist consumption to abate2 GHG emissions2 Electric fleet enabler through dynamic charging 1. This pathway depends on the commercial availability of the required technologies. 2. Expected average between FY24 and FY30. 3. To enable the corresponding diesel displacement, ~300GWh pa of renewable power is required. Haul truck emissions represent approximately 80% of Scope 1 emissions at Escondida and Spence. Operational decarbonisation 21 June 2023 14
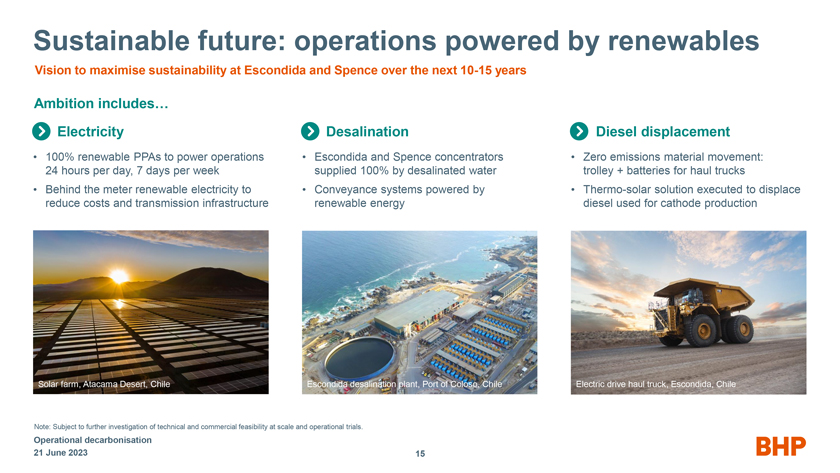
Sustainable future: operations powered by renewables Vision to maximise sustainability at Escondida and Spence over the next 10-15 years Ambition includes… Electricity Desalination Diesel displacement • 100% renewable PPAs to power operations • Escondida and Spence concentrators • Zero emissions material movement: 24 hours per day, 7 days per week supplied 100% by desalinated water trolley + batteries for haul trucks • Behind the meter renewable electricity to • Conveyance systems powered by • Thermo-solar solution executed to displace reduce costs and transmission infrastructure renewable energy diesel used for cathode production Solar farm, Atacama Desert, Chile Escondida desalination plant, Port of Coloso, Chile Electric drive haul truck, Escondida, Chile Note: Subject to further investigation of technical and commercial feasibility at scale and operational trials. Operational decarbonisation 21 June 2023 15
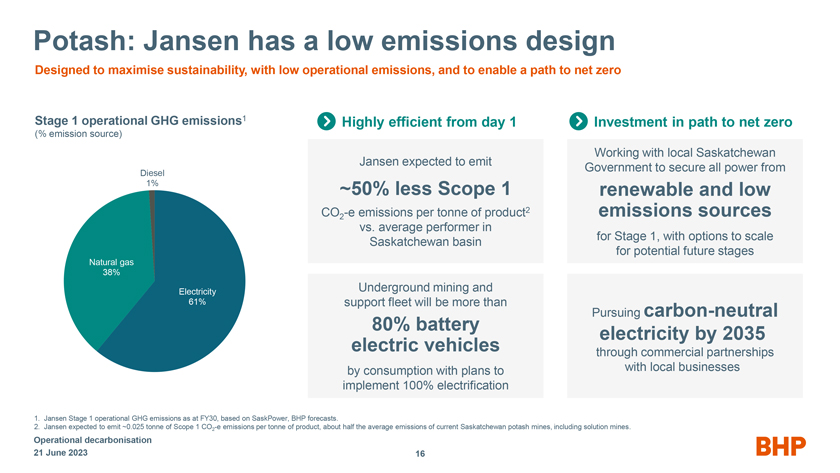
Potash: Jansen has a low emissions design Designed to maximise sustainability, with low operational emissions, and to enable a path to net zero Stage 1 operational GHG emissions1 Highly efficient from day 1 Investment in path to net zero (% emission source) Working with local Saskatchewan Jansen expected to emit Government to secure all power from Diesel 1% ~50% less Scope 1 renewable and low CO -e emissions per tonne of product2 emissions sources 2 vs. average performer in for Stage 1, with options to scale Saskatchewan basin for potential future stages Natural gas 38% Electricity Electricity Underground mining and 61% support fleet will be more than carbon- Pursuing neutral 80% battery electricity by 2035 electric vehicles through commercial partnerships by consumption with plans to with local businesses implement 100% electrification 1. Jansen Stage 1 operational GHG emissions as at FY30, based on SaskPower, BHP forecasts. 2. Jansen expected to emit ~0.025 tonne of Scope 1 CO2-e emissions per tonne of product, about half the average emissions of current Saskatchewan potash mines, including solution mines. Operational decarbonisation 21 June 2023 16
Operational decarbonisation Minerals Australia Anna Wiley Vice President Planning and Technical Minerals Australia Western Australia Iron Ore
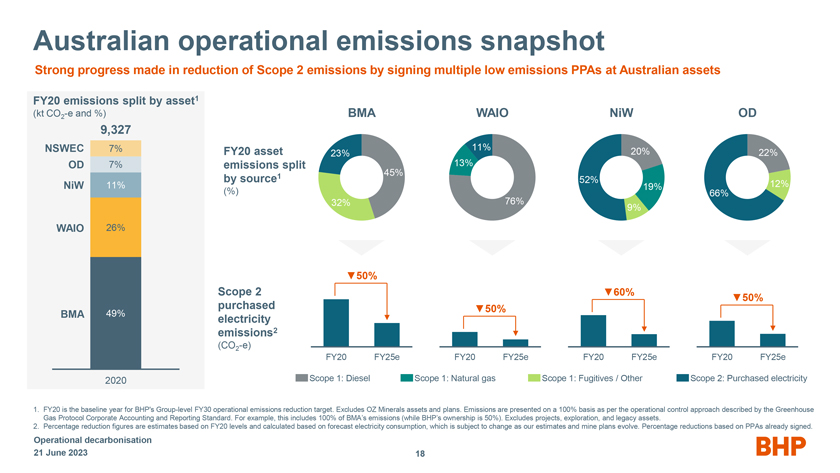
Australian operational emissions snapshot Strong progress made in reduction of Scope 2 emissions by signing multiple low emissions PPAs at Australian assets FY20 emissions split by asset1 (kt CO2-e and %) BMA WAIO NiW OD 9,327 NSWEC 7% 11% FY20 asset 23% 20% 22% OD 7% emissions split 13% 1 45% by source 52% NiW 11% 19% 12% (%) 66% 32% 76% 9% WAIO 26% 50% Scope 2 60% 50% purchased 50% BMA 49% electricity emissions2 (CO2-e) FY20 FY25e FY20 FY25e FY20 FY25e FY20 FY25e 2020 Scope 1: Diesel Scope 1: Natural gas Scope 1: Fugitives / Other Scope 2: Purchased electricity 1. FY20 is the baseline year for BHP’s Group-level FY30 operational emissions reduction target. Excludes OZ Minerals assets and plans. Emissions are presented on a 100% basis as per the operational control approach described by the Greenhouse Gas Protocol Corporate Accounting and Reporting Standard. For example, this includes 100% of BMA’s emissions (while BHP’s ownership is 50%). Excludes projects, exploration, and legacy assets. 2. Percentage reduction figures are estimates based on FY20 levels and calculated based on forecast electricity consumption, which is subject to change as our estimates and mine plans evolve. Percentage reductions based on PPAs already signed. Operational decarbonisation 21 June 2023 18
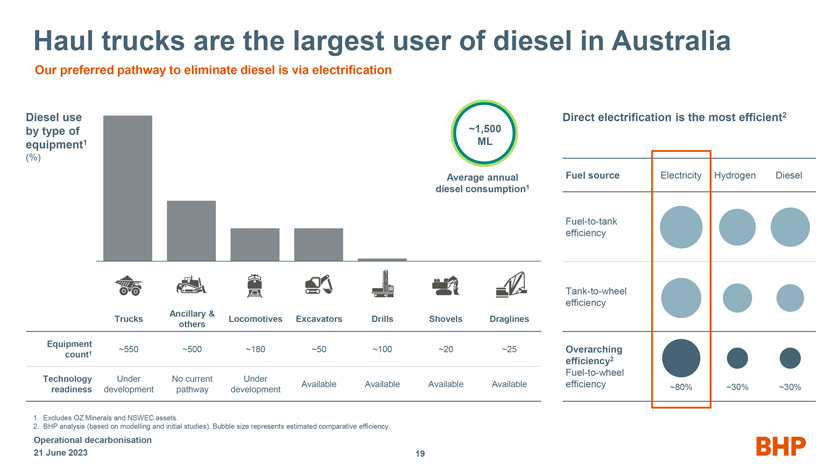
Haul trucks are the largest user of diesel in Australia Our preferred pathway to eliminate diesel is via electrification Diesel use Direct electrification is the most efficient2 by type of ~1,500 equipment1 ML (%) Average annual Fuel source Electricity Hydrogen Diesel diesel consumption1 Fuel-to-tank efficiency Tank-to-wheel efficiency Ancillary & Trucks Locomotives Excavators Drills Shovels Draglines others Equipment ~550 ~500 ~180 ~50 ~100 ~20 ~25 Overarching count1 efficiency2 Fuel-to-wheel Technology Under No current Under Available Available Available Available efficiency ~80% ~30% ~30% readiness development pathway development 1. Excludes OZ Minerals and NSWEC assets. 2. BHP analysis (based on modelling and initial studies). Bubble size represents estimated comparative efficiency. Operational decarbonisation 21 June 2023 19
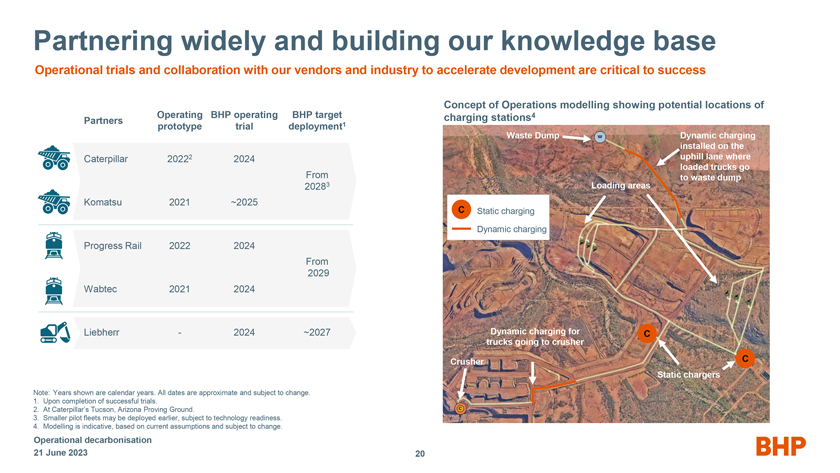
Partnering widely and building our knowledge base Operational trials and collaboration with our vendors and industry to accelerate development are critical to success Concept of Operations modelling showing potential locations of Operating BHP operating BHP target charging stations4 Partners prototype trial deployment1 Waste Dump Dynamic charging installed on the Caterpillar 20222 2024 uphill lane where From loaded trucks go to waste dump 20283 Loading areas Komatsu 2021 ~2025 C Static charging Dynamic charging Progress Rail 2022 2024 From 2029 Wabtec 2021 2024 Liebherr - 2024 ~2027 Dynamic charging for C trucks going to crusher Crusher C Static chargers Note: Years shown are calendar years. All dates are approximate and subject to change. 1. Upon completion of successful trials. 2. At Caterpillar’s Tucson, Arizona Proving Ground. 3. Smaller pilot fleets may be deployed earlier, subject to technology readiness. 4. Modelling is indicative, based on current assumptions and subject to change. Operational decarbonisation 21 June 2023 20
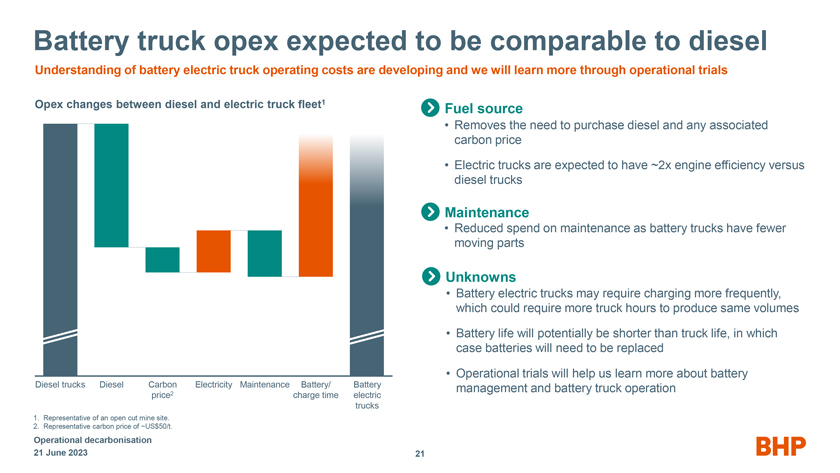
Battery truck opex expected to be comparable to diesel Understanding of battery electric truck operating costs are developing and we will learn more through operational trials Opex changes between diesel and electric truck fleet1 Fuel source • Removes the need to purchase diesel and any associated carbon price • Electric trucks are expected to have ~2x engine efficiency versus diesel trucks Maintenance • Reduced spend on maintenance as battery trucks have fewer moving parts Unknowns • Battery electric trucks may require charging more frequently, which could require more truck hours to produce same volumes • Battery life will potentially be shorter than truck life, in which case batteries will need to be replaced • Operational trials will help us learn more about battery Diesel trucks Diesel Carbon Electricity Maintenance Battery/ Battery management and battery truck operation price2 charge time electric trucks 1. Representative of an open cut mine site. 2. Representative carbon price of ~US$50/t. Operational decarbonisation 21 June 2023 21
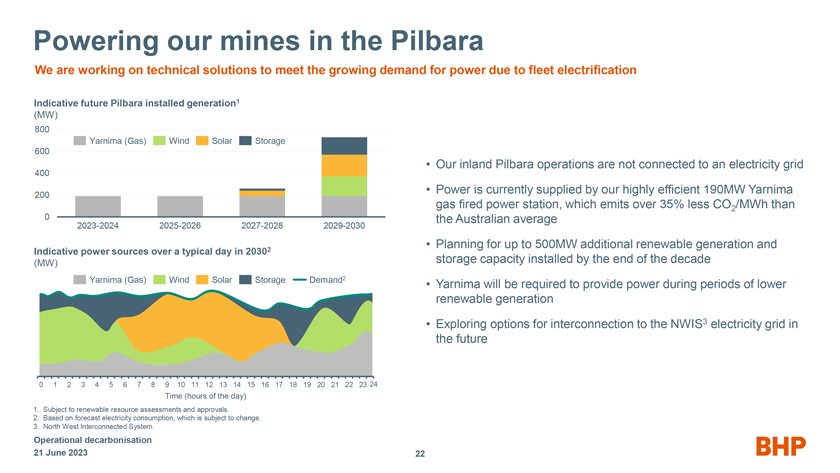
Powering our mines in the Pilbara We are working on technical solutions to meet the growing demand for power due to fleet electrification Indicative future Pilbara installed generation1 (MW) 800 Yarnima (Gas) Wind Solar Storage 600 400 • Our inland Pilbara operations are not connected to an electricity grid • Power is currently supplied by our highly efficient 190MW Yarnima 200 gas fired power station, which emits over 35% less CO /MWh than 2 0 the Australian average 2023-2024 2025-2026 2027-2028 2029-2030 • Planning for up to 500MW additional renewable generation and Indicative power sources over a typical day in 20302 storage capacity installed by the end of the decade (MW) Yarnima (Gas) Wind Solar Storage Demand2 • Yarnima will be required to provide power during periods of lower renewable generation • Exploring options for interconnection to the NWIS3 electricity grid in the future 0 1 2 3 4 5 6 7 8 9 10 11 12 13 14 15 16 17 18 19 20 21 22 23 24 Time (hours of the day) 1. Subject to renewable resource assessments and approvals. 2. Based on forecast electricity consumption, which is subject to change. 3. North West Interconnected System. Operational decarbonisation 21 June 2023 22
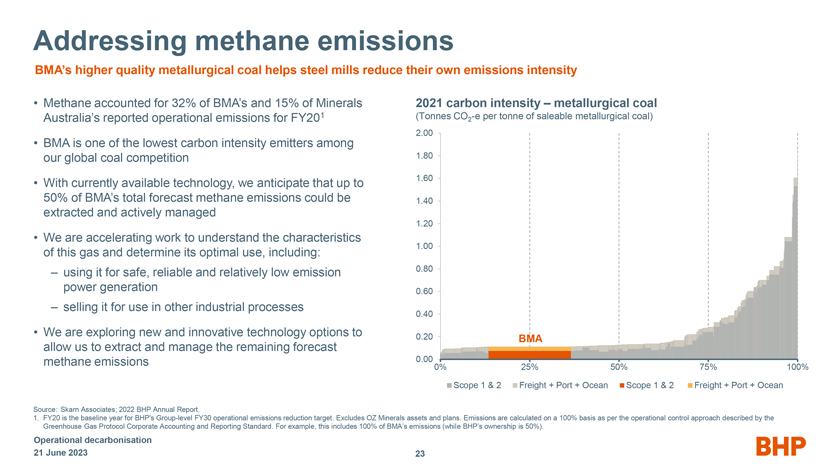
Addressing methane emissions BMA’s higher quality metallurgical coal helps steel mills reduce their own emissions intensity • Methane accounted for 32% of BMA’s and 15% of Minerals 2021 carbon intensity – metallurgical coal 1 (Tonnes CO -e per tonne of saleable metallurgical coal) Australia’s reported operational emissions for FY20 2 • BMA is one of the lowest carbon intensity emitters among 2.00 our global coal competition 1.80 • With currently available technology, we anticipate that up to 1.60 50% of BMA’s total forecast methane emissions could be 1.40 extracted and actively managed 1.20 • We are accelerating work to understand the characteristics 1.00 of this gas and determine its optimal use, including: – using it for safe, reliable and relatively low emission 0.80 power generation 0.60 – selling it for use in other industrial processes 0.40 • We are exploring new and innovative technology options to 0.20 BMA allow us to extract and manage the remaining forecast methane emissions 0.00 0% 25% 50% 75% 100% Scope 1 & 2 Freight + Port + Ocean Scope 1 & 2 Freight + Port + Ocean Source: Skarn Associates; 2022 BHP Annual Report. 1. FY20 is the baseline year for BHP’s Group-level FY30 operational emissions reduction target. Excludes OZ Minerals assets and plans. Emissions are calculated on a 100% basis as per the operational control approach described by the Greenhouse Gas Protocol Corporate Accounting and Reporting Standard. For example, this includes 100% of BMA’s emissions (while BHP’s ownership is 50%). Operational decarbonisation 21 June 2023 23
Operational decarbonisation Decision Evaluation Patrick Collins Head of Decision Evaluation Transformation Portfolio & Performance BMA
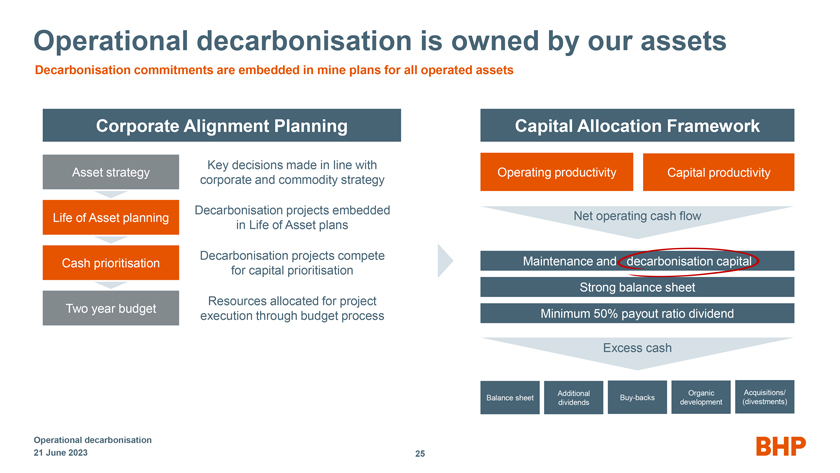
Operational decarbonisation is owned by our assets Decarbonisation commitments are embedded in mine plans for all operated assets Corporate Alignment Planning Capital Allocation Framework Key decisions made in line with Asset strategy Operating productivity Capital productivity corporate and commodity strategy Decarbonisation projects embedded Life of Asset planning Net operating cash flow in Life of Asset plans Decarbonisation projects compete Cash prioritisation Maintenance and decarbonisation capital for capital prioritisation Strong balance sheet Resources allocated for project Two year budget Minimum 50% payout ratio dividend execution through budget process Excess cash Additional Organic Acquisitions/ Balance sheet Buy-backs dividends development (divestments) Operational decarbonisation 21 June 2023 25
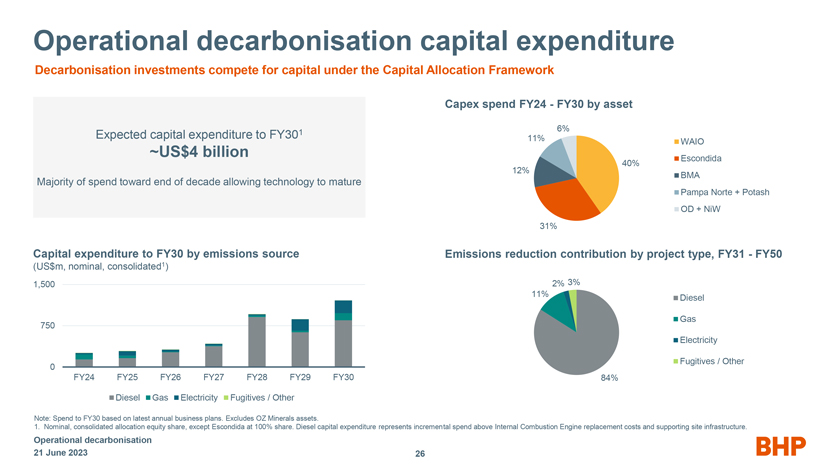
Operational decarbonisation capital expenditure Decarbonisation investments compete for capital under the Capital Allocation Framework Capex spend FY24 - FY30 by asset 1 6% Expected capital expenditure to FY30 11% WAIO ~US$4 billion Escondida 12% 40% BMA Majority of spend toward end of decade allowing technology to mature Pampa Norte + Potash OD + NiW 31% Capital expenditure to FY30 by emissions source Emissions reduction contribution by project type, FY31 - FY50 (US$m, nominal, consolidated1) 1,500 2% 3% 11% Diesel Gas 750 Electricity Fugitives / Other 0 FY24 FY25 FY26 FY27 FY28 FY29 FY30 84% Diesel Gas Electricity Fugitives / Other Note: Spend to FY30 based on latest annual business plans. Excludes OZ Minerals assets. 1. Nominal, consolidated allocation equity share, except Escondida at 100% share. Diesel capital expenditure represents incremental spend above Internal Combustion Engine replacement costs and supporting site infrastructure. Operational decarbonisation 21 June 2023 26
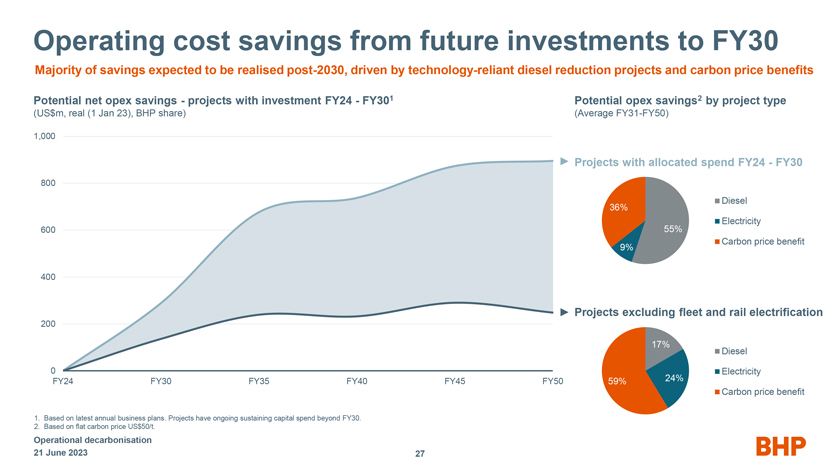
Operating cost savings from future investments to FY30 Majority of savings expected to be realised post-2030, driven by technology-reliant diesel reduction projects and carbon price benefits Potential net opex savings - projects with investment FY24 - FY301 Potential opex savings2 by project type (US$m, real (1 Jan 23), BHP share) (Average FY31-FY50) 1,000 Projects with allocated spend FY24 - FY30 800 Diesel 36% 55% Electricity 600 Carbon price benefit 9% 400 Projects excluding fleet and rail electrification 200 17% Diesel 0 Electricity FY24 FY30 FY35 FY40 FY45 FY50 59% 24% Carbon price benefit 1. Based on latest annual business plans. Projects have ongoing sustaining capital spend beyond FY30. 2. Based on flat carbon price US$50/t. Operational decarbonisation 21 June 2023 27
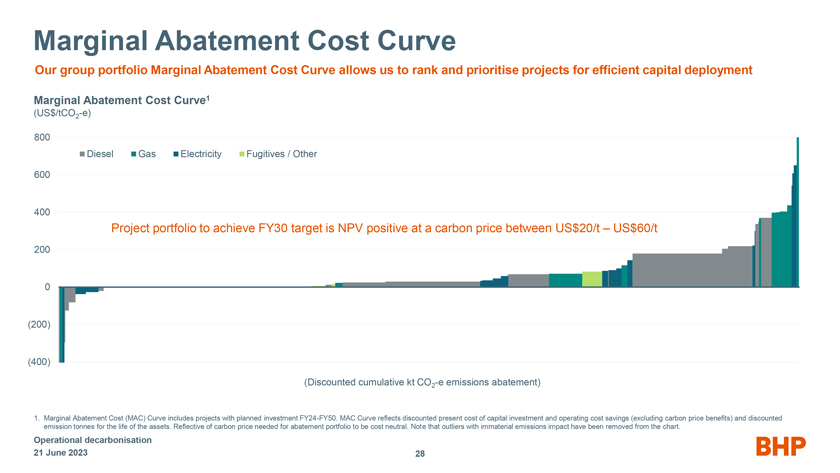
Marginal Abatement Cost Curve Our group portfolio Marginal Abatement Cost Curve allows us to rank and prioritise projects for efficient capital deployment Marginal Abatement Cost Curve1 (US$/tCO2-e) 800 Diesel Gas Electricity Fugitives / Other 600 400 Project portfolio to achieve FY30 target is NPV positive at a carbon price between US$20/t – US$60/t 200 0 (200) (400) (Discounted cumulative kt CO2-e emissions abatement) 1. Marginal Abatement Cost (MAC) Curve includes projects with planned investment FY24-FY50. MAC Curve reflects discounted present cost of capital investment and operating cost savings (excluding carbon price benefits) and discounted emission tonnes for the life of the assets. Reflective of carbon price needed for abatement portfolio to be cost neutral. Note that outliers with immaterial emissions impact have been removed from the chart. Operational decarbonisation 21 June 2023 28

Our focus on operational decarbonisation Working with global partners and other stakeholders in the value chain On track to reduce our operational emissions by at least 30% by FY30 from FY20 levels We have an aspirational goal to achieve net zero operational emissions by 2050 To succeed: • technology must advance quickly from where it is now • we must collaborate with our vendors and industry • we must effectively integrate decarbonisation into all aspects of our business The pathway to net zero will be non-linear as we grow the business Working hard to find the most capital efficient carbon abatement solutions Operational decarbonisation 21 June 2023 29

BHP
SIGNATURES
Pursuant to the requirements of the Securities Exchange Act of 1934, the registrant has duly caused this report to be signed on its behalf by the undersigned, thereunto duly authorized.
| BHP Group Limited | ||||||
| Date: June 21, 2023 | By: | /s/ Stefanie Wilkinson |
||||
| Name: | Stefanie Wilkinson | |||||
| Title: | Group Company Secretary | |||||