UNITED STATES
SECURITIES AND EXCHANGE COMMISSION
Washington, D.C. 20549
FORM 6-K
REPORT OF FOREIGN PRIVATE ISSUER
PURSUANT TO RULE 13a-16 OR 15d-16
UNDER THE SECURITIES EXCHANGE ACT OF 1934
For the month of May 2023
Commission File Number 001-33098
Mizuho Financial Group, Inc.
(Translation of registrant’s name into English)
5-5, Otemachi 1-chome
Chiyoda-ku, Tokyo 100-8176
Japan
(Address of principal executive office)
Indicate by check mark whether the registrant files or will file annual reports under cover of Form 20-F or Form 40-F. Form 20-F ☒ Form 40-F ☐
Indicate by check mark if the registrant is submitting the Form 6-K in paper as permitted by Regulation S-T Rule 101(b)(1): ☐
Indicate by check mark if the registrant is submitting the Form 6-K in paper as permitted by Regulation S-T Rule 101(b)(7): ☐
Indicate by check mark whether the registrant by furnishing the information contained in this Form is also thereby furnishing the information to the Commission pursuant to Rule 12g3-2(b) under the Securities Exchange Act of 1934. Yes ☐ No ☒
If “Yes” is marked, indicate below the file number assigned to the registrant in connection with Rule 12g3-2(b):82- .
THIS REPORT ON FORM 6-K SHALL BE DEEMED TO BE INCORPORATED BY REFERENCE INTO THE PROSPECTUS FORMING A PART OF MIZUHO FINANCIAL GROUP, INC.’S REGISTRATION STATEMENT ON FORM F-3 (FILE NO. 333-266555) AND TO BE A PART OF SUCH PROSPECTUS FROM THE DATE ON WHICH THIS REPORT IS FURNISHED, TO THE EXTENT NOT SUPERSEDED BY DOCUMENTS OR REPORTS SUBSEQUENTLY FILED OR FURNISHED.
SIGNATURES
Pursuant to the requirements of the Securities Exchange Act of 1934, the registrant has duly caused this report to be signed on its behalf by the undersigned, thereunto duly authorized.
| Date: May 15, 2023 | ||
| Mizuho Financial Group, Inc. | ||
| By: | /s/ Takefumi Yonezawa |
|
| Name: | Takefumi Yonezawa | |
| Title: | Senior Executive Officer / Group CFO | |
For Immediate Release:
| Consolidated Financial Statements for Fiscal 2022 (Under Japanese GAAP) |

|
| Company Name: | Mizuho Financial Group, Inc. (“MHFG”) | May 15, 2023 |
| Stock Code Number (Japan): | 8411 | |||||||
| Stock Exchange Listings: | Tokyo Stock Exchange (Prime Market), New York Stock Exchange | |||||||
| URL: | https://www.mizuhogroup.com | |||||||
| Representative: | Masahiro Kihara | President & Group CEO | ||||||
| For Inquiry: | Yasutoshi Tanaka | General Manager of Accounting | Phone: +81-3-6838-6101 | |||||
| Ordinary General Meeting of Shareholders (scheduled): | June 23, 2023 | Commencement of Dividend Payment (scheduled): June 6, 2023 | ||||
| Filing of Yuka Shoken Hokokusho to the Kanto Local Finance Bureau (scheduled): |
June 16, 2023 | Trading Accounts: Established | ||||
| Supplementary Materials on Annual Results: | Attached | |||||
| IR Conference on Annual Results: | Scheduled | |||||
| Amounts less than one million yen are rounded down. | ||||||
1. Financial Highlights for Fiscal 2022 (for the fiscal year ended March 31, 2023)
(1) Consolidated Results of Operations
| (%: Changes from the previous fiscal year) |
|
|||||||||||||||||||||||
| Ordinary Income | Ordinary Profits | Profit Attributable to Owners of Parent |
||||||||||||||||||||||
| ¥ million | % | ¥ million | % | ¥ million | % | |||||||||||||||||||
| Fiscal 2022 |
5,778,772 | 45.8 | 789,606 | 41.0 | 555,527 | 4.7 | ||||||||||||||||||
| Fiscal 2021 |
3,963,091 | 23.1 | 559,847 | 4.3 | 530,479 | 12.6 | ||||||||||||||||||
| Note: |
Comprehensive Income: Fiscal 2022: ¥277,666 million, 489.2%; Fiscal 2021: ¥47,121 million, (94.9)% |
|
| Net Income per Share of Common Stock |
Diluted Net Income per Share of Common Stock |
Net Income on Own Capital |
Ordinary Profits to Total Assets |
Ordinary Profits to Ordinary Income |
||||||||||||||||
| ¥ | ¥ | % | % | % | ||||||||||||||||
| Fiscal 2022 |
219.20 | 219.19 | 6.1 | 0.3 | 13.6 | |||||||||||||||
| Fiscal 2021 |
209.27 | 209.26 | 5.7 | 0.2 | 14.1 | |||||||||||||||
| Reference: |
Equity in Income from Investments in Affiliates: Fiscal 2022: ¥11,889 million; Fiscal 2021: ¥25,434 million |
|
(2) Consolidated Financial Conditions
| Total Assets | Total Net Assets | Own Capital Ratio | Total Net Assets per Share of Common Stock |
|||||||||||||
| ¥ million | ¥ million | % | ¥ | |||||||||||||
| Fiscal 2022 |
254,258,203 | 9,208,463 | 3.5 | 3,603.98 | ||||||||||||
| Fiscal 2021 |
237,066,142 | 9,201,031 | 3.8 | 3,581.39 | ||||||||||||
| Reference: |
Own Capital: As of March 31, 2023: ¥9,133,294 million; As of March 31, 2022: ¥9,077,382 million |
|
| Note: |
Own Capital Ratio is calculated as follows: (Total Net Assets - Stock Acquisition Rights - Non-controlling Interests) / Total Assets × 100 | |
| Own Capital Ratio stated above is not calculated based on the public notice of Own Capital Ratio. |
(3) Conditions of Consolidated Cash Flows
| Cash Flows from Operating Activities |
Cash Flows from Investing Activities |
Cash Flows from Financing Activities |
Cash and Cash Equivalents at the end of the fiscal year |
|||||||||||||
| ¥ million | ¥ million | ¥ million | ¥ million | |||||||||||||
| Fiscal 2022 |
8,867,246 | 6,605,667 | (611,143 | ) | 65,825,681 | |||||||||||
| Fiscal 2021 |
4,917,186 | (1,860,490 | ) | (522,056 | ) | 50,136,299 | ||||||||||
2. Cash Dividends for Shareholders of Common Stock
| Annual Cash Dividends per Share | Total Cash Dividends (Total) |
Dividends Pay-out Ratio (Consolidated basis) |
Dividends on Net Assets (Consolidated basis) |
|||||||||||||||||||||||||||||
| First quarter-end |
Second quarter-end |
Third quarter-end |
Fiscal year-end |
Annual | ||||||||||||||||||||||||||||
| ¥ | ¥ | ¥ | ¥ | ¥ | ¥ million | % | % | |||||||||||||||||||||||||
| Fiscal 2021 |
— | 40.00 | — | 40.00 | 80.00 | 203,087 | 38.2 | 2.2 | ||||||||||||||||||||||||
| Fiscal 2022 |
— | 42.50 | — | 42.50 | 85.00 | 215,772 | 38.7 | 2.3 | ||||||||||||||||||||||||
| Fiscal 2023 (estimate) |
— | 47.50 | — | 47.50 | 95.00 | 39.5 | ||||||||||||||||||||||||||
3. Consolidated Earnings Estimates for Fiscal 2023 (for the fiscal year ending March 31, 2024)
| (%: Changes from the corresponding period of the previous fiscal year) | ||||||||||||
| Profit Attributable to Owners of Parent |
Net Income per Share of Common Stock |
|||||||||||
| ¥ million | % | ¥ | ||||||||||
| 1H F2023 |
— | — | — | |||||||||
| Fiscal 2023 |
610,000 | 9.8 | 240.61 | |||||||||
| Note: |
The number of shares of common stock used in the above calculation is based on the number of outstanding shares of common stock (excluding treasury stock) as of March 31, 2023. | |
Notes
(1) Changes in Significant Subsidiaries during the Fiscal Year (changes in specified subsidiaries accompanying changes in the scope of consolidation): No
(2) Changes in Accounting Policies and Accounting Estimates / Restatements
i . Changes in accounting policies due to revisions of accounting standards: Yes
ii . Changes in accounting policies other than i above: No
iii. Changes in accounting estimates: No
iv. Restatements: No
Note: For more information, please refer to “Changes in Accounting Policies” on page 1 – 14 of the attachment.
(3) Issued Shares of Common Stock
| i . Year-end issued shares (including treasury stock): |
As of March 31, 2023 | 2,539,249,894 shares | As of March 31, 2022 | 2,539,249,894 shares | ||||||||||||
| ii . Year-end treasury stock: |
As of March 31, 2023 | 5,027,306 shares | As of March 31, 2022 | 4,659,024 shares | ||||||||||||
|
iii. Average number of outstanding shares: |
Fiscal 2022 | 2,534,340,257 shares | Fiscal 2021 | 2,534,897,183 shares |
This immediate release is outside the scope of the audit.
This immediate release contains statements that constitute forward-looking statements within the meaning of the United States Private Securities Litigation Reform Act of 1995, including estimates, forecasts, targets and plans. Such forward-looking statements do not represent any guarantee by management of future performance.
In many cases, but not all, we use such words as “aim,” “anticipate,” “believe,” “endeavor,” “estimate,” “expect,” “intend,” “may,” “plan,” “probability,” “project,” “risk,” “seek,” “should,” “strive,” “target” and similar expressions in relation to us or our management to identify forward-looking statements. You can also identify forward-looking statements by discussions of strategy, plans or intentions. These statements reflect our current views with respect to future events and are subject to risks, uncertainties and assumptions.
We may not be successful in implementing our business strategies, and management may fail to achieve its targets, for a wide range of possible reasons, including, without limitation: impact of geopolitical disruptions and the corona virus pandemic; intensification of competition in the market for financial services; incurrence of significant credit-related costs; declines in the value of our securities portfolio; changes in interest rates; foreign currency fluctuations; decrease in the market liquidity of our assets; revised assumptions or other changes related to our pension plans; a decline in our deferred tax assets; impairment of the carrying value of our long-lived assets; problems related to our information technology systems, including as a result of cyber attacks; the effect of financial transactions entered into for hedging and other similar purposes; failure to maintain required capital adequacy ratio levels and meet other financial regulatory requirements; downgrades in our credit ratings; our ability to avoid reputational harm; our ability to implement our 5-Year Business Plan, and implement other strategic initiatives and measures effectively; the effectiveness of our operational, legal and other risk management policies; the effect of changes in general economic conditions in Japan and elsewhere; and changes to applicable laws and regulations.
Further information regarding factors that could affect our financial condition and results of operations is included in “Item 3. D. Key Information-Risk Factors” and “Item 5. Operating and Financial Review and Prospects” in our most recent Form 20-F filed with the U.S. Securities and Exchange Commission (“SEC”) and our report on Form 6-K furnished to the SEC on December 28, 2022, both of which are available in the Financial Information section of our web page at www.mizuhogroup.com and also at the SEC’s web site at www.sec.gov.
We do not intend to update our forward-looking statements. We are under no obligation, and disclaim any obligation, to update or alter our forward-looking statements, whether as a result of new information, future events or otherwise, except as may be required by the rules of the Tokyo Stock Exchange.
Mizuho Financial Group, Inc.
m Contents of Attachment
| 1. | Overview of Consolidated Results of Operations and Financial Conditions | p.1-2 | ||||
| (1) Overview of Results of Operations | p.1-2 | |||||
| (2) Overview of Financial Conditions | p.1-3 | |||||
| (3) Basic Policy on Profit Distribution, Dividend Payment for Fiscal 2022 and Dividend Estimates for Fiscal 2023 | p.1-3 | |||||
| 2. | Basic Stance on Selection of Accounting Standards | p.1-4 | ||||
| 3. | Consolidated Financial Statements and Others | p.1-5 | ||||
| (1) Consolidated Balance Sheets | p.1-5 | |||||
| (2) Consolidated Statements of Income and Consolidated Statements of Comprehensive Income | p.1-7 | |||||
| (3) Consolidated Statements of Changes in Net Assets | p.1-10 | |||||
| (4) Consolidated Statements of Cash Flows | p.1-12 | |||||
| (5) Notes regarding Consolidated Financial Statements | p.1-14 | |||||
| (Matters Related to the Assumption of Going Concern) |
||||||
| (Changes in Accounting Policies) |
||||||
| (Business Segment Information) |
||||||
| (Per Share Information) |
||||||
| (Subsequent Events) |
||||||
Note to XBRL
Please note that the names of the English accounts contained in XBRL data, which are available through EDINET and TDNet, may be different from those of the English accounts in our financial statements.
An MHFG IR conference for institutional investors and analysts is scheduled for Thursday, May 18, 2023. The IR conference presentation materials and audio archive will be available for use by individual investors in the IR Information section of the Mizuho Financial Group website immediately after the conference.
1-1
Mizuho Financial Group, Inc.
1. Overview of Consolidated Results of Operations and Financial Conditions
(1) Overview of Results of Operations
Reviewing the economic environment over the fiscal year ended March 31, 2023, while demand continued to recover, supported by the transition to a world of living with COVID-19 and fiscal expenditure by each country, global inflation was triggered by structural shifts in the labor market, natural resource supply constraints caused by the situation in Ukraine and other factors. In addition, the impact of the heightened pace of monetary tightening, which is centered on Europe and the United States, materialized and the outlook for the global economy remained uncertain.
In the United States, the economy continued to grow steadily, mainly in terms of consumption, even under steep inflation and sudden monetary tightening by the Federal Reserve Board (FRB) in response thereto. Wages, which support consumption, remained high as a result of labor supply constraints stemming from strong demand for labor, the spread of COVID-19 and other factors. While the FRB continued to tighten monetary policy based on these circumstances, several financial institutions have gone bankrupt and the economic outlook has become increasingly uncertain.
In Europe, economic growth slowed due to surging resource prices and resource supply constraints caused by the situation in Ukraine. Although the rise in gas prices came to a pause, the rise in food prices and other factors continued to increase inflation, pushing down consumption. However, as not only price increases but also wage growth is accelerating, the European Central Bank (ECB) has continued to raise interest rates. The economy is expected to remain somewhat sluggish in the future, affected by the rising rate of inflation and interest rate hikes. In addition, there are concerns that the financial market turmoil caused by uncertainty over the business management of financial institutions will have a significant impact on monetary policy and economic trends.
In Asia, China has experienced weak real estate investment for a prolonged time and consumer sentiment has also remained weak due to the “Zero COVID” policy. After the end of the “Zero COVID” policy, the number of infections temporarily rose in a steep manner but the infection rate eventually stabilized. Led mainly by services consumption, China has recently been recovering at a gradual rate. However, considering China’s ongoing conflicts with the United States, there remains a high degree of uncertainty with respect to issues such as trade and national security. In emerging economies, the overall growth rate has been higher due to the relaxation of restrictions on activities. On the other hand, the trend of growth has recently slowed as the corresponding round of recovery of consumer demand following the COVID-19 pandemic has come to an end and the impact of inflation has slowed such growth.
In Japan, despite the weakened production activities of manufacturers due to sluggish capital investment and shortages of semiconductors, with the relaxation of restrictions on activities, gradual recovery is expected to continue mainly in domestic demand-oriented industries, such as service industries. Inflation rates that had been rising against the backdrop of increased resource prices and the depreciation of the yen are also expected to weaken in light of a pause in the surge in the commodity market. On the other hand, the slowdown of overseas economies due to monetary tightening in Europe and the United States that may diminish capital investments is a cause for concern. Concerns remain high about whether there will be a change in the financial policy of the Bank of Japan; and if the change is actually implemented, such change may affect the Japanese economy.
The prospects for the global economy are expected to remain uncertain given a lack of clarity as to the impact that global monetary tightening will have on the real economy. In addition, depending on the circumstances, such as the spread of financial system instabilities resulting from the bankruptcy of financial institutions in Europe and the United States, increasing tensions with respect to the situation in Ukraine and further worsening of inflation, particularly in the United States, there is a possibility of financial and capital market disruption and the risk of further economic downturn, which may also adversely affect the Japanese economy.
Under the foregoing business environment, we recorded Consolidated Gross Profits of ¥2,278.4 billion for fiscal 2022, increasing by ¥25.9 billion from the previous fiscal year. General and Administrative Expenses increased by ¥52.3 billion on a year-on-year basis to ¥1,445.2 billion mainly due to increasing expenses as a result of currency fluctuations whereas further progress in cost reduction through structural reform was achived.
1-2
Mizuho Financial Group, Inc.
As a result, Consolidated Net Business Profits decreased by ¥45.9 billion on a year-on-year basis to ¥805.2 billion. Consolidated Net Business Profits + Net gains or losses related to ETFs and others, which consists of Consolidated Net Business Profits, Net gains or losses related to ETFs and others on a non-consolidated aggregated basis of the banks, and Net gains or losses related to operating investment securities on a consolidated basis of Mizuho Securities Co., Ltd., decreased by ¥46.0 billion on a year-on-year basis to ¥807.1 billion mainly due to a decline in profits after booking unrealized losses on foreign bonds portfolio in Markets Groups whereas we had a steady business performance in Customer Groups especially overseas.
Credit-related Costs decreased by ¥145.8 billion on a year-on-year basis to ¥89.3 billion mainly due to the elimination of a large provision for reserves relating to certain customers recorded in the previous fiscal year.
Net Gains (Losses) related to Stocks increased by ¥130.3 billion on a year-on-year basis to net gains of ¥86.4 billion mainly due to the elimination of losses on the cancellation of bear funds intended on fixing unrealized gain on stocks recorded in the previous fiscal year in addition to steady progress in the sale of cross-holding stocks.
As a result, Ordinary Income increased by ¥229.7 billion on a year-on-year basis to ¥789.6 billion.
Extraordinary Gains (Losses) decreased by ¥54.6 billion on a year-on-year basis to net losses of ¥10.6 billion mainly due to the elimination of a large amount of gains on cancellation of employee retirement benefit trust recorded in the previous fiscal year.
Tax-related Expenses increased by ¥158.1 billion on a year-on-year basis to ¥218.8 billion mainly due to the elimination of the influence of the tax effect of capital optimization of Mizuho Securities Co., Ltd. as part of our financial structural reform recorded in the previous fiscal year.
As a result, Profit Attributable to Owners of Parent for fiscal 2022 increased by ¥25.0 billion on a year-on-year basis to ¥555.5 billion.
As for earnings estimates for fiscal 2023, we estimate Ordinary Profits of ¥860.0 billion and Profit Attributable to Owners of Parent of ¥610.0 billion on a consolidated basis.
We will disclose promptly if we need to revise the above consolidated earnings estimates.
(2) Overview of Financial Conditions
Consolidated total assets as of March 31, 2023 amounted to ¥254,258.2 billion, increasing by ¥17,192.0 billion from the end of the previous fiscal year mainly due to an increase in Cash and Due from Banks.
Securities were ¥37,363.1 billion, decreasing by ¥7,277.9 billion from the end of the previous fiscal year. Loans and Bills Discounted amounted to ¥88,687.1 billion, increasing by ¥3,950.8 billion from the end of the previous fiscal year. Deposits and Negotiable Certificates of Deposit amounted to ¥164,287.3 billion, increasing by ¥8,587.5 billion from the end of the previous fiscal year.
Net Assets amounted to ¥9,208.4 billion, increasing by ¥7.4 billion from the end of the previous fiscal year. Shareholders’ Equity was ¥8,471.1 billion, Accumulated Other Comprehensive Income was ¥662.1 billion, and Non-controlling Interests was ¥75.1 billion.
Net Cash Provided by Operating Activities was ¥8,867.2 billion mainly due to increased deposits. Net Cash Provided in Investing Activities was ¥6,605.6 billion mainly due to purchase, sale and redemption of securities, and Net Cash Used in Financing Activities was ¥611.1 billion mainly due to the redemption of subordinated bonds.
As a result, Cash and Cash Equivalents as of March 31, 2023 was ¥65,825.6 billion.
(3) Basic Policy on Profit Distribution, Dividend Payment for Fiscal 2022 and Dividend Estimates for Fiscal 2023
Based on our capital management policy of pursuing the optimum balance between capital adequacy, growth investment and enhancement of shareholder return, we maintain our shareholder return policy of progressive dividends as our principal approach while executing flexible and intermittent share buybacks. In addition, as for the dividends, we will decide based on the steady growth of our stable earnings base, taking 40% of the dividend payout ratio as a guide into consideration. As for share buybacks, we will consider our business results and capital adequacy, our stock price and the opportunities for growth investment in determining the execution.
1-3
Mizuho Financial Group, Inc.
Based on this policy, at the meeting of the Board of Directors held today, we have decided to issue ¥42.5 of year-end cash dividends on common stock for Fiscal 2022 (annual cash dividends of ¥85.0 including interim dividends of ¥42.5) in accordance with the Dividend Estimate of an increase of ¥2.5, based on the fact that Profit Attributable to Owners of Parent for Fiscal 2022 was ¥555.5 billion.
Consolidated Common Equity Tier 1 capital ratio (Basel III finalization basis, excluding Net Unrealized Gains (Losses) on Other Securities) was 9.5%, thus again fulfilling our target level of the 5-Year Business Plan which was set at the lower end of the 9-10% range.
| Year-end cash dividends on Common Stock |
¥42.5 per share | (unchanged from the estimate of an increase of ¥2.5) |
||
| Annual cash dividends incl. interim dividends |
¥85.0 per share | (unchanged from the estimate of an increase of ¥5.0) |
Meanwhile, in accordance with the Articles of Incorporation, we may decide to issue dividends by resolution of the Board of Directors unless otherwise stipulated by laws and regulations.
As for the dividend estimates of common stock for Fiscal 2023, we predict ¥95.0 per share of common stock, which is an increase of ¥10.0 from Fiscal 2022. We intend to continue payments of cash dividends at the interim period to return profits to our shareholders in a timely manner.
| (Dividend Estimates for Fiscal 2023) | ||||||||
| Common Stock |
Cash Dividends per Share | ¥ | 95.0 | (Increase of ¥10.0 from Fiscal 2022) |
||||
| of which Interim Dividends |
¥ | 47.5 | (Increase of ¥5.0 from Fiscal 2022) |
|||||
2. Basic Stance on Selection of Accounting Standards
MHFG prepares its consolidated financial statements in accordance with Japanese Generally Accepted Accounting Principles. With respect to International Financial Reporting Standards (IFRS), in light of possible adoption in the future, MHFG is continuing research and study on the situation in Japan and overseas and/or the development of IFRS.
1-4
Mizuho Financial Group, Inc.
3. Consolidated Financial Statements and Others
(1) Consolidated Balance Sheets
| Millions of yen | ||||||||
| As of March 31, 2022 |
As of March 31, 2023 |
|||||||
| Assets |
||||||||
| Cash and Due from Banks |
¥ | 51,359,301 | ¥ | 67,152,100 | ||||
| Call Loans and Bills Purchased |
940,008 | 1,386,895 | ||||||
| Receivables under Resale Agreements |
12,750,363 | 11,693,419 | ||||||
| Guarantee Deposits Paid under Securities Borrowing Transactions |
2,340,089 | 1,897,429 | ||||||
| Other Debt Purchased |
3,476,021 | 3,836,735 | ||||||
| Trading Assets |
13,221,415 | 17,404,494 | ||||||
| Money Held in Trust |
591,183 | 514,607 | ||||||
| Securities |
44,641,060 | 37,363,140 | ||||||
| Loans and Bills Discounted |
84,736,280 | 88,687,155 | ||||||
| Foreign Exchange Assets |
2,627,492 | 2,408,587 | ||||||
| Derivatives other than for Trading Assets |
2,277,160 | 2,184,875 | ||||||
| Other Assets |
7,797,796 | 8,689,547 | ||||||
| Tangible Fixed Assets |
1,095,977 | 1,105,851 | ||||||
| Buildings |
340,016 | 325,241 | ||||||
| Land |
623,627 | 618,787 | ||||||
| Lease Assets |
4,675 | 6,333 | ||||||
| Construction in Progress |
21,737 | 43,679 | ||||||
| Other Tangible Fixed Assets |
105,919 | 111,808 | ||||||
| Intangible Fixed Assets |
601,292 | 572,719 | ||||||
| Software |
371,534 | 375,322 | ||||||
| Goodwill |
52,547 | 49,613 | ||||||
| Lease Assets |
1,823 | 2,098 | ||||||
| Other Intangible Fixed Assets |
175,387 | 145,685 | ||||||
| Net Defined Benefit Asset |
863,217 | 859,271 | ||||||
| Deferred Tax Assets |
184,594 | 316,168 | ||||||
| Customers’ Liabilities for Acceptances and Guarantees |
8,346,878 | 8,905,643 | ||||||
| Reserves for Possible Losses on Loans |
(783,886 | ) | (720,437 | ) | ||||
| Reserve for Possible Losses on Investments |
(107 | ) | (1 | ) | ||||
|
|
|
|
|
|||||
| Total Assets |
¥ | 237,066,142 | ¥ | 254,258,203 | ||||
|
|
|
|
|
|||||
1-5
Mizuho Financial Group, Inc.
| Millions of yen | ||||||||
| As of March 31, 2022 |
As of March 31, 2023 |
|||||||
| Liabilities |
||||||||
| Deposits |
¥ | 138,830,872 | ¥ | 150,498,976 | ||||
| Negotiable Certificates of Deposit |
16,868,931 | 13,788,347 | ||||||
| Call Money and Bills Sold |
1,278,050 | 1,814,873 | ||||||
| Payables under Repurchase Agreements |
20,068,779 | 25,735,560 | ||||||
| Guarantee Deposits Received under Securities Lending Transactions |
1,172,248 | 757,842 | ||||||
| Commercial Paper |
1,775,859 | 1,782,111 | ||||||
| Trading Liabilities |
9,608,976 | 12,698,007 | ||||||
| Borrowed Money |
6,590,527 | 4,155,480 | ||||||
| Foreign Exchange Liabilities |
1,508,453 | 671,552 | ||||||
| Short-term Bonds |
537,167 | 477,141 | ||||||
| Bonds and Notes |
10,714,004 | 11,371,189 | ||||||
| Due to Trust Accounts |
1,167,284 | 1,534,097 | ||||||
| Derivatives other than for Trading Liabilities |
2,770,852 | 2,749,138 | ||||||
| Other Liabilities |
6,301,484 | 7,777,025 | ||||||
| Reserve for Bonus Payments |
120,052 | 126,694 | ||||||
| Reserve for Variable Compensation |
2,278 | 2,381 | ||||||
| Net Defined Benefit Liability |
71,774 | 68,429 | ||||||
| Reserve for Director and Corporate Auditor Retirement Benefits |
557 | 539 | ||||||
| Reserve for Possible Losses on Sales of Loans |
1,309 | 15,049 | ||||||
| Reserve for Contingencies |
6,622 | 13,706 | ||||||
| Reserve for Reimbursement of Deposits |
17,620 | 13,695 | ||||||
| Reserve for Reimbursement of Debentures |
10,504 | 7,798 | ||||||
| Reserves under Special Laws |
3,132 | 3,352 | ||||||
| Deferred Tax Liabilities |
30,923 | 22,391 | ||||||
| Deferred Tax Liabilities for Revaluation Reserve for Land |
59,962 | 58,711 | ||||||
| Acceptances and Guarantees |
8,346,878 | 8,905,643 | ||||||
|
|
|
|
|
|||||
| Total Liabilities |
¥ | 227,865,110 | ¥ | 245,049,740 | ||||
|
|
|
|
|
|||||
| Net Assets |
||||||||
| Common Stock |
¥ | 2,256,767 | ¥ | 2,256,767 | ||||
| Capital Surplus |
1,125,324 | 1,129,267 | ||||||
| Retained Earnings |
4,756,435 | 5,093,911 | ||||||
| Treasury Stock |
(8,342 | ) | (8,786 | ) | ||||
|
|
|
|
|
|||||
| Total Shareholders’ Equity |
8,130,185 | 8,471,160 | ||||||
|
|
|
|
|
|||||
| Net Unrealized Gains (Losses) on Other Securities |
719,822 | 564,495 | ||||||
| Deferred Gains or Losses on Hedges |
(76,757 | ) | (358,102 | ) | ||||
| Revaluation Reserve for Land |
132,156 | 129,321 | ||||||
| Foreign Currency Translation Adjustments |
2,346 | 144,093 | ||||||
| Remeasurements of Defined Benefit Plans |
169,652 | 182,306 | ||||||
| Own Credit Risk Adjustments, Net of Tax |
(23 | ) | 19 | |||||
|
|
|
|
|
|||||
| Total Accumulated Other Comprehensive Income |
947,197 | 662,133 | ||||||
|
|
|
|
|
|||||
| Stock Acquisition Rights |
94 | 5 | ||||||
| Non-controlling Interests |
123,555 | 75,163 | ||||||
|
|
|
|
|
|||||
| Total Net Assets |
9,201,031 | 9,208,463 | ||||||
|
|
|
|
|
|||||
| Total Liabilities and Net Assets |
¥ | 237,066,142 | ¥ | 254,258,203 | ||||
|
|
|
|
|
|||||
1-6
Mizuho Financial Group, Inc.
(2) Consolidated Statements of Income and Consolidated Statements of Comprehensive Income
Consolidated Statements of Income
| Millions of yen | ||||||||
| For the fiscal year ended March 31, 2022 |
For the fiscal year ended March 31, 2023 |
|||||||
| Ordinary Income |
¥ | 3,963,091 | ¥ | 5,778,772 | ||||
| Interest Income |
1,309,009 | 3,178,214 | ||||||
| Interest on Loans and Bills Discounted |
877,895 | 1,750,984 | ||||||
| Interest and Dividends on Securities |
275,393 | 392,104 | ||||||
| Interest on Call Loans and Bills Purchased |
1,426 | 13,898 | ||||||
| Interest on Receivables under Resale Agreements |
29,694 | 281,313 | ||||||
| Interest on Securities Borrowing Transactions |
2,431 | 22,411 | ||||||
| Interest on Due from Banks |
58,748 | 498,504 | ||||||
| Other Interest Income |
63,419 | 218,996 | ||||||
| Fiduciary Income |
60,490 | 58,958 | ||||||
| Fee and Commission Income |
905,575 | 915,534 | ||||||
| Trading Income |
1,017,889 | 992,631 | ||||||
| Other Operating Income |
393,956 | 452,853 | ||||||
| Other Ordinary Income |
276,170 | 180,579 | ||||||
| Recovery of Written-off Claims |
18,260 | 7,730 | ||||||
| Other |
257,910 | 172,848 | ||||||
| Ordinary Expenses |
3,403,244 | 4,989,165 | ||||||
| Interest Expenses |
315,550 | 2,217,636 | ||||||
| Interest on Deposits |
64,829 | 840,042 | ||||||
| Interest on Negotiable Certificates of Deposit |
15,436 | 209,222 | ||||||
| Interest on Call Money and Bills Sold |
1,149 | 17,140 | ||||||
| Interest on Payables under Repurchase Agreements |
36,356 | 651,987 | ||||||
| Interest on Securities Lending Transactions |
42 | 8,734 | ||||||
| Interest on Commercial Paper |
3,721 | 51,776 | ||||||
| Interest on Borrowed Money |
6,034 | 34,377 | ||||||
| Interest on Short-term Bonds |
68 | 71 | ||||||
| Interest on Bonds and Notes |
171,577 | 238,031 | ||||||
| Other Interest Expenses |
16,334 | 166,251 | ||||||
| Fee and Commission Expenses |
164,579 | 163,841 | ||||||
| Trading Expenses |
730,204 | 657,923 | ||||||
| Other Operating Expenses |
224,116 | 280,386 | ||||||
| General and Administrative Expenses |
1,392,896 | 1,445,283 | ||||||
| Other Ordinary Expenses |
575,896 | 224,095 | ||||||
| Provision for Reserves for Possible Losses on Loans |
236,491 | 65,698 | ||||||
| Other |
339,404 | 158,396 | ||||||
|
|
|
|
|
|||||
| Ordinary Profits |
¥ | 559,847 | ¥ | 789,606 | ||||
|
|
|
|
|
|||||
1-7
Mizuho Financial Group, Inc.
| Millions of yen | ||||||||
| For the fiscal year ended March 31, 2022 |
For the fiscal year ended March 31, 2023 |
|||||||
| Extraordinary Gains |
¥ | 78,196 | ¥ | 50,888 | ||||
| Gains on Disposition of Fixed Assets |
3,938 | 3,260 | ||||||
| Gains on Cancellation of Employee Retirement Benefit Trust |
74,254 | 47,627 | ||||||
| Other Extraordinary Gains |
3 | — | ||||||
| Extraordinary Losses |
34,171 | 61,530 | ||||||
| Losses on Disposition of Fixed Assets |
6,585 | 7,462 | ||||||
| Losses on Impairment of Fixed Assets |
27,585 | 51,545 | ||||||
| Losses on Sales of Shares of Affiliates |
— | 2,301 | ||||||
| Other Extraordinary Losses |
— | 220 | ||||||
|
|
|
|
|
|||||
| Income before Income Taxes |
603,872 | 778,964 | ||||||
|
|
|
|
|
|||||
| Income Taxes: |
||||||||
| Current |
130,079 | 180,716 | ||||||
| Refund of Income Taxes |
(12,738 | ) | (9,911 | ) | ||||
| Deferred |
(56,652 | ) | 48,029 | |||||
|
|
|
|
|
|||||
| Total Income Taxes |
60,688 | 218,834 | ||||||
|
|
|
|
|
|||||
| Profit |
543,183 | 560,130 | ||||||
|
|
|
|
|
|||||
| Profit Attributable to Non-controlling Interests |
12,703 | 4,602 | ||||||
|
|
|
|
|
|||||
| Profit Attributable to Owners of Parent |
¥ | 530,479 | ¥ | 555,527 | ||||
|
|
|
|
|
|||||
1-8
Mizuho Financial Group, Inc.
Consolidated Statements of Comprehensive Income
| Millions of yen | ||||||||
| For the fiscal year ended March 31, 2022 |
For the fiscal year ended March 31, 2023 |
|||||||
| Profit |
¥ | 543,183 | ¥ | 560,130 | ||||
| Other Comprehensive Income (Loss) |
(496,061 | ) | (282,463 | ) | ||||
| Net Unrealized Gains (Losses) on Other Securities |
(411,077 | ) | (157,244 | ) | ||||
| Deferred Gains or Losses on Hedges |
(108,186 | ) | (281,515 | ) | ||||
| Foreign Currency Translation Adjustments |
130,612 | 127,170 | ||||||
| Remeasurements of Defined Benefit Plans |
(115,038 | ) | 13,298 | |||||
| Own Credit Risk Adjustments, Net of Tax |
(23 | ) | 42 | |||||
| Share of Other Comprehensive Income of Associates Accounted for Using Equity Method |
7,650 | 15,783 | ||||||
|
|
|
|
|
|||||
| Comprehensive Income |
47,121 | 277,666 | ||||||
|
|
|
|
|
|||||
| (Breakdown) |
||||||||
| Comprehensive Income Attributable to Owners of Parent |
33,676 | 273,298 | ||||||
| Comprehensive Income Attributable to Non-controlling Interests |
13,444 | 4,368 | ||||||
1-9
Mizuho Financial Group, Inc.
(3) Consolidated Statements of Changes in Net Assets
For the fiscal year ended March 31, 2022
| Millions of yen | ||||||||||||||||||||
| Shareholders’ Equity | ||||||||||||||||||||
| Common Stock |
Capital Surplus |
Retained Earnings |
Treasury Stock |
Total Shareholders’ Equity |
||||||||||||||||
| Balance as of the beginning of the period |
2,256,767 | 1,135,940 | 4,421,655 | (7,124 | ) | 7,807,239 | ||||||||||||||
| Cumulative Effects of Changes in Accounting Policies |
(724 | ) | (724 | ) | ||||||||||||||||
| Balance as of the beginning of the period reflecting Changes in Accounting Policies |
2,256,767 | 1,135,940 | 4,420,931 | (7,124 | ) | 7,806,515 | ||||||||||||||
| Changes during the period |
||||||||||||||||||||
| Cash Dividends |
(196,746 | ) | (196,746 | ) | ||||||||||||||||
| Profit Attributable to Owners of Parent |
530,479 | 530,479 | ||||||||||||||||||
| Repurchase of Treasury Stock |
(2,869 | ) | (2,869 | ) | ||||||||||||||||
| Disposition of Treasury Stock |
(54 | ) | 1,651 | 1,597 | ||||||||||||||||
| Transfer from Revaluation Reserve for Land |
4,227 | 4,227 | ||||||||||||||||||
| Change in Treasury Shares of Parent Arising from Transactions with Non-controlling Shareholders |
(10,616 | ) | (10,616 | ) | ||||||||||||||||
| Decrease in Retained Earnings by Decreasing of Equity Method Affiliates and Others |
(2,402 | ) | (2,402 | ) | ||||||||||||||||
| Transfer from Retained Earnings to Capital Surplus |
54 | (54 | ) | — | ||||||||||||||||
| Net Changes in Items other than Shareholders’ Equity |
||||||||||||||||||||
|
|
|
|
|
|
|
|
|
|
|
|||||||||||
| Total Changes during the period |
— | (10,616 | ) | 335,503 | (1,217 | ) | 323,669 | |||||||||||||
|
|
|
|
|
|
|
|
|
|
|
|||||||||||
| Balance as of the end of the period |
2,256,767 | 1,125,324 | 4,756,435 | (8,342 | ) | 8,130,185 | ||||||||||||||
|
|
|
|
|
|
|
|
|
|
|
|||||||||||
| Accumulated Other Comprehensive Income | Stock Acquisition Rights |
Non-Controlling Interests |
Total Net Assets |
|||||||||||||||||||||||||||||||||||||
| Net Unrealized Gains (Losses) on Other Securities |
Deferred Gains or Losses on Hedges |
Revaluation Reserve for Land |
Foreign Currency Translation Adjustments |
Remeasurements of Defined Benefit Plans |
Own Credit Risk Adjustments, Net of Tax |
Total Accumulated Other Comprehensive Income |
||||||||||||||||||||||||||||||||||
| Balance as of the beginning of the period |
1,132,460 | 31,618 | 136,384 | (139,514 | ) | 288,088 | — | 1,449,035 | 134 | 105,797 | 9,362,207 | |||||||||||||||||||||||||||||
| Cumulative Effects of Changes in Accounting Policies |
— | (724 | ) | |||||||||||||||||||||||||||||||||||||
| Balance as of the beginning of the period reflecting Changes in Accounting Policies |
1,132,460 | 31,618 | 136,384 | (139,514 | ) | 288,088 | — | 1,449,035 | 134 | 105,797 | 9,361,483 | |||||||||||||||||||||||||||||
| Changes during the period |
||||||||||||||||||||||||||||||||||||||||
| Cash Dividends |
(196,746 | ) | ||||||||||||||||||||||||||||||||||||||
| Profit Attributable to Owners of Parent |
530,479 | |||||||||||||||||||||||||||||||||||||||
| Repurchase of Treasury Stock |
(2,869 | ) | ||||||||||||||||||||||||||||||||||||||
| Disposition of Treasury Stock |
1,597 | |||||||||||||||||||||||||||||||||||||||
| Transfer from Revaluation Reserve for Land |
4,227 | |||||||||||||||||||||||||||||||||||||||
| Change in Treasury Shares of Parent Arising from Transactions with Non-controlling Shareholders |
(10,616 | ) | ||||||||||||||||||||||||||||||||||||||
| Decrease in Retained Earnings by Decreasing of Equity Method Affiliates and Others |
(2,402 | ) | ||||||||||||||||||||||||||||||||||||||
| Transfer from Retained Earnings to Capital Surplus |
— | |||||||||||||||||||||||||||||||||||||||
| Net Changes in Items other than Shareholders’ Equity |
(412,638 | ) | (108,375 | ) | (4,227 | ) | 141,861 | (118,435 | ) | (23 | ) | (501,838 | ) | (40 | ) | 17,757 | (484,121 | ) | ||||||||||||||||||||||
|
|
|
|
|
|
|
|
|
|
|
|
|
|
|
|
|
|
|
|
|
|||||||||||||||||||||
| Total Changes during the period |
(412,638 | ) | (108,375 | ) | (4,227 | ) | 141,861 | (118,435 | ) | (23 | ) | (501,838 | ) | (40 | ) | 17,757 | (160,451 | ) | ||||||||||||||||||||||
|
|
|
|
|
|
|
|
|
|
|
|
|
|
|
|
|
|
|
|
|
|||||||||||||||||||||
| Balance as of the end of the period |
719,822 | (76,757 | ) | 132,156 | 2,346 | 169,652 | (23 | ) | 947,197 | 94 | 123,555 | 9,201,031 | ||||||||||||||||||||||||||||
|
|
|
|
|
|
|
|
|
|
|
|
|
|
|
|
|
|
|
|
|
|||||||||||||||||||||
1-10
Mizuho Financial Group, Inc.
For the fiscal year ended March 31, 2023
| Millions of yen | ||||||||||||||||||||
| Shareholders’ Equity | ||||||||||||||||||||
| Common Stock |
Capital Surplus |
Retained Earnings |
Treasury Stock |
Total Shareholders’ Equity |
||||||||||||||||
| Balance as of the beginning of the period |
2,256,767 | 1,125,324 | 4,756,435 | (8,342 | ) | 8,130,185 | ||||||||||||||
| Changes during the period |
||||||||||||||||||||
| Cash Dividends |
(209,432 | ) | (209,432 | ) | ||||||||||||||||
| Profit Attributable to Owners of Parent |
555,527 | 555,527 | ||||||||||||||||||
| Repurchase of Treasury Stock |
(2,314 | ) | (2,314 | ) | ||||||||||||||||
| Disposition of Treasury Stock |
(255 | ) | 1,870 | 1,615 | ||||||||||||||||
| Transfer from Revaluation Reserve for Land |
2,834 | 2,834 | ||||||||||||||||||
| Change in Treasury Shares of Parent Arising from Transactions with Non-controlling Shareholders |
4,064 | 4,064 | ||||||||||||||||||
| Decrease in Retained Earnings by Decreasing of Equity Method Affiliates and Others |
(11,319 | ) | (11,319 | ) | ||||||||||||||||
| Transfer from Retained Earnings to Capital Surplus |
134 | (134 | ) | — | ||||||||||||||||
| Net Changes in Items other than Shareholders’ Equity |
||||||||||||||||||||
|
|
|
|
|
|
|
|
|
|
|
|||||||||||
| Total Changes during the period |
— | 3,943 | 337,475 | (443 | ) | 340,975 | ||||||||||||||
|
|
|
|
|
|
|
|
|
|
|
|||||||||||
| Balance as of the end of the period |
2,256,767 | 1,129,267 | 5,093,911 | (8,786 | ) | 8,471,160 | ||||||||||||||
|
|
|
|
|
|
|
|
|
|
|
|||||||||||
| Accumulated Other Comprehensive Income | Stock Acquisition Rights |
Non-Controlling Interests |
Total Net Assets |
|||||||||||||||||||||||||||||||||||||
| Net Unrealized Gains (Losses) on Other Securities |
Deferred Gains or Losses on Hedges |
Revaluation Reserve for Land |
Foreign Currency Translation Adjustments |
Remeasurements of Defined Benefit Plans |
Own Credit Risk Adjustments, Net of Tax |
Total Accumulated Other Comprehensive Income |
||||||||||||||||||||||||||||||||||
| Balance as of the beginning of the period |
719,822 | (76,757 | ) | 132,156 | 2,346 | 169,652 | (23 | ) | 947,197 | 94 | 123,555 | 9,201,031 | ||||||||||||||||||||||||||||
| Changes during the period |
||||||||||||||||||||||||||||||||||||||||
| Cash Dividends |
(209,432 | ) | ||||||||||||||||||||||||||||||||||||||
| Profit Attributable to Owners of Parent |
555,527 | |||||||||||||||||||||||||||||||||||||||
| Repurchase of Treasury Stock |
(2,314 | ) | ||||||||||||||||||||||||||||||||||||||
| Disposition of Treasury Stock |
1,615 | |||||||||||||||||||||||||||||||||||||||
| Transfer from Revaluation Reserve for Land |
2,834 | |||||||||||||||||||||||||||||||||||||||
| Change in Treasury Shares of Parent Arising from Transactions with Non-controlling Shareholders |
4,064 | |||||||||||||||||||||||||||||||||||||||
| Decrease in Retained Earnings by Decreasing of Equity Method Affiliates and Others |
(11,319 | ) | ||||||||||||||||||||||||||||||||||||||
| Transfer from Retained Earnings to Capital Surplus |
— | |||||||||||||||||||||||||||||||||||||||
| Net Changes in Items other than Shareholders’ Equity |
(155,326 | ) | (281,345 | ) | (2,834 | ) | 141,746 | 12,654 | 42 | (285,063 | ) | (88 | ) | (48,392 | ) | (333,544 | ) | |||||||||||||||||||||||
|
|
|
|
|
|
|
|
|
|
|
|
|
|
|
|
|
|
|
|
|
|||||||||||||||||||||
| Total Changes during the period |
(155,326 | ) | (281,345 | ) | (2,834 | ) | 141,746 | 12,654 | 42 | (285,063 | ) | (88 | ) | (48,392 | ) | 7,431 | ||||||||||||||||||||||||
|
|
|
|
|
|
|
|
|
|
|
|
|
|
|
|
|
|
|
|
|
|||||||||||||||||||||
| Balance as of the end of the period |
564,495 | (358,102 | ) | 129,321 | 144,093 | 182,306 | 19 | 662,133 | 5 | 75,163 | 9,208,463 | |||||||||||||||||||||||||||||
|
|
|
|
|
|
|
|
|
|
|
|
|
|
|
|
|
|
|
|
|
|||||||||||||||||||||
1-11
Mizuho Financial Group, Inc.
(4) Consolidated Statements of Cash Flows
| Millions of yen | ||||||||
| For the fiscal year ended March 31, 2022 |
For the fiscal year ended March 31, 2023 |
|||||||
| Cash Flow from Operating Activities |
||||||||
| Income before Income Taxes |
¥ | 603,872 | ¥ | 778,964 | ||||
| Depreciation |
161,897 | 163,166 | ||||||
| Losses on Impairment of Fixed Assets |
27,585 | 51,545 | ||||||
| Amortization of Goodwill |
3,741 | 3,771 | ||||||
| Equity in Loss (Gain) from Investments in Affiliates |
(25,434 | ) | (11,889 | ) | ||||
| Increase (Decrease) in Reserves for Possible Losses on Loans |
194,340 | (71,488 | ) | |||||
| Increase (Decrease) in Reserve for Possible Losses on Investments |
106 | (106 | ) | |||||
| Increase (Decrease) in Reserve for Possible Losses on Sales of Loans |
234 | 13,740 | ||||||
| Increase (Decrease) in Reserve for Contingencies |
(202 | ) | 6,115 | |||||
| Increase (Decrease) in Reserve for Bonus Payments |
11,954 | 1,746 | ||||||
| Increase (Decrease) in Reserve for Variable Compensation |
(656 | ) | 102 | |||||
| Decrease (Increase) in Net Defined Benefit Asset |
56,392 | 69,067 | ||||||
| Increase (Decrease) in Net Defined Benefit Liability |
6,169 | (4,506 | ) | |||||
| Increase (Decrease) in Reserve for Director and Corporate Auditor Retirement Benefits |
(126 | ) | (17 | ) | ||||
| Increase (Decrease) in Reserve for Reimbursement of Deposits |
(4,479 | ) | (3,924 | ) | ||||
| Increase (Decrease) in Reserve for Reimbursement of Debentures |
(3,915 | ) | (2,706 | ) | ||||
| Interest Income—accrual basis |
(1,309,009 | ) | (3,178,214 | ) | ||||
| Interest Expenses—accrual basis |
315,550 | 2,217,636 | ||||||
| Losses (Gains) on Securities |
62,305 | 50,633 | ||||||
| Losses (Gains) on Money Held in Trust |
85 | 22 | ||||||
| Foreign Exchange Losses (Gains)—net |
(928,800 | ) | (662,938 | ) | ||||
| Losses (Gains) on Disposition of Fixed Assets |
2,647 | 4,202 | ||||||
| Losses (Gains) on Cancellation of Employee Retirement Benefit Trust |
(74,254 | ) | (47,627 | ) | ||||
| Decrease (Increase) in Trading Assets |
(201,023 | ) | (3,869,757 | ) | ||||
| Increase (Decrease) in Trading Liabilities |
1,234,368 | 2,855,475 | ||||||
| Decrease (Increase) in Derivatives other than for Trading Assets |
(528,425 | ) | 118,439 | |||||
| Increase (Decrease) in Derivatives other than for Trading Liabilities |
996,914 | (46,028 | ) | |||||
| Decrease (Increase) in Loans and Bills Discounted |
1,343,307 | (2,092,530 | ) | |||||
| Increase (Decrease) in Deposits |
3,508,335 | 10,000,741 | ||||||
| Increase (Decrease) in Negotiable Certificates of Deposit |
(913,529 | ) | (3,395,330 | ) | ||||
| Increase (Decrease) in Borrowed Money (excluding Subordinated Borrowed Money) |
(869,766 | ) | (2,436,997 | ) | ||||
| Decrease (Increase) in Due from Banks (excluding Due from Central Banks) |
(125,565 | ) | (44,557 | ) | ||||
| Decrease (Increase) in Call Loans, etc. |
(928,392 | ) | 1,029,697 | |||||
| Decrease (Increase) in Guarantee Deposits Paid under Securities Borrowing Transactions |
367,621 | 442,660 | ||||||
| Increase (Decrease) in Call Money, etc. |
(133,057 | ) | 4,808,324 | |||||
| Increase (Decrease) in Commercial Paper |
(551,464 | ) | (155,216 | ) | ||||
| Increase (Decrease) in Guarantee Deposits Received under Securities Lending Transactions |
214,099 | (414,405 | ) | |||||
| Decrease (Increase) in Foreign Exchange Assets |
(398,661 | ) | 357,779 | |||||
| Increase (Decrease) in Foreign Exchange Liabilities |
973,697 | (837,977 | ) | |||||
| Increase (Decrease) in Short-term Bonds (Liabilities) |
81,121 | (60,026 | ) | |||||
| Increase (Decrease) in Bonds and Notes |
607,064 | 887,829 | ||||||
| Increase (Decrease) in Due to Trust Accounts |
6,676 | 366,812 | ||||||
| Interest and Dividend Income—cash basis |
1,424,865 | 3,027,958 | ||||||
| Interest Expenses—cash basis |
(273,855 | ) | (2,028,391 | ) | ||||
| Other—net |
147,257 | 1,108,820 | ||||||
|
|
|
|
|
|||||
| Subtotal |
5,081,594 | 9,000,617 | ||||||
|
|
|
|
|
|||||
| Cash Refunded (Paid) in Income Taxes |
(164,408 | ) | (133,371 | ) | ||||
|
|
|
|
|
|||||
| Net Cash Provided by (Used in) Operating Activities |
4,917,186 | 8,867,246 | ||||||
|
|
|
|
|
|||||
1-12
Mizuho Financial Group, Inc.
| Millions of yen | ||||||||
| For the fiscal year ended March 31, 2022 |
For the fiscal year ended March 31, 2023 |
|||||||
| Cash Flow from Investing Activities |
||||||||
| Payments for Purchase of Securities |
(102,478,445 | ) | (80,978,246 | ) | ||||
| Proceeds from Sale of Securities |
57,161,461 | 44,652,769 | ||||||
| Proceeds from Redemption of Securities |
43,586,621 | 43,032,475 | ||||||
| Payments for Increase in Money Held in Trust |
(31,898 | ) | (3,843 | ) | ||||
| Proceeds from Decrease in Money Held in Trust |
22,312 | 79,409 | ||||||
| Payments for Purchase of Tangible Fixed Assets |
(42,297 | ) | (64,845 | ) | ||||
| Payments for Purchase of Intangible Fixed Assets |
(96,964 | ) | (118,331 | ) | ||||
| Proceeds from Sale of Tangible Fixed Assets |
18,239 | 9,813 | ||||||
| Proceeds from Sale of Intangible Fixed Assets |
480 | — | ||||||
| Payments for Purchase of Stocks of Subsidiaries (affecting the scope of consolidation) |
— | (3,533 | ) | |||||
|
|
|
|
|
|||||
| Net Cash Provided by (Used in) Investing Activities |
(1,860,490 | ) | 6,605,667 | |||||
|
|
|
|
|
|||||
| Cash Flow from Financing Activities |
||||||||
| Proceeds from Subordinated Borrowed Money |
10,000 | 20,000 | ||||||
| Repayments of Subordinated Borrowed Money |
(4,000 | ) | (35,000 | ) | ||||
| Proceeds from Issuance of Subordinated Bonds |
171,410 | 208,500 | ||||||
| Payments for Redemption of Subordinated Bonds |
(494,000 | ) | (544,615 | ) | ||||
| Proceeds from Investments by Non-controlling Shareholders |
565 | 2,219 | ||||||
| Repayments to Non-controlling Shareholders |
(502 | ) | (324 | ) | ||||
| Cash Dividends Paid |
(196,783 | ) | (209,457 | ) | ||||
| Cash Dividends Paid to Non-controlling Shareholders |
(7,693 | ) | (10,459 | ) | ||||
| Payments for Purchase of Stocks of Subsidiaries (not affecting the scope of consolidation) |
— | (41,307 | ) | |||||
| Payments for Repurchase of Treasury Stock |
(1,927 | ) | (2,314 | ) | ||||
| Proceeds from Sale of Treasury Stock |
873 | 1,615 | ||||||
| Payments for Repurchase of Treasury Stock of Subsidiaries |
(0 | ) | — | |||||
|
|
|
|
|
|||||
| Net Cash Provided by (Used in) Financing Activities |
(522,056 | ) | (611,143 | ) | ||||
|
|
|
|
|
|||||
| Effect of Foreign Exchange Rate Changes on Cash and Cash Equivalents |
620,261 | 827,611 | ||||||
|
|
|
|
|
|||||
| Net Increase (Decrease) in Cash and Cash Equivalents |
3,154,900 | 15,689,381 | ||||||
|
|
|
|
|
|||||
| Cash and Cash Equivalents at the beginning of the fiscal year |
46,981,399 | 50,136,299 | ||||||
|
|
|
|
|
|||||
| Cash and Cash Equivalents at the end of the fiscal year |
¥ | 50,136,299 | ¥ | 65,825,681 | ||||
|
|
|
|
|
|||||
1-13
Mizuho Financial Group, Inc.
(5) Notes regarding Consolidated Financial Statements
(Matters Related to the Assumption of Going Concern)
There is no applicable information.
(Changes in Accounting Policies)
(Implementation Guidance on Accounting Standard for Fair Value Measurement)
MHFG has applied “Implementation Guidance on Accounting Standard for Fair Value Measurement” (ASBJ Guidance No.31, June 17, 2021 (referred to as “Fair Value Accounting Standard Implementation Guidance”)) from the beginning of the consolidated fiscal year ended March 31, 2023. In accordance with the transitional treatment set out in Paragraph 27-2 of “Fair Value Accounting Standard Implementation Guidance”, MHFG applies the new accounting policy set forth in “Fair Value Accounting Standard Implementation Guidance” prospectively. As a result, some Investment trusts and others are calculated using net asset value, etc., as of the calculation date of the fair value.
1-14
Mizuho Financial Group, Inc.
(Business Segment Information)
1. Summary of reportable segment
MHFG has introduced an in-house company system based on the group’s diverse customer segments.
The aim of this system is to leverage MHFG’s strengths and competitive advantage, which is the seamless integration of MHFG’s banking, trust and securities functions under a holding company structure, to speedily provide high-quality financial services that closely match customer needs.
Specifically, the company system is classified into the following five in-house companies, each based on a customer segment: the Retail & Business Banking Company, the Corporate & Institutional Company, the Global Corporate Company, the Global Markets Company, and the Asset Management Company.
The services that each in-house company is in charge of are as follows:
Retail & Business Banking Company:
Services for individual customers, small and medium-sized enterprises and middle market firms in Japan
Corporate & Institutional Company:
Services for large corporations, financial institutions and public corporations in Japan
Global Corporate Company:
Services for Japanese overseas affiliated corporate customers and non-Japanese corporate customers, etc.
Global Markets Company:
Investment services with respect to interest rates, equities and credits, etc. , and other services
Asset Management Company:
Development of products and provision of services that match the asset management needs of its wide range of customers from individuals to institutional investors
The reportable segment information, set forth below, is derived from the internal management reporting systems used by management to measure the performance of the Group’s operating segments.
Management measures the performance of each of the operating segments in accordance with internal managerial accounting rules and practices.
2. Calculating method of Gross profits (excluding the amounts of credit costs of trust accounts) + Net gains or losses related to ETFs and others, Net business profits or losses (excluding the amounts of credit costs of trust accounts, before reversal of (provision for) general reserve for losses on loans) + Net gains or losses related to ETFs and others, and Fixed assets by reportable segment
The following information of reportable segment is based on internal management reporting.
Gross profits (excluding the amounts of credit costs of trust accounts) + Net gains or losses related to ETFs and others is the total amount of Interest Income, Fiduciary Income, Fee and Commission Income, Trading Income, Other Operating Income, and Net gains or losses related to ETFs and others.
Net business profits or losses (excluding the amounts of credit costs of trust accounts, before reversal of (provision for) general reserve for losses on loans) + Net gains or losses related to ETFs and others is the amount of which General and administrative expenses (excluding non-recurring expenses and others), Equity in income from investments in affiliates, and Amortization of goodwill and others (including amortization of intangible assets) are deducted from, or added to, Gross profits (excluding the amounts of credit costs of trust accounts) + Net gains or losses related to ETFs and others.
Gross profits (excluding the amounts of credit costs of trust accounts) + Net gains or losses related to ETFs and others relating to transactions between segments is based on the current market price.
Fixed assets disclosed as asset information by segment are the total amount of tangible fixed assets and intangible fixed assets. Fixed assets pertaining to Mizuho Bank, Ltd., Mizuho Trust & Banking Co., Ltd., and Mizuho Securities Co., Ltd. have been allocated to each segment.
1-15
Mizuho Financial Group, Inc.
3. Gross profits (excluding the amounts of credit costs of trust accounts) + Net gains or losses related to ETFs and others, Net business profits or losses (excluding the amounts of credit costs of trust accounts, before reversal of (provision for) general reserve for losses on loans) + Net gains or losses related to ETFs and others, and Fixed assets by reportable segment
| Millions of yen | ||||||||||||||||||||||||||||
| MHFG (Consolidated) | ||||||||||||||||||||||||||||
| Retail & Business Banking Company |
Corporate & Institutional Company |
Global Corporate Company |
Global Markets Company |
Asset Management Company |
Others (Note 2) |
|||||||||||||||||||||||
| Gross profits (excluding the amounts of credit costs of trust accounts) + Net gains or losses related to ETFs and others |
704,010 | 502,333 | 672,208 | 321,205 | 55,165 | 25,325 | 2,280,246 | |||||||||||||||||||||
| General and administrative expenses (excluding Non-Recurring Losses and others) |
611,572 | 197,274 | 322,981 | 258,031 | 35,194 | 48,512 | 1,473,564 | |||||||||||||||||||||
| Equity in income from investments in affiliates |
(17,036 | ) | 6,376 | 22,781 | — | 241 | (472 | ) | 11,889 | |||||||||||||||||||
| Amortization of goodwill and others |
2,071 | 91 | 740 | 770 | 6,861 | 901 | 11,434 | |||||||||||||||||||||
| Net business profits or losses (excluding the amounts of credit costs of trust accounts, before reversal of (provision for) general reserve for losses on loans) + Net gains or losses related to ETFs and others |
73,331 | 311,344 | 371,268 | 62,404 | 13,351 | (24,561 | ) | 807,136 | ||||||||||||||||||||
| Fixed assets |
489,333 | 150,141 | 173,722 | 87,865 | — | 777,510 | 1,678,571 | |||||||||||||||||||||
| Notes: 1. |
Gross profits (excluding the amounts of credit costs of trust accounts) +Net gains or losses related to ETFs and others is reported instead of sales reported by general corporations. Net gains or losses related to ETFs and others amounted to ¥ 1,840 million, of which ¥ (299) million is included in the Global Markets Company. | |
| 2. |
“Others” includes items which should be eliminated as internal transactions between each segment on a consolidated basis. | |
| 3. |
“Others” in Fixed assets includes assets of headquarters that have not been allocated to each segment, Fixed assets pertaining to consolidated subsidiaries that are not subject to allocation, consolidated adjustments, and others. | |
| Among Fixed assets that have not been allocated to each segment, some related expenses are allocated to each segment using a reasonable criteria of allocation. | ||
1-16
Mizuho Financial Group, Inc.
4. The difference between the total amounts of reportable segments and the recorded amounts in the Consolidated Statement of Income, and the contents of the difference (Matters relating to adjustment to difference)
The above amount of Gross profits (excluding the amounts of credit costs of trust accounts) + Net gains or losses related to ETFs and others and that of Net business profits (excluding the amounts of credit costs of trust accounts, before reversal of (provision for) general reserve for losses on loans) + Net gains or losses related to ETFs and others derived from internal management reporting by reportable segment are different from the amounts recorded in the Consolidated Statement of Income.
The contents of the difference for the period are as follows:
| (1) | The total of Gross profits (excluding the amounts of credit costs of trust accounts) + Net gains or losses related to ETFs and others of Segment Information and Ordinary Profits recorded in the Consolidated Statement of Income |
| Millions of yen | ||||
| Amount | ||||
| Gross profits (excluding the amounts of credit costs of trust accounts) + Net gains or losses related to ETFs and others | 2,280,246 | |||
| Net gains or losses related to ETFs and others |
(1,840 | ) | ||
| Other Ordinary Income |
180,579 | |||
| General and Administrative Expenses |
(1,445,283 | ) | ||
| Other Ordinary Expenses |
(224,095 | ) | ||
|
|
|
|||
| Ordinary Profits recorded in Consolidated Statement of Income |
789,606 | |||
|
|
|
|||
| (2) | The total of Net business profits (excluding the amounts of credit costs of trust accounts, before reversal of (provision for) general reserve for losses on loans) + Net gains or losses related to ETFs and others of Segment Information and Income before Income Taxes recorded in the Consolidated Statement of Income |
| Millions of yen | ||||
| Amount | ||||
| Net Business Profits (excluding the amounts of credit costs of trust accounts, before reversal of (provision for) general reserve for losses on loans) + Net Gains (Losses) related to ETFs and others |
807,136 | |||
| General and Administrative Expenses (non-recurring losses) |
39,715 | |||
| Expenses related to Portfolio Problems (including reversal of (provision for) general reserve for losses on loans) |
(96,737 | ) | ||
| Gains on Reversal of Reserves for Possible Losses on Loans, and others |
7,426 | |||
| Net Gains (Losses) related to Stocks—Net Gains (Losses) related to ETFs and others |
84,633 | |||
| Net Extraordinary Gains (Losses) |
(10,641 | ) | ||
| Others |
(52,568 | ) | ||
|
|
|
|||
| Income before Income Taxes recorded in Consolidated Statement of Income |
778,964 | |||
|
|
|
|||
1-17
Mizuho Financial Group, Inc.
(Per Share Information)
(Consolidated basis)
| Fiscal 2021 | Fiscal 2022 | |||||||||||
| Net Assets per Share of Common Stock |
¥ | 3,581.39 | ¥ | 3,603.98 | ||||||||
| Net Income per Share of Common Stock |
¥ | 209.27 | ¥ | 219.20 | ||||||||
| Diluted Net Income per Share of Common Stock |
¥ | 209.26 | ¥ | 219.19 | ||||||||
| Notes: 1. | Total Net Assets per Share of Common Stock is based on the following information: |
| Fiscal 2021 | Fiscal 2022 | |||||||||||
| Net Assets per Share of Common Stock |
|
|||||||||||
| Total Net Assets |
¥ | million | 9,201,031 | 9,208,463 | ||||||||
| Deductions from Total Net Assets |
¥ | million | 123,649 | 75,168 | ||||||||
| Stock Acquisition Rights |
¥ | million | 94 | 5 | ||||||||
| Non-Controlling Interests |
¥ | million | 123,555 | 75,163 | ||||||||
| Net Assets (year-end) related to Common Stock |
¥ | million | 9,077,382 | 9,133,294 | ||||||||
| Year-end Outstanding Shares of Common Stock, based on
which Total Net Assets per Share |
|
Thousands of shares |
|
2,534,590 | 2,534,222 | |||||||
| 2. | Net Income per Share of Common Stock and Diluted Net Income per Share of Common Stock are based on the following information: |
| Fiscal 2021 | Fiscal 2022 | |||||||||||
| Net Income per Share of Common Stock |
|
|||||||||||
| Profit Attributable to Owners of Parent |
¥ | million | 530,479 | 555,527 | ||||||||
| Amount not attributable to Common Stock |
¥ | million | — | — | ||||||||
| Profit Attributable to Owners of Parent related to Common Stock |
¥ | million | 530,479 | 555,527 | ||||||||
| Average Outstanding Shares of Common Stock (during the period) |
|
Thousands of shares |
|
2,534,897 | 2,534,340 | |||||||
| Diluted Net Income per Share of Common Stock |
|
|||||||||||
| Adjustment to Profit Attributable to Owners of Parent |
¥ | million | — | — | ||||||||
| Increased Number of Shares of Common Stock |
|
Thousands of shares |
|
65 | 15 | |||||||
| Stock Acquisition Rights |
|
Thousands of shares |
|
65 | 15 | |||||||
| Description of dilutive securities which were not included in the calculation of Diluted
Net |
— | — | ||||||||||
1-18
Mizuho Financial Group, Inc.
| 3. | In the calculation of Net Assets per Share of Common Stock, MHFG shares outstanding in BBT trust account that were recognized as Treasury Stock in Shareholders’ Equity are included in Treasury Stock shares deducted from the number of issued shares as of March 31, 2022 and 2023. The numbers of such Treasury Stock shares deducted during the period ended March 31, 2022 and 2023 are 3,079 thousand and 3,231 thousand, respectively. |
| In the calculation of Net Income per Share of Common Stock and Diluted Net Income per Share of Common Stock, such Treasury Stock shares are included in Treasury Stock shares deducted in the calculation of the Average Outstanding Shares of Common Stock during the period. The average numbers of such Treasury Stock shares deducted during the period ended March 31, 2022 and 2023 are 2,892 thousand and 3,275 thousand, respectively. |
(Subsequent Events)
There is no applicable information.
1-19
SELECTED FINANCIAL INFORMATION
For Fiscal 2022
(Under Japanese GAAP)

C O N T E N T S
Notes:
“CON”: Consolidated figures for Mizuho Financial Group, Inc. (“MHFG”)
“NON”: Non-consolidated figures for Mizuho Financial Group, Inc., Mizuho Bank, Ltd. (“MHBK”) and Mizuho Trust & Banking Co., Ltd. (“MHTB”)
| I. FINANCIAL DATA FOR FISCAL 2022 |
See above Notes | Page | ||||||||||
| 1. Income Analysis |
CON | NON | 2- 1 | |||||||||
| 2. Interest Margins (Domestic Operations) |
NON | 2- 5 | ||||||||||
| 3. Use and Source of Funds |
NON | 2- 6 | ||||||||||
| 4. Net Gains/Losses on Securities |
CON | NON | 2- 8 | |||||||||
| 5. Unrealized Gains/Losses on Securities |
CON | NON | 2- 10 | |||||||||
| 6. Projected Redemption Amounts for Securities |
NON | 2- 12 | ||||||||||
| 7. Overview of Derivative Transactions Qualifying for Hedge Accounting |
NON | 2- 13 | ||||||||||
| 8. Employee Retirement Benefits |
NON | CON | 2- 14 | |||||||||
| 9. Capital Ratio |
CON | NON | 2- 17 | |||||||||
| II. REVIEW OF CREDITS |
See above Notes | Page | ||||||||||
| 1. Status of Non Performing Loans based on the Banking Act (“BA”) and the Financial Reconstruction Act (“FRA”) |
CON | NON | 2- 18 | |||||||||
| 2. Status of Reserves for Possible Losses on Loans |
CON | NON | 2- 22 | |||||||||
| 3. Reserve Ratios for Non Performing Loans based on the BA and the FRA |
CON | NON | 2- 23 | |||||||||
| 4. Coverage on Non Performing Loans based on the BA and the FRA |
NON | 2- 24 | ||||||||||
| 5. Overview of Non-Performing Loans(“NPLs”) |
NON | 2- 27 | ||||||||||
| 6. Results of Removal of NPLs from the Balance Sheet |
NON | 2- 28 | ||||||||||
| 7. Status of Loans by Industry |
||||||||||||
| (1) Outstanding Balances by Industry |
NON | 2- 29 | ||||||||||
| (2) Non Performing Loans based on the BA and the FRA and Coverage Ratio by Industry |
NON | 2- 31 | ||||||||||
| 8. Housing and Consumer Loans & Loans to Small and Medium-Sized Enterprises (“SMEs”) and Individual Customers |
||||||||||||
| (1) Balance of Housing and Consumer Loans |
NON | 2- 32 | ||||||||||
| (2) Loans to SMEs and Individual Customers |
NON | 2- 32 | ||||||||||
| 9. Status of Loans by Region |
||||||||||||
| (1) Outstanding Balances by Region |
NON | 2- 33 | ||||||||||
| (2) Non Performing Loans based on the BA and the FRA by Region |
NON | 2- 34 | ||||||||||
| III. DEFERRED TAXES |
See above Notes | Page | ||||||||||
| 1. Estimation for Calculating Deferred Tax Assets |
NON | 2- 35 | ||||||||||
| IV. OTHERS |
See above Notes | Page | ||||||||||
| 1. Breakdown of Deposits (Domestic Offices) |
NON | 2- 37 | ||||||||||
| 2. Number of Directors and Employees |
2- 38 | |||||||||||
| 3. Number of Offices |
2- 38 | |||||||||||
| 4. Earnings Plan for Fiscal 2023 |
CON | NON | 2- 39 | |||||||||
| Attachments |
Page | |||||||
| Mizuho Bank, Ltd. |
||||||||
| Comparison of Non-Consolidated Balance Sheets (selected items) |
2- 40 | |||||||
| Comparison of Non-Consolidated Statements of Income (selected items) |
2- 41 | |||||||
| Mizuho Trust & Banking Co., Ltd. |
||||||||
| Comparison of Non-Consolidated Balance Sheets (selected items) |
2- 42 | |||||||
| Comparison of Non-Consolidated Statements of Income (selected items) |
2- 43 | |||||||
| Statement of Trust Assets and Liabilities |
2- 44 | |||||||
| Comparison of Balances of Principal Items |
2- 45 | |||||||
| Mizuho Securities Co., Ltd. |
||||||||
| Comparison of Non-Consolidated Balance Sheets (selected items) |
2- 46 | |||||||
| Comparison of Non-Consolidated Statements of Income (selected items) |
2- 47 | |||||||
This immediate release contains statements that constitute forward-looking statements within the meaning of the United States Private Securities Litigation Reform Act of 1995, including estimates, forecasts, targets and plans. Such forward-looking statements do not represent any guarantee by management of future performance.
In many cases, but not all, we use such words as “aim,” “anticipate,” “believe,” “endeavor,” “estimate,” “expect,” “intend,” “may,” “plan,” “probability,” “project,” “risk,” “seek,” “should,” “strive,” “target” and similar expressions in relation to us or our management to identify forward-looking statements. You can also identify forward-looking statements by discussions of strategy, plans or intentions. These statements reflect our current views with respect to future events and are subject to risks, uncertainties and assumptions.
We may not be successful in implementing our business strategies, and management may fail to achieve its targets, for a wide range of possible reasons, including, without limitation: impact of geopolitical disruptions and the corona virus pandemic; intensification of competition in the market for financial services; incurrence of significant credit-related costs; declines in the value of our securities portfolio; changes in interest rates; foreign currency fluctuations; decrease in the market liquidity of our assets; revised assumptions or other changes related to our pension plans; a decline in our deferred tax assets; impairment of the carrying value of our long-lived assets; problems related to our information technology systems, including as a result of cyber attacks; the effect of financial transactions entered into for hedging and other similar purposes; failure to maintain required capital adequacy ratio levels and meet other financial regulatory requirements; downgrades in our credit ratings; our ability to avoid reputational harm; our ability to implement our 5-Year Business Plan and implement other strategic initiatives and measures effectively; the effectiveness of our operational, legal and other risk management policies; the effect of changes in general economic conditions in Japan and elsewhere; and changes to applicable laws and regulations.
Further information regarding factors that could affect our financial condition and results of operations is included in “Item 3.D. Key Information-Risk Factors” and “Item 5. Operating and Financial Review and Prospects” in our most recent Form 20-F filed with the U.S. Securities and Exchange Commission (“SEC”) and our report on Form 6-K furnished to the SEC on December 28, 2022, both of which are available in the Financial Information section of our web page at www.mizuho-fg.com/index.html and also at the SEC’s web site at www.sec.gov.
We do not intend to update our forward-looking statements. We are under no obligation, and disclaim any obligation, to update or alter our forward-looking statements, whether as a result of new information, future events or otherwise, except as may be required by the rules of the Tokyo Stock Exchange.
Mizuho Financial Group, Inc.
I. FINANCIAL DATA FOR FISCAL 2022
1. Income Analysis
Consolidated
| (Millions of yen) | ||||||||||||||||
| Fiscal 2022 | Fiscal 2021 | |||||||||||||||
| Change | ||||||||||||||||
| Consolidated Gross Profits |
1 | 2,278,405 | 25,936 | 2,252,469 | ||||||||||||
| Net Interest Income |
2 | 960,578 | (32,879 | ) | 993,458 | |||||||||||
| Fiduciary Income |
3 | 58,958 | (1,531 | ) | 60,490 | |||||||||||
| Credit Costs for Trust Accounts |
4 | — | — | — | ||||||||||||
| Net Fee and Commission Income |
5 | 751,693 | 10,697 | 740,995 | ||||||||||||
| Net Trading Income |
6 | 334,708 | 47,023 | 287,685 | ||||||||||||
| Net Other Operating Income |
7 | 172,466 | 2,626 | 169,839 | ||||||||||||
| General and Administrative Expenses |
8 | (1,445,283 | ) | (52,387 | ) | (1,392,896 | ) | |||||||||
| Expenses related to Portfolio Problems (including Reversal of (Provision for) General Reserve for Losses on Loans) |
9 | (96,737 | ) | 159,203 | (255,941 | ) | ||||||||||
| Losses on Write-offs of Loans |
10 | (16,234 | ) | (4,259 | ) | (11,975 | ) | |||||||||
| Gains on Reversal of Reserves for Possible Losses on Loans, and others |
11 | 7,426 | (13,339 | ) | 20,765 | |||||||||||
| Net Gains (Losses) related to Stocks |
12 | 86,474 | 130,321 | (43,846 | ) | |||||||||||
| Equity in Income from Investments in Affiliates |
13 | 11,889 | (13,545 | ) | 25,434 | |||||||||||
| Other |
14 | (52,568 | ) | (6,430 | ) | (46,137 | ) | |||||||||
|
|
|
|
|
|
|
|||||||||||
| Ordinary Profits |
15 | 789,606 | 229,759 | 559,847 | ||||||||||||
|
|
|
|
|
|
|
|||||||||||
| Net Extraordinary Gains (Losses) |
16 | (10,641 | ) | (54,666 | ) | 44,024 | ||||||||||
| Income before Income Taxes |
17 | 778,964 | 175,092 | 603,872 | ||||||||||||
| Income Taxes - Current |
18 | (170,805 | ) | (53,464 | ) | (117,341 | ) | |||||||||
| - Deferred |
19 | (48,029 | ) | (104,681 | ) | 56,652 | ||||||||||
| Profit |
20 | 560,130 | 16,947 | 543,183 | ||||||||||||
| Profit Attributable to Non-controlling Interests |
21 | (4,602 | ) | 8,100 | (12,703 | ) | ||||||||||
|
|
|
|
|
|
|
|||||||||||
| Profit Attributable to Owners of Parent |
22 | 555,527 | 25,047 | 530,479 | ||||||||||||
|
|
|
|
|
|
|
|||||||||||
| Credit-related Costs (including Credit Costs for Trust Accounts) |
23 | (89,311 | ) | 145,864 | (235,175 | ) | ||||||||||
|
* Credit-related Costs [23] = Expenses related to Portfolio Problems (including Reversal of (Provision for) General Reserve for Losses on Loans) [9] + Gains on Reversal of Reserves for Possible Losses on Loans, and others [11] + Credit Costs for Trust Accounts [4] |
|
|||||||||||||||
| (Reference) | ||||||||||||||||
| Consolidated Net Business Profits |
24 | 805,296 | (45,963 | ) | 851,259 | |||||||||||
|
* Consolidated Net Business Profits [24] = Consolidated Gross Profits [1] - General and Administrative Expenses (excluding Non-Recurring Losses) + Equity in Income from Investments in Affiliates and certain other consolidation adjustments |
|
|||||||||||||||
| Number of consolidated subsidiaries |
25 | 178 | 15 | 163 | ||||||||||||
| Number of affiliates under the equity method |
26 | 25 | 1 | 24 | ||||||||||||
2-1
Mizuho Financial Group, Inc.
Aggregate Figures for the 2 Banks
Non-Consolidated
| (Millions of yen) | ||||||||||||||||||||||||
| Fiscal 2022 | Fiscal 2021 | |||||||||||||||||||||||
| MHBK | MHTB | Aggregate Figures |
Change | |||||||||||||||||||||
| Gross Profits |
1 | 1,321,194 | 109,836 | 1,431,031 | (37,620 | ) | 1,468,651 | |||||||||||||||||
| Domestic Gross Profits |
2 | 827,090 | 109,921 | 937,012 | 84,877 | 852,134 | ||||||||||||||||||
| Net Interest Income |
3 | 454,676 | 19,635 | 474,312 | 2,923 | 471,388 | ||||||||||||||||||
| Fiduciary Income |
4 | 59,527 | 59,527 | (1,500 | ) | 61,028 | ||||||||||||||||||
| Trust Fees for Jointly Operated Designated Money Trust |
5 | 4,005 | 4,005 | 49 | 3,955 | |||||||||||||||||||
| Credit Costs for Trust Accounts (1) |
6 | — | — | — | — | |||||||||||||||||||
| Net Fee and Commission Income |
7 | 260,337 | 30,947 | 291,285 | (6,577 | ) | 297,862 | |||||||||||||||||
| Net Trading Income |
8 | 64,015 | — | 64,015 | 51,612 | 12,402 | ||||||||||||||||||
| Net Other Operating Income |
9 | 48,060 | (189 | ) | 47,870 | 38,418 | 9,452 | |||||||||||||||||
| International Gross Profits |
10 | 494,104 | (85 | ) | 494,019 | (122,497 | ) | 616,516 | ||||||||||||||||
| Net Interest Income |
11 | 416,221 | 67 | 416,289 | (18,431 | ) | 434,721 | |||||||||||||||||
| Net Fee and Commission Income |
12 | 150,898 | (166 | ) | 150,732 | 13,338 | 137,394 | |||||||||||||||||
| Net Trading Income |
13 | (58,025 | ) | — | (58,025 | ) | (46,647 | ) | (11,378 | ) | ||||||||||||||
| Net Other Operating Income |
14 | (14,990 | ) | 13 | (14,976 | ) | (70,756 | ) | 55,779 | |||||||||||||||
| General and Administrative Expenses (excluding Non-Recurring Losses) |
15 | (777,433 | ) | (79,206 | ) | (856,639 | ) | 1,267 | (857,906 | ) | ||||||||||||||
| Expense Ratio |
16 | 58.8 | % | 72.1 | % | 59.8 | % | 1.4 | % | 58.4 | % | |||||||||||||
| Personnel Expenses |
17 | (298,450 | ) | (38,662 | ) | (337,113 | ) | 3,084 | (340,197 | ) | ||||||||||||||
| Non-Personnel Expenses |
18 | (433,914 | ) | (36,838 | ) | (470,753 | ) | (2,708 | ) | (468,044 | ) | |||||||||||||
| Premium for Deposit Insurance |
19 | (15,326 | ) | (498 | ) | (15,825 | ) | 17,746 | (33,571 | ) | ||||||||||||||
| Miscellaneous Taxes |
20 | (45,067 | ) | (3,705 | ) | (48,773 | ) | 892 | (49,665 | ) | ||||||||||||||
|
|
|
|
|
|
|
|
|
|
|
|||||||||||||||
| Net Business Profits (before Reversal of (Provision for) General Reserve for Losses on Loans) |
21 | 543,761 | 30,630 | 574,391 | (36,353 | ) | 610,744 | |||||||||||||||||
| Net Business Profits (before Reversal of (Provision for) General Reserve for Losses on Loans) from core business areas (2) |
22 | 727,500 | 30,641 | 758,142 | 97,934 | 660,207 | ||||||||||||||||||
| Excluding Net Gains (Losses) from redemption of Investment Trusts |
23 | 703,966 | 30,641 | 734,608 | 91,860 | 642,748 | ||||||||||||||||||
|
|
|
|
|
|
|
|
|
|
|
|||||||||||||||
| Reversal of (Provision for) General Reserve for Losses on Loans |
24 | (45,325 | ) | (1,199 | ) | (46,524 | ) | (156,678 | ) | 110,153 | ||||||||||||||
|
|
|
|
|
|
|
|
|
|
|
|||||||||||||||
| Net Business Profits |
25 | 498,436 | 29,430 | 527,866 | (193,031 | ) | 720,898 | |||||||||||||||||
| Net Gains (Losses) related to Bonds |
26 | (183,738 | ) | (11 | ) | (183,750 | ) | (134,287 | ) | (49,462 | ) | |||||||||||||
|
|
|
|
|
|
|
|
|
|
|
|||||||||||||||
| Net Non-Recurring Gains (Losses) |
27 | 60,734 | 8,620 | 69,354 | 528,798 | (459,443 | ) | |||||||||||||||||
| Net Gains (Losses) related to Stocks |
28 | 57,896 | 2,892 | 60,788 | 108,191 | (47,402 | ) | |||||||||||||||||
| Expenses related to Portfolio Problems |
29 | 3,212 | 61 | 3,273 | 437,310 | (434,036 | ) | |||||||||||||||||
| Gains on Reversal of Reserves for Possible Losses on Loans, and others |
30 | 6,955 | 1 | 6,956 | (13,226 | ) | 20,183 | |||||||||||||||||
| Other |
31 | (7,330 | ) | 5,666 | (1,663 | ) | (3,476 | ) | 1,812 | |||||||||||||||
|
|
|
|
|
|
|
|
|
|
|
|||||||||||||||
| Ordinary Profits |
32 | 559,170 | 38,051 | 597,221 | 335,767 | 261,454 | ||||||||||||||||||
|
|
|
|
|
|
|
|
|
|
|
|||||||||||||||
| Net Extraordinary Gains (Losses) |
33 | 28,942 | (41 | ) | 28,900 | (16,486 | ) | 45,387 | ||||||||||||||||
| Net Gains (Losses) on Disposition of Fixed Assets |
34 | (4,225 | ) | (136 | ) | (4,361 | ) | (2,832 | ) | (1,528 | ) | |||||||||||||
| Losses on Impairment of Fixed Assets |
35 | (12,936 | ) | (5,271 | ) | (18,207 | ) | 9,131 | (27,338 | ) | ||||||||||||||
| Gains on Cancellation of Employee Retirement Benefit Trust |
36 | 45,553 | 2,074 | 47,627 | (26,626 | ) | 74,254 | |||||||||||||||||
| Income before Income Taxes |
37 | 588,112 | 38,009 | 626,122 | 319,280 | 306,841 | ||||||||||||||||||
| Income Taxes - Current |
38 | (106,291 | ) | (10,043 | ) | (116,335 | ) | 54,076 | (170,411 | ) | ||||||||||||||
| - Deferred |
39 | (85,659 | ) | (995 | ) | (86,654 | ) | (169,490 | ) | 82,836 | ||||||||||||||
|
|
|
|
|
|
|
|
|
|
|
|||||||||||||||
| Net Income |
40 | 396,161 | 26,970 | 423,132 | 203,866 | 219,265 | ||||||||||||||||||
|
|
|
|
|
|
|
|
|
|
|
|||||||||||||||
|
(1) Net Business Profits (before Reversal of (Provision for) General Reserve for Losses on Loans) for MHTB excludes the amounts of “Credit Costs for Trust Accounts” [6]. |
|
|||||||||||||||||||||||
| (2) Net Business Profits (before Reversal of (Provision for) General Reserve for Losses on Loans) from core business areas[22] =Net Business Profits(before Reversal of (Provision for) General Reserve for Losses on Loans)[21]-Net Gains (Losses) related to Bonds[26] |
|
|||||||||||||||||||||||
| Credit-related Costs |
41 | (35,157 | ) | (1,137 | ) | (36,295 | ) | 267,405 | (303,700) | |||||||||||||||
|
Credit-related Costs [41] = Expenses related to Portfolio Problems [29] + Reversal of (Provision for) General Reserve for Losses on Loans [24] + Gains on Reversal of Reserves for Possible Losses on Loans, and others [30] + Credit Costs for Trust Accounts [6] |
|
|||||||||||||||||||||||
| (Reference) Breakdown of Credit-related Costs |
||||||||||||||||||||||||
| Credit Costs for Trust Accounts |
42 | — | — | — | — | |||||||||||||||||||
| Reversal of (Provision for) General Reserve for Losses on Loans |
43 | (45,325 | ) | (1,199 | ) | (46,524 | ) | (157,479 | ) | 110,954 | ||||||||||||||
| Losses on Write-offs of Loans |
44 | (8,337 | ) | (6 | ) | (8,343 | ) | (15,635 | ) | 7,291 | ||||||||||||||
| Reversal of (Provision for) Specific Reserve for Possible Losses on Loans |
45 | 9,387 | 68 | 9,456 | 379,234 | (369,777 | ) | |||||||||||||||||
| Reversal of (Provision for) Reserve for Possible Losses on Loans to Restructuring Countries |
46 | 15,181 | — | 15,181 | 68,474 | (53,293 | ) | |||||||||||||||||
| Reversal of (Provision for) Reserve for Contingencies |
47 | (3,380 | ) | — | (3,380 | ) | (5,442 | ) | 2,062 | |||||||||||||||
| Other (including Losses on Sales of Loans) |
48 | (2,684 | ) | — | (2,684 | ) | (1,745 | ) | (938 | ) | ||||||||||||||
| Total |
49 | (35,157 | ) | (1,137 | ) | (36,295 | ) | 267,405 | (303,700 | ) | ||||||||||||||
2-2
Mizuho Financial Group, Inc.
Mizuho Bank
Non-Consolidated
| (Millions of yen) | ||||||||||||||
| Fiscal 2022 | Fiscal 2021 | |||||||||||||
| Change | ||||||||||||||
| Gross Profits |
1 | 1,321,194 | (25,129 | ) | 1,346,323 | |||||||||
| Domestic Gross Profits |
2 | 827,090 | 97,092 | 729,997 | ||||||||||
| Net Interest Income |
3 | 454,676 | 2,094 | 452,582 | ||||||||||
| Net Fee and Commission Income |
4 | 260,337 | 5,060 | 255,277 | ||||||||||
| Net Trading Income |
5 | 64,015 | 50,983 | 13,031 | ||||||||||
| Net Other Operating Income |
6 | 48,060 | 38,954 | 9,106 | ||||||||||
| International Gross Profits |
7 | 494,104 | (122,221 | ) | 616,325 | |||||||||
| Net Interest Income |
8 | 416,221 | (17,985 | ) | 434,207 | |||||||||
| Net Fee and Commission Income |
9 | 150,898 | 13,182 | 137,716 | ||||||||||
| Net Trading Income |
10 | (58,025 | ) | (46,658 | ) | (11,367 | ) | |||||||
| Net Other Operating Income |
11 | (14,990 | ) | (70,759 | ) | 55,768 | ||||||||
| General and Administrative Expenses (excluding Non-Recurring Losses) |
12 | (777,433 | ) | 590 | (778,023 | ) | ||||||||
| Expense Ratio |
13 | 58.8 | % | 1.0 | % | 57.7 | % | |||||||
| Personnel Expenses |
14 | (298,450 | ) | 3,754 | (302,204 | ) | ||||||||
| Non-Personnel Expenses |
15 | (433,914 | ) | (3,923 | ) | (429,991 | ) | |||||||
| Premium for Deposit Insurance |
16 | (15,326 | ) | 17,128 | (32,455 | ) | ||||||||
| Miscellaneous Taxes |
17 | (45,067 | ) | 760 | (45,827 | ) | ||||||||
|
|
|
|
|
|
|
|||||||||
| Net Business Profits (before Reversal of (Provision for) General Reserve for Losses on Loans) |
18 | 543,761 | (24,538 | ) | 568,299 | |||||||||
| Net Business Profits (before Reversal of (Provision for) General Reserve for Losses on Loans) from core business areas * |
19 | 727,500 | 109,730 | 617,769 | ||||||||||
| Excluding Net Gains (Losses) from redemption of Investment Trusts |
20 | 703,966 | 103,646 | 600,320 | ||||||||||
|
|
|
|
|
|
|
|||||||||
| Reversal of (Provision for) General Reserve for Losses on Loans |
21 | (45,325 | ) | (155,478 | ) | 110,153 | ||||||||
|
|
|
|
|
|
|
|||||||||
| Net Business Profits |
22 | 498,436 | (180,017 | ) | 678,453 | |||||||||
| Net Gains (Losses) related to Bonds |
23 | (183,738 | ) | (134,269 | ) | (49,469 | ) | |||||||
|
|
|
|
|
|
|
|||||||||
| Net Non-Recurring Gains (Losses) |
24 | 60,734 | 528,328 | (467,594 | ) | |||||||||
| Net Gains (Losses) related to Stocks |
25 | 57,896 | 109,019 | (51,123 | ) | |||||||||
| Expenses related to Portfolio Problems |
26 | 3,212 | 437,173 | (433,961 | ) | |||||||||
| Gains on Reversal of Reserves for Possible Losses on Loans, and others |
27 | 6,955 | (12,511 | ) | 19,466 | |||||||||
| Other |
28 | (7,330 | ) | (5,353 | ) | (1,976 | ) | |||||||
|
|
|
|
|
|
|
|||||||||
| Ordinary Profits |
29 | 559,170 | 348,311 | 210,858 | ||||||||||
|
|
|
|
|
|
|
|||||||||
| Net Extraordinary Gains (Losses) |
30 | 28,942 | (9,145 | ) | 38,088 | |||||||||
| Net Gains (Losses) on Disposition of Fixed Assets |
31 | (4,225 | ) | (2,960 | ) | (1,264 | ) | |||||||
| Losses on Impairment of Fixed Assets |
32 | (12,936 | ) | 14,222 | (27,158 | ) | ||||||||
| Gains on Cancellation of Employee Retirement Benefit Trust |
33 | 45,553 | (20,958 | ) | 66,511 | |||||||||
| Income before Income Taxes |
34 | 588,112 | 339,165 | 248,946 | ||||||||||
| Income Taxes - Current |
35 | (106,291 | ) | 53,469 | (159,760 | ) | ||||||||
| - Deferred |
36 | (85,659 | ) | (173,055 | ) | 87,395 | ||||||||
|
|
|
|
|
|
|
|||||||||
| Net Income |
37 | 396,161 | 219,579 | 176,581 | ||||||||||
|
|
|
|
|
|
|
|||||||||
|
* Net Business Profits (before Reversal of (Provision for) General Reserve for Losses on Loans)
from core business areas[19] |
|
|||||||||||||
| Credit-related Costs |
38 | (35,157 | ) | 269,183 | (304,341 | ) | ||||||||
|
Credit-related Costs [38] = Expenses
related to Portfolio Problems [26] + Reversal of (Provision for) General Reserve for Losses on Loans [21] |
|
|||||||||||||
| (Reference) Breakdown of Credit-related Costs | ||||||||||||||
| Reversal of (Provision for) General Reserve for Losses on Loans |
39 | (45,325 | ) | (155,478 | ) | 110,153 | ||||||||
| Losses on Write-offs of Loans |
40 | (8,337 | ) | (15,700 | ) | 7,362 | ||||||||
| Reversal of (Provision for) Specific Reserve for Possible Losses on Loans |
41 | 9,387 | 379,076 | (369,688 | ) | |||||||||
| Reversal of (Provision for) Reserve for Possible Losses on Loans to Restructuring Countries |
42 | 15,181 | 68,474 | (53,293 | ) | |||||||||
| Reversal of (Provision for) Reserve for Contingencies |
43 | (3,380 | ) | (5,442 | ) | 2,062 | ||||||||
| Other (including Losses on Sales of Loans) |
44 | (2,684 | ) | (1,745 | ) | (938 | ) | |||||||
| Total |
45 | (35,157 | ) | 269,183 | (304,341 | ) | ||||||||
2-3
Mizuho Financial Group, Inc.
Mizuho Trust & Banking
Non-Consolidated
| (Millions of yen) | ||||||||||||||
| Fiscal 2022 | Fiscal 2021 | |||||||||||||
| Change | ||||||||||||||
| Gross Profits |
1 | 109,836 | (12,491 | ) | 122,327 | |||||||||
| Domestic Gross Profits |
2 | 109,921 | (12,215 | ) | 122,137 | |||||||||
| Net Interest Income |
3 | 19,635 | 829 | 18,806 | ||||||||||
| Fiduciary Income |
4 | 59,527 | (1,500 | ) | 61,028 | |||||||||
| Trust Fees for Jointly Operated Designated Money Trust |
5 | 4,005 | 49 | 3,955 | ||||||||||
| Credit Costs for Trust Accounts (1) |
6 | — | — | — | ||||||||||
| Net Fee and Commission Income |
7 | 30,947 | (11,637 | ) | 42,585 | |||||||||
| Net Trading Income |
8 | — | 629 | (629 | ) | |||||||||
| Net Other Operating Income |
9 | (189 | ) | (536 | ) | 346 | ||||||||
| International Gross Profits |
10 | (85 | ) | (276 | ) | 190 | ||||||||
| Net Interest Income |
11 | 67 | (446 | ) | 514 | |||||||||
| Net Fee and Commission Income |
12 | (166 | ) | 156 | (322 | ) | ||||||||
| Net Trading Income |
13 | — | 11 | (11 | ) | |||||||||
| Net Other Operating Income |
14 | 13 | 2 | 10 | ||||||||||
| General and Administrative Expenses (excluding Non-Recurring Losses) |
15 | (79,206 | ) | 676 | (79,882 | ) | ||||||||
| Expense Ratio |
16 | 72.1 | % | 6.8 | % | 65.3 | % | |||||||
| Personnel Expenses |
17 | (38,662 | ) | (670 | ) | (37,992 | ) | |||||||
| Non-Personnel Expenses |
18 | (36,838 | ) | 1,214 | (38,053 | ) | ||||||||
| Premium for Deposit Insurance |
19 | (498 | ) | 617 | (1,115 | ) | ||||||||
| Miscellaneous Taxes |
20 | (3,705 | ) | 131 | (3,837 | ) | ||||||||
|
|
|
|
|
|
|
|||||||||
| Net Business Profits (before Reversal of (Provision for) General Reserve for Losses on Loans) |
21 | 30,630 | (11,814 | ) | 42,445 | |||||||||
| Net Business Profits (before Reversal of (Provision for) General Reserve for Losses on Loans) from core business areas (2) |
22 | 30,641 | (11,795 | ) | 42,437 | |||||||||
| Excluding Net Gains (Losses) from redemption of Investment Trusts |
23 | 30,641 | (11,786 | ) | 42,428 | |||||||||
|
|
|
|
|
|
|
|||||||||
| Reversal of (Provision for) General Reserve for Losses on Loans |
24 | (1,199 | ) | (1,199 | ) | — | ||||||||
|
|
|
|
|
|
|
|||||||||
| Net Business Profits |
25 | 29,430 | (13,014 | ) | 42,445 | |||||||||
| Net Gains (Losses) related to Bonds |
26 | (11 | ) | (18 | ) | 7 | ||||||||
|
|
|
|
|
|
|
|||||||||
| Net Non-Recurring Gains (Losses) |
27 | 8,620 | 469 | 8,150 | ||||||||||
| Net Gains (Losses) related to Stocks |
28 | 2,892 | (828 | ) | 3,720 | |||||||||
| Expenses related to Portfolio Problems |
29 | 61 | 136 | (75 | ) | |||||||||
| Gains on Reversal of Reserves for Possible Losses on Loans, and others |
30 | 1 | (715 | ) | 716 | |||||||||
| Other |
31 | 5,666 | 1,876 | 3,789 | ||||||||||
|
|
|
|
|
|
|
|||||||||
| Ordinary Profits |
32 | 38,051 | (12,544 | ) | 50,595 | |||||||||
|
|
|
|
|
|
|
|||||||||
| Net Extraordinary Gains (Losses) |
33 | (41 | ) | (7,340 | ) | 7,298 | ||||||||
| Net Gains (Losses) on Disposition of Fixed Assets |
34 | (136 | ) | 127 | (264 | ) | ||||||||
| Losses on Impairment of Fixed Assets |
35 | (5,271 | ) | (5,091 | ) | (179 | ) | |||||||
| Gains on Cancellation of Employee Retirement Benefit Trust |
36 | 2,074 | (5,668 | ) | 7,742 | |||||||||
| Income before Income Taxes |
37 | 38,009 | (19,884 | ) | 57,894 | |||||||||
| Income Taxes - Current |
38 | (10,043 | ) | 607 | (10,651 | ) | ||||||||
| - Deferred |
39 | (995 | ) | 3,564 | (4,559 | ) | ||||||||
|
|
|
|
|
|
|
|||||||||
| Net Income |
40 | 26,970 | (15,712 | ) | 42,683 | |||||||||
|
|
|
|
|
|
|
|||||||||
|
(1) Net Business Profits (before Reversal of (Provision for) General Reserve for Losses on Loans) excludes the amounts of “Credit Costs for Trust Accounts” [6]. |
|
|||||||||||||
| (2) Net Business Profits (before Reversal of (Provision for) General Reserve for Losses on Loans) from core business areas[22] =Net Business Profits(before Reversal of (Provision for) General Reserve for Losses on Loans)[21]-Net Gains (Losses) related to Bonds[26] |
|
|||||||||||||
| Credit-related Costs |
41 | (1,137 | ) | (1,778 | ) | 640 | ||||||||
|
Credit-related Costs [41] = Expenses
related to Portfolio Problems [29] + Reversal of (Provision for) General Reserve for Losses on Loans [24] |
|
|||||||||||||
| (Reference) Breakdown of Credit-related Costs |
||||||||||||||
| Credit Costs for Trust Accounts |
42 | — | — | — | ||||||||||
| Reversal of (Provision for) General Reserve for Losses on Loans |
43 | (1,199 | ) | (2,000) | 801 | |||||||||
| Losses on Write-offs of Loans |
44 | (6 | ) | 64 | (70 | ) | ||||||||
| Reversal of (Provision for) Specific Reserve for Possible Losses on Loans |
45 | 68 | 158 | (89 | ) | |||||||||
| Reversal of (Provision for) Reserve for Possible Losses on Loans to Restructuring Countries |
46 | — | — | — | ||||||||||
| Reversal of (Provision for) Reserve for Contingencies |
47 | — | — | — | ||||||||||
| Other (including Losses on Sales of Loans) |
48 | — | — | — | ||||||||||
| Total |
49 | (1,137 | ) | (1,778 | ) | 640 | ||||||||
2-4
Mizuho Financial Group, Inc.
2. Interest Margins (Domestic Operations)
Non-Consolidated
| (%) | ||||||||||||||||||
| Fiscal 2022 | Fiscal 2021 |
|||||||||||||||||
| Mizuho Bank | Change | |||||||||||||||||
| Return on Interest-Earning Assets |
1 | 0.43 | 0.03 | 0.39 | ||||||||||||||
| Return on Loans and Bills Discounted *1 |
2 | 0.75 | 0.01 | 0.74 | ||||||||||||||
| Return on Securities |
3 | 0.34 | (0.01 | ) | 0.36 | |||||||||||||
| Cost of Funding (including Expenses) |
4 | 0.51 | (0.01 | ) | 0.52 | |||||||||||||
| Cost of Deposits (including Expenses) |
5 | 0.52 | (0.02 | ) | 0.54 | |||||||||||||
| Cost of Deposits *2 |
6 | 0.00 | (0.00 | ) | 0.00 | |||||||||||||
| Cost of Other External Liabilities |
7 | 0.26 | (0.02 | ) | 0.29 | |||||||||||||
|
|
|
|
|
|
|
|||||||||||||
| Net Interest Margin |
(1)-(4) | 8 | (0.08 | ) | 0.05 | (0.13 | ) | |||||||||||
| Loan and Deposit Rate Margin (including Expenses) |
(2)-(5) | 9 | 0.23 | 0.03 | 0.20 | |||||||||||||
| Loan and Deposit Rate Margin |
(2)-(6) | 10 | 0.75 | 0.01 | 0.74 | |||||||||||||
|
|
|
|
|
|
|
|||||||||||||
|
*1 Return on Loans and Bills Discounted excludes loans to financial institutions (including MHFG). |
|
|||||||||||||||||
| *2 Deposits include Negotiable Certificates of Deposit (“NCDs”). |
|
|||||||||||||||||
| (Reference) After excluding loans to the Japanese government and others |
|
|||||||||||||||||
| Return on Loans and Bills Discounted |
11 | 0.77 | 0.01 | 0.75 | ||||||||||||||
| Loan and Deposit Rate Margin (including Expenses) |
(11)-(5) | 12 | 0.25 | 0.03 | 0.21 | |||||||||||||
| Loan and Deposit Rate Margin |
(11)-(6) | 13 | 0.77 | 0.01 | 0.75 | |||||||||||||
| (%) | ||||||||||||||||||
| Fiscal 2022 | Fiscal 2021 |
|||||||||||||||||
| Mizuho Trust & Banking | Change | |||||||||||||||||
| Return on Interest-Earning Assets |
14 | 0.50 | 0.01 | 0.49 | ||||||||||||||
| Return on Loans and Bills Discounted *1 |
15 | 0.60 | 0.01 | 0.59 | ||||||||||||||
| Return on Securities |
16 | 2.51 | 0.37 | 2.13 | ||||||||||||||
| Cost of Funding |
17 | 0.11 | (0.01 | ) | 0.13 | |||||||||||||
| Cost of Deposits *2 |
18 | 0.00 | (0.00 | ) | 0.01 | |||||||||||||
|
|
|
|
|
|
|
|||||||||||||
| Net Interest Margin |
(14)-(17) | 19 | 0.38 | 0.02 | 0.36 | |||||||||||||
| Loan and Deposit Rate Margin |
(15)-(18) | 20 | 0.59 | 0.01 | 0.58 | |||||||||||||
|
|
|
|
|
|
|
|||||||||||||
|
*1 Return on Loans and Bills Discounted excludes loans to financial institutions (including MHFG). |
|
|||||||||||||||||
| *2 Deposits include NCDs. |
|
|||||||||||||||||
| (Reference) After excluding loans to the Japanese government and others |
|
|||||||||||||||||
| Return on Loans and Bills Discounted |
21 | 0.60 | 0.00 | 0.60 | ||||||||||||||
| Loan and Deposit Rate Margin |
(21)-(18) | 22 | 0.59 | 0.00 | 0.59 | |||||||||||||
| (Reference) | (%) | |||||||||||||||||
| Fiscal 2022 | Fiscal 2021 | |||||||||||||||||
| Aggregate Figures for the 2 Banks | Change | |||||||||||||||||
| Return on Loans and Bills Discounted *1 |
23 | 0.74 | 0.01 | 0.73 | ||||||||||||||
| Cost of Deposits *2 |
24 | 0.00 | (0.00 | ) | 0.00 | |||||||||||||
|
|
|
|
|
|
|
|||||||||||||
| Loan and Deposit Rate Margin |
(23)-(24) | 25 | 0.74 | 0.01 | 0.73 | |||||||||||||
|
|
|
|
|
|
|
|||||||||||||
|
*1 Return on Loans and Bills Discounted excludes loans to financial institutions (including MHFG). |
|
|||||||||||||||||
| *2 Deposits include NCDs. |
|
|||||||||||||||||
| (Reference) After excluding loans to the Japanese government and others |
|
|||||||||||||||||
| Return on Loans and Bills Discounted |
26 | 0.76 | 0.01 | 0.74 | ||||||||||||||
| Loan and Deposit Rate Margin |
(26)-(24) | 27 | 0.76 | 0.01 | 0.74 | |||||||||||||
2-5
Mizuho Financial Group, Inc.
3. Use and Source of Funds
Non-Consolidated
Mizuho Bank
| (Millions of yen, %) | ||||||||||||||||||||||||
| Fiscal 2022 | Fiscal 2021 | |||||||||||||||||||||||
| Change | ||||||||||||||||||||||||
| Average Balance |
Rate | Average Balance | Rate | Average Balance | Rate | |||||||||||||||||||
| (Total) |
||||||||||||||||||||||||
| Use of Funds |
182,630,345 | 1.45 | (4,497,008 | ) | 0.85 | 187,127,354 | 0.60 | |||||||||||||||||
| Loans and Bills Discounted |
87,092,723 | 1.85 | 4,450,395 | 0.91 | 82,642,328 | 0.93 | ||||||||||||||||||
| Securities |
40,359,316 | 0.92 | (2,459,382 | ) | 0.31 | 42,818,698 | 0.60 | |||||||||||||||||
|
|
|
|
|
|
|
|
|
|
|
|
|
|||||||||||||
| Source of Funds |
195,136,869 | 0.91 | 8,282,095 | 0.78 | 186,854,774 | 0.13 | ||||||||||||||||||
| Deposits |
138,803,255 | 0.57 | 9,355,277 | 0.55 | 129,447,977 | 0.02 | ||||||||||||||||||
| NCDs |
19,435,079 | 1.03 | (561,533 | ) | 0.97 | 19,996,613 | 0.06 | |||||||||||||||||
| (Domestic Operations) |
||||||||||||||||||||||||
| Use of Funds |
115,947,840 | 0.43 | (11,029,414 | ) | 0.03 | 126,977,255 | 0.39 | |||||||||||||||||
| Loans and Bills Discounted |
52,341,831 | 0.74 | 59,164 | 0.00 | 52,282,666 | 0.73 | ||||||||||||||||||
| Securities |
26,650,831 | 0.34 | (734,337 | ) | (0.01 | ) | 27,385,169 | 0.36 | ||||||||||||||||
|
|
|
|
|
|
|
|
|
|
|
|
|
|||||||||||||
| Source of Funds |
125,906,095 | 0.03 | 355,017 | (0.00 | ) | 125,551,077 | 0.04 | |||||||||||||||||
| Deposits |
103,302,605 | 0.00 | 3,003,199 | (0.00 | ) | 100,299,405 | 0.00 | |||||||||||||||||
| NCDs |
12,294,568 | 0.00 | (1,089,933 | ) | (0.00 | ) | 13,384,502 | 0.00 | ||||||||||||||||
| (International Operations) |
||||||||||||||||||||||||
| Use of Funds |
71,722,336 | 3.00 | 7,713,998 | 2.01 | 64,008,337 | 0.99 | ||||||||||||||||||
| Loans and Bills Discounted |
34,750,892 | 3.53 | 4,391,230 | 2.23 | 30,359,661 | 1.29 | ||||||||||||||||||
| Securities |
13,708,484 | 2.02 | (1,725,044 | ) | 0.98 | 15,433,528 | 1.04 | |||||||||||||||||
|
|
|
|
|
|
|
|
|
|
|
|
|
|||||||||||||
| Source of Funds |
74,270,605 | 2.34 | 9,108,670 | 2.03 | 65,161,934 | 0.30 | ||||||||||||||||||
| Deposits |
35,500,650 | 2.26 | 6,352,078 | 2.14 | 29,148,571 | 0.11 | ||||||||||||||||||
| NCDs |
7,140,511 | 2.82 | 528,400 | 2.64 | 6,612,111 | 0.17 | ||||||||||||||||||
2-6
Mizuho Financial Group, Inc.
Mizuho Trust & Banking (Banking Account)
| (Millions of yen, %) | ||||||||||||||||||||||||
| Fiscal 2022 | Fiscal 2021 | |||||||||||||||||||||||
| Change | ||||||||||||||||||||||||
| Average Balance |
Rate | Average Balance | Rate | Average Balance | Rate | |||||||||||||||||||
| (Total) |
||||||||||||||||||||||||
| Use of Funds |
5,156,002 | 0.50 | (97,174 | ) | 0.00 | 5,253,176 | 0.50 | |||||||||||||||||
| Loans and Bills Discounted |
3,161,285 | 0.61 | (71,994 | ) | 0.00 | 3,233,280 | 0.60 | |||||||||||||||||
| Securities |
210,090 | 2.42 | (27,971 | ) | 0.35 | 238,061 | 2.06 | |||||||||||||||||
|
|
|
|
|
|
|
|
|
|
|
|
|
|||||||||||||
| Source of Funds |
5,491,647 | 0.11 | 249,174 | (0.01 | ) | 5,242,473 | 0.13 | |||||||||||||||||
| Deposits |
2,646,057 | 0.00 | (127,740 | ) | (0.00 | ) | 2,773,797 | 0.01 | ||||||||||||||||
| NCDs |
644,477 | 0.00 | (44,545 | ) | (0.00 | ) | 689,023 | 0.00 | ||||||||||||||||
| (Domestic Operations) |
||||||||||||||||||||||||
| Use of Funds |
5,138,769 | 0.50 | (80,006 | ) | 0.01 | 5,218,775 | 0.49 | |||||||||||||||||
| Loans and Bills Discounted |
3,135,620 | 0.60 | (55,143 | ) | 0.00 | 3,190,763 | 0.59 | |||||||||||||||||
| Securities |
201,800 | 2.51 | (28,006 | ) | 0.37 | 229,807 | 2.13 | |||||||||||||||||
|
|
|
|
|
|
|
|
|
|
|
|
|
|||||||||||||
| Source of Funds |
5,474,337 | 0.11 | 266,591 | (0.01 | ) | 5,207,746 | 0.13 | |||||||||||||||||
| Deposits |
2,642,826 | 0.00 | (127,108 | ) | (0.00 | ) | 2,769,934 | 0.01 | ||||||||||||||||
| NCDs |
644,477 | 0.00 | (44,545 | ) | (0.00 | ) | 689,023 | 0.00 | ||||||||||||||||
| (International Operations) | ||||||||||||||||||||||||
| Use of Funds |
40,643 | 1.04 | (19,869 | ) | 0.01 | 60,512 | 1.03 | |||||||||||||||||
| Loans and Bills Discounted |
25,665 | 1.56 | (16,850 | ) | 0.15 | 42,516 | 1.40 | |||||||||||||||||
| Securities |
8,289 | 0.18 | 35 | (0.08 | ) | 8,253 | 0.26 | |||||||||||||||||
|
|
|
|
|
|
|
|
|
|
|
|
|
|||||||||||||
| Source of Funds |
40,721 | 0.88 | (20,117 | ) | 0.69 | 60,839 | 0.18 | |||||||||||||||||
| Deposits |
3,230 | 0.00 | (631 | ) | (0.00 | ) | 3,862 | 0.01 | ||||||||||||||||
| NCDs |
— | — | — | — | — | — | ||||||||||||||||||
2-7
Mizuho Financial Group, Inc.
4. Net Gains/Losses on Securities
Consolidated
| (Millions of yen) | ||||||||||||
| Fiscal 2022 | Fiscal 2021 | |||||||||||
| Change | ||||||||||||
| Net Gains (Losses) related to Bonds |
(184,107 | ) | (131,659 | ) | (52,447 | ) | ||||||
| Gains on Sales and Others |
75,798 | (40,851 | ) | 116,650 | ||||||||
| Losses on Sales and Others |
(221,962 | ) | (56,484 | ) | (165,477 | ) | ||||||
| Impairment (Devaluation) |
(472 | ) | 909 | (1,382 | ) | |||||||
| Reversal of (Provision for) Reserve for Possible Losses on Investments |
(0 | ) | (0 | ) | 0 | |||||||
| Gains (Losses) on Derivatives other than for Trading |
(37,470 | ) | (35,232 | ) | (2,237 | ) | ||||||
| Fiscal 2022 | Fiscal 2021 | |||||||||||
| Change | ||||||||||||
| Net Gains (Losses) related to Stocks |
86,474 | 130,321 | (43,846 | ) | ||||||||
| Gains on Sales |
147,796 | (71,359 | ) | 219,155 | ||||||||
| Losses on Sales |
(49,707 | ) | 139,890 | (189,598 | ) | |||||||
| Impairment (Devaluation) |
(2,085 | ) | 39,566 | (41,652 | ) | |||||||
| Reversal of (Provision for) Reserve for Possible Losses on Investments |
— | 106 | (106 | ) | ||||||||
| Gains (Losses) on Derivatives other than for Trading |
(9,528 | ) | 22,116 | (31,644 | ) | |||||||
| Non-Consolidated
Aggregate Figures for the 2 Banks |
|
|||||||||||
| (Millions of yen) | ||||||||||||
| Fiscal 2022 | Fiscal 2021 | |||||||||||
| Change | ||||||||||||
| Net Gains (Losses) related to Bonds |
(183,750 | ) | (134,287 | ) | (49,462 | ) | ||||||
| Gains on Sales and Others |
76,746 | (43,169 | ) | 119,916 | ||||||||
| Losses on Sales and Others |
(222,560 | ) | (56,810 | ) | (165,750 | ) | ||||||
| Impairment (Devaluation) |
(464 | ) | 917 | (1,382 | ) | |||||||
| Reversal of (Provision for) Reserve for Possible Losses on Investments |
— | — | — | |||||||||
| Gains (Losses) on Derivatives other than for Trading |
(37,472 | ) | (35,225 | ) | (2,246 | ) | ||||||
| Fiscal 2022 | Fiscal 2021 | |||||||||||
| Change | ||||||||||||
| Net Gains (Losses) related to Stocks |
60,788 | 108,191 | (47,402 | ) | ||||||||
| Gains on Sales |
133,467 | (77,252 | ) | 210,720 | ||||||||
| Losses on Sales |
(47,844 | ) | 138,202 | (186,047 | ) | |||||||
| Impairment (Devaluation) |
(15,305 | ) | 25,018 | (40,323 | ) | |||||||
| Reversal of (Provision for) Reserve for Possible Losses on Investments |
— | 106 | (106 | ) | ||||||||
| Gains (Losses) on Derivatives other than for Trading |
(9,528 | ) | 22,116 | (31,644 | ) | |||||||
2-8
Mizuho Financial Group, Inc.
| Mizuho Bank | ||||||||||||
| (Millions of yen) | ||||||||||||
| Fiscal 2022 | Fiscal 2021 | |||||||||||
| Change | ||||||||||||
| Net Gains (Losses) related to Bonds |
(183,738 | ) | (134,269 | ) | (49,469 | ) | ||||||
| Gains on Sales and Others |
76,746 | (43,158 | ) | 119,905 | ||||||||
| Losses on Sales and Others |
(222,549 | ) | (56,802 | ) | (165,746 | ) | ||||||
| Impairment (Devaluation) |
(464 | ) | 917 | (1,382 | ) | |||||||
| Reversal of (Provision for) Reserve for Possible Losses on Investments |
— | — | — | |||||||||
| Gains (Losses) on Derivatives other than for Trading |
(37,472 | ) | (35,225 | ) | (2,246 | ) | ||||||
| Fiscal 2022 | Fiscal 2021 | |||||||||||
| Change | ||||||||||||
| Net Gains (Losses) related to Stocks |
57,896 | 109,019 | (51,123 | ) | ||||||||
| Gains on Sales |
127,940 | (78,643 | ) | 206,583 | ||||||||
| Losses on Sales |
(45,261 | ) | 140,524 | (185,786 | ) | |||||||
| Impairment (Devaluation) |
(15,254 | ) | 24,915 | (40,169 | ) | |||||||
| Reversal of (Provision for) Reserve for Possible Losses on Investments |
— | 106 | (106 | ) | ||||||||
| Gains (Losses) on Derivatives other than for Trading |
(9,528 | ) | 22,116 | (31,644 | ) | |||||||
| Mizuho Trust & Banking |
|
|||||||||||
| (Millions of yen) | ||||||||||||
| Fiscal 2022 | Fiscal 2021 | |||||||||||
| Change | ||||||||||||
| Net Gains (Losses) related to Bonds |
(11 | ) | (18 | ) | 7 | |||||||
| Gains on Sales and Others |
— | (11 | ) | 11 | ||||||||
| Losses on Sales and Others |
(11 | ) | (7 | ) | (4 | ) | ||||||
| Impairment (Devaluation) |
— | — | — | |||||||||
| Reversal of (Provision for) Reserve for Possible Losses on Investments |
— | — | — | |||||||||
| Gains (Losses) on Derivatives other than for Trading |
— | — | — | |||||||||
| Fiscal 2022 | Fiscal 2021 | |||||||||||
| Change | ||||||||||||
| Net Gains (Losses) related to Stocks |
2,892 | (828 | ) | 3,720 | ||||||||
| Gains on Sales |
5,526 | 1,390 | 4,136 | |||||||||
| Losses on Sales |
(2,583 | ) | (2,322 | ) | (261 | ) | ||||||
| Impairment (Devaluation) |
(50 | ) | 103 | (153 | ) | |||||||
| Reversal of (Provision for) Reserve for Possible Losses on Investments |
— | — | — | |||||||||
| Gains (Losses) on Derivatives other than for Trading |
— | — | — | |||||||||
2-9
Mizuho Financial Group, Inc.
5. Unrealized Gains/Losses on Securities
| • | Stocks and others without a quoted market price and Investments in Partnerships are excluded. |
Consolidated
(1) Other Securities
| (Millions of yen) | ||||||||||||||||||||||||||||||||
| As of March 31, 2023 | As of March 31, 2022 | |||||||||||||||||||||||||||||||
| Book Value (= Fair Value) |
Unrealized Gains/Losses | Book Value (= Fair Value) |
Unrealized Gains/Losses | |||||||||||||||||||||||||||||
| Gains | Losses | Gains | Losses | |||||||||||||||||||||||||||||
| Other Securities |
34,403,458 | 789,855 | 1,596,302 | 806,446 | 42,065,723 | 990,184 | 1,593,785 | 603,600 | ||||||||||||||||||||||||
| Japanese Stocks |
2,515,722 | 1,518,382 | 1,548,463 | 30,081 | 2,577,310 | 1,499,915 | 1,538,391 | 38,475 | ||||||||||||||||||||||||
| Japanese Bonds |
20,239,297 | (61,492 | ) | 14,440 | 75,933 | 28,620,413 | (52,186 | ) | 19,799 | 71,986 | ||||||||||||||||||||||
| Japanese Government Bonds |
16,449,293 | (31,971 | ) | 3,871 | 35,842 | 25,158,730 | (30,543 | ) | 7,495 | 38,039 | ||||||||||||||||||||||
| Other |
11,648,438 | (667,033 | ) | 33,398 | 700,432 | 10,867,999 | (457,544 | ) | 35,593 | 493,138 | ||||||||||||||||||||||
| Foreign Bonds |
9,554,507 | (580,690 | ) | 14,788 | 595,479 | 8,937,594 | (414,292 | ) | 2,316 | 416,609 | ||||||||||||||||||||||
|
|
||||||||||||||||||||||||||||||||
| * In addition to “Securities” on the consolidated balance sheets, NCDs in “Cash and Due from Banks,” certain items in “Other Debt Purchased” and certain items in “Other Assets” are also included. * The book values of Other Securities which have readily determinable fair value are stated at fair value, so Unrealized Gains/Losses indicate the difference between book values on the consolidated balance sheets and the acquisition costs. Unrealized Gains/Losses include ¥36,513 million and ¥27,448 million, which were recognized in the statement of income for March 31, 2023 and March 31, 2022, respectively, by applying the fair-value hedge accounting and others. As a result, the base amounts to be recorded directly to Net Assets after necessary consolidation adjustments as of March 31, 2023 and March 31, 2022 are ¥753,341 million and ¥962,735 million, respectively. * Other Securities mainly including Foreign Bonds are hedged by using derivative instruments, which apply the deferred method of hedge accounting. Deferred Hedge Gains/Losses before tax adjustment as of March 31, 2023 and March 31, 2022 are ¥59,072 million (Foreign Bonds ¥125,968 million and Japanese Government Bonds ¥(14,507) million) and ¥126,280 million (Foreign Bonds ¥135,310 million and Japanese Government Bonds ¥— million), respectively. Unrealized Gains/Losses applying deferred hedging accounting among hedging instruments as of March 31, 2023 and March 31, 2022 are ¥848,927 million (Foreign Bonds ¥(454,722) million and Japanese Government Bonds ¥(46,478) million) and ¥1,116,464 million (Foreign Bonds ¥(278,982) million and Japanese Government Bonds ¥(30,543) million), respectively. * Unrealized Gains/Losses on Other Securities, net of Taxes (recorded directly to Net Assets after tax and consolidation adjustments, excluding the amount recognized in the statement of income by applying the fair-value hedge accounting and others, including translation differences and others regarding stocks and others without a quoted market price and Investments in Partnerships) as of March 31, 2023 and March 31, 2022 are ¥564,495 million and ¥719,822 million, respectively.
(2) Bonds Held to Maturity
|
|
|||||||||||||||||||||||||||||||
| (Millions of yen) | ||||||||||||||||||||||||||||||||
| As of March 31, 2023 | As of March 31, 2022 | |||||||||||||||||||||||||||||||
| Book Value | Unrealized Gains/Losses | Book Value | Unrealized Gains/Losses | |||||||||||||||||||||||||||||
| Gains | Losses | Gains | Losses | |||||||||||||||||||||||||||||
| Bonds Held to Maturity |
2,048,188 | (133,080 | ) | 2,538 | 135,618 | 1,517,583 | (52,007 | ) | 5,336 | 57,343 | ||||||||||||||||||||||
Non-Consolidated
(1) Other Securities
Aggregate Figures for the 2 Banks
| (Millions of yen) | ||||||||||||||||||||||||||||||||
| As of March 31, 2023 | As of March 31, 2022 | |||||||||||||||||||||||||||||||
| Book Value | Unrealized Gains/Losses | Book Value | Unrealized Gains/Losses | |||||||||||||||||||||||||||||
| (= Fair Value) | Gains | Losses | (= Fair Value) | Gains | Losses | |||||||||||||||||||||||||||
| Other Securities |
33,665,664 | 730,479 | 1,537,999 | 807,520 | 41,483,698 | 919,942 | 1,525,116 | 605,173 | ||||||||||||||||||||||||
| Japanese Stocks |
2,444,956 | 1,458,955 | 1,491,327 | 32,372 | 2,497,331 | 1,432,316 | 1,473,018 | 40,701 | ||||||||||||||||||||||||
| Japanese Bonds |
20,220,815 | (61,494 | ) | 14,439 | 75,933 | 28,603,457 | (52,190 | ) | 19,795 | 71,986 | ||||||||||||||||||||||
| Japanese Government Bonds |
16,438,019 | (31,971 | ) | 3,870 | 35,842 | 25,147,531 | (30,545 | ) | 7,493 | 38,039 | ||||||||||||||||||||||
| Other |
10,999,893 | (666,982 | ) | 32,232 | 699,215 | 10,382,908 | (460,182 | ) | 32,302 | 492,484 | ||||||||||||||||||||||
| Foreign Bonds |
8,953,192 | (580,710 | ) | 14,044 | 594,755 | 8,487,969 | (414,822 | ) | 1,198 | 416,020 | ||||||||||||||||||||||
| Mizuho Bank |
||||||||||||||||||||||||||||||||
| Other Securities |
33,455,851 | 651,416 | 1,456,728 | 805,311 | 41,243,397 | 846,893 | 1,446,756 | 599,863 | ||||||||||||||||||||||||
| Japanese Stocks |
2,306,663 | 1,380,927 | 1,411,109 | 30,182 | 2,349,073 | 1,360,494 | 1,395,908 | 35,413 | ||||||||||||||||||||||||
| Japanese Bonds |
20,155,116 | (61,854 | ) | 14,060 | 75,914 | 28,517,031 | (52,979 | ) | 18,984 | 71,964 | ||||||||||||||||||||||
| Japanese Government Bonds |
16,438,019 | (31,971 | ) | 3,870 | 35,842 | 25,147,531 | (30,545 | ) | 7,493 | 38,039 | ||||||||||||||||||||||
| Other |
10,994,072 | (667,656 | ) | 31,558 | 699,215 | 10,377,292 | (460,620 | ) | 31,864 | 492,484 | ||||||||||||||||||||||
| Foreign Bonds |
8,953,192 | (580,710 | ) | 14,044 | 594,755 | 8,487,969 | (414,822 | ) | 1,198 | 416,020 | ||||||||||||||||||||||
| Mizuho Trust & Banking |
||||||||||||||||||||||||||||||||
| Other Securities |
209,812 | 79,062 | 81,271 | 2,208 | 240,300 | 73,048 | 78,359 | 5,310 | ||||||||||||||||||||||||
| Japanese Stocks |
138,292 | 78,027 | 80,218 | 2,190 | 148,258 | 71,822 | 77,109 | 5,287 | ||||||||||||||||||||||||
| Japanese Bonds |
65,699 | 360 | 378 | 18 | 86,426 | 788 | 811 | 22 | ||||||||||||||||||||||||
| Japanese Government Bonds |
— | — | — | — | — | — | — | — | ||||||||||||||||||||||||
| Other |
5,821 | 674 | 674 | 0 | 5,616 | 437 | 437 | 0 | ||||||||||||||||||||||||
| Foreign Bonds |
— | — | — | — | — | — | — | — | ||||||||||||||||||||||||
|
|
||||||||||||||||||||||||||||||||
| * In addition to “Securities” on the balance sheets, NCDs in “Cash and Due from Banks” and certain items in “Other Debt Purchased” are also included. * The book values of Other Securities which have readily determinable fair value are stated at fair value, so Unrealized Gains/Losses indicate the difference between book values on the balance sheets and the acquisition costs. * Unrealized Gains/Losses include ¥36,611 million and ¥27,448 million, which were recognized in the statement of income (aggregate figures for the 2 banks) for March 31, 2023 and March 31, 2022, respectively, by applying the fair-value hedge accounting. As a result, the base amounts to be recorded directly to Net Assets after necessary adjustments (aggregate figures for the 2 banks) as of March 31, 2023 and March 31, 2022 are ¥693,867 million and ¥892,494 million, respectively. * Other Securities mainly including Foreign Bonds are hedged by using derivative instruments, which apply the deferred method of hedge accounting. Deferred Hedge Gains/Losses before tax adjustment (aggregate figures for the 2 banks) as of March 31, 2023 and March 31, 2022 are ¥59,072 million (Foreign Bonds ¥125,968 million and Japanese Government Bonds ¥(14,507) million) and ¥126,280 million (Foreign Bonds ¥135,310 million and Japanese Government Bonds ¥— million), respectively. Unrealized Gains/Losses applying deferred hedging accounting among hedging instruments (aggregate figures for the 2 banks) as of March 31, 2023 and March 31, 2022 are ¥789,551 million (Foreign Bonds ¥(454,742) million and Japanese Government Bonds ¥(46,478) million) and ¥1,046,223 million (Foreign Bonds ¥(279,511) million and Japanese Government Bonds ¥(30,545) million), respectively. * Unrealized Gains/Losses on Other Securities, net of Taxes (recorded directly to Net Assets after tax adjustment, excluding the amount recognized in the statement of income by applying the fair-value hedge accounting including translation differences and others regarding stocks and others without a quoted market price and Investments in Partnerships) as of March 31, 2023 and March 31, 2022 are as follows. |
|
|||||||||||||||||||||||||||||||
| (Millions of yen) | ||||||||
| As of March 31, 2023 | As of March 31, 2022 | |||||||
| Aggregate Figures |
524,356 | 654,388 | ||||||
| Mizuho Bank |
462,550 | 596,706 | ||||||
| Mizuho Trust & Banking |
61,805 | 57,681 | ||||||
2-10
Mizuho Financial Group, Inc.
(2) Bonds Held to Maturity
Aggregate Figures for the 2 Banks
| (Millions of yen) | ||||||||||||||||||||||||||||||||
| As of March 31, 2023 | As of March 31, 2022 | |||||||||||||||||||||||||||||||
| Unrealized Gains/Losses | Unrealized Gains/Losses | |||||||||||||||||||||||||||||||
| Book Value | Gains | Losses | Book Value | Gains | Losses | |||||||||||||||||||||||||||
| Aggregate Figures |
2,048,188 | (133,080 | ) | 2,538 | 135,618 | 1,517,583 | (52,007 | ) | 5,336 | 57,343 | ||||||||||||||||||||||
| Mizuho Bank |
2,048,188 | (133,080 | ) | 2,538 | 135,618 | 1,517,583 | (52,007 | ) | 5,336 | 57,343 | ||||||||||||||||||||||
| Mizuho Trust & Banking |
— | — | — | — | — | — | — | — | ||||||||||||||||||||||||
|
(3) Investment in Subsidiaries and Affiliates
Aggregate Figures for the 2 Banks |
|
|||||||||||||||||||||||||||||||
| (Millions of yen) | ||||||||||||||||||||||||||||||||
| As of March 31, 2023 | As of March 31, 2022 | |||||||||||||||||||||||||||||||
| Unrealized Gains/Losses | Unrealized Gains/Losses | |||||||||||||||||||||||||||||||
| Book Value | Gains | Losses | Book Value | Gains | Losses | |||||||||||||||||||||||||||
| Aggregate Figures |
106,131 | 355,959 | 355,959 | — | 108,996 | 311,957 | 312,302 | 345 | ||||||||||||||||||||||||
| Mizuho Bank |
106,131 | 355,959 | 355,959 | — | 108,996 | 311,957 | 312,302 | 345 | ||||||||||||||||||||||||
| Mizuho Trust & Banking |
— | — | — | — | — | — | — | — | ||||||||||||||||||||||||
(Reference)
Unrealized Gains/Losses on Other Securities
(the base amount to be recorded directly to Net Assets after necessary adjustments)
For certain Other Securities, Unrealized Gains/Losses were recognized in the statement of income by applying the fair-value hedge accounting and others. Unrealized Gains/Losses on Other Securities after excluding such Income/Loss (the “base amount”) are recorded directly to Net Assets after necessary adjustments.
The base amounts are as follows:
Consolidated
| (Millions of yen) | ||||||||||||
| As of March 31, 2023 | As of March 31, 2022 |
|||||||||||
| Unrealized Gains/Losses | Unrealized Gains/Losses |
|||||||||||
| Change | ||||||||||||
| Other Securities |
753,341 | (209,393 | ) | 962,735 | ||||||||
| Japanese Stocks |
1,481,771 | 9,303 | 1,472,467 | |||||||||
| Japanese Bonds |
(61,492 | ) | (9,305 | ) | (52,186 | ) | ||||||
| Japanese Government Bonds |
(31,971 | ) | (1,427 | ) | (30,543 | ) | ||||||
| Other |
(666,936 | ) | (209,391 | ) | (457,544 | ) | ||||||
| Foreign Bonds |
(580,593 | ) | (166,300 | ) | (414,293 | ) | ||||||
Non-Consolidated
Aggregate Figures for the 2 Banks
| (Millions of yen) | ||||||||||||
| As of March 31, 2023 | As of March 31, 2022 |
|||||||||||
| Unrealized Gains/Losses | Unrealized Gains/Losses |
|||||||||||
| Change | ||||||||||||
| Other Securities |
693,867 | (198,626 | ) | 892,494 | ||||||||
| Japanese Stocks |
1,422,344 | 17,476 | 1,404,868 | |||||||||
| Japanese Bonds |
(61,494 | ) | (9,303 | ) | (52,190 | ) | ||||||
| Japanese Government Bonds |
(31,971 | ) | (1,425 | ) | (30,545 | ) | ||||||
| Other |
(666,982 | ) | (206,799 | ) | (460,183 | ) | ||||||
| Foreign Bonds |
(580,711 | ) | (165,888 | ) | (414,822 | ) | ||||||
2-11
Mizuho Financial Group, Inc.
6. Projected Redemption Amounts for Securities
| • | The redemption schedule by term for Bonds Held to Maturity and Other Securities with maturities is as follows: |
Non-Consolidated
Aggregate Figures for the 2 Banks
| (Billions of yen) | ||||||||||||||||||||||||||||||||||||||||||||||||
| Maturity as of March 31, 2023 | Change | Maturity as of March 31, 2022 | ||||||||||||||||||||||||||||||||||||||||||||||
| Within 1 year |
1 - 5 years |
5 - 10 years |
Over 10 years |
Within 1 year |
1 - 5 years |
5 - 10 years |
Over 10 years |
Within 1 year |
1 - 5 years |
5 - 10 years |
Over 10 years |
|||||||||||||||||||||||||||||||||||||
| Japanese Bonds |
15,229.2 | 2,944.1 | 2,108.4 | 711.7 | (4,562.0 | ) | (3,493.8 | ) | (81.1 | ) | 71.3 | 19,791.3 | 6,438.0 | 2,189.5 | 640.4 | |||||||||||||||||||||||||||||||||
| Japanese Government Bonds |
14,541.4 | 965.7 | 1,579.8 | 100.0 | (4,781.5 | ) | (3,556.7 | ) | (58.8 | ) | (5.0 | ) | 19,322.9 | 4,522.4 | 1,638.6 | 105.0 | ||||||||||||||||||||||||||||||||
| Japanese Local Government Bonds |
35.5 | 275.7 | 241.5 | 7.4 | 8.3 | 55.6 | 74.7 | — | 27.2 | 220.1 | 166.7 | 7.4 | ||||||||||||||||||||||||||||||||||||
| Japanese Corporate Bonds |
652.2 | 1,702.7 | 287.1 | 604.3 | 211.1 | 7.2 | (97.0 | ) | 76.3 | 441.1 | 1,695.5 | 384.2 | 528.0 | |||||||||||||||||||||||||||||||||||
| Other |
2,619.3 | 1,455.7 | 1,571.5 | 5,853.6 | 249.9 | (241.3 | ) | (412.7 | ) | 1,610.9 | 2,369.4 | 1,697.1 | 1,984.3 | 4,242.6 | ||||||||||||||||||||||||||||||||||
| Mizuho Bank | ||||||||||||||||||||||||||||||||||||||||||||||||
| Japanese Bonds |
15,227.6 | 2,884.5 | 2,104.3 | 711.7 | (4,563.4 | ) | (3,480.9 | ) | (72.4 | ) | 71.3 | 19,791.0 | 6,365.4 | 2,176.8 | 640.4 | |||||||||||||||||||||||||||||||||
| Japanese Government Bonds |
14,541.4 | 965.7 | 1,579.8 | 100.0 | (4,781.5 | ) | (3,556.7 | ) | (58.8 | ) | (5.0 | ) | 19,322.9 | 4,522.4 | 1,638.6 | 105.0 | ||||||||||||||||||||||||||||||||
| Japanese Local Government Bonds |
35.5 | 275.7 | 241.5 | 7.4 | 8.3 | 55.6 | 74.7 | — | 27.2 | 220.1 | 166.7 | 7.4 | ||||||||||||||||||||||||||||||||||||
| Japanese Corporate Bonds |
650.6 | 1,643.1 | 283.0 | 604.3 | 209.8 | 20.1 | (88.4 | ) | 76.3 | 440.7 | 1,622.9 | 371.4 | 528.0 | |||||||||||||||||||||||||||||||||||
| Other |
2,618.9 | 1,450.8 | 1,568.3 | 5,853.6 | 250.0 | (241.3 | ) | (413.4 | ) | 1,610.9 | 2,368.8 | 1,692.1 | 1,981.7 | 4,242.6 | ||||||||||||||||||||||||||||||||||
| Mizuho Trust & Banking | ||||||||||||||||||||||||||||||||||||||||||||||||
| Japanese Bonds |
1.6 | 59.5 | 4.1 | — | 1.3 | (12.9 | ) | (8.6 | ) | — | 0.3 | 72.5 | 12.7 | — | ||||||||||||||||||||||||||||||||||
| Japanese Government Bonds |
— | — | — | — | — | — | — | — | — | — | — | — | ||||||||||||||||||||||||||||||||||||
| Japanese Local Government Bonds |
— | — | — | — | — | — | — | — | — | — | — | — | ||||||||||||||||||||||||||||||||||||
| Japanese Corporate Bonds |
1.6 | 59.5 | 4.1 | — | 1.3 | (12.9 | ) | (8.6 | ) | — | 0.3 | 72.5 | 12.7 | — | ||||||||||||||||||||||||||||||||||
| Other |
0.4 | 4.9 | 3.2 | — | (0.1 | ) | (0.0 | ) | 0.6 | — | 0.5 | 5.0 | 2.5 | — | ||||||||||||||||||||||||||||||||||
2-12
Mizuho Financial Group, Inc.
7. Overview of Derivative Transactions Qualifying for Hedge Accounting
Non-Consolidated
| • | Notional Amounts of Interest Rate Swaps (qualifying for hedge accounting (deferred method)) by Remaining Contractual Term |
Aggregate Figures for the 2 Banks
| (Billions of yen) | ||||||||||||||||||||||||||||||||||||||||||||||||
| As of March 31, 2023 | Change | As of March 31, 2022 | ||||||||||||||||||||||||||||||||||||||||||||||
| Within 1 year |
1 - 5 years |
Over 5 years |
Total | Within 1 year |
1 - 5 years |
Over 5 years |
Total | Within 1 year |
1 - 5 years |
Over 5 years |
Total | |||||||||||||||||||||||||||||||||||||
| Receive Fixed / Pay Float |
3,098.5 | 14,433.0 | 6,643.9 | 24,175.5 | (123.5 | ) | 5,166.2 | 2,487.5 | 7,530.2 | 3,222.0 | 9,266.7 | 4,156.4 | 16,645.2 | |||||||||||||||||||||||||||||||||||
| Receive Float / Pay Fixed |
681.5 | 2,335.6 | 4,803.8 | 7,820.9 | (589.8 | ) | (509.3 | ) | 1,669.8 | 570.6 | 1,271.4 | 2,844.9 | 3,133.9 | 7,250.3 | ||||||||||||||||||||||||||||||||||
| Receive Float / Pay Float |
— | — | — | — | — | — | — | — | — | — | — | — | ||||||||||||||||||||||||||||||||||||
| Receive Fixed / Pay Fixed |
— | — | — | — | — | — | — | — | — | — | — | — | ||||||||||||||||||||||||||||||||||||
| Total |
3,780.1 | 16,768.6 | 11,447.7 | 31,996.4 | (713.4 | ) | 4,656.8 | 4,157.4 | 8,100.8 | 4,493.5 | 12,111.7 | 7,290.3 | 23,895.6 | |||||||||||||||||||||||||||||||||||
| Mizuho Bank | ||||||||||||||||||||||||||||||||||||||||||||||||
| Receive Fixed / Pay Float |
3,098.5 | 14,433.0 | 6,643.9 | 24,175.5 | (123.5 | ) | 5,166.2 | 2,487.5 | 7,530.2 | 3,222.0 | 9,266.7 | 4,156.4 | 16,645.2 | |||||||||||||||||||||||||||||||||||
| Receive Float / Pay Fixed |
681.5 | 2,285.6 | 4,289.8 | 7,256.9 | (589.8 | ) | (459.3 | ) | 1,510.8 | 461.6 | 1,271.4 | 2,744.9 | 2,778.9 | 6,795.3 | ||||||||||||||||||||||||||||||||||
| Receive Float / Pay Float |
— | — | — | — | — | — | — | — | — | — | — | — | ||||||||||||||||||||||||||||||||||||
| Receive Fixed / Pay Fixed |
— | — | — | — | — | — | — | — | — | — | — | — | ||||||||||||||||||||||||||||||||||||
| Total |
3,780.1 | 16,718.6 | 10,933.7 | 31,432.4 | (713.4 | ) | 4,706.8 | 3,998.4 | 7,991.8 | 4,493.5 | 12,011.7 | 6,935.3 | 23,440.6 | |||||||||||||||||||||||||||||||||||
| Mizuho Trust & Banking | ||||||||||||||||||||||||||||||||||||||||||||||||
| Receive Fixed / Pay Float |
— | — | — | — | — | — | — | — | — | — | — | — | ||||||||||||||||||||||||||||||||||||
| Receive Float / Pay Fixed |
— | 50.0 | 514.0 | 564.0 | — | (50.0 | ) | 159.0 | 109.0 | — | 100.0 | 355.0 | 455.0 | |||||||||||||||||||||||||||||||||||
| Receive Float / Pay Float |
— | — | — | — | — | — | — | — | — | — | — | — | ||||||||||||||||||||||||||||||||||||
| Receive Fixed / Pay Fixed |
— | — | — | — | — | — | — | — | — | — | — | — | ||||||||||||||||||||||||||||||||||||
| Total |
— | 50.0 | 514.0 | 564.0 | — | (50.0 | ) | 159.0 | 109.0 | — | 100.0 | 355.0 | 455.0 | |||||||||||||||||||||||||||||||||||
(Reference)
Deferred Hedge Gains/Losses on Derivative Transactions Qualifying for Hedge Accounting
| (Billions of yen) | ||||||||||||||||||||||||||||||||||||
| As of March 31, 2023 | Change | As of March 31, 2022 | ||||||||||||||||||||||||||||||||||
| Deferred Hedge Gains/Losses | Deferred Hedge Gains/Losses | Deferred Hedge Gains/Losses | ||||||||||||||||||||||||||||||||||
| Gains | Losses | Gains | Losses | Gains | Losses | |||||||||||||||||||||||||||||||
| Aggregate Figures |
2,302.9 | 2,825.5 | (522.6 | ) | 966.8 | 1,373.7 | (406.8 | ) | 1,336.0 | 1,451.7 | (115.7 | ) | ||||||||||||||||||||||||
| Mizuho Bank |
2,281.5 | 2,810.8 | (529.3 | ) | 961.1 | 1,375.0 | (413.9 | ) | 1,320.4 | 1,435.8 | (115.3 | ) | ||||||||||||||||||||||||
| Mizuho Trust & Banking |
21.3 | 14.6 | 6.6 | 5.7 | (1.2 | ) | 7.0 | 15.5 | 15.9 | (0.3 | ) | |||||||||||||||||||||||||
Note: Above figures reflect all derivative transactions qualifying for hedge accounting, and are before net of applicable income taxes and others.
2-13
Mizuho Financial Group, Inc.
8. Employee Retirement Benefits
Non-Consolidated
Retirement Benefit Obligations
Aggregate Figures for the 2 Banks
| (Millions of yen) | ||||||||||||||||
| Fiscal 2022 | Change | Fiscal 2021 | ||||||||||||||
| Retirement Benefit Obligations |
(A) | 1,000,481 | (69,367 | ) | 1,069,848 | |||||||||||
| Discount Rate (%) |
(0.00)~1.54 | (0.00)~1.05 | ||||||||||||||
|
|
|
|
|
|
|
|||||||||||
| Total Fair Value of Plan Assets |
(B) | 1,734,825 | (65,334 | ) | 1,800,159 | |||||||||||
| Unrecognized Actuarial Differences |
(C) | (262,029 | ) | (34,001 | ) | (228,027 | ) | |||||||||
| Prepaid Pension Cost/Reserve for Employee Retirement Benefits |
(B)+ (C)-(A) | 472,314 | (29,968 | ) | 502,283 | |||||||||||
| Mizuho Bank |
||||||||||||||||
| Retirement Benefit Obligations |
(A) | 876,616 | (61,386 | ) | 938,002 | |||||||||||
| Discount Rate (%) |
(0.00)~1.54 | (0.00)~1.05 | ||||||||||||||
|
|
|
|
|
|
|
|||||||||||
| Total Fair Value of Plan Assets |
(B) | 1,484,864 | (91,150 | ) | 1,576,015 | |||||||||||
| Unrecognized Actuarial Differences |
(C) | (204,717 | ) | (7,316 | ) | (197,401 | ) | |||||||||
| Prepaid Pension Cost |
(B)+ (C)-(A) | 403,530 | (37,081 | ) | 440,611 | |||||||||||
| Mizuho Trust & Banking |
||||||||||||||||
| Retirement Benefit Obligations |
(A) | 123,864 | (7,981 | ) | 131,845 | |||||||||||
| Discount Rate (%) |
(0.00)~1.54 | (0.00)~1.05 | ||||||||||||||
|
|
|
|
|
|
|
|||||||||||
| Total Fair Value of Plan Assets |
(B) | 249,960 | 25,816 | 224,144 | ||||||||||||
| Unrecognized Actuarial Differences |
(C) | (57,311 | ) | (26,685 | ) | (30,626 | ) | |||||||||
| Prepaid Pension Cost/Reserve for Employee Retirement Benefits |
(B)+ (C)-(A) | 68,784 | 7,112 | 61,672 | ||||||||||||
2-14
Mizuho Financial Group, Inc.
Income (Expenses) related to Employee Retirement Benefits
Aggregate Figures for the 2 Banks
| (Millions of yen) | ||||||||||||||||
| Fiscal 2022 | Change | Fiscal 2021 | ||||||||||||||
| Service Cost |
(19,075 | ) | 1,203 | (20,278 | ) | |||||||||||
| Interest Cost |
(4,447 | ) | (1,188 | ) | (3,258 | ) | ||||||||||
| Expected Return on Plan Assets |
29,001 | (1,056 | ) | 30,057 | ||||||||||||
| Accumulation (Amortization) of Unrecognized Actuarial Differences |
45,113 | (2,942 | ) | 48,056 | ||||||||||||
| Gains on Cancellation of Employee Retirement Benefit Trust |
47,627 | (26,626 | ) | 74,254 | ||||||||||||
| Other |
(4,177 | ) | 4,131 | (8,309 | ) | |||||||||||
|
|
|
|
|
|
|
|||||||||||
| Total |
94,042 | (26,479 | ) | 120,522 | ||||||||||||
|
|
|
|
|
|
|
|||||||||||
|
Note: Gains on Cancellation of Employee Retirement Benefit Trust are recorded to Extraordinary Gains (Losses). |
|
|||||||||||||||
| Mizuho Bank | ||||||||||||||||
| (Millions of yen) | ||||||||||||||||
| Fiscal 2022 | Change | Fiscal 2021 | ||||||||||||||
| Service Cost |
(16,168 | ) | 878 | (17,046 | ) | |||||||||||
| Interest Cost |
(3,895 | ) | (1,039 | ) | (2,856 | ) | ||||||||||
| Expected Return on Plan Assets |
25,918 | (877 | ) | 26,796 | ||||||||||||
| Accumulation (Amortization) of Unrecognized Actuarial Differences |
39,692 | (2,577 | ) | 42,270 | ||||||||||||
| Gains on Cancellation of Employee Retirement Benefit Trust |
45,553 | (20,958 | ) | 66,511 | ||||||||||||
| Other |
(3,645 | ) | 3,856 | (7,501 | ) | |||||||||||
|
|
|
|
|
|
|
|||||||||||
| Total |
87,455 | (20,718 | ) | 108,173 | ||||||||||||
|
|
|
|
|
|
|
|||||||||||
|
Note: Gains on Cancellation of Employee Retirement Benefit Trust are recorded to Extraordinary Gains (Losses). |
|
|||||||||||||||
|
Mizuho Trust & Banking
|
||||||||||||||||
| (Millions of yen) | ||||||||||||||||
| Fiscal 2022 | Change | Fiscal 2021 | ||||||||||||||
| Service Cost |
(2,906 | ) | 325 | (3,231 | ) | |||||||||||
| Interest Cost |
(551 | ) | (148 | ) | (402 | ) | ||||||||||
| Expected Return on Plan Assets |
3,082 | (179 | ) | 3,261 | ||||||||||||
| Accumulation (Amortization) of Unrecognized Actuarial Differences |
5,420 | (365 | ) | 5,785 | ||||||||||||
| Gains on Cancellation of Employee Retirement Benefit Trust |
2,074 | (5,668 | ) | 7,742 | ||||||||||||
| Other |
(532 | ) | 275 | (807 | ) | |||||||||||
|
|
|
|
|
|
|
|||||||||||
| Total |
6,586 | (5,761 | ) | 12,348 | ||||||||||||
|
|
|
|
|
|
|
|||||||||||
Note: Gains on Cancellation of Employee Retirement Benefit Trust are recorded to Extraordinary Gains (Losses).
2-15
Mizuho Financial Group, Inc.
Consolidated
Retirement Benefit Obligations
| (Millions of yen) | ||||||||||||||||
| As of March 31, 2023 |
Change | As of March 31, 2022 |
||||||||||||||
| Retirement Benefit Obligations |
(A) | 1,200,089 | (78,837 | ) | 1,278,926 | |||||||||||
| Fair Value of Plan Assets |
(B) | 1,990,930 | (79,439 | ) | 2,070,370 | |||||||||||
| Unrecognized Actuarial Differences |
(C) | (262,960 | ) | (19,107 | ) | (243,853 | ) | |||||||||
| Net Defined Benefit Asset |
(D) | 859,271 | (3,946 | ) | 863,217 | |||||||||||
| Net Defined Benefit Liability |
(A)-(B)+(D) | 68,429 | (3,344 | ) | 71,774 | |||||||||||
|
Income (Expenses) related to Employee Retirement Benefits
|
|
|||||||||||||||
| (Millions of yen) | ||||||||||||||||
| Fiscal 2022 | Change | Fiscal 2021 | ||||||||||||||
| Service Cost |
(29,308 | ) | 3,113 | (32,421 | ) | |||||||||||
| Interest Cost |
(5,578 | ) | (1,409 | ) | (4,169 | ) | ||||||||||
| Expected Return on Plan Assets |
34,142 | (808 | ) | 34,951 | ||||||||||||
| Accumulation (Amortization) of Unrecognized Actuarial Differences |
47,385 | (1,064 | ) | 48,449 | ||||||||||||
| Accumulation (Amortization) of Unrecognized Prior Service Cost |
(11 | ) | 34 | (46 | ) | |||||||||||
| Gains on Cancellation of Employee Retirement Benefit Trust |
47,627 | (26,626 | ) | 74,254 | ||||||||||||
| Other |
(14,070 | ) | 423 | (14,494 | ) | |||||||||||
|
|
|
|
|
|
|
|||||||||||
| Total |
80,187 | (26,337 | ) | 106,525 | ||||||||||||
|
|
|
|
|
|
|
|||||||||||
Note: Gains on Cancellation of Employee Retirement Benefit Trust is recorded to Extraordinary Gains.
2-16
Mizuho Financial Group, Inc.
9. Capital Ratio
Mizuho Financial Group
International Standard
| Consolidated | (%, Billions of yen) | |||||||||||||||
| As of March 31, 2023 (Preliminary) |
Change | As of March 31, 2022
|
||||||||||||||
| (1) Total Capital Ratio |
16.05 | (1.48 | ) | 17.53 | ||||||||||||
| (2) Tier 1 Capital Ratio |
13.91 | (1.09 | ) | 15.00 | ||||||||||||
| (3) Common Equity Tier 1 Capital Ratio |
11.80 | (0.66 | ) | 12.46 | ||||||||||||
| (4) Total Capital |
11,306.9 | (44.7 | ) | 11,351.6 | ||||||||||||
| (5) Tier 1 Capital |
9,803.3 | 90.1 | 9,713.2 | |||||||||||||
| (6) Common Equity Tier 1 Capital |
8,315.5 | 248.2 | 8,067.2 | |||||||||||||
| (7) Risk weighted Assets |
70,434.1 | 5,703.7 | 64,730.4 | |||||||||||||
| (8) Total Required Capital (7) X8% |
5,634.7 | 456.2 | 5,178.4 | |||||||||||||
| Mizuho Bank
International Standard |
||||||||||||||||
| Consolidated | Non-Consolidated | |||||||||||||||
| As of March 31, 2023 (Preliminary) |
Change | As of March 31, 2022
|
As of March 31, 2023 (Preliminary) |
|||||||||||||
| (1) Total Capital Ratio |
14.94 | (2.08 | ) | 17.02 | 14.48 | |||||||||||
| (2) Tier 1 Capital Ratio |
12.78 | (1.64 | ) | 14.42 | 12.18 | |||||||||||
| (3) Common Equity Tier 1 Capital Ratio |
10.51 | (1.17 | ) | 11.68 | 9.78 | |||||||||||
| (4) Total Capital |
9,769.7 | (380.8 | ) | 10,150.6 | 8,853.4 | |||||||||||
| (5) Tier 1 Capital |
8,356.5 | (247.9 | ) | 8,604.5 | 7,450.7 | |||||||||||
| (6) Common Equity Tier 1 Capital |
6,873.5 | (95.1 | ) | 6,968.7 | 5,981.9 | |||||||||||
| (7) Risk weighted Assets |
65,371.8 | 5,733.1 | 59,638.6 | 61,141.7 | ||||||||||||
| (8) Total Required Capital (7) X8% |
5,229.7 | 458.6 | 4,771.0 | 4,891.3 | ||||||||||||
| Mizuho Trust & Banking
International Standard |
||||||||||||||||
| Consolidated | Non-Consolidated | |||||||||||||||
| As of March 31, 2023 (Preliminary) |
Change | As of March 31, 2022
|
As of March 31, 2023 (Preliminary) |
|||||||||||||
| (1) Total Capital Ratio |
25.95 | 0.77 | 25.18 | 25.11 | ||||||||||||
| (2) Tier 1 Capital Ratio |
25.94 | 0.76 | 25.18 | 25.10 | ||||||||||||
| (3) Common Equity Tier 1 Capital Ratio |
25.94 | 0.76 | 25.18 | 25.10 | ||||||||||||
| (4) Total Capital |
444.9 | 2.4 | 442.5 | 425.4 | ||||||||||||
| (5) Tier 1 Capital |
444.7 | 2.3 | 442.4 | 425.2 | ||||||||||||
| (6) Common Equity Tier 1 Capital |
444.7 | 2.3 | 442.4 | 425.2 | ||||||||||||
| (7) Risk weighted Assets |
1,714.3 | (42.6 | ) | 1,756.9 | 1,693.9 | |||||||||||
| (8) Total Required Capital (7) X8% |
137.1 | (3.4 | ) | 140.5 | 135.5 | |||||||||||
2-17
Mizuho Financial Group, Inc.
II. REVIEW OF CREDITS
1. Status of Non Performing Loans based on the Banking Act (“BA”) and the Financial Reconstruction Act (“FRA”)
| • | The figures below are presented net of partial direct write-offs. |
| • | Treatment of accrued interest is based on the results of the self-assessment of assets. |
(All loans to obligors classified in the self-assessment of assets as Bankrupt Obligors, Substantially Bankrupt Obligors, and Intensive Control Obligors are categorized as non-accrual loans.)
Consolidated
| (Millions of yen) | ||||||||||||
| As of March 31, 2023 |
As of March 31, 2022 |
|||||||||||
| Change | ||||||||||||
| Claims against Bankrupt and Substantially Bankrupt Obligors |
43,866 | (6,980 | ) | 50,846 | ||||||||
| Claims with Collection Risk |
655,396 | (66,826 | ) | 722,222 | ||||||||
| Claims for Special Attention |
372,433 | 18,399 | 354,034 | |||||||||
| Loans Past Due for 3 Months or More |
288 | (2,209 | ) | 2,498 | ||||||||
| Restructured Loans |
372,144 | 20,609 | 351,535 | |||||||||
| Sub-total[1] |
1,071,696 | (55,407 | ) | 1,127,104 | ||||||||
| Normal Claims |
100,457,014 | 4,232,113 | 96,224,900 | |||||||||
|
|
|
|
|
|
|
|||||||
| Total[2] |
101,528,710 | 4,176,705 | 97,352,004 | |||||||||
|
|
|
|
|
|
|
|||||||
| Above figures are presented net of partial direct write-offs, the amounts of which are indicated in the table below. |
|
|||||||||||
| Amount of Partial Direct Write-offs |
87,247 | (21,626 | ) | 108,874 | ||||||||
| (%) | ||||||||||||
| NPL ratio[1]/[2] |
1.05 | (0.10 | ) | 1.15 | ||||||||
| Trust Account | ||||||||||||
| (Millions of yen) | ||||||||||||
| As of March 31, 2023 |
As of March 31, 2022 |
|||||||||||
| Change | ||||||||||||
| Claims against Bankrupt and Substantially Bankrupt Obligors |
— | — | — | |||||||||
| Claims with Collection Risk |
— | — | — | |||||||||
| Claims for Special Attention |
— | — | — | |||||||||
| Loans Past Due for 3 Months or More |
— | — | — | |||||||||
| Restructured Loans |
— | — | — | |||||||||
| Sub-total[3] |
— | — | — | |||||||||
| Normal Claims |
2,814 | (1,010 | ) | 3,825 | ||||||||
|
|
|
|
|
|
|
|||||||
| Total[4] |
2,814 | (1,010 | ) | 3,825 | ||||||||
|
|
|
|
|
|
|
|||||||
| (%) | ||||||||||||
| NPL ratio[3]/[4] |
— | — | — | |||||||||
2-18
Mizuho Financial Group, Inc.
| Consolidated + Trust Account |
|
|||||||||||
| (Millions of yen) | ||||||||||||
| As of March 31, 2023 |
As of March 31, 2022 |
|||||||||||
| Change | ||||||||||||
| Claims against Bankrupt and Substantially Bankrupt Obligors |
43,866 | (6,980 | ) | 50,846 | ||||||||
| Claims with Collection Risk |
655,396 | (66,826 | ) | 722,222 | ||||||||
| Claims for Special Attention |
372,433 | 18,399 | 354,034 | |||||||||
| Loans Past Due for 3 Months or More |
288 | (2,209 | ) | 2,498 | ||||||||
| Restructured Loans |
372,144 | 20,609 | 351,535 | |||||||||
| Sub-total[5] |
1,071,696 | (55,407 | ) | 1,127,104 | ||||||||
| Normal Claims |
100,459,828 | 4,231,102 | 96,228,725 | |||||||||
|
|
|
|
|
|
|
|||||||
| Total[6] |
101,531,524 | 4,175,694 | 97,355,829 | |||||||||
|
|
|
|
|
|
|
|||||||
| Above figures are presented net of partial direct write-offs, the amounts of which are indicated in the table below. |
|
|||||||||||
| Amount of Partial Direct Write-offs |
87,247 | (21,626 | ) | 108,874 | ||||||||
| (%) | ||||||||||||
| NPL ratio[5]/[6] |
1.05 | (0.10 | ) | 1.15 | ||||||||
| Trust account represents trust accounts that guarantee principals in the agreement. |
2-19
Mizuho Financial Group, Inc.
Non-Consolidated
Aggregate Figures for the 2 Banks
(Banking Account + Trust Account)
| (Millions of yen) | ||||||||||||
| As of March 31, 2023 |
Change | As of March 31, 2022 |
||||||||||
| Claims against Bankrupt and Substantially Bankrupt Obligors |
34,036 | (7,073 | ) | 41,109 | ||||||||
| Claims with Collection Risk |
658,482 | (67,524 | ) | 726,007 | ||||||||
| Claims for Special Attention |
354,948 | 36,383 | 318,564 | |||||||||
| Loans Past Due for 3 Months or More |
288 | (2,209 | ) | 2,497 | ||||||||
| Restructured Loans |
354,659 | 38,592 | 316,066 | |||||||||
| Sub-total[1] |
1,047,467 | (38,214 | ) | 1,085,681 | ||||||||
| Normal Claims |
103,112,269 | 5,178,730 | 97,933,539 | |||||||||
|
|
|
|
|
|
|
|||||||
| Total[2] |
104,159,737 | 5,140,516 | 99,019,221 | |||||||||
|
|
|
|
|
|
|
|||||||
| Above figures are presented net of partial direct write-offs, the amounts of which are indicated in the table below. |
|
|||||||||||
| Amount of Partial Direct Write-offs |
84,793 | (20,619 | ) | 105,413 | ||||||||
| (%) | ||||||||||||
| NPL ratio[1]/[2] |
1.00 | (0.09 | ) | 1.09 | ||||||||
| Mizuho Bank | ||||||||||||
| (Millions of yen) | ||||||||||||
| Claims against Bankrupt and Substantially Bankrupt Obligors |
33,874 | (6,886 | ) | 40,761 | ||||||||
| Claims with Collection Risk |
651,224 | (63,576 | ) | 714,801 | ||||||||
| Claims for Special Attention |
346,665 | 29,681 | 316,984 | |||||||||
| Loans Past Due for 3 Months or More |
288 | (2,185 | ) | 2,473 | ||||||||
| Restructured Loans |
346,377 | 31,866 | 314,510 | |||||||||
| Sub-total[3] |
1,031,765 | (40,781 | ) | 1,072,547 | ||||||||
| Normal Claims |
100,039,242 | 5,304,332 | 94,734,910 | |||||||||
|
|
|
|
|
|
|
|||||||
| Total[4] |
101,071,007 | 5,263,550 | 95,807,457 | |||||||||
|
|
|
|
|
|
|
|||||||
| Above figures are presented net of partial direct write-offs, the amounts of which are indicated in the table below. |
|
|||||||||||
| Amount of Partial Direct Write-offs |
84,576 | (20,626 | ) | 105,202 | ||||||||
| (%) | ||||||||||||
| NPL ratio[3]/[4] |
1.02 | (0.09 | ) | 1.11 | ||||||||
2-20
Mizuho Financial Group, Inc.
| Mizuho Trust & Banking | ||||||||||||
| (Banking Account) | ||||||||||||
| (Millions of yen) | ||||||||||||
| Claims against Bankrupt and Substantially Bankrupt Obligors |
161 | (186 | ) | 348 | ||||||||
| Claims with Collection Risk |
7,258 | (3,948 | ) | 11,206 | ||||||||
| Claims for Special Attention |
8,282 | 6,702 | 1,580 | |||||||||
| Loans Past Due for 3 Months or More |
— | (23 | ) | 23 | ||||||||
| Restructured Loans |
8,282 | 6,726 | 1,556 | |||||||||
| Sub-total[5] |
15,702 | 2,567 | 13,134 | |||||||||
| Normal Claims |
3,070,213 | (124,591 | ) | 3,194,804 | ||||||||
|
|
|
|
|
|
|
|||||||
| Total[6] |
3,085,915 | (122,023 | ) | 3,207,938 | ||||||||
|
|
|
|
|
|
|
|||||||
| Above figures are presented net of partial direct write-offs, the amounts of which are indicated in the table below. |
|
|||||||||||
| Amount of Partial Direct Write-offs |
217 | 6 | 210 | |||||||||
| (%) | ||||||||||||
| NPL ratio[5]/[6] |
0.50 | 0.09 | 0.40 | |||||||||
| (Trust Account) |
||||||||||||
| (Millions of yen) | ||||||||||||
| Claims against Bankrupt and Substantially Bankrupt Obligors |
— | — | — | |||||||||
| Claims with Collection Risk |
— | — | — | |||||||||
| Claims for Special Attention |
— | — | — | |||||||||
| Loans Past Due for 3 Months or More |
— | — | — | |||||||||
| Restructured Loans |
— | — | — | |||||||||
| Sub-total[7] |
— | — | — | |||||||||
| Normal Claims |
2,814 | (1,010 | ) | 3,825 | ||||||||
|
|
|
|
|
|
|
|||||||
| Total[8] |
2,814 | (1,010 | ) | 3,825 | ||||||||
|
|
|
|
|
|
|
|||||||
| (%) | ||||||||||||
| NPL ratio[7]/[8] |
— | — | — | |||||||||
| Trust account represents trust accounts that guarantee principals in the agreement. |
||||||||||||
2-21
Mizuho Financial Group, Inc.
2. Status of Reserves for Possible Losses on Loans
Consolidated
| (Millions of yen) | ||||||||||||
| As of March 31, 2023 |
Change | As of March 31, 2022 |
||||||||||
| Reserves for Possible Losses on Loans |
720,437 | (63,448 | ) | 783,886 | ||||||||
| General Reserve for Possible Losses on Loans |
313,052 | 43,912 | 269,140 | |||||||||
| Specific Reserve for Possible Losses on Loans |
363,448 | (96,565 | ) | 460,013 | ||||||||
| Reserve for Possible Losses on Loans to Restructuring Countries |
43,937 | (10,795 | ) | 54,732 | ||||||||
| Above figures are presented net of partial direct write-offs, the amounts of which are indicated in the table below. |
||||||||||||
| Amount of Partial Direct Write-offs |
87,534 | (21,588 | ) | 109,122 | ||||||||
|
Non-Consolidated
Aggregate Figures for the 2 Banks
|
||||||||||||
| (Millions of yen) | ||||||||||||
| As of March 31, 2023 |
Change | As of March 31, 2022 |
||||||||||
| Reserves for Possible Losses on Loans |
705,254 | (111,995 | ) | 817,249 | ||||||||
| General Reserve for Possible Losses on Loans |
297,006 | 46,524 | 250,482 | |||||||||
| Specific Reserve for Possible Losses on Loans |
364,310 | (147,724 | ) | 512,034 | ||||||||
| Reserve for Possible Losses on Loans to Restructuring Countries |
43,937 | (10,795 | ) | 54,732 | ||||||||
| Above figures are presented net of partial direct write-offs, the amounts of which are indicated in the table below. |
||||||||||||
| Amount of Partial Direct Write-offs |
84,793 | (20,619 | ) | 105,413 | ||||||||
| Mizuho Bank |
||||||||||||
| Reserves for Possible Losses on Loans | 701,652 | (113,126 | ) | 814,778 | ||||||||
| General Reserve for Possible Losses on Loans |
293,760 | 45,325 | 248,435 | |||||||||
| Specific Reserve for Possible Losses on Loans |
363,954 | (147,655 | ) | 511,610 | ||||||||
| Reserve for Possible Losses on Loans to Restructuring Countries |
43,937 | (10,795 | ) | 54,732 | ||||||||
| Above figures are presented net of partial direct write-offs, the amounts of which are indicated in the table below. |
||||||||||||
| Amount of Partial Direct Write-offs |
84,576 | (20,626 | ) | 105,202 | ||||||||
| Mizuho Trust & Banking |
||||||||||||
| Reserves for Possible Losses on Loans |
3,601 | 1,130 | 2,470 | |||||||||
| General Reserve for Possible Losses on Loans |
3,246 | 1,199 | 2,046 | |||||||||
| Specific Reserve for Possible Losses on Loans |
355 | (68 | ) | 424 | ||||||||
| Reserve for Possible Losses on Loans to Restructuring Countries |
— | — | — | |||||||||
| Above figures are presented net of partial direct write-offs, the amounts of which are indicated in the table below. |
||||||||||||
| Amount of Partial Direct Write-offs |
217 | 6 | 210 | |||||||||
Reserve for Possible Losses on Entrusted Loans (¥9 million and ¥12 million for March 31, 2023 and March 31, 2022, respectively) is not included in the above figures for Trust Account.
2-22
Mizuho Financial Group, Inc.
3. Reserve Ratios for Non Performing Loans based on the BA and the FRA
Consolidated
| (%) | ||||||||||||
| As of March 31, 2023 |
Change | As of March 31, 2022 |
||||||||||
| Mizuho Financial Group |
67.22 | (2.32 | ) | 69.54 | ||||||||
|
Above figures are presented net of partial direct write-offs. |
||||||||||||
| Non-Consolidated |
||||||||||||
| (%) | ||||||||||||
| As of March 31, 2023 |
Change | As of March 31, 2022 |
||||||||||
| Total |
67.32 | (7.94 | ) | 75.27 | ||||||||
| Mizuho Bank |
68.00 | (7.96 | ) | 75.96 | ||||||||
| Mizuho Trust & Banking (Banking Account) |
22.93 | 4.12 | 18.81 | |||||||||
Above figures are presented net of partial direct write-offs.
2-23
Mizuho Financial Group, Inc.
4. Coverage on Non Performing Loans based on the BA and the FRA
Non-Consolidated
(1) Non Performing Loans based on the BA and the FRA and Coverage Amount
Aggregate Figures for the 2 Banks (Banking Account)
| (Billions of yen) | ||||||||||||
| As of March 31, 2023 |
Change | As of March 31, 2022 |
||||||||||
| Claims against Bankrupt and Substantially Bankrupt Obligors |
34.0 | (7.0 | ) | 41.1 | ||||||||
| Collateral, Guarantees, and equivalent |
28.9 | (6.4 | ) | 35.4 | ||||||||
| Reserve for Possible Losses |
5.1 | (0.5 | ) | 5.6 | ||||||||
| Claims with Collection Risk |
658.4 | (67.5 | ) | 726.0 | ||||||||
| Collateral, Guarantees, and equivalent |
172.8 | 8.0 | 164.8 | |||||||||
| Reserve for Possible Losses |
342.9 | (95.9 | ) | 438.9 | ||||||||
| Claims for Special Attention |
354.9 | 36.3 | 318.5 | |||||||||
| Collateral, Guarantees, and equivalent |
103.4 | 9.9 | 93.5 | |||||||||
| Reserve for Possible Losses |
66.0 | 13.7 | 52.2 | |||||||||
| Total |
1,047.4 | (38.2 | ) | 1,085.6 | ||||||||
| Collateral, Guarantees, and equivalent |
305.2 | 11.4 | 293.8 | |||||||||
| Reserve for Possible Losses |
414.1 | (82.7 | ) | 496.9 | ||||||||
| Mizuho Bank | ||||||||||||
| Claims against Bankrupt and Substantially Bankrupt Obligors |
33.8 | (6.8 | ) | 40.7 | ||||||||
| Collateral, Guarantees, and equivalent |
28.7 | (6.2 | ) | 35.0 | ||||||||
| Reserve for Possible Losses |
5.1 | (0.5 | ) | 5.6 | ||||||||
| Claims with Collection Risk |
651.2 | (63.5 | ) | 714.8 | ||||||||
| Collateral, Guarantees, and equivalent |
166.1 | 11.8 | 154.2 | |||||||||
| Reserve for Possible Losses |
342.6 | (95.9 | ) | 438.5 | ||||||||
| Claims for Special Attention |
346.6 | 29.6 | 316.9 | |||||||||
| Collateral, Guarantees, and equivalent |
96.4 | 3.0 | 93.4 | |||||||||
| Reserve for Possible Losses |
65.7 | 13.8 | 51.9 | |||||||||
| Total |
1,031.7 | (40.7 | ) | 1,072.5 | ||||||||
| Collateral, Guarantees, and equivalent |
291.3 | 8.6 | 282.7 | |||||||||
| Reserve for Possible Losses |
413.5 | (82.6 | ) | 496.2 | ||||||||
| Mizuho Trust & Banking (Banking Account) | ||||||||||||
| Claims against Bankrupt and Substantially Bankrupt Obligors |
0.1 | (0.1 | ) | 0.3 | ||||||||
| Collateral, Guarantees, and equivalent |
0.1 | (0.1 | ) | 0.3 | ||||||||
| Reserve for Possible Losses |
— | — | — | |||||||||
| Claims with Collection Risk |
7.2 | (3.9 | ) | 11.2 | ||||||||
| Collateral, Guarantees, and equivalent |
6.7 | (3.8 | ) | 10.6 | ||||||||
| Reserve for Possible Losses |
0.3 | (0.0 | ) | 0.4 | ||||||||
| Claims for Special Attention |
8.2 | 6.7 | 1.5 | |||||||||
| Collateral, Guarantees, and equivalent |
6.9 | 6.8 | 0.1 | |||||||||
| Reserve for Possible Losses |
0.2 | (0.0 | ) | 0.2 | ||||||||
| Total |
15.7 | 2.5 | 13.1 | |||||||||
| Collateral, Guarantees, and equivalent |
13.8 | 2.7 | 11.0 | |||||||||
| Reserve for Possible Losses |
0.6 | (0.0 | ) | 0.7 | ||||||||
| Reference: Trust Account | ||||||||||||
| Claims against Bankrupt and Substantially Bankrupt Obligors |
— | — | — | |||||||||
| Collateral, Guarantees, and equivalent |
— | — | — | |||||||||
| Claims with Collection Risk |
— | — | — | |||||||||
| Collateral, Guarantees, and equivalent |
— | — | — | |||||||||
| Claims for Special Attention |
— | — | — | |||||||||
| Collateral, Guarantees, and equivalent |
— | — | — | |||||||||
| Total |
— | — | — | |||||||||
| Collateral, Guarantees, and equivalent |
— | — | — | |||||||||
Trust account represents trust accounts that guarantee principals in the agreement.
2-24
Mizuho Financial Group, Inc.
(2) Coverage Ratio
Aggregate Figures for the 2 Banks (Banking Account)
| (Billions of yen) | ||||||||||||
| As of March 31, 2023 |
Change | As of March 31, 2022 |
||||||||||
| Coverage Amount |
719.3 | (71.3 | ) | 790.7 | ||||||||
| Reserves for Possible Losses on Loans |
414.1 | (82.7 | ) | 496.9 | ||||||||
| Collateral, Guarantees, and equivalent |
305.2 | 11.4 | 293.8 | |||||||||
| (%) | ||||||||||||
| Coverage Ratio |
68.6 | (4.1 | ) | 72.8 | ||||||||
| Claims against Bankrupt and Substantially Bankrupt Obligors |
100.0 | — | 100.0 | |||||||||
| Claims with Collection Risk |
78.3 | (4.8 | ) | 83.1 | ||||||||
| Claims for Special Attention |
47.7 | 1.9 | 45.7 | |||||||||
| Claims against Special Attention Obligors |
51.5 | 4.7 | 46.8 | |||||||||
| Reserve Ratio against Non-collateralized Claims |
||||||||||||
| (%) | ||||||||||||
| Claims against Bankrupt and Substantially Bankrupt Obligors |
100.0 | — | 100.0 | |||||||||
| Claims with Collection Risk |
70.6 | (7.6 | ) | 78.2 | ||||||||
| Claims for Special Attention |
26.2 | 3.0 | 23.2 | |||||||||
| Claims against Special Attention Obligors |
29.7 | 4.4 | 25.3 | |||||||||
| Reference: Reserve Ratio |
||||||||||||
| (%) | ||||||||||||
| Claims against Special Attention Obligors |
20.52 | 2.47 | 18.05 | |||||||||
| Claims against Watch Obligors excluding Special Attention Obligors |
2.91 | (0.54 | ) | 3.46 | ||||||||
| Claims against Normal Obligors |
0.09 | (0.00 | ) | 0.10 | ||||||||
| Mizuho Bank |
||||||||||||
| (Billions of yen) | ||||||||||||
| Coverage Amount |
704.9 | (74.0 | ) | 778.9 | ||||||||
| Reserves for Possible Losses on Loans |
413.5 | (82.6 | ) | 496.2 | ||||||||
| Collateral, Guarantees, and equivalent |
291.3 | 8.6 | 282.7 | |||||||||
| (%) | ||||||||||||
| Coverage Ratio |
68.3 | (4.3 | ) | 72.6 | ||||||||
| Claims against Bankrupt and Substantially Bankrupt Obligors |
100.0 | — | 100.0 | |||||||||
| Claims with Collection Risk |
78.1 | (4.8 | ) | 82.9 | ||||||||
| Claims for Special Attention |
46.8 | 0.9 | 45.8 | |||||||||
| Claims against Special Attention Obligors |
51.3 | 4.4 | 46.9 | |||||||||
| Reserve Ratio against Non-collateralized Claims |
|
|||||||||||
| (%) | ||||||||||||
| Claims against Bankrupt and Substantially Bankrupt Obligors |
100.0 | — | 100.0 | |||||||||
| Claims with Collection Risk |
70.6 | (7.6 | ) | 78.2 | ||||||||
| Claims for Special Attention |
26.2 | 3.0 | 23.2 | |||||||||
| Claims against Special Attention Obligors |
29.8 | 4.5 | 25.3 | |||||||||
| Reference: Reserve Ratio |
||||||||||||
| (%) | ||||||||||||
| Claims against Special Attention Obligors |
20.74 | 2.69 | 18.04 | |||||||||
| Claims against Watch Obligors excluding Special Attention Obligors |
2.92 | (0.56 | ) | 3.49 | ||||||||
| Claims against Normal Obligors |
0.09 | (0.00 | ) | 0.10 | ||||||||
2-25
Mizuho Financial Group, Inc.
Mizuho Trust & Banking (Banking Account)
| (Billions of yen) | ||||||||||||
| As of March 31, 2023 |
Change | As of March 31, 2022 |
||||||||||
| Coverage Amount |
14.4 | 2.7 | 11.7 | |||||||||
| Reserves for Possible Losses on Loans |
0.6 | (0.0 | ) | 0.7 | ||||||||
| Collateral, Guarantees, and equivalent |
13.8 | 2.7 | 11.0 | |||||||||
| (%) | ||||||||||||
| Coverage Ratio |
92.1 | 2.5 | 89.5 | |||||||||
| Claims against Bankrupt and Substantially Bankrupt Obligors |
100.0 | — | 100.0 | |||||||||
| Claims with Collection Risk |
97.7 | (0.5 | ) | 98.2 | ||||||||
| Claims for Special Attention |
87.1 | 61.4 | 25.6 | |||||||||
| Claims against Special Attention Obligors |
60.7 | 36.6 | 24.0 | |||||||||
| Reserve Ratio against Non-collateralized Claims |
||||||||||||
| (%) | ||||||||||||
| Claims against Bankrupt and Substantially Bankrupt Obligors |
— | — | — | |||||||||
| Claims with Collection Risk |
67.3 | (0.8 | ) | 68.1 | ||||||||
| Claims for Special Attention |
19.8 | (0.1 | ) | 20.0 | ||||||||
| Claims against Special Attention Obligors |
19.4 | (0.5 | ) | 19.9 | ||||||||
| Reference: Reserve Ratio |
||||||||||||
| (%) | ||||||||||||
| Claims against Special Attention Obligors |
9.48 | (9.48 | ) | 18.96 | ||||||||
| Claims against Watch Obligors excluding Special Attention Obligors |
1.68 | 0.59 | 1.08 | |||||||||
| Claims against Normal Obligors |
0.03 | (0.00 | ) | 0.04 | ||||||||
2-26
Mizuho Financial Group, Inc.
5. Overview of Non-Performing Loans (“NPLs”)
Non-Consolidated
Aggregate Figures for the 2 Banks (Banking Account)
(Billions of yen)
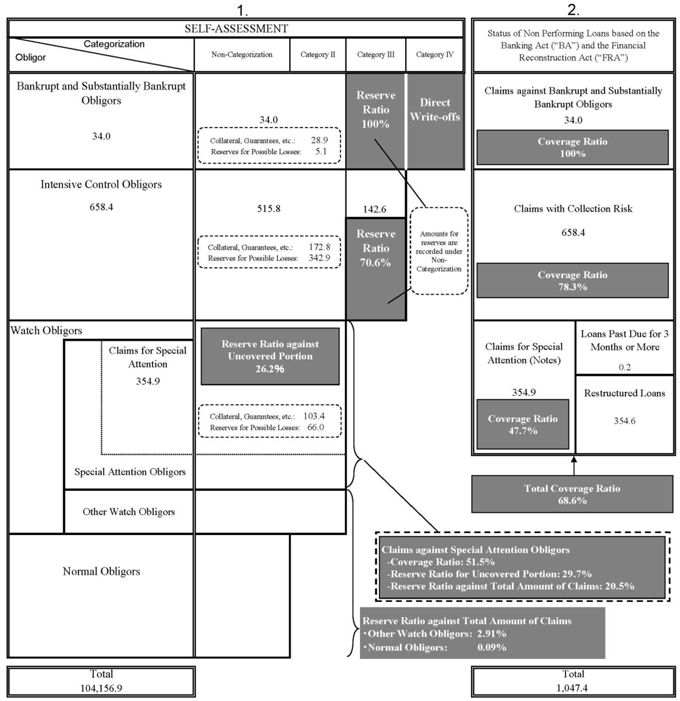
| Notes: 1. | Claims for Special Attention is denoted on an individual loans basis. Claims against Special Attention Obligors includes all claims, not limited to Claims for Special Attention. |
2-27
Mizuho Financial Group, Inc.
6. Results of Removal of NPLs from the Balance Sheet
Non-Consolidated
(1) Outstanding Balance of Claims against Bankrupt and Substantially Bankrupt Obligors and Claims with Collection Risk (under the BA and the FRA)
Aggregate Figures for the 2 Banks (Banking Account + Trust Account)
| (Billions of yen) | ||||||||||||||||||||||||||||
| Fiscal 2019 | Fiscal 2020 | Fiscal 2021 | Fiscal 2022 | |||||||||||||||||||||||||
| As of March 31, 2020 |
As of March 31, 2021 |
As of March 31, 2022 |
As of March 31, 2023 | |||||||||||||||||||||||||
| MHBK | MHTB* | Aggregate Figures for the 2 Banks |
Change from March 31, 2022 |
|||||||||||||||||||||||||
| Claims against Bankrupt and Substantially Bankrupt Obligors |
51.0 | 33.6 | 28.6 | 20.3 | 0.1 | 20.4 | (8.1 | ) | ||||||||||||||||||||
| Claims with Collection Risk |
386.5 | 246.8 | 162.5 | 138.1 | 0.7 | 138.9 | (23.6 | ) | ||||||||||||||||||||
| Amount Categorized as above up to Fiscal 2019 |
437.5 | 280.5 | 191.2 | 158.5 | 0.8 | 159.4 | (31.7 | ) | ||||||||||||||||||||
| of which the amount which was in the process of being removed from the balance sheet |
44.5 | 31.6 | 30.1 | 19.9 | 0.1 | 20.0 | (10.0 | ) | ||||||||||||||||||||
| Claims against Bankrupt and Substantially Bankrupt Obligors |
15.0 | 4.8 | 2.5 | 0.0 | 2.5 | (2.2 | ) | |||||||||||||||||||||
| Claims with Collection Risk |
164.2 | 92.5 | 64.9 | 0.3 | 65.2 | (27.3 | ) | |||||||||||||||||||||
| Amount Newly Categorized as above during Fiscal 2020 |
179.2 | 97.3 | 67.4 | 0.3 | 67.8 | (29.5 | ) | |||||||||||||||||||||
| of which the amount which was in the process of being removed from the balance sheet |
13.6 | 2.7 | 1.5 | 0.0 | 1.5 | (1.2 | ) | |||||||||||||||||||||
| Claims against Bankrupt and Substantially Bankrupt Obligors |
7.6 | 2.9 | 0.0 | 2.9 | (4.6 | ) | ||||||||||||||||||||||
| Claims with Collection Risk |
470.9 | 294.6 | 5.8 | 300.4 | (170.4 | ) | ||||||||||||||||||||||
| Amount Newly Categorized as above during Fiscal 2021 |
478.5 | 297.5 | 5.8 | 303.4 | (175.0 | ) | ||||||||||||||||||||||
| of which the amount which was in the process of being removed from the balance sheet |
7.1 | 2.5 | 0.0 | 2.6 | (4.5 | ) | ||||||||||||||||||||||
| Claims against Bankrupt and Substantially Bankrupt Obligors |
7.9 | 0.0 | 7.9 | 7.9 | ||||||||||||||||||||||||
| Claims with Collection Risk |
153.5 | 0.3 | 153.8 | 153.8 | ||||||||||||||||||||||||
| Amount Newly Categorized as above during Fiscal 2022 |
161.4 | 0.3 | 161.8 | 161.8 | ||||||||||||||||||||||||
| of which the amount which was in the process of being removed from the balance sheet |
6.2 | 0.0 | 6.3 | 6.3 | ||||||||||||||||||||||||
| Claims against Bankrupt and Substantially Bankrupt Obligors |
51.0 | 48.7 | 41.1 | 33.8 | 0.1 | 34.0 | (7.0 | ) | ||||||||||||||||||||
| Claims with Collection Risk |
386.5 | 411.0 | 726.0 | 651.2 | 7.2 | 658.4 | (67.5 | ) | ||||||||||||||||||||
| Total |
437.5 | 459.7 | 767.1 | 685.0 | 7.4 | 692.5 | (74.5 | ) | ||||||||||||||||||||
| of which the amount which was in the process of being removed from the balance sheet |
44.5 | 45.3 | 40.0 | 30.3 | 0.1 | 30.5 | (9.5 | ) | ||||||||||||||||||||
|
* Trust account represents trust accounts that guarantee principals in the agreement. |
||||
| * | denotes newly categorized amounts. | |||
(2) Breakdown of Reasons for Removal of NPLs from the Balance Sheet in Fiscal 2022
| (Billions of yen) | ||||||||||||
| Aggregate Figures for the 2 Banks (Banking Account + Trust Account) |
MHBK | MHTB (Banking Account + Trust Account) |
||||||||||
| Liquidation |
(9.4 | ) | (9.4 | ) | — | |||||||
| Restructuring |
(147.2 | ) | (147.2 | ) | — | |||||||
| Improvement in Business Performance due to Restructuring |
— | — | — | |||||||||
| Loan Sales |
(23.4 | ) | (23.4 | ) | — | |||||||
| Direct Write-off |
164.8 | 164.8 | — | |||||||||
| Other |
(221.1 | ) | (216.6 | ) | (4.4 | ) | ||||||
| Debt recovery |
(188.9 | ) | (184.7 | ) | (4.1 | ) | ||||||
| Improvement in Business Performance |
(32.2 | ) | (31.9 | ) | (0.3 | ) | ||||||
|
|
|
|
|
|
|
|||||||
| Total |
(236.4 | ) | (231.9 | ) | (4.4 | ) | ||||||
|
|
|
|
|
|
|
|||||||
2-28
Mizuho Financial Group, Inc.
7. Status of Loans by Industry
(1) Outstanding Balances by Industry
Non-Consolidated
Aggregate Figures for the 2 Banks (Banking Account + Trust Account)
| (Billions of yen) | ||||||||||||
| As of March 31, 2023 | As of March 31, 2022 | |||||||||||
| Outstanding Balance |
Change | Outstanding Balance |
||||||||||
| Domestic Total (excluding Loans Booked Offshore) |
61,307.8 | 1,119.7 | 60,188.1 | |||||||||
| Manufacturing |
9,847.1 | 76.2 | 9,770.8 | |||||||||
| Agriculture & Forestry |
47.5 | 0.0 | 47.5 | |||||||||
| Fishery |
2.7 | (0.1 | ) | 2.9 | ||||||||
| Mining, Quarrying Industry & Gravel Extraction Industry |
205.5 | (15.2 | ) | 220.7 | ||||||||
| Construction |
902.0 | 44.6 | 857.4 | |||||||||
| Utilities |
3,398.3 | 354.9 | 3,043.3 | |||||||||
| Communication |
1,000.3 | (206.1 | ) | 1,206.4 | ||||||||
| Transportation & Postal Industry |
2,436.0 | (145.4 | ) | 2,581.5 | ||||||||
| Wholesale & Retail |
4,911.5 | (303.2 | ) | 5,214.7 | ||||||||
| Finance & Insurance |
9,451.7 | 419.5 | 9,032.1 | |||||||||
| Real Estate |
11,041.2 | 880.8 | 10,160.4 | |||||||||
| Commodity Lease |
3,136.3 | 244.3 | 2,891.9 | |||||||||
| Service Industries |
2,982.4 | (99.5 | ) | 3,082.0 | ||||||||
| Local Governments |
541.5 | (47.5 | ) | 589.0 | ||||||||
| Governments |
1,079.3 | 242.7 | 836.5 | |||||||||
| Other |
10,323.8 | (326.2 | ) | 10,650.0 | ||||||||
| Overseas Total (including Loans Booked Offshore) |
29,610.6 | 3,146.7 | 26,463.8 | |||||||||
| Governments |
145.3 | (118.4 | ) | 263.8 | ||||||||
| Financial Institutions |
11,098.0 | 1,553.4 | 9,544.6 | |||||||||
| Other |
18,367.2 | 1,711.8 | 16,655.3 | |||||||||
|
|
|
|
|
|
|
|||||||
| Total |
90,918.5 | 4,266.5 | 86,651.9 | |||||||||
|
|
|
|
|
|
|
|||||||
| * | Loans to Finance & Insurance sector includes loans to MHFG as follows: |
| As of March 31, 2023: |
¥810.0 billion (from MHBK) | |
| As of March 31, 2022: |
¥755.0 billion (from MHBK) |
| * | Amounts of Outstanding Balances are the aggregate figures for banking and trust accounts. |
2-29
Mizuho Financial Group, Inc.
| (Billions of yen) | ||||||||||||
| As of March 31, 2023 | As of March 31, 2022 | |||||||||||
| Outstanding Balance |
Change | Outstanding Balance |
||||||||||
| Mizuho Bank | ||||||||||||
| Domestic Total (excluding Loans Booked Offshore) |
57,669.7 | 1,170.9 | 56,498.8 | |||||||||
| Manufacturing |
9,446.5 | 89.6 | 9,356.9 | |||||||||
| Agriculture & Forestry |
47.5 | 0.0 | 47.5 | |||||||||
| Fishery |
2.7 | (0.1 | ) | 2.9 | ||||||||
| Mining, Quarrying Industry & Gravel Extraction Industry |
204.1 | (15.0 | ) | 219.2 | ||||||||
| Construction |
859.1 | 42.4 | 816.7 | |||||||||
| Utilities |
3,132.4 | 365.9 | 2,766.4 | |||||||||
| Communication |
907.6 | (197.2 | ) | 1,104.9 | ||||||||
| Transportation & Postal Industry |
2,297.9 | (104.7 | ) | 2,402.6 | ||||||||
| Wholesale & Retail |
4,791.8 | (291.6 | ) | 5,083.4 | ||||||||
| Finance & Insurance |
8,946.8 | 390.9 | 8,555.8 | |||||||||
| Real Estate |
9,489.5 | 789.6 | 8,699.8 | |||||||||
| Commodity Lease |
2,946.8 | 253.0 | 2,693.8 | |||||||||
| Service Industries |
2,941.3 | (88.4 | ) | 3,029.8 | ||||||||
| Local Governments |
540.3 | (46.9 | ) | 587.3 | ||||||||
| Governments |
1,079.3 | 242.7 | 836.5 | |||||||||
| Other |
10,035.3 | (259.2 | ) | 10,294.6 | ||||||||
| Overseas Total (including Loans Booked Offshore) |
29,610.6 | 3,147.0 | 26,463.6 | |||||||||
| Governments |
145.3 | (118.4 | ) | 263.8 | ||||||||
| Financial Institutions |
11,098.0 | 1,553.4 | 9,544.6 | |||||||||
| Other |
18,367.2 | 1,712.0 | 16,655.1 | |||||||||
|
|
|
|
|
|
|
|||||||
| Total |
87,280.3 | 4,317.9 | 82,962.4 | |||||||||
|
|
|
|
|
|
|
|||||||
| Mizuho Trust & Banking (Banking Account + Trust Account) | ||||||||||||
| Domestic Total (excluding Loans Booked Offshore) |
3,638.1 | (51.1 | ) | 3,689.3 | ||||||||
| Manufacturing |
400.6 | (13.3 | ) | 413.9 | ||||||||
| Agriculture & Forestry |
0.0 | (0.0 | ) | 0.0 | ||||||||
| Fishery |
— | — | — | |||||||||
| Mining, Quarrying Industry & Gravel Extraction Industry |
1.4 | (0.1 | ) | 1.5 | ||||||||
| Construction |
42.8 | 2.1 | 40.7 | |||||||||
| Utilities |
265.9 | (11.0 | ) | 276.9 | ||||||||
| Communication |
92.6 | (8.8 | ) | 101.5 | ||||||||
| Transportation & Postal Industry |
138.1 | (40.6 | ) | 178.8 | ||||||||
| Wholesale & Retail |
119.7 | (11.6 | ) | 131.3 | ||||||||
| Finance & Insurance |
504.8 | 28.5 | 476.2 | |||||||||
| Real Estate |
1,551.6 | 91.1 | 1,460.5 | |||||||||
| Commodity Lease |
189.5 | (8.6 | ) | 198.1 | ||||||||
| Service Industries |
41.1 | (11.0 | ) | 52.1 | ||||||||
| Local Governments |
1.1 | (0.5 | ) | 1.6 | ||||||||
| Governments |
— | — | — | |||||||||
| Other |
288.5 | (66.9 | ) | 355.4 | ||||||||
| Overseas Total (including Loans Booked Offshore) |
— | (0.2 | ) | 0.2 | ||||||||
| Governments |
— | — | — | |||||||||
| Financial Institutions |
— | — | — | |||||||||
| Other |
— | (0.2 | ) | 0.2 | ||||||||
|
|
|
|
|
|
|
|||||||
| Total |
3,638.1 | (51.3 | ) | 3,689.5 | ||||||||
|
|
|
|
|
|
|
|||||||
| * | Amounts of Outstanding Balances are the aggregate figures for banking and trust accounts. |
2-30
Mizuho Financial Group, Inc.
(2) Non Performing Loans based on the BA and the FRA and Coverage Ratio by Industry
Non-Consolidated
Aggregate Figures for the 2 Banks (Banking Account + Trust Account)
| (Billions of yen, %) | ||||||||||||||||||||||||
| As of March 31, 2023 | As of March 31, 2022 | |||||||||||||||||||||||
| Change | ||||||||||||||||||||||||
| Non Performing Loans based on the BA and the FRA |
Coverage Ratio |
Non Performing Loans based on the BA and the FRA |
Coverage Ratio |
Non Performing Loans based on the BA and the FRA |
Coverage Ratio |
|||||||||||||||||||
| Domestic Total (excluding Loans Booked Offshore) |
898.8 | 65.7 | (99.5 | ) | (6.5 | ) | 998.4 | 72.3 | ||||||||||||||||
| Manufacturing |
464.3 | 64.3 | (52.2 | ) | (12.0 | ) | 516.5 | 76.4 | ||||||||||||||||
| Agriculture & Forestry |
7.2 | 60.0 | 5.9 | 13.1 | 1.3 | 46.9 | ||||||||||||||||||
| Fishery |
0.2 | 62.6 | (0.0 | ) | 0.0 | 0.2 | 62.6 | |||||||||||||||||
| Mining, Quarrying Industry & Gravel Extraction Industry |
— | — | (0.1 | ) | — | 0.1 | 100.0 | |||||||||||||||||
| Construction |
6.2 | 78.1 | 0.2 | (0.4 | ) | 5.9 | 78.5 | |||||||||||||||||
| Utilities |
5.3 | 55.6 | 4.2 | 18.1 | 1.1 | 37.4 | ||||||||||||||||||
| Communication |
8.7 | 68.7 | (0.4 | ) | (6.3 | ) | 9.1 | 75.1 | ||||||||||||||||
| Transportation & Postal Industry |
21.9 | 63.8 | (4.3 | ) | 16.0 | 26.2 | 47.7 | |||||||||||||||||
| Wholesale & Retail |
121.6 | 59.7 | (8.7 | ) | 2.1 | 130.3 | 57.5 | |||||||||||||||||
| Finance & Insurance |
12.0 | 45.4 | (2.2 | ) | (36.1 | ) | 14.3 | 81.6 | ||||||||||||||||
| Real Estate |
30.3 | 87.4 | (5.2 | ) | 5.9 | 35.5 | 81.5 | |||||||||||||||||
| Commodity Lease |
0.2 | 89.4 | (1.1 | ) | 2.2 | 1.4 | 87.1 | |||||||||||||||||
| Service Industries |
152.5 | 61.3 | (16.8 | ) | (1.9 | ) | 169.4 | 63.2 | ||||||||||||||||
| Local Governments |
— | — | — | — | — | — | ||||||||||||||||||
| Other |
67.8 | 90.6 | (18.6 | ) | 0.9 | 86.5 | 89.6 | |||||||||||||||||
| Overseas Total (including Loans Booked Offshore) |
148.6 | 86.2 | 61.3 | 7.3 | 87.2 | 78.9 | ||||||||||||||||||
| Governments |
— | — | — | — | — | — | ||||||||||||||||||
| Financial Institutions |
— | — | — | — | — | — | ||||||||||||||||||
| Other |
148.6 | 86.2 | 61.3 | 7.3 | 87.2 | 78.9 | ||||||||||||||||||
|
|
|
|
|
|
|
|
|
|
|
|
|
|||||||||||||
| Total |
1,047.4 | 68.6 | (38.2 | ) | (4.1 | ) | 1,085.6 | 72.8 | ||||||||||||||||
|
|
|
|
|
|
|
|
|
|
|
|
|
|||||||||||||
| * | Trust account represents trust accounts that guarantee principals in the agreement. |
2-31
Mizuho Financial Group, Inc.
8. Housing and Consumer Loans & Loans to Small and Medium-Sized Enterprises (“SMEs”) and Individual Customers
(1) Balance of Housing and Consumer Loans
Non-Consolidated
Aggregate Figures for the 2 Banks (Banking Account + Trust Account)
| (Billions of yen) | ||||||||||||
| As of March 31, 2023 |
As of March 31, 2022 |
|||||||||||
| Change | ||||||||||||
| Housing and Consumer Loans |
8,112.5 | (344.7 | ) | 8,457.3 | ||||||||
| Housing Loans for owner’s residential housing |
7,603.1 | (293.2 | ) | 7,896.3 | ||||||||
| Mizuho Bank |
||||||||||||
| Housing and Consumer Loans |
8,067.3 | (336.7 | ) | 8,404.1 | ||||||||
| Housing Loans |
7,671.7 | (309.6 | ) | 7,981.4 | ||||||||
| for owner’s residential housing |
7,560.4 | (286.0 | ) | 7,846.4 | ||||||||
| Consumer loans |
395.5 | (27.0 | ) | 422.6 | ||||||||
| Mizuho Trust & Banking (Banking Account + Trust Account) |
||||||||||||
| Housing and Consumer Loans |
45.2 | (8.0 | ) | 53.2 | ||||||||
| Housing Loans for owner’s residential housing |
42.6 | (7.1 | ) | 49.8 | ||||||||
|
* Above figures are aggregate banking and trust account amounts. |
||||||||||||
| (2) Loans to SMEs and Individual Customers |
|
|||||||||||
| Non-Consolidated |
|
|||||||||||
| Aggregate Figures for the 2 Banks (Banking Account + Trust Account) |
|
|||||||||||
| (%, Billions of yen) | ||||||||||||
| As of March 31, 2023 |
As of March 31, 2022 |
|||||||||||
| Change | ||||||||||||
| Percentage of Loans to SMEs and Individual Customers, of Total Domestic Loans |
58.8 | 0.8 | 57.9 | |||||||||
| Loans to SMEs and Individual Customers |
36,070.1 | 1,172.2 | 34,897.9 | |||||||||
| Mizuho Bank |
||||||||||||
| Percentage of Loans to SMEs and Individual Customers, of Total Domestic Loans |
58.6 | 0.3 | 58.3 | |||||||||
| Loans to SMEs and Individual Customers |
33,850.8 | 874.7 | 32,976.0 | |||||||||
| Mizuho Trust & Banking (Banking Account + Trust Account) |
||||||||||||
| Percentage of Loans to SMEs and Individual Customers, of Total Domestic Loans |
61.0 | 8.9 | 52.0 | |||||||||
| Loans to SMEs and Individual Customers |
2,219.3 | 297.4 | 1,921.8 | |||||||||
| * | Above figures are aggregate banking and trust account amounts. |
| * | Above figures do not include loans booked at overseas offices and offshore loans. |
| * | The definition of “Small and Medium-sized Enterprises” is as follows: |
| Enterprises of which the capital is ¥300 million or below (¥100 million or below for the wholesale industry, and ¥50 million or below for the retail, restaurant and commodity lease industries, etc.), or enterprises with full-time employees of 300 or below (100 or below for the wholesale and commodity lease industries etc., 50 or below for the retail and restaurant industries.) |
2-32
Mizuho Financial Group, Inc.
9. Status of Loans by Region
(1) Outstanding Balances by Region
Non-Consolidated
Aggregate Figures for the 2 Banks (Banking Account + Trust Account)
| (Billions of yen) | ||||||||||||
| As of March 31, 2023 | As of March 31, 2022 |
|||||||||||
| Outstanding Balance |
Change | Outstanding Balance |
||||||||||
| Asia |
7,550.1 | (217.8 | ) | 7,768.0 | ||||||||
| Hong Kong |
1,685.7 | (208.2 | ) | 1,893.9 | ||||||||
| Singapore |
1,295.9 | (58.2 | ) | 1,354.1 | ||||||||
| Thailand |
1,061.5 | (77.6 | ) | 1,139.2 | ||||||||
| Taiwan |
716.0 | (268.2 | ) | 984.3 | ||||||||
| India |
548.8 | 21.5 | 527.2 | |||||||||
| South Korea |
822.5 | 174.7 | 647.8 | |||||||||
| Indonesia |
429.8 | 108.4 | 321.3 | |||||||||
| Philippines |
302.7 | 8.1 | 294.5 | |||||||||
| China |
155.6 | 30.8 | 124.8 | |||||||||
| Malaysia |
92.0 | (0.3 | ) | 92.4 | ||||||||
| Central and South America |
5,334.9 | 145.4 | 5,189.5 | |||||||||
| Mexico |
470.6 | 101.6 | 369.0 | |||||||||
| Brazile |
198.0 | (41.8 | ) | 239.8 | ||||||||
| North America |
11,584.6 | 3,340.4 | 8,244.1 | |||||||||
| United States |
10,681.7 | 3,237.6 | 7,444.1 | |||||||||
| Eastern Europe |
237.8 | (36.3 | ) | 274.2 | ||||||||
| Russia |
205.5 | (4.3 | ) | 209.8 | ||||||||
| Western Europe |
5,275.6 | 361.6 | 4,914.0 | |||||||||
| United Kingdom |
1,231.6 | (230.3 | ) | 1,462.0 | ||||||||
| Netherlands |
1,159.7 | 217.2 | 942.5 | |||||||||
| Germany |
672.8 | 204.3 | 468.5 | |||||||||
| Ireland |
454.6 | 136.1 | 318.5 | |||||||||
| Switzerland |
107.1 | (214.3 | ) | 321.5 | ||||||||
| France |
429.8 | 73.4 | 356.4 | |||||||||
| Turkey |
78.0 | (11.8 | ) | 89.8 | ||||||||
| Italy |
158.9 | 52.9 | 106.0 | |||||||||
| Other |
3,689.6 | 121.6 | 3,567.9 | |||||||||
| Australia |
2,048.1 | 75.9 | 1,972.1 | |||||||||
| Total |
33,673.0 | 3,715.0 | 29,957.9 | |||||||||
| The above figures are based on obligor country of location. |
|
|||||||||||
| The outstanding balance of loans in major banking subsidiaries outside Japan in the consolidated financial statement is as follows. |
|
|||||||||||
| As of March 31, 2023 | As of March 31, 2022 |
|||||||||||
| Outstanding Balance |
Change | Outstanding Balance |
||||||||||
| Mizuho Bank (China) ,Ltd |
1,296.1 | 15.6 | 1,280.4 | |||||||||
| Mizuho Bank (USA) |
477.7 | 19.7 | 458.0 | |||||||||
| PT. Bank Mizuho Indonesia |
439.2 | 138.4 | 300.7 | |||||||||
Note: The balances of loans of AO Mizuho Bank (Moscow) for the fiscal year ended March 31, 2023 and 2022 are ¥49.9 billion and
¥68.8 billion, respectively.
2-33
Mizuho Financial Group, Inc.
(2) Non Performing Loans based on the BA and the FRA by Region
Non-Consolidated
Aggregate Figures for the 2 Banks (Banking Account + Trust Account)
| (Billions of yen) | ||||||||||||
| As of March 31, 2023 | As of March 31, 2022 | |||||||||||
| Non Performing Loans based on the BA and the FRA |
Change | Non Performing Loans based on the BA and the FRA |
||||||||||
| Asia |
83.2 | 26.3 | 56.8 | |||||||||
| Hong Kong |
0.6 | 0.6 | 0.0 | |||||||||
| Singapore |
34.5 | (0.4 | ) | 35.0 | ||||||||
| Thailand |
2.1 | 1.1 | 1.0 | |||||||||
| Taiwan |
21.4 | 21.4 | 0.0 | |||||||||
| India |
0.1 | 0.0 | 0.1 | |||||||||
| South Korea |
— | (0.0 | ) | 0.0 | ||||||||
| Indonesia |
0.8 | (0.1 | ) | 0.9 | ||||||||
| Philippines |
0.0 | (0.0 | ) | 0.0 | ||||||||
| China |
0.1 | 0.1 | 0.0 | |||||||||
| Malaysia |
— | — | — | |||||||||
| Central and South America |
16.1 | (1.7 | ) | 17.8 | ||||||||
| Mexico |
0.3 | (0.0 | ) | 0.4 | ||||||||
| Brazile |
1.9 | (1.6 | ) | 3.5 | ||||||||
| North America |
15.3 | 0.3 | 15.0 | |||||||||
| United States |
15.3 | 0.3 | 15.0 | |||||||||
| Eastern Europe |
41.0 | 33.1 | 7.8 | |||||||||
| Russia |
41.0 | 33.1 | 7.8 | |||||||||
| Western Europe |
32.0 | 8.7 | 23.2 | |||||||||
| United Kingdom |
4.0 | 0.5 | 3.4 | |||||||||
| Netherlands |
— | — | — | |||||||||
| Germany |
— | (0.5 | ) | 0.5 | ||||||||
| Ireland |
— | — | — | |||||||||
| Switzerland |
— | (0.2 | ) | 0.2 | ||||||||
| France |
— | — | — | |||||||||
| Turkey |
— | — | — | |||||||||
| Italy |
8.7 | 0.5 | 8.2 | |||||||||
| Other |
8.2 | (3.6 | ) | 11.8 | ||||||||
| Australia |
— | — | — | |||||||||
| Total |
196.0 | 63.2 | 132.8 | |||||||||
| The above figures are based on obligor country of location. |
|
|||||||||||
| The outstanding balance of Non Performing Loans based on the BA and the FRA in major banking subsidiaries outside Japan in the consolidated financial statement is as follows. |
|
|||||||||||
| As of March 31, 2023 | As of March 31, 2022 | |||||||||||
| Non Performing Loans based on the BA and the FRA |
Change | Non Performing Loans based on the BA and the FRA |
||||||||||
| Mizuho Bank (China) ,Ltd |
0.8 | (1.0 | ) | 1.8 | ||||||||
| Mizuho Bank (USA) |
— | (3.0 | ) | 3.0 | ||||||||
| PT. Bank Mizuho Indonesia |
5.9 | 0.1 | 5.8 | |||||||||
Note: The balance of loans of Non Performing Loans based on the BA and the FRA of AO Mizuho Bank (Moscow) for the fiscal year ended March 31, 2023 is ¥0.6 billion. The balance of loans of Non Performing Loans based on the BA and the FRA of AO Mizuho Bank (Moscow) for the fiscal year ended March 31, 2022 is not existed.
2-34
Mizuho Financial Group, Inc.
III. DEFERRED TAXES
1. Estimation for Calculating Deferred Tax Assets
Non-Consolidated
Mizuho Bank
1. Estimate of future taxable income
| (Billions of yen) | ||||||||
| Total amount for five years (from April 1, 2023 to March 31, 2028) |
||||||||
| Net Business Profits (before Reversal of (Provision for) General Reserve for Losses on Loans) |
1 | 3,350.7 | ||||||
| Income before Income Taxes |
2 | 3,372.5 | ||||||
| Tax Adjustments *1 |
3 | 401.7 | ||||||
| Taxable Income before Current Deductible Temporary Differences *2 |
4 | 3,774.2 | ||||||
| Effective Statutory Tax Rate |
5 | 30.62% | ||||||
| Deferred Tax Assets corresponding to Taxable Income before Current Deductible Temporary Differences [ 4 x 5 ] |
6 | 1,155.6 | ||||||
| *1. | Tax Adjustments are estimated future book-tax differences under the provisions of the corporation tax law and others. |
| *2. | Taxable Income before Current Deductible Temporary Differences is an estimate of taxable income before adjusting deductible temporary differences as of March 31, 2023. |
| (Reference) Past results of taxable income (tax loss)
|
||||
| (Billions of yen) | ||||
| Fiscal 2018 |
267.2 | |||
| Fiscal 2019 |
378.5 | |||
| Fiscal 2020 |
316.3 | |||
| Fiscal 2021 |
360.3 | |||
| Fiscal 2022(estimate) |
162.0 | |||
| *1. | Figures are taxable income (tax loss) amounts per the final corporation tax returns before deducting tax losses carried forward from prior years. Subsequent amendments have not been reflected. |
| *2. | Figure for fiscal 2022 is an estimate of taxable income. |
2. Breakdown of Deferred Tax Assets
| (Billions of yen) | ||||||||||||||||
| As of March 31, 2023 |
Change | As of March 31, 2022 |
||||||||||||||
| Reserves for Possible Losses on Loans |
7 | 225.4 | (26.2 | ) | 251.6 | |||||||||||
| Impairment of Securities |
8 | 112.4 | (12.8 | ) | 125.2 | |||||||||||
| Net Unrealized Losses on Other Securities |
9 | 125.8 | 63.5 | 62.3 | ||||||||||||
| Reserve for Employee Retirement Benefits |
10 | — | — | — | ||||||||||||
| Depreciation and Impairment |
11 | 93.7 | (28.4 | ) | 122.1 | |||||||||||
| Net Deferred Hedge Losses |
12 | 166.3 | 126.5 | 39.7 | ||||||||||||
| Tax Losses Carried Forward |
13 | 8.4 | 8.2 | 0.1 | ||||||||||||
| Other |
14 | 246.2 | 16.4 | 229.7 | ||||||||||||
|
|
|
|
|
|
|
|||||||||||
| Total Deferred Tax Assets |
15 | 978.4 | 147.3 | 831.1 | ||||||||||||
|
|
|
|
|
|
|
|||||||||||
| Valuation Allowance |
16 | (136.0 | ) | (29.3 | ) | (106.7 | ) | |||||||||
|
|
|
|
|
|
|
|||||||||||
| Sub-Total [ 15 + 16 ] |
17 | 842.4 | 118.0 | 724.3 | ||||||||||||
|
|
|
|
|
|
|
|||||||||||
| Amount related to Retirement Benefits Accounting |
18 | (123.5 | ) | 11.3 | (134.9 | ) | ||||||||||
| Net Unrealized Gains on Other Securities |
19 | (271.9 | ) | 4.9 | (276.8 | ) | ||||||||||
| Net Deferred Hedge Gains |
20 | — | — | — | ||||||||||||
| Other |
21 | (64.6 | ) | (25.2 | ) | (39.4 | ) | |||||||||
|
|
|
|
|
|
|
|||||||||||
| Total Deferred Tax Liabilities |
22 | (460.1 | ) | (8.9 | ) | (451.2 | ) | |||||||||
|
|
|
|
|
|
|
|||||||||||
| Net Deferred Tax Assets (Liabilities) [17 + 22] |
23 | 382.2 | 109.0 | 273.1 | ||||||||||||
| Tax effects related to Net Unrealized Losses (Gains) on Other Securities * |
24 | (154.5 | ) | 69.4 | (223.9 | ) | ||||||||||
| Tax effects related to Net Deferred Hedge Losses (Gains) |
25 | 166.3 | 126.5 | 39.7 | ||||||||||||
| Tax effects related to others |
26 | 370.4 | (86.9 | ) | 457.3 | |||||||||||
| * | Tax effects related to Net Unrealized Losses (Gains) on Other Securities is the amount after deducting Valuation Allowance. |
Assessment of Recoverability of Deferred Tax Assets is based on 19. Company Classification (Category 2) of “Revised Implementation Guidance on Recoverability of Deferred Tax Assets” (ASBJ Guidance No.26).
Future taxable income was estimated using assumptions used in the Business Plan, etc.
The above includes forward-looking information. See the disclaimer at the end of the table of contents located at the beginning of this document.
2-35
Mizuho Financial Group, Inc.
Mizuho Trust & Banking
1. Estimate of future taxable income
| (Billions of yen) | ||||||||
| Total amount for five years (from April 1, 2023 to March 31, 2028) |
||||||||
| Net Business Profits (before Reversal of (Provision for) General Reserve for Losses on Loans) |
1 | 195.9 | ||||||
| Income before Income Taxes |
2 | 226.6 | ||||||
| Tax Adjustments (1) |
3 | (16.4 | ) | |||||
| Taxable Income before Current Deductible Temporary Differences (2) |
4 | 210.1 | ||||||
| Effective Statutory Tax Rate |
5 | 30.62% | ||||||
| Deferred Tax Assets corresponding to Taxable Income before Current Deductible Temporary Differences [ 4 x 5 ] |
6 | 64.3 | ||||||
| *1. | Tax Adjustments are estimated future book-tax differences under the provisions of the corporation tax law and others. |
| *2. | Taxable Income before Current Deductible Temporary Differences is an estimate of taxable income before adjusting deductible temporary differences as of March 31, 2023. |
| (Reference) Past results of taxable income (tax loss)
|
||||
| (Billions of yen) | ||||
| Fiscal 2018 |
39.0 | |||
| Fiscal 2019 |
31.7 | |||
| Fiscal 2020 |
26.6 | |||
| Fiscal 2021 |
33.2 | |||
| Fiscal 2022(estimate) |
31.0 | |||
| *1. | Figures are taxable income (tax loss) amounts per the final corporation tax returns before deducting tax losses carried forward from prior years. Subsequent amendments have not been reflected. |
| *2. | Figure for fiscal 2022 is an estimate of taxable income. |
2. Breakdown of Deferred Tax Assets
| (Billions of yen) | ||||||||||||||||
| As of March 31, 2023 |
Change | As of March 31, 2022 |
||||||||||||||
| Reserves for Possible Losses on Loans |
7 | 1.1 | 0.3 | 0.7 | ||||||||||||
| Impairment of Securities |
8 | 5.7 | (2.0 | ) | 7.7 | |||||||||||
| Net Unrealized Losses on Other Securities |
9 | 0.3 | (0.0 | ) | 0.4 | |||||||||||
| Reserve for Employee Retirement Benefits |
10 | 0.6 | (0.8 | ) | 1.5 | |||||||||||
| Reserve for Loss of Transfer |
11 | — | (0.9 | ) | 0.9 | |||||||||||
| Net Deferred Hedge Losses |
12 | — | (0.1 | ) | 0.1 | |||||||||||
| Tax Losses Carried Forward |
13 | — | — | — | ||||||||||||
| Other |
14 | 18.4 | 0.6 | 17.8 | ||||||||||||
|
|
|
|
|
|
|
|||||||||||
| Total Deferred Tax Assets |
15 | 26.4 | (2.9 | ) | 29.3 | |||||||||||
|
|
|
|
|
|
|
|||||||||||
| Valuation Allowance |
16 | (7.5 | ) | 0.2 | (7.7 | ) | ||||||||||
|
|
|
|
|
|
|
|||||||||||
| Sub-Total [ 15 + 16 ] |
17 | 18.9 | (2.7 | ) | 21.6 | |||||||||||
|
|
|
|
|
|
|
|||||||||||
| Amount related to Retirement Benefits Accounting |
18 | (21.7 | ) | (1.3 | ) | (20.3 | ) | |||||||||
| Net Unrealized Gains on Other Securities |
19 | (17.2 | ) | (1.0 | ) | (16.1 | ) | |||||||||
| Net Deferred Hedge Gains |
20 | (2.0 | ) | (2.0 | ) | — | ||||||||||
| Other |
21 | (0.4 | ) | 2.2 | (2.6 | ) | ||||||||||
|
|
|
|
|
|
|
|||||||||||
| Total Deferred Tax Liabilities |
22 | (41.4 | ) | (2.3 | ) | (39.1 | ) | |||||||||
|
|
|
|
|
|
|
|||||||||||
| Net Deferred Tax Assets (Liabilities) [17 + 22] |
23 | (22.5 | ) | (5.0 | ) | (17.4 | ) | |||||||||
| Tax effects related to Net Unrealized Losses (Gains) on Other Securities* |
24 | (17.2 | ) | (1.8 | ) | (15.3 | ) | |||||||||
| Tax effects related to Net Deferred Hedge Losses (Gains) |
25 | (2.0 | ) | (2.1 | ) | 0.1 | ||||||||||
| Tax effects related to others |
26 | (3.2 | ) | (0.9 | ) | (2.2 | ) | |||||||||
| * | Tax effects related to Net Unrealized Losses (Gains) on Other Securities is the amount after deducting Valuation Allowance. |
Assessment of Recoverability of Deferred Tax Assets is based on 19. Company Classification (Category 2) of “Revised Implementation Guidance on Recoverability of Deferred Tax Assets” (ASBJ Guidance No.26).
Future taxable income was estimated using assumptions used in the Business Plan, etc.
The above includes forward-looking information. See the disclaimer at the end of the table of contents located at the beginning of this document.
2-36
Mizuho Financial Group, Inc.
IV. OTHERS
1. Breakdown of Deposits (Domestic Offices)
Non-Consolidated
Aggregate Figures for the 2 Banks
| (Billions of yen) | ||||||||||||
| As of March 31, 2023 |
Change | As of March 31, 2022 |
||||||||||
| Deposits |
119,182.8 | 6,651.3 | 112,531.4 | |||||||||
| Individual Deposits |
48,082.7 | 415.2 | 47,667.5 | |||||||||
| Corporate Deposits |
60,091.4 | 4,495.2 | 55,596.1 | |||||||||
| Financial/Government Institutions |
11,008.6 | 1,740.8 | 9,267.7 | |||||||||
| Mizuho Bank | ||||||||||||
| Deposits |
116,402.8 | 6,442.7 | 109,960.1 | |||||||||
| Individual Deposits |
47,308.5 | 445.0 | 46,863.5 | |||||||||
| Corporate Deposits |
58,698.6 | 4,240.6 | 54,457.9 | |||||||||
| Financial/Government Institutions |
10,395.6 | 1,757.0 | 8,638.6 | |||||||||
| Mizuho Trust & Banking | ||||||||||||
| Deposits |
2,780.0 | 208.6 | 2,571.3 | |||||||||
| Individual Deposits |
774.2 | (29.7 | ) | 803.9 | ||||||||
| Corporate Deposits |
1,392.7 | 254.5 | 1,138.1 | |||||||||
| Financial/Government Institutions |
613.0 | (16.1 | ) | 629.1 | ||||||||
| * | Above figures do not include deposits booked at overseas offices and offshore deposits. |
2-37
Mizuho Financial Group, Inc.
2. Number of Directors and Employees
(1) Number of Directors
Aggregate Figures for Mizuho Financial Group, the 2 Banks, and Mizuho Securities
| As of March 31, 2023 |
Change | As of March 31, 2022 |
||||||||||
| Directors, Executive Officers as defined in the Companies Act, and Auditors |
45 | — | 45 | |||||||||
| Executive Officers as defined in our internal regulations (excluding those doubling as Directors as defined in the Companies Act) |
46 | 2 | 44 | |||||||||
|
* The above numbers have been adjusted for those who are doubling other positions. |
|
|||||||||||
| (2) Number of Employees
Consolidated
|
|
|||||||||||
| As of March 31, 2023 |
Change | As of March 31, 2022 |
||||||||||
| Employees (excluding Executive Officers as defined in our internal regulations) |
51,212 | (1,208 | ) | 52,420 | ||||||||
| Average number of temporary employees |
13,190 | (829 | ) | 14,019 | ||||||||
|
* The number of Employees excludes employees seconded to outside the company and includes employees seconded from outside the company in each consolidated subsidiary. That number also includes overseas local staff but excludes advisers and temporary employees. |
|
|||||||||||
| 3. Number of Offices
(Domestic) The 2 Banks and Mizuho Securities
|
||||||||||||
| As of March 31, 2023 |
Change | As of March 31, 2022 |
||||||||||
| Mizuho Bank |
461 | — | 461 | |||||||||
| Mizuho Trust & Banking |
59 | (1 | ) | 60 | ||||||||
| Mizuho Securities |
225 | (5 | ) | 230 | ||||||||
|
* The above numbers are the numbers of head office, domestic branches (excluding branches and offices for remittance purposes only (46), branches offering account transfer services only (2), branches and offices to maintain shared ATMs only (1), internet branches (1), and pension plan advisory offices (1)), domestic sub-branches, and others. |
|
|||||||||||
|
(Overseas) The 2 Banks and Mizuho Securities
|
|
|||||||||||
| As of March 31, 2023 |
Change | As of March 31, 2022 |
||||||||||
| Mizuho Bank |
48 | (1 | ) | 49 | ||||||||
| Mizuho Trust & Banking |
— | — | — | |||||||||
| Mizuho Securities |
2 | — | 2 | |||||||||
|
* The above numbers are the numbers of overseas branches or relevant offices, and overseas representative offices. |
|
|||||||||||
2-38
Mizuho Financial Group, Inc.
4. Earnings Plan for Fiscal 2023
Consolidated
| (Billions of yen) | ||||
| Fiscal 2023 | ||||
| Ordinary Profits |
860.0 | |||
| Profit Attributable to Owners of Parent |
610.0 | |||
Non-Consolidated
Mizuho Bank, Mizuho Trust & Banking
| (Billions of yen) | ||||||||||||
| Fiscal 2023 | ||||||||||||
| Aggregate Figures for the 2 Banks |
MHBK | MHTB* | ||||||||||
| Net Business Profits (before Reversal of (Provision for) General Reserve for Losses on Loans) + Net Gains (Losses) related to ETF |
635.0 | 600.0 | 35.0 | |||||||||
| Ordinary Profits |
605.0 | 565.0 | 40.0 | |||||||||
| Net Income |
425.0 | 395.0 | 30.0 | |||||||||
| Credit-related Costs |
(95.0 | ) | (90.0 | ) | (5.0 | ) | ||||||
| * | Net Business Profits (before Reversal of (Provision for) General Reserve for Losses on Loans) for MHTB excludes the amounts of Credit Costs for Trust Accounts. |
The above information constitute forward-looking statements. Please see the legend regarding forward-looking statements in CONTENTS.
2-39
Mizuho Bank, Ltd.
(Attachments)
COMPARISON OF NON-CONSOLIDATED BALANCE SHEETS (selected items)
OF MIZUHO BANK
| Millions of yen | ||||||||||||
| As of March 31, 2023 (A) |
As of March 31, 2022 (B) |
Change (A) - (B) |
||||||||||
| Assets |
||||||||||||
| Cash and Due from Banks |
¥ | 63,079,031 | ¥ | 48,803,771 | ¥ | 14,275,259 | ||||||
| Call Loans |
1,812,740 | 1,223,766 | 588,974 | |||||||||
| Receivables under Resale Agreements |
868,058 | 1,681,260 | (813,202 | ) | ||||||||
| Guarantee Deposits Paid under Securities Borrowing Transactions |
156,807 | 154,255 | 2,552 | |||||||||
| Other Debt Purchased |
651,514 | 679,939 | (28,425 | ) | ||||||||
| Trading Assets |
5,422,696 | 4,496,695 | 926,000 | |||||||||
| Money Held in Trust |
504 | 504 | 0 | |||||||||
| Securities |
37,110,218 | 44,608,181 | (7,497,962 | ) | ||||||||
| Loans and Bills Discounted |
87,280,378 | 82,962,457 | 4,317,920 | |||||||||
| Foreign Exchange Assets |
2,293,584 | 2,509,122 | (215,538 | ) | ||||||||
| Derivatives other than for Trading |
8,392,051 | 6,133,443 | 2,258,607 | |||||||||
| Other Assets |
7,910,755 | 5,958,848 | 1,951,907 | |||||||||
| Tangible Fixed Assets |
858,037 | 847,689 | 10,347 | |||||||||
| Intangible Fixed Assets |
352,884 | 347,681 | 5,203 | |||||||||
| Prepaid Pension Cost |
403,530 | 440,611 | (37,081 | ) | ||||||||
| Deferred Tax Assets |
382,227 | 273,129 | 109,098 | |||||||||
| Customers’ Liabilities for Acceptances and Guarantees |
10,003,767 | 8,733,646 | 1,270,120 | |||||||||
| Reserves for Possible Losses on Loans |
(701,652 | ) | (814,778 | ) | 113,126 | |||||||
| Reserve for Possible Losses on Investments |
— | (106 | ) | 106 | ||||||||
|
|
|
|
|
|
|
|||||||
| Total Assets |
¥ | 226,277,135 | ¥ | 209,040,119 | ¥ | 17,237,015 | ||||||
|
|
|
|
|
|
|
|||||||
| Liabilities |
||||||||||||
| Deposits |
¥ | 145,157,919 | ¥ | 133,633,887 | ¥ | 11,524,032 | ||||||
| Negotiable Certificates of Deposit |
13,272,253 | 16,162,209 | (2,889,955 | ) | ||||||||
| Call Money |
1,229,224 | 940,058 | 289,165 | |||||||||
| Payables under Repurchase Agreements |
14,106,366 | 9,293,236 | 4,813,130 | |||||||||
| Guarantee Deposits Received under Securities Lending Transactions |
93,216 | 146,864 | (53,648 | ) | ||||||||
| Commercial Paper |
1,782,111 | 1,775,859 | 6,251 | |||||||||
| Trading Liabilities |
4,574,447 | 3,447,533 | 1,126,914 | |||||||||
| Borrowed Money |
12,507,802 | 14,397,626 | (1,889,823 | ) | ||||||||
| Foreign Exchange Liabilities |
889,189 | 1,788,299 | (899,110 | ) | ||||||||
| Bonds and Notes |
585,861 | 810,504 | (224,643 | ) | ||||||||
| Derivatives other than for Trading |
8,976,741 | 6,635,032 | 2,341,708 | |||||||||
| Other Liabilities |
6,320,855 | 4,302,633 | 2,018,222 | |||||||||
| Reserve for Bonus Payments |
26,406 | 24,582 | 1,824 | |||||||||
| Reserve for Variable Compensation |
757 | 763 | (6 | ) | ||||||||
| Reserve for Possible Losses on Sales of Loans |
15,049 | 1,309 | 13,740 | |||||||||
| Reserve for Contingencies |
4,781 | 1,306 | 3,474 | |||||||||
| Reserve for Reimbursement of Deposits |
12,980 | 16,627 | (3,646 | ) | ||||||||
| Reserve for Reimbursement of Debentures |
7,798 | 10,504 | (2,706 | ) | ||||||||
| Deferred Tax Liabilities for Revaluation Reserve for Land |
58,711 | 59,962 | (1,251 | ) | ||||||||
| Acceptances and Guarantees |
10,003,767 | 8,733,646 | 1,270,120 | |||||||||
|
|
|
|
|
|
|
|||||||
| Total Liabilities |
219,626,240 | 202,182,447 | 17,443,793 | |||||||||
|
|
|
|
|
|
|
|||||||
| Net Assets |
||||||||||||
| Common Stock and Preferred Stock |
1,404,065 | 1,404,065 | — | |||||||||
| Capital Surplus |
2,259,392 | 2,259,392 | — | |||||||||
| Capital Reserve |
660,805 | 660,805 | — | |||||||||
| Other Capital Surplus |
1,598,587 | 1,598,587 | — | |||||||||
| Retained Earnings |
2,757,032 | 2,519,294 | 237,738 | |||||||||
| Appropriated Reserve |
421,264 | 389,012 | 32,251 | |||||||||
| Other Retained Earnings |
2,335,768 | 2,130,281 | 205,487 | |||||||||
| Retained Earnings Brought Forward |
2,335,768 | 2,130,281 | 205,487 | |||||||||
|
|
|
|
|
|
|
|||||||
| Total Shareholders’ Equity |
6,420,490 | 6,182,751 | 237,738 | |||||||||
|
|
|
|
|
|
|
|||||||
| Net Unrealized Gains (Losses) on Other Securities, net of Taxes |
468,873 | 623,367 | (154,494 | ) | ||||||||
| Net Deferred Hedge Gains (Losses), net of Taxes |
(367,790 | ) | (80,603 | ) | (287,187 | ) | ||||||
| Revaluation Reserve for Land, net of Taxes |
129,321 | 132,156 | (2,834 | ) | ||||||||
|
|
|
|
|
|
|
|||||||
| Total Valuation and Translation Adjustments |
230,404 | 674,920 | (444,516 | ) | ||||||||
|
|
|
|
|
|
|
|||||||
| Total Net Assets |
6,650,894 | 6,857,672 | (206,777 | ) | ||||||||
|
|
|
|
|
|
|
|||||||
| Total Liabilities and Net Assets |
¥ | 226,277,135 | ¥ | 209,040,119 | ¥ | 17,237,015 | ||||||
|
|
|
|
|
|
|
|||||||
2-40
Mizuho Bank, Ltd.
COMPARISON OF NON-CONSOLIDATED STATEMENTS OF INCOME
(selected items) OF MIZUHO BANK
| Millions of yen | ||||||||||||
| For the fiscal year ended March 31, 2023 (A) |
For the fiscal year ended March 31, 2022 (B) |
Change (A) - (B) |
||||||||||
| Ordinary Income |
¥ | 3,665,159 | ¥ | 2,147,111 | ¥ | 1,518,047 | ||||||
| Interest Income |
2,657,640 | 1,131,111 | 1,526,528 | |||||||||
| Interest on Loans and Bills Discounted |
1,614,231 | 774,657 | 839,574 | |||||||||
| Interest and Dividends on Securities |
371,369 | 260,684 | 110,684 | |||||||||
| Fee and Commission Income |
589,189 | 542,348 | 46,841 | |||||||||
| Trading Income |
6,350 | 1,664 | 4,685 | |||||||||
| Other Operating Income |
264,425 | 235,596 | 28,828 | |||||||||
| Other Ordinary Income |
147,553 | 236,390 | (88,836 | ) | ||||||||
|
|
|
|
|
|
|
|||||||
| Ordinary Expenses |
3,105,989 | 1,936,252 | 1,169,736 | |||||||||
| Interest Expenses |
1,786,742 | 244,322 | 1,542,419 | |||||||||
| Interest on Deposits |
804,311 | 36,330 | 767,980 | |||||||||
| Fee and Commission Expenses |
177,952 | 149,353 | 28,598 | |||||||||
| Trading Expenses |
361 | — | 361 | |||||||||
| Other Operating Expenses |
231,355 | 170,721 | 60,633 | |||||||||
| General and Administrative Expenses |
742,375 | 744,859 | (2,483 | ) | ||||||||
| Other Ordinary Expenses |
167,201 | 626,995 | (459,793 | ) | ||||||||
|
|
|
|
|
|
|
|||||||
| Ordinary Profits |
559,170 | 210,858 | 348,311 | |||||||||
|
|
|
|
|
|
|
|||||||
| Extraordinary Gains |
48,003 | 70,436 | (22,432 | ) | ||||||||
|
|
|
|
|
|
|
|||||||
| Extraordinary Losses |
19,061 | 32,348 | (13,286 | ) | ||||||||
|
|
|
|
|
|
|
|||||||
| Income before Income Taxes |
588,112 | 248,946 | 339,165 | |||||||||
| Income Taxes: |
||||||||||||
| Current |
115,972 | 172,495 | (56,522 | ) | ||||||||
| Refund of Income Taxes |
(9,680 | ) | (12,734 | ) | 3,053 | |||||||
| Deferred |
85,659 | (87,395 | ) | 173,055 | ||||||||
|
|
|
|
|
|
|
|||||||
| Net Income |
¥ | 396,161 | ¥ | 176,581 | ¥ | 219,579 | ||||||
|
|
|
|
|
|
|
|||||||
2-41
Mizuho Trust & Banking Co., Ltd.
COMPARISON OF NON-CONSOLIDATED BALANCE SHEETS (selected items)
OF MIZUHO TRUST & BANKING
| Millions of yen | ||||||||||||
| As of March 31, 2023 (A) |
As of March 31, 2022 (B) |
Change (A) - (B) |
||||||||||
| Assets |
||||||||||||
| Cash and Due from Banks |
¥ | 2,704,297 | ¥ | 1,923,672 | ¥ | 780,625 | ||||||
| Guarantee Deposits Paid under Securities Borrowing Transactions |
20,177 | 20,046 | 131 | |||||||||
| Other Debt Purchased |
32,261 | 35,314 | (3,053 | ) | ||||||||
| Money Held in Trust |
27,418 | 26,556 | 861 | |||||||||
| Securities |
265,136 | 288,530 | (23,394 | ) | ||||||||
| Loans and Bills Discounted |
3,065,766 | 3,192,348 | (126,582 | ) | ||||||||
| Foreign Exchange Assets |
5,160 | 3,898 | 1,262 | |||||||||
| Other Assets |
277,573 | 255,755 | 21,818 | |||||||||
| Tangible Fixed Assets |
93,577 | 100,132 | (6,554 | ) | ||||||||
| Intangible Fixed Assets |
18,929 | 21,728 | (2,798 | ) | ||||||||
| Prepaid Pension Cost |
71,058 | 66,607 | 4,450 | |||||||||
| Customers’ Liabilities for Acceptances and Guarantees |
13,655 | 14,100 | (445 | ) | ||||||||
| Reserves for Possible Losses on Loans |
(3,601 | ) | (2,470 | ) | (1,130 | ) | ||||||
|
|
|
|
|
|
|
|||||||
| Total Assets |
¥ | 6,591,410 | ¥ | 5,946,221 | ¥ | 645,189 | ||||||
|
|
|
|
|
|
|
|||||||
| Liabilities |
||||||||||||
| Deposits |
¥ | 2,780,028 | ¥ | 2,571,352 | ¥ | 208,676 | ||||||
| Negotiable Certificates of Deposit |
470,180 | 691,880 | (221,700 | ) | ||||||||
| Call Money |
907,935 | 603,990 | 303,945 | |||||||||
| Borrowed Money |
303,400 | 300,000 | 3,400 | |||||||||
| Due to Trust Accounts |
1,534,097 | 1,167,284 | 366,812 | |||||||||
| Other Liabilities |
28,363 | 31,317 | (2,953 | ) | ||||||||
| Reserve for Bonus Payments |
3,134 | 2,741 | 393 | |||||||||
| Reserve for Variable Compensation |
245 | 272 | (26 | ) | ||||||||
| Provision for Retirement Benefits |
2,273 | 4,935 | (2,662 | ) | ||||||||
| Reserve for Reimbursement of Deposits |
714 | 992 | (278 | ) | ||||||||
| Reserve for Loss of Transfer |
— | 3,061 | (3,061 | ) | ||||||||
| Deferred Tax Liabilities |
22,527 | 17,484 | 5,043 | |||||||||
| Acceptances and Guarantees |
13,655 | 14,100 | (445 | ) | ||||||||
|
|
|
|
|
|
|
|||||||
| Total Liabilities |
6,066,558 | 5,409,413 | 657,144 | |||||||||
|
|
|
|
|
|
|
|||||||
| Net Assets |
||||||||||||
| Common Stock and Preferred Stock |
247,369 | 247,369 | — | |||||||||
| Capital Surplus |
15,505 | 15,505 | — | |||||||||
| Capital Reserve |
15,505 | 15,505 | — | |||||||||
| Retained Earnings |
275,474 | 296,471 | (20,997 | ) | ||||||||
| Appropriated Reserve |
159,891 | 150,297 | 9,593 | |||||||||
| Other Retained Earnings |
115,583 | 146,174 | (30,591 | ) | ||||||||
| Retained Earnings Brought Forward |
115,583 | 146,174 | (30,591 | ) | ||||||||
| Treasury Stock |
(79,999 | ) | (79,999 | ) | — | |||||||
|
|
|
|
|
|
|
|||||||
| Total Shareholders’ Equity |
458,349 | 479,346 | (20,997 | ) | ||||||||
|
|
|
|
|
|
|
|||||||
| Net Unrealized Gains (Losses) on Other Securities, net of Taxes |
61,861 | 57,707 | 4,153 | |||||||||
| Net Deferred Hedge Gains (Losses), net of Taxes |
4,642 | (246 | ) | 4,888 | ||||||||
|
|
|
|
|
|
|
|||||||
| Total Valuation and Translation Adjustments |
66,503 | 57,460 | 9,042 | |||||||||
|
|
|
|
|
|
|
|||||||
| Total Net Assets |
524,852 | 536,807 | (11,954 | ) | ||||||||
|
|
|
|
|
|
|
|||||||
| Total Liabilities and Net Assets |
¥ | 6,591,410 | ¥ | 5,946,221 | ¥ | 645,189 | ||||||
|
|
|
|
|
|
|
|||||||
2-42
Mizuho Trust & Banking Co., Ltd.
COMPARISON OF NON-CONSOLIDATED STATEMENTS OF INCOME
(selected items) OF MIZUHO TRUST & BANKING
| Millions of yen | ||||||||||||
| For the fiscal year ended March 31, 2023 (A) |
For the fiscal year ended March 31, 2022 (B) |
Change (A) - (B) |
||||||||||
| Ordinary Income |
¥ | 162,102 | ¥ | 173,959 | ¥ | (11,857 | ) | |||||
| Fiduciary Income |
59,527 | 61,028 | (1,500 | ) | ||||||||
| Interest Income |
26,283 | 26,345 | (62 | ) | ||||||||
| Interest on Loans and Bills Discounted |
19,376 | 19,640 | (263 | ) | ||||||||
| Interest and Dividends on Securities |
5,088 | 4,926 | 162 | |||||||||
| Fee and Commission Income |
68,350 | 79,058 | (10,707 | ) | ||||||||
| Other Operating Income |
13 | 369 | (356 | ) | ||||||||
| Other Ordinary Income |
7,927 | 7,157 | 769 | |||||||||
|
|
|
|
|
|
|
|||||||
| Ordinary Expenses |
124,051 | 123,363 | 687 | |||||||||
| Interest Expenses |
6,611 | 7,049 | (438 | ) | ||||||||
| Interest on Deposits |
186 | 296 | (110 | ) | ||||||||
| Fee and Commission Expenses |
37,569 | 36,795 | 773 | |||||||||
| Trading Expenses |
— | 640 | (640 | ) | ||||||||
| Other Operating Expenses |
189 | 12 | 176 | |||||||||
| General and Administrative Expenses |
74,465 | 75,132 | (666 | ) | ||||||||
| Other Ordinary Expenses |
5,215 | 3,733 | 1,482 | |||||||||
|
|
|
|
|
|
|
|||||||
| Ordinary Profits |
38,051 | 50,595 | (12,544 | ) | ||||||||
|
|
|
|
|
|
|
|||||||
| Extraordinary Gains |
5,720 | 7,742 | (2,021 | ) | ||||||||
|
|
|
|
|
|
|
|||||||
| Extraordinary Losses |
5,762 | 443 | 5,318 | |||||||||
|
|
|
|
|
|
|
|||||||
| Income before Income Taxes |
38,009 | 57,894 | (19,884 | ) | ||||||||
| Income Taxes: |
||||||||||||
| Current |
10,043 | 10,651 | (607 | ) | ||||||||
| Deferred |
995 | 4,559 | (3,564 | ) | ||||||||
|
|
|
|
|
|
|
|||||||
| Net Income |
¥ | 26,970 | ¥ | 42,683 | ¥ | (15,712 | ) | |||||
|
|
|
|
|
|
|
|||||||
2-43
Mizuho Trust & Banking Co., Ltd.
(Reference)
Statement of Trust Assets and Liabilities
As of March 31, 2023
| Millions of yen |
||||||||||
| Assets |
Amount | Liabilities |
Amount | |||||||
| Loans and Bills Discounted |
572,414 | Money Trusts | 29,178,683 | |||||||
| Securities |
42,170 | Pension Trusts | 3,201,484 | |||||||
| Beneficiary Rights to the Trusts |
71,061,503 | Property Formation Benefit Trusts | 3,737 | |||||||
| Securities held in Custody Accounts |
373,412 | Investment Trusts | 20,450,405 | |||||||
| Money Claims |
12,647,622 | Money Entrusted Other than Money Trusts | 2,129,418 | |||||||
| Tangible Fixed Assets |
10,879,470 | Securities Trusts | 15,094,438 | |||||||
| Intangible Fixed Assets |
340,953 | Money Claims Trusts | 11,520,986 | |||||||
| Other Claims |
1,201,474 | Land and Fixtures Trusts | 709,057 | |||||||
| Due from Banking Account |
1,534,097 | Composite Trusts | 16,874,039 | |||||||
| Cash and Due from Banks |
514,597 | Other Trusts | 5,463 | |||||||
|
|
|
|
|
|||||||
| Total |
99,167,715 | Total |
99,167,715 | |||||||
|
|
|
|
|
|||||||
Notes:
| 1. | The statement is exclusive of Trusts that are difficult to value monetarily. |
| 2. | Beneficiary Rights to the Trusts include entrusted Trusts for asset maintenance of ¥68,720,918 million. |
| 3. | Joint trust assets under the management of other companies: ¥168,454 million. |
| 4. | There is no balance of Claims against Bankrupt and Substantially Bankrupt Obligors, Claims with Collection Risk, Loans Past Due for 3 Months or More or Restructured Loans in the claims of trust accounts that guarantee principals in the agreement of ¥2,814 million. |
(Reference) Breakdown of Accounts of Money Trusts and Loan Trusts with the contracts of principal indemnification (including Trusts entrusted for asset management) are as follows:
Money Trusts
| Millions of yen |
||||||||||
| Assets |
Amount | Liabilities |
Amount | |||||||
| Loans and Bills Discounted |
2,814 | Principal | 835,674 | |||||||
| Securities |
1 | Reserve | 9 | |||||||
| Others |
832,943 | Others | 74 | |||||||
|
|
|
|
|
|||||||
| Total |
835,758 | Total |
835,758 | |||||||
|
|
|
|
|
|||||||
2-44
Mizuho Trust & Banking Co., Ltd.
(Reference)
Comparison of Balances of Principal Items
| Millions of yen | ||||||||||||
| Items |
As of March 31, 2023 (A) |
As of March 31, 2022 (B) |
Change (A) - (B) |
|||||||||
| Total Amount of Funds |
35,634,113 | 36,350,351 | (716,237 | ) | ||||||||
| Deposits |
2,780,028 | 2,571,352 | 208,676 | |||||||||
| Negotiable Certificates of Deposit |
470,180 | 691,880 | (221,700 | ) | ||||||||
| Money Trusts |
29,178,683 | 29,909,179 | (730,495 | ) | ||||||||
| Pension Trusts |
3,201,484 | 3,173,021 | 28,462 | |||||||||
| Property Formation Benefit Trusts |
3,737 | 4,918 | (1,181 | ) | ||||||||
| Loans and Bills Discounted |
3,638,180 | 3,689,533 | (51,353 | ) | ||||||||
| of Banking accounts |
3,065,766 | 3,192,348 | (126,582 | ) | ||||||||
| of Trust accounts |
572,414 | 497,185 | 75,229 | |||||||||
| Securities for Investments |
307,306 | 357,726 | (50,420 | ) | ||||||||
| of Banking accounts |
265,136 | 288,530 | (23,394 | ) | ||||||||
| of Trust accounts |
42,170 | 69,195 | (27,025 | ) | ||||||||
2-45
Mizuho Securities Co., Ltd.
COMPARISON OF NON-CONSOLIDATED BALANCE SHEETS (selected items)
OF MIZUHO SECURITIES
| Millions of yen | ||||||||||||
| As of March 31, 2023 (A) |
As of March 31, 2022 (B) |
Change (A) - (B) |
||||||||||
| Assets |
||||||||||||
| Current Assets |
||||||||||||
| Cash and Bank Deposits |
¥ | 866,603 | ¥ | 405,261 | ¥ | 461,342 | ||||||
| Cash Segregated as Deposits for Customers and Others |
462,232 | 541,274 | (79,042 | ) | ||||||||
| Trading Assets |
6,430,652 | 6,921,502 | (490,850 | ) | ||||||||
| Receivables - Unsettled Trades |
— | 145,887 | (145,887 | ) | ||||||||
| Operating Investment Securities |
90,676 | 40,926 | 49,749 | |||||||||
| Operating Loans Receivable |
9,611 | — | 9,611 | |||||||||
| Receivables Related to Margin Transactions |
25,742 | 34,802 | (9,059 | ) | ||||||||
| Collateralized Short-Term Financing Agreements-Receivable |
4,722,172 | 4,707,548 | 14,623 | |||||||||
| Advances Paid |
1,372 | 94 | 1,278 | |||||||||
| Securities: Fail to Deliver |
30,155 | 32,415 | (2,259 | ) | ||||||||
| Short-Term Loans Receivable |
7,881 | 47,983 | (40,102 | ) | ||||||||
| Other Current Assets |
563,427 | 700,334 | (136,906 | ) | ||||||||
| Less: Allowance for Doubtful Accounts |
(64 | ) | (79 | ) | 14 | |||||||
| Noncurrent Assets |
||||||||||||
| Property and Equipment |
16,992 | 18,742 | (1,750 | ) | ||||||||
| Intangible Assets |
44,747 | 68,497 | (23,750 | ) | ||||||||
| Investments and Other Assets |
458,184 | 304,034 | 154,150 | |||||||||
|
|
|
|
|
|
|
|||||||
| Total Assets |
¥ | 13,730,388 | ¥ | 13,969,227 | ¥ | (238,839 | ) | |||||
|
|
|
|
|
|
|
|||||||
| Liabilities |
||||||||||||
| Current Liabilities |
||||||||||||
| Trading Liabilities |
¥ | 5,918,952 | ¥ | 5,356,537 | ¥ | 562,414 | ||||||
| Payables - Unsettled Trades |
36,516 | — | 36,516 | |||||||||
| Payables Related to Margin Transactions |
37,624 | 50,556 | (12,932 | ) | ||||||||
| Collateralized Short-Term Financing Agreements-Payable |
3,318,666 | 4,144,682 | (826,016 | ) | ||||||||
| Deposits Received |
385,028 | 425,452 | (40,424 | ) | ||||||||
| Guarantee Deposits Received |
191,053 | 425,613 | (234,560 | ) | ||||||||
| Securities: Fail to Receive |
1,018 | 7,083 | (6,064 | ) | ||||||||
| Short-Term Borrowings |
957,701 | 904,079 | 53,622 | |||||||||
| Commercial Paper |
436,000 | 490,500 | (54,500 | ) | ||||||||
| Bonds and Notes Due within One Year |
303,842 | 148,768 | 155,073 | |||||||||
| Income Taxes Payable |
3,624 | 2,515 | 1,109 | |||||||||
| Accrued Employees’ Bonuses |
15,390 | 25,379 | (9,989 | ) | ||||||||
| Provision for Variable Compensation |
401 | 411 | (9 | ) | ||||||||
| Other Current Liabilities |
49,852 | 46,970 | 2,882 | |||||||||
| Noncurrent Liabilities |
||||||||||||
| Bonds and Notes |
641,254 | 753,870 | (112,615 | ) | ||||||||
| Long-Term Borrowings |
724,100 | 580,000 | 144,100 | |||||||||
| Provision for Retirement Benefits |
21,790 | 22,579 | (789 | ) | ||||||||
| Reserve for Loss of Transfer |
923 | 1,541 | (617 | ) | ||||||||
| Other Noncurrent Liabilities |
3,895 | 3,769 | 126 | |||||||||
| Statutory Reserves |
||||||||||||
| Reserve for Financial Instruments Transaction Liabilities |
3,352 | 3,132 | 220 | |||||||||
|
|
|
|
|
|
|
|||||||
| Total Liabilities |
13,050,989 | 13,393,441 | (342,452 | ) | ||||||||
|
|
|
|
|
|
|
|||||||
| Net Assets |
||||||||||||
| Common Stock |
125,167 | 125,167 | — | |||||||||
| Capital Surplus |
407,071 | 381,649 | 25,421 | |||||||||
| Additional Paid - in Capital |
285,831 | 285,831 | — | |||||||||
| Other Capital Surplus |
121,239 | 95,817 | 25,421 | |||||||||
| Retained Earnings |
394,868 | 425,554 | (30,685 | ) | ||||||||
| Other Retained Earnings |
394,868 | 425,554 | (30,685 | ) | ||||||||
| Retained Earnings Brought Forward |
394,868 | 425,554 | (30,685 | ) | ||||||||
| Treasury Stock |
(257,520 | ) | (369,999 | ) | 112,479 | |||||||
|
|
|
|
|
|
|
|||||||
| Total Shareholders’ Equity |
669,587 | 562,371 | 107,216 | |||||||||
|
|
|
|
|
|
|
|||||||
| Net Unrealized Gains on (Operating) Investment Securities, net of Tax |
19,610 | 23,193 | (3,583 | ) | ||||||||
| Net Deferred Gains or Losses on Hedges, net of Tax |
(9,798 | ) | (9,778 | ) | (20 | ) | ||||||
|
|
|
|
|
|
|
|||||||
| Total Valuation and Translation Adjustments |
9,811 | 13,415 | (3,603 | ) | ||||||||
|
|
|
|
|
|
|
|||||||
| Total Net Assets |
679,398 | 575,786 | 103,612 | |||||||||
|
|
|
|
|
|
|
|||||||
| Total Liabilities and Net Assets |
¥ | 13,730,388 | ¥ | 13,969,227 | ¥ | (238,839 | ) | |||||
|
|
|
|
|
|
|
|||||||
2-46
Mizuho Securities Co., Ltd.
COMPARISON OF NON-CONSOLIDATED STATEMENTS OF INCOME
(selected items) OF MIZUHO SECURITIES
| Millions of yen | ||||||||||||
| For the fiscal year ended March 31, 2023 (A) |
For the fiscal year ended March 31, 2022 (B) |
Change (A) - (B) |
||||||||||
| Operating Revenues |
¥ | 372,379 | ¥ | 380,505 | ¥ | (8,125 | ) | |||||
| Commissions |
143,118 | 183,633 | (40,514 | ) | ||||||||
| Net Gain on Trading |
90,648 | 123,761 | (33,112 | ) | ||||||||
| Net Gain on Operating Investment Securities |
1,204 | (2,831 | ) | 4,036 | ||||||||
| Interest and Dividend Income |
137,406 | 75,942 | 61,463 | |||||||||
|
|
|
|
|
|
|
|||||||
| Interest Expenses |
120,444 | 53,612 | 66,831 | |||||||||
|
|
|
|
|
|
|
|||||||
| Net Operating Revenues |
251,934 | 326,892 | (74,957 | ) | ||||||||
|
|
|
|
|
|
|
|||||||
| Selling, General and Administrative Expenses |
230,326 | 251,967 | (21,641 | ) | ||||||||
| Transaction-Related Expenses |
52,590 | 70,197 | (17,606 | ) | ||||||||
| Personnel Expenses |
83,735 | 96,131 | (12,395 | ) | ||||||||
| Real Estate Expenses |
27,558 | 21,017 | 6,540 | |||||||||
| Administrative Expenses |
41,437 | 39,150 | 2,286 | |||||||||
| Depreciation and Amortization |
16,599 | 17,770 | (1,170 | ) | ||||||||
| Taxes and Dues |
5,586 | 5,252 | 334 | |||||||||
| Provision of Allowance for Doubtful Accounts |
53 | 36 | 16 | |||||||||
| Other |
2,764 | 2,411 | 353 | |||||||||
|
|
|
|
|
|
|
|||||||
| Operating Income |
21,608 | 74,924 | (53,316 | ) | ||||||||
|
|
|
|
|
|
|
|||||||
| Non-Operating Income |
2,952 | 3,437 | (484 | ) | ||||||||
| Non-Operating Expenses |
227 | 506 | (279 | ) | ||||||||
|
|
|
|
|
|
|
|||||||
| Ordinary Income |
24,333 | 77,855 | (53,522 | ) | ||||||||
|
|
|
|
|
|
|
|||||||
| Extraordinary Gain |
19,300 | 3,738 | 15,561 | |||||||||
|
|
|
|
|
|
|
|||||||
| Extraordinary Loss |
44,026 | 10,627 | 33,398 | |||||||||
|
|
|
|
|
|
|
|||||||
| Income before Income Taxes |
(393 | ) | 70,966 | (71,359 | ) | |||||||
| Income Taxes: |
||||||||||||
| Current |
3,737 | 10,303 | (6,565 | ) | ||||||||
| Deferred |
(28,428 | ) | 203 | (28,632 | ) | |||||||
|
|
|
|
|
|
|
|||||||
| Net Income |
¥ | 24,297 | ¥ | 60,459 | ¥ | (36,161 | ) | |||||
|
|
|
|
|
|
|
|||||||
2-47