SECURITIES AND EXCHANGE COMMISSION
Washington, D.C. 20549
Form 6-K
REPORT OF FOREIGN PRIVATE ISSUER
PURSUANT TO RULE 13a-16 OR 15d-16
OF THE SECURITIES EXCHANGE ACT OF 1934
For the month of May 2023
Commission File Number 1-14926
KT Corporation
(Translation of registrant’s name into English)
90, Buljeong-ro,
Bundang-gu, Seongnam-si,
Gyeonggi-do,
Korea
(Address of principal executive offices)
Indicate by check mark whether the registrant files or will file annual reports under cover of Form 20-F or Form 40-F:
Form 20-F ☒ Form 40-F ☐
Indicate by check mark if the registrant is submitting the Form 6-K in paper as permitted by Regulation S-T Rule 101(b)(1): ☐
Indicate by check mark if the registrant is submitting the Form 6-K in paper as permitted by Regulation S-T Rule 101(b)(7): ☐
Indicate by check mark whether by furnishing the information contained in this Form, the registrant is also thereby furnishing the information to the Commission pursuant to Rule 12g3-2(b) under the Securities Exchange Act of 1934.
Yes ☐ No ☒
If “Yes” is marked, indicate below the file number assigned to the registrant in connection with Rule 12g3-2(b): 82-Pursuant to the requirements of the Securities Exchange Act of 1934, the registrant has duly caused this report to be signed on its behalf by the undersigned, thereunto duly authorized.
SIGNATURES
| Dated: May 11, 2023 | ||
| KT Corporation | ||
| By: | /s/ Seunghoon Chi |
|
| Name: | Seunghoon Chi | |
| Title: | Vice President | |
| By: | /s/ Sanghyun Cho |
|
| Name: | Sanghyun Cho | |
| Title: | Director | |
KT 1Q23 Earnings Release
Disclaimer This presentation has been prepared by KT Corp.(the “Company”) in accordance with K-IFRS. This presentation contains forward-looking statements, which are subject to risks, uncertainties, and assumptions. This presentation is being presented solely for your information and is subject to change without notice. No presentation or warranty, expressed or implied, is made and no reliance should be placed on the accuracy, actuality, fairness, or completeness of the information presented. st The Company has applied new accounting standard of K-IFRS 1115 as of Jan 1 , 2018 and K-IFRS 1116 ‘Leases’ as st of Jan 1 , 2019. There are no obligation to apply the new standard to previous financial statements. The Company, its affiliates or representatives accept no liability whatsoever for any losses arising from any information contained in the presentation. This presentation does not constitute an offer or invitation to purchase or subscribe for any shares of the Company, and no part of this presentation shall form the Basis of or be relied upon in connection with any contract or commitment. Any decision to purchase shares of the Company could be made solely on the Basis of information, which has been publicly filed with the Securities and Exchange Commission or the Korea Stock Exchange and distributed to all investors. The contents of this presentation may not be reproduced, redistributed or passed on, directly or indirectly, to any other person or published, in whole or in part, for any purpose. If you have any related questions to this material, please contact the IR department. Tel: +82-2-3495-3254, 3262, 3265, 3557, 3558, 3564, 3595, 5339, 5341, 5344 Fax: +82-2-3495-5917 2

2 Financial Highlights 3 Business Overview 4 Appendix 3
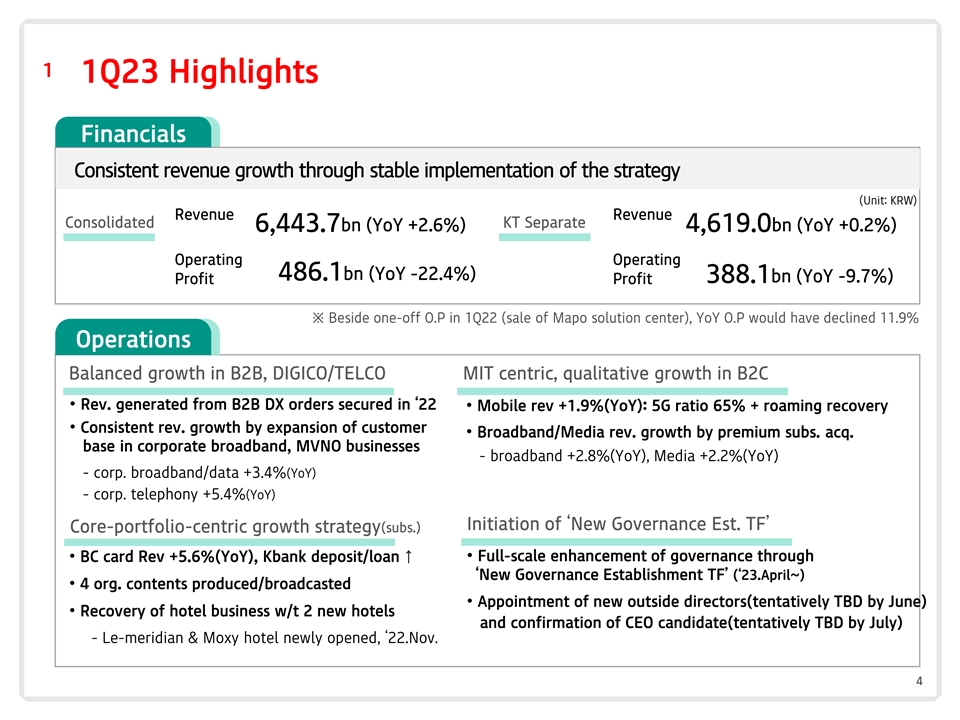
1 1Q23 Highlights Financials (Unit: KRW) Consistent revenue growth through stable implementation of the strategy (Unit: KRW) Revenue Revenue Consolidated KT Separate 6,443.7bn (YoY +2.6%) 4,619.0bn (YoY +0.2%) Operating Operating 486.1bn (YoY -22.4%) 388.1bn (YoY -9.7%) Profit Profit ※ Beside one-off O.P in 1Q22 (sale of Mapo solution center), YoY O.P would have declined 11.9% Operations Balanced growth in B2B, DIGICO/TELCO MIT centric, qualitative growth in B2C • Rev. generated from B2B DX orders secured in ‘22 • Mobile rev +1.9%(YoY): 5G ratio 65% + roaming recovery • Consistent rev. growth by expansion of customer • Broadband/Media rev. growth by premium subs. acq. base in corporate broadband, MVNO businesses - broadband +2.8%(YoY), Media +2.2%(YoY) - corp. broadband/data +3.4%(YoY) - corp. telephony +5.4%(YoY) Initiation of ‘New Governance Est. TF’ Core-portfolio-centric growth strategy(subs.) • Full-scale enhancement of governance through • BC card Rev +5.6%(YoY), Kbank deposit/loan ↑ ‘New Governance Establishment TF’ (‘23.April~) • 4 org. contents produced/broadcasted • Appointment of new outside directors(tentatively TBD by June) • Recovery of hotel business w/t 2 new hotels and confirmation of CEO candidate(tentatively TBD by July) - Le-meridian & Moxy hotel newly opened, ‘22.Nov. 4
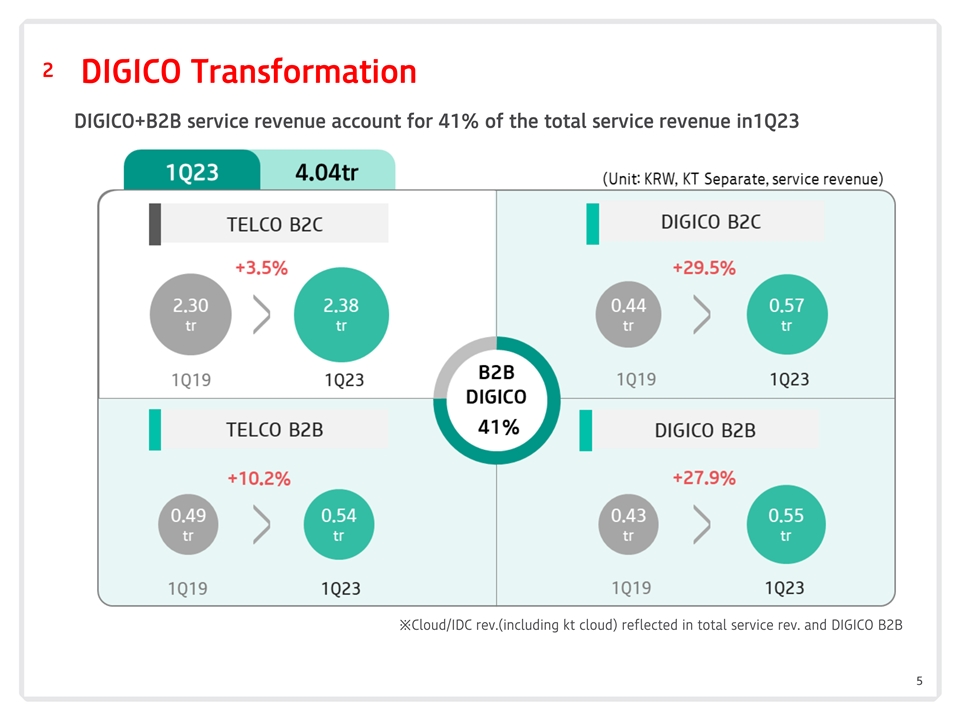
2 DIGICO Transformation DIGICO+B2B service revenue account for 41% of the total service revenue in1Q23 ※Cloud/IDC rev.(including kt cloud) reflected in total service rev. and DIGICO B2B 5
1 1Q23 Highlights 2 Financial Highlights 3 Business Overview 4 Appendix 6
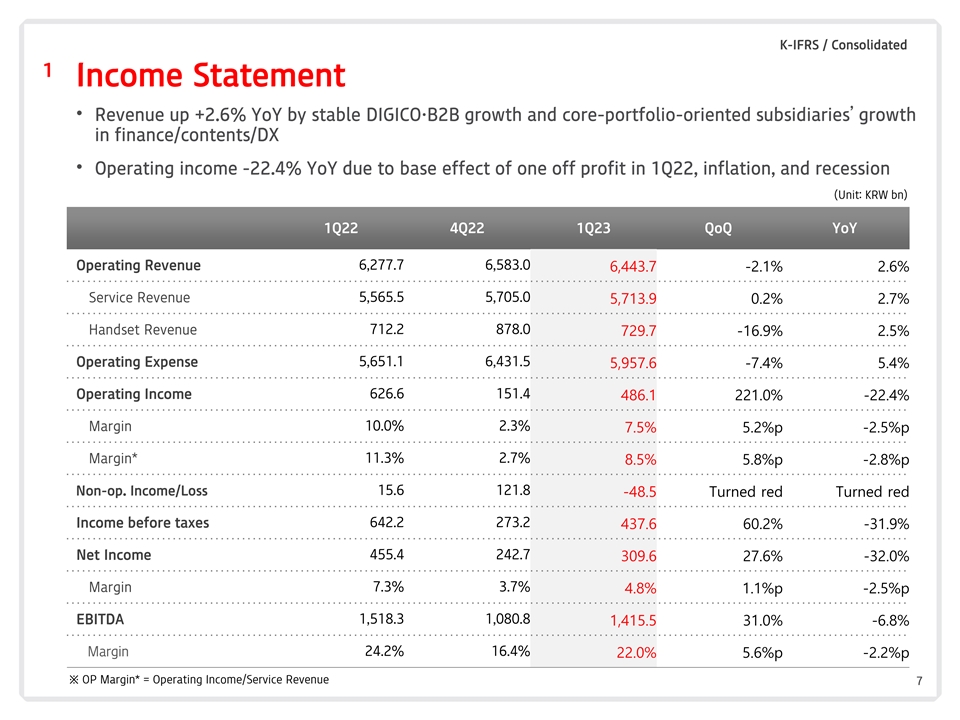
K-IFRS / Consolidated 1 Income Statement • Revenue up +2.6% YoY by stable DIGICO·B2B growth and core-portfolio-oriented subsidiaries’ growth in finance/contents/DX • Operating income -22.4% YoY due to base effect of one off profit in 1Q22, inflation, and recession (Unit: KRW bn) 1Q22 4Q22 1Q23 QoQ YoY Operating Revenue 6,277.7 6,583.0 6,443.7 -2.1% 2.6% Service Revenue 5,565.5 5,705.0 5,713.9 0.2% 2.7% Handset Revenue 712.2 878.0 729.7 -16.9% 2.5% Operating Expense 5,651.1 6,431.5 5,957.6 -7.4% 5.4% 626.6 151.4 Operating Income 486.1 221.0% -22.4% 10.0% 2.3% Margin 7.5% 5.2%p -2.5%p 11.3% 2.7% Margin* 8.5% 5.8%p -2.8%p Non-op. Income/Loss 15.6 121.8 -48.5 Turned red Turned red Income before taxes 642.2 273.2 437.6 60.2% -31.9% Net Income 455.4 242.7 309.6 27.6% -32.0% Margin 7.3% 3.7% 4.8% 1.1%p -2.5%p EBITDA 1,518.3 1,080.8 1,415.5 31.0% -6.8% 24.2% 16.4% Margin 22.0% 5.6%p -2.2%p ※ OP Margin* = Operating Income/Service Revenue 7
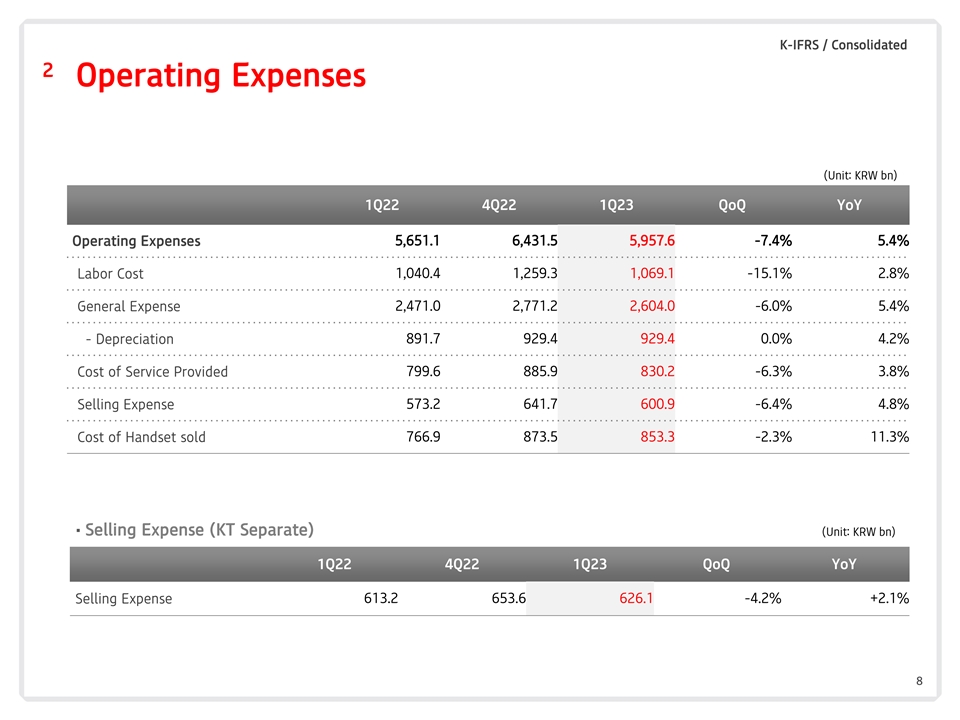
K-IFRS / Consolidated 2 Operating Expenses (Unit: KRW bn) 1Q22 4Q22 1Q23 QoQ YoY 5,651.1 6,431.5 5,957.6 -7.4% 5.4% Operating Expenses Labor Cost 1,040.4 1,259.3 1,069.1 -15.1% 2.8% 2,471.0 2,771.2 2,604.0 -6.0% 5.4% General Expense - Depreciation 891.7 929.4 929.4 0.0% 4.2% 799.6 885.9 830.2 -6.3% 3.8% Cost of Service Provided Selling Expense 573.2 641.7 600.9 -6.4% 4.8% 766.9 873.5 853.3 -2.3% 11.3% Cost of Handset sold § Selling Expense (KT Separate) (Unit: KRW bn) 1Q22 4Q22 1Q23 QoQ YoY Selling Expense 613.2 653.6 626.1 -4.2% +2.1% 8

K-IFRS / Consolidated 3 Financial Position (Unit: KRW bn) 1Q22 4Q22 1Q23 QoQ YoY Assets 37,301.1 40,980.7 40,214.4 -1.9% 7.8% Cash & Cash equivalents 2,682.2 2,449.1 2,109.2 -13.9% -21.4% Liabilities 20,707.3 22,566.0 22,062.4 -2.2% 6.5% Borrowings 8,894.9 10,006.7 10,577.1 5.7% 18.9% 16,593.8 18,414.7 18,152.0 -1.4% 9.4% Equity 1,564.5 1,564.5 1,564.5 0.0% 0.0% Capital Stock 6,212.7 7,557.6 8,467.9 12.0% 36.3% Net Debt 124.8% 122.5% 121.5% -1.0%p -3.3%p Debt / Equity Net Debt / Equity 37.4% 41.0% 46.6% 5.6%p 9.2%p 131.1% 127.0% 124.8% 124.3% 122.6% 122.5% 121.5% 118.7% 117.9% Debt/Equity 46.6% 42.9% 40.6% 41.0% 37.4% Net Debt/Equity 32.4% 33.0% 32.7% 29.7% 1Q 21 2Q 21 3Q 21 4Q 21 1Q 22 2Q 22 3Q 22 4Q 22 1Q 23 9

K-IFRS / Separate and major subsidiaries 4 CAPEX • 1Q23 CAPEX execution : KRW 313.5 bn(KT separate), KRW 152.7bn(major subsidiaries) (Unit: KRW bn) ■ Major subsidiaries CAPEX 3,502 3,452 Finance, Media·Content, Cloud/IDC, 3,127 Real Estate and etc. 692 782 462 ■ KT separate CAPEX Access network, Backbone Network, B2B and etc. 2,760 2,721 2,666 466 153 314 2020 2021 2022 1Q23 ※ Cloud/IDC related investment in 2020 and 2021 are retroactively reflected in subsidiaries’ CAPEX 10
1 1Q23 Highlights 2 Financial Highlights 3 Business Overview 4 Appendix 11

K-IFRS / Separate 1 KT – Telco B2C • Revenue up +1.2% YoY due to premium mobile/broadband subs acq and growth in roaming service • 5G penetration ratio reached 65% among handset subs, and GiGA subs portion reached 67% (Unit: KRW bn) 1Q22 4Q22 1Q23 QoQ YoY Telco B2C 2,353.5 2,382.3 2,381.1 -0.1% 1.2% Wireless 1,537.6 1,548.3 1,554.8 0.4% 1.1% Broadband 591.1 605.3 607.9 0.4% 2.8% Telephony 224.8 228.7 218.4 -4.5% -2.8% (Unit: Thousands) (Unit: Thousands) Wireless Subscribers Broadband Subscribers (GiGA portion) 9,774 9,727 9,679 9,609 9,531 24,332 24,062 23,827 23,409 23,060 7,945 8,882 7,467 8,449 6,941 67.3% 66.9% 66.6% 66.1% 65.8% 5,973 5,297 4,836 6,486 7,111 3,788 3,754 3,652 3,481 3,392 6,827 6,562 6,257 5,974 5,616 1Q 22 2Q 22 3Q 22 4Q 22 1Q 23 1Q 22 2Q 22 3Q 22 4Q 22 1Q 23 12 MVNO 2nd device & IoT Handset(excl. 5G) Handset(5G)

K-IFRS / Separate 2 KT – DIGICO B2C • DIGICO B2C revenue up +3.1% YoY based on balanced growth of media and mobile platform biz • IPTV revenue up +2.8% YoY with consistent growth of subscriber base (Unit: KRW bn) 1Q22 4Q22 1Q23 QoQ YoY DIGICO B2C 549.3 565.5 566.1 0.1% 3.1% Media 496.0 509.8 506.9 -0.6% 2.2% Mobile Platform 53.3 55.7 59.1 6.1% 10.9% (Unit: Thousands) IPTV DIGICO B2C 9,451 9,432 9,399 9,329 IPTV 9,236 Media Media and etc. *Finance Platform Mobile **Contents Market Platform IoT * Finance Platform : Mobile payment, Authentification, Fintech and etc. ** Contents Market : App market payment, One-store, Contents distribution and etc. 1Q22 2Q22 3Q22 4Q22 1Q23 ※ Number of IPTV subscribers above deviates from MSIT’s released figure below following IPTV law - Number of KT pay TV subscriber is 8,586,837 in 1H 2022 (6 month average) 13
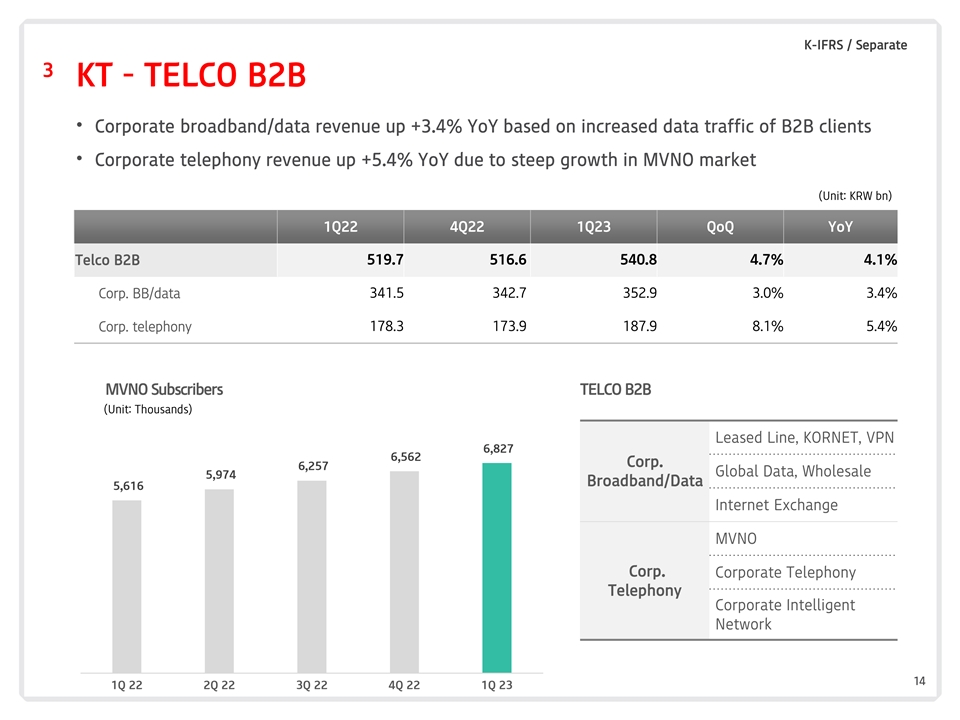
K-IFRS / Separate 3 KT – TELCO B2B • Corporate broadband/data revenue up +3.4% YoY based on increased data traffic of B2B clients • Corporate telephony revenue up +5.4% YoY due to steep growth in MVNO market (Unit: KRW bn) 1Q22 4Q22 1Q23 QoQ YoY Telco B2B 519.7 516.6 540.8 4.7% 4.1% Corp. BB/data 341.5 342.7 352.9 3.0% 3.4% Corp. telephony 178.3 173.9 187.9 8.1% 5.4% MVNO Subscribers TELCO B2B (Unit: Thousands) Leased Line, KORNET, VPN 6,827 6,562 Corp. 6,257 Global Data, Wholesale 5,974 Broadband/Data 5,616 Internet Exchange MVNO Corp. Corporate Telephony Telephony Corporate Intelligent Network 14 1Q 22 2Q 22 3Q 22 4Q 22 1Q 23
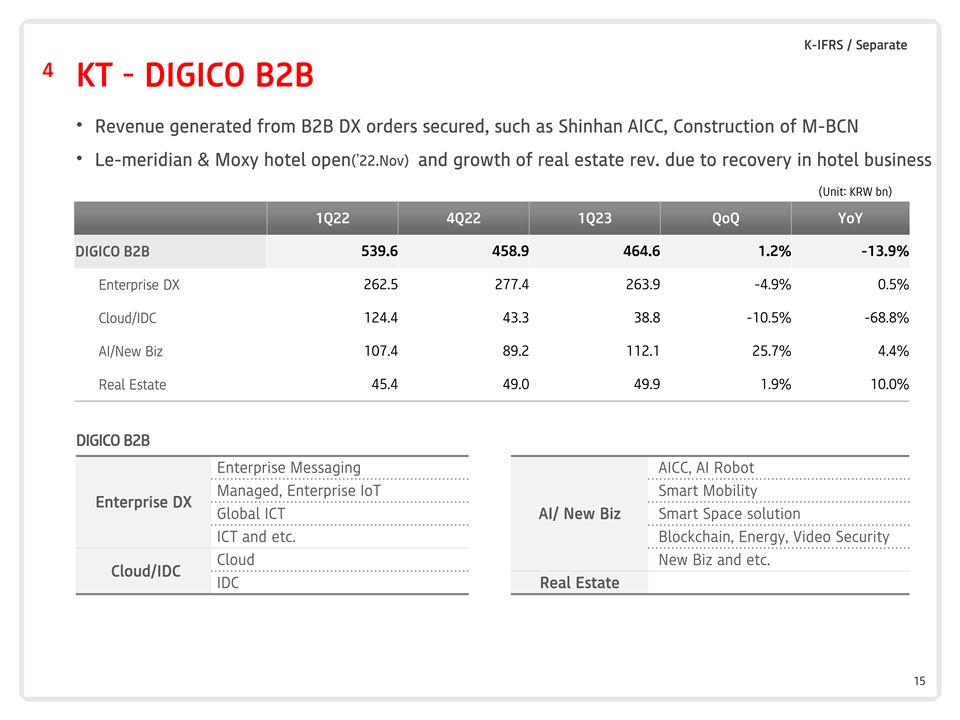
K-IFRS / Separate 4 KT – DIGICO B2B • Revenue generated from B2B DX orders secured, such as Shinhan AICC, Construction of M-BCN • Le-meridian & Moxy hotel open(’22.Nov) and growth of real estate rev. due to recovery in hotel business (Unit: KRW bn) 1Q22 4Q22 1Q23 QoQ YoY 539.6 458.9 464.6 1.2% -13.9% DIGICO B2B 262.5 277.4 263.9 -4.9% 0.5% Enterprise DX 124.4 43.3 38.8 -10.5% -68.8% Cloud/IDC 107.4 89.2 112.1 25.7% 4.4% AI/New Biz Real Estate 45.4 49.0 49.9 1.9% 10.0% DIGICO B2B Enterprise Messaging AICC, AI Robot Managed, Enterprise IoT Smart Mobility Enterprise DX Global ICT Smart Space solution AI/ New Biz ICT and etc. Blockchain, Energy, Video Security Cloud New Biz and etc. Cloud/IDC IDC Real Estate 15

K-IFRS / consolidated(each subsidiary) 5 Major Subsidiaries • BC card revenue up +5.6% YoY with increased credit card transaction and finance biz expansion • Contents subsidiaries revenue -7.6% YoY owing to sluggish advertising market due to recession • OP of subsidiaries recorded KRW 98 bn despite recession, inflation and expense increase for expansion Major Subsidiaries consolidated(each subsidiary) (Unit: KRW bn) 1Q22 4Q22 1Q23 QoQ YoY BC card 902.2 1,018.2 953.2 -6.4% 5.6% 240.8 271.1 254.8 -6.0% 5.8% Skylife Contents Subsidiaries 270.4 308.8 249.9 -19.1% -7.6% KT Estate 150.5 130.9 112.8 -13.8% -25.1% 158.3 148.7 -6.1% - kt cloud - ※ Contents Subsidiaries : Nasmedia(PlayD incl.), KT alpha, KT Studiogenie(Genie music, Storywiz, and others incl.) (Unit: KRW bn) [OP Contribution of subsidiaries] 196.7 98.0 83.5 78.2 1Q20 1Q21 1Q22 1Q23 16 ※ Including following one-off profit : KRW74.6bn (sale of Mapo Solution Center) in 1Q22 *BDE : Bad Debt Expense
1 1Q23 Highlights 2 Financial Highlights 3 Business Overview 4 Appendix 17

1 K-IFRS Income Statement (Unit: KRW bn) Consolidated 1Q 22 2Q 22 3Q 22 4Q22 1Q 23 KT Separate 1Q 22 2Q 22 3Q 22 4Q 22 1Q 23 6,277.7 6,312.2 6,477.2 6,583.0 6,443.7 4,608.4 4,517.8 4,590.2 4,572.8 4,619.0 Operating revenue Operating revenue Service revenue 5,565.5 5,670.5 5,744.8 5,705.0 5,713.9 Service revenue 3,962.1 3,937.3 3,944.4 3,923.3 3,952.6 Handset revenue 712.2 641.7 732.4 878.0 729.7 Handset revenue 646.2 580.5 645.8 649.5 666.4 Operating expense 5,651.1 5,853.0 6,024.3 6,431.5 5,957.6 Operating expense 4,178.5 4,214.3 4,266.6 4,461.7 4,230.9 Service expense 4,884.2 5,150.1 5,197.3 5,558.1 5,104.2 Service expense 3,516.0 3,655.4 3,607.9 3,783.7 3,491.5 1,040.4 1,120.9 1,075.3 1,259.3 1,069.1 549.3 605.8 535.8 689.7 530.2 Labor cost Labor cost General expense 2,471.0 2,560.2 2,586.0 2,771.2 2,604.0 General expense 1,692.8 1,719.4 1,743.6 1,824.0 1,720.5 Cost of svc provided 799.6 863.0 887.6 885.9 830.2 Cost of svc provided 646.4 660.2 666.7 605.1 601.6 Selling expense 573.2 606.0 648.4 641.7 600.9 Selling expense 627.4 670.0 661.8 664.9 639.3 Cost of device sold 766.9 703.0 827.0 873.5 853.3 Cost of device sold 662.5 558.9 658.7 678.0 739.4 Operating income 626.6 459.2 452.9 151.4 486.1 Operating income 429.9 303.5 323.6 111.1 388.1 N-OP income (loss) 15.6 80.5 -13.9 121.8 -48.5 N-OP income (loss) 99.2 23.0 1.5 -21.1 39.6 N-OP income 223.2 445.1 515.8 101.6 242.3 N-OP income 268.7 359.1 468.3 -110.8 265.1 N-OP expense 204.0 385.7 520.8 -46.1 287.0 N-OP expense 169.6 336.0 466.8 -89.7 225.5 Equity Method (G/L) -3.6 21.0 -8.9 -25.9 -3.8 Income bf tax 642.2 539.7 439.0 273.2 437.6 Income bf tax 529.1 326.5 325.1 90.1 427.7 Income tax 186.8 176.3 112.8 30.5 128.0 Income tax 138.1 302.1 84.9 -18.0 107.8 Net income 455.4 363.4 326.2 242.7 309.6 Net income 391.0 24.4 240.3 108.1 319.9 NI contribution to KT 409.8 313.1 297.6 242.0 296.6 EBITDA 1,518.3 1,387.2 1,359.7 1,080.8 1,415.5 1,217.1 1,070.9 1,096.5 889.4 1,167.4 EBITDA EBITDA Margin EBITDA Margin 24.2% 22.0% 21.0% 16.4% 22.0% 26.4% 23.7% 23.9% 19.5% 25.3% 18
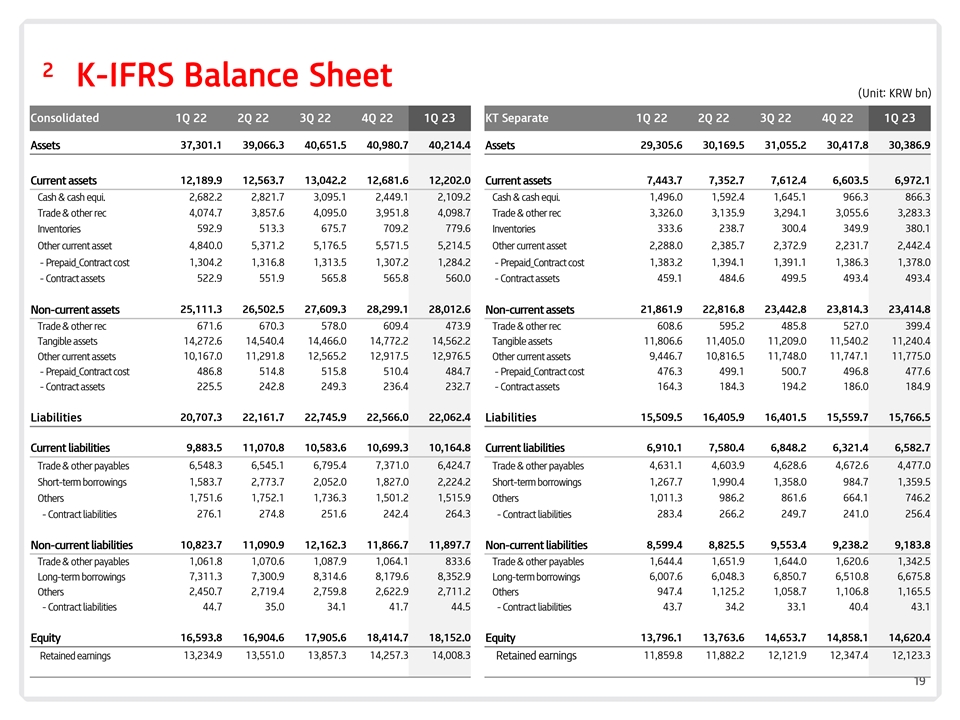
2 K-IFRS Balance Sheet (Unit: KRW bn) Consolidated 1Q 22 2Q 22 3Q 22 4Q 22 1Q 23 KT Separate 1Q 22 2Q 22 3Q 22 4Q 22 1Q 23 Assets 37,301.1 39,066.3 40,651.5 40,980.7 40,214.4 Assets 29,305.6 30,169.5 31,055.2 30,417.8 30,386.9 Current assets 12,189.9 12,563.7 13,042.2 12,681.6 12,202.0 Current assets 7,443.7 7,352.7 7,612.4 6,603.5 6,972.1 Cash & cash equi. 2,682.2 2,821.7 3,095.1 2,449.1 2,109.2 Cash & cash equi. 1,496.0 1,592.4 1,645.1 966.3 866.3 Trade & other rec 4,074.7 3,857.6 4,095.0 3,951.8 4,098.7 Trade & other rec 3,326.0 3,135.9 3,294.1 3,055.6 3,283.3 Inventories 592.9 513.3 675.7 709.2 779.6 Inventories 333.6 238.7 300.4 349.9 380.1 4,840.0 5,371.2 5,176.5 5,571.5 5,214.5 2,288.0 2,385.7 2,372.9 2,231.7 2,442.4 Other current asset Other current asset - Prepaid_Contractcost 1,304.2 1,316.8 1,313.5 1,307.2 1,284.2 - Prepaid_Contractcost 1,383.2 1,394.1 1,391.1 1,386.3 1,378.0 - Contract assets 522.9 551.9 565.8 565.8 560.0 - Contract assets 459.1 484.6 499.5 493.4 493.4 25,111.3 26,502.5 27,609.3 28,299.1 28,012.6 21,861.9 22,816.8 23,442.8 23,814.3 23,414.8 Non-current assets Non-current assets Trade & other rec 671.6 670.3 578.0 609.4 473.9 Trade & other rec 608.6 595.2 485.8 527.0 399.4 Tangible assets 14,272.6 14,540.4 14,466.0 14,772.2 14,562.2 Tangible assets 11,806.6 11,405.0 11,209.0 11,540.2 11,240.4 10,167.0 11,291.8 12,565.2 12,917.5 12,976.5 9,446.7 10,816.5 11,748.0 11,747.1 11,775.0 Other current assets Other current assets - Prepaid_Contractcost 486.8 514.8 515.8 510.4 484.7 - Prepaid_Contractcost 476.3 499.1 500.7 496.8 477.6 - Contract assets 225.5 242.8 249.3 236.4 232.7 - Contract assets 164.3 184.3 194.2 186.0 184.9 20,707.3 22,161.7 22,745.9 22,566.0 22,062.4 15,509.5 16,405.9 16,401.5 15,559.7 15,766.5 Liabilities Liabilities 9,883.5 11,070.8 10,583.6 10,699.3 10,164.8 6,910.1 7,580.4 6,848.2 6,321.4 6,582.7 Current liabilities Current liabilities 6,548.3 6,545.1 6,795.4 7,371.0 6,424.7 4,631.1 4,603.9 4,628.6 4,672.6 4,477.0 Trade & other payables Trade & other payables Short-term borrowings 1,583.7 2,773.7 2,052.0 1,827.0 2,224.2 Short-term borrowings 1,267.7 1,990.4 1,358.0 984.7 1,359.5 Others 1,751.6 1,752.1 1,736.3 1,501.2 1,515.9 Others 1,011.3 986.2 861.6 664.1 746.2 - Contract liabilities 276.1 274.8 251.6 242.4 264.3 - Contract liabilities 283.4 266.2 249.7 241.0 256.4 Non-current liabilities 10,823.7 11,090.9 12,162.3 11,866.7 11,897.7 Non-current liabilities 8,599.4 8,825.5 9,553.4 9,238.2 9,183.8 1,061.8 1,070.6 1,087.9 1,064.1 833.6 1,644.4 1,651.9 1,644.0 1,620.6 1,342.5 Trade & other payables Trade & other payables Long-term borrowings 7,311.3 7,300.9 8,314.6 8,179.6 8,352.9 Long-term borrowings 6,007.6 6,048.3 6,850.7 6,510.8 6,675.8 Others 2,450.7 2,719.4 2,759.8 2,622.9 2,711.2 Others 947.4 1,125.2 1,058.7 1,106.8 1,165.5 44.7 35.0 34.1 41.7 44.5 43.7 34.2 33.1 40.4 43.1 - Contract liabilities - Contract liabilities Equity 16,593.8 16,904.6 17,905.6 18,414.7 18,152.0 Equity 13,796.1 13,763.6 14,653.7 14,858.1 14,620.4 Retained earnings 13,234.9 13,551.0 13,857.3 14,257.3 14,008.3 Retained earnings 11,859.8 11,882.2 12,121.9 12,347.4 12,123.3 19
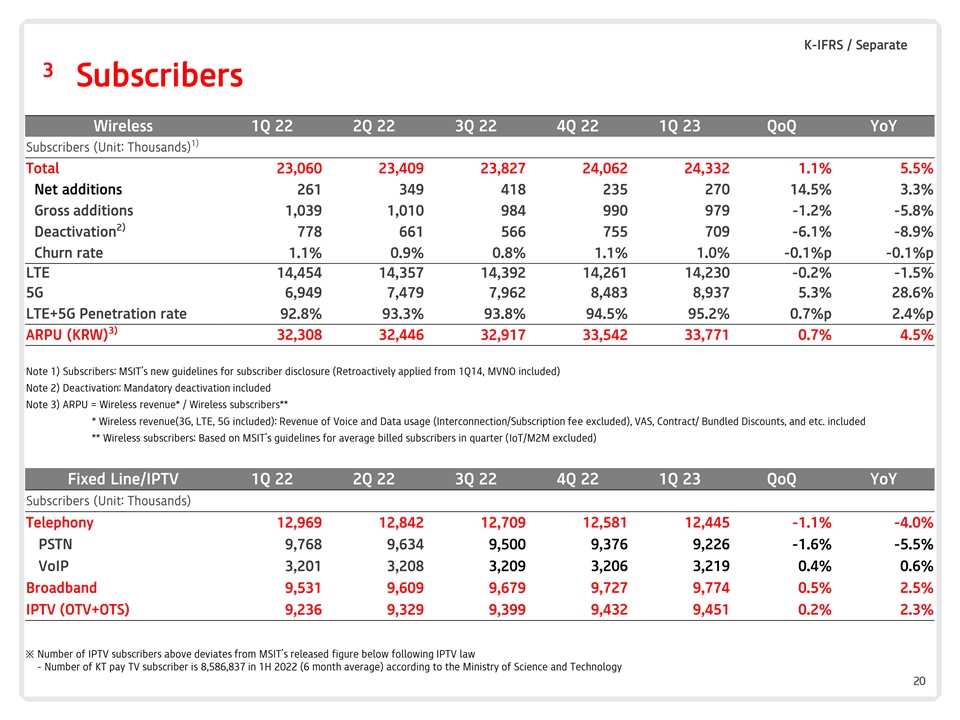
K-IFRS / Separate 3 Subscribers Wireless 1Q 22 2Q 22 3Q 22 4Q 22 1Q 23 QoQ YoY 1) Subscribers (Unit: Thousands) Total 23,060 23,409 23,827 24,062 24,332 1.1% 5.5% Net additions 261 349 418 235 270 14.5% 3.3% Gross additions 1,039 1,010 984 990 979 -1.2% -5.8% 2) Deactivation 778 661 566 755 709 -6.1% -8.9% Churn rate 1.1% 0.9% 0.8% 1.1% 1.0% -0.1%p -0.1%p LTE 14,454 14,357 14,392 14,261 14,230 -0.2% -1.5% 5G 8,937 5.3% 28.6% 6,949 7,479 7,962 8,483 LTE+5G Penetration rate 92.8% 93.3% 93.8% 94.5% 95.2% 0.7%p 2.4%p 3) ARPU (KRW) 32,308 32,446 32,917 33,542 33,771 0.7% 4.5% Note 1) Subscribers: MSIT’s new guidelines for subscriber disclosure (Retroactively applied from 1Q14, MVNO included) Note 2) Deactivation: Mandatory deactivation included Note 3) ARPU = Wireless revenue* / Wireless subscribers** * Wireless revenue(3G, LTE, 5G included): Revenue of Voice and Data usage (Interconnection/Subscription fee excluded), VAS, Contract/ Bundled Discounts, and etc. included ** Wireless subscribers: Based on MSIT’s guidelines for average billed subscribers in quarter (IoT/M2M excluded) Fixed Line/IPTV 1Q 22 2Q 22 3Q 22 4Q 22 1Q 23 QoQ YoY Subscribers (Unit: Thousands) Telephony 12,969 12,842 12,709 12,581 12,445 -1.1% -4.0% PSTN 9,768 9,634 9,500 9,376 9,226 -1.6% -5.5% VoIP 3,201 3,208 3,209 3,206 3,219 0.4% 0.6% Broadband 9,531 9,609 9,679 9,727 9,774 0.5% 2.5% IPTV (OTV+OTS) 9,236 9,329 9,399 9,432 9,451 0.2% 2.3% ※ Number of IPTV subscribers above deviates from MSIT’s released figure below following IPTV law - Number of KT pay TV subscriber is 8,586,837 in 1H 2022 (6 month average) according to the Ministry of Science and Technology 20
