UNITED STATES
SECURITIES AND EXCHANGE COMMISSION
Washington, D.C. 20549
FORM 8-K
CURRENT REPORT
Pursuant to Section 13 or 15(d)
of The Securities Exchange Act of 1934
Date of Report (Date of earliest event reported): May 4, 2023
Block, Inc.
(Exact name of registrant as specified in its charter)
| Delaware | 001-37622 | 80-0429876 | ||
| (State or other jurisdiction of incorporation) |
(Commission File Number) |
(IRS Employer Identification No.) |
Not Applicable1
(Address of principal executive offices, including zip code)
(415) 375-3176
(Registrant’s telephone number, including area code)
Not Applicable
(Former name or former address, if changed since last report)
Check the appropriate box below if the Form 8-K filing is intended to simultaneously satisfy the filing obligation of the registrant under any of the following provisions (see General Instruction A.2. below):
| ☐ | Written communications pursuant to Rule 425 under the Securities Act (17 CFR 230.425) |
| ☐ | Soliciting material pursuant to Rule 14a-12 under the Exchange Act (17 CFR 240.14a-12) |
| ☐ | Pre-commencement communications pursuant to Rule 14d-2(b) under the Exchange Act (17 CFR 240.14d-2(b)) |
| ☐ | Pre-commencement communications pursuant to Rule 13e-4(c) under the Exchange Act (17 CFR 240.13e-4(c)) |
Securities registered pursuant to Section 12(b) of the Act:
Title of each class |
Trading |
Name of each exchange on which registered |
||
| Class A Common Stock, $0.0000001 par value per share | SQ | New York Stock Exchange |
Indicate by check mark whether the registrant is an emerging growth company as defined in Rule 405 of the Securities Act of 1933 (§230.405 of this chapter) or Rule 12b-2 of the Securities Exchange Act of 1934 (§240.12b-2 of this chapter).
Emerging growth company ☐
If an emerging growth company, indicate by check mark if the registrant has elected not to use the extended transition period for complying with any new or revised financial accounting standards provided pursuant to Section 13(a) of the Exchange Act. ☐
| 1 | We do not designate a headquarters location as we have adopted a distributed work model. |
| Item 2.02 | Results of Operations and Financial Condition. |
On May 4, 2023, Block, Inc. (the “Company”) issued a Shareholder Letter (the “Letter”) announcing its financial results for the first quarter ended March 31, 2023. In the Letter, the Company also announced that it would be holding a conference call and earnings webcast on May 4, 2023 at 2:00 p.m. Pacific Time to discuss its financial results for the first quarter ended March 31, 2023. The Letter is furnished as Exhibit 99.1 to this Current Report on Form 8-K (this “Report”).
The Company is making reference to non-GAAP financial information in both the Letter and the conference call. A reconciliation of these non-GAAP financial measures to their nearest GAAP equivalents is provided in the Letter.
The information furnished pursuant to Item 2.02 on this Report, including Exhibit 99.1 attached hereto, shall not be deemed “filed” for purposes of Section 18 of the Securities Exchange Act of 1934, as amended (the “Exchange Act”), or otherwise subject to the liabilities of that section, nor shall it be deemed incorporated by reference into any other filing under the Securities Act of 1933, as amended, or the Exchange Act, except as expressly set forth by specific reference in such a filing.
| Item 9.01 | Financial Statements and Exhibits. |
(d) Exhibits
| Exhibit No. |
Description |
|
| 99.1 | Shareholder Letter, dated May 4, 2023. | |
| 104 | Cover Page Interactive Data File, formatted in inline XBRL. | |
SIGNATURES
Pursuant to the requirements of the Securities Exchange Act of 1934, the registrant has duly caused this report to be signed on its behalf by the undersigned hereunto duly authorized.
| BLOCK, INC. | ||||||
| Date: May 4, 2023 | By: | /s/ Chrysty Esperanza |
||||
| Chrysty Esperanza Chief Legal Officer and Corporate Secretary |
||||||
Exhibit 99.1

Q1’23 Highlights
|
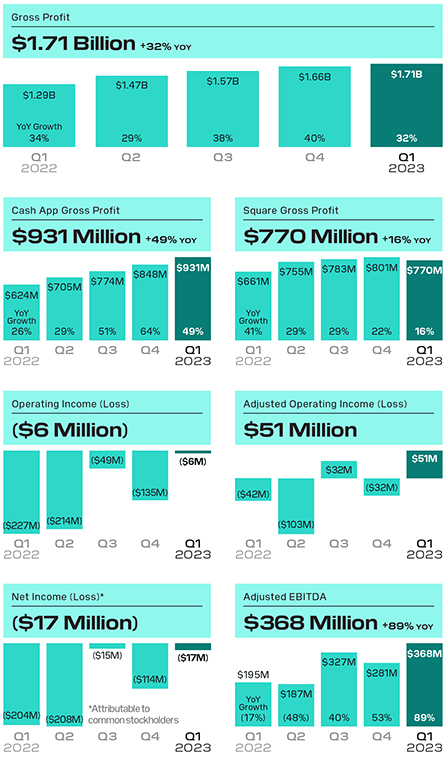
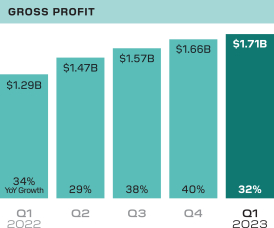
In the first quarter of 2023, we generated gross profit of $1.71 billion, up 32% year over year. Cash App generated gross profit of $931 million, up 49% year over year, and Square generated gross profit of $770 million, up 16% year over year.
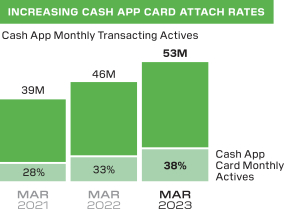
Cash App Card has continued to expand its reach and engagement: In March, there were 20 million monthly Cash App Card actives, up 34% year over year, with average spend per active increasing as well.
We recently launched approximately 100 new products, features, and partnerships across Square’s ecosystem to help sellers diversify their revenue streams and automate more of their operations. |
|
|
In the first quarter of 2023, total net revenue was $4.99 billion, up 26% year over year, and, excluding bitcoin revenue, revenue was $2.83 billion, up 27% year over year.
Reconciliations of non-GAAP financial measures used in this letter to their nearest GAAP equivalents are provided at the end of this letter. Please see these reconciliations for a description of certain items that impacted operating income (loss) and net income (loss) in the first quarter of 2023.
|
|
BLOCK Q1 2023 2 |
| SQUARE HIGHLIGHT Yo También Cantina is a San Francisco–based restaurant that has grown through creating new revenue streams. They use nine Square products, including Square Point of Sale, Square Online, Square Invoices, Square
Subscriptions, Square Register, Square Payroll, Team Management, Gift Cards, and Square Savings. |

|
|
| To Our Shareholders | ||
| May 4, 2023
Combined company gross profit is calculated assuming a $51 million gross profit contribution from our BNPL platform in January 2022, as if our BNPL platform had been acquired on January 1, 2022. We believe combined company gross profit is more representative of underlying growth trends in the first quarter, given we acquired our BNPL platform on January 31, 2022. We acquired our BNPL platform through the acquisition of Afterpay.
We facilitated access to Paycheck Protection Program (PPP) loans for our sellers during the COVID-19 pandemic. We recognize revenue and gross profit over the life of the loan. If a loan is forgiven, we recognize the remaining revenue and gross profit in the period the loan is forgiven. |
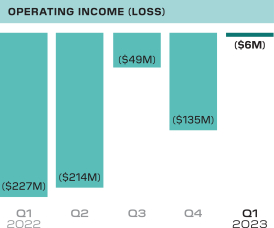
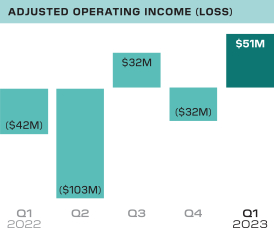
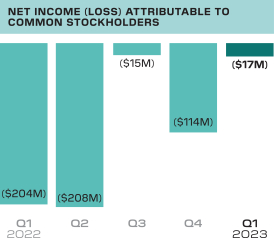
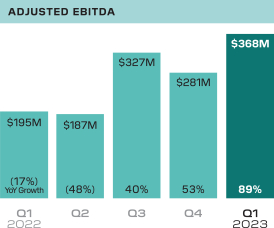
We delivered strong growth and profitability at scale during the first quarter of 2023. Gross profit grew 32% year over year to $1.71 billion. On a combined company basis, gross profit grew 27% year over year. Our Cash App ecosystem delivered gross profit of $931 million, an increase of 49% year over year. Our Square ecosystem delivered gross profit of $770 million, an increase of 16% year over year. Excluding gross profit attributable to Paycheck Protection Program (PPP) loan forgiveness, Square gross profit increased 26% year over year. Operating loss was $6 million and Adjusted Operating Income was $51 million. Net loss attributable to common stockholders was $17 million and Adjusted EBITDA was $368 million. |
|
|
|
BLOCK Q1 2023 3 |
A transacting active is a Cash App account that has at least one financial transaction using any product or service within Cash App during a specified period. A transacting active for a specific Cash App product has at least one financial transaction using that product during the specified period and is referred to as an active. Certain of these accounts may share an alias identifier with one or more other transacting active accounts. This could represent, among other things, one customer with multiple accounts or multiple customers sharing one alias identifier (for example, families).
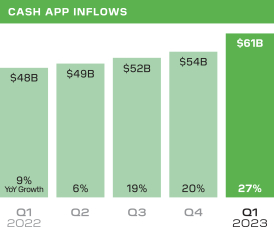
Inflows per transacting active refers to total inflows in the quarter divided by monthly actives for the last month of the quarter. Inflows refers to funds entering the Cash App ecosystem. Inflows does not include the movement of funds when funds remain in the Cash App ecosystem or when funds leave the Cash App ecosystem, or inflows related to the Afterpay or Verse apps. Inflows from Verse actives are not material to overall inflows.
Cash App Ecosystem
We use our inflows framework to assess the performance of Cash App’s gross profit as a result of three primary variables: (1) Actives, (2) Inflows per Active, and (3) Monetization Rate on Inflows. We are investing in the following development pillars: Trust, Financial Services, Community, Commerce, Global, Bitcoin, and Operating System.
Community
Cash App has an extensive, highly engaged network rooted in peer-to-peer payments, which allows for viral growth as current actives bring their friends and family into Cash App. Growing monthly transacting actives is a component of the inflows framework and one of the ways we drive gross profit: In March, there were 53 million monthly transacting actives.
Financial Services
Building a suite of financial services to enable customers to use Cash App to manage all their financial needs is among our top focus areas. We believe that offering broad utility across products allows us to deepen our relationship with customers and grow their trust in Cash App’s capabilities and network. Our financial services products have been key drivers of inflows per active, and, in the first quarter, inflows per transacting active were $1,136, an increase of 8% year over year and quarter over quarter.

|
|
BLOCK Q1 2023 4 |
Within financial services, we are focused on building out robust product offerings. With its intuitive design and instant rewards through Boost, Cash App Card provides an opportunity for customers to deepen their financial relationship with Cash App. We have continued to add enhanced security features for Cash App Card, recently launching real-time transaction monitoring to help track and defend against suspicious activity. We also recently introduced Cash App Card into the onboarding process by offering new actives a chance to sign up for a Cash App Card when joining, which has resulted in an encouraging early lift in new card orders. Cash App Card has continued to expand its reach and engagement: In March, there were 20 million monthly Cash App Card actives, up 34% year over year, with average spend per active increasing as well.
We have also been able to drive meaningful inflows from other banking products. To further our direct deposit strategy, we have increased benefits for those receiving their recurring paycheck in Cash App, such as free in-network ATM withdrawals. In March, there were 2 million direct deposit actives and paycheck deposits totaled $2.5 billion, up 69% year over year.
Money management has been a highly requested feature by our customers, leading us to launch Savings at the beginning of this year. Cash App’s Savings product provides a simple and flexible way to manage money and easily set aside funds as a separate savings balance. From launch through the end of April, more than 3 million Savings actives had added funds to their savings balance, with most setting a savings goal or using Round Ups to automatically save when they spend with their Cash App Card.
|
|
BLOCK Q1 2023 5 |
Square Ecosystem
In 2023, we’re focused on four strategic priorities to drive Square’s business: enabling omnichannel, growing upmarket, expanding globally, and a new priority, integrating generative artificial intelligence.
Enabling Omnichannel
Square’s mission is to make commerce and financial services easy and accessible whether sellers operate in person, online, or across multiple channels. We recently launched approximately 100 new products, features, and partnerships across Square’s ecosystem to help sellers diversify their revenue streams and automate more of their operations. For example, we launched Waitlists to help our sellers maintain fully booked schedules by automating the booking process. We also integrated Square for Restaurants with OpenTable, enabling sellers to efficiently maximize table availability and diner reservation details.
Growing Upmarket
We continued to experience strong growth upmarket. Gross profit from our mid-market sellers was up 19% year over year in the first quarter, despite lapping gross profit from PPP forgiveness during the prior year. In the first quarter, we redesigned Square’s homepage to change the primary call to action to contact sales in support of upmarket acquisition, and to create a verticalized experience for restaurants, retail, and beauty sellers, three of our primary verticals. The updated homepage details how Square can help sellers diversify revenue streams, streamline operations, and manage their staff. We have seen early strength in leading acquisition metrics including new lead generation for sales since launching our redesigned homepage.

Our redesigned homepage is now optimized to feature relevant content and messaging targeted toward larger sellers across different verticals.
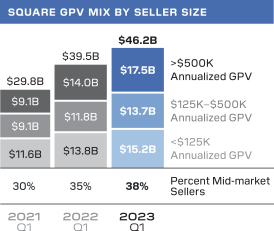
We determine seller size based on annualized GPV during the applicable quarter. A mid-market seller generates more than $500,000 in annualized GPV. GPV does not include transactions from our BNPL platform because GPV is related only to transaction-based revenue and not to subscription and services-based revenue. Gross profit from mid-market sellers does not include gross profit contributions from our BNPL platform.
|
|
BLOCK Q1 2023 6 |
Expanding Globally
We have continued to make progress on our global strategy by improving product parity in our markets outside the U.S. During the first quarter, we launched Square Loyalty and Square for Restaurants in Japan, providing food and drink sellers with integrated solutions focused on operating more efficiently, delivering better hospitality to their guests, and growing their businesses. To further help Japanese restaurants run both front and back of house, we also introduced our Kitchen Display System in the country, allowing sellers to streamline orders via digital tickets. In the first quarter, gross profit in markets outside the U.S. grew 43% year over year and represented 16% of Square gross profit, and we experienced strong product adoption particularly among mid-market sellers.
Integrating Generative Artificial Intelligence (AI)
Though we’ve launched features leveraging machine learning and generative AI in prior years, in 2023, we’ve doubled down and have incorporated this as a strategic priority for all Square product teams. In March, we launched Suggested Actions in Square Messages, which uses a large language model (LLM) to predict the next actions that sellers may want to take based on a conversation with a customer. Those actions include sending coupons, invoices, and photos, and requesting payments from customers. Suggested Actions complement our previously launched generative AI–powered Suggested Replies. Since launch, more than 400,000 sellers have accepted and sent more than 1 million suggested replies or actions. We also launched AI-generated item descriptions as part of Square for Retail’s item creation flow. Since launch, approximately 3 out of 4 of Suggested Item Descriptions are saved without edits. These AI capabilities can help make commerce easier and give sellers time back.
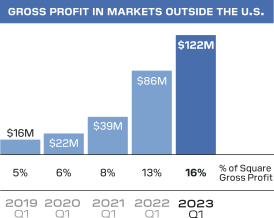
Square gross profit in markets outside the U.S. includes contributions from our BNPL platform beginning in the first quarter of 2022. Excluding our BNPL platform, Square gross profit in markets outside the U.S. was $75 million in the first quarter of 2023, representing 11% of Square gross profit.
|
|
BLOCK Q1 2023 7 |
Reconciliations of non-GAAP metrics used in this letter to their nearest GAAP equivalents are provided at the end of this letter.
Combined company gross profit is calculated assuming a $51 million gross profit contribution from our BNPL platform in January 2022, as if our BNPL platform had been acquired on January 1, 2022.
We recognize revenue from our BNPL platform as subscription and services-based revenue, and have allocated 50% of revenue and gross profit from our BNPL platform to each of Square and Cash App. Revenue from our BNPL platform includes fees generated from consumer receivables, late fees, and certain affiliate and advertising fees from the platform.
GPV includes Square GPV and Cash App Business GPV. Square GPV is defined as the total dollar amount of all card payments processed by sellers using Square, net of refunds, and ACH transfers. Cash App Business GPV comprises Cash App activity related to peer-to-peer transactions received by business accounts and peer-to-peer payments sent from a credit card. GPV does not include transactions from our BNPL platform because GPV is related only to transaction-based revenue and not to subscription and services-based revenue.
Financial Discussion
REVENUE AND GROSS PROFIT
Total net revenue was $4.99 billion in the first quarter of 2023, up 26% year over year. Excluding bitcoin revenue, revenue in the first quarter was $2.83 billion, up 27% year over year. Gross profit was $1.71 billion, up 32% year over year, and, on a combined company basis, gross profit grew 27% year over year. In the first quarter, gross profit included $19 million of amortization of acquired technology assets, the majority of which was from the acquisition of our BNPL platform.
Transaction-based revenue was $1.42 billion in the first quarter of 2023, up 15% year over year, and transaction-based gross profit was $602 million, up 16% year over year. We processed $51.12 billion in GPV in the first quarter of 2023, up 17% year over year. Transaction-based gross profit as a percentage of GPV was 1.18% in the first quarter, up 4 basis points quarter over quarter and down 1 basis point year over year.
Subscription and services-based revenue was $1.37 billion in the first quarter of 2023, up 42% year over year, and subscription and services-based gross profit was $1.10 billion, up 42% year over year.
Bitcoin gross profit was $50 million in the first quarter of 2023. The total sale amount of bitcoin sold to customers, which we recognize as bitcoin revenue, was $2.16 billion. Bitcoin gross profit was 2% of bitcoin revenue.
|
|
BLOCK Q1 2023 8 |
Bitcoin revenue is the total sale amount of bitcoin sold to customers. Bitcoin costs are the total amount we pay to purchase bitcoin in order to facilitate customers’ access to bitcoin. In future quarters, bitcoin revenue and gross profit may fluctuate as a result of changes in customer demand or the market price of bitcoin.
CASH APP ECOSYSTEM REVENUE
AND GROSS PROFIT
In the first quarter of 2023, Cash App generated $3.27 billion of revenue and $931 million of gross profit, up 33% and 49% year over year, respectively. Excluding bitcoin revenue, Cash App revenue was $1.11 billion, up 52% year over year.
We drove growth in net new transacting actives and strong engagement across products in our Cash App ecosystem. Inflows per transacting active were $1,136, up 8% year over year and quarter over quarter, and overall inflows were $61 billion, up 27% year over year. Monetization rate was 1.41% excluding gross profit contributions from our BNPL platform.
In the first quarter of 2023, Cash App Business GPV was $4.90 billion, up 24% year over year. Cash App Business GPV comprises Cash App activity related to peer-to-peer transactions received by business accounts and peer-to-peer payments sent from a credit card. Cash App generated $135 million of transaction-based revenue during the first quarter of 2023, up 23% year over year. Growth was driven by an increase in the number of business accounts and in the number of transactions.
Cash App generated $974 million of subscription and services-based revenue during the first quarter of 2023, up 56% year over year. Growth in the quarter was driven by transaction fees from both Cash App Card and Instant Deposit, as well as contributions from our BNPL platform, interest earned on customer funds, and revenue from other financial services products.
Cash App generated $50 million of bitcoin gross profit in the first quarter of 2023, up 16% year over year. The total sale amount of bitcoin sold to customers, which we recognize as bitcoin revenue, was $2.16 billion, up 25% year over year. The year-over-year increase in bitcoin revenue and gross profit was driven by an increase in the quantity of bitcoin sold to customers, partially offset by a decrease in the market price of bitcoin compared to the prior-year period.
This chart has been revised from the fourth quarter 2022 shareholder letter to reflect the correct rounding for the second quarter of 2022.
|
|
BLOCK Q1 2023 9 |
SQUARE ECOSYSTEM REVENUE
AND GROSS PROFIT
In the first quarter of 2023, Square generated $1.67 billion of revenue and $770 million of gross profit, up 15% and 16% year over year, respectively. Excluding gross profit attributable to PPP loan forgiveness, Square gross profit was up 26% year over year.
In the first quarter of 2023, Square generated $1.29 billion of transaction-based revenue, up 15% year over year, with growth from both in-person and online channels. During the quarter, Square saw a lower percentage of debit card transactions on a year-over-year basis, which have a lower cost per transaction, as the proportion of debit transactions was comparable to pre-pandemic levels.
In the first quarter of 2023, Square GPV was $46.22 billion, up 17% year over year and 18% year over year on a constant currency basis. On a year-over-year basis, Square GPV was up 23% in January, 16% in February, and 13% in March, as we lapped impacts from Omicron in January and the first half of February 2022. We observed the following trends in Square GPV during the first quarter of 2023:
| • | Products: Card-present GPV was up 21% year over year and card-not-present GPV was up 10% year over year. |
| • | Geographies: Square GPV in our U.S. market grew 14% year over year, and growth in our international markets was 33% year over year. On a constant currency basis, Square GPV in our international markets was up 44% year over year. |
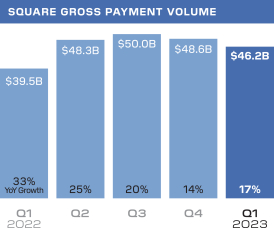
Square GPV is defined as the total dollar amount of all card payments processed by sellers using Square, net of refunds, and ACH transfers. Square GPV does not include transactions from our BNPL platform because GPV is related only to transaction-based revenue and not to subscription and services-based revenue.
|
|
BLOCK Q1 2023 10 |
Square generated $342 million of subscription and services-based revenue during the first quarter of 2023, up 21% year over year. Excluding revenue from PPP loan forgiveness, Square subscription and services-based revenue was up 48% year over year.
| • | Banking: Excluding revenue from PPP loan forgiveness, revenue and gross profit from seller banking products achieved strong year-over-year growth in the first quarter of 2023. This includes Instant Transfer, Square Card, and Square Loans, which represent most of our financial services products for sellers. |
| • | Square Loans: Excluding revenue from PPP loan forgiveness, Square Loans achieved strong revenue and gross profit growth during the first quarter of 2023, facilitating approximately 113,000 loans totaling $1.10 billion in originations, up 46% year over year. Square Loans benefited from $1 million of PPP loan forgiveness revenue and gross profit during the first quarter of 2023, compared to $51 million in the first quarter of 2022. |
| • | Software: Revenue and gross profit from software subscriptions delivered strong year-over-year growth during the quarter. |
Hardware revenue in the first quarter of 2023 was $37 million, flat year over year, resulting in a gross loss of $21 million as we use hardware as an acquisition tool.
CORPORATE AND OTHER REVENUE
AND GROSS PROFIT
Corporate and Other generated $51 million in revenue and $13 million in gross profit in the first quarter of 2023. Corporate and Other comprised areas outside Square and Cash App, which were primarily TIDAL and intersegment eliminations between Cash App and Square in the first quarter of 2023.
|
|
BLOCK Q1 2023 11 |
We discuss Cash App marketing expenses because a large portion is generated by our peer-to-peer service, which we offer free to our Cash App customers, and we consider it to be a marketing tool to encourage the use of Cash App. In the third quarter of 2022, we reclassified marketing expenses related to our BNPL platform from “Cash App sales and marketing” expenses to “other sales and marketing” expenses. In the first quarter of 2022, this amount was $29 million. Accordingly, year over year “Cash App sales and marketing” and “other sales and marketing” expense growth rates provided in this letter are calculated assuming this reclassification took place in the first quarter of 2022.
OPERATING EXPENSES
Operating expenses were $1.72 billion on a GAAP basis and $1.37 billion on a non-GAAP basis in the first quarter of 2023, up 13% and 22% year over year, respectively. In the first quarter, operating expenses included $37 million of amortization of customer and other acquired intangible assets, the majority of which was from the acquisition of our BNPL platform.
Product development expenses were $627 million on a GAAP basis and $398 million on a non-GAAP basis in the first quarter of 2023, up 37% and 39% year over year, respectively. The increase was driven primarily by headcount and personnel costs related to our engineering, data science, and design teams.
Sales and marketing expenses were $496 million on a GAAP basis and $465 million on a non-GAAP basis in the first quarter of 2023, down 1% and 3% year over year, respectively.
| • | Cash App marketing expenses were up 9% year over year, driven by an increase in peer-to-peer processing costs, related peer-to-peer transaction losses, and card issuance costs. |
| • | Other sales and marketing expenses were down 11% year over year. Other sales and marketing expenses primarily include expenses related to Square, our BNPL platform, and TIDAL. |
General and administrative expenses were $433 million on a GAAP basis, down 3% year over year. Excluding $66 million of acquisition-related accelerated share-based compensation expenses incurred in the first quarter of 2022, general and administrative expenses were up 15% year over year. General and administrative expenses were $362 million on a non-GAAP basis, up 44% year over year. The increase was due primarily to additions to human resources, customer support, and compliance personnel.
|
|
BLOCK Q1 2023 12 |
The accounting rules for bitcoin currently require us to recognize any decreases in market price below carrying value as an impairment charge, with no upward revisions recognized when the market price increases until the sale of that bitcoin. Bitcoin impairment loss is a GAAP expense. Non-GAAP operating expenses exclude bitcoin impairment losses. To determine fair value, Block revalues its bitcoin holdings on a daily basis using the closing price at midnight Coordinated Universal Time (UTC).
Transaction, loan, and consumer receivables losses were $128 million in the first quarter of 2023, up 40% year over year. The increase was driven primarily from growth in Square Loans volumes and Cash App Card transactions. In the first quarter, loss rates for Square GPV, Square Loans, and BNPL consumer receivables remained consistent with historical ranges, and we will continue to monitor trends closely given the dynamic macro environment.
In the fourth quarter of 2020 and first quarter of 2021, we invested $50 million and $170 million, respectively, in bitcoin. As an indefinite-lived intangible asset, bitcoin is subject to impairment losses if the fair value of bitcoin decreases below the carrying value during the assessed period. In the first quarter of 2023, we did not recognize a bitcoin impairment loss. As of March 31, 2023, the fair value of our investment in bitcoin was $229 million based on observable market prices, which was $126 million greater than the carrying value of the investment after cumulative impairment charges.
|
|
BLOCK Q1 2023 13 |
EARNINGS
In the first quarter of 2023, operating loss was $6 million. Adjusted Operating Income was $51 million. Adjusted Operating Income (Loss) is a non-GAAP financial measure that excludes certain expenses that we believe are not reflective of our core operating performance, including amortization of intangible assets, bitcoin impairment losses, acquisition-related accelerated share-based compensation expenses, and acquisition-related, integration, and other costs. We present Adjusted Operating Income (Loss) because we use it to evaluate our operating performance, generate future operating plans, and make strategic decisions.
Please see the reconciliations at the end of this letter for a description of certain items that impacted operating income (loss) in the first quarter of 2023.
|
|
BLOCK Q1 2023 14 |
EARNINGS
In the first quarter of 2023, net loss attributable to common stockholders was $17 million. Net loss per share attributable to common stockholders was $0.03 on a basic and diluted basis in the first quarter of 2023, based on 602 million weighted-average basic and diluted shares outstanding during the first quarter of 2023.
Adjusted EBITDA was $368 million in the first quarter of 2023, compared to $195 million in the first quarter of 2022. The increase in Adjusted EBITDA compared to the prior-year period was driven by gross profit growth across our Cash App and Square ecosystems.
In the first quarter of 2023, Adjusted Net Income Per Share (Adjusted EPS) was $0.40 on a diluted basis based on 627 million weighted-average diluted shares, representing a $0.22 increase year over year.
BALANCE SHEET/CASH FLOW
We ended the first quarter of 2023 with $7.6 billion in available liquidity, with $7.0 billion in cash, cash equivalents, restricted cash, and investments in marketable debt securities, as well as $600 million available to be withdrawn from our revolving credit facility. We believe our available liquidity is sufficient to meet our current obligations, including those that may arise from the 2023 Convertible Notes. Additionally, we had $1.0 billion available to be withdrawn under our warehouse funding facilities, to support funding of growth in our consumer receivables related to our BNPL platform.
In the first quarter of 2023, Adjusted EBITDA contributed positively to our overall liquidity.
Please see the reconciliations at the end of this letter for a description of certain items that impacted net income (loss) in the first quarter of 2023.
|
|
BLOCK Q1 2023 15 |
Trends and Forward-Looking Commentary
| Q1 2023 YoY Growth % |
April 2023 YoY Growth % |
|||
| BUSINESS TRENDS
|
||||
| Gross Profit
|
32% | 24% | ||
| Combined Company Gross Profit* | 27% | 24% | ||
|
|
|
|
Note: The table above presents preliminary gross profit growth estimates for the month of April 2023. These represent our current estimates as we have not yet finalized our financial statements for the month of April, and our monthly and combined company results are not subject to interim review by our auditors. As a result, actual April results may differ from these preliminary estimates.
Given we acquired our BNPL platform on January 31, 2022, through the acquisition of Afterpay, we believe combined company gross profit is more representative of underlying growth trends in the first quarter. *Combined company gross profit is calculated assuming a $51 million gross profit contribution from our BNPL platform in January 2022, as if our BNPL platform had been acquired on January 1, 2022. On a combined company basis, our BNPL platform contributed $143 million of gross profit in the first quarter of 2022. For April 2023, gross profit and combined company gross profit growth rates are calculated on the same basis.
| OPERATING EXPENSES
|
Q2 2023 | QoQ increase ($) |
||
|
Block Non-GAAP Operating Expenses1 |
$1,565M | $200M | ||
|
|
|
|
On a GAAP basis, we currently expect to recognize approximately $55 million in quarterly expenses related to amortization of intangible assets over the next few years, based on the intangible assets as of March 31, 2023. This quarterly expense includes approximately $18 million recognized in cost of sales and approximately $37 million in operating expenses. These amounts may be affected by fluctuations in foreign exchange rates in future periods.
In the second quarter of 2023, we expect our share-based compensation expense to increase quarter over quarter on a dollar basis. These share-based compensation expenses are not included in the aforementioned non-GAAP operating expenses.
| 2023 OUTLOOK
|
Current 2023 |
Previous 2023 |
||||||
| Adjusted EBITDA1 |
$1,360M | $1,300M | ||||||
| Adjusted Operating Income (Loss)1 |
($115M) | ($150M) | ||||||
|
|
|
|
|
|
||||
1. We have not provided the forward-looking GAAP equivalents for certain forward-looking non-GAAP metrics, including Block Non-GAAP Operating Expenses, Adjusted EBITDA, Adjusted EBITDA margin, Adjusted Operating Income (Loss), Adjusted Operating Income margin of any of the aforementioned, as a result of the uncertainty regarding, and the potential variability of, reconciling items such as share-based compensation expense. Accordingly, reconciliations of these non-GAAP guidance metrics to their corresponding GAAP equivalents are not available without unreasonable effort. However, it is important to note that material changes to reconciling items could have a significant effect on future GAAP results. We have provided reconciliations of other historical GAAP to non-GAAP metrics in tables at the end of this letter.
Adjusted EBITDA margin and Adjusted Operating Income margin are both defined by dividing the respective metric taken over a period by gross profit over the same period.
|
|
BLOCK Q1 2023 16 |
MEDIA CONTACT
press@block.xyz
INVESTOR RELATIONS CONTACT
ir@block.xyz
Earnings
Webcast
Block (NYSE:SQ) will host a conference call and earnings webcast at 2:00 p.m. Pacific time/5:00 p.m. Eastern time, May 4, to discuss these financial results. To register to participate in the conference call, or to listen to the live audio webcast, please visit the Events & Presentations section of Block’s Investor Relations website at investors.block.xyz. A replay will be available on the same website following the call.
We will release financial results for the second quarter of 2023 on August 3, 2023, after the market closes, and will also host a conference call and earnings webcast at 2:00 p.m. Pacific time/5:00 p.m. Eastern time on the same day to discuss those financial results.
|
|
|
|
| Jack Dorsey | Amrita Ahuja |
|
|
BLOCK Q1 2023 17 |
|
|
BLOCK Q1 2023 18 |

|
|
BLOCK Q1 2023 19 |
SAFE HARBOR STATEMENT
This letter contains “forward-looking statements” within the meaning of the Safe Harbor provisions of the U.S. Private Securities Litigation Reform Act of 1995. All statements other than statements of historical fact could be deemed forward-looking, including, but not limited to, statements regarding the future performance of Block, Inc. and its consolidated subsidiaries (the Company); the Company’s strategies, including expected impact of such strategies on our customers, actives, and sellers as well as our business and financial performance, expected financial results, guidance, and general business outlook for current and future periods; the Company’s integration of Afterpay into its Square and Cash App businesses, and its impacts on the Company’s business and financial results; future profitability and growth in the Company’s businesses and products and the Company’s ability to drive such profitability and growth; the Company’s expectations regarding scale, economics, and the demand for or benefits from its products, product features, and services; the Company’s product development plans; the ability of the Company’s products to attract and retain customers, particularly in new or different markets or demographics; trends in the Company’s markets and the continuation of such trends; the Company’s expectations and intentions regarding future expenses, including future transaction and loan losses and the Company’s estimated reserves for such losses; the Company’s bitcoin investments and strategy as well as the potential financial impact and volatility; and management’s statements related to business strategy, plans, investments, opportunities, and objectives for future operations. In some cases, forward-looking statements can be identified by terms such as “may,” “will,” “appears,” “should,” “expects,” “plans,” “anticipates,” “could,” “intends,” “target,” “projects,” “contemplates,” “believes,” “estimates,” “predicts,” “potential,” or “continue,” or the negative of these words or other similar terms or expressions that concern our expectations, strategy, plans, or intentions.
Such statements are subject to a number of known and unknown risks, uncertainties, assumptions, and other factors that may cause the Company’s actual results, performance, or achievements to differ materially from results expressed or implied in this letter. Investors are cautioned not to place undue reliance on these statements, and reported results should not be considered as an indication of future performance.
Risks that contribute to the uncertain nature of the forward-looking statements include, among others, a continued or prolonged economic downturn in the United States and in other countries around the world; the Company’s investments in its business and ability to maintain profitability; the Company’s efforts to expand its product portfolio and market reach; the Company’s ability to develop products and services to address the rapidly evolving market for payments and financial services; the Company’s ability to deal with the substantial and increasingly intense competition in its industry; acquisitions, strategic investments, entries into new businesses, joint ventures, divestitures, and other transactions that the Company may undertake; the integration of Afterpay; the Company’s ability to ensure the integration of its services with a variety of operating systems and the interoperability of its technology with that of third parties; the Company’s ability to retain existing customers, attract new customers, and increase sales to all customers; the Company’s dependence on payment card networks and acquiring processors; our participation in government relief programs set up in response to the COVID-19 pandemic; the effect of extensive regulation and oversight related to the Company’s business in a variety of areas; risks related to the banking ecosystem, including through our bank partnerships, and FDIC and other regulatory obligations; the effect of management changes and business initiatives; the liabilities and loss potential associated with new products, product features, and services; litigation, including intellectual property claims, government investigations or inquiries, and regulatory matters or disputes; adoption of the Company’s products and services in international markets; changes in political, business, and economic conditions; as well as other risks listed or described from time to time in the Company’s filings with the Securities and Exchange Commission (the SEC), including the Company’s Annual Report on Form 10-K for the fiscal year ended December 31, 2022, which are on file with the SEC and available on the Investor Relations page of the Company’s website. Additional information will also be set forth in the Company’s Quarterly Report on Form 10-Q for the quarter ended March 31, 2023. All forward-looking statements represent management’s current expectations and predictions regarding trends affecting the Company’s business and industry and are based on information and estimates available to the Company at the time of this letter and are not guarantees of future performance. Except as required by law, the Company assumes no obligation to update any of the statements in this letter.
|
|
BLOCK Q1 2023 20 |
KEY OPERATING METRICS AND
NON-GAAP FINANCIAL MEASURES
To supplement our financial information presented in accordance with generally accepted accounting principles in the United States (GAAP), from period to period, we consider and present certain operating and financial measures that we consider key metrics or are not prepared in accordance with GAAP, including Gross Payment Volume (GPV), Adjusted EBITDA, Adjusted EBITDA margin, Adjusted Net Income (Loss), Diluted Adjusted Net Income (Loss) Per Share (Adjusted EPS), Adjusted Operating Income (Loss), constant currency, and non-GAAP operating expenses as well as other measures defined in this letter such as measures excluding bitcoin revenue, measures excluding gross profit contributions from our BNPL platform, measures excluding acquisition-related share-based compensation, measures excluding PPP loan forgiveness revenue and gross profit, and Block combined company gross profit. We believe these metrics and measures are useful to facilitate period-to-period comparisons of our business and to facilitate comparisons of our performance to that of other payments solution providers.
We define GPV as the total dollar amount of all card payments processed by sellers using Square, net of refunds, and ACH transfers. Additionally, GPV includes Cash App Business GPV, which comprises Cash App activity related to peer-to-peer transactions received by business accounts, and peer-to-peer payments sent from a credit card. GPV does not include BNPL transactions.
Adjusted EBITDA, Adjusted EBITDA margin, Adjusted Net Income (Loss), and Diluted Adjusted Net Income (Loss) Per Share (Adjusted EPS) are non-GAAP financial measures that represent our net income (loss) and net income (loss) per share, adjusted to eliminate the effect of share-based compensation expenses; amortization of intangible assets; gain or loss on revaluation of equity investments; bitcoin impairment losses; amortization of debt discount and issuance costs; and the gain or loss on the disposal of property and equipment, as applicable. Adjusted Operating Income (Loss) is a non-GAAP financial measure that represents our operating income (loss), adjusted to eliminate the effect of amortization of acquired technology assets, acquisition-related, integration and other costs, bitcoin impairment losses, amortization of customer and other acquired intangible assets, and acquisition related share-based acceleration costs. We also exclude certain acquisition-related and integration costs associated with business combinations, and various other costs that are not reflective of our core operating performance. We exclude amortization of intangible assets arising from business combinations because the amount of such expenses in any specific period may not directly correlate to the underlying performance of our ongoing business operations. Acquisition-related costs include amounts paid to redeem acquirees’ unvested stock-based compensation awards, and legal, accounting, and due diligence costs. Integration costs include advisory and other professional services or consulting fees necessary to integrate acquired businesses. Other costs that are non-recurring operating expenses may include contingent losses, certain litigation, and regulatory charges. We also add back the impact of the acquired deferred revenue and deferred cost adjustment, which was written down to fair value in purchase accounting. Additionally, for purposes of calculating diluted Adjusted EPS, we add back cash interest expense on convertible senior notes, as if converted at the beginning of the period, if the impact is dilutive. In addition to the items above, Adjusted EBITDA is a non-GAAP financial measure that also excludes depreciation and amortization, interest income and expense, other income and expense, and provision or benefit from income taxes, as applicable. Adjusted EBITDA margin is calculated as Adjusted EBITDA divided by gross profit. To calculate the diluted Adjusted EPS, we adjust the weighted-average number of shares of common stock outstanding for the dilutive effect of all potential shares of common stock. In periods when we
recorded an Adjusted Net Loss, the diluted Adjusted EPS is the same as basic Adjusted EPS because the effects of potentially dilutive items were anti-dilutive given the Adjusted Net Loss position.
Constant currency growth is calculated by assuming international results in a given period and the comparative prior period are translated from local currencies to the U.S. dollar at rates consistent with the monthly average rates in the comparative prior period. We discuss growth on a constant currency basis because a portion of our business operates in markets outside the U.S. and is subject to changes in foreign exchange rates.
Non-GAAP operating expenses is a non-GAAP financial measure that represents operating expenses adjusted to remove the impact of share-based compensation, depreciation and amortization, bitcoin impairment losses, loss on disposal of property and equipment, and acquisition-related integration and other costs.
We have included Adjusted EBITDA, Adjusted Operating Income (Loss), Adjusted Net Income, Adjusted EPS, and non-GAAP operating expenses because they are key measures used by our management to evaluate our operating performance, generate future operating plans, and make strategic decisions, including those relating to operating expenses and the allocation of internal resources. Accordingly, we believe that Adjusted EBITDA, Adjusted Operating Income (Loss), Adjusted Net Income, Adjusted EPS, and non-GAAP operating expenses provide useful information to investors and others in understanding and evaluating our operating results in the same manner as our management and board of directors. In addition, they provide useful measures for period-to-period comparisons of our business, as they remove the effect of certain non-cash items and certain variable charges that do not vary with our operations. We have included measures excluding our BNPL platform or acquisition-related share based compensation because we believe these measures are useful in understanding the ongoing results of our operations. We have included measures excluding bitcoin revenue because our role is to facilitate customers’ access to bitcoin. When customers buy bitcoin through Cash App, we only apply a small margin to the market cost of bitcoin, which tends to be volatile and outside our control. Therefore, we believe deducting bitcoin revenue or gross profit better reflects the economic benefits as well as our performance from these transactions. We have included measures excluding PPP loan forgiveness revenue and gross profit because we believe these measures are useful in order to facilitate comparisons of our business without PPP loan forgiveness.
Adjusted EBITDA, Adjusted Net Income, Adjusted Operating Income (Loss), Adjusted EPS, and non-GAAP operating expenses, combined company gross profit, as well as other measures defined in the shareholder letter, such as measures excluding our BNPL platform, bitcoin revenue or gross profit, PPP loan forgiveness revenue and gross profit, bitcoin impairment losses, and measures excluding acquisition-related share-based compensation, have limitations as financial measures, should be considered as supplemental in nature, and are not meant as substitutes for the related financial information prepared in accordance with GAAP.
|
|
BLOCK Q1 2023 21 |
KEY OPERATING METRICS AND
NON-GAAP FINANCIAL MEASURES
We believe that the aforementioned metrics and measures provide useful information about our operating results, enhance the overall understanding of our past performance and future prospects, and provide useful measures for period-to-period comparisons of our business, as they remove the effect of certain variable amounts, or they remove amounts that were not repeated across periods and therefore make comparisons more difficult. Our management uses these measures to evaluate our operating performance, generate future operating plans, and make strategic decisions, including those relating to operating expenses and the allocation of internal resources.
These non-GAAP financial measures should not be considered in isolation from, or as a substitute for, financial information prepared in accordance with GAAP. These non-GAAP financial measures are not based on any standardized methodology prescribed by GAAP. Other companies, including companies in our industry, may calculate the non-GAAP financial measures differently or not at all, which reduces their usefulness as comparative measures.
|
|
BLOCK Q1 2023 22 |
Condensed Consolidated
Statements of Operations
UNAUDITED
In thousands, except per share data
| THREE MONTHS ENDED | ||||||||
| Mar 31, 2023 | Mar 31, 2022 | |||||||
| Revenue: |
||||||||
| Transaction-based revenue |
$ | 1,422,705 | $ | 1,232,969 | ||||
| Subscription and services-based revenue |
1,366,224 | 959,557 | ||||||
| Hardware revenue |
37,451 | 37,326 | ||||||
| Bitcoin revenue |
2,163,751 | 1,730,793 | ||||||
|
|
|
|
||||||
| Total net revenue |
4,990,131 | 3,960,645 | ||||||
|
|
|
|
||||||
| Cost of revenue: |
||||||||
| Transaction-based costs |
820,787 | 716,236 | ||||||
| Subscription and services-based costs |
264,092 | 182,857 | ||||||
| Hardware costs |
58,785 | 63,664 | ||||||
| Bitcoin costs |
2,113,375 | 1,687,459 | ||||||
| Amortization of acquired technology assets |
18,508 | 15,469 | ||||||
|
|
|
|
||||||
| Total cost of revenue |
3,275,547 | 2,665,685 | ||||||
|
|
|
|
||||||
| Gross profit |
1,714,584 | 1,294,960 | ||||||
|
|
|
|
||||||
| Operating expenses: |
||||||||
| Product development |
626,937 | 458,224 | ||||||
| Sales and marketing |
496,011 | 501,562 | ||||||
| General and administrative |
432,825 | 444,149 | ||||||
| Transaction, loan, and consumer receivable losses |
127,896 | 91,150 | ||||||
| Amortization of customer and other acquired intangible assets |
37,087 | 26,664 | ||||||
| Total operating expenses |
1,725,756 | 1,521,749 | ||||||
|
|
|
|
||||||
| Operating loss |
(6,172) | (226,789) | ||||||
|
|
|
|
||||||
| Interest expense (income), net |
(3,161) | 15,748 | ||||||
| Other expense (income), net |
18,371 | (33,472) | ||||||
|
|
|
|
||||||
| Loss before income tax |
(21,382) | (209,065) | ||||||
|
|
|
|
||||||
| Benefit for income taxes |
(2,056) | (1,702) | ||||||
|
|
|
|
||||||
| Net loss |
(19,326) | (207,363) | ||||||
| Less: Net loss attributable to noncontrolling interests |
(2,488) | (3,164) | ||||||
|
|
|
|
||||||
| Net loss attributable to common stockholders |
$ | (16,838) | $ | (204,199) | ||||
|
|
|
|
||||||
| Net loss per share attributable to common stockholders: |
||||||||
| Basic |
$ | (0.03) | $ | (0.38) | ||||
|
|
|
|
||||||
| Diluted |
$ | (0.03) | $ | (0.38) | ||||
|
|
|
|
||||||
| Weighted-average shares used to compute net loss per share attributable to common stockholders: |
||||||||
| Basic |
602,234 | 541,435 | ||||||
|
|
|
|
||||||
| Diluted |
602,234 | 541,435 | ||||||
|
|
|
|
||||||
|
|
BLOCK Q1 2023 23 |
Condensed Consolidated
Balance Sheets
In thousands, except per share data
| Mar 31, 2023 | Dec 31, 2022 | |||||||
| Assets | UNAUDITED | |||||||
| Current assets: |
||||||||
| Cash and cash equivalents |
$ | 5,061,091 | $ | 4,544,202 | ||||
| Investments in short-term debt securities |
1,024,110 | 1,081,851 | ||||||
| Settlements receivable |
1,897,835 | 2,416,324 | ||||||
| Customer funds |
3,800,473 | 3,180,324 | ||||||
| Consumer receivables, net |
1,486,511 | 1,871,160 | ||||||
| Loans held for sale |
476,754 | 474,036 | ||||||
| Safeguarding asset related to bitcoin held for other parties |
726,495 | 428,243 | ||||||
| Other current assets |
1,427,210 | 1,627,265 | ||||||
|
|
|
|
||||||
| Total current assets |
15,900,479 | 15,623,405 | ||||||
|
|
|
|
||||||
| Goodwill |
11,919,274 | 11,966,761 | ||||||
| Acquired intangible assets, net |
1,949,086 | 2,014,034 | ||||||
| Investments in long-term debt securities |
412,747 | 573,429 | ||||||
| Operating lease right-of-use assets |
344,229 | 373,172 | ||||||
| Other non-current assets |
811,512 | 813,539 | ||||||
|
|
|
|
||||||
| Total assets |
$ | 31,337,327 | $ | 31,364,340 | ||||
|
|
|
|
||||||
| Liabilities and Stockholders’ Equity |
||||||||
| Current liabilities: |
||||||||
| Customers payable |
$ | 5,749,857 | $ | 5,548,656 | ||||
| Settlements payable |
397,977 | 462,505 | ||||||
| Accrued expenses and other current liabilities |
1,066,203 | 1,073,516 | ||||||
| Current portion of long-term debt (Note 13) |
460,539 | 460,356 | ||||||
| Warehouse funding facilities, current |
305,195 | 461,240 | ||||||
| Safeguarding obligation liability related to bitcoin held for other parties |
726,495 | 428,243 | ||||||
|
|
|
|
||||||
| Total current liabilities |
8,706,266 | 8,434,516 | ||||||
|
|
|
|
||||||
| Warehouse funding facilities, non-current |
384,998 | 877,066 | ||||||
| Long-term debt (Note 13) |
4,112,356 | 4,109,829 | ||||||
| Operating lease liabilities, non-current |
329,196 | 357,419 | ||||||
| Other non-current liabilities |
329,626 | 334,155 | ||||||
|
|
|
|
||||||
| Total liabilities |
13,862,442 | 14,112,985 | ||||||
|
|
|
|
||||||
| Commitments and contingencies (Note 18) |
||||||||
| Stockholders’ equity: |
||||||||
| Preferred stock, $0.0000001 par value: 100,000 shares authorized at March 31, 2023 and December 31, 2022. None issued and outstanding at March 31, 2023 and December 31, 2022. |
— | — | ||||||
| Class A common stock, $0.0000001 par value: 1,000,000 shares authorized at March 31, 2023 and December 31, 2022; 542,757 and 539,408 issued and outstanding at March 31, 2023 and December 31, 2022, respectively. |
— | — | ||||||
| Class B common stock, $0.0000001 par value: 500,000 shares authorized at March 31, 2023 and December 31, 2022; 60,636 and 60,652 issued and outstanding at March 31, 2023 and December 31, 2022, respectively. |
— | — | ||||||
| Additional paid-in capital |
18,607,008 | 18,314,681 | ||||||
| Accumulated other comprehensive loss |
(572,561) | (523,090) | ||||||
| Accumulated deficit |
(585,550) | (568,712) | ||||||
|
|
|
|
||||||
| Total stockholders’ equity attributable to common stockholders |
17,448,897 | 17,222,879 | ||||||
| Noncontrolling interests |
25,988 | 28,476 | ||||||
|
|
|
|
||||||
| Total stockholders’ equity |
17,474,885 | 17,251,355 | ||||||
|
|
|
|
||||||
| Total liabilities and stockholders’ equity |
$ | 31,337,327 | $ | 31,364,340 | ||||
|
|
|
|
||||||
|
|
BLOCK Q1 2023 24 |
Condensed Consolidated
Statements of Cash Flows
UNAUDITED
In thousands
| THREE MONTHS ENDED | ||||||||
| Mar 31, 2023 | Mar 31, 2022 | |||||||
| Cash Flows from Operating Activities |
||||||||
| Net loss |
$ | (19,326) | $ | (207,363) | ||||
| Adjustments to reconcile net loss to net cash provided by operating activities: |
||||||||
| Depreciation and amortization |
93,173 | 70,056 | ||||||
| Amortization of discounts and premiums and other non-cash adjustments |
(85,314) | (64,351) | ||||||
| Non-cash lease expense |
24,333 | 22,696 | ||||||
| Share-based compensation |
279,592 | 275,423 | ||||||
| Loss (gain) on revaluation of equity investments |
14,885 | (49,741) | ||||||
| Transaction, loan, and consumer receivable losses |
127,896 | 91,150 | ||||||
| Change in deferred income taxes |
1,353 | (7,653) | ||||||
| Changes in operating assets and liabilities: |
||||||||
| Settlements receivable |
452,868 | (220,361) | ||||||
| Purchases and originations of loans |
(1,834,442) | (951,665) | ||||||
| Proceeds from payments and forgiveness of loans |
1,753,515 | 1,112,266 | ||||||
| Customers payable |
(418,948) | 136,474 | ||||||
| Settlements payable |
(64,528) | 10,360 | ||||||
| Other assets and liabilities |
(30,656) | 12,132 | ||||||
|
|
|
|
||||||
| Net cash provided by operating activities |
294,401 | 229,423 | ||||||
|
|
|
|
||||||
| Cash Flows from Investing Activities |
||||||||
| Purchases of marketable debt securities |
(56,761) | (209,981) | ||||||
| Proceeds from maturities of marketable debt securities |
273,771 | 262,559 | ||||||
| Proceeds from sale of marketable debt securities |
15,697 | 178,352 | ||||||
| Proceeds from maturities of marketable debt securities from customer funds |
— | 73,000 | ||||||
| Proceeds from sale of marketable debt securities from customer funds |
— | 316,576 | ||||||
| Payments from originations of consumer receivables |
(4,911,509) | (1,946,468) | ||||||
| Proceeds from principal repayments and sales of consumer receivables |
5,339,800 | 1,943,554 | ||||||
| Purchases of property and equipment |
(32,253) | (41,187) | ||||||
| Purchases of other investments |
(4,821) | (16,495) | ||||||
| Business combinations, net of cash acquired |
— | 570,703 | ||||||
|
|
|
|
||||||
| Net cash provided by investing activities |
623,924 | 1,130,613 | ||||||
|
|
|
|
||||||
| Cash Flows from Financing Activities |
||||||||
| Repayments of PPP Liquidity Facility advances |
(5,077) | (372,897) | ||||||
| Payments to redeem convertible notes |
— | (1,071,788) | ||||||
| Proceeds from warehouse facilities borrowings |
47,975 | 183,440 | ||||||
| Repayments of warehouse facilities borrowings |
(692,556) | (90,491) | ||||||
| Proceeds from the exercise of stock options and purchases under the employee stock purchase plan |
6,825 | 4,093 | ||||||
| Payments for tax withholding related to vesting of restricted stock units |
— | (2,456) | ||||||
| Net increase in interest-bearing deposits |
13,601 | 21,633 | ||||||
| Change in customer funds, restricted from use in the Company’s operations |
620,149 | 359,910 | ||||||
|
|
|
|
||||||
| Net cash used in financing activities |
(9,083) | (968,556) | ||||||
|
|
|
|
||||||
| Effect of foreign exchange rate on cash and cash equivalents |
1,033 | (948) | ||||||
|
|
|
|
||||||
| Net increase in cash, cash equivalents, restricted cash, and customer funds |
910,275 | 390,532 | ||||||
| Cash, cash equivalents, restricted cash, and customer funds, beginning of the year |
8,435,906 | 6,975,090 | ||||||
|
|
|
|
||||||
| Cash, cash equivalents, restricted cash, and customer funds, end of the year |
$ | 9,346,181 | $ | 7,365,622 | ||||
|
|
|
|
||||||
|
|
BLOCK Q1 2023 25 |
Reportable Segment Disclosures
Information on the reportable segments revenue and segment operating profit are
as follows (in thousands):
| THREE MONTHS ENDED | ||||||||||||||||
| MAR 31, 2023 | ||||||||||||||||
| (UNAUDITED) | ||||||||||||||||
| Cash App
|
Square
|
Corporate and Other(i) |
Total
|
|||||||||||||
| Revenue |
||||||||||||||||
| Transaction-based revenue |
$ | 134,663 | $ | 1,288,042 | $ | — | $ | 1,422,705 | ||||||||
| Subscription and services-based revenue |
973,891 | 341,741 | 50,592 | 1,366,224 | ||||||||||||
| Hardware revenue |
— | 37,451 | — | 37,451 | ||||||||||||
| Bitcoin revenue |
2,163,751 | — | — | 2,163,751 | ||||||||||||
|
|
|
|
|
|
|
|
|
|
||||||||
| Segment revenue |
3,272,305 | 1,667,234 | 50,592 | 4,990,131 | ||||||||||||
|
|
|
|
|
|
|
|
|
|
||||||||
| Segment gross profit (ii) |
$ | 931,240 | $ | 770,275 | $ | 13,069 | $ | 1,714,584 | ||||||||
|
|
|
|
|
|
|
|
|
|
||||||||
| THREE MONTHS ENDED | ||||||||||||||||
| MAR 31, 2022 | ||||||||||||||||
| (UNAUDITED) | ||||||||||||||||
| Cash App
|
Square
|
Corporate and Other(i) |
Total
|
|||||||||||||
| Revenue |
||||||||||||||||
| Transaction-based revenue |
$ | 109,241 | $ | 1,123,728 | $ | — | $ | 1,232,969 | ||||||||
| Subscription and services-based revenue |
622,309 | 282,650 | 54,598 | 959,557 | ||||||||||||
| Hardware revenue |
— | 37,326 | — | 37,326 | ||||||||||||
| Bitcoin revenue |
1,730,793 | — | — | 1,730,793 | ||||||||||||
|
|
|
|
|
|
|
|
|
|
||||||||
| Segment revenue |
2,462,343 | 1,443,704 | 54,598 | 3,960,645 | ||||||||||||
|
|
|
|
|
|
|
|
|
|
||||||||
| Segment gross profit (ii) |
$ | 623,659 | $ | 661,221 | $ | 10,080 | $ | 1,294,960 | ||||||||
|
|
|
|
|
|
|
|
|
|
||||||||
(i) Corporate and other represents results related to products and services that are not assigned to a specific reportable segment, and intersegment eliminations between Cash App and Square.
(ii) Segment gross profit for Cash App for the three months ended March 31, 2023 and March 31, 2022 included $8.5 million and $7.0 million of amortization of acquired technology assets expense, respectively. Segment gross profit for Square for the three months ended and March 31, 2023 and March 31, 2022 included $8.6 million and $7.0 million of amortization of acquired technology assets expense, respectively. Amortization of acquired technology assets expense included in Corporate and Other was immaterial for the three months ended March 31, 2023 and March 31, 2022.
|
|
BLOCK Q1 2023 26 |
Operating Segment Disclosures
A reconciliation of total segment gross profit to the Company’s income (loss)
before applicable income taxes is as follows (in thousands):
| THREE MONTHS ENDED | ||||||||
| (UNAUDITED) | ||||||||
| Mar 31, 2023 | Mar 31, 2022 | |||||||
| Total segment gross profit |
$ | 1,714,584 | $ | 1,294,960 | ||||
| Less: Product development |
626,937 | 458,224 | ||||||
| Less: Sales and marketing |
496,011 | 501,562 | ||||||
| Less: General and administrative |
432,825 | 444,149 | ||||||
| Less: Transaction, loan, and consumer receivable losses |
127,896 | 91,150 | ||||||
| Less: Amortization of customer and other intangible assets |
37,087 | 26,664 | ||||||
| Less: Interest expense (income), net |
(3,161 | ) | 15,748 | |||||
| Less: Other expense (income), net |
18,371 | (33,472 | ) | |||||
|
|
|
|
||||||
| Loss before applicable income taxes |
$ | (21,382 | ) | $ | (209,065 | ) | ||
|
|
|
|
||||||
Key Operating Metrics and
Non-GAAP Financial Measures
UNAUDITED
In thousands, except GPV and per share data
| THREE MONTHS ENDED | ||||||||
| Mar 31, 2023 | Mar 31, 2022 | |||||||
| Gross Payment Volume (“GPV”) (in millions) |
$ | 51,117 | $ | 43,504 | ||||
| Adjusted EBITDA (in thousands) |
$ | 368,367 | $ | 195,361 | ||||
| Adjusted Operating Income (in thousands) |
$ | 50,974 | $ | (42,254 | ) | |||
| Adjusted Net Income Per Share: |
||||||||
| Basic |
$ | 0.42 | $ | 0.19 | ||||
| Diluted |
$ | 0.40 | $ | 0.18 | ||||
| THREE MONTHS ENDED | ||||||||
| Mar 31, 2023 | Mar 31, 2022 | |||||||
| GPV Square |
$ | 46,220 | $ | 39,544 | ||||
| GPV Cash App Business |
4,897 | 3,960 | ||||||
|
|
|
|
||||||
| Total GPV |
$ | 51,117 | $ | 43,504 | ||||
|
|
|
|
||||||
|
|
BLOCK Q1 2023 27 |
Adjusted EBITDA
UNAUDITED
In thousands
| THREE MONTHS ENDED |
||||||||||||||||||||
| Mar 31, 2023 | Mar 31, 2022 | June 30, 2022 | Sept 30, 2022 | Dec 31, 2022 | ||||||||||||||||
| Net loss attributable to common stockholders |
$ | (16,838) | $ | (204,199) | $ | (208,014) | $ | (14,711) | $ | (113,823) | ||||||||||
| Net loss attributable to noncontrolling interests |
(2,488) | (3,164) | (1,263) | (4,033) | (3,798) | |||||||||||||||
|
|
|
|
|
|
|
|
|
|
||||||||||||
| Net loss |
(19,326) | (207,363) | (209,277) | (18,744) | (117,621) | |||||||||||||||
| Share-based compensation expense |
279,591 | 275,423 | 256,638 | 262,733 | 274,495 | |||||||||||||||
| Depreciation and amortization |
93,173 | 70,056 | 90,839 | 88,721 | 90,907 | |||||||||||||||
| Acquisition-related, integration, and other costs |
1,551 | 76,065 | 17,067 | 23,470 | 40,662 | |||||||||||||||
| Interest expense (income), net |
(3,161) | 15,748 | 12,966 | 6,042 | 1,472 | |||||||||||||||
| Other expense (income), net |
18,371 | (33,472) | (18,766) | (18,798) | (24,407) | |||||||||||||||
| Bitcoin impairment losses |
— | — | 35,961 | 1,619 | 8,991 | |||||||||||||||
| Provision (benefit) for income taxes |
(2,056) | (1,702) | 1,304 | (17,289) | 5,375 | |||||||||||||||
| Loss on disposal of property and equipment |
191 | 534 | 548 | (447) | 984 | |||||||||||||||
| Acquired deferred revenue and cost adjustment |
33 | 72 | 62 | 53 | 43 | |||||||||||||||
|
|
|
|
||||||||||||||||||
| Adjusted EBITDA |
$ | 368,367 | $ | 195,361 | $ | 187,342 | $ | 327,360 | $ | 280,901 | ||||||||||
|
|
|
|
||||||||||||||||||
Adjusted Operating Income (Loss)
UNAUDITED
In thousands
| THREE MONTHS ENDED |
||||||||||||||||||||
| Mar 31, 2023 | Mar 31, 2022 | June 30, 2022 | Sept 30, 2022 | Dec 31, 2022 | ||||||||||||||||
| Operating loss |
$ | (6,172) | $ | (226,789) | $ | (213,773) | $ | (48,789) | $ | (135,181) | ||||||||||
| Amortization of acquired technology assets |
18,508 | 15,469 | 17,899 | 18,506 | 18,320 | |||||||||||||||
| Acquisition-related, integration and other costs |
1,551 | 76,065 | 17,067 | 23,470 | 40,662 | |||||||||||||||
| Bitcoin Impairment losses |
— | — | 35,961 | 1,619 | 8,991 | |||||||||||||||
| Amortization of customer and other acquired intangible assets |
37,087 | 26,664 | 39,389 | 37,361 | 35,344 | |||||||||||||||
| Acquisition-related share-based acceleration costs |
$ | — | $ | 66,337 | $ | — | $ | — | $ | — | ||||||||||
|
|
|
|
||||||||||||||||||
| Adjusted Operating Income (Loss) |
$ | 50,974 | $ | (42,254) | $ | (103,457) | $ | 32,167 | $ | (31,864) | ||||||||||
|
|
|
|
||||||||||||||||||
|
|
BLOCK Q1 2023 28 |
Select Financial Results
Excluding Bitcoin and PPP
UNAUDITED
In thousands
| THREE MONTHS ENDED |
||||||||
| Mar 31, 2023 | Mar 31, 2022 | |||||||
| Bitcoin revenue |
$ | 2,163,751 | $ | 1,730,793 | ||||
| Bitcoin costs |
2,113,375 | 1,687,459 | ||||||
|
|
|
|
||||||
| Bitcoin gross profit |
$ | 50,376 | $ | 43,334 | ||||
|
|
|
|
||||||
| THREE MONTHS ENDED | ||||||||
| Mar 31, 2023 | Mar 31, 2022 | |||||||
| Revenue |
$ | 4,990,131 | $ | 3,960,645 | ||||
| Less: Bitcoin revenue |
2,163,751 | 1,730,793 | ||||||
|
|
|
|
||||||
| Total revenue less excluding bitcoin |
$ | 2,826,380 | $ | 2,229,852 | ||||
|
|
|
|
||||||
| THREE MONTHS ENDED | ||||||||
| Mar 31, 2023 | Mar 31, 2022 | |||||||
| Cash App revenue (GAAP) |
$ | 3,272,305 | $ | 2,462,343 | ||||
| Less: Bitcoin contribution to Cash App revenue |
2,163,751 | 1,730,793 | ||||||
|
|
|
|
||||||
| Total Cash App revenue, excluding Bitcoin |
$ | 1,108,554 | $ | 731,550 | ||||
|
|
|
|
||||||
| THREE MONTHS ENDED | ||||||||
| Mar 31, 2023 | Mar 31, 2022 | |||||||
| Square gross profit (GAAP) |
$ | 770,275 | $ | 661,221 | ||||
| Less: Square gross profit – U.S. |
647,930 | 575,467 | ||||||
|
|
|
|
||||||
| Total Square gross profit – International |
$ | 122,345 | $ | 85,754 | ||||
| Less: BNPL Platform contribution to Square gross |
47,628 | 27,587 | ||||||
| profit – Interntional |
||||||||
|
|
|
|
||||||
| Total Square gross profit – International, excluding BNPL Platform |
$ | 74,717 | $ | 58,167 | ||||
|
|
|
|
||||||
| THREE MONTHS ENDED | ||||||||
| Mar 31, 2023 | Mar 31, 2022 | |||||||
| Square gross profit (GAAP) |
$ | 770,275 | $ | 661,221 | ||||
| Less: gross profit from Paycheck Protection Program (PPP) loan forgiveness |
693 | 51,454 | ||||||
|
|
|
|
||||||
| Square gross profit excluding loan forgiveness from Paycheck Protection Program (PPP) |
$ | 769,582 | $ | 609,767 | ||||
|
|
|
|
||||||
| THREE MONTHS ENDED | ||||||||
| Mar 31, 2023 | Mar 31, 2022 | |||||||
| Square subscription and services-based revenue |
$ | 341,741 | $ | 282,650 | ||||
| Less: revenue from Paycheck Protection Program (PPP) loan forgiveness |
693 | 51,454 | ||||||
|
|
|
|
||||||
| Square subscription and services-based revenue excluding loan forgiveness from Paycheck Protection Program (PPP) |
$ | 341,048 | $ | 231,196 | ||||
|
|
|
|
||||||
|
|
BLOCK Q1 2023 29 |
Combined Company Reporting and
Excluding Acquisition Related SBC
UNAUDITED
In thousands
| THREE MONTHS ENDED | ||||||||
| Mar 31, 2023 | Mar 31, 2022 | |||||||
| Gross profit |
$ | 1,714,584 | $ | 1,294,960 | ||||
| Assumed BNPL gross profit January 2022 |
— | 50,700 | ||||||
|
|
|
|
||||||
| Gross profit including BNPL gross profit January 2022 |
$ | 1,714,584 | $ | 1,345,660 | ||||
|
|
|
|
||||||
| THREE MONTHS ENDED | ||||||||
| Mar 31, 2023 | Mar 31, 2022 | |||||||
| Operating expenses (GAAP) |
$ | 1,720,756 | $ | 1,521,749 | ||||
| Less: acquisition-related share based costs |
— | 66,337 | ||||||
|
|
|
|
||||||
| Opex ex acquisition related SBC |
$ | 1,720,756 | $ | 1,455,412 | ||||
|
|
|
|
||||||
| THREE MONTHS ENDED | ||||||||
| Mar 31, 2023 | Mar 31, 2022 | |||||||
| General and administrative (GAAP) |
$ | 432,825 | $ | 444,149 | ||||
| Less: acquisition-related share based costs |
— | 66,337 | ||||||
|
|
|
|
||||||
| Opex ex acquisition related SBC |
$ | 432,825 | $ | 377,812 | ||||
|
|
|
|
||||||
|
|
BLOCK Q1 2023 30 |
Adjusted Net Income
and Adjusted EPS
UNAUDITED
In thousands, except per share data
| THREE MONTHS ENDED | ||||||||
| Mar 31, 2023 | Mar 31, 2022 | |||||||
| Net loss attributable to common stockholders |
$ | (16,838) | $ | (204,199) | ||||
| Net loss attributable to noncontrolling interests |
(2,488) | (3,164) | ||||||
|
|
|
|
||||||
| Net loss |
(19,326) | (207,363) | ||||||
| Share-based compensation expense |
279,591 | 275,423 | ||||||
| Acquisition-related, integration and other costs |
1,551) | 76,065 | ||||||
| Amortization of intangible assets |
55,595 | 42,160 | ||||||
| Amortization of debt discount and issuance costs |
2,949 | 3,630 | ||||||
| Loss (gain) on revaluation of equity investments |
14,885 | (49,741) | ||||||
| Loss on disposal of property and equipment |
191 | 534 | ||||||
| Acquired deferred revenue and cost adjustment |
33 | 72 | ||||||
| Tax effect of non-GAAP net income adjustments |
$ | (84,607) | (38,326) | |||||
| Adjusted Net Income (Loss) - basic |
$ | 250,862 | $ | 102,454 | ||||
|
|
|
|
||||||
| Cash interest expense on convertible notes |
$ | 1,236 | $ | 1,241 | ||||
|
|
|
|
||||||
| Adjusted Net Income - diluted |
$ | 252,098 | $ | 103,695 | ||||
|
|
|
|
||||||
| Weighted-average shares used to compute net income per share attributable to common stockholders: |
||||||||
| Basic |
602,234 | 541,435 | ||||||
|
|
|
|
||||||
| Diluted |
602,234 | 541,435 | ||||||
|
|
|
|
||||||
| Net loss per share attributable to common stockholders: |
||||||||
| Basic |
$ | (0.03) | $ | (0.38) | ||||
|
|
|
|
||||||
| Diluted |
$ | (0.03) | $ | (0.38) | ||||
|
|
|
|
||||||
| Weighted-average shares used to compute Adjusted Net Income Per Share: |
||||||||
| Basic |
602,234 | 541,435 | ||||||
|
|
|
|
||||||
| Diluted |
627,423 | 583,452 | ||||||
|
|
|
|
||||||
| Adjusted Net Income Per Share: |
||||||||
| Basic |
$ | 0.42 | $ | 0.19 | ||||
|
|
|
|
||||||
| Diluted |
$ | 0.40 | $ | 0.18 | ||||
|
|
|
|
||||||
|
|
BLOCK Q1 2023 31 |
Non-GAAP Operating Expenses
UNAUDITED
In thousands
| THREE MONTHS ENDED | ||||||||
| Mar 31, 2023 | Mar 31, 2022 | |||||||
| Operating expenses |
$ | (1,720,756) | $ | (1,521,749) | ||||
| Share-based compensation |
279,449 | 275,314 | ||||||
| Depreciation and amortization |
73,951 | 54,587 | ||||||
| Loss on disposal of property and equipment |
191 | 534 | ||||||
| Acquisition related, integration and other costs |
1,551 | 76,065 | ||||||
|
|
|
|
||||||
| Non-GAAP operating expenses |
$ | (1,365,614) | $ | (1,115,249) | ||||
|
|
|
|
||||||
| Product development |
$ | (626,937) | $ | (458,224) | ||||
| Share-based compensation |
197,857 | 145,075 | ||||||
| Depreciation and amortization |
30,537 | 26,851 | ||||||
| Loss (gain) on disposal of property and equipment |
324 | (19) | ||||||
|
|
|
|
||||||
| Non-GAAP product development |
$ | (398,219) | $ | (286,317) | ||||
|
|
|
|
||||||
| Sales and marketing |
$ | (496,011) | $ | (501,562) | ||||
| Share-based compensation |
29,365 | 21,256 | ||||||
| Depreciation and amortization |
1,458 | 1,491 | ||||||
| Loss on disposal of property and equipment |
— | 420 | ||||||
|
|
|
|
||||||
| Non-GAAP sales and marketing |
$ | (465,188) | $ | (478,395) | ||||
|
|
|
|
||||||
| General and administrative |
$ | (432,825) | $ | (444,149) | ||||
| Share-based compensation |
52,227 | 108,983 | ||||||
| Depreciation and amortization |
16,879 | 7,352 | ||||||
| Loss on disposal of property and equipment |
(133) | 133 | ||||||
| Acquisition related, integration and other costs |
1,551 | 76,065 | ||||||
|
|
|
|
||||||
| Non-GAAP general and administrative |
$ | (362,301) | $ | (251,616) | ||||
|
|
|
|
||||||
Depreciation and Amortization
by Function
UNAUDITED
In thousands
| THREE MONTHS ENDED | ||||||||
| Mar 31, 2023 | Mar 31, 2022 | |||||||
| Cost of revenue |
$ | 19,222 | $ | 15,469 | ||||
| Product development |
30,537 | 26,851 | ||||||
| Sales and marketing |
1,458 | 1,491 | ||||||
| General and administrative |
16,879 | 7,352 | ||||||
| Amortization of acquired customer assets |
25,077 | 18,893 | ||||||
|
|
|
|
||||||
| Total depreciation and amortization |
$ | 93,173 | $ | 70,056 | ||||
|
|
|
|
||||||
|
|
BLOCK Q1 2023 32 |