UNITED STATES
SECURITIES AND EXCHANGE COMMISSION
Washington, D.C. 20549
FORM 8-K
CURRENT REPORT
Pursuant to Section 13 or 15(d)
of the Securities Exchange Act of 1934
Date of Report (Date of earliest event reported): November 9, 2022
Coherent Corp.
(Exact name of registrant as specified in its charter)
| Pennsylvania | 001-39375 | 25-1214948 | ||
| (State or Other Jurisdiction of Incorporation) |
(Commission File Number) |
(I.R.S. Employer Identification No.) |
375 Saxonburg Boulevard
Saxonburg, Pennsylvania 16056
(Address of Principal Executive Offices) (Zip Code)
(724) 352-4455
(Registrant’s telephone number, including area code)
Not Applicable
(Former name or former address, if changed since last report)
Check the appropriate box below if the Form 8-K filing is intended to simultaneously satisfy the filing obligation of the registrant under any of the following provisions:
| ☐ | Written communications pursuant to Rule 425 under the Securities Act (17 CFR 230.425) |
| ☐ | Soliciting material pursuant to Rule 14a-12 under the Exchange Act (17 CFR 240.14a-12) |
| ☐ | Pre-commencement communications pursuant to Rule 14d-2(b) under the Exchange Act (17 CFR 240.14d-2(b)) |
| ☐ | Pre-commencement communications pursuant to Rule 13e-4(c) under the Exchange Act (17 CFR 240.13e-4(c)) |
Securities registered pursuant to Section 12(b) of the Act:
| Title of each class |
Trading |
Name of each exchange |
||
| Common Stock, no par value | COHR | Nasdaq Global Select Market | ||
| Series A Mandatory Convertible Preferred Stock, no par value | IIVIP | Nasdaq Global Select Market |
Indicate by check mark whether the registrant is an emerging growth company as defined in Rule 405 of the Securities Act of 1933 (§230.405 of this chapter) or Rule 12b-2 of the Securities Exchange Act of 1934 (§240.12b-2 of this chapter).
Emerging growth company ☐
If an emerging growth company, indicate by check mark if the registrant has elected not to use the extended transition period for complying with any new or revised financial accounting standards provided pursuant to Section 13(a) of the Exchange Act. ☐
| Item 2.02. | Results of Operations and Financial Condition. |
On November 9, 2022, Coherent Corp. (the “Company”) issued a press release, a copy of which is attached hereto as Exhibit 99.1 and is incorporated herein by reference.
| Item 7.01. | Regulation FD Disclosure. |
A slide presentation to be used by senior management of the Company in connection with its discussions with investors regarding the Company’s financial results for our quarter ended September 30, 2022 is included in Exhibit 99.2 to this report and is being furnished in accordance with Regulation FD of the Securities and Exchange Commission.
The information in this Current Report on Form 8-K, including the exhibits furnished pursuant to Item 9.01, shall not be deemed “filed” for the purposes of Section 18 of the Securities Exchange Act of 1934 or otherwise subject to the liabilities under that Section. Furthermore, the information in this Current Report on Form 8-K, including the exhibits furnished pursuant to Item 9.01 shall not be deemed to be incorporated by reference into the filings of the Company under the Securities Act of 1933.
| Item 9.01. | Financial Statements and Exhibits. |
Exhibit 99.1. Press release dated November 9, 2022
Exhibit 99.2. Investor Presentation
Exhibit 104 Cover Page Interactive Data File (embedded within the Inline XBRL document)
SIGNATURE
Pursuant to the requirements of the Securities Exchange Act of 1934, the registrant has duly caused this report to be signed on its behalf by the undersigned hereunto duly authorized.
| Coherent Corp. | ||||||
| Date: November 9, 2022 | By: | /s/ Mary Jane Raymond |
||||
| Mary Jane Raymond | ||||||
| Chief Financial Officer and Treasurer | ||||||
Exhibit 99.1

|
PRESS RELEASE |
Coherent Corp. |
||
| 375 Saxonburg Boulevard | ||||
| Saxonburg, PA 16056-9499 |
Coherent Corp. Reports Fiscal 2023 First Quarter Results
| • | Record Revenue of 1.34 Billion, Grew 69% Year-Over-Year |
| • | Organic Revenue Growth of 20% Year-Over-Year |
| • | Record Backlog of $3.05 Billion, Grew 119% Year-Over-Year |
| • | GAAP EPS of $(0.56) |
| • | Non-GAAP EPS of $1.04 |
PITTSBURGH, November 9, 2022 (GLOBE NEWSWIRE) — Coherent Corp. (Nasdaq:COHR) (“Coherent,” “We” or the “Company”) today reported results for its fiscal 2023 first quarter ended September 30, 2022.
“Our first quarter of FY23 was a great start to our new chapter as Coherent Corp. We achieved revenue of $1.34 billion with solid contributions from all three segments, growing 69% year-over-year, 20% organically and 13% year-over-year on a proforma basis. In the quarter, Electronics led the way with our sensing revenue in one of its two seasonally high quarters, and Communications contributed strong performance as well in both telecom and datacom, including record revenues from our datacom transceiver business as we continue to gain share in high-speed modules. Our non-GAAP diluted EPS was $1.04 and was affected favorably by FX by about $0.07 in the quarter. The company delivered very good earnings due to continued focus on revenue strength, cost controls, operating efficiencies and timely launches of industry leading new products,” said Dr. Vincent D. Mattera, Jr., Chair and CEO.
Dr. Mattera continued, “Our integration activities started strong and remain on track. The impact of current escalating trade tensions are not material to our business. We will continue to drive innovation, prudently directing our roughly $1 billion of investment again this year between R&D and cap ex to support our long-term growth.”
| coherent.com | T. 724.352.4455 | Page 1 |

|
PRESS RELEASE |
Coherent Corp. |
||
| 375 Saxonburg Boulevard | ||||
| Saxonburg, PA 16056-9499 |
Table 1
Financial Metrics
$ Millions, except per share amounts and %
(Unaudited)
| Three Months Ended | ||||||||||||
| Sept 30, | Jun 30, | Sept 30, | ||||||||||
| 2022 | 2022 | 2021 | ||||||||||
| Revenues | $ | 1,344.6 | $ | 887.0 | $ | 795.1 | ||||||
| GAAP Gross Profit (3) | $ | 443.6 | $ | 326.0 | $ | 306.6 | ||||||
| Non-GAAP Gross Profit (2) | $ | 542.2 | $ | 343.4 | $ | 317.7 | ||||||
| GAAP Operating Income (1) | $ | 42.5 | $ | 114.2 | $ | 95.1 | ||||||
| Non-GAAP Operating Income (2) | $ | 286.4 | $ | 168.6 | $ | 150.2 | ||||||
| GAAP Net Earnings (Loss) | $ | (38.7 | ) | $ | 43.6 | $ | 74.5 | |||||
| Non-GAAP Net Earnings (2) | $ | 183.6 | $ | 133.7 | $ | 117.7 | ||||||
| GAAP Diluted Earnings (Loss) Per Share | $ | (0.56 | ) | $ | 0.23 | $ | 0.50 | |||||
| Non-GAAP Diluted Earnings Per Share (2) | $ | 1.04 | $ | 0.98 | $ | 0.87 | ||||||
| Other Selected Financial Metrics | ||||||||||||
| GAAP gross margin (3) |
33.0 | % | 36.8 | % | 38.6 | % | ||||||
| Non-GAAP gross margin (2) |
40.3 | % | 38.7 | % | 40.0 | % | ||||||
| GAAP operating margin |
3.2 | % | 12.9 | % | 12.0 | % | ||||||
| Non-GAAP operating margin (2) |
21.3 | % | 19.0 | % | 18.9 | % | ||||||
| GAAP return on sales |
(2.9 | )% | 4.9 | % | 9.4 | % | ||||||
| Non-GAAP return on sales (2) |
13.7 | % | 15.1 | % | 14.8 | % | ||||||
| (1) | GAAP operating income is defined as earnings before income taxes, interest expense and other expense or income, net. |
| (2) | All non-GAAP amounts exclude certain adjustments for share-based compensation, acquired intangible amortization expense, restructuring, integration and transaction expenses, and start-up costs related to the start-up of new devices for new customer applications. See Table 4 for the Reconciliation of GAAP measures to non-GAAP measures. |
| (3) | GAAP gross profit for the three months ended September 30, 2021 has been updated to include amortization of developed technology intangible assets. |
| coherent.com | T. 724.352.4455 | Page 2 |

|
PRESS RELEASE |
Coherent Corp. |
||
| 375 Saxonburg Boulevard | ||||
| Saxonburg, PA 16056-9499 |
Outlook
The outlook for the second fiscal quarter ending December 31 2022 is revenue of $1,340 million to $1,400 million and earnings per diluted share on a non-GAAP basis of $0.88 to $1.00. This is at today’s exchange rate and today’s estimated tax impact of 23%. Both of these are subject to variability. For the non-GAAP earnings per share, we added back to the GAAP earnings pre-tax amounts of $83 million in amortization, $34 million in share-based compensation, $46 million related to the preliminary fair value adjustment on acquired inventory, and $20-30 million in transaction, integration and other related costs. Refer to Table 8 for the share count range for the aforementioned outlook. Non-GAAP adjustments are by their nature highly volatile and we have low visibility as to the range that may be incurred in the future.
The Company also expects full year revenue between $5,250 to $5,550 million, at today’s exchange rate.
Conference Call & Webcast Information
The Company will host a conference call at 9:00 a.m. Eastern Time on Wednesday, November 9, 2022 to discuss these results. Individuals wishing to participate in the webcast can access the event at the Company’s web site by visiting https://www.coherent.com/news/press-releases/coherent-corp-to-host-fy-2023-first-quarter-conference-call or via this link. Equity analysts and others who wish to participate in the question-and-answer session of the conference call can pre-register at this link to receive dial-in numbers and a unique PIN.
The call will be recorded, and a replay will be available to interested parties who are unable to attend the live event. This service will be available on the company’s website beginning November 9, 2022, at 4:00 p.m. ET.
About Coherent Corp.
Coherent Corp. (“Coherent”, the “Company,” “we,” “us” or “our”), a global leader in materials, networking and lasers, is a vertically integrated manufacturing company that develops, manufactures and markets engineered materials, optoelectronic components and devices, and lasers for use in industrial materials processing, optical communications, aerospace and defense, consumer electronics, semiconductor capital equipment, medical diagnostics and life sciences, automotive applications, machine tools, consumer goods and medical device manufacturing. Headquartered in Saxonburg, Pennsylvania, Coherent has research and development, manufacturing, sales, service, and distribution facilities worldwide. Coherent produces a wide variety of lasers, along with application-specific photonic and electronic materials and components, and deploys them in various forms, including integrated with advanced software to enable its customers. For more information, please visit us at coherent.com.
Forward-looking Statements
This press release contains forward-looking statements relating to future events and expectations that are based on certain assumptions and contingencies. The forward-looking statements are made pursuant to the safe harbor provisions of the U.S. Private Securities Litigation Reform Act of 1995 and relate to the Company’s performance on a going-forward basis. The forward-looking statements in this press release involve risks and uncertainties, which could cause actual results, performance or trends to differ materially from those expressed in the forward-looking statements herein or in previous disclosures.
The Company believes that all forward-looking statements made by it in this press release have a reasonable basis, but there can be no assurance that management’s expectations, beliefs, or projections as expressed in the forward-looking statements will actually occur or prove to be correct. In addition to general industry and global economic conditions, factors that could cause actual results to differ materially from those discussed in the forward-looking
| coherent.com | T. 724.352.4455 | Page 3 |

|
PRESS RELEASE |
Coherent Corp. |
||
| 375 Saxonburg Boulevard | ||||
| Saxonburg, PA 16056-9499 |
statements in this press release include but are not limited to: (i) the failure of any one or more of the assumptions stated herein to prove to be correct; (ii) the risks relating to forward-looking statements and other “Risk Factors” discussed in the Company’s Annual Report on Form 10-K for the fiscal year ended June 30, 2022 and additional risk factors that may be identified from time to time in filings of the Company; (iii) the substantial indebtedness the Company incurred in connection with its acquisition of Coherent, Inc. (the “Transaction”) and the need to generate sufficient cash flows to service and repay such debt; (iv) the possibility that the Company may be unable to achieve expected synergies, operating efficiencies and other benefits within the expected time-frames or at all and to successfully integrate operations of Coherent, Inc. (“Coherent”) with those of the Company; (v) the possibility that such integration may be more difficult, time-consuming or costly than expected or that operating costs and business disruption (including, without limitation, disruptions in relationships with employees, customers or suppliers) may be greater than expected in connection with the Transaction; (vi) any unexpected costs, charges or expenses resulting from the Transaction; (vii) the risk that disruption from the Transaction materially and adversely affects the respective businesses and operations of the Company and Coherent; (viii) potential adverse reactions or changes to business relationships resulting from the completion of the Transaction; (ix) the ability of the Company to retain and hire key employees; (x) the purchasing patterns of customers and end users; (xi) the timely release of new products, and acceptance of such new products by the market; (xii) the introduction of new products by competitors and other competitive responses; (xiii) the Company’s ability to assimilate recently acquired businesses, and realize synergies, cost savings, and opportunities for growth in connection therewith, together with the risks, costs, and uncertainties associated with such acquisitions; (xiv) the Company’s ability to devise and execute strategies to respond to market conditions; (xv) the risks to realizing the benefits of investments in R&D and commercialization of innovations; (xvi) the risks that the Company’s stock price will not trade in line with industrial technology leaders; and/or (xvii) the risks of business and economic disruption related to the currently ongoing COVID-19 outbreak and any other worldwide health epidemics or outbreaks that may arise. The Company disclaims any obligation to update information contained in these forward-looking statements, whether as a result of new information, future events or developments, or otherwise.
Use of Non-GAAP Financial Measures
The Company has disclosed financial measurements in this press release that present financial information considered to be non-GAAP financial measures. These measurements are not a substitute for GAAP measurements, although the Company’s management uses these measurements as an aid in monitoring the Company’s on-going financial performance. The non-GAAP net earnings, the non-GAAP earnings per share, the non-GAAP operating income, the non-GAAP gross profit, the non-GAAP internal research and development, the non-GAAP selling, general and administration, the non-GAAP interest and other (income) expense, and the non-GAAP income tax (benefit), measure earnings and operating income (loss), respectively, excluding non-recurring or unusual items that are considered by management to be outside the Company’s standard operation and excluding certain non-cash items. EBITDA is an adjusted non-GAAP financial measurement that is considered by management to be useful in measuring the profitability between companies within the industry by reflecting operating results of the Company excluding non-operating factors. There are limitations associated with the use of non-GAAP financial measures, including that such measures may not be entirely comparable to similarly titled measures used by other companies, due to potential differences among calculation methodologies. Thus, there can be no assurance whether (i) items excluded from the non-GAAP financial measures will occur in the future or (ii) there will be cash costs associated with items excluded from the non-GAAP financial measures. The Company compensates for these limitations by using these non-GAAP financial measures as supplements to GAAP financial measures and by providing the reconciliations of the non-GAAP financial measures to their most comparable GAAP financial measures. Investors should consider adjusted measures in addition to, and not as a substitute for, or superior to, financial performance measures prepared in accordance with GAAP.
| coherent.com | T. 724.352.4455 | Page 4 |
Coherent Corp. and Subsidiaries
Condensed Consolidated Statements of Earnings (Loss) (Unaudited)
($000 except per share data)
| Three Months Ended | ||||||||||||
| Sept 30, | Jun 30, | Sept 30, | ||||||||||
| 2022 | 2022 | 2021 | ||||||||||
| Revenues | $ | 1,344,570 | $ | 886,962 | $ | 795,111 | ||||||
| Costs, Expenses & Other Expense | ||||||||||||
| Cost of goods sold |
900,996 | 560,930 | 488,487 | |||||||||
| Internal research and development |
121,084 | 95,917 | 88,966 | |||||||||
| Selling, general and administrative |
280,014 | 115,862 | 122,608 | |||||||||
| Interest expense |
61,889 | 48,502 | 12,191 | |||||||||
| Other expense (income), net |
31,605 | 16,768 | (7,582 | ) | ||||||||
|
|
|
|
|
|
|
|||||||
| Total Costs, Expenses, & Other Expense | 1,395,588 | 837,979 | 704,670 | |||||||||
|
|
|
|
|
|
|
|||||||
| Earnings (Loss) Before Income Taxes | (51,018 | ) | 48,983 | 90,441 | ||||||||
| Income Taxes | (12,320 | ) | 5,347 | 15,977 | ||||||||
|
|
|
|
|
|
|
|||||||
| Net Earnings (Loss) | $ | (38,698 | ) | $ | 43,636 | $ | 74,464 | |||||
|
|
|
|
|
|
|
|||||||
| Less: Dividends on Preferred Stock | 35,577 | 17,291 | 17,082 | |||||||||
|
|
|
|
|
|
|
|||||||
| Net Earnings (Loss) available to the Common Shareholders | $ | (74,275 | ) | $ | 26,345 | $ | 57,382 | |||||
|
|
|
|
|
|
|
|||||||
| Basic Earnings (Loss) Per Share | $ | (0.56 | ) | $ | 0.25 | $ | 0.54 | |||||
|
|
|
|
|
|
|
|||||||
| Diluted Earnings (Loss) Per Share | $ | (0.56 | ) | $ | 0.23 | $ | 0.50 | |||||
|
|
|
|
|
|
|
|||||||
| Average Shares Outstanding - Basic | 133,280 | 106,520 | 105,761 | |||||||||
| Average Shares Outstanding - Diluted |
133,280 | 116,821 | 115,849 | |||||||||
| coherent.com | T. 724.352.4455 | Page 5 |
Coherent Corp. and Subsidiaries
Condensed Consolidated Balance Sheets (Unaudited)
($000)
| September 30, 2022 |
June 30, 2022 |
|||||||
| Assets |
||||||||
| Current Assets |
||||||||
| Cash, cash equivalents, and restricted cash |
$ | 898,501 | $ | 2,582,371 | ||||
| Accounts receivable |
975,437 | 700,331 | ||||||
| Inventories |
1,346,940 | 902,559 | ||||||
| Prepaid and refundable income taxes |
23,205 | 19,585 | ||||||
| Prepaid and other current assets |
150,547 | 100,346 | ||||||
|
|
|
|
|
|||||
| Total Current Assets |
3,394,630 | 4,305,192 | ||||||
| Property, plant & equipment, net |
1,803,646 | 1,363,195 | ||||||
| Goodwill |
5,284,591 | 1,285,759 | ||||||
| Other intangible assets, net |
2,984,979 | 635,404 | ||||||
| Deferred income taxes |
28,451 | 31,714 | ||||||
| Other assets |
334,262 | 223,582 | ||||||
|
|
|
|
|
|||||
| Total Assets |
$ | 13,830,559 | $ | 7,844,846 | ||||
|
|
|
|
|
|||||
| Liabilities, Mezzanine Equity and Shareholders’ Equity |
||||||||
| Current Liabilities |
||||||||
| Current portion of long-term debt |
$ | 129,011 | $ | 403,212 | ||||
| Accounts payable |
479,385 | 434,917 | ||||||
| Operating lease current liabilities |
38,855 | 27,574 | ||||||
| Accruals and other current liabilities |
535,833 | 401,256 | ||||||
|
|
|
|
|
|||||
| Total Current Liabilities |
1,183,084 | 1,266,959 | ||||||
| Long-term debt |
4,494,282 | 1,897,214 | ||||||
| Deferred income taxes |
618,565 | 77,259 | ||||||
| Operating lease liabilities |
141,542 | 110,214 | ||||||
| Other liabilities |
230,568 | 109,922 | ||||||
|
|
|
|
|
|||||
| Total Liabilities |
6,668,041 | 3,461,568 | ||||||
| Total Mezzanine Equity |
2,153,480 | 766,803 | ||||||
| Total Shareholders’ Equity |
5,009,038 | 3,616,475 | ||||||
|
|
|
|
|
|||||
| Total Liabilities, Mezzanine Equity and Shareholders’ Equity |
$ | 13,830,559 | $ | 7,844,846 | ||||
|
|
|
|
|
|||||
| coherent.com | T. 724.352.4455 | Page 6 |
Coherent Corp. and Subsidiaries
Condensed Consolidated Statements of Cash Flows (Unaudited)
($000)
| Three Months Ended September 30, |
||||||||
| 2022 | 2021 | |||||||
| Cash Flows from Operating Activities |
||||||||
| Net cash provided by operating activities |
$ | 79,577 | $ | 52,336 | ||||
|
|
|
|
|
|||||
| Cash Flows from Investing Activities |
||||||||
| Additions to property, plant & equipment |
(138,990 | ) | (47,565 | ) | ||||
| Purchases of businesses, net of cash acquired |
(5,488,556 | ) | — | |||||
| Other investing activities |
(711 | ) | — | |||||
|
|
|
|
|
|||||
| Net cash used in investing activities |
(5,628,257 | ) | (47,565 | ) | ||||
|
|
|
|
|
|||||
| Cash Flows from Financing Activities |
||||||||
| Proceeds from borrowings of Term A Facility |
850,000 | — | ||||||
| Proceeds from borrowings of Term B Facility |
2,800,000 | — | ||||||
| Proceeds from borrowings of Revolving Credit Facility |
65,000 | — | ||||||
| Proceeds from issuance of Series B preferred shares |
1,400,000 | — | ||||||
| Payments on existing debt |
(996,429 | ) | (15,513 | ) | ||||
| Debt issuance costs |
(126,516 | ) | — | |||||
| Equity Issuance Costs |
(42,000 | ) | — | |||||
| Proceeds from exercises of stock options |
7,425 | 7,481 | ||||||
| Payment on convertible notes |
(3,561 | ) | — | |||||
| Payments in satisfaction of employees’ minimum tax obligations |
(40,885 | ) | (13,017 | ) | ||||
| Payment of dividends |
— | (13,808 | ) | |||||
| Other financing activities |
(292 | ) | (1,109 | ) | ||||
|
|
|
|
|
|||||
| Net cash provided by (used in) financing activities |
3,912,742 | (35,966 | ) | |||||
|
|
|
|
|
|||||
| Effect of exchange rate changes on cash, cash equivalents, and restricted cash |
(42,273 | ) | (522 | ) | ||||
| Net decrease in cash, cash equivalents, and restricted cash |
(1,678,211 | ) | (31,717 | ) | ||||
| Cash, Cash Equivalents, and Restricted Cash at Beginning of Period |
2,582,371 | 1,591,892 | ||||||
|
|
|
|
|
|||||
| Cash, Cash Equivalents, and Restricted Cash at End of Period(1) |
$ | 904,160 | $ | 1,560,175 | ||||
|
|
|
|
|
|||||
| (1) | Restricted cash, non-current is included in the condensed consolidated balance sheets under ‘Other Assets’. |
| coherent.com | T. 724.352.4455 | Page 7 |
Table 2
Segment Revenues, GAAP Operating Income (Loss) & Margins, and
Non-GAAP Operating Income (Loss) & Margins*
$ Millions, except %
(Unaudited)
| Three Months Ended | ||||||||||||
| Sept 30, | Jun 30, | Sept 30, | ||||||||||
| 2022 | 2022 | 2021 | ||||||||||
| Revenues:(1) |
||||||||||||
| Networking |
$ | 596.6 | $ | 590.1 | $ | 531.0 | ||||||
| Materials |
355.6 | 296.9 | 264.1 | |||||||||
| Lasers |
392.4 | — | — | |||||||||
|
|
|
|
|
|
|
|||||||
| Consolidated |
$ | 1,344.6 | $ | 887.0 | $ | 795.1 | ||||||
|
|
|
|
|
|
|
|||||||
| GAAP Operating Income (Loss):(1) |
||||||||||||
| Networking |
$ | 91.0 | $ | 67.1 | $ | 59.4 | ||||||
| Materials |
75.3 | 53.5 | 46.8 | |||||||||
| Lasers |
(123.8 | ) | — | — | ||||||||
| Unallocated and Other |
— | (6.4 | ) | (11.2 | ) | |||||||
|
|
|
|
|
|
|
|||||||
| Consolidated |
$ | 42.5 | $ | 114.2 | $ | 95.1 | ||||||
|
|
|
|
|
|
|
|||||||
| Non-GAAP Operating Income:(1) |
||||||||||||
| Networking |
$ | 117.7 | $ | 89.2 | $ | 86.8 | ||||||
| Materials |
96.8 | 79.5 | 63.5 | |||||||||
| Lasers |
71.9 | — | — | |||||||||
| Unallocated and Other |
— | — | — | |||||||||
|
|
|
|
|
|
|
|||||||
| Consolidated |
$ | 286.4 | $ | 168.6 | $ | 150.2 | ||||||
|
|
|
|
|
|
|
|||||||
| GAAP Operating Margin (Loss):(1) |
||||||||||||
| Networking |
15.3 | % | 11.4 | % | 11.2 | % | ||||||
| Materials |
21.2 | % | 18.0 | % | 17.7 | % | ||||||
| Lasers |
(31.5 | )% | NA | NA | ||||||||
| Consolidated |
3.2 | % | 12.9 | % | 12.0 | % | ||||||
| Non-GAAP Operating Margin:(1) |
||||||||||||
| Networking |
19.7 | % | 15.1 | % | 16.3 | % | ||||||
| Materials |
27.2 | % | 26.8 | % | 24.0 | % | ||||||
| Lasers |
18.3 | % | NA | NA | ||||||||
| Consolidated |
21.3 | % | 19.0 | % | 18.9 | % | ||||||
| * | Amounts may not recalculate due to rounding. |
| (1) | Segment results for prior periods have been updated to include the movement of two businesses between Materials and Networking. |
| coherent.com | T. 724.352.4455 | Page 8 |
Table 3
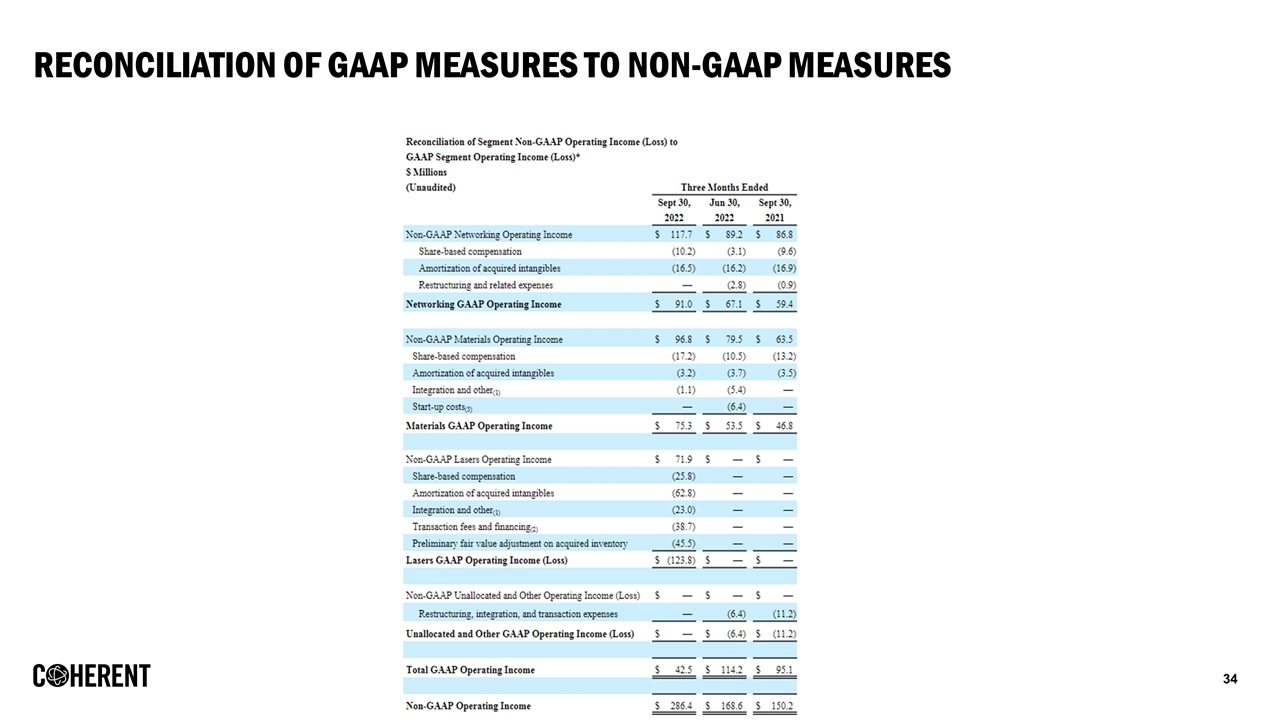
Reconciliation of Segment Non-GAAP Operating Income (Loss) to
GAAP Segment Operating Income (Loss)*
$ Millions
(Unaudited)
| Three Months Ended | ||||||||||||
| Sept 30, 2022 |
Jun 30, 2022 |
Sept 30, 2021 |
||||||||||
| Non-GAAP Networking Operating Income |
$ | 117.7 | $ | 89.2 | $ | 86.8 | ||||||
| Share-based compensation |
(10.2 | ) | (3.1 | ) | (9.6 | ) | ||||||
| Amortization of acquired intangibles |
(16.5 | ) | (16.2 | ) | (16.9 | ) | ||||||
| Restructuring and related expenses |
— | (2.8 | ) | (0.9 | ) | |||||||
|
|
|
|
|
|
|
|||||||
| Networking GAAP Operating Income |
$ | 91.0 | $ | 67.1 | $ | 59.4 | ||||||
|
|
|
|
|
|
|
|||||||
| Non-GAAP Materials Operating Income |
$ | 96.8 | $ | 79.5 | $ | 63.5 | ||||||
| Share-based compensation |
(17.2 | ) | (10.5 | ) | (13.2 | ) | ||||||
| Amortization of acquired intangibles |
(3.2 | ) | (3.7 | ) | (3.5 | ) | ||||||
| Integration and other(1) |
(1.1 | ) | (5.4 | ) | — | |||||||
| Start-up costs(3) |
— | (6.4 | ) | — | ||||||||
|
|
|
|
|
|
|
|||||||
| Materials GAAP Operating Income |
$ | 75.3 | $ | 53.5 | $ | 46.8 | ||||||
|
|
|
|
|
|
|
|||||||
| Non-GAAP Lasers Operating Income |
$ | 71.9 | $ | — | $ | — | ||||||
| Share-based compensation |
(25.8 | ) | — | — | ||||||||
| Amortization of acquired intangibles |
(62.8 | ) | — | — | ||||||||
| Integration and other(1) |
(23.0 | ) | — | — | ||||||||
| Transaction fees and financing(2) |
(38.7 | ) | — | — | ||||||||
| Preliminary fair value adjustment on acquired inventory |
(45.5 | ) | — | — | ||||||||
|
|
|
|
|
|
|
|||||||
| Lasers GAAP Operating Income (Loss) |
$ | (123.8 | ) | $ | — | $ | — | |||||
|
|
|
|
|
|
|
|||||||
| Non-GAAP Unallocated and Other Operating Income (Loss) |
$ | — | $ | — | $ | — | ||||||
| Restructuring, integration, and transaction expenses |
— | (6.4 | ) | (11.2 | ) | |||||||
|
|
|
|
|
|
|
|||||||
| Unallocated and Other GAAP Operating Income (Loss) |
$ | — | $ | (6.4 | ) | $ | (11.2 | ) | ||||
|
|
|
|
|
|
|
|||||||
|
|
|
|
|
|
|
|||||||
| Total GAAP Operating Income |
$ | 42.5 | $ | 114.2 | $ | 95.1 | ||||||
|
|
|
|
|
|
|
|||||||
| Non-GAAP Operating Income |
$ | 286.4 | $ | 168.6 | $ | 150.2 | ||||||
|
|
|
|
|
|
|
|||||||
| * | Amounts may not recalculate due to rounding. |
| (1) | During fiscal year 2023, Integration and Other includes one-time retention and severance payments, as well as other integration costs related to the Coherent transaction. During fiscal year 2022, Integration and other includes integration and restructuring charges from the Finisar acquisition. |
| (2) | Transaction fees and financing in fiscal year 2023 includes debt extinguishment costs and various fees related to closing the Coherent transaction. Transaction fees and financing in fiscal year 2022 includes incremental interest expense related to the financing for the Coherent transaction which were be included as an adjustment in arriving at non-GAAP earnings through the closing of the Coherent transaction, as the associated funding was contingent on transaction close. |
| coherent.com | T. 724.352.4455 | Page 9 |
| (3) | Start-up costs in operating expenses were related to the start-up of new devices for new customer applications. |
Table 4
Reconciliation of GAAP Measures to non-GAAP Measures*
$ Millions
(Unaudited)
| Three Months Ended | ||||||||||||
| Sept 30, 2022 |
Jun 30, 2022 |
Sept 30, 2021 |
||||||||||
| Gross profit on GAAP basis (4) |
$ | 443.6 | $ | 326.0 | $ | 306.6 | ||||||
| Share-based compensation |
5.3 | 0.9 | 1.5 | |||||||||
| Amortization of acquired intangibles |
47.4 | 9.6 | 9.6 | |||||||||
| Preliminary fair value adjustment on acquired inventory |
45.5 | — | — | |||||||||
| Integration and other(1) |
0.4 | 6.9 | ||||||||||
|
|
|
|
|
|
|
|||||||
| Gross profit on non-GAAP basis |
$ | 542.2 | $ | 343.4 | $ | 317.7 | ||||||
|
|
|
|
|
|
|
|||||||
| Internal research and development on GAAP basis |
$ | 121.1 | $ | 95.9 | $ | 89.0 | ||||||
| Share-based compensation |
(5.4 | ) | (1.3 | ) | (2.3 | ) | ||||||
| Start-up costs(3) |
— | (6.4 | ) | — | ||||||||
| Integration and other(1) |
— | (0.6 | ) | — | ||||||||
|
|
|
|
|
|
|
|||||||
| Internal research and development on non-GAAP basis |
$ | 115.7 | $ | 87.6 | $ | 86.7 | ||||||
|
|
|
|
|
|
|
|||||||
| Selling, general and administrative on GAAP basis |
$ | 280.0 | $ | 115.9 | $ | 122.6 | ||||||
| Share-based compensation |
(42.5 | ) | (11.3 | ) | (18.9 | ) | ||||||
| Amortization of acquired intangibles |
(35.1 | ) | (10.3 | ) | (10.8 | ) | ||||||
| Integration and other(1) |
(23.7 | ) | — | — | ||||||||
| Transaction fees and financing(2) |
(38.7 | ) | (7.1 | ) | (12.0 | ) | ||||||
|
|
|
|
|
|
|
|||||||
| Selling, general and administrative on non-GAAP basis |
$ | 140.0 | $ | 87.2 | $ | 80.9 | ||||||
|
|
|
|
|
|
|
|||||||
| Operating income on GAAP basis |
$ | 42.5 | $ | 114.2 | $ | 95.1 | ||||||
| Share-based compensation |
53.2 | 13.5 | 22.7 | |||||||||
| Amortization of acquired intangibles |
82.5 | 19.9 | 20.4 | |||||||||
| Start-up costs(3) |
— | 6.4 | — | |||||||||
| Preliminary fair value adjustment on acquired inventory |
45.5 | — | — | |||||||||
| Integration and other(1) |
24.1 | — | — | |||||||||
| Transaction fees and financing(2) |
38.7 | 14.6 | 12.0 | |||||||||
|
|
|
|
|
|
|
|||||||
| Operating income on non-GAAP basis |
$ | 286.4 | $ | 168.6 | $ | 150.2 | ||||||
|
|
|
|
|
|
|
|||||||
| coherent.com | T. 724.352.4455 | Page 10 |
Table 4
Reconciliation of GAAP Measures to non-GAAP Measures (Continued)*
$ Millions
(Unaudited)
| Three Months Ended | ||||||||||||
| Sept 30, 2022 |
Jun 30, 2022 |
Sept 30, 2021 |
||||||||||
| Interest and other (income) expense, net on GAAP basis |
$ | 93.5 | $ | 65.3 | $ | 4.6 | ||||||
| Foreign currency exchange gains (losses), net |
3.0 | (19.8 | ) | 4.9 | ||||||||
| Transaction fees and financing(2) |
(34.8 | ) | (38.3 | ) | — | |||||||
|
|
|
|
|
|
|
|||||||
| Interest and other (income) expense, net on non-GAAP basis |
$ | 61.7 | $ | 7.2 | $ | 9.5 | ||||||
|
|
|
|
|
|
|
|||||||
| Income taxes on GAAP basis |
$ | (12.3 | ) | $ | 5.3 | $ | 16.0 | |||||
| Tax impact of non-GAAP measures |
53.5 | 22.6 | 7.1 | |||||||||
|
|
|
|
|
|
|
|||||||
| Income taxes on non-GAAP basis |
$ | 41.2 | $ | 27.9 | $ | 23.1 | ||||||
|
|
|
|
|
|
|
|||||||
| Net earnings (loss) on GAAP basis |
$ | (38.7 | ) | $ | 43.6 | $ | 74.5 | |||||
| Share-based compensation |
53.2 | 13.5 | 22.7 | |||||||||
| Amortization of acquired intangibles |
82.5 | 19.9 | 20.4 | |||||||||
| Preliminary fair value adjustment on acquired inventory |
45.5 | — | — | |||||||||
| Start-up costs(3) |
— | 6.4 | — | |||||||||
| Foreign currency exchange (gains) losses |
(3.0 | ) | 19.8 | (4.9 | ) | |||||||
| Integration and other(1) |
24.1 | 14.7 | 12.0 | |||||||||
| Transaction fees and financing(2) |
73.5 | 38.3 | — | |||||||||
| Tax impact of non-GAAP measures |
(53.5 | ) | (22.6 | ) | (7.1 | ) | ||||||
|
|
|
|
|
|
|
|||||||
| Net earnings on non-GAAP basis |
$ | 183.6 | $ | 133.7 | $ | 117.7 | ||||||
|
|
|
|
|
|
|
|||||||
| Per share data: |
||||||||||||
| Net earnings (loss) on GAAP basis | ||||||||||||
| Basic Earnings (Loss) Per Share |
$ | (0.56 | ) | $ | 0.25 | $ | 0.54 | |||||
| Diluted Earnings (Loss) Per Share |
$ | (0.56 | ) | $ | 0.23 | $ | 0.50 | |||||
| Net earnings on non-GAAP basis |
||||||||||||
| Basic Earnings Per Share |
$ | 1.11 | $ | 1.09 | $ | 0.95 | ||||||
| Diluted Earnings Per Share |
$ | 1.04 | $ | 0.98 | $ | 0.87 | ||||||
| * | Amounts may not recalculate due to rounding. |
| (1) | During fiscal year 2023, Integration and other includes one-time retention and severance payments and other integration costs related to the Coherent transaction. During fiscal year 2022, Integration and other includes integration and restructuring charges from the Finisar acquisition. |
| (2) | Transaction fees and financing in fiscal year 2023 includes debt extinguishment costs, various fees related to closing the Coherent transaction. Transaction fees and financing in fiscal year 2022 includes incremental interest expense related to the financing for the Coherent transaction which were included as an adjustment in arriving at non-GAAP earnings through the closing of the Coherent transaction, as the associated funding was contingent on transaction close. |
| (3) | Start-up costs in operating expenses were related to the start-up of new devices for new customer applications. |
| (4) | GAAP gross profit for the three months ended September 30, 2021 has been updated to include amortization of developed technology intangible assets. |
| coherent.com | T. 724.352.4455 | Page 11 |
Table 5
Reconciliation of GAAP Net Income (Loss), EBITDA and Adjusted EBITDA*
$ Millions
(Unaudited)
| Three Months Ended | ||||||||||||
| Sept 30, 2022 |
Jun 30, 2022 |
Sept 30, 2021 |
||||||||||
| Net earnings (loss) on GAAP basis |
$ | (38.7 | ) | $ | 43.6 | $ | 74.5 | |||||
| Income taxes |
(12.3 | ) | 5.3 | 16.0 | ||||||||
| Depreciation and amortization |
147.3 | 73.3 | 69.7 | |||||||||
| Interest expense |
61.9 | 48.5 | 12.2 | |||||||||
|
|
|
|
|
|
|
|||||||
| EBITDA (1) |
$ | 158.2 | $ | 170.7 | $ | 172.4 | ||||||
|
|
|
|
|
|
|
|||||||
| EBITDA margin |
11.8 | % | 19.2 | % | 21.7 | % | ||||||
| Preliminary fair value adjustment on acquired inventory |
45.5 | — | — | |||||||||
| Share-based compensation |
53.2 | 13.5 | 22.7 | |||||||||
| Foreign currency exchange (gains) losses |
(3.0 | ) | 19.8 | (4.9 | ) | |||||||
| Start-up costs |
— | 6.4 | — | |||||||||
| Integration and other(3) |
24.1 | — | — | |||||||||
| Transaction fees and financing(4) |
73.5 | 14.6 | 12.0 | |||||||||
|
|
|
|
|
|
|
|||||||
| Adjusted EBITDA (2) |
$ | 351.5 | $ | 225.0 | $ | 202.2 | ||||||
|
|
|
|
|
|
|
|||||||
| Adjusted EBITDA margin |
26.1 | % | 25.4 | % | 25.4 | % | ||||||
| * | Amounts may not recalculate due to rounding. |
| (1) | EBITDA is defined as earnings before interest expense, income taxes, depreciation and amortization. |
| (2) | Adjusted EBITDA excludes non-GAAP adjustments for share-based compensation, certain one-time restructuring, integration, and transaction expenses, debt extinguishment charges, start-up costs, and the impact of foreign currency exchange gains and losses. |
| (3) | During fiscal year 2023, Integration and other includes one-time retention and severance payments, and other integration costs related to the Coherent transaction. During fiscal year 2022, Integration and other includes integration and restructuring charges from the Finisar acquisition. |
| (4) | Transaction fees and financing includes debt extinguishment costs and various fees related to closing the Coherent transaction. |
| coherent.com | T. 724.352.4455 | Page 12 |
Table 6
GAAP Earnings Per Share Calculation*
$ Millions
(Unaudited)
| Three Months Ended | ||||||||||||
| Sept 30, 2022 |
Jun 30, 2022 |
Sept 30, 2021 |
||||||||||
| Numerator |
||||||||||||
| Net earnings (loss) |
$ | (38.7 | ) | $ | 43.6 | $ | 74.5 | |||||
| Deduct Series A preferred stock dividends |
(6.9 | ) | (6.9 | ) | (6.9 | ) | ||||||
| Deduct Series B redeemable preferred dividends |
(28.7 | ) | (10.4 | ) | (10.2 | ) | ||||||
|
|
|
|
|
|
|
|||||||
| Basic earnings (loss) available to common shareholders |
$ | (74.3 | ) | $ | 26.3 | $ | 57.4 | |||||
|
|
|
|
|
|
|
|||||||
| Effect of dilutive securities: |
||||||||||||
| Add back interest on convertible notes |
$ | — | $ | 0.6 | $ | 0.5 | ||||||
|
|
|
|
|
|
|
|||||||
| Diluted earnings (loss) available to common shareholders |
$ | (74.3 | ) | 26.9 | $ | 57.9 | ||||||
|
|
|
|
|
|
|
|||||||
| Denominator |
||||||||||||
| Weighted average shares |
133.3 | 106.5 | 105.8 | |||||||||
| Effect of dilutive securities: |
||||||||||||
| Common stock equivalents |
— | 3.0 | 2.8 | |||||||||
| Convertible notes |
— | 7.3 | 7.3 | |||||||||
|
|
|
|
|
|
|
|||||||
| Diluted weighted average common shares |
133.3 | 116.8 | 115.8 | |||||||||
|
|
|
|
|
|
|
|||||||
| Basic earnings (loss) per common share |
$ | (0.56 | ) | $ | 0.25 | $ | 0.54 | |||||
|
|
|
|
|
|
|
|||||||
| Diluted earnings (loss) per common share |
$ | (0.56 | ) | $ | 0.23 | $ | 0.50 | |||||
|
|
|
|
|
|
|
|||||||
| * | Amounts may not recalculate due to rounding. |
| coherent.com | T. 724.352.4455 | Page 13 |
Table 7
Non-GAAP Earnings Per Share Calculation*
$ Millions
(Unaudited)
| Three Months Ended | ||||||||||||
| Sept 30, 2022 |
Jun 30, 2022 |
Sept 30, 2021 |
||||||||||
| Numerator |
||||||||||||
| Net earnings on non-GAAP basis |
$ | 183.6 | $ | 133.7 | $ | 117.7 | ||||||
| Deduct Series A preferred stock dividends |
(6.9 | ) | (6.9 | ) | (6.9 | ) | ||||||
| Deduct Series B redeemable preferred dividends |
(28.7 | ) | (10.4 | ) | (10.2 | ) | ||||||
|
|
|
|
|
|
|
|||||||
| Basic earnings available to common shareholders |
$ | 148.1 | $ | 116.4 | $ | 100.6 | ||||||
|
|
|
|
|
|
|
|||||||
| Effect of dilutive securities: |
||||||||||||
| Add back interest on convertible notes |
$ | 0.4 | $ | 0.6 | $ | 0.5 | ||||||
| Add back Series A preferred stock dividends |
6.9 | 6.9 | 6.9 | |||||||||
|
|
|
|
|
|
|
|||||||
| Diluted earnings available to common shareholders |
$ | 155.3 | $ | 123.8 | $ | 108.0 | ||||||
|
|
|
|
|
|
|
|||||||
| Denominator |
||||||||||||
| Weighted average shares |
133.3 | 106.5 | 105.8 | |||||||||
| Effect of dilutive securities: |
||||||||||||
| Common stock equivalents |
1.5 | 3.0 | 2.8 | |||||||||
| Convertible notes |
4.5 | 7.3 | 7.3 | |||||||||
| Series A Mandatory Convertible Preferred Stock |
9.6 | 8.9 | 8.9 | |||||||||
|
|
|
|
|
|
|
|||||||
| Diluted weighted average common shares |
148.8 | 125.7 | 124.8 | |||||||||
|
|
|
|
|
|
|
|||||||
| Basic earnings per common share on non-GAAP basis |
$ | 1.11 | $ | 1.09 | $ | 0.95 | ||||||
|
|
|
|
|
|
|
|||||||
| Diluted earnings per common share on non-GAAP basis |
$ | 1.04 | $ | 0.98 | $ | 0.87 | ||||||
|
|
|
|
|
|
|
|||||||
| * | Amounts may not recalculate due to rounding. |
| coherent.com | T. 724.352.4455 | Page 14 |
Table 8
Example EPS Calculations (1)
$ Millions
| Hypothetical Earnings Level for Q2 FY23 | ||||||||||||||||
| Non-GAAP net earnings |
$ | 162.0 | $ | 171.0 | $ | 180.0 | $ | 200.0 | ||||||||
| Deduct Series B redeemable preferred dividends |
(29.4 | ) | (29.4 | ) | (29.4 | ) | — | |||||||||
|
|
|
|
|
|
|
|
|
|||||||||
| Non-GAAP net earnings available to common shareholders |
$ | 132.6 | $ | 141.6 | $ | 150.6 | $ | 200.0 | ||||||||
|
|
|
|
|
|
|
|
|
|||||||||
| Diluted weighted average common shares |
151.0 | 151.0 | 151.0 | 177.0 | ||||||||||||
| Diluted earnings per common share on non-GAAP basis |
$ | 0.88 | $ | 0.94 | $ | 1.00 | $ | 1.13 | ||||||||
|
|
|
|
|
|
|
|
|
|||||||||
| (1) | The Company does not provide reconciliations of the hypothetical non-GAAP net earnings and hypothetical diluted non-GAAP EPS presented in this table. This table contains purely hypothetical figures, which are provided solely to illustrate how the Company would calculate diluted non-GAAP EPS under different factual scenarios. |
CONTACT:
Mary Jane Raymond
Treasurer and Chief Financial Officer
investor.relations@coherent.com
https://www.coherent.com/company/investor-relations
| coherent.com | T. 724.352.4455 | Page 15 |

November 2022 Investor Presentation Exhibit 99.2

Forward-Looking Statements This presentation contains forward-looking statements relating to future events and expectations that are based on certain assumptions and contingencies. The forward-looking statements are made pursuant to the safe harbor provisions of the U.S. Private Securities Litigation Reform Act of 1995 and relate to the Company’s performance on a going forward basis. The forward-looking statements in this presentation involve risks and uncertainties, which could cause actual results, performance or trends to differ materially from those expressed in the forward-looking statements herein or in previous disclosures. The Company believes that all forward-looking statements made by it in this presentation have a reasonable basis, but there can be no assurance that management’s expectations, beliefs, or projections as expressed in the forward-looking statements will actually occur or prove to be correct. In addition to general industry and global economic conditions, factors that could cause actual results to differ materially from those discussed in the forward-looking statements in this presentation include but are not limited to: (i) the failure of any one or more of the assumptions stated herein to prove to be correct; (ii) the risks relating to forward-looking statements and other “Risk Factors” discussed in the Company’s Annual Report on Form 10-K for the fiscal year ended June 30, 2022 and additional risk factors that may be identified from time to time in filings of the Company; (iii) the substantial indebtedness the Company incurred in connection with its acquisition of Coherent, Inc. (the “Transaction”) and the need to generate sufficient cash flows to service and repay such debt; (iv) the possibility that the Company may be unable to achieve expected synergies, operating efficiencies and other benefits within the expected time-frames or at all and to successfully integrate operations of Coherent, Inc. (“Coherent”) with those of the Company; (v) the possibility that such integration may be more difficult, time-consuming or costly than expected or that operating costs and business disruption (including, without limitation, disruptions in relationships with employees, customers or suppliers) may be greater than expected in connection with the Transaction; (vi) any unexpected costs, charges or expenses resulting from the Transaction; (vii) the risk that disruption from the Transaction materially and adversely affects the respective businesses and operations of the Company and Coherent; (viii) potential adverse reactions or changes to business relationships resulting from the completion of the Transaction; (ix) the ability of the Company to retain and hire key employees; (x) the purchasing patterns of customers and end users; (xi) the timely release of new products, and acceptance of such new products by the market; (xii) the introduction of new products by competitors and other competitive responses; (xiii) the Company’s ability to assimilate recently acquired businesses, and realize synergies, cost savings, and opportunities for growth in connection therewith, together with the risks, costs, and uncertainties associated with such acquisitions; (xiv) the Company’s ability to devise and execute strategies to respond to market conditions; (xv) the risks to realizing the benefits of investments in R&D and commercialization of innovations; (xvi) the risks that the Company’s stock price will not trade in line with industrial technology leaders; and/or (xvi) the risks of business and economic disruption related to the currently ongoing COVID-19 outbreak and any other worldwide health epidemics or outbreaks that may arise. The Company disclaims any obligation to update information contained in these forward-looking statements, whether as a result of new information, future events or developments, or otherwise. All information in this presentation is as of November 9, 2022. This presentation contains non-GAAP financial measures and key metrics relating to the Company’s past performance. These non-GAAP financial measures are in addition to, and not as a substitute for or superior to, measures of financial performance prepared in accordance with U.S. GAAP. There are a number of limitations related to the use of these non-GAAP financial measures versus their nearest GAAP equivalents. For example, other companies may calculate non-GAAP financial measures differently or may use other measures to evaluate their performance, all of which could reduce the usefulness of our non-GAAP financial measures as tools for comparison. As required by Regulation G, we have provided reconciliations of those measures to the most directly comparable GAAP measures, which are available in the Appendix.

Patents(2) COHERENT at a Glance From a Foundation of Materials and Imagination, We Enable Exciting Megatrends 1971 Year Founded COHR Nasdaq 130 Locations 3,000+ 28,000+ Employees(2) FY22 Revenue(1) $4.8 B 24 Countries VERTICAL INTEGRATION Materials, Components, Subsystems, Systems and Service 4,400+ Engineering & Technology Employees(2) Available Market(2) $65 B Proforma non-GAAP revenue combines II-VI FY22 revenue (as of FYE 6/30/22) and Coherent 6/30/22 TTM. Not calculated in accordance with Article 11 of SEC regulation S-X. As of July 1, 2022

$4.8 Billion of Proforma(1) Revenue in FY22 Proforma non-GAAP revenue combines II-VI FY22 revenue (as of FYE 6/30/22) and Coherent 6/30/22 TTM. Not calculated in accordance with Article 11 of SEC regulation S-X. Revenue by region is based on customer headquarter addresses. Industrial Communications Electronics Instrumentation North America Europe China Other Materials Lasers Networking Korea & Japan

Building Momentum for 50 Years One of the largest photonics and compound semiconductor companies Materials expertise drives differentiation in multiple growing markets Vertically integrated, diverse global manufacturing footprint History of insightful targeting and successful integration of strategic acquisitions Experience management team with a successful track record Strong execution and resilient growth

Revenue(1) ($M) IIVI+COHR Proforma(3) Figures prior to FY2019 do not reflect the adoption of ASC 606. FY21 actual. See Appendix for reconciliation to most comparable GAAP measures. Prepared in accordance to ASC 805. Pro Forma includes the revenue of Finisar in Q1FY20 prior to the acquisition date of 9/24/20. Not calculated in accordance with Article 11 of SEC regulation S-X. 2022 - Laser sources & systems 2019 - Indium phosphide technology platform 2016 - Epitaxial wafer and SiC electronic devices 2013 - Gallium arsenide technology platform 2010 - Optical networks & China market 5 Transformative Acquisitions Insightful Targeting and Integration of Strategic Acquisitions CAGR 20% 10 Years of Continuous Revenue Growth

Our Products Responsible sourcing Environment People Governance Innovation and impact Product quality and lean manufacturing Conflict materials and traceability Human rights Supplier diversity Supplier engagement Climate and energy management in our operations Waste management Environmental, health, and safety Diversity, equity, and inclusion Talent acquisition Talent management Employee management Employee wellness Community engagement Corporate governance Ethical business conduct and compliance Enterprise risk management Data privacy and security Corporate Social Responsibility OUR 5 ESG PILLARS We are focused on making the world safer, healthier, closer, and more efficient. Energy FY21 FY22 Total electricity consumption (MWh) 547,557 564,689 Self-generated electricity (%) 0% 0% Electricity purchased from the grid (%) 100% 100% Total fuel consumption (MWh) 72, 222 74,779 Total Energy Consumption (MWh) 619,779 639,468 Energy consumption from renewable sources 22% 29% CARBON FOOTPRINT REDUCTION IS A PRIORITY As of June 30, 2022 Coherent purchases 38% of our electricity from renewable sources 35 sites (9 in U.S. and all sites in Europe) are powered by renewable energy Largest facility in China will be powered by 100% renewable energy by 2026 PRODUCTS AND TECHNOLOGY Investing to help the world transition to cleaner energy solutions, including: Silicon Carbide for power electronics Advanced Lithium Selenium Sulfur batteries EV battery recycling solution BOARD DIVERSITY 13 total Board members 5 of 13 (38%) are ethnically diverse 2 Board members are women 11 of 13 (82%) are independent 7 new directors over the past 5 years Note: Energy consumption includes electricity and natural gas only. No other energy sources are significant.

Operating Income II-VI Q1 FY23 financial highlights Revenue $1.3B $3.1B Backlog $42.5M GAAP $286.4M Non-GAAP Earnings (Loss) Per Share $(0.56) GAAP $1.04 Non-GAAP (1) Revenue by region is based on customer headquarter addresses Industrial Communications Electronics Instrumentation North America Europe China Korea and Japan Other REVENUE BY REGION(1) REVENUE BY END MARKET

All non-GAAP amounts exclude certain adjustments for share-based compensation, acquired intangible amortization expense, certain one-time transaction expenses, debt extinguishment expense, fair value measurement period adjustments and restructuring and related items. See Appendix for reconciliation to most comparable GAAP measures. II-VI Incorporated and Coherent, Inc. figures are for the three months ended June 30, 2022 Strong Execution and Synergy Realization Post Coherent Transaction Close Driving Margins Non-GAAP Gross Margin(1) Non-GAAP Operating Margin(1) Attractive and Increasing Operating Margins Proforma(2) Proforma(2)

Three REPORTING Segments MATERIALS NETWORKING LASERS

Half a billion dollars in annual R&D Investment Combined R&D and capex spend expected to be highest in industry and to accelerate breakthroughs, time-to-market and time-to-scale advantages Increased scale improves competitiveness and drives more strategic dialogue with customers Will enable better alignment of organic and inorganic investments to market demand Drives profitability and targeted returns “We are mainly constrained by the quality of our materials and the limits of our imaginations.” Dr. Carl J. Johnson Co-founder and first CEO of II-VI

Simplifying and Strengthening our Focus on Four Markets with a Combined $65B in TAM INDUSTRIAL COMMUNICATIONS ELECTRONICS INSTRUMENTATION TAM: $28B CAGR: 13% TAM: $21B CAGR: 12% TAM: $11B CAGR: 17% TAM: $5B CAGR: 7% Note: TAM based on CY2022; CAGR based on 2022-27 timeframe. Sources: LightCounting, Omdia, Cignal AI, Yole, Internal Estimates Sources: Optech Consulting, Strategies Unlimited, SEMI, Internal Estimates Sources: Strategies Unlimited, Markets & Markets, SDI (Strategic Directions), Internal Estimates Sources: IDC, Morgan Stanley, Research & Markets, Forbes, Yole, Strategy Analytics, Internal Estimates
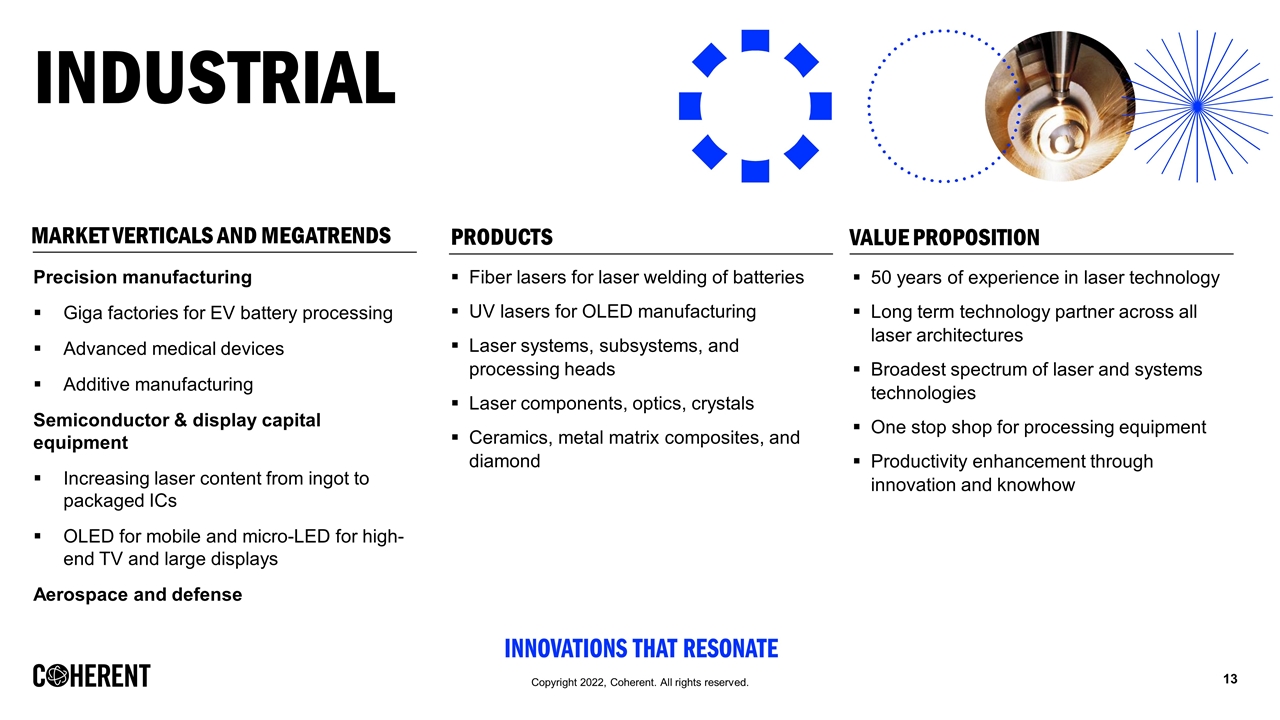
Industrial Precision manufacturing Giga factories for EV battery processing Advanced medical devices Additive manufacturing Semiconductor & display capital equipment Increasing laser content from ingot to packaged ICs OLED for mobile and micro-LED for high-end TV and large displays Aerospace and defense PRODUCTS Fiber lasers for laser welding of batteries UV lasers for OLED manufacturing Laser systems, subsystems, and processing heads Laser components, optics, crystals Ceramics, metal matrix composites, and diamond VALUE PROPOSITION 50 years of experience in laser technology Long term technology partner across all laser architectures Broadest spectrum of laser and systems technologies One stop shop for processing equipment Productivity enhancement through innovation and knowhow MARKET VERTICALS AND MEGATRENDS
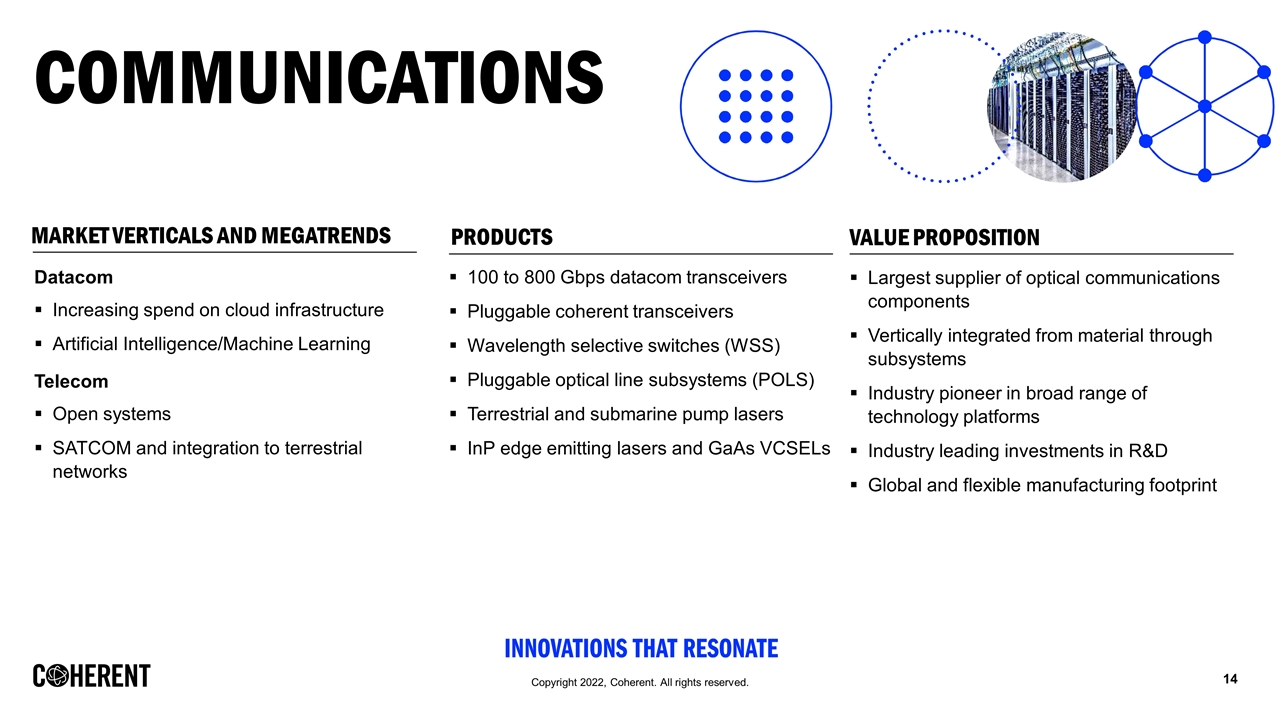
Communications Datacom Increasing spend on cloud infrastructure Artificial Intelligence/Machine Learning Telecom Open systems SATCOM and integration to terrestrial networks 100 to 800 Gbps datacom transceivers Pluggable coherent transceivers Wavelength selective switches (WSS) Pluggable optical line subsystems (POLS) Terrestrial and submarine pump lasers InP edge emitting lasers and GaAs VCSELs Largest supplier of optical communications components Vertically integrated from material through subsystems Industry pioneer in broad range of technology platforms Industry leading investments in R&D Global and flexible manufacturing footprint PRODUCTS VALUE PROPOSITION MARKET VERTICALS AND MEGATRENDS
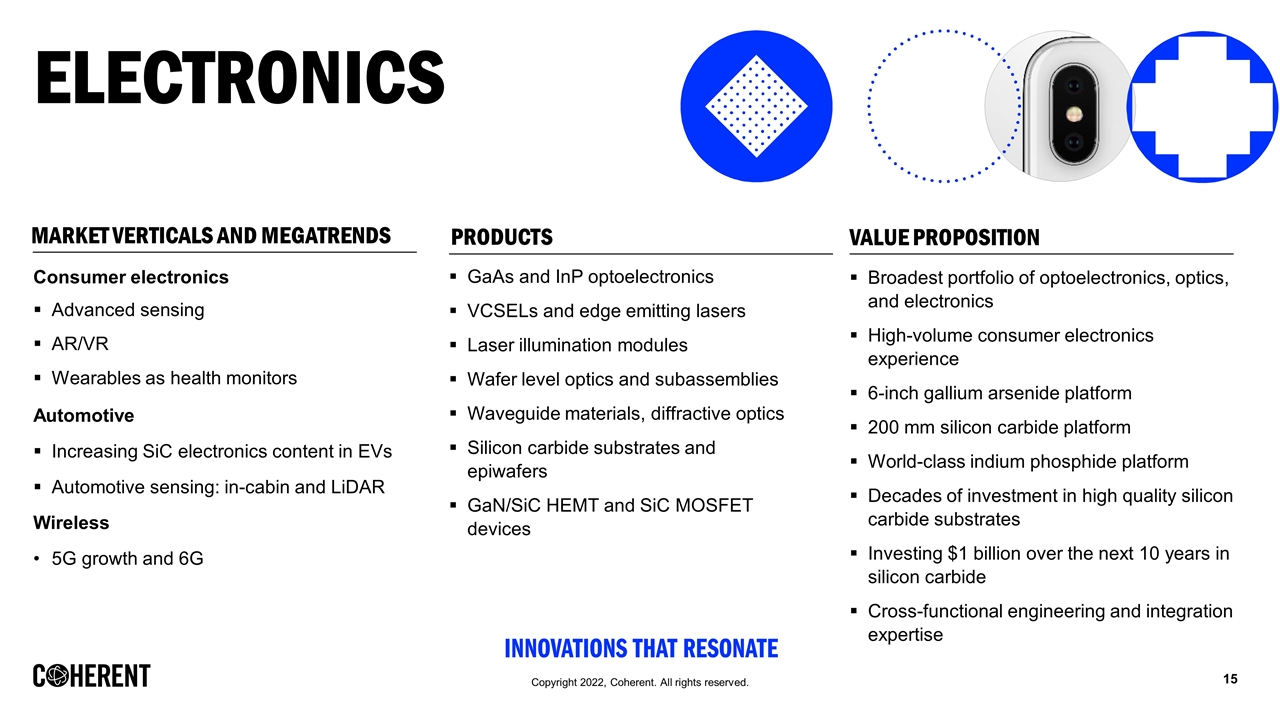
Electronics Consumer electronics Advanced sensing AR/VR Wearables as health monitors Automotive Increasing SiC electronics content in EVs Automotive sensing: in-cabin and LiDAR Wireless 5G growth and 6G GaAs and InP optoelectronics VCSELs and edge emitting lasers Laser illumination modules Wafer level optics and subassemblies Waveguide materials, diffractive optics Silicon carbide substrates and epiwafers GaN/SiC HEMT and SiC MOSFET devices Broadest portfolio of optoelectronics, optics, and electronics High-volume consumer electronics experience 6-inch gallium arsenide platform 200 mm silicon carbide platform World-class indium phosphide platform Decades of investment in high quality silicon carbide substrates Investing $1 billion over the next 10 years in silicon carbide Cross-functional engineering and integration expertise PRODUCTS VALUE PROPOSITION MARKET VERTICALS AND MEGATRENDS
instrumentation Materials, optics, lasers, and thermoelectrics Components to subassemblies and subsystems Optical, mechanical, electrical and software integration ISO 9001 & 13485 Life sciences (biotechnology, medical,and environmental) and scientific segment solutions Custom solutions from proof-of-concept to manufacturing at scale Rapid time to market of complete turnkey subassemblies and systems Broad product portfolio to support a wide range of applications Extensive technology innovation for next-generation capabilities Global manufacturing footprint and flexible supply chain partners Smart healthcare evolution, largely based on technology Point-of-care diagnostics Personalized medicine Environmental sustainability Advanced instrumentation PRODUCTS VALUE PROPOSITION MEGATRENDS

Silicon Carbide Electrification of transportation Sustainability of the planet
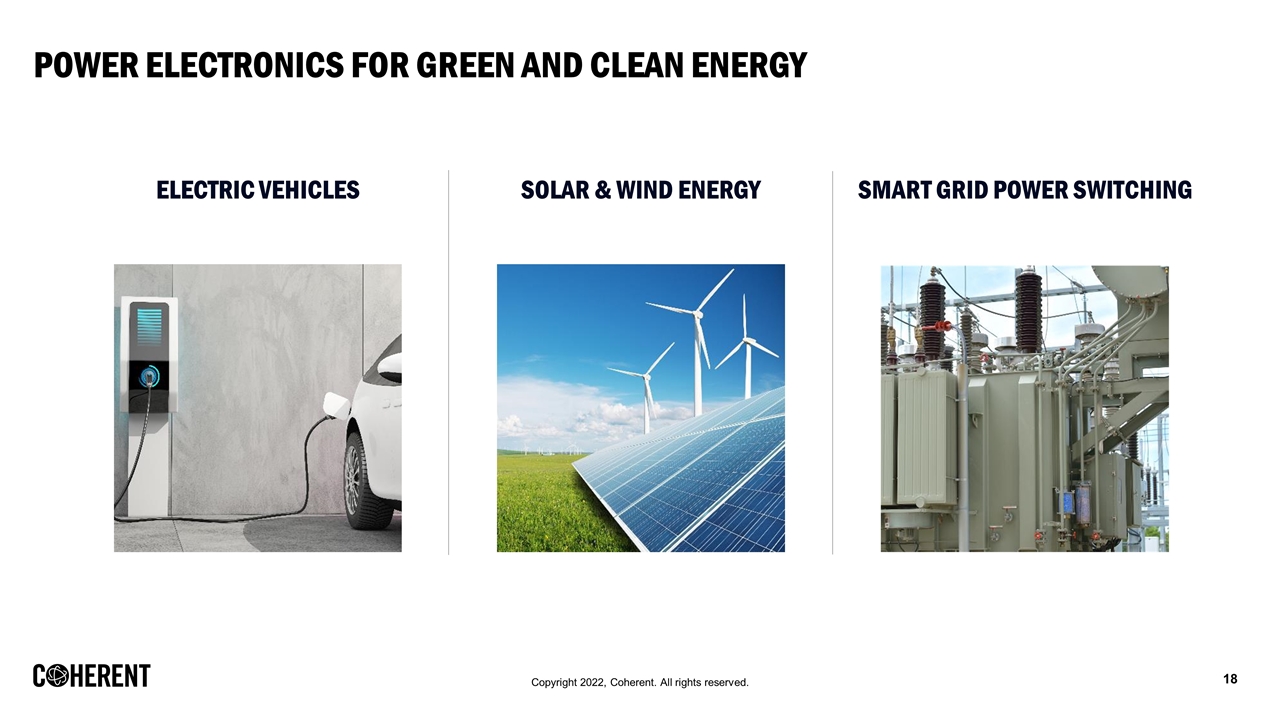
Power Electronics for Green and clean Energy ELECTRIC VEHICLES SOLAR & WIND ENERGY SMART GRID POWER SWITCHING

NOW, NEXT, and Beyond Silicon Carbide Materials 100 mm 150 mm 3 inch 200 mm 2015 World’s First 200 mm Demonstrated 2019 4H n-Type 6H SI 2021 Back-end Processing in China 2024 Manufacturing 2012 Demonstrated 2013 Manufactured 2005 Demonstrated 2007 High Quality Wafer 2009 Manufactured Demonstrated 2004 Manufactured 2 inch 2000 Manufactured Wafer Size What’s next: Targeting the world’s first 300 mm demonstration Two decades of innovation

SiC Modules SiC Devices SiC Chips SiC Epiwafers SiC Substrates Accelerating Time-to-Market II-VI and GE Technology II-VI and GE Technology II-VI and GE Technology II-VI (3DSiC®) II-VI JUNE 2020 - Licensed technology from GE to manufacture silicon carbide devices and modules for power electronics. APRIL 2021 - Expanded SiC wafer finishing manufacturing footprint in China. FEBRUARY 2022 - Qualified 1200 V SiC MOSFET and expanded relationship with GE. Vertical Integration

Acquisition of Coherent
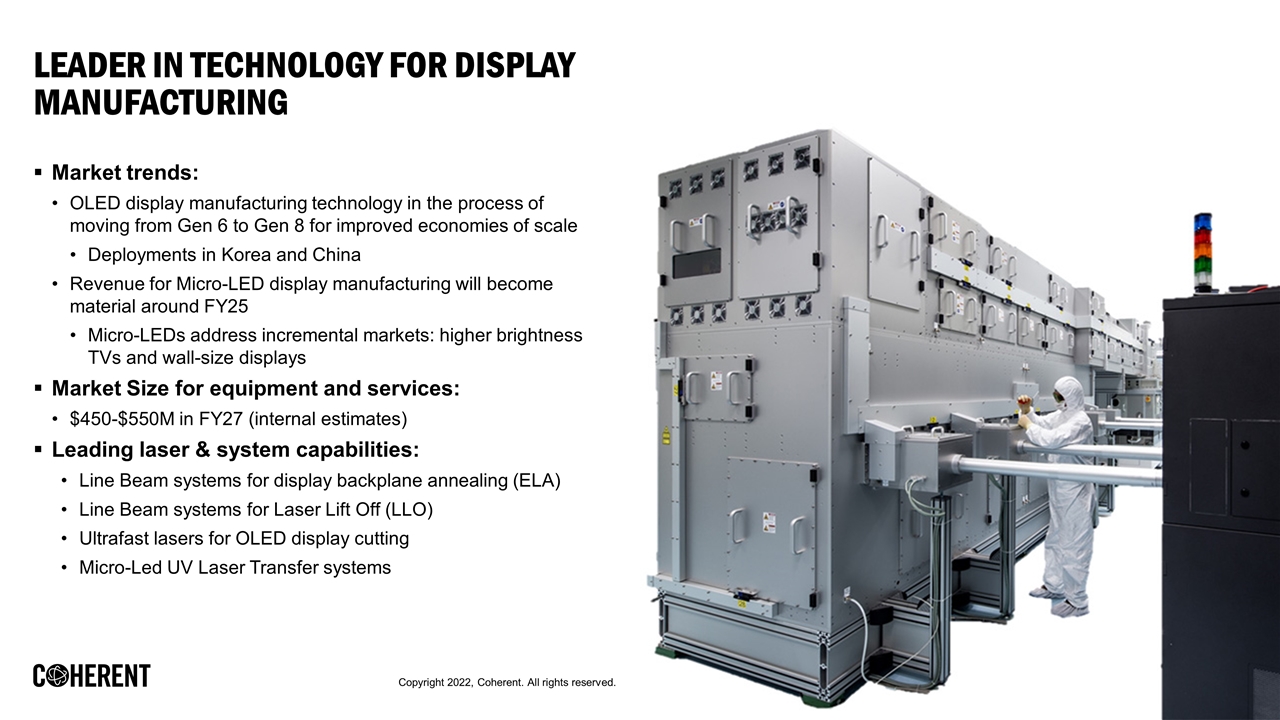
Leader in Technology for Display Manufacturing Market trends: OLED display manufacturing technology in the process of moving from Gen 6 to Gen 8 for improved economies of scale Deployments in Korea and China Revenue for Micro-LED display manufacturing will become material around FY25 Micro-LEDs address incremental markets: higher brightness TVs and wall-size displays Market Size for equipment and services: $450-$550M in FY27 (internal estimates) Leading laser & system capabilities: Line Beam systems for display backplane annealing (ELA) Line Beam systems for Laser Lift Off (LLO) Ultrafast lasers for OLED display cutting Micro-Led UV Laser Transfer systems
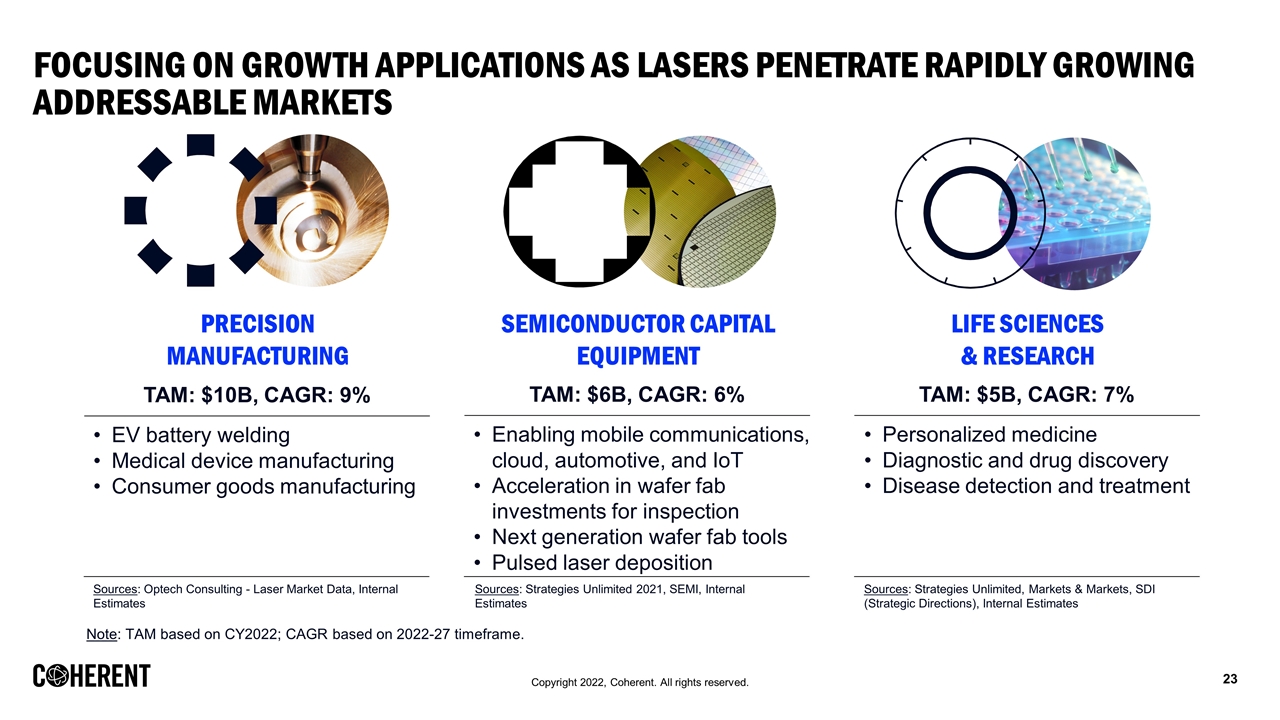
Focusing on growth Applications as lasers penetrate rapidly growing addressable markets PRECISION MANUFACTURING SEMICONDUCTOR CAPITAL EQUIPMENT LIFE SCIENCES & RESEARCH TAM: $10B, CAGR: 9% TAM: $6B, CAGR: 6% TAM: $5B, CAGR: 7% Note: TAM based on CY2022; CAGR based on 2022-27 timeframe. Sources: Optech Consulting - Laser Market Data, Internal Estimates Sources: Strategies Unlimited, Markets & Markets, SDI (Strategic Directions), Internal Estimates Sources: Strategies Unlimited 2021, SEMI, Internal Estimates EV battery welding Medical device manufacturing Consumer goods manufacturing Enabling mobile communications, cloud, automotive, and IoT Acceleration in wafer fab investments for inspection Next generation wafer fab tools Pulsed laser deposition Personalized medicine Diagnostic and drug discovery Disease detection and treatment
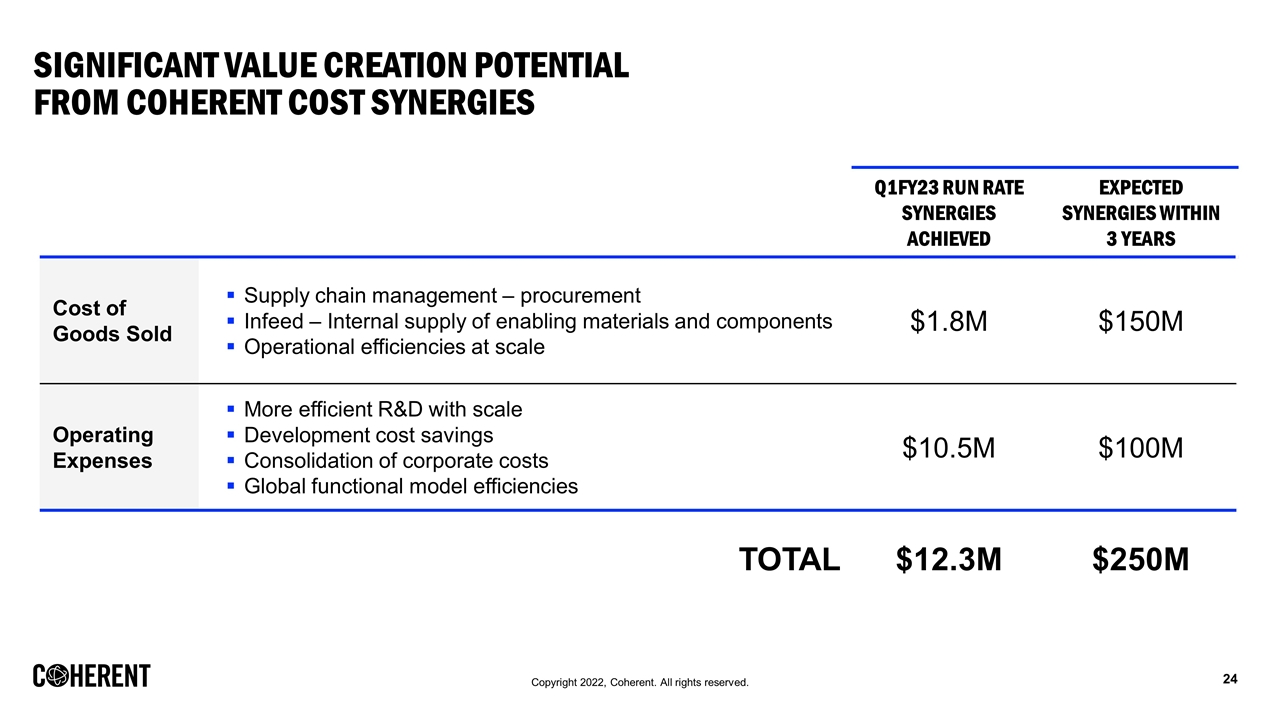
Significant Value Creation Potential from Coherent Cost Synergies Q1FY23 Run Rate Synergies Achieved Expected Synergies within 3 years Cost of Goods Sold Supply chain management – procurement Infeed – Internal supply of enabling materials and components Operational efficiencies at scale $1.8M $150M Operating Expenses More efficient R&D with scale Development cost savings Consolidation of corporate costs Global functional model efficiencies $10.5M $100M TOTAL $12.3M $250M
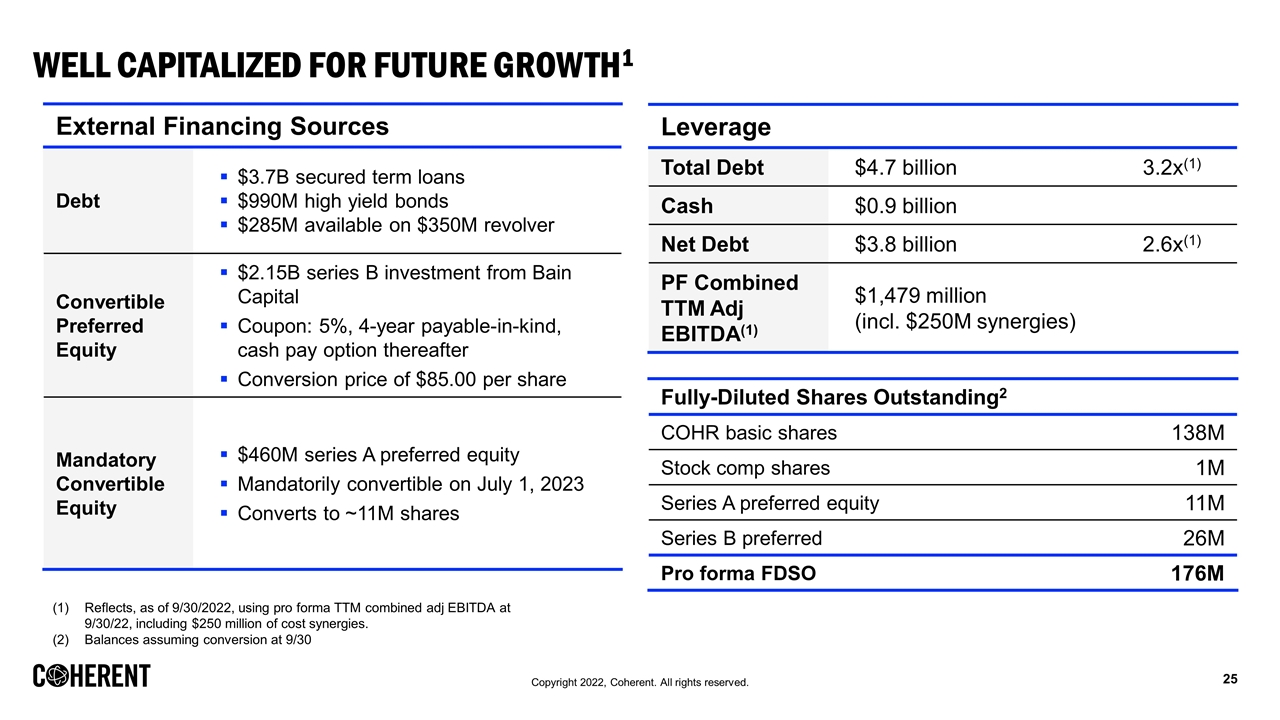
Well Capitalized for Future Growth1 External Financing Sources Debt $3.7B secured term loans $990M high yield bonds $285M available on $350M revolver Convertible Preferred Equity $2.15B series B investment from Bain Capital Coupon: 5%, 4-year payable-in-kind, cash pay option thereafter Conversion price of $85.00 per share Mandatory Convertible Equity $460M series A preferred equity Mandatorily convertible on July 1, 2023 Converts to ~11M shares Leverage Total Debt $4.7 billion3.2x(1) Cash $0.9 billion Net Debt $3.8 billion2.6x(1) PF Combined TTM Adj EBITDA(1) $1,479 million (incl. $250M synergies) Reflects, as of 9/30/2022, using pro forma TTM combined adj EBITDA at 9/30/22, including $250 million of cost synergies. Balances assuming conversion at 9/30 Fully-Diluted Shares Outstanding2 COHR basic shares 138M Stock comp shares 1M Series A preferred equity 11M Series B preferred 26M Pro forma FDSO 176M
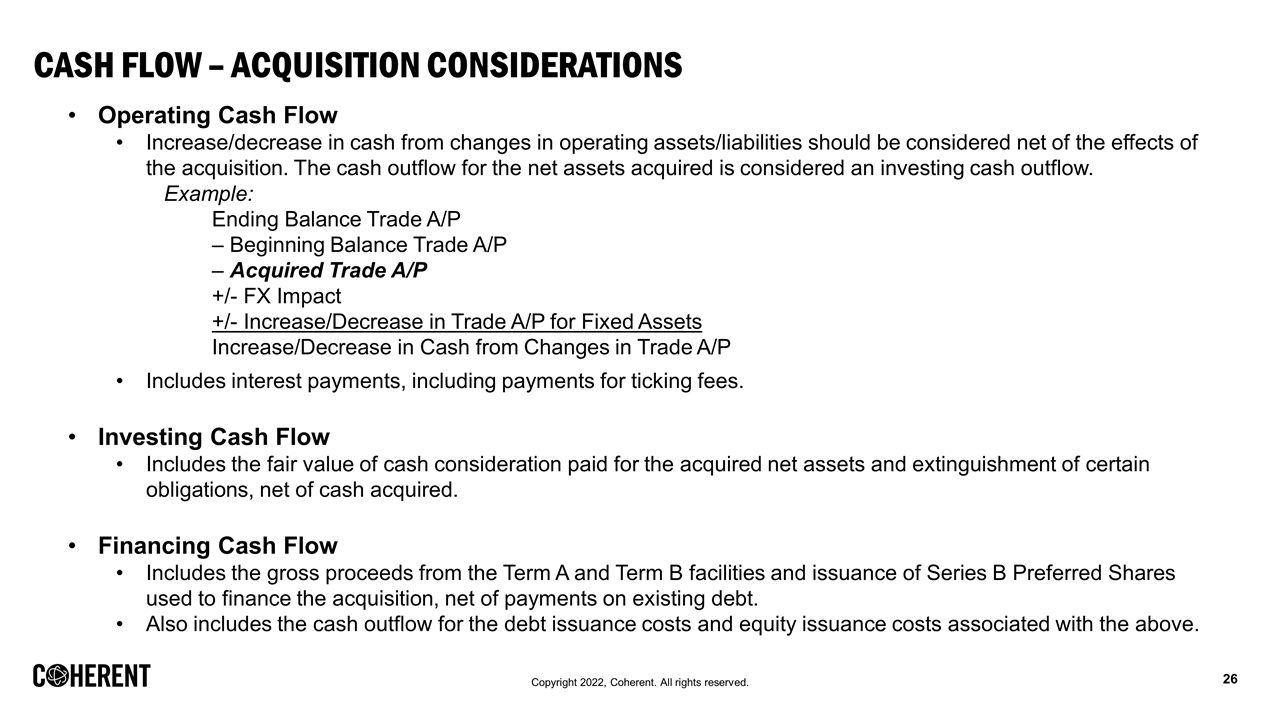
Cash flow – acquisition considerations Operating Cash Flow Increase/decrease in cash from changes in operating assets/liabilities should be considered net of the effects of the acquisition. The cash outflow for the net assets acquired is considered an investing cash outflow. Example: Ending Balance Trade A/P – Beginning Balance Trade A/P – Acquired Trade A/P +/- FX Impact +/- Increase/Decrease in Trade A/P for Fixed Assets Increase/Decrease in Cash from Changes in Trade A/P Includes interest payments, including payments for ticking fees. Investing Cash Flow Includes the fair value of cash consideration paid for the acquired net assets and extinguishment of certain obligations, net of cash acquired. Financing Cash Flow Includes the gross proceeds from the Term A and Term B facilities and issuance of Series B Preferred Shares used to finance the acquisition, net of payments on existing debt. Also includes the cash outflow for the debt issuance costs and equity issuance costs associated with the above.
Financial Appendix
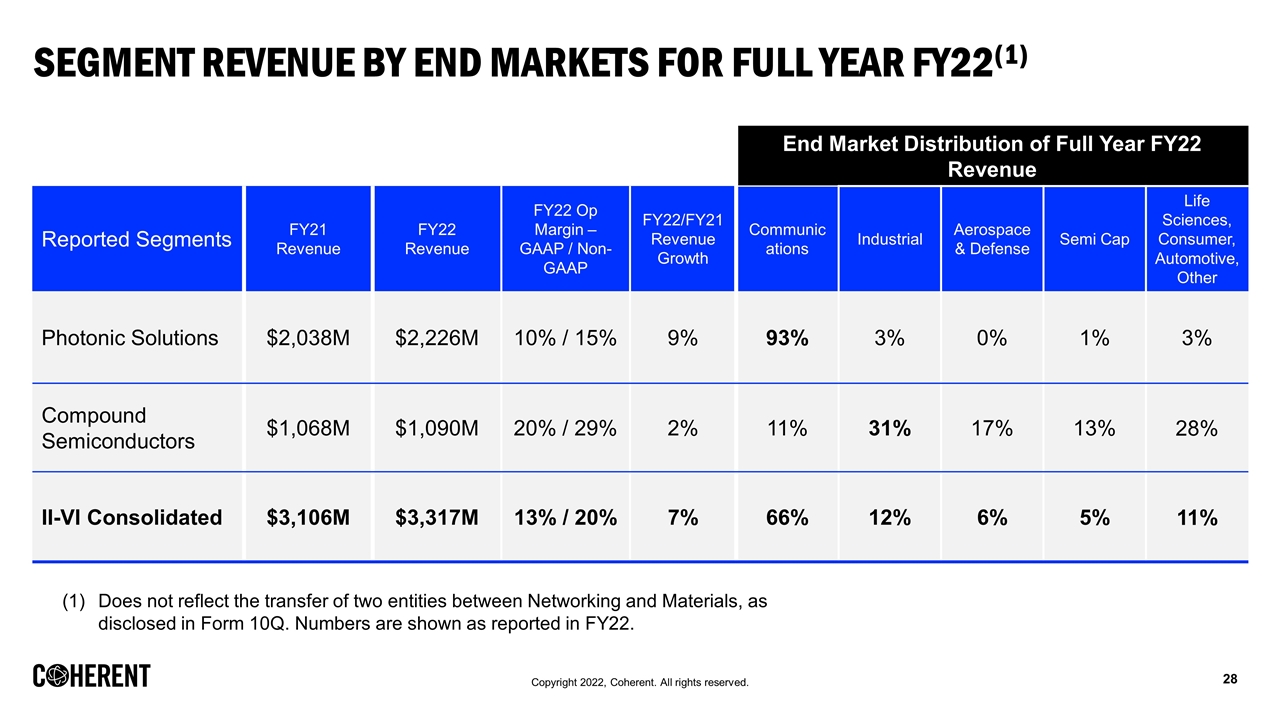
End Market Distribution of Full Year FY22 Revenue Reported Segments FY21 Revenue FY22 Revenue FY22 Op Margin – GAAP / Non-GAAP FY22/FY21 Revenue Growth Communications Industrial Aerospace & Defense Semi Cap Life Sciences, Consumer, Automotive, Other Photonic Solutions $2,038M $2,226M 10% / 15% 9% 93% 3% 0% 1% 3% Compound Semiconductors $1,068M $1,090M 20% / 29% 2% 11% 31% 17% 13% 28% II-VI Consolidated $3,106M $3,317M 13% / 20% 7% 66% 12% 6% 5% 11% Segment Revenue by End Markets for Full Year FY22(1) Does not reflect the transfer of two entities between Networking and Materials, as disclosed in Form 10Q. Numbers are shown as reported in FY22.

Mapping Into Four Markets Wireless Consumer Electronics Automotive ELECTRONICS Precision Manufacturing Semiconductor Capital Equipment Display Capital Equipment Aerospace & Defense INDUSTRIAL COMMUNICATIONS Communications INSTRUMENTATION Life Sciences Scientific Instrumentation Communications Optical Communications Wireless Precision Manufacturing Microelectronics Aerospace & Defense Instrumentation Industrial Semiconductor Capital Equipment Aerospace & Defense Life Sciences Consumer Electronics Automotive II-VI COHERENT

FY22 Revenue by FY23 Market Segments End Market Distribution of Full Year FY22 Revenue Companies FY22 Revenue Communications Industrial Electronics Instrumentation II-VI Incorporated $3,317M 65% 23% 9% 3% Coherent, Inc.(1) $1,520M(1) 0% 75% 0% 25% Proforma Combined(2) $4,837M(2) 45% 39% 6% 10% Coherent Revenue 6/30/22 TTM. Proforma non-GAAP revenue combines II-VI FY22 revenue (as of FYE 6/30/22) and Coherent 6/30/22 TTM. Not calculated in accordance with Article 11 of SEC regulation S-X.
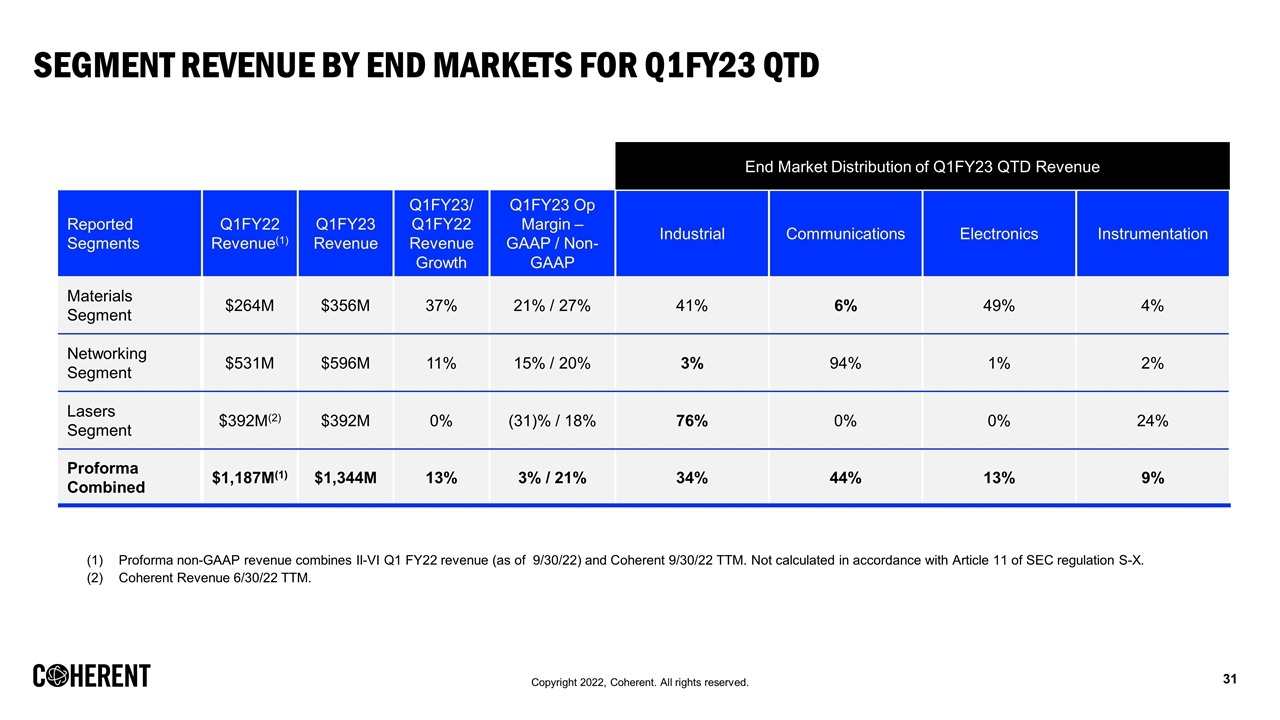
End Market Distribution of Q1FY23 QTD Revenue Reported Segments Q1FY22 Revenue(1) Q1FY23 Revenue Q1FY23/ Q1FY22 Revenue Growth Q1FY23 Op Margin – GAAP / Non-GAAP Industrial Communications Electronics Instrumentation Materials Segment $264M $356M 37% 21% / 27% 41% 6% 49% 4% Networking Segment $531M $596M 11% 15% / 20% 3% 94% 1% 2% Lasers Segment $392M(2) $392M 0% (31)% / 18% 76% 0% 0% 24% Proforma Combined $1,187M(1) $1,344M 13% 3% / 21% 34% 44% 13% 9% Segment Revenue by End Markets for Q1FY23 QTD Proforma non-GAAP revenue combines II-VI Q1 FY22 revenue (as of 9/30/22) and Coherent 9/30/22 TTM. Not calculated in accordance with Article 11 of SEC regulation S-X. Coherent Revenue 6/30/22 TTM.
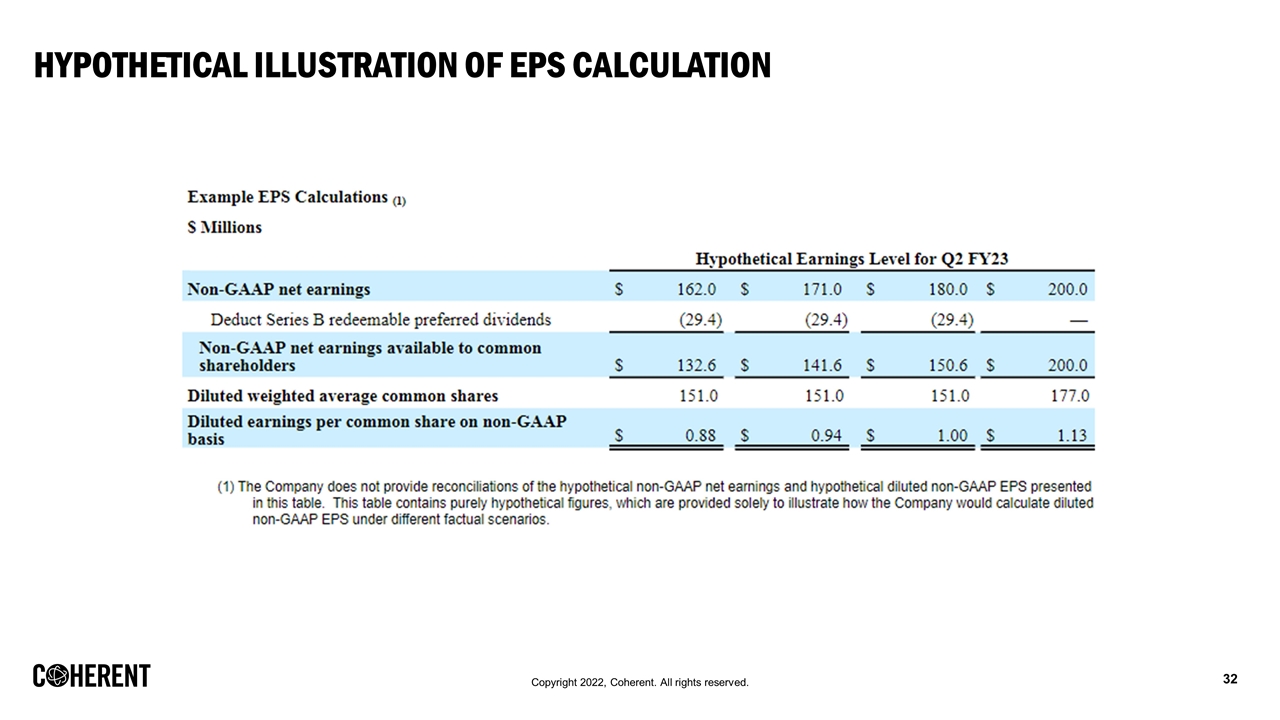
Hypothetical Illustration of EPS Calculation
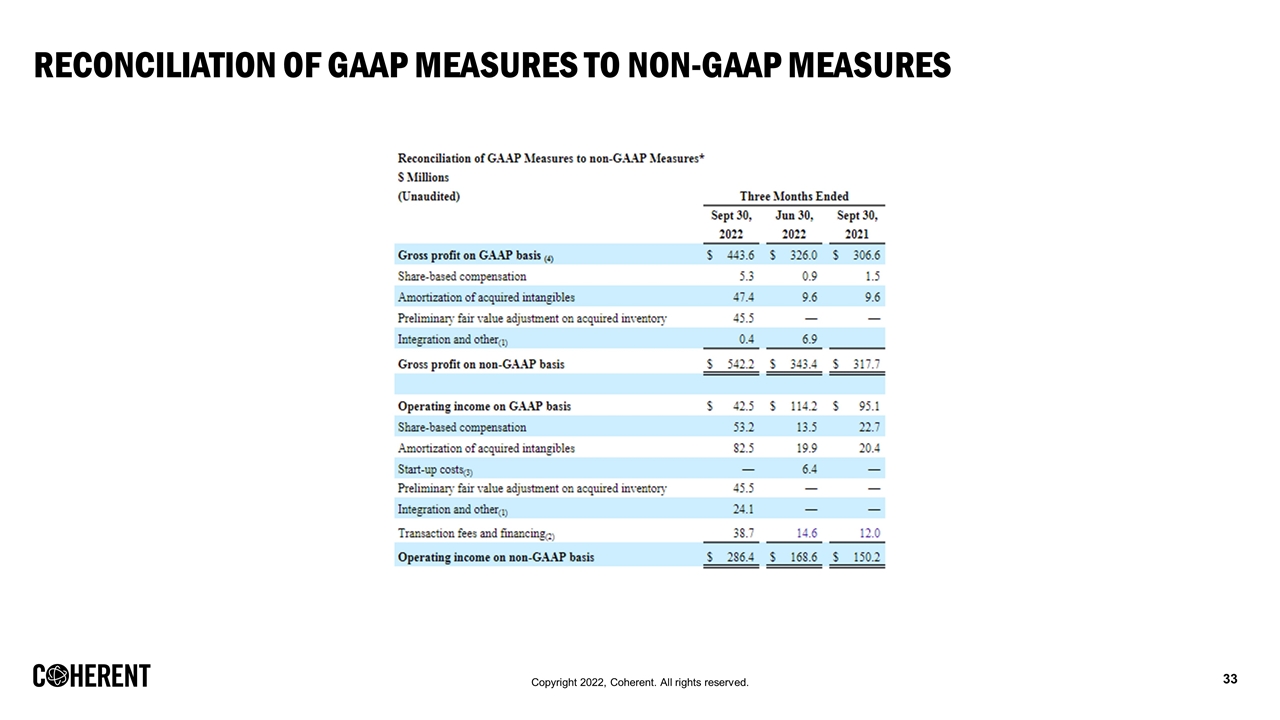
Reconciliation of GAAP Measures to Non-GAAP Measures
Reconciliation of GAAP Measures to Non-GAAP Measures
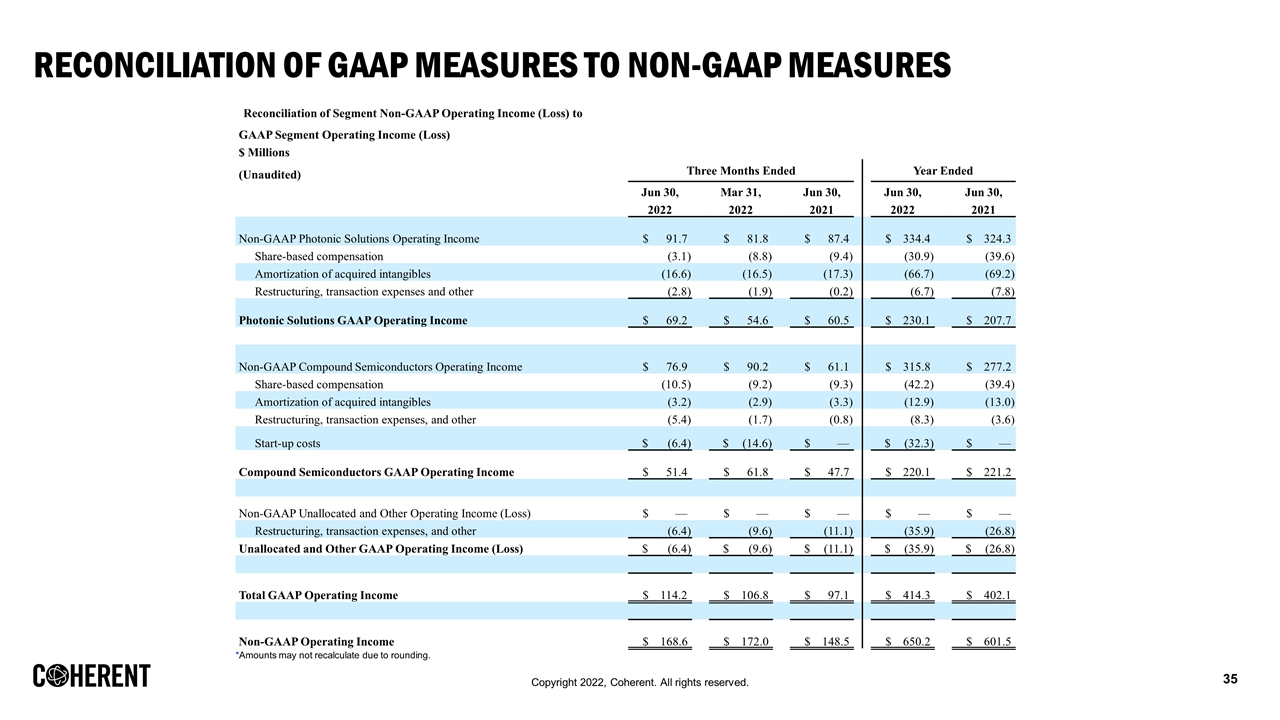
Reconciliation of GAAP Measures to Non-GAAP Measures Reconciliation of Segment Non-GAAP Operating Income (Loss) to GAAP Segment Operating Income (Loss) $ Millions (Unaudited) Three Months Ended Year Ended Jun 30, Mar 31, Jun 30, Jun 30, Jun 30, 2022 2022 2021 2022 2021 Non-GAAP Photonic Solutions Operating Income $91.7 $81.8 $87.4 $334.4 $324.3 Share-based compensation (3.1) (8.8) (9.4) (30.9) (39.6) Amortization of acquired intangibles (16.6) (16.5) (17.3) (66.7) (69.2) Restructuring, transaction expenses and other (2.8) (1.9) (0.2) (6.7) (7.8) Photonic Solutions GAAP Operating Income $69.2 $54.6 $60.5 $230.1 $207.7 Non-GAAP Compound Semiconductors Operating Income $76.9 $90.2 $61.1 $315.8 $277.2 Share-based compensation (10.5) (9.2) (9.3) (42.2) (39.4) Amortization of acquired intangibles (3.2) (2.9) (3.3) (12.9) (13.0) Restructuring, transaction expenses, and other (5.4) (1.7) (0.8) (8.3) (3.6) Start-up costs $(6.4) $(14.6) $— $(32.3) $— Compound Semiconductors GAAP Operating Income $51.4 $61.8 $47.7 $220.1 $221.2 Non-GAAP Unallocated and Other Operating Income (Loss) $— $— $— $— $— Restructuring, transaction expenses, and other (6.4) (9.6) (11.1) (35.9) (26.8) Unallocated and Other GAAP Operating Income (Loss) $(6.4) $(9.6) $(11.1) $(35.9) $(26.8) Total GAAP Operating Income $114.2 $106.8 $97.1 $414.3 $402.1 Non-GAAP Operating Income $168.6 $172.0 $148.5 $650.2 $601.5 *Amounts may not recalculate due to rounding.
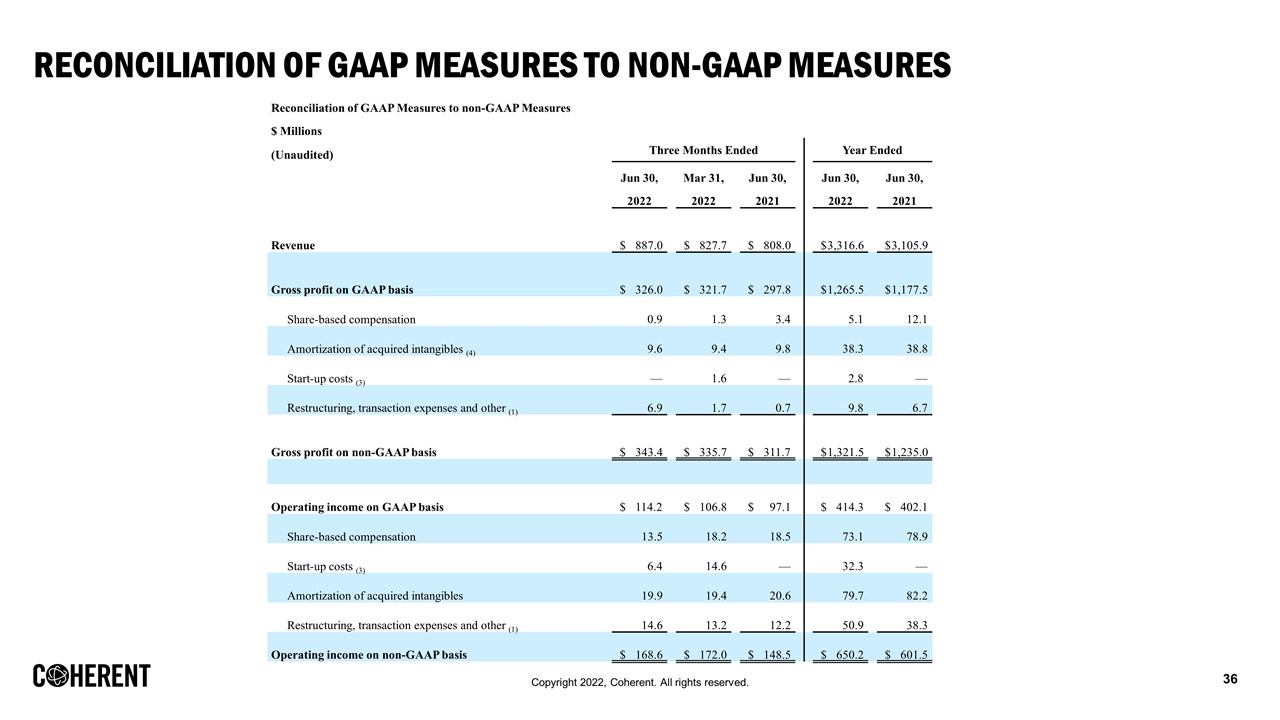
Reconciliation of GAAP Measures to Non-GAAP Measures Reconciliation of GAAP Measures to non-GAAP Measures $ Millions (Unaudited) Three Months Ended Year Ended Jun 30, Mar 31, Jun 30, Jun 30, Jun 30, 2022 2022 2021 2022 2021 Revenue $887.0 $827.7 $808.0 $3,316.6 $3,105.9 Gross profit on GAAP basis $326.0 $321.7 $297.8 $1,265.5 $1,177.5 Share-based compensation 0.9 1.3 3.4 5.1 12.1 Amortization of acquired intangibles (4) 9.6 9.4 9.8 38.3 38.8 Start-up costs (3) — 1.6 — 2.8 — Restructuring, transaction expenses and other (1) 6.9 1.7 0.7 9.8 6.7 Gross profit on non-GAAP basis $343.4 $335.7 $311.7 $1,321.5 $1,235.0 Operating income on GAAP basis $114.2 $106.8 $97.1 $414.3 $402.1 Share-based compensation 13.5 18.2 18.5 73.1 78.9 Start-up costs (3) 6.4 14.6 — 32.3 — Amortization of acquired intangibles 19.9 19.4 20.6 79.7 82.2 Restructuring, transaction expenses and other (1) 14.6 13.2 12.2 50.9 38.3 Operating income on non-GAAP basis $168.6 $172.0 $148.5 $650.2 $601.5
Reconciliation of GAAP Measures to Non-GAAP Measures
