| Exhibit |
Description
|
|
NAYAX LTD.
|
|||
|
By:
|
/s/ Gal Omer
|
||
|
Name: Gal Omer
|
|||
|
Title: Chief Legal Officer
|
|||
|
|
(1) |
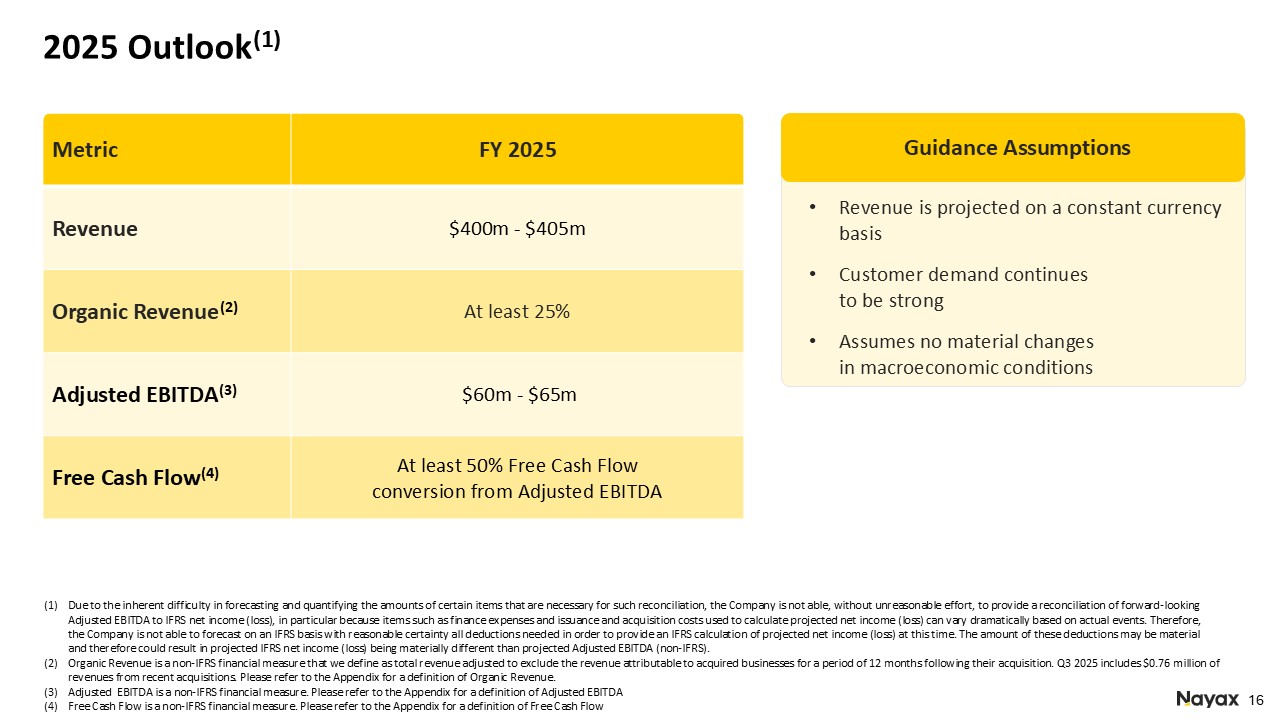
Organic Revenue, Adjusted EBITDA, Free Cash Flow and Adjusted OPEX are non-IFRS financial measures. Please refer to the footnote 3 in the table below and the additional tables at the end of this press release for a reconciliation of
Organic Revenue, Adjusted EBITDA, Free Cash Flow and Adjusted OPEX to the most directly comparable IFRS measure for each. The Company does not provide a reconciliation of forward-looking Adjusted EBITDA to IFRS net income (loss) due to the
inherent difficulty in forecasting and quantifying certain amounts that are necessary for such reconciliation, in particular, because special items such as finance expenses and issuance and acquisition costs used to calculate projected net
income (loss) can vary dramatically based on actual events. Therefore, the Company is not able to forecast on an IFRS basis with reasonable certainty all deductions needed in order to provide an IFRS calculation of projected net income (loss)
at this time. The amount of these deductions may be material and therefore could result in projected IFRS net income (loss) being materially different than projected Adjusted EBITDA (non-IFRS).
|
|
Revenue Summary
|
Q3 2025 ($M)
|
Q3 2024 ($M)
|
Growth (%)
|
|
Payment processing fees
|
47.7
|
36.0
|
32.5%
|
|
SaaS revenue
|
29.4
|
23.9
|
23.0%
|
|
Total recurring revenue (1)
|
77.1
|
59.9
|
28.7%
|
|
POS devices revenue (2)
|
27.2
|
23.1
|
17.7%
|
|
Total revenue (3)
|
104.3
|
83.0
|
25.7%
|
|
Margin Summary
|
Q3 2025
|
Q3 2024
|
Variance
|
|
Payment processing margin
|
39.6%
|
33.0%
|
6.6%
|
|
SaaS margin
|
76.3%
|
76.0%
|
0.3%
|
|
Total recurring margin
|
53.6%
|
50.1%
|
3.5%
|
|
POS devices margin
|
37.0%
|
34.4%
|
2.6%
|
|
Total margin
|
49.3%
|
45.7%
|
3.6%
|
|
|
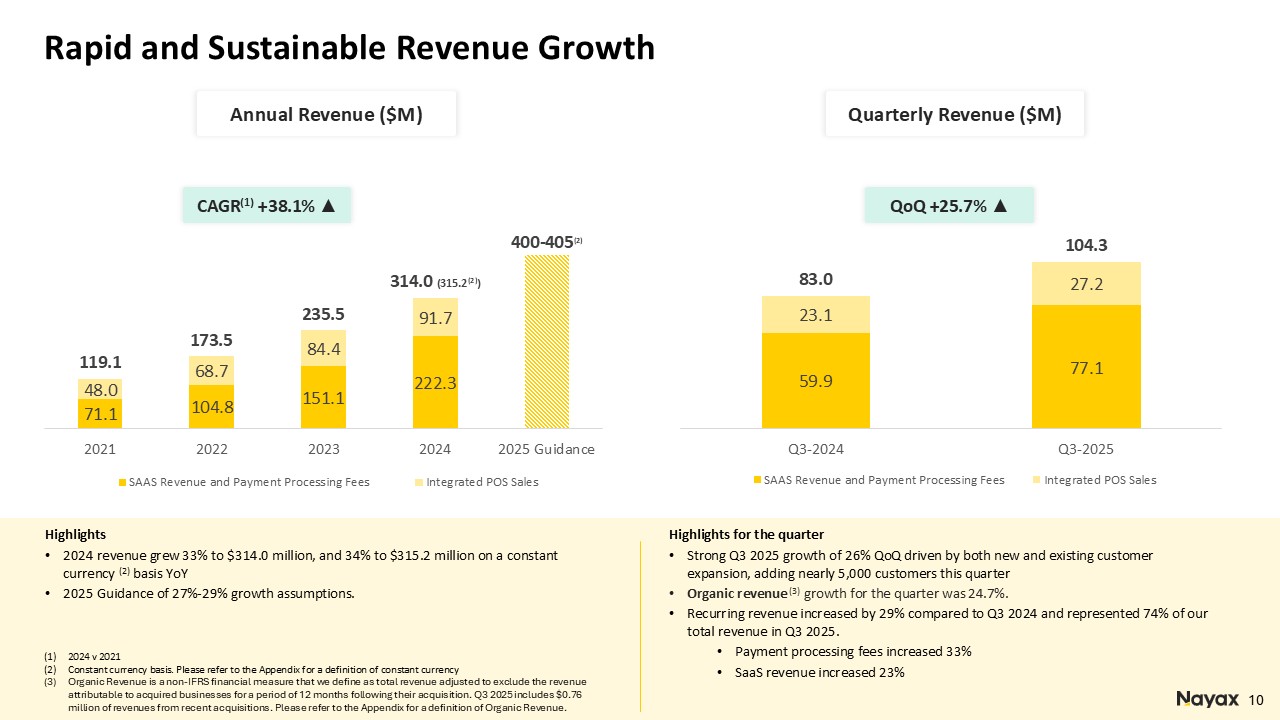
• |
Revenue increased 26% to $104.3 million from $83.0 million driven by both new and existing customer expansion. Revenue includes $2.0 million of favorable foreign exchange rate.
|
|
|
• |
Organic Revenue growth for the quarter was 24.7%.
|
|
|
• |
Recurring revenue from SaaS and payment processing fees grew 29%, to $77.1 million and represented 74% of total revenue.
|
|
|
o |
Processing revenue growth continues to demonstrate our success as a scalable and valued payment partner to our diverse customer base as the market continues its cash-to-cashless conversion.
|
|
|
• |
Hardware revenue increased by 18% to $27.2 million with strong demand for our products, solutions, and technology across all market segments.
|
|
|
• |
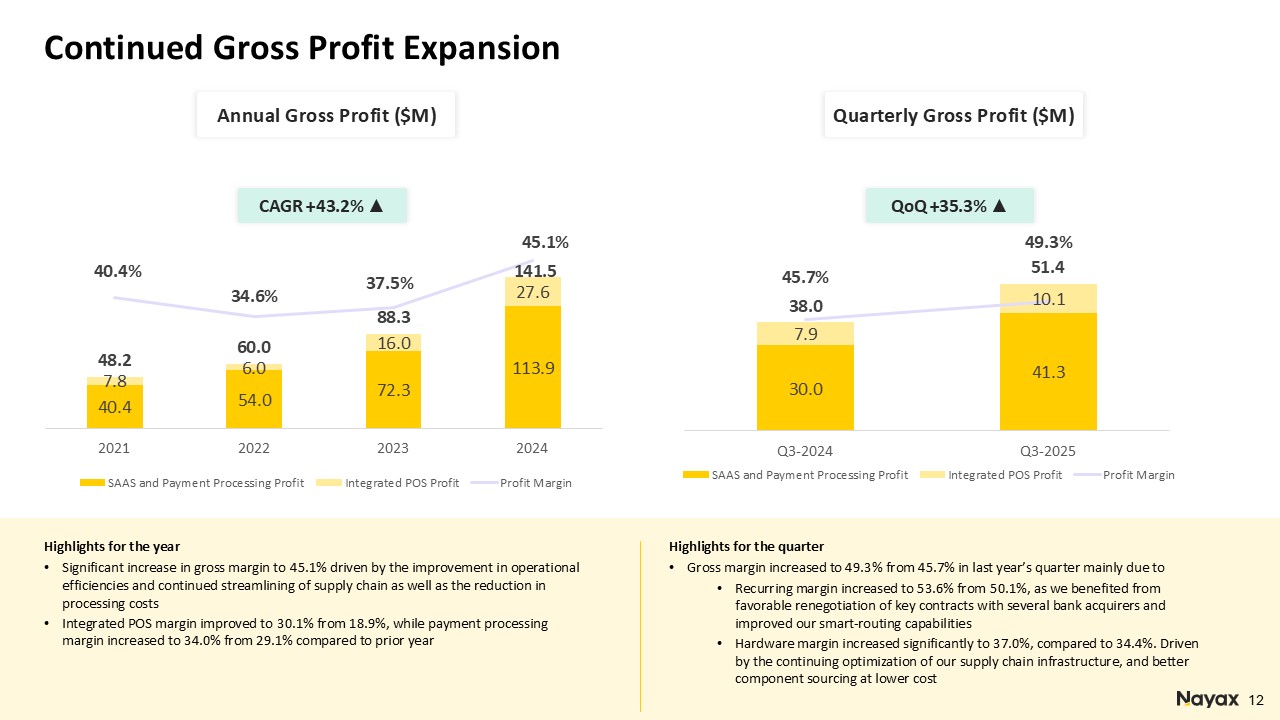
Gross margin improved to 49.3% from 45.7%, primarily due to:
|
|
|
o |
Recurring margin improved to 53.6% from 50.1%, driven mainly by processing margins that improved to 39.6% from 33.0% reflecting the ongoing benefits of renegotiated contracts with several bank acquirers and the Company’s improved
smart-routing capabilities.
|
|
|
o |
Hardware margin improved meaningfully to 37.0% from 34.4% driven by continuing optimization of our supply chain infrastructure, and better component sourcing and cost.
|
|
|
• |
Operating profit was $7.8 million compared to $1.5 million in last year’s third quarter.
|
|
|
• |
Net income was $3.5 million compared to $0.7 million in last year’s third quarter.
|
|
|
• |
Basic and diluted earnings per share for the quarter ending September 30, 2025 were $0.095 and $0.092, respectively. Basic and diluted earnings per share for the quarter ending September 30, 2024, were each $0.019 per share.
|
|
|
• |
Weighted average number of basic and diluted shares for the third quarter of 2025 were 37,102,759 and 38,451,507, respectively, compared with weighted average number of basic and diluted shares for the third quarter of 2024 of 36,370,817
and 37,171,974, respectively.
|
|
|
• |
Adjusted OPEX of $34 million dollars was 32.2% of revenue and continues to improve, a testament to our disciplined cost management.
|
|
|
• |
Adjusted EBITDA was $18.2 million, representing a margin of 17.5% of total revenue, compared to Adjusted EBITDA of $11.1 million, representing a margin of 13.3% of total revenue, in last year’s third quarter. This significant growth in
our Adjusted EBITDA demonstrates the continued scaling of operating leverage in the business.
|
|
|
• |
Cash flow provided from operating activities was $10.5 million and Free Cash Flow was $3.9 million mainly due to the timing of cash settlement from processing activities.
|
|
|
• |
As of September 30, 2025, the Company had $172.8 million in cash and cash equivalents and short-term deposits. Short-term and long-term debt balances were at $156.2 million.
|
|
Key Performance Indicators
|
Q3 2025
|
Q3 2024
|
Growth (%)
|
|
Total transaction value ($m)
|
1,763
|
1,310
|
34.6%
|
|
Number of processed transactions (millions)
|
736
|
609
|
20.9%
|
|
Take rate (payments) (4)
|
2.71%
|
2.75%
|
-0.04%
|
|
Managed and connected devices (thousands)
|
1,433
|
1,227
|
16.8%
|
|
Customers
|
109,571
|
90,875
|
20.6%
|
|
|
• |
Total transaction value grew by 34.6% to $1.763 billion.
|
|
|
• |
Number of processed transactions increased 20.9% to 736 million.
|
|
|
• |
Take rate was 2.71% as the Company continues to expand into additional verticals and new geographies.
|
|
|
• |
Total number of managed and connected devices was approximately 1.433 million devices representing an increase of 16.8%. Nayax added more than 56,300 devices in the third quarter of 2025.
|
|
|
• |
Growth in the customer base continued at a healthy pace, adding 4,880 new customers in the third quarter of 2025, bringing the total customer base to 109,571, an increase of 20.6%.
|
|
|
• |
The dollar-based net retention rate remained high at 122%, reflecting strong customer satisfaction, alongside a low customer churn rate of 2.8%
|
|
|
• |
Partnered with ChargeSmart EV, one of the largest US charge point operators, to improve the payment experience for EV drivers across the U.S. ChargeSmart EV has named Nayax as its preferred cashless supplier, and will integrate
Nayax’s EMV-certified solutions, making it easier for EV drivers to pay for services. For operators, the combination provides better visibility and real-time insights into station performance. This collaboration supports the broader push
toward simpler, more reliable EV charging as the market continues to grow quickly.
|
|
|
• |
Retail Pro (a Nayax Ltd. Company) has teamed up with Onebeat, an AI-powered inventory optimization platform, to help retailers better match their inventory to real demand. By connecting Retail Pro’s retail management tools with
Onebeat’s analytics, merchants can improve stock availability, reduce overordering, and react more quickly to changes in customer behavior.
|
|
|
• |
In August we announced a strategic partnership with Autel Energy, a leading global provider of EV charging solutions, to embed Nayax’s payment technology into approximately 100,000 Autel chargers across North America and
Europe by the end of 2026. We also developed EMV-Core SDK integration certification for Uno Mini with six leading Chinese OEM partners, enabling embedded contactless payments across EV charging and other unattended machines. The
certification validates Nayax’s embedded payment stack, paired with the Uno Mini terminal, and strengthens OEM adoption in one of the world’s largest manufacturing ecosystems.
|
|
|
• |
Signed a non-binding letter of intent and exclusivity to acquire Integral Vending, Nayax’s exclusive distribution partner in Mexico. The move reflects Nayax’s continued focus on strengthening its position in the Latin American
market. The combination of Integral Vending and Nayax is aligned with the Company’s multi-year strategy to bring an offering of a more complete suite of tools for managing routes, operations, and payments for the Latin American market.
|
|
|
• |
U.S. TOLL-FREE: 1-877-737-7051
|
|
|
• |
ISRAEL TOLL-FREE: 1-809-455-690
|
|
|
• |
INTERNATIONAL: 1-201-689-8878
|
|
|
• |
Replay TOLL-FREE: 1-844-512-2921
|
|
|
• |
Replay TOLL/INTERNATIONAL: 1-412-317-6671
|
|
|
• |
Access PIN: 13756921
|
|
Public Relations Contact:
Scott Gamm
Strategy Voice Associates
Scott@strategyvoiceassociates.com
|
Investor Relations Contact:
Aaron Greenberg
Chief Strategy Officer
IR@nayax.com
|
|
September 30
|
December 31
|
|||||||
|
2025
|
2024
|
|||||||
|
U.S. dollars in thousands
|
||||||||
|
ASSETS
|
||||||||
|
CURRENT ASSETS:
|
||||||||
|
Cash and cash equivalents
|
167,294
|
83,130
|
||||||
|
Restricted cash transferable to customers for processing activity
|
91,410
|
60,299
|
||||||
|
Short-term bank deposits
|
5,515
|
9,327
|
||||||
|
Receivables in respect of processing activity
|
60,624
|
45,071
|
||||||
|
Trade receivable, net
|
67,356
|
55,694
|
||||||
|
Inventory
|
24,014
|
19,768
|
||||||
|
Other current assets
|
22,813
|
14,368
|
||||||
|
Total current assets
|
439,026
|
287,657
|
||||||
|
NON-CURRENT ASSETS:
|
||||||||
|
Long-term bank deposits
|
210
|
2,155
|
||||||
|
Other long-term assets
|
7,498
|
4,253
|
||||||
|
Investment in associate
|
-
|
3,754
|
||||||
|
Right-of-use assets, net
|
4,608
|
6,292
|
||||||
|
Property and equipment, net
|
16,987
|
11,112
|
||||||
|
Goodwill and intangible assets, net
|
169,376
|
117,670
|
||||||
|
Total non-current assets
|
198,679
|
145,236
|
||||||
|
TOTAL ASSETS
|
637,705
|
432,893
|
||||||
|
September 30
|
December 31
|
|||||||
|
2025
|
2024
|
|||||||
|
U.S. dollars in thousands
|
||||||||
|
LIABILITIES AND EQUITY
|
||||||||
|
CURRENT LIABILITIES:
|
||||||||
|
Short-term bank credit and short term loan
|
-
|
25,276
|
||||||
|
Current maturities of long-term bank loans
|
3,220
|
3,978
|
||||||
|
Current maturities of other long-term liabilities
|
5,408
|
1,353
|
||||||
|
Current maturities of leases liabilities
|
2,622
|
2,967
|
||||||
|
Payables in respect of processing activity
|
181,092
|
130,958
|
||||||
|
Trade payables
|
21,893
|
21,059
|
||||||
|
Other payables
|
42,507
|
33,887
|
||||||
|
Total current liabilities
|
256,742
|
219,478
|
||||||
|
NON-CURRENT LIABILITIES:
|
||||||||
|
Long-term bank loans
|
11,375
|
18,605
|
||||||
|
Other long-term liabilities
|
9,145
|
20,716
|
||||||
|
Post-employment benefit obligations, net
|
569
|
497
|
||||||
|
Bonds
|
141,565
|
-
|
||||||
|
Lease liabilities
|
2,811
|
4,078
|
||||||
|
Deferred income taxes
|
7,384
|
4,274
|
||||||
|
Total non-current liabilities
|
172,849
|
48,170
|
||||||
|
TOTAL LIABILITIES
|
429,591
|
267,648
|
||||||
|
EQUITY:
|
||||||||
|
Shareholders Equity:
|
||||||||
|
Share capital
|
9
|
9
|
||||||
|
Additional paid in capital
|
231,223
|
220,715
|
||||||
|
Capital reserves
|
10,067
|
7,832
|
||||||
|
Accumulated deficit
|
(33,185
|
)
|
(63,311
|
)
|
||||
|
TOTAL EQUITY
|
208,114
|
165,245
|
||||||
|
TOTAL LIABILITIES AND EQUITY
|
637,705
|
432,893
|
||||||
|
Nine months ended
September 30 |
Three months ended
September 30 |
|||||||||||||||
|
2025
|
2024
|
2025
|
2024
|
|||||||||||||
|
U.S. dollars in thousands
|
||||||||||||||||
|
(Excluding loss per share data)
|
||||||||||||||||
|
Revenues
|
280,979
|
225,054
|
104,280
|
83,005
|
||||||||||||
|
Cost of revenues
|
(143,542
|
)
|
(124,507
|
)
|
(52,914
|
)
|
(45,033
|
)
|
||||||||
|
Gross Profit
|
137,437
|
100,547
|
51,366
|
37,972
|
||||||||||||
|
Research and development expenses
|
(23,705
|
)
|
(19,632
|
)
|
(8,821
|
)
|
(6,870
|
)
|
||||||||
|
Selling, general and administrative expenses
|
(88,766
|
)
|
(71,355
|
)
|
(30,007
|
)
|
(26,071
|
)
|
||||||||
|
Depreciation and amortization in respect of technology and capitalized development costs
|
(10,428
|
)
|
(8,615
|
)
|
(3,926
|
)
|
(3,232
|
)
|
||||||||
|
Other income (expenses)
|
10,944
|
(506
|
)
|
(766
|
)
|
-
|
||||||||||
|
Share of losses of equity method investees
|
(226
|
)
|
(885
|
)
|
-
|
(347
|
)
|
|||||||||
|
Profit (Loss) from ordinary operations
|
25,256
|
(446
|
)
|
7,846
|
1,452
|
|||||||||||
|
Financial Income
|
8,461
|
2,194
|
1,685
|
1,105
|
||||||||||||
|
Financial Expense
|
(9,761
|
)
|
(8,512
|
)
|
(4,962
|
)
|
(1,434
|
)
|
||||||||
|
Profit (loss) before taxes on income
|
23,956
|
(6,764
|
)
|
4,569
|
1,123
|
|||||||||||
|
Tax expense
|
(1,611
|
)
|
(513
|
)
|
(1,032
|
)
|
(431
|
)
|
||||||||
|
Profit (loss) for the period
|
22,345
|
(7,277
|
)
|
3,537
|
692
|
|||||||||||
|
Basic earnings (loss) per share
|
0.605
|
(0.205
|
)
|
0.095
|
0.019
|
|||||||||||
|
Diluted earnings (loss) per share
|
0.584
|
(0.205
|
)
|
0.092
|
0.019
|
|||||||||||
|
Nine months ended
September 30 |
Three months ended
September 30 |
|||||||||||||||
|
2025
|
2024
|
2025
|
2024
|
|||||||||||||
|
U.S. dollars in thousands
|
||||||||||||||||
|
Profit (loss) for the period
|
22,345
|
(7,277
|
)
|
3,537
|
692
|
|||||||||||
|
Other comprehensive income (loss) for the period:
|
||||||||||||||||
|
Items that may be reclassified to profit or loss:
|
||||||||||||||||
|
Gain (loss) from translation of financial statements of foreign operations
|
852
|
364
|
323
|
(161
|
)
|
|||||||||||
|
Gain (loss) on cash flow hedges
|
1,383
|
(41
|
)
|
(650
|
)
|
(2
|
)
|
|||||||||
|
Total comprehensive profit (loss) for the period
|
24,580
|
(6,954
|
)
|
3,210
|
529
|
|||||||||||
|
Share
capital |
Additional paid in capital
|
Remeasurement of post-employment benefit obligations
|
Other capital reserves
|
Foreign currency translation reserve
|
Accumulated
deficit |
Total
equity |
||||||||||||||||||||||
|
U.S. dollars in thousands
|
||||||||||||||||||||||||||||
|
Balance as of January 1, 2024 (audited)
|
8
|
153,524
|
248
|
9,545
|
(150
|
)
|
(65,585
|
)
|
97,590
|
|||||||||||||||||||
|
Changes in the nine months ended September 30, 2024:
|
||||||||||||||||||||||||||||
|
Loss for the period
|
-
|
-
|
-
|
-
|
-
|
(7,277
|
)
|
(7,277
|
)
|
|||||||||||||||||||
|
Issuance of ordinary shares
|
1
|
63,190
|
-
|
-
|
-
|
-
|
63,191
|
|||||||||||||||||||||
|
Other comprehensive income (loss) for the period
|
-
|
-
|
-
|
(41
|
)
|
364
|
-
|
323
|
||||||||||||||||||||
|
Employee options exercised and vesting of restricted shares
|
*
|
3,028
|
-
|
-
|
-
|
-
|
3,028
|
|||||||||||||||||||||
|
Share-based payment
|
-
|
-
|
-
|
-
|
-
|
6,449
|
6,449
|
|||||||||||||||||||||
|
Balance as of September 30, 2024 (unaudited)
|
9
|
219,742
|
248
|
9,504
|
214
|
(66,413
|
)
|
163,304
|
||||||||||||||||||||
|
Balance as of January 1, 2025 (audited)
|
9
|
220,715
|
463
|
9,973
|
(2,604
|
)
|
(63,311
|
)
|
165,245
|
|||||||||||||||||||
|
Changes in the nine months ended September 30, 2025:
|
||||||||||||||||||||||||||||
|
Profit for the period
|
-
|
-
|
-
|
-
|
-
|
22,345
|
22,345
|
|||||||||||||||||||||
|
Issuance of warrants, net
|
-
|
5,706
|
-
|
-
|
-
|
-
|
5,706
|
|||||||||||||||||||||
|
Issuance of options due acquisition
|
-
|
1,222
|
-
|
-
|
-
|
-
|
1,222
|
|||||||||||||||||||||
|
Other comprehensive income for the period
|
-
|
-
|
-
|
1,383
|
852
|
-
|
2,235
|
|||||||||||||||||||||
|
Employee options exercised and vesting of restricted shares
|
*
|
3,580
|
-
|
-
|
-
|
-
|
3,580
|
|||||||||||||||||||||
|
Share-based payment
|
-
|
-
|
-
|
-
|
-
|
7,781
|
7,781
|
|||||||||||||||||||||
|
Balance as of September 30, 2025 (unaudited)
|
9
|
231,223
|
463
|
11,356
|
(1,752
|
)
|
(33,185
|
)
|
208,114
|
|||||||||||||||||||
|
Share
capital |
Additional paid in capital
|
Remeasurement of post-employment benefit obligations
|
Other capital reserves
|
Foreign currency translation reserve
|
Accumulated
deficit |
Total
equity |
||||||||||||||||||||||
|
U.S. dollars in thousands
|
||||||||||||||||||||||||||||
|
Balance as of June 30, 2024 (unaudited)
|
9
|
218,792
|
248
|
9,506
|
375
|
(70,243
|
)
|
158,687
|
||||||||||||||||||||
|
Changes in the three months ended September 30, 2024:
|
||||||||||||||||||||||||||||
|
Profit for the period
|
-
|
-
|
-
|
-
|
-
|
692
|
692
|
|||||||||||||||||||||
|
Other comprehensive loss for the period
|
-
|
-
|
-
|
(2
|
)
|
(161
|
)
|
-
|
(163
|
)
|
||||||||||||||||||
|
Employee options exercised and vesting of restricted shares
|
*
|
950
|
-
|
-
|
-
|
-
|
950
|
|||||||||||||||||||||
|
Share-based payment
|
-
|
-
|
-
|
-
|
-
|
3,138
|
3,138
|
|||||||||||||||||||||
|
Balance as of September 30, 2024 (unaudited)
|
9
|
219,742
|
248
|
9,504
|
214
|
(66,413
|
)
|
163,304
|
||||||||||||||||||||
|
Balance as of June 30, 2025 (unaudited)
|
9
|
230,733
|
463
|
12,006
|
(2,075
|
)
|
(39,649
|
)
|
201,487
|
|||||||||||||||||||
|
Changes in the three months ended September 30, 2025:
|
||||||||||||||||||||||||||||
|
Profit for the period
|
-
|
-
|
-
|
-
|
-
|
3,537
|
3,537
|
|||||||||||||||||||||
|
Other comprehensive income for the period
|
-
|
-
|
-
|
(650
|
)
|
323
|
-
|
(327
|
)
|
|||||||||||||||||||
|
Employee options exercised and vesting of restricted shares
|
*
|
490
|
-
|
-
|
-
|
-
|
490
|
|||||||||||||||||||||
|
Share-based payment
|
-
|
-
|
-
|
-
|
-
|
2,927
|
2,927
|
|||||||||||||||||||||
|
Balance as of September 30, 2025 (unaudited)
|
9
|
231,223
|
463
|
11,356
|
(1,752
|
)
|
(33,185
|
)
|
208,114
|
|||||||||||||||||||
|
Nine months ended
September 30 |
Three months ended
September 30 |
|||||||||||||||
|
2025
|
2024
|
2025
|
2024
|
|||||||||||||
|
U.S. dollars in thousands
|
||||||||||||||||
|
CASH FLOWS FROM OPERATING ACTIVITIES:
|
||||||||||||||||
|
Net profit (loss) for the period
|
22,345
|
(7,277
|
)
|
3,537
|
692
|
|||||||||||
|
Adjustments to reconcile net profit (loss) to net cash provided by operations (see Appendix A)
|
2,352
|
33,171
|
6,925
|
15,872
|
||||||||||||
|
Net cash provided by operating activities
|
24,697
|
25,894
|
10,462
|
16,564
|
||||||||||||
|
CASH FLOWS FROM INVESTING ACTIVITIES:
|
||||||||||||||||
|
Capitalized development costs
|
(17,025
|
)
|
(15,458
|
)
|
(4,537
|
)
|
(5,670
|
)
|
||||||||
|
Acquisition of property and equipment
|
(3,977
|
)
|
(1,785
|
)
|
(2,071
|
)
|
(776
|
)
|
||||||||
|
Loans granted to related company
|
(2,062
|
)
|
(559
|
)
|
-
|
-
|
||||||||||
|
Decrease (Increase) in bank deposits
|
4,926
|
(23,126
|
)
|
(4,080
|
)
|
(411
|
)
|
|||||||||
|
Interest received
|
4,382
|
2,194
|
1,509
|
1,149
|
||||||||||||
|
Investments in financial assets
|
(5,000
|
)
|
(284
|
)
|
-
|
-
|
||||||||||
|
Proceeds from sub-lessee
|
22
|
170
|
-
|
59
|
||||||||||||
|
Payments for acquisitions of subsidiaries, net of cash acquired
|
(15,541
|
)
|
(14,934
|
)
|
-
|
-
|
||||||||||
|
Repayment of contingent liability due consideration of subsidiary acquisition
|
(8,287
|
)
|
-
|
(2,768
|
)
|
-
|
||||||||||
|
Net cash used in investing activities
|
(42,562
|
)
|
(53,782
|
)
|
(11,947
|
)
|
(5,649
|
)
|
||||||||
|
CASH FLOWS FROM FINANCING ACTIVITIES:
|
||||||||||||||||
|
Issuance of ordinary shares
|
-
|
62,686
|
-
|
-
|
||||||||||||
|
Proceeds from issue of bonds and warrants, net
|
132,941
|
-
|
-
|
-
|
||||||||||||
|
Interest paid
|
(6,806
|
)
|
(3,492
|
)
|
(5,208
|
)
|
(1,153
|
)
|
||||||||
|
Changes in short-term bank credit
|
(26,000
|
)
|
(17,155
|
)
|
-
|
(4,751
|
)
|
|||||||||
|
Receipt of long-term bank loans
|
-
|
17,000
|
-
|
-
|
||||||||||||
|
Repayment of long-term bank loans
|
(7,884
|
)
|
(2,675
|
)
|
(805
|
)
|
(495
|
)
|
||||||||
|
Repayment of long-term loans from others
|
-
|
(2,932
|
)
|
-
|
(1,209
|
)
|
||||||||||
|
Repayment of other long-term liabilities
|
(1,000
|
)
|
(100
|
)
|
-
|
-
|
||||||||||
|
Employee options exercised
|
4,067
|
3,184
|
1,387
|
558
|
||||||||||||
|
Principal lease payments
|
(2,200
|
)
|
(1,968
|
)
|
(767
|
)
|
(699
|
)
|
||||||||
|
Net cash provided by (used in) financing activities
|
93,118
|
54,548
|
(5,393
|
)
|
(7,749
|
)
|
||||||||||
|
Increase (decrease) in cash and cash equivalents
|
75,253
|
26,660
|
(6,878
|
)
|
3,166
|
|||||||||||
|
Balance of cash and cash equivalents at beginning of period
|
83,130
|
38,386
|
172,267
|
61,912
|
||||||||||||
|
Gains (losses) from exchange differences on cash and cash equivalents
|
8,663
|
(1,214
|
)
|
1,774
|
(220
|
)
|
||||||||||
|
Gains (losses) from translation differences on cash and cash equivalents of foreign operations
|
248
|
819
|
131
|
(207
|
)
|
|||||||||||
|
Balance of cash and cash equivalents at end of period
|
167,294
|
64,651
|
167,294
|
64,651
|
||||||||||||
|
Nine months ended
September 30 |
Three months ended
September 30 |
|||||||||||||||
|
2025
|
2024
|
2025
|
2024
|
|||||||||||||
|
U.S. dollars in thousands
|
||||||||||||||||
|
Appendix A – adjustments to reconcile net loss to net cash provided by operations:
|
||||||||||||||||
|
Adjustments in respect of:
|
||||||||||||||||
|
Depreciation and amortization
|
18,565
|
15,495
|
6,830
|
5,934
|
||||||||||||
|
Post-employment benefit obligations, net
|
45
|
4
|
10
|
9
|
||||||||||||
|
Deferred taxes
|
(1,569
|
)
|
(1,219
|
)
|
(497
|
)
|
(447
|
)
|
||||||||
|
Finance expenses, net
|
5,371
|
4,286
|
1,690
|
1,724
|
||||||||||||
|
Expenses in respect of long-term employee benefits
|
-
|
634
|
-
|
-
|
||||||||||||
|
Profit from gaining control in subsidiary
|
(12,152
|
)
|
-
|
-
|
-
|
|||||||||||
|
Share of loss of equity method investee
|
226
|
885
|
-
|
347
|
||||||||||||
|
Long-term deferred income
|
144
|
287
|
39
|
(283
|
)
|
|||||||||||
|
Expenses in respect of share-based compensation
|
6,857
|
5,962
|
2,562
|
2,997
|
||||||||||||
|
Total adjustments
|
17,487
|
26,334
|
10,634
|
10,281
|
||||||||||||
|
Changes in operating asset and liability items:
|
||||||||||||||||
|
Increase in restricted cash transferable to customers for processing activity
|
(31,089
|
)
|
(12,229
|
)
|
(10,654
|
)
|
(7,690
|
)
|
||||||||
|
Decrease (Increase) in receivables from processing activity
|
(15,553
|
)
|
(25,372
|
)
|
19,794
|
3,726
|
||||||||||
|
Increase in trade receivables
|
(9,328
|
)
|
(5,143
|
)
|
(5,033
|
)
|
(1,854
|
)
|
||||||||
|
Decrease (Increase) in other current assets
|
(4,847
|
)
|
2,652
|
(2,399
|
)
|
432
|
||||||||||
|
Increase in inventory
|
(3,238
|
)
|
(1,155
|
)
|
(740
|
)
|
(2,600
|
)
|
||||||||
|
Increase (Decrease) in payables in respect of processing activity
|
50,134
|
48,664
|
(7,078
|
)
|
13,407
|
|||||||||||
|
Increase (Decrease) in trade payables
|
(6,304
|
)
|
(819
|
)
|
1,386
|
(550
|
)
|
|||||||||
|
Increase (Decrease) in other payables
|
5,090
|
239
|
1,015
|
720
|
||||||||||||
|
Total changes in operating assets and liability items
|
(15,135
|
)
|
6,837
|
(3,709
|
)
|
5,591
|
||||||||||
|
Total adjustments to reconcile net loss to net cash provided by operations
|
2,352
|
33,171
|
6,925
|
15,872
|
||||||||||||
|
Appendix B – Information regarding investing and financing activities not involving cash flows:
|
||||||||||||||||
|
Purchase of property and equipment in credit
|
154
|
396
|
-
|
396
|
||||||||||||
|
Recognition of right-of-use assets through lease liabilities
|
117
|
660
|
117
|
76
|
||||||||||||
|
Share based payments costs attributed to development activities, capitalized as intangible assets
|
924
|
487
|
365
|
141
|
||||||||||||
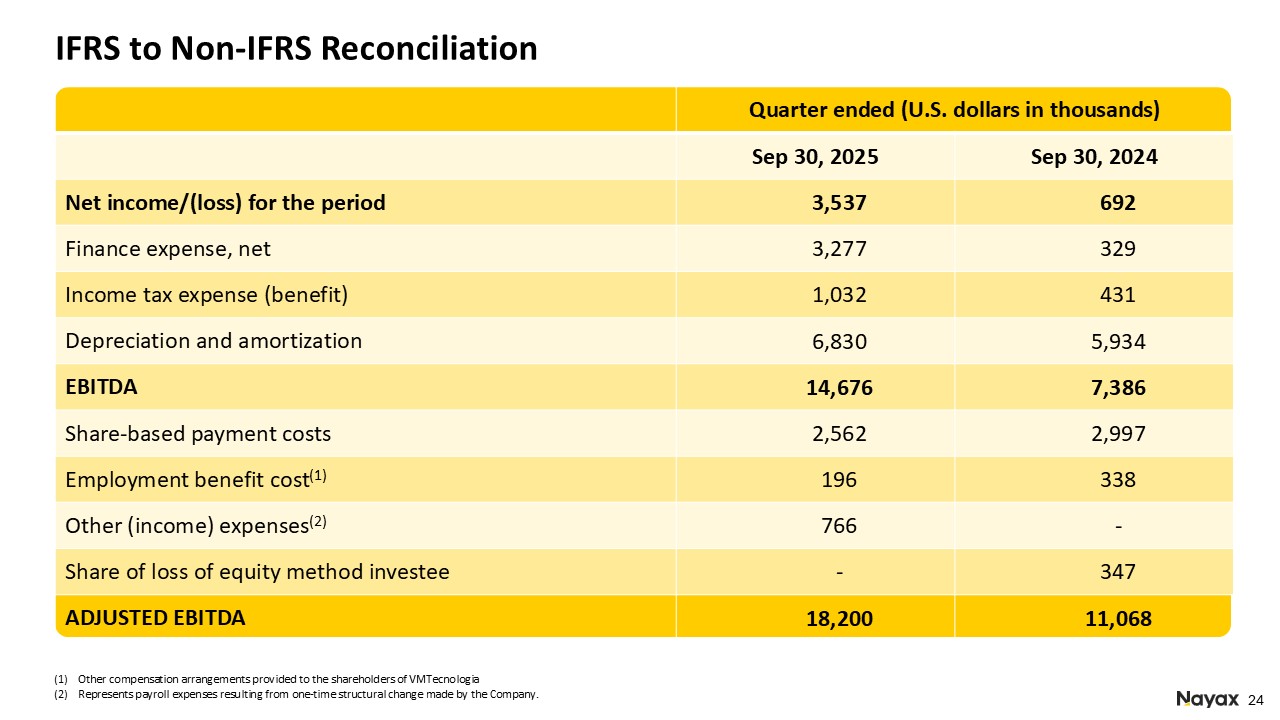
|
Quarter ended
(U.S. dollars in thousands)
|
||
|
Sep 30, 2025
|
Sep 30, 2024
|
|
|
Net income/loss for the period
|
3,537
|
692
|
|
Finance expense, net
|
3,277
|
329
|
|
Income tax expense (benefit)
|
1,032
|
431
|
|
Depreciation and amortization
|
6,830
|
5,934
|
|
EBITDA
|
14,676
|
7,386
|
|
Share-based payment costs
|
2,562
|
2,997
|
|
Employment benefit cost(1)
|
196
|
338
|
|
Other (income) expense(2)
|
766
|
-
|
|
Share of loss of equity method investee
|
-
|
347
|
|
ADJUSTED EBITDA
|
18,200
|
11,068
|
|
|
(1) |
Other compensation arrangements provided to the shareholders of VMTecnologia
|
|
|
(2) |
Represents payroll expenses resulting from one-time structural change made by the Company.
|
|
Quarter ended
(U.S. dollars in thousands)
|
||
|
Sep 30, 2025
|
Sep 30, 2024
|
|
|
Operating Cash
|
10,462
|
16,564
|
|
Capitalized development costs
|
(4,537)
|
(5,670)
|
|
Acquisition of property and equipment
|
(2,071)
|
(776)
|
|
Free Cash Flow
|
3,854
|
10,118
|
|
Quarter ended
(U.S. dollars in thousands)
|
||
|
Sep 30, 2025
|
Sep 30, 2024
|
|
|
OPEX
|
42,754
|
36,173
|
|
Stock Based Compensation
|
(2,469)
|
(2,896)
|
|
Depreciation & Amortization
|
(6,472)
|
(5,609)
|
|
Employment Benefit Cost(1)
|
(196)
|
(338)
|
|
Adjusted OPEX
|
33,617
|
27,330
|
|
|
(1) |
Other compensation arrangements provided to the shareholders of VMTecnologia
|