|
|
|
|
|
KENON HOLDINGS LTD.
|
|
|
|
|
|
|
Date: November 19, 2025
|
By:
|
/s/ Robert L. Rosen
|
|
|
Name:
|
Robert L. Rosen
|
|
|
Title:
|
Chief Executive Officer
|
| 1. |
Executive Summary1
|
|
For the
|
For the
|
||||||||||||||||||||||||
|
Nine Months Ended
|
Three Months Ended
|
||||||||||||||||||||||||
|
September 30
|
September 30
|
||||||||||||||||||||||||
|
2025
|
2024
|
%
|
2025
|
2024
|
%
|
||||||||||||||||||||
| Consolidated |
EBITDA after proportionate
Consolidation
|
1,255
|
980
|
28
|
%
|
522
|
407
|
28
|
%
|
||||||||||||||||
|
|
Net income |
333
|
74
|
350
|
%
|
236
|
86
|
174
|
%
|
||||||||||||||||
|
|
Adjusted net income
|
311
|
162
|
92
|
%
|
201
|
122
|
65
|
%
|
||||||||||||||||
|
|
FFO
|
827 |
564
|
46 |
%
|
437
|
244
|
79
|
%
|
||||||||||||||||
|
Israel
|
EBITDA
|
522
|
541
|
(4
|
)%
|
258
|
255
|
1
|
%
|
||||||||||||||||
|
|
FFO | 394 |
375
|
(5
|
)%
|
208
|
144
|
44 |
%
|
||||||||||||||||
|
|
|
||||||||||||||||||||||||
|
U.S.
|
EBITDA after proportionate
Consolidation
|
750
|
452
|
66
|
%
|
270
|
157
|
72
|
%
|
||||||||||||||||
|
|
FFO
|
482
|
228
|
111
|
%
|
240
|
84
|
186
|
%
|
||||||||||||||||
|
|
EBITDA after proportionate
consolidation – energy
Transition
|
847
|
447
|
89
|
%
|
349
|
169
|
107
|
%
|
||||||||||||||||
|
|
EBITDA after proportionate
consolidation – renewable
Energies
|
80
|
84
|
(5
|
)%
|
21
|
21
|
(0
|
)%
|
||||||||||||||||
|
|
* |
EBITDA, EBITDA after proportionate consolidation, adjusted net income and FFO are not recognized in accordance with IFRS – for definitions and the manner of their calculation – see Sections 4B and 4G below. In addition, for additional
details – see Sections 6C and 7C, below.
|
| 1 |
The Executive Summary below is presented solely for convenience and it is not a substitute for reading the full detail (including with reference to the matters referred to in the Summary) as stated in this report
with all its parts (including warnings relating to “forward‑looking” information as it is defined in the Securities Law, 1968 (“the Securities Law”), definitions or explanations with respect to the indices for measurement of the results and
including the information included by means of reference, as applicable). This Summary includes estimates, plans and assessment of the Company, which constitute “forward‑looking” information regarding which there is no certainty they will
materialize and the readers are directed to the detail presented in this report below.
|
| 1. |
Executive Summary (Cont.)
|
|
Israel
|
Hadera 2 project – on August 10, 2025, the government of Israel approved National Infrastructures Plan 20B (NIP 20B) regarding construction of an additional power
plant in Hadera. For details – see Section 6A(2) below.
|
|
|
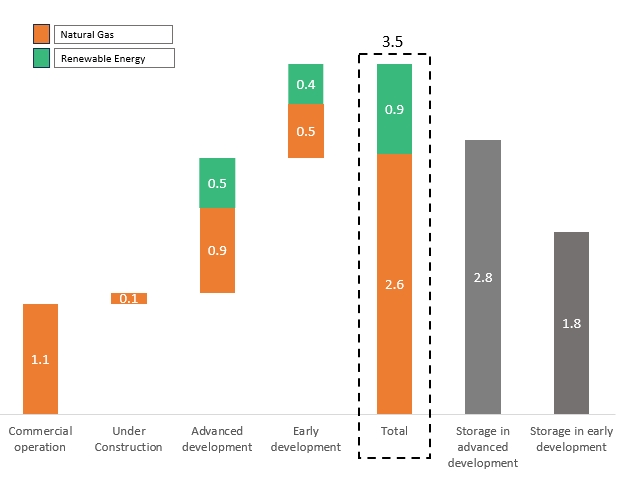
Continuing increase in
the portfolio of projects under development in the area of renewable energy – in addition to the Ramat Beka project, as at the approval date of the report the portfolio of projects in the renewable energy area
with integrated storage is estimated at a cumulative about 0.4 gigawatts and 1.8 gigawatts per hour. For details see Section 6A(2) below.
|
||
|
Corporate financing in Israel – in July 2025, OPC Israel signed an additional bank financing agreement, in the aggregate amount of about NIS 400 million, on terms
similar to those of the agreements it signed in 2024 and in the beginning of 2025, which is for refinancing long‑term debt in OPC Israel and the Company’s share is mainly for repayment of its debentures. For details – see Note 7A(1) to the
Interim Statements.
|
||
|
Hearing regarding update of the structure of the electricity tariff for consumers of Israel Electric Company – in September 2025, the Electricity Authority
published a hearing regarding update of the structure of the electricity tariff, which provides, among other things, that assuming a shekel/dollar exchange rate in 2026 of 3.4 will be 28.55 agurot and the tariff will be for three‑years
(2026–2028) and during the period it will be linked to the relevant price indices. For details – see Section 3.2E below.
|
||
|
Performance of upgrading and planned maintenance work at the Rotem power plant in the fourth quarter – in October 2025, the Rotem power plant was shut down for
purposes of upgrading and planned maintenance work. For details – see Section 4C below.
|
||
|
U.S.
|
Financial closing and start of construction of the Basin Ranch power plant in Texas (a combined cycle power plant with a capacity of about 1.35 gigawatts) at an
estimated total construction cost of $1.8 – $2.0 billion –for details – see Section 6B(2) below.
|
|
|
Signing of a transaction for acquisition of the remaining rights (30%) in the Basin Ranch power plant for an aggregate consideration of about $371 million –
completion of the transaction (if ultimately completed) is expected no later than February 2026. Upon and subject to completion of the transaction, the project will be consolidated in the Company’s financial statements. For details – see
Section 6B(2) below and Note 6B to the Interim Statements.
|
||
|
Signing of a transaction for acquisition of the remaining rights (11%) in the Shore power plant in the Energy Transition area (a combined cycle power plant with a
capacity of 725 megawatts in PJM) in exchange for an immaterial amount – upon and subject to its completion, which is expected to take place in the upcoming months, CPV’s rate of holdings will be 100% and control of the power plant will
be achieved – this being as part of the CPV Group’s strategy to increase the holdings and attain control of the active power plants running on natural gas. For details – see Section 10B below and Note 6A to the Interim Statements.
|
| 1. |
Executive Summary (Cont.)
|
|
U.S. (Cont.)
|
Change of the financing terms for the Fairview power plant – in October 2025, a transaction was completed for revision of the financing terms such that the margin
was updated to 2.5% (in place of 3%) and a dividend was distributed to the partners, in the aggregate amount of about $ 217 million (the CPV Group’s share – about $54 million).
|
|
|
Signing of an investment agreement with the tax partner in the Rouges Wind project (a wind project under construction with a capacity of about 114 megawatts) – in
August 2025, a binding investment agreement was signed with a tax partner for investment in the project the aggregate amount of about $163 million. For details – see Section 6B(1) below.
|
||
|
Capacity auctions in the PJM market for the period June 2026 through May 2028 – in July 2025, the results of a capacity auction for the period from June 1, 2026
through May 31, 2027 were published at a price of $329 for MW/day, which reflects the ceiling for the price range and which was approved by the FERC for two capacity auctions from June 2026 and up to May 2028. For details – see Section 3.3M
below.
|
||
|
The “One Big Beautiful Bill” and change of the tax benefit arrangements in the energy area, particularly renewable energies, and update of the U.S. income tax
guidelines regarding the Safe Harbor rules – for details – see Section 3.1C below.
|
||
|
Group headquarters
|
Raising of capital – in August 2025, the Company completed raising of capital from classified investors, in the amount of NIS 900 million (gross). The proceeds of
the issuance are intended mainly for purposes of continued growth and development of the Company’s business. For details – see Note 7D to the Interim Statements.
|
|
|
Early partial repayment of the debentures (Series B) – on September 30, 2025, the Company made an early partial repayment of the debentures (Series B), in the
total amount of about NIS 302 million. For details – see Note 7A(5) to the Interim Statements.
|
| 1. |
Executive Summary (Cont.)
|
|
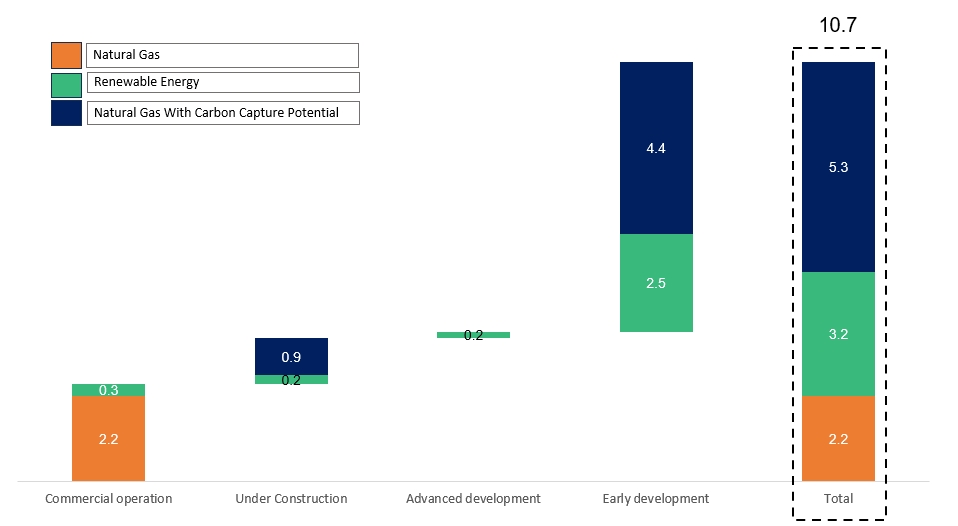
|
(1) |
The projects are presented in accordance with the relative share of the CPV Group in each project.
|
|
|
(2) |
The Basin Ranch (under construction) and Shore (active) power plants are presented in accordance with the rate of ownership of the CPV Group as at the approval date of the report (70% and 89%, respectively). For details regarding
transactions for acquisition of the remaining partners in the two projects, which as at the approval date of the report had not yet been completed – see Section 10 below and Note 6 to the Interim Statements.
|
|
|
(3) |
The Mason Road project (in the early development stage), the sale of which had been completed as at the approval date of the report, is not presented in the above chart. For details – see Section 6B(3) below and Note 10C(1) to the Interim
Statements.
|
| 1. |
Executive Summary (Cont.)
|
|
|
(1) |
For details regarding examination of a possible increase in the capacity and scope of the storage in the Ramat Beka project (in the advanced development stage) – see Section 6A(2) below.
|
|
|
(2) |
At this preliminary stage, not including a project covered by an agreement with Migdal, as detailed in Section 6A(2) below.
|
| 2. |
Brief description of the areas of activity
|
| 3. |
Main Developments in the Business Environment
|
|
|
3.1 |
General
|
|
|
A. |
Macro‑economic environment (particularly inflation and interest) – for details regarding the business and macro‑economic environment in which the Group companies operate, significant changes that occurred in 2024 and the impact
thereof on the Group’s activities – see Section 3.1A to the Report of the Board of Directors for 2024.
|
|
Dollar/shekel exchange rate *
|
2025
|
2024
|
Change
|
|||||||||
|
At the end of the previous year
|
3.647
|
3.627
|
0.6
|
%
|
||||||||
|
On September 30
|
3.306
|
3.710
|
(10.9
|
)%
|
||||||||
|
On June 30
|
3.372
|
3.759
|
(10.3
|
)%
|
||||||||
|
Average January – September
|
3.519
|
3.701
|
(4.9
|
)%
|
||||||||
|
Average July – September
|
3.364
|
3.714
|
(9.4
|
)%
|
||||||||
|
|
* |
The dollar/shekel exchange rate shortly before the approval date of the report (on November 14, 2025) is 3.235.
|
| 3. |
Main Developments in the Business Environment (Cont.)
|
|
|
3.1 |
General (Cont.)
|
|
|
A. |
(Cont.)
|
|
Israeli
|
U.S.
|
Bank of Israel
|
Federal
|
|||||||||||||
|
CPI
|
CPI
|
interest rate
|
interest rate
|
|||||||||||||
|
On November 14, 2025
|
117.8
|
324.8
|
4.5
|
%
|
3.75%–4.00
|
%
|
||||||||||
|
On September 30, 2025
|
118.5
|
324.0
|
4.5
|
%
|
4.00%–4.25
|
%
|
||||||||||
|
On June 30, 2025
|
116.9
|
321.2
|
4.5
|
%
|
4.25%–4.50
|
%
|
||||||||||
|
On December 31, 2024
|
115.1
|
315.5
|
4.5
|
%
|
4.25%–4.50
|
%
|
||||||||||
|
On September 30, 2024
|
115.2
|
314.8
|
4.5
|
%
|
4.75%–5.00
|
%
|
||||||||||
|
On June 30, 2024
|
113.4
|
314.1
|
4.5
|
%
|
5.25%–5.50
|
%
|
||||||||||
|
On December 31, 2023
|
111.3
|
307.1
|
4.75
|
%
|
5.25%–5.50
|
%
|
||||||||||
|
Change in the first nine months of 2025
|
3.0
|
%
|
2.7
|
%
|
0
|
%
|
(0.25
|
)%
|
||||||||
|
Change in the first nine months of 2024
|
3.5
|
%
|
2.5
|
%
|
(0.25
|
)%
|
(0.5
|
)%
|
||||||||
|
Change in the third quarter of 2025
|
1.4
|
%
|
0.9
|
%
|
0
|
%
|
(0.25
|
)%
|
||||||||
|
Change in the third quarter of 2024
|
1.6
|
%
|
0.2
|
%
|
0
|
%
|
(0.5
|
)%
|
||||||||
|
|
B. |
Domestic and geopolitical instability in the defense (security) situation in Israel – further to that stated in Section 6.1.1 of Part A of the Periodic Report for 2024, during of the period of the report, the security instability in
Israel increased with a rekindling of the fighting, including calling up of military reserves and missiles from the Yemenite terrorist organizations.
|
| 3. |
Main Developments in the Business Environment (Cont.)
|
|
|
3.1 |
General (Cont.)
|
|
|
B. |
(Cont.)
|
| 3. |
Main Developments in the Business Environment (Cont.)
|
|
|
3.1 |
General (Cont.)
|
|
|
C. |
Changes in government policies (including with respect to tariffs) and passage of the One Big Beautiful Bill in the U.S. – further to that stated in Section 3.1C of the Report of the Board of Directors for 2024, the policy changes
against the background of entry into office of the Trump administration have created and are continuing to create uncertainty along with opportunities in the energy sector in the U.S.
|
| 2 |
That stated in this Section above constitutes “forward‑looking” information, as it is defined in the Securities Law, which is based solely on the Company’s estimates as at the approval date of the report,
which are subject to uncertainty and changes that are not under the Company’s control. The policies (present or additional) of the U.S. government could have a negative impact on advancement and/or benefits with respect to renewable energy
projects (particularly, renewable energies) and the costs of equipment, services and shipping for the projects and power plants in the U.S. In addition, such changes could have macro impacts on the Company’s activity markets.
|
| 3. |
Main Developments in the Business Environment (Cont.)
|
|
|
3.1 |
General (Cont.)
|
|
|
C. |
(Cont.)
|
| 3 |
That stated above regarding the absence of a negative impact of the
new legislation on the list of projects in the advanced development stage, and relating to the demand for renewable energies and an increase in prices (and scope), a decline in the equipment prices and/or reduction of the impacts of the Law on renewable energy projects, constitutes “forward‑looking” information as it is defined in the Securities Law, which is based on the estimates of the CPV Group as at the approval date of the report and on an assumption regarding high demand for renewable
energies on the part ofsignificant consumers, and regarding which there is no certainty they will be realized or the manner of their
realization. As at the approval date of the report, the manner of the impact of the new legislation on the renewable energy sector in the U.S. has not yet been fully clarified and assimilated at this stage. Therefore, as part of the
process of internalizing the legislation (including updates, if any, or changes in other regulations) there could be changes in the sector the results of which will be different than the said estimates, including changes that could have
a significant negative impact on the activities, including on projects of the CPV Group in the area. As at the approval date of the report, the estimates described with reference to the impacts of the legislation on the CPV Group are
not final and the CPV Group is continuing to examine these impacts. Accordingly, the said estimates are subject to changes (including due to specific circumstances of the projects on the list of the awaiting projects of the CPV Group).
|
| 3. |
Main Developments in the Business Environment (Cont.)
|
|
|
3.2 |
Activities in Israel
|
|
|
D. |
Update of the electricity tariffs – in January 2025, a decision of the Electricity Authority entered into effect regarding update of the tariff for 2025 for consumers of electricity from the Electric Company. Pursuant to the
decision, the weighted‑average generation component was updated to 29.39 agurot per kilowatt hour – a decline of about 2.2% in the weighted‑average generation component with reference to the generation component in effect at the end of 2024,
this being mainly as a result of a decrease in the Electric Company’s generation cost due to a reduction in the use of coal and a forecasted decline in the Electric Company’s natural‑gas price. In addition, there was a non‑recurring
recognition of surplus receipts from sale of the Eshkol power plant, which led to a reduction in the generation component.
|
|
Period
|
2025
|
2024
|
Change
|
|||||||||
|
January–September average
|
29.39
|
30.11
|
(2.4
|
)%
|
||||||||
|
July–September average
|
29.39
|
30.07
|
(2.2
|
)%
|
||||||||
| 4 |
That stated regarding the impact of changes in the generation component on the Company’s results, is subject to changes, among other things, as a result of determination of the periodic generation component and/or the manner of its
application between the hourly demand hours’ brackets, operational factors and/or existence of one or more of the risk factors to which the Company is exposed, as stated in Section 19.2 of Part A of the Periodic Report for 2024. For
additional details regarding the generation component – see section 7.2.3 of Part A of the Periodic Report for 2024.
|
| 3. |
Main Developments in the Business Environment (Cont.)
|
|
|
3.2 |
Activities in Israel (Cont.)
|
|
|
E. |
Hearing regarding update of the tariff structure for electricity for consumers of Israel Electric Company – further to that stated in the Public Announcement regarding a proposal for changes in the tariff structure described in
Section 7.2.3 of Part A of the Periodic Report for 2024, on September 30, 2025, the Electricity Authority published a hearing regarding the matter of “Update of the Tariff Structure for Electricity for Consumers of Israel Electric Company”.
As part of the Hearing, the Electricity Authority is proposing to partially apply the change proposed in the Public Announcement and, among other things, that: (1) update of the tariff will be made every quarter automatically; (2) the pricing
will be updated for the network sector and for the supply sector; and (3) the structure of the generation component will change such that starting from January 1, 2026 the generation component will be split into a fixed component and a
variable component based on the tariff costs for 2025 (without assimilation of the MCP price5 and pricing of the external costs of the emissions at this stage). The split up of the components is intended, among other things, to
prepare the market for separation between the components to the extent it will be decided at a later stage that the variable component will be based on the MCP price. Regarding the tariffs for the starting point of each of the two components,
a linkage and advancement mechanism was provided that conforms to the costs that compose it and their characteristics. The tariff will be a three‑year tariff (2026–2028), where during the period the tariff will be linked to relevant indices
and prices, as stated. In addition, the Electricity Authority notes that it intends to determine a tariff update mechanism in respect of differences in the tariff and between the actual costs in a cumulative scope of more than NIS 1 billion
for Israel Electric Company and NIS 0.5 billion for the System Operator, in accordance with the mechanism.
|
| 5 |
Marginal Clearing Price, that is, the marginal cost computed at the half‑hour level by the System Operator. In the original Public Announcement, SMP was the subject while at the present time the System Operator is taking action to update
the methodology, where the new methodology is called MCP.
|
| 6 |
The Company’s estimates with respect to the impact of the Hearing is
“forward‑looking” information as it is defined in the Securities Law, which is based on the Company’s preliminary estimates regarding the arrangements included in the Hearing for which there is no certainty of their realization.
Ultimately, the impacts could be different due to, among other things, the market conditions, changes impacting the components of the proposed tariffs, regulator changes/factors that impact the electricity market and/or final arrangements that will be determined, should they enter into effect, which do not depend on the Company.
|
| 3. |
Main Developments in the Business Environment (Cont.)
|
|
|
3.2 |
Activities in Israel (Cont.)
|
|
|
F. |
Update off the decision regarding regulation of conventional generation units – further to that stated in Section 7.3.4 of Part A of the Periodic Report for 2024, on March 26, 2025, the Electricity Authority published a decision –
“Update of the Decision regarding Regulation of Conventional Generation Units” (“the Decision”). As part of the Decision, the Electricity Authority increased the quota to four additional generation units and extended the validity of the
decision up to the end of June 2027. The availability tariff determined runs from 3.05 agurot to 3.31 agurot based on the date of the financial closing. In addition, an incentive of 0.5 agurot was provided for the first unit that reaches a
financial closing – this being only for units located in the northern part of Gush Dan (central Israel), as well as an incentive of 0.75% of the availability tariff for every month of acceleration of the commercial operation prior to
December 31, 2029. It is noted that the Company is taking action such that the Hadera 2 project, which has reached the advanced development stages, will operate (subject to its construction and completion) under this regulation, as detailed
in Section 6A(2) below.
|
|
|
G. |
Regulation for undertakings in transactions for sale of availability in high‑voltage solar generation facilities with integrated storage – further to the hearing described in Section 7.3.5 of Part A of the Periodic Report for 2024,
on May 20, 2025, the Electricity Authority published a decision regarding a bilateral regulation for generation and storage facilities connected to or integrated in the transmission network. The regulation will apply from January 1, 2026 to
renewable energy generation facilities with integrated storage (it was provided that the facility must with a storage capacity to installed generation capacity ratio that does not exceed 7), which will receive tariff approval up to June 1,
2027 or for a quota of up to 2,000 megawatts.
|
| 3. |
Main Developments in the Business Environment (Cont.)
|
|
|
3.2 |
Activities in Israel (Cont.)
|
|
|
H. |
Revised hearing regarding a temporary mechanism for acquisition of availability certificates by virtual suppliers from the System Operator (“the Revised Hearing”) – further to the publication of the Electricity Authority on June 26,
2025 with respect to a hearing regarding integration of existing private conventional generators that are connected to the transmission network in the bilateral regulation (“the Original Hearing”)7, on September 29, 2025 the
Electricity Authority published a hearing revising the Original Hearing. As part of the Revised Hearing, the Electricity Authority is proposing to provide a mechanism that will permit virtual suppliers that will win in competitive processes
for determination of tariffs for acquisition of availability certificates from the System Operator that will be published by the Electricity Authority, to acquire capacity directly from the System Operator (instead of the expired original
proposal to acquire from generators having conventional generation units for which an availability tariff was determined based on the relevant regulation, and that are not permitted to designate the supplier or to sell energy to a private
supplier or yard consumer, such as Zomet). Pursuant to the Revised Hearing, the mechanism will apply temporarily until the conditions in the market are ready for maintenance of a decentralized availability market based on bilateral
transactions between generators and suppliers in accordance with the right of the winning suppliers to acquire capacity from the System Operator at the winning tariff in the process, which will be valid for them only up to December 31, 2029,
and thereafter the suppliers will be required to acquire capacity in the bilateral availability market. In the Company’s estimation, as at the approval date of the report, the Revised Hearing (if it is recorded in an agreement and subject to
the final arrangements) could have a positive impact on the Group’s activities in Israel8.
|
|
|
I. |
Decision regarding determination of the value of the land of the Eshkol site – assessment of the Electricity Authority – as part of the Electricity Authority’s decision on July 24, 2025, it was determined that the value of the land
of the Eshkol site that will be recognized by Israel Electric Company in the framework of sale of the site will be NIS 1,740 million. As part of update of the electricity tariff for 2025, the amount of NIS 508 million was recognized by the
Electricity Authority. Recognition of the rest of the amount, totaling NIS 1,232 million, plus interest and linkage differences, will be spread out by Israel Electric Company in the framework of the updated tariff over the next 3 years. It is
noted that this amount will be included in a three‑year tariff update mechanism in respect of tariff differences and between actual costs as detailed in Section 3.2E above.
|
|
|
J. |
Continued increase of activities in the market for supply to household customers and small businesses – further to that stated in Section 7.6.5 of Part A of the Periodic Report for 2024, as part of diversification of the mix of the
customers of OPC Israel and further to the undertaking with Partner Communications Ltd. in 2024, in the period of the report an agreement was signed with an additional large retail company.
|
| 7 |
For details – see Section 3.2G of the Report of the Company’s Board of Directors for the second quarter of 2025 published on August 13, 2025 (Reference No.: 2025-01-059955).
|
| 8 |
That stated constitutes “forward‑looking” information as it is defined in the Securities Law, which is based solely on the Company’s estimates pursuant to the Revised Hearing as at the approval date of the
report. Ultimately, the impacts could be different – this being as a result of the final arrangements, market conditions and/or the manner of implementation of the arrangements as will be determined (if ultimately determined).
|
|
|
3.3 |
Activities in the U.S.
|
|
|
K. |
Electricity and natural gas prices
|
|
For the
|
For the
|
|||||||||||||||||||||||
|
Nine Months Ended
|
Three Months Ended
|
|||||||||||||||||||||||
|
Region
|
September 30
|
September 30
|
||||||||||||||||||||||
|
(Power Plant)
|
2025
|
2024
|
Change
|
2025
|
2024
|
Change
|
||||||||||||||||||
|
PJM West (Shore, Maryland)
|
47.66
|
33.52
|
42
|
%
|
46.82
|
37.10
|
26
|
%
|
||||||||||||||||
|
New York Zone G (Valley)
|
60.41
|
34.74
|
74
|
%
|
51.88
|
35.36
|
47
|
%
|
||||||||||||||||
|
Mass Hub (Towantic)
|
64.31
|
37.10
|
73
|
%
|
50.20
|
38.08
|
32
|
%
|
||||||||||||||||
|
PJM AEP Dayton (Fairview)
|
43.98
|
30.14
|
46
|
%
|
43.51
|
32.21
|
35
|
%
|
||||||||||||||||
|
PJM ComEd (Three Rivers)
|
36.40
|
25.87
|
41
|
%
|
42.77
|
29.00
|
48
|
%
|
||||||||||||||||
|
ERCOT West Hub (Basin Ranch)**
|
33.53
|
30.20
|
11
|
%
|
37.69
|
28.87
|
31
|
%
|
||||||||||||||||
|
|
* |
Based on Day‑Ahead prices as published by the relevant ISO.
|
|
|
** |
As at the approval date of the report, the Basin Ranch project is under construction.
|
| 9 |
That stated constitutes merely a general estimate that could be subject to changes due to projects characteristics or factors and events that are not under the control of the CPV Group.
|
| 3. |
Main Developments in the Business Environment (Cont.)
|
|
|
3.3 |
Activities in the U.S. (Cont.)
|
|
|
K. |
Electricity and natural gas prices (Cont.)
|
|
For the nine months ended
|
For the three months ended
|
|||||||||||||||||||||||
|
Region
|
September 30
|
September 30
|
||||||||||||||||||||||
|
(Power Plant)
|
2025
|
2024
|
Change
|
2025
|
2024
|
Change
|
||||||||||||||||||
|
Texas Eastern M‑3 (Shore, Valley – 70%)
|
3.70
|
1.98
|
87
|
%
|
2.27
|
1.50
|
51
|
%
|
||||||||||||||||
|
Transco Zone 5 North (Maryland)
|
3.67
|
2.55
|
44
|
%
|
2.34
|
1.77
|
32
|
%
|
||||||||||||||||
|
Dominion South Pt (Valley – 30%)
|
2.72
|
1.57
|
73
|
%
|
2.13
|
1.41
|
51
|
%
|
||||||||||||||||
|
Algonquin City Gate (Towantic)
|
5.85
|
2.56
|
129
|
%
|
2.96
|
1.75
|
69
|
%
|
||||||||||||||||
|
Texas Eastern M‑3 and Texas
|
||||||||||||||||||||||||
|
Eastern M‑2 (Fairview)**
|
2.81
|
1.62
|
73
|
%
|
2.27
|
1.41
|
61
|
%
|
||||||||||||||||
|
Chicago City Gate (Three Rivers)
|
3.21
|
2.09
|
54
|
%
|
2.77
|
1.78
|
56
|
%
|
||||||||||||||||
|
Waha (Basin Ranch)***
|
1.09
|
(0.15
|
)
|
827
|
%
|
0.44
|
(1.00
|
)
|
144
|
%
|
||||||||||||||
|
|
* |
Source: The Day‑Ahead prices at gas Midpoints as reported in Platt’s Gas Daily. It is clarified that the actual gas prices of the power plants of the CPV Group could be significantly different.
|
|
|
** |
Commencing from the third quarter of 2025, Fairview has started acquiring natural gas that is priced based on the Texas Eastern M‑3 transmission region. The above table presents Fairview’s combined gas price, which constitutes the gas
price up to June 2025 based on the Texas Eastern M‑2 transmission region, and starting from July 2025 the gas price based on the Texas Eastern M‑3 transmission region. For additional details – see Appendix A below.
|
|
|
*** |
As at the approval date of the report, the Basin Ranch project is under construction.
|
| 3. |
Main Developments in the Business Environment (Cont.)
|
|
|
3.3 |
Activities in the U.S. (Cont.)
|
|
|
K. |
Electricity and natural gas prices (Cont.)
|
|
|
|
Set forth below are the average Spark Spread margins for each of the main markets in which the power plants of the CPV Group are operating (the prices are denominated in dollars per megawatt/hour)*:
|
|
For the
|
For the
|
|||||||||||||||||||||||
|
Nine Months Ended
|
Three Months Ended
|
|||||||||||||||||||||||
|
September 30
|
September 30
|
|||||||||||||||||||||||
|
Power Plant10
|
2025
|
2024
|
Change
|
2025
|
2024
|
Change
|
||||||||||||||||||
|
Shore
|
22.13
|
19.86
|
11
|
%
|
31.16
|
26.75
|
17
|
%
|
||||||||||||||||
|
Maryland
|
22.34
|
15.93
|
40
|
%
|
30.67
|
24.89
|
23
|
%
|
||||||||||||||||
|
Valley
|
36.91
|
21.93
|
68
|
%
|
36.51
|
25.20
|
45
|
%
|
||||||||||||||||
|
Towantic
|
26.29
|
20.46
|
29
|
%
|
30.96
|
26.71
|
16
|
%
|
||||||||||||||||
|
Fairview
|
25.72
|
19.61
|
31
|
%
|
28.76
|
23.05
|
25
|
%
|
||||||||||||||||
|
Three Rivers
|
15.54
|
12.29
|
26
|
%
|
24.77
|
17.43
|
42
|
%
|
||||||||||||||||
|
Basin Ranch**
|
26.45
|
31.18
|
(15
|
)%
|
34.83
|
35.37
|
(2
|
)%
|
||||||||||||||||
|
|
* |
Based on electricity prices as shown in the above table, with assuming a thermal conversion ratio (heat rate) of 6.9 MMBtu/MWh for Maryland, Shore and Valley, and a thermal conversion ratio of 6.5 MMBtu/MWh for Three Rivers, Fairview,
Towantic and Basin Ranch. It is clarified that the actual energy margins of the power plants of the CPV Group could be significantly different due to, among other things, the existence of Power Basis and a different breakdown in the scope of
the electricity sold in the peak and off‑peak hours in CPV’s power plants and that shown above (which was calculated in the above table based on the assumption of generation in all the hours of the 24‑hour period).
|
|
|
** |
As at the approval date of the report, the Basin Ranch project was under construction.
|
| 3. |
Main Developments in the Business Environment (Cont.)
|
|
|
3.3 |
Activities in the U.S. (Cont.)
|
|
|
K. |
Electricity and natural gas prices (Cont.)
|
|
|
3.3 |
Activities in the U.S. (Cont.)
|
|
|
L. |
Tax on carbon emissions (RGGI)
|
|
Average for the
|
Average for the
|
|||||||||||||||||||||||
|
Nine Months Ended
|
Three Months Ended
|
|||||||||||||||||||||||
|
September 30
|
September 30
|
|||||||||||||||||||||||
|
2025
|
2024
|
Change
|
2025
|
2024
|
Change
|
|||||||||||||||||||
|
Price of carbon emission tax in the RGGI
tenders ($ per short ton / 2,000 pounds)*
|
19.81
|
17.30
|
15
|
%
|
19.63
|
21.03
|
(7
|
)%
|
||||||||||||||||
|
Cost of the carbon emission tax (in terms
of gas cost) ($ per MMBtu)**
|
1.18
|
1.03
|
15
|
%
|
1.17
|
1.25
|
(7
|
)%
|
||||||||||||||||
|
|
* |
The prices of the carbon emissions tax are presented under the assumption that the price of the tender that is held prior to a certain quarter represents the price of the carbon emissions tax for the subsequent quarter. For example, the
tender held in December 2024 will represent the price for the first quarter of 2025. It is noted that the actual price of the carbon emissions tax could be different than the tender prices as a result of transactions made in the secondary
market.
|
|
|
** |
The cost of the carbon emissions tax (in terms of gas cost) is calculated under the assumption of emissions of carbon dioxide with a reference (ratio) of 119 lbs./MMBtu. It is noted that the actual carbon dioxide emissions ratio varies
between the different power plants, and in the estimation of the CPV Group a ratio of 119 lbs./MMBtu is a representative ratio for power plants running on natural gas.
|
|
|
3.3 |
Activities in the U.S. (Cont.)
|
|
|
M. |
Capacity revenues
|
|
Sub-Region
|
CPV Plants
|
2026/2027
|
2025/2026
|
2024/2025
|
2023/2024
|
|
PJM RTO
|
|
329.17
|
269.92
|
28.92
|
34.13
|
|
PJM COMED
|
Three Rivers
|
329.17
|
269.92
|
28.92
|
34.13
|
|
PJM MAAC
|
Fairview, Maryland,
Maple Hill
|
329.17
|
269.92
|
49.49
|
49.49
|
|
PJM EMAAC
|
Shore
|
329.17
|
269.92
|
54.95
|
49.49
|
| 3. |
Main Developments in the Business Environment (Cont.)
|
|
|
3.3 |
Activities in the U.S. (Cont.)
|
|
|
M. |
Capacity revenues (Cont.)
|
| 11 |
That stated in this Section regarding the estimation of the CPV Group constitutes “forward‑looking” information as it is defined in the Securities Law, with respect to which there is no certainty it will
materialize. Ultimately, the revenues of the CPV Group from availability could be different (even significantly) as a result of, among other things, regulatory changes (including appeal or other processes in the PJM market or relating to
other authorities), operating factors, changes in the business environment and/or existence of one or more of the risk factors the CPV Group is exposed to.
|
| 3. |
Main Developments in the Business Environment (Cont.)
|
|
|
3.3 |
Activities in the U.S. (Cont.)
|
|
|
M. |
Capacity revenues (Cont.)
|
|
|
3.3 |
Activities in the U.S. (Cont.)
|
|
|
M. |
Capacity revenues (Cont.)
|
|
Sub-Area
|
CPV
Plants
|
Winter
2025/2026
|
Summer
2025
|
Winter 2024/2025
|
Summer
2024
|
|
NYISO
Rest of the Market
|
–
|
89.83
|
153.26
|
66.30
|
168.91
|
|
Lower Hudson Valley
|
Valley
|
89.83
|
153.26
|
66.30
|
168.91
|
|
|
3.3 |
Activities in the U.S. (Cont.)
|
|
|
M. |
Capacity revenues (Cont.)
|
|
Sub-Region
|
CPV Power Plants
|
2027/2028
|
2026/2027
|
2025/2026
|
|
ISO-NE
Rest of the Market
|
Towantic
|
117.70
|
85.15
|
85.15
|
|
|
3.3 |
Activities in the U.S. (Cont.)
|
|
|
N. |
The ERCOT market in Texas (Basin Ranch project under construction)
|
| 4. |
Analysis of the results of operations for the nine months ended September 30, 2025 (in millions of NIS)
|
|
|
A. |
Statement of income
|
|
For the Nine Months Ended
|
||||||||
|
Section
|
September 30
|
|||||||
|
*2025
|
2024
|
|||||||
|
Revenues from sales and provision of services (1)
|
2,256
|
2,190
|
||||||
|
Cost of sales and provision of services (without depreciation and amortization) (2)
|
(1,643
|
)
|
(1,493
|
)
|
||||
|
Depreciation and amortization
|
(180
|
)
|
(245
|
)
|
||||
|
Gross profit
|
433
|
452
|
||||||
|
Share in earnings of associated companies
|
423
|
150
|
||||||
|
Compensation for loss of income
|
–
|
44
|
||||||
|
Administrative and general expenses
|
(295
|
)
|
(191
|
)
|
||||
|
Business development expenses
|
(10
|
)
|
(33
|
)
|
||||
|
Other income (expenses), net
|
19
|
(50
|
)
|
|||||
|
Operating income
|
570
|
372
|
||||||
|
Financing expenses, net
|
(163
|
)
|
(200
|
)
|
||||
|
Loss from settlement of financial liabilities
|
–
|
(49
|
)
|
|||||
|
Income before taxes on income
|
407
|
123
|
||||||
|
Taxes on income expenses
|
(74
|
)
|
(49
|
)
|
||||
|
Net income for the period**
|
333
|
74
|
||||||
|
Attributable to:
|
||||||||
|
The Company’s shareholders
|
254
|
83
|
||||||
|
Holders of non‑controlling interests
|
79
|
(9
|
)
|
|||||
|
|
* |
Commencing from November 2024, as a result of loss of discontinuance of consolidation of CPV Renewable and transition to the equity method of accounting, the Company has discontinued consolidation in the consolidated financial statements
of the results of the renewable energy segment in the U.S.
|
|
|
** |
For an analysis of the change in the net income and a definition and analysis of the change in the adjusted net income – see Section 4G below.
|
| 4. |
Analysis of the results of operations for the nine months ended September 30, 2025 (in millions of NIS) (Cont.)
|
|
|
A. |
Statement of income (Cont.)
|
| (1) | Changes in revenues: |
|
Revenues
|
For the
|
Board’s Explanations
|
|||||||
|
Nine Months
|
|||||||||
|
Ended
|
|||||||||
|
September 30
|
|||||||||
|
2025
|
2024
|
||||||||
|
Revenues in Israel
|
|||||||||
|
Revenues from sale of energy to private customers
|
986
|
1,121
|
A decrease, in the amount of about NIS 92 million, stemming from a decline in the consumption of customers compared
with the corresponding period last year, among other things in light of the “Nation as a Lioness” mission and an additional decline, of about NIS 40 million, stemming from a decrease in the tariff for the generation component compared with
the corresponding period last year.
|
||||||
|
Revenues from sale of energy to the System Operator and to other suppliers
|
158
|
146
|
|||||||
|
Revenues in respect of capacity payments
|
110
|
127
|
Most of the decrease compared with the corresponding period last year stems from a decline in the availability of the Zomet power plant offset by an
increase in the availability of the Gat power plant. For additional details – see Section 4C below.
|
||||||
|
Revenues from sale of energy at cogeneration tariff
|
56
|
42
|
Most of the increase stems from maintenance work at the Hadera power plant in the corresponding period last year.
|
||||||
|
Revenues from sale of steam
|
44
|
44
|
|||||||
|
Other revenues
|
2
|
23
|
Most of the decrease derives from discontinuance of the consolidation of Gnrgy at the end of second quarter of 2024.
|
||||||
|
Total revenues from sale of energy and others in Israel (without infrastructure services)
|
1,356
|
1,503
|
|||||||
|
Revenues from private customers in respect of infrastructure services
|
433
|
332
|
The increase stems mainly from an average increase in the tariffs, at the rate of about 40%.
|
||||||
|
Total revenues in Israel
|
1,789
|
1,835
|
|||||||
|
Revenues in the U.S.
|
|||||||||
|
Revenues from sale of electricity from renewable energy
|
–
|
164
|
The decrease derives mainly from discontinuance of consolidation of the renewable energies segment in November 2024, and transition to the equity
method of accounting. For additional details – see Note 23E to the annual financial statements.
|
||||||
|
Revenues from sale of electricity (retail) activities and others
|
467
|
191
|
The increase stems mainly from an increase in the scope of the retail activities.
|
||||||
|
Total revenues in the U.S.
|
467
|
355
|
|||||||
|
Total revenues
|
2,256
|
2,190
|
|||||||
| 4. |
Analysis of the results of operations for the nine months ended September 30, 2025 (in millions of NIS) (Cont.)
|
|
|
A. |
Statement of income (Cont.)
|
|
|
(2) |
Changes in the cost of sales and provision of services (not including depreciation and amortization):
|
|
Cost of Sales and
Services
|
For the
Nine Months
|
Board’s Explanations
|
|||||||
|
Ended
|
|||||||||
|
September 30
|
|||||||||
|
2025
|
2024
|
||||||||
|
Cost of sales in Israel
|
|||||||||
|
Natural gas and diesel oil
|
502
|
495
|
|||||||
|
Expenses in respect of acquisition of energy
|
136
|
280
|
Most of the decrease stems from a decline in customer consumption compared with the corresponding period last year due to, among other things, the
“Nation as a Lioness” mission, as well as maintenance work performed at the Rotem, Hadera and Gat power plants in the corresponding period last year.
|
||||||
|
Cost of transmission of gas
|
38
|
41
|
|||||||
|
Salaries and related expenses
|
33
|
33
|
|||||||
|
Operating expenses
|
88
|
87
|
|||||||
|
Other expenses
|
–
|
18
|
Most of the decrease stems from discontinuance of the consolidation of Gnrgy at the end of the second quarter of 2024.
|
||||||
|
Total cost of sales in Israel without infrastructure services
|
797
|
954
|
|||||||
|
Expenses in respect of infrastructure services
|
433
|
332
|
For details – see the explanation of the change in the revenues in respect of infrastructure services.
|
||||||
|
Total cost of sales in Israel
|
1,230
|
1,286
|
|||||||
|
Cost of sales and services in the U.S.
|
|||||||||
|
Cost of sales in respect of sale of electricity from renewable energy
|
–
|
53
|
The decrease stems from discontinuance of consolidation of the renewable energies segment in November 2024 and transition to the equity method of
accounting. For additional details – see Note 23E to the annual financial statements.
|
||||||
|
Cost of sales in respect of sale of electricity (Retail) and others
|
413
|
154
|
The increase stems mainly from an increase in the scope of the retail activities.
|
||||||
|
Total cost of sales and provision of services in the U.S.
|
413
|
207
|
|||||||
|
Total cost of sales and provision of services
|
1,643
|
1,493
|
|||||||
| 4. |
Analysis of the results of operations for the nine months ended September 30, 2025 (in millions of NIS) (Cont.)
|
|
|
B. |
EBITDA, FFO and net cash flows after debt service
|
|
|
1. |
EBITDA indices
|
|
|
2. |
“FFO” (funds from operations) – with respect to active projects – cash flows from current operating activities for the period (including changes in working capital) and less investments in property, plant and equipment and periodic
maintenance costs that are not included in the operating activities and less net interest payments. With respect to the rest of the Group’s activities – cash flows from current operating activities for the period (including changes in working
capital) and less net interest payments (to the extent they do not relate to projects under construction). It is clarified that investments in property, plant and equipment (under construction and/or in development) including the net interest
payments in respect thereof, are not included in FFO.
|
|
|
3. |
“Net cash flows after service of project debt” – the “FFO” less/plus payment of principal in respect of financial debt and/or taking out of project debt and non‑project debt (loans and/or debentures), and after adjustments for a
change in other credit from banks and a change in cash, including cash restricted for debt service and deposits (including to secure transactions hedging electricity margins).
|
| 14 |
It is clarified that the compensation for loss of income is included in EBITDA in the consolidated statements.
|
| 4. |
Analysis of the results of operations for the nine months ended September 30, 2025 (in millions of NIS) (Cont.)
|
|
|
B. |
EBITDA, FFO and net cash flows after debt service (Cont.)
|
|
For the
Nine Months Ended
|
||||||||
|
September 30
|
||||||||
|
2025
|
2024
|
|||||||
|
Revenues from sales and provision of services
|
2,256
|
2,190
|
||||||
|
Cost of sales (without depreciation and amortization)
|
(1,643
|
)
|
(1,493
|
)
|
||||
|
Share in income of associated companies
|
423
|
150
|
||||||
|
Compensation for lost revenues
|
–
|
44
|
||||||
|
Administrative and general expenses (without depreciation and amortization)
|
(282
|
)
|
(179
|
)
|
||||
|
Business development expenses
|
(10
|
)
|
(33
|
)
|
||||
|
Consolidated EBITDA
|
744
|
679
|
||||||
|
Elimination of the share in income of associated companies
|
(423
|
)
|
(150
|
)
|
||||
|
Plus – Group’s share of the EBITDA after proportionate consolidation of
|
||||||||
|
associated companies in the Energy Transition segment (1)
|
854
|
451
|
||||||
|
Plus – Group’s share of the EBITDA after proportionate consolidation of
|
||||||||
|
activities in the renewable energies segment in the U.S. (2)*
|
80
|
–
|
||||||
|
EBITDA after proportionate consolidation
|
1,255
|
980
|
||||||
|
|
* |
Due to completion of an investment transaction in the area of renewable energies in the U.S. in November 2024, starting from this date the data of this segment is calculated on the basis of a proportionate consolidation (instead of a full
consolidation up to that time) where the share of the CPV Group is about 66.7%.
|
| 15 |
It is noted that other companies might define EBITDA and FFO indices differently.
|
| 4. |
Analysis of the results of operations for the nine months ended September 30, 2025 (in millions of NIS) (Cont.)
|
|
|
B. |
EBITDA, FFO and net cash flows after debt service (Cont.)
|
|
|
(1) |
Calculation of the Group’s share in the EBITDA after proportionate consolidation, FFO and net cash flows after service of project debt of associated companies in the Energy Transition segment (in millions of NIS):
|
|
For the nine months ended September 30, 2025
|
Fairview
|
Towantic
|
Maryland
|
Shore (1)
|
|
Valley
|
Three
Rivers
|
Total
|
||||||||||||||||||||
|
Rate of holdings of the CPV Group
|
25%
|
|
26%
|
|
75%
|
|
89%
|
|
50%
|
|
10%
|
|
||||||||||||||||
|
Revenues from sales of energy
|
231
|
230
|
553
|
370
|
431
|
71
|
1,886
|
|||||||||||||||||||||
|
Cost of natural gas
|
106
|
140
|
240
|
195
|
169
|
38
|
888
|
|||||||||||||||||||||
|
Carbon emissions tax (RGGI)
|
–
|
29
|
89
|
57
|
60
|
–
|
235
|
|||||||||||||||||||||
|
Cost of sales – other expenses (without depreciation and amortization)
|
1
|
3
|
12
|
10
|
7
|
1
|
34
|
|||||||||||||||||||||
|
Gain (loss) on realization of transactions hedging the electricity margins
|
5
|
(9
|
)
|
(10
|
)
|
20
|
(16
|
)
|
7
|
(3
|
)
|
|||||||||||||||||
|
Net energy margin
|
129
|
49
|
202
|
128
|
179
|
39
|
726
|
|||||||||||||||||||||
|
Revenues from capacity payments
|
31
|
58
|
65
|
76
|
45
|
12
|
287
|
|||||||||||||||||||||
|
Other income
|
3
|
12
|
18
|
11
|
2
|
2
|
48
|
|||||||||||||||||||||
|
Gross profit
|
163
|
119
|
285
|
215
|
226
|
53
|
1,061
|
|||||||||||||||||||||
|
Fixed costs (without depreciation and amortization)
|
9
|
14
|
40
|
49
|
48
|
11
|
171
|
|||||||||||||||||||||
|
Administrative and general expenses (without depreciation and amortization)
|
4
|
4
|
8
|
9
|
6
|
1
|
32
|
|||||||||||||||||||||
|
Loss from revaluation of unrealized hedging transactions
|
(1
|
)
|
(1
|
)
|
–
|
–
|
–
|
(2
|
)
|
(4
|
)
|
|||||||||||||||||
|
Group’s share in EBITDA after proportionate consolidation in the Energy Transition segment
|
149
|
100
|
237
|
157
|
172
|
39
|
854
|
|||||||||||||||||||||
|
Group’s share in FFO
|
112
|
47
|
181
|
36
|
125
|
24
|
525
|
|||||||||||||||||||||
|
Group’s share in net cash flows after service service of project debt (3)
|
64
|
51
|
74
|
(2)(243 |
)
|
17
|
9
|
(28
|
)
|
|||||||||||||||||||
|
|
(1) |
At the Shore power plant – gas transmission costs (totaling in the period of the report of about NIS 35 million) are classified in accordance with IFRS 16 as depreciation expenses and, accordingly, are not included in the EBITDA.
|
|
|
(2) |
The net cash flows after service of the project debt in Shore includes partial repayment of debt that was made as part of the refinancing made in February 2025. For additional details – see Section 9A(7) below.
|
|
|
(3) |
It is pointed out that the financing agreements of the CPV Group include arrangements for mechanisms of the “cash sweep” type, in the framework of which all or part of the free cash flows of the projects is designated for repayment of loan
principal on a current basis along with a predetermined minimum repayment schedule relating to every long‑term loan. Accordingly, there could be an acceleration of execution of repayments upon occurrence of certain events and there are also
restrictions on distributions to shareholders.
|
|
|
* |
For details regarding transactions for acquisition of additional holdings in the Shore and Maryland power plants in the fourth quarter of 2024 and the second quarter of 2025 – see Note 24C to the annual financial statements and Note 6A to
the Interim Statements. For additional details regarding signing of an agreement for acquisition of the balance of the rights in the Shore power plant after the date of the report – see Note 6A to the Interim Statements.
|
| 4. |
Analysis of the results of operations for the three months ended September 30, 2025 (in millions of NIS) (Cont.)
|
|
|
B. |
EBITDA, FFO and net cash flows after debt service (Cont.)
|
|
|
(1) |
Calculation of the Group’s share in the EBITDA after proportionate consolidation, FFO and net cash flows after service of project debt of associated companies in the Energy Transition segment (in millions of NIS): (Cont.)
|
|
|
|
|||||||||||||||||||||||||||
|
For the nine months ended September 30, 2024
|
Fairview
|
Towantic
|
Maryland
|
Shore (1)
|
|
Valley
|
Three
Rivers
|
Total
|
||||||||||||||||||||
|
Rate of holdings of the CPV Group
|
25%
|
|
26%
|
|
25%
|
|
38%
|
|
50%
|
|
10%
|
|
||||||||||||||||
|
Revenues from sales of energy
|
155
|
145
|
120
|
122
|
259
|
48
|
849
|
|||||||||||||||||||||
|
Cost of natural gas
|
66
|
59
|
48
|
57
|
95
|
28
|
353
|
|||||||||||||||||||||
|
Carbon emissions tax (RGGI)**
|
–
|
30
|
21
|
32
|
65
|
–
|
148
|
|||||||||||||||||||||
|
Cost of sales – other expenses (without depreciation and amortization)
|
2
|
3
|
5
|
5
|
5
|
2
|
22
|
|||||||||||||||||||||
|
Gain on realization of transactions hedgingthe electricity margins
|
18
|
(5
|
)
|
(1
|
)
|
7
|
45
|
12
|
76
|
|||||||||||||||||||
|
Net energy margin
|
105
|
48
|
45
|
35
|
139
|
30
|
402
|
|||||||||||||||||||||
|
Revenues from capacity payments
|
13
|
89
|
9
|
14
|
45
|
3
|
173
|
|||||||||||||||||||||
|
Other income
|
3
|
4
|
5
|
4
|
2
|
1
|
19
|
|||||||||||||||||||||
|
Gross profit
|
121
|
141
|
59
|
53
|
186
|
34
|
594
|
|||||||||||||||||||||
|
Fixed costs (without depreciation and amortization)
|
10
|
15
|
13
|
20
|
51
|
9
|
118
|
|||||||||||||||||||||
|
Administrative and general expenses (without depreciation and amortization)
|
4
|
3
|
3
|
4
|
6
|
1
|
21
|
|||||||||||||||||||||
|
Gain (loss) from revaluation of unrealized hedging transactions
|
7
|
(5
|
)
|
–
|
(6
|
)
|
–
|
–
|
(4
|
)
|
||||||||||||||||||
|
Group’s share in EBITDA after proportionate consolidation in theEnergy Transition segment
|
114
|
118
|
43
|
23
|
129
|
24
|
451
|
|||||||||||||||||||||
|
Group’s share in FFO
|
90
|
108
|
4
|
4
|
55
|
10
|
271
|
|||||||||||||||||||||
|
Group’s share in net cash flows after service of project debt
|
(2)270
|
|
38
|
2
|
4
|
1
|
10
|
325
|
||||||||||||||||||||
|
|
(1) |
At the Shore power plant – gas transport costs (totaling in the corresponding period last year about NIS 17 million)
are classified in accordance with IFRS 16 as depreciation expenses and, accordingly, are not included in the EBITDA.
|
|
|
(2) |
The net cash flows after debt service in Fairview includes taking out of additional financing for the project as part of the refinance in the third quarter of 2024, which was distributed as a dividend to the project’s partners (the share
of the CPV Group amounted to about NIS 246 million)).
|
| 4. |
Analysis of the results of operations for the nine months ended September 30, 2025 (in millions of NIS) (Cont.)
|
|
|
B. |
EBITDA, FFO and net cash flows after debt service (Cont.)
|
|
|
(2) |
Calculation of the Group’s share in EBITDA after proportionate consolidation of the renewable energies segment (in NIS millions):
|
|
For the nine months ended
|
||||
|
September 30, 2025
|
||||
|
Revenues
|
141
|
|||
|
Fixed costs (without depreciation and amortization)
|
(29
|
)
|
||
|
Administrative and general
|
(16
|
)
|
||
|
EBITDA from active projects
|
96
|
|||
|
Business development and other costs
|
(16
|
)
|
||
|
Share of the Group in EBITDA after proportionate
|
||||
|
consolidation in the renewable energies segment in
|
||||
|
the U.S.
|
80
|
|||
| 4. |
Analysis of the results of operations for the nine months ended September 30, 2025 (in millions of NIS) (Cont.)
|
|
|
B. |
EBITDA, FFO and net cash flows after debt service (Cont.)
|
|
|
(3) |
Set forth below is a breakdown of the EBITDA after proportionate consolidation data broken down by subsidiaries (on a consolidated basis) and the associated companies (on a proportionate basis, based on the rate of the holdings of the CPV
Group therein) as well as FFO and cash flows after service of project debt data (in NIS millions):
|
|
For the nine months ended
|
For the nine months ended
|
||||||||||||||||||||||||
|
Main projects in operation
|
Basis of
|
September 30, 2025
|
September 30, 2024
|
||||||||||||||||||||||
|
|
presentation
|
Net cash
|
Net cash
|
||||||||||||||||||||||
|
|
in the
|
EBITDA
|
flows
|
EBITDA
|
flows
|
||||||||||||||||||||
|
|
Company’s
|
after
|
after
|
after
|
after
|
||||||||||||||||||||
|
|
financial
|
proportionate
|
debt
|
proportionate
|
debt
|
||||||||||||||||||||
|
|
statements
|
consolidation
|
FFO
|
service
|
consolidation
|
FFO
|
service
|
||||||||||||||||||
|
|
|||||||||||||||||||||||||
|
Total operating projects in Israel and accompanying business activities (1) (3)
|
Consolidated
|
531
|
501
|
465
|
(2)564
|
|
|
485
|
424
|
||||||||||||||||
|
Business development costs,
headquarters in Israel and other costs (3)
|
Consolidated
|
(9
|
)
|
(107
|
)
|
(137
|
)
|
(23
|
)
|
(110
|
)
|
(45
|
)
|
||||||||||||
|
Total Israel (4)
|
522
|
394
|
328
|
541
|
375
|
379
|
|||||||||||||||||||
|
Total operating projects (5)
|
Associated
|
854
|
525
|
(28
|
)
|
451
|
271
|
325
|
|||||||||||||||||
|
Other costs
|
Consolidated
|
(7
|
)
|
(21
|
)
|
(21
|
)
|
(4
|
)
|
(2
|
)
|
(2
|
)
|
||||||||||||
|
Total energy transition in the U.S.
|
847
|
504
|
(49
|
)
|
447
|
269
|
323
|
||||||||||||||||||
|
Total operating projects (6)
|
Associated
|
96
|
64
|
11
|
104
|
59
|
6
|
||||||||||||||||||
|
Business development and other costs
|
Associated
|
(16
|
)
|
(27
|
)
|
(27
|
)
|
(20
|
)
|
(33
|
)
|
(33
|
)
|
||||||||||||
|
Total renewable energy in the U.S.
|
80
|
37
|
(16
|
)
|
84
|
26
|
(27
|
)
|
|||||||||||||||||
|
Total activities as part of the “others” segment (7)
|
Consolidated
|
(12
|
)
|
(19
|
)
|
(7
|
)
|
(18
|
)
|
(18
|
)
|
(18
|
)
|
||||||||||||
|
Headquarters in the United States (8) (9)
|
Consolidated
|
(165
|
)
|
(40
|
)
|
(40
|
)
|
(61
|
)
|
(49
|
)
|
(49
|
)
|
||||||||||||
|
Total United States
|
750
|
482
|
(112
|
)
|
452
|
228
|
229
|
||||||||||||||||||
|
Company headquarters (not allocated
|
|||||||||||||||||||||||||
|
to the segments) (4) (8)
|
Consolidated
|
(17
|
)
|
(49
|
)
|
(167
|
)
|
(13
|
)
|
(39
|
)
|
(35
|
)
|
||||||||||||
|
Total consolidated (10)
|
1,255
|
827
|
49 |
980
|
564
|
573
|
|||||||||||||||||||
|
|
(1) |
The accompanying business activities in Israel include mainly virtual supply activities through OPC Israel, and sale/purchase of natural gas, including with third parties through OPC Natural Gas.
|
|
|
(2) |
In the corresponding period last year, the EBITDA of the active projects in Israel included compensation in the total amount of about NIS 44 million (about NIS 18 million in the Hadera power plant and about NIS 26 million in the Zomet
power plant, respectively. For additional details – see Notes 26A(2) and 26A(3) to the annual financial statements.
|
|
|
(3) |
For purposes of comparison, the FFO and cash‑flow data after debt service for the activities in Israel were updated in the comparative data, such that the financial data for the headquarters in Israel includes payments of interest and
principal of the project credit in Zomet and Gat up to the early repayment date and refinancing of corporate credit in Israel in the third quarter of 2024 (for additional details see – Note 14B(1) to the annual financial statements).
|
|
|
(4) |
Not including intercompany activities between the headquarters and the subsidiaries in Israel.
|
|
|
(5) |
For details regarding active projects in the Energy Transition segment in the U.S. – see Section 1 above and regarding calculation of the Group’s share in the EBITDA after proportionate consolidation of the Renewable Energies segment – see
Section 2 above.
|
|
|
(6) |
Due to completion of the transaction for investment in the area of renewable energies in the U.S. in November 2024, the data of this segment in the U.S. is calculated from this date on the basis of proportionate consolidation where the
share of the CPV Group is 66.7%.
|
|
|
(7) |
Includes mainly business development and other costs in the area of initiation and development of high‑efficiency power plants running on natural gas, with future carbon capture potential, and the results of the retail activities in the
U.S.
|
|
|
(8) |
After elimination of management fees between the CPV Group and the Company, in the amounts of about NIS 27 million and about NIS 23 million for the nine months ended September 30, 2025 and 2024, respectively.
|
|
|
(9) |
Most of the change in the period of the report compared with the corresponding period last year, in the amount of
about NIS 103 million, relates to changes in the fair value of a profit participation plan for employees of the CPV Group. For details – see Note 7G to the Interim Statements.
|
|
|
(10) |
In the period of the report, the consolidated FFO without adjustments for changes in the working capital was about
NIS 850 million (in the corresponding period last year – about NIS 588 million).
|
| 4. |
Analysis of the results of operations for the nine months ended September 30, 2025 (in millions of NIS) (Cont.)
|
|
|
C. |
Analysis of the change in EBITDA – Israel segment
|
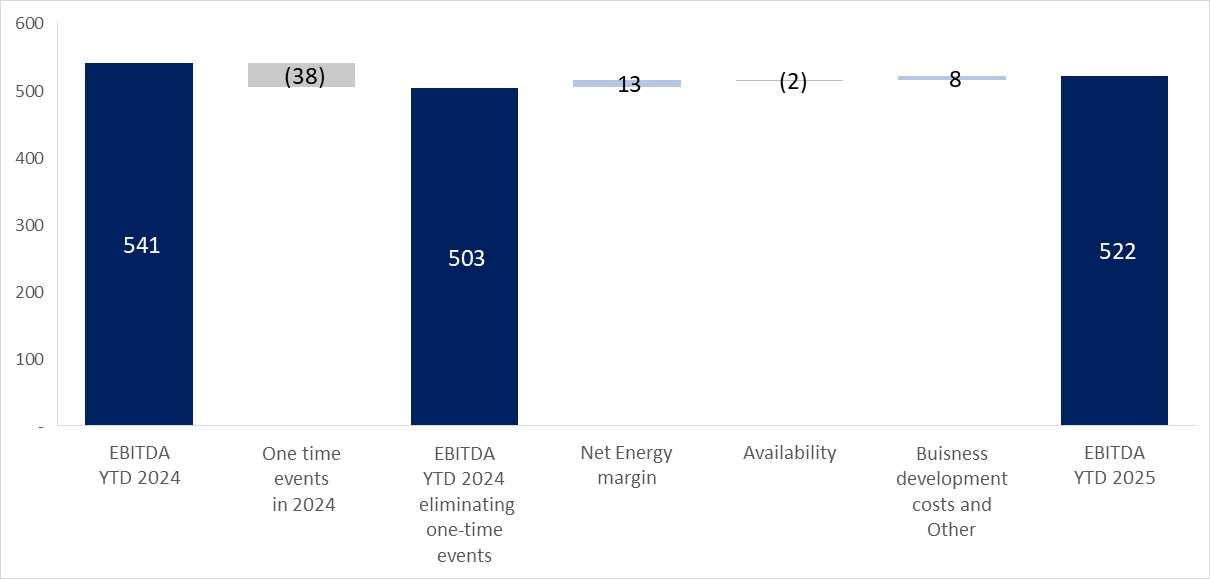
|
|
1. |
Availability (operational) – further to that stated in Section 7.11.1 of Part A of the Periodic Report for 2024, for purposes of reducing the risk of an operating failure at the Zomet power plant due to a technical defect discovered
and in coordination with the contractor, as part of the process of clarifying and repairing the defect, the availability of the power plant was partially limited, where starting from March 2025 the potential maximum capacity of each of the
power plant’s generation units is limited to about 80% – 85%. In addition, maintenance work was performed in in the period of the report, including gradual replacement of the generation units. These factors have a negative (and cumulative)
impact on the power plant’s availability and, in turn, on its results for the period of the report. For additional details – see Section H below. As at the approval date of the report, the Company estimates that the process of clarification
and repair of the defect is expected to be mostly completed by the end of 2026.16
|
| 16 |
That stated constitutes “forward‑looking” information as it is defined in the Securities Law. Ultimately, there could be delays in completion of the required clarification and/or repairs beyond the said
dates and/or other operation limitations could be caused, among other things, as a result of technical and operational factors, factors relating to the construction contractor, shipment of equipment and/or performance of work that could
have an impact on the availability of the power plant, scope of the limitation of the capacity, as stated, and/or the duration of the repair.
|
| 4. |
Analysis of the results of operations for the nine months ended September 30, 2025 (in millions of NIS) (Cont.)
|
|
|
C. |
Analysis of the change in EBITDA – Israel segment (Cont.)
|
|
|
1. |
Availability (operational) – (Cont.)
|
|
|
2. |
One‑time events –
mainly in respect of: (1) signing of an amendment to the agreement was signed with Zomet’s construction contractor in the first quarter of 2024, in the framework of which, among other things, the construction contractor paid Zomet
compensation, in the amount of about NIS 26 million (about $7 million) in respect of a loss of revenues caused to Zomet due to delay in the commercial operation date of the power plant. For additional details – see Note 26A(3) to the
annual financial statements; and (2) receipt of a non‑recurring amount in Hadera from its insurers in the third quarter of 2024, in the amount of about NIS 18 million ($5 million), in connection with lost profits prior to the commercial
operation of the Hadera power plant. For additional details – see Note 26A(2) to the annual financial statements.
|
| 17 |
That stated regarding the expected date of completion of the maintenance work at Rotem, as stated,
and estimation of the cost of the maintenance constitutes “forward‑looking” information as it is defined in the Securities Law and there is no certainty regarding its realization. Ultimately, there could be delays in completion of the maintenance and/or disruptions in the return to full activities even beyond the aforesaid time period, and/or changes in the costs involved with the
maintenance, due to, among other things, technical breakdowns or operational problems, defects in the maintenance work, delays in the arrival of teams of personnel, constraints stemming from the maintenance contractor, force majeure events, changes in the projected costs compared with the final costs that will be formulated upon conclusion and/or occurrence of one or more of the Company’s risk factors enumerated in the Periodic Report. Extension of the maintenance would be expected to
have negative impacts (even significant ones) on the results of the Company’s activities, depending on the actual time (duration) of the maintenance
work.
|
| 4. |
Analysis of the results of operations for the nine months ended September 30, 2025 (in millions of NIS) (Cont.)
|
|
|
D. |
Analysis of the change in EBITDA after proportionate consolidation – energy transition segment in the U.S.
|
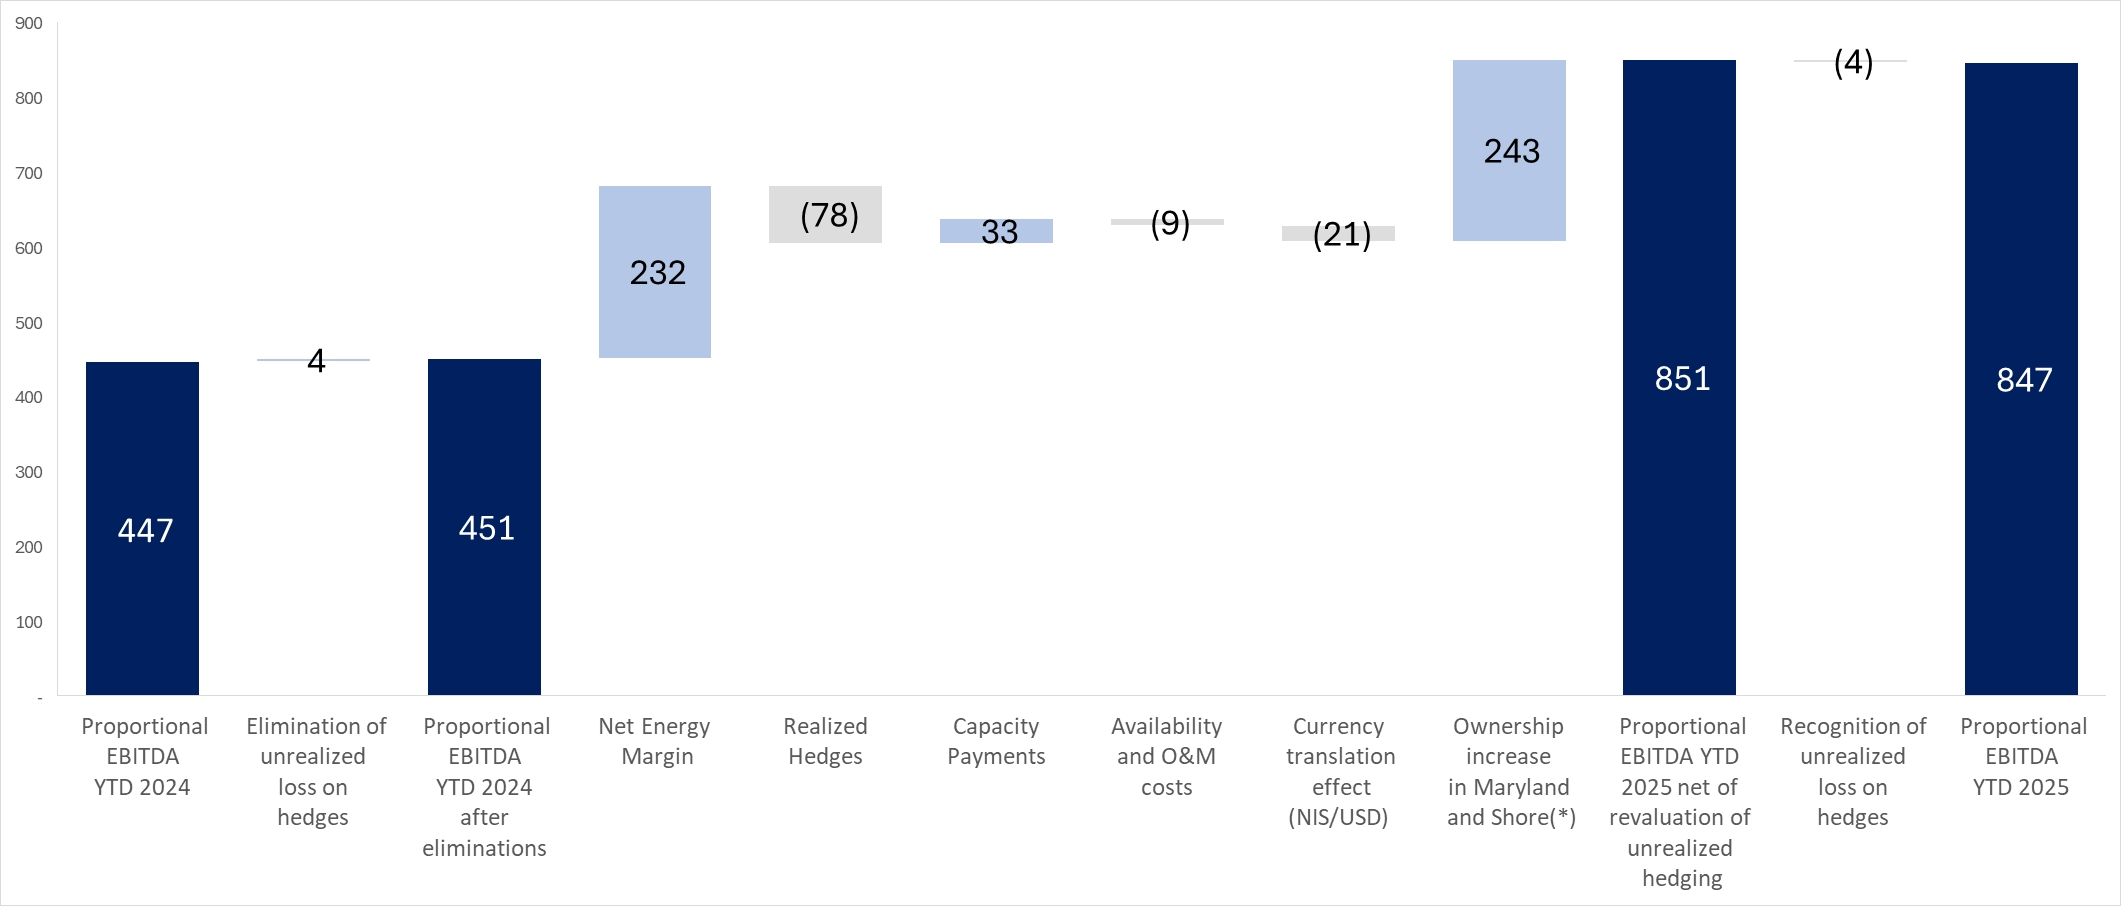
|
|
(*) |
Reflects the impact of the increase in the holdings (in the fourth quarter of 2024 and in the beginning of the second quarter of 2025) in the Maryland and Short power plants on the EBITDA after proportionate consolidation in the period of
the report. For details – see Note 24C to the annual financial statements and Note 6A to the Interim Statements.
|
| 4. |
Analysis of the results of operations for the nine months ended September 30, 2025 (in millions of NIS) (Cont.)
|
|
|
E. |
Renewable energies segment in the U.S.
|
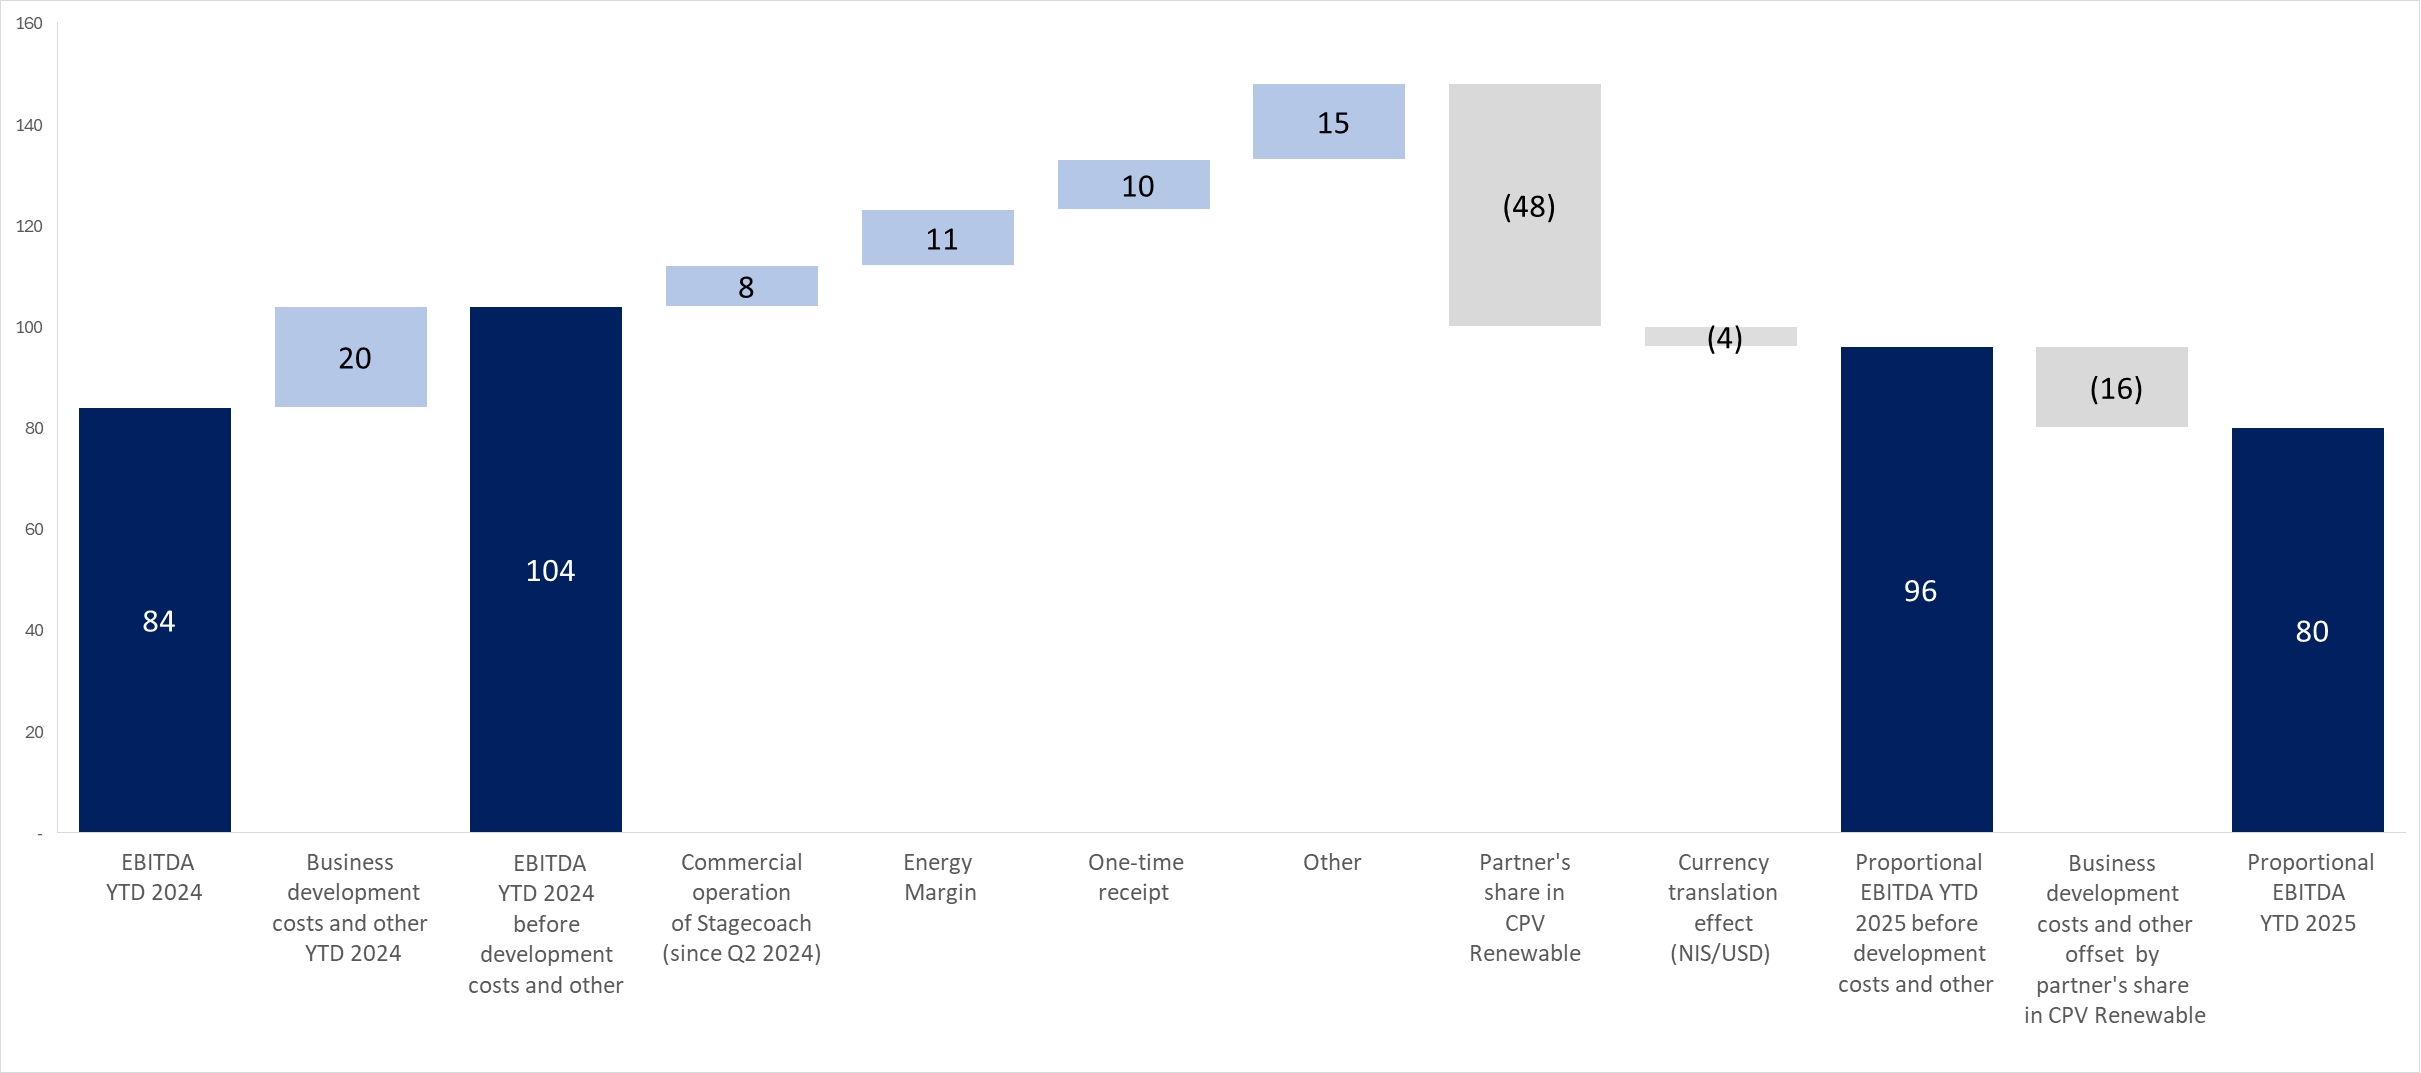
| 4. |
Analysis of the results of operations for the nine months ended September 30, 2025 (in millions of NIS) (Cont.)
|
|
|
F. |
Additional details regarding energy hedges and guaranteed capacity payments in the Energy Transition segment in the U.S.
|
|
October–December
|
||||||
|
2025
|
2026
|
|||||
|
Expected generation (MWh)
|
2,384,000
|
11,988,000
|
||||
|
Net scope of the hedged energy margin (% of the expected generation of the power plants) (*)
|
87%
|
|
62%
|
|
||
|
Net hedged energy margin (millions of $)
|
≈ 38
(≈ NIS 134 million)
|
≈ 141
(≈ NIS 496 million)
|
||||
|
Net hedged energy margin ($/MWh)
|
18.16
|
18.94
|
||||
|
Net market prices of energy margin ($/MWh) (**)
|
15.99
|
15.18
|
|
|
* |
Pursuant to the policy for hedging electricity margins as at the date of the report, in general the CPV Group seeks to hedge about 50% of the scope of the expected generation. The actual hedge rate could ultimately be different, depending
on the market factors.
|
|
|
** |
The net energy margin is the energy margin (Spark Spread) plus/minus Power Basis less carbon tax (RGGI) and other variable costs. For details regarding the manner of calculation of the electricity margin (Spark Spread) – see Section 3.3K
above. The market prices of the net energy margin are based on future contracts for electricity and natural gas.
|
| 18 | The estimated percentages and the actual hedged energy margins could change due to new hedges and/or sales of capacity made or as a result of changes in market conditions or the hedging policy of the CPV Group. That stated in this Section with respect to the scope of the hedging, energy margin and availability receipts constitutes “forward‑looking” information as it is defined in the Securities Law, which may change due to, among other things, operating factors and availability of the power plant, market conditions, regulatory changes and/or occurrence of one or more of the risk factors as stated in Section 19 of Part A of the Periodic Report for 2024. |
| 4. |
Analysis of the results of operations for the nine months ended September 30, 2025 (in millions of NIS) (Cont.)
|
|
|
F. |
Additional details regarding energy hedges and guaranteed capacity payments in the Energy Transition segment in the U.S. (Cont.)
|
|
October–December
|
||||||
|
2025
|
2026
|
|||||
|
Scope of the secured capacity revenues (% of the power plant’s capacity) (*)
|
93%
|
|
87%
|
|
||
|
Capacity receipts (millions of $)
|
≈ 35
(≈ NIS 123 million)
|
≈ 151
(≈ NIS 533 million)
|
|
|
(*) |
Most of the non‑guaranteed availability relates to the Valley power plant that operates in the NYISO market. For details regarding the availability tariffs in this market – see Section 3.3M above.
|
|
|
G. |
Net income and adjusted net income (in millions of NIS)
|
|
|
1. |
Definitions
|
| 4. |
Analysis of the results of operations for the nine months ended September 30, 2025 (in millions of NIS) (Cont.)
|
|
|
G. |
Net income and adjusted net income (in millions of NIS) (Cont.)
|
|
|
2. |
Analysis of the change in net income and adjusted net income (in millions of NIS)
|
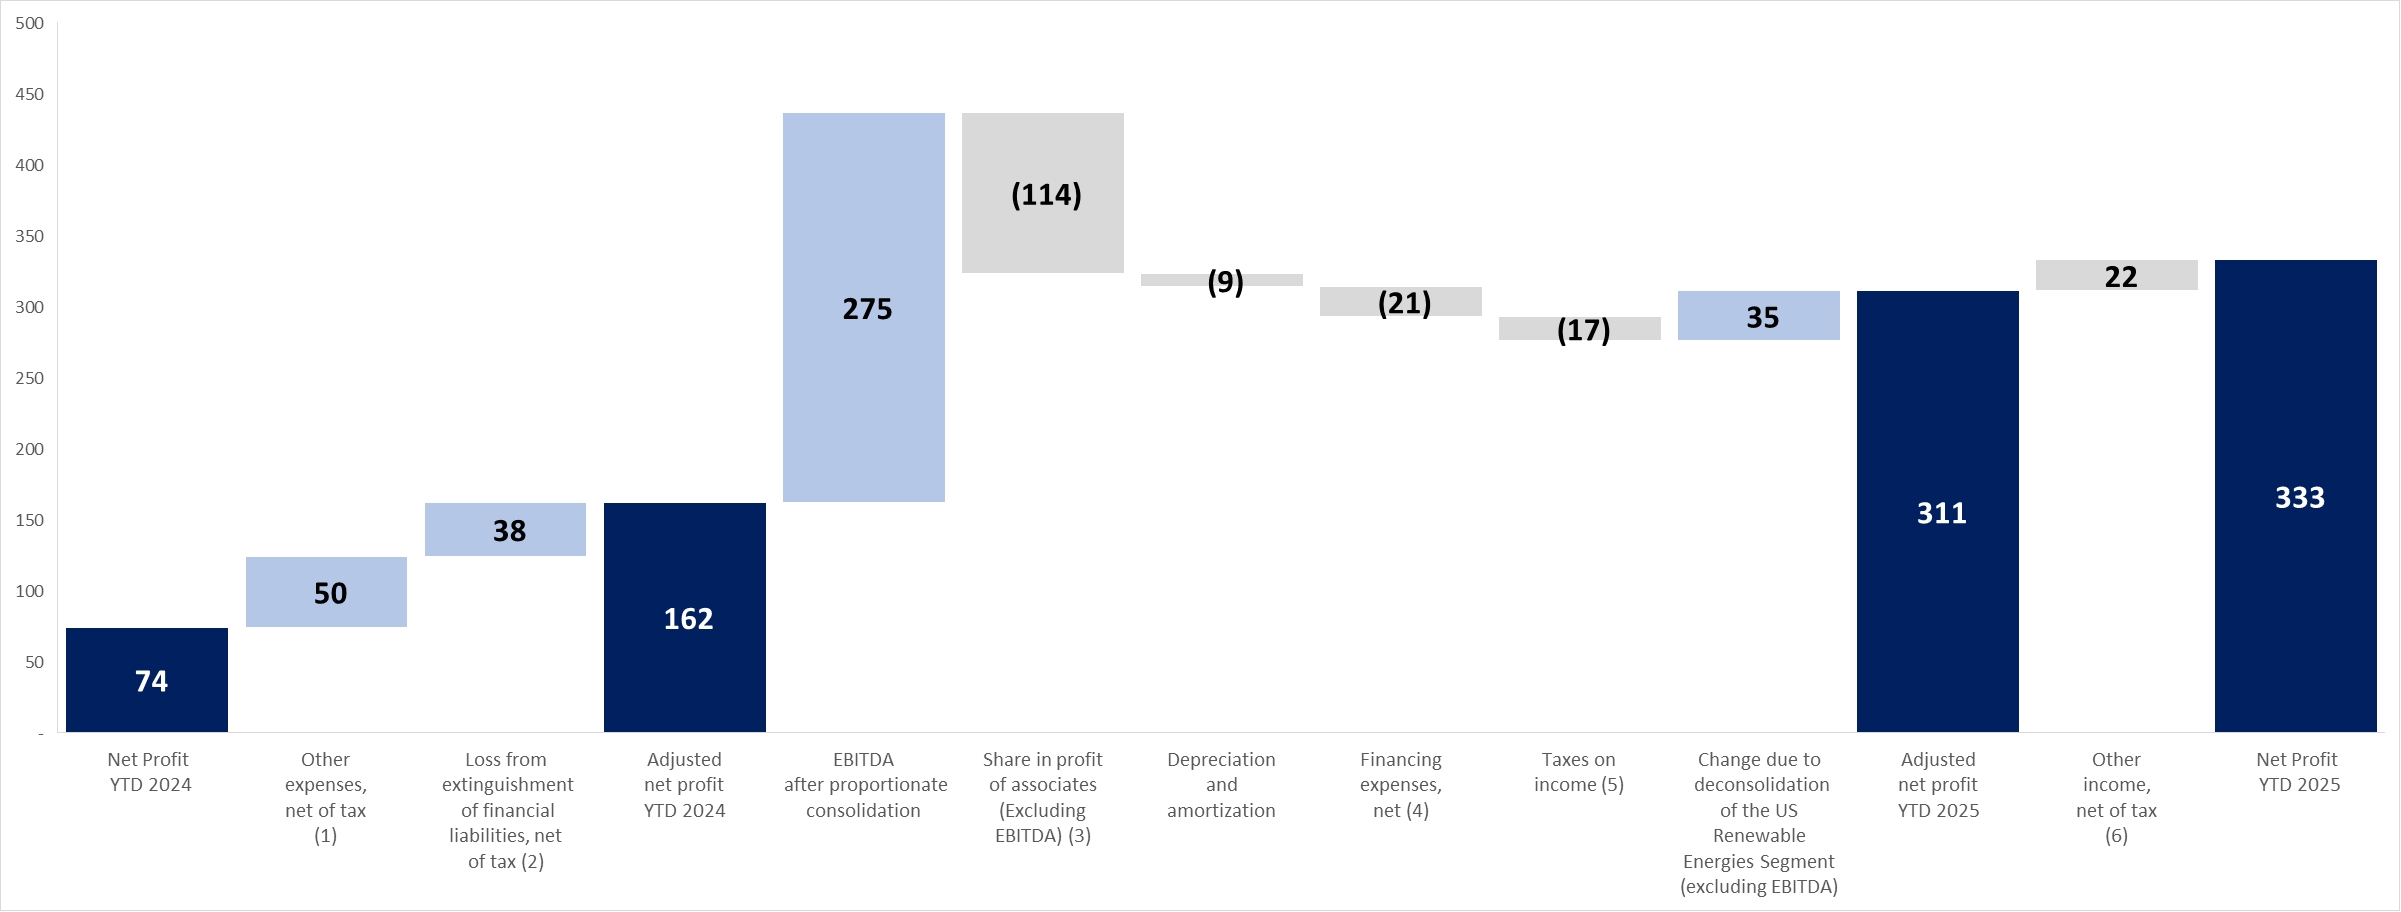
|
|
(1) |
A loss from impairment in value of the investment in Gnrgy in the corresponding period last year, in the amount of about NIS 21 million, of which there was an impairment loss in Hadera 2, in the amount of about NIS 31 million, in light of
the government’s original decision to reject the plan.
|
|
|
(2) |
Including non‑recurring financing expenses in respect of repayment of the project credit in Zomet and Gat, in the amount of about NIS 49 million (about NIS 38 million, net of tax). For details – see Note 14B(1) to the annual financial
statements.
|
|
|
(3) |
Most of the increase stems from additional depreciation and financing expenses, in the amount of about NIS 143 million due to increase in the rate of holdings in the Shore and Maryland power plants in the fourth quarter of 2024 and in the
beginning of the second quarter of 2025.
|
|
|
(4) |
Most of the increase stems from an increase in the financing expenses as a result of the impact of the changes in the dollar/shekel exchange rate: (1) an increase in the financing expenses in the period of the report, in the amount of
about NIS 24 million; and (2) a decrease in the financing income in the corresponding period last year, in the amount of about NIS 40 million. On the other hand, there was an increase of about NIS 17 million due to interest income on bank
deposits and a decrease in financing expenses of about NIS 19 million mainly due to a decline in the expenses stemming from linkage differences in respect of the Company’s linked debentures.
|
|
|
(5) |
The increase in the tax expenses derives from better results compared with the corresponding period last year.
|
|
|
(6) |
Stems mainly from cancellation of an impairment loss recognized by Hadera 2 in the third quarter of 2025 that was recorded in the corresponding period last year – this being due to approval of the plan by the government. For additional
details – see Note 10B to the Interim Statements.
|
| 4. |
Analysis of the results of operations for the nine months ended September 30, 2025 (in millions of NIS) (Cont.)
|
|
|
H. |
Detail of generation
|
|
For the nine months ended September 30, 2025
|
For the nine months ended September 30, 2024
|
|||||||||||||||||||||||||||||||||||
|
Actual
|
Actual
|
|||||||||||||||||||||||||||||||||||
|
Potential
|
Net
|
Actual
|
calculated
|
Potential
|
Net
|
Actual
|
calculated
|
|||||||||||||||||||||||||||||
|
electricity
|
electricity
|
generation
|
availability
|
electricity
|
electricity
|
generation
|
availability
|
|||||||||||||||||||||||||||||
|
Capacity
|
generation
|
generation
|
percentage
|
percentage
|
generation
|
generation
|
percentage
|
percentage
|
||||||||||||||||||||||||||||
|
(MW)
|
(GWh)(1)
|
(GWh)(2)
|
(%)(3)
|
(%)
|
(GWh)
|
(GWh)
|
(%)
|
(%)
|
||||||||||||||||||||||||||||
|
Rotem
|
466
|
2,775
|
2,698
|
97.2
|
%
|
99.6
|
%
|
2,789
|
2,425
|
86.9
|
%
|
93.0
|
%
|
|||||||||||||||||||||||
|
Hadera
|
144
|
757
|
715
|
94.5
|
%
|
95.0
|
%
|
784
|
680
|
86.7
|
%
|
88.0
|
%
|
|||||||||||||||||||||||
|
Gat
|
75
|
463
|
400
|
86.4
|
%
|
99.8
|
%
|
467
|
323
|
69.2
|
%
|
69.2
|
%
|
|||||||||||||||||||||||
|
Zomet*
|
396
|
2,369
|
220
|
9.3
|
%
|
68.2
|
%
|
2,449
|
398
|
16.3
|
%
|
83.0
|
%
|
|||||||||||||||||||||||
|
|
(1) |
The generation potential is the net generation capability adjusted for temperature and humidity.
|
|
|
(2) |
The actual net generation in the period.
|
|
|
(3) |
The actual generation percentage is the net electricity generated divided by the generation potential.
|
|
|
* |
The generation potential presented in the above table does not include the temporary generation limitation that applied in the period of the report to each of the generation units, as detailed in Section 4C(1) above. In addition, in the
period of the report some of the generation units were replaced due to the maintenance work, as stated in Section 4C(1) above, and accordingly they were only partly used.
|
|
For the nine months ended September 30, 2025
|
For the nine months ended September 30, 2024
|
|||||||||||||||||||||||||||||||||||
|
Potential
|
Net
|
Actual
|
Actual
|
Potential
|
Net
|
Actual
|
Actual
|
|||||||||||||||||||||||||||||
|
electricity
|
electricity
|
generation
|
availability
|
electricity
|
electricity
|
generation
|
availability
|
|||||||||||||||||||||||||||||
|
Capacity
|
generation
|
generation
|
percentage
|
percentage
|
generation
|
generation
|
percentage
|
percentage
|
||||||||||||||||||||||||||||
|
(MW)
|
(GWh)(1)
|
(GWh)(2)
|
(%)(3)
|
(%)
|
(GWh)
|
(GWh)
|
(%)
|
(%)
|
||||||||||||||||||||||||||||
|
Energy transition projects (natural gas)
|
||||||||||||||||||||||||||||||||||||
|
Shore
|
725
|
4,674
|
2,737
|
58.1
|
%
|
88.0
|
%
|
4,574
|
2,799
|
59.0
|
%
|
93.2
|
%
|
|||||||||||||||||||||||
|
Maryland
|
745
|
4,783
|
3,464
|
72.2
|
%
|
95.5
|
%
|
4,641
|
2,774
|
57.6
|
%
|
94.0
|
%
|
|||||||||||||||||||||||
|
Valley
|
720
|
4,518
|
3,998
|
88.3
|
%
|
95.0
|
%
|
4,578
|
3,999
|
88.1
|
%
|
95.6
|
%
|
|||||||||||||||||||||||
|
Towantic*
|
805
|
4,343
|
3,694
|
69.3
|
%
|
82.1
|
%
|
5,001
|
4,125
|
77.0
|
%
|
89.7
|
%
|
|||||||||||||||||||||||
|
Fairview
|
1,050
|
6,852
|
6,218
|
90.0
|
%
|
96.4
|
%
|
6,808
|
5,777
|
83.2
|
%
|
90.4
|
%
|
|||||||||||||||||||||||
|
Three Rivers
|
1,258
|
7,471
|
5,018
|
62.5
|
%
|
87.8
|
%
|
7,647
|
5,082
|
64.0
|
%
|
80.2
|
%
|
|||||||||||||||||||||||
| (1) |
The potential generation is the gross generation capability during the period after planned maintenance and less the electricity used for the power plant’s internal purposes.
|
| (2) |
The net generation of electricity is the gross generation during the period less the electricity used for the power plant’s internal purposes.
|
| (3) |
The actual generation percentage is the quantity of the net electricity generated in the facilities compared with the maximum quantity that can be generated in the period.
|
|
|
* |
In the second quarter of 2025, planned maintenance was performed at the power plant, as part of which a signification item of equipment was replaced. The equipment is insured under the insurance policy covering the power plant, and as at
the approval date of the report, an agreement was signed with the insurer regarding the monetary indemnification which covers most of the costs required for replacement and installation of the equipment.19.
|
| 19 |
It is noted that in the usual course of things long maintenance periods (planned or unplanned) have a negative impact on the power plant’s results.
|
| 5. |
Analysis of the results of operations for the three months ended September 30, 2025 (in millions of NIS)
|
|
|
A. |
Statement of income
|
|
For the Three Months Ended
|
||||||||
|
Section
|
September 30
|
|||||||
|
*2025
|
2024
|
|||||||
|
Revenues from sales and provision of services (1)
|
895
|
879
|
||||||
|
Cost of sales and provision of services (without depreciation and amortization) (2)
|
(603
|
)
|
(582
|
)
|
||||
|
Depreciation and amortization
|
(59
|
)
|
(90
|
)
|
||||
|
Gross profit
|
233
|
207
|
||||||
|
Share in earnings of associated companies
|
211
|
64
|
||||||
|
Compensation for lost revenues
|
–
|
18
|
||||||
|
Administrative and general expenses
|
(147
|
)
|
(72
|
)
|
||||
|
Business development expenses
|
(4
|
)
|
(11
|
)
|
||||
|
Other income, net
|
35
|
2
|
||||||
|
Operating income
|
328
|
208
|
||||||
|
Financing expenses, net
|
(44
|
)
|
(51
|
)
|
||||
|
Loss from settlement of financial liabilities
|
–
|
(49
|
)
|
|||||
|
Income before taxes on income
|
284
|
108
|
||||||
|
Taxes on income
|
(48
|
)
|
(22
|
)
|
||||
|
Net income for the period**
|
236
|
86
|
||||||
|
Attributable to:
|
||||||||
|
The Company’s shareholders
|
183
|
81
|
||||||
|
Holders of non‑controlling interests
|
53
|
5
|
||||||
|
|
* |
Commencing from November 2024, as a result of exit from the consolidation of CPV Renewable and transition to the equity method of accounting, the Company has discontinued consolidation in the consolidated financial statements of the
results of the renewable energy segment in the U.S.
|
|
|
** |
For an analysis of the change in the net income and a definition and analysis of the change in the adjusted net income – see Section 5F below.
|
| 5. |
Analysis of the results of operations for the three months ended September 30, 2025 (in millions of NIS) (Cont.)
|
|
|
A. |
Statement of income (Cont.)
|
|
Revenues
|
For the Three
|
Board’s Explanations
|
|||||||
|
Months Ended
|
|||||||||
|
September 30
|
|||||||||
|
2025
|
2024
|
||||||||
|
Revenues in Israel
|
|||||||||
|
Revenues from sale of energy to private customers
|
427
|
516
|
A decrease, in the amount of about NIS 65 million, stems from a decline in the consumption of customers, compared with
the corresponding quarter last year, mainly due to the “Nation as a Lioness” mission and a decrease, in the amount of about NIS 22 million, deriving from the generation tariff component, compared with the corresponding quarter last year.
|
||||||
|
Revenues from sale of energy to the System Operator and to other suppliers
|
54
|
50
|
|||||||
|
Revenues in respect of capacity payments
|
40
|
39
|
The increase stems from an increase in the availability of the Gat power plant due to maintenance work performed in
the corresponding quarter last year, while on the other hand there was a decline in the availability Zomet compared with the corresponding quarter last year. For additional details – see Section 4C above.
|
||||||
|
Revenues from sale of energy at cogeneration tariff
|
7
|
17
|
|||||||
|
Revenues from sale of steam
|
13
|
14
|
|||||||
|
Other income
|
2
|
–
|
|||||||
|
Total revenues from sale of energy and others in Israel (without infrastructure services)
|
543
|
636
|
|||||||
|
Revenues from private customers in respect of infrastructure services
|
171
|
125
|
The increase derives mainly from the increase in the average tariffs at a rate of about 40%.
|
||||||
|
Total revenues in Israel
|
714
|
761
|
|||||||
|
Revenues in the U.S.
|
|||||||||
|
Revenues from sale of electricity from renewable energy
|
–
|
39
|
The decrease stems from discontinuance of the consolidation of the renewable energies segment in November 2024 and transition to the equity method of
accounting. For additional details – see Note 23E to the annual financial statements.
|
||||||
|
Revenues from sale of electricity (retail) and others
|
181
|
79
|
The increase stems mainly from an increase in the scope of the retail activities.
|
||||||
|
Total revenues in the U.S.
|
181
|
118
|
|||||||
|
Total revenues
|
895
|
879
|
|||||||
| 5. |
Analysis of the results of operations for the three months ended September 30, 2025 (in millions of NIS) (Cont.)
|
|
|
A. |
Statement of income (Cont.)
|
|
|
(2) |
Changes in the cost of sales and provision of services (not including depreciation and amortization):
|
|
Cost of Sales and
Provision of Services
|
For the Three
Months Ended
|
Board’s Explanations
|
|||||||
|
September 30
|
|||||||||
|
2025
|
2024
|
||||||||
|
Cost of sales in Israel
|
|||||||||
|
Natural gas and diesel oil
|
167
|
164
|
|||||||
|
Expenses in respect of acquisition of energy
|
50
|
163
|
Most of the decrease stems from a decline in customer consumption compared with the corresponding period last year due to, among other things, the
“Nation as a Lioness” mission and from maintenance activities performed at the Gat power plant in the corresponding quarter last year.
|
||||||
|
Cost of transmission of gas
|
11
|
13
|
|||||||
|
Salaries and related expenses
|
13
|
12
|
|||||||
|
Operating expenses
|
30
|
30
|
|||||||
|
Total cost of sales in Israel without infrastructure services
|
271
|
382
|
|||||||
|
Expenses in respect of infrastructure services
|
171
|
125
|
For details – see the explanation of the change in the revenues in respect of infrastructure services.
|
||||||
|
Total cost of sales in Israel
|
442
|
507
|
|||||||
|
Cost of sales and services in the U.S.
|
|||||||||
|
Cost of sales in respect of sale of electricity from renewable energy
|
–
|
11
|
The decrease stems from discontinuance of the consolidation of the renewable energies segment in November 2024 and transition to the equity method of
accounting. For additional details – see Note 23E to the annual financial statements.
|
||||||
|
Cost of sales in respect of sale of electricity (Retail) and others
|
161
|
64
|
The increase stems mainly from an increase in the scope of the retail activities.
|
||||||
|
Total cost of sales and provision of services in the U.S.
|
161
|
75
|
|||||||
|
Total cost of sales and provision of services
|
603
|
582
|
|||||||
| 5. |
Analysis of the results of operations for the three months ended September 30, 2025 (in millions of NIS) (Cont.)
|
|
|
B. |
EBITDA, FFO and net cash flows after debt service
|
|
For the
|
||||||||
|
Three Months Ended
|
||||||||
|
September 30
|
||||||||
|
2025
|
2024
|
|||||||
|
Revenues from sales and provision of services
|
895
|
879
|
||||||
|
Cost of sales and provision of services (without depreciation and
|
||||||||
|
amortization)
|
(603
|
)
|
(582
|
)
|
||||
|
Share in income of associated companies
|
211
|
64
|
||||||
|
Compensation for lost revenues
|
–
|
18
|
||||||
|
Administrative and general expenses (without depreciation and amortization)
|
(142
|
)
|
(67
|
)
|
||||
|
Business development expenses
|
(4
|
)
|
(11
|
)
|
||||
|
Consolidated EBITDA
|
357
|
301
|
||||||
|
Elimination of the share in income of associated companies
|
(211
|
)
|
(64
|
)
|
||||
|
Plus – Group’s share of the EBITDA after proportionate consolidation of
|
||||||||
|
associated companies in the Energy Transition segment (1)
|
354
|
170
|
||||||
|
Plus – Group’s share of the EBITDA after proportionate consolidation of
|
||||||||
|
activities of the Renewable Energies segment in the U.S. (2)*
|
22
|
–
|
||||||
|
EBITDA after proportionate consolidation
|
522
|
407
|
||||||
| 5. |
Analysis of the results of operations for the three months ended September 30, 2025 (in millions of NIS) (Cont.)
|
|
|
B. |
EBITDA, FFO and net cash flows after debt service (Cont.)
|
|
|
(1) |
Calculation of the Group’s share in the EBITDA after proportionate consolidation, FFO and net cash flows after service of project debt of associated companies in the Energy Transition segment (in millions of NIS):
|
|
For the three months ended September 30, 2025
|
Fairview
|
Towantic
|
Maryland
|
Shore
(1)
|
|
Valley
|
Three
Rivers
|
Total
|
||||||||||||||||||||
|
Rate of holdings of the CPV Group
|
25%
|
|
26%
|
|
75%
|
|
89%
|
|
50%
|
|
10%
|
|
||||||||||||||||
|
Revenues from sales of energy
|
72
|
66
|
187
|
153
|
118
|
30
|
626
|
|||||||||||||||||||||
|
Cost of natural gas
|
26
|
24
|
57
|
58
|
35
|
13
|
213
|
|||||||||||||||||||||
|
Carbon emissions tax (RGGI)
|
–
|
12
|
29
|
31
|
20
|
–
|
92
|
|||||||||||||||||||||
|
Cost of sales – other expenses (without depreciation and amortization)
|
–
|
1
|
1
|
5
|
4
|
1
|
12
|
|||||||||||||||||||||
|
Loss on realization of transactions
hedging the electricity margins |
(2
|
)
|
(7
|
)
|
(22
|
)
|
(4
|
)
|
(4
|
)
|
(4
|
)
|
(43
|
)
|
||||||||||||||
|
Net energy margin
|
44
|
22
|
78
|
55
|
55
|
12
|
266
|
|||||||||||||||||||||
|
Revenues from capacity payments
|
18
|
5
|
37
|
44
|
18
|
8
|
130
|
|||||||||||||||||||||
|
Other income
|
–
|
3
|
6
|
5
|
1
|
1
|
16
|
|||||||||||||||||||||
|
Gross profit
|
62
|
30
|
121
|
104
|
74
|
21
|
412
|
|||||||||||||||||||||
|
Fixed costs (without depreciation and amortization)
|
3
|
4
|
12
|
11
|
13
|
4
|
47
|
|||||||||||||||||||||
|
Administrative and general expenses (without depreciation and amortization)
|
1
|
2
|
2
|
3
|
2
|
–
|
10
|
|||||||||||||||||||||
|
Income (loss) from revaluation of unrealized hedging transactions
|
1
|
(1
|
)
|
–
|
–
|
–
|
(1
|
)
|
(1
|
)
|
||||||||||||||||||
|
Group’s share in EBITDA after proportionate consolidation in the Energy Transition segment
|
59
|
23
|
107
|
90
|
59
|
16
|
354
|
|||||||||||||||||||||
|
Group’s share in FFO
|
50
|
1
|
95
|
60
|
52
|
10
|
268
|
|||||||||||||||||||||
|
Group’s share in the net cash flows after service of the project debt (2)
|
35
|
9
|
41
|
(2
|
)
|
18
|
1
|
102
|
||||||||||||||||||||
|
|
(1) |
At the Shore power plant – gas transmission costs (totaling in the third quarter of 2025 about NIS 12 million) are classified in accordance with IFRS 16 as depreciation expenses and, accordingly, are not included in the EBITDA.
|
|
|
(2) |
It is pointed out that the financing agreements of the CPV Group include arrangements for mechanisms of the “cash sweep” type, in the framework of which all or part of the free cash flows of the projects is designated for repayment of loan
principal on a current basis along with a predetermined minimum repayment schedule relating to every long‑term loan. Accordingly, there could be an acceleration of execution of repayments upon occurrence of certain events and there are also
restrictions on distributions to shareholders.
|
|
|
* |
For details regarding transactions for acquisition of additional holdings in the Shore and Maryland power plants in the fourth quarter of 2024 and in the second quarter of 2025 – see Note 24C to the annual financial statements and Note 6A
to the Interim Statements. Subsequent to the date of the report, the CPV Group signed an agreement for acquisition of the balance of the holdings in the Shore power plant, where as at the approval date of the report the transaction had not
yet been completed. For details – see Note 6A to the Interim Statements.
|
| 5. |
Analysis of the results of operations for the three months ended September 30, 2025 (in millions of NIS) (Cont.)
|
|
|
B. |
EBITDA, FFO and net cash flows after debt service (Cont.)
|
|
|
(1) |
Calculation of the Group’s share in the EBITDA after proportionate consolidation, FFO and net cash flows after service of project debt of associated companies in the Energy Transition segment (in millions of NIS): (Cont.)
|
|
For the three months ended September 30, 2024
|
Fairview
|
Towantic
|
Maryland
|
Shore
(1)
|
|
Valley
|
Three
Rivers
|
Total
|
||||||||||||||||||||
|
Rate of holdings of the CPV Group
|
25%
|
|
26%
|
|
25%
|
|
38%
|
|
50%
|
|
10%
|
|
|
|
|
|||||||||||||
|
Revenues from sales of energy
|
53
|
52
|
53
|
46
|
91
|
22
|
317
|
|||||||||||||||||||||
|
Cost of natural gas
|
19
|
13
|
12
|
14
|
26
|
10
|
94
|
|||||||||||||||||||||
|
Carbon emissions tax (RGGI)
|
–
|
14
|
10
|
10
|
30
|
–
|
64
|
|||||||||||||||||||||
|
Cost of sales – other expenses (without depreciation and amortization)
|
1
|
1
|
2
|
2
|
2
|
1
|
9
|
|||||||||||||||||||||
|
Gain (loss) on realization of transactions hedging the electricity margins
|
3
|
(8
|
)
|
(9
|
)
|
(1
|
)
|
6
|
1
|
(8
|
)
|
|||||||||||||||||
|
Net energy margin
|
36
|
16
|
20
|
19
|
39
|
12
|
142
|
|||||||||||||||||||||
|
Revenues from capacity payments
|
5
|
33
|
3
|
5
|
16
|
1
|
63
|
|||||||||||||||||||||
|
Other income
|
1
|
–
|
2
|
1
|
1
|
–
|
5
|
|||||||||||||||||||||
|
Gross profit
|
42
|
49
|
25
|
25
|
56
|
13
|
210
|
|||||||||||||||||||||
|
Fixed costs (without depreciation and amortization)
|
5
|
5
|
4
|
5
|
17
|
3
|
39
|
|||||||||||||||||||||
|
Administrative and general expenses (without depreciation and amortization)
|
2
|
1
|
1
|
1
|
2
|
–
|
7
|
|||||||||||||||||||||
|
Gain from revaluation of unrealized hedging transactions
|
3
|
3
|
–
|
–
|
–
|
–
|
6
|
|||||||||||||||||||||
|
Group’s share in EBITDA after proportionate consolidation in the Energy Transition segment
|
38
|
46
|
20
|
19
|
37
|
10
|
170
|
|||||||||||||||||||||
|
Group’s share in FFO
|
27
|
42
|
9
|
9
|
5
|
4
|
96
|
|||||||||||||||||||||
|
Group’s share in net cash flows after service of project debt
|
(2)243
|
|
28
|
4
|
9
|
(10
|
)
|
1
|
275
|
|||||||||||||||||||
|
|
(1) |
At the Shore power plant – gas transmission costs (totaling in the third quarter of 2024 about NIS 5 million) are classified in accordance with IFRS 16 as depreciation expenses and, accordingly, are not included in the EBITDA.
|
|
|
(2) |
The free cash flows after service of the debt in Fairview includes taking out additional financing for the project as part of a refinancing in the third quarter of 2024 (which was distributed as a dividend to the partners in the project,
where the share of the CPV Group is about NIS 246 million).
|
|
|
(2) |
Calculation of the Group’s share in EBITDA after proportionate consolidation of the renewable energies segment (in NIS millions):
|
|
For the three months ended
|
||||
|
September 30, 2025
|
||||
|
Revenues
|
42
|
|||
|
Fixed costs (without depreciation and amortization)
|
(10
|
)
|
||
|
Administrative and general
|
(6
|
)
|
||
|
EBITDA from active projects
|
26
|
|||
|
Business development and other costs
|
(5
|
)
|
||
|
|
||||
|
Share of the Group in EBITDA after proportionate consolidation in the renewable energies segment in the U.S.
|
21
|
|||
| 5. |
Analysis of the results of operations for the three months ended September 30, 2025 (in millions of NIS) (Cont.)
|
|
|
B. |
EBITDA, FFO and net cash flows after debt service (Cont.)
|
|
|
(3) |
Set forth below is a breakdown of the EBITDA after proportionate consolidation data broken down by the subsidiaries (on a consolidated basis) and the associated companies (on a proportionate basis, based on the rate of the holdings of the
CPV Group therein) as well as FFO and cash flows after service of project debt data (in NIS millions):
|
|
Main projects in operation
|
Basis of
|
For the three months ended
September 30, 2025
|
For the three months ended
September 30, 2024
|
||||||||||||||||||||||
|
|
presentation |
Net cash
|
Net cash
|
||||||||||||||||||||||
|
|
in the
|
EBITDA
|
flows
|
EBITDA
|
flows
|
||||||||||||||||||||
|
|
Company’s
|
after
|
after
|
after
|
after
|
||||||||||||||||||||
|
|
financial
|
proportionate
|
debt
|
proportionate
|
debt
|
||||||||||||||||||||
|
|
statements |
consolidation
|
FFO
|
service
|
consolidation
|
FFO
|
service
|
||||||||||||||||||
|
Total operating projects in Israel and
|
|||||||||||||||||||||||||
|
accompanying business activities (1) (3)
|
Consolidated
|
261
|
254
|
241
|
(2)261
|
186
|
173
|
||||||||||||||||||
|
Business development costs,
|
|||||||||||||||||||||||||
|
headquarters in Israel and other costs (3)
|
Consolidated
|
(3
|
)
|
(46
|
)
|
(63
|
)
|
(6
|
)
|
(42
|
)
|
42
|
|||||||||||||
|
Total Israel (4)
|
258
|
208
|
178 |
255
|
144
|
215
|
|||||||||||||||||||
|
Total operating projects (5)
|
Associated
|
354
|
268
|
102
|
170
|
96
|
275
|
||||||||||||||||||
|
Other costs
|
Consolidated
|
(5
|
)
|
(10
|
)
|
(10
|
)
|
(1
|
)
|
7
|
7
|
||||||||||||||
|
Total energy transition in the U.S.
|
349
|
258
|
92
|
169
|
103
|
282
|
|||||||||||||||||||
|
Total operating projects (6)
|
Associated
|
26
|
12
|
(6
|
)
|
27
|
11
|
(6
|
)
|
||||||||||||||||
|
Business development and other costs
|
Associated
|
(5
|
)
|
(10
|
)
|
(10
|
)
|
(6
|
)
|
(14
|
)
|
(14
|
)
|
||||||||||||
|
Total renewable energy in the U.S.
|
21
|
2
|
(16
|
)
|
21
|
(3
|
)
|
(20
|
)
|
||||||||||||||||
|
Total activities as part of the “others”
|
|||||||||||||||||||||||||
|
segment (7)
|
Consolidated
|
(6
|
)
|
(13
|
)
|
(1
|
)
|
(4
|
)
|
(4
|
)
|
(4
|
)
|
||||||||||||
|
Headquarters in the United States (8) (9)
|
Consolidated
|
(94
|
)
|
(7
|
)
|
(7
|
)
|
(29
|
)
|
(12
|
)
|
(12
|
)
|
||||||||||||
|
Total United States
|
270
|
240
|
68
|
157
|
84
|
246
|
|||||||||||||||||||
|
Company headquarters (not allocated
|
|||||||||||||||||||||||||
|
to the segments) (4) (8)
|
Consolidated
|
(6
|
)
|
(11
|
)
|
(257
|
)
|
(5
|
)
|
16
|
(82
|
)
|
|||||||||||||
|
Total consolidated (10)
|
522
|
437
|
(11
|
)
|
407
|
244
|
379
|
||||||||||||||||||
|
|
(1) |
The accompanying business activities in Israel include mainly virtual supply activities through OPC Israel, and sale/purchase of natural gas, including with third parties through OPC Natural Gas.
|
|
|
(2) |
In the corresponding quarter last year, the EBITDA of the active projects in Israel included compensation of about NIS 18 million in the Hadera power plant.
|
|
|
(3) |
For purposes of comparison, the FFO and cash‑flows after debt service in the Israeli activities data were updated in the comparative data, such that the financial data of the headquarters in Israel includes payments of interest and
principal of project credit in Zomet and Gat up to the date of the early repayment and refinancing of the corporate credit in Israel in the third quarter of 2024 (for additional details – see Note 14B(1) to the annual financial statements).
|
|
|
(4) |
Not including intercompany activities between the Company, the headquarters in Israel and the subsidiaries in Israel.
|
|
|
(5) |
For details regarding active projects in the Energy Transition segment in the U.S. – see Section 1 above and regarding calculation of the Group’s share in the EBITDA after proportionate consolidation of the Renewable Energies segment – see
Section 2 above.
|
|
|
(6) |
Due to completion of the transaction for investment in the area of renewable energies in the U.S. in November 2024, the data of this segment in the U.S. is calculated from this date on the basis of proportionate consolidation (instead of a
full consolidation) where the share of the CPV Group is 66.7%.
|
|
|
(7) |
Includes mainly business development and other costs in the area of initiation and development of high‑efficiency power plants running on natural gas, with future carbon capture potential, and the results of the retail activities in the
U.S.
|
|
|
(8) |
After elimination of management fees between the CPV Group and the Company, in the amounts of about NIS 9 million and about NIS 8 million for the three months ended September 30, 2025 and 2024, respectively.
|
|
|
(9) |
Most of the change in the third quarter of 2025 compared with the corresponding quarter last year, in the amount of about
NIS 73 million relates to changes in the fair value of a profit participation plan for employees of the CPV Group. For details – see Note 7G to the Interim Statements.
|
|
|
(10) |
In the third quarter of 2025, the consolidated FFO without adjustments for changes in the working capital was about NIS 399 million (in the corresponding period last year – about NIS 272 million).
|
| 5. |
Analysis of the results of operations for the three months ended September 30, 2025 (in millions of NIS) (Cont.)
|
|
|
C. |
Analysis of the change in EBITDA – Israel segment
|
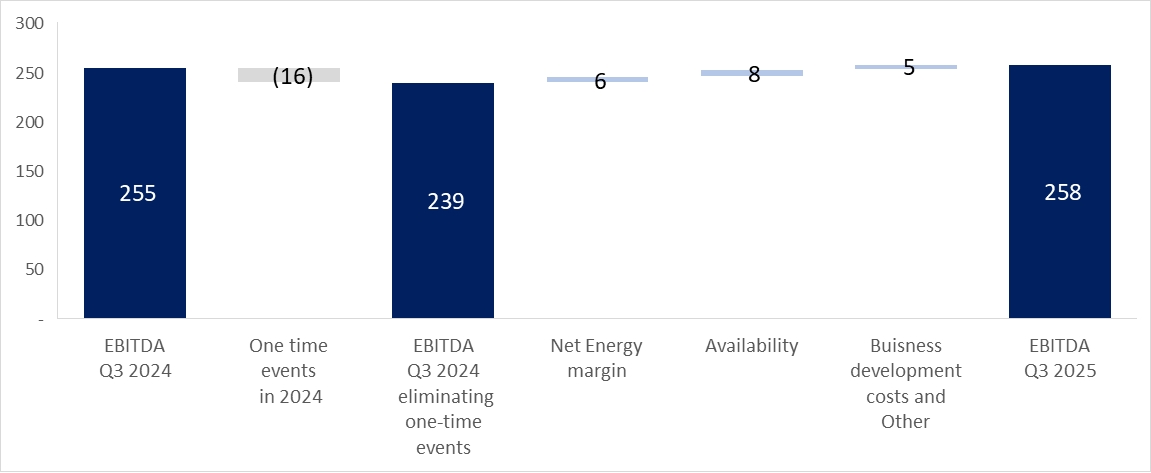
|
|
1. |
Availability (operational) – in the corresponding quarter last year, the Gat power plant was shut down for purposes of unplanned maintenance, which had a negative impact on its results. On the other hand, in the current quarter
there was a capacity limitation and maintenance work is being performed at Zomet, as detailed in Section 4C(1).
|
|
|
2. |
One‑time events – derives mainly from the fact that in the third quarter of 2024, Hadera received a non‑recurring amount of about NIS 18 million ($5 million) in connection with lost profits prior to the commercial operation of the
Hadera power plant. For additional details – see Note 26A(2) to the annual financial statements.
|
| 5. |
Analysis of the results of operations for the three months ended September 30, 2025 (in millions of NIS) (Cont.)
|
|
|
D. |
Analysis of the change in EBITDA after proportionate consolidation – energy transition segment in the U.S.
|
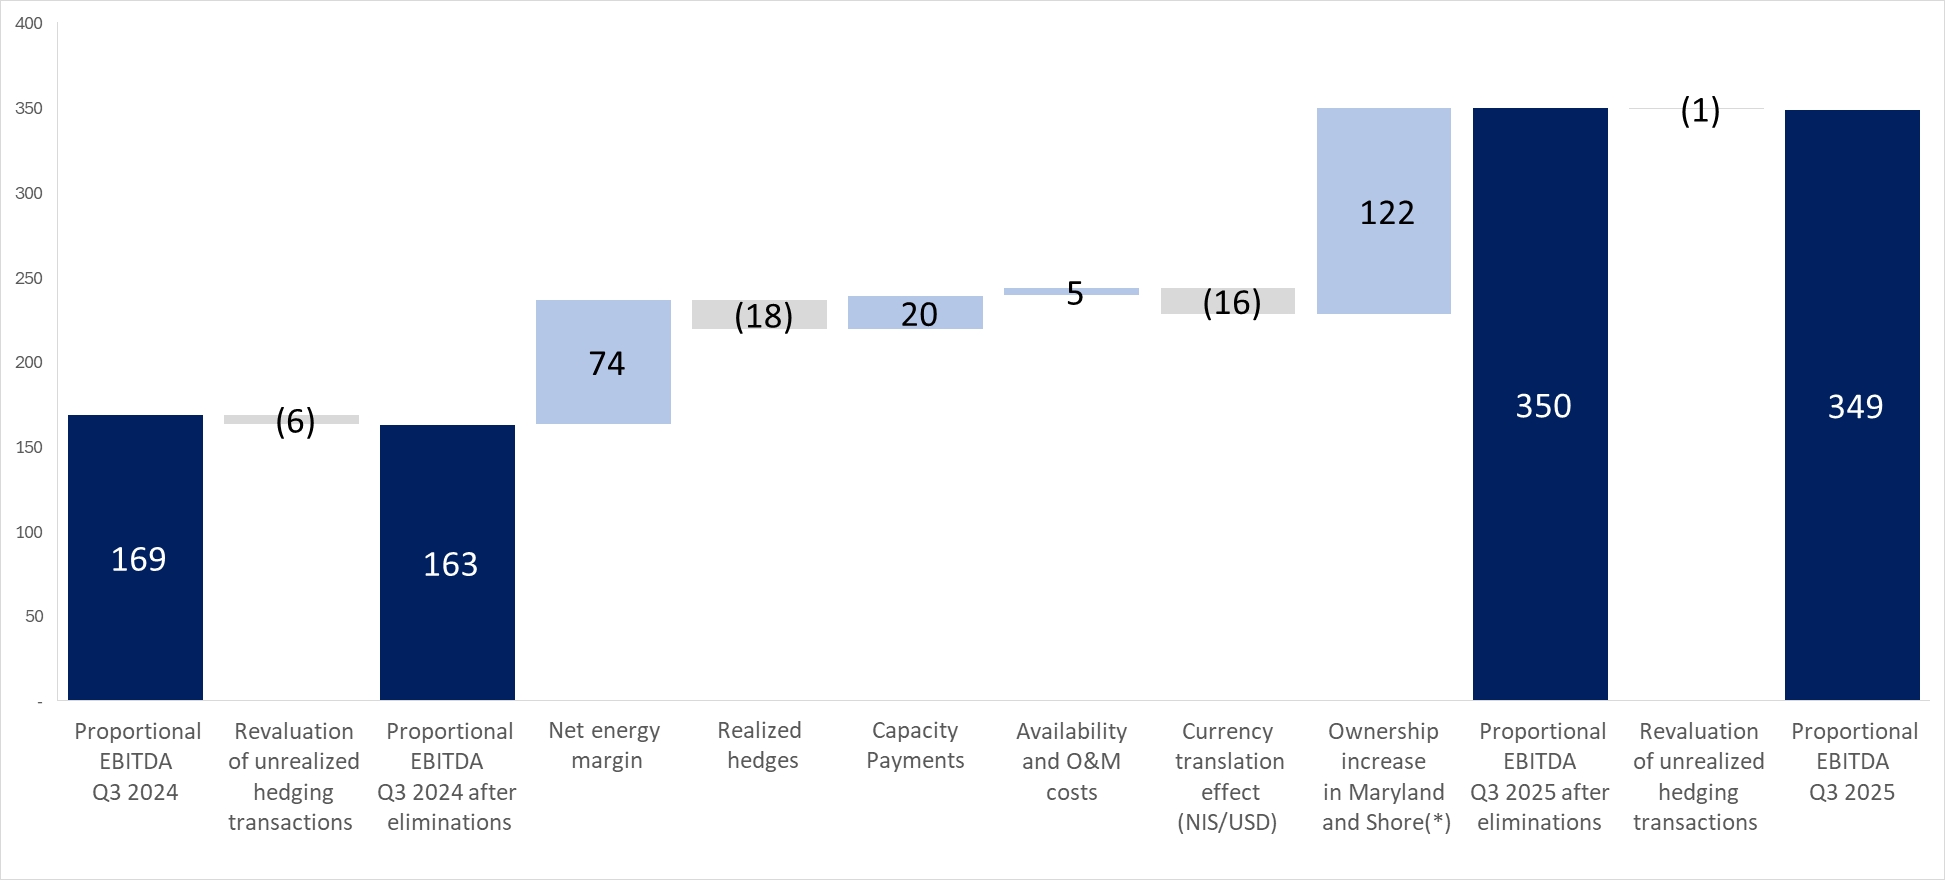
|
|
(*) |
Reflects the impact of the increase in the holdings which was completed in the fourth quarter of 2024 and in the beginning of the second quarter of 2025 in the Maryland and Shore power plants on the EBITDA after proportionate consolidation
in the period of the report. For details – see Note 24C to the annual financial statements and Note 6A to the Interim Statements.
|
| 5. |
Analysis of the results of operations for the three months ended September 30, 2025 (in millions of NIS) (Cont.)
|
|
|
E. |
Renewable energies segment in the U.S.
|
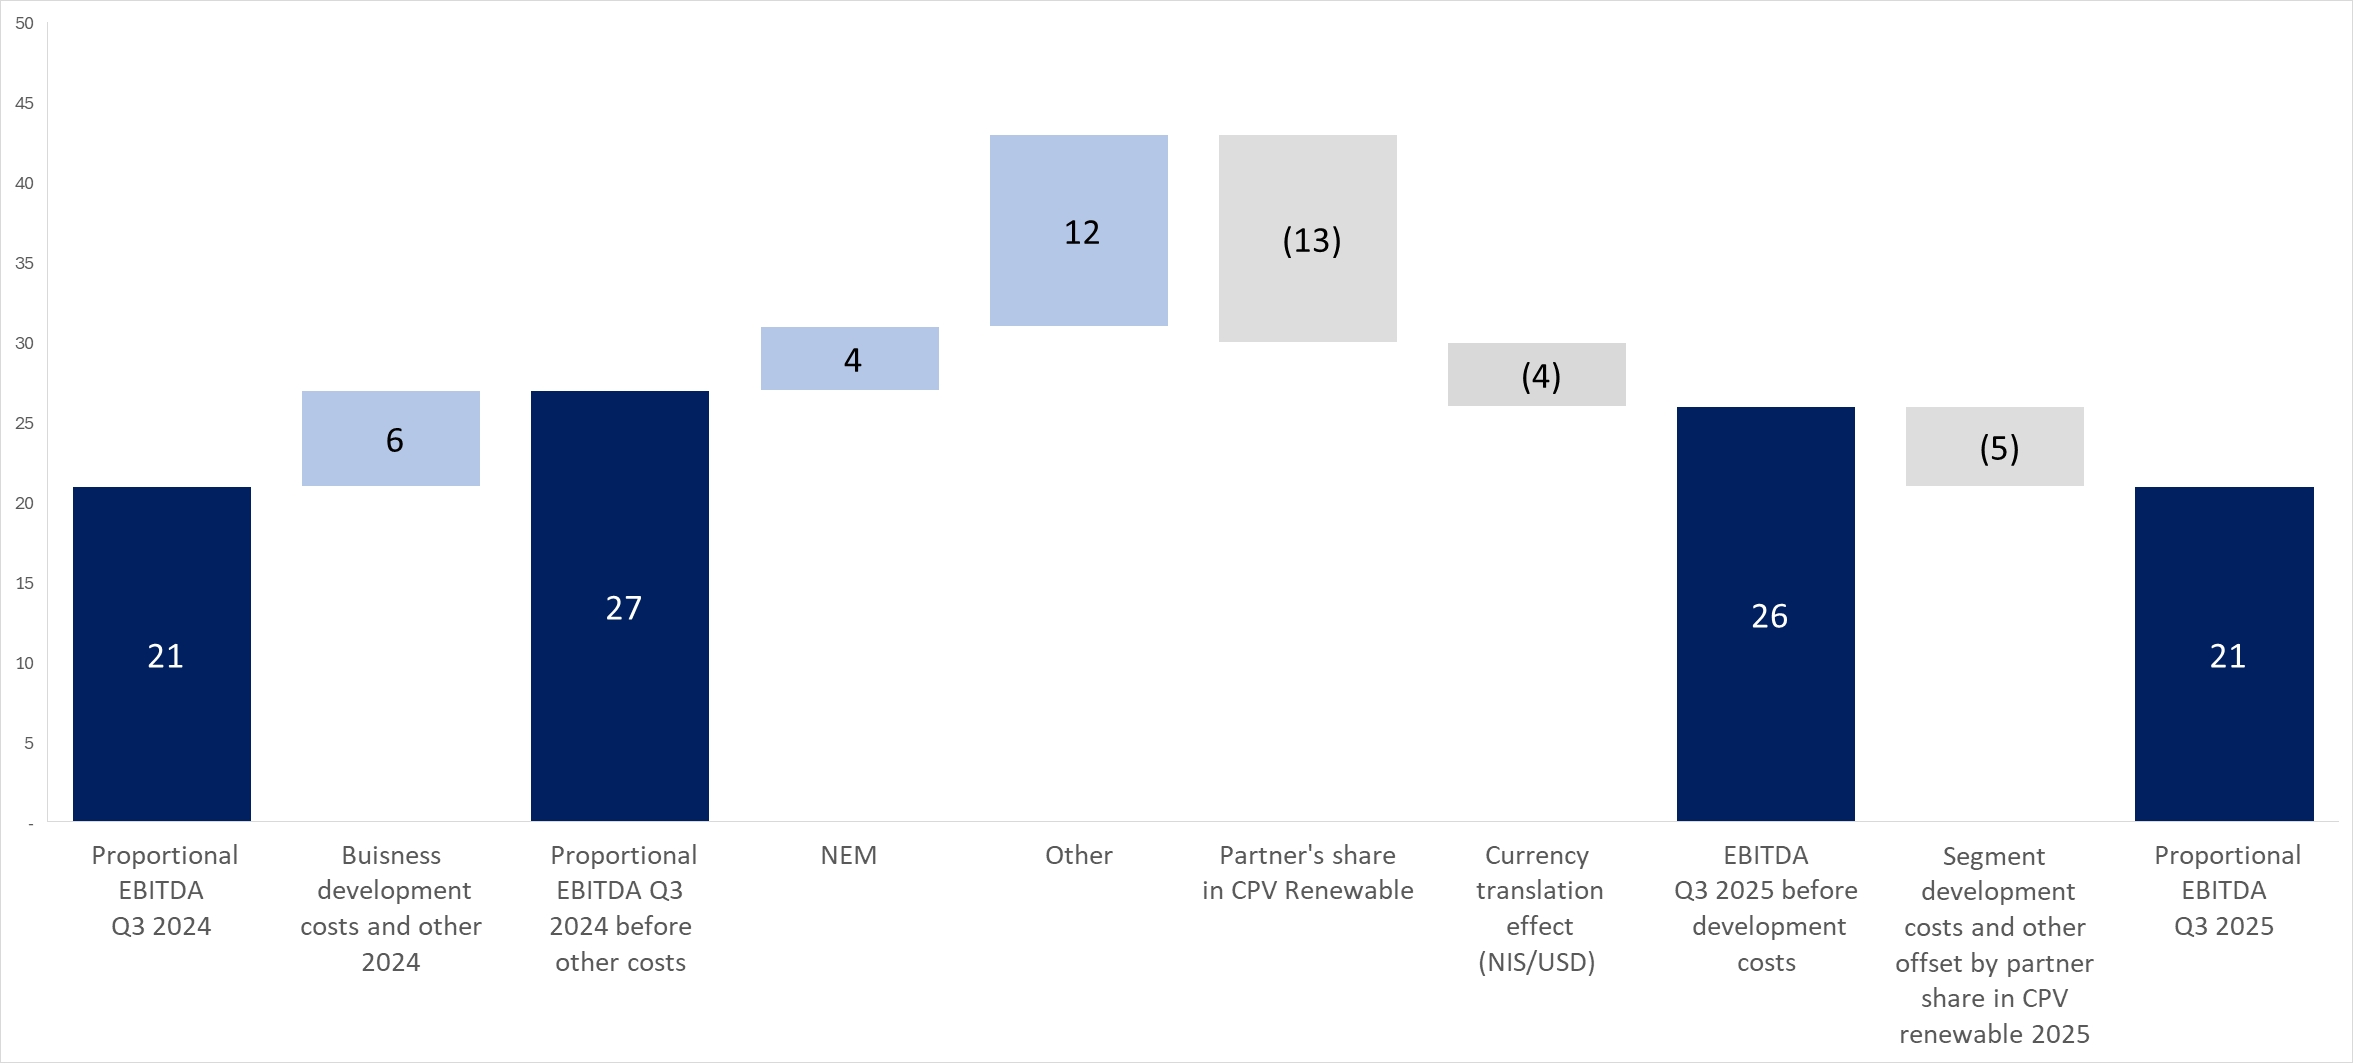
| 5. |
Analysis of the results of operations for the three months ended September 30, 2025 (in millions of NIS) (Cont.)
|
|
|
F. |
Net income and adjusted net income (in millions of NIS)
|
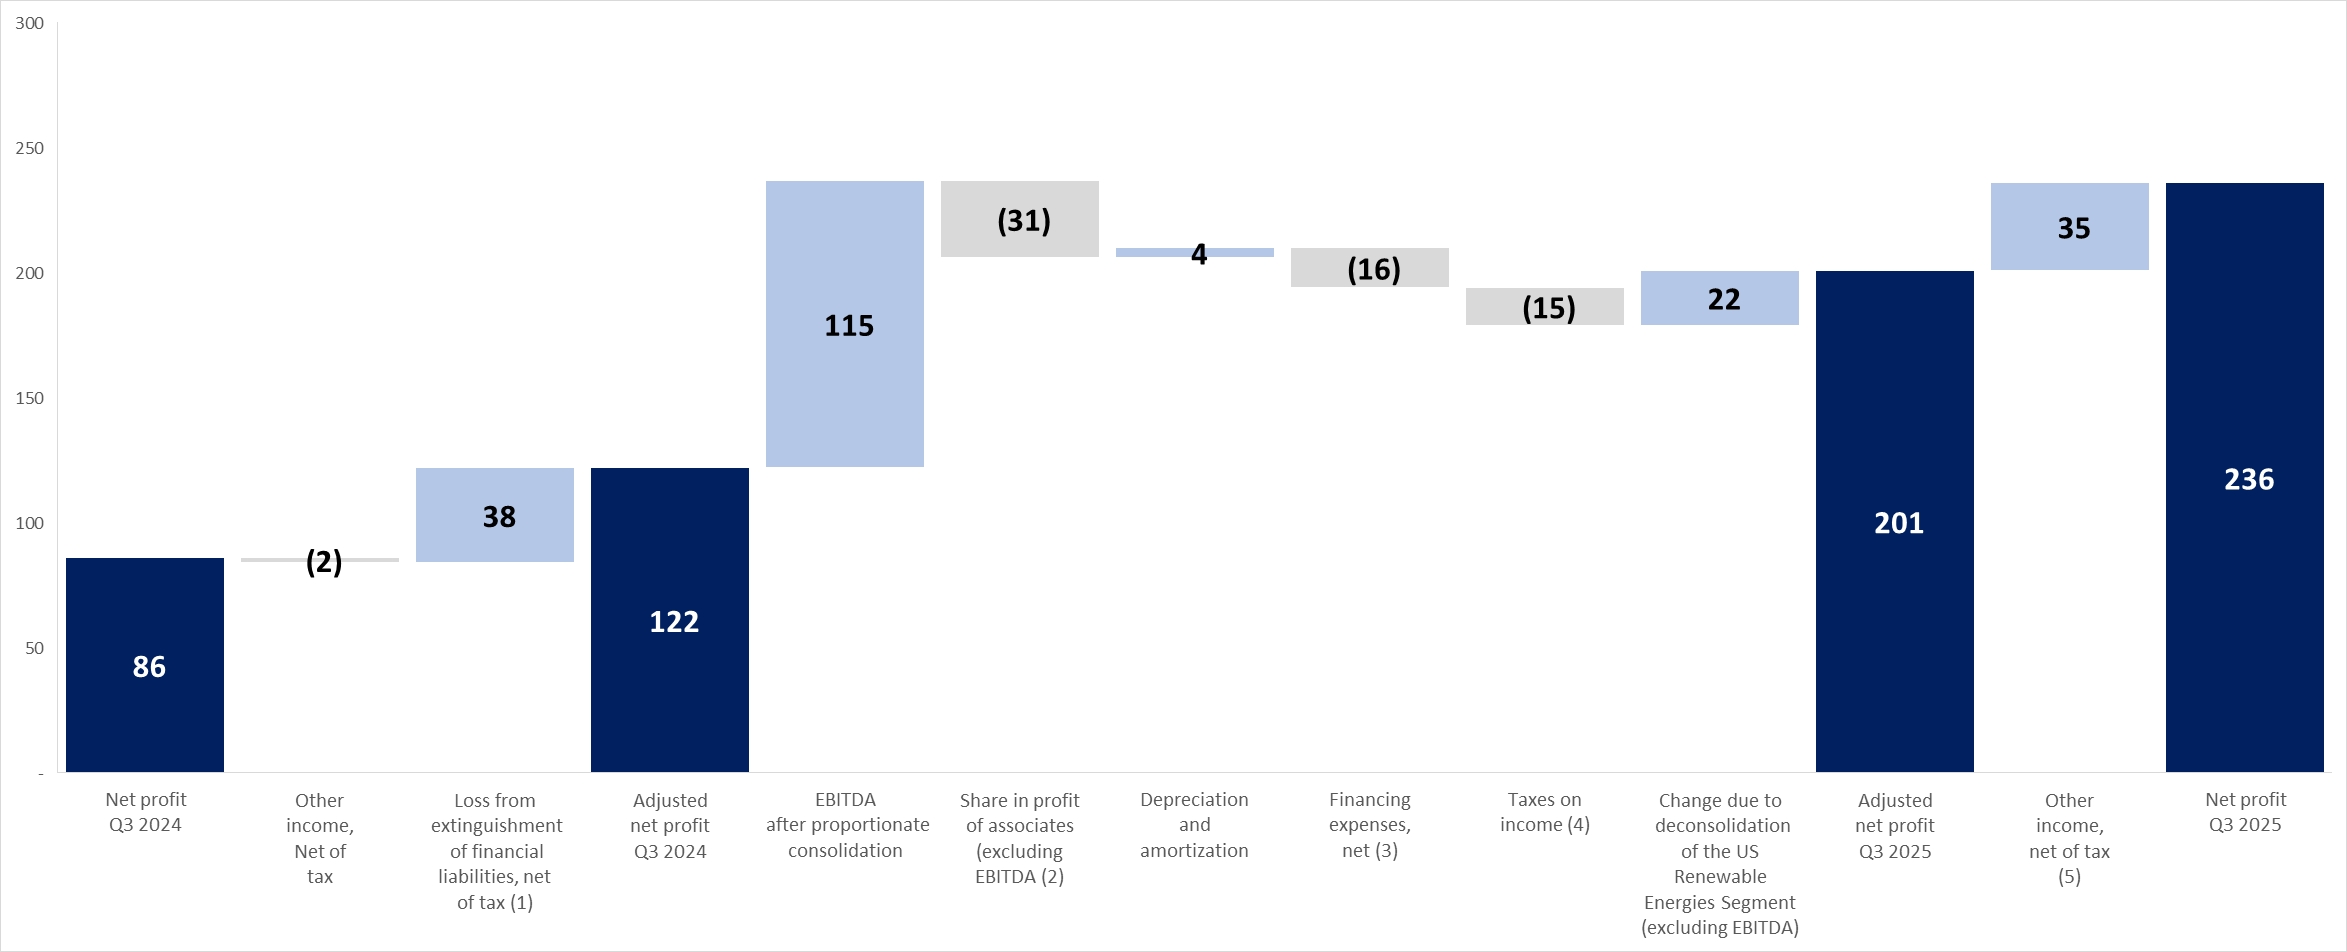
|
|
(1) |
For additional details – see Section 4G(2) above.
|
|
|
(2) |
Most of the increase stems from additional depreciation and financing expenses, in the amount of about NIS 58 million, due to increase in the rate of holdings in the Shore and Maryland power plants in the fourth quarter of 2024 and in the
beginning of the second quarter of 2025.
|
|
|
(3) |
Most of the increase stems from financing expenses as a result of the impact of changes in the shekel/dollar exchange rate compared with the corresponding quarter last year, in the amount of about NIS 37 million. On the other hand, there
was an increase of about NIS 12 million as a result of interest income from bank deposits.
|
|
|
(4) |
The increase in the tax expenses derives from higher pre‑tax income compared with the corresponding quarter last year.
|
|
|
(5) |
Stems mainly from cancellation of an impairment loss in Hadera 2 in the third quarter of 2025 that was recognized in 2024 – this being due to approval of the plan by the government. For additional details – see Note 10B to the Interim
Statements.
|
|
|
A. |
Projects under construction and in development in Israel (held at 100% ownership by OPC Israel, which is 80% held by the Company)20:
|
|
|
1. |
Main details with reference to construction projects in Israel (the data presented in the table below is in respect of 100% for each project):
|
| 20 |
That stated in connection with projects that have not yet reached operation, including with
reference to the expected operation date, the technologies, capacity and/or the anticipated cost of the investment, is “forward‑looking” information, as it is defined in the Securities Law, which is based on, among other things, the
Company’s estimates as at the approval date of the report and regarding which there is no certainty it will be realized (in whole or in part). Completion of the said projects (or any one of them) may not occur or may occur in a manner
different than that stated above, among other things due to dependency on various factors, including those that are not under the Company’s control, including completion of the construction and connection work, assurance of connection to
the network and output of electricity from the project sites and/or connection to the infrastructures (including gas infrastructures), receipt of permits, completion of planning processes and licensing, completion of construction work,
final costs in respect of development, construction, equipment and acquisition of rights in land, the proper functioning of the equipment, force majeure events and/or the terms of undertakings with main suppliers (including lenders), and there is no certainty they will be fulfilled, the manner of their fulfillment, the extent of their impact or what their
final terms will be. Ultimately technical, operational or other delays and/or breakdowns and/or an increase in expenses and/or other changes could be caused, this being as a result of, among other things, factors as stated above or as a
result of occurrence of one or more of the risk factors the Company is exposed to, including construction risks (including force
majeure events and the War and its impacts), regulatory, licensing or planning risks, macro‑economic changes, delays in receipt of permits, delays/problems regarding performance of acceptance tests or assurance of connection to
the networks and infrastructures, delays and increased costs due relating to the supply chain and changes in raw‑material prices and etc. For additional details regarding risk factors – see Section 19 of Section A of the Periodic Report
for 2024. It is further clarified that delays in completion of the above‑mentioned projects beyond the date originally planned for this could impact the ability of the Company and the Group companies to comply with their obligations to
third parties (including under guarantees provided), including authorities, conditions of permits, lenders, yard consumers, customers and others, in connection with the projects, and/or cause a charge for additional costs, payment of
compensation or starting of proceedings (including under guarantees provided).
|
|
|
A. |
Projects under construction and in development in Israel (held at 100% ownership by OPC Israel, which is 80% held by the Company)20: (Cont.)
|
|
|
1. |
Main details with reference to construction projects in Israel (the data presented in the table below is in respect of 100% for each project): (Cont.)
|
|
Power
plants/
facilities
for
generation
of energy
|
Status
|
Capacity
(megawatts)
|
Location
|
Technology
|
Date/
expectation
of the start
of the
commercial
operation
|
Main
customer/
consumer
|
Total
expected
construction
cost
(NIS millions)
|
Total
construction
cost as at
September 30,
2025
(NIS millions)
|
||||||||
|
OPC Sorek 2 Ltd. (“Sorek 2”)
|
Under construction
|
≈ 87
|
On the premises of the Sorek B seawater desalination facility
|
Powered by natural gas, cogeneration
|
Fourth quarter of 202521
|
Yard consumers and the System Operator
|
22≈ 230
|
≈ 211
|
| 21 | It is noted that a delay in the commercial operation on the part of Sorek 2 beyond the original contractual date, which is not considered a justified delay as defined in the project agreements, could trigger payment of monthly compensation at a limited graduated rate (taking into account the length of the delay, where a delay after full utilization of the compensation ceiling could give rise to a cancellation right). The construction work, its completion, the commercial operation date and the costs involved with the construction were adversely impacted by the War and/or its impacts, including in the period of the report and due to the “Nation as a Lioness” mission”. As at the date of the report, the financial closing for the project had been completed, however completion of the construction and operation of the Sorek 2 generation facility are subject to fulfillment of conditions and factors that have not yet been fulfilled, and to operational or technical factors that relate to completion of the construction and the work on the project’s site, which are impacted by, among other things, the defense (security) situation in Israel and the disruptions regarding arrival of work teams and equipment in Israel due to the war. It is noted that in the position of the construction contractor and the equipment supplier is that the security situation in Israel constitutes force majeure, and as a result of construction contractor demanded recognition of an increase in costs. In this regard, it is noted that Sorek 2 approached and notified IDE and the State of Israel that delays in the timetables on the part of the contractor and regarding completion of the construction by it are expected, as a result of that stated, and it submitted a request for recognition of expenses due to a force majeure event, where as at the approval date of the report there is no certainty regarding the results of the approach by Sorek 2. It is emphasized that ultimately, the date expected for completion of the construction and commencement of the operation, as shown in the table, could be delayed even beyond that shown in the table, as a result of, among other things, a delay (including construction of the desalination facility) of the construction work, connection to the grid and operation of the equipment and infrastructures, delays in receipt of the required permits all of which had not yet been received at the approval date of the report, disruptions in arrival of equipment and experts, force majeure events, and occurrence of risk factors to which the Company is exposed, including delays relating to the War or its consequences. Such delays involve an increase in the project costs (beyond the expected cost indicated above) and/or could constitute non‑compliance with liabilities to third parties. As stated in Section 7.15.1.2 to Part A of the Periodic Report for 2024. |
| 22 | Not including a charge for headquarters costs and financing for the Company and the headquarters in Israel. |
|
|
A. |
Projects under construction and in development in Israel (held at 100% ownership by OPC Israel, which is 80% held by the Company)20: (Cont.)
|
|
|
2. |
Set forth below is a description of the main developments regarding projects in the advanced and initial development stages in Israel. For additional details – see Section 6A(2) to the Report of the Board of Directors for 202423.
|
|
|
– |
Ramat Beka project – further to that stated in Section 6A(2) to the Report of the Board of Directors for 2024 regarding the project, in March 2025, government authorization was received for advancement of the plan on the National
Infrastructures Board. In addition, further to that stated in Section 3.2F above, in May 2025 the market regulation was published that is expected to apply to the Ramat Beka project, the provisions of which should permit a significant
increase of the scope of the energy in the project. Further to that stated in Section 6A(2) of the Report of the Board of Directors for 2024, the planned scope of the project is for a capacity of about 505 megawatts and storage capacity of
2,760 megawatts per hour, and accordingly the estimate of the cost of the project is NIS 4.0 to 4.2 billion. Nonetheless, in light of the provisions of the regulation, as stated, the Company is making technical feasibility studies along with
economic optimization regarding the possibility of increasing the solar capacity up to about 550 megawatts and the scope of storage in the project up to about 3,850 megawatts per hour, and to the extent such increase is made, the estimated
cost of the project is expected to be about NIS 5.2 billion24. For details regarding the decision of the Taxes Authority to reject the appeal filed by the Company of the Purchase Tax assessment received in respect of part of the
areas of the Ramat Beka project and filing of an appeal against rejection of the said appeal – see Note 7B to the Interim Statements.
|
| 23 |
The information regarding projects in the advanced and initial development stages in Israel constitutes “forward‑looking” information as it
is defined in the Securities Law. The ultimate execution of the development projects (in whole or in part) might not materialize and/or could be delayed, and there could be changes in the estimated costs – this being as a result of,
among other things, non‑fulfillment of the conditions and circumstances required or that are appropriate for their execution, regulatory changes, changes in market conditions and the defense situation in Israel as well as other factors.
|
| 24 |
That stated regarding the expected project‑cost estimates constitutes “forward‑looking” information as it is defined in the Securities Law, which is
based solely on the Company’s estimates as at the approval date of the report, and regarding which there is no certainty they will materialize. These cost estimates are subject to changes due to factors as stated in footnote 20. Ultimately,
the scope of the project and its costs could be different than that stated as a result of these factors or due to occurrence of one or more of the risk factors the Company is exposed to.
|
| 25 |
It is noted that the Bank has the possibility of joining additional lenders as part of a syndication pursuant to the terms stipulated.
|
| 26 | The Borrower will be owned by OPC Power Plants Ltd. As at the approval date of the report, transfer of the rights in the project to the designated company is subject to conditions that have not yet been completed. |
|
|
A. |
Projects under construction and in development in Israel (held at 100% ownership by OPC Israel, which is 80% held by the Company)20: (Cont.)
|
|
|
2. |
Set forth below is a description of the main developments regarding projects in the advanced and initial development stages in Israel. For additional details – see Section 6A(2) to the Report of the Board of Directors for 202422.
(Cont.)
|
|
|
– |
Ramat Beka project – (Cont.)
|
|
|
– |
Intel project – further to that stated in Section 6A(2) to the Report of the Board of Directors for 2024 regarding the project, in March 2025 government authorization was received for advancement of the plan with the State National
Infrastructures Board. As at the approval date of the report, the Company estimates that projected construction cost of the project will be in the range of about NIS 5.3 to NIS 6.0 million per megawatt (about $1.6 to $1.8 million per
megawatt)28.
|
| 27 |
In addition, it is noted that included as part of the negotiations is a possibility for additional financing that could be provided at the Borrower’s choice as a bridge loan for the payment to Israel Lands Authority in respect of the
project’s land lease agreement and a possibility to receive usual accompanying credit frameworks for the project. Also, as part of the negotiations there is an alternate project financing format for the long‑term.
|
| 28 |
That stated regarding the estimate of the projected cost (including estimate of the costs of the
equipment, construction and financing), constitutes “forward‑looking” information as it is defined in the Securities Law, which is based on the Company’s plans as at the approval date of the report and regarding which there is no certainty
they will be realized. As at the date of the report, advancement of the project, its development, construction, operation, cost and final characteristics are subject to existence of various factors and conditions (regulatory, operational,
commercial and financing), which have not yet been fulfilled (and there is no certainty whether they will ultimately be fulfilled).
|
|
|
A. |
Projects under construction and in development in Israel (held at 100% ownership by OPC Israel, which is 80% held by the Company)20: (Cont.)
|
|
|
– |
Hadera 2 project29 – further to that stated in
Section 6A(2) to the Report of the Board of Directors for 2024, regarding the government’s decision to reject National Infrastructures Plan 20B (NIP 20B) that is being advanced by Hadera 2 for construction of a power plant on land located
adjacent to the Hadera power plant (“the Plan”), and further to that stated in Section 5A(2) of the Report of the Board of Directors for the first quarter of 2025 regarding the appeal to the High Court of Justice filed by Hadera 2 against
the said rejection, as part of an additional hearing held by the government on August 10, 2025 it was decided to approve the plant. Further to this, Hadera 2 is making preparations to act to construct a power plant powered by natural gas
with an estimated capacity of about 850 megawatts (“the Project”30) as part of the update to the arrangement for conventional generation units, as detailed in Section 3.3E above (“the Arrangement”). In this framework as at the
approval date of the report, the Company is taking action to advance the steps necessary to develop the project, including, advancing the undertaking in the project agreements and ordering of equipment (taking into account, among other
things, constraints with respect to global timetables regarding ordering equipment).
|
| 29 |
Construction of the Project in accordance with that stated, application of the Arrangement to the
Project, the start date of construction of the Project, the Project’s said capacity and characteristics and/or the estimate of its projected construction cost, includes “forward‑looking” information as it is defined in the Securities Law,
which is based on the Company’s intentions and estimates as at the approval date of the report, and there is no certainty it will be realized. Execution of the Project pursuant to that stated (or at all) is subject to existence of various
conditions (including factors that are not under the Company’s control), including the Project’s compliance with the quota stipulated in the Arrangement on the relevant dates, assurance of signing main agreements for the Project (such as, construction, equipment, gas and financing agreements) on appropriate conditions and dates, receipt of regulatory approvals, completion of surveys
and permit processes, connection and licensing, completion of the rest of the processes noted above, existence of suitable market conditions, assurance of equipment and construction costs and non‑occurrence of one or more the risk factors
the Company is exposed to as stated in Section 19 of Part A of the Periodic Report for 2024. As at the approval date of the report, such conditions have not yet been fulfilled and there is no certainty regarding their fulfillment
or the date thereof and, accordingly, as at the approval date of the report, there is no certainty the Project will ultimately be executed.
|
| 30 |
It is noted that the Project will be constructed through use of the best available technology and, in addition, the
existing energy center located alongside the Hadera power plant (including the smokestack) will be dismantled. Also, Hadera 2 will execute an environmental project in joint cooperation with the relevant parties and in accordance with law up
to operation of the power plant (if constructed).
|
|
|
A. |
Projects under construction and in development in Israel (held at 100% ownership by OPC Israel, which is 80% held by the Company)20: (Cont.)
|
|
|
2. |
(Cont.)
|
|
|
– |
Hadera 2 project – (Cont.)
As at the approval date of the report, the Company estimates that the expenses preceding the undertaking in a final
agreement with respect to ordering of the equipment are expected to amount to tens of millions of dollars31.
|
| 31 |
That stated constitutes “forward‑looking” information as it is defined in the Securities
Law, which is based solely on the Company’s estimates as at the approval date of the report, and there is no certainty regarding its ultimate realization. Ultimately, the expenses preceding the signing of a equipment agreement (or
other project agreements) for Hadera 2 project could be different than that stated, among other things, taking into account the relevant market conditions for equipment for the power plant, macro conditions, duration of the
development period and/or occurrence of one or more of the risk factors the Company is exposed to, as stated in Section 19.2 of Part A of the
Periodic Report for 2024. It is noted that certain expenses are exposed, in full, to the development risks as stated.
|
| 32 |
It is noted that possibilities are being examined for provision of usual accompanying credit frameworks for the project. Also, as part of the negotiations there
is an alternate project financing format for the long‑term.
|
| 33 |
If the Borrower chooses that the Loan is to be provided in a mix of shekels and euros, the base interest with respect to the amount in euros will be Euribor up to the Conversion Date and Euro Swap after the Conversion Date, plus various
margins as determined.
|
|
|
A. |
Projects under construction and in development in Israel (held at 100% ownership by OPC Israel, which is 80% held by the Company)20: (Cont.)
|
|
|
2. |
(Cont.)
|
|
|
– |
Hadera 2 project – (Cont.)
|
|
|
– |
Portfolio of solar and
storage projects – the Company has signed agreements with holders of rights in lands (communities located in the periphery – kibbutzim and joint communities) that hold rights in potential land sites for solar projects with
integrated storage. For details regarding the main characteristics of the said undertakings – see Section 7.3.13.2 of Part A of the Periodic Report for 2024, as at the approval date of the report, agreements had been signed for
construction of solar facilities estimated at a cumulative about 0.4 gigawatts and about 1.8 gigawatts per hour of storage. In August 2025, the government’s consent was received for advancement of a plan estimated at about 0.15 gigawatts
and about 0.75 gigawatts per hour of storage by the National Infrastructures Planning Board.
|
|
|
A. |
Projects under construction and in development in Israel (held at 100% ownership by OPC Israel, which is 80% held by the Company)20: (Cont.)
|
|
|
2. |
(Cont.)
|
|
|
– |
Development of natural gas project as part of an undertaking with Migdal – further to the government’s decision regarding “Advancement of the Energy Security of the Israeli Electricity Sector”34 (“Decision 2282”), in
August 2025, OPC Israel signed an agreement with companies in the Migdal Insurance Company Ltd. Group (“Migdal”), which as at the date of the report is an interested party in the Company by force of its holdings, for establishment of a
limited partnership that will be held by OPC Israel and Migdal at the rates of 51% and 49%, respectively (“the Partnership”), which will take action to develop, construct and operate power plants powered by natural gas in a region that was
defined in Decision 2282, and in particular on the option lands as they are defined below (“The Agreed Region”, “The Projects” and “The Partnership Agreement”, as applicable). OPC Israel will hold (indirectly) all the rights in the General
Partner. Pursuant to the Partnership Agreement, OPC Israel will be given preference with respect to acquisition of the electricity generated in the Projects based on the conditions determined. In addition, arrangements were provided in
connection with investment of shareholders’ equity to cover the development and construction expenses, and in connection with activities in the Agreed Region and preference to Migdal regarding participation in an additional project, that is
not in the Agreed Region – all of this on the conditions determined. Moreover, the Partnership Agreement provides arrangements regarding management fees and initiation fees, customary limitations on transfer of rights in the Partnership,
decisions that require a special majority, information rights, etc. It was also provided that under certain circumstances, each of the parties (as applicable, will have, including under certain circumstances of entry of an investor into
OPC Israel), the right to convert the share of Migdal in the Partnership to holdings in OPC Israel and this being subject to certain conditions and limitations. In addition, an option agreement of the Partnership with Migdal was signed for
lease of land (in which Migdal holds the rights) it owns in the Agreed Region that has potential for construction of a power plant powered by natural gas (“the Option Lands”). The option is for a cumulative period of 9 years, with early
cancellation rights under the circumstances determined. Exercise of the option and transfer of the holding are contingent on fulfillment of certain conditions, including conditions contingent on third parties. If the option is exercised, a
lease agreement will be signed for a period that corresponds to the lease period of the land from Israel Lands Authority.
|
|
|
A. |
Projects under construction and in development in Israel (held at 100% ownership by OPC Israel, which is 80% held by the Company)20: (Cont.)
|
|
|
2. |
(Cont.)
|
|
|
– |
Development of natural gas projects as part of an agreement with Migdal – (Cont.)
|
|
|
B. |
Construction and development projects in the U.S. (the data presented in the table below is in respect of 100% for each project)35:
|
|
|
1. |
Main details regarding construction projects in the area of renewable energy using solar and wind technologies in the U.S. (all projects in the renewable energy area held by CPV Renewable which is held at the rate of 66.7% by the CPV Group
(the CPV Group is held at the rate of 70.62% by the Company)).
|
| 35 |
Details with respect to the scope of the investments in the United States were translated from dollars and presented in
NIS based on the currency rate of exchange on September, 2025 – $1 = NIS 3.306. The information presented below regarding projects under
construction and development, including with respect to the expected commercial structure, the projected commercial operation date, the expected construction cost, an undertaking with a tax partner and/or the expected results of the
activities for the first full calendar year (revenues, EBITDA, investments of the tax partner and cash flows after the tax partner) includes “forward‑looking” information, as it is defined in the Securities Law, regarding which there is no
certainty it will materialize (in whole or in part), including due to factors that are not under the control of the CPV Group. The information is based on, among other things, estimates of the CPV Group as at the approval date of the
report, the realization of which is not certain, and which might not be realized due to factors, such as: regulatory changes or legislative changes (including changes impacting main suppliers of the projects and/or import of equipment and
including regulatory/legislative changes in the area of energy or import tariffs due to changes in the government’s policies), delays in receipt of permits, an increase in the construction costs, delays in execution of the construction work
and/or technical or operational malfunctions, problems or delays regarding signing an agreement for connection to the network or connection of the project to transmission or other infrastructures, an increase in costs due to the commercial
conditions in the agreements with main suppliers (such as equipment suppliers and contractors), problems signing an investment agreement with a Tax Equity Partner regarding part of the cost of the project and utilization of the tax benefits
(if relevant), problems signing commercial agreements sale for of the potential revenues from the project, terms of the commercial agreements, conditions of the energy market, an increase in the financing expenses, unforeseen expenses,
macro‑economic changes, weather events, delays and an increase in costs related to the supply chain, transport and an increase in raw‑material prices, etc. Completion of the projects in accordance with the said estimates is subject to the
fulfillment of conditions which as at the approval date of the report had not yet been fulfilled (fully or partly) and, therefore, there is no certainty they will be completed in accordance with that stated. Construction delays could even
impact the ability to comply with liabilities of the project and the CPV Group to third parties in connection with the projects (including based on guarantees provided in favor of those third parties) or to detract from the entitlement to
tax benefits. For details regarding regulatory changes and changes in the government’s policies – see Section 8.1.2.2 of Part A of the Periodic Report for 2024.
|
| 6. |
Initiation and Construction Projects (Cont.)
|
|
|
B. |
Construction and development projects in the U.S. (including projects in the renewable energy area held by CPV Renewable which is held at the rate of 66.7% by the CPV Group (the CPV Group is held at the rate of 70.53% by the Company)36:
(Cont.)
|
|
|
1. |
Main details regarding construction projects in the area of renewable energy using solar and wind technologies in the U.S. (including projects in the renewable energy area held by CPV Renewable which is held at the rate of 66.7% by the CPV
Group (the CPV Group is held at the rate of 70.62% by the Company). (Cont.)
|
|
Total
expected
construction
cost net
for 100%
of the
|
Total
construction
cost
as at
|
Expectation for a first full calendar year
in the period of the PPA agreements |
||||||||||||||||||||
|
Regulated
market
|
Cash flows
after tax
|
|||||||||||||||||||||
|
Expected
|
Tax
|
September 30,
|
||||||||||||||||||||
|
commercial
|
after
|
project
|
equity
|
2025
|
Revenues36
|
EBITDA36
|
partner
|
|||||||||||||||
|
Capacity
|
operation
|
Commercial
|
the PPA
|
(NIS
|
(NIS
|
(NIS
|
(NIS
|
(NIS
|
(NIS
|
|||||||||||||
|
Project
|
(megawatts)
|
Location
|
date
|
structure
|
period
|
millions)
|
millions)
|
millions)
|
millions)
|
millions)
|
millions)
|
|||||||||||
|
CPV Backbone37
Solar, LLC (“Backbone”)
|
179 MWdc
+
36 MWdc
|
Maryland
|
Second half of 2025
|
Long-term PPA38 (including green certificates)
|
PJM + MD SRECs
|
≈ 1,265
(≈ $382
million)
|
≈ 462
(≈ $140
million)39
|
≈ 1,018
(≈ $308
million)
|
≈ 81
(≈ $23
million)
|
≈ 56
(≈ $16
million)
|
≈ 46
(≈ $13
million)
|
|||||||||||
| 36 | It is clarified that the expected revenues and EBITDA presented in the above table do not include the tax benefits, even though the project meets the conditions for their receipt. |
| 37 | The above table includes data relating to expansion of the project of about 36 MWdc, which entered into the construction period subsequent to the date of the report and its commercial operation is expected in the second half of 2026. |
| 38 | The project has signed an agreement with a global e‑commerce company for a period of 10 years from the start of the commercial operation, for supply of 82% of the electricity expected to be generated by the project in the said period, and sale of solar renewable energy certificates, which is valid up to 2035. The balance of the project’s capacity (18%) will be used for supply to active customers, retail supply of electricity of the CPV Group or for sale in the market. |
| 39 | In October 2024, the CPV Group signed an agreement with a tax partner in the ITC (Investment Tax Credit) format, where pursuant to the agreement the investment of the tax partner in the project will be partly (about 20%) on the mechanical completion date, and the balance (about 80%) will be paid on the commercial operation date. In October 2025, an agreement was signed to join expansion of the project to the tax partner agreement, on conditions similar to those of the original agreement. |
| 6. |
Initiation and Construction Projects (Cont.)
|
|
|
B. |
Construction and development projects in the U.S. (including projects in the area of renewable energy area held by CPV Renewable which is held at the rate of 66.7% by the CPV Group (the CPV Group is held at the rate of 70.53% by the
Company)36: (Cont.)
|
|
|
1. |
Main details regarding construction projects in the area of renewable energy using solar and wind technologies in the U.S. (including projects in the renewable energy area held by CPV Renewable which is held at the rate of 66.7% by the CPV
Group (the CPV Group is held at the rate of 70.62% by the Company). (Cont.)
|
|
Total
expected
construction
cost net
for 100%
of the
|
Total
construction
cost
as at
|
Expectation for a first full calendar year in the period of the PPA agreements |
||||||||||||||||||||
|
Regulated
market
|
Cash flows
after tax
|
|||||||||||||||||||||
|
Expected
|
Tax
|
September 30,
|
||||||||||||||||||||
|
commercial
|
after
|
project
|
equity
|
2025
|
Revenues36
|
EBITDA37
|
partner
|
|||||||||||||||
|
Capacity
|
operation
|
Commercial
|
the PPA
|
(NIS
|
(NIS
|
(NIS
|
(NIS
|
(NIS
|
(NIS
|
|||||||||||||
|
Project
|
(megawatts)
|
Location
|
date
|
structure
|
period
|
millions)
|
millions)
|
millions)
|
millions)
|
millions)
|
millions)
|
|||||||||||
|
CPV Rogue’s Wind, LLC (“Rogues”)
|
114 |
Pennsylvania
|
First half of 2026
|
Long-term PPA40 (including green certificates) |
PJM MAAC
|
≈ 1,207
(≈ $365
million)
|
≈ 538
(≈ $163
million)41
|
≈ 906
(≈ $274
million)
|
≈ 84
(≈ $24 million)
|
≈ 63
(≈ $18 million)
|
≈ 53
(≈ $15 million)
|
|||||||||||
| 40 |
In April 2021, the project signed an agreement for sale of all the electricity and the environmental consideration (including Renewable Energy Certificates (RECs), benefits relating to availability and accompanying services), the terms of which were improved in 2024. The agreement was signed for a period of 10 years starting from the commercial operation date. The CPV Group has provided collateral for assurance of its obligations under the agreement, which includes execution of certain payments to the other party if certain milestones (including the commencement date of the activities) in the project are not completed in accordance with the timetable determined. |
| 41 |
The project is located on a former coal mine and, therefore, it is expected to be entitled to enlarged tax benefits of 40% in accordance with the IRA Law. In August 2025, the CPV Group signed an agreement with a tax partner (Equity Tax) in an ITC format in respect of about 40% of the cost of the project and use of the tax credits that are available to the project (subject to appropriate regulatory arrangements) on terms that are customary for agreements of this type (including provision of a guarantee by the CPV Group for certain liabilities.). |
| 6. |
Initiation and Construction Projects (Cont.)
|
|
|
B. |
Construction and development projects in the U.S. (including projects in the area of renewable energy area held by CPV Renewable which is held at the rate of 66.7% by the CPV Group (the CPV Group is held at the rate of 70.53% by the
Company)36: (Cont.)
|
|
|
2. |
Main details relating to a natural gas project with carbon capture potential, Basin Ranch (held as at the approval date of the report at the rate of 70% by the CPV Group (1) that is held at the rate of 70.62% by the Company), the
construction of which started on October 28, 202542:
|
|
Project
|
Capacity
(MW)
|
Location
|
Expected
start
of the
commercial
operation
|
Expected
commercial
structure
|
Regulated
market
(2)
|
Total
expected
construction
cost
(3)
|
Total
senior
financing
(4)
|
Expectation for the first
full year of operation
|
||||||||||
|
EBITDA
|
Cash flows
after
service of
senior
debt
|
|||||||||||||||||
|
CPV Basin Ranch Holdings, LLC (“Basin Ranch”)
|
1,350
|
Ward County, Texas
|
2029
|
Sale of electricity in the ERCOT market (energy only), where the project is expected to sign commercial agreements to hedge about 75% of the power plant’s capacity for a period of 7 years
from the commercial operation date43
|
ERCOT - West
|
NIS 6.1-6.7 billion ($1.8-2.0 billion)
|
≈ NIS 3.7 billion
(≈ $1.1 billion)
|
≈ NIS 1.0 billion
(≈ $0.275 billion)
|
≈ NIS 0.9 billion
(≈ $0.25 billion)
|
|||||||||
| (1) |
For details regarding an undertaking of the CPV Group on October 28, 2025 in an agreement for acquisition of the balance of 30% of the ownership rights of the
remaining partnership in the project (GE Vernova), in the framework of which an aggregate amount of about $371 million (about NIS 1.2 billion) will be provided in connection with the acquisition, which is to be completed, subject to
fulfillment of preconditions, no later than February 28, 2026 – see the Company’s Immediate Report dated October 29, 2025 (Reference No.: 2025‑01‑081169) and Note 6B to the Interim Statements1. The sources for provision of the
above‑mentioned amount (including the amount of about $58 million that was paid on the closing date of the TEF loan), are expected to include a combination of available cash of the CPV Group and letters of credit frameworks, equity the
holders of interests in the CPV Group and/or debt that will be provided directly to the CPV Group. It is noted that as at the approval date of the report, the CPV Group is carrying on negotiation with Bank Leumi for an increase in the scope
of the loan it granted, as detailed in Note 7A(2) to the Interim Statements, on the same terms, in an aggregate amount of about $430 million (an increase of about $130 million) for purpose of financing the said acquisition transactions. As
at the approval date of the report, the parties are carrying on negotiations in connection with an increase of the loan, as stated, which is subject to fulfillment of conditions that are customary for undertakings of this type and including
an undertaking in a binding agreement that as at the approval date of the report had not yet been fulfilled, and there is no certainty regarding their signing a binding agreement and/or its final terms. In addition, the Company intends to
provide the CPV Group the amount of the equity required from the holders (that is not provided by CPV’s cash, financing or letters of credit, as stated) from internal and/or external sources, and to hold a process in accordance with the
partnership agreement regarding participation of the other limited partners holding interests in CPV.
|
| 42 |
The
information presented below, including regarding the expected commercial structure, date of commercial operation, construction cost, total senior financing and/or results of the activities for the first full calendar year
(EBITDA, cash flows after service of senior debt), constitutes “forward‑looking” information as it is defined in the Securities Law regarding which there is no certainty it will be realized (fully or partly), including due to
factors that are not under the control of the CPV Group. The information is based on, among other things, the estimates of the CPV Group as at the approval date of the report, regarding which there is no certainty they will
materialize, and which might not materialize, among other things, due to factors as stated in footnote 35 above. In addition, as at the approval date of the report, there is no certainty regarding an increase of the loan from Bank
Leumi in accordance with that stated and/or completion of the project for acquisition of the balance of the rights in the project, which depends on, among other things, third parties.
|
| 43 |
As at the approval date of the report, hedging of the exposure to market prices is expected by means of: gas agreements
of the Netback type (which includes a pricing mechanism whereby the gas price paid by the generator of the electricity derives from the electricity price) and agreements for sale of electricity at a fixed price. In addition, as at the
approval date of the report, some of the agreements had been signed and some of them are ready for signature.
|
| 44 |
If completed, the CPV Group will consolidate the Basin Ranch power plant in its financial statements. As at the
approval date of the report, the Company is examining the accounting treatment of the acquisition transaction, particularly the impacts of transition from an associated company to a consolidated subsidiary.
|
| 6. |
Initiation and Construction Projects (Cont.)
|
|
|
B. |
Construction and development projects in the U.S. (including projects in the area of renewable energy area held by CPV Renewable which is held at the rate of 66.7% by the CPV Group (the CPV Group is held at the rate of 70.53% by the
Company)36: (Cont.)
|
|
|
2. |
Main details relating to a natural gas project with carbon capture potential, Basin Ranch (held at the rate of 70% by the CPV Group that is held at the rate of 70.62% by the Company), the construction of which, as at the date of the
report, had not yet started43: (Cont.)
|
| (2) |
The project is expected to operate in the ERCOT market (for details – see Section 3.3N above and
Section 8.1.2.2(D) of Part A of the Periodic Report for 2024, and the Immediate Report published on June 9, 2025 (Reference No.: 2025‑01‑041243) and on October 29, 2025 (Reference No.: 2025‑01‑081169)).
|
| (3) |
For details regarding the project’s main agreements, particularly an agreement with the construction contractor (EPC) and the manufacturer of the main equipment (GE Vernova) – see the Company’s Immediate Report dated October 29, 2025
(Reference No.: 2025‑01‑081169) and Note 6C to the Interim Statements45.
|
| (4) |
For additional details regarding the Texas Energy Fund (“the TEF Loan”) loan agreement that was signed on
October 27, 2025, and which was completed on October 28, 2025 – see the Company’s Immediate Report dated October 28, 2025 (Reference No.: 2025‑01‑080757), the Company’s Immediate Report dated October 29, 2025 (Reference No.:
2025‑01‑081169) and Note 6B to the Interim Statements.
|
| (5) |
Pursuant to the terms of the TEF Loan, on the date of the financial closing (October 28, 2025), the holders of the
rights in the project provided a commitment for the required shareholders’ equity for the project (proportionately (pro rata) to their holdings on the date of the financial closing), where for this purpose the CPV Group (70%) provided a
total cash amount of about $470 million, of which the amount of about $300 million was provided by means of a loan from Bank Leumi (for details – see the Company’s Immediate Report dated October 29, 2025 (Reference No.: 2025‑01‑081169) and
Note 7A(2) to the Interim Statements), and the amount of about $170 million (which includes recognition of development investments and payments made prior to the financial closing in the amount of about $67 million), which was provided by
the Company by means of a bridge loan for equity in proportion to the balance of the amount required up to completion of the process for the equity investment with the additional limited partners holding interests in the CPV Group. The
Company used part of the monies raised in the equity issuance made in June 2025 for this purpose.
In addition, additional collaterals relating to the project were provided by the holders of the rights in the
project as part of the financial closing of the TEF loan, where as at the approval date of the report the share of the CPV Group in the said collaterals was provided by means of letters of credit, in the amount of about $135 million (for
details – see Note 6C to the Interim Statements).
|
| 45 |
As at the approval date of the report, there is no certainty regarding the conditions required for entry of the
project into operation, its connection to the network or its construction, which had not yet been fulfilled as at the approval date of the report, and there is no certainty regarding their fulfillment, the date of their fulfillment or
their final conditions, which could be different (even significantly) from that stated (if fulfilled).
|
| 6. |
Initiation and Construction Projects (Cont.)
|
|
|
B. |
Construction and development projects in the U.S. (including projects in the area of renewable energy area held by CPV Renewable which is held at the rate of 66.7% by the CPV Group (the CPV Group is held at the rate of 70.53% by the
Company)36: (Cont.)
|
|
|
3. |
Main details regarding development projects in the U.S.
|
|
Advanced
|
Preliminary
|
|||||||||||
|
Renewable energy
|
development47
|
development
|
Total
|
|||||||||
|
PJM market
|
||||||||||||
|
Solar (3)
|
–
|
1,330
|
1,330
|
|||||||||
|
Wind
|
–
|
130
|
130
|
|||||||||
|
Total PJM market (2)
|
–
|
1,460
|
1,460
|
|||||||||
|
Other markets
|
||||||||||||
|
Solar (3)
|
240
|
1,050
|
1,290
|
|||||||||
|
Wind
|
–
|
1,200
|
1,200
|
|||||||||
|
Total other markets
|
240
|
2,250
|
2,490
|
|||||||||
|
Total renewable energy
|
240
|
3,710
|
3,950
|
|||||||||
|
Share of the CPV Group (66.67%)
|
160
|
2,475
|
2,635
|
|||||||||
| 46 | The information presented in the report regarding the backlog of development projects of the CPV Group, including with respect to the scope of the backlog, status of the projects and/or their characteristics (capacity, technology, integration possibilities with carbon capture potential, expected construction date, etc.), and assessments regarding entitlement to benefits and/or potential compliance with the safe harbor rules, constitutes “forward‑looking” information as it is defined in the Securities Law, regarding which there is no certainty it will be realized or how it will be realized. As at the approval date of the report, there is no certainty regarding execution of the development projects (in whole or in part), and their advancement and the rate thereof are subject to, among other things (as applicable), an estimate regarding continuation of the increase in the demand for electricity from renewable energy and the assumption that the conditions for recognition at the beginning of the construction will not become stricter, completion of development and licensing processes, assurance of control over the land (real estate), assurance of an appropriate commercial format, signing of agreements (such as equipment and construction agreements), execution of construction processes, assurance of a connection process, assurance of financing and/or receipt of regulatory and other approvals (or regulatory changes applicable to licensing and permits in the area). In addition, advance of the development projects is subject to the discretion of the competent organs of the CPV Group and of the Company, and is impacted by government policy, legislative changes and macro‑economic factors. As at the approval date of the report, the government policy and regulation in the U.S. are taking action to reduce renewable‑energy projects by means of cutting back the tax benefits and granting of fewer permits (particularly for wind energy). As at the approval date of the report, the CPV Group is examining the impacts of the said trend on the awaiting list of projects. |
| 47 | In general, the CPV Group views projects that in its estimation are in a period of up to two years or up to three years to the start of the construction as projects in the advanced development stage (there is no certainty the development projects, including projects in the advanced stage, will be executed). That stated is impacted by, among other things, potential compliance with the safe harbor rules under the legislation in the U.S. (including additional regulatory changes and stricter regulations applying to renewable energy), the scope of the project and the technology, and could change based on specific characteristics of a certain project, as well as from the external circumstances that are relevant to the project, such as the anticipated activities’ market or additional regulatory circumstances. In general, projects that are designated to operate in the PJM market could be impacted by the changes in the connection processes as part of the proposed change described in Section 8.1.2.2(A) of Part A to the Periodic Report for 2024, and their progress could be delayed as a result of these proposed changes. It is clarified that in the early development stages (in particular), the scope of the projects and their characteristics are subject to changes, if and to the extent they reach advanced stages. |
|
|
B. |
Construction and development projects in the U.S. (including projects in the area of renewable energy area held by CPV Renewable which is held at the rate of 66.7% by the CPV Group (the CPV Group is held at the rate of 70.53% by the
Company)36: (Cont.)
|
|
|
3. |
Main details regarding development projects in the U.S. (Cont.)
|
|
|
(1) |
For details regarding the policies of the U.S. government with respect to renewable energies and legislation of the
“One Big Beautiful Bill” law in the U.S., which gradually cancels the tax benefits in the area of renewable energies – see Section 3.1C above.
|
|
|
(2) |
For details regarding the process with respect to requests for connection to the network and the interim results regarding some of the connection studies in the PJM market, which in the estimation of the CPV Group triggered and could
continue to trigger a delay in the development of certain projects, taking into account, among other things, the required costs for upgrading the network and their position in the connection process – see Section 6B(2) to the Report of the
Board of Directors for 2024.48
|
|
|
(3) |
Further to that stated in Section 8.13.2 of Part A of the Periodic Report for 2024, with respect to a framework agreement for acquisition of solar panels, in April 2025 CPV Renewable (which as at the approval date of the report is held by the
CPV Group at the rate of 66.67%) signed an amendment to the agreement, to increase the total number of the solar panels as part of the agreement to about 140 MWdc, for an aggregate consideration of about $23 million, among other things,
while reducing the price per unit, adjustment of the timetables for supply of the panels to the timetables of the development projects, update of the deposit provided by CPV Renewable and reduction of the scope of the compensation that
will apply to CPV Renewable in a case of early conclusion of the agreement.
|
|
Natural gas projects with carbon capture potential*
|
Megawatts
|
|||
|
Projects in early-stage development (1) (2)
|
5,000
|
|||
|
Share of the CPV Group
|
4,370
|
|||
|
|
* |
For additional details – see Section 8.10(A) of Part A of the Periodic Report for 202449.
|
| 48 | That stated above in connection with the impacts of the processes with respect to the connection agreements of PJM on the projects of the CPV Group, includes “forward‑looking” information as it is defined in the Securities Law, the realization of which and the manner thereof are uncertain and depend on, among other things, factors that are not under the Company’s control. |
| 49 | The information stated above regarding the projects under construction of the CPV Group, the scope thereof and their additional characteristics, such as, carbon capture potential and the stages of development of the projects, constitutes “forward‑looking” information as it is defined in the Securities Law, and there is no certainty regarding its realization, including due to stages of development that have not yet been completed (as described in Section 8.10 of Part A of the Periodic Report for 2024), and/or uncertainty regarding the feasibility of assimilation of the carbon capture technology in the development projects of the CPV Group and/or the relevant costs. |
| 6. |
Initiation and Construction Projects (Cont.)
|
|
|
B. |
Construction and development projects in the U.S. (including projects in the area of renewable energy area held by CPV Renewable which is held at the rate of 66.7% by the CPV Group (the CPV Group is held at the rate of 70.53% by the
Company)33: (Cont.)
|
|
|
2. |
Main details regarding development projects in the U.S. (Cont.)
|
|
|
(1) |
Further to that stated in Section 6B(2)(3) to the Report of the Board of Directors for 2024, regarding the “Resource Reliability Initiative” (“RRI”) of the FERC, and participation in the Oregon project (in initial development) in the said
process, and taking into account the interim results of the connection studies received after the date of the report, at this stage and as at the approval date of the report the CPV Group does not intend to advance the project in the
framework of an accelerated connection process and to deposit the collaterals required for this purpose. The CPV Group is continuing to examine various alternatives for advancement of the project.
|
|
|
(2) |
As part of the development activities, the CPV Group is acting to, among other things, advance the appropriate
commercial format for each of the projects on its above‑mentioned list of awaiting projects. In this regard, it is noted that in October 2025, the CPV Group signed an agreement for sale of rights in Mason Road project in early development
stage located in Michigan and having a capacity of about 1.4 gigawatts (the share of the CPV Group – 70%) in exchange for a consideration that is not material, part of which was received on the signing date and a part is to be paid in the
future subject to compliance with milestones relating to development of the project, which are not under the CPV Group’s control and uncertainty exists regarding their fulfillment. Based on an initial examination, the Company estimates
that it will recognize capital gain as a result of the sale in an amount that is not material to the Company. In light of the said sale, as at the approval date of the report the project is not yet included the above table.
|
|
|
(3) |
The above table includes a new project in the development stage located in Ohio with a capacity of about 1.4 gigawatts and which, as at the date of the report, is wholly owned by the CPV Group.
|
|
Category
|
9/30/2025
|
12/31/2024
|
Board’s Explanations
|
||||||
|
Current Assets
|
|||||||||
|
Cash and cash equivalents
|
2,300
|
962
|
For details – see the Company’s consolidated statements of cash flows in the interim statements and Part 8 below.
|
||||||
|
Trade receivables
|
420
|
293
|
Most of the increase stems from an increase in receivables from customers in Israel due to seasonal factors in the electricity tariff.
|
||||||
|
Receivables and debit balances
|
108
|
90
|
|||||||
|
Total current assets
|
2,828
|
1,345
|
|||||||
|
Non-Current Assets
|
|||||||||
|
Long-term deposits and restricted cash
|
54
|
60
|
|||||||
|
Long-term receivables and debit balances
|
158
|
162
|
|||||||
|
Investments in associated companies
|
5,368
|
5,320
|
Most of the increase stems from an investment in Shore, in the amount of about NIS 257 million, for purposes of refinancing the project debt (for additional details – see Note 10 to the
Interim Statements), equity income of the CPV Group, in the amount of about NIS 423 million, and an investment in the Basin Ranch project, in the amount of about NIS 148 million. For additional details regarding the results of associated
companies – see Sections 4D and 4E above. This increase was mostly offset by a decline in shekel/dollar exchange rate, in the amount of about NIS 535 million, an other comprehensive loss from associated companies, in the amount of about
NIS 105 million, and distribution of dividends to the CPV Group by associated companies, in the amount of about NIS 203 million.
|
||||||
|
Long-term derivative financial instruments
|
43
|
44
|
|||||||
|
Property, plant and equipment
|
4,281
|
4,238
|
Most of the increase, in the amount of about NIS 169 million stems from investments in Israel and cancellation of an impairment loss, in the amount of about NIS 34 million related to Hadera 2
(for additional details – see Note 10 to the Interim Statements). On the other hand there was a decrease of about NIS 166 million deriving from depreciation expenses.
|
||||||
|
Right-of use assets and long-term deferred expenses
|
638
|
637
|
|||||||
|
Intangible assets
|
265
|
261
|
|||||||
|
Total non-current assets
|
10,807
|
10,722
|
|||||||
|
Total assets
|
13,635
|
12,067
|
|||||||
| 7. |
Financial Position as at September 30, 2025 (in millions of NIS) (Cont.)
|
|
Category
|
9/30/2025
|
12/31/2024
|
Board’s Explanations
|
||||||
|
Current Liabilities
|
|||||||||
|
Loans and credit from banks and financial institutions (including current maturities)
|
114
|
82
|
Most of the increase stems from update of the current maturities of the loans of OPC Israel.
|
||||||
|
Current maturities of debt of holders of non‑controlling interests
|
–
|
14
|
|||||||
|
Current maturities of debentures
|
218
|
212
|
|||||||
|
Trade payables
|
314
|
213
|
Most of the increase stems from timing differences and seasonality in the electricity tariff in Israel.
|
||||||
|
Other payables and credit balances
|
354
|
123
|
Most of the increase, in the amount of about NIS 105 million, stems from reclassification of current maturities of liabilities in respect of a profit participation plan for employees of the
CPV Group and from an additional increase of about NIS 120 million due to an increase in the said liability as a result of an increase in the fair value of the plan (for additional details – see Note 7G to the Interim Statements).
|
||||||
|
Total current liabilities
|
1,000
|
644
|
|||||||
| 7. |
Financial Position as at September 30, 2025 (in millions of NIS) (Cont.)
|
|
Non-Current Liabilities
|
|||||||||
|
Long-term loans from banks and financial institutions
|
2,569
|
2,150
|
Most of the increase derives from taking out a loan, in the amount of NIS 500 million, in OPC Israel in the period of the report. It is noted that the Company used and
will use in the future part of the loan for repayment of its debentures – for additional details – see Note 7A(1) to the Interim Statements.
|
||||||
|
Long-term debt from holders of non-controlling interests
|
443
|
500
|
Most of the decrease in the amount of about NIS 60 million, stems from repayment of loans from holders of non‑controlling interests in OPC Israel.
|
||||||
|
Debentures
|
1,165
|
1,663
|
Most of the decrease, in the amount of about NIS 515 million, derives from repayment of debentures, including a partial early repayment, in the amount of about NIS 302 million (for additional
details – see Note 7E to the Interim Statements). For additional details regarding the source of the amount used for the current repayments and the partial early repayment – see the explanation above in the Section “long‑term loans from banks
and financial institutions”.
|
||||||
|
Long-term lease liabilities
|
23
|
31
|
|||||||
|
Other long-term liabilities
|
11
|
115
|
See explanation in the “other payables and credit balances” section above.
|
||||||
|
Liabilities for deferred taxes
|
552
|
543
|
|||||||
|
Total non-current liabilities
|
4,763
|
5,002
|
|||||||
|
Total liabilities
|
5,763
|
5,646
|
|||||||
|
Total equity
|
7,872
|
6,421
|
Most of the increase stems from issuance of shares, net, in the amount of about NIS 1,721 million, and the net income, in the amount of about NIS 333 million. On the other hand, there was a
decrease as the result of an other comprehensive loss, in the amount of about NIS 605 million (deriving mainly from a translation reserve due to a decline in the shekel/dollar exchange rate).
|
||||||
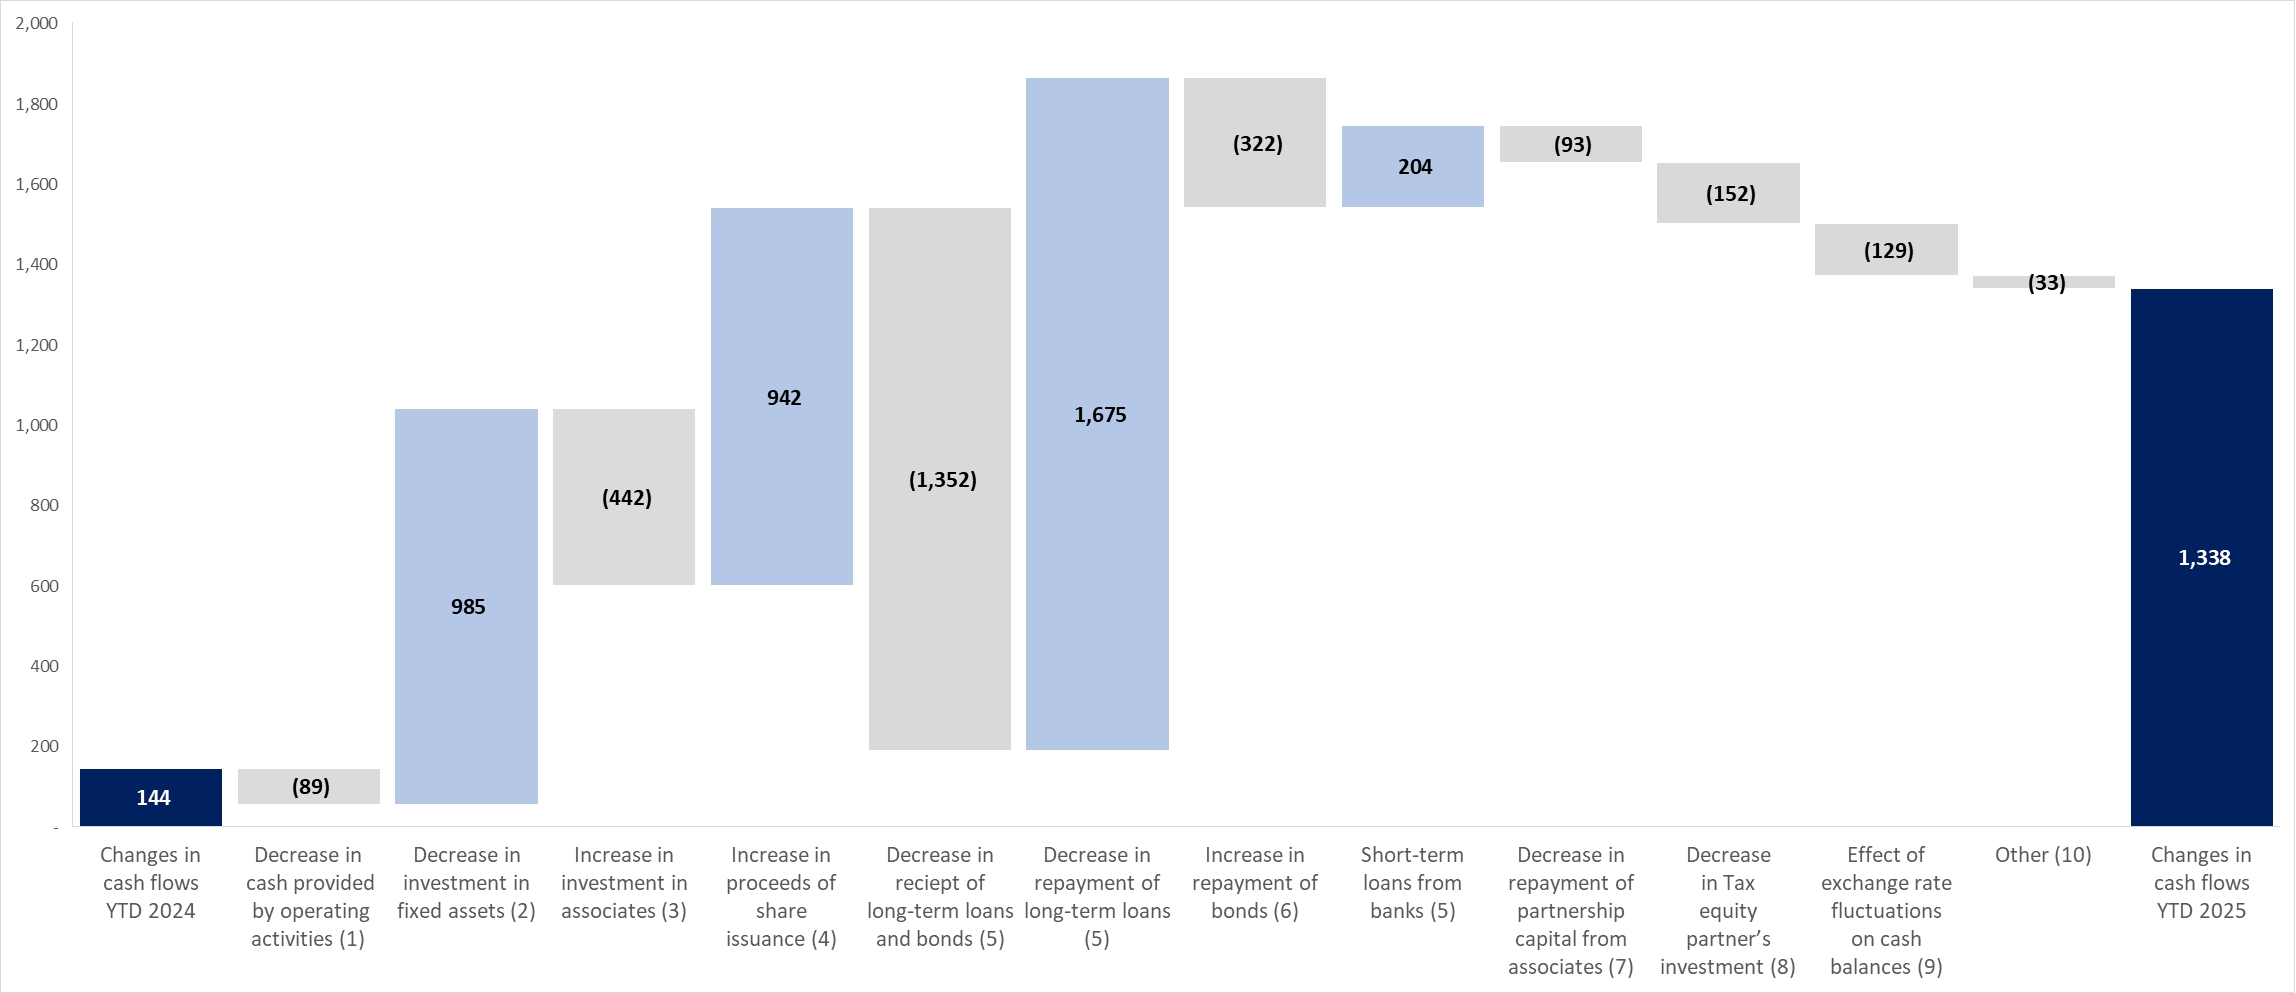
|
|
(1) |
Most of the decrease stems from a decline in the income on a cash basis, which derives mainly from the exit of CPV Renewable from the consolidation in the fourth quarter of 2024.
|
|
|
(2) |
Most of the decrease stems from exit from the consolidation of CPV Renewable in the fourth quarter of 2024 and, as a result, transition to the equity method of accounting – see Note 23E to the annual financial statements.
|
|
|
(3) |
Most of the increase in the period of the report stems from an increase in the rate of holdings in the Shore Power plant and an additional investment in the Shore power plant in the period of the report as part of a refinancing executed in
February 2025 (For additional details – see Note 11 to the Interim Statements). In addition, the period of the report includes investments prior to the financial closing of the Basin Ranch power plant.
|
|
|
(4) |
For additional details regarding an issuance of shares in the period of the report and in the corresponding period last year – see Note 7D to the Interim Statements and Note 18B to the annual financial statements, respectively.
|
|
|
(5) |
For additional details – see Notes 14 and 15 to the annual financial statements and Note 7A to the Interim Statements.
|
|
|
(6) |
For additional details regarding a partial early redemption of debentures (Series B) – see Note 7A(5) to the Interim
Statements.
|
|
|
(7) |
Most of the decline stems from a receipt from Fairview in the third quarter of 2024 as part of the refinancing
|
|
|
(8) |
For additional details regarding the investment of the tax partner in the Stagecoach project in 2024 (prior to the exit from the consolidation of CPV Renewable) – see Note 8.14.7 to Part A of the Periodic Report for 2024.
|
|
|
(9) |
The decrease stems mainly from the sharp decline in the shekel/dollar exchange rate in the period of the report.
|
|
|
(10) |
Includes mainly an increase, in the amount of about NIS 81 million, in respect of repayment of loans and distribution of dividends to holders of non‑controlling interests – for details see Note 7 to the Interim Statements. On the other
hand, it includes a decrease, in the amount of about NIS 48 million, in interest paid due to the exit of CPV Renewable from the consolidation in the fourth quarter of 2024.
|
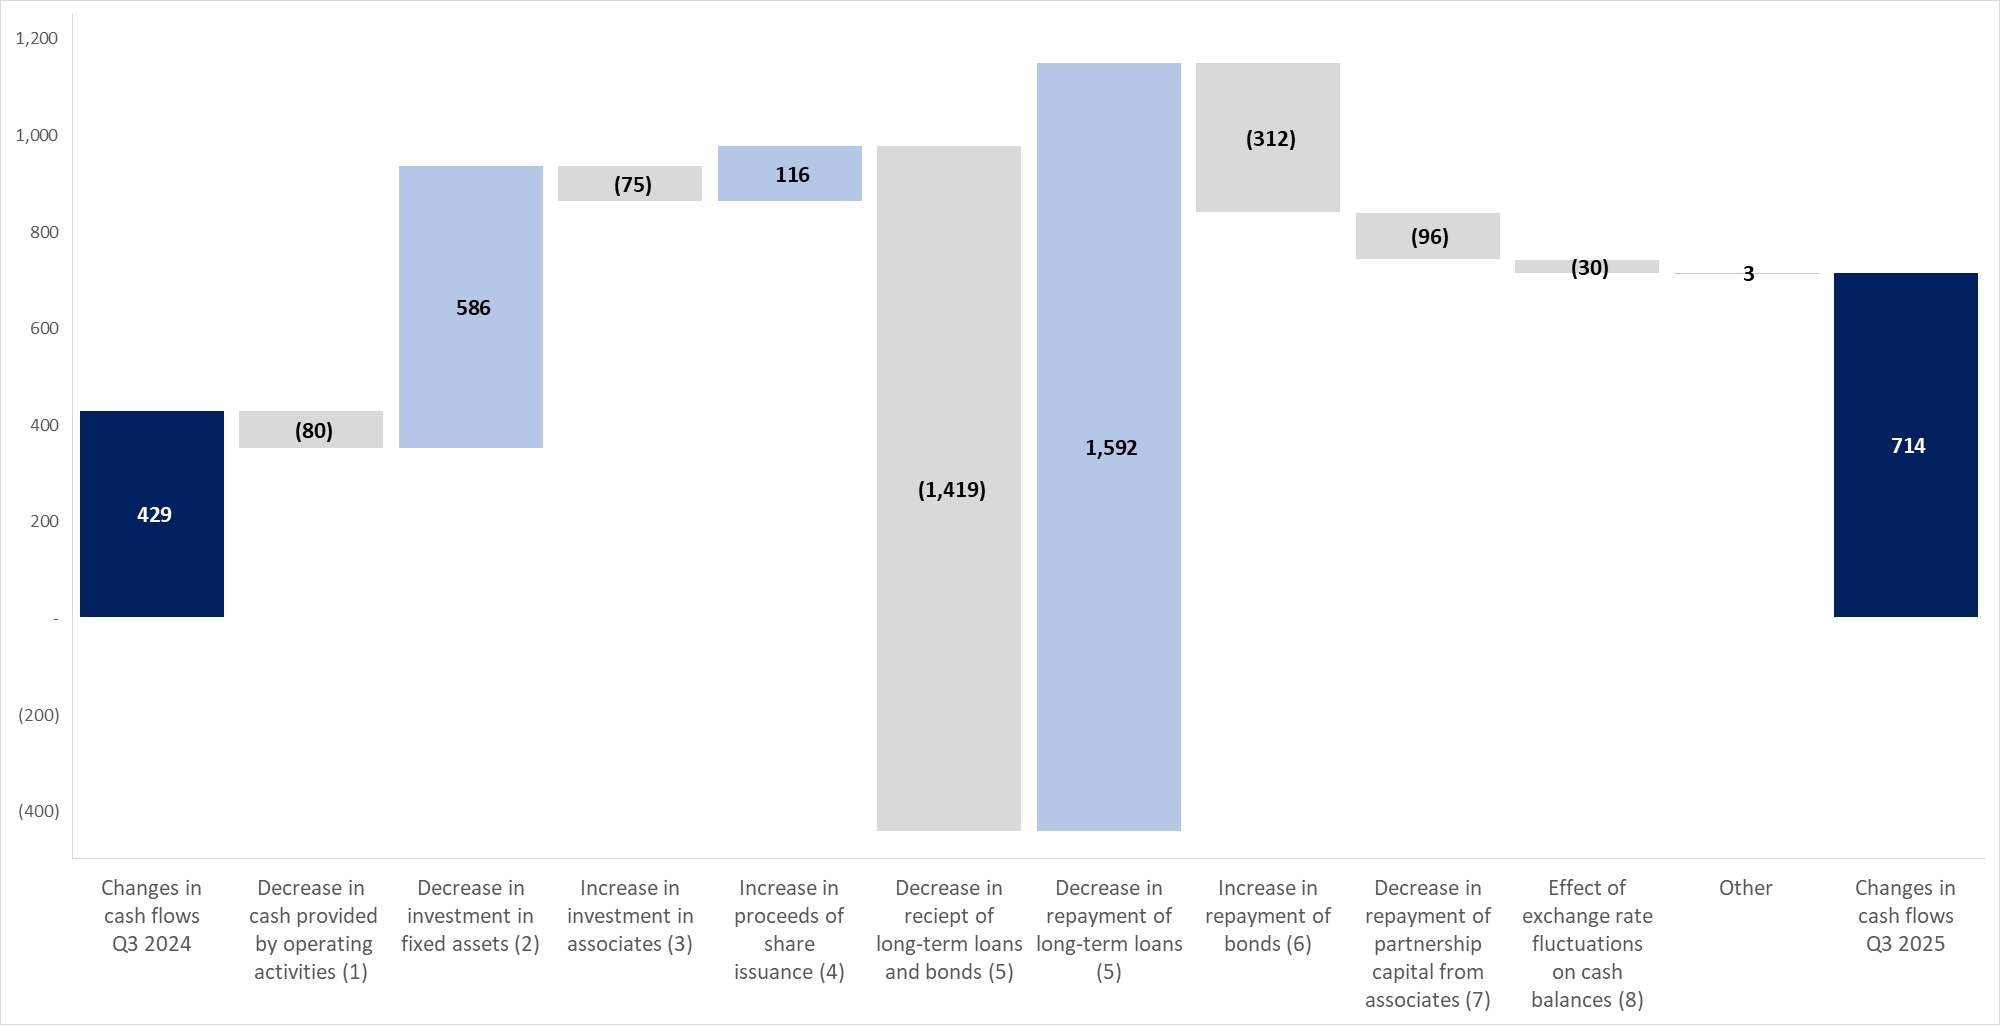
|
|
(1) |
Most of the decrease stems from dividends from associated companies in the U.S.
|
|
|
(2) |
Most of the decrease stems from exit from the consolidation of CPV Renewable in the fourth quarter of 2024 and, as a result, transition to the equity method of accounting – see Note 23E to the annual financial statements.
|
|
|
(3) |
Most of the increase stems from investments prior to the financial closing of the Basin Ranch power plant in the third quarter of 2025.
|
|
|
(4) |
For additional details regarding an issuance of shares in the third quarter of 2025 and in the corresponding quarter last year – see Note 7D to the Interim Statements and Note 18B to the annual financial statements, respectively.
|
|
|
(5) |
For additional details – see Notes 14 and 15 to the annual financial statements and Note 7A to the Interim Statements.
|
|
|
(6) |
For additional details regarding a partial early redemption of debentures (Series B) – see Note 7A(5) to the Interim
Statements.
|
|
|
(7) |
Most of the decline stems from a receipt from Fairview in the third quarter of 2024 as part of the refinancing
|
|
|
(8) |
The decrease stems mainly from the decline in the shekel/dollar exchange rate in the third quarter of 2025.
|
| 9. |
Adjusted financial debt, net
|
|
|
A. |
Composition of the adjusted financial debt, net
|
|
As at September 30, 2025(1)(2)
|
As at December 31, 2024(3)
|
|
|
3.0
|
5.2
|
|
|
(1) |
After elimination of debt under construction in the Renewable Energies segment in the U.S. of about NIS 614 million, as at September 30, 2025, as detailed in the following table. With reference to acquisition of additional holdings in some
of the power plants in the Energy Transition area in the U.S. (“the Additional Acquisitions”) and regarding transition to the equity method of accounting in the Renewable Energies segment, the representative EBITDA was calculated as follows:
Maryland and Shore based on the rate of holdings with respect to the actual results in 2024 and in the first quarter of 2025 for the Additional Acquisitions; the renewable energy activities based on the rate of holdings with respect to the
actual results in 2024 at the rate of 66.7% in the period prior to completion of the investment transaction in November 2024.
|
|
|
(2) |
As at September 30, 2025, the adjusted financial debt, net, includes a cash balance of about NIS 1,810 million, in the headquarters company, as detailed in the following table, the source of which is, among other things, issuances of
capital in June and August 2025, which were intended to serve for financing of part of the shareholders’ equity required for construction of the Basin Ranch power plant, as well as for continued growth and development of the Company’s
business. For additional details – see Note 7D to the Interim Statements.
|
|
|
(3) |
For details – see Section 9A of the Report of the Board of Directors for 2024.
|
| 9. |
Adjusted financial debt, net (Cont.)
|
|
|
A. |
Compositions of the adjusted financial debt, net (Cont.)
|
|
Gross debt
|
||||||||||||||||||||||||||
|
Name of project
|
Method of
presentation
in the
Company’s
financial
statements
|
Debt
(including
interest
payable
and
deferred
expenses)
|
Weighted-
average
interest
rate
|
Final
repayment
date of
the loan
|
Cash and cash
equivalents
and deposits
(including
restricted cash
used for debt
service) (1)
|
Derivative
financial
instruments
for hedging
principal
and/or
interest
|
Net
debt
|
|||||||||||||||||||
|
Hadera
|
Consolidated
|
562
|
4.9%
|
|
2037
|
100
|
44
|
418
|
||||||||||||||||||
|
Israel headquarters and others
|
Consolidated
|
2,115
|
6.3%–6.4%
|
|
2033
|
168
|
–
|
1,947
|
||||||||||||||||||
|
Total Israel
|
2,677
|
6.0%
|
|
268
|
44
|
2,365
|
||||||||||||||||||||
|
Active renewable energy
projects (3)
|
Associated (66.7%)
|
262
|
4.2%
|
|
2028–2030
|
5
|
8
|
249
|
||||||||||||||||||
|
Financing of renewable energy
projects (4)
|
Associated (66.7%)
|
616
|
5.9%
|
|
2026–2029
|
5
|
(3
|
)
|
614
|
|||||||||||||||||
|
Renewable energies headquarters
|
Associated (66.7%)
|
–
|
–
|
|
171
|
–
|
(171
|
)
|
||||||||||||||||||
|
Total renewable energy
|
878
|
5.4%
|
|
181
|
5
|
692
|
||||||||||||||||||||
|
Fairview (5) (Cash Sweep 39%)
|
Associated (25%)
|
394
|
7.0%
|
|
2030–2031
|
1
|
(1
|
)
|
394
|
|||||||||||||||||
|
Towantic (Cash Sweep 9%)
|
Associated (26%)
|
188
|
8.1%
|
|
2029
|
4
|
(4
|
)
|
188
|
|||||||||||||||||
|
Maryland (6) (Cash Sweep 55%)
|
Associated (75%)
|
698
|
6.1%
|
|
2028
|
–
|
6
|
636
|
||||||||||||||||||
|
Shore (7) (Cash Sweep 100%)
|
Associated (69%)
|
872
|
7.9%
|
|
2030–2032
|
–
|
(6
|
)
|
878
|
|||||||||||||||||
|
Valley (8) (Cash Sweep 100%)
|
Associated (50%)
|
523
|
10.3%
|
|
May 2026
|
111
|
–
|
412
|
||||||||||||||||||
|
Three Rivers (Cash Sweep 58%)
|
Associated (10%)
|
215
|
5.2%
|
|
2028
|
13
|
10
|
192
|
||||||||||||||||||
|
Total energy transition (9)
|
2,890
|
7.6%
|
|
185
|
5
|
2,700
|
||||||||||||||||||||
|
Headquarters and others – U.S.
|
Consolidated
|
9
|
–
|
–
|
293
|
–
|
(284
|
)
|
||||||||||||||||||
|
Total U.S.
|
3,777
|
659
|
10
|
3,108
|
||||||||||||||||||||||
|
Total energy headquarters (11)
|
1,385
|
2.5%–6.2% (weighted-average
3.1%)
|
2028–2034
|
1,810
|
–
|
(425
|
)
|
|||||||||||||||||||
|
Total
|
7,839
|
2,737
|
54
|
5,048
|
||||||||||||||||||||||
|
|
(1) |
Includes restricted cash, in the amount of about NIS 53 million in Hadera and about NIS 162 million in the Energy Transition segment.
|
|
|
(2) |
For details regarding an undertaking in a financing agreement with Bank Hapoalim Ltd. in the period of the report
for provision of a loan in the cumulative amount of NIS 400 million (of which the amount of NIS 200 million was withdrawn in the period of the report) – see Note 7A(1) to the Interim Statements.
|
|
|
(3) |
As at the date of the report, relates to the Keenan and Mountain Wind projects.
|
|
|
(4) |
For details – see Section 8.17.5 of Part A of the Periodic Report for 2024. Includes the Maple Hill, Stagecoach and Backbone (under construction) projects that are financed as part of a construction financing framework for renewable energy
projects, and the Rouge’s Wind project (under construction), which is financed under a separate financing agreement.
|
|
|
(5) |
In February 2025, Fairview’s financing agreement was amended such that the interest margin on the long‑term loan was reduced from 3.5% to 3.0%. In addition, after the date of the report the financing agreement was amended again such that
the long‑term loan principal (Term Loan B) increased from about $491 million to about $700 million (the share of the CPV increased from about $52 million (NIS 172 million)) and the interest margin on the loan was reduced from 3.0% to 2.5%.
Upon completion of the transaction, the amount of about $217 million (NIS 717 million) was distributed as a dividend to the partners holding the project, where the share of the CPV is about $54 million (NIS 179 million).
|
| 9. |
Adjusted financial debt, net (Cont.)
|
|
|
A. |
Compositions of the adjusted financial debt, net (Cont.)
|
|
|
(6) |
In March 2025, Maryland’s financing agreement was amended, such that the interest‑rate margin on the long‑term loan was reduced from 3.75% to 3.25%.
|
|
|
(7) |
On February 4, 2025, Shore completed an undertaking in a new financing agreement. For details – see Section 8.17.4 of Part A of the Periodic Report for 2024. It is noted that for purposes of completion of Shore’s new financing agreement,
the amount of about $80 million (NIS 286 million) was granted to Shore by all of its equity holders (CPV’s share – about $72 million).
|
|
|
(8) |
The interest margin of Valley was determined without the Title V permit as at the extension date of the financing agreement in September 2023. For additional information regarding completion of the request for the Title V permit – see
Section 8.1.4(J) of Part A of the Periodic Report for 2024.
|
|
|
(9) |
The rate (%) of the Cash Sweep mechanism is in accordance with the estimate of the CPV Group and it could change from time to time based on the provisions of the financing agreements of the projects.
|
|
|
(10) |
As part of some of the financing agreements, financial covenants were determined for the projects. As at the date of the report, the associated companies are in compliance with all the financial covenants. As part of Maryland’s financing
agreement, a financial covenant was provided requiring a historical debt service coverage ratio of 1:1 during the last four quarters. As at the date of the financial statements, Maryland is in compliance with this financial covenant (5:1).
|
|
|
(11) |
Includes balances of debt and cash in the Company and cash in ICG Energy Inc. (available for use for all the Group’s needs). In the period of the report, on September 30, 2025, the Company made partial early repayment, in the amount of
about NIS 256 million, of the par value of debentures (Series B). The amount of the redemption in respect of the partial early repayment, including linkage differences, is about NIS 302 million.
|
|
|
(12) |
As at the approval date of the report, the Company is examining the possibility of taking out additional long‑term debt, which will serve mainly for refinancing of existing long‑term debt and extension of the life (period) of the loans. As
at the approval date of the report, there is no certainty regarding the said refinancing, the timing thereof or its conditions, which are subject to market conditions and the discretion of the Company’s competent organs.
|
|
|
A. |
Compositions of the adjusted financial debt, net (Cont.)
|
|
|
Method of
presentation
in the
Company’s
financial
statements
|
Debt
(including
interest
payable
and deferred
expenses)
|
Cash and cash
equivalents
and deposits
(including
restricted cash used
for debt service)
|
Derivative
financial
instruments
for hedging
principal
and/or interest
|
Net
debt
|
||||||||||||
|
Hadera
|
Consolidated
|
585
|
72
|
44
|
469
|
||||||||||||
|
Headquarters and others – Israel
|
Consolidated
|
1,649
|
16
|
–
|
1,633
|
||||||||||||
|
Total Israel
|
2,234
|
88
|
44
|
2,102
|
|||||||||||||
|
Active renewable energy projects
|
Associated (66.7%)
|
323
|
5
|
16
|
302
|
||||||||||||
|
Financing construction of renewable
|
|||||||||||||||||
|
energy projects
|
Associated (66.7%)
|
426
|
69
|
9
|
348
|
||||||||||||
|
Renewable energies headquarters
|
Associated (66.7%)
|
–
|
216
|
–
|
(216
|
)
|
|||||||||||
|
Total renewable energy
|
749
|
290
|
25
|
434
|
|||||||||||||
|
Fairview
|
Associated (25%)
|
482
|
–
|
2
|
480
|
||||||||||||
|
Towantic
|
Associated (26%)
|
215
|
9
|
(1
|
)
|
207
|
|||||||||||
|
Maryland
|
Associated (75%)
|
891
|
80
|
15
|
796
|
||||||||||||
|
Shore
|
Associated (69%)
|
1,114
|
235
|
–
|
879
|
||||||||||||
|
Valley
|
Associated (50%)
|
686
|
104
|
–
|
582
|
||||||||||||
|
Three Rivers
|
Associated (10%)
|
252
|
14
|
17
|
221
|
||||||||||||
|
Total energy transition
|
3,640
|
442
|
33
|
3,165
|
|||||||||||||
|
Headquarters and others – U.S.
|
Consolidated
|
–
|
264
|
–
|
(264
|
)
|
|||||||||||
|
Total U.S.
|
4,389
|
996
|
58
|
3,335
|
|||||||||||||
|
Total Energy headquarters
|
1,891
|
664
|
–
|
1,227
|
|||||||||||||
|
Total
|
8,514
|
1,748
|
102
|
6,664
|
|||||||||||||
|
|
B. |
Interest and linkage bases
|
| C. | Financial covenants |
| 9. |
Adjusted financial debt, net (Cont.)
|
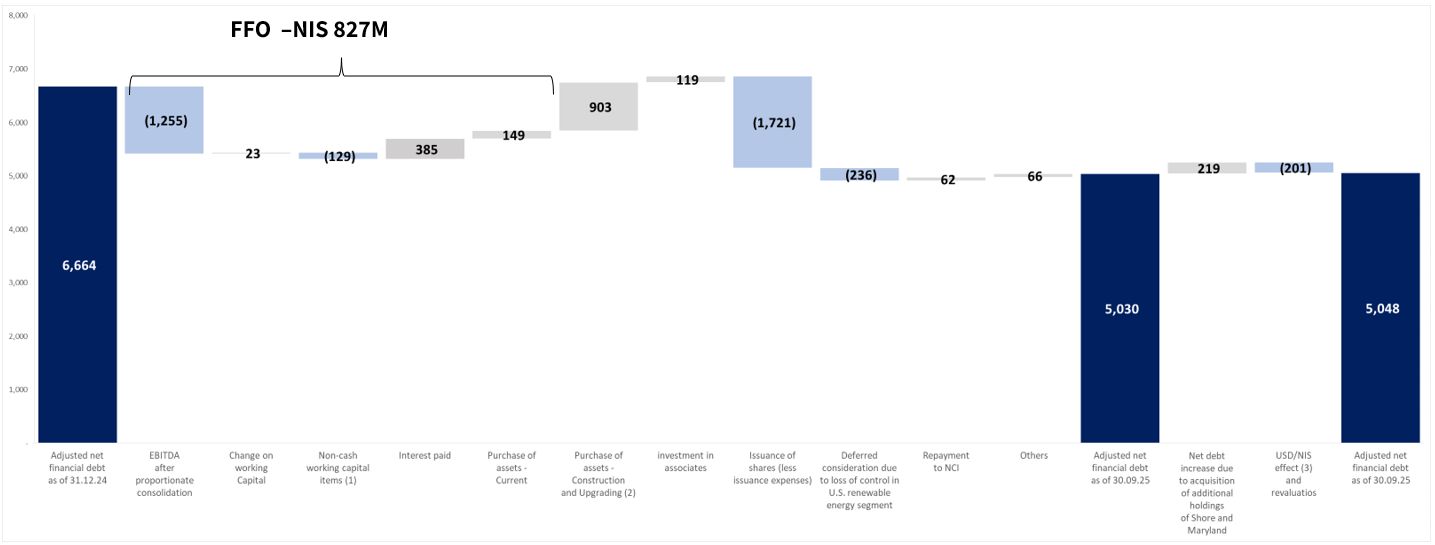
|
|
(1) |
Includes mainly changes in the fair value of the profit participation plan for employees of the CPV Group. For details – see Note 7G to the Interim Statements.
|
|
|
(2) |
Includes an amount of NIS 53 million for upgrade works carried out as part of the upgrade and maintenance works of the Rotem power plant since October 2025, as
detailed in Section 4C above.
|
|
|
(2) |
Mainly in respect of translation of the net financial debt of the U.S., which is denominated in dollars, into shekels.
|
| 10. |
Additional Events in the Company’s Areas of Activity in the Period of the Report and Thereafter
|
|
|
A. |
Examination of possibilities for expansion of the Company’s activities in the area of generation and supply of electricity in additional geographic regions – further to that stated in Section 17.2 of Part A of the Periodic Report
for 2024 with respect to the possibility of expansion of its activities in the area of generation and supply of electricity and energy in additional geographic regions in addition to Israel and the U.S., and further to that stated in
Section 10A of the Report of the Board of Directors for the second quarter of 2025 regarding a preliminary examination of potential investment opportunities in the area of renewable energies on a significant platform operating in a number of
European markets, as at the approval date of the report, the Company does not intend to advance the said opportunities, and as stated in the Periodic Report for 2024 and in the Report of the Board of Directors for the second quarter of 2025,
the Company is continuing to examine additional opportunities, including opportunities in the area of renewable energies in additional geographic areas that are being considered as at the approval date of the report (regarding which there is
no certainty they will reach the stage of due diligence examinations and negotiations), and the Company also might, from time to time, continue to examine additional opportunities for expanding its activities in the area of generation and
supply of electricity in frameworks similar to that stated, to the extent they are consistent with the Company’s strategy in its area of activities.
|
|
|
B. |
Actions for attaining control in some of the power plants of the CPV Group – further to that stated in Section 18.1.6 of Part A of the Periodic Report for 2024 and in Section 10B of the Report of the Board of Directors for the
second quarter of 2025 regarding the continued examination of business opportunities in connection with increase of the holdings of the CPV Group in active power plants it holds, as at the approval date of the report the CPV Group:
|
|
|
(1) |
Signed an agreement for acquisition of the remaining 11% in the Shore power plant, in exchange for an amount that is
not material to the Company. Completion of the transaction, which is subject to preconditions that have not yet been fulfilled (including regulatory approvals), is expected to take place in the upcoming months, and if completed the
CPV Group will hold 100% of the Shore power plant and will consolidate it for the first time starting from this date in its financial statements52. As at the approval date of the report, the Company is examining the Company is
examining the accounting treatment of the acquisition transaction (to the extent it is completed), particularly the impacts of the transition from an associated company to a consolidated subsidiary; and
|
|
|
(2) |
Is carrying on advanced negotiations for execution of an exchange transaction with the remaining partner in the Maryland power plant53 in such a manner that in exchange for its holdings in the Maryland power plant (25%), the
CPV Group will pay an amount in cash that is not material for the Company and will transfer to the said partner its rights in the Three Rivers power plant (10%). To the extent the said negotiations ripen into final consents and all the
conditions for signing and completion of the transaction are fulfilled, the CPV Group is expected to hold 100% of the Maryland power plant and concurrently will cease to hold the Three Rivers power plant. Commencing from the completion date
of the transaction (if expected), which is expected by the end of the first half of 2026, subject to fulfillment of all the conditions, as stated, after receipt of the required approvals (including regulatory approvals and third-party
consents, which have not yet been obtained), if completed, the Maryland power plant will be consolidated in the financial statements of the CPV Group.
|
| 10. |
Additional Events in the Company’s Areas of Activity in the Period of the Report and Thereafter (Cont.)
|
|
|
B. |
Agreements for attaining control in some of the power plants of the CPV Group – (Cont.)
|
|
|
(2) |
(Cont.)
|
|
|
C. |
Financial closing, start of
construction and acquisition of the remaining rights in the Basin Ranch power plant – for details – see Section 6B(2) above and Notes 6B and 6C to the Interim Statements.
|
| 11. |
Debentures (Series B, Series C and Series D)
|
| 12. |
Impacts of changes in the macro‑economic environment on the Group’s activities and its results
|
| 13. |
Corporate Governance
|
|
|
A. |
Undertaking to purchase an insurance policy covering directors and officers – on April 1, 2025, a decision of the Board of Directors entered into effect (after approval by the Remuneration Committee) in connection with renewal of
the Company’s undertaking to purchase an insurance policy covering directors and officers (“Insurance Policies”), this being, among other things, in accordance with the provisions of the Companies Regulations (Leniencies in Transactions with
Interested Parties), 2000 and the provisions of the Company’s remuneration policy. The Insurance Policies are valid for the period from April 3, 2025, to October 2, 2026. For additional details – see the Company’s Immediate Report dated April
1, 2025 (Reference No.: 2025-01-023882).
|
|
|
B. |
Extension of shelf prospectus – on May 25, 2025, a shelf prospectus of the Company bearing the date May 30, 2023, was extended by an additional year up to May 30, 2026. For additional details – see the Company’s Immediate Report
dated May 25, 2025 (Reference No: 2025‑01‑036811).
|
|
|
C. |
For details regarding an Extraordinary General Meeting on August 26, 2025 that approved an equity remuneration grant to the Company’s CEO, Mr. Giora Almogy, see the Company’s Immediate Report dated August 27, 2025 (Reference No.:
2025‑01‑064130).
|
| 14. |
Contributions policy
|
|
Recipient of the
|
Amount of the
|
Relationship to the
|
|||
|
Contribution
|
Contribution
|
Recipient of the Contribution
|
|||
|
“Password for Every Student” Society
|
1,000
|
“Password for Every Student” also receives contributions from parties related to the Company’s controlling shareholder,
including corporations in which officers serving as directors of the Company hold positions (including from the Israel Corporation Group and its controlling shareholders). The Company’s CEO is a representative of the project’s Steering
Committee without compensation.
|
|||
|
“Rahashei Lev” Society
|
150
|
For the sake of good order, it is noted that as the Company was informed, commencing from November 2022, the daughter of Mr.
Yosef Tena, an external director of the Company, is employed by the Tel‑Aviv Medical Center in the name of Sorosky.
|
|||
|
“Running to Give” Society
|
50
|
For the sake of good order, it is noted that a relative of the Company’s CEO serves as Chairman of the Society without
compensation.
|
|||
|
Yair Caspi
|
Giora Almogy
|
|
|
Chairman of the Board of Directors
|
CEO
|
| 55 | The Company was informed that parties related directly or indirectly to the Company’s controlling shareholder also contributed (as well as other parties in the economy) to restoration of the Soroka Hospital. Increase of the contributions’ budget, including making of the above‑mentioned contributions, was approved by the Company’s Board of Directors after approval of the Contributions Committee (the members of which are members of the Audit Committee). |
| – |
In the peak hours, electricity is sold in the maximum scope;
|
| – |
Sale of the balance of the electricity is made in the off‑peak hours.
|
| – |
The scope of the generation of each power plant was estimated separately on the basis of the historical generation data while taking into generation forecasts.
|
| * |
Assumption of a thermal conversion ratio (heat rate) of 6.9 MMBtu/MWh for Maryland, Shore and Valley, and a thermal conversion ratio (heat rate) of 6.5 MMBtu/MWh for Three Rivers, Towantic, Fairview and Basin Ranch.
|
| 56 | EOX is a subsidiary of a commodity broker, OTC Global Holdings, which publishes forward prices for the electricity and natural gas markets based on trading data in the futures markets. The futures prices are an objective way of estimating the future expectation with respect to electricity and natural gas prices since they represent transactions with entities operating in these markets involving buying and selling futures contracts at specific prices. |
|
For the
|
||||||||||||
|
three months
|
||||||||||||
|
October –
|
For the
|
For the
|
||||||||||
|
December
|
year
|
year
|
||||||||||
|
Power Plant
|
2025
|
2026
|
2027
|
|||||||||
|
Fairview
|
||||||||||||
|
Gas price (Texas Eastern M3)
|
3.12
|
3.94
|
4.06
|
|||||||||
|
Electricity price (AEP Dayton (AD))
|
45.03
|
50.98
|
51.64
|
|||||||||
|
Electricity margin
|
24.75
|
25.34
|
25.28
|
|||||||||
|
Towantic
|
||||||||||||
|
Gas price (Algonquin City Gate)
|
5.32
|
6.07
|
5.87
|
|||||||||
|
Electricity price (Mass Hub)
|
59.66
|
67.67
|
65.27
|
|||||||||
|
Electricity margin
|
25.05
|
28.22
|
27.11
|
|||||||||
|
Maryland
|
||||||||||||
|
Gas price (Transco Zone 5)
|
3.85
|
4.87
|
4.65
|
|||||||||
|
Electricity price (PJM West Hub)
|
50.35
|
58.44
|
59.86
|
|||||||||
|
Electricity margin
|
23.76
|
24.81
|
27.75
|
|||||||||
|
Shore
|
||||||||||||
|
Gas price (Texas Eastern M3)
|
3.12
|
3.94
|
4.06
|
|||||||||
|
Electricity price (PJM West Hub)
|
50.35
|
58.44
|
59.86
|
|||||||||
|
Electricity margin
|
28.81
|
31.23
|
31.87
|
|||||||||
|
Valley
|
||||||||||||
|
Gas price (Texas Eastern M3 – 70%, Dominion South Pt – 30%)
|
2.92
|
3.66
|
3.76
|
|||||||||
|
Electricity price (New York Zone G)
|
55.32
|
62.54
|
60.54
|
|||||||||
|
Electricity margin
|
35.15
|
37.25
|
34.62
|
|||||||||
|
Three Rivers
|
||||||||||||
|
Gas price (Chicago City Gate)
|
3.29
|
3.80
|
3.86
|
|||||||||
|
Electricity price (PJM ComEd)
|
38.85
|
45.25
|
45.72
|
|||||||||
|
Electricity margin
|
17.45
|
20.52
|
20.62
|
|||||||||
|
Basin Ranch (under construction)
|
||||||||||||
|
Gas price (Waha)
|
(0.04
|
)
|
1.79
|
3.18
|
||||||||
|
Electricity price (ERCOT West Pk)
|
39.41
|
59.32
|
63.75
|
|||||||||
|
Electricity margin
|
39.64
|
47.70
|
43.08
|
|||||||||
| Waha |
Transco
Zn5 Dlvd
M2M
|
Chicago
CG
|
Algonquin
CG
|
Dominion
S Pt
|
Texas
Eastern
M-3
|
ERCOT
West OPk
|
ERCOT
West Pk
|
Mass Hub
OPk
|
Mass
Hub Pk |
Contract
Date |
|
-1.87
|
2.92
|
2.72
|
2.15
|
1.76
|
1.89
|
32.09
|
41.37
|
32.37
|
40.33
|
01/10/2025
|
|
0.12
|
3.65
|
3.08
|
4.01
|
2.44
|
2.72
|
34.43
|
41.36
|
45.45
|
52.82
|
01/11/2025
|
|
1.64
|
4.99
|
4.07
|
9.81
|
3.18
|
4.76
|
40.50
|
48.15
|
85.81
|
95.72
|
01/12/2025
|
|
2.87
|
7.71
|
4.93
|
14.27
|
3.62
|
7.71
|
65.85
|
61.26
|
119.85
|
131.54
|
01/01/2026
|
|
2.71
|
6.74
|
4.76
|
12.72
|
3.45
|
6.70
|
64.14
|
59.55
|
101.58
|
114.83
|
01/02/2026
|
|
0.33
|
4.58
|
3.52
|
5.99
|
3.00
|
3.40
|
46.95
|
39.85
|
57.66
|
67.15
|
01/03/2026
|
|
0.11
|
4.04
|
3.29
|
3.70
|
2.86
|
2.99
|
41.71
|
43.66
|
41.38
|
49.96
|
01/04/2026
|
|
0.37
|
4.19
|
3.20
|
3.11
|
2.70
|
2.83
|
45.36
|
49.72
|
36.80
|
45.83
|
01/05/2026
|
|
0.74
|
4.21
|
3.30
|
3.51
|
2.77
|
2.93
|
50.40
|
60.70
|
37.78
|
56.80
|
01/06/2026
|
|
1.71
|
4.51
|
3.54
|
4.31
|
2.97
|
3.29
|
65.80
|
93.01
|
52.17
|
86.85
|
01/07/2026
|
|
1.93
|
4.37
|
3.57
|
4.19
|
2.98 |
3.22
|
74.81 |
142.23
|
43.69 |
69.91
|
01/08/2026
|
|
1.71
|
3.98
|
3.44
|
3.10
|
2.62
|
2.72
|
56.29
|
71.77
|
37.89
|
50.48
|
01/09/2026
|
|
2.02
|
4.02
|
3.46
|
3.14
|
2.49
|
2.68
|
45.34
|
51.04
|
38.55
|
48.04
|
01/10/2026
|
|
3.10
|
4.02
|
3.89
|
5.11
|
2.98
|
3.40
|
46.30
|
50.06
|
55.33
|
63.82
|
01/11/2026
|
|
3.87
|
6.11
|
4.75
|
9.69
|
3.71
|
5.46
|
56.83
|
52.28
|
81.82
|
95.94
|
01/12/2026
|
|
4.35
|
8.15
|
5.47
|
13.52
|
4.05 |
7.99
|
78.15
|
79.99
|
117.45
|
130.66
|
01/01/2027
|
|
4.03
|
7.12
|
5.18
|
12.26
|
3.82
|
7.41
|
74.48
|
75.42
|
96.05
|
106.74
|
01/02/2027
|
|
3.02
|
4.50
|
3.69
|
6.01
|
3.27
|
3.54
|
46.69
|
50.10
|
57.24
|
68.19
|
01/03/2027
|
|
2.36
|
3.89
|
3.28
|
3.90
|
2.85
|
2.99
|
43.30
|
52.78
|
40.49
|
48.21
|
01/04/2027
|
|
2.40
|
3.84
|
3.15
|
3.22
|
2.70
|
2.86
|
46.66
|
51.70
|
35.55
|
43.98
|
01/05/2027
|
|
2.79
|
3.85
|
3.28
|
3.36
|
2.75
|
2.99
|
48.56
|
60.29
|
36.38
|
52.84
|
01/06/2027
|
|
3.04
|
4.00
|
3.44
|
4.23
|
2.84
|
3.16
|
75.62
|
101.01
|
47.87
|
84.91
|
01/07/2027
|
|
3.10
|
3.85
|
3.50
|
4.03
|
2.82
|
3.07
|
81.11
|
132.24
|
44.23
|
71.88
|
01/08/2027
|
|
3.01
|
3.60
|
3.37
|
3.05
|
2.54
|
2.71
|
56.44
|
70.26
|
36.05
|
48.23
|
01/09/2027
|
|
3.01
|
3.57
|
3.44
|
3.30
|
2.53
|
2.84
|
47.56
|
53.21
|
38.65
|
45.25
|
01/10/2027
|
|
3.24
|
3.95
|
3.79
|
4.91
|
2.92 |
3.47
|
45.09
|
51.49
|
53.13 |
59.47
|
01/11/2027
|
| 3.81 | 5.51 | 4.73 | 8.66 | 3.65 | 5.63 | 54.87 | 61.48 | 76.20 |
89.63 |
01/12/2027
|
|
4.19
|
8.44
|
5.45
|
14.34
|
4.05
|
8.26
|
86.06
|
82.79
|
115.53
|
122.55
|
01/01/2028
|
|
3.81
|
7.24
|
5.14
|
12.70
|
3.75
|
7.43
|
81.85
|
75.63 |
105.70
|
116.08
|
01/02/2028
|
|
2.65
|
4.45
|
3.56
|
4.70
|
3.11
|
3.68
|
48.33
|
50.15
|
46.91
|
51.99
|
01/03/2028
|
|
2.17
|
3.64
|
3.14
|
3.73
|
2.72
|
2.93
|
45.07
|
47.52
|
37.11
|
46.82
|
01/04/2028
|
|
2.22
|
3.70
|
3.02
|
3.14
|
2.51
|
2.80
|
45.21
|
48.06
|
32.76
|
43.30
|
01/05/2028
|
|
2.64
|
3.60
|
3.10
|
3.27
|
2.65
|
2.93
|
54.55
|
58.53
|
33.35
|
49.72
|
01/06/2028
|
|
2.97
|
3.62
|
3.29
|
3.49
|
2.62
|
2.95
|
75.06 |
102.51
|
43.44
|
84.45
|
01/07/2028
|
|
3.09
|
3.48
|
3.37
|
3.37
|
2.73
|
2.89
|
76.17
|
122.53
|
40.45
|
73.72
|
01/08/2028
|
|
2.93
|
3.37
|
3.31
|
2.99
|
2.42
|
2.68
|
57.13
|
66.62
|
32.52
|
47.20
|
01/09/2028
|
|
3.02
|
3.31
|
3.36
|
3.26
|
2.46
|
2.81
|
50.00
|
52.75
|
35.93
|
42.42
|
01/10/2028
|
|
3.26
|
3.74
|
3.63
|
4.71
|
2.80
|
3.35
|
46.30
|
50.10
|
44.54
|
55.03
|
01/11/2028
|
|
3.88
|
5.30
|
4.59
|
8.45
|
3.56
|
5.55
|
51.63
|
60.18
|
70.17
|
82.39
|
01/12/2028
|
|
East NY
ZnG OPk
|
East NY
ZnG Pk
|
PJM
ComEd
OPk
|
PJM
ComEd Pk
|
AEP-
Dayton
OPk
|
AEP -
Dayton Pk
|
PJM West
OPk
|
PJM West
Pk
|
Contract Date |
|
35.87
|
45.93
|
27.73
|
43.69
|
36.16
|
50.71
|
37.04
|
54.75
|
01/10/2025
|
|
42.15
|
50.93
|
28.69
|
38.81
|
37.42
|
46.12
|
38.83
|
49.55
|
01/11/2025
|
|
68.15
|
80.29
|
33.76
|
45.25
|
42.43
|
52.31
|
46.81
|
57.69
|
01/12/2025
|
|
104.35
|
119.30
|
47.54
|
61.11
|
58.73
|
69.46
|
66.55
|
79.04
|
01/01/2026
|
|
76.85
|
98.87
|
39.42
|
50.77
|
49.92
|
60.20
|
56.59
|
68.68
|
01/02/2026
|
|
48.98
|
57.51
|
29.53
|
37.79
|
40.38
|
46.12
|
42.68
|
50.74
|
01/03/2026
|
|
40.28
|
48.06
|
25.58
|
38.08
|
38.61
|
46.91
|
40.06
|
51.47
|
01/04/2026
|
|
34.74
|
44.77
|
24.48
|
40.00
|
33.68
|
47.79
|
35.09
|
52.15
|
01/05/2026
|
|
38.13
|
55.24
|
27.76
|
49.65
|
34.06
|
55.30
|
35.66
|
59.61
|
01/06/2026
|
|
50.96
|
85.39
|
38.51
|
76.82
|
43.50
|
79.01
|
45.55
|
88.87
|
01/07/2026
|
|
43.49
|
70.41
|
33.74
|
63.28
|
36.90
|
68.51
|
38.95
|
76.39
|
01/08/2026
|
|
35.48
|
50.88
|
27.38
|
48.88
|
34.76
|
54.65
|
36.57
|
59.07
|
01/09/2026
|
|
34.53
|
45.83
|
29.31
|
44.83
|
38.78
|
53.16
|
41.09
|
57.28
|
01/10/2026
|
|
48.30
|
58.90
|
30.99
|
44.83
|
43.51
|
52.43
|
45.36
|
55.99
|
01/11/2026
|
|
72.32
|
84.28
|
40.69
|
49.96
|
49.12
|
58.91
|
53.93
|
64.84
|
01/12/2026
|
|
98.94
|
118.41
|
56.00
|
67.02
|
65.16
|
76.80
|
73.28
|
87.02
|
01/01/2027
|
|
79.20
|
95.26
|
46.52
|
55.05
|
56.27
|
65.03
|
64.04
|
74.42
|
01/02/2027
|
|
50.57
|
58.64
|
28.61
|
40.22
|
42.80
|
48.03
|
44.51
|
53.26
|
01/03/2027
|
|
38.65
|
44.78
|
26.67
|
38.69
|
37.77
|
47.21
|
39.54
|
52.24
|
01/04/2027
|
|
34.36
|
43.48
|
23.05
|
41.80
|
32.65
|
47.07
|
35.03
|
52.60
|
01/05/2027
|
|
35.93
|
51.20
|
27.35
|
48.20
|
33.69
|
53.39
|
35.81
|
59.28
|
01/06/2027
|
|
46.83
|
82.82
|
35.37
|
78.04
|
41.55
|
80.52
|
44.24
|
89.80
|
01/07/2027
|
|
43.78
|
70.09
|
31.79
|
67.13
|
37.95
|
69.28
|
40.64
|
78.57
|
01/08/2027
|
|
34.55
|
46.99
|
30.99
|
45.39
|
33.96
|
53.03
|
36.24
|
58.47
|
01/09/2027
|
|
33.11
|
39.96
|
31.48
|
41.48
|
36.45
|
51.69
|
40.76
|
56.78
|
01/10/2027
|
|
49.78
|
54.23
|
26.16
|
40.82
|
42.78
|
50.43
|
45.57
|
55.32
|
01/11/2027
|
|
67.62
|
84.69
|
37.48
|
47.39
|
49.75
|
57.19
|
54.56
|
63.72
|
01/12/2027
|
|
91.51
|
102.06
|
57.69
|
67.31
|
65.00
|
72.21
|
73.98
|
84.91
|
01/01/2028
|
|
85.34
|
95.61
|
49.48
|
61.19
|
57.76
|
65.80
|
66.70
|
78.56
|
01/02/2028
|
|
45.43
|
54.14
|
32.84
|
42.42
|
40.18
|
45.53
|
44.72
|
53.00
|
01/03/2028
|
|
37.32
|
46.58
|
27.47
|
39.96
|
34.47
|
46.58
|
38.91
|
51.70
|
01/04/2028
|
|
33.91
|
45.79
|
18.22
|
35.27
|
34.09
|
47.24
|
36.30
|
52.51
|
01/05/2028
|
|
35.55
|
51.76
|
20.26
|
43.69
|
33.68
|
53.56
|
35.44
|
58.43
|
01/06/2028
|
|
48.42
|
81.33
|
31.20
|
78.09
|
39.97
|
83.52
|
42.54
|
89.54
|
01/07/2028
|
|
44.73
|
72.49
|
27.98
|
68.29
|
36.44
|
72.94
|
39.06
|
78.55
|
01/08/2028
|
|
33.27
|
49.68
|
25.51
|
44.35
|
33.57
|
52.46
|
35.68
|
57.12
|
01/09/2028
|
|
34.80
|
39.71
|
29.50
|
41.43
|
37.58
|
47.48
|
39.69
|
52.08
|
01/10/2028
|
|
40.99
|
49.94
|
30.05
|
37.97
|
39.94
|
49.85
|
43.39
|
55.38
|
01/11/2028
|
|
64.99
|
77.06
|
38.12
|
45.87
|
48.51
|
59.06
|
54.07
|
66.23
|
01/12/2028
|
|
OPC Energy Ltd.
Condensed Consolidated Interim
Financial Statements
As of September 30, 2025
(Unaudited)
|
| Page |
|
|
F-3
|
|
|
F-4
|
|
|
F-5
|
|
|
F-7
|
|
|
F-8
|
|
|
F-9
|
|
|
F-12
|
|
|
F-14
|
|
|
(1) |
Independent auditors’ review report of November 18, 2025 on the Company’s Condensed Consolidated Financial
Information as of September 30, 2025 and for the nine- and three-month periods then ended.
|
|
|
(2) |
Independent auditors’ special report of November 18, 2025 on the Company’s separate interim financial information as of September 30, 2025, in accordance with Regulation 38D to the Securities Regulations (Periodic and Immediate Reports),
1970 and for the nine- and three-month periods then ended.
|
|
September 30
|
September 30
|
December 31
|
||||||||||
|
2025
|
2024
|
2024
|
||||||||||
|
(Unaudited)
|
(Unaudited)
|
(Audited)
|
||||||||||
|
NIS million
|
NIS million
|
NIS million
|
||||||||||
|
Current assets
|
||||||||||||
|
Cash and cash equivalents
|
2,300
|
1,151
|
962
|
|||||||||
|
Trade receivables
|
420
|
360
|
293
|
|||||||||
|
Other receivables and debit balances
|
108
|
163
|
90
|
|||||||||
|
Total current assets
|
2,828
|
1,674
|
1,345
|
|||||||||
|
Non‑current assets
|
||||||||||||
|
Long-term restricted deposits and cash
|
54
|
57
|
60
|
|||||||||
|
Long-term receivables and debit balances
|
158
|
231
|
162
|
|||||||||
|
Investments in associates
|
5,368
|
2,463
|
5,320
|
|||||||||
|
Long-term derivative financial instruments
|
43
|
54
|
44
|
|||||||||
|
Property, plant & equipment
|
4,281
|
7,048
|
4,238
|
|||||||||
|
Right‑of‑use assets and deferred expenses
|
638
|
790
|
637
|
|||||||||
|
Intangible assets
|
265
|
1,138
|
261
|
|||||||||
|
Total non‑current assets
|
10,807
|
11,781
|
10,722
|
|||||||||
|
Total assets
|
13,635
|
13,455
|
12,067
|
|||||||||
|
September 30
|
September 30
|
December 31
|
||||||||||
|
2025
|
2024
|
2024
|
||||||||||
|
(Unaudited)
|
(Unaudited)
|
(Audited)
|
||||||||||
|
NIS million
|
NIS million
|
NIS million
|
||||||||||
|
Current liabilities
|
||||||||||||
|
Loans and credit from banking corporations and financial institutions (including current maturities)
|
114
|
148
|
82
|
|||||||||
|
Current maturities of debt from non‑controlling interests
|
-
|
22
|
14
|
|||||||||
|
Current maturities of debentures
|
218
|
212
|
212
|
|||||||||
|
Trade payables
|
314
|
314
|
213
|
|||||||||
|
Payables and credit balances
|
354
|
183
|
123
|
|||||||||
|
Total current liabilities
|
1,000
|
879
|
644
|
|||||||||
|
Non‑current liabilities
|
||||||||||||
|
Long-term loans from banking corporations and financial institutions
|
2,569
|
2,953
|
2,150
|
|||||||||
|
Long-term debt from non-controlling interests
|
443
|
455
|
500
|
|||||||||
|
Debentures
|
1,165
|
1,664
|
1,663
|
|||||||||
|
Long-term lease liabilities
|
23
|
199
|
31
|
|||||||||
|
Long-term derivative financial instruments
|
-
|
36
|
-
|
|||||||||
|
Other long‑term liabilities
|
11
|
565
|
115
|
|||||||||
|
Deferred tax liabilities
|
552
|
517
|
543
|
|||||||||
|
Total non-current liabilities
|
4,763
|
6,389
|
5,002
|
|||||||||
|
Total liabilities
|
5,763
|
7,268
|
5,646
|
|||||||||
|
Equity
|
||||||||||||
|
Share capital
|
3
|
3
|
3
|
|||||||||
|
Share premium
|
5,745
|
3,990
|
3,993
|
|||||||||
|
Capital reserves
|
48
|
574
|
532
|
|||||||||
|
Retained earnings
|
478
|
196
|
224
|
|||||||||
|
Total equity attributable to the Company’s shareholders
|
6,274
|
4,763
|
4,752
|
|||||||||
|
Non‑controlling interests
|
1,598
|
1,424
|
1,669
|
|||||||||
|
Total equity
|
7,872
|
6,187
|
6,421
|
|||||||||
|
Total liabilities and equity
|
13,635
|
13,455
|
12,067
|
|||||||||
|
Yair Caspi
|
Giora Almogy
|
Shai Abramovitz
|
||
|
Chairman of the Board of Directors
|
CEO
|
Chief Comptroller1
|
|
For the nine-month period ended September 30
|
For the three-month period ended September 30
|
For the
year ended December 31
|
||||||||||||||||||
|
2025
|
2024
|
2025
|
2024
|
2024
|
||||||||||||||||
|
(Unaudited)
|
(Unaudited)
|
(Unaudited)
|
(Unaudited)
|
(Audited)
|
||||||||||||||||
|
NIS million
|
NIS million
|
NIS million
|
NIS million
|
NIS million
|
||||||||||||||||
|
Revenues from sales and provision of services
|
2,256
|
2,190
|
895
|
879
|
2,779
|
|||||||||||||||
|
Cost of sales and services (excluding depreciation and amortization)
|
(1,643
|
)
|
(1,493
|
)
|
(603
|
)
|
(582
|
)
|
(1,931
|
)
|
||||||||||
|
Depreciation and amortization
|
(180
|
)
|
(245
|
)
|
(59
|
)
|
(90
|
)
|
(317
|
)
|
||||||||||
|
Gross income
|
433
|
452
|
233
|
207
|
531
|
|||||||||||||||
|
Share in profits of associates
|
423
|
150
|
211
|
64
|
166
|
|||||||||||||||
|
Compensation for loss of income
|
-
|
44
|
-
|
18
|
44
|
|||||||||||||||
|
General and administrative expenses
|
(295
|
)
|
(191
|
)
|
(147
|
)
|
(72
|
)
|
(263
|
)
|
||||||||||
|
Business development expenses
|
(10
|
)
|
(33
|
)
|
(4
|
)
|
(11
|
)
|
(45
|
)
|
||||||||||
|
Gain on loss of control in the US Renewable Energy Segment
|
-
|
-
|
-
|
-
|
259
|
|||||||||||||||
|
Other revenues (expenses), net
|
19
|
(50
|
)
|
35
|
2
|
(56
|
)
|
|||||||||||||
|
Operating profit
|
570
|
372
|
328
|
208
|
636
|
|||||||||||||||
|
Finance expenses
|
(216
|
)
|
(272
|
)
|
(74
|
)
|
(99
|
)
|
(339
|
)
|
||||||||||
|
Finance income
|
53
|
72
|
30
|
48
|
87
|
|||||||||||||||
|
Loss from extinguishment of financial liabilities
|
-
|
(49
|
)
|
-
|
(49
|
)
|
(49
|
)
|
||||||||||||
|
Finance expenses, net
|
(163
|
)
|
(249
|
)
|
(44
|
)
|
(100
|
)
|
(301
|
)
|
||||||||||
|
Profit before taxes on income
|
407
|
123
|
284
|
108
|
335
|
|||||||||||||||
|
Expenses for income tax
|
(74
|
)
|
(49
|
)
|
(48
|
)
|
(22
|
)
|
(138
|
)
|
||||||||||
|
Profit for the period
|
333
|
74
|
236
|
86
|
197
|
|||||||||||||||
|
Attributable to:
|
||||||||||||||||||||
|
The Company’s shareholders
|
254
|
83
|
183
|
81
|
111
|
|||||||||||||||
|
Non‑controlling interests
|
79
|
(9
|
)
|
53
|
5
|
86
|
||||||||||||||
|
Profit for the period
|
333
|
74
|
236
|
86
|
197
|
|||||||||||||||
|
Earnings per share attributable to the Company’s owners
|
||||||||||||||||||||
|
Basic diluted earnings per share (in NIS)
|
0.95
|
0.36
|
0.64
|
0.33
|
0.46
|
|||||||||||||||
|
For the nine-month period ended
September 30 |
For the three-month period ended
September 30
|
For the
year ended December 31
|
||||||||||||||||||
|
2025
|
2024
|
2025
|
2024
|
2024
|
||||||||||||||||
|
(Unaudited)
|
(Unaudited)
|
(Unaudited)
|
(Unaudited)
|
(Audited)
|
||||||||||||||||
|
NIS million
|
NIS million
|
NIS million
|
NIS million
|
NIS million
|
||||||||||||||||
|
Profit for the period
|
333
|
74
|
236
|
86
|
197
|
|||||||||||||||
|
Components of other comprehensive income (loss) which, after being recognized in comprehensive income were or will be carried to profit and loss
|
||||||||||||||||||||
|
Effective portion of the change in the fair value of cash flow hedges
|
(2
|
)
|
25
|
3
|
-
|
42
|
||||||||||||||
|
Net change in fair value of derivative financial instruments used to hedge cash flows transferred to profit and loss
|
(5
|
)
|
(14
|
)
|
(3
|
)
|
(6
|
)
|
(11
|
)
|
||||||||||
|
Group’s share in other comprehensive income (loss) of associates, net of tax
|
(84
|
)
|
(29
|
)
|
9
|
27
|
13
|
|||||||||||||
|
Foreign currency translation differences in respect of foreign operations
|
(*) (555
|
)
|
84
|
(*) (123
|
)
|
(75
|
)
|
(8
|
)
|
|||||||||||
|
Tax on other comprehensive income (loss) items
|
41
|
(3
|
)
|
12
|
4
|
(6
|
)
|
|||||||||||||
|
Other comprehensive income (loss) for the period, net of tax
|
(605
|
)
|
63
|
(102
|
)
|
(50
|
)
|
30
|
||||||||||||
|
Total comprehensive income (loss) for the period
|
(272
|
)
|
137
|
134
|
36
|
227
|
||||||||||||||
|
Attributable to:
|
||||||||||||||||||||
|
The Company’s shareholders
|
(202
|
)
|
131
|
102
|
36
|
121
|
||||||||||||||
|
Non‑controlling interests
|
(70
|
)
|
6
|
32
|
-
|
106
|
||||||||||||||
|
Comprehensive income (loss) for the period
|
(272
|
)
|
137
|
134
|
36
|
227
|
||||||||||||||
|
Attributable to the Company’s shareholders
|
||||||||||||||||||||||||||||||||||||
|
Share capital
|
Share premium
|
Capital reserves
|
Hedge fund
|
Foreign operations translation reserve
|
Retained earnings
|
Total
|
Non‑controlling interests
|
Total equity
|
||||||||||||||||||||||||||||
|
NIS million
|
NIS million
|
NIS million
|
NIS million
|
NIS million
|
NIS million
|
NIS million
|
NIS million
|
NIS million
|
||||||||||||||||||||||||||||
|
(Unaudited)
|
||||||||||||||||||||||||||||||||||||
|
|
||||||||||||||||||||||||||||||||||||
|
For the nine-month period
ended September 30, 2025
|
||||||||||||||||||||||||||||||||||||
|
Balance as of January 1, 2025
|
3
|
3,993
|
247
|
49
|
236
|
224
|
4,752
|
1,669
|
6,421
|
|||||||||||||||||||||||||||
|
Issuance of shares (less issuance expenses)
|
*-
|
1,721
|
-
|
-
|
-
|
-
|
1,721
|
-
|
1,721
|
|||||||||||||||||||||||||||
|
Investments by holders of non-controlling interests in equity of subsidiary
|
-
|
-
|
-
|
-
|
-
|
-
|
-
|
35
|
35
|
|||||||||||||||||||||||||||
|
Share-based payment
|
-
|
-
|
4
|
-
|
-
|
-
|
4
|
1
|
5
|
|||||||||||||||||||||||||||
|
Exercised and expired options and RSUs
|
*-
|
31
|
(31
|
)
|
-
|
-
|
-
|
-
|
-
|
-
|
||||||||||||||||||||||||||
|
Dividend paid to non‑controlling interests
|
-
|
-
|
-
|
-
|
-
|
-
|
-
|
(38
|
)
|
(38
|
)
|
|||||||||||||||||||||||||
|
Other
|
-
|
-
|
(1
|
)
|
-
|
-
|
-
|
(1
|
)
|
1
|
-
|
|||||||||||||||||||||||||
|
Other comprehensive loss for the period, net of tax
|
-
|
-
|
-
|
(60
|
)
|
(396
|
)
|
-
|
(456
|
)
|
(149
|
)
|
(605
|
)
|
||||||||||||||||||||||
|
Profit for the period
|
-
|
-
|
-
|
-
|
-
|
254
|
254
|
79
|
333
|
|||||||||||||||||||||||||||
|
Balance as of September 30, 2025
|
3
|
5,745
|
219
|
(11
|
)
|
(160
|
)
|
478
|
6,274
|
1,598
|
7,872
|
|||||||||||||||||||||||||
|
For the nine-month period
ended September 30, 2024
|
||||||||||||||||||||||||||||||||||||
|
Balance as of January 1, 2024
|
2
|
3,210
|
248
|
25
|
250
|
113
|
3,848
|
1,394
|
5,242
|
|||||||||||||||||||||||||||
|
Issuance of shares (less issuance expenses)
|
1
|
778
|
-
|
-
|
-
|
-
|
779
|
-
|
779
|
|||||||||||||||||||||||||||
|
Investments by holders of non-controlling interests in equity of subsidiary
|
-
|
-
|
-
|
-
|
-
|
-
|
-
|
34
|
34
|
|||||||||||||||||||||||||||
|
Share-based payment
|
-
|
-
|
5
|
-
|
-
|
-
|
5
|
1
|
6
|
|||||||||||||||||||||||||||
|
Exercised and expired options and RSUs
|
*-
|
2
|
(2
|
)
|
-
|
-
|
-
|
-
|
-
|
-
|
||||||||||||||||||||||||||
|
Other
|
-
|
-
|
-
|
-
|
-
|
-
|
-
|
(11
|
)
|
(11
|
)
|
|||||||||||||||||||||||||
|
Other comprehensive income (loss) for the period, net of tax
|
-
|
-
|
-
|
(13
|
)
|
61
|
-
|
48
|
15
|
63
|
||||||||||||||||||||||||||
|
Profit (loss) for the period
|
-
|
-
|
-
|
-
|
-
|
83
|
83
|
(9
|
)
|
74
|
||||||||||||||||||||||||||
|
Balance as of September 30, 2024
|
3
|
3,990
|
251
|
12
|
311
|
196
|
4,763
|
1,424
|
6,187
|
|||||||||||||||||||||||||||
|
Attributable to the Company’s shareholders
|
||||||||||||||||||||||||||||||||||||
|
Share capital
|
Share premium
|
Capital reserves
|
Hedge fund
|
Foreign operations translation reserve
|
Retained earnings
|
Total
|
Non‑controlling interests
|
Total equity
|
||||||||||||||||||||||||||||
|
NIS million
|
NIS million
|
NIS million
|
NIS million
|
NIS million
|
NIS million
|
NIS million
|
NIS million
|
NIS million
|
||||||||||||||||||||||||||||
|
(Unaudited)
|
||||||||||||||||||||||||||||||||||||
|
For the three-month period
ended September 30, 2025
|
||||||||||||||||||||||||||||||||||||
|
Balance as of July 1, 2025
|
3
|
4,842
|
225
|
(17
|
)
|
(73
|
)
|
295
|
5,275
|
1,594
|
6,869
|
|||||||||||||||||||||||||
|
Issuance of shares (less issuance expenses)
|
*-
|
895
|
-
|
-
|
-
|
-
|
895
|
-
|
895
|
|||||||||||||||||||||||||||
|
Share-based payment
|
-
|
-
|
2
|
-
|
-
|
-
|
2
|
1
|
3
|
|||||||||||||||||||||||||||
|
Exercised and expired options and RSUs
|
*-
|
8
|
(8
|
)
|
-
|
-
|
-
|
-
|
-
|
-
|
||||||||||||||||||||||||||
|
Dividend paid to non‑controlling interests
|
-
|
-
|
-
|
-
|
-
|
-
|
-
|
(29
|
)
|
(29
|
)
|
|||||||||||||||||||||||||
|
Other comprehensive income (loss) for the period, net of tax
|
-
|
-
|
-
|
6
|
(87
|
)
|
-
|
(81
|
)
|
(21
|
)
|
(102
|
)
|
|||||||||||||||||||||||
|
Profit for the period
|
-
|
-
|
-
|
-
|
-
|
183
|
183
|
53
|
236
|
|||||||||||||||||||||||||||
|
Balance as of September 30, 2025
|
3
|
5,745
|
219
|
(11
|
)
|
(160
|
)
|
478
|
6,274
|
1,598
|
7,872
|
|||||||||||||||||||||||||
|
For the three-month period
ended September 30, 2024
|
||||||||||||||||||||||||||||||||||||
|
Balance as of July 1, 2024
|
2
|
3,211
|
251
|
(2
|
)
|
370
|
115
|
3,947
|
1,434
|
5,381
|
||||||||||||||||||||||||||
|
Issuance of shares (less issuance expenses)
|
1
|
778
|
-
|
-
|
-
|
-
|
779
|
-
|
779
|
|||||||||||||||||||||||||||
|
Share-based payment
|
-
|
-
|
1
|
-
|
-
|
-
|
1
|
1
|
2
|
|||||||||||||||||||||||||||
|
Exercised and expired options and RSUs
|
*-
|
1
|
(1
|
)
|
-
|
-
|
-
|
-
|
-
|
-
|
||||||||||||||||||||||||||
|
Other
|
-
|
-
|
-
|
-
|
-
|
-
|
-
|
(11
|
)
|
(11
|
)
|
|||||||||||||||||||||||||
|
Other comprehensive income (loss) for the period, net of tax
|
-
|
-
|
-
|
14
|
(59
|
)
|
-
|
(45
|
)
|
(5
|
)
|
(50
|
)
|
|||||||||||||||||||||||
|
Profit for the period
|
-
|
-
|
-
|
-
|
-
|
81
|
81
|
5
|
86
|
|||||||||||||||||||||||||||
|
Balance as of September 30, 2024
|
3
|
3,990
|
251
|
12
|
311
|
196
|
4,763
|
1,424
|
6,187
|
|||||||||||||||||||||||||||
|
Attributable to the Company’s shareholders
|
||||||||||||||||||||||||||||||||||||
|
Share capital
|
Share premium
|
Capital reserves
|
Hedge fund
|
Foreign operations translation reserve
|
Retained earnings
|
Total
|
Non‑controlling interests
|
Total equity
|
||||||||||||||||||||||||||||
|
NIS million
|
NIS million
|
NIS million
|
NIS million
|
NIS million
|
NIS million
|
NIS million
|
NIS million
|
NIS million
|
||||||||||||||||||||||||||||
|
(Audited)
|
||||||||||||||||||||||||||||||||||||
|
For the year ended December 31, 2024
|
||||||||||||||||||||||||||||||||||||
|
Balance as of January 1, 2024
|
2
|
3,210
|
248
|
25
|
250
|
113
|
3,848
|
1,394
|
5,242
|
|||||||||||||||||||||||||||
|
Issuance of shares (less issuance expenses)
|
1
|
779
|
-
|
-
|
-
|
-
|
780
|
-
|
780
|
|||||||||||||||||||||||||||
|
Investments by holders of non-controlling interests in equity of subsidiary
|
-
|
-
|
-
|
-
|
-
|
-
|
-
|
175
|
175
|
|||||||||||||||||||||||||||
|
Share-based payment
|
-
|
-
|
7
|
-
|
-
|
-
|
7
|
1
|
8
|
|||||||||||||||||||||||||||
|
Exercised and expired options and RSUs
|
*-
|
4
|
(4
|
)
|
-
|
-
|
-
|
-
|
-
|
-
|
||||||||||||||||||||||||||
|
Other
|
-
|
-
|
(4
|
)
|
-
|
-
|
-
|
(4
|
)
|
(7
|
)
|
(11
|
)
|
|||||||||||||||||||||||
|
Other comprehensive income (loss) for the year, net of tax
|
-
|
-
|
-
|
24
|
(14
|
)
|
-
|
10
|
20
|
30
|
||||||||||||||||||||||||||
|
Profit for the year
|
-
|
-
|
-
|
-
|
-
|
111
|
111
|
86
|
197
|
|||||||||||||||||||||||||||
|
Balance as of December 31, 2024
|
3
|
3,993
|
247
|
49
|
236
|
224
|
4,752
|
1,669
|
6,421
|
|||||||||||||||||||||||||||
|
For the nine-month period ended September 30
|
For the three-month period ended September 30
|
For the
year ended December 31
|
||||||||||||||||||
|
2025
|
2024
|
2025
|
2024
|
2024
|
||||||||||||||||
|
(Unaudited)
|
(Unaudited)
|
(Unaudited)
|
(Unaudited)
|
(Audited)
|
||||||||||||||||
|
NIS million
|
NIS million
|
NIS million
|
NIS million
|
NIS million
|
||||||||||||||||
|
Cash flows from operating activities
|
||||||||||||||||||||
|
Profit for the period
|
333
|
74
|
236
|
86
|
197
|
|||||||||||||||
|
Adjustments:
|
||||||||||||||||||||
|
Depreciation and amortization
|
193
|
257
|
64
|
95
|
333
|
|||||||||||||||
|
Diesel fuel consumption
|
20
|
9
|
4
|
1
|
12
|
|||||||||||||||
|
Finance expenses, net
|
163
|
249
|
44
|
100
|
301
|
|||||||||||||||
|
Expenses for income tax
|
74
|
49
|
48
|
22
|
138
|
|||||||||||||||
|
Share in profits of associates
|
(423
|
)
|
(150
|
)
|
(211
|
)
|
(64
|
)
|
(166
|
)
|
||||||||||
|
Other expenses (revenues), net
|
(19
|
)
|
50
|
(35
|
)
|
(2
|
)
|
56
|
||||||||||||
|
Gain on loss of control in the US Renewable Energy Segment
|
-
|
-
|
-
|
-
|
(259
|
)
|
||||||||||||||
|
Share-based payment transactions
|
125
|
24
|
86
|
14
|
35
|
|||||||||||||||
|
466
|
562
|
236
|
252
|
647
|
||||||||||||||||
|
Changes in trade and other receivables
|
(166
|
)
|
(176
|
)
|
(36
|
)
|
(75
|
)
|
(64
|
)
|
||||||||||
|
Changes in trade payables, service providers, payables and other long-term liabilities
|
161
|
158
|
38
|
62
|
14
|
|||||||||||||||
|
(5
|
)
|
(18
|
)
|
2
|
(13
|
)
|
(50
|
)
|
||||||||||||
|
Dividends received from associates
|
203
|
205
|
108
|
179
|
235
|
|||||||||||||||
|
Income taxes paid
|
(8
|
)
|
(4
|
)
|
(8
|
)
|
-
|
(67
|
)
|
|||||||||||
|
Net cash provided by operating activities
|
656
|
745
|
338
|
418
|
765
|
|||||||||||||||
|
Cash flows used in investing activities
|
||||||||||||||||||||
|
Interest received
|
38
|
23
|
22
|
11
|
35
|
|||||||||||||||
|
Investment in associates
|
(479
|
)
|
(37
|
)
|
(84
|
)
|
(9
|
)
|
(737
|
)
|
||||||||||
|
Purchase of property, plant, and equipment, intangible assets and deferred expenses
|
(235
|
)
|
(1,203
|
)
|
(97
|
)
|
(698
|
)
|
(1,260
|
)
|
||||||||||
|
Loss of control in the US Renewable Energies Segment
|
-
|
-
|
-
|
-
|
134
|
|||||||||||||||
|
Proceeds for repayment of partnership capital from associates
|
3
|
95
|
-
|
95
|
95
|
|||||||||||||||
|
Other
|
5
|
25
|
(6
|
)
|
18
|
21
|
||||||||||||||
|
Net cash used for investing activities
|
(668
|
)
|
(1,097
|
)
|
(165
|
)
|
(583
|
)
|
(1,712
|
)
|
||||||||||
|
For the nine-month period ended September 30
|
For the three-month period ended September 30
|
For the year ended December 31
|
||||||||||||||||||
|
2025
|
2024
|
2025
|
2024
|
2024
|
||||||||||||||||
|
(Unaudited)
|
(Unaudited)
|
(Unaudited)
|
(Unaudited)
|
(Audited)
|
||||||||||||||||
|
NIS million
|
NIS million
|
NIS million
|
NIS million
|
NIS million
|
||||||||||||||||
|
Cash flows provided by financing activities
|
||||||||||||||||||||
|
Proceeds of share issuance, less issuance expenses (1)
|
1,721
|
779
|
895
|
779
|
780
|
|||||||||||||||
|
Proceeds of debenture issuance, less issuance expenses
|
-
|
198
|
-
|
-
|
198
|
|||||||||||||||
|
Receipt of long-term loans from banking corporations and financial institutions, net (2)
|
494
|
1,649
|
194
|
1,614
|
1,951
|
|||||||||||||||
|
Receipt of long-term debt from non-controlling interests
|
11
|
60
|
-
|
36
|
104
|
|||||||||||||||
|
Investments by holders of non-controlling interests in equity of subsidiary
|
35
|
34
|
-
|
-
|
175
|
|||||||||||||||
|
Change in short-term loans from banking corporations, net
|
10
|
(195
|
)
|
12
|
10
|
(204
|
)
|
|||||||||||||
|
Tax equity partner’s investment in US-based renewable energy projects
|
-
|
152
|
-
|
-
|
152
|
|||||||||||||||
|
Interest paid
|
(150
|
)
|
(198
|
)
|
(60
|
)
|
(79
|
)
|
(228
|
)
|
||||||||||
|
Dividend paid to non‑controlling interests
|
(38
|
)
|
-
|
(29
|
)
|
-
|
-
|
|||||||||||||
|
Repayment of long-term loans from banking corporations and others (2)
|
(68
|
)
|
(1,743
|
)
|
(25
|
)
|
(1,617
|
)
|
(1,755
|
)
|
||||||||||
|
Repayment of long-term loans from non-controlling interests
|
(62
|
)
|
(68
|
)
|
(13
|
)
|
(59
|
)
|
(76
|
)
|
||||||||||
|
Repayment of debentures (3)
|
(515
|
)
|
(193
|
)
|
(409
|
)
|
(97
|
)
|
(193
|
)
|
||||||||||
|
Other
|
12
|
(8
|
)
|
(2
|
)
|
(1
|
)
|
(13
|
)
|
|||||||||||
|
Net cash provided by financing activities
|
1,450
|
467
|
563
|
586
|
891
|
|||||||||||||||
|
Net increase (decrease) in cash and cash equivalents
|
1,438
|
115
|
736
|
421
|
(56
|
)
|
||||||||||||||
|
Balance of cash and cash equivalents as of the beginning of the period
|
962
|
1,007
|
1,586
|
722
|
1,007
|
|||||||||||||||
|
Effect of exchange rate fluctuations on cash and cash equivalent balances
|
(100
|
)
|
29
|
(22
|
)
|
8
|
11
|
|||||||||||||
|
Balance of cash and cash equivalents as of the end of the period
|
2,300
|
1,151
|
2,300
|
1,151
|
962
|
|||||||||||||||
|
|
(1) |
For further details, see Note 7D.
|
|
|
(2) |
For further details regarding OPC Israel's entering into financing agreements with banking corporations in Israel during the reporting period and the third quarter
of 2025, see Note 7A and Note 14B1 to the Annual Financial Statements.
|
|
|
(3) |
For details regarding the partial early redemption of Debentures (Series B) in the third quarter of 2025, see Note 7A5.
|
|
|
A. |
Statement of compliance with International Financial Reporting Standards (hereinafter - “IFRS”)
|
|
|
B. |
Functional and presentation currency
|
|
|
C. |
Use of estimates and judgments
|
|
|
D. |
Seasonality
|
|
For the nine-month period ended September 30, 2025
|
||||||||||||||||||||||||
|
Israel
|
US Energy Transition Segment
|
US Renewable Energies
|
Other activities in the US
|
Adjustments to consolidated
|
Consolidated – total
|
|||||||||||||||||||
|
In NIS million
|
(Unaudited)
|
|||||||||||||||||||||||
|
Revenues from sales and provision of services
|
1,789
|
2,201
|
146
|
331
|
(2,211
|
)
|
2,256
|
|||||||||||||||||
|
EBITDA after proportionate consolidation1
|
522
|
847
|
80
|
(12
|
)
|
(934
|
)
|
503
|
||||||||||||||||
|
Adjustments:
|
||||||||||||||||||||||||
|
Share in profits of associates
|
423
|
|||||||||||||||||||||||
|
General and administrative expenses at the US headquarters (not attributed to US segments)
|
(165
|
)
|
||||||||||||||||||||||
|
General and administrative expenses at the Company’s headquarters (not attributed to the operating segments)
|
(17
|
)
|
||||||||||||||||||||||
|
Total EBITDA
|
744
|
|||||||||||||||||||||||
|
Depreciation and amortization
|
(193
|
)
|
||||||||||||||||||||||
|
Finance expenses, net
|
(163
|
)
|
||||||||||||||||||||||
|
Other revenues, net
|
19
|
|||||||||||||||||||||||
|
(337
|
)
|
|||||||||||||||||||||||
|
Profit before taxes on income
|
407
|
|||||||||||||||||||||||
|
Expenses for income tax
|
(74
|
)
|
||||||||||||||||||||||
|
Profit for the period
|
333
|
|||||||||||||||||||||||
|
For the nine-month period ended September 30, 2024
|
||||||||||||||||||||||||
|
Israel
|
US Energy Transition Segment
|
US Renewable Energies
|
Other activities in the US
|
Adjustments to consolidated
|
Consolidated – total
|
|||||||||||||||||||
|
In NIS million
|
(Unaudited)
|
|||||||||||||||||||||||
|
Revenues from sales and provision of services
|
1,835
|
1,328
|
188
|
92
|
(1,253
|
)
|
2,190
|
|||||||||||||||||
|
EBITDA after proportionate consolidation
|
541
|
447
|
84
|
(18
|
)
|
(451
|
)
|
603
|
||||||||||||||||
|
Adjustments:
|
||||||||||||||||||||||||
|
Share in profits of associates
|
150
|
|||||||||||||||||||||||
|
General and administrative expenses at the US headquarters (not attributed to US segments)
|
(61
|
)
|
||||||||||||||||||||||
|
General and administrative expenses at the Company’s headquarters (not attributed to the operating segments)
|
(13
|
)
|
||||||||||||||||||||||
|
Total EBITDA
|
679
|
|||||||||||||||||||||||
|
Depreciation and amortization
|
(257
|
)
|
||||||||||||||||||||||
|
Finance expenses, net
|
(249
|
)
|
||||||||||||||||||||||
|
Other expenses, net
|
(50
|
)
|
||||||||||||||||||||||
|
(556
|
)
|
|||||||||||||||||||||||
|
Profit before taxes on income
|
123
|
|||||||||||||||||||||||
|
Expenses for income tax
|
(49
|
)
|
||||||||||||||||||||||
|
Profit for the period
|
74
|
|||||||||||||||||||||||
|
For the three-month period ended September 30, 2025
|
||||||||||||||||||||||||
|
Israel
|
US Energy Transition Segment
|
US Renewable Energies
|
Other activities in the US
|
Adjustments to consolidated
|
Consolidated – total
|
|||||||||||||||||||
|
In NIS million
|
(Unaudited)
|
|||||||||||||||||||||||
|
Revenues from sales and provision of services
|
714
|
806
|
57
|
137
|
(819
|
)
|
895
|
|||||||||||||||||
|
EBITDA after proportionate consolidation
|
258
|
349
|
21
|
(5
|
)
|
(377
|
)
|
246
|
||||||||||||||||
|
Adjustments:
|
||||||||||||||||||||||||
|
Share in profits of associates
|
211
|
|||||||||||||||||||||||
|
General and administrative expenses at the US headquarters (not attributed to segments)
|
(94
|
)
|
||||||||||||||||||||||
|
General and administrative expenses at the Company’s headquarters (not attributed to segments)
|
(6
|
)
|
||||||||||||||||||||||
|
Total EBITDA
|
357
|
|||||||||||||||||||||||
|
Depreciation and amortization
|
(64
|
)
|
||||||||||||||||||||||
|
Finance expenses, net
|
(44
|
)
|
||||||||||||||||||||||
|
Other revenues, net
|
35
|
|||||||||||||||||||||||
|
(73
|
)
|
|||||||||||||||||||||||
|
Profit before taxes on income
|
284
|
|||||||||||||||||||||||
|
Expenses for income tax
|
(48
|
)
|
||||||||||||||||||||||
|
Profit for the period
|
236
|
|||||||||||||||||||||||
|
For the three-month period ended September 30, 2024
|
||||||||||||||||||||||||
|
Israel
|
US Energy Transition Segment
|
US Renewable Energies
|
Other activities in the US
|
Adjustments to consolidated
|
Consolidated – total
|
|||||||||||||||||||
|
In NIS million
|
(Unaudited)
|
|||||||||||||||||||||||
|
Revenues from sales and provision of services
|
761
|
448
|
49
|
45
|
(424
|
)
|
879
|
|||||||||||||||||
|
EBITDA after proportionate consolidation
|
255
|
169
|
21
|
(4
|
)
|
(170
|
)
|
271
|
||||||||||||||||
|
Adjustments:
|
||||||||||||||||||||||||
|
Share in profits of associates
|
64
|
|||||||||||||||||||||||
|
General and administrative expenses at the US headquarters (not attributed to US segments)
|
(29
|
)
|
||||||||||||||||||||||
|
General and administrative expenses at the Company’s headquarters (not attributed to the operating segments)
|
(5
|
)
|
||||||||||||||||||||||
|
Total EBITDA
|
301
|
|||||||||||||||||||||||
|
Depreciation and amortization
|
(95
|
)
|
||||||||||||||||||||||
|
Finance expenses, net
|
(100
|
)
|
||||||||||||||||||||||
|
Other revenues, net
|
2
|
|||||||||||||||||||||||
|
(193
|
)
|
|||||||||||||||||||||||
|
Profit before taxes on income
|
108
|
|||||||||||||||||||||||
|
Expenses for income tax
|
(22
|
)
|
||||||||||||||||||||||
|
Profit for the period
|
86
|
|||||||||||||||||||||||
|
For the year ended December 31, 2024
|
||||||||||||||||||||||||
|
Israel
|
US Energy Transition Segment
|
US Renewable Energies
|
Other activities in the US
|
Adjustments to consolidated
|
Consolidated – total
|
|||||||||||||||||||
|
In NIS million
|
(Audited)
|
|||||||||||||||||||||||
|
Revenues from sales and provision of services
|
2,312
|
1,796
|
228
|
145
|
(1,702
|
)
|
2,779
|
|||||||||||||||||
|
EBITDA after proportionate consolidation
|
639
|
588
|
112
|
(22
|
)
|
(608
|
)
|
709
|
||||||||||||||||
|
Adjustments:
|
||||||||||||||||||||||||
|
Share in profits of associates
|
166
|
|||||||||||||||||||||||
|
General and administrative expenses at the US headquarters (not attributed to US segments)
|
(89
|
)
|
||||||||||||||||||||||
|
General and administrative expenses at the Company’s headquarters (not attributed to the operating segments)
|
(20
|
)
|
||||||||||||||||||||||
|
Total EBITDA
|
766
|
|||||||||||||||||||||||
|
Depreciation and amortization
|
(333
|
)
|
||||||||||||||||||||||
|
Finance expenses, net
|
(301
|
)
|
||||||||||||||||||||||
|
Gain on loss of control in the US Renewable Energy Segment
|
259
|
|||||||||||||||||||||||
|
Other expenses, net
|
(56
|
)
|
||||||||||||||||||||||
|
(431
|
)
|
|||||||||||||||||||||||
|
Profit before taxes on income
|
335
|
|||||||||||||||||||||||
|
Expenses for income tax
|
(138
|
)
|
||||||||||||||||||||||
|
Profit for the year
|
197
|
|||||||||||||||||||||||
|
For the nine-month period ended September 30
|
For the three-month period ended September 30
|
For the
year ended December 31
|
||||||||||||||||||
|
2025
|
2024
|
2025
|
2024
|
2024
|
||||||||||||||||
|
In NIS million
|
(Unaudited)
|
(Unaudited)
|
(Audited)
|
|||||||||||||||||
|
Revenues from sale of electricity in Israel:
|
||||||||||||||||||||
|
Revenues from the sale of energy to private customers
|
986
|
1,121
|
427
|
516
|
1,368
|
|||||||||||||||
|
Revenues from energy sales to the system operator and other suppliers
|
158
|
146
|
54
|
50
|
165
|
|||||||||||||||
|
Revenues for capacity services
|
110
|
127
|
40
|
39
|
171
|
|||||||||||||||
|
Revenues from the sale of energy to the system operator, at cogeneration tariff
|
56
|
42
|
7
|
17
|
83
|
|||||||||||||||
|
Revenues from sale of steam in Israel
|
44
|
44
|
13
|
14
|
57
|
|||||||||||||||
|
Other revenues in Israel
|
2
|
23
|
2
|
-
|
23
|
|||||||||||||||
|
Total revenues from sale of energy and others in Israel (excluding infrastructure services)
|
1,356
|
1,503
|
543
|
636
|
1,867
|
|||||||||||||||
|
Revenues from private customers for infrastructure services
|
433
|
332
|
171
|
125
|
445
|
|||||||||||||||
|
Total revenues in Israel
|
1,789
|
1,835
|
714
|
761
|
2,312
|
|||||||||||||||
|
Revenues from sale of electricity from renewable energy (*)
|
-
|
164
|
-
|
39
|
195
|
|||||||||||||||
|
Revenues from sale of retail electricity and others
|
467
|
191
|
181
|
79
|
272
|
|||||||||||||||
|
Total revenues in the US
|
467
|
355
|
181
|
118
|
467
|
|||||||||||||||
|
Total revenues
|
2,256
|
2,190
|
895
|
879
|
2,779
|
|||||||||||||||
|
|
(*) |
For details regarding deconsolidation and transition to the equity method in the fourth quarter of 2024 with respect to the investment in CPV Renewable, see Note 23E to the Annual
Financial Statements.
|
|
|
A. |
Agreements for the acquisition of the remaining interests in the Shore power plant
|
|
|
B. |
Commencement of construction of the Basin Ranch Power Plant and material agreements
related to the project
|
|
|
B. |
Commencement of construction of the Basin Ranch Power Plant and material agreements related to the project (cont.)
|
|
|
1. |
Equity financing and provision of collateral:
|
|
|
2. |
Construction and equipment agreements:
|
| 2 |
The amount includes recognition of pre-financial closing development investments totaling approx. NIS 221 million (approx. USD 67 million). In addition, the CPV Group was credited with development fees totaling approx. NIS 93 million
(approx. USD 28 million) as part of the commitment to provide capital.
|
|
|
B. |
Commencement of construction
of the Basin Ranch Power Plant and material agreements related to the project (cont.)
|
|
|
3. |
TEF Loan Agreement (senior debt)
|
|
Loan provision date
|
As from October 2025, in a number of tranches in accordance with the percentage of completion of the project’s construction.
|
|
|
The loan amount to the Project Company (100%)
|
Approx. USD 1.1 billion (approx. NIS 3.6 billion).
|
|
|
Interest rate
|
Annual interest at a fixed rate of 3%.
|
|
|
Amortization schedule of the principal and interest
|
Final repayment date: September 30, 2045.
The loan principal will be repaid in quarterly principal payments as from March 31, 2031, at a rate equal to 0.25% per
quarter, through March 31, 2032. Thereafter, repayments of principal and interest in accordance with an amortization schedule in a mortgage format (hereinafter - "Spitzer”).
Interest payments will be paid every quarter, including during the construction period.
|
|
|
Pledges
|
A first degree, senior, fixed and secured pledge on the project, its assets and the rights arising therefrom.
|
|
|
Default financial covenants
|
•
|
A historical 12-month debt service coverage ratio (DSCR) of 1.10x, which shall be measured on a quarterly basis starting one year after the commercial operation date (COD), as defined in the loan agreement. |
| • | Expected 5-year contracted DSCR of 1.20x on COD; the contracts for compliance with this ratio should be renewed or replaced two years before their termination, on a rolling basis. The project entered into hedging arrangements3 for a substantial portion of the project's capacity, which comply with this requirement. | |
| • | Performance-based project covenants for the past 12 months, which will be measured monthly as from the date on which full 12 calendar months will elapse after COD. The covenants set minimum uptime of 85% and maximum downtime of 15%, which may be remediated by presenting a remedial action plan and a reserve to finance the plan for the next 12 months. | |
|
Other key conditions (including certain collateral)
|
• | Distributions are subject to generally accepted definitions and conditions and to the following: (a) Compliance with contracted DSCR of 1.20x over 4 consecutive quarters, or a DSCR of 1.35x based on the total cash flow; and (b) a performance test (downtime/uptime) for the past 12 months, which includes certain conditions, which allow distribution even if the criteria are not met. |
| • |
Additional undertakings of the project interest holders (100%) totaling approx. NIS 631 million (approx.
USD 191 million) (the CPV Group’s share, as of the report approval date is approx. NIS 446 million (approx. USD 135 million)). These undertakings include collateral in the form of letters of credit (LCs) or other generally acceptable
collateral (such as cash) to secure certain matters pertaining to key agreements and the cost of the project, and to secure completion of construction (which can be forfeited after exhausting a budget contingency); and to secure the
project’s connection to the grid within 4 years, subject to an extension option (with the collateral released in accordance with the abovementioned date).
For further details regarding the balance of the guarantees provided by the Group in favor of the project as of
the report date and the report approval date, see Note 7A3.
|
|
| • | Additional project-level undertakings pertaining to collateral include, among other things, cash reserves or letters of credit on COD to secure expected DSR and operating expenses. | |
| • | Other undertakings and default and repayment events include, among other things, events that are deemed “change of control” including circumstances where CPV Power Holdings, LP (a wholly owned subsidiary partnership of the CPV Group) no longer holds and controls at least 50% of the Borrower, and circumstances where the CPV Group no longer holds or controls at least 50% of CPV Power Holdings, LP (as applicable in accordance with the relevant provisions), and generally accepted immediate repayment grounds such as non-payment, failure to comply with certain undertakings, breach of representations, undertakings and covenants, default events, regulatory and legal proceedings – all in accordance with the conditions and the remediation periods (as applicable) set in the loan agreement. | |
|
|
B. |
Commencement of construction
of the Basin Ranch Power Plant and material agreements related to the project (cont.)
|
|
|
4. |
Agreement to acquire the remaining ownership rights in the project
|
|
|
• |
At the Financial Closing Date of the TEF Loan (October 28, 2025), a total of approx. NIS 195 million (approx. USD 59 million) was paid for the seller's
investments prior to the financial closing, plus an estimate of additional investments made by the seller until the completion date of the Acquisition Transaction;6
|
|
|
• |
At the completion date of the Acquisition Agreement, a total of approx. NIS 558 million (approx. USD 169 million) will be provided by way of cash and/or letters
of credit (LCs) in respect of the equity required in connection with the TEF Loan. Moreover, additional collateral will be provided by way of letters of credit (LCs) required to secure shareholders' liabilities related to the project in
the amount of approx. NIS 208 million (approx. USD 63 million7). It is noted that the said letters of credit shall be provided out of the Company's facilities and/or facilities guaranteed by the Company. For details regarding
increasing guarantee facilities subsequent to the report date, see Note 7A3 below.
|
|
|
• |
During the Project’s construction period, from 2025 to 2029 - the seller will be paid an additional consideration amount of approx. NIS 265 million (approx.
USD 80 million), in four equal annual installments.
|
| 4 |
It is noted that if the transaction is not completed by this date, the agreement will be terminated in accordance with the termination arrangements set in the
Acquisition Agreement.
|
| 5 |
Under the Acquisition Agreement, the CPV Group serves as the guarantor for future payments payable to the seller subsequent to the completion of the
transaction. Furthermore, the seller is entitled to their share in the balance of future development fees in respect of the Project totaling approx. NIS 59 million (approx. USD 18 million), which are expected to be paid on the
Project’s commercial operation date.
|
| 6 |
At the Transaction Completion Date, if any, a calculation will be made regarding differences, if any, between the said estimate and the actual investments.
|
| 7 |
Of which a total of approx. US 6 million was provided as of the report approval date.
|
|
|
A. |
Significant events during and subsequent to the Reporting Period
|
|
|
1. |
Banking financing agreements in OPC Israel
|
|
|
2. |
Financing agreement with Bank Leumi in the CPV Group
|
|
|
A. |
Significant events during and subsequent to the Reporting Period (cont.)
|
|
|
2. |
Financing agreement with Bank Leumi in the CPV Group (cont.)
|
|
Borrower
|
CPV Group
|
|
|
Loan amount (principal)
|
USD 300 million (approx. NIS 1 billion).
|
|
|
Loan withdrawal dates
|
First payment of approx. NIS 460 million (USD 150 million) on the signing date, and a second payment of approx. NIS 460 million (USD 150 million) - no later than December 31, 2026,
concurrently with the expiry of the letter of credit (LC) issued on the signing date.
|
|
|
Interest rate (annual)
|
Long-term loan: Interest based on SOFR plus a 2.8% to 3.4% spread.
Financial guarantee fee (through the abovementioned letter of credit): 1.3% to 2%.
|
|
|
Repayment dates principal and interest
|
The interest on the loan principal shall be payable each quarter starting on March 31, 2027, with the interest accrued until
the first payment date is added to the loan principal;
The loan principal (including said accrued interest) is payable by March 31, 2027 in accordance with the amortization
schedule, as follows:
2027-2029: 5% per annum
2030-2031: 25% per annum
2032: %35.
Notwithstanding the foregoing, if the commercial operation of the Project commences during 2029, an adjustment will be made to
the principal payment rates (an increase from 1.25% per quarter to 6.25% per quarter) as of the first quarter after the commercial operation date, all such that the entire loan is repaid no later than December 31, 2032.
|
|
|
Default financial covenants
|
Financial covenants applicable to Borrower:
|
|
| • |
Total equity attributable to the shareholders of the CPV Group: More than USD 750 million;
|
|
| • |
Adjusted net debt to adjusted EBITDA ratio of the CPV Group is less than 7.0.
|
|
|
The financial covenants will be examined each quarter and will be subject to the terms and provisions (as well as to
agreed-upon remediation periods) and testing mechanisms as shall be set forth in the Financing Agreement.
As of the report date, the calculation of compliance with the covenants is as follows: (1) Equity - USD 1.6 billion;
(2) Adjusted net debt to adjusted EBITDA ratio - 3.4x.
|
||
|
Collateral
|
Subject to the relevant statutory provisions and the terms of the project’s financing agreements (including the TEF Loan
described in Note 6B), the Lender will be entitled to a lien on the account to which the dividends from the project companies are paid directly to the Borrower, all as stipulated in the Financing Agreement;
Furthermore, the Borrower undertook to have in place a negative pledge, except under the following circumstances:
(a) Existing and future limited resource project financing or the provision of liens under the financing of the portfolio assets of the Borrower and/or its subsidiaries and/or associates; (b) other existing and future permitted liens,
in the ordinary course of business, all as stipulated under the Financing Agreement.
|
|
|
|
A. |
Significant events during and subsequent to the reporting period (cont.)
|
|
|
2. |
Financing Agreement with Bank Leumi in the CPV Group (cont.)
|
|
Additional material terms and conditions
|
Additional terms, undertakings and grounds for repayment (if applicable), include (as the case may be) certain restrictions on the Borrower and/or its subsidiaries and/or associates, with
respect to:
(a) Undertaking debt as stipulated in the Financing Agreement, except for the undertaking of a permitted debt (as defined in the Financing Agreement and under pre-determined conditions as
to the Borrower’s level of leveraging and liquidity) with respect to the areas of activity of the Borrower and/or its subsidiaries and/or associates (such as undertaking non-recourse project financing for a new project and/or the
refinancing a debt of an existing project or the financing of a portfolio of existing/ new projects through non-recourse financing, the Borrower’s undertaking corporate debts under the conditions stipulated in the Financing Agreement,
undertaking and/or extending certain credit facilities, etc.);
(b) Restrictions on the sale of assets, except for assets, which meet the pre-determined conditions set in the financing agreement as to the Borrower’s level of leveraging and liquidity
or assets, or assets which are immaterial to the business activities of the Borrower and/or its subsidiaries and/or associates;
(c) Restrictions on investments outside the normal business activities originating from the Borrower’s free cash flow, where (i) the net debt to EBITDA ratio covenant (as detailed above)
exceeds the value stipulated in the Financing Agreement; or (ii) the occurrence of certain default events in the project and/or other ongoing default events in the project, which were not remediated within the remediation periods
stipulated in the Financing Agreement;
(d) Other undertakings, default events and grounds for repayment as is generally accepted in agreements of this
type, including: Restrictions on change of control in the Borrower (including the Company and its controlling shareholders); restrictions on changes to the Borrower’s area of activity; cross acceleration as defined in the Financing
Agreement; non-payment; default events; legal or regulatory proceedings/matters as defined in the Financing Agreement; breach of covenants and undertakings (subject to remediation periods); cross-default for certain events pertaining to
the project (including material adverse effect events as defined in the Financing Agreement, breach of an undertaking to repay a TEF Loan or its acceleration, bankruptcy and abandonment event); non-payment of a debt of the Borrower or
the project above a certain threshold, all in accordance with the definitions, remediation periods and other conditions set in the Financing Agreement.
|
|
|
Payments
to the Borrower’s shareholders |
As from March 31, 2027, dividend distributions and repayment of shareholder loans8 are subject to the following financial covenants (as defined above):
|
|
| • |
Total equity attributable to the shareholders of the CPV Group: More than USD 1 billion;
|
|
| • |
Adjusted net debt to adjusted EBITDA ratio of the CPV Group is less than 4.0 up to 12 months subsequent to the
project's commercial operation date (COD) and less than 5.0 thereafter.
|
|
| Furthermore, under certain adverse circumstances defined in the Financing Agreement, such payments and additional payments to shareholders (such as management fees) will not be permitted even if the abovementioned financial covenants are met. | ||
|
Fees
|
Provisions have been set regarding fees, including upfront-fees and non-utilization fees, as is generally accepted
in financing agreements, as well as early repayment fees. It is clarified that the loan’s early repayment fees (except with respect to financial damage, if incurred) were set at declining levels over the loan term, such that after a set
number of years no early repayment fees will apply.
|
|
|
|
A. |
Significant events during and subsequent to the reporting period (cont.)
|
|
|
3. |
Short-term credit facilities:
|
|
Facility amount
|
Utilization as of the report date (2)
|
Utilization immediately prior to the report approval date (1) (2)
|
||||||||||
|
Company
|
300
|
-
|
-
|
|||||||||
|
OPC Israel
|
300
|
2
|
2
|
|||||||||
|
The Company for the CPV Group (3)
|
Approx. 314 (USD 95 million)(4)
|
72
|
210
|
|||||||||
|
CPV Group(3)
|
Approx. 380 (USD 115 million) (4)
|
100
|
365
|
|||||||||
|
Total
|
1,294
|
174
|
577
|
|||||||||
|
|
(1) |
As of November 14, 2025. The increase in utilization of letters of credit and bank guarantees immediately prior to the report approval date arises mainly from the provision of bank guarantees with respect to the financial closing of the
TEF Loan as detailed in Note 6B.
|
|
|
(2) |
Mostly for the purpose of letters of credit and bank guarantees.
|
|
|
(3) |
The facilities provided to the CPV Group or for the CPV Group, which are detailed in the above table, are backed with a Company guarantee.
|
|
|
(4) |
It is noted that, subsequent to the report date, the Company's facility for the CPV Group increased to approx. NIS 545 million (approx. USD 165 million) and that of
the CPV Group increased to approx. NIS 562 million (approx. USD 170 million), mainly for financing part of the transaction to acquire the interests of the remaining partner in the Basin Ranch project, as detailed in Note 6B4 above.
|
|
|
4. |
In May 2025, Midroog assigned an initial rating of A1.il with a stable outlook for the Company and its
debentures. In addition, in May 2025, Ma’alot S&P upgraded the Company's credit rating to ilA with a stable outlook and the rating of its debentures to ilA+, following an improvement in business profile and financial ratios.
|
|
|
5. |
On September 30, 2025, the Company repaid, by way of partial early redemption, approx. NIS 256 million par value
in Debentures (Series B) in addition to the fixed payment in accordance with the amortization schedule of Debentures (Series B) as of that date. The total amount redeemed with respect to the partial early redemption, including linkage,
is approx. NIS 302 million.
|
|
|
B. |
Changes in the Group’s material guarantees:
|
|
As of September 30, 2025
|
As of December 31, 2024
|
|||||||
|
NIS million
|
NIS million
|
|||||||
|
In respect of operating projects in Israel (Rotem, Hadera, Zomet and Gat) (1)
|
164
|
249
|
||||||
|
For projects under construction and development in Israel (Sorek 2 and consumers’ premises)
|
73
|
74
|
||||||
|
In respect of the filing of a bid in the Sorek tender (2)
|
50
|
100
|
||||||
|
In respect of virtual supply activity in Israel (3)
|
88
|
21
|
||||||
|
In respect of projects under construction and development in the US (CPV Group)*
|
265
|
339
|
||||||
|
For the Basin Ranch Project* (4)
|
41
|
-
|
||||||
|
In respect of operating projects in the US Renewable Energies and Other Segment*
|
37
|
22
|
||||||
|
Total
|
718
|
805
|
||||||
|
|
(1) |
The decrease arises mainly from the release of a bank guarantee provided by OPC Israel for Zomet in favor of ILA
totaling NIS 67 million (for further details, see Note 10B5 to the Annual Financial Statements).
|
|
|
(2) |
The decrease arises from a decrease in bank guarantee provided by OPC Israel in connection with the Sorek tender, as described in Note 14C3 to the Annual Financial
Statements.
|
|
|
(3) |
The increase stems from an increase of the bank guarantee provided in favor of the system operator in respect of the virtual supply activity due to seasonality.
|
|
|
(4) |
Immediately prior to the report approval date, the balance of the guarantees stands at approx. NIS 559 million (approx. USD 169 million), which arises mainly from
the provision of bank guarantees with respect to the financial closing of the TEF Loan as described in Note 6B.
|
|
|
C. |
Financial covenants:
|
|
Ratio
|
Required value – Series B
|
Required value – Series C and D
|
Actual value
|
|||
|
Net financial debt (1) to adjusted EBITDA (2)
|
Will not exceed 13 (for distribution purposes – 11)
|
Will not exceed 13 (for distribution purposes – 11)
|
3.3
|
|||
|
The Company shareholders’ equity (“separate”)
|
Will not fall below NIS 250 million (for distribution purposes – NIS 350 million)
|
With respect to Debentures (Series C): will not fall below NIS 1 billion (for distribution purposes – NIS 1.4 billion)
With respect to Debentures (Series D): will not fall below NIS 2 billion (for distribution purposes – NIS 2.4 billion)
|
Approx. NIS 6,274 million
|
|||
|
The Company’s equity to asset ratio (“separate”)
|
Will not fall below 17% (for distribution purposes: 27%)
|
Will not fall below 20% (for distribution
purposes: 30%)
|
82%
|
|||
|
The Company’s equity to asset ratio (“consolidated”)
|
--
|
Will not fall below 17%
|
58%
|
|
|
C. |
Financial covenants: (cont.)
|
|
Financial covenants
|
Breach ratio
|
Actual value
|
||
|
Covenants applicable to OPC Israel with respect to the corporate financing agreements9
|
||||
|
OPC Israel’s equity capital
|
Will not fall below NIS 1,100 million
|
Approx. NIS 2,216 million
|
||
|
OPC Israel’s equity to asset ratio
|
Will not fall below 20%
|
38%
|
||
|
OPC Israel’s ratio of net debt to EBITDA
|
Will not exceed 8
|
3.8
|
||
|
Covenants applicable to Hadera in connection with the Hadera Financing Agreement
|
||||
|
Minimum expected DSCR
|
1.10
|
1.13
|
||
|
Average expected DSCR
|
1.10
|
1.67
|
||
|
LLCR
|
1.10
|
1.57
|
||
|
Covenants applicable to the Company in connection with binding credit facilities with Israeli banking corporations10
|
||||
|
The Company shareholders’ equity (“separate”)
|
Will not fall below NIS 1,200 million
|
Approx. NIS 6,274 million
|
||
|
The Company’s equity to asset ratio (“separate”)
|
Will not fall below 30%
|
82%
|
||
|
The Company’s net debt to EBITDA ratio
|
Will not exceed 12
|
3.3
|
||
|
|
D. |
Capital raising
|
|
|
1. |
In June 2025, the Company issued to the public 21,303,200 ordinary shares of NIS 0.01 par value each, of which a total of 7,923,600 ordinary shares were issued to the Parent Company. The gross proceeds of the issuance totaled NIS 850
million and the issuance expenses totaled approx. NIS 23 million.
|
|
|
2. |
In August 2025, the Company issued to qualified investors 18,750,000 ordinary shares of NIS 0.01 par value each. The gross proceeds of the issuance totaled NIS 900 million and the issuance expenses totaled approx. NIS 6 million.
|
|
|
E. |
Shelf prospectus
|
|
|
F. |
Equity compensation plans
|
|
|
1. |
Allocations of offered securities in the Reporting Period and thereafter:
|
|
Offerees and
allotment date |
No. of options at the grant date (in thousands)
|
Average fair value of each option at the grant date (in NIS)
|
Exercise price per option
(in NIS, unlinked) |
Standard deviation (1)
|
Risk-free interest rate (2)
|
Cost of benefit
(in NIS million) (3)
|
|||||||||||||||
|
Executives, March 2025
|
441
|
11.80
|
31.98
|
30.4%-34.5
|
%
|
4.09%-4.15
|
%
|
Approx. 5.0
|
|||||||||||||
|
CEO, July 2025 (4)
|
646
|
19.84
|
43.39
|
31.2%-31.8
|
%
|
3.93%-3.94
|
%
|
Approx. 12.8
|
|||||||||||||
|
|
(1) |
The standard deviation is calculated based on historical volatility of the Company’s share over the expected life of the option until exercise date.
|
|
|
(2) |
The rate of the risk-free interest is based on the Fair Spread database and an expected life of 4 to 6 years.
|
|
|
(3) |
This amount will be recorded in profit and loss over the vesting period of each tranche.
|
|
|
(4) |
The fair value of the options in the above table was calculated immediately prior to the date of the general meeting’s approval – August 26, 2025.
|
|
|
F. |
Equity compensation plans (cont.)
|
|
|
2. |
Exercise of options and issuance of shares:
|
|
|
3. |
Expiry of options during the Reporting Period
|
|
|
G. |
Profit sharing compensation plan for CPV Group employees
|
|
|
A. |
Commitments (Including with Related and Interested Parties)
|
|
|
B. |
Claims and other liabilities
|
|
|
A. |
Financial instruments measured at fair value for disclosure purposes only
|
|
As of September 30, 2025
|
||||||||
|
Carrying value (*)
|
Fair value
|
|||||||
|
In NIS million
|
(Unaudited)
|
(Unaudited)
|
||||||
|
Loans from banking corporations and financial institutions (Level 2)
|
2,686
|
2,700
|
||||||
|
Loans from non‑controlling interests (Level 2)
|
443
|
448
|
||||||
|
Debentures (Level 1)
|
1,385
|
1,353
|
||||||
|
4,514
|
4,501
|
|||||||
|
As of September 30, 2024
|
||||||||
|
Carrying value (*)
|
Fair value
|
|||||||
|
In NIS million
|
(Unaudited)
|
(Unaudited)
|
||||||
|
Loans from banking corporations and financial institutions (Level 2)
|
3,103
|
3,091
|
||||||
|
Loans from non‑controlling interests (Level 2)
|
478
|
488
|
||||||
|
Debentures (Level 1)
|
1,878
|
1,784
|
||||||
|
5,459
|
5,363
|
|||||||
|
As of December 31, 2024
|
||||||||
|
Carrying value (*)
|
Fair value
|
|||||||
|
In NIS million
|
(Audited)
|
(Audited)
|
||||||
|
Loans from banking corporations and financial institutions (Level 2)
|
2,234
|
2,237
|
||||||
|
Loans from non‑controlling interests (Level 2)
|
514
|
508
|
||||||
|
Debentures (Level 1)
|
1,891
|
1,805
|
||||||
|
4,639
|
4,550
|
|||||||
|
|
B. |
Fair value hierarchy of financial instruments measured at fair value
|
|
As of September 30
|
As of December 31
|
|||||||||||
|
2025
|
2024
|
2024
|
||||||||||
|
In NIS million
|
(Unaudited)
|
(Audited)
|
||||||||||
|
Financial assets
|
||||||||||||
|
Derivatives used for hedge accounting
|
||||||||||||
|
CPI swap contracts (Level 2)
|
43
|
46
|
(*) 44
|
|
||||||||
|
Interest rate swaps (SOFR) (Level 2) (1)
|
-
|
14
|
-
|
|||||||||
|
Total
|
43
|
60
|
44
|
|||||||||
|
Financial liabilities
|
||||||||||||
|
Derivatives used for hedge accounting
|
||||||||||||
|
CPI swap contracts (Level 2)
|
-
|
(1
|
)
|
(*) (1
|
)
|
|||||||
|
Interest rate swaps (SOFR) (Level 2) (1)
|
-
|
(12
|
)
|
-
|
||||||||
|
Electricity price hedge contracts (the US renewable energy segment) (Level 3) (1)
|
-
|
(30
|
)
|
-
|
||||||||
|
Total
|
-
|
(43
|
)
|
(1
|
)
|
|||||||
|
|
(1) |
The balances as of September 30, 2024 are in respect of CPV Renewable. For details regarding deconsolidation and transition to the equity method in the fourth quarter of 2024 with respect to the investment in CPV Renewable, see Note 23E
to the Annual Financial Statements.
|
|
|
A. |
General
|
|
|
1. |
Further to Note 1 to the Annual Financial Statements, in June 2025, there was a further escalation of the geopolitical situation, with the outbreak of a large-scale military conflict between Israel and Iran (hereinafter – “Operation Rising Lion"), which included missile attacks by Iran, the closure of Israeli airspace, a general state of emergency in the Israeli home front and a substantial escalation in the regional arena.
On June 24, 2025, a ceasefire with Iran was declared, which is in place as of the report approval date. Furthermore, during October 2025, a ceasefire was declared in the Gaza front between the State of Israel and the terrorist organization
Hamas, which led to a significant decrease in the intensity of fighting and in the scope of attacks against Israel by the terrorist organizations in Yemen. However, the situation in Israel continues to be characterized by substantial
geopolitical uncertainty.
|
|
|
2. |
In the nine‑month periods ended September 30, 2025 and 2024 the Group purchased property, plant and equipment for a total of approx. NIS 206 million and approx. NIS 982 million, respectively. Furthermore, these amounts include non-cash
purchases totaling approx. NIS 17 million and approx. NIS 38 million during these periods, respectively.
|
|
|
3. |
For further details regarding agreements to acquire additional rights in associates in the Reporting Period and thereafter, and financial closing and commencement of construction of the Basin Ranch Project subsequent to the report date
and disclosure of material agreements in the project, see Note 6.
|
|
|
4. |
For further details regarding developments in credit from banking corporations and others, debentures, credit ratings of the Company and its debentures, guarantees and equity in the Reporting Period and thereafter, see Note 7.
|
|
|
5. |
For further details regarding developments in commitments (including with related parties and interested parties), claims and other commitments during the Reporting Period and thereafter, see Note 8.
|
|
|
B. |
OPC Israel
|
|
|
C. |
CPV Group
|
|
|
1. |
Further to Note 23E to the Annual Financial Statements regarding the investment agreement in the US Renewable Energy
Segment, a further total of approx. NIS 330 million (approx. USD 100 million) was invested in the reporting period by the Investor.
|
|
|
2. |
Further to Note 23A3 to the Annual Financial Statements, following is information regarding investment undertakings and provision of loans by OPC Power’s partners (in USD million):
|
|
Immediately prior to the report approval date
|
As of September 30, 2025
|
As of December 31, 2024
|
||||||||||
|
Total investment undertakings and loan provision (a)
|
1,535
|
1,535
|
1,535
|
|||||||||
|
Utilization (b)
|
(1,535
|
)
|
(1,510
|
)
|
(1,455
|
)
|
||||||
|
Balance of investment undertakings and loan provision
|
-
|
25
|
80
|
|||||||||
|
|
A. |
Excluding an additional investment commitment for backing guarantees which were or will be provided for the purpose
of development and expansion of projects – each partner based on its pro rata share in the partnership, for a total of approx. NIS 248 million (approx. USD 75 million).
|
|
|
B. |
In the Reporting Period, the Company and non-controlling interests (both directly and indirectly) made equity investments in the Partnership and advanced loans totaling approx. USD 42 million (approx. NIS 146 million) and approx. USD 13
million (approx. NIS 48 million), respectively. Subsequent to the report date, in October 2025, equity investments in the Partnership were made and additional loans were advanced totaling approx. USD 19 million (approx. NIS 63 million) and
approx. USD 6 million (approx. NIS 20 million), respectively.
|
|
|
3. |
Dividends and capital distributions from associates
|
| 11 |
Non-recourse project financing, as accepted in agreements of this type.
|
|
As of September 30, 2025
|
||||||||||||||
|
US GAAP
|
Adjustments
|
IFRS
|
||||||||||||
|
In USD thousand
|
In USD thousand
|
In USD thousand
|
||||||||||||
|
Cash and cash equivalents
|
D
|
199
|
1,067
|
1,266
|
||||||||||
|
Restricted cash
|
D
|
12,628
|
(1,067
|
)
|
11,561
|
|||||||||
|
Property, plant & equipment
|
A,C
|
779,191
|
58,134
|
837,325
|
||||||||||
|
Intangible assets
|
C
|
25,231
|
(25,231
|
)
|
-
|
|||||||||
|
Other assets
|
31,436
|
-
|
31,436
|
|||||||||||
|
Total assets
|
848,685
|
32,903
|
881,588
|
|||||||||||
|
Accounts payable and deferred expenses
|
A
|
12,432
|
(6,802
|
)
|
5,630
|
|||||||||
|
Other liabilities
|
F
|
495,174
|
(7,614
|
)
|
487,560
|
|||||||||
|
Total liabilities
|
507,606
|
(14,416
|
)
|
493,190
|
||||||||||
|
Partners’ equity
|
A
|
341,079
|
47,319
|
388,398
|
||||||||||
|
Total liabilities and equity
|
848,685
|
32,903
|
881,588
|
|||||||||||
|
As of September 30, 2024
|
||||||||||||||
|
US GAAP
|
Adjustments
|
IFRS
|
||||||||||||
|
In USD thousand
|
In USD thousand
|
In USD thousand
|
||||||||||||
|
Cash and cash equivalents
|
D
|
85
|
1,560
|
1,645
|
||||||||||
|
Restricted cash
|
D
|
19,612
|
(1,560
|
)
|
18,052
|
|||||||||
|
Property, plant & equipment
|
A,C
|
800,887
|
52,723
|
853,610
|
||||||||||
|
Intangible assets
|
C
|
26,101
|
(26,101
|
)
|
-
|
|||||||||
|
Other assets
|
25,860
|
-
|
25,860
|
|||||||||||
|
Total assets
|
872,545
|
26,622
|
899,167
|
|||||||||||
|
Accounts payable and deferred expenses
|
A
|
17,577
|
(10,905
|
)
|
6,672
|
|||||||||
|
Other liabilities
|
550,137
|
-
|
550,137
|
|||||||||||
|
Total liabilities
|
567,714
|
(10,905
|
)
|
556,809
|
||||||||||
|
Partners’ equity
|
A
|
304,831
|
37,527
|
342,358
|
||||||||||
|
Total liabilities and equity
|
872,545
|
26,622
|
899,167
|
|||||||||||
|
As of December 31, 2024
|
||||||||||||||
|
US GAAP
|
Adjustments
|
IFRS
|
||||||||||||
|
In USD thousand
|
In USD thousand
|
In USD thousand
|
||||||||||||
|
Cash and cash equivalents
|
D
|
43
|
444
|
487
|
||||||||||
|
Restricted cash
|
D
|
4,793
|
(444
|
)
|
4,349
|
|||||||||
|
Property, plant & equipment
|
A, C
|
797,304
|
57,331
|
854,635
|
||||||||||
|
Intangible assets
|
C
|
25,883
|
(25,883
|
)
|
-
|
|||||||||
|
Other assets
|
36,526
|
-
|
36,526
|
|||||||||||
|
Total assets
|
864,549
|
31,448
|
895,997
|
|||||||||||
|
Accounts payable and deferred expenses
|
A
|
13,820
|
(6,360
|
)
|
7,460
|
|||||||||
|
Other liabilities
|
530,317
|
-
|
530,317
|
|||||||||||
|
Total liabilities
|
544,137
|
(6,360
|
)
|
537,777
|
||||||||||
|
Partners’ equity
|
A
|
320,412
|
37,808
|
358,220
|
||||||||||
|
Total liabilities and equity
|
864,549
|
31,448
|
895,997
|
|||||||||||
|
For the nine-month period ended September 30, 2025
|
||||||||||||||||||
|
US GAAP
|
IFRS adjustments
|
Adjustments to the Group’s accounting policies*
|
IFRS – according to the Group’s accounting policies
|
|||||||||||||||
|
In USD thousand
|
In USD thousand
|
In USD thousand
|
In USD thousand
|
|||||||||||||||
|
Revenues
|
B
|
305,412
|
(267
|
)
|
1,214
|
306,359
|
||||||||||||
|
Operating expenses
|
A
|
142,979
|
(7,194
|
)
|
1,214
|
136,999
|
||||||||||||
|
Depreciation and amortization
|
A
|
20,838
|
5,296
|
-
|
26,134
|
|||||||||||||
|
Operating profit
|
141,595
|
1,631
|
-
|
143,226
|
||||||||||||||
|
Finance expenses
|
B,F
|
28,376
|
(9,101
|
)
|
-
|
19,275
|
||||||||||||
|
Profit for the period
|
113,219
|
10,732
|
-
|
123,951
|
||||||||||||||
|
Other comprehensive loss
|
B
|
(20,052
|
)
|
(1,220
|
)
|
-
|
(21,272
|
)
|
||||||||||
|
Comprehensive income for the period
|
93,167
|
9,512
|
-
|
102,679
|
||||||||||||||
|
For the nine-month period ended September 30, 2024
|
||||||||||||||||||||
|
US GAAP
|
IFRS adjustments
|
Adjustments to the Group’s accounting policies*
|
IFRS – according to the Group’s accounting policies
|
|||||||||||||||||
|
In USD thousand
|
In USD thousand
|
In USD thousand
|
In USD thousand
|
|||||||||||||||||
|
Revenues
|
B |
|
212,728
|
(1,384
|
)
|
17,247
|
228,591
|
|||||||||||||
|
Operating expenses
|
A |
|
93,943
|
(6,602
|
)
|
17,247
|
104,588
|
|||||||||||||
|
Depreciation and amortization
|
A |
|
20,591
|
5,296
|
-
|
25,887
|
||||||||||||||
|
|
||||||||||||||||||||
|
Operating profit
|
|
98,194
|
(78
|
)
|
-
|
98,116
|
||||||||||||||
|
|
||||||||||||||||||||
|
Finance expenses
|
B |
|
16,732
|
(4,325
|
)
|
-
|
12,407
|
|||||||||||||
|
|
||||||||||||||||||||
|
Profit for the period
|
|
81,462
|
4,247
|
-
|
85,709
|
|||||||||||||||
|
|
||||||||||||||||||||
|
Other comprehensive income (loss)
|
B |
|
2,442
|
(2,778
|
)
|
-
|
(336
|
)
|
||||||||||||
|
Comprehensive income for the period
|
83,904
|
1,469
|
-
|
85,373
|
||||||||||||||||
|
For the three-month period ended September 30, 2025
|
||||||||||||||||||
|
US GAAP
|
IFRS adjustments
|
Adjustments to the Group’s accounting policies*
|
IFRS – according to the Group’s accounting policies
|
|||||||||||||||
|
In USD thousand
|
In USD thousand
|
In USD thousand
|
In USD thousand
|
|||||||||||||||
|
Revenues
|
B |
105,597
|
878
|
5,265
|
111,740
|
|||||||||||||
|
Operating expenses
|
A |
39,399
|
(2,482
|
)
|
5,265
|
42,182
|
||||||||||||
|
Depreciation and amortization
|
A |
6,944
|
1,765
|
-
|
8,709
|
|||||||||||||
|
Operating profit
|
59,254
|
1,595
|
-
|
60,849
|
||||||||||||||
|
Finance expenses
|
B, F |
9,290
|
464
|
-
|
9,754
|
|||||||||||||
|
Profit for the period
|
49,964
|
1,131
|
-
|
51,095
|
||||||||||||||
|
Other comprehensive loss
|
B |
(410
|
)
|
(878
|
)
|
-
|
(1,288
|
)
|
||||||||||
|
Comprehensive income for the period
|
49,554
|
253
|
-
|
49,807
|
||||||||||||||
|
For the three-month period ended September 30, 2024
|
||||||||||||||||||
|
US GAAP
|
IFRS adjustments
|
Adjustments to the Group’s accounting policies*
|
IFRS – according to the Group’s accounting policies
|
|||||||||||||||
|
In USD thousand
|
In USD thousand
|
In USD thousand
|
In USD thousand
|
|||||||||||||||
|
Revenues
|
B |
69,113
|
(2
|
)
|
7,406
|
76,517
|
||||||||||||
|
Operating expenses
|
A |
28,859
|
(2,161
|
)
|
7,406
|
34,104
|
||||||||||||
|
Depreciation and amortization
|
A |
6,867
|
1,765
|
-
|
8,632
|
|||||||||||||
|
Operating profit
|
33,387
|
394
|
-
|
33,781
|
||||||||||||||
|
Finance expenses
|
B,F
|
9,018
|
(871
|
)
|
-
|
8,147
|
||||||||||||
|
Profit for the period
|
24,369
|
1,265
|
-
|
25,634
|
||||||||||||||
|
Other comprehensive income
|
B |
4,480
|
(846
|
)
|
-
|
3,634
|
||||||||||||
|
Comprehensive income for the period
|
28,849
|
419
|
-
|
29,268
|
||||||||||||||
|
For the year ended December 31, 2024
|
||||||||||||||||||
|
US GAAP
|
IFRS adjustments
|
Adjustments to the Group’s accounting policies*
|
IFRS – according to the Group’s accounting policies
|
|||||||||||||||
|
In USD thousand
|
In USD thousand
|
In USD thousand
|
In USD thousand
|
|||||||||||||||
|
|
||||||||||||||||||
|
Revenues
|
B |
275,102
|
(2,854
|
)
|
27,083
|
299,331
|
||||||||||||
|
Operating expenses
|
A |
121,590
|
(8,648
|
)
|
27,083
|
140,025
|
||||||||||||
|
Depreciation and amortization
|
A |
27,485
|
7,062
|
-
|
34,547
|
|||||||||||||
|
|
||||||||||||||||||
|
Operating profit
|
|
126,027
|
(1,268
|
)
|
-
|
124,759
|
||||||||||||
|
|
||||||||||||||||||
|
Finance expenses
|
B |
27,325
|
(5,185
|
)
|
-
|
22,140
|
||||||||||||
|
|
||||||||||||||||||
|
Profit for the year
|
|
98,702
|
3,917
|
-
|
102,619
|
|||||||||||||
|
|
||||||||||||||||||
|
Other comprehensive income
|
B |
9,533
|
(1,911
|
)
|
-
|
7,622
|
||||||||||||
|
|
||||||||||||||||||
|
Comprehensive income for the year
|
|
108,235
|
2,006
|
-
|
110,241
|
|||||||||||||
|
For the nine-month period ended September 30, 2025
|
||||||||||||||
|
US GAAP
|
Adjustments
|
IFRS
|
||||||||||||
|
In USD thousand
|
In USD thousand
|
In USD thousand
|
||||||||||||
|
Profit for the period
|
A,B
|
113,219
|
10,732
|
123,951
|
||||||||||
|
Net cash provided by operating activities
|
129,183
|
-
|
129,183
|
|||||||||||
|
Net cash used for investing activities
|
D |
(2,072
|
)
|
(7,213
|
)
|
(9,285
|
)
|
|||||||
|
Net cash used for financing activities
|
(119,120
|
)
|
-
|
(119,120
|
)
|
|||||||||
|
Net increase in cash and cash equivalents
|
7,991
|
(7,213
|
)
|
778
|
||||||||||
|
Balance of cash and cash equivalents as of the beginning of the period
|
D |
43
|
444
|
487
|
||||||||||
|
Restricted cash balance as of the beginning of the period
|
D |
4,793
|
(4,793
|
)
|
-
|
|||||||||
|
Balance of cash and cash equivalents as of the end of the period
|
D |
199
|
1,066
|
1,265
|
||||||||||
|
Restricted cash balance as of the end of the period
|
D |
12,628
|
(12,628
|
)
|
-
|
|||||||||
|
For the nine-month period ended September 30, 2024
|
||||||||||||||
|
US GAAP
|
Adjustments
|
IFRS
|
||||||||||||
|
In USD thousand
|
In USD thousand
|
In USD thousand
|
||||||||||||
|
Profit for the period
|
A,B
|
81,462
|
4,247
|
85,709
|
||||||||||
|
Net cash provided by operating activities
|
101,096
|
-
|
101,096
|
|||||||||||
|
Net cash provided by (used for) investing activities
|
D |
(3,509
|
)
|
10,010
|
6,501
|
|||||||||
|
Net cash used for financing activities
|
(106,268
|
)
|
-
|
(106,268
|
)
|
|||||||||
|
Net increase (decrease) in cash and cash equivalents
|
(8,681
|
)
|
10,010
|
1,329
|
||||||||||
|
Balance of cash and cash equivalents as of the beginning of the period
|
D |
52
|
265
|
317
|
||||||||||
|
Restricted cash balance as of the beginning of the period
|
D |
28,328
|
(28,328
|
)
|
-
|
|||||||||
|
Balance of cash and cash equivalents as of the end of the period
|
D |
85
|
1,561
|
1,646
|
||||||||||
|
Restricted cash balance as of the end of the period
|
D |
19,614
|
(19,614
|
)
|
-
|
|||||||||
|
For the three-month period ended September 30, 2025
|
||||||||||||||
|
US GAAP
|
Adjustments
|
IFRS
|
||||||||||||
|
In USD thousand
|
In USD thousand
|
In USD thousand
|
||||||||||||
|
Profit for the period
|
A,B
|
49,964
|
1,131
|
51,095
|
||||||||||
|
Net cash provided by operating activities
|
60,364
|
-
|
60,364
|
|||||||||||
|
Net cash used for investing activities
|
(1,790
|
)
|
(4,251
|
)
|
(6,041
|
)
|
||||||||
|
Net cash used for financing activities
|
(53,334
|
)
|
-
|
(53,334
|
)
|
|||||||||
|
Net increase in cash and cash equivalents
|
D
|
5,240
|
(4,251
|
)
|
989
|
|||||||||
|
Balance of cash and cash equivalents as of the beginning of the period
|
D
|
76
|
200
|
276
|
||||||||||
|
Restricted cash balance as of the beginning of the period
|
D
|
7,511
|
(7,511
|
)
|
-
|
|||||||||
|
Balance of cash and cash equivalents as of the end of the period
|
D
|
199
|
1,066
|
1,265
|
||||||||||
|
Restricted cash balance as of the end of the period
|
D
|
12,628
|
(12,628
|
)
|
-
|
|||||||||
|
For the three-month period ended September 30, 2024
|
||||||||||||||
|
US GAAP
|
Adjustments
|
IFRS
|
||||||||||||
|
In USD thousand
|
In USD thousand
|
In USD thousand
|
||||||||||||
|
Profit for the period
|
A,B
|
24,369
|
1,265
|
25,634
|
||||||||||
|
Net cash provided by operating activities
|
30,622
|
-
|
30,622
|
|||||||||||
|
Net cash provided by (used for) investing activities
|
D
|
(1,275
|
)
|
8,792
|
7,517
|
|||||||||
|
Net cash used for financing activities
|
(39,135
|
)
|
-
|
(39,135
|
)
|
|||||||||
|
Net decrease in cash and cash equivalents
|
(9,788
|
)
|
8,792
|
(996
|
)
|
|||||||||
|
Balance of cash and cash equivalents as of the beginning of the period
|
D
|
73
|
2,569
|
2,642
|
||||||||||
|
Restricted cash balance as of the beginning of the period
|
D
|
29,414
|
(29,414
|
)
|
-
|
|||||||||
|
Balance of cash and cash equivalents as of the end of the period
|
D
|
85
|
1,561
|
1,646
|
||||||||||
|
Restricted cash balance as of the end of the period
|
D
|
19,614
|
(19,614
|
)
|
-
|
|||||||||
|
For the year ended December 31, 2024
|
||||||||||||||
|
US GAAP
|
Adjustments
|
IFRS
|
||||||||||||
|
In USD thousand
|
In USD thousand
|
In USD thousand
|
||||||||||||
|
Profit for the year
|
A,B
|
98,702
|
3,917
|
102,619
|
||||||||||
|
Net cash provided by operating activities
|
125,851
|
-
|
125,851
|
|||||||||||
|
Net cash provided by (used for) investing activities
|
D
|
(11,286
|
)
|
23,714
|
12,428
|
|||||||||
|
Net cash used for financing activities
|
(138,109
|
)
|
-
|
(138,109
|
)
|
|||||||||
|
Net increase (decrease) in cash and cash equivalents
|
(23,544
|
)
|
23,714
|
170
|
||||||||||
|
Balance of cash and cash equivalents as of the beginning of the year
|
D
|
52
|
265
|
317
|
||||||||||
|
Restricted cash balance as of the beginning of the year
|
D
|
28,328
|
(28,328
|
)
|
-
|
|||||||||
|
Balance of cash and cash equivalents as of the end of the year
|
D
|
43
|
444
|
487
|
||||||||||
|
Restricted cash balance as of the end of the year
|
D
|
4,793
|
(4,793
|
)
|
-
|
|||||||||
|
As of September 30, 2025
|
||||||||||||||
|
US GAAP
|
Adjustments
|
IFRS
|
||||||||||||
|
In USD thousand
|
In USD thousand
|
In USD thousand
|
||||||||||||
|
Cash and cash equivalents
|
D
|
44
|
559
|
603
|
||||||||||
|
Restricted cash
|
D
|
560
|
(559
|
)
|
1
|
|||||||||
|
Property, plant & equipment
|
A,C
|
555,368
|
44,082
|
599,450
|
||||||||||
|
Intangible assets
|
C
|
12,342
|
(12,342
|
)
|
-
|
|||||||||
|
Other assets
|
70,011
|
-
|
70,011
|
|||||||||||
|
Total assets
|
638,325
|
31,740
|
670,065
|
|||||||||||
|
Accounts payable and deferred expenses
|
A
|
11,752
|
(1,957
|
)
|
9,795
|
|||||||||
|
Other liabilities
|
297,177
|
(4,466
|
)
|
292,711
|
||||||||||
|
Total liabilities
|
308,929
|
(6,423
|
)
|
302,506
|
||||||||||
|
Partners’ equity
|
A
|
329,396
|
38,162
|
367,558
|
||||||||||
|
Total liabilities and equity
|
638,325
|
31,739
|
670,064
|
|||||||||||
|
As of September 30, 2024
|
||||||||||||||
|
US GAAP
|
Adjustments
|
IFRS
|
||||||||||||
|
In USD thousand
|
In USD thousand
|
In USD thousand
|
||||||||||||
|
Cash and cash equivalents
|
D
|
43
|
3,483
|
3,526
|
||||||||||
|
Restricted cash
|
D
|
3,484
|
(3,483
|
)
|
1
|
|||||||||
|
Property, plant & equipment
|
A,C
|
571,409
|
40,294
|
611,703
|
||||||||||
|
Intangible assets
|
C
|
12,741
|
(12,741
|
)
|
-
|
|||||||||
|
Other assets
|
79,969
|
-
|
79,969
|
|||||||||||
|
Total assets
|
667,646
|
27,553
|
695,199
|
|||||||||||
|
Accounts payable and deferred expenses
|
A
|
11,193
|
(1,588
|
)
|
9,605
|
|||||||||
|
Other liabilities
|
359,144
|
(550
|
)
|
358,594
|
||||||||||
|
Total liabilities
|
370,337
|
(2,138
|
)
|
368,199
|
||||||||||
|
Partners’ equity
|
A
|
297,309
|
29,692
|
327,001
|
||||||||||
|
Total liabilities and equity
|
667,646
|
27,554
|
695,200
|
|||||||||||
|
As of December 31, 2024
|
||||||||||||||
|
US GAAP
|
Adjustments
|
IFRS
|
||||||||||||
|
In USD thousand
|
In USD thousand
|
In USD thousand
|
||||||||||||
|
Cash and cash equivalents
|
D
|
34
|
4,800
|
4,834
|
||||||||||
|
Restricted cash
|
D
|
4,800
|
(4,800
|
)
|
-
|
|||||||||
|
Property, plant & equipment
|
A,C
|
567,685
|
41,156
|
608,841
|
||||||||||
|
Intangible assets
|
C
|
12,641
|
(12,641
|
)
|
-
|
|||||||||
|
Other assets
|
76,181
|
(1
|
)
|
76,180
|
||||||||||
|
Total assets
|
661,341
|
28,514
|
689,855
|
|||||||||||
|
Accounts payable and deferred expenses
|
A
|
11,770
|
(1,375
|
)
|
10,395
|
|||||||||
|
Other liabilities
|
336,376
|
(2,784
|
)
|
333,592
|
||||||||||
|
Total liabilities
|
348,146
|
(4,159
|
)
|
343,987
|
||||||||||
|
Partners’ equity
|
A
|
313,195
|
32,673
|
345,868
|
||||||||||
|
Total liabilities and equity
|
661,341
|
28,514
|
689,855
|
|||||||||||
|
For the nine-month period ended September 30, 2025
|
||||||||||||||
|
US GAAP
|
Adjustments
|
IFRS
|
||||||||||||
|
In USD thousand
|
In USD thousand
|
In USD thousand
|
||||||||||||
|
Revenues
|
236,403
|
(72
|
)
|
236,331
|
||||||||||
|
Operating expenses
|
A
|
152,299
|
(5,625
|
)
|
146,674
|
|||||||||
|
Depreciation and amortization
|
A
|
14,536
|
136
|
14,672
|
||||||||||
|
Operating profit
|
69,568
|
5,417
|
74,985
|
|||||||||||
|
Finance expenses
|
B
|
15,267
|
(7
|
)
|
15,260
|
|||||||||
|
Profit for the period
|
54,301
|
5,424
|
59,725
|
|||||||||||
|
Other comprehensive loss
|
B
|
(5,750
|
)
|
65
|
(5,685
|
)
|
||||||||
|
Comprehensive income for the period
|
48,551
|
5,489
|
54,040
|
|||||||||||
|
For the nine-month period ended September 30, 2024
|
||||||||||||||
|
US GAAP
|
Adjustments
|
IFRS
|
||||||||||||
|
In USD thousand
|
In USD thousand
|
In USD thousand
|
||||||||||||
|
Revenues
|
185,861
|
(691
|
)
|
185,170
|
||||||||||
|
Operating expenses
|
A
|
144,579
|
(4,676
|
)
|
139,903
|
|||||||||
|
Depreciation and amortization
|
A
|
13,911
|
2,989
|
16,900
|
||||||||||
|
Operating profit
|
27,371
|
996
|
28,367
|
|||||||||||
|
Finance expenses
|
B
|
17,783
|
(26
|
)
|
17,757
|
|||||||||
|
Profit for the period
|
9,588
|
1,022
|
10,610
|
|||||||||||
|
Other comprehensive income (loss)
|
B
|
(535
|
)
|
665
|
130
|
|||||||||
|
Comprehensive loss for the period
|
9,053
|
1,687
|
10,740
|
|||||||||||
|
For the three-month period ended September 30, 2025
|
||||||||||||||
|
US GAAP
|
Adjustments
|
IFRS
|
||||||||||||
|
In USD thousand
|
In USD thousand
|
In USD thousand
|
||||||||||||
|
Revenues
|
90,380
|
(93
|
)
|
90,287
|
||||||||||
|
Operating expenses
|
A
|
50,892
|
(1,956
|
)
|
48,936
|
|||||||||
|
Depreciation and amortization
|
A
|
4,856
|
1,062
|
5,918
|
||||||||||
|
Operating profit
|
34,632
|
801
|
35,433
|
|||||||||||
|
Finance expenses
|
B
|
4,851
|
(4
|
)
|
4,847
|
|||||||||
|
Profit for the period
|
29,781
|
805
|
30,586
|
|||||||||||
|
Other comprehensive income
|
B
|
8,109
|
89
|
8,198
|
||||||||||
|
Comprehensive income for the period
|
37,890
|
894
|
38,784
|
|||||||||||
|
For the three-month period ended September 30, 2024
|
||||||||||||||
|
US GAAP
|
Adjustments
|
IFRS
|
||||||||||||
|
In USD thousand
|
In USD thousand
|
In USD thousand
|
||||||||||||
|
Revenues
|
69,307
|
(308
|
)
|
68,999
|
||||||||||
|
Operating expenses
|
A
|
50,260
|
(1,694
|
)
|
48,566
|
|||||||||
|
Depreciation and amortization
|
A
|
4,810
|
810
|
5,620
|
||||||||||
|
Operating profit
|
14,237
|
576
|
14,813
|
|||||||||||
|
Finance expenses
|
B
|
6,069
|
17
|
6,086
|
||||||||||
|
Profit for the period
|
8,168
|
559
|
8,727
|
|||||||||||
|
Other comprehensive income
|
B
|
4,923
|
325
|
5,248
|
||||||||||
|
Comprehensive income for the period
|
13,091
|
884
|
13,975
|
|||||||||||
|
For the year ended December 31, 2024
|
||||||||||||||
|
US GAAP
|
Adjustments
|
IFRS
|
||||||||||||
|
In USD thousand
|
In USD thousand
|
In USD thousand
|
||||||||||||
|
Revenues
|
234,641
|
(835
|
)
|
233,806
|
||||||||||
|
Operating expenses
|
A
|
185,058
|
(6,050
|
)
|
179,008
|
|||||||||
|
Depreciation and amortization
|
A
|
18,721
|
1,381
|
20,102
|
||||||||||
|
Operating profit
|
30,862
|
3,834
|
34,696
|
|||||||||||
|
Finance expenses
|
B
|
23,513
|
(18
|
)
|
23,495
|
|||||||||
|
Profit for the year
|
7,349
|
3,852
|
11,201
|
|||||||||||
|
Other comprehensive income
|
B
|
19,340
|
817
|
20,157
|
||||||||||
|
Comprehensive income for the year
|
26,689
|
4,669
|
31,358
|
|||||||||||
|
For the nine-month period ended September 30, 2025
|
||||||||||||||
|
US GAAP
|
Adjustments
|
IFRS
|
||||||||||||
|
In USD thousand
|
In USD thousand
|
In USD thousand
|
||||||||||||
|
Profit for the period
|
A,B
|
54,301
|
5,424
|
59,725
|
||||||||||
|
Net cash provided by operating activities
|
70,545
|
-
|
70,545
|
|||||||||||
|
Net cash provided by (used for) investing activities
|
D
|
(1,927
|
)
|
2,422
|
495
|
|||||||||
|
Net cash used for financing activities
|
(75,271
|
)
|
-
|
(75,271
|
)
|
|||||||||
|
Net decrease in cash and cash equivalents
|
(6,653
|
)
|
2,422
|
(4,231
|
)
|
|||||||||
|
Balance of cash and cash equivalents as of the beginning of the period
|
D
|
34
|
4,800
|
4,834
|
||||||||||
|
Restricted cash balance as of the beginning of the period
|
D
|
29,040
|
(29,040
|
)
|
-
|
|||||||||
|
Balance of cash and cash equivalents as of the end of the period
|
D
|
44
|
559
|
603
|
||||||||||
|
Restricted cash balance as of the end of the period
|
D
|
22,377
|
(22,377
|
)
|
-
|
|||||||||
|
For the nine-month period ended September 30, 2024
|
||||||||||||||
|
US GAAP
|
Adjustments
|
IFRS
|
||||||||||||
|
In USD thousand
|
In USD thousand
|
In USD thousand
|
||||||||||||
|
Profit for the period
|
A,B
|
9,588
|
1,022
|
10,610
|
||||||||||
|
Net cash provided by operating activities
|
12,592
|
-
|
12,592
|
|||||||||||
|
Net cash used for investing activities
|
D
|
(7,887
|
)
|
300
|
(7,587
|
)
|
||||||||
|
Net cash used for financing activities
|
(5,861
|
)
|
-
|
(5,861
|
)
|
|||||||||
|
Net decrease in cash and cash equivalents
|
(1,156
|
)
|
300
|
(856
|
)
|
|||||||||
|
Balance of cash and cash equivalents as of the beginning of the period
|
D
|
41
|
4,341
|
4,382
|
||||||||||
|
Restricted cash balance as of the beginning of the period
|
D
|
28,917
|
(28,917
|
)
|
-
|
|||||||||
|
Balance of cash and cash equivalents as of the end of the period
|
D
|
43
|
3,483
|
3,526
|
||||||||||
|
Restricted cash balance as of the end of the period
|
D
|
27,759
|
(27,759
|
)
|
-
|
|||||||||
|
For the three-month period ended September 30, 2025
|
||||||||||||||
|
US GAAP
|
Adjustments
|
IFRS
|
||||||||||||
|
In USD thousand
|
In USD thousand
|
In USD thousand
|
||||||||||||
|
Profit for the period
|
A,B
|
29,781
|
805
|
30,586
|
||||||||||
|
Net cash provided by operating activities
|
37,449
|
-
|
37,449
|
|||||||||||
|
Net cash used for investing activities
|
D
|
(871
|
)
|
799
|
(72
|
)
|
||||||||
|
Net cash used for financing activities
|
(41,264
|
)
|
-
|
(41,264
|
)
|
|||||||||
|
Net decrease in cash and cash equivalents
|
(4,686
|
)
|
799
|
(3,887
|
)
|
|||||||||
|
Balance of cash and cash equivalents as of the beginning of the period
|
D
|
44
|
4,446
|
4,490
|
||||||||||
|
Restricted cash balance as of the beginning of the period
|
D
|
27,063
|
(27,063
|
)
|
-
|
|||||||||
|
Balance of cash and cash equivalents as of the end of the period
|
D
|
44
|
559
|
603
|
||||||||||
|
Restricted cash balance as of the end of the period
|
D
|
22,377
|
(22,377
|
)
|
-
|
|||||||||
|
For the three-month period ended September 30, 2024
|
||||||||||||||
|
US GAAP
|
Adjustments
|
IFRS
|
||||||||||||
|
In USD thousand
|
In USD thousand
|
In USD thousand
|
||||||||||||
|
Profit for the period
|
A,B
|
8,168
|
559
|
8,727
|
||||||||||
|
Net cash provided by operating activities
|
10,039
|
-
|
10,039
|
|||||||||||
|
Net cash provided by (used for) investing activities
|
D
|
(405
|
)
|
1,102
|
697
|
|||||||||
|
Net cash used for financing activities
|
(8,149
|
)
|
-
|
(8,149
|
)
|
|||||||||
|
Net increase in cash and cash equivalents
|
1,485
|
1,102
|
2,587
|
|||||||||||
|
Balance of cash and cash equivalents as of the beginning of the period
|
D
|
44
|
895
|
939
|
||||||||||
|
Restricted cash balance as of the beginning of the period
|
D
|
26,273
|
(26,273
|
)
|
-
|
|||||||||
|
Balance of cash and cash equivalents as of the end of the period
|
D
|
43
|
3,483
|
3,526
|
||||||||||
|
Restricted cash balance as of the end of the period
|
D
|
27,759
|
(27,759
|
)
|
-
|
|||||||||
|
For the year ended December 31, 2024
|
||||||||||||||
|
US GAAP
|
Adjustments
|
IFRS
|
||||||||||||
|
In USD thousand
|
In USD thousand
|
In USD thousand
|
||||||||||||
|
Profit for the year
|
A,B
|
7,349
|
3,852
|
11,201
|
||||||||||
|
Net cash provided by operating activities
|
22,178
|
-
|
22,178
|
|||||||||||
|
Net cash used for investing activities
|
D
|
(8,882
|
)
|
336
|
(8,546
|
)
|
||||||||
|
Net cash used for financing activities
|
(13,180
|
)
|
-
|
(13,180
|
)
|
|||||||||
|
Net increase in cash and cash equivalents
|
116
|
336
|
452
|
|||||||||||
|
Balance of cash and cash equivalents as of the beginning of the year
|
D
|
41
|
4,341
|
4,382
|
||||||||||
|
Restricted cash balance as of the beginning of the year
|
D
|
28,917
|
(28,917
|
)
|
-
|
|||||||||
|
Balance of cash and cash equivalents as of the end of the year
|
D
|
34
|
4,800
|
4,834
|
||||||||||
|
Restricted cash balance as of the end of the year
|
D
|
29,040
|
(29,040
|
)
|
-
|
|||||||||
|
|
A. |
Maintenance costs under the Long Term Maintenance Plan (hereinafter – the “LTPC Agreement”): under IFRS, variable payments which were paid in accordance with the milestones as set in the LTPC
Agreement are capitalized to the cost of property, plant and equipment and amortized over the period from the date on which maintenance work was carried out until the date on which maintenance work is due to take place again. Under US GAAP,
the said payments are recognized on payment date within current expenses in the statement of income.
|
|
|
B. |
Hedge effectiveness of swaps: in accordance with the IFRS – the associates recognize adjustments relating to the ineffective portion of their cash flow hedge under profit and loss. Under US GAAP, there is no part which is not effective,
and the hedging results are recognized in full in other comprehensive income.
|
|
|
C. |
Intangible assets: Under IFRS, certain intangible assets are defined as property, plant and equipment.
|
|
|
D. |
Restricted cash: There is a difference between the presentation and classification of restricted cash in the cash flow statements and in the statements of financial position.
|
|
|
E. |
Right-of-use assets: In IFRS, certain contracts are classified as leases. Under US GAAP, these contracts do not meet the definition of lease contracts, and are recorded as operating expenses.
|
|
|
F. |
Changes in financing and refinancing agreements: In cases where the Group has made a modification of terms in existing loans and the change is immaterial, in accordance with IFRS 9, the carrying value of the loans has been adjusted to
reflect the present value of the updated contractual cash flows, discounted according to the original effective interest rate. The difference resulting from this adjustment was immediately recognized in the income statement. Under US GAAP,
there was no effect on profit or loss date on which the terms and conditions were changed.
|