|
|
BioLineRx Ltd.
|
|
|
|
|
|
|
|
|
|
By:
|
/s/ Philip A. Serlin
|
|
|
|
|
Philip A. Serlin
|
|
|
|
|
Chief Executive Officer
|
|
|
|
• |
With $28.2 million on its balance sheet as of June 30, 2025, BioLineRx is guiding to a cash runway into the first half of 2027. This represents an improvement as compared to the Company’s previous
cash runway guidance into the second half of 2026.
|
|
|
• |
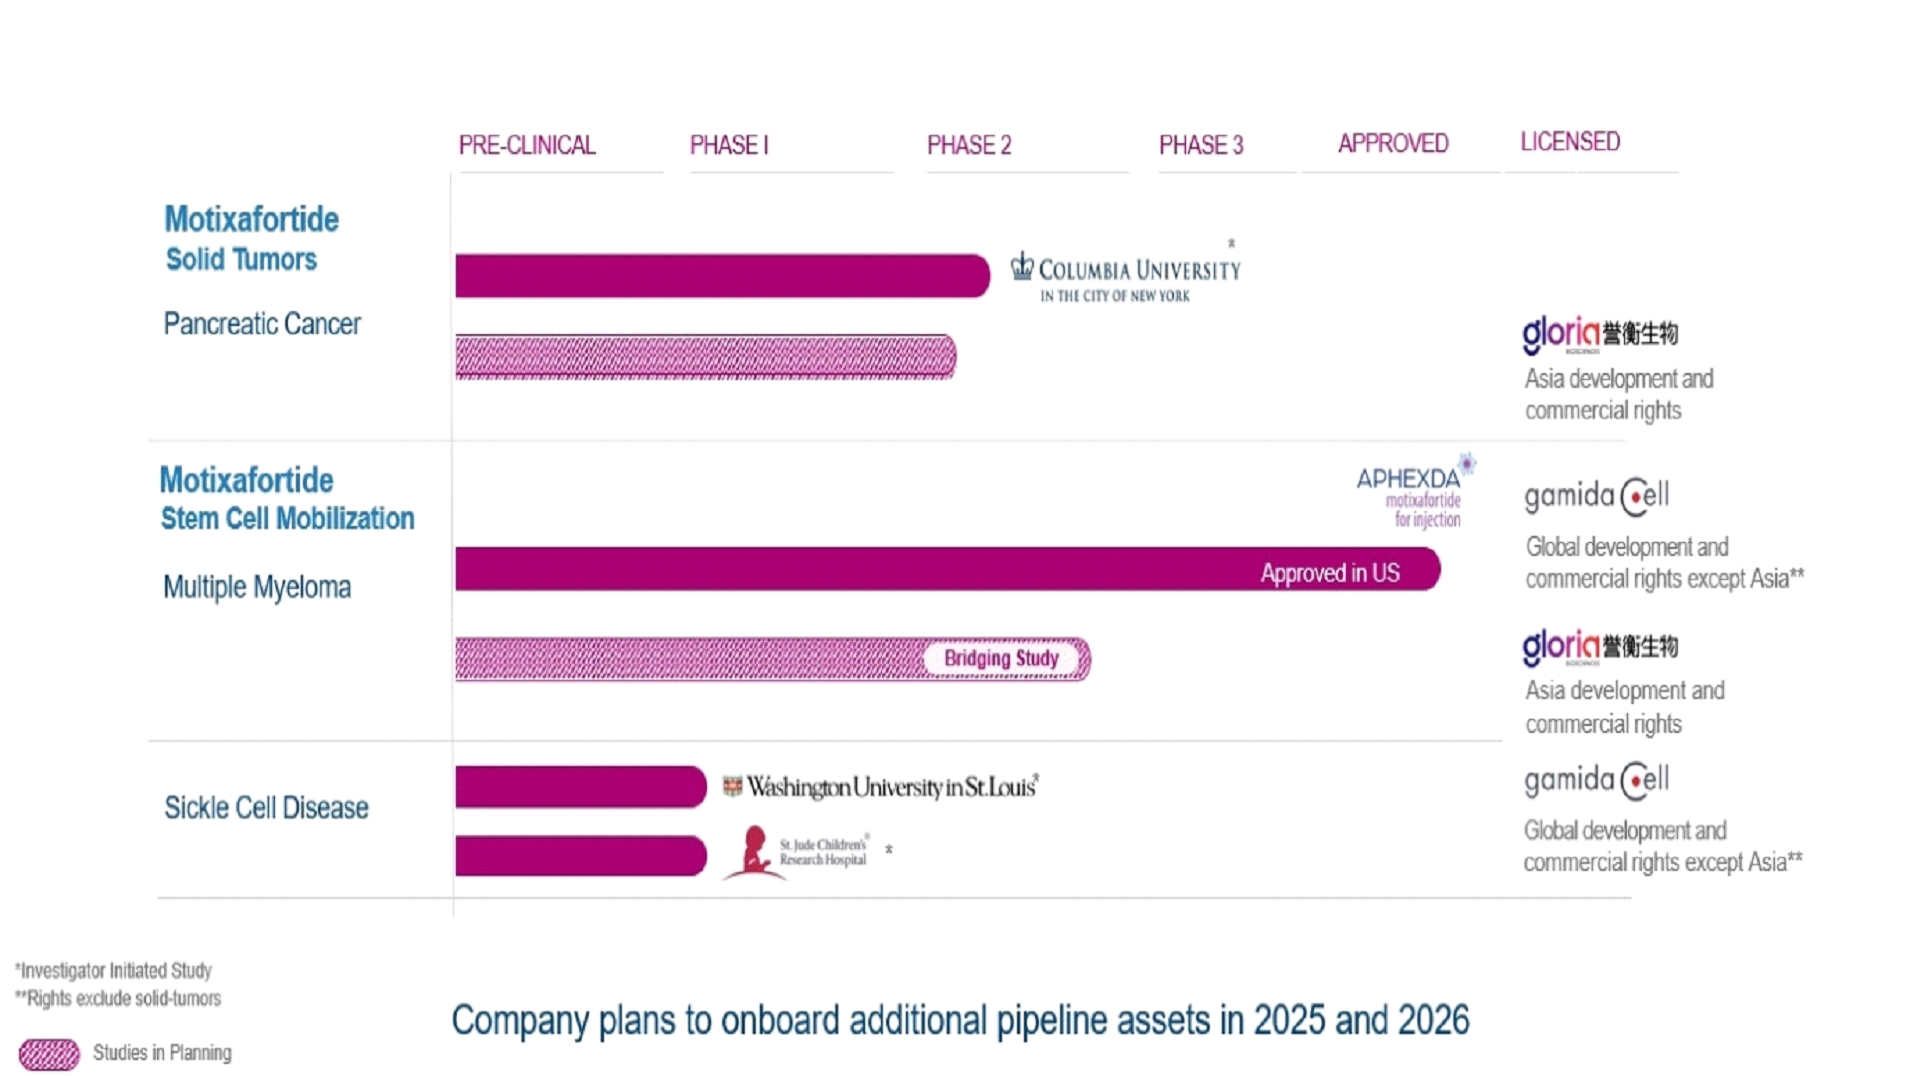
Enrollment activities continue in the CheMo4METPANC Phase 2b clinical trial, which is being led by Columbia University, and supported by both Regeneron and BioLineRx. The CheMo4METPANC trial is
evaluating motixafortide in combination with the PD-1 inhibitor cemiplimab and standard chemotherapy (gemcitabine and nab-paclitaxel).
|
|
|
• |
A prespecified interim analysis is planned when 40% of progression-free survival (PFS) events are observed.
|
|
|
• |
An abstract featuring updated data from the pilot phase of the ongoing CheMo4METPANC clinical trial was presented at the 2025 ASCO Annual Meeting in May. Key highlights include:
|
|
|
o |
Four of 11 patients remained progression-free after more than one year.
|
|
|
o |
Two patients underwent definitive treatment for metastatic pancreatic cancer: one had complete resolution of all radiologically detected liver lesions and underwent radiation to the primary
pancreatic tumor, and one had a sustained partial response and underwent pancreaticoduodenectomy with pathology demonstrating a complete response.
|
|
|
o |
An analysis of pre- and on-treatment biopsies revealed that CD8+ T-cell tumor infiltration increased across all eleven patients treated with the motixafortide combination.
|
|
|
• |
Ongoing Phase 1 clinical trial evaluating motixafortide as monotherapy and in combination with natalizumab for stem cell mobilization for gene therapies in sickle cell disease continues to
progress. The trial is sponsored by Washington University School of Medicine in St. Louis, and results are anticipated in the second half of 2025.
|
|
|
• |
A second study, sponsored by St. Jude Children's Research Hospital, continues to enroll patients. The study is a multi-center Phase 1 clinical trial evaluating motixafortide for the mobilization of
CD34+ hematopoietic stem cells (HSCs) used in the development of gene therapies for patients with Sickle Cell Disease (SCD).
|
|
|
• |
APHEXDA generated sales of $1.7 million in the second quarter of 2025, providing royalty revenue to the Company of $0.3 million.
|
|
|
• |
Total revenues for the second quarter of 2025 were $0.3 million, reflecting the royalties paid by Ayrmid from the commercialization of APHEXDA in stem cell mobilization in the U.S. Total revenues in
2025 are not comparable to the same period in 2024, which included direct commercial sales by BioLineRx prior to the Ayrmid transaction in November 2024.
|
|
|
• |
Cost of revenues for the second quarter of 2025 was immaterial, compared to cost of revenues of $0.9 million for the second quarter of 2024. Cost of revenues in 2025 are not comparable to the same
period in 2024, which included cost of sales from direct commercial sales by BioLineRx prior to the Ayrmid transaction in November 2024.
|
|
|
• |
Research and development expenses for the second quarter of 2025 were $2.3 million, compared to $2.2 million for the second quarter of 2024. The increase resulted primarily from certain one-time
costs associated with the PDAC study at Columbia University, offset by lower expenses related to motixafortide due to the out-licensing of U.S. rights to Ayrmid, as well as a decrease in payroll and share-based compensation, primarily due to
a decrease in headcount.
|
|
|
• |
There were no sales and marketing expenses for the second quarter of 2025, compared to $6.4 million for the second quarter of 2024. The decrease resulted primarily from the shutdown of U.S.
commercial operations in the fourth quarter of 2024 following the Ayrmid transaction.
|
|
|
• |
General and administrative expenses for the second quarter of 2025 were $0.2 million, compared to $1.6 million for the second quarter of 2024. The decrease resulted primarily from the reversal of a
provision for doubtful accounts following receipt of an overdue milestone payment from Gloria, a decrease in payroll and share-based compensation, primarily due to a decrease in headcount, as well as small decreases in a number of general and
administrative expenses.
|
|
|
• |
Net non-operating expenses for the second quarter of 2025 were $1.9 million, compared to net non-operating income of $7.8 million for the second quarter of 2024. Non-operating income (expenses) for
both periods primarily relate to fair-value adjustments of warrant liabilities on the balance sheet, as a result of changes in the Company’s share price
|
|
|
• |
Net financial income for the second quarter of 2025 was $0.2 million, compared to net financial expenses of $1.6 million for the second quarter of 2024. Net financial income (expenses) for both
periods primarily relate to loan interest paid, partially offset by investment income earned on bank deposits and gains on foreign currency (primarily NIS) cash balances due to the strengthening of the NIS during the period. The significant
decrease in financial expenses in the 2025 period results from a substantial paydown of the BlackRock loan balance in November 2024, following the transaction with Ayrmid.
|
|
|
• |
Net loss for the second quarter of 2025 was $3.9 million, compared to net income of $0.5 million for the second quarter of 2024.
|
|
|
• |
As of June 30, 2025, the Company had cash, cash equivalents, and short-term bank deposits of $28.2 million, sufficient to fund operations, as currently planned, into the first half of 2027.
|
|
December 31,
|
June 30,
|
|||||||
|
2024
|
2025
|
|||||||
|
in USD thousands
|
||||||||
|
Assets
|
||||||||
|
CURRENT ASSETS
|
||||||||
|
Cash and cash equivalents
|
10,436
|
7,189
|
||||||
|
Short-term bank deposits
|
9,126
|
20,970
|
||||||
|
Trade receivables
|
2,476
|
78
|
||||||
|
Prepaid expenses
|
443
|
572
|
||||||
|
Other receivables
|
1,478
|
203
|
||||||
|
Inventory
|
3,145
|
2,850
|
||||||
|
Total current assets
|
27,104
|
31,862
|
||||||
|
NON-CURRENT ASSETS
|
||||||||
|
Property and equipment, net
|
386
|
197
|
||||||
|
Right-of-use assets, net
|
967
|
800
|
||||||
|
Intangible assets, net
|
10,449
|
10,408
|
||||||
|
Total non-current assets
|
11,802
|
11,405
|
||||||
|
Total assets
|
38,906
|
43,267
|
||||||
|
Liabilities and equity
|
||||||||
|
CURRENT LIABILITIES
|
||||||||
|
Current maturities of long-term loan
|
4,479
|
4,479
|
||||||
|
Accounts payable and accruals:
|
||||||||
|
Trade
|
5,583
|
3,465
|
||||||
|
Other
|
3,131
|
2,767
|
||||||
|
Current maturities of lease liabilities
|
522
|
408
|
||||||
|
Warrants
|
1,691
|
4,360
|
||||||
|
Total current liabilities
|
15,406
|
15,479
|
||||||
|
NON-CURRENT LIABILITIES
|
||||||||
|
Long-term loan, net of current maturities
|
8,958
|
6,718
|
||||||
|
Lease liabilities
|
1,081
|
998
|
||||||
|
Total non-current liabilities
|
10,039
|
7,716
|
||||||
|
COMMITMENTS AND CONTINGENT LIABILITIES
|
||||||||
|
Total liabilities
|
25,445
|
23,195
|
||||||
|
EQUITY
|
||||||||
|
Ordinary shares
|
38,097
|
71,819
|
||||||
|
Share premium
|
353,693
|
327,475
|
||||||
|
Warrants
|
5,367
|
3,686
|
||||||
|
Capital reserve
|
17,547
|
17,148
|
||||||
|
Other comprehensive loss
|
(1,416
|
)
|
(1,416
|
)
|
||||
|
Accumulated deficit
|
(399,827
|
)
|
(398,640
|
)
|
||||
|
Total equity
|
13,461
|
20,072
|
||||||
|
Total liabilities and equity
|
38,906
|
43,267
|
||||||
|
Three months ended June 30,
|
Six months ended June 30,
|
|||||||||||||||
|
2024
|
2025
|
2024
|
2025
|
|||||||||||||
|
in USD thousands
|
In USD thousands
|
|||||||||||||||
|
REVENUES:
|
||||||||||||||||
|
License revenues
|
3,550
|
304
|
9,481
|
559
|
||||||||||||
|
Product sales, net
|
1,843
|
-
|
2,767
|
-
|
||||||||||||
|
Total revenues
|
5,393
|
304
|
12,248
|
559
|
||||||||||||
|
COST OF REVENUES
|
(897
|
)
|
(72
|
)
|
(2,352
|
)
|
(106
|
)
|
||||||||
|
GROSS PROFIT
|
4,496
|
232
|
9,896
|
453
|
||||||||||||
|
RESEARCH AND DEVELOPMENT EXPENSES
|
(2,225
|
)
|
(2,326
|
)
|
(4,719
|
)
|
(3,949
|
)
|
||||||||
|
SALES AND MARKETING EXPENSES
|
(6,415
|
)
|
-
|
(12,757
|
)
|
-
|
||||||||||
|
GENERAL AND ADMINISTRATIVE EXPENSES
|
(1,629
|
)
|
(209
|
)
|
(3,015
|
)
|
(1,198
|
)
|
||||||||
|
OPERATING LOSS
|
(5,773
|
)
|
(2,303
|
)
|
(10,595
|
)
|
(4,694
|
)
|
||||||||
|
NON-OPERATING INCOME (EXPENSES), NET
|
7,807
|
(1,851
|
)
|
12,297
|
5,793
|
|||||||||||
|
FINANCIAL INCOME
|
535
|
490
|
1,100
|
784
|
||||||||||||
|
FINANCIAL EXPENSES
|
(2,085
|
)
|
(276
|
)
|
(3,014
|
)
|
(696
|
)
|
||||||||
|
NET INCOME (LOSS) AND COMPREHENSIVE INCOME (LOSS)
|
484
|
(3,940
|
)
|
(212
|
)
|
1,187
|
||||||||||
|
in USD
|
In USD
|
|||||||||||||||
|
EARNINGS (LOSS) PER ORDINARY SHARE - BASIC AND DILUTED
|
0.00
|
(0.00
|
)
|
(0.00
|
)
|
0.00
|
||||||||||
|
WEIGHTED AVERAGE NUMBER OF SHARES USED IN
CALCULATION OF EARNINGS (LOSS) PER ORDINARY SHARE |
1,197,582,901
|
2,369,687,536
|
1,142,221,033
|
2,294,127,662
|
||||||||||||
|
Ordinary
shares
|
Share
premium
|
Warrants
|
Capital
reserve
|
Other
comprehensive loss
|
Accumulated
deficit
|
Total
|
||||||||||||||||||||||
|
in USD thousands
|
||||||||||||||||||||||||||||
|
BALANCE AT JANUARY 1, 2024
|
31,355
|
355,482
|
1,408
|
17,000
|
(1,416
|
)
|
(390,606
|
)
|
13,223
|
|||||||||||||||||||
|
CHANGES FOR SIX MONTHS ENDED
JUNE 30, 2024:
|
||||||||||||||||||||||||||||
|
Issuance of share capital and warrants, net
|
3,056
|
(3,056
|
)
|
-
|
-
|
-
|
-
|
-
|
||||||||||||||||||||
|
Employee stock options expired
|
-
|
-
|
-
|
(66
|
)
|
-
|
-
|
(66
|
)
|
|||||||||||||||||||
|
Share-based compensation
|
-
|
-
|
-
|
1,036
|
-
|
-
|
1,036
|
|||||||||||||||||||||
|
Comprehensive loss for the period
|
-
|
-
|
-
|
-
|
-
|
(212
|
)
|
(212
|
)
|
|||||||||||||||||||
|
BALANCE AT JUNE 30, 2024
|
34,411
|
352,426
|
1,408
|
17,970
|
(1,416
|
)
|
(390,818
|
)
|
13,891
|
|||||||||||||||||||
|
Ordinary
shares
|
Share
premium
|
Warrants
|
Capital
reserve
|
Other
comprehensive loss
|
Accumulated
deficit
|
Total
|
||||||||||||||||||||||
|
in USD thousands
|
||||||||||||||||||||||||||||
|
BALANCE AT JANUARY 1, 2025
|
38,097
|
353,693
|
5,367
|
17,547
|
(1,416
|
)
|
(399,827
|
)
|
13,461
|
|||||||||||||||||||
|
CHANGES FOR SIX MONTHS ENDED
JUNE 30, 2025:
|
||||||||||||||||||||||||||||
|
Issuance of share capital, pre-funded warrants and warrants, net
|
25,664
|
(20,988
|
)
|
501
|
-
|
-
|
-
|
5,177
|
||||||||||||||||||||
|
Pre-funded warrants exercised
|
8,058
|
(5,876
|
)
|
(2,182
|
)
|
-
|
-
|
-
|
-
|
|||||||||||||||||||
|
Employee stock options expired
|
-
|
646
|
-
|
(646
|
)
|
-
|
-
|
-
|
||||||||||||||||||||
|
Share-based compensation
|
-
|
-
|
-
|
247
|
-
|
-
|
247
|
|||||||||||||||||||||
|
Comprehensive income for the period
|
-
|
-
|
-
|
-
|
-
|
1,187
|
1,187
|
|||||||||||||||||||||
|
BALANCE AT JUNE 30, 2025
|
71,819
|
327,475
|
3,686
|
17,148
|
(1,416
|
)
|
(398,640
|
)
|
20,072
|
|||||||||||||||||||
|
Six months ended
June 30,
|
||||||||
|
2024
|
2025
|
|||||||
|
in USD thousands
|
||||||||
|
CASH FLOWS - OPERATING ACTIVITIES
|
||||||||
|
Comprehensive income (loss) for the period
|
(212
|
)
|
1,187
|
|||||
|
Adjustments required to reflect net cash used in operating activities
(see appendix below)
|
(25,226
|
)
|
(3,955
|
)
|
||||
|
Net cash used in operating activities
|
(25,438
|
)
|
(2,768
|
)
|
||||
|
CASH FLOWS - INVESTING ACTIVITIES
|
||||||||
|
Investments in short-term deposits
|
(20,559
|
)
|
(24,818
|
)
|
||||
|
Maturities of short-term deposits
|
28,660
|
12,926
|
||||||
|
Sale (purchase) of property and equipment
|
(59
|
)
|
11
|
|||||
|
Net cash provided by (used in) investing activities
|
8,042
|
(11,881
|
)
|
|||||
|
CASH FLOWS - FINANCING ACTIVITIES
|
||||||||
|
Issuance of share capital and warrants, net of issuance costs
|
5,565
|
13,554
|
||||||
|
Net proceeds from loan
|
19,223
|
-
|
||||||
|
Repayments of loan
|
(1,547
|
)
|
(2,240
|
)
|
||||
|
Repayments of lease liabilities
|
(256
|
)
|
(262
|
)
|
||||
|
Net cash provided by financing activities
|
22,985
|
11,052
|
||||||
|
INCREASE (DECREASE) IN CASH AND CASH EQUIVALENTS
|
5,589
|
(3,597
|
)
|
|||||
|
CASH AND CASH EQUIVALENTS – BEGINNING OF PERIOD
|
4,255
|
10,436
|
||||||
|
EXCHANGE DIFFERENCES ON CASH AND CASH EQUIVALENTS
|
(221
|
)
|
350
|
|||||
|
CASH AND CASH EQUIVALENTS - END OF PERIOD
|
9,623
|
7,189
|
||||||
|
Six months ended
June 30,
|
||||||||
|
2024
|
2025
|
|||||||
|
in USD thousands
|
||||||||
|
Adjustments required to reflect net cash used in operating activities:
|
||||||||
|
Income and expenses not involving cash flows:
|
||||||||
|
Depreciation and amortization
|
1,373
|
341
|
||||||
|
Exchange differences on cash and cash equivalents
|
221
|
(350
|
)
|
|||||
|
Fair value adjustments of warrants
|
(12,845
|
)
|
(6,410
|
)
|
||||
|
Warrant issuance costs
|
642
|
702
|
||||||
|
Share-based compensation
|
970
|
247
|
||||||
|
Interest on short-term deposits
|
201
|
48
|
||||||
|
Interest on loan
|
1,997
|
-
|
||||||
|
Exchange differences on lease liabilities
|
189
|
110
|
||||||
|
(7,252
|
)
|
(5,312
|
)
|
|||||
|
Changes in operating asset and liability items:
|
||||||||
|
Decrease (increase) in trade receivables
|
(2,821
|
)
|
2,398
|
|||||
|
Decrease (increase) in prepaid expenses and other receivables
|
(359
|
)
|
1,146
|
|||||
|
Decrease (increase) in inventory
|
(1,681
|
)
|
295
|
|||||
|
Decrease in accounts payable and accruals
|
(5,633
|
)
|
(2,482
|
)
|
||||
|
Decrease in contract liabilities
|
(7,480
|
)
|
-
|
|||||
|
(17,974
|
)
|
1,357
|
||||||
|
(25,226
|
)
|
(3,955
|
)
|
|||||
|
Supplemental information on interest received in cash
|
931
|
583
|
||||||
|
Supplemental information on interest paid in cash
|
971
|
694
|
||||||
|
Supplemental information on non-cash transactions:
|
||||||||
|
Changes in right-of-use asset and lease liabilities
|
58
|
45
|
||||||
|
Warrant issuance costs
|
207
|
-
|
||||||
Page |
||
F-1 |
||
F-2 |
||
F-3 |
||
F-4 - F-5 |
||
F-6 - F-15 |
|
December 31,
|
June 30,
|
|||||||
|
2024
|
2025
|
|||||||
|
in USD thousands
|
||||||||
|
Assets
|
||||||||
|
CURRENT ASSETS
|
||||||||
|
Cash and cash equivalents
|
10,436
|
7,189
|
||||||
|
Short-term bank deposits
|
9,126
|
20,970
|
||||||
|
Trade receivables
|
2,476
|
78
|
||||||
|
Prepaid expenses
|
443
|
572
|
||||||
|
Other receivables
|
1,478
|
203
|
||||||
|
Inventory
|
3,145
|
2,850
|
||||||
|
Total current assets
|
27,104
|
31,862
|
||||||
|
NON-CURRENT ASSETS
|
||||||||
|
Property and equipment, net
|
386
|
197
|
||||||
|
Right-of-use assets, net
|
967
|
800
|
||||||
|
Intangible assets, net
|
10,449
|
10,408
|
||||||
|
Total non-current assets
|
11,802
|
11,405
|
||||||
|
Total assets
|
38,906
|
43,267
|
||||||
|
Liabilities and equity
|
||||||||
|
CURRENT LIABILITIES
|
||||||||
|
Current maturities of long-term loan
|
4,479
|
4,479
|
||||||
|
Accounts payable and accruals:
|
||||||||
|
Trade
|
5,583
|
3,465
|
||||||
|
Other
|
3,131
|
2,767
|
||||||
|
Current maturities of lease liabilities
|
522
|
408
|
||||||
|
Warrants
|
1,691
|
4,360
|
||||||
|
Total current liabilities
|
15,406
|
15,479
|
||||||
|
NON-CURRENT LIABILITIES
|
||||||||
|
Long-term loan, net of current maturities
|
8,958
|
6,718
|
||||||
|
Lease liabilities
|
1,081
|
998
|
||||||
|
Total non-current liabilities
|
10,039
|
7,716
|
||||||
|
COMMITMENTS AND CONTINGENT LIABILITIES
|
||||||||
|
Total liabilities
|
25,445
|
23,195
|
||||||
|
EQUITY
|
||||||||
|
Ordinary shares
|
38,097
|
71,819
|
||||||
|
Share premium
|
353,693
|
327,475
|
||||||
|
Warrants
|
5,367
|
3,686
|
||||||
|
Capital reserve
|
17,547
|
17,148
|
||||||
|
Other comprehensive loss
|
(1,416
|
)
|
(1,416
|
)
|
||||
|
Accumulated deficit
|
(399,827
|
)
|
(398,640
|
)
|
||||
|
Total equity
|
13,461
|
20,072
|
||||||
|
Total liabilities and equity
|
38,906
|
43,267
|
||||||
F - 1
|
Three months ended June 30,
|
Six months ended June 30,
|
|||||||||||||||
|
2024
|
2025
|
2024
|
2025
|
|||||||||||||
|
in USD thousands
|
In USD thousands
|
|||||||||||||||
|
REVENUES:
|
||||||||||||||||
|
License revenues
|
3,550
|
304
|
9,481
|
559
|
||||||||||||
|
Product sales, net
|
1,843
|
-
|
2,767
|
-
|
||||||||||||
|
Total revenues
|
5,393
|
304
|
12,248
|
559
|
||||||||||||
|
COST OF REVENUES
|
(897
|
)
|
(72
|
)
|
(2,352
|
)
|
(106
|
)
|
||||||||
|
GROSS PROFIT
|
4,496
|
232
|
9,896
|
453
|
||||||||||||
|
RESEARCH AND DEVELOPMENT EXPENSES
|
(2,225
|
)
|
(2,326
|
)
|
(4,719
|
)
|
(3,949
|
)
|
||||||||
|
SALES AND MARKETING EXPENSES
|
(6,415
|
)
|
-
|
(12,757
|
)
|
-
|
||||||||||
|
GENERAL AND ADMINISTRATIVE EXPENSES
|
(1,629
|
)
|
(209
|
)
|
(3,015
|
)
|
(1,198
|
)
|
||||||||
|
OPERATING LOSS
|
(5,773
|
)
|
(2,303
|
)
|
(10,595
|
)
|
(4,694
|
)
|
||||||||
|
NON-OPERATING INCOME (EXPENSES), NET
|
7,807
|
(1,851
|
)
|
12,297
|
5,793
|
|||||||||||
|
FINANCIAL INCOME
|
535
|
490
|
1,100
|
784
|
||||||||||||
|
FINANCIAL EXPENSES
|
(2,085
|
)
|
(276
|
)
|
(3,014
|
)
|
(696
|
)
|
||||||||
|
NET INCOME (LOSS) AND COMPREHENSIVE INCOME (LOSS)
|
484
|
(3,940
|
)
|
(212
|
)
|
1,187
|
||||||||||
|
in USD
|
In USD
|
|||||||||||||||
|
EARNINGS (LOSS) PER ORDINARY SHARE - BASIC AND DILUTED
|
0.00
|
(0.00
|
)
|
(0.00
|
)
|
0.00
|
||||||||||
|
WEIGHTED AVERAGE NUMBER OF SHARES USED IN
CALCULATION OF EARNINGS (LOSS) PER ORDINARY SHARE |
1,197,582,901
|
2,369,687,536
|
1,142,221,033
|
2,294,127,662
|
||||||||||||
F - 2
|
Ordinary shares
|
Share premium
|
Warrants
|
Capital reserve
|
Other comprehensive loss
|
Accumulated deficit
|
Total
|
||||||||||||||||||||||
|
in USD thousands
|
||||||||||||||||||||||||||||
|
BALANCE AT JANUARY 1, 2024
|
31,355
|
355,482
|
1,408
|
17,000
|
(1,416
|
)
|
(390,606
|
)
|
13,223
|
|||||||||||||||||||
|
CHANGES FOR SIX MONTHS ENDED
JUNE 30, 2024:
|
||||||||||||||||||||||||||||
|
Issuance of share capital and warrants, net
|
3,056
|
(3,056
|
)
|
-
|
-
|
-
|
-
|
-
|
||||||||||||||||||||
|
Employee stock options expired
|
-
|
-
|
-
|
(66
|
)
|
-
|
-
|
(66
|
)
|
|||||||||||||||||||
|
Share-based compensation
|
-
|
-
|
-
|
1,036
|
-
|
-
|
1,036
|
|||||||||||||||||||||
|
Comprehensive loss for the period
|
-
|
-
|
-
|
-
|
-
|
(212
|
)
|
(212
|
)
|
|||||||||||||||||||
|
BALANCE AT JUNE 30, 2024
|
34,411
|
352,426
|
1,408
|
17,970
|
(1,416
|
)
|
(390,818
|
)
|
13,891
|
|||||||||||||||||||
|
Ordinary shares
|
Share premium
|
Warrants
|
Capital reserve
|
Other comprehensive loss
|
Accumulated deficit
|
Total
|
||||||||||||||||||||||
|
in USD thousands
|
||||||||||||||||||||||||||||
|
BALANCE AT JANUARY 1, 2025
|
38,097
|
353,693
|
5,367
|
17,547
|
(1,416
|
)
|
(399,827
|
)
|
13,461
|
|||||||||||||||||||
|
CHANGES FOR SIX MONTHS ENDED
JUNE 30, 2025:
|
||||||||||||||||||||||||||||
|
Issuance of share capital, pre-funded warrants and warrants, net
|
25,664
|
(20,988
|
)
|
501
|
-
|
-
|
-
|
5,177
|
||||||||||||||||||||
|
Pre-funded warrants exercised
|
8,058
|
(5,876
|
)
|
(2,182
|
)
|
-
|
-
|
-
|
-
|
|||||||||||||||||||
|
Employee stock options expired
|
-
|
646
|
-
|
(646
|
)
|
-
|
-
|
-
|
||||||||||||||||||||
|
Share-based compensation
|
-
|
-
|
-
|
247
|
-
|
-
|
247
|
|||||||||||||||||||||
|
Comprehensive income for the period
|
-
|
-
|
-
|
-
|
-
|
1,187
|
1,187
|
|||||||||||||||||||||
|
BALANCE AT JUNE 30, 2025
|
71,819
|
327,475
|
3,686
|
17,148
|
(1,416
|
)
|
(398,640
|
)
|
20,072
|
|||||||||||||||||||
F - 3
|
Six months ended
June 30,
|
||||||||
|
2024
|
2025
|
|||||||
|
in USD thousands
|
||||||||
|
CASH FLOWS - OPERATING ACTIVITIES
|
||||||||
|
Comprehensive income (loss) for the period
|
(212
|
)
|
1,187
|
|||||
|
Adjustments required to reflect net cash used in operating activities
(see appendix below)
|
(25,226
|
)
|
(3,955
|
)
|
||||
|
Net cash used in operating activities
|
(25,438
|
)
|
(2,768
|
)
|
||||
|
CASH FLOWS - INVESTING ACTIVITIES
|
||||||||
|
Investments in short-term deposits
|
(20,559
|
)
|
(24,818
|
)
|
||||
|
Maturities of short-term deposits
|
28,660
|
12,926
|
||||||
|
Sale (purchase) of property and equipment
|
(59
|
)
|
11
|
|||||
|
Net cash provided by (used in) investing activities
|
8,042
|
(11,881
|
)
|
|||||
|
CASH FLOWS - FINANCING ACTIVITIES
|
||||||||
|
Issuance of share capital and warrants, net of issuance costs
|
5,565
|
13,554
|
||||||
|
Net proceeds from loan
|
19,223
|
-
|
||||||
|
Repayments of loan
|
(1,547
|
)
|
(2,240
|
)
|
||||
|
Repayments of lease liabilities
|
(256
|
)
|
(262
|
)
|
||||
|
Net cash provided by financing activities
|
22,985
|
11,052
|
||||||
|
INCREASE (DECREASE) IN CASH AND CASH EQUIVALENTS
|
5,589
|
(3,597
|
)
|
|||||
|
CASH AND CASH EQUIVALENTS – BEGINNING OF PERIOD
|
4,255
|
10,436
|
||||||
|
EXCHANGE DIFFERENCES ON CASH AND CASH EQUIVALENTS
|
(221
|
)
|
350
|
|||||
|
CASH AND CASH EQUIVALENTS - END OF PERIOD
|
9,623
|
7,189
|
||||||
F - 4
BioLineRx Ltd.
|
Six months ended
June 30,
|
||||||||
|
2024
|
2025
|
|||||||
|
in USD thousands
|
||||||||
|
Adjustments required to reflect net cash used in operating activities:
|
||||||||
|
Income and expenses not involving cash flows:
|
||||||||
|
Depreciation and amortization
|
1,373
|
341
|
||||||
|
Exchange differences on cash and cash equivalents
|
221
|
(350
|
)
|
|||||
|
Fair value adjustments of warrants
|
(12,845
|
)
|
(6,410
|
)
|
||||
|
Warrant issuance costs
|
642
|
702
|
||||||
|
Share-based compensation
|
970
|
247
|
||||||
|
Interest on short-term deposits
|
201
|
48
|
||||||
|
Interest on loan
|
1,997
|
-
|
||||||
|
Exchange differences on lease liabilities
|
189
|
110
|
||||||
|
(7,252
|
)
|
(5,312
|
)
|
|||||
|
Changes in operating asset and liability items:
|
||||||||
|
Decrease (increase) in trade receivables
|
(2,821
|
)
|
2,398
|
|||||
|
Decrease (increase) in prepaid expenses and other receivables
|
(359
|
)
|
1,146
|
|||||
|
Decrease (increase) in inventory
|
(1,681
|
)
|
295
|
|||||
|
Decrease in accounts payable and accruals
|
(5,633
|
)
|
(2,482
|
)
|
||||
|
Decrease in contract liabilities
|
(7,480
|
)
|
-
|
|||||
|
(17,974
|
)
|
1,357
|
||||||
|
(25,226
|
)
|
(3,955
|
)
|
|||||
|
Supplemental information on interest received in cash
|
931
|
583
|
||||||
|
Supplemental information on interest paid in cash
|
971
|
694
|
||||||
|
Supplemental information on non-cash transactions:
|
||||||||
|
Changes in right-of-use asset and lease liabilities
|
58
|
45
|
||||||
|
Warrant issuance costs
|
207
|
-
|
||||||
F - 5
| a. |
General
|
F - 6
BioLineRx Ltd.
NOTES TO CONDENSED CONSOLIDATED INTERIM FINANCIAL STATEMENTS
(UNAUDITED)
| b. |
War in Israel
|
F - 7
BioLineRx Ltd.
NOTES TO CONDENSED CONSOLIDATED INTERIM FINANCIAL STATEMENTS
(UNAUDITED)
| c. |
Going concern
|
F - 8
BioLineRx Ltd.
NOTES TO CONDENSED CONSOLIDATED INTERIM FINANCIAL STATEMENTS
(UNAUDITED)
| d. |
Approval of financial statements
|
| a. |
General
|
F - 9
BioLineRx Ltd.
NOTES TO CONDENSED CONSOLIDATED INTERIM FINANCIAL STATEMENTS
(UNAUDITED)
| b. |
New international financial reporting standards, amendments to standards and new interpretations
|
F - 10
BioLineRx Ltd.
NOTES TO CONDENSED CONSOLIDATED INTERIM FINANCIAL STATEMENTS
(UNAUDITED)
| a. |
Securities purchase agreement – Highbridge
|
F - 11
BioLineRx Ltd.
NOTES TO CONDENSED CONSOLIDATED INTERIM FINANCIAL STATEMENTS
(UNAUDITED)
| a. |
Securities purchase agreement – Highbridge (cont.)
|
| b. |
January 2025 offering
|
F - 12
BioLineRx Ltd.
NOTES TO CONDENSED CONSOLIDATED INTERIM FINANCIAL STATEMENTS
(UNAUDITED)
| b. |
January 2025 offering (cont.)
|
F - 13
BioLineRx Ltd.
NOTES TO CONDENSED CONSOLIDATED INTERIM FINANCIAL STATEMENTS
(UNAUDITED)
|
Warrants
|
||||
|
in USD thousands
|
||||
|
Balance as of December 31, 2024
|
1,691
|
|||
|
Changes during 2025:
|
||||
|
Issuances
|
10,465
|
|||
|
Day One loss
|
(1,383
|
)
|
||
|
Recognition of Day One loss within profit or loss
|
163
|
|||
|
Changes in fair value through profit and loss
|
(6,573
|
)
|
||
|
Balance as of June 30, 2025
|
4,360
|
|||
|
Number of ordinary shares
|
||||||||
|
December 31,
|
June 30,
|
|||||||
|
2024
|
2025
|
|||||||
|
Authorized share capital
|
5,000,000,000
|
20,000,000,000
|
||||||
|
Issued and paid-up share capital
|
1,336,670,575
|
2,557,611,190
|
||||||
|
In USD and NIS
|
||||||||
|
December 31,
|
June 30,
|
|||||||
|
2024
|
2025
|
|||||||
|
Authorized share capital (in NIS)
|
500,000,000
|
2,000,000,000
|
||||||
|
Issued and paid-up share capital (in NIS)
|
133,667,057
|
255,761,119
|
||||||
|
Issued and paid-up share capital (in USD)
|
38,096,940
|
71,819,083
|
||||||
F - 14
BioLineRx Ltd.
NOTES TO CONDENSED CONSOLIDATED INTERIM FINANCIAL STATEMENTS
(UNAUDITED)
| a. |
Cost of revenues
|
|
Three months ended
June 30,
|
Six months ended
June 30,
|
|||||||||||||||
|
2024
|
2025
|
2024
|
2025
|
|||||||||||||
|
in USD thousands
|
in USD thousands
|
|||||||||||||||
|
Cost related to license revenues
|
330
|
72
|
1,071
|
106
|
||||||||||||
|
Amortization of intangible asset in respect of license revenues
|
482
|
-
|
1,128
|
-
|
||||||||||||
|
Cost of product sales
|
85
|
-
|
153
|
-
|
||||||||||||
|
897
|
72
|
2,352
|
106
|
|||||||||||||
| b. |
General and administrative expenses
|
|
|
• |
the clinical development, commercialization and market acceptance of our therapeutic candidates, including the degree and pace of market uptake of APHEXDA for the
mobilization of hematopoietic stem cells for autologous transplantation in multiple myeloma patients;
|
|
|
• |
the initiation, timing, progress and results of our preclinical studies, clinical trials and other therapeutic candidate development efforts;
|
|
|
• |
our ability to advance our therapeutic candidates into clinical trials or to successfully complete our preclinical studies or clinical trials;
|
|
|
• |
whether the clinical trial results for APHEXDA will be predictive of real-world results;
|
|
|
• |
our receipt of regulatory approvals for our therapeutic candidates, and the timing of other regulatory filings and approvals;
|
|
|
• |
whether access to APHEXDA is achieved in a commercially viable manner and whether APHEXDA receives adequate reimbursement from third-party payors;
|
|
|
• |
our ability to establish, manage, and maintain corporate collaborations, as well as the ability of our collaborators to execute on their development and
commercialization plans;
|
|
|
• |
our ability to integrate new therapeutic candidates and new personnel, as well as new collaborations;
|
|
|
• |
the interpretation of the properties and characteristics of our therapeutic candidates and of the results obtained with our therapeutic candidates in preclinical
studies or clinical trials;
|
|
|
• |
the implementation of our business model and strategic plans for our business and therapeutic candidates;
|
|
|
• |
the scope of protection that we are able to establish and maintain for intellectual property rights covering our therapeutic candidates and our ability to operate our
business without infringing the intellectual property rights of others;
|
|
|
• |
estimates of our expenses, future revenues, capital requirements and our need for and ability to access sufficient additional financing;
|
|
|
• |
risks related to changes in healthcare laws, rules and regulations in the United States or elsewhere;
|
|
|
• |
competitive companies, technologies and our industry;
|
|
|
• |
our ability to maintain the listing of our ADSs on Nasdaq;
|
|
|
• |
statements as to the impact of the political and security situation in Israel on our business, including the impact of Israel’s war with Hamas and other militant
groups, which may exacerbate the magnitude of the factors discussed above; and
|
|
|
• |
those factors referred to in “Item 3.D. Risk Factors,” “Item 4. Information on the Company,” and “Item 5. Operating and Financial Review and Prospects” in the Annual
Report, as well as in the Annual Report generally.
|
|
Project
|
Status
|
Expected Near Term Milestones
|
||
|
motixafortide
|
1.
|
FDA approval received on September 8, 2023 for stem-cell mobilization in multiple myeloma patients.
|
1.
|
Out-licensed to Ayrmid in November 2024; five-year long-term follow-up of GENESIS patients ongoing
|
|
2.
|
Reported preliminary data in September 2023 from
single-arm pilot phase of the investigator-initiated Phase 2 combination trial in first-line PDAC. Of 11 patients with metastatic pancreatic cancer enrolled, 7 patients (64%) experienced partial response (PR), of which 6 (55%) were
confirmed PRs with one patient experiencing resolution of the hepatic (liver) metastatic lesion. 3 patients (27%) experienced stable disease, resulting in a disease control rate of 91%. Based on these encouraging preliminary results, study
was substantially revised to a multi-institution, randomized Phase 2b trial of 108 patients. In May 2025, reported updated results from the pilot phase indicating that four of 11 patients remained progression free after more than
one year. Two patients underwent definitive treatment for mPDAC – one had complete resolution of all radiologically detected liver lesions and underwent definitive radiation to the primary pancreatic tumor, and one had a sustained partial
response and underwent pancreaticoduodenectomy with pathology demonstrating a complete response. An analysis of pre- and on-treatment biopsies and peripheral blood mononuclear cells (PBMCs) also revealed that CD8+ T-cell tumor infiltration
increased across all eleven patients treated with the motixafortide combination.
|
2.
|
First patient dosed in February 2024. Interim data planned for 2026 and full enrollment projected for 2027*
|
|
|
3.
|
Phase 1 study for gene therapies in SCD (with Washington University School of Medicine in St. Louis)**
|
3.
|
First patient dosed in December 2023 and initial data from the study released in November 2024. Final data planned in 2025*
|
|
|
4.
|
Phase 1 study for gene therapies in SCD (with St. Jude Children’s Research Hospital, Inc.)**
|
4.
|
First patient dosed in February 2025, with data planned in 2025/2026*
|
|
|
5.
|
IND approved in China for initiation of pivotal bridging study in SCM under license agreement with Gloria
|
5.
|
Initiation of the study is currently delayed***
|
|
|
6.
|
Phase 2b randomized study in first-line PDAC in China under license agreement with Gloria
|
6.
|
IND submission and protocol finalization is currently delayed***
|
|
| * |
These studies are investigator-initiated studies; therefore, the timelines are ultimately controlled by the independent investigators and are subject to change.
|
| ** |
Study to be continued under the Ayrmid License Agreement
|
| *** |
The planned studies of motixafortide in China under the Gloria License Agreement are currently not advancing according to schedule and it is unclear when such studies
will be initiated, if at all.
|
|
|
• |
the number of sites included in the clinical trials;
|
|
|
• |
the length of time required to enroll suitable patients;
|
|
|
• |
the number of patients that participate, and are eligible to participate, in the clinical trials;
|
|
|
• |
the duration of patient follow-up;
|
|
|
• |
whether the patients require hospitalization or can be treated on an outpatient basis;
|
|
|
• |
the development stage of the therapeutic candidate; and
|
|
|
• |
the efficacy and safety profile of the therapeutic candidate.
|
|
Three months ended June 30,
|
Six months ended June 30,
|
|||||||||||||||||||||||
|
2024
|
2025
|
Increase
(decrease) |
2024
|
2025
|
Increase
(decrease)
|
|||||||||||||||||||
|
(in thousands of U.S. dollars)
|
||||||||||||||||||||||||
|
License revenues
|
3,550
|
304
|
(3,246
|
)
|
9,481
|
559
|
(8,922
|
)
|
||||||||||||||||
|
Product sales, net
|
1,843
|
-
|
(1,843
|
)
|
2,767
|
-
|
(2,767
|
)
|
||||||||||||||||
|
Total revenues
|
5,393
|
304
|
(5,089
|
)
|
12,248
|
559
|
(11,689
|
)
|
||||||||||||||||
|
Three months ended June 30,
|
Six months ended June 30,
|
|||||||||||||||||||||||
|
2024
|
2025
|
Increase
(decrease)
|
2024
|
2025
|
Increase
(decrease)
|
|||||||||||||||||||
|
(in thousands of U.S. dollars)
|
||||||||||||||||||||||||
|
Amortization of intangible asset
|
482
|
-
|
(482
|
) |
1,128
|
-
|
(1,128
|
)
|
||||||||||||||||
|
Direct costs related to license revenues
|
155
|
-
|
(155
|
)
|
388
|
-
|
(388
|
)
|
||||||||||||||||
|
License fees and royalties payable to licensor
|
175
|
72
|
(103
|
)
|
683
|
106
|
(577
|
)
|
||||||||||||||||
|
Cost of product sales
|
85
|
-
|
(85
|
)
|
153
|
-
|
(153
|
)
|
||||||||||||||||
|
Total cost of revenues
|
897
|
72
|
(825
|
)
|
2,352
|
106
|
(2,246
|
)
|
||||||||||||||||
|
Three months ended June 30,
|
Six months ended June 30,
|
|||||||||||||||||||||||
|
2024
|
2025
|
Increase
(decrease)
|
2024
|
2025
|
Increase
(decrease)
|
|||||||||||||||||||
|
(in thousands of U.S. dollars)
|
||||||||||||||||||||||||
|
Research and development expenses
|
2,225
|
2,326
|
101
|
4,719
|
3,949
|
(770
|
)
|
|||||||||||||||||
|
Three months ended June 30,
|
Six months ended June 30,
|
|||||||||||||||||||||||
|
2024
|
2025
|
Increase
(decrease)
|
2024
|
2025
|
Increase
(decrease)
|
|||||||||||||||||||
|
(in thousands of U.S. dollars)
|
||||||||||||||||||||||||
|
Sales and marketing expenses
|
6,415
|
-
|
(6,415
|
)
|
12,757
|
-
|
(12,757
|
)
|
||||||||||||||||
|
Three months ended June 30,
|
Six months ended June 30,
|
|||||||||||||||||||||||
|
2024
|
2025
|
Increase
(decrease)
|
2024
|
2025
|
Increase
(decrease)
|
|||||||||||||||||||
|
(in thousands of U.S. dollars)
|
||||||||||||||||||||||||
|
General and administrative expenses
|
1,629
|
209
|
(1,420
|
)
|
3,015
|
1,198
|
(1,817
|
)
|
||||||||||||||||
|
Three months ended June 30,
|
Six months ended June 30,
|
|||||||||||||||||||||||
|
2024
|
2025
|
Increase
(decrease)
|
2024
|
2025
|
Increase
(decrease)
|
|||||||||||||||||||
|
(in thousands of U.S. dollars)
|
||||||||||||||||||||||||
|
Non-operating income (expenses), net
|
7,807
|
(1,851
|
)
|
(9,658
|
)
|
12,297
|
5,793
|
(6,504
|
)
|
|||||||||||||||
|
Three months ended June 30,
|
Six months ended June 30,
|
|||||||||||||||||||||||
|
2024
|
2025
|
Increase
(decrease)
|
2024
|
2025
|
Increase
(decrease)
|
|||||||||||||||||||
|
(in thousands of U.S. dollars)
|
||||||||||||||||||||||||
|
Financial income
|
535
|
490
|
(45
|
)
|
1,100
|
784
|
(316
|
)
|
||||||||||||||||
|
Financial expenses
|
(2,085
|
)
|
(276
|
)
|
(1,809
|
)
|
(3,014
|
)
|
(696
|
)
|
2,318
|
|||||||||||||
|
Net financial income (expenses)
|
(1,550
|
)
|
214
|
(1,764
|
)
|
(1,914
|
)
|
88
|
2,002
|
|||||||||||||||
|
|
• |
the progress and costs of our preclinical studies, clinical trials and other research and development activities;
|
|
|
• |
the scope, prioritization and number of our clinical trials and other research and development programs;
|
|
|
• |
the amount of revenues we receive, if any, under our collaboration or licensing arrangements;
|
|
|
• |
the costs of the development and expansion of our operational infrastructure;
|
|
|
• |
the costs and timing of obtaining regulatory approval of our therapeutic candidates;
|
|
|
• |
our success in effecting out-licensing arrangements with third parties;
|
|
|
• |
the ability of our collaborators and licensees to achieve development milestones, marketing approval and other events or developments under our collaboration and
out-licensing agreements;
|
|
|
• |
the costs of filing, prosecuting, enforcing and defending patent claims and other intellectual property rights;
|
|
|
• |
the costs and timing of securing manufacturing arrangements for clinical or commercial production;
|
|
|
• |
the costs of establishing sales and marketing capabilities or contracting with third parties to provide these capabilities for us;
|
|
|
• |
the costs of acquiring or undertaking development and commercialization efforts for any future therapeutic candidates;
|
|
|
• |
the magnitude of our general and administrative expenses;
|
|
|
• |
interest and principal payments on the loan from BlackRock;
|
|
|
• |
any cost that we may incur under current and future licensing arrangements relating to our therapeutic candidates; and
|
|
|
• |
market conditions.
|
|
Three months ended
June 30,
|
Six months ended
June 30,
|
|||||||||||||||
|
2024
|
2025
|
2024
|
2025
|
|||||||||||||
|
(in U.S. dollars)
|
||||||||||||||||
|
Earnings (loss) per ADS – basic and diluted
|
0.00
|
(1.00
|
)
|
(0.00
|
)
|
0.31
|
||||||||||
|
Earnings (loss) per ordinary share – basic and diluted
|
0.00
|
)0.00(
|
(0.00
|
)
|
0.00
|
|||||||||||
|
December 31,
2024
|
June 30,
2025
|
|||||||
|
(in number of ADSs)
|
||||||||
|
Authorized share capital
|
8,333,333
|
33,333,333
|
||||||
|
Issued and paid-up capital
|
2,227,784
|
4,262,685
|
||||||