| Exhibit |
Description
|
|
NAYAX LTD.
|
|||
|
By:
|
/s/ Gal Omer
|
||
|
Name: Gal Omer
|
|||
|
Title: Chief Legal Officer
|
|||
|
|
(1) |
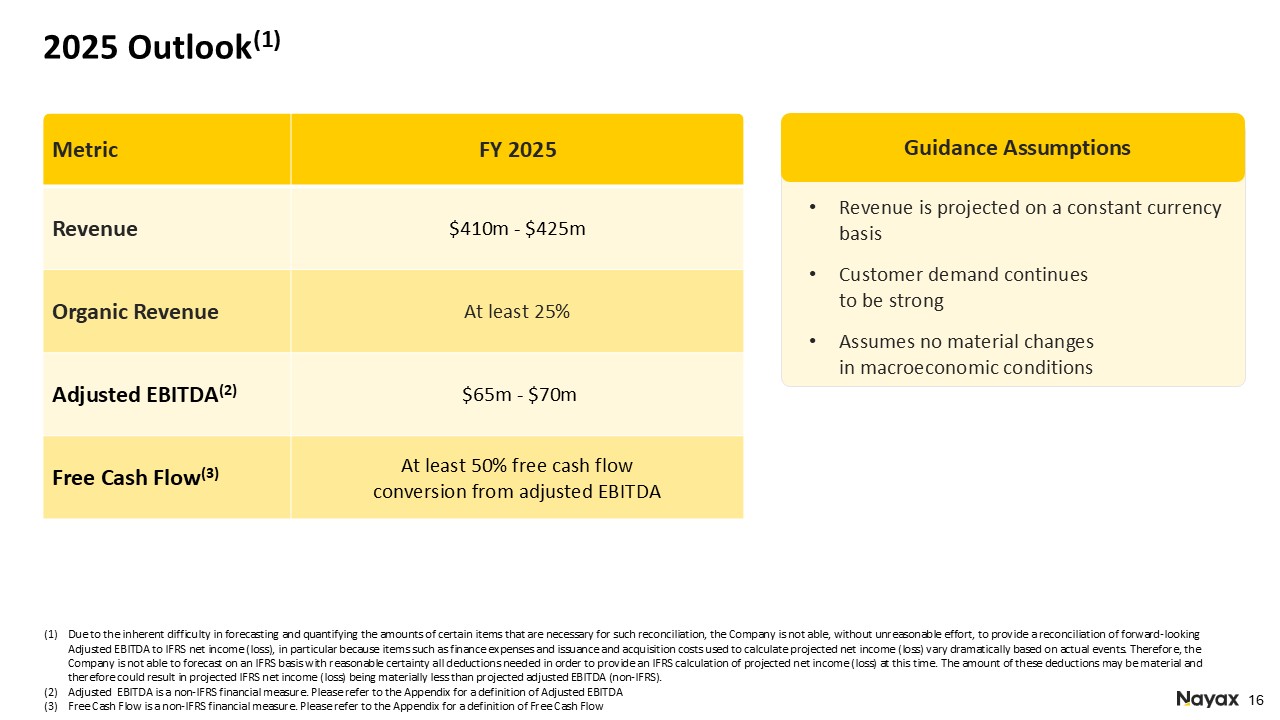
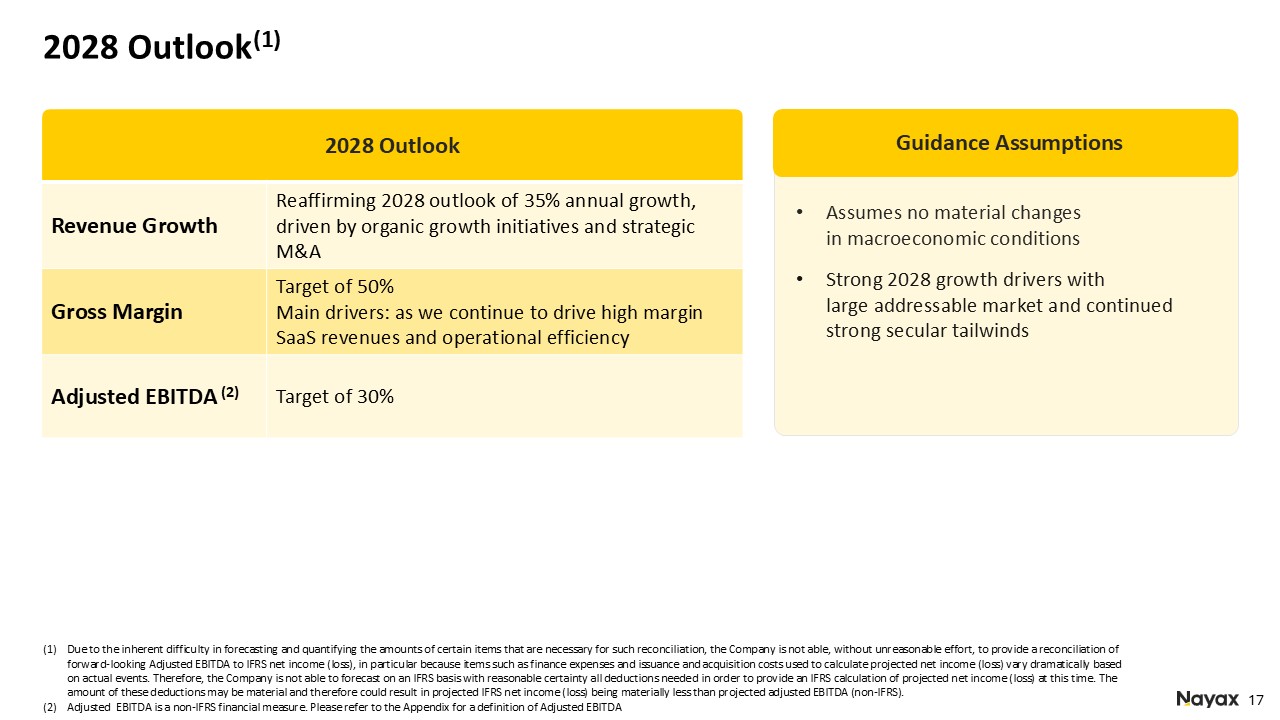
Adjusted EBITDA and Free Cash Flow are non-IFRS financial measures. Please refer to the tables at the end of this press release for a reconciliation of adjusted
EBITDA and Free cash flow to the most directly comparable IFRS measure. The Company does not provide a reconciliation of forward-looking adjusted EBITDA to IFRS net income (loss) due to the inherent difficulty in forecasting and quantifying
certain amounts that are necessary for such reconciliation, in particular, because special items such as finance expenses and Issuance and acquisition costs used to calculate projected net income (loss) vary dramatically based on actual
events. Therefore, the Company is not able to forecast on an IFRS basis with reasonable certainty all deductions needed in order to provide an IFRS calculation of projected net income (loss) at this time. The amount of these deductions may
be material and therefore could result in projected IFRS net income (loss) being materially less than projected adjusted EBITDA (non-IFRS).
|
|
Revenue Summary
|
Q2 2025 ($M)
|
Q2 2024 ($M)
|
Growth (%)
|
|
Payment processing fees
|
43.1
|
32.0
|
34.7%
|
|
SaaS revenue
|
27.6
|
21.4
|
29.0%
|
|
Total recurring revenue (1)
|
70.7
|
53.4
|
32.4%
|
|
POS devices revenue (2)
|
24.9
|
24.7
|
0.8%
|
|
Total revenue (3)
|
95.6
|
78.1
|
22.4%
|
|
Margin Summary
|
Q2 2025
|
Q2 2024
|
Variance
|
|
Payment processing margin
|
39.1%
|
33.6%
|
5.5%
|
|
SaaS margin
|
74.2%
|
78.3%
|
-4.1%
|
|
Total recurring margin
|
52.8%
|
51.5%
|
1.3%
|
|
POS devices margin
|
35.4%
|
28.7%
|
6.7%
|
|
Total margin
|
48.3%
|
44.3%
|
4.0%
|
|
|
• |
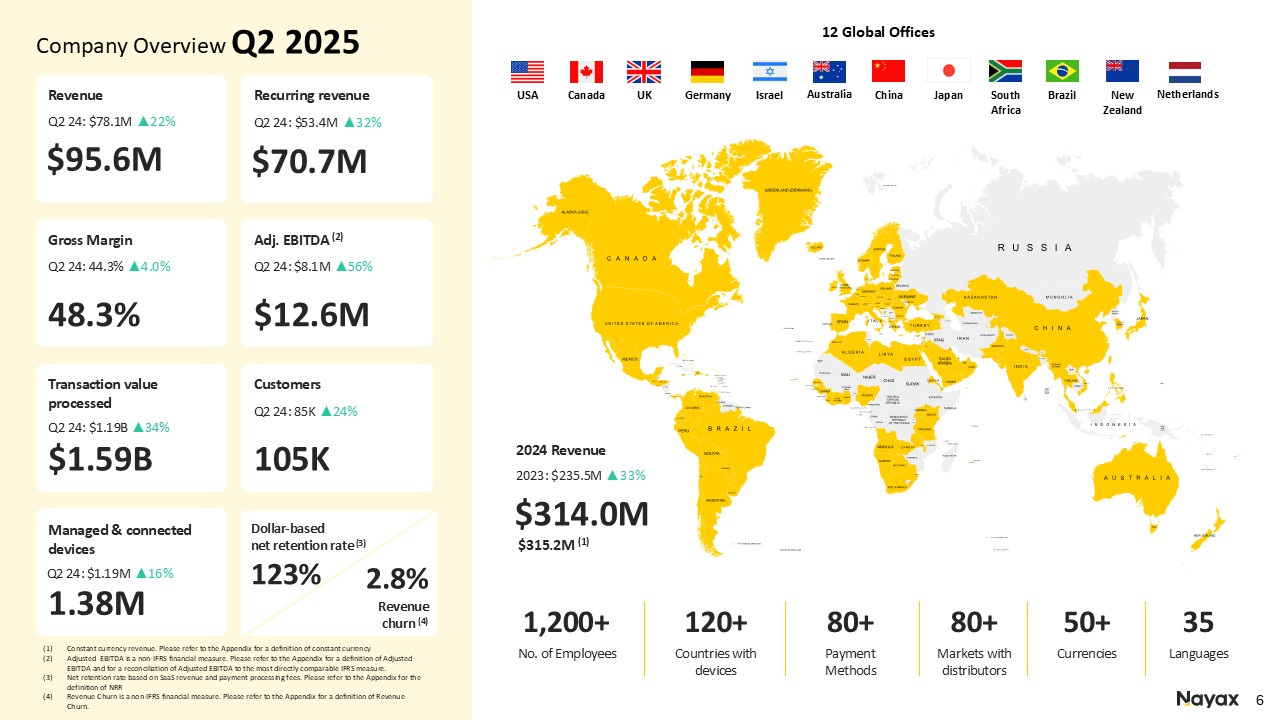
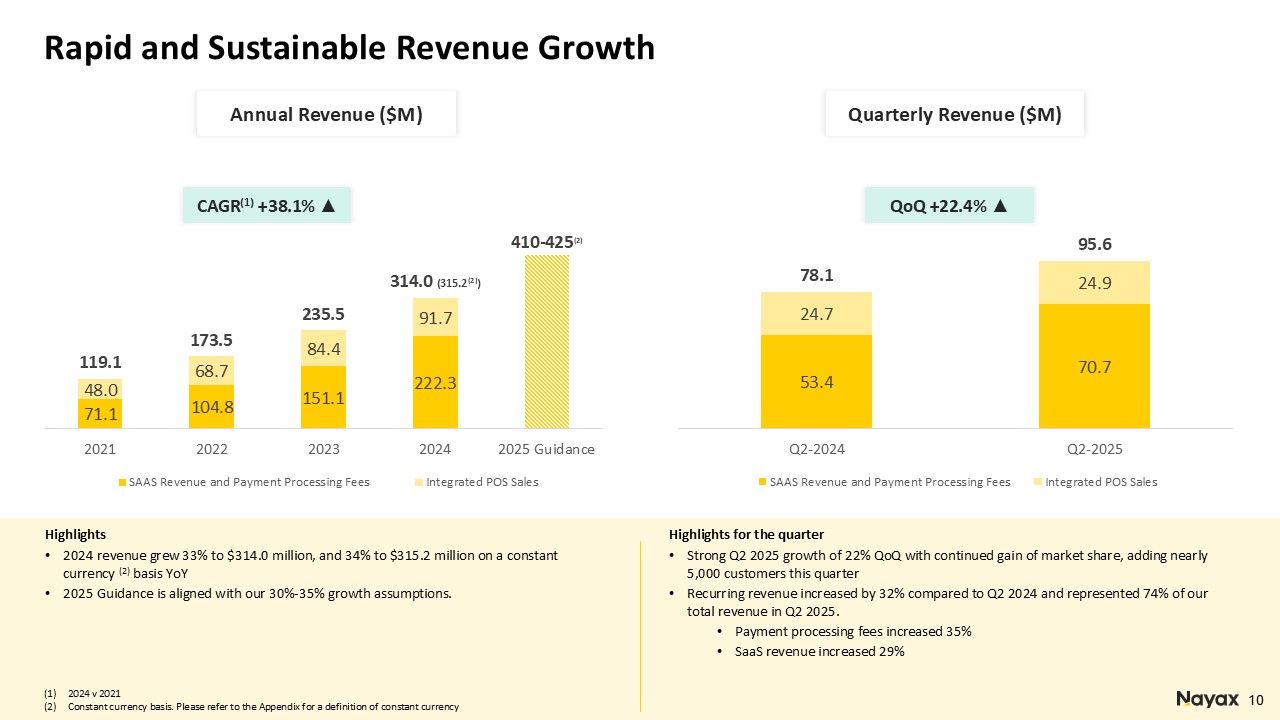
Revenue increased 22% to $95.6 million from $78.1 million driven by both new and existing customer expansion. Revenue includes $1.1 million of favorable foreign
exchange rate.
|
|
|
• |
Organic revenue growth for the quarter was 20%.
|
|
|
• |
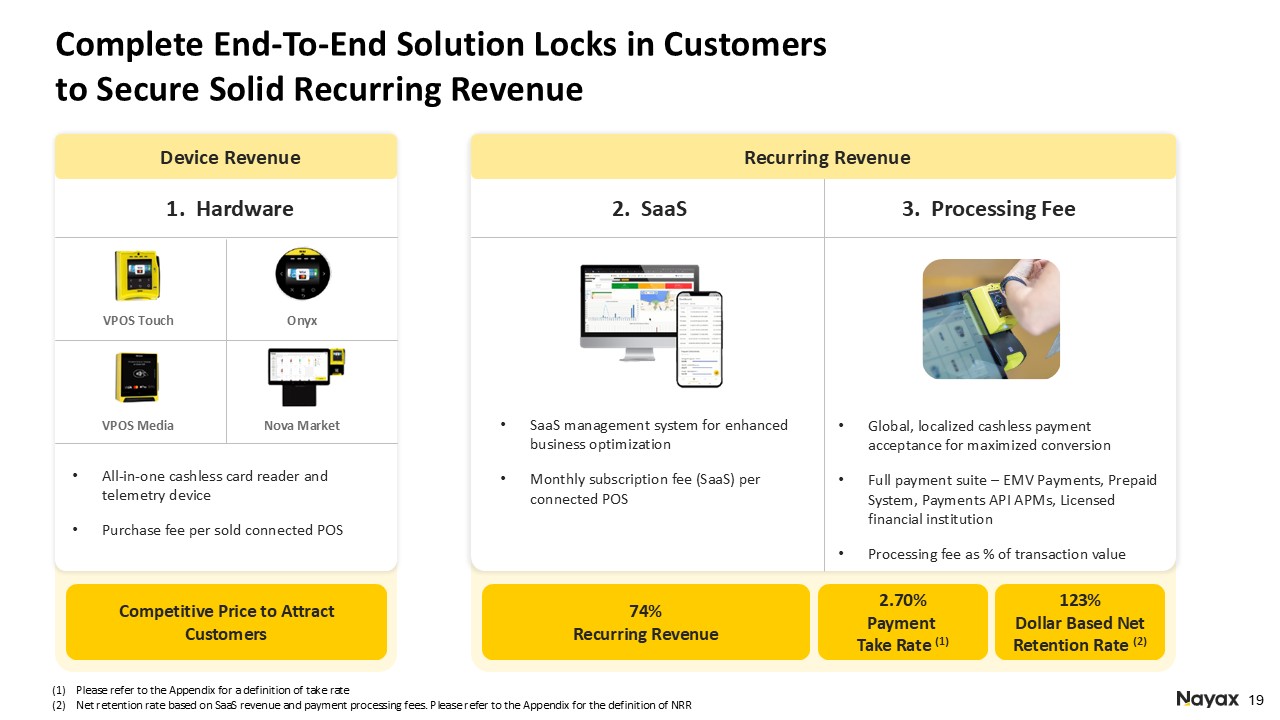
Recurring revenue from SaaS and payment processing fees grew 32%, to $70.7 million and represented 74% of total revenue.
|
|
|
o |
Processing revenue growth continues to demonstrate our success as a scalable and valued payment partner to our diverse customer base as the market continues its
cash-to-cashless conversion.
|
|
|
• |
Hardware revenue was $24.9 million consistent with the prior year period. We continue to see strong demand for our products, solutions and technology, supporting
both the unattended and attended markets.
|
|
|
• |
Gross margin improved to 48.3% from 44.3%. This was primarily due to:
|
|
|
o |
Recurring margin improved to 52.8% from 51.5%, partly from renegotiated contracts with several bank acquirers and the Company’s improved smart-routing capabilities.
|
|
|
o |
Hardware margin improved to 35.4% from 28.7% driven by continuing optimization of our supply chain infrastructure, and better component sourcing and cost.
|
|
|
• |
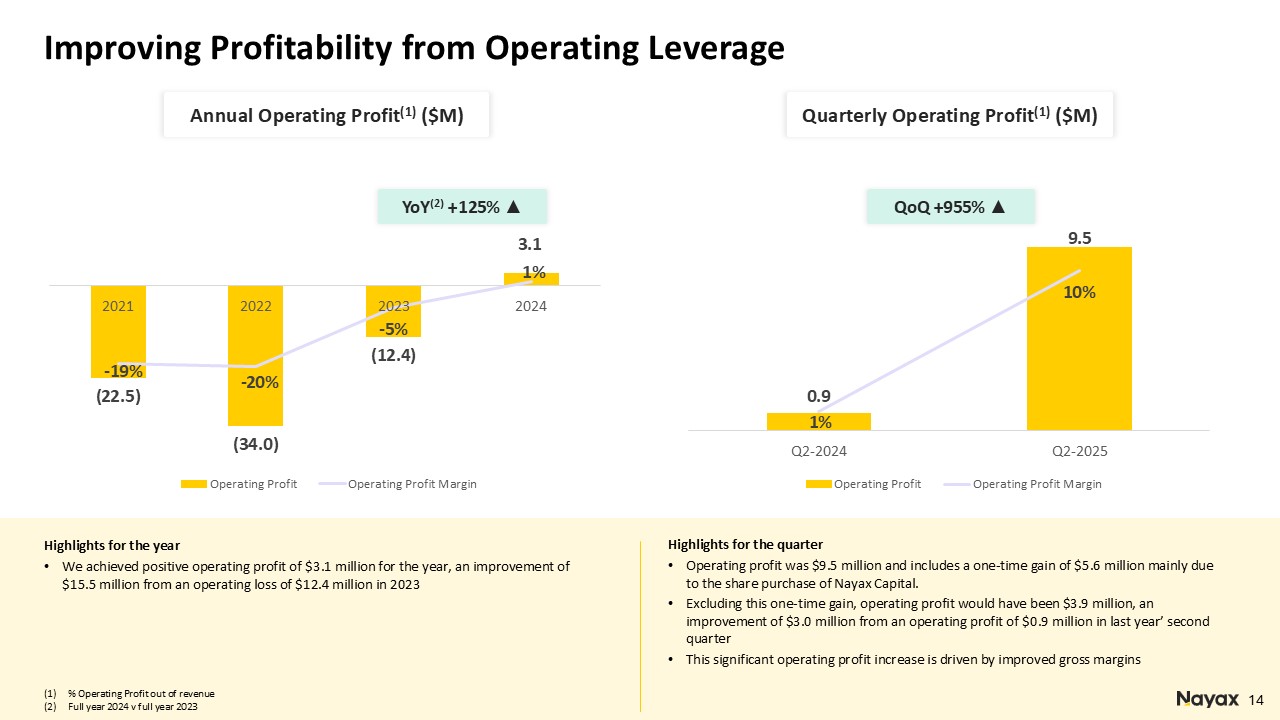
Operating profit was $9.5 million which includes a one-time gain of $5.6 million mainly due to the share purchase of the remaining 51% of Nayax Capital, an embedded financing solution for operators, previously held as a joint venture.
|
|
|
• |
Excluding this one-time gain, operating profit would have been $3.9 million, an improvement of $3.0 million from $0.9 million in last year’s second quarter.
|
|
|
• |
Net income for the quarter was $11.7 million. Excluding a one-time gain associated with the share purchase of Nayax Capital, net income would have been $6.1
million, a significant improvement of $9.1 million compared to a net loss of $3.0 million in the prior year period.
|
|
|
• |
Basic and diluted earnings per share for the quarter ending June 30, 2025 was $0.316 and $0.308, respectively. The basic loss per share for the quarter ended June
30, 2024 was $(0.083) per share.
|
|
|
• |
Weighted average number of basic and diluted shares were 36,913,470 and 37,786,355, respectively, for the second quarter of 2025, compared the weighted average
number of basic shares 36,223,886 for the second quarter of 2024.
|
|
|
• |
Adjusted EBITDA was $12.6 million, representing a margin of 13% of total revenue. This compared to Adjusted EBITDA of $8.1 million, representing 10% of total
revenue in the prior year period.
|
|
|
• |
Cash flow provided from operating activities was $12.9 million and free cash flow was $5.6 million.
|
|
|
• |
As of June 30, 2025, the Company had $172.3 million in cash and cash equivalents and short-term deposits. Short-term and long-term debt balances was at $155.7
million.
|
|
Key Performance Indicators
|
Q2 2025
|
Q2 2024
|
Growth (%)
|
|
Total transaction value ($m)
|
1,593
|
1,186
|
34.3%
|
|
Number of processed transactions (millions)
|
726
|
583
|
24.5%
|
|
Take rate (payments) (4)
|
2.70%
|
2.70%
|
0.00%
|
|
Managed and connected devices (thousands) (5)
|
1,377
|
1,186
|
16.1%
|
|
Customers (6)
|
105,000
|
85,000
|
23.5%
|
|
|
• |
Total transaction value grew by 34.3% to nearly $1.6 billion.
|
|
|
• |
Number of processed transactions increased 24.5% to 726 million.
|
|
|
• |
Take rate was 2.7% as the Company continues to expand into additional verticals.
|
|
|
• |
Total number of managed and connected devices was approximately 1.38 million devices representing an increase of 16.1%. Nayax added more than 48,000 devices in this
quarter.
|
|
|
• |
Growth in the customer base continued at a healthy pace, adding nearly 5,000 new customers in the quarter, bringing the total customer base to nearly 105,000, an
increase of 23.5%.
|
|
|
• |
The dollar-based net retention rate remained high at 123%, reflecting strong customer satisfaction, while the customer churn rate remained low at 2.8%.
|
|
|
• |
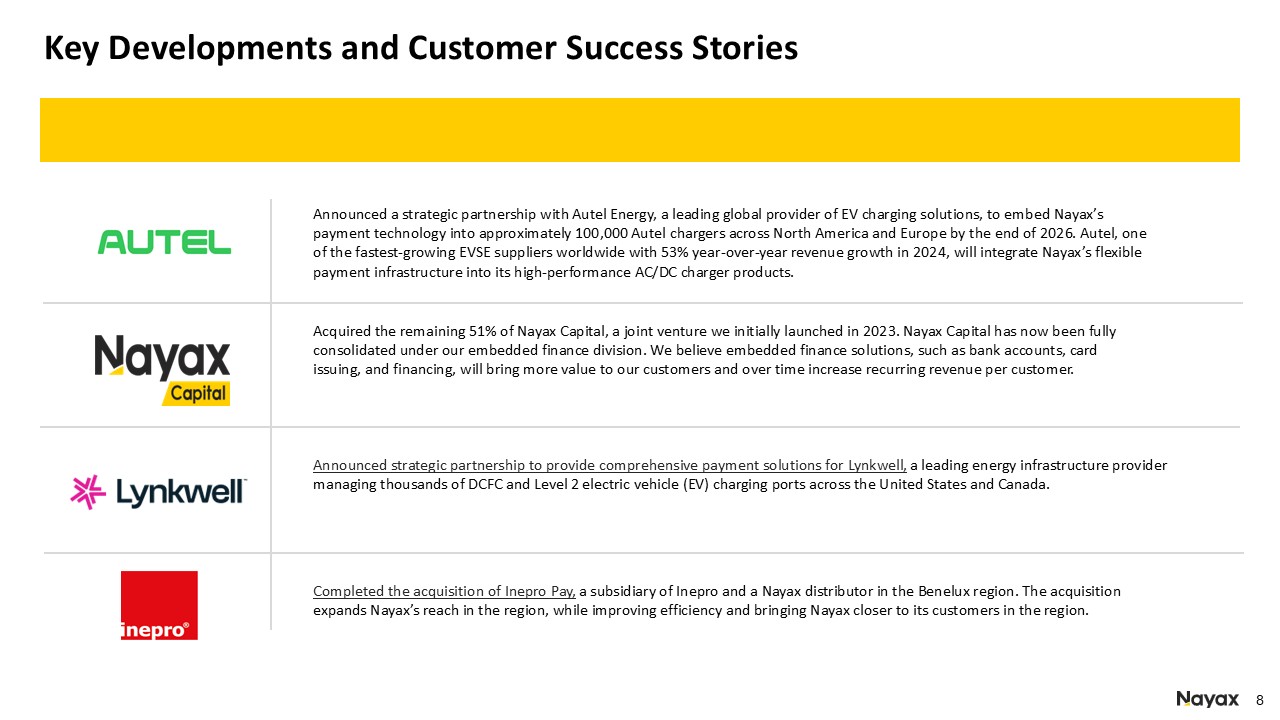
Announced a strategic partnership with Autel Energy, a leading global
provider of EV charging solutions, to embed Nayax’s payment technology into approximately 100,000 Autel chargers across North America and Europe by the end of 2026. Autel, one of the fastest-growing EV charging suppliers worldwide with
53% year-over-year revenue growth in 2024, will integrate Nayax’s flexible payment infrastructure into its high-performance AC/DC charger products. The partnership enables faster deployment for operators and improves the charging and
payment experience for drivers.
|
|
|
• |
Acquired the remaining 51% of Nayax Capital, a joint venture we initially launched in 2023. Nayax Capital has now been fully consolidated under our embedded finance
division. Embedded finance solutions, such as bank accounts, card issuing, and financing, will bring more value to our customers and increase recurring revenue per customer over time.
|
|
|
• |
Announced strategic partnership to provide comprehensive payment solutions for
Lynkwell, a leading energy infrastructure provider managing thousands of charging stations across North America and manufacturing its AC chargers in the United States. Lynkwell’s ViaLynkTM network is the eighth-largest public charging network in the United States.
|
|
|
• |
Completed the acquisition of Inepro Pay, a Nayax distributor in the
Benelux region. The acquisition expands Nayax’s reach in the region, while improving efficiency and bringing Nayax closer to its customers.
|
|
|
• |
U.S. TOLL-FREE: 1-877-737-7051
|
|
|
• |
ISRAEL TOLL-FREE: 1-809-455-690
|
|
|
• |
INTERNATIONAL: 1-201-689-8878
|
|
|
• |
Replay TOLL-FREE: 1-844-512-2921
|
|
|
• |
Replay TOLL/INTERNATIONAL: 1-412-317-6671
|
|
|
• |
Replay TOLL/Israel: 1-809-458-327
|
|
|
• |
Replay Pin Number: 13755150
|
|
Public Relations Contact:
Scott Gamm
Strategy Voice Associates
Scott@strategyvoiceassociates.com
|
Investor Relations Contact:
Aaron Greenberg
Chief Strategy Officer
IR@nayax.com
|
|
June 30
|
December 31
|
|||||||
|
2025
|
2024
|
|||||||
|
U.S. dollars in thousands
|
||||||||
|
ASSETS
|
||||||||
|
CURRENT ASSETS:
|
||||||||
|
Cash and cash equivalents
|
172,267
|
83,130
|
||||||
|
Restricted cash transferable to customers for processing activity
|
80,756
|
60,299
|
||||||
|
Short-term bank deposits
|
638
|
9,327
|
||||||
|
Receivables in respect of processing activity
|
80,418
|
45,071
|
||||||
|
Trade receivable, net
|
61,815
|
55,694
|
||||||
|
Inventory
|
23,177
|
19,768
|
||||||
|
Other current assets
|
20,127
|
14,368
|
||||||
|
Total current assets
|
439,198
|
287,657
|
||||||
|
NON-CURRENT ASSETS:
|
||||||||
|
Long-term bank deposits
|
1,216
|
2,155
|
||||||
|
Other long-term assets
|
7,589
|
4,253
|
||||||
|
Investment in associate
|
-
|
3,754
|
||||||
|
Right-of-use assets, net
|
5,111
|
6,292
|
||||||
|
Property and equipment, net
|
15,496
|
11,112
|
||||||
|
Goodwill and intangible assets, net
|
164,698
|
117,670
|
||||||
|
Total non-current assets
|
194,110
|
145,236
|
||||||
|
TOTAL ASSETS
|
633,308
|
432,893
|
||||||
|
June 30
|
December 31
|
|||||||
|
2025
|
2024
|
|||||||
|
U.S. dollars in thousands
|
||||||||
|
LIABILITIES AND EQUITY
|
||||||||
|
CURRENT LIABILITIES:
|
||||||||
|
Short-term bank credit and short term loan
|
-
|
25,276
|
||||||
|
Current maturities of long-term bank loans
|
3,220
|
3,978
|
||||||
|
Current maturities of other long-term liabilities
|
5,751
|
1,353
|
||||||
|
Current maturities of leases liabilities
|
2,830
|
2,967
|
||||||
|
Payables in respect of processing activity
|
188,170
|
130,958
|
||||||
|
Trade payables
|
19,407
|
21,059
|
||||||
|
Other payables
|
41,533
|
33,887
|
||||||
|
Total current liabilities
|
260,911
|
219,478
|
||||||
|
NON-CURRENT LIABILITIES:
|
||||||||
|
Long-term bank loans
|
12,187
|
18,605
|
||||||
|
Other long-term liabilities
|
11,076
|
20,716
|
||||||
|
Post-employment benefit obligations, net
|
552
|
497
|
||||||
|
Bonds
|
140,252
|
-
|
||||||
|
Lease liabilities
|
3,158
|
4,078
|
||||||
|
Deferred income taxes
|
3,685
|
4,274
|
||||||
|
Total non-current liabilities
|
170,910
|
48,170
|
||||||
|
TOTAL LIABILITIES
|
431,821
|
267,648
|
||||||
|
EQUITY:
|
||||||||
|
Shareholders Equity:
|
||||||||
|
Share capital
|
9
|
9
|
||||||
|
Additional paid in capital
|
230,733
|
220,715
|
||||||
|
Capital reserves
|
10,394
|
7,832
|
||||||
|
Accumulated deficit
|
(39,649
|
)
|
(63,311
|
)
|
||||
|
TOTAL EQUITY
|
201,487
|
165,245
|
||||||
|
TOTAL LIABILITIES AND EQUITY
|
633,308
|
432,893
|
||||||
|
Six months ended
June 30 |
Three months ended
June 30 |
|||||||||||||||
|
2025
|
2024
|
2025
|
2024
|
|||||||||||||
|
U.S. dollars in thousands
|
||||||||||||||||
|
(Excluding loss per share data)
|
||||||||||||||||
|
Revenues
|
176,699
|
142,049
|
95,589
|
78,087
|
||||||||||||
|
Cost of revenues
|
(90,628
|
)
|
(79,474
|
)
|
(49,417
|
)
|
(43,499
|
)
|
||||||||
|
Gross Profit
|
86,071
|
62,575
|
46,172
|
34,588
|
||||||||||||
|
Research and development expenses
|
(14,884
|
)
|
(12,762
|
)
|
(7,732
|
)
|
(6,417
|
)
|
||||||||
|
Selling, general and administrative expenses
|
(58,759
|
)
|
(45,284
|
)
|
(31,218
|
)
|
(23,824
|
)
|
||||||||
|
Depreciation and amortization in respect of technology and capitalized development costs
|
(6,502
|
)
|
(5,383
|
)
|
(3,326
|
)
|
(2,812
|
)
|
||||||||
|
Other income (expenses)
|
11,710
|
(506
|
)
|
5,621
|
(378
|
)
|
||||||||||
|
Share of losses of equity method investees
|
(226
|
)
|
(538
|
)
|
-
|
(248
|
)
|
|||||||||
|
Profit (Loss) from ordinary operations
|
17,410
|
(1,898
|
)
|
9,517
|
909
|
|||||||||||
|
Financial Income
|
7,935
|
1,089
|
6,099
|
652
|
||||||||||||
|
Financial Expense
|
(5,958
|
)
|
(7,078
|
)
|
(3,631
|
)
|
(4,253
|
)
|
||||||||
|
Profit (loss) before taxes on income
|
19,387
|
(7,887
|
)
|
11,985
|
(2,692
|
)
|
||||||||||
|
Tax expense
|
(579
|
)
|
(82
|
)
|
(333
|
)
|
(321
|
)
|
||||||||
|
Profit (loss) for the period
|
18,808
|
(7,969
|
)
|
11,652
|
(3,013
|
)
|
||||||||||
|
Basic earnings (loss) per share
|
0.511
|
(0.227
|
)
|
0.316
|
(0.083
|
)
|
||||||||||
|
Diluted earnings per share
|
0.498
|
-
|
0.308
|
-
|
||||||||||||
|
Six months ended
June 30 |
Three months ended
June 30 |
|||||||||||||||
|
2025
|
2024
|
2025
|
2024
|
|||||||||||||
|
U.S. dollars in thousands
|
||||||||||||||||
|
Profit (loss) for the period
|
18,808
|
(7,969
|
)
|
11,652
|
(3,013
|
)
|
||||||||||
|
Other comprehensive income (loss) for the period:
|
||||||||||||||||
|
Items that may be reclassified to profit or loss:
|
||||||||||||||||
|
Gain (loss) from translation of financial statements of foreign operations
|
529
|
(39
|
)
|
(157
|
)
|
3
|
||||||||||
|
Gain on cash flow hedges
|
2,033
|
525
|
3,104
|
314
|
||||||||||||
|
Total comprehensive profit (loss) for the period
|
21,370
|
(7,483
|
)
|
14,599
|
(2,696
|
)
|
||||||||||
|
Share
capital |
Additional paid in capital
|
Remeasurement of post-employment benefit obligations
|
Other capital reserves
|
Foreign currency translation reserve
|
Accumulated
deficit |
Total
equity |
||||||||||||||||||||||
|
U.S. dollars in thousands
|
||||||||||||||||||||||||||||
|
Balance as of January 1, 2024 (audited)
|
8
|
153,524
|
248
|
9,545
|
(150
|
)
|
(65,585
|
)
|
97,590
|
|||||||||||||||||||
|
Changes in the six months ended June 30, 2024:
|
||||||||||||||||||||||||||||
|
Loss for the period
|
-
|
-
|
-
|
-
|
-
|
(7,969
|
)
|
(7,969
|
)
|
|||||||||||||||||||
|
Issuance of ordinary shares
|
1
|
63,190
|
-
|
-
|
-
|
-
|
63,191
|
|||||||||||||||||||||
|
Other comprehensive income for the period
|
-
|
-
|
-
|
(39
|
)
|
525
|
-
|
486
|
||||||||||||||||||||
|
Employee options exercised and vesting of restricted shares
|
*
|
2,078
|
-
|
-
|
-
|
-
|
2,078
|
|||||||||||||||||||||
|
Share-based payment
|
-
|
-
|
-
|
-
|
-
|
3,311
|
3,311
|
|||||||||||||||||||||
|
Balance as of June 30, 2024 (unaudited)
|
9
|
218,792
|
248
|
9,506
|
375
|
(70,243
|
)
|
158,687
|
||||||||||||||||||||
|
Balance as of January 1, 2025 (audited)
|
9
|
220,715
|
463
|
9,973
|
(2,604
|
)
|
(63,311
|
)
|
165,245
|
|||||||||||||||||||
|
Changes in the six months ended June 30, 2025:
|
||||||||||||||||||||||||||||
|
Profit for the period
|
-
|
-
|
-
|
-
|
-
|
18,808
|
18,808
|
|||||||||||||||||||||
|
Issuance of warrants, net
|
-
|
5,706
|
-
|
-
|
-
|
-
|
5,706
|
|||||||||||||||||||||
|
Issuance of options due acquisition
|
-
|
1,222
|
-
|
-
|
-
|
-
|
1,222
|
|||||||||||||||||||||
|
Other comprehensive income for the period
|
-
|
-
|
-
|
2,033
|
529
|
-
|
2,562
|
|||||||||||||||||||||
|
Employee options exercised and vesting of restricted shares
|
*
|
3,090
|
-
|
-
|
-
|
-
|
3,090
|
|||||||||||||||||||||
|
Share-based payment
|
-
|
-
|
-
|
-
|
-
|
4,854
|
4,854
|
|||||||||||||||||||||
|
Balance as of June 30, 2025 (unaudited)
|
9
|
230,733
|
463
|
12,006
|
(2,075
|
)
|
(39,649
|
)
|
201,487
|
|||||||||||||||||||
|
Share
capital |
Additional paid in capital
|
Remeasurement of post-employment benefit obligations
|
Other capital reserves
|
Foreign currency translation reserve
|
Accumulated
deficit |
Total
equity |
||||||||||||||||||||||
|
U.S. dollars in thousands
|
||||||||||||||||||||||||||||
|
Balance as of March 31, 2024 (unaudited)
|
9
|
217,330
|
248
|
9,503
|
61
|
(68,964
|
)
|
158,187
|
||||||||||||||||||||
|
Changes in the three months ended June 30, 2024:
|
||||||||||||||||||||||||||||
|
Loss for the period
|
-
|
-
|
-
|
-
|
-
|
(3,013
|
)
|
(3,013
|
)
|
|||||||||||||||||||
|
Other comprehensive income for the period
|
-
|
-
|
-
|
3
|
314
|
-
|
317
|
|||||||||||||||||||||
|
Employee options exercised and vesting of restricted shares
|
*
|
957
|
-
|
-
|
-
|
-
|
957
|
|||||||||||||||||||||
|
Issuance of ordinary shares
|
*
|
505
|
-
|
-
|
-
|
-
|
505
|
|||||||||||||||||||||
|
Share-based payment
|
-
|
-
|
-
|
-
|
-
|
1,734
|
1,734
|
|||||||||||||||||||||
|
Balance as of June 30, 2024 (unaudited)
|
9
|
218,792
|
248
|
9,506
|
375
|
(70,243
|
)
|
158,687
|
||||||||||||||||||||
|
Balance as of March 31, 2025 (unaudited)
|
9
|
227,571
|
463
|
8,902
|
(1,918
|
)
|
(54,224
|
)
|
180,803
|
|||||||||||||||||||
|
Changes in the three months ended June 30, 2025:
|
||||||||||||||||||||||||||||
|
Profit for the period
|
-
|
-
|
-
|
-
|
-
|
11,652
|
11,652
|
|||||||||||||||||||||
|
Issuance of options due acquisition
|
-
|
1,222
|
-
|
-
|
-
|
-
|
1,222
|
|||||||||||||||||||||
|
Other comprehensive income for the period
|
-
|
-
|
-
|
3,104
|
(157
|
)
|
-
|
2,947
|
||||||||||||||||||||
|
Employee options exercised and vesting of restricted shares
|
*
|
1,940
|
-
|
-
|
-
|
-
|
1,940
|
|||||||||||||||||||||
|
Share-based payment
|
-
|
-
|
-
|
-
|
-
|
2,923
|
2,923
|
|||||||||||||||||||||
|
Balance as of June 30, 2025 (unaudited)
|
9
|
230,733
|
463
|
12,006
|
(2,075
|
)
|
(39,649
|
)
|
201,487
|
|||||||||||||||||||
|
Six months ended
June 30 |
Three months ended
June 30 |
|||||||||||||||
|
2025
|
2024
|
2025
|
2024
|
|||||||||||||
|
U.S. dollars in thousands
|
||||||||||||||||
|
CASH FLOWS FROM OPERATING ACTIVITIES:
|
||||||||||||||||
|
Net profit (loss) for the period
|
18,808
|
(7,969
|
)
|
11,652
|
(3,013
|
)
|
||||||||||
|
Adjustments to reconcile net profit (loss) to net cash provided by operations (see Appendix A)
|
(4,573
|
)
|
17,299
|
1,294
|
12,203
|
|||||||||||
|
Net cash provided by operating activities
|
14,235
|
9,330
|
12,946
|
9,190
|
||||||||||||
|
CASH FLOWS FROM INVESTING ACTIVITIES:
|
||||||||||||||||
|
Capitalized development costs
|
(12,488
|
)
|
(9,788
|
)
|
(6,262
|
)
|
(5,417
|
)
|
||||||||
|
Acquisition of property and equipment
|
(1,906
|
)
|
(1,009
|
)
|
(1,110
|
)
|
(849
|
)
|
||||||||
|
Loans granted to related company
|
(2,062
|
)
|
(559
|
)
|
(1,962
|
)
|
(300
|
)
|
||||||||
|
Decrease (Increase) in bank deposits
|
9,006
|
(22,715
|
)
|
(549
|
)
|
312
|
||||||||||
|
Interest received
|
2,873
|
1,045
|
1,576
|
612
|
||||||||||||
|
Investments in financial assets
|
(5,000
|
)
|
(284
|
)
|
(5,000
|
)
|
-
|
|||||||||
|
Proceeds from sub-lessee
|
22
|
111
|
-
|
56
|
||||||||||||
|
Payments for acquisitions of subsidiaries, net of cash acquired
|
(15,541
|
)
|
(14,934
|
)
|
(7,341
|
)
|
(14,934
|
)
|
||||||||
|
Repayment of contingent liability due consideration of subsidiary acquisition
|
(5,519
|
)
|
-
|
(1,983
|
)
|
-
|
||||||||||
|
Net cash used in investing activities
|
(30,615
|
)
|
(48,133
|
)
|
(22,631
|
)
|
(20,520
|
)
|
||||||||
|
CASH FLOWS FROM FINANCING ACTIVITIES:
|
||||||||||||||||
|
Issuance of ordinary shares
|
-
|
62,686
|
-
|
-
|
||||||||||||
|
Proceeds from issue of bonds and warrants, net
|
132,941
|
-
|
-
|
-
|
||||||||||||
|
Interest paid
|
(1,598
|
)
|
(2,339
|
)
|
(400
|
)
|
(1,254
|
)
|
||||||||
|
Changes in short-term bank credit
|
(26,000
|
)
|
(12,404
|
)
|
(774
|
)
|
7,051
|
|||||||||
|
Receipt of long-term bank loans
|
-
|
17,000
|
-
|
-
|
||||||||||||
|
Repayment of long-term bank loans
|
(7,079
|
)
|
(2,180
|
)
|
(805
|
)
|
(1,916
|
)
|
||||||||
|
Repayment of long-term loans from others
|
-
|
(1,723
|
)
|
-
|
(581
|
)
|
||||||||||
|
Repayment of other long-term liabilities
|
(1,000
|
)
|
(100
|
)
|
-
|
(76
|
)
|
|||||||||
|
Employee options exercised
|
2,680
|
2,626
|
1,484
|
1,730
|
||||||||||||
|
Principal lease payments
|
(1,433
|
)
|
(1,269
|
)
|
(729
|
)
|
(683
|
)
|
||||||||
|
Net cash provided by (used in) financing activities
|
98,511
|
62,297
|
(1,224
|
)
|
4,271
|
|||||||||||
|
Increase (decrease) in cash and cash equivalents
|
82,131
|
23,494
|
(10,909
|
)
|
(7,059
|
)
|
||||||||||
|
Balance of cash and cash equivalents at beginning of period
|
83,130
|
38,386
|
176,763
|
68,569
|
||||||||||||
|
Gains (losses) from exchange differences on cash and cash equivalents
|
6,889
|
(994
|
)
|
6,605
|
(523
|
)
|
||||||||||
|
Gains (losses) from translation differences on cash and cash equivalents of foreign operations
|
117
|
1,026
|
(192
|
)
|
925
|
|||||||||||
|
Balance of cash and cash equivalents at end of period
|
172,267
|
61,912
|
172,267
|
61,912
|
||||||||||||
|
Six months ended
June 30 |
Three months ended
June 30 |
|||||||||||||||
|
2025
|
2024
|
2025
|
2024
|
|||||||||||||
|
U.S. dollars in thousands
|
||||||||||||||||
|
Appendix A – adjustments to reconcile net loss to net cash provided by operations:
|
||||||||||||||||
|
Adjustments in respect of:
|
||||||||||||||||
|
Depreciation and amortization
|
11,735
|
9,561
|
6,014
|
5,043
|
||||||||||||
|
Post-employment benefit obligations, net
|
35
|
(5
|
)
|
24
|
(9
|
)
|
||||||||||
|
Deferred taxes
|
(1,072
|
)
|
(772
|
)
|
(381
|
)
|
(283
|
)
|
||||||||
|
Finance expenses, net
|
3,681
|
2,562
|
5,143
|
1,750
|
||||||||||||
|
Expenses in respect of long-term employee benefits
|
-
|
634
|
-
|
334
|
||||||||||||
|
Profit from gaining control in subsidiary
|
(12,152
|
)
|
-
|
(6,063
|
)
|
-
|
||||||||||
|
Share of loss of equity method investee
|
226
|
538
|
-
|
248
|
||||||||||||
|
Long-term deferred income
|
105
|
570
|
144
|
261
|
||||||||||||
|
Expenses in respect of share-based compensation
|
4,295
|
2,965
|
2,512
|
1,512
|
||||||||||||
|
Total adjustments
|
6,853
|
16,053
|
7,393
|
8,856
|
||||||||||||
|
Changes in operating asset and liability items:
|
||||||||||||||||
|
Increase in restricted cash transferable to customers for processing activity
|
(20,435
|
)
|
(4,539
|
)
|
(8,766
|
)
|
(447
|
)
|
||||||||
|
Increase in receivables from processing activity
|
(35,347
|
)
|
(29,098
|
)
|
(15,895
|
)
|
(6,707
|
)
|
||||||||
|
Increase in trade receivables
|
(4,295
|
)
|
(3,289
|
)
|
(5,693
|
)
|
(3,684
|
)
|
||||||||
|
Decrease (Increase) in other current assets
|
(2,448
|
)
|
2,220
|
(2,704
|
)
|
2,873
|
||||||||||
|
Decrease (Increase) in inventory
|
(2,498
|
)
|
1,445
|
(1,714
|
)
|
901
|
||||||||||
|
Increase in payables in respect of processing activity
|
57,212
|
35,257
|
25,689
|
9,304
|
||||||||||||
|
Increase (Decrease) in trade payables
|
(7,690
|
)
|
(269
|
)
|
(1,309
|
)
|
4,115
|
|||||||||
|
Increase (Decrease) in other payables
|
4,075
|
(481
|
)
|
4,293
|
(3,008
|
)
|
||||||||||
|
Total changes in operating assets and liability items
|
(11,426
|
)
|
1,246
|
(6,099
|
)
|
3,347
|
||||||||||
|
Total adjustments to reconcile net loss to net cash provided by operations
|
(4,573
|
)
|
17,299
|
1,294
|
12,203
|
|||||||||||
|
Appendix B – Information regarding investing and financing activities not involving cash flows:
|
||||||||||||||||
|
Purchase of property and equipment in credit
|
154
|
130
|
39
|
130
|
||||||||||||
|
Recognition of right-of-use assets through lease liabilities
|
-
|
584
|
-
|
63
|
||||||||||||
|
Share based payments costs attributed to development activities, capitalized as intangible assets
|
559
|
346
|
411
|
222
|
||||||||||||
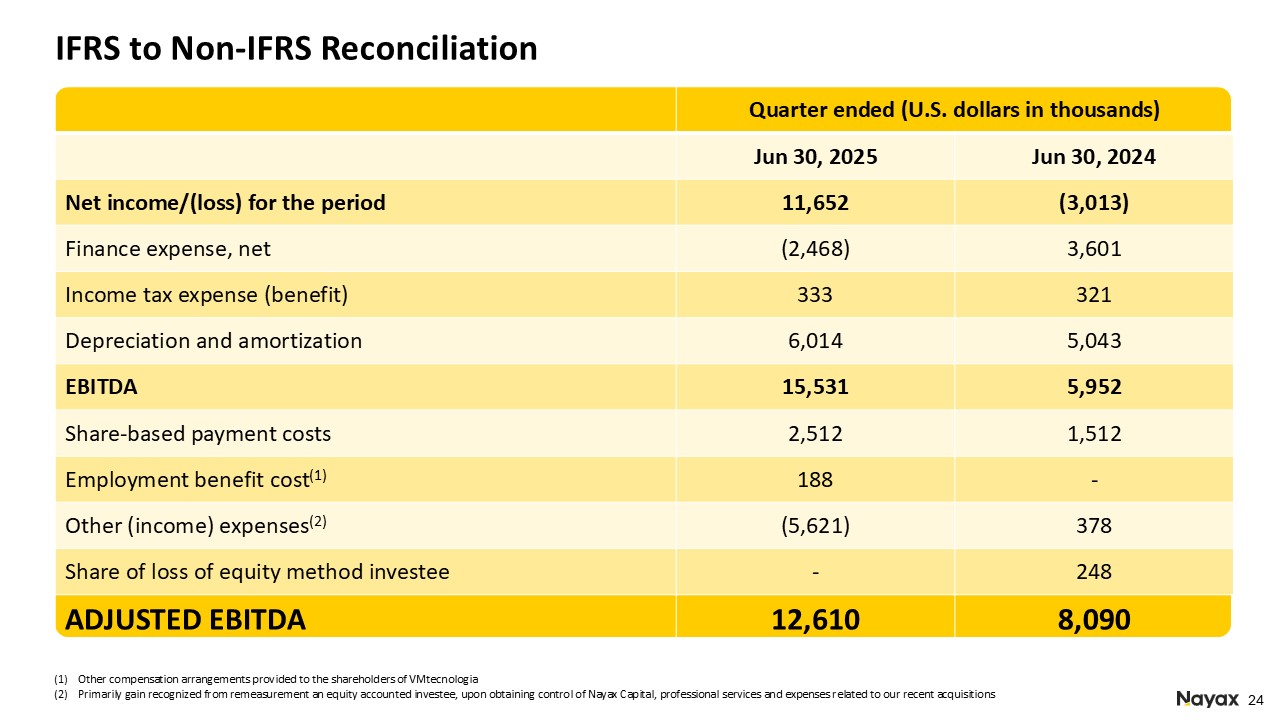
|
Quarter ended
(U.S. dollars in thousands)
|
||
|
Jun 30, 2025
|
Jun 30, 2024
|
|
|
Net income/loss for the period
|
11,652
|
(3,013)
|
|
Finance expense, net
|
(2,468)
|
3,601
|
|
Income tax expense (benefit)
|
333
|
321
|
|
Depreciation and amortization
|
6,014
|
5,043
|
|
EBITDA
|
15,531
|
5,952
|
|
Share-based payment costs
|
2,512
|
1,512
|
|
Employment benefit cost(1)
|
188
|
-
|
|
Other (income) expense(2)
|
(5,621)
|
378
|
|
Share of loss of equity method investee
|
-
|
248
|
|
ADJUSTED EBITDA
|
12,610
|
8,090
|
|
|
(1) |
Other compensation arrangements provided to the shareholders of VMT
|
|
|
(2) |
Primarily gain recognized from remeasurement an equity accounted investee, upon obtaining control of Nayax Capital, professional services and expenses related to our
recent acquisitions
|
|
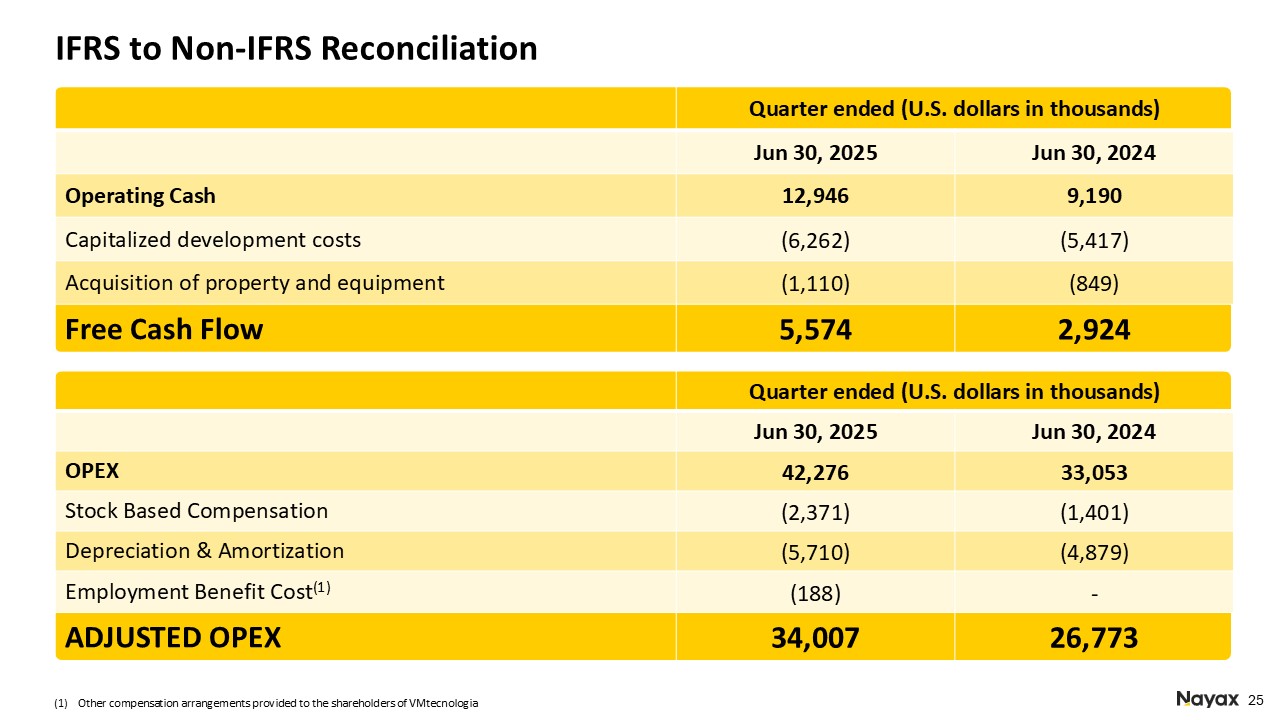
Quarter ended
(U.S. dollars
in thousands)
|
||
|
Jun 30, 2025
|
Jun 30, 2024
|
|
|
Operating Cash
|
12,946
|
9,190
|
|
Capitalized development costs
|
(6,262)
|
(5,417)
|
|
Acquisition of property and equipment
|
(1,110)
|
(849)
|
|
Free Cash Flow
|
5,574
|
2,924
|
|
Quarter ended
(U.S. dollars
in thousands)
|
||
|
Jun 30, 2025
|
Jun 30, 2024
|
|
|
OPEX
|
42,276
|
33,053
|
|
Stock Based Compensation
|
(2,371)
|
(1,401)
|
|
Depreciation & Amortization
|
(5,710)
|
(4,879)
|
|
Employment Benefit Cost(1)
|
(188)
|
-
|
|
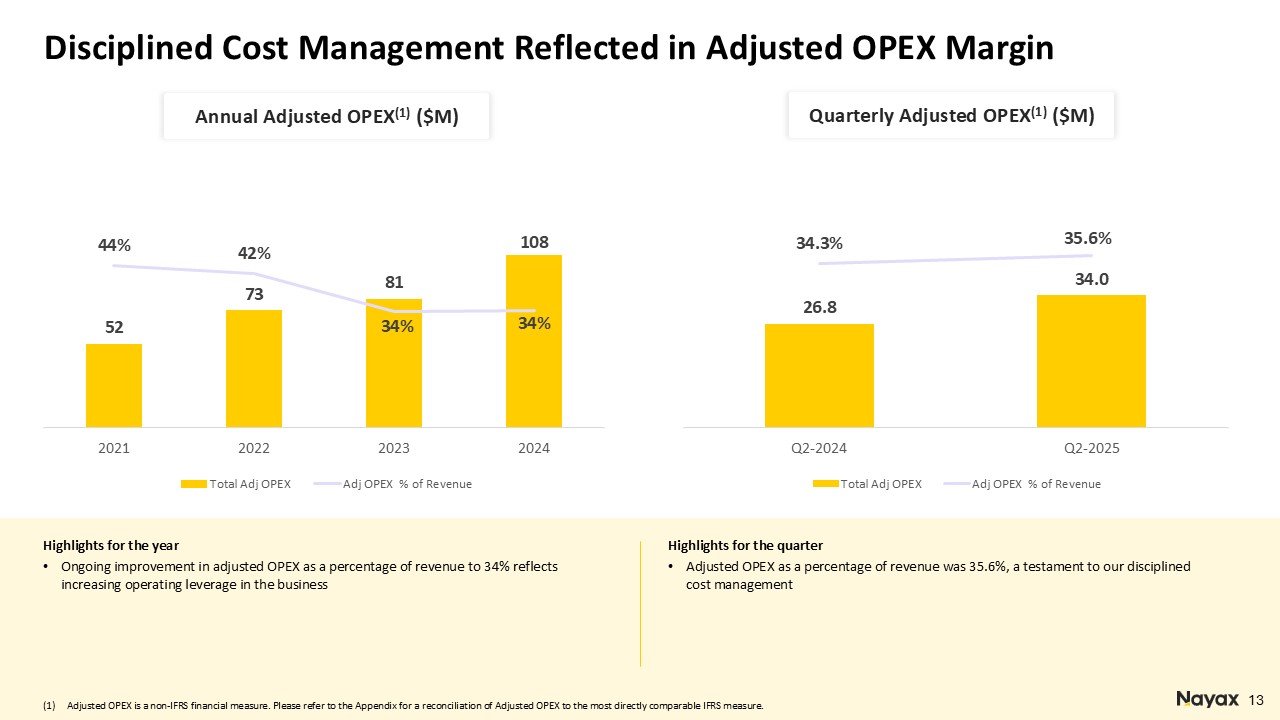
Adjusted OPEX
|
34,007
|
26,773
|
|
|
(1) |
Other compensation arrangements provided to the shareholders of VMT
|