|
|
MONDAY.COM LTD.
|
|
|
|
|
|
|
|
|
|
By:
|
/s/ Shiran Nawi
|
|
|
|
|
Name: Shiran Nawi
|
|
|
|
|
Title: Chief People and Legal Officer
|
|
| Exhibit |
Description
|
| 99.2 |
| 99.3 |

|
●
|
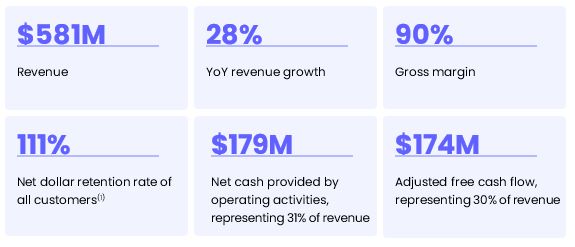
Revenue was $299.0 million, an increase of 27% year-over-year.
|
|
●
|
GAAP operating loss was $11.6 million compared to GAAP operating income of $1.8 million in the second quarter of 2024; GAAP operating margin was
negative 4% compared to 1% in the second quarter of 2024.
|
|
●
|
Non-GAAP operating income was $45.1 million compared to $38.4 million in the second quarter of 2024; non-GAAP operating margin was 15%, compared to 16%
in the second quarter of 2024.
|
|
●
|
GAAP basic and diluted net income per share was $0.03, compared to GAAP basic and diluted net income per share of $0.29 and $0.27, respectively, in the
second quarter of 2024; non-GAAP basic and diluted net income per share was $1.13 and $1.09, respectively, compared to non-GAAP basic and diluted net income per share of $0.99 and $0.94, respectively, in the second quarter of 2024.
|
|
●
|
Net cash provided by operating activities was $66.8 million, with $64.1 million of adjusted free cash flow, compared to net cash provided by operating
activities of $55.8 million and $50.8 million of adjusted free cash flow in the second quarter of 2024.
|
|
Three months ended June 30,
|
Six months ended June 30,
|
|||||||||||||||
|
2025
|
2024
|
2025
|
2024
|
|||||||||||||
|
(unaudited)
|
(unaudited)
|
|||||||||||||||
|
Revenue
|
$
|
299,014
|
$
|
236,106
|
$
|
581,264
|
$
|
453,019
|
||||||||
|
Cost of revenue
|
31,173
|
23,763
|
59,978
|
47,217
|
||||||||||||
|
Gross profit
|
267,841
|
212,343
|
521,286
|
405,802
|
||||||||||||
|
Operating expenses:
|
||||||||||||||||
|
Research and development
|
87,039
|
50,445
|
156,424
|
94,868
|
||||||||||||
|
Sales and marketing
|
152,590
|
131,471
|
294,310
|
259,612
|
||||||||||||
|
General and administrative
|
39,763
|
28,633
|
72,307
|
54,550
|
||||||||||||
|
Total operating expenses
|
279,392
|
210,549
|
523,041
|
409,030
|
||||||||||||
|
Operating income (loss)
|
(11,551
|
)
|
1,794
|
(1,755
|
)
|
(3,228
|
)
|
|||||||||
|
Financial income, net
|
14,102
|
14,850
|
31,749
|
27,689
|
||||||||||||
|
Income before income taxes
|
2,551
|
16,644
|
29,994
|
24,461
|
||||||||||||
|
Income tax expense
|
(978
|
)
|
(2,329
|
)
|
(996
|
)
|
(3,068
|
)
|
||||||||
|
Net income
|
$
|
1,573
|
$
|
14,315
|
$
|
28,998
|
$
|
21,393
|
||||||||
|
Net income per share attributable to ordinary shareholders, basic
|
$
|
0.03
|
$
|
0.29
|
$
|
0.57
|
$
|
0.43
|
||||||||
|
Net income per share attributable to ordinary shareholders, diluted
|
$
|
0.03
|
$
|
0.27
|
$
|
0.55
|
$
|
0.41
|
||||||||
|
Weighted-average ordinary shares used in calculating net income per ordinary share, basic
|
51,385,862
|
49,680,114
|
51,196,507
|
49,442,327
|
||||||||||||
|
Weighted-average ordinary shares used in calculating net income per ordinary share, diluted
|
53,271,524
|
52,209,431
|
53,149,561
|
52,106,369
|
||||||||||||
|
June 30,
|
December 31,
|
|||||||
|
2025
|
2024
|
|||||||
|
ASSETS
|
(unaudited)
|
(audited)
|
||||||
|
CURRENT ASSETS:
|
||||||||
|
Cash and cash equivalents
|
$
|
1,590,515
|
$
|
1,411,602
|
||||
|
Marketable securities
|
60,102
|
50,004
|
||||||
|
Accounts receivable, net
|
36,196
|
25,804
|
||||||
|
Prepaid expenses and other current assets
|
87,237
|
44,836
|
||||||
|
Total current assets
|
1,774,050
|
1,532,246
|
||||||
|
LONG-TERM ASSETS:
|
||||||||
|
Property and equipment, net
|
47,232
|
41,576
|
||||||
|
Operating lease right-of-use assets
|
109,612
|
94,703
|
||||||
|
Other long-term assets
|
33,077
|
16,983
|
||||||
|
Total long-term assets
|
189,921
|
153,262
|
||||||
|
Total assets
|
$
|
1,963,971
|
$
|
1,685,508
|
||||
|
LIABILITIES AND SHAREHOLDERS' EQUITY
|
||||||||
|
CURRENT LIABILITIES:
|
||||||||
|
Accounts payable
|
$
|
41,859
|
$
|
35,611
|
||||
|
Accrued expenses and other current liabilities
|
198,429
|
171,040
|
||||||
|
Deferred revenue, current
|
402,794
|
339,951
|
||||||
|
Operating lease liabilities, current
|
29,828
|
29,013
|
||||||
|
Total current liabilities
|
672,910
|
575,615
|
||||||
|
LONG-TERM LIABILITIES:
|
||||||||
|
Operating lease liabilities, non-current
|
96,384
|
77,023
|
||||||
|
Deferred revenue, non-current
|
2,299
|
2,639
|
||||||
|
Total long-term liabilities
|
98,683
|
79,662
|
||||||
|
Total liabilities
|
771,593
|
655,277
|
||||||
|
SHAREHOLDERS' EQUITY:
|
||||||||
|
Other comprehensive income
|
22,984
|
3,189
|
||||||
|
Share capital and additional paid-in capital
|
1,692,428
|
1,579,074
|
||||||
|
Accumulated deficit
|
(523,034
|
)
|
(552,032
|
)
|
||||
|
Total shareholders’ equity
|
1,192,378
|
1,030,231
|
||||||
|
Total liabilities and shareholders’ equity
|
$
|
1,963,971
|
$
|
1,685,508
|
||||
|
Three months ended June 30,
|
Six months ended June 30,
|
|||||||||||||||
|
2025
|
2024
|
2025
|
2024
|
|||||||||||||
|
unaudited
|
unaudited
|
|||||||||||||||
|
CASH FLOWS FROM OPERATING ACTIVITIES:
|
||||||||||||||||
|
Net income
|
$
|
1,573
|
$
|
14,315
|
$
|
28,998
|
$
|
21,393
|
||||||||
|
Adjustments to reconcile net income to net cash provided by operating activities:
|
||||||||||||||||
|
Depreciation and amortization
|
3,375
|
2,920
|
6,625
|
5,453
|
||||||||||||
|
Share-based compensation
|
56,645
|
36,623
|
87,603
|
63,166
|
||||||||||||
|
Amortization of discount and accretion of interest on marketable securities
|
580
|
—
|
(95
|
)
|
—
|
|||||||||||
|
Changes in operating assets and liabilities:
|
||||||||||||||||
|
Accounts receivable, net
|
(9,760
|
)
|
(1,292
|
)
|
(10,392
|
)
|
(1,691
|
)
|
||||||||
|
Prepaid expenses and other assets
|
(16,987
|
)
|
(17,306
|
)
|
(26,757
|
)
|
(15,199
|
)
|
||||||||
|
Accounts payable
|
10,068
|
9,625
|
6,224
|
21,668
|
||||||||||||
|
Accrued expenses and other liabilities, net
|
2,941
|
(3,636
|
)
|
24,098
|
2,710
|
|||||||||||
|
Deferred revenue
|
18,402
|
14,545
|
62,503
|
50,249
|
||||||||||||
|
Net cash provided by operating activities
|
66,837
|
55,794
|
178,807
|
147,749
|
||||||||||||
|
CASH FLOWS FROM INVESTING ACTIVITIES:
|
||||||||||||||||
|
Purchase of property and equipment
|
(5,884
|
)
|
(4,504
|
)
|
(9,571
|
)
|
(5,964
|
)
|
||||||||
|
Purchase of marketable securities
|
—
|
—
|
(10,049
|
)
|
—
|
|||||||||||
|
Capitalized software development costs
|
(924
|
)
|
(469
|
)
|
(1,703
|
)
|
(1,070
|
)
|
||||||||
|
Net cash used in investing activities
|
(6,808
|
)
|
(4,973
|
)
|
(21,323
|
)
|
(7,034
|
)
|
||||||||
|
CASH FLOWS FROM FINANCING ACTIVITIES:
|
||||||||||||||||
|
Proceeds from exercise of share options and employee share purchase plan
|
12,365
|
10,616
|
26,501
|
19,324
|
||||||||||||
|
Receipt (repayment) of tax advance relating to exercises of share options and RSUs, net
|
(9,484
|
)
|
4,261
|
(5,072
|
)
|
14,075
|
||||||||||
|
Net cash provided by financing activities
|
2,881
|
14,877
|
21,429
|
33,399
|
||||||||||||
|
INCREASE IN CASH, AND CASH EQUIVALENTS
|
62,910
|
65,698
|
178,913
|
174,114
|
||||||||||||
|
CASH AND CASH EQUIVALENTS - Beginning of period
|
1,527,605
|
1,224,544
|
1,411,602
|
1,116,128
|
||||||||||||
|
CASH AND CASH EQUIVALENTS - End of period
|
$
|
1,590,515
|
$
|
1,290,242
|
$
|
1,590,515
|
$
|
1,290,242
|
||||||||
|
Three months ended June 30,
|
Six months ended June 30,
|
|||||||||||||||
|
2025
|
2024
|
2025
|
2024
|
|||||||||||||
|
(unaudited)
|
(unaudited)
|
|||||||||||||||
|
Reconciliation of gross profit and gross margin
|
||||||||||||||||
|
GAAP gross profit
|
$
|
267,841
|
$
|
212,343
|
$
|
521,286
|
$
|
405,802
|
||||||||
|
Share-based compensation
|
2,272
|
1,872
|
3,406
|
3,116
|
||||||||||||
|
Non-GAAP gross profit
|
$
|
270,113
|
$
|
214,215
|
$
|
524,692
|
$
|
408,918
|
||||||||
|
GAAP gross margin
|
90
|
%
|
90
|
%
|
90
|
%
|
90
|
%
|
||||||||
|
Non-GAAP gross margin
|
90
|
%
|
91
|
%
|
90
|
%
|
90
|
%
|
||||||||
|
Reconciliation of operating expenses
|
||||||||||||||||
|
GAAP research and development
|
$
|
87,039
|
$
|
50,445
|
$
|
156,424
|
$
|
94,868
|
||||||||
|
Share-based compensation
|
(27,806
|
)
|
(13,567
|
)
|
(43,347
|
)
|
(23,193
|
)
|
||||||||
|
Non-GAAP research and development
|
$
|
59,233
|
$
|
36,878
|
$
|
113,077
|
$
|
71,675
|
||||||||
|
GAAP sales and marketing
|
$
|
152,590
|
$
|
131,471
|
$
|
294,310
|
$
|
259,612
|
||||||||
|
Share-based compensation
|
(13,367
|
)
|
(10,733
|
)
|
(19,205
|
)
|
(18,068
|
)
|
||||||||
|
Non-GAAP sales and marketing
|
$
|
139,223
|
$
|
120,738
|
$
|
275,105
|
$
|
241,544
|
||||||||
|
GAAP general and administrative
|
$
|
39,763
|
$
|
28,633
|
$
|
72,307
|
$
|
54,550
|
||||||||
|
Share-based compensation
|
(13,200
|
)
|
(10,451
|
)
|
(21,645
|
)
|
(18,789
|
)
|
||||||||
|
Non-GAAP general and administrative
|
$
|
26,563
|
$
|
18,182
|
$
|
50,662
|
$
|
35,761
|
||||||||
|
Reconciliation of operating income (loss)
|
||||||||||||||||
|
GAAP operating income (loss)
|
$
|
(11,551
|
)
|
$
|
1,794
|
$
|
(1,755
|
)
|
$
|
(3,228
|
)
|
|||||
|
Share-based compensation
|
56,645
|
36,623
|
87,603
|
63,166
|
||||||||||||
|
Non-GAAP operating income
|
$
|
45,094
|
$
|
38,417
|
$
|
85,848
|
$
|
59,938
|
||||||||
|
GAAP operating margin
|
(4
|
)%
|
1
|
%
|
(0
|
)%
|
(1
|
)%
|
||||||||
|
Non-GAAP operating margin
|
15
|
%
|
16
|
%
|
15
|
%
|
13
|
%
|
||||||||
|
Reconciliation of net income
|
||||||||||||||||
|
GAAP net income
|
$
|
1,573
|
$
|
14,315
|
$
|
28,998
|
$
|
21,393
|
||||||||
|
Share-based compensation
|
56,645
|
36,623
|
87,603
|
63,166
|
||||||||||||
|
Tax expense (benefit) related to share-based compensation(1)
|
78
|
(1,620
|
)
|
78
|
(3,525
|
)
|
||||||||||
|
Non-GAAP net income
|
$
|
58,296
|
$
|
49,318
|
$
|
116,679
|
$
|
81,034
|
||||||||
|
Reconciliation of weighted average number of shares outstanding
|
||||||||||||||||
|
Weighted-average ordinary shares used in calculating GAAP and Non-GAAP net income per ordinary share, basic
|
51,385,862
|
49,680,114
|
51,196,507
|
49,442,327
|
||||||||||||
|
Effect of dilutive shares
|
1,885,662
|
2,529,317
|
1,953,054
|
2,664,042
|
||||||||||||
|
Weighted-average ordinary shares used in calculating GAAP and Non-GAAP net income per ordinary share, diluted
|
53,271,524
|
52,209,431
|
53,149,561
|
52,106,369
|
||||||||||||
|
GAAP net income per share, basic
|
$
|
0.03
|
$
|
0.29
|
$
|
0.57
|
$
|
0.43
|
||||||||
|
GAAP net income per share, diluted
|
$
|
0.03
|
$
|
0.27
|
$
|
0.55
|
$
|
0.41
|
||||||||
|
Non-GAAP net income per share, basic
|
$
|
1.13
|
$
|
0.99
|
$
|
2.28
|
$
|
1.64
|
||||||||
|
Non-GAAP net income per share, diluted
|
$
|
1.09
|
$
|
0.94
|
$
|
2.20
|
$
|
1.56
|
||||||||
| (1) |
The tax benefit related to share-based compensation was excluded in calculating non-GAAP net income and non-GAAP net income per basic and diluted share. The Company believes that excluding the
tax benefit enables investors to see the full effect that excluding share-based compensation expenses had on the operating results.
|
|
Three months ended June 30,
|
Six months ended June 30,
|
|||||||||||||||
|
2025
|
2024
|
2025
|
2024
|
|||||||||||||
|
(unaudited)
|
(unaudited)
|
|||||||||||||||
|
Net cash provided by operating activities
|
$
|
66,837
|
$
|
55,794
|
$
|
178,807
|
$
|
147,749
|
||||||||
|
Purchase of property and equipment
|
(5,884
|
)
|
(4,504
|
)
|
(9,571
|
)
|
(5,964
|
)
|
||||||||
|
Capitalized software development costs
|
(924
|
)
|
(469
|
)
|
(1,703
|
)
|
(1,070
|
)
|
||||||||
|
Purchase of property and equipment related to build-out and expansion of our corporate headquarters
|
4,064
|
—
|
6,092
|
—
|
||||||||||||
|
Adjusted free cash flow
|
$
|
64,093
|
$
|
50,821
|
173,625
|
140,715
|
||||||||||
|
Adjusted free cash flow margin
|
21
|
%
|
22
|
%
|
30
|
%
|
31
|
%
|
||||||||

Page |
|
F - 2 |
|
F - 3 |
|
F - 4 |
|
F - 5 |
|
F - 6 |
|
F - 7 – F - 24 |
|
June 30,
|
December 31,
|
|||||||
|
2025
|
2024
|
|||||||
|
(Unaudited)
|
(audited)
|
|||||||
|
ASSETS
|
||||||||
|
CURRENT ASSETS:
|
||||||||
|
Cash and cash equivalents
|
$
|
1,590,515
|
$
|
1,411,602
|
||||
|
Marketable securities
|
60,102
|
50,004
|
||||||
|
Accounts receivable - net of allowance for credit losses of $354 and $296 as of June 30, 2025 (unaudited) and December 31, 2024, respectively
|
36,196
|
25,804
|
||||||
|
Prepaid expenses and other current assets
|
87,237
|
44,836
|
||||||
|
Total current assets
|
1,774,050
|
1,532,246
|
||||||
|
|
||||||||
|
Property and equipment, net
|
47,232
|
41,576
|
||||||
|
Operating lease right-of-use assets
|
109,612
|
94,703
|
||||||
|
Other long-term assets
|
33,077
|
16,983
|
||||||
|
Total long-term assets
|
189,921
|
153,262
|
||||||
|
Total assets
|
$
|
1,963,971
|
$
|
1,685,508
|
||||
|
LIABILITIES AND SHAREHOLDERS' EQUITY
|
||||||||
|
CURRENT LIABILITIES:
|
||||||||
|
Accounts payable
|
$
|
41,859
|
$
|
35,611
|
||||
|
Accrued expenses and other current liabilities
|
198,429
|
171,040
|
||||||
|
Deferred revenue, current
|
402,794
|
339,951
|
||||||
|
Operating lease liabilities, current
|
29,828
|
29,013
|
||||||
|
Total current liabilities
|
672,910
|
575,615
|
||||||
|
Operating lease liabilities, non-current
|
96,384
|
77,023
|
||||||
|
Deferred revenue, non-current
|
2,299
|
2,639
|
||||||
|
Total long-term liabilities
|
98,683
|
79,662
|
||||||
|
Total liabilities
|
771,593
|
655,277
|
||||||
|
COMMITMENTS AND CONTINGENCIES (NOTE 9)
|
||||||||
|
SHAREHOLDERS' EQUITY:
|
||||||||
|
Ordinary shares, no par value – Authorized: 99,999,999 shares as of June 30, 2025 (unaudited) and December 31, 2024; Issued and Outstanding: 51,551,462 and 50,773,337 as of June 30, 2025 (unaudited) and December 31,2024, respectively
|
-
|
-
|
||||||
|
Founders’ shares no par value: Authorized: 1 share as of June 30, 2025 (unaudited), and December 31, 2024; Issued and Outstanding: 1 share as of June 30,2025 (unaudited), and December 31, 2024
|
||||||||
|
Additional paid-in capital
|
1,692,428
|
1,579,074
|
||||||
|
Accumulated other comprehensive income
|
22,984
|
3,189
|
||||||
|
Accumulated deficit
|
(523,034
|
)
|
(552,032
|
)
|
||||
|
Total shareholders’ equity
|
1,192,378
|
1,030,231
|
||||||
|
Total liabilities and shareholders’ equity
|
$
|
1,963,971
|
$
|
1,685,508
|
||||
|
Six months ended June 30,
|
||||||||
|
2025
|
2024
|
|||||||
|
(Unaudited)
|
||||||||
|
Revenue
|
$
|
581,264
|
$
|
453,019
|
||||
|
Cost of revenue
|
59,978
|
47,217
|
||||||
|
Gross profit
|
521,286
|
405,802
|
||||||
|
OPERATING EXPENSES
|
||||||||
|
Research and development
|
156,424
|
94,868
|
||||||
|
Sales and marketing
|
294,310
|
259,612
|
||||||
|
General and administrative
|
72,307
|
54,550
|
||||||
|
Total operating expenses
|
523,041
|
409,030
|
||||||
|
Operating loss
|
(1,755
|
)
|
(3,228
|
)
|
||||
|
Financial income, net
|
31,749
|
27,689
|
||||||
|
Income before income taxes
|
29,994
|
24,461
|
||||||
|
Income tax expense
|
(996
|
)
|
(3,068
|
)
|
||||
|
Net income
|
$
|
28,998
|
$
|
21,393
|
||||
|
Net income per share attributable to ordinary shareholders, basic
|
$
|
0.57
|
$
|
0.43
|
||||
|
Net income per share attributable to ordinary shareholders, diluted
|
$
|
0.55
|
$
|
0.41
|
||||
|
Weighted-average ordinary shares used in calculating net income per ordinary share, basic
|
51,196,507
|
49,442,327
|
||||||
|
Weighted-average ordinary shares used in calculating net income per ordinary share, diluted
|
53,149,561
|
52,106,369
|
||||||
|
Six months ended June 30,
|
||||||||
|
2025
|
2024
|
|||||||
|
(Unaudited)
|
||||||||
|
Net Income
|
$
|
28,998
|
$
|
21,393
|
||||
|
Other comprehensive income (loss):
|
||||||||
|
Change in unrealized gains on marketable securities
|
||||||||
|
Unrealized losses arising during the period, net of tax
|
(46
|
)
|
-
|
|||||
|
Losses (gains) reclassified into earnings, net of tax
|
-
|
-
|
||||||
|
Change in unrealized gains (losses) on cash flow hedges
|
||||||||
|
Unrealized gains (losses) arising during the period, net of tax
|
24,004
|
(5,480
|
)
|
|||||
|
gains reclassified into earnings, net of tax
|
(4,163
|
)
|
(1,667
|
)
|
||||
|
Net current-period other comprehensive income (loss)
|
19,795
|
(7,147
|
)
|
|||||
|
Comprehensive income
|
$
|
48,793
|
$
|
14,246
|
||||
|
Number of Founders’
Shares
|
Number of Ordinary
shares
|
Additional Paid-in-
Capital
|
Accumulated Other
Comprehensive Income
(*)
|
Accumulated Deficit
|
Shareholders’ equity
|
|||||||||||||||||||
|
Balance as of January 1, 2025
|
1
|
50,773,337
|
$
|
1,579,074
|
$
|
3,189
|
$
|
(552,032
|
)
|
$
|
1,030,231
|
|||||||||||||
|
Exercise of options
|
-
|
415,101
|
16,134
|
-
|
-
|
16,134
|
||||||||||||||||||
|
Issuance of ordinary shares upon vesting of restricted share units
|
-
|
325,163
|
-
|
-
|
-
|
-
|
||||||||||||||||||
|
Issuance of ordinary shares under employee share purchase plan
|
-
|
37,861
|
8,562
|
-
|
-
|
8,562
|
||||||||||||||||||
|
Share-based compensation
|
-
|
-
|
88,658
|
-
|
-
|
88,658
|
||||||||||||||||||
|
Other comprehensive income
|
-
|
-
|
-
|
19,795
|
-
|
19,795
|
||||||||||||||||||
|
Net income
|
-
|
-
|
-
|
-
|
28,998
|
28,998
|
||||||||||||||||||
|
Balance as of June 30, 2025 (unaudited)
|
1
|
51,551,462
|
$
|
1,692,428
|
$
|
22,984
|
$
|
(523,034
|
)
|
$
|
1,192,378
|
|||||||||||||
|
Balance as of January 1, 2024
|
1
|
48,923,903
|
$
|
1,388,108
|
$
|
9,804
|
$
|
(584,404
|
)
|
$
|
813,508
|
|||||||||||||
|
Exercise of options
|
-
|
671,366
|
12,573
|
-
|
-
|
12,573
|
||||||||||||||||||
|
Issuance of ordinary shares upon vesting of restricted share units
|
-
|
223,678
|
-
|
-
|
-
|
-
|
||||||||||||||||||
|
Issuance of ordinary shares under employee share purchase plan
|
-
|
39,840
|
5,981
|
-
|
-
|
5,981
|
||||||||||||||||||
|
Share-based compensation
|
-
|
-
|
63,814
|
-
|
-
|
63,814
|
||||||||||||||||||
|
Other comprehensive loss
|
-
|
-
|
-
|
(7,147
|
)
|
-
|
(7,147
|
)
|
||||||||||||||||
|
Net income
|
-
|
-
|
-
|
-
|
21,393
|
21,393
|
||||||||||||||||||
|
Balance as of June 30, 2024 (unaudited)
|
1
|
49,858,787
|
$
|
1,470,476
|
$
|
2,657
|
$
|
(563,011
|
)
|
$
|
910,122
|
|||||||||||||
|
Six months ended June 30,
|
||||||||
|
2025
|
2024
|
|||||||
|
(Unaudited)
|
||||||||
|
CASH FLOWS FROM OPERATING ACTIVITIES:
|
||||||||
|
Net income
|
$
|
28,998
|
$
|
21,393
|
||||
|
Adjustments to reconcile net income to net cash provided by operating activities:
|
||||||||
|
Depreciation and amortization
|
6,625
|
5,453
|
||||||
|
Share-based compensation
|
87,603
|
63,166
|
||||||
|
Amortization of discount and accretion of interest on marketable securities
|
(95
|
)
|
-
|
|||||
|
Changes in operating assets and liabilities:
|
||||||||
|
Accounts receivable, net
|
(10,392
|
)
|
(1,691
|
)
|
||||
|
Prepaid expenses and other assets
|
(26,757
|
)
|
(15,199
|
)
|
||||
|
Accounts payable
|
6,224
|
21,668
|
||||||
|
Accrued expenses and other liabilities
|
24,098
|
2,710
|
||||||
|
Deferred revenue
|
62,503
|
50,249
|
||||||
|
Net cash provided by operating activities
|
178,807
|
147,749
|
||||||
|
CASH FLOWS FROM INVESTING ACTIVITIES:
|
||||||||
|
Purchase of property and equipment
|
(9,571
|
)
|
(5,964
|
)
|
||||
|
Capitalized software development costs
|
(1,703
|
)
|
(1,070
|
)
|
||||
|
Purchase of marketable securities
|
(10,049
|
)
|
-
|
|||||
|
Net cash used in investing activities
|
(21,323
|
)
|
(7,034
|
)
|
||||
|
CASH FLOWS FROM FINANCING ACTIVITIES:
|
||||||||
|
Proceeds from exercise of share options and employee share purchase plan
|
26,501
|
19,324
|
||||||
|
Receipt (repayment)of tax advance relating to exercises of share options and RSUs, net
|
(5,072
|
)
|
14,075
|
|||||
|
Net cash provided by financing activities
|
21,429
|
33,399
|
||||||
|
|
||||||||
|
INCREASE IN CASH, AND CASH EQUIVALENTS
|
178,913
|
174,114
|
||||||
|
CASH AND CASH EQUIVALENTS - Beginning of period
|
1,411,602
|
1,116,128
|
||||||
|
CASH AND CASH EQUIVALENTS - End of period
|
$
|
1,590,515
|
$
|
1,290,242
|
||||
|
NON-CASH INVESTING AND FINANCING ACTIVITIES:
|
||||||||
|
Non-cash purchases of property and equipment
|
$
|
-
|
$
|
212
|
||||
|
Capitalized share-based compensation costs
|
$
|
1,055
|
$
|
648
|
||||
|
Right-of-use asset recognized with corresponding lease liability
|
$
|
27,111
|
$
|
8,753
|
||||
|
NOTE 1:-
|
ORGANIZATION AND DESCRIPTION OF BUSINESS
|
|
NOTE 2:-
|
BASIS OF PRESENTATION and SIGNIFICANT ACCOUNTING POLICIES
|
|
|
a.
|
Unaudited Interim Condensed Consolidated Financial Information
|
F - 7
|
MONDAY.COM AND SUBSIDIARIES
NOTES TO CONDENSED CONSOLIDATED FINANCIAL STATEMENTS
|
NOTE 2:-
|
BASIS OF PRESENTATION and SIGNIFICANT ACCOUNTING POLICIES (cont.)
|
F - 8
|
MONDAY.COM AND SUBSIDIARIES
NOTES TO CONDENSED CONSOLIDATED FINANCIAL STATEMENTS
|
NOTE 2:-
|
BASIS OF PRESENTATION and SIGNIFICANT ACCOUNTING POLICIES (cont.)
|
|
b.
|
Use of estimates
|
|
c.
|
Accounting pronouncements not yet effective
|
F - 9
|
MONDAY.COM AND SUBSIDIARIES
NOTES TO CONDENSED CONSOLIDATED FINANCIAL STATEMENTS
|
NOTE 3:-
|
REVENUE RECOGNITION
|
|
Six months ended June 30,
|
||||||||
|
2025
|
2024
|
|||||||
|
(Unaudited)
|
||||||||
|
Beginning balance
|
$
|
20,522
|
$
|
3,675
|
||||
|
Capitalization of deferred contract costs
|
34,787
|
10,187
|
||||||
|
Amortization
|
(9,090
|
)
|
(1,825
|
)
|
||||
|
Ending balance
|
$
|
46,219
|
$
|
12,037
|
||||
|
June 30,
2025
|
December 31,
2024
|
|||||||
|
(Unaudited)
|
||||||||
|
Deferred contract costs, current
|
$
|
20,160
|
$
|
10,409
|
||||
|
Deferred contract costs, noncurrent
|
26,059
|
10,113
|
||||||
|
Total deferred contract costs
|
$
|
46,219
|
$
|
20,522
|
||||
F - 10
|
MONDAY.COM AND SUBSIDIARIES
NOTES TO CONDENSED CONSOLIDATED FINANCIAL STATEMENTS
|
NOTE 3:-
|
REVENUE RECOGNITION (cont.)
|
|
NOTE 4:-
|
CASH, CASH EQUIVALENTS AND MARKETABLE SECURITIES
|
|
June 30,
|
December 31,
|
|||||||
|
2025
|
2024
|
|||||||
|
(Unaudited)
|
||||||||
|
Cash and cash equivalents:
|
||||||||
|
Cash
|
$
|
73,804
|
$
|
98,392
|
||||
|
Bank deposits
|
182,327
|
21,936
|
||||||
|
Money market funds
|
1,334,384
|
1,291,274
|
||||||
|
Total cash and cash equivalents
|
1,590,515
|
1,411,602
|
||||||
|
Marketable securities:
|
||||||||
|
U.S. Treasury bills
|
60,102
|
50,004
|
||||||
|
Total marketable securities
|
60,102
|
50,004
|
||||||
|
Total cash and cash equivalents and marketable securities
|
$
|
1,650,617
|
$
|
1,461,606
|
||||
|
June 30, 2025
|
||||||||||||||||
|
(Unaudited)
|
||||||||||||||||
|
Amortized cost
|
Gross unrealized gains
|
Gross unrealized losses
|
Fair value
|
|||||||||||||
|
Contractual maturity:
|
||||||||||||||||
|
Within one year
|
$
|
59,941
|
$
|
161
|
$
|
-
|
$
|
60,102
|
||||||||
|
After one year through five years
|
-
|
-
|
-
|
-
|
||||||||||||
|
Total
|
$
|
59,941
|
$
|
161
|
$
|
-
|
$
|
60,102
|
||||||||
F - 11
|
MONDAY.COM AND SUBSIDIARIES
NOTES TO CONDENSED CONSOLIDATED FINANCIAL STATEMENTS
|
NOTE 4:-
|
CASH, CASH EQUIVALENTS AND MARKETABLE SECURITIES (cont.)
|
|
December 31, 2024
|
||||||||||||||||
|
Amortized cost
|
Gross unrealized gains
|
Gross unrealized losses
|
Fair value
|
|||||||||||||
|
Contractual maturity:
|
||||||||||||||||
|
Within one year
|
$
|
49,797
|
$
|
207
|
$
|
-
|
$
|
50,004
|
||||||||
|
After one year through five years
|
-
|
-
|
-
|
-
|
||||||||||||
|
Total
|
$
|
49,797
|
$
|
207
|
$
|
-
|
$
|
50,004
|
||||||||
|
NOTE 5:-
|
PREPAID EXPENSES AND OTHER CURRENT ASSETS
|
|
June 30,
|
December 31,
|
|||||||
|
2025
|
2024
|
|||||||
|
(Unaudited)
|
||||||||
|
Prepaid expenses
|
$
|
23,526
|
$
|
15,944
|
||||
|
Related parties’ receivable
|
81
|
1,587
|
||||||
|
Government institutions
|
12,408
|
7,376
|
||||||
|
Derivative instruments
|
22,825
|
2,984
|
||||||
|
Interest receivable
|
5,010
|
4,864
|
||||||
|
Short-term vendor deposits
|
436
|
335
|
||||||
|
Deferred contract costs
|
20,160
|
10,409
|
||||||
|
Other current assets
|
2,791
|
1,337
|
||||||
|
Total prepaid expenses and other current assets
|
$
|
87,237
|
$
|
44,836
|
||||
|
NOTE 6:-
|
ACCRUED EXPENSES AND OTHER CURRENT LIABILITIES
|
|
June 30,
|
December 31,
|
|||||||
|
2025
|
2024
|
|||||||
|
(Unaudited)
|
||||||||
|
Accrued employee compensation and benefits
|
$
|
108,845
|
$
|
95,960
|
||||
|
Accrued expenses
|
67,598
|
56,528
|
||||||
|
Advances from customers
|
5,826
|
3,431
|
||||||
|
Income and indirect taxes payable
|
16,160
|
15,121
|
||||||
|
Total
|
$
|
198,429
|
$
|
171,040
|
||||
F - 12
|
MONDAY.COM AND SUBSIDIARIES
NOTES TO CONDENSED CONSOLIDATED FINANCIAL STATEMENTS
|
NOTE 7:-
|
FAIR VALUE MEASUREMENTS
|
|
As of June 30,
|
As of December 31,
|
|||||||||||||||||||||||
|
2025
|
2024
|
|||||||||||||||||||||||
|
Level 1
|
Level 2
|
Total
|
Level 1
|
Level 2
|
Total
|
|||||||||||||||||||
|
(Unaudited)
|
||||||||||||||||||||||||
|
Cash equivalents:
|
||||||||||||||||||||||||
|
Money market funds
|
$
|
1,334,384
|
$
|
-
|
$
|
1,334,384
|
$
|
1,291,274
|
$
|
-
|
$
|
1,291,274
|
||||||||||||
|
Marketable securities:
|
||||||||||||||||||||||||
|
U.S. Treasury bills
|
60,102
|
-
|
60,102
|
50,004
|
-
|
50,004
|
||||||||||||||||||
|
Foreign currency derivative contracts:
|
||||||||||||||||||||||||
|
Foreign exchange contracts
|
-
|
22,825
|
22,825
|
-
|
2,984
|
2,984
|
||||||||||||||||||
|
Total
|
$
|
1,394,486
|
$
|
22,825
|
$
|
1,417,311
|
$
|
1,341,278
|
$
|
2,984
|
$
|
1,344,262
|
||||||||||||
|
NOTE 8:-
|
DERIVATIVES AND HEDGING
|
F - 13
|
MONDAY.COM AND SUBSIDIARIES
NOTES TO CONDENSED CONSOLIDATED FINANCIAL STATEMENTS
|
NOTE 8:-
|
DERIVATIVES AND HEDGING (cont.)
|
|
June 30,
|
December 31,
|
||||||||
|
Balance sheet line item
|
2025
|
2024
|
|||||||
|
(Unaudited)
|
|||||||||
|
Derivatives designated as hedging instruments:
|
|||||||||
|
Foreign exchange contracts
|
Prepaid expenses and other current assets
|
$
|
22,825
|
$
|
2,984
|
||||
|
22,825
|
2,984
|
||||||||
|
Derivatives not designated as hedging instruments:
|
|||||||||
|
-
|
-
|
||||||||
|
Total
|
$
|
22,825
|
$
|
2,984
|
|||||
|
Gain (Loss) Recognized
in Other Comprehensive
Income on Effective-
Portion of Derivative, net
|
Realized gains on Derivative Reclassified from Accumulated Other Comprehensive Income (*)
|
Amount Excluded from Effectiveness Testing Recognized in Income (Loss)
|
||||||||||||||||||||||
|
Six months ended June 30
|
Six months ended June 30
|
Six months ended June 30
|
||||||||||||||||||||||
|
2025
|
2024
|
2025
|
2024
|
2025
|
2024
|
|||||||||||||||||||
|
(Unaudited)
|
||||||||||||||||||||||||
|
Derivatives designated as hedging instruments:
|
||||||||||||||||||||||||
|
Foreign exchange contracts
|
$
|
24,004
|
$
|
(5,480
|
)
|
$
|
4,163
|
$
|
1,667
|
$
|
(182
|
)
|
$
|
-
|
||||||||||
|
24,004
|
(5,480
|
)
|
4,163
|
1,667
|
(182
|
)
|
-
|
|||||||||||||||||
|
Derivatives not designated as hedging instruments:
|
||||||||||||||||||||||||
|
Foreign exchange contracts
|
-
|
-
|
-
|
-
|
-
|
-
|
||||||||||||||||||
|
Total
|
$
|
24,004
|
$
|
(5,480
|
)
|
$
|
4,163
|
$
|
1,667
|
$
|
(182
|
)
|
$
|
-
|
||||||||||
F - 14
|
MONDAY.COM AND SUBSIDIARIES
NOTES TO CONDENSED CONSOLIDATED FINANCIAL STATEMENTS
|
NOTE 8:-
|
DERIVATIVES AND HEDGING (cont.)
|
|
June 30,
2025
|
December 31,
2024
|
|||||||
|
(Unaudited)
|
||||||||
|
Derivatives designated as hedging instruments:
|
||||||||
|
Foreign exchange contracts:
|
||||||||
|
NIS
|
$
|
274,259
|
$
|
209,487
|
||||
|
Total
|
$
|
274,259
|
$
|
209,487
|
||||
|
NOTE 9:-
|
LEASES
|
|
Amount (*)
|
||||
|
The remainder of 2025
|
$
|
16,047
|
||
|
2026
|
25,101
|
|||
|
2027
|
21,049
|
|||
|
2028
|
21,119
|
|||
|
2029
|
19,665
|
|||
|
Thereafter
|
37,948
|
|||
|
Total undiscounted cash flows
|
$
|
140,929
|
||
|
Less: Imputed interest
|
$
|
(14,717
|
)
|
|
|
Present value of lease liabilities
|
$
|
126,212
|
||
F - 15
|
MONDAY.COM AND SUBSIDIARIES
NOTES TO CONDENSED CONSOLIDATED FINANCIAL STATEMENTS
|
NOTE 9:-
|
LEASES (cont.)
|
|
June 30,
2025
|
December 31,
2024
|
|||||||
|
(Unaudited)
|
||||||||
|
Weighted-average remaining lease term
|
5.9 years
|
5.2 years
|
||||||
|
Weighted-average discount rate
|
3.9
|
%
|
4.2
|
%
|
||||
|
NOTE 10:-
|
COMMITMENTS AND CONTINGENCIES
|
|
a.
|
Guarantees
|
|
b.
|
Indemnifications
|
F - 16
|
MONDAY.COM AND SUBSIDIARIES
NOTES TO CONDENSED CONSOLIDATED FINANCIAL STATEMENTS
|
NOTE 10:-
|
COMMITMENTS AND CONTINGENCIES (cont.)
|
|
c.
|
Legal Contingencies
|
|
d.
|
Other Commitments
|
|
Amount
|
||||
|
The remainder of 2025
|
$
|
18,361
|
||
|
2026
|
34,762
|
|||
|
2027
|
17,710
|
|||
|
2028
|
-
|
|||
|
Total contractual obligations
|
$
|
70,833
|
||
F - 17
|
MONDAY.COM AND SUBSIDIARIES
NOTES TO CONDENSED CONSOLIDATED FINANCIAL STATEMENTS
|
NOTE 11:-
|
FINANCIAL INCOME, NET
|
|
Six months ended June 30,
|
||||||||
|
2025
|
2024
|
|||||||
|
(Unaudited)
|
||||||||
|
Financial expenses:
|
||||||||
|
Bank charges and other
|
$
|
278
|
$
|
274
|
||||
|
Exchange rate expense, net
|
-
|
1,309
|
||||||
|
Total financial expenses
|
278
|
1,583
|
||||||
|
Financial income:
|
||||||||
|
Exchange rate income, net
|
556
|
-
|
||||||
|
Interest income on deposits, money market funds and marketable securities
|
30,158
|
29,272
|
||||||
|
Accretion of discount on marketable securities
|
1,313
|
-
|
||||||
|
Total financial income
|
32,027
|
29,272
|
||||||
|
Financial income, net
|
$
|
31,749
|
$
|
27,689
|
||||
|
NOTE 12:-
|
RELATED PARTIES
|
|
NOTE 13:-
|
SHAREHOLDERS’ EQUITY
|
|
a.
|
Ordinary shares
|
|
June 30,
2025
|
December 31,
2024
|
|||||||
|
(Unaudited)
|
||||||||
|
Ordinary shares
|
51,551,462
|
50,773,337
|
||||||
|
Outstanding share options and RSUs
|
3,032,942
|
3,164,395
|
||||||
|
Shares available for future grants under the 2021 plan
|
10,871,688
|
8,941,243
|
||||||
|
Shares available for future grants under the 2024 Foundation plan
|
14,410
|
15,000
|
||||||
|
Shares subject to the employee share purchase plan
|
1,118,576
|
1,156,437
|
||||||
|
Total
|
66,589,078
|
64,050,412
|
||||||
F - 18
|
MONDAY.COM AND SUBSIDIARIES
NOTES TO CONDENSED CONSOLIDATED FINANCIAL STATEMENTS
|
NOTE 13:-
|
SHAREHOLDERS’ EQUITY (cont.)
|
|
b.
|
Share-based compensation
|
|
Number of Options
|
Weighted-Average Exercise Price
|
Weighted Average Remaining Contractual life
|
Aggregate Intrinsic Value
|
|||||||||||||
|
(Unaudited)
|
||||||||||||||||
|
Outstanding — January 1, 2025 (*)
|
1,768,230
|
$
|
62.90
|
6.04
|
$
|
305,379
|
||||||||||
|
Granted (*)
|
42,897
|
$
|
0.87
|
|||||||||||||
|
Exercised
|
(415,101
|
)
|
$
|
38.74
|
||||||||||||
|
Expired and forfeited
|
(34,323
|
)
|
$
|
54.03
|
||||||||||||
|
Outstanding — June 30, 2025
|
1,361,703
|
$
|
68.54
|
5.68
|
$
|
334,903
|
||||||||||
|
Exercisable — June 30, 2025 (*)
|
1,134,484
|
$
|
64.20
|
5.34
|
$
|
283,937
|
||||||||||
F - 19
|
MONDAY.COM AND SUBSIDIARIES
NOTES TO CONDENSED CONSOLIDATED FINANCIAL STATEMENTS
|
NOTE 13:-
|
SHAREHOLDERS’ EQUITY (cont.)
|
|
Number of Units
|
Weighted-Average Fair Value
|
|||||||
|
(Unaudited)
|
||||||||
|
Balance at January 1, 2025 (*)
|
1,396,165
|
$
|
177.72
|
|||||
|
Granted (*)
|
696,448
|
$
|
269.61
|
|||||
|
Vested
|
(325,163
|
)
|
$
|
175.71
|
||||
|
Canceled
|
(96,211
|
)
|
$
|
176.79
|
||||
|
Balance at June 30, 2025 (*)
|
1,671,239
|
$
|
216.46
|
|||||
|
Six months ended June 30,
|
||||||||
|
2025
|
2024
|
|||||||
|
Cost of revenues
|
$
|
3,406
|
$
|
3,116
|
||||
|
Research and development
|
43,347
|
23,193
|
||||||
|
Sales and marketing
|
19,205
|
18,068
|
||||||
|
General and administrative
|
21,645
|
18,789
|
||||||
|
Share-based compensation, net of amounts capitalized
|
$
|
87,603
|
$
|
63,166
|
||||
|
Capitalized share-based compensation expense
|
1,055
|
648
|
||||||
|
Total share-based compensation
|
$
|
88,658
|
$
|
63,814
|
||||
F - 20
|
MONDAY.COM AND SUBSIDIARIES
NOTES TO CONDENSED CONSOLIDATED FINANCIAL STATEMENTS
|
NOTE 13:-
|
SHAREHOLDERS’ EQUITY (cont.)
|
|
Six months ended June 30,
|
||||||||
|
2025
|
2024
|
|||||||
|
(Unaudited)
|
||||||||
|
Risk-free interest rate
|
3.74%-4.1%
|
|
4.03%-4.77%
|
|
||||
|
Expected dividend yield
|
0%
|
|
0%
|
|
||||
|
Expected term (in years)
|
2-7
|
5-7
|
||||||
|
Expected volatility
|
57.02%-59.32%
|
|
57.81%
|
|
||||
|
c.
|
Employee Share Purchase Plan
|
F - 21
|
MONDAY.COM AND SUBSIDIARIES
NOTES TO CONDENSED CONSOLIDATED FINANCIAL STATEMENTS
|
NOTE 14:-
|
EARNINGS PER SHARE
|
|
Six months ended June 30,
|
||||||||
|
2025
|
2024
|
|||||||
|
Numerator:
|
(Unaudited)
|
|||||||
|
Net income attributable to ordinary shareholders, basic and diluted
|
$
|
28,998
|
$
|
21,393
|
||||
|
Denominator:
|
||||||||
|
Weighted-average ordinary shares outstanding, basic
|
51,196,507
|
49,442,327
|
||||||
|
Dilutive effect
|
||||||||
|
Employee stock options, RSUs and PSUs
|
1,953,054
|
2,664,042
|
||||||
|
Weighted average ordinary shares outstanding, diluted
|
53,149,561
|
52,106,369
|
||||||
|
Net income per share attributable to ordinary shareholders, basic
|
$
|
0.57
|
$
|
0.43
|
||||
|
Net income per share attributable to ordinary shareholders, diluted
|
$
|
0.55
|
$
|
0.41
|
||||
|
Six months ended June 30,
|
||||||||
|
2025
|
2024
|
|||||||
|
(Unaudited)
|
||||||||
|
Options
|
-
|
248,083
|
||||||
|
RSUs
|
29,176
|
90,105
|
||||||
|
Total
|
29,176
|
338,188
|
||||||
F - 22
|
MONDAY.COM AND SUBSIDIARIES
NOTES TO CONDENSED CONSOLIDATED FINANCIAL STATEMENTS
|
NOTE 15:-
|
SEGMENT REPORTING
|
|
Six months ended June 30,
|
||||||||
|
2025
|
2024
|
|||||||
|
Total revenues
|
$
|
581,264
|
453,019
|
|||||
|
Share-based compensation
|
(87,603
|
)
|
(63,166
|
)
|
||||
|
Tax benefit (expense) related to share-based compensation
|
(78
|
)
|
3,525
|
|||||
|
Other segment items (*)
|
(464,585
|
)
|
(371,985
|
)
|
||||
|
Net income
|
$
|
28,998
|
$
|
21,393
|
||||
|
Six months ended June 30,
|
||||||||
|
2025
|
2024
|
|||||||
|
(Unaudited)
|
||||||||
|
United States
|
$
|
293,324
|
$
|
242,075
|
||||
|
EMEA
|
124,902
|
98,445
|
||||||
|
United Kingdom
|
62,300
|
46,865
|
||||||
|
Rest of the world
|
100,738
|
65,634
|
||||||
|
Total
|
$
|
581,264
|
$
|
453,019
|
||||
F - 23
|
MONDAY.COM AND SUBSIDIARIES
NOTES TO CONDENSED CONSOLIDATED FINANCIAL STATEMENTS
|
NOTE 15:-
|
SEGMENT REPORTING (cont.)
|
|
As of
June 30,
2025
|
As of
December 31,
2024
|
|||||||
|
(Unaudited)
|
||||||||
|
Israel
|
$
|
94,257
|
$
|
72,613
|
||||
|
United States
|
13,467
|
17,895
|
||||||
|
United Kingdom
|
46,953
|
43,030
|
||||||
|
Rest of the world
|
2,168
|
2,741
|
||||||
|
Total
|
$
|
156,845
|
$
|
136,279
|
||||
|
H1 2025
|
|
|
• |
our ability to effectively manage the scope and complexity of our business following years of rapid growth and our ability to maintain profitability;
|
|
|
• |
foreign currency exchange rate fluctuations;
|
|
|
• |
the fact that we continue to derive a majority of revenues from monday work management;
|
|
|
• |
fluctuations in operating results;
|
|
|
• |
real or perceived errors, failures, vulnerabilities or bugs in our platform, products, or third-party applications offered on our app marketplace or interruptions or performance problems in the technology or
infrastructure underlying our platform;
|
|
|
• |
risks related to artificial intelligence (“AI”) or machine learning (“ML”);
|
|
|
• |
our ability to attract customers, grow our retention rates and expand usage within organizations, including cross selling and upselling;
|
|
|
• |
risks related to our subscription-based business model;
|
|
|
• |
our sales efforts may require considerable time and expense and the use of differing sales strategies
and may extend our sales cycles;
|
|
|
• |
changes in sizes or types of business that purchase our platform and products;
|
|
|
• |
our ability to offer high-quality customer support and consistent sales strategies;
|
|
|
• |
maintenance of corporate culture;
|
|
|
• |
risks related to international operations and compliance with laws and regulations applicable to our global operations;
|
|
|
• |
risks related to acquisitions, strategic investments, partnerships, or alliances;
|
|
H1 2025
|
|
|
• |
risks associated with environmental and social responsibility and climate change;
|
|
|
• |
our dependence on key employees and ability to attract and retain highly skilled employees;
|
|
|
• |
our ability to raise additional capital or generate cash flows necessary to grow our business;
|
|
|
• |
uncertain global economic conditions and inflation;
|
|
|
• |
changes and competition in the market and software categories in which we participate;
|
|
|
• |
our ability to introduce new products, features, integrations, capabilities, and enhancements;
|
|
|
• |
the ability of our platform to interoperate with a variety of software applications;
|
|
|
• |
our reliance on third-party application stores to distribute our mobile application;
|
|
|
• |
our successful strategic relationships with, and our dependence on third parties;
|
|
|
• |
our reliance on traditional web search engines to direct traffic to our website;
|
|
|
• |
interruption or delays in service from third parties or our inability to plan and manage interruptions;
|
|
|
• |
risks related to security disruptions, unauthorized system access;
|
|
|
• |
evolving privacy protection and data security laws, regulations, industry standards, policies, contractual obligations, and cross-border data transfer or localization restrictions;
|
|
|
• |
new legislation and regulatory obligations regulating AI;
|
|
|
• |
changes in tax law and regulations or if we were to be classified as a passive foreign investment company;
|
|
|
• |
our ability to maintain, protect or enforce our intellectual property rights or risks related to
intellectual property infringement claims;
|
|
|
• |
risks related to our use of open-source software;
|
|
|
• |
risks related to our founder share that provides certain veto rights
|
|
|
• |
risks related to our status as a foreign private issuer incorporated and located in Israel, including risks related to the ongoing war between Israel and Hamas and escalations thereof;
|
|
|
• |
our expectation not to pay dividends for the foreseeable future;
|
|
|
• |
risks related to our Digital Lift Initiative and the monday.com Foundation; and
|
|
|
• |
risks related to legal and regulatory matters.
|
|
H1 2025
|
|
|
• |
“dollars” or “$” means United States dollars; and
|
|
|
• |
“NIS” means New Israeli Shekels.
|
|
H1 2025
|
|
|
• |
Revenue: Our revenue was $581.3 million and $453.0 million for
the six months ended June 30, 2025, and June 30, 2024, respectively.
|
|
|
• |
Year over Year Revenue Growth: Our revenue growth was 28% and
34% for the six months ended June 30, 2025, and June 30, 2024, respectively.
|
|
|
• |
Net Income: Our net income was $29.0 million and $21.4 million
for the six months ended June 30, 2025, and June 30, 2024, respectively.
|
|
|
• |
Net Cash Provided by Operating Activities: Our net cash
provided by operating activities was $178.8 million and $147.7 million for the six months ended June 30, 2025, and June 30, 2024, respectively.
|
|
|
• |
Adjusted free Cash Flow: Our adjusted free cash flow was
$173.6 million and $140.7 million for the six months ended June 30, 2025, and June 30, 2024, respectively.
|
|
H1 2025
|
|
H1 2025
|
|
H1 2025
|
|
H1 2025
|
|
Six months ended June 30,
|
||||||||
|
2025
|
2024
|
|||||||
|
(in thousands)
|
||||||||
|
Revenue
|
$
|
581,264
|
$
|
453,019
|
||||
|
Cost of revenue (1)
|
59,978
|
47,217
|
||||||
|
Gross profit
|
521,286
|
405,802
|
||||||
|
Operating Expenses:
|
||||||||
|
Research and development (1)
|
156,424
|
94,868
|
||||||
|
Sales and marketing (1)
|
294,310
|
259,612
|
||||||
|
General and administrative (1)
|
72,307
|
54,550
|
||||||
|
Total operating expenses
|
523,041
|
409,030
|
||||||
|
Operating loss
|
(1,755
|
)
|
(3,228
|
)
|
||||
|
Financial income, net
|
31,749
|
27,689
|
||||||
|
Income before income taxes
|
29,994
|
24,461
|
||||||
|
Income tax expenses
|
(996
|
)
|
(3,068
|
)
|
||||
|
Net income
|
$
|
28,998
|
$
|
21,393
|
||||
|
Six months ended June 30,
|
||||||||
|
2025
|
2024
|
|||||||
|
(in thousands)
|
||||||||
|
Cost of revenue
|
$
|
3,406
|
$
|
3,116
|
||||
|
Research and development
|
43,347
|
23,193
|
||||||
|
Sales and marketing
|
19,205
|
18,068
|
||||||
|
General and administrative
|
21,645
|
18,789
|
||||||
|
Total share-based compensation
|
$
|
87,603
|
$
|
63,166
|
||||
|
H1 2025
|
|
Six months ended June 30,
|
||||||||
|
2025
|
2024
|
|||||||
|
Revenue
|
100
|
%
|
100
|
%
|
||||
|
Cost of revenue
|
10
|
10
|
||||||
|
Gross profit
|
90
|
90
|
||||||
|
Operating Expenses:
|
||||||||
|
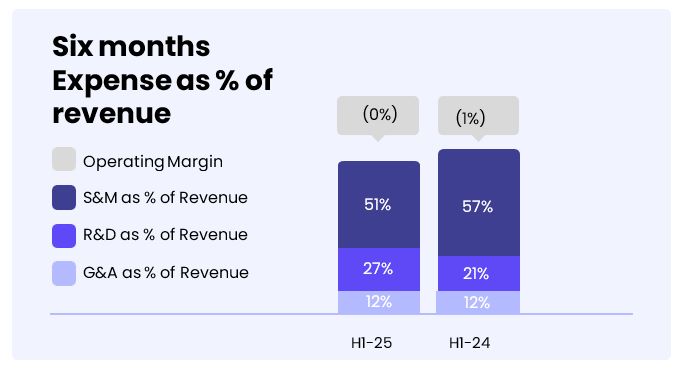
Research and development
|
27
|
21
|
||||||
|
Sales and marketing
|
51
|
57
|
||||||
|
General and administrative
|
12
|
12
|
||||||
|
Total operating expenses
|
90
|
90
|
||||||
|
Operating loss
|
(-
|
)
|
(1
|
)
|
||||
|
Financial income, net
|
5
|
6
|
||||||
|
Income before income taxes
|
5
|
5
|
||||||
|
Income tax expenses
|
(-
|
)
|
(1
|
)
|
||||
|
Net income
|
5
|
%
|
5
|
%
|
||||
|
Six months ended June 30,
|
||||||||||||||||
|
2025
|
2024
|
Change
|
%
|
|||||||||||||
|
(in thousands)
|
||||||||||||||||
|
Revenue
|
$
|
581,264
|
$
|
453,019
|
$
|
128,245
|
28
|
%
|
||||||||
|
Six months ended June 30,
|
||||||||||||||||
|
2025
|
2024
|
Change
|
% change
|
|||||||||||||
|
(in thousands)
|
||||||||||||||||
|
Cost of revenue
|
$
|
59,978
|
$
|
47,217
|
$
|
12,761
|
27
|
%
|
||||||||
|
Gross profit
|
90
|
%
|
90
|
%
|
||||||||||||
|
H1 2025
|
|
Six months ended June 30,
|
||||||||||||||||
|
2025
|
2024
|
Change
|
%
|
|||||||||||||
|
(in thousands)
|
||||||||||||||||
|
Research and development
|
$
|
156,424
|
$
|
94,868
|
$
|
61,556
|
65
|
%
|
||||||||
|
Sales and marketing
|
294,310
|
259,612
|
34,698
|
13
|
%
|
|||||||||||
|
General and administrative
|
72,307
|
54,550
|
17,757
|
33
|
%
|
|||||||||||
|
Total operating expenses
|
$
|
523,041
|
$
|
409,030
|
$
|
114,011
|
28
|
%
|
||||||||
|
H1 2025
|
|
Six months ended June 30,
|
||||||||||||||||
|
2025
|
2024
|
Change
|
%
|
|||||||||||||
|
(in thousands)
|
||||||||||||||||
|
Financial income, net
|
$
|
31,749
|
$
|
27,689
|
$
|
4,060
|
15
|
%
|
||||||||
|
Six months ended June 30,
|
||||||||||||||||
|
2025
|
2024
|
Change
|
%
|
|||||||||||||
|
(in thousands)
|
||||||||||||||||
|
Income tax expenses
|
$
|
996
|
$
|
3,068
|
$
|
(2,072
|
)
|
(68
|
)%
|
|||||||
|
H1 2025
|
|
Six months ended June 30,
|
||||||||
|
2025
|
2024
|
|||||||
|
(in thousands)
|
||||||||
|
Non-GAAP operating income
|
$
|
85,848
|
$
|
59,938
|
||||
|
Adjusted free cash flow
|
$
|
173,625
|
$
|
140,715
|
||||
|
Six months ended June 30,
|
||||||||
|
2025
|
2024
|
|||||||
|
(in thousands)
|
||||||||
|
Operating loss
|
$
|
(1,755
|
)
|
$
|
(3,228
|
)
|
||
|
Share-based compensation expenses
|
87,603
|
63,166
|
||||||
|
Non-GAAP operating income
|
$
|
85,848
|
$
|
59,938
|
||||
|
H1 2025
|
|
Six months ended June 30,
|
||||||||
|
2025
|
2024
|
|||||||
|
(in thousands)
|
||||||||
|
Net cash provided by operating activities
|
$
|
178,807
|
$
|
147,749
|
||||
|
Purchase of property and equipment
|
(9,571
|
)
|
(5,964
|
)
|
||||
|
Capitalized software development costs
|
(1,703
|
)
|
(1,070
|
)
|
||||
|
Purchase of property and equipment related to build-out and expansion of our corporate headquarters
|
6,092
|
-
|
||||||
|
Adjusted free cash flow
|
$
|
173,625
|
$
|
140,715
|
||||
|
H1 2025
|
|
Six months ended June 30,
|
||||||||
|
2025
|
2024
|
|||||||
|
(in thousands)
|
||||||||
|
Net cash provided by operating activities
|
$
|
178,807
|
$
|
147,749
|
||||
|
Net cash used in investing activities
|
$
|
(21,323
|
)
|
$
|
(7,034
|
)
|
||
|
Net cash provided by financing activities
|
$
|
21,429
|
$
|
33,399
|
||||
|
H1 2025
|
|
H1 2025
|
|
Derivatives designated as hedging instruments:
|
Maturity in 2025-2026
|
|||
|
Foreign exchange contracts:
|
||||
|
NIS
|
$
|
274,259
|
||
|
Total
|
$
|
274,259
|
||