|
Date: May 21, 2025 |
|
EVOGENE LTD.
(Registrant) By: /s/ Yaron Eldad Yaron Eldad Chief Financial Office |

| ◾ |
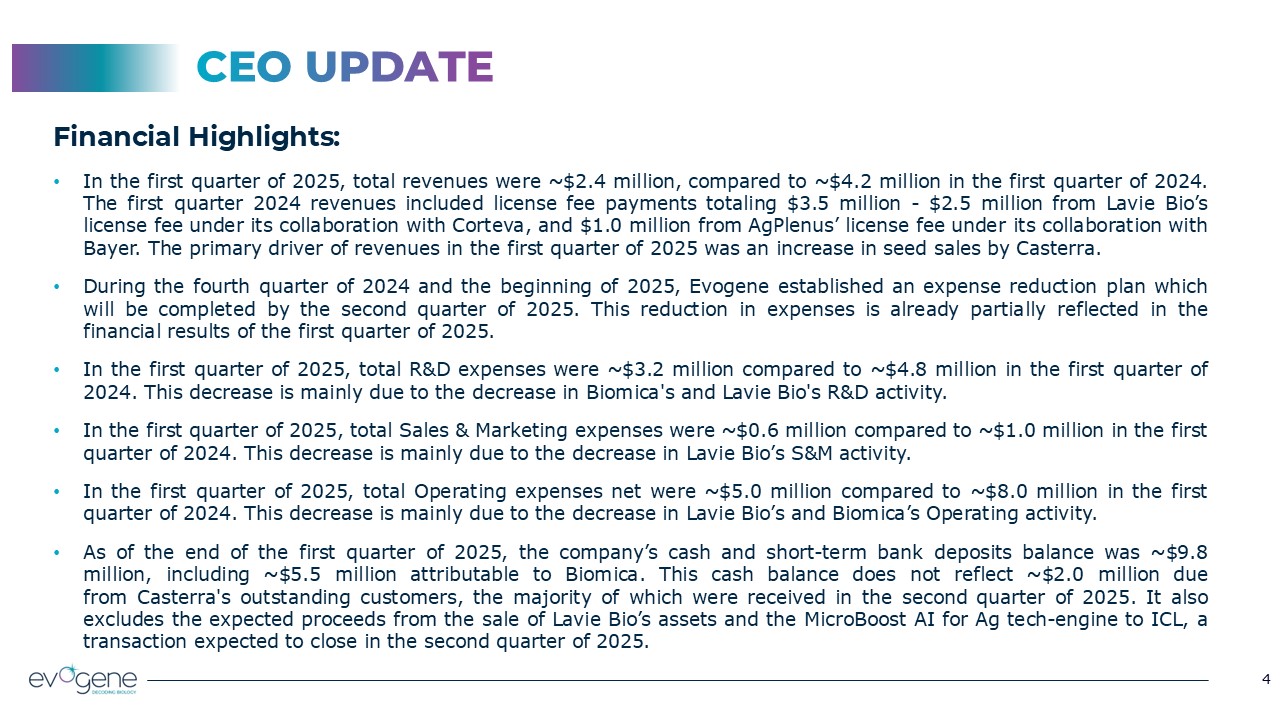
In the first quarter of 2025, total revenues were approximately $2.4 million, compared to approximately $4.2 million in the first quarter of 2024. The first quarter of 2024 revenues
included license fee payments totaling $3.5 million - $2.5 million from Lavie Bio’s license fee under its collaboration with Corteva, and $1.0 million from AgPlenus’ license fee under its collaboration with Bayer. The primary driver of
revenue in the first quarter of 2025 was an increase in seed sales by Casterra.
|
| ◾ |
During the fourth quarter of 2024 and the beginning of 2025, Evogene established an expense reduction plan which is expected to be completed by the second quarter of
2025. This reduction in expenses is already partially reflected in the financial results of the first quarter of 2025.
|
| ◾ |
In the first quarter of 2025, total R&D expenses were approximately $3.2 million, compared to approximately $4.8 million in the first quarter of 2024. This decrease is mainly due to
the decrease in Biomica's and Lavie Bio's R&D activity.
|
| ◾ |
In the first quarter of 2025, total Sales & Marketing expenses were approximately $0.6 million compared to approximately $1.0 million in the first quarter of 2024. This decrease is
mainly due to the decrease in Lavie Bio’s S&M activity.
|
| ◾ |
In the first quarter of 2025, total Operating expenses net were approximately $5.0 million, compared to approximately $8.0 million in the first quarter of 2024. This decrease is mainly
due to the decrease in Lavie Bio’s and Biomica’s operating activity.
|
| ◾ |
Evogene announced on April 21, 2025 the acquisition of most of the activity of Lavie Bio by ICL, for $15.25 million. In addition, ICL will acquire MicroBoost AI for Ag, for
approximately $3.5 million. Lavie Bio will redeem the SAFE investment, made by an ICL affiliate. Acquisition completion is expected during Q2 2025, following satisfactory completion of customary closing conditions. This transaction is
expected to generate value for Evogene both directly, through the sale of MicroBoost AI for Ag and indirectly, through dividends, as Evogene will remain a major shareholder in Lavie Bio.
|
| ◾ |
As of the end of the first quarter of 2025, the company’s cash and short-term bank deposits balance was approximately $9.8 million, including approximately $5.5 million attributable to
Biomica. This cash balance does not reflect approximately $2.0 million due from Casterra's outstanding customers, the majority of which were received in the second quarter of 2025. It also excludes the expected proceeds from the sale of
Lavie Bio’s assets and the MicroBoost AI for Ag tech-engine to ICL, a transaction expected to close in the second quarter of 2025 subject to completion of customary closing conditions.
|
|
-
|
April 21, 2025 – announced the acquisition of most of the activity of Lavie Bio by ICL, for $15.25 million in value. In addition, ICL will
acquire MicroBoost AI for Ag, for approximately $3.5 million. Lavie Bio will redeem the prior SAFE investment, made by an ICL affiliate.
|
|
-
|
Acquisition completion is expected during Q2 2025, following completion of customary and regulatory closing conditions.
|
|
-
|
Delivery of approximately 250 tons of castor seeds to a partner in Africa — surpassing the approximately 215 tons delivered in entire 2024.
|
|
-
|
Strengthening the sales team in Brazil and initial execution of a new marketing and sales strategy.
|
|
-
|
Castor farming proof of concept trials for grain (not seed) to be sold to castor crushing factories, in Kenya and Brazil, with local partners.
Trials are underway in all locations, with initial results expected in Q3 2025.
|
|
-
|
February 2025 - discovery of a new mode of action for fungicides against Septoria in wheat.
|
|
-
|
Advancement in the discovery phase with the identification of promising candidate compounds targeting the new MoA.
|
|
-
|
BMC128 - Phase I clinical study is progressing. New data shows early signs of monotherapy effectiveness, through immune activation within 14
days.
|
|
-
|
Obesity and Longevity - initial computational analyses indicate that microbiome-based solutions can be effectively designed and developed.
Early-stage discussions taking place to evaluate potential partnerships.
|
|
-
|
Additional funding is required for Phase II of the clinical study. An expense reduction plan has been established, to be completed by Q3 2025. Expense reduction is
already reflected in Biomica's financial results of Q1 2025.
|
|
|
• |
Biomica Ltd. (www.biomicamed.com) – developing and advancing novel microbiome-based therapeutics to treat human disorders powered by MicroBoost AI;
|
|
|
• |
Lavie Bio (www.lavie-bio.com) – developing and commercially advancing, microbiome based ag-biologicals powered by MicroBoost AI;
|
|
|
• |
AgPlenus Ltd. (www.agplenus.com) – developing next generation ag-chemicals for effective and sustainable crop protection powered by ChemPass AI; and
|
|
|
• |
Casterra Ag (www.casterra.co) – developing and marketing superior castor seed varieties producing high yield and high-grade oil content, on an industrial scale for the biofuel and other industries powered by GeneRator AI.
|
|
March 31,
|
December 31,
|
|||||||
|
2025
|
2024
|
|||||||
|
Unaudited
|
||||||||
|
ASSETS
|
||||||||
|
CURRENT ASSETS:
|
||||||||
|
Cash and cash equivalents
|
$
|
7,495
|
$
|
15,301
|
||||
|
Short-term bank deposits
|
2,354
|
10
|
||||||
|
Trade receivables
|
2,640
|
1,091
|
||||||
|
Other receivables and prepaid expenses
|
651
|
2,064
|
||||||
|
Deferred expenses related to issuance of warrants
|
1,209
|
1,304
|
||||||
|
Inventories
|
2,152
|
1,819
|
||||||
|
16,501
|
21,589
|
|||||||
|
LONG-TERM ASSETS:
|
||||||||
|
Long-term deposits and other receivables
|
162
|
12
|
||||||
|
Investment in an associate
|
80
|
82
|
||||||
|
Deferred expenses related to issuance of warrants
|
1,505
|
1,735
|
||||||
|
Right-of-use-assets
|
2,480
|
2,447
|
||||||
|
Property, plant and equipment, net
|
1,621
|
1,804
|
||||||
|
Intangible assets, net
|
11,955
|
12,195
|
||||||
|
17,803
|
18,275
|
|||||||
|
TOTAL ASSETS
|
$
|
34,304
|
$
|
39,864
|
||||
|
LIABILITIES AND EQUITY
|
||||||||
|
CURRENT LIABILITIES:
|
||||||||
|
Trade payables
|
$
|
592
|
$
|
1,228
|
||||
|
Employees and payroll accruals
|
1,622
|
1,869
|
||||||
|
Lease liabilities
|
670
|
589
|
||||||
|
Liabilities in respect of government grants
|
353
|
323
|
||||||
|
Deferred revenues and other advances
|
209
|
360
|
||||||
|
Warrants and pre-funded warrants liability
|
1,169
|
2,876
|
||||||
|
Convertible SAFE
|
10,371
|
10,371
|
||||||
|
Other payables
|
613
|
1,079
|
||||||
|
15,599
|
18,695
|
|||||||
|
LONG-TERM LIABILITIES:
|
||||||||
|
Lease liabilities
|
1,922
|
1,914
|
||||||
|
Liabilities in respect of government grants
|
4,302
|
4,327
|
||||||
|
Deferred revenues and other advances
|
86
|
90
|
||||||
|
6,310
|
6,331
|
|||||||
|
TOTAL LIABILITIES
|
$
|
21,909
|
$
|
25,026
|
||||
|
SHAREHOLDERS' EQUITY:
|
||||||||
|
Ordinary shares of NIS 0. 2 par value:
Authorized − 15,000,000 ordinary shares; Issued and outstanding – 6,672,173 ordinary shares on March 31, 2025 and 6,514,589 ordinary shares on December 31, 2024
|
372
|
363
|
||||||
|
Share premium and other capital reserves
|
272,641
|
272,257
|
||||||
|
Accumulated deficit
|
(276,658
|
)
|
(274,071
|
)
|
||||
|
Equity attributable to equity holders of the Company
|
(3,645
|
)
|
(1,451
|
)
|
||||
|
Non-controlling interests
|
16,040
|
16,289
|
||||||
|
TOTAL EQUITY
|
12,395
|
14,838
|
||||||
|
TOTAL LIABILITIES AND EQUITY
|
$
|
34,304
|
$
|
39,864
|
||||
|
Three months ended
March 31,
|
Year ended
December 31,
|
|||||||||||
|
2025
|
2024
|
2024
|
||||||||||
|
Unaudited
|
||||||||||||
|
Revenues
|
$
|
2,444
|
$
|
4,190
|
$
|
8,511
|
||||||
|
Cost of revenues
|
1,614
|
310
|
2,683
|
|||||||||
|
Gross profit
|
830
|
3,880
|
5,828
|
|||||||||
|
Operating expenses (income):
|
||||||||||||
|
Research and development, net
|
3,208
|
4,801
|
16,648
|
|||||||||
|
Sales and marketing
|
645
|
992
|
3,425
|
|||||||||
|
General and administrative
|
1,294
|
1,654
|
7,441
|
|||||||||
|
Other expenses (income)
|
(191
|
)
|
519
|
524
|
||||||||
|
Total operating expenses, net
|
4,956
|
7,966
|
28,038
|
|||||||||
|
Operating loss
|
(4,126
|
)
|
(4,086
|
)
|
(22,210
|
)
|
||||||
|
Financing income
|
1,603
|
407
|
7,546
|
|||||||||
|
Financing expenses
|
(464
|
)
|
(166
|
)
|
(3,342
|
)
|
||||||
|
Financing income, net
|
1,139
|
241
|
4,204
|
|||||||||
|
Share of loss of an associate
|
2
|
-
|
39
|
|||||||||
|
Loss before taxes on income
|
(2,989
|
)
|
(3,845
|
)
|
(18,045
|
)
|
||||||
|
Taxes on income
|
-
|
-
|
9
|
|||||||||
|
Loss
|
$
|
(2,989
|
)
|
$
|
(3,845
|
)
|
$
|
(18,054
|
)
|
|||
|
Attributable to:
|
||||||||||||
|
Equity holders of the Company
|
(2,587
|
)
|
(3,863
|
)
|
(16,485
|
)
|
||||||
|
Non-controlling interests
|
(402
|
)
|
18
|
(1,569
|
)
|
|||||||
|
$
|
(2,989
|
)
|
$
|
(3,845
|
)
|
$
|
(18,054
|
)
|
||||
|
Basic and diluted loss per share, attributable to equity holders of the Company (*)
|
$
|
(0.38
|
)
|
$
|
(0.76
|
)
|
$
|
(2.89
|
)
|
|||
|
Weighted average number of shares used in computing basic and diluted loss per share (*)
|
6,798,173
|
5,083,116
|
5,697,245
|
|||||||||
|
Three months ended
March 31,
|
Year ended
December 31,
|
|||||||||||
|
2025
|
2024
|
2024
|
||||||||||
|
Unaudited
|
||||||||||||
|
Cash flows from operating activities:
|
||||||||||||
|
Loss
|
$
|
(2,989
|
)
|
$
|
(3,845
|
)
|
$
|
(18,054
|
)
|
|||
|
Adjustments to reconcile loss to net cash used in operating activities:
|
||||||||||||
|
Adjustments to the profit or loss items:
|
||||||||||||
|
Depreciation and amortization of property, plant and equipment and right-of-use-assets
|
339
|
426
|
1,530
|
|||||||||
|
Amortization of intangible assets
|
240
|
245
|
974
|
|||||||||
|
Share-based compensation
|
316
|
539
|
1,795
|
|||||||||
|
Remeasurement of Convertible SAFE
|
-
|
(25
|
)
|
3
|
||||||||
|
Net financing income
|
1
|
(194
|
)
|
(689
|
)
|
|||||||
|
Loss from sale of property, plant and equipment
|
-
|
519
|
524
|
|||||||||
|
Gain from deduction of right-of-use asset and subsequent
|
||||||||||||
|
investment in sub-lease asset
|
(191
|
)
|
-
|
-
|
||||||||
|
Excess of initial fair value of pre-funded warrants over transaction proceeds
|
-
|
-
|
2,684
|
|||||||||
|
Amortization of deferred expenses related to issuance of warrants
|
326
|
-
|
471
|
|||||||||
|
Remeasurement of pre-funded warrants and warrants
|
(1,477
|
)
|
-
|
(6,529
|
)
|
|||||||
|
Share of loss of an associate
|
2
|
-
|
39
|
|||||||||
|
Taxes on income
|
-
|
-
|
9
|
|||||||||
|
(444
|
)
|
1,510
|
811
|
|||||||||
|
Changes in asset and liability items:
|
||||||||||||
|
Increase in trade receivables
|
(1,549
|
)
|
(182
|
)
|
(734
|
)
|
||||||
|
Decrease (increase) in other receivables and prepaid expenses
|
1,467
|
(179
|
)
|
925
|
||||||||
|
Increase in inventories
|
(333
|
)
|
(640
|
)
|
(1,743
|
)
|
||||||
|
Decrease in trade payables
|
(515
|
)
|
(685
|
)
|
(596
|
)
|
||||||
|
Decrease in employees and payroll accruals
|
(247
|
)
|
(105
|
)
|
(668
|
)
|
||||||
|
Increase (decrease) in other payables
|
(466
|
)
|
(61
|
)
|
62
|
|||||||
|
Decrease in deferred revenues and other advances
|
(155
|
)
|
(71
|
)
|
(559
|
)
|
||||||
|
(1,798
|
)
|
(1,923
|
)
|
(3,313
|
)
|
|||||||
|
Cash received (paid) during the year for:
|
||||||||||||
|
Interest received
|
95
|
171
|
934
|
|||||||||
|
Interest paid
|
(46
|
)
|
(23
|
)
|
(67
|
)
|
||||||
|
Taxes paid
|
-
|
-
|
(11
|
)
|
||||||||
|
Net cash used in operating activities
|
$
|
(5,182
|
)
|
$
|
(4,110
|
)
|
$
|
(19,700
|
)
|
|||
|
Three months ended
March 31,
|
Year ended
December 31,
|
|||||||||||
|
2025
|
2024
|
2024
|
||||||||||
|
Unaudited
|
||||||||||||
|
Cash flows from investing activities:
|
||||||||||||
|
Purchase of property, plant and equipment
|
$
|
(122
|
)
|
$
|
(141
|
)
|
$
|
(626
|
)
|
|||
|
Proceeds from sale of property, plant and equipment
|
-
|
10
|
58
|
|||||||||
|
Proceeds from finance sub -lease asset
|
2
|
-
|
-
|
|||||||||
|
Proceeds from short-term bank deposits
|
-
|
1,210
|
27,340
|
|||||||||
|
Investment in short-term bank deposits
|
(2,326
|
)
|
(5,441
|
)
|
(17,150
|
)
|
||||||
|
Net cash provided by (used in) investing activities
|
(2,446
|
)
|
(4,362
|
)
|
9,622
|
|||||||
|
Cash flows from financing activities:
|
||||||||||||
|
Proceeds from issuance of ordinary shares, pre-funded warrants and warrants
|
-
|
-
|
5,500
|
|||||||||
|
Proceeds from issuance of ordinary shares, net of issuance expenses
|
-
|
3
|
123
|
|||||||||
|
Repayment of lease liabilities
|
(143
|
)
|
(231
|
)
|
(901
|
)
|
||||||
|
Proceeds from government grants
|
106
|
-
|
232
|
|||||||||
|
Repayment of government grants
|
(122
|
)
|
(139
|
)
|
(298
|
)
|
||||||
|
Net cash provided by (used in) financing activities
|
(159
|
)
|
(367
|
)
|
4,656
|
|||||||
|
|
|
|
|
Exchange rate differences on balances of cash and cash equivalent balances
|
(19
|
)
|
(18
|
)
|
(49
|
)
|
||||||
|
Decrease in cash and cash equivalents
|
(7,806
|
)
|
(8,857
|
)
|
(5,471
|
)
|
||||||
|
Cash and cash equivalents at the beginning of the period
|
15,301
|
20,772
|
20,772
|
|||||||||
|
Cash and cash equivalents at the end of the period
|
$
|
7,495
|
$
|
11,915
|
$
|
15,301
|
||||||
|
Significant non-cash activities
|
||||||||||||
|
Purchase of property, plant and equipment
|
$
|
-
|
$
|
22
|
$
|
120
|
||||||
|
Right-of-use asset recognized with corresponding lease liability
|
$
|
207
|
$
|
130
|
$
|
2,307
|
||||||
|
Exercise of pre-funded warrants
|
$
|
229
|
$
|
-
|
$
|
2,289
|
||||||
|
Derecognition of property, plant and equipment under a finance lease
|
$
|
13
|
$
|
-
|
$
|
-
|
||||||
|
Investment in affiliated company with corresponding deferred revenues
|
$
|
-
|
$
|
120
|
$
|
120
|