|
|
|
|
|
KENON HOLDINGS LTD.
|
|
|
|
|
|
|
|
|
Date: May 21, 2025
|
By:
|
/s/ Robert L. Rosen
|
|
|
|
Name:
|
Robert L. Rosen
|
|
|
|
Title:
|
Chief Executive Officer
|
|
| 1. |
Executive Summary0F1
|
|
For the
|
|||||||||||||
|
Three Months Ended
|
|||||||||||||
|
March 31
|
|||||||||||||
|
2025
|
2024
|
%
|
|||||||||||
|
Consolidated
|
EBITDA after proportionate consolidation
|
410
|
332
|
23
|
%
|
||||||||
|
|
Net income
|
93
|
15
|
520
|
%
|
||||||||
|
|
Adjusted net income
|
101
|
71
|
42
|
%
|
||||||||
|
FFO
|
325
|
289
|
12
|
%
|
|||||||||
|
|
|||||||||||||
|
Israel
|
EBITDA
|
137
|
170
|
(19
|
)%
|
||||||||
|
|
FFO
|
193
|
229
|
(16
|
)%
|
||||||||
|
|
|||||||||||||
|
U.S.
|
EBITDA after proportionate consolidation
|
279
|
165
|
69
|
%
|
||||||||
|
|
FFO
|
153
|
90
|
70
|
%
|
||||||||
|
|
EBITDA after proportionate consolidation – energy transition
|
277
|
166
|
67
|
%
|
||||||||
|
|
EBITDA after proportionate consolidation – renewable energies
|
27
|
28
|
(4
|
)%
|
||||||||
|
|
* |
EBITDA, EBITDA after proportionate consolidation, adjusted net income and FFO are not recognized in accordance with IFRS – for definitions and the manner of their calculation – see Sections 4B and 4G below.
|
| 1 |
The Executive Summary below is presented solely for convenience and it is not a substitute for reading the full detail (including with reference to the matters referred to in the Summary) as stated in this report
with all its parts (including warnings relating to “forward‑looking” information as it is defined in the Securities Law, 1968 (“the Securities Law”), definitions or explanations with respect to the indices for measurement of the results and
including the information included by means of reference, as applicable). This Summary includes estimates, plans and assessment of the Company, which constitute “forward‑looking” information regarding which there is no certainty they will
materialize and the readers are directed to the detail presented in this report below.
|
| 1. |
Executive Summary (Cont.)
|
|
Israel
|
Ramat Beka project about 505 megawatts of solar energy and about 2,760 megawatts per hour of storage) – in March 2025, government approval was received for
advancement of the plan on the National Infrastructures Board and in May 2025 a regulation of the Electricity Authority was published. For details see Section 5A(2) below.
|
|
|
Project Intel (combined‑cycle power plant with a capacity of 450–650 megawatts) – in March 2025, government authorization was received for advancement of the
plan on the National Infrastructures Board. For details see Section 5A(2) below.
|
||
|
Financing in Israel – in February 2025, OPC Israel signed a bank financing agreement, in the aggregate amount of about NIS 300 million, on terms similar to those
of the agreements it signed in 2024. For details – see Note 6A(1) to the Interim Statements.
|
||
|
U.S.
|
Basin Ranch project (combined cycle power plant(1) with a capacity of 1.35 gigawatts) advancing toward an investment decision and start of
construction in the second half of 2025. for details – see Section 5B below.
|
|
|
Transaction for increase in the holdings in the Shore power plant in the area of Energy Transition in the U.S. – in April 2025, acquisition of an additional 20%
of the Shore power plant was completed such that as at the approval date of the report CPV’s holding is about 89%. For details – see Note 9C(1) to the Interim Statements.
|
||
|
Capacity auctions in the PJM market for the period June 2026 through May 2028 – in April 2025, the FERC approved for PJM minimum and maximum ceiling (collar)
prices of $329 for MW/day and $177 for MW/day, respectively, for the following two auctions for the period from June 1, 2026 through May 31, 2028. For details – see Section 3.3I below.
|
||
|
Refinancing in Shore and reductions of interest in Maryland and Fairview – in the first quarter of 2025 the undertaking for refinancing in Shore was completed.
In addition, the transactions for interest reductions (repricing) in Maryland and Fairview were completed. For details – see Section 8 below.
|
||
|
Oregon project (combined cycle power plant(1) with a capacity of 1.45 gigawatts) chosen by PJM for advancement in an accelerated connection process as part of a RRI (Reliability
Resource Initiative). For details – see Section 5B below.
|
||
|
Group headquarters
|
Credit rating of A1.il with a stable rating outlook for the Company – in May 2025, Midroog determined an initial rating of A2.il with a stable rating outlook for the Company and its debentures. For
details – see Section 8C below.
|

|
|
(1) |
Renewable energy projects are presented in accordance with the relative share of the CPV Group in this area of activities (about 66.7%).
|
|
|
(2) |
Natural gas projects are presented in accordance with the relative share of the CPV Group in each project.
|
| 1. |
Executive Summary (Cont.)
|
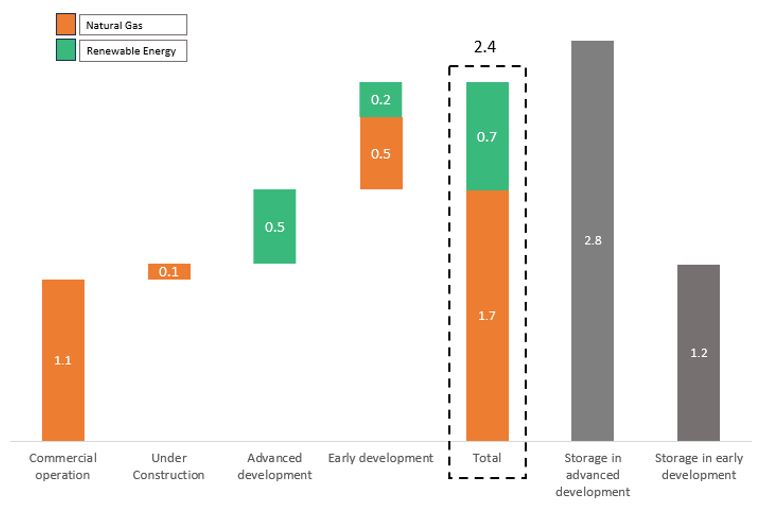
| (1) |
The above chart does not include the Hadera 2 project, with a capacity of 850 megawatts, in light of the Government’s decision to reject the plan. As at the approval date of the report, a petition is underway in the Supreme Court sitting
as the High Court of Justice regarding cancellation of the said Government decision. For details – see Section 5A(2) below and Section 7.3.13.4 of Part A to the Periodic Report for 2024.
|
| 2. |
Brief description of the areas of activity
|
| 3. |
Main Developments in the Business Environment
|
|
|
3.1 |
General
|
|
|
A. |
Macro‑economic environment (particularly inflation and interest) – for details regarding the business and macro‑economic environment in which the Group companies operate, significant changes that occurred in 2024 and the impact
thereof on the Group’s activities – see Section 3.1A to the Report of the Board of Directors for 2024.
|
|
Dollar/shekel exchange rate *
|
2025
|
2024
|
Change
|
|||||||||
|
At the end of the previous year
|
3.647
|
3.627
|
0.6
|
%
|
||||||||
|
On March 31
|
3.718
|
3.681
|
1.0
|
%
|
||||||||
|
Average January– March
|
3.613
|
3.664
|
(1.4
|
)%
|
||||||||
|
|
* |
The dollar/shekel exchange rate shortly before the approval date of the report (on May 16, 2025) is 3.549.
|
| 3. |
Main Developments in the Business Environment (Cont.)
|
|
|
3.1 |
General (Cont.)
|
|
Israeli
CPI
|
U.S.
CPI
|
Bank of Israel
interest rate
|
Federal
interest rate
|
|||||||||||||
|
On May 16, 2025
|
117.3
|
320.8
|
4.5
|
%
|
4.25%–4.50
|
%
|
||||||||||
|
On March 31, 2025
|
115.4
|
319.1
|
4.5
|
%
|
4.25%–4.50
|
%
|
||||||||||
|
On December 31, 2024
|
115.1
|
315.5
|
4.5
|
%
|
4.25%–4.50
|
%
|
||||||||||
|
On March 31, 2024
|
111.6
|
310.3
|
4.5
|
%
|
5.25%–5.50
|
%
|
||||||||||
|
On December 31, 2023
|
111.3
|
307.1
|
4.75
|
%
|
5.25%–5.50
|
%
|
||||||||||
|
Change in the first quarter of 2025
|
0.3
|
%
|
1.1
|
%
|
0
|
%
|
0
|
%
|
||||||||
|
Change in the first quarter of 2024
|
0.3
|
%
|
1.0
|
%
|
(0.25
|
%)
|
0
|
%
|
||||||||
|
|
B. |
Domestic and geopolitical instability in the defense (security) situation in Israel – further to that stated in Section 6.1.1 of Part A of the Periodic Report for 2024, as of the approval date of the report, the ceasefire had
ended in some of the combat areas along with increased security instability and a rekindling of the fighting, including calling up of military reserves and air strikes by Yemenite terrorist organizations, as well as significant
uncertainty regarding the defense situation in Israel. Also, there is considerable uncertainty with respect to the impacts of the war on macro‑economic and financial factors in Israel, including the Israeli capital market.
|
|
|
As a group operating in Israel, the said rekindling of the fighting, expansion of the scope of the combat and/or a worsening of the defense situation in Israel could
unfavorably affect its activities, operating results and liquidity, including due to impacts, as stated, on the Group’s significant suppliers and customers and/or macro‑economic factors and the capital market. Regarding the possible impacts
of the war – see Sections 6.1.1 of Part A of the Periodic Report for 2024.
|
|
|
C. |
Change of the government in the U.S. – further to that stated in Section 3.1C of the Report of the Board of Directors for 2024, the policy changes against the background of entry into office of the Trump administration has created
uncertainty along with opportunities in the energy sector in the U.S. Since his entry into the position in January 2025, President Trump has issued executive orders promoting the production of fossil fuels, including with respect to natural
gas and LNG and reduction of government support in the area of renewable energies relating to, among other things, off‑shore wind. In addition, the Trump administration has suspended plans for Federal funding of clean energy and Federal
licensing processes for wind projects. In the estimation of the CPV Group, as at the approval date of the report, the said executive orders do not have a significant impact on the activities of the CPV Group in the renewable energy area,
and they may have a favorable impact on the business environment and the overall sentiment in the area of natural gas. Furthermore, as at the date of the report, President Trump has imposed tariffs (some of which have been stayed) on import
of equipment and raw materials (such as, steel and solar panels) into the U.S., in such a manner that at the present time there is uncertainty regarding the full extent of the impacts of the said orders on the cost of the equipment for the
projects. It is noted that the said update of the Customs’ duty could affect the equipment costs (both in the areas of renewable‑energy projects and natural‑gas projects) and trigger disruptions in the supply chain and, ultimately, lead to
an increase in the construction costs of projects1F2.
|
| 2 |
That stated in this Section above constitutes “forward‑looking” information, as it is defined in the Securities Law, which is based solely on the Company’s estimates as at the approval date of the report,
which are subject to uncertainty and changes that are not under the Company’s control. Ultimately, the policy changes made by the Trump administration (present or additional) could have a negative impact on advancement and/or benefits with
respect to renewable energy projects and the costs of equipment, services and shipping for the projects and power plants in the U.S. In addition, such changes could have macro impacts on the Company’s activity markets.
|
| 3. |
Main Developments in the Business Environment (Cont.)
|
|
|
3.1 |
General (Cont.)
|
|
|
C. |
(Cont.)
|
|
|
3.2 |
Activities in Israel
|
|
|
D. |
Update of the electricity tariffs – in January 2025, a decision of the Electricity Authority entered into effect regarding update of the tariff for 2025 for consumers of electricity from the Electric Company. Pursuant to the
decision, the weighted‑average generation component was updated to 29.39 agurot per kilowatt hour – a decline of about 2.2% in the weighted‑average generation component with reference to the generation component in effect at the end of
2024, this being mainly as a result of a decrease in the Electric Company’s generation cost due to a reduction in the use of coal and a forecasted decline in the Electric Company’s natural‑gas price. In addition, there was a non‑recurring
recognition of surplus receipts from sale of the Eshkol power plant, which led to a reduction in the generation component.
|
|
Period
|
2025
|
2024
|
Change
|
|||||||||
|
January–March average
|
29.39
|
30.18
|
(2.6
|
)%
|
||||||||
|
|
E. |
Update off the decision regarding regulation of conventional generation units – further to that stated in Section 7.3.4 of Part A of the Periodic Report for 2024, on March 26, 2025, the Electricity Authority published a decision –
“Update of the Decision regarding Regulation of Conventional Generation Units” (“the Decision”). As part of the Decision, the Electricity Authority increased the quota to four additional generation units and extended the validity of the
decision up to the end of June 2027. The availability tariff determined runs from 3.05 agurot to 3.31 agurot based on the date of the financial closing. In addition, an incentive of 0.5 agurot was provided for the first unit that reaches a
financial closing – this being only for units located in the northern part of Gush Dan (central Israel), as well as an incentive of 0.75% of the availability tariff for every month of acceleration of the commercial operation prior to
December 31, 2029. For details regarding the developments relating to the Hadera 2 projects – see Section 5 below.
|
| 3 |
That stated regarding the impact of changes in the generation component on the Company’s results, is subject to changes, among other things, as a result of determination of the periodic generation component and/or the manner of its
application between the hourly demand hours’ brackets, operational factors and/or existence of one or more of the risk factors to which the Company is exposed, as stated in Section 19.2 of Part A of the Periodic Report for 2024. For
additional details – see section 7.2.3 of Part A of the Periodic Report for 2024.
|
|
|
3.3 |
Activities in the U.S.
|
|
|
F. |
Electricity and natural gas prices
|
|
For the
|
||||||||||||
|
Three Months Ended
|
||||||||||||
|
Region
|
March 31
|
|||||||||||
|
(Power Plant)
|
2025
|
2024
|
Change
|
|||||||||
|
PJM West (Shore, Maryland)
|
53.90
|
32.61
|
65
|
%
|
||||||||
|
New York Zone G (Valley)
|
88.85
|
40.22
|
121
|
%
|
||||||||
|
Mass Hub (Towantic)
|
102.78
|
43.93
|
134
|
%
|
||||||||
|
PJM AEP Dayton (Fairview)
|
47.91
|
29.56
|
62
|
%
|
||||||||
|
PJM ComEd (Three Rivers)
|
35.24
|
26.17
|
35
|
%
|
||||||||
|
|
* |
Based on Day‑Ahead prices as published by the relevant ISO.
|
| 3. |
Main Developments in the Business Environment (Cont.)
|
|
|
3.3 |
Activities in the U.S. (Cont.)
|
|
|
F. |
Electricity and natural gas prices (Cont.)
|
|
For the three months ended
|
||||||||||||
|
Region
|
March 31
|
|||||||||||
|
(Power Plant)
|
2025
|
2024
|
Change
|
|||||||||
|
Texas Eastern M‑3 (Shore, Valley – 70%)
|
6.42
|
2.90
|
121
|
%
|
||||||||
|
Transco Zone 5 North (Maryland)
|
6.06
|
3.70
|
64
|
%
|
||||||||
|
Dominion South Pt (Valley – 30%)
|
3.74
|
1.86
|
101
|
%
|
||||||||
|
Algonquin City Gate (Towantic)
|
11.83
|
4.26
|
178
|
%
|
||||||||
|
Texas Eastern M‑2 (Fairview)
|
3.83
|
2.02
|
90
|
%
|
||||||||
|
Chicago City Gate (Three Rivers)
|
4.00
|
2.85
|
40
|
%
|
||||||||
| 3. |
Main Developments in the Business Environment (Cont.)
|
|
|
3.3 |
Activities in the U.S. (Cont.)
|
|
|
F. |
Electricity and natural gas prices (Cont.)
|
|
|
|
Set forth below are the average Spark Spread margins for each of the main markets in which the power plants of the CPV Group are operating (the prices are denominated in dollars per megawatt/hour)*:
|
|
For the
|
||||||||||||
|
Three Months Ended
|
||||||||||||
|
March 31
|
||||||||||||
|
Power Plant4
|
2025
|
2024
|
Change
|
|||||||||
|
Shore
|
9.60
|
12.60
|
(24
|
)%
|
||||||||
|
Maryland
|
12.09
|
7.08
|
71
|
%
|
||||||||
|
Valley
|
50.10
|
22.36
|
124
|
%
|
||||||||
|
Towantic
|
25.89
|
16.24
|
59
|
%
|
||||||||
|
Fairview
|
23.02
|
16.43
|
40
|
%
|
||||||||
|
Three Rivers
|
9.24
|
7.65
|
21
|
%
|
||||||||
|
|
* |
Based on electricity prices as shown in the above table, with assuming a thermal conversion ratio (heat rate) of 6.9 MMBtu/MWh for Maryland, Shore and Valley, and a thermal conversion ratio of 6.5 MMBtu/MWh for Three Rivers, Towantic and
Fairview. It is clarified that the actual energy margins of the power plants of the CPV Group could be significantly different due to, among other things, the existence of Power Basis and a different breakdown in the scope of the electricity
sold in the peak and off‑peak hours in CPV’s power plants and that shown above (which was calculated in the above table based on the assumption of generation in all the hours of the 24‑hour period).
|
| 4 |
For additional details regarding the energy margin of the CPV Group – see Section 4F below.
|
|
|
3.3 |
Activities in the U.S. (Cont.)
|
|
|
G. |
Tax on carbon emissions (RGGI)
|
|
Average for the
|
||||||||||||
|
Year Ended
|
||||||||||||
|
March 31
|
||||||||||||
|
2025
|
2024
|
Change
|
||||||||||
|
Price of carbon emission tax in the RGGI tenders ($ per short ton / 2,000 pounds)*
|
20.05
|
14.88
|
35
|
%
|
||||||||
|
Cost of the carbon emission tax (in terms of gas cost) ($ per MMBtu)**
|
1.19
|
0.89
|
35
|
%
|
||||||||
|
|
* |
The prices of the carbon emissions tax are presented under the assumption that the price of the tender that is held prior to a certain quarter represents the price of the carbon emissions tax. For example, the tender held in December 2024
will represent the price for the first quarter of 2025. It is noted that the actual price of the carbon emissions tax could be different than the tender prices as a result of transactions made in the secondary market.
|
|
|
** |
The cost of the carbon emissions tax (in terms of gas cost) is calculated under the assumption of emissions of carbon dioxide with a reference (ratio) of 119 lbs./MMBtu. It is noted that the actual carbon dioxide emissions ratio varies
between the different power plants, and in the estimation of the CPV Group a ratio of 119 lbs./MMBtu is a representative ratio for power plants running on natural gas.
|
|
|
3.3 |
Activities in the U.S. (Cont.)
|
|
|
H. |
Capacity revenues
|
|
Sub-Region
|
CPV Plants5
|
2025/2026
|
2024/2025
|
2023/2024
|
|
PJM RTO
|
|
269.92
|
28.92
|
34.13
|
|
PJM COMED
|
Three Rivers
|
269.92
|
28.92
|
34.13
|
|
PJM MAAC
|
Fairview,
Maryland, Maple
Hill
|
269.92
|
49.49
|
49.49
|
|
PJM EMAAC
|
Shore
|
269.92
|
54.95
|
49.49
|
| 5 |
The Three Rivers power plant, which commenced commercial operation in July 2023, is entitled to capacity payments, from this date.
|
| 3. |
Main Developments in the Business Environment (Cont.)
|
|
|
3.3 |
Activities in the U.S. (Cont.)
|
|
|
H. |
Capacity revenues (Cont.)
|
| 6 |
That stated in this Section regarding the estimation of the CPV Group constitutes “forward‑looking” information as it is defined in the Securities Law, with respect to which there is no certainty it will
materialize. Ultimately, the revenues of the CPV Group from availability could be different (even significantly) as a result of, among other things, regulatory changes (including appeal or other processes in the PJM market or relating to
other authorities), operating factors, changes in the business environment and/or existence of one or more of the risk factors the CPV Group is exposed to.
|
| 3. |
Main Developments in the Business Environment (Cont.)
|
|
|
3.3 |
Activities in the U.S. (Cont.)
|
|
|
H. |
Capacity revenues (Cont.)
|
|
Sub-Area
|
CPV
Plants
|
Summer
2025
|
Winter 2024/2025
|
Summer
2024
|
|
NYISO
Rest of the Market
|
–
|
153.26
|
66.30
|
168.91
|
|
Lower Hudson Valley
|
Valley
|
153.26
|
66.30
|
168.91
|
|
|
3.3 |
Activities in the U.S. (Cont.)
|
|
|
H. |
Capacity revenues (Cont.)
|
|
Sub-Region
|
CPV Power Plants
|
2027/2028
|
2026/2027
|
2025/2026
|
|
ISO-NE
Rest of the Market
|
Towantic
|
117.70
|
85.15
|
85.15
|
| 4. |
Analysis of the results of operations for the three months ended March 31, 2025 (in millions of NIS)
|
|
|
A. |
Statement of income
|
|
For the Three Months Ended
|
||||||||
|
Section
|
March 31
|
|||||||
|
*2025
|
2024
|
|||||||
|
Revenues from sales and provision of services (1)
|
660
|
638
|
||||||
|
Cost of sales and provision of services (without depreciation and amortization) (2)
|
(501
|
)
|
(430
|
)
|
||||
|
Depreciation and amortization
|
(62
|
)
|
(74
|
)
|
||||
|
Gross profit
|
97
|
134
|
||||||
|
Share in earnings of associated companies
|
138
|
72
|
||||||
|
Compensation for loss of income
|
–
|
26
|
||||||
|
Administrative and general expenses
|
(54
|
)
|
(61
|
)
|
||||
|
Business development expenses
|
(3
|
)
|
(12
|
)
|
||||
|
Other expenses, net
|
(11
|
)
|
(56
|
)
|
||||
|
Operating income
|
167
|
103
|
||||||
|
Financing expenses, net
|
(47
|
)
|
(61
|
)
|
||||
|
Income before taxes on income
|
120
|
42
|
||||||
|
Taxes on income expenses
|
(27
|
)
|
(27
|
)
|
||||
|
Net income for the period**
|
93
|
15
|
||||||
|
Attributable to:
|
||||||||
|
The Company’s shareholders
|
66
|
18
|
||||||
|
Holders of non‑controlling interests
|
27
|
(3
|
)
|
|||||
|
|
* |
Commencing from November 2024, as a result of loss of control of CPV Renewable and transition to the equity method of accounting, the Company has discontinued consolidation in the consolidated financial statements of the results of the
renewable energy segment in the U.S.
|
|
|
** |
For an analysis of the change in the net income and a definition and analysis of the change in the adjusted net income – see Section 4G below.
|
| 4. |
Analysis of the results of operations for the three months ended March 31, 2025 (in millions of NIS) (Cont.)
|
|
|
A. |
Statement of income (Cont.)
|
|
Revenues
|
For the
|
Board’s Explanations
|
|||||||
|
Three Months
|
|||||||||
|
Ended
|
|||||||||
|
March 31
|
|||||||||
|
2025
|
2024
|
||||||||
|
Revenues in Israel
|
|||||||||
|
Revenues from sale of energy to private customers
|
282
|
300
|
Stems mainly from a decrease in the tariff for the generation component compared with the corresponding period last year.
|
||||||
|
Revenues from sale of energy to the System Operator and to other suppliers
|
50
|
46
|
|||||||
|
Revenues in respect of capacity payments
|
33
|
42
|
|||||||
|
Revenues from sale of energy at cogeneration tariff
|
18
|
19
|
|||||||
|
Revenues from sale of steam
|
15
|
17
|
|||||||
|
Other revenues
|
–
|
7
|
|||||||
|
Total revenues from sale of energy and others in Israel (without infrastructure services)
|
398
|
431
|
|||||||
|
Revenues from private customers in respect of infrastructure services
|
128
|
101
|
|||||||
|
Total revenues in Israel
|
526
|
532
|
|||||||
|
Revenues in the U.S.
|
|||||||||
|
Revenues from sale of electricity from renewable energy
|
–
|
56
|
The decrease derives mainly from discontinuance of consolidation of the renewable energies segment in November 2024, and transition to the equity method of accounting. For additional
details – see Note 23E to the annual financial statements.
|
||||||
|
Revenues from sale of electricity (retail) activities and others
|
134
|
50
|
The increase stems mainly from an increase in the scope of the retail activities.
|
||||||
|
Total revenues in the U.S.
|
134
|
106
|
|||||||
|
Total revenues
|
660
|
638
|
|||||||
| 4. |
Analysis of the results of operations for the three months ended March 31, 2025 (in millions of NIS) (Cont.)
|
|
|
A. |
Statement of income (Cont.)
|
|
|
(2) |
Changes in the cost of sales and provision of services (not including depreciation and amortization):
|
|
Cost of Sales and
Services
|
For the
Three Months
|
Board’s Explanations
|
|||||||
|
Ended
|
|||||||||
|
March 31
|
|||||||||
|
2025
|
2024
|
||||||||
|
Cost of sales in Israel
|
|||||||||
|
Natural gas and diesel oil
|
174
|
154
|
Most of the increase stems from an increase in the gas consumption against the background of the maintenance work performed at the Rotem power
plant in the corresponding quarter last year.
|
||||||
|
Expenses in respect of acquisition of energy
|
26
|
59
|
Most of the decrease stems from maintenance work performed at the Rotem power plant in the corresponding quarter last year.
|
||||||
|
Cost of transmission of gas
|
13
|
14
|
|||||||
|
Salaries and related expenses
|
9
|
10
|
|||||||
|
Operating expenses
|
28
|
28
|
|||||||
|
Other expenses
|
–
|
5
|
|||||||
|
Total cost of sales in Israel without infrastructure services
|
250
|
270
|
|||||||
|
Expenses in respect of infrastructure services
|
128
|
101
|
|||||||
|
Total cost of sales in Israel
|
378
|
371
|
|||||||
|
Cost of sales and services in the U.S.
|
|||||||||
|
Cost of sales in respect of sale of electricity from renewable energy
|
–
|
16
|
The decrease stems from discontinuance of consolidation of the renewable energies segment in November 2024 and transition to the equity method of accounting. For
additional details – see Note 23E to the annual financial statements.
|
||||||
|
Cost of sales in respect of sale of electricity (Retail) and others
|
123
|
43
|
The increase stems mainly from an increase in the scope of the retail activities.
|
||||||
|
Total cost of sales and provision of services in the U.S.
|
123
|
59
|
|||||||
|
Total cost of sales and provision of services
|
501
|
430
|
|||||||
| 4. |
Analysis of the results of operations for the three months ended March 31, 2025 (in millions of NIS) (Cont.)
|
|
|
B. |
EBITDA, FFO and net cash flows after debt service
|
|
|
1. |
EBITDA indices
|
|
|
2. |
“FFO” (funds from operations) – with respect to active projects – cash flows from current operating activities for the period (including changes in working capital) and less investments in property, plant and equipment and periodic
maintenance costs that are not included in the operating activities and less net interest payments. With respect to the rest of the Group’s activities – cash flows from current operating activities for the period (including changes in working
capital) and less net interest payments (to the extent they do not relate to projects under construction). It is clarified that investments in property, plant and equipment (under construction and/or in development) including the net interest
payments in respect thereof, are not included in FFO.
|
|
|
3. |
“Net cash flows after service of project debt” – the “FFO” less/plus payment of principal in respect of financial debt and/or taking out of project debt and non‑project debt (loans and/or debentures), and after adjustments for a
change in other credit from banks and a change in cash, including cash restricted for debt service and deposits (including to secure transactions hedging electricity margins).
|
| 7 |
It is clarified that the compensation for loss of income is included in EBITDA in the consolidated statements.
|
| 4. |
Analysis of the results of operations for the three months ended March 31, 2025 (in millions of NIS) (Cont.)
|
|
|
B. |
EBITDA, FFO and net cash flows after debt service (Cont.)
|
|
For the
Three Months Ended
|
||||||||
|
March 31
|
||||||||
|
2025
|
2024
|
|||||||
|
Revenues from sales and provision of services
|
660
|
638
|
||||||
|
Cost of sales (without depreciation and amortization)
|
(501
|
)
|
(430
|
)
|
||||
|
Share in income of associated companies
|
138
|
72
|
||||||
|
Compensation for lost revenues
|
– |
26
|
||||||
|
Administrative and general expenses (without depreciation and amortization)
|
(50
|
)
|
(58
|
)
|
||||
|
Business development expenses
|
(3
|
)
|
(12
|
)
|
||||
|
Consolidated EBITDA
|
244
|
236
|
||||||
|
Elimination of the share in income of associated companies
|
(138
|
)
|
(72
|
)
|
||||
|
Plus – Group’s share of the EBITDA after proportionate consolidation of
|
||||||||
|
associated companies in the Energy Transition segment (1)
|
277
|
168
|
||||||
|
Plus – Group’s share of the EBITDA after proportionate consolidation of
|
||||||||
|
activities in the renewable energies segment in the U.S. (2)*
|
27
|
–
|
||||||
|
EBITDA after proportionate consolidation
|
410
|
332
|
||||||
|
|
* |
Due to completion of an investment transaction in the area of renewable energies in the U.S. in November 2024, starting from this date the data of this segment is calculated on the basis of a proportionate consolidation where the share of
the CPV Group is about 66.7%.
|
| 8 |
It is noted that other companies might define EBITDA and FFO indices differently.
|
| 4. |
Analysis of the results of operations for the three months ended March 31, 2025 (in millions of NIS) (Cont.)
|
|
|
B. |
EBITDA, FFO and net cash flows after debt service (Cont.)
|
|
|
(1) |
Calculation of the Group’s share in the EBITDA after proportionate consolidation, FFO and net cash flows after service of project debt of associated companies in the Energy Transition segment (in millions of NIS):
|
|
For the three months ended March 31, 2025
|
Fairview
|
Towantic
|
Maryland
|
(1)(2)
Shore |
Valley
|
Three
Rivers |
Total
|
|||||||||||||||||||||
|
Rate of holdings of the CPV Group
|
25%
|
|
26%
|
|
*75%
|
|
*69%
|
|
50%
|
|
10%
|
|
||||||||||||||||
|
Revenues from sales of energy
|
93
|
137
|
196
|
116
|
227
|
25
|
794
|
|||||||||||||||||||||
|
Cost of natural gas
|
52
|
104
|
126
|
94
|
99
|
16
|
491
|
|||||||||||||||||||||
|
Carbon emissions tax (RGGI)
|
–
|
12
|
32
|
13
|
23
|
–
|
80
|
|||||||||||||||||||||
|
Cost of sales – other expenses (without
|
||||||||||||||||||||||||||||
|
depreciation and amortization)
|
–
|
1
|
5
|
2
|
2
|
–
|
10
|
|||||||||||||||||||||
|
Gain (loss) on realization of transactions
|
||||||||||||||||||||||||||||
|
hedging the electricity margins
|
4
|
(2
|
)
|
22
|
24
|
(17
|
)
|
6
|
37
|
|||||||||||||||||||
|
Net energy margin
|
45
|
18
|
55
|
31
|
86
|
15
|
250
|
|||||||||||||||||||||
|
Revenues from capacity payments
|
4
|
32
|
9
|
9
|
12
|
1
|
67
|
|||||||||||||||||||||
|
Other income
|
2
|
5
|
7
|
4
|
1
|
1
|
20
|
|||||||||||||||||||||
|
Gross profit
|
51
|
55
|
71
|
44
|
99
|
17
|
337
|
|||||||||||||||||||||
|
Fixed costs (without depreciation and
|
||||||||||||||||||||||||||||
|
amortization)
|
3
|
3
|
10
|
10
|
16
|
4
|
46
|
|||||||||||||||||||||
|
Administrative and general expenses
|
||||||||||||||||||||||||||||
|
(without depreciation and amortization)
|
1
|
1
|
3
|
3
|
2
|
–
|
10
|
|||||||||||||||||||||
|
Loss from revaluation of unrealized
|
||||||||||||||||||||||||||||
|
hedging transactions
|
(3
|
)
|
–
|
–
|
–
|
–
|
(1
|
)
|
(4
|
)
|
||||||||||||||||||
|
Group’s share in EBITDA after
|
||||||||||||||||||||||||||||
|
proportionate consolidation in the
|
||||||||||||||||||||||||||||
|
Energy Transition segment
|
44
|
51
|
58
|
31
|
81
|
12
|
277
|
|||||||||||||||||||||
|
Group’s share in FFO
|
34
|
38
|
36
|
1
|
70
|
9
|
188
|
|||||||||||||||||||||
|
Group’s share in net cash flows after flows
|
||||||||||||||||||||||||||||
|
service of project debt (3)
|
16
|
28
|
8
|
(201
|
)
|
14
|
4
|
(131
|
)
|
|||||||||||||||||||
|
|
(1) |
At the Shore power plant – gas transmission costs (totaling in the first quarter of 2025 about NIS 10 million) are classified in accordance with IFRS 16 as depreciation expenses and, accordingly, are not included in the EBITDA.
|
|
|
(2) |
The net cash flows after service of the project debt in Shore includes partial repayment of debt that was made as part of the refinancing made in February 2025. For additional details – see Section 8A(6) below.
|
|
|
(3) |
It is pointed out that the financing agreements of the CPV Group include arrangements for mechanisms of the “cash sweep” type, in the framework of which all or part of the free cash flows of the projects is designated for repayment of loan
principal on a current basis along with a predetermined minimum repayment schedule relating to every long‑term loan. Accordingly, there could be an acceleration of execution of repayments upon occurrence of certain events and there are also
restrictions on distributions to shareholders.
|
|
|
* |
For details regarding transactions for acquisition of additional holdings in the Shore and Maryland power plants in the fourth quarter of 2024 – see Note 24C to the annual financial statements.
|
| 4. |
Analysis of the results of operations for the three months ended March 31, 2025 (in millions of NIS) (Cont.)
|
|
|
B. |
EBITDA, FFO and net cash flows after debt service (Cont.)
|
|
|
(1) |
Calculation of the Group’s share in the EBITDA after proportionate consolidation, FFO and net cash flows after service of project debt of associated companies in the Energy Transition segment (in millions of NIS): (Cont.)
|
|
For the three months ended March 31, 2024
|
Fairview
|
Towantic
|
Maryland
|
(1)
Shore |
Valley
|
Three
Rivers |
Total
|
|||||||||||||||||||||
|
Rate of holdings of the CPV Group
|
25%
|
|
26%
|
|
25%
|
|
38%
|
|
50%
|
|
10%
|
|
|
|||||||||||||||
|
Revenues from sales of energy
|
58
|
61
|
31
|
43
|
102
|
14
|
309
|
|||||||||||||||||||||
|
Cost of natural gas
|
29
|
36
|
23
|
30
|
45
|
12
|
175
|
|||||||||||||||||||||
|
Carbon emissions tax (RGGI)
|
–
|
8
|
5
|
10
|
17
|
–
|
40
|
|||||||||||||||||||||
|
Cost of sales – other expenses (without
|
||||||||||||||||||||||||||||
|
depreciation and amortization)
|
1
|
1
|
1
|
1
|
2
|
–
|
6
|
|||||||||||||||||||||
|
Gain on realization of transactions hedging
|
||||||||||||||||||||||||||||
|
the electricity margins
|
11
|
4
|
7
|
7
|
35
|
9
|
73
|
|||||||||||||||||||||
|
Net energy margin
|
39
|
20
|
9
|
9
|
73
|
11
|
161
|
|||||||||||||||||||||
|
Revenues from capacity payments
|
4
|
28
|
3
|
4
|
14
|
1
|
54
|
|||||||||||||||||||||
|
Other income
|
1
|
3
|
1
|
1
|
1
|
–
|
7
|
|||||||||||||||||||||
|
Gross profit
|
44
|
51
|
13
|
14
|
88
|
12
|
222
|
|||||||||||||||||||||
|
Fixed costs (without depreciation and
|
||||||||||||||||||||||||||||
|
amortization)
|
3
|
4
|
3
|
5
|
16
|
4
|
35
|
|||||||||||||||||||||
|
Administrative and general expenses
|
||||||||||||||||||||||||||||
|
(without depreciation and amortization)
|
1
|
1
|
1
|
1
|
2
|
–
|
6
|
|||||||||||||||||||||
|
Gain (loss) from revaluation of unrealized
|
||||||||||||||||||||||||||||
|
hedging transactions
|
1
|
(10
|
)
|
–
|
(4
|
)
|
–
|
–
|
(13
|
)
|
||||||||||||||||||
|
Group’s share in EBITDA after
|
||||||||||||||||||||||||||||
|
proportionate consolidation in the
|
||||||||||||||||||||||||||||
|
Energy Transition segment
|
41
|
36
|
9
|
4
|
70
|
8
|
168
|
|||||||||||||||||||||
|
Group’s share in FFO
|
37
|
40
|
(5
|
)
|
(5
|
)
|
55
|
4
|
126
|
|||||||||||||||||||
|
Group’s share in net cash flows after service
|
||||||||||||||||||||||||||||
|
of project debt
|
20
|
(1
|
)
|
–
|
(5
|
)
|
17
|
9
|
40
|
|||||||||||||||||||
|
|
(1) |
At the Shore power plant – gas transport costs (totaling in the first quarter of 2024 about NIS 6 million) are classified in accordance with IFRS 16 as depreciation expenses and, accordingly, are not included in the EBITDA.
|
| 4. |
Analysis of the results of operations for the three months ended March 31, 2025 (in millions of NIS) (Cont.)
|
|
|
B. |
EBITDA, FFO and net cash flows after debt service (Cont.)
|
|
|
(2) |
Calculation of the Group’s share in EBITDA after proportionate consolidation of the renewable energies segment (in NIS millions):
|
|
For the three months ended
|
||||
|
March 31, 2025
|
||||
|
Revenues
|
47
|
|||
|
Fixed costs (without depreciation and amortization)
|
(10
|
)
|
||
|
Administrative and general
|
(4
|
)
|
||
|
EBITDA from active projects
|
33
|
|||
|
Business development and other costs
|
(6
|
)
|
||
|
Share of the Group in EBITDA after proportionate
|
||||
|
consolidation in the renewable energies segment in
|
||||
|
the U.S.
|
27
|
|||
| 4. |
Analysis of the results of operations for the three months ended March 31, 2025 (in millions of NIS) (Cont.)
|
|
|
B. |
EBITDA, FFO and net cash flows after debt service (Cont.)
|
|
|
(3) |
Set forth below is a breakdown of the EBITDA after proportionate consolidation data broken down by subsidiaries (on a consolidated basis) and the associated companies (on a proportionate basis, based on the rate of the holdings of the CPV
Group therein) as well as FFO and cash flows after service of project debt data (in NIS millions):
|
|
For the three months ended
|
For the three months ended
|
|||||||||||||||||||||||||
|
Main projects in operation
|
Basis of
|
March 31, 2025
|
March 31, 2024
|
|||||||||||||||||||||||
|
|
presentation
|
Net cash
|
Net cash
|
|||||||||||||||||||||||
|
|
in the
|
EBITDA
|
flows
|
EBITDA
|
flows
|
|||||||||||||||||||||
|
|
Company’s
|
after
|
after
|
after
|
after
|
|||||||||||||||||||||
|
|
financial
|
proportionate
|
debt
|
proportionate
|
debt
|
|||||||||||||||||||||
|
|
statements
|
consolidation
|
FFO
|
service
|
consolidation
|
FFO
|
service
|
|||||||||||||||||||
|
Total operating projects in Israel and
|
||||||||||||||||||||||||||
|
accompanying business activities (1)
|
|
Consolidated
|
|
139
|
|
|
|
222
|
|
|
|
209
|
|
|
|
(2)180 |
|
|
|
(3)239 |
|
(3)201 |
|
|||
|
Business development costs,
|
||||||||||||||||||||||||||
|
headquarters in Israel and other costs
|
Consolidated
|
(2
|
)
|
(3)(29 |
)
|
(3)113 |
|
(10
|
)
|
(10
|
)
|
(10
|
)
|
|||||||||||||
|
Total Israel (4)
|
137
|
193
|
322
|
170
|
229
|
191
|
||||||||||||||||||||
|
Total operating projects (5)
|
Associated
|
277
|
188
|
(131
|
)
|
168
|
126
|
40
|
||||||||||||||||||
|
Other costs
|
Consolidated
|
–
|
(4
|
)
|
(4
|
)
|
(2
|
)
|
(2
|
)
|
(2
|
)
|
||||||||||||||
|
Total energy transition in the U.S.
|
277
|
184
|
(135
|
)
|
166
|
124
|
38
|
|||||||||||||||||||
|
Total operating projects (5) (6)
|
Associated
|
33
|
22
|
1
|
37
|
25
|
(1
|
)
|
||||||||||||||||||
|
Business development and other costs
|
Associated
|
(6
|
)
|
(4
|
)
|
(4
|
)
|
(9
|
)
|
(10
|
)
|
(10
|
)
|
|||||||||||||
|
Total renewable energy in the U.S.
|
27
|
18
|
(3
|
)
|
28
|
15
|
(11
|
)
|
||||||||||||||||||
|
Total activities as part of the “others”
|
||||||||||||||||||||||||||
|
segment (7)
|
Consolidated
|
(8
|
)
|
(8
|
)
|
(8
|
)
|
(9
|
)
|
(9
|
)
|
(9
|
)
|
|||||||||||||
|
Headquarters in the United States (8)
|
Consolidated
|
(17
|
)
|
(41
|
)
|
(41
|
)
|
(20
|
)
|
(40
|
)
|
(40
|
)
|
|||||||||||||
|
Total United States
|
279
|
153
|
(187
|
)
|
165
|
90
|
(22
|
)
|
||||||||||||||||||
|
Company headquarters (not allocated
|
||||||||||||||||||||||||||
|
to the segments) (4) (8)
|
Consolidated
|
(6
|
)
|
(21
|
)
|
(127
|
)
|
(3
|
)
|
(30
|
)
|
72
|
||||||||||||||
|
Total consolidated (9)
|
410
|
325
|
8
|
332
|
289
|
241
|
||||||||||||||||||||
|
|
(1) |
The accompanying business activities in Israel include mainly virtual supply activities through OPC Israel, and sale/purchase of natural gas, including with third parties through OPC Natural Gas.
|
|
|
(2) |
In the first quarter of 2024, the EBITDA of the active projects in Israel included compensation of about NIS 26 million in respect of lost revenues caused by a delay in the commercial operation of the Zomet power plant.
|
|
|
(3) |
In the period of the report, the financial data of the headquarters in Israel includes payments of interest and principal (if any) of the company credit in OPC Israel (which was used partly for early repayment of project financing in Zomet
and Gat) and taking out of company credit in OPC Israel, as described in Note 6A(1) to the Interim Statements. In the corresponding period last year, the financial data of the active projects in Israel includes payments of interest and
principal of project credit in Zomet and Gat, which were repaid early, as stated, in the third quarter of 2024 (for additional details see – Note 14B(1) to the annual financial statements).
|
|
|
(4) |
Not including intercompany activities between the Company, on the one hand, and the headquarters and the subsidiaries in Israel, on the other hand.
|
|
|
(5) |
For details regarding active projects in the Energy Transition segment in the U.S. – see Section 1 above and regarding calculation of the Group’s share in the EBITDA after proportionate consolidation of the Renewable Energies segment – see
Section 2 above.
|
|
|
(6) |
Due to completion of the transaction for investment in the area of renewable energies in the U.S. in November 2024, the data of this segment in the U.S. is calculated from this date on the basis of proportionate consolidation where the
share of the CPV Group is 66.7%.
|
|
|
(7) |
Includes mainly business development and other costs in the area of initiation and development of high‑efficiency power plants running on natural gas, with future carbon capture potential, and the results of the retail activities in the
U.S.
|
|
|
(8) |
After elimination of management fees between the CPV Group and the Company, in the amounts of about NIS 8 million and about NIS 7 million for the three months ended March 31, 2025 and 2024, respectively.
|
|
|
(9) |
In the period of the report, the consolidated FFO without adjustments for changes in the working capital was about NIS 245 million (in the corresponding period last year – about NIS 200 million).
|
| 4. |
Analysis of the results of operations for the three months ended March 31, 2025 (in millions of NIS) (Cont.)
|
|
|
C. |
Analysis of the change in EBITDA – Israel segment
|

|
|
1. |
Availability (operational) – further to that stated in Section 7.11.1 of Part A of the Periodic Report for 2024, for purposes of reducing the risk of an operating failure at the Zomet power plant due to a technical defect discovered
and in coordination with the contractor, as part of the process of clarifying and repairing the defect, in the period of the report the availability of the power plant was partially limited (for details – see Section H. below), which starting
from March 2025 the capacity of the power plant is limited about 80% – 85%, which had a negative impact on the availability of the power plant and, in turn, on the results for the period of the report. In the Company’s estimation, as at the
approval date of the report, the process of clarification and repair of the defect is expected to be completed at the latest within about 10 months.9 For details – see Section 7.11.1 of Part A of the Periodic Report for 2024.
|
|
|
2. |
One‑time events – in the corresponding period last year, an amendment to the agreement was signed with Zomet’s construction contractor, in the framework of which, among other things, the construction contractor paid Zomet
compensation, in the amount of about NIS 26 million (about $7 million) in respect of a loss of revenues caused to Zomet due to delay in the commercial operation date of the power plant. For additional details – see Note 26A(3) to the annual
financial statements.
|
| 9 |
That stated constitutes “forward‑looking” information as it is defined in the Securities Law. Ultimately, there could be delays in completion of the required clarification and repairs and/or other operation
limitations, among other things, as a result of technical and/or operational factors and/or factors relating to the construction contractor.
|
| 4. |
Analysis of the results of operations for the three months ended March 31, 2025 (in millions of NIS) (Cont.)
|
|
|
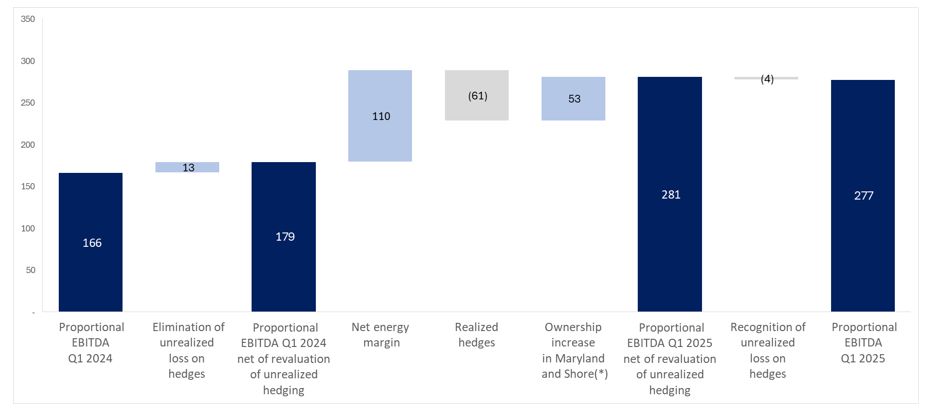
D. |
Analysis of the change in EBITDA after proportionate consolidation – energy transition segment in the U.S.
|
|
|
(*) |
Reflects the impact of the increase in the holdings (which was completed in the fourth quarter of 2024) in the Maryland and Short power plants on the EBITDA after proportionate consolidation in the period of the report. For details – see
Note 24C to the annual financial statements.
|
| 4. |
Analysis of the results of operations for the three months ended March 31, 2025 (in millions of NIS) (Cont.)
|
|
|
E. |
Renewable energies segment in the U.S.
|

| 4. |
Analysis of the results of operations for the three months ended March 31, 2025 (in millions of NIS) (Cont.)
|
|
|
F. |
Additional details regarding energy hedges and guaranteed capacity payments in the Energy Transition segment in the U.S.
|
|
April–December
|
|
|
2025
|
|
|
Expected generation (MWh)
|
8,341,918
|
|
Net scope of the hedged energy margin (% of the expected generation of the power plants) (*)
|
64%
|
|
Net hedged energy margin (millions of $)
|
≈ 95
(≈ NIS 343 million)
|
|
Net hedged energy margin ($/MWh)
|
17.69
|
|
Net market prices of energy margin ($/MWh) (**)
|
14.92
|
|
|
(*) |
Pursuant to the policy for hedging electricity margins as at the date of the report, in general the CPV Group seeks to hedge up to 50% of the scope of the expected generation. The actual hedge rate could ultimately be different.
|
|
|
(**) |
The net energy margin is the energy margin (Spark Spread) plus/minus Power Basis less carbon tax (RGGI) and other variable costs. For details regarding the manner of calculation of the electricity margin (Spark Spread) – see Section 3.3G
above. The market prices of the net energy margin are based on future contracts for electricity and natural gas.
|
| 4. |
Analysis of the results of operations for the three months ended March 31, 2025 (in millions of NIS) (Cont.)
|
|
|
F. |
Additional details regarding energy hedges and guaranteed capacity payments in the Energy Transition segment in the U.S. (Cont.)
|
|
April–December
|
|
|
2025
|
|
|
Scope of the secured capacity revenues (% of the power plant’s capacity)
|
94%
|
|
Capacity receipts (millions of $)
|
≈ 97
(≈ NIS 350 million)
|
|
|
G. |
Net income and adjusted net income (in millions of NIS)
|
|
|
1. |
Definitions
|
| 4. |
Analysis of the results of operations for the three months ended March 31, 2025 (in millions of NIS) (Cont.)
|
|
|
G. |
Net income and adjusted net income (in millions of NIS) (Cont.)
|
|
|
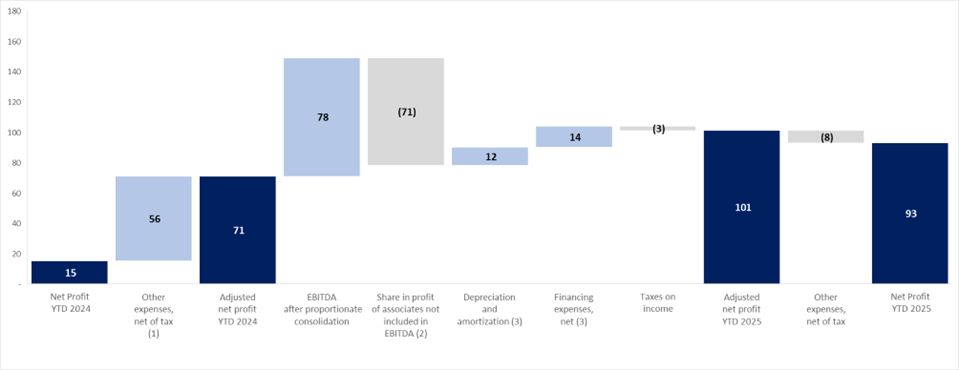
2. |
Analysis of the change in net income and adjusted net income (in millions of NIS)
|
|
|
(1) |
A loss from impairment in value of the investment in Gnrgy in 2024, in the amount of about NIS 19 million. For additional details – see Note 11C to the annual financial statements. In addition, in 2024 there was an impairment loss in
Hadera 2, in the amount of about NIS 31 million, in light of the government’s decision to reject the plan, for additional details, see Note 10B(4) to the annual financial statements.
|
|
|
(2) |
Most of the increase stems from additional depreciation and financing expenses, in the amount of about NIS 29 million in the period of the report, relating to transition to presenting the investment in the renewable energies segment in the
U.S. based on the equity method of accounting, commencing from November 2024, and additional depreciation and financing expenses, in the amount of about NIS 35 million, due to increase in the rate of holdings in the Shore and Maryland power
plants in the fourth quarter of 2024.
|
|
|
(3) |
Most of the decrease in the depreciation and amortization and financing expenses, net, stems from discontinuance of the consolidation of the renewable energies in the U.S. segment from November 2024 and transition to the equity method of
accounting (for additional details – see Note 23E to the annual financial statements).
|
| 4. |
Analysis of the results of operations for the three months ended March 31, 2025 (in millions of NIS) (Cont.)
|
|
|
H. |
Detail of generation
|
|
For the three months ended March 31, 2025
|
For the three months ended March 31, 2024
|
|||||||||||||||||||||||||||||||||||
|
Actual
|
Actual
|
|||||||||||||||||||||||||||||||||||
|
Potential
|
Net
|
Actual
|
calculated
|
Potential
|
Net
|
Actual
|
calculated
|
|||||||||||||||||||||||||||||
|
electricity
|
electricity
|
generation
|
availability
|
electricity
|
electricity
|
generation
|
availability
|
|||||||||||||||||||||||||||||
|
Capacity
|
generation
|
generation
|
percentage
|
percentage
|
generation
|
generation
|
percentage
|
percentage
|
||||||||||||||||||||||||||||
|
(MW)
|
(GWh)(1)
|
(GWh)(2)
|
(%)(3)
|
(%)
|
(GWh)
|
(GWh)
|
(%)
|
(%)
|
||||||||||||||||||||||||||||
|
Rotem
|
466
|
961
|
926
|
96.4
|
%
|
99.3
|
%
|
964
|
685
|
71.1
|
%
|
82.0
|
%
|
|||||||||||||||||||||||
|
Hadera
|
144
|
257
|
233
|
90.7
|
%
|
90.8
|
%
|
268
|
258
|
96.3
|
%
|
96.4
|
%
|
|||||||||||||||||||||||
|
Gat
|
75
|
154
|
143
|
92.9
|
%
|
100.0
|
%
|
159
|
141
|
88.7
|
%
|
88.0
|
%
|
|||||||||||||||||||||||
|
Zomet*
|
396
|
782
|
73
|
9.3
|
%
|
67.5
|
%
|
818
|
136
|
16.6
|
%
|
83.5
|
%
|
|||||||||||||||||||||||
|
|
(1) |
The generation potential is the net generation capability adjusted for temperature and humidity.
|
|
|
(2) |
The actual net generation in the period.
|
|
|
(3) |
The actual generation percentage is the net electricity generated divided by the generation potential.
|
|
For the three months ended March 31, 2025
|
For the three months ended March 31, 2024
|
|||||||||||||||||||||||||||||||||||
|
Potential
|
Net
|
Actual
|
Actual
|
Potential
|
Net
|
Actual
|
Actual
|
|||||||||||||||||||||||||||||
|
electricity
|
electricity
|
generation
|
availability
|
electricity
|
electricity
|
generation
|
availability
|
|||||||||||||||||||||||||||||
|
Capacity
|
generation
|
generation
|
percentage
|
percentage
|
generation
|
generation
|
percentage
|
percentage
|
||||||||||||||||||||||||||||
|
(MW)
|
(GWh)(1)
|
(GWh)(2)
|
(%)(3)
|
(%)
|
(GWh)
|
(GWh)
|
(%)
|
(%)
|
||||||||||||||||||||||||||||
|
Energy transition projects (natural gas)
|
||||||||||||||||||||||||||||||||||||
|
Shore
|
725
|
1,476
|
778
|
49.1
|
%
|
92.6
|
%
|
1,600
|
1,011
|
63.0
|
%
|
98.9
|
%
|
|||||||||||||||||||||||
|
Maryland
|
745
|
1,620
|
1,066
|
65.8
|
%
|
98.9
|
%
|
1,483
|
832
|
50.7
|
%
|
90.5
|
%
|
|||||||||||||||||||||||
|
Valley
|
720
|
1,555
|
1,438
|
92.6
|
%
|
99.6
|
%
|
1,572
|
1,411
|
89.8
|
%
|
97.4
|
%
|
|||||||||||||||||||||||
|
Towantic*
|
805
|
1,741
|
1,459
|
80.0
|
%
|
99.9
|
%
|
1,759
|
1,477
|
80.1
|
%
|
99.1
|
%
|
|||||||||||||||||||||||
|
Fairview
|
1,050
|
2,324
|
2,127
|
93.2
|
%
|
100.0
|
%
|
2,349
|
2,139
|
92.7
|
%
|
99.9
|
%
|
|||||||||||||||||||||||
|
Three Rivers
|
1,258
|
2,717
|
1,615
|
61.0
|
%
|
97.9
|
%
|
2,746
|
1,677
|
62.7
|
%
|
75.8
|
%
|
|||||||||||||||||||||||
| (1) |
The potential generation is the gross generation capability during the period after planned maintenance and less the electricity used for the power plant’s internal purposes.
|
| (2) |
The net generation of electricity is the gross generation during the period less the electricity used for the power plant’s internal purposes.
|
| (3) |
The actual generation percentage is the quantity of the net electricity generated in the facilities compared with the maximum quantity that can be generated in the period.
|
|
|
* |
Subsequent to the date of the report, planned maintenance started at the power plant wherein a significant piece of equipment is expected to be replaced, which as at the date of the report had not yet been completed11.
|
| 11 |
It is noted that in the usual course of things long maintenance periods (planned or unplanned) have a negative impact of the power plant’s results.
|
|
|
A. |
Projects under construction and in development in Israel (held at 100% ownership by OPC Israel, which is 80% held by the Company)12:
|
|
|
1. |
Main details with reference to construction projects in Israel (the data presented in the table below is in respect of 100% for each project):
|
| 12 |
That stated in connection with projects that have not yet reached operation, including with reference to the expected operation date, the technologies and/or the anticipated cost of the investment, is
“forward‑looking” information, as it is defined in the Securities Law, which is based on, among other things, the Company’s estimates as at the approval date of the report and regarding which there is no certainty it will be realized (in
whole or in part). Completion of the said projects (or any one of them) may not occur or may occur in a manner different than that stated above, among other things due to dependency on various factors, including those that are not under
the Company’s control, including assurance of connection to the network and output of electricity from the project sites and/or connection to the infrastructures (including gas infrastructures), receipt of permits, completion of planning
processes and licensing, completion of construction work, final costs in respect of development, construction, equipment and acquisition of rights in land, the proper functioning of the equipment and/or the terms of undertakings with main
suppliers (including lenders), and there is no certainty they will be fulfilled, the manner of their fulfillment, the extent of their impact or what their final terms will be. Ultimately technical, operational or other delays and/or
breakdowns and/or an increase in expenses and/or other changes could be caused, this being as a result of, among other things, factors as stated above or as a result of occurrence of one or more of the risk factors the Company is exposed
to, including construction risks (including force majeure events and the War and its impacts), regulatory, licensing or planning risks,
macro‑economic changes, delays in receipt of permits or assurance of connection to the networks and infrastructures, delays and increased costs due relating to the supply chain and changes in raw‑material prices and etc. For additional
details regarding risk factors – see Section 19 of Section A of the Periodic Report for 2024. It is further clarified that delays in completion of the above‑mentioned projects beyond the date originally planned for this could impact the
ability of the Company and the Group companies to comply with their obligations to third parties (including under guarantees provided), including authorities, conditions of permits, lenders, yard consumers, customers and others, in
connection with the projects, and cause a charge for additional costs, payment of compensation or starting of proceedings (including under guarantees provided).
|
|
|
A. |
Projects under construction and in development in Israel (held at 100% ownership by OPC Israel, which is 80% held by the Company)12: (Cont.)
|
|
Power
|
Date/
|
Total
|
||||||||||||||
|
plants/
|
expectation
|
Total
|
construction
|
|||||||||||||
|
facilities
|
of the start
|
expected
|
cost as at
|
|||||||||||||
|
for
|
of the
|
Main
|
construction
|
March 31,
|
||||||||||||
|
generation
|
Capacity
|
commercial
|
customer/
|
cost
|
2025
|
|||||||||||
|
of energy
|
Status
|
(megawatts)
|
Location
|
Technology
|
operation
|
consumer
|
(NIS millions)
|
(NIS millions)
|
||||||||
|
OPC Sorek 2 Ltd. (“Sorek 2”)
|
Under construction
|
≈ 87
|
On the premises of the Sorek B seawater desalination facility
|
Powered by natural gas, cogeneration
|
Second half of 202513
|
Yard consumers and the System Operator
|
14≈ 220
|
≈ 196
|
|
|
A. |
Projects under construction and in development in Israel (held at 100% ownership by OPC Israel, which is 80% held by the Company)12: (Cont.)
|
|
|
2. |
For additional details regarding projects in the advanced and initial development stages in Israel, particularly facilities for generation of energy on the customer’s premises in various stages of construction and development and solar
and storage projects in kibbutzim/communities – see Section 6A(2) to the Report of the Board of Directors for 202415.
|
|
|
B. |
Construction and development projects in the U.S. (including projects in the renewable energy area held by CPV Renewable which is held at the rate of 66.7% by the CPV Group (the CPV Group is held at the rate of 70.53% by the Company)16:
|
|
|
1. |
Main details regarding construction projects in the area of renewable energy using solar and wind technologies in the U.S. (the data presented in the table below is in respect of 100% for each project):
|
| 5. |
Initiation and Construction Projects (Cont.)
|
|
|
B. |
Construction and development projects in the U.S. (including projects in the renewable energy area held by CPV Renewable which is held at the rate of 66.7% by the CPV Group (the CPV Group is held at the rate of 70.53% by the Company)16:
(Cont.)
|
|
|
1. |
Main details regarding construction projects in the area of renewable energy using solar and wind technologies in the U.S. The data presented in the table below is in respect of 100% for each project (Cont.)
|
|
Total
expected
construction
cost net
for 100%
|
Total
construction
cost
as at
|
Expectation for a first full calendar year
|
||||||||||||||||||||
| in the period of the PPA agreements | ||||||||||||||||||||||
|
Regulated
|
Cash flows
|
|||||||||||||||||||||
|
Expected
|
market
|
of the
|
Tax
|
March 31,
|
after tax
|
|||||||||||||||||
|
commercial
|
after
|
project
|
equity
|
2025
|
Revenues
|
EBITDA
|
partner
|
|||||||||||||||
|
Capacity
|
operation
|
Commercial
|
the PPA
|
(NIS
|
(NIS
|
(NIS
|
(NIS
|
(NIS
|
(NIS
|
|||||||||||||
|
Project
|
(megawatts)
|
Location
|
date
|
structure
|
period
|
millions)
|
millions)
|
millions)
|
millions)
|
millions)
|
millions)
|
|||||||||||
|
CPV Backbone Solar, LLC (“Backbone”)
|
179 MWdc
|
Maryland
|
Second half of 2025
|
Long-term PPA17 (including green certificates)
|
PJM + MD SRECs
|
≈ 1,212
(≈ $326 million)
|
≈ 445
(≈ $120 million)18
|
≈ 959
(≈ $258 million)
|
≈ 70
(≈ $19 million)
|
≈ 47
(≈ $13 million)
|
≈ 39
(≈ $11 million)
|
|||||||||||
| 5. |
Initiation and Construction Projects (Cont.)
|
|
|
B. |
Construction and development projects in the U.S. (including projects in the renewable energy area held by CPV Renewable which is held at the rate of 66.7% by the CPV Group (the CPV Group is held at the rate of 70.53% by the Company)16:
(Cont.)
|
|
|
1. |
Main details regarding construction projects in the area of renewable energy using solar and wind technologies in the U.S. The data presented in the table below is in respect of 100% for each project (Cont.)
|
|
Total
expected
construction
cost net
for 100%
|
Total
construction
cost
as at
|
Expectation for a first full calendar year | ||||||||||||||||||||
| in the period of the PPA agreements | ||||||||||||||||||||||
|
Regulated
market
|
Cash flows
|
|||||||||||||||||||||
|
Expected
|
of the
|
Tax
|
March 31,
|
after tax
|
||||||||||||||||||
|
commercial
|
after
|
project
|
equity
|
2025
|
Revenues
|
EBITDA
|
partner
|
|||||||||||||||
|
Capacity
|
operation
|
Commercial
|
the PPA
|
(NIS
|
(NIS
|
(NIS
|
(NIS
|
(NIS
|
(NIS
|
|||||||||||||
|
Project
|
(megawatts)
|
Location
|
date
|
structure
|
period
|
millions)
|
millions)
|
millions)
|
millions)
|
millions)
|
millions)
|
|||||||||||
|
CPV Rogue’s Wind, LLC (“Rogues”)
|
114 |
Pennsylvania
|
First half of 2026
|
Long-term PPA19 (including green certificates) |
PJM MAAC
|
≈ 1,357
(≈ $365 million)
|
≈ 596
(≈ $160 million)20
|
≈ 438
(≈ $118 million)
|
≈ 89
(≈ $25 million)
|
≈ 70
(≈ $19 million)
|
≈ 57
(≈ $16 million)
|
|||||||||||
| 5. |
Initiation and Construction Projects (Cont.)
|
|
|
B. |
Construction and development projects in the U.S. (including projects in the renewable energy area held by CPV Renewable which is held at the rate of 66.7% by the CPV Group (the CPV Group is held at the rate of 70.53% by the
Company)16: (Cont.)
|
|
|
2. |
Main details regarding development projects in the U.S.
|
| 5. |
Initiation and Construction Projects (Cont.)
|
|
|
B. | Construction and development projects in the U.S. (including projects in the renewable energy area held by CPV Renewable which is held at the rate of 66.7% by the CPV Group (the CPV Group is held at the rate of 70.53% by the Company)16: (Cont.) |
|
|
2. |
Main details regarding development projects in the U.S.
|
|
Advanced
|
Preliminary
|
|||||||||||
|
Renewable energy
|
development22
|
development
|
Total
|
|||||||||
|
PJM market
|
||||||||||||
|
Solar (2)
|
40
|
1,330
|
1,370
|
|||||||||
|
Wind
|
150
|
–
|
150
|
|||||||||
|
Total PJM market (1)
|
190
|
1,330
|
1,520
|
|||||||||
|
Other markets
|
||||||||||||
|
Solar (2)
|
490
|
1,330
|
1,820
|
|||||||||
|
Wind
|
300
|
900
|
1,200
|
|||||||||
|
Total other markets
|
790
|
2,230
|
3,020
|
|||||||||
|
Total renewable energy
|
980
|
3,560
|
4,540
|
|||||||||
|
Share of the CPV Group (66.67%)
|
650
|
2,390
|
3,040
|
|||||||||
|
|
(1) |
For details regarding the process with respect to requests for connection to the network and the interim results regarding some of the connection studies in the PJM market, which in the estimation of the CPV Group triggered a delay in the
development of certain projects, taking into account, among other things, the required costs for upgrading the network and their position in the connection process – see Section 6B(2) to the Report of the Board of Directors for 2024.23
|
| 5. |
Initiation and Construction Projects (Cont.)
|
|
|
B. | Construction and development projects in the U.S. (including projects in the renewable energy area held by CPV Renewable which is held at the rate of 66.7% by the CPV Group (the CPV Group is held at the rate of 70.53% by the Company)16: (Cont.) |
|
|
2. |
Main details regarding development projects in the U.S. (Cont.)
|
|
|
(2) |
Further to that stated in Section 8.13.2 of Part A of the Periodic Report for 2024, with respect to a framework agreement for acquisition of solar panels, in April 2025 CPV Renewable (which as at the date of the report is held by the CPV
Group at the rate of 66.7%) signed an amendment to the agreement, to increase the total number of the solar panels as part of the agreement to about 140 MWdc, for an aggregate consideration of about $23 million, among other things, while
reducing the price per unit, adjustment of the timetables for supply of the panels to the timetables of the development projects, update of the deposit provided by CPV Renewable and reduction of the scope of the compensation that will apply
to CPV Renewable in a case of early conclusion of the agreement.
|
|
Natural gas projects
|
Advanced
|
Preliminary
|
||||||||||
|
with carbon capture potential*
|
development
|
development
|
Total
|
|||||||||
|
Development projects
|
(2)1,350
|
|
(3)5,000
|
|
6,350
|
|||||||
|
Share of the CPV Group
|
950
|
3,940
|
4,890
|
|||||||||
|
|
(3) |
Further to that stated in Section 6B(2)(2) to the Report of the Board of Directors for 2024, in the third quarter of 2024 the Basin Ranch project (a natural gas project with an estimated capacity of about 1.35 gigawatts located in the
State of Texas and having future carbon capture potential, which is held at the rate of 70% by the CPV Group and 30% by GE Vernova) was selected by the Texas Energy Fund (“TEF”) to advance to the stage of due diligence examinations in
order to receive a subsidized loan for a combined‑cycle power plant in the amount of about $1 billion for a period of 20 years with fixed interest of 3% and principal repayments beginning at the end of 3 years from the commercial
operation date – this being on the condition that the construction thereof will start by the end of 2025. As at the approval date of the report, the CPV Group is carrying on advanced negotiations with TEF in connection with the loan
agreements. The project is expected to operate in the ERCOT market (which operates solely as an energy market) pursuant to the price offers of the generators and the market’s demands (for details regarding the ERCOT market – see
Section 8.1.2.2(D) of Part A of the Periodic Report for 2024), where the project is expected to enter into commercial agreements of the “gas netback” type with gas suppliers and PPA agreements for sale of electricity with the goal of
hedging about 75% of the power plant’s capacity for a period of seven years from the end of the construction period. As at the date of the report, the CPV Group estimates that the project’s total construction cost (100%) will be in the
range of about NIS 6.4 billion to about NIS 7.1 billion ($1.8 billion to $2 billion), and it has completed obtaining the required permits in order to commence construction of the project. In addition, as at the approval date of the report
the CPV Group is advancing various pre‑construction actions with respect to the project, and in this framework it is endeavoring to complete significant undertakings in connection with the construction (such as, an EPC agreement and a
network connection agreement), where in order to cope with global constraints regarding supply times for equipment to power plants, the CPV Group is presently signing an agreement with the equipment manufacturer which is the partner in
the project (GE Vernova) for acquisition of the main equipment for generation of electricity, particularly two H class technology turbines for the project.
|
| 5. |
Initiation and Construction Projects (Cont.)
|
|
|
B. | Construction and development projects in the U.S. (including projects in the renewable energy area held by CPV Renewable which is held at the rate of 66.7% by the CPV Group (the CPV Group is held at the rate of 70.53% by the Company)16: (Cont.) |
|
|
2. |
Main details regarding development projects in the U.S. (Cont.)
|
|
|
(3) |
(Cont.)
|
|
|
|
The said equipment agreement includes, among other things, the supply and payment dates and terms, warranty of the manufacturer and specifications of the equipment, and it permits cancellation of the
agreement up to the end of December 2025 with no additional compensation beyond the amounts paid up to the cancellation date, which in the estimation of the CPV Group up to the end of August 2025 are not expected to be significant.
Subject to completion of the said processes and agreements, signing of the loan agreement with TEF, as stated, and raising the capital needed for construction of the project, a decision to invest in the project and start of the project’s
construction are expected to take place in the second half of 2025.
It is noted that as at the approval date of the report, taking into account the project’s timetables and the market conditions, the Company and the CPV Group are examining various alternatives for raising the
capital required for construction of the project (including through an integration of financing in addition to the TEF financing), while at the same time it is examining raising private capital in the CPV Group. It is further noted that
as at the approval date of the report, there is no certainty regarding the structure, manner or amount of the said fundraising, or the terms or the results of any fundraising that might be executed, which have not yet been finally
determined, and the matter is subject to, among other things, the market conditions, advancement of the project’s development and the discretion of the Company’s competent organs.
In addition, there is no certainty regarding completion of the project’s development processes, signing of all the detailed agreements referred to above, receipt of
the TEF loan and the other conditions necessary for purposes execution or construction of the project, which had not yet been fulfilled as at the approval date of the report and there is no certainty regarding their fulfillment or the
timing thereof24. It is clarified that construction of the project and the operation thereof are exposed to various risk factors that characterize projects in the Energy Transition area (including construction risk and exposure
to market risks, operating risks (including breakdowns or extreme weather/environmental conditions), commercial and/or regulatory events (including by force of legislation, regulation and/or ERCOT requirements)).
For additional details see Section 8.21 of the Periodic Report for 2024.
|
|
|
(4) |
Further to that stated in Section 6B(2)(3) to the Report of the Board of Directors for 2024, regarding the “Resource Reliability Initiative” (“RRI”) of the FERC, as at the approval date of the report, the Oregon project (which is in
the initial development stage) was chosen by PJM to advance in this accelerated connection process. It is noted that most of the capacity selected as part of the RRI is through use of natural gas technology, a fact that the CPV Group
believes constitutes a positive indication regarding the high demand expected for power plants running on natural gas in the PJM market.
|
| 24 |
It is clarified that that stated above relating to execution of the project, its characteristics (including capacity and commercial format as stated above), expected construction date, estimated construction
and development costs, completion of material undertakings and their final terms, receipt of the TEF loan and its terms and/or completion of raising the necessary capital (including its scope and format) includes “forward‑looking”
information as it is defined in the Securities Law. As stated above, as at the approval date of the report, the conditions for receipt of the said loan and the additional conditions necessary for construction and execution of the project
and its commercial format had not yet been fulfilled, and their fulfillment and the timing thereof are impacted by various changes or factors (such as macro events (including due to actions of the U.S. government), regulatory changes,
operational events, commercial and/or financing terms), including factors that are not under the control of the CPV Group. Delays or changes in the project’s operational characteristics could cause delays in construction of the project, an
increase in the costs and/or non‑compliance with commitments to third parties (and conclusion of the undertaking with them and/or additional expenses). Accordingly, that stated might not materialize or might materialize in a significantly
different manner, including due to occurrence of one or more of the risk factors the Company and the CPV Group are exposed to.
|
|
Category
|
3/31/2025
|
12/31/2024
|
Board’s Explanations
|
||||||
|
Current Assets
|
|||||||||
|
Cash and cash equivalents
|
837
|
962
|
For details – see the Company’s consolidated statements of cash flows in the interim statements and Part 7 below.
|
||||||
|
Trade receivables
|
286
|
293
|
|||||||
|
Receivables and debit balances
|
83
|
90
|
|||||||
|
Total current assets
|
1,206
|
1,345
|
|||||||
|
Non-Current Assets
|
|||||||||
|
Long-term deposits and restricted cash
|
61
|
60
|
|||||||
|
Long-term receivables and debit balances
|
160
|
162
|
|||||||
|
Investments in associated companies
|
5,715
|
5,320
|
Most of the increase stems from an investment in Shore, in the amount of about NIS 257 million, for purposes of refinancing the project debt (for additional details – see Note 10 to the
Interim Statements), equity income of the CPV Group, in the amount of about NIS 63 million, and an increase in the shekel/dollar exchange rate, in the amount of about NIS 114 million. This increase was partly offset by distribution of
dividends to the CPV Group by associated companies, in the amount of about NIS 59 million. For additional details regarding investments in associated companies – see Sections 4D and 4E above.
|
||||||
|
Long-term derivative financial instruments
|
41
|
44
|
|||||||
|
Property, plant and equipment
|
4,198
|
4,238
|
Most of the decrease stems from depreciation expenses on property, plant and equipment.
|
||||||
|
Right-of use assets and long-term deferred expenses
|
648
|
637
|
|||||||
|
Intangible assets
|
264
|
261
|
|||||||
|
Total non-current assets
|
11,087
|
10,722
|
|||||||
|
Total assets
|
12,293
|
12,067
|
|||||||
| 6. |
Financial Position as at March 31, 2025 (in millions of NIS) (Cont.)
|
|
Category
|
3/31/2025
|
12/31/2024
|
Board’s Explanations
|
||||||
|
Current Liabilities
|
|||||||||
|
Loans and credit from banks and financial institutions (including current maturities)
|
85
|
82
|
|||||||
|
Current maturities of debt of holders of non‑controlling interests
|
13
|
14
|
|||||||
|
Current maturities of debentures
|
235
|
212
|
|||||||
|
Trade payables
|
276
|
213
|
Most of the increase stems from timing differences.
|
||||||
|
Other payables and credit balances
|
203
|
123
|
Most of the increase, in the amount of about NIS 105 million, stems from reclassification of current maturities of liabilities in respect of a profit participation plan for employees of the
CPV Group.
|
||||||
|
Total current liabilities
|
812
|
644
|
|||||||
|
Non-Current Liabilities
|
|||||||||
|
Long-term loans from banks and financial institutions
|
2,274
|
2,150
|
Most of the increase derives from a financing agreement signed by OPC Israel in the period of the report, under which a loan in the amount of NIS 150 million was drawn
(for additional details – see Note 7A(1) to the Interim Statements).
|
||||||
|
Long-term debt from holders of non-controlling interests
|
495
|
500
|
|||||||
|
Debentures
|
1,537
|
1,663
|
Most of the decrease, in the amount of about NIS 106 million, derives from repayment of debentures.
|
||||||
|
Long-term lease liabilities
|
29
|
31
|
|||||||
|
Other long-term liabilities
|
11
|
115
|
See explanation in the “other payables and credit balances” section.
|
||||||
|
Liabilities for deferred taxes
|
564
|
543
|
|||||||
|
Total non-current liabilities
|
4,910
|
5,002
|
|||||||
|
Total liabilities
|
5,722
|
5,646
|
|||||||
|
Total equity
|
6,571
|
6,421
|
Most of the increase stems from the net income, in the amount of about NIS 93 million and other comprehensive income, in the amount of about NIS 39 million.
|
||||||
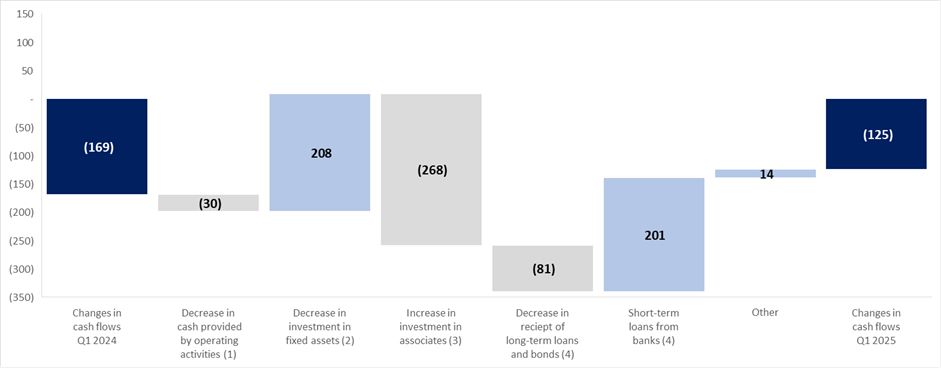
|
|
(1) |
Most of the decrease in cash provided by operating activities stems from a decrease in income on a cash basis, in the amount of about NIS 65 million. On the other hand, there was an increase of about NIS 41 million in dividends from
associated companies in the U.S.
|
|
|
(2) |
Most of the decrease stems from exit from the consolidation of CPV Renewable in the fourth quarter of 2024 and, as a result, transition to the equity method of accounting – see Note 23E to the annual financial statements.
|
|
|
(3) |
Most of the increase stems from an additional investment in the Shore power plant as part of a refinancing executed in February 2025. For additional details – see Note 10 to the Interim Statements.
|
|
|
(4) |
For additional details – see Notes 14 and 15 to the annual financial statements and Note 6 to the Interim Statements.
|
| 8. |
Adjusted financial debt, net
|
|
|
A. |
Composition of the adjusted financial debt, net
|
|
As at March 31, 2025(1)
|
As at December 31, 2024(2)
|
|
|
4.8
|
5.2
|
|
|
(1) |
After elimination of debt under construction in the Renewable Energies segment in the U.S. of about NIS 401 million, as at March 31, 2025, as detailed in the following table. With reference to acquisition of additional holdings in some
of the power plants in the Energy Transition area in the U.S. (“the Additional Acquisitions”) and regarding transition to the equity method of accounting in the Renewable Energies segment, the representative EBITDA was calculated as
follows: Maryland and Shore based on the rate of holdings with respect to the actual results in 2024 for the Additional Acquisitions; the renewable energy activities based on the rate of holdings with respect to the actual results in 2024
at the rate of 66.7% in the period prior to completion of the investment transaction in November 2024.
|
|
|
(2) |
For details – see Section 9A of the Report of the Board of Directors for 2024.
|
| 8. |
Adjusted financial debt, net (Cont.)
|
|
|
A. |
Compositions of the adjusted financial debt, net (Cont.)
|
|
|
|
Gross debt
|
|||||||||||||||||||||||
|
|
Debt
|
Cash and cash
|
Derivative
|
||||||||||||||||||||||
|
|
Method of
|
(including
|
equivalents
|
financial
|
|||||||||||||||||||||
|
|
presentation
|
interest
|
and deposits
|
instruments
|
|||||||||||||||||||||
|
|
in the
|
payable
|
Weighted-
|
Final
|
(including
|
for hedging
|
|||||||||||||||||||
|
|
Company’s
|
and
|
average
|
repayment
|
restricted cash
|
principal
|
|||||||||||||||||||
|
|
financial
|
deferred
|
interest
|
date of
|
used for debt
|
and/or
|
Net
|
||||||||||||||||||
|
Name of project
|
statements
|
expenses)
|
rate
|
the loan
|
service) (1)
|
interest
|
debt
|
||||||||||||||||||
|
Hadera
|
Consolidated
|
573
|
4.9
|
%
|
2037
|
86
|
44
|
443
|
|||||||||||||||||
|
Israel headquarters and others
|
Consolidated
|
1,788
|
6.3%–6.4
|
%
|
2033
|
137
|
–
|
1,651
|
|||||||||||||||||
|
Total Israel
|
2,361
|
6.0
|
%
|
223
|
44
|
2,094
|
|||||||||||||||||||
|
Active renewable energy projects (2)
|
Associated (66.7%)
|
315
|
4.2
|
%
|
2028–2030
|
8
|
12
|
295
|
|||||||||||||||||
|
Financing of renewable energy projects (3)
|
Associated (66.7%)
|
435
|
6.4
|
%
|
2026
|
33
|
1
|
401
|
|||||||||||||||||
|
Renewable energies headquarters
|
Associated (66.7%)
|
–
|
–
|
136
|
–
|
(136
|
)
|
||||||||||||||||||
|
Total renewable energy
|
750
|
5.5
|
%
|
177
|
13
|
560
|
|||||||||||||||||||
|
Fairview (4) (Cash Sweep 50%)
|
Associated (25%)
|
467
|
7.0
|
%
|
2030–2031
|
–
|
–
|
467
|
|||||||||||||||||
|
Towantic (Cash Sweep 5%)
|
Associated (26%)
|
215
|
8.0
|
%
|
2029
|
4
|
(3
|
)
|
214
|
||||||||||||||||
|
Maryland (5) (Cash Sweep 75%)
|
Associated (75%)
|
868
|
6.1
|
%
|
2028
|
77
|
11
|
780
|
|||||||||||||||||
|
Shore (6) (Cash Sweep 100%)
|
Associated (69%)
|
816
|
7.9
|
%
|
2030–2032
|
39
|
(3
|
)
|
780
|
||||||||||||||||
|
Valley (Cash Sweep 100%)
|
Associated (50%)
|
636
|
10.2
|
%
|
May 2026
|
114
|
–
|
522
|
|||||||||||||||||
|
Three Rivers (Cash Sweep 100%)
|
Associate (10%)
|
250
|
5.2
|
%
|
2028
|
15
|
15
|
220
|
|||||||||||||||||
|
Total energy transition (7)
|
3,252
|
7.5
|
%
|
249
|
20
|
2,983
|
|||||||||||||||||||
|
Headquarters and others – U.S.
|
Consolidated
|
–
|
–
|
–
|
171
|
–
|
(171
|
)
|
|||||||||||||||||
|
Total U.S.
|
4,002
|
597
|
33
|
3,372
|
|||||||||||||||||||||
|
Total energy headquarters (9)
|
1,774
|
|
2.5%–6.2% (weighted-average 3%)
|
2028–2034
|
515
|
–
|
1,259
|
||||||||||||||||||
|
Total
|
8,137
|
1,335
|
77
|
6,725
|
|||||||||||||||||||||
| (1) |
Includes restricted cash, in the amount of about NIS 53 million in Hadera and about NIS 178 million in the Energy Transition segment.
|
| (2) |
As at the date of the report, relates to the Keenan and Mountain Wind projects.
|
| (3) |
For details – see Section 8.17.5 of Part A of the Periodic Report for 2024. It is noted that as at the date of the report, the Maple Hill and Stagecoach projects are financed as part of a construction financing framework for renewable
energy projects together with the Backbone project, which is under construction, while the Rouge’s Wind project is financed under a separate agreement.
|
| (4) |
In February 2025, Fairview’s financing agreement was amended such that the interest margin on the long‑term loan was reduced from 3.5% to 3.0%.
|
| (5) |
In March 2025, Maryland’s financing agreement was amended, such that the interest‑rate margin on the long‑term loan was reduced from 3.75% to 3.25%.
|
| (6) |
On February 4, 2025, Shore completed an undertaking in a new financing agreement. For details – see Section 8.17.4 of Part A of the Periodic Report for 2024. It is noted that for purposes of completion of Shore’s new financing agreement,
the amount of about NIS 286 million ($80 million) was granted to Shore by all of its equity holders (CPV’s share – about $72 million).
|
|
|
A. |
Compositions of the adjusted financial debt, net (Cont.)
|
| (7) |
The rate (%) of the Cash Sweep mechanism is in accordance with the estimate of the CPV Group and it could change based on the provisions of the financing agreements of the projects.
|
| (8) |
As part of some of the financing agreements, financial covenants were determined for the projects. As at the date of the report, the associated companies are in compliance with the financial covenants. As part of Maryland’s financing
agreement, a financial covenant was provided requiring a historical debt service coverage ratio of 1:1 during the last four quarters. As at the date of the financial statements, Maryland is in compliance with this financial covenant (2.26).
|
| (9) |
Includes balances of debt and cash in the Company and cash in ICG Energy Inc. (available for use for all the Group’s needs).
|
|
|
Method of
presentation
in the
Company’s
financial
statements
|
Debt
(including
interest
payable
and deferred
expenses)
|
Cash and cash
equivalents
and deposits
(including
restricted cash used
for debt service)
|
Derivative
financial
instruments
for hedging
principal
and/or interest
|
Net
debt
|
|||||||||||||
|
Hadera
|
Consolidated
|
585
|
72
|
44
|
469
|
|||||||||||||
|
Headquarters and others – Israel
|
Consolidated
|
1,649
|
16
|
–
|
1,633
|
|||||||||||||
|
Total Israel
|
2,234
|
88
|
44
|
2,102
|
||||||||||||||
|
Active renewable energy projects
|
Associated (66.7%)
|
323
|
5
|
16
|
302
|
|||||||||||||
|
Financing construction of renewable
|
||||||||||||||||||
|
energy projects
|
Associated (66.7%)
|
426
|
69
|
9
|
348
|
|||||||||||||
|
Renewable energies headquarters
|
Associated (66.7%)
|
–
|
216
|
–
|
(216
|
)
|
||||||||||||
|
Total renewable energy
|
749
|
290
|
25
|
434
|
||||||||||||||
|
Fairview
|
Associated (25%)
|
482
|
–
|
2
|
480
|
|||||||||||||
|
Towantic
|
Associated (26%)
|
215
|
9
|
(1
|
)
|
207
|
||||||||||||
|
Maryland
|
Associated (75%)
|
891
|
80
|
15
|
796
|
|||||||||||||
|
Shore
|
Associated (69%)
|
1,114
|
235
|
–
|
879
|
|||||||||||||
|
Valley
|
Associated (50%)
|
686
|
104
|
–
|
582
|
|||||||||||||
|
Three Rivers
|
Associated (10%)
|
252
|
14
|
17
|
221
|
|||||||||||||
|
Total energy transition
|
3,640
|
442
|
33
|
3,165
|
||||||||||||||
|
Headquarters and others – U.S.
|
Consolidated
|
–
|
264
|
–
|
(264
|
)
|
||||||||||||
|
Total U.S.
|
4,389
|
996
|
58
|
3,335
|
||||||||||||||
|
Total Energy headquarters
|
1,891
|
664
|
–
|
1,227
|
||||||||||||||
|
Total
|
8,514
|
1,748
|
102
|
6,664
|
||||||||||||||
|
|
B. |
Interest and linkage bases
|
|
|
C. |
Financial covenants
|
| 8. |
Adjusted financial debt, net (Cont.)
|
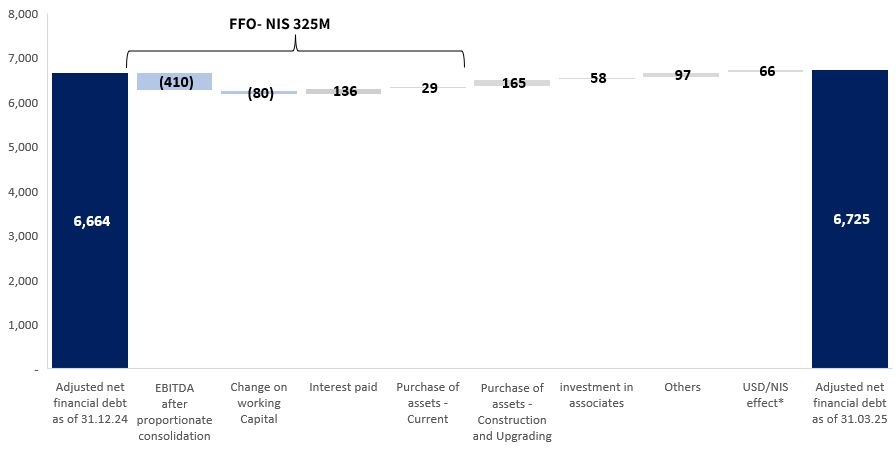
| 9. |
Debentures (Series B, Series C and Series D)
|
| 10. |
Impacts of changes in the macro‑economic environment on the Group’s activities and its results
|
|
11.
|
Corporate Governance
|
|
Yair Caspi
|
Giora Almogy
|
|
Chairman of the Board of Directors
|
CEO
|
| – |
In the peak hours, electricity is sold in the maximum scope;
|
| – |
Sale of the balance of the electricity is made in the off‑peak hours.
|
| – |
The scope of the generation of each power plant was estimated separately on the basis of the historical generation data while taking into generation forecasts.
|
| * |
Assumption of a thermal conversion ratio (heat rate) of 6.9 MMBtu/MWh for Maryland, Shore and Valley, and a thermal conversion ratio (heat rate) of 6.5 MMBtu/MWh for Three Rivers, Towantic and Fairview.
|
|
For the
|
||||||||||||
|
nine months
|
||||||||||||
|
April –
|
For the
|
For the
|
||||||||||
|
December
|
year
|
year
|
||||||||||
|
Power Plant
|
2025
|
2026
|
2027
|
|||||||||
|
Fairview
|
||||||||||||
|
Gas price (Texas Eastern M2, as of 2026: M3)
|
3.43
|
4.26
|
3.84
|
|||||||||
|
Electricity price (AEP Dayton (AD))
|
52.02
|
53.45
|
49.72
|
|||||||||
|
Electricity margin
|
29.73
|
25.75
|
24.76
|
|||||||||
|
Towantic
|
||||||||||||
|
Gas price (Algonquin City Gate)
|
4.91
|
6.41
|
5.62
|
|||||||||
|
Electricity price (Mass Hub)
|
60.73
|
68.55
|
60.59
|
|||||||||
|
Electricity margin
|
28.85
|
26.90
|
24.06
|
|||||||||
|
Maryland
|
||||||||||||
|
Gas price (Transco Zone 5)
|
4.70
|
5.16
|
4.41
|
|||||||||
|
Electricity price (PJM West Hub)
|
59.66
|
61.44
|
58.05
|
|||||||||
|
Electricity margin
|
27.21
|
25.85
|
27.64
|
|||||||||
|
Shore
|
||||||||||||
|
Gas price (Texas Eastern M3)
|
3.77
|
4.26
|
3.84
|
|||||||||
|
Electricity price (PJM West Hub)
|
59.66
|
61.44
|
58.05
|
|||||||||
|
Electricity margin
|
33.64
|
32.03
|
31.56
|
|||||||||
|
Valley
|
||||||||||||
|
Gas price (Texas Eastern M3 – 70%, Dominion South Pt – 30%)
|
3.67
|
4.01
|
3.57
|
|||||||||
|
Electricity price (New York Zone G)
|
57.00
|
62.77
|
57.46
|
|||||||||
|
Electricity margin
|
31.68
|
35.10
|
32.86
|
|||||||||
|
Three Rivers
|
||||||||||||
|
Gas price (Chicago City Gate)
|
3.99
|
4.23
|
3.69
|
|||||||||
|
Electricity price (PJM ComEd)
|
46.60
|
47.16
|
43.56
|
|||||||||
|
Electricity margin
|
20.67
|
19.64
|
19.54
|
|||||||||
|
Transco
Zn5 Dlvd
M2M
|
Chicago
CG
M2M
|
Texas
Eastern M-
2 M2M
|
Algonquin
CG M2M
Fwd
|
Dominion
S Pt
M2M
|
Texas
Eastern
M-3
|
Mass
Hub
M2M
|
Mass
Hub
M2M Pk
|
Contract Date
|
|
3.79
|
3.09
|
2.52
|
3.49
|
2.55
|
2.61
|
44.91
|
47.58
|
01/03/2025
|
|
3.71
|
3.38
|
3.02
|
3.45
|
3.04
|
3.12
|
42.61
|
48.94
|
01/04/2025
|
|
4.51
|
3.53
|
3.13
|
3.47
|
3.16
|
3.25
|
40.54
|
47.01
|
01/05/2025
|
|
4.55
|
3.67
|
3.34
|
4.29
|
3.35
|
3.47
|
45.68
|
61.95
|
01/06/2025
|
|
4.90
|
3.89
|
3.58
|
4.67
|
3.58
|
3.82
|
55.74
|
88.26
|
01/07/2025
|
|
4.90
|
3.96
|
3.61
|
4.24
|
3.61
|
3.87
|
48.42
|
74.52
|
01/08/2025
|
|
4.43
|
3.90
|
3.22
|
3.70
|
3.24
|
3.36
|
43.75
|
56.42
|
01/09/2025
|
|
4.38
|
3.88
|
3.12
|
3.57
|
3.13
|
3.24
|
43.52
|
52.39
|
01/10/2025
|
|
4.86
|
4.35
|
3.54
|
6.09
|
3.54
|
3.91
|
59.46
|
67.74
|
01/11/2025
|
|
6.08
|
5.35
|
4.31
|
10.68
|
4.21
|
5.91
|
89.83
|
98.92
|
01/12/2025
|
|
7.94
|
5.98
|
4.76
|
14.49
|
4.50
|
8.06
|
124.34
|
135.53
|
01/01/2026
|
|
6.99
|
5.75
|
4.59
|
13.20
|
4.31
|
7.26
|
99.86
|
112.00
|
01/02/2026
|
|
5.41
|
4.20
|
3.91
|
6.74
|
3.88
|
4.20
|
61.55
|
70.81
|
01/03/2026
|
|
4.48
|
3.66
|
3.27
|
4.31
|
3.31
|
3.40
|
45.82
|
50.96
|
01/04/2026
|
|
4.69
|
3.61
|
3.09
|
3.76
|
3.11
|
3.22
|
41.63
|
50.51
|
01/05/2026
|
|
4.54
|
3.65
|
3.07
|
3.79
|
3.08
|
3.24
|
39.04
|
55.78
|
01/06/2026
|
|
4.68
|
3.77
|
3.17
|
4.30
|
3.15
|
3.42
|
55.62
|
82.33
|
01/07/2026
|
|
4.57
|
3.80
|
3.10
|
4.21
|
3.12
|
3.38
|
44.81
|
67.66
|
01/08/2026
|
|
4.13
|
3.68
|
2.81
|
3.49
|
2.86
|
2.96
|
39.82
|
54.67
|
01/09/2026
|
|
4.22
|
3.69
|
2.78
|
3.58
|
2.80
|
2.92
|
40.21
|
48.89
|
01/10/2026
|
|
4.22
|
4.09
|
3.19
|
5.71
|
3.22
|
3.58
|
52.90
|
62.58
|
01/11/2026
|
|
6.02
|
4.95
|
3.86
|
9.32
|
3.78
|
5.48
|
81.76
|
92.13
|
01/12/2026
|
|
7.85
|
5.59
|
4.39
|
13.13
|
4.15
|
7.90
|
115.76
|
127.37
|
01/01/2027
|
|
6.84
|
5.26
|
4.06
|
11.89
|
3.82
|
7.31
|
94.20
|
101.98
|
01/02/2027
|
|
4.53
|
3.63
|
3.41
|
5.89
|
3.32
|
3.70
|
53.20
|
64.45
|
01/03/2027
|
|
3.72
|
3.04
|
2.68
|
3.85
|
2.68
|
2.80
|
35.61
|
45.30
|
01/04/2027
|
|
3.69
|
2.93
|
2.56
|
3.19
|
2.55
|
2.68
|
32.25
|
42.18
|
01/05/2027
|
|
3.67
|
3.04
|
2.62
|
3.30
|
2.60
|
2.78
|
32.60
|
47.22
|
01/06/2027
|
|
3.78
|
3.20
|
2.63
|
3.90
|
2.63
|
2.91
|
44.66
|
72.95
|
01/07/2027
|
|
3.63
|
3.24
|
2.59
|
3.70
|
2.59
|
2.82
|
41.77
|
62.72
|
01/08/2027
|
|
3.37
|
3.21
|
2.32
|
2.94
|
2.35
|
2.45
|
32.59
|
46.81
|
01/09/2027
|
|
3.34
|
3.26
|
2.26
|
3.20
|
2.33
|
2.59
|
35.36
|
38.61
|
01/10/2027
|
|
3.52
|
3.51
|
2.67
|
4.34
|
2.69
|
2.97
|
47.60
|
58.53
|
01/11/2027
|
|
4.94
|
4.43
|
3.40
|
8.13
|
3.36
|
5.19
|
68.51
|
78.80
|
01/12/2027
|
|
East NY
ZnG M2M
OPk
|
East NY
ZnG M2M
Pk
|
PJM
ComEd
M2MS
|
PJM
ComEd
M2MS Pk
|
AEP-
Dayton
M2M OPk
|
AEP-
Dayton
M2M Pk
|
PJM
West
M2M
|
PJM
West
M2M Pk |
Contract Date
|
|
43.23
|
48.60
|
21.54
|
30.16
|
37.03
|
43.13
|
40.50
|
48.25
|
01/03/2025
|
|
41.20
|
49.10
|
22.32
|
35.50
|
38.86
|
47.00
|
40.79
|
51.99
|
01/04/2025
|
|
39.35
|
48.79
|
27.37
|
41.38
|
35.44
|
51.02
|
38.10
|
55.65
|
01/05/2025
|
|
41.54
|
59.16
|
31.35
|
50.36
|
35.11
|
55.59
|
38.49
|
60.62
|
01/06/2025
|
|
51.53
|
82.98
|
42.53
|
77.50
|
45.69
|
83.36
|
49.18
|
91.16
|
01/07/2025
|
|
46.95
|
70.10
|
38.12
|
65.48
|
41.88
|
71.03
|
44.26
|
78.99
|
01/08/2025
|
|
41.01
|
57.26
|
32.63
|
52.33
|
37.05
|
58.66
|
40.41
|
64.12
|
01/09/2025
|
|
40.37
|
51.54
|
32.50
|
48.49
|
42.15
|
57.12
|
44.29
|
61.37
|
01/10/2025
|
|
52.01
|
60.13
|
35.25
|
45.77
|
42.88
|
54.60
|
47.91
|
58.64
|
01/11/2025
|
|
72.46
|
82.86
|
42.49
|
51.45
|
53.06
|
60.41
|
57.95
|
66.68
|
01/12/2025
|
|
112.09
|
125.71
|
58.17
|
69.94
|
69.02
|
80.75
|
77.38
|
90.79
|
01/01/2026
|
|
84.90
|
99.51
|
46.99
|
58.40
|
57.13
|
67.71
|
65.90
|
77.03
|
01/02/2026
|
|
51.23
|
59.93
|
31.07
|
42.42
|
42.67
|
50.52
|
46.23
|
55.36
|
01/03/2026
|
|
40.79
|
47.79
|
26.49
|
40.12
|
39.82
|
49.49
|
42.23
|
53.84
|
01/04/2026
|
|
38.68
|
49.46
|
28.19
|
44.05
|
37.21
|
52.28
|
39.77
|
56.62
|
01/05/2026
|
|
39.19
|
53.37
|
27.55
|
48.85
|
35.34
|
54.30
|
37.79
|
59.35
|
01/06/2026
|
|
55.07
|
77.62
|
40.62
|
77.15
|
47.33
|
81.90
|
50.35
|
89.82
|
01/07/2026
|
|
44.51
|
65.00
|
33.21
|
63.95
|
38.86
|
68.94
|
41.83
|
76.87
|
01/08/2026
|
|
35.96
|
53.67
|
27.58
|
48.49
|
35.52
|
56.01
|
38.59
|
60.91
|
01/09/2026
|
|
34.95
|
45.53
|
29.49
|
45.29
|
38.93
|
53.57
|
41.44
|
57.61
|
01/10/2026
|
|
44.22
|
53.65
|
31.21
|
41.96
|
41.13
|
50.09
|
44.86
|
54.79
|
01/11/2026
|
|
72.25
|
78.31
|
37.26
|
48.30
|
47.50
|
57.28
|
55.00
|
64.34
|
01/12/2026
|
|
97.33
|
111.51
|
53.27
|
65.71
|
64.22
|
76.44
|
73.64
|
86.81
|
01/01/2027
|
|
77.26
|
85.51
|
46.98
|
57.58
|
56.96
|
66.53
|
65.94
|
76.17
|
01/02/2027
|
|
53.66
|
62.00
|
28.30
|
39.89
|
39.76
|
47.36
|
44.12
|
53.48
|
01/03/2027
|
|
37.07
|
44.10
|
21.59
|
36.62
|
33.56
|
44.64
|
37.40
|
50.60
|
01/04/2027
|
|
34.70
|
43.77
|
23.58
|
39.85
|
31.90
|
46.66
|
35.38
|
52.02
|
01/05/2027
|
|
36.05
|
48.06
|
24.68
|
44.66
|
31.34
|
50.32
|
34.52
|
55.83
|
01/06/2027
|
|
49.11
|
71.69
|
34.45
|
71.40
|
40.44
|
77.21
|
44.64
|
84.62
|
01/07/2027
|
|
45.77
|
63.26
|
31.49
|
62.34
|
37.12
|
67.84
|
41.42
|
75.05
|
01/08/2027
|
|
34.79
|
48.00
|
24.83
|
45.00
|
31.74
|
52.31
|
35.38
|
57.06
|
01/09/2027
|
|
33.41
|
35.17
|
23.61
|
37.62
|
33.82
|
46.93
|
37.60
|
51.93
|
01/10/2027
|
|
46.07
|
51.29
|
28.26
|
38.66
|
38.67
|
46.42
|
41.27
|
51.22
|
01/11/2027
|
|
62.99
|
71.11 |
34.36
|
46.03
|
47.67
|
54.49
|
52.07
|
60.90
|
01/12/2027
|
|
OPC Energy Ltd.
Condensed Consolidated Interim
Financial Statements
As of March 31, 2025
(Unaudited)
|
| Page |
|
|
F-3
|
|
|
F-4
|
|
|
F-5
|
|
|
F-7
|
|
|
F-8
|
|
|
F-9
|
|
|
F-11
|
|
|
F-13
|

|
|
(1) |
Independent auditors’ review report of May 20, 2025 on the Company’s condensed consolidated financial information as of March 31, 2025 and for the three-month period ended on that date.
|
|
|
(2) |
Independent auditors’ special report of May 20, 2025 on the Company’s separate interim financial information in accordance with Regulation 38D to the Securities Regulations (Periodic and Immediate Reports), 1970 as of March 31, 2025 and
for the three-month period then ended.
|
|
March 31
|
March 31
|
December 31
|
||||||||||
|
2025
|
2024
|
2024
|
||||||||||
|
(Unaudited)
|
(Unaudited)
|
(Audited)
|
||||||||||
|
NIS million
|
NIS million
|
NIS million
|
||||||||||
|
Current assets
|
||||||||||||
|
Cash and cash equivalents
|
837
|
838
|
962
|
|||||||||
|
Trade receivables
|
286
|
248
|
293
|
|||||||||
|
Other receivables and debit balances
|
83
|
394
|
90
|
|||||||||
|
Total current assets
|
1,206
|
1,480
|
1,345
|
|||||||||
|
Non‑current assets
|
||||||||||||
|
Long-term restricted deposits and cash
|
61
|
58
|
60
|
|||||||||
|
Long-term receivables and debit balances
|
160
|
240
|
162
|
|||||||||
|
Investments in associates
|
5,715
|
2,577
|
5,320
|
|||||||||
|
Long-term derivative financial instruments
|
41
|
58
|
44
|
|||||||||
|
Property, plant & equipment
|
4,198
|
6,395
|
4,238
|
|||||||||
|
Right‑of‑use assets and deferred expenses
|
648
|
627
|
637
|
|||||||||
|
Intangible assets
|
264
|
1,145
|
261
|
|||||||||
|
Total non‑current assets
|
11,087
|
11,100
|
10,722
|
|||||||||
|
Total assets
|
12,293
|
12,580
|
12,067
|
|||||||||
|
March 31
|
March 31
|
December 31
|
||||||||||
|
2025
|
2024
|
2024
|
||||||||||
|
(Unaudited)
|
(Unaudited)
|
(Audited)
|
||||||||||
|
NIS million
|
NIS million
|
NIS million
|
||||||||||
|
Current liabilities
|
||||||||||||
|
Loans and credit from banking corporations and financial institutions (including current maturities)
|
85
|
164
|
82
|
|||||||||
|
Current maturities of debt from non‑controlling interests
|
13
|
29
|
14
|
|||||||||
|
Current maturities of debentures
|
235
|
201
|
212
|
|||||||||
|
Trade payables
|
276
|
267
|
213
|
|||||||||
|
Payables and credit balances
|
203
|
409
|
123
|
|||||||||
|
Total current liabilities
|
812
|
1,070
|
644
|
|||||||||
|
Non‑current liabilities
|
||||||||||||
|
Long-term loans from banking corporations and financial institutions
|
2,274
|
2,898
|
2,150
|
|||||||||
|
Long-term debt from non-controlling interests
|
495
|
442
|
500
|
|||||||||
|
Debentures
|
1,537
|
1,743
|
1,663
|
|||||||||
|
Long-term lease liabilities
|
29
|
200
|
31
|
|||||||||
|
Long-term derivative financial instruments
|
-
|
49
|
-
|
|||||||||
|
Other long‑term liabilities
|
11
|
414
|
115
|
|||||||||
|
Deferred tax liabilities
|
564
|
490
|
543
|
|||||||||
|
Total non-current liabilities
|
4,910
|
6,236
|
5,002
|
|||||||||
|
Total liabilities
|
5,722
|
7,306
|
5,646
|
|||||||||
|
Equity
|
||||||||||||
|
Share capital
|
3
|
2
|
3
|
|||||||||
|
Share premium
|
3,997
|
3,210
|
3,993
|
|||||||||
|
Capital reserves
|
567
|
543
|
532
|
|||||||||
|
Retained earnings
|
290
|
131
|
224
|
|||||||||
|
Total equity attributable to the Company’s shareholders
|
4,857
|
3,886
|
4,752
|
|||||||||
|
Non‑controlling interests
|
1,714
|
1,388
|
1,669
|
|||||||||
|
Total equity
|
6,571
|
5,274
|
6,421
|
|||||||||
|
Total liabilities and equity
|
12,293
|
12,580
|
12,067
|
|||||||||
|
Yair Caspi
|
Giora Almogy
|
Ana Bernstein Schwartzman
|
||
|
Chairman of the Board of Directors
|
CEO
|
CFO
|
|
For the three-month period
ended March 31
|
For the year
ended
December 31
|
|||||||||||
|
2025
|
2024
|
2024
|
||||||||||
|
(Unaudited)
|
(Unaudited)
|
(Audited)
|
||||||||||
|
NIS million
|
NIS million
|
NIS million
|
||||||||||
|
Revenues from sales and provision of services
|
660
|
638
|
2,779
|
|||||||||
|
Cost of sales and services (excluding depreciation and amortization)
|
(501
|
)
|
(430
|
)
|
(1,931
|
)
|
||||||
|
Depreciation and amortization
|
(62
|
)
|
(74
|
)
|
(317
|
)
|
||||||
|
Gross income
|
97
|
134
|
531
|
|||||||||
|
Share in profits of associates
|
138
|
72
|
166
|
|||||||||
|
Compensation for loss of income
|
-
|
26
|
44
|
|||||||||
|
General and administrative expenses
|
(54
|
)
|
(61
|
)
|
(263
|
)
|
||||||
|
Business development expenses
|
(3
|
)
|
(12
|
)
|
(45
|
)
|
||||||
|
Gain on loss of control in the US Renewable Energies Segment
|
-
|
-
|
259
|
|||||||||
|
Other expenses, net
|
(11
|
)
|
(56
|
)
|
(56
|
)
|
||||||
|
Operating profit
|
167
|
103
|
636
|
|||||||||
|
Finance expenses
|
(59
|
)
|
(76
|
)
|
(339
|
)
|
||||||
|
Finance income
|
12
|
15
|
87
|
|||||||||
|
Loss from extinguishment of financial liabilities
|
-
|
-
|
(49
|
)
|
||||||||
|
Finance expenses, net
|
(47
|
)
|
(61
|
)
|
(301
|
)
|
||||||
|
Profit before taxes on income
|
120
|
42
|
335
|
|||||||||
|
Expenses for income tax
|
(27
|
)
|
(27
|
)
|
(138
|
)
|
||||||
|
Profit for the period
|
93
|
15
|
197
|
|||||||||
|
Attributable to:
|
||||||||||||
|
The Company’s shareholders
|
66
|
18
|
111
|
|||||||||
|
Non‑controlling interests
|
27
|
(3
|
)
|
86
|
||||||||
|
Profit for the period
|
93
|
15
|
197
|
|||||||||
|
Earnings per share attributable to the Company’s owners
|
||||||||||||
|
Basic and diluted earnings per share (in NIS)
|
0.26
|
0.08
|
0.46
|
|||||||||
|
For the three-month period
ended March 31
|
For the year
ended
December 31
|
|||||||||||
|
2025
|
2024
|
2024
|
||||||||||
|
(Unaudited)
|
(Unaudited)
|
(Audited)
|
||||||||||
|
NIS million
|
NIS million
|
NIS million
|
||||||||||
|
Profit for the period
|
93
|
15
|
197
|
|||||||||
|
Other comprehensive income items that, subsequent to initial recognition in comprehensive income, were or will be transferred to profit and loss
|
||||||||||||
|
Effective portion of the change in the fair value of cash flow hedges
|
(4
|
)
|
18
|
42
|
||||||||
|
Net change in fair value of derivative financial instruments used to hedge cash flows transferred to profit and loss
|
-
|
(2
|
)
|
(11
|
)
|
|||||||
|
Group’s share in other comprehensive income (loss) of associates, net
of tax |
(60
|
)
|
(61
|
)
|
13
|
|||||||
|
Foreign currency translation differences in respect of foreign operations
|
109
|
65
|
(8
|
)
|
||||||||
|
Tax on other comprehensive income items
|
(6
|
)
|
(4
|
)
|
(6
|
)
|
||||||
|
Other comprehensive income for the period, net of tax
|
39
|
16
|
30
|
|||||||||
|
Total comprehensive income for the period
|
132
|
31
|
227
|
|||||||||
|
Attributable to:
|
||||||||||||
|
The Company’s shareholders
|
104
|
37
|
121
|
|||||||||
|
Non‑controlling interests
|
28
|
(6
|
)
|
106
|
||||||||
|
Comprehensive income for the period
|
132
|
31
|
227
|
|||||||||
|
Attributable to the Company’s shareholders
|
||||||||||||||||||||||||||||||||||||
|
Share capital
|
Share premium
|
Capital reserves
|
Hedge fund
|
Foreign operations translation reserve
|
Retained earnings
|
Total
|
Non‑controlling interests
|
Total equity
|
||||||||||||||||||||||||||||
|
NIS million
|
NIS million
|
NIS million
|
NIS million
|
NIS million
|
NIS million
|
NIS million
|
NIS million
|
NIS million
|
||||||||||||||||||||||||||||
|
(Unaudited)
|
||||||||||||||||||||||||||||||||||||
|
For the three-month period ended March 31, 2025
|
||||||||||||||||||||||||||||||||||||
|
Balance as of January 1, 2025
|
3
|
3,993
|
247
|
49
|
236
|
224
|
4,752
|
1,669
|
6,421
|
|||||||||||||||||||||||||||
|
Investments by holders of non-controlling interests in equity
of subsidiary |
-
|
-
|
-
|
-
|
-
|
-
|
-
|
16
|
16
|
|||||||||||||||||||||||||||
|
Share-based payment
|
-
|
-
|
1
|
-
|
-
|
-
|
1
|
-
|
1
|
|||||||||||||||||||||||||||
|
Exercised and expired options and RSUs
|
*-
|
4
|
(4
|
)
|
-
|
-
|
-
|
-
|
-
|
-
|
||||||||||||||||||||||||||
|
Other
|
-
|
-
|
-
|
-
|
-
|
-
|
-
|
1
|
1
|
|||||||||||||||||||||||||||
|
Other comprehensive income (loss) for the period, net of tax
|
-
|
-
|
-
|
(41
|
)
|
79
|
-
|
38
|
1
|
39
|
||||||||||||||||||||||||||
|
Profit for the period
|
-
|
-
|
-
|
-
|
-
|
66
|
66
|
27
|
93
|
|||||||||||||||||||||||||||
|
Balance as of March 31, 2025
|
3
|
3,997
|
244
|
8
|
315
|
290
|
4,857
|
1,714
|
6,571
|
|||||||||||||||||||||||||||
|
For the three-month period ended March 31, 2024
|
||||||||||||||||||||||||||||||||||||
|
Balance as of January 1, 2024
|
2
|
3,210
|
248
|
25
|
250
|
113
|
3,848
|
1,394
|
5,242
|
|||||||||||||||||||||||||||
|
Share-based payment
|
-
|
-
|
1
|
-
|
-
|
-
|
1
|
-
|
1
|
|||||||||||||||||||||||||||
|
Exercised options and RSUs
|
*-
|
*-
|
*-
|
-
|
-
|
-
|
-
|
-
|
-
|
|||||||||||||||||||||||||||
|
Other comprehensive income (loss) for the period, net of tax
|
-
|
-
|
-
|
(30
|
)
|
49
|
-
|
19
|
(3
|
)
|
16
|
|||||||||||||||||||||||||
|
Profit (loss) for the period
|
-
|
-
|
-
|
-
|
-
|
18
|
18
|
(3
|
)
|
15
|
||||||||||||||||||||||||||
|
Balance as of March 31, 2024
|
2
|
3,210
|
249
|
(5
|
)
|
299
|
131
|
3,886
|
1,388
|
5,274
|
||||||||||||||||||||||||||
|
Attributable to the Company’s shareholders
|
||||||||||||||||||||||||||||||||||||
|
Share capital
|
Share premium
|
Capital reserves
|
Hedge fund
|
Foreign operations translation reserve
|
Retained earnings
|
Total
|
Non‑controlling interests
|
Total equity
|
||||||||||||||||||||||||||||
|
NIS million
|
NIS million
|
NIS million
|
NIS million
|
NIS million
|
NIS million
|
NIS million
|
NIS million
|
NIS million
|
||||||||||||||||||||||||||||
|
(Audited)
|
||||||||||||||||||||||||||||||||||||
|
For the year ended December 31, 2024
|
||||||||||||||||||||||||||||||||||||
|
Balance as of January 1, 2024
|
2
|
3,210
|
248
|
25
|
250
|
113
|
3,848
|
1,394
|
5,242
|
|||||||||||||||||||||||||||
|
Issuance of shares (less issuance expenses)
|
1
|
779
|
-
|
-
|
-
|
-
|
780
|
-
|
780
|
|||||||||||||||||||||||||||
|
Investments by holders of non-controlling interests in equity
of subsidiary |
-
|
-
|
-
|
-
|
-
|
-
|
-
|
175
|
175
|
|||||||||||||||||||||||||||
|
Share-based payment
|
-
|
-
|
7
|
-
|
-
|
-
|
7
|
1
|
8
|
|||||||||||||||||||||||||||
|
Exercised and expired options and RSUs
|
*-
|
4
|
(4
|
)
|
-
|
-
|
-
|
-
|
-
|
-
|
||||||||||||||||||||||||||
|
Other
|
-
|
-
|
(4
|
)
|
-
|
-
|
-
|
(4
|
)
|
(7
|
)
|
(11
|
)
|
|||||||||||||||||||||||
|
Other comprehensive income for the year, net of tax
|
-
|
-
|
-
|
24
|
(14
|
)
|
-
|
10
|
20
|
30
|
||||||||||||||||||||||||||
|
Profit for the year
|
-
|
-
|
-
|
-
|
-
|
111
|
111
|
86
|
197
|
|||||||||||||||||||||||||||
|
Balance as of December 31, 2024
|
3
|
3,993
|
247
|
49
|
236
|
224
|
4,752
|
1,669
|
6,421
|
|||||||||||||||||||||||||||
|
For the three-month period
ended March 31
|
For the year
ended
December 31
|
|||||||||||
|
2025
|
2024
|
2024
|
||||||||||
|
(Unaudited)
|
(Unaudited)
|
(Audited)
|
||||||||||
|
NIS million
|
NIS million
|
NIS million
|
||||||||||
|
Cash flows from operating activities
|
||||||||||||
|
Profit for the period
|
93
|
15
|
197
|
|||||||||
|
Adjustments:
|
||||||||||||
|
Depreciation and amortization
|
66
|
77
|
333
|
|||||||||
|
Diesel fuel consumption
|
4
|
4
|
12
|
|||||||||
|
Finance expenses, net
|
47
|
61
|
301
|
|||||||||
|
Expenses for income tax
|
27
|
27
|
138
|
|||||||||
|
Share in profits of associates
|
(138
|
)
|
(72
|
)
|
(166
|
)
|
||||||
|
Other expenses, net
|
11
|
56
|
56
|
|||||||||
|
Gain on loss of control in the US Renewable Energies Segment
|
-
|
-
|
(259
|
)
|
||||||||
|
Share-based payment transactions
|
(1
|
)
|
6
|
35
|
||||||||
|
109
|
174
|
647
|
||||||||||
|
Changes in trade and other receivables
|
18
|
39
|
(64
|
)
|
||||||||
|
Changes in trade payables, service providers, payables and other long-term liabilities
|
47
|
32
|
14
|
|||||||||
|
65
|
71
|
(50
|
)
|
|||||||||
|
Dividends received from associates
|
59
|
18
|
235
|
|||||||||
|
Revenues taxes paid
|
-
|
-
|
(67
|
)
|
||||||||
|
Net cash provided by operating activities
|
233
|
263
|
765
|
|||||||||
|
Cash flows used for investing activities
|
||||||||||||
|
Interest received
|
11
|
7
|
35
|
|||||||||
|
Investment in associates (see Note 10)
|
(278
|
)
|
(10
|
)
|
(737
|
)
|
||||||
|
Purchase of property, plant, and equipment, intangible assets and deferred expenses
|
(48
|
)
|
(254
|
)
|
(1,260
|
)
|
||||||
|
Loss of control in the US Renewable Energies Segment
|
-
|
-
|
134
|
|||||||||
|
Proceeds for repayment of partnership capital from associates
|
-
|
-
|
95
|
|||||||||
|
Other
|
1
|
10
|
21
|
|||||||||
|
Net cash used for investing activities
|
(314
|
)
|
(247
|
)
|
(1,712
|
)
|
||||||
|
For the three-month period
ended March 31
|
For the year
ended
December 31
|
|||||||||||
|
2025
|
2024
|
2024
|
||||||||||
|
(Unaudited)
|
(Unaudited)
|
(Audited)
|
||||||||||
|
NIS million
|
NIS million
|
NIS million
|
||||||||||
|
Cash flows provided by financing activities
|
||||||||||||
|
Proceeds of share issuance, less issuance expenses
|
-
|
-
|
780
|
|||||||||
|
Proceeds of debenture issuance, less issuance expenses
|
-
|
198
|
198
|
|||||||||
|
Receipt of long-term loans from banking corporations and financial institutions, net
|
150
|
33
|
1,951
|
|||||||||
|
Receipt of long-term debt from non-controlling interests
|
5
|
13
|
104
|
|||||||||
|
Investments by holders of non-controlling interests in equity of subsidiary
|
16
|
-
|
175
|
|||||||||
|
Change in short term loans from banking corporations, net
|
(2
|
)
|
(203
|
)
|
(204
|
)
|
||||||
|
Tax equity partner’s investment in US-based renewable energy projects
|
-
|
-
|
152
|
|||||||||
|
Interest paid
|
(58
|
)
|
(66
|
)
|
(228
|
)
|
||||||
|
Repayment of long-term loans from banking corporations and others
|
(22
|
)
|
(62
|
)
|
(1,755
|
)
|
||||||
|
Repayment of long-term loans from non-controlling interests
|
(29
|
)
|
(9
|
)
|
(76
|
)
|
||||||
|
Repayment of debentures
|
(106
|
)
|
(96
|
)
|
(193
|
)
|
||||||
|
Other
|
(2
|
)
|
(5
|
)
|
(13
|
)
|
||||||
|
Net cash provided by (used for) financing activities
|
(48
|
)
|
(197
|
)
|
891
|
|||||||
|
Net decrease in cash and cash equivalents
|
(129
|
)
|
(181
|
)
|
(56
|
)
|
||||||
|
Balance of cash and cash equivalents of the beginning of period
|
962
|
1,007
|
1,007
|
|||||||||
|
Effect of exchange rate fluctuations on cash and cash equivalent balances
|
4
|
12
|
11
|
|||||||||
|
Balance of cash and cash equivalents as of the end of the period
|
837
|
838
|
962
|
|||||||||
|
|
A. |
Statement of compliance with International Financial Reporting Standards (IFRS)
|
|
|
B. |
Functional and presentation currency
|
|
|
C. |
Use of estimates and judgments
|
|
|
D. |
Seasonality
|
|
For the three-month period ended March 31, 2025
|
||||||||||||||||||||||||
|
Israel
|
Energy Transition in the US
|
US Renewable Energies
|
Other activities in the USA
|
Adjustments to consolidated
|
Consolidated - total
|
|||||||||||||||||||
|
In NIS million
|
(Unaudited)
|
|||||||||||||||||||||||
|
Revenues from sales and provision of services
|
526
|
779
|
45
|
89
|
(779
|
)
|
660
|
|||||||||||||||||
|
EBITDA after proportionate consolidation
|
137
|
277
|
27
|
(8
|
)
|
(304
|
)
|
129
|
||||||||||||||||
|
Adjustments:
|
||||||||||||||||||||||||
|
Share in profits of associates
|
138
|
|||||||||||||||||||||||
|
General and administrative expenses at the US headquarters (not attributed to US segments)
|
(17
|
)
|
||||||||||||||||||||||
|
General and administrative expenses at the Company’s headquarters (not attributed to the operating segments)
|
(6
|
)
|
||||||||||||||||||||||
|
Total EBITDA
|
244
|
|||||||||||||||||||||||
|
Depreciation and amortization
|
(66
|
)
|
||||||||||||||||||||||
|
Finance expenses, net
|
(47
|
)
|
||||||||||||||||||||||
|
Other expenses, net
|
(11
|
)
|
||||||||||||||||||||||
|
(124
|
)
|
|||||||||||||||||||||||
|
Profit before taxes on income
|
120
|
|||||||||||||||||||||||
|
Expenses for income tax
|
(27
|
)
|
||||||||||||||||||||||
|
Profit for the period
|
93
|
|||||||||||||||||||||||
|
For the three-month period ended March 31, 2024
|
||||||||||||||||||||||||
|
Israel
|
Energy Transition in the US
|
US Renewable Energies
|
Other activities in the USA
|
Adjustments to consolidated
|
Consolidated - total
|
|||||||||||||||||||
|
In NIS million
|
(Unaudited)
|
|||||||||||||||||||||||
|
Revenues from sales and provision of services
|
532
|
518
|
60
|
21
|
(493
|
)
|
638
|
|||||||||||||||||
|
EBITDA after proportionate consolidation
|
170
|
166
|
28
|
(9
|
)
|
(168
|
)
|
187
|
||||||||||||||||
|
Adjustments:
|
||||||||||||||||||||||||
|
Share in profits of associates
|
72
|
|||||||||||||||||||||||
|
General and administrative expenses at the US headquarters (not attributed to US segments)
|
(20
|
)
|
||||||||||||||||||||||
|
General and administrative expenses at the Company’s headquarters (not attributed to the operating segments)
|
(3
|
)
|
||||||||||||||||||||||
|
Total EBITDA
|
236
|
|||||||||||||||||||||||
|
Depreciation and amortization
|
(77
|
)
|
||||||||||||||||||||||
|
Finance expenses, net
|
(61
|
)
|
||||||||||||||||||||||
|
Other expenses, net
|
(56
|
)
|
||||||||||||||||||||||
|
(194
|
)
|
|||||||||||||||||||||||
|
Profit before taxes on income
|
42
|
|||||||||||||||||||||||
|
Expenses for income tax
|
(27
|
)
|
||||||||||||||||||||||
|
Profit for the period
|
15
|
|||||||||||||||||||||||
|
For the year ended December 31, 2024
|
||||||||||||||||||||||||
|
Israel
|
Energy
Transition
in the US
|
US
Renewable
Energies
|
Other
activities
in the USA
|
Adjustments to consolidated
|
Consolidated -
total
|
|||||||||||||||||||
|
In NIS million
|
(Audited)
|
|||||||||||||||||||||||
|
Revenues from sales and provision of services
|
2,312
|
1,796
|
228
|
145
|
(1,702
|
)
|
2,779
|
|||||||||||||||||
|
EBITDA after proportionate consolidation
|
639
|
588
|
112
|
(22
|
)
|
(608
|
)
|
709
|
||||||||||||||||
|
Adjustments:
|
||||||||||||||||||||||||
|
Share in profits of associates
|
166
|
|||||||||||||||||||||||
|
General and administrative expenses at the US headquarters (not attributed to US segments)
|
(89
|
)
|
||||||||||||||||||||||
|
General and administrative expenses at the Company’s headquarters (not attributed to the operating segments)
|
(20
|
)
|
||||||||||||||||||||||
|
Total EBITDA
|
766
|
|||||||||||||||||||||||
|
Depreciation and amortization
|
(333
|
)
|
||||||||||||||||||||||
|
Finance expenses, net
|
(301
|
)
|
||||||||||||||||||||||
|
Gain on loss of control in the US Renewable Energies Segment
|
259
|
|||||||||||||||||||||||
|
Other expenses, net
|
(56
|
)
|
||||||||||||||||||||||
|
(431
|
)
|
|||||||||||||||||||||||
|
Profit before taxes on income
|
335
|
|||||||||||||||||||||||
|
Expenses for income tax
|
(138
|
)
|
||||||||||||||||||||||
|
Profit for the year
|
197
|
|||||||||||||||||||||||
|
For the three-month period
ended March 31
|
For the year
ended
December 31
|
|||||||||||
|
2025
|
2024
|
2024
|
||||||||||
|
In NIS million
|
(Unaudited)
|
(Audited)
|
||||||||||
|
Revenues from sale of electricity in Israel:
|
||||||||||||
|
Revenues from the sale of energy to private customers
|
282
|
300
|
1,368
|
|||||||||
|
Revenues from energy sales to the System Operator and other suppliers
|
50
|
46
|
165
|
|||||||||
|
Revenues for capacity services
|
33
|
42
|
171
|
|||||||||
|
Revenues from the sale of energy to the System Operator, at cogeneration tariff
|
18
|
19
|
83
|
|||||||||
|
Revenues from sale of steam in Israel
|
15
|
17
|
57
|
|||||||||
|
Other revenues in Israel
|
-
|
7
|
23
|
|||||||||
|
Total income from sale of energy and others in Israel (excluding infrastructure services)
|
398
|
431
|
1,867
|
|||||||||
|
Revenues from private customers for infrastructure services
|
128
|
101
|
445
|
|||||||||
|
Total income in Israel
|
526
|
532
|
2,312
|
|||||||||
|
Revenues from sale of electricity from renewable energy (*)
|
-
|
56
|
195
|
|||||||||
|
Revenues from sale of retail electricity and others
|
134
|
50
|
272
|
|||||||||
|
Total income in the USA
|
134
|
106
|
467
|
|||||||||
|
Total income
|
660
|
638
|
2,779
|
|||||||||
|
|
A. |
Significant events during and subsequent to the reporting period
|
|
|
1. |
Banking financing agreement in OPC Israel
|
|
|
2. |
Short-term credit facilities from Israeli banking corporations:
|
|
Facility amount
|
Utilization as of the
report date (1)
|
|||||||
|
The Company
|
300
|
-
|
||||||
|
OPC Israel
|
300
|
2
|
||||||
|
The Company for CPV Group (2)
|
Approx. 174
(USD 20 million and NIS 100 million)
|
92
|
||||||
|
CPV Group(2)
|
Approx. 279
(USD 75 million)
|
219
|
||||||
|
Total
|
1,053
|
313
|
||||||
|
|
(1) |
Mostly for the purpose of letters of credit and bank guarantees.
|
|
|
(2) |
The facilities provided for CPV Group are backed with a Company guarantee.
|
|
|
3. |
On May 18, 2025, Midroog has set an initial rating of A1.il with a stable outlook for the Company and its debentures.
|
|
|
B. |
Changes in the Group’s material guarantees:
|
|
As of March 31, 2025
|
As of December 31, 2024
|
|||||||
|
NIS million
|
NIS million
|
|||||||
|
In respect of operating projects in Israel (Rotem, Hadera, Zomet and Gat) (1)
|
159
|
249
|
||||||
|
For projects under construction and development in Israel (Sorek 2 and consumers’ premises)
|
74
|
74
|
||||||
|
In respect of the filing of a bid in the Sorek tender (2)
|
50
|
100
|
||||||
|
In respect of virtual supply activity in Israel (3)
|
69
|
21
|
||||||
|
In respect of operating projects in the US Renewable Energies Segment*
|
45
|
22
|
||||||
|
In respect of projects under construction and development in the USA (CPV Group) (4)*
|
380
|
339
|
||||||
|
Total
|
777
|
805
|
||||||
|
|
(1) |
The decrease arises mainly from the release of a bank guarantee provided by OPC Israel for Zomet in favor of ILA totaling NIS 67 million (for further details, see Note 10B5 to the Annual Financial Statements).
|
|
|
(2) |
The decrease arises from a decrease in bank guarantee provided by OPC Israel in connection with the Sorek tender as described in Note 14C3 to the Annual Financial Statements.
|
|
|
(3) |
The increase stems from an increase of the bank guarantee provided in favor of the System Operator in respect of the virtual supply activity.
|
|
|
(4) |
The increase arises mainly from projects under construction in the Renewable Energy Segment.
|
|
|
C. |
Financial covenants:
|
|
Ratio
|
Required value - Series B
|
Required value - Series C and D
|
Actual value
|
|||
|
Net financial debt (1) to adjusted EBITDA (2)
|
Will not exceed 13 (for distribution purposes - 11)
|
Will not exceed 13 (for distribution purposes - 11)
|
5.2
|
|||
|
The Company shareholders’ equity (“separate”)
|
Will not fall below NIS 250 million (for distribution purposes - NIS 350 million)
|
With respect to Debentures (Series C): will not fall below NIS 1 billion (for distribution purposes - NIS 1.4 billion)
With respect to Debentures (Series D): will not fall below NIS 2 billion (for distribution purposes - NIS 2.4 billion)
|
Approx.
NIS 4,857 million
|
|||
|
The Company’s equity to asset ratio (“separate”)
|
Will not fall below 17% (for distribution purposes: 27%)
|
Will not fall below 20% (for distribution purposes - 30%)
|
73%
|
|||
|
The Company’s equity to asset ratio (“consolidated”)
|
--
|
Will not fall below 17%
|
53%
|
|
Financial covenants
|
Breach ratio
|
Actual value
|
||
|
Covenants applicable to OPC Israel with respect to the corporate financing agreements2
|
||||
|
OPC Israel’s equity capital
|
Will not fall below NIS 1,100 million
|
Approx. NIS 2,324 million
|
||
|
OPC Israel’s equity to asset ratio
|
Will not fall below 20%
|
42%
|
||
|
OPC Israel’s ratio of net debt to EBITDA
|
Will not exceed 8
|
3.6
|
||
|
Covenants applicable to Hadera in connection with the Hadera Financing Agreement
|
||||
|
Minimum expected DSCR (1)
|
1.10
|
1.10
|
||
|
Average expected DSCR (1)
|
1.10
|
1.61
|
||
|
LLCR (2)
|
1.10
|
1.53
|
||
|
Covenants applicable to the Company in connection with binding credit facilities with Israeli banking corporations3
|
||||
|
The Company shareholders’ equity (“separate”)
|
Will not fall below NIS 1,200 million
|
Approx. NIS 4,898 million
|
||
|
The Company’s equity to asset ratio (“separate”)
|
Will not fall below 30%
|
73%
|
||
|
The Company’s net debt to EBITDA ratio
|
Will not exceed 12
|
5.2
|
||
|
|
D. |
Equity compensation plans
|
|
|
1. |
Following is information about allotments of offered securities in the reporting period:
|
|
Offerees and allotment date
|
No. of options at the grant date (in thousands)
|
Average fair
value of each
option at the
grant date
(in NIS)
|
Exercise
price per
option (in
NIS,
unlinked)
|
Standard
deviation (1)
|
Risk-free interest rate (2)
|
Cost of benefit (in
NIS million) (3)
|
||||||
|
Executives, March 2025
|
441
|
11.80
|
31.98
|
30.4%-34.5%
|
4.09%-4.15%
|
Approx. 5
|
|
|
2. |
In January 2025, approximately 184 thousand options awarded to the Chairman of the Board, Mr. Yair Caspi, expired.
|
|
|
3. |
Subsequent to the report date, in April 2025, the Company’s CEO, Mr. Giora Almogy, exercised approx. 626 thousand options into approx. 3 thousand Company shares.
|
|
|
E. |
Profit-sharing plan for CPV Group employees
|
|
|
A. |
Financial instruments measured at fair value for disclosure purposes only
|
|
As of March 31, 2025
|
||||||||
|
Carrying value (*)
|
Fair value
|
|||||||
|
In NIS million
|
(Unaudited)
|
(Unaudited)
|
||||||
|
Loans from banking corporations and financial institutions (Level 2)
|
2,362
|
2,365
|
||||||
|
Loans from non‑controlling interests (Level 2)
|
508
|
507
|
||||||
|
Debentures (Level 1)
|
1,774
|
1,710
|
||||||
|
4,644
|
4,582
|
|||||||
|
As of March 31, 2024
|
||||||||
|
Carrying value (*)
|
Fair value
|
|||||||
|
In NIS million
|
(Unaudited)
|
(Unaudited)
|
||||||
|
Loans from banking corporations and financial institutions (Level 2)
|
3,064
|
3,125
|
||||||
|
Loans from non‑controlling interests (Level 2)
|
471
|
479
|
||||||
|
Debentures (Level 1)
|
1,948
|
1,869
|
||||||
|
5,483
|
5,473
|
|||||||
|
|
As of December 31, 2024
|
|||||||
|
Carrying value (*)
|
Fair value
|
|||||||
|
In NIS million
|
(Audited)
|
(Audited)
|
||||||
|
Loans from banking corporations and financial institutions (Level 2)
|
2,234
|
2,237
|
||||||
|
Loans from non‑controlling interests (Level 2)
|
514
|
508
|
||||||
|
Debentures (Level 1)
|
1,891
|
1,805
|
||||||
|
4,639
|
4,550
|
|||||||
|
|
B. |
Fair value hierarchy of financial instruments measured at fair value
|
|
As of March 31
|
As of December 31
|
|||||||||||
|
2025
|
2024
|
2024
|
||||||||||
|
In NIS million
|
(Unaudited)
|
(Audited)
|
||||||||||
|
Financial assets
|
||||||||||||
|
Derivatives used for hedge accounting
|
||||||||||||
|
CPI swap contracts (Level 2)
|
41
|
41
|
(*)44
|
|
||||||||
|
Interest rate swaps (SOFR) (Level 2) (1)
|
-
|
30
|
-
|
|||||||||
|
Total
|
41
|
71
|
44
|
|||||||||
|
Financial liabilities
|
||||||||||||
|
Derivatives used for hedge accounting
|
||||||||||||
|
CPI swap contracts (Level 2)
|
(1
|
)
|
(2
|
)
|
(*)(1
|
) |
||||||
|
Interest rate swaps (SOFR) (Level 2) (1)
|
-
|
(3
|
)
|
-
|
||||||||
|
Electricity price hedge contracts (the US renewable energy segment) (Level 3) (1)
|
-
|
(51
|
)
|
-
|
||||||||
|
Total
|
(1
|
)
|
(56
|
)
|
(1
|
)
|
||||||
|
|
(1) |
The balances as of March 31, 2024 are in respect of CPV Renewable. For details regarding deconsolidation and transition to the equity method in the fourth quarter of 2024 with respect to the investment in CPV Renewable, see Note 23E to
the Annual Financial Statements.
|
|
|
A. |
General
|
|
|
1. |
As of the report approval date there was no material change in the Company’s assessments regarding the Iron Swords War, compared to Note 1 to the Annual Financial Statements.
|
|
|
2. |
In the three‑month periods ended March 31, 2025 and 2024 the Group purchased property, plant and equipment for a total of approx. NIS 17 million and approx. NIS 201 million, respectively. Furthermore, these amounts include non-cash
purchases totaling approx. NIS 3 million and approx. NIS 13 million during these periods, respectively.
|
|
|
3. |
For further details regarding developments in credit from banking corporations and others, debentures, credit ratings of the Company and its debentures, guarantees and equity in the reporting period and
thereafter, see Note 6.
|
|
|
4. |
For further details regarding developments in commitments with related parties and interested parties in the reporting period and thereafter, see Note 7.
|
|
|
B. |
OPC Israel
Further to Note 10B4 to the Annual Financial Statements regarding a petition to the High Court of Justice on the Hadera 2 Project, in April 2025, a hearing was held on the conditional order instructing the government to explain its decision, following which the court proposed to weigh the possibility of the issue being rediscussed by the government while setting the schedule
in this matter
|
|
|
C. |
CPV Group
|
|
|
1. |
Further to Note 24C to the Annual Financial Statements regarding an agreement to acquire a further 20% stake in the Shore Power Plant, such that subsequent to its completion, the holding
stake will be approx. 89% - on April 1, 2025, the acquisition agreement was completed. At the transaction completion date, the CPV Group paid the seller a consideration amount that is immaterial to the Company, in addition to injecting
the partner's share on Shore’s refinancing date during the first quarter of 2025, as detailed in Note 10 below. Most of the excess acquisition cost will be allocated to property, plant, and equipment. Given the interests of the remaining
partner in the Shore Power Plant, the Company is expected to continue to account for its investment in Shore in accordance with the equity method
|
|
|
2. |
Further to Note 23E to the Annual Financial Statements regarding the investment agreement in the US Renewable Energy Segment, a further total of approx. USD 50 million was invested in April 2025 by the Investor.
|
|
|
3. |
Further to Note 23A3 to the Annual Financial Statements, following is information regarding investment undertakings and provision of loans by OPC Power’s partners (in USD million):
|
|
Immediately
prior to the
report approval
date
|
As of March 31, 2025
|
As of
December 31,
2024
|
||||||||||
|
Total investment undertakings and loan provision (a)
|
1,535
|
1,535
|
1,535
|
|||||||||
|
Utilization (b)
|
(1,510
|
)
|
(1,480
|
)
|
(1,455
|
)
|
||||||
|
Balance of investment undertakings and loan provision
|
25
|
55
|
80
|
|||||||||
|
|
A. |
Excluding an additional investment commitment for backing guarantees which were or will be provided for the purpose of development and expansion of projects - each partner based on its pro rata share in the
partnership, for a total of approx. USD 75 million.
|
|
|
B. |
In the reporting period, the Company and non-controlling interests (both directly and indirectly) made equity investments in the partnership and advanced loans totaling approx. USD 19 million (approx. NIS 68
million) and approx. USD 6 million (approx. NIS 21 million), respectively.
|
| 4 |
Non-recourse project financing, as accepted in agreements of this type.
|
|
As of March 31, 2025
|
||||||||||||||
|
US GAAP
|
Adjustments
|
IFRS
|
||||||||||||
|
In USD thousand
|
In USD thousand
|
In USD thousand
|
||||||||||||
|
Cash and cash equivalents
|
D
|
51
|
15,069
|
15,120
|
||||||||||
|
Restricted cash
|
D
|
19,434
|
(15,069
|
)
|
4,365
|
|||||||||
|
Property, plant & equipment
|
A, C,G
|
556,343
|
(68,580
|
)
|
487,763
|
|||||||||
|
Intangible assets
|
C
|
14,014
|
(14,014
|
)
|
-
|
|||||||||
|
Right‑of‑use assets
|
E
|
86,869
|
132,203
|
219,072
|
||||||||||
|
Other assets
|
F
|
37,686
|
-
|
37,686
|
||||||||||
|
Total assets
|
714,397
|
49,609
|
764,006
|
|||||||||||
|
Accounts payable and deferred expenses
|
A
|
13,692
|
(2,088
|
)
|
11,604
|
|||||||||
|
Long-term lease liability
|
E
|
74,043
|
140,022
|
214,065
|
||||||||||
|
Other liabilities
|
H |
345,093
|
10,466
|
355,559
|
||||||||||
|
Total liabilities
|
432,828
|
148,400
|
581,228
|
|||||||||||
|
Partners’ equity
|
A, E,G
|
281,569
|
(98,791
|
)
|
182,778
|
|||||||||
|
Total liabilities and equity
|
714,397
|
49,609
|
764,006
|
|||||||||||
|
As of March 31, 2024
|
||||||||||||||
|
US GAAP
|
Adjustments
|
IFRS
|
||||||||||||
|
In USD thousand
|
In USD thousand
|
In USD thousand
|
||||||||||||
|
Cash and cash equivalents
|
D |
|
49
|
1,491
|
1,540
|
|||||||||
|
Restricted cash
|
D |
|
3,641
|
(1,491
|
)
|
2,150
|
||||||||
|
|
|
|||||||||||||
|
Property, plant & equipment
|
A, C,G
|
|
576,973
|
(66,852
|
)
|
510,121
|
||||||||
|
Intangible assets
|
C |
|
14,562
|
(14,562
|
)
|
-
|
||||||||
|
Right‑of‑use asset
|
E |
|
88,568
|
139,068
|
227,636
|
|||||||||
|
Other assets
|
F |
|
108,058
|
-
|
108,058
|
|||||||||
|
|
||||||||||||||
|
Total assets
|
|
791,851
|
57,654
|
849,505
|
||||||||||
|
|
||||||||||||||
|
Accounts payable and deferred expenses
|
A |
|
21,119
|
(1,599
|
)
|
19,520
|
||||||||
|
|
|
|||||||||||||
|
Other liabilities
|
E |
|
534,201
|
152,008
|
686,209
|
|||||||||
|
|
||||||||||||||
|
Total liabilities
|
|
555,320
|
150,409
|
705,729
|
||||||||||
|
|
||||||||||||||
|
Partners’ equity
|
A, E, F
|
|
236,531
|
(92,755
|
)
|
143,776
|
||||||||
|
Total liabilities and equity
|
791,851
|
57,654
|
849,505
|
|||||||||||
|
As of December 31, 2024
|
||||||||||||||
|
US GAAP
|
Adjustments
|
IFRS
|
||||||||||||
|
In USD thousand
|
In USD thousand
|
In USD thousand
|
||||||||||||
|
Cash and cash equivalents
|
D
|
49
|
16,098
|
16,147
|
||||||||||
|
Restricted cash
|
D
|
18,308
|
(16,098
|
)
|
2,210
|
|||||||||
|
Property, plant & equipment
|
A, C,G
|
561,594
|
(67,979
|
)
|
493,615
|
|||||||||
|
Intangible assets
|
C
|
14,151
|
(14,151
|
)
|
-
|
|||||||||
|
Right‑of‑use assets
|
E
|
87,301
|
133,961
|
221,262
|
||||||||||
|
Other assets
|
F
|
100,391
|
-
|
100,391
|
||||||||||
|
Total assets
|
781,794
|
51,831
|
833,625
|
|||||||||||
|
Accounts payable and deferred expenses
|
A
|
39,641
|
(2,023
|
)
|
37,618
|
|||||||||
|
Long-term lease liability
|
E
|
74,384
|
140,865
|
215,249
|
||||||||||
|
Other liabilities
|
452,673
|
9,472
|
462,145
|
|||||||||||
|
Total liabilities
|
566,698
|
148,314
|
715,012
|
|||||||||||
|
Partners’ equity
|
A, E,F
|
215,096
|
(96,483
|
)
|
118,613
|
|||||||||
|
Total liabilities and equity
|
781,794
|
51,831
|
833,625
|
|||||||||||
|
For the three-month period ended March 31, 2025
|
||||||||||||||||
|
US GAAP
|
IFRS adjustments
|
IFRS - according to the Group’s accounting policies
|
||||||||||||||
|
In USD thousand
|
In USD thousand
|
In USD thousand
|
||||||||||||||
|
Revenue
|
B |
|
41,364
|
(44
|
)
|
41,320
|
||||||||||
|
Fuels and other
|
E |
|
21,717
|
(3,988
|
)
|
17,729
|
||||||||||
|
Other operating expenses
|
A |
|
12,312
|
(1,281
|
)
|
11,031
|
||||||||||
|
Depreciation and amortization
|
A, E,
|
|
5,496
|
4,863
|
10,359
|
|||||||||||
|
|
||||||||||||||||
|
Operating loss
|
|
1,839
|
362
|
2,201
|
||||||||||||
|
|
||||||||||||||||
|
Finance expenses
|
B, E,H
|
|
8,276
|
2,864
|
11,140
|
|||||||||||
|
|
||||||||||||||||
|
Loss for the period
|
|
(6,437
|
)
|
(2,502
|
)
|
(8,939
|
)
|
|||||||||
|
|
||||||||||||||||
|
Other comprehensive loss
|
B |
|
(7,090
|
)
|
196
|
(6,894
|
)
|
|||||||||
|
Comprehensive loss for the period
|
(13,527
|
)
|
(2,306
|
)
|
(15,833
|
)
|
||||||||||
|
For the three-month period ended March 31, 2024
|
||||||||||||||||
|
US GAAP
|
IFRS adjustments
|
IFRS - according to the Group’s accounting policies
|
||||||||||||||
|
In USD thousand
|
In USD thousand
|
In USD thousand
|
||||||||||||||
|
Revenue
|
B |
|
44,552
|
(441
|
)
|
44,111
|
||||||||||
|
Fuels and other
|
E |
|
31,803
|
(3,987
|
)
|
27,816
|
||||||||||
|
Other operating expenses
|
A |
|
14,869
|
(1,599
|
)
|
13,270
|
||||||||||
|
Depreciation and amortization
|
A, E,G
|
|
5,490
|
4,898
|
10,388
|
|||||||||||
|
|
||||||||||||||||
|
Operating loss
|
|
(7,610
|
)
|
247
|
(7,363
|
)
|
||||||||||
|
|
||||||||||||||||
|
Finance expenses
|
B,E
|
|
6,935
|
3,006
|
9,941
|
|||||||||||
|
|
||||||||||||||||
|
Loss for the period
|
|
(14,545
|
)
|
(2,759
|
)
|
(17,304
|
)
|
|||||||||
|
|
||||||||||||||||
|
Other comprehensive loss
|
B |
|
(8,624
|
)
|
659
|
(7,965
|
)
|
|||||||||
|
Comprehensive loss for the period
|
(23,169
|
)
|
(2,100
|
)
|
(25,269
|
)
|
||||||||||
|
For the year ended December 31, 2024
|
||||||||||||||||
|
US GAAP
|
IFRS adjustments
|
IFRS - according to the Group’s accounting policies
|
||||||||||||||
|
In USD thousand
|
In USD thousand
|
In USD thousand
|
||||||||||||||
|
Revenue
|
B |
|
167,618
|
(704
|
)
|
166,914
|
||||||||||
|
Fuels and other
|
E |
|
100,114
|
(15,946
|
)
|
84,168
|
||||||||||
|
Other operating expenses
|
A |
|
66,577
|
(5,536
|
)
|
61,041
|
||||||||||
|
Depreciation and amortization
|
A, E,G
|
|
21,982
|
15,479
|
37,461
|
|||||||||||
|
|
||||||||||||||||
|
Operating loss
|
|
(21,055
|
)
|
5,299
|
(15,756
|
)
|
||||||||||
|
|
||||||||||||||||
|
Finance expenses
|
B,E
|
|
29,107
|
11,537
|
40,644
|
|||||||||||
|
|
||||||||||||||||
|
Loss for the year
|
|
(50,162
|
)
|
(6,238
|
)
|
(56,400
|
)
|
|||||||||
|
|
||||||||||||||||
|
Other comprehensive income
|
B |
|
5,558
|
1,439
|
6,997
|
|||||||||||
|
|
||||||||||||||||
|
Comprehensive loss for the year
|
(44,604
|
)
|
(4,799
|
)
|
(49,403
|
)
|
||||||||||
|
For the three-month period ended March 31, 2025
|
||||||||||||||
|
US GAAP
|
Adjustments
|
IFRS
|
||||||||||||
|
In USD thousand
|
In USD thousand
|
In USD thousand
|
||||||||||||
|
Loss for the period
|
A, E,B |
(6,437
|
)
|
(2,502
|
)
|
(8,939
|
)
|
|||||||
|
Net cash provided by operating activities
|
(30,402
|
)
|
-
|
(30,402
|
)
|
|||||||||
|
Net cash used for investing activities
|
D
|
(284
|
)
|
72,958
|
72,674
|
|||||||||
|
Net cash provided by financing activities
|
(43,299
|
)
|
-
|
(43,299
|
)
|
|||||||||
|
Net increase in cash and cash equivalents
|
(73,985
|
)
|
72,958
|
(1,027
|
)
|
|||||||||
|
Balance of cash and cash equivalents of the beginning of period
|
D
|
49
|
16,098
|
16,147
|
||||||||||
|
Restricted cash balance as of the beginning of the period
|
D
|
93,421
|
(93,421
|
)
|
-
|
|||||||||
|
Balance of cash and cash equivalents as of the end of the period
|
D
|
51
|
15,069
|
15,120
|
||||||||||
|
Restricted cash balance as of the end of the period
|
D
|
19,434
|
(19,434
|
)
|
-
|
|||||||||
|
For the three-month period ended March 31, 2024
|
||||||||||||||
|
US GAAP
|
Adjustments
|
IFRS
|
||||||||||||
|
In USD thousand
|
In USD thousand
|
In USD thousand
|
||||||||||||
|
Loss for the period
|
A, E,B |
(14,545
|
)
|
(2,759
|
)
|
(17,304
|
)
|
|||||||
|
Net cash used for operating activities
|
(3,859
|
)
|
-
|
(3,859
|
)
|
|||||||||
|
Net cash used for investing activities
|
D
|
-
|
(919
|
)
|
(919
|
)
|
||||||||
|
Net cash provided by financing activities
|
869
|
-
|
869
|
|||||||||||
|
Net decrease in cash and cash equivalents
|
(2,990
|
)
|
(919
|
)
|
(3,909
|
)
|
||||||||
|
Balance of cash and cash equivalents of the beginning of period
|
D
|
48
|
5,400
|
5,448
|
||||||||||
|
Restricted cash balance as of the beginning of the period
|
D
|
77,609
|
(77,609
|
)
|
-
|
|||||||||
|
Balance of cash and cash equivalents as of the end of the period
|
D
|
49
|
1,490
|
1,539
|
||||||||||
|
Restricted cash balance as of the end of the period
|
D
|
74,618
|
(74,618
|
)
|
-
|
|||||||||
|
For the year ended December 31, 2024
|
||||||||||||||
|
US GAAP
|
Adjustments
|
IFRS
|
||||||||||||
|
In USD thousand
|
In USD thousand
|
In USD thousand
|
||||||||||||
|
Loss for the year
|
A, E,B |
(50,162
|
)
|
(6,238
|
)
|
(56,400
|
)
|
|||||||
|
Net cash provided by operating activities
|
11,635
|
-
|
11,635
|
|||||||||||
|
Net cash provided by (used for) investing activities
|
D
|
(526
|
)
|
(5,114
|
)
|
(5,640
|
)
|
|||||||
|
Net cash used for financing activities
|
4,704
|
-
|
4,704
|
|||||||||||
|
Net decrease in cash and cash equivalents
|
15,813
|
(5,114
|
)
|
10,699
|
||||||||||
|
Balance of cash and cash equivalents as of the beginning of the year
|
D
|
48
|
5,400
|
5,448
|
||||||||||
|
Restricted cash balance as of the beginning of the year
|
D
|
77,609
|
(77,609
|
)
|
-
|
|||||||||
|
Balance of cash and cash equivalents as of the end of the year
|
D
|
49
|
16,098
|
16,147
|
||||||||||
|
Restricted cash balance as of the end of the year
|
D
|
93,421
|
(93,421
|
)
|
-
|
|||||||||
|
As of March 31, 2025
|
||||||||||||||
|
US GAAP
|
Adjustments
|
IFRS
|
||||||||||||
|
In USD thousand
|
In USD thousand
|
In USD thousand
|
||||||||||||
|
Cash and cash equivalents
|
D
|
76
|
168
|
244
|
||||||||||
|
Restricted cash
|
D
|
6,638
|
(168
|
)
|
6,470
|
|||||||||
|
Property, plant & equipment
|
A,C
|
790,334
|
57,394
|
847,728
|
||||||||||
|
Intangible assets
|
C
|
25,666
|
(25,666
|
)
|
-
|
|||||||||
|
Other assets
|
39,485
|
-
|
39,485
|
|||||||||||
|
Total assets
|
862,199
|
31,728
|
893,927
|
|||||||||||
|
Accounts payable and deferred expenses
|
A
|
14,263
|
(6,760
|
)
|
7,503
|
|||||||||
|
Other liabilities
|
527,260
|
(8,555
|
)
|
518,705
|
||||||||||
|
Total liabilities
|
541,523
|
(15,315
|
)
|
526,208
|
||||||||||
|
Partners’ equity
|
A
|
320,676
|
47,043
|
367,719
|
||||||||||
|
Total liabilities and equity
|
862,199
|
31,728
|
893,927
|
|||||||||||
|
As of March 31, 2024
|
||||||||||||||
|
US GAAP
|
Adjustments
|
IFRS
|
||||||||||||
|
In USD thousand
|
In USD thousand
|
In USD thousand
|
||||||||||||
|
Cash and cash equivalents
|
D
|
82
|
2,652
|
2,734
|
||||||||||
|
Restricted cash
|
D
|
2,743
|
(2,652
|
)
|
91
|
|||||||||
|
Property, plant & equipment
|
A,C
|
811,580
|
56,689
|
868,269
|
||||||||||
|
Intangible assets
|
C
|
26,536
|
(26,536
|
)
|
-
|
|||||||||
|
Other assets
|
66,307
|
-
|
66,307
|
|||||||||||
|
Total assets
|
907,248
|
30,153
|
937,401
|
|||||||||||
|
Accounts payable and deferred expenses
|
A
|
14,673
|
(6,722
|
)
|
7,951
|
|||||||||
|
Other liabilities
|
372,009
|
350
|
372,359
|
|||||||||||
|
Total liabilities
|
386,682
|
(6,372
|
)
|
380,310
|
||||||||||
|
Partners’ equity
|
A
|
520,566
|
36,525
|
557,091
|
||||||||||
|
Total liabilities and equity
|
907,248
|
30,153
|
937,401
|
|||||||||||
|
As of December 31, 2024
|
||||||||||||||
|
US GAAP
|
Adjustments
|
IFRS
|
||||||||||||
|
In USD thousand
|
In USD thousand
|
In USD thousand
|
||||||||||||
|
Cash and cash equivalents
|
D
|
43
|
444
|
487
|
||||||||||
|
Restricted cash
|
D
|
4,793
|
(444
|
)
|
4,349
|
|||||||||
|
Property, plant & equipment
|
A,C
|
797,304
|
57,331
|
854,635
|
||||||||||
|
Intangible assets
|
C
|
25,883
|
(25,883
|
)
|
-
|
|||||||||
|
Other assets
|
36,526
|
-
|
36,526
|
|||||||||||
|
Total assets
|
864,549
|
31,448
|
895,997
|
|||||||||||
|
Accounts payable and deferred expenses
|
A
|
13,820
|
(6,360
|
)
|
7,460
|
|||||||||
|
Other liabilities
|
530,317
|
-
|
530,317
|
|||||||||||
|
Total liabilities
|
544,137
|
(6,360
|
)
|
537,777
|
||||||||||
|
Partners’ equity
|
A
|
320,412
|
37,808
|
358,220
|
||||||||||
|
Total liabilities and equity
|
864,549
|
31,448
|
895,997
|
|||||||||||
|
For the three-month period ended March 31, 2025
|
||||||||||||||||||
|
US GAAP
|
IFRS adjustments
|
Adjustments to the Group’s accounting policies*
|
IFRS - according to the Group’s accounting policies
|
|||||||||||||||
|
In USD thousand
|
In USD thousand
|
In USD thousand
|
In USD thousand
|
|||||||||||||||
|
Revenue
|
B
|
112,375
|
(1,976
|
)
|
(6,421
|
)
|
103,978
|
|||||||||||
|
Operating expenses
|
A
|
64,639
|
(2,446
|
)
|
(6,421
|
)
|
55,772
|
|||||||||||
|
Depreciation and amortization
|
A
|
6,943
|
1,765
|
-
|
8,708
|
|||||||||||||
|
Operating profit
|
40,793
|
(1,295
|
)
|
-
|
39,498
|
|||||||||||||
|
Finance expenses
|
B,H
|
9,833
|
(9,326
|
)
|
-
|
507
|
||||||||||||
|
Profit for the period
|
30,960
|
8,031
|
-
|
38,991
|
||||||||||||||
|
Other comprehensive loss
|
B
|
(13,196
|
)
|
1,205
|
-
|
(11,991
|
)
|
|||||||||||
|
Comprehensive income for the period
|
17,764
|
9,236
|
-
|
27,000
|
||||||||||||||
|
For the three-month period ended March 31, 2024
|
||||||||||||||||||
|
US GAAP
|
IFRS adjustments
|
Adjustments to the Group’s accounting policies*
|
IFRS - according to the Group’s accounting policies
|
|||||||||||||||
|
In USD thousand
|
In USD thousand
|
In USD thousand
|
In USD thousand
|
|||||||||||||||
|
Revenue
|
B
|
82,926
|
(1,473
|
)
|
3,321
|
84,774
|
||||||||||||
|
Operating expenses
|
A
|
39,292
|
(2,419
|
)
|
3,321
|
40,194
|
||||||||||||
|
Depreciation and amortization
|
A
|
6,860
|
1,766
|
-
|
8,626
|
|||||||||||||
|
Operating profit
|
36,774
|
(820
|
)
|
-
|
35,954
|
|||||||||||||
|
Finance expenses
|
B
|
2,898
|
(2,167
|
)
|
-
|
731
|
||||||||||||
|
Profit for the period
|
33,876
|
1,347
|
-
|
35,223
|
||||||||||||||
|
Other comprehensive loss
|
B
|
(5,587
|
)
|
(624
|
)
|
-
|
(6,211
|
)
|
||||||||||
|
Comprehensive income for the period
|
28,289
|
723
|
-
|
29,012
|
||||||||||||||
|
For the year ended December 31, 2024
|
||||||||||||||||||
|
US GAAP
|
IFRS adjustments
|
Adjustments to the Group’s accounting policies*
|
IFRS - according to the Group’s accounting policies
|
|||||||||||||||
|
In USD thousand
|
In USD thousand
|
In USD thousand
|
In USD thousand
|
|||||||||||||||
|
Revenue
|
B
|
275,102
|
(2,854
|
)
|
27,083
|
299,331
|
||||||||||||
|
Operating expenses
|
A
|
121,590
|
(8,648
|
)
|
27,083
|
140,025
|
||||||||||||
|
Depreciation and amortization
|
A
|
27,485
|
7,062
|
-
|
34,547
|
|||||||||||||
|
Operating profit
|
126,027
|
(1,268
|
)
|
-
|
124,759
|
|||||||||||||
|
Finance expenses
|
B
|
27,325
|
(5,185
|
)
|
-
|
22,140
|
||||||||||||
|
Profit for the year
|
98,702
|
3,917
|
-
|
102,619
|
||||||||||||||
|
Other comprehensive income
|
B
|
9,533
|
(1,911
|
)
|
-
|
7,622
|
||||||||||||
|
Comprehensive income for the year
|
108,235
|
2,006
|
-
|
110,241
|
||||||||||||||
|
For the three-month period ended March 31, 2025
|
||||||||||||||
|
US GAAP
|
Adjustments
|
IFRS
|
||||||||||||
|
In USD thousand
|
In USD thousand
|
In USD thousand
|
||||||||||||
|
Profit for the period
|
A, B, H
|
30,960
|
8,031
|
38,991
|
||||||||||
|
Net cash provided by operating activities
|
37,664
|
-
|
37,664
|
|||||||||||
|
Net cash used for investing activities
|
D
|
-
|
(2,121
|
)
|
(2,121
|
)
|
||||||||
|
Net cash used for financing activities
|
(35,786
|
)
|
-
|
(35,786
|
)
|
|||||||||
|
Net increase (decrease) in cash and cash equivalents
|
1,878
|
(2,121
|
)
|
(243
|
)
|
|||||||||
|
Balance of cash and cash equivalents of the beginning of period
|
D
|
43
|
444
|
487
|
||||||||||
|
Restricted cash balance as of the beginning of the period
|
D
|
4,793
|
(4,793
|
)
|
-
|
|||||||||
|
Balance of cash and cash equivalents as of the end of the period
|
D
|
76
|
168
|
244
|
||||||||||
|
Restricted cash balance as of the end of the period
|
D
|
6,638
|
(6,638
|
)
|
-
|
|||||||||
|
For the three-month period ended March 31, 2024
|
||||||||||||||
|
US GAAP
|
Adjustments
|
IFRS
|
||||||||||||
|
In USD thousand
|
In USD thousand
|
In USD thousand
|
||||||||||||
|
Profit for the period
|
A, B |
33,876
|
1,347
|
35,223
|
||||||||||
|
Net cash provided by operating activities
|
41,167
|
-
|
41,167
|
|||||||||||
|
Net cash provided by (used for) investing activities
|
D
|
(907
|
)
|
2,826
|
1,919
|
|||||||||
|
Net cash used for financing activities
|
(40,670
|
)
|
-
|
(40,670
|
)
|
|||||||||
|
Net increase (decrease) in cash and cash equivalents
|
(410
|
)
|
2,826
|
2,416
|
||||||||||
|
Balance of cash and cash equivalents of the beginning of period
|
D
|
52
|
265
|
317
|
||||||||||
|
Restricted cash balance as of the beginning of the period
|
D
|
28,328
|
(28,328
|
)
|
-
|
|||||||||
|
Balance of cash and cash equivalents as of the end of the period
|
D
|
82
|
2,651
|
2,733
|
||||||||||
|
Restricted cash balance as of the end of the period
|
D
|
27,888
|
(27,888
|
)
|
-
|
|||||||||
|
For the year ended December 31, 2024
|
||||||||||||||
|
US GAAP
|
Adjustments
|
IFRS
|
||||||||||||
|
In USD thousand
|
In USD thousand
|
In USD thousand
|
||||||||||||
|
Profit for the year
|
A, B |
98,702
|
3,917
|
102,619
|
||||||||||
|
Net cash provided by operating activities
|
125,851
|
-
|
125,851
|
|||||||||||
|
Net cash provided by (used for) investing activities
|
D
|
(11,286
|
)
|
23,714
|
12,428
|
|||||||||
|
Net cash used for financing activities
|
(138,109
|
)
|
-
|
(138,109
|
)
|
|||||||||
|
Net increase (decrease) in cash and cash equivalents
|
(23,544
|
)
|
23,714
|
170
|
||||||||||
|
Balance of cash and cash equivalents as of the beginning of the year
|
D
|
52
|
265
|
317
|
||||||||||
|
Restricted cash balance as of the beginning of the year
|
D
|
28,328
|
(28,328
|
)
|
-
|
|||||||||
|
Balance of cash and cash equivalents as of the end of the year
|
D
|
43
|
444
|
487
|
||||||||||
|
Restricted cash balance as of the end of the year
|
D
|
4,793
|
(4,793
|
)
|
-
|
|||||||||
|
As of March 31, 2025
|
||||||||||||||
|
US GAAP
|
Adjustments
|
IFRS
|
||||||||||||
|
In USD thousand
|
In USD thousand
|
In USD thousand
|
||||||||||||
|
Cash and cash equivalents
|
D
|
99
|
3,881
|
3,980
|
||||||||||
|
Restricted cash
|
D
|
29,962
|
(3,881
|
)
|
26,081
|
|||||||||
|
Property, plant & equipment
|
A,C
|
711,567
|
78,711
|
790,278
|
||||||||||
|
Intangible assets
|
C
|
46,946
|
(46,946
|
)
|
-
|
|||||||||
|
Other assets
|
E |
63,739
|
(3
|
)
|
63,736
|
|||||||||
|
Total assets
|
852,313
|
31,762
|
884,075
|
|||||||||||
|
Accounts payable and deferred expenses
|
A
|
22,175
|
(2,351
|
)
|
19,824
|
|||||||||
|
Other liabilities
|
270,941
|
(422
|
)
|
270,519
|
||||||||||
|
Total liabilities
|
293,116
|
(2,773
|
)
|
290,343
|
||||||||||
|
Partners’ equity
|
A
|
559,197
|
34,535
|
593,732
|
||||||||||
|
Total liabilities and equity
|
852,313
|
31,762
|
884,075
|
|||||||||||
|
As of March 31, 2024
|
||||||||||||||
|
US GAAP
|
Adjustments
|
IFRS
|
||||||||||||
|
In USD thousand
|
In USD thousand
|
In USD thousand
|
||||||||||||
|
Cash and cash equivalents
|
D
|
98
|
865
|
963
|
||||||||||
|
Restricted cash
|
D
|
947
|
(865
|
)
|
82
|
|||||||||
|
Property, plant & equipment
|
A,C
|
734,659
|
80,636
|
815,295
|
||||||||||
|
Intangible assets
|
C
|
50,455
|
(50,455
|
)
|
-
|
|||||||||
|
Other assets
|
125,911
|
-
|
125,911
|
|||||||||||
|
Total assets
|
912,070
|
30,181
|
942,251
|
|||||||||||
|
Accounts payable and deferred expenses
|
A
|
9,976
|
(2,368
|
)
|
7,608
|
|||||||||
|
Other liabilities
|
H |
382,650
|
(88
|
)
|
382,562
|
|||||||||
|
Total liabilities
|
392,626
|
(2,456
|
)
|
390,170
|
||||||||||
|
Partners’ equity
|
A
|
519,444
|
32,637
|
552,081
|
||||||||||
|
Total liabilities and equity
|
912,070
|
30,181
|
942,251
|
|||||||||||
|
As of December 31, 2024
|
||||||||||||||
|
US GAAP
|
Adjustments
|
IFRS
|
||||||||||||
|
In USD thousand
|
In USD thousand
|
In USD thousand
|
||||||||||||
|
Cash and cash equivalents
|
D
|
99
|
8,969
|
9,068
|
||||||||||
|
Restricted cash
|
D
|
29,631
|
(8,969
|
)
|
20,662
|
|||||||||
|
Property, plant & equipment
|
A,C
|
717,309
|
79,455
|
796,764
|
||||||||||
|
Intangible assets
|
C
|
47,824
|
(47,824
|
)
|
-
|
|||||||||
|
Other assets
|
70,362
|
-
|
70,362
|
|||||||||||
|
Total assets
|
865,225
|
31,631
|
896,856
|
|||||||||||
|
Accounts payable and deferred expenses
|
A
|
39,630
|
(2,207
|
)
|
37,423
|
|||||||||
|
Other liabilities
|
H |
266,468
|
(450
|
)
|
266,018
|
|||||||||
|
Total liabilities
|
306,098
|
(2,657
|
)
|
303,441
|
||||||||||
|
Partners’ equity
|
A
|
559,127
|
34,288
|
593,415
|
||||||||||
|
Total liabilities and equity
|
865,225
|
31,631
|
896,856
|
|||||||||||
|
For the three-month period ended March 31, 2025
|
||||||||||||||
|
US GAAP
|
IFRS adjustments
|
IFRS - according to the Group’s accounting policies
|
||||||||||||
|
In USD thousand
|
In USD thousand
|
In USD thousand
|
||||||||||||
|
Revenue
|
B
|
151,072
|
221
|
151,293
|
||||||||||
|
Operating expenses
|
A,E
|
99,711
|
(2,383
|
)
|
97,328
|
|||||||||
|
Depreciation and amortization
|
A,E
|
7,249
|
2,091
|
9,340
|
||||||||||
|
Operating profit
|
44,112
|
513
|
44,625
|
|||||||||||
|
Finance expenses
|
B,E
|
4,185
|
(595
|
)
|
3,590
|
|||||||||
|
Profit for the period
|
39,927
|
1,108
|
41,035
|
|||||||||||
|
Other comprehensive loss
|
B
|
(4,857
|
)
|
(860
|
)
|
(5,717
|
)
|
|||||||
|
Comprehensive income for the period
|
35,070
|
248
|
35,318
|
|||||||||||
|
For the three-month period ended March 31, 2024
|
||||||||||||||
|
US GAAP
|
IFRS adjustments
|
IFRS - according to the Group’s accounting policies
|
||||||||||||
|
In USD thousand
|
In USD thousand
|
In USD thousand
|
||||||||||||
|
Revenue
|
B
|
134,344
|
(15,207
|
)
|
119,137
|
|||||||||
|
Operating expenses
|
A,E
|
83,392
|
(2,367
|
)
|
81,025
|
|||||||||
|
Depreciation and amortization
|
A,E
|
7,227
|
1,402
|
8,629
|
||||||||||
|
Operating profit
|
43,725
|
(14,242
|
)
|
29,483
|
||||||||||
|
Finance expenses
|
B,E
|
4,439
|
(1,082
|
)
|
3,357
|
|||||||||
|
Profit for the period
|
39,286
|
(13,160
|
)
|
26,126
|
||||||||||
|
Other comprehensive loss
|
B
|
(19,144
|
)
|
14,107
|
(5,037
|
)
|
||||||||
|
Comprehensive income for the period
|
20,142
|
947
|
21,089
|
|||||||||||
|
For the year ended December 31, 2024
|
||||||||||||||
|
US GAAP
|
IFRS adjustments
|
IFRS - according to the Group’s accounting policies
|
||||||||||||
|
In USD thousand
|
In USD thousand
|
In USD thousand
|
||||||||||||
|
Revenue
|
B
|
437,675
|
(18,991
|
)
|
418,684
|
|||||||||
|
Operating expenses
|
A,E
|
257,262
|
(8,779
|
)
|
248,483
|
|||||||||
|
Depreciation and amortization
|
A,E
|
28,927
|
6,515
|
35,442
|
||||||||||
|
Operating profit
|
151,486
|
(16,727
|
)
|
134,759
|
||||||||||
|
Finance expenses
|
B,E
|
19,316
|
(4,222
|
)
|
15,094
|
|||||||||
|
Profit for the year
|
132,170
|
(12,505
|
)
|
119,665
|
||||||||||
|
Other comprehensive loss
|
B
|
(24,345
|
)
|
15,102
|
(9,243
|
)
|
||||||||
|
Comprehensive income for the year
|
107,825
|
2,597
|
110,422
|
|||||||||||
|
For the three-month period ended March 31, 2025
|
||||||||||||||
|
US GAAP
|
Adjustments
|
IFRS
|
||||||||||||
|
In USD thousand
|
In USD thousand
|
In USD thousand
|
||||||||||||
|
Profit for the period
|
A,B |
39,927
|
1,108
|
41,035
|
||||||||||
|
Net cash provided by operating activities
|
41,382
|
-
|
41,382
|
|||||||||||
|
Net cash used for investing activities
|
D
|
(630
|
)
|
(5,419
|
)
|
(6,049
|
)
|
|||||||
|
Net cash used for financing activities
|
(40,421
|
)
|
-
|
(40,421
|
)
|
|||||||||
|
Net increase (decrease) in cash and cash equivalents
|
331
|
(5,419
|
)
|
(5,088
|
)
|
|||||||||
|
Balance of cash and cash equivalents of the beginning of period
|
D
|
99
|
8,969
|
9,068
|
||||||||||
|
Restricted cash balance as of the beginning of the period
|
D
|
29,631
|
(29,631
|
)
|
-
|
|||||||||
|
Balance of cash and cash equivalents as of the end of the period
|
D
|
99
|
3,881
|
3,980
|
||||||||||
|
Restricted cash balance as of the end of the period
|
D
|
29,962
|
(29,962
|
)
|
-
|
|||||||||
|
For the three-month period ended March 31, 2024
|
||||||||||||||
|
US GAAP
|
Adjustments
|
IFRS
|
||||||||||||
|
In USD thousand
|
In USD thousand
|
In USD thousand
|
||||||||||||
|
Profit for the period
|
A,B |
39,286
|
(13,160
|
)
|
26,126
|
|||||||||
|
Net cash provided by operating activities
|
41,784
|
-
|
41,784
|
|||||||||||
|
Net cash used for investing activities
|
D
|
(119
|
)
|
(1,311
|
)
|
(1,430
|
)
|
|||||||
|
Net cash used for financing activities
|
(41,437
|
)
|
-
|
(41,437
|
)
|
|||||||||
|
Net increase (decrease) in cash and cash equivalents
|
228
|
(1,311
|
)
|
(1,083
|
)
|
|||||||||
|
Balance of cash and cash equivalents of the beginning of period
|
D
|
100
|
1,946
|
2,046
|
||||||||||
|
Restricted cash balance as of the beginning of the period
|
D
|
46,767
|
(46,767
|
)
|
-
|
|||||||||
|
Balance of cash and cash equivalents as of the end of the period
|
D
|
98
|
865
|
963
|
||||||||||
|
Restricted cash balance as of the end of the period
|
D
|
46,997
|
(46,997
|
)
|
-
|
|||||||||
|
For the year ended December 31, 2024
|
||||||||||||||
|
US GAAP
|
Adjustments
|
IFRS
|
||||||||||||
|
In USD thousand
|
In USD thousand
|
In USD thousand
|
||||||||||||
|
Profit for the year
|
A,B |
132,170
|
(12,505
|
)
|
119,665
|
|||||||||
|
Net cash provided by operating activities
|
164,646
|
-
|
164,646
|
|||||||||||
|
Net cash provided by (used for) investing activities
|
D
|
(1,882
|
)
|
24,159
|
22,277
|
|||||||||
|
Net cash used for financing activities
|
(179,901
|
)
|
-
|
(179,901
|
)
|
|||||||||
|
Net increase (decrease) in cash and cash equivalents
|
(17,137
|
)
|
24,159
|
7,022
|
||||||||||
|
Balance of cash and cash equivalents as of the beginning of the year
|
D
|
100
|
1,946
|
2,046
|
||||||||||
|
Restricted cash balance as of the beginning of the year
|
D
|
46,767
|
(46,767
|
)
|
-
|
|||||||||
|
Balance of cash and cash equivalents as of the end of the year
|
D
|
99
|
8,969
|
9,068
|
||||||||||
|
Restricted cash balance as of the end of the year
|
D
|
29,631
|
(29,631
|
)
|
-
|
|||||||||
|
|
A. |
Maintenance costs under the Long Term Maintenance Plan (hereinafter - the “LTPC Agreement”): under IFRS, variable payments which were paid in accordance with the milestones as set in the LTPC Agreement are capitalized to the cost of
property, plant and equipment and amortized over the period from the date on which maintenance work was carried out until the date on which maintenance work is due to take place again. Under US GAAP, the said payments are recognized on
payment date within current expenses in the statement of income.
|
|
|
B. |
Hedge effectiveness of swaps: in accordance with the IFRS - the associates recognize adjustments relating to the ineffective portion of their cash flow hedge under profit and loss. Under US GAAP, there is no part which is not effective,
and the hedging results are recognized in full in other comprehensive income.
|
|
|
C. |
Intangible assets: Under IFRS, certain intangible assets are defined as property, plant and equipment.
|
|
|
D. |
Restricted cash: There is a difference between the presentation and classification of restricted cash in the cash flow statements and in the statements of financial position.
|
|
|
E. |
Right-of-use assets: In IFRS, certain contracts are classified as leases. Under US GAAP, these contracts do not meet the definition of lease contracts, and are recorded as an operating expense.
|
|
|
F. |
Certain compound financial instruments are classified in full as financial derivatives in IFRS. Under US GAAP, these financial instruments are bifurcated between financial derivatives and non-derivative
financial instruments.
|
|
|
G. |
Property, plant and equipment in Shore: In Shore’s financial statements the property, plant, and equipment is presented at historical cost. The adjustments to property, plant and equipment include, in addition to Sections A and C above,
the allocation of excess cost carried out on the acquisition date of CPV Group.
|
|
|
H. |
Changes in financing and refinancing agreements: In cases where the Group has made a change in conditions of existing loans and the change is immaterial, in accordance with IFRS 9, the carrying value of the loans has been adjusted to
reflect the present value of the updated contractual cash flows, discounted according to the original effective interest rate. The difference resulting from this adjustment was immediately recognized in the income statement. Under US
GAAP, there was no effect on profit or loss date on which the terms and conditions were changed.
|