| Exhibit |
Description
|
|
NAYAX LTD.
|
|||
|
|
By:
|
/s/ Gal Omer | |
|
Name: Gal Omer
|
|||
|
Title: Chief Legal Officer
|
|||
|
|
(1) |
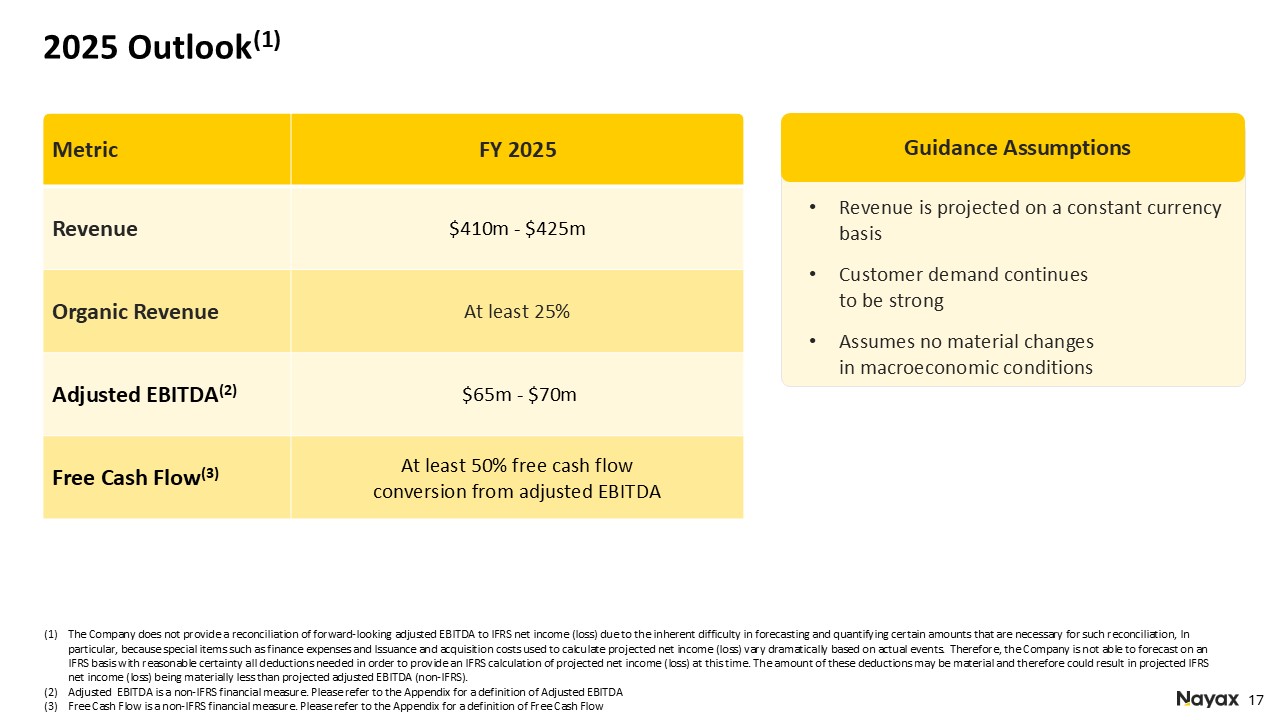
Adjusted EBITDA and Free Cash Flow are non-IFRS financial measures. Please refer to the tables at the end of this press release for a reconciliation of adjusted EBITDA and Free cash flow to the most directly comparable IFRS measure. The
Company does not provide a reconciliation of forward-looking adjusted EBITDA to IFRS net income (loss) due to the inherent difficulty in forecasting and quantifying certain amounts that are necessary for such reconciliation, in particular,
because special items such as finance expenses and Issuance and acquisition costs used to calculate projected net income (loss) vary dramatically based on actual events. Therefore, the Company is not able to forecast on an IFRS basis with
reasonable certainty all deductions needed in order to provide an IFRS calculation of projected net income (loss) at this time. The amount of these deductions may be material and therefore could result in projected IFRS net income (loss)
being materially less than projected adjusted EBITDA (non-IFRS).
|
|
Revenue Summary
|
Q1 2025 ($M)
|
Q1 2024 ($M)
|
Growth (%)
|
|
Payment processing fees
|
36.9
|
28.3
|
30.4%
|
|
SaaS revenue
|
25.3
|
17.9
|
41.3%
|
|
Total recurring revenue (1)
|
62.2
|
46.2
|
34.6%
|
|
POS devices revenue (2)
|
18.9
|
17.8
|
6.2%
|
|
Total revenue (3)
|
81.1
|
64.0
|
26.7%
|
|
Margin Summary
|
Q1 2025
|
Q1 2024
|
Variance
|
|
Payment processing margin
|
35.8%
|
32.9%
|
2.9%
|
|
SaaS margin
|
75.9%
|
77.4%
|
-1.5%
|
|
Total recurring margin
|
52.1%
|
50.1%
|
2.0%
|
|
POS devices margin
|
39.5%
|
27.3%
|
12.2%
|
|
Total margin
|
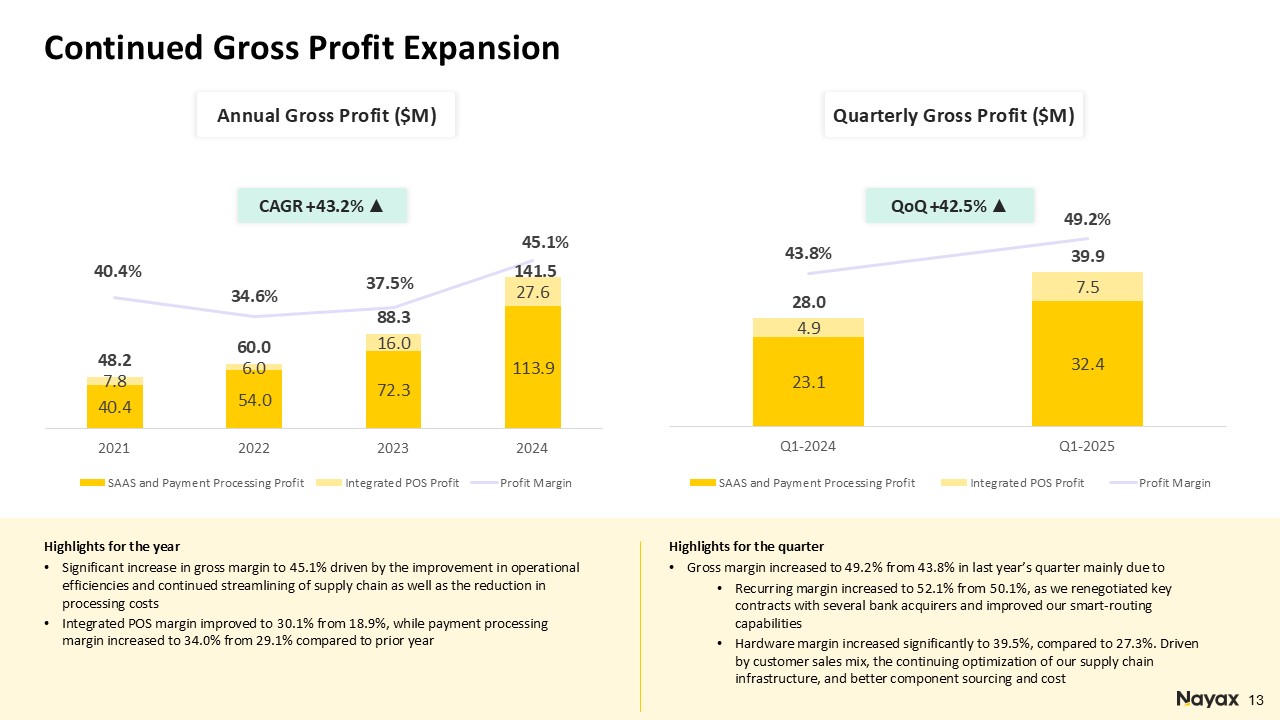
49.2%
|
43.8%
|
5.4%
|
|
|
• |
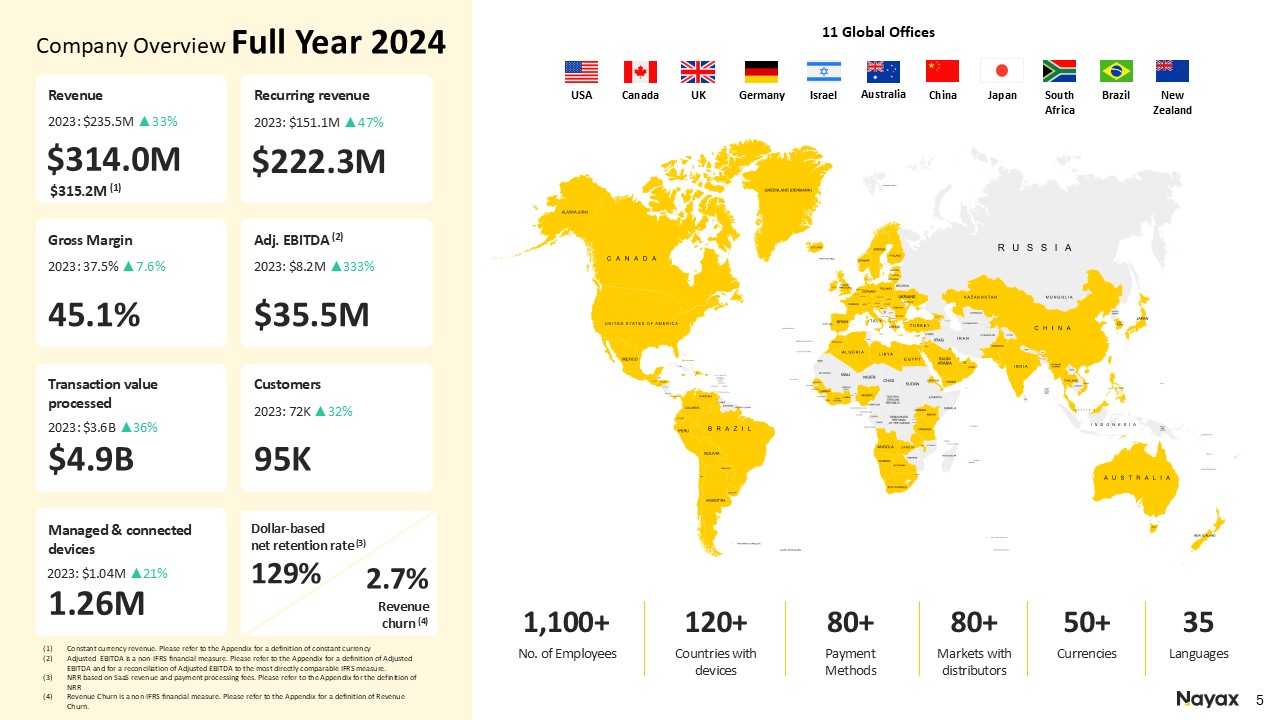
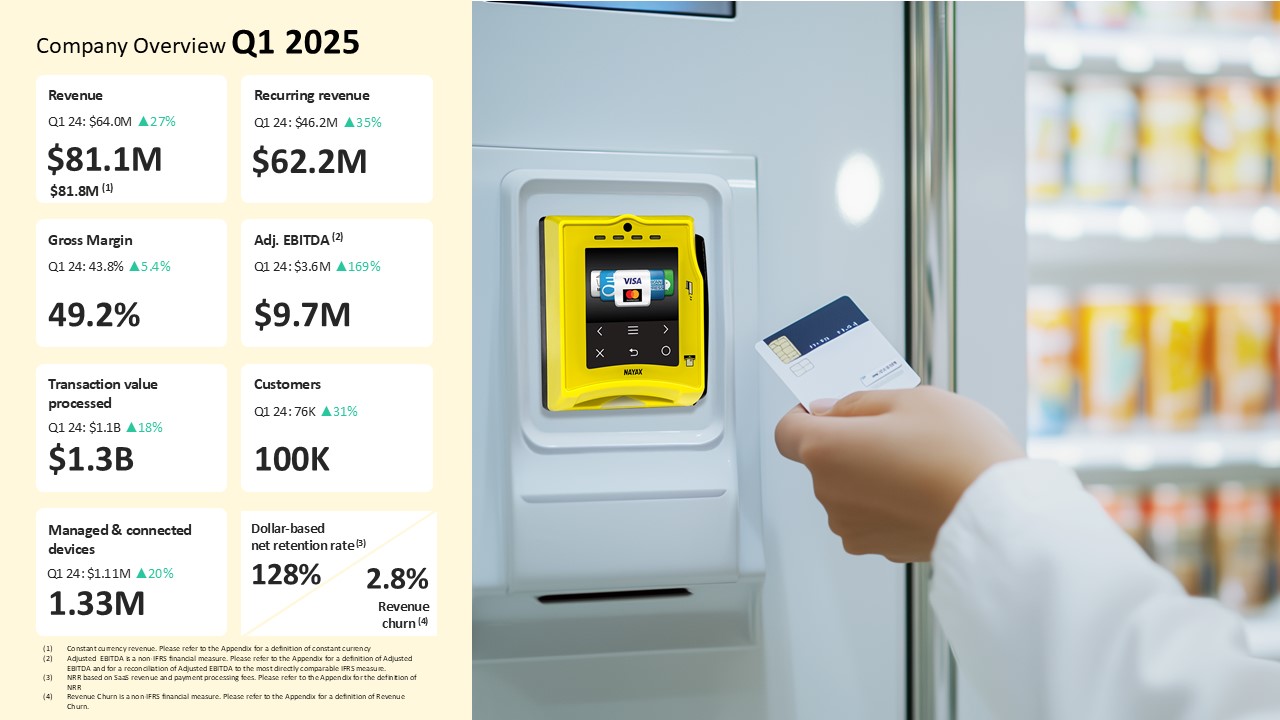
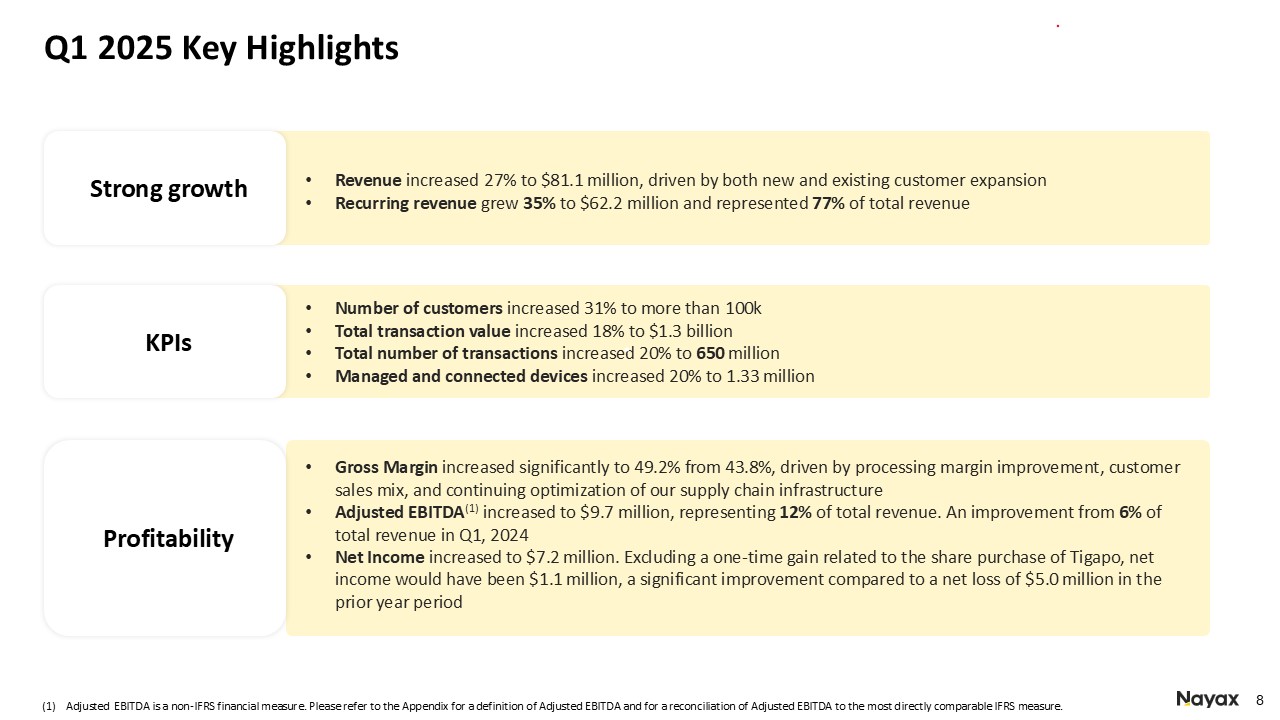
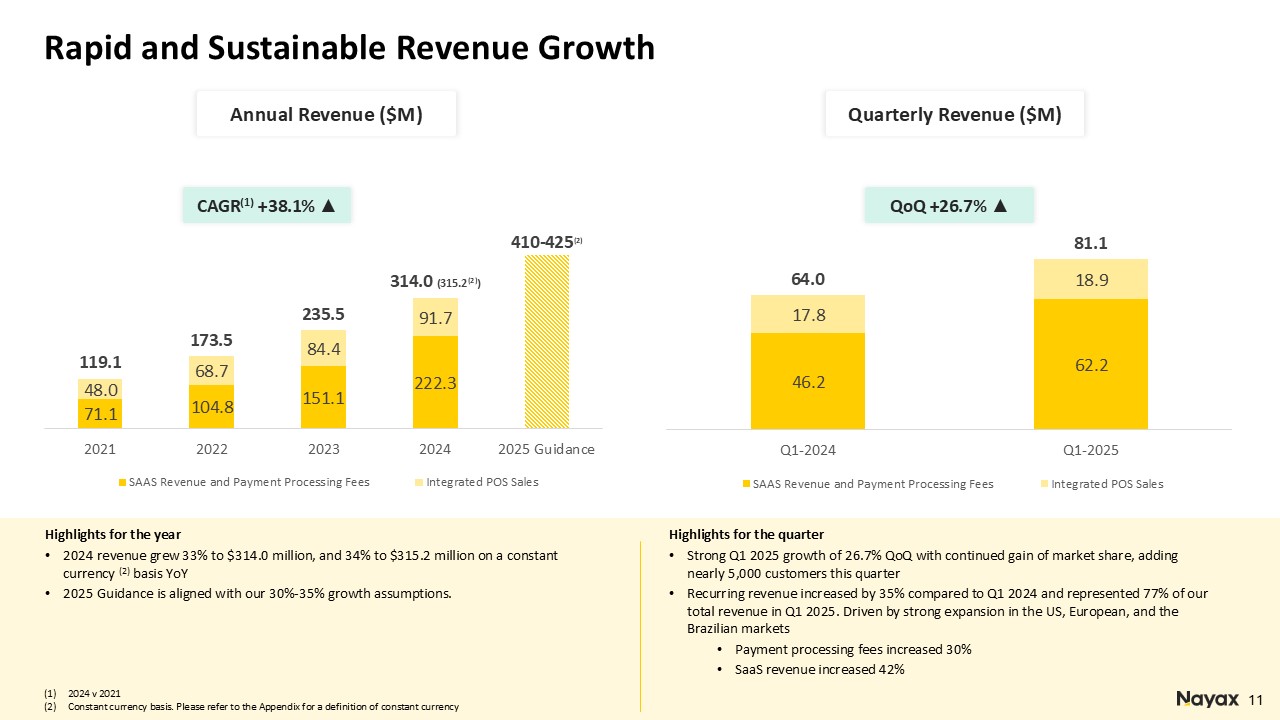
Revenue increased 27% to $81.1 million from $64.0 million in the prior year period.
|
|
|
• |
Revenue at constant currency increased 28% to nearly $82 million.
|
|
|
• |
Organic revenue growth for the quarter was 18%.
|
|
|
• |
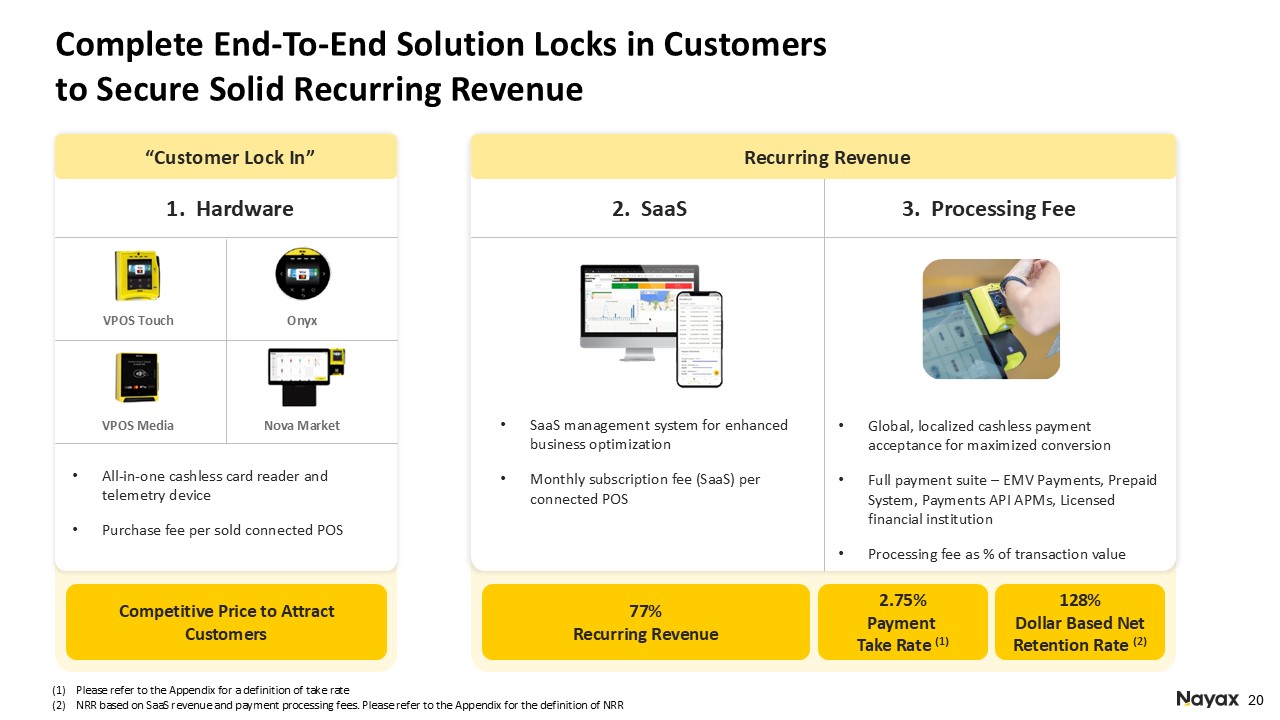
Recurring revenue from SaaS and payment processing fees grew 35%, demonstrating the strength and resilience of our business model. Recurring revenue represented 77% of total revenue.
|
|
|
• |
Hardware revenues were $19 million, increased of 6% with strong demand for our products, solutions and technology, supporting both the unattended and attended markets.
|
|
|
• |
Gross margin improved significantly to 49.2% from 43.8%. This was primarily due to:
|
|
|
o |
Recurring margin improving to 52.1% from 50.1%, partly from renegotiated contracts with several bank acquirers and the Company’s improved smart-routing capabilities.
|
|
|
o |
Hardware margin rose to 39.5% from 27.3% driven by customer sales mix, continuing optimization of our supply chain infrastructure, and better component sourcing and cost.
|
|
|
• |
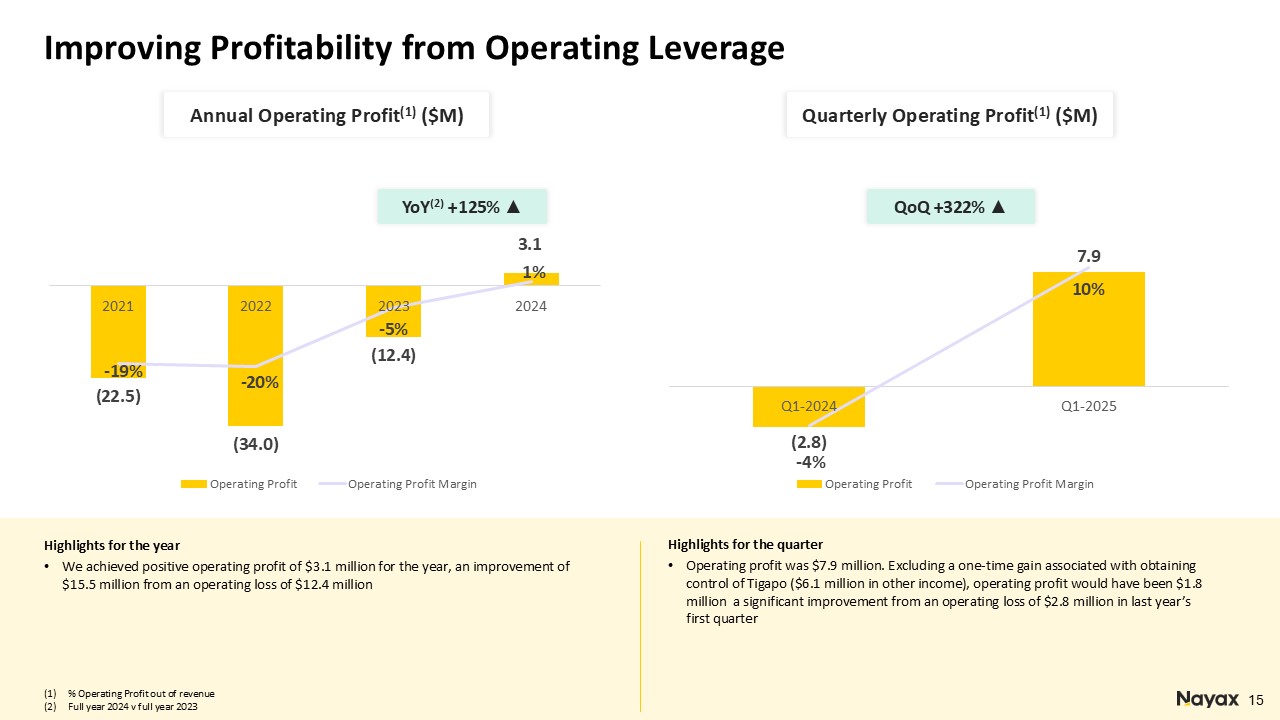
Operating profit was $7.9 million and includes a one-time $6.1 million dollars gain from share purchase of Tigapo Ltd. Excluding this one-time gain, operating profit would have been $1.8 million dollars, an improvement of $4.6 million
dollars from an operating loss of $2.8 million dollars in last year’ first quarter.
|
|
|
• |
Net income for the quarter was $7.2 million dollars. Excluding the one-time gain associated with Tigapo, net income would have been $1.1 million dollars, a significant improvement of $6.1 million dollars compared to a net loss of $5.0
million dollars in the prior year period.
|
|
|
• |
Basic and diluted earnings per share for the quarter ended March 31, 2025 was $0.195 and $0.192, respectively. The basic loss per share for the quarter ended March 31, 2024 was $(0.147) per share.
|
|
|
• |
Weighted average number of basic and diluted shares were 36,712,748 and 37,267,022, respectively, for the first quarter of 2025, compared the weighted average number of basic shares 33,881,629 for the first quarter of 2024.
|
|
|
• |
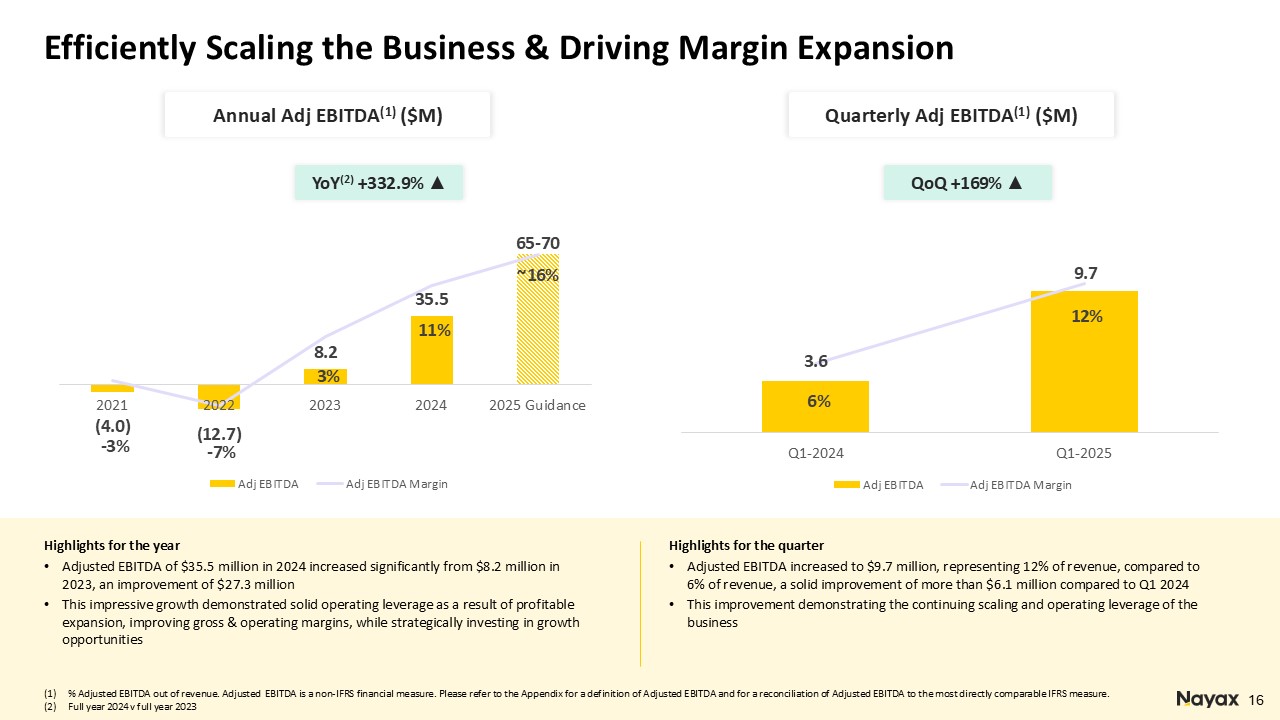
Adjusted EBITDA was $9.7 million, representing a margin of 12% of total revenue. This was an improvement of $6.1 million compared to 6% in the prior year period.
|
|
|
• |
Cash flow from operating activities of $1.3 million while free cash flow was negative $5.7 million mainly due to the timing of cash settlement from processing activities.
|
|
|
• |
In March, Nayax completed a note and warrant offering and raised $133.0 million.
|
|
|
• |
As of March 31, 2025, the Company had $176.8 million in cash and cash equivalents and short-term deposits. Short-term and long-term debt balances was at $142.4 million.
|
|
Key Performance Indicators
|
Q1 2025
|
Q1 2024
|
Growth (%)
|
|
Total transaction value ($m)
|
1,300
|
1,100
|
18.2%
|
|
Number of processed transactions (millions)
|
650
|
540
|
20.4%
|
|
Take rate (payments) (4)
|
2.75%
|
2.65%
|
0.1%
|
|
Managed and connected devices (thousands) (5)
|
1,329
|
1,108
|
19.9%
|
|
Customers (6)
|
100,021
|
76,358
|
31.0%
|
|
|
• |
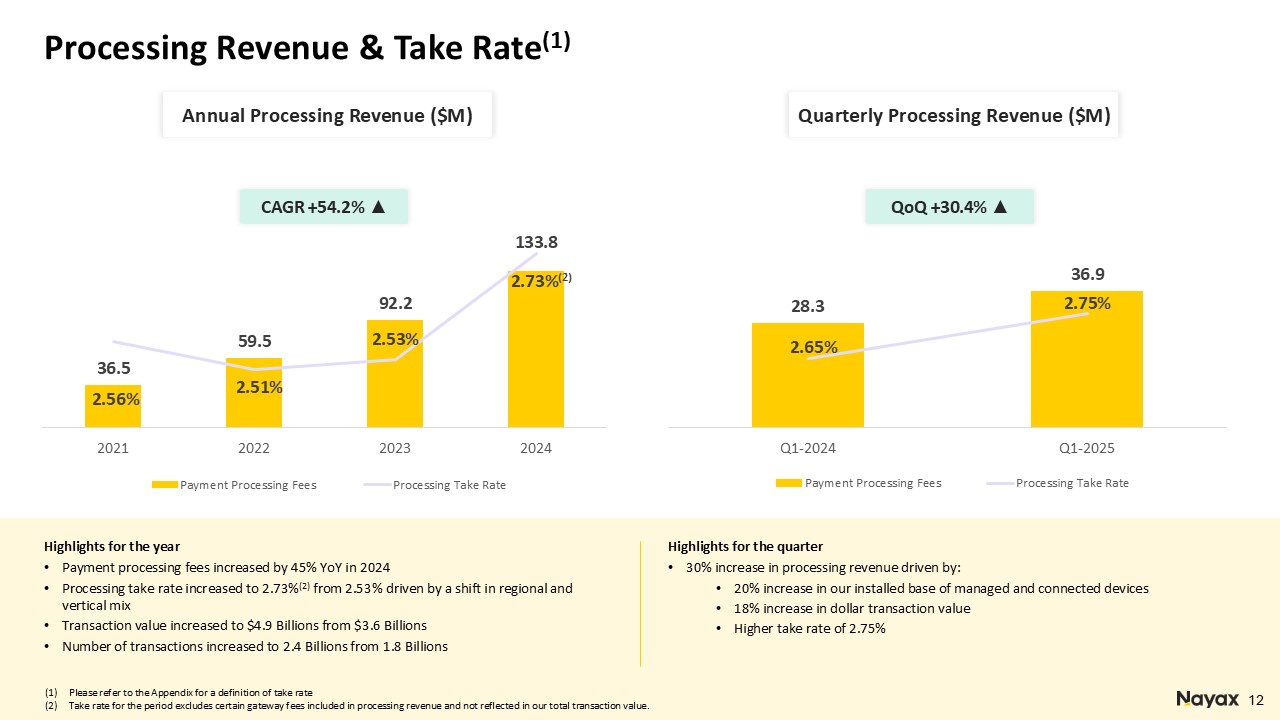
Total transaction value grew by more than 18% to more than $1.3 billion.
|
|
|
• |
Number of processed transactions increased 20.4% to 650 million.
|
|
|
• |
Take rate increased to 2.75% from 2.65% as the Company continues to expand into additional verticals.
|
|
|
• |
Total number of managed and connected devices was approximately 1.33 million devices representing an increase of 20% year-over-year. Driven by robust customer demand, Nayax added more than 69,000 devices in the quarter, including more
than 25,000 devices from the recent acquisition of UPPay.
|
|
|
• |
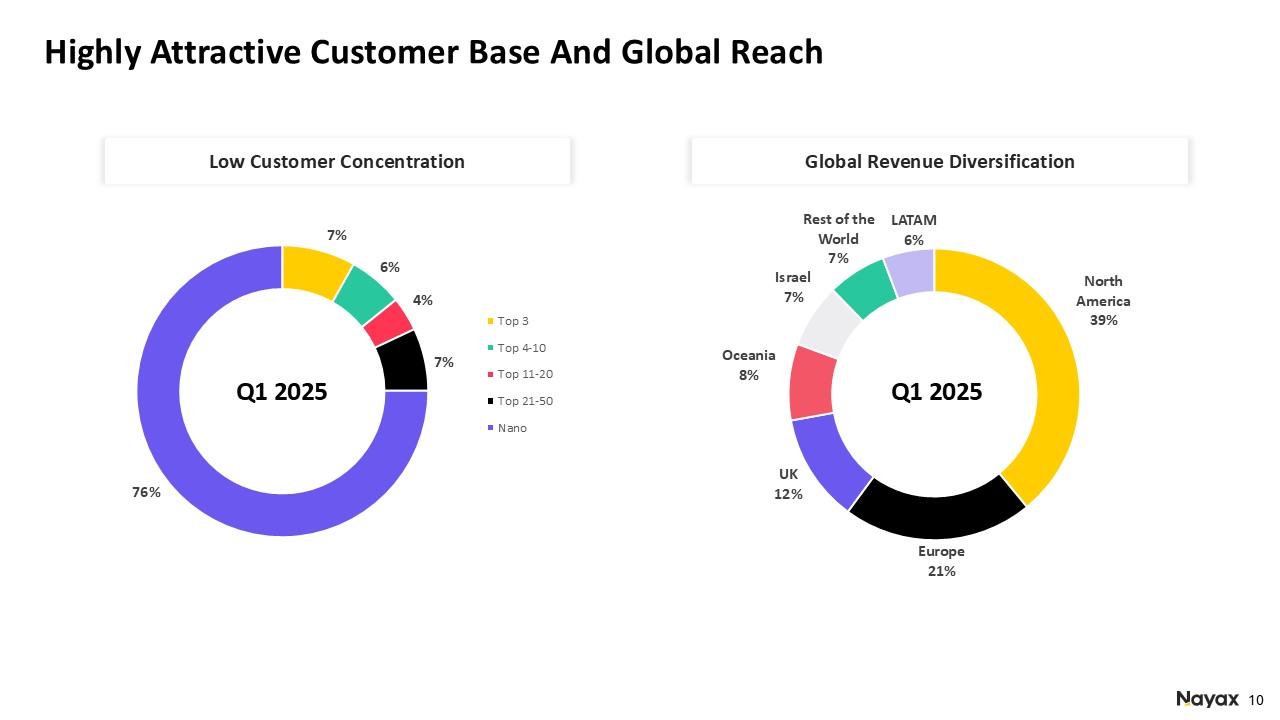
Growth in the customer base continued at a healthy pace, adding nearly 5,000 new customers in the quarter, bringing the total customer base to more than 100,000, an increase of 31% year-over-year.
|
|
|
• |
The dollar-based net retention rate remained high at 128%, reflecting strong customer satisfaction, while the customer churn rate remained low at 2.8%.
|
|
|
• |
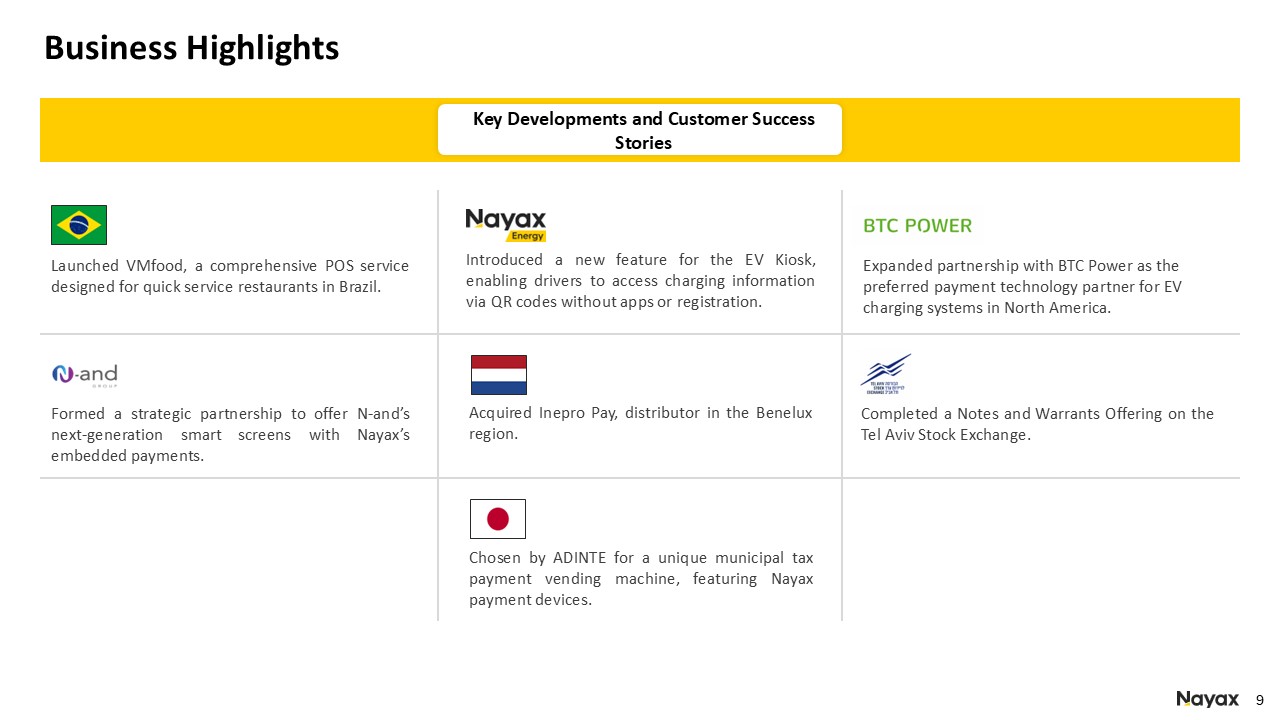
Completed the acquisition of UPPay, which more than doubles Nayax’s connected devices footprint in Brazil, adding over 25,000 unattended devices, primarily in self-service coffee vending machines.
|
|
|
• |
Completed a Notes and Warrants Offering in Israel, raising net proceeds of approximately NIS 486.2 million (approximately $133 million). The Company intends to use the net proceeds of the offering for general
corporate purposes including repayment of debt and potential future acquisitions and investments.
|
|
|
• |
Introduced Innovative State-of-Charge Feature for EV Kiosk, Elevating EV Charging Experience. The new upgrade simplifies electric vehicle (EV) charging by clearly separating card-present payments from mobile access to
charging sessions details. Payments are securely completed directly at the payment kiosk, while detailed charging information is effortlessly accessed on drivers’ smartphones by scanning a QR code – no app downloads or personal details
required.
|
|
|
• |
Announced a Strategic Partnership with N-and Group to embed Nayax-powered payment technology within N-and products, the first of which will be its payment-enabled smart screens for next generation automated self-service commerce
machines. N-and Group will integrate Nayax’s embedded OEM payment technology directly into its extensive lineup of smart screen solutions for OEMs.
|
|
|
• |
Announced the acquisition of Inepro Pay, a subsidiary of Inepro and a Nayax distributor in the Benelux region on April 2, 2025. Acquiring Inepro expands Nayax’s reach in the Benelux region by consolidating a trusted
partnership in-house, improving efficiency, and bringing Nayax closer to its customers in the region.
|
|
|
• |
U.S. TOLL-FREE: 1-877-737-7051
|
|
|
• |
ISRAEL TOLL-FREE: 1-809-455-690
|
|
|
• |
INTERNATIONAL: 1-201-689-8878
|
|
|
• |
Replay TOLL-FREE: 1-844-512-2921
|
|
|
• |
Replay TOLL/INTERNATIONAL: 1-412-317-6671
|
|
|
• |
Replay TOLL/Israel: 1-809-458-327
|
|
|
• |
Replay Pin Number: 13753260
|
|
Public Relations Contact:
Scott Gamm
Strategy Voice Associates
Scott@strategyvoiceassociates.com
|
Investor Relations Contact:
Aaron Greenberg
Chief Strategy Officer
IR@nayax.com
|
|
March 31
|
December 31
|
|||||||
|
2025
|
2024
|
|||||||
|
U.S. dollars in thousands
|
||||||||
|
ASSETS
|
||||||||
|
CURRENT ASSETS:
|
||||||||
|
Cash and cash equivalents
|
176,763
|
83,130
|
||||||
|
Restricted cash transferable to customers for processing activity
|
71,990
|
60,299
|
||||||
|
Short-term bank deposits
|
44
|
9,327
|
||||||
|
Receivables in respect of processing activity
|
64,523
|
45,071
|
||||||
|
Trade receivable, net
|
55,292
|
55,694
|
||||||
|
Inventory
|
20,835
|
19,768
|
||||||
|
Other current assets
|
7,924
|
14,368
|
||||||
|
Total current assets
|
397,371
|
287,657
|
||||||
|
NON-CURRENT ASSETS:
|
||||||||
|
Long-term bank deposits
|
1,891
|
2,155
|
||||||
|
Other long-term assets
|
3,314
|
4,253
|
||||||
|
Investment in associate
|
-
|
3,754
|
||||||
|
Right-of-use assets, net
|
5,609
|
6,292
|
||||||
|
Property and equipment, net
|
13,942
|
11,112
|
||||||
|
Goodwill and intangible assets, net
|
144,734
|
117,670
|
||||||
|
Total non-current assets
|
169,490
|
145,236
|
||||||
|
TOTAL ASSETS
|
566,861
|
432,893
|
||||||
|
March 31
|
December 31
|
|||||||
|
2025
|
2024
|
|||||||
|
U.S. dollars in thousands
|
||||||||
|
LIABILITIES AND EQUITY
|
||||||||
|
CURRENT LIABILITIES:
|
||||||||
|
Short-term bank credit and short term loan
|
-
|
25,276
|
||||||
|
Current maturities of long-term bank loans
|
3,220
|
3,978
|
||||||
|
Current maturities of other long-term liabilities
|
5,599
|
1,353
|
||||||
|
Current maturities of leases liabilities
|
2,771
|
2,967
|
||||||
|
Payables in respect of processing activity
|
162,481
|
130,958
|
||||||
|
Trade payables
|
14,522
|
21,059
|
||||||
|
Other payables
|
37,481
|
33,887
|
||||||
|
Total current liabilities
|
226,074
|
219,478
|
||||||
|
NON-CURRENT LIABILITIES:
|
||||||||
|
Long-term bank loans
|
13,018
|
18,605
|
||||||
|
Other long-term liabilities
|
13,057
|
20,716
|
||||||
|
Post-employment benefit obligations, net
|
504
|
497
|
||||||
|
Bonds
|
126,123
|
-
|
||||||
|
Lease liabilities
|
3,452
|
4,078
|
||||||
|
Deferred income taxes
|
3,830
|
4,274
|
||||||
|
Total non-current liabilities
|
159,984
|
48,170
|
||||||
|
TOTAL LIABILITIES
|
386,058
|
267,648
|
||||||
|
EQUITY:
|
||||||||
|
Shareholders Equity:
|
||||||||
|
Share capital
|
9
|
9
|
||||||
|
Additional paid in capital
|
227,571
|
220,715
|
||||||
|
Capital reserves
|
7,447
|
7,832
|
||||||
|
Accumulated deficit
|
(54,224
|
)
|
(63,311
|
)
|
||||
|
TOTAL EQUITY
|
180,803
|
165,245
|
||||||
|
TOTAL LIABILITIES AND EQUITY
|
566,861
|
432,893
|
||||||
|
Three months ended
March 31 |
||||||||
|
2025
|
2024
|
|||||||
|
U.S. dollars in thousands
|
||||||||
|
(Excluding loss per share data)
|
||||||||
|
Revenues
|
81,110
|
63,962
|
||||||
|
Cost of revenues
|
(41,211
|
)
|
(35,975
|
)
|
||||
|
Gross Profit
|
39,899
|
27,987
|
||||||
|
Research and development expenses
|
(7,152
|
)
|
(6,345
|
)
|
||||
|
Selling, general and administrative expenses
|
(27,541
|
)
|
(21,460
|
)
|
||||
|
Depreciation and amortization in respect of technology and capitalized development costs
|
(3,176
|
)
|
(2,571
|
)
|
||||
|
Other income (expenses)
|
6,089
|
(128
|
)
|
|||||
|
Share of losses of equity method investees
|
(226
|
)
|
(290
|
)
|
||||
|
Profit (Loss) from ordinary operations
|
7,893
|
(2,807
|
)
|
|||||
|
Financial Income
|
1,836
|
437
|
||||||
|
Financial Expense
|
(2,327
|
)
|
(2,825
|
)
|
||||
|
Profit (loss) before taxes on income
|
7,402
|
(5,195
|
)
|
|||||
|
Tax benefit (Income tax expense)
|
(246
|
)
|
239
|
|||||
|
Profit (loss) for the year
|
7,156
|
(4,956
|
)
|
|||||
|
Basic earnings (loss) per share
|
0.195
|
(0.147
|
)
|
|||||
|
Diluted earnings per share
|
0.192
|
-
|
||||||
|
Three months ended
March 31 |
||||||||
|
2025
|
2024
|
|||||||
|
U.S. dollars in thousands
|
||||||||
|
Profit (loss) for the period
|
7,156
|
(4,956
|
)
|
|||||
|
Other comprehensive income (loss) for the period:
|
||||||||
|
Items that may be reclassified to profit or loss:
|
||||||||
|
Gain from translation of financial statements of foreign operations
|
686
|
169
|
||||||
|
Loss on cash flow hedges
|
(1,071
|
)
|
-
|
|||||
|
Total comprehensive profit (loss) for the period
|
6,771
|
(4,787
|
)
|
|||||
|
Share
capital |
Additional paid in capital
|
Remeasurement of post-employment benefit obligations
|
Other capital reserves
|
Foreign currency translation reserve
|
Accumulated
deficit |
Total
equity |
||||||||||||||||||||||
|
U.S. dollars in thousands
|
||||||||||||||||||||||||||||
|
Balance at January 1, 2024 (audited)
|
8
|
153,524
|
248
|
9,545
|
(150
|
)
|
(65,585
|
)
|
97,590
|
|||||||||||||||||||
|
Changes in the three months ended March 31, 2024:
|
||||||||||||||||||||||||||||
|
Loss for the period
|
-
|
-
|
-
|
-
|
-
|
(4,956
|
)
|
(4,956
|
)
|
|||||||||||||||||||
|
Issuance of ordinary shares
|
1
|
62,685
|
62,686
|
|||||||||||||||||||||||||
|
Other comprehensive income for the period
|
-
|
-
|
-
|
(42
|
)
|
211
|
-
|
169
|
||||||||||||||||||||
|
Employee options exercised
|
*
|
1,121
|
-
|
-
|
-
|
-
|
1,121
|
|||||||||||||||||||||
|
Share-based payment
|
-
|
-
|
-
|
-
|
-
|
1,577
|
1,577
|
|||||||||||||||||||||
|
Balance on March 31, 2024 (unaudited)
|
9
|
217,330
|
248
|
9,503
|
61
|
(68,964
|
)
|
158,187
|
||||||||||||||||||||
|
Balance at January 1, 2025 (audited)
|
9
|
220,715
|
463
|
9,973
|
(2,604
|
)
|
(63,311
|
)
|
165,245
|
|||||||||||||||||||
|
Changes in the three months ended March 31, 2025:
|
||||||||||||||||||||||||||||
|
Profit for the period
|
-
|
-
|
-
|
-
|
-
|
7,156
|
7,156
|
|||||||||||||||||||||
|
Issuance of warrants, net
|
-
|
5,706
|
-
|
-
|
-
|
-
|
5,706
|
|||||||||||||||||||||
|
Other comprehensive income for the period
|
-
|
-
|
-
|
(1,071
|
)
|
686
|
-
|
(385
|
)
|
|||||||||||||||||||
|
Employee options exercised
|
*
|
1,150
|
-
|
-
|
-
|
-
|
1,150
|
|||||||||||||||||||||
|
Share-based payment
|
-
|
-
|
-
|
-
|
-
|
1,931
|
1,931
|
|||||||||||||||||||||
|
Balance on March 31, 2025 (unaudited)
|
9
|
227,571
|
463
|
8,902
|
(1,918
|
)
|
(54,224
|
)
|
180,803
|
|||||||||||||||||||
|
Three months ended
March 31 |
||||||||
|
2025
|
2024
|
|||||||
|
U.S. dollars in thousands
|
||||||||
|
CASH FLOWS FROM OPERATING ACTIVITIES:
|
||||||||
|
Net profit (loss) for the period
|
7,156
|
(4,956
|
)
|
|||||
|
Adjustments to reconcile net profit (loss) to net cash provided by operations (see Appendix A)
|
(5,867
|
)
|
5,096
|
|||||
|
Net cash provided by operating activities
|
1,289
|
140
|
||||||
|
CASH FLOWS FROM INVESTING ACTIVITIES:
|
||||||||
|
Capitalized development costs
|
(6,226
|
)
|
(4,371
|
)
|
||||
|
Acquisition of property and equipment
|
(796
|
)
|
(160
|
)
|
||||
|
Loans granted to related company
|
(100
|
)
|
(259
|
)
|
||||
|
Decrease (Increase) in bank deposits
|
9,555
|
(23,027
|
)
|
|||||
|
Interest received
|
1,297
|
433
|
||||||
|
Investments in financial assets
|
-
|
(284
|
)
|
|||||
|
Proceeds from sub-lessee
|
22
|
55
|
||||||
|
Payments for acquisitions of subsidiaries, net of cash acquired
|
(8,200
|
)
|
-
|
|||||
|
Repayment of contingent liability due consideration of subsidiary acquisition
|
(3,536
|
)
|
-
|
|||||
|
Net cash used in investing activities
|
(7,984
|
)
|
(27,613
|
)
|
||||
|
CASH FLOWS FROM FINANCING ACTIVITIES:
|
||||||||
|
Issuance of ordinary shares
|
-
|
62,686
|
||||||
|
Proceeds from issue of bonds and warrants, net
|
132,941
|
-
|
||||||
|
Interest paid
|
(1,198
|
)
|
(1,085
|
)
|
||||
|
Changes in short-term bank credit
|
(25,226
|
)
|
(19,455
|
)
|
||||
|
Receipt of long-term bank loans
|
-
|
17,000
|
||||||
|
Repayment of long-term bank loans
|
(6,274
|
)
|
(264
|
)
|
||||
|
Repayment of long-term loans from others
|
-
|
(1,142
|
)
|
|||||
|
Repayment of other long-term liabilities
|
(1,000
|
)
|
(24
|
)
|
||||
|
Employee options exercised
|
1,196
|
896
|
||||||
|
Principal lease payments
|
(704
|
)
|
(586
|
)
|
||||
|
Net cash provided by financing activities
|
99,735
|
58,026
|
||||||
|
Increase in cash and cash equivalents
|
93,040
|
30,553
|
||||||
|
Balance of cash and cash equivalents at beginning of period
|
83,130
|
38,386
|
||||||
|
Gains (losses) from exchange differences on cash and cash equivalents
|
284
|
(471
|
)
|
|||||
|
Gains from translation differences on cash and cash equivalents of foreign operations
|
309
|
101
|
||||||
|
Balance of cash and cash equivalents at end of period
|
176,763
|
68,569
|
||||||
|
Three months ended
March 31 |
||||||||
|
2025
|
2024
|
|||||||
|
U.S. dollars in thousands
|
||||||||
|
Appendix A – adjustments to reconcile net loss to net cash provided by operations:
|
||||||||
|
Adjustments in respect of:
|
||||||||
|
Depreciation and amortization
|
5,721
|
4,518
|
||||||
|
Post-employment benefit obligations, net
|
11
|
4
|
||||||
|
Deferred taxes
|
(691
|
)
|
(489
|
)
|
||||
|
Finance expenses (income), net
|
(1,462
|
)
|
812
|
|||||
|
Expenses in respect of long-term employee benefits
|
-
|
300
|
||||||
|
Profit from gaining control in subsidiary
|
(6,089
|
)
|
-
|
|||||
|
Share of loss of equity method investee
|
226
|
290
|
||||||
|
Long-term deferred income
|
(39
|
)
|
309
|
|||||
|
Expenses in respect of share-based compensation
|
1,783
|
1,453
|
||||||
|
Total adjustments
|
(540
|
)
|
7,197
|
|||||
|
Changes in operating asset and liability items:
|
||||||||
|
Increase in restricted cash transferable to customers for processing activity
|
(11,669
|
)
|
(4,092
|
)
|
||||
|
Increase in receivables from processing activity
|
(19,452
|
)
|
(22,391
|
)
|
||||
|
Decrease in trade receivables
|
1,398
|
395
|
||||||
|
Increase in other current assets
|
256
|
(653
|
)
|
|||||
|
Decrease (Increase) in inventory
|
(784
|
)
|
544
|
|||||
|
Increase in payables in respect of processing activity
|
31,523
|
25,953
|
||||||
|
Decrease in trade payables
|
(6,381
|
)
|
(4,384
|
)
|
||||
|
Increase (Decrease) in other payables
|
(218
|
)
|
2,527
|
|||||
|
Total changes in operating assets and liability items
|
(5,327
|
)
|
(2,101
|
)
|
||||
|
Total adjustments to reconcile net loss to net cash provided by operations
|
(5,867
|
)
|
5,096
|
|||||
|
Appendix B – Information regarding investing and financing activities not involving cash flows:
|
||||||||
|
Purchase of property and equipment in credit
|
115
|
6
|
||||||
|
Acquisition of right-of-use assets through lease liabilities
|
-
|
521
|
||||||
|
Share based payments costs attributed to development activities, capitalized as intangible assets
|
148
|
124
|
||||||
|
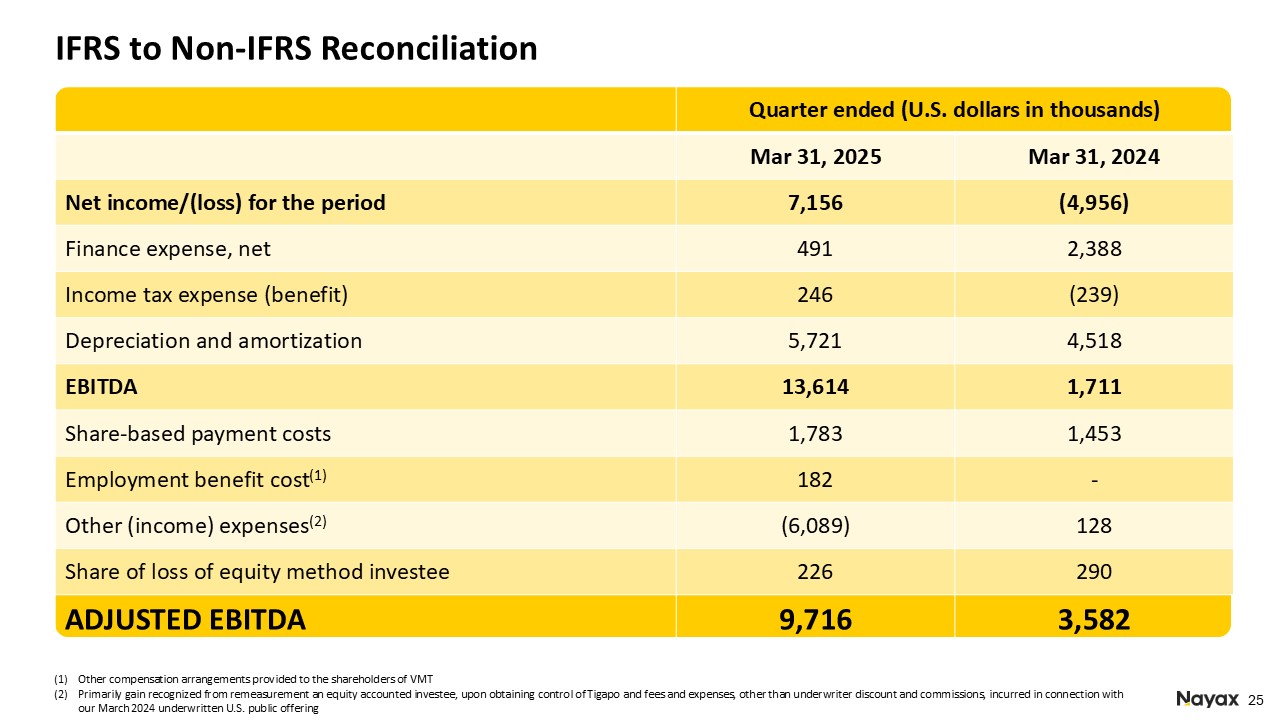
Quarter ended
(U.S. dollars in thousands)
|
||
|
Mar 31, 2025
|
Mar 31, 2024
|
|
|
Net income/loss for the period
|
7,156
|
(4,956)
|
|
Finance expense, net
|
491
|
2,388
|
|
Income tax expense (benefit)
|
246
|
(239)
|
|
Depreciation and amortization
|
5,721
|
4,518
|
|
EBITDA
|
13,614
|
1,711
|
|
Share-based payment costs
|
1,783
|
1,453
|
|
Employment benefit cost(1)
|
182
|
-
|
|
Other (income) expense(2)
|
(6,089)
|
128
|
|
Share of loss of equity method investee
|
226
|
290
|
|
ADJUSTED EBITDA
|
9,716
|
3,582
|
|
|
(1) |
Other compensation arrangements provided to the shareholders of VMT
|
|
|
(2) |
Primarily gain recognized from remeasurement an equity accounted investee, upon obtaining control of Tigapo and fees and expenses, other than underwriter discount and commissions, incurred in connection with our March 2024 underwritten
U.S. public offering
|
|
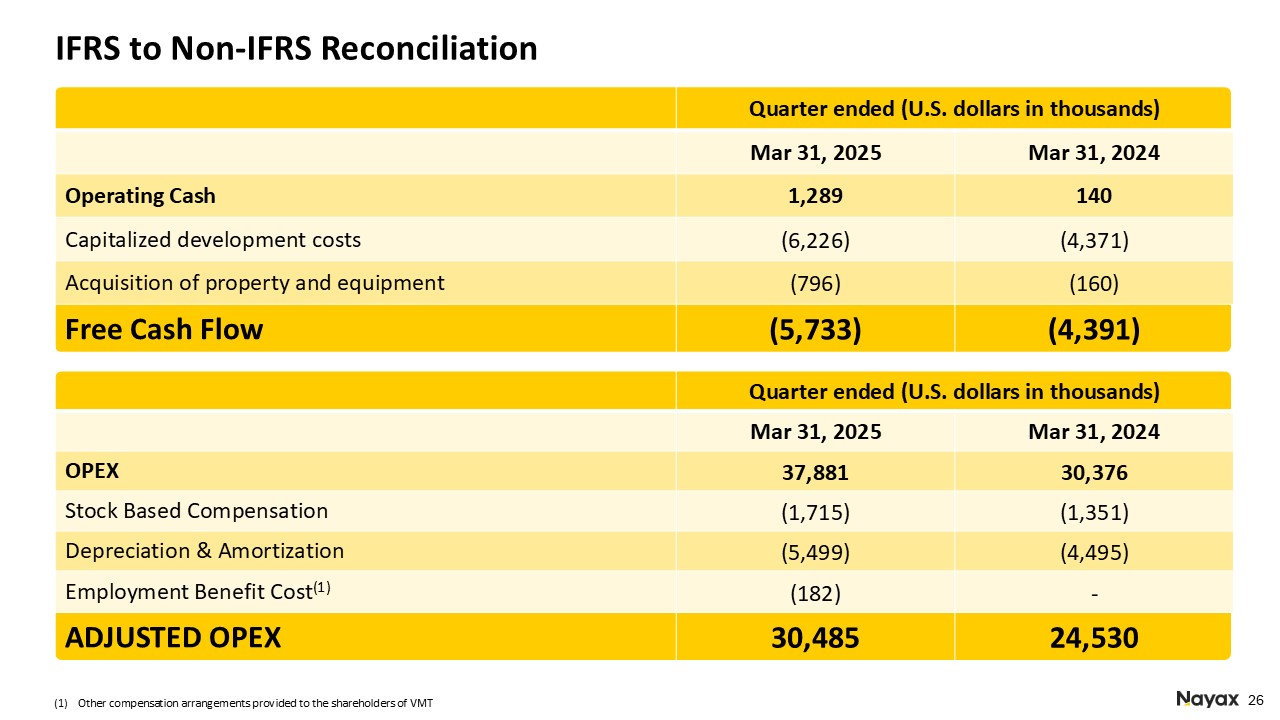
Quarter ended
(U.S. dollars in thousands)
|
||
|
Mar 31, 2025
|
Mar 31, 2024
|
|
|
Operating Cash
|
1,289
|
140
|
|
Capitalized development costs
|
(6,226)
|
(4,371)
|
|
Acquisition of property and equipment
|
(796)
|
(160)
|
|
Free Cash Flow
|
(5,733)
|
(4,391)
|
|
Quarter ended
(U.S. dollars in thousands)
|
||
|
Mar 31, 2025
|
Mar 31, 2024
|
|
|
OPEX
|
37,881
|
30,376
|
|
Stock Based Compensation
|
(1,715)
|
(1,351)
|
|
Depreciation & Amortization
|
(5,499)
|
(4,495)
|
|
Employment Benefit Cost(1)
|
(182)
|
-
|
|
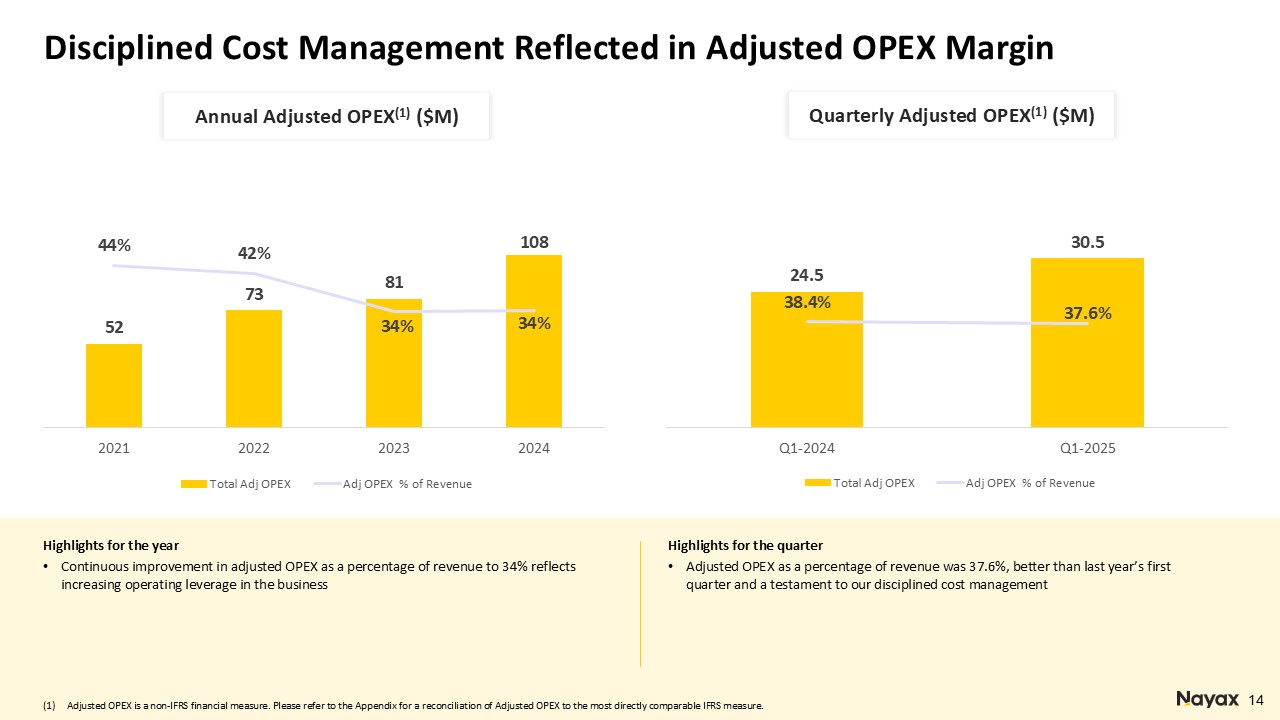
Adjusted OPEX
|
30,485
|
24,530
|
|
|
(1) |
Other compensation arrangements provided to the shareholders of VMT
|