|
|
|
|
|
KENON HOLDINGS LTD.
|
|
|
|
|
|
|
Date: March 12, 2025
|
By:
|
/s/ Robert L. Rosen
|
|
|
Name:
|
Robert L. Rosen
|
|
|
Title:
|
Chief Executive Officer
|
| 1. |
Executive Summary1
|
|
For the
|
For the
|
||||||||||||||||||||||||
|
Year Ended
|
Three Months Ended
|
||||||||||||||||||||||||
|
December 31
|
December 31
|
||||||||||||||||||||||||
|
2024
|
2023
|
%
|
2024
|
2023
|
%
|
||||||||||||||||||||
|
Consolidated
|
EBITDA after proportionate consolidation
|
1,208
|
1,099
|
10
|
%
|
228
|
319
|
(29
|
)%
|
||||||||||||||||
|
|
Net income
|
197
|
169
|
17
|
%
|
123
|
29
|
324
|
%
|
||||||||||||||||
|
|
Adjusted net income (loss)
|
115
|
180
|
(64
|
)%
|
(47
|
)
|
43
|
(209
|
)%
|
|||||||||||||||
|
|
FFO |
726
|
648
|
12
|
%
|
154
|
4
|
3,750
|
%
|
||||||||||||||||
|
Israel
|
EBITDA
|
639
|
562
|
14
|
%
|
98
|
135
|
(27
|
)%
|
||||||||||||||||
|
|
FFO |
428
|
440
|
(3
|
)%
|
45
|
10
|
350
|
%
|
||||||||||||||||
|
U.S.
|
EBITDA after proportionate consolidation
|
589
|
564
|
4
|
%
|
137
|
191
|
(28
|
)%
|
||||||||||||||||
|
|
FFO |
339
|
264
|
28
|
%
|
111
|
(8
|
)
|
1,488
|
%
|
|||||||||||||||
|
|
EBITDA after proportionate consolidation – energy transition
|
588
|
585
|
1
|
%
|
141
|
163
|
(13
|
)%
|
||||||||||||||||
|
|
EBITDA after proportionate consolidation – renewable energies
|
112
|
31
|
261
|
%
|
28
|
14
|
100
|
%
|
||||||||||||||||
|
|
* |
EBITDA, EBITDA after proportionate consolidation, adjusted net income and FFO are not recognized in accordance with IFRS – for definitions and the manner of their calculation – see Sections 4B and 4F below.
|
| 1 |
The Executive Summary below is presented solely for convenience and it is not a substitute for reading the full detail (including with reference to the matters referred to in the Summary) as stated in this
report with all its parts (including warnings relating to “forward‑looking” information as it is defined in the Securities Law, 1968 (“the Securities Law”) definitions or explanations with respect to the indices for measurement of the
results and including the information included by means of reference, as applicable). This Summary includes estimates, plans and assessment of the Company, which constitute “forward‑looking” information regarding which there is no certainty
it will materialize and the readers are directed to the detail presented in this report below.
|
| 1. |
Executive Summary (Cont.)
|
|
Israel
|
Ramat Beka project – the Company is continuing to advance a consolidated project for generation of electricity using photovoltaic technology with integrated
storage with a cumulative capacity of about 505 megawatts and about 2,760 megawatts per hour of storage. See also Section 6A(2) below. In September 2024, the Group made an initial payment to Israel Lands Authority (ILA) in respect of the
Ramat Beka 2 tender, in the amount of about NIS 178 million (the Company’s share – about NIS 142 million), constituting 20% of the aggregate consideration for the areas of the second tender. As at the approval date of the report, to the
best of the Company’s knowledge government was received for advancement of the plan to State’s National Infrastructures Board – for details see Section 7.3.13.1 of Part A of the Periodic Report.
|
|
Additional renewable energy projects – as part of its strategic entry into the renewable energies area in Israel, the
Company is developing additional projects using photovoltaic technology with integrated storage, with a cumulative capacity of about 215 megawatts and about 1,100 megawatt hours of storage. To the best of the Company’s knowledge,
government was received for advancement of the plan to State’s National Infrastructures Board – for details see Section 6A(2) below.
|
|
|
Memorandum of principles with Intel for construction of a power plant with a capacity of 450–650 megawatts – in March 2024, a non‑binding memorandum of
principles for supply of electricity to Intel’s facilities in Kiryat Gat was signed, including expansion of the currently‑existing facilities, for a period of 20 years from the date of commencement of operation. See also – Section 6A(1)
below.
|
|
|
Sale of electricity to consumers of Partner Communications Ltd. (“Partner”) that are household consumers and small businesses and a decision regarding smart meters
– in February 2024, an agreement was signed with Partner that will permit diversification of the mix of the Company’s customers. In April 2024, a decision of the Electricity Authority was received that will permit the Company to also sell
electricity to household consumers without a smart meter and assignment thereof to a private conventional supplier commencing from November 1, 2024.
|
|
|
Refinancing in Israel – in August 2024, OPC Holdings Israel signed two bank financing agreements, with an aggregate scope of NIS 1.65 billion, which were used
mainly for purposes of early repayment of the project financing of the Zomet and Gat power plants. In February 2025, OPC Israel signed an additional bank financing agreement in the aggregate amount of NIS 300 million under similar
conditions. See also Note 14B(1) to the Financial Statements.
|
|
|
Hadera 2 project – after the government’s rejection of the plan for construction of a power plant for generation of electricity using natural gas in April
2024, in June 2024 Hadera 2 submitted a petition to the High Court of Justice regarding cancellation of the said Government Decision and approval of the plan. In December 2024, a conditional order was issued by High Court of Justice
instructing the government to provide reasons why not to return of the plan for a rehearing by the National Infrastructures Board or, alternatively, to provide reasons why not to approve the plan. A hearing of the petition was scheduled
for April 2025. See also – Section 6A.
|
|
|
Public Announcement regarding a proposal for changes in the tariff structure (the generation component) – for details – see Section 3.2E below and
Section 7.2.3 to Part A of the Periodic Report.
|
| 1. |
Executive Summary (Cont.)
|
|
U.S.
|
Transactions for increase in the holdings in the Shore and Maryland power plants in the area of Energy Transition in the U.S. – in October 2024, acquisition of
25% of the Maryland power plant was completed and in December 2024 acquisition of an additional 25% of Maryland and 31% of Shore was completed. On the completion date of the transactions, consideration was paid in the aggregate amount of
about $188 million – see also Section 24C to the financial statements. Furthermore, in February 2025 the CPV Group signed an agreement, subject to preconditions that have not yet been actualized, for acquisition of an additional 20% of
the Shore power plant. As part of the aforesaid transactions, the total investment commitments were increased and provision of shareholders’ loans to the CPV Group, in the amount of about $220 million, such that subject to investment of
the full amount of the commitments, the Company’s holdings (indirectly) will be about 70.7%.
|
|
Entry of an investor into the area of renewable energy activities in the U.S. – in August 2024, the CPV Group signed binding investment agreements with
Harrison Street, in the aggregate amount of $300 million in CPV Renewable, in exchange for 33.3% of the ordinary rights in CPV’s renewable‑energy activities, based on a value “before the money” of $600 million. In November 2024, the
transaction was completed. See also – Section 23E to the financial statements.
|
|
|
Capacity auctions in the PJM market for the period June 2025 through May 2026 – in July 2024, the results of auctions for capacity prices in PJM were
published, with a significant increase in the prices to about $270 per megawatt per day. For details regarding the estimated addition to the Group’s revenues from capacity for the period of the auction and with respect to expected changes
in the methodology of the auctions on the capacity prices in PJM for 2026–2027, and particularly determination of minimum and maximum (collar) prices of 175–325 megawatts per day – see Section 3.3M below.
|
|
|
Basin Ranch project – the CPV Group is continuing to advance the Basin Ranch project, a natural gas project with future carbon capture potential located in the
western part of Texas, with a capacity of about 1.35 gigawatts, the construction cost of which is estimated at about $1.8 – $2 billion and commencement of its construction is expected by the end of 2025. The project was chosen by the TEF
to advance to the stage of due diligence examinations for receipt of a subsidized loan in the amount of about $1 billion. In addition, as at the approval date of the report, the CPV Group is working on a private fundraising process that
is required for construction of the project. For additional details – see Section 6B(2) below.
|
|
|
Refinancing in Towantic, Fairview, Shore and reductions of interest in Maryland and Fairview – during 2024 and in February 2025, undertakings for refinancing
in Towantic, Fairview and Shore were completed. In addition, in September 2024 and February 2025, the transactions for interest reductions (repricing) in Maryland and Fairview were completed. See also Section 9 below.
|
|
|
Start of construction of the Rogue’s Wind project (wind‑energy power plant with a capacity of 114 megawatts located in Pennsylvania) – in August 2024 a Work
Commencement Order was issued concurrent with completion of the receipt of financing for construction of the project. See also Section 6A(2) below.
|
| 1. |
Executive Summary (Cont.)
|
|
U.S. (Cont.)
|
Tax partner agreement in the Backbone project (solar technology‑based power plant with a capacity of 179 megawatts, in the state of Maryland) – in October
2024, a binding agreement was signed with a tax partner for investment of an aggregate amount of about $116 million. See also Section 6A(2) below.
|
|
Commercial operation of the Stagecoach project with a capacity of 102 megawatts – in May 2024, the project reached commercial operation and an agreement was
signed with a tax partner (PTC) in the aggregate amount of about $52 million.
|
|
|
Group headquarters
|
Raising of capital – in July 2024, the Company completed raising of capital, in the amount of about NIS 800 million.
|
|
Credit rating – in July 2024, S&P Maalot reconfirmed the credit rating of the Company and its debentures at the level of ilA– and updated the rating
outlook from negative to stable.
|
|
|
Issuance of a new series of debentures (Series D) – in January 2024, the debentures (Series D) were issued in the amount of NIS 200 million with a term of
about 6.4 years and bearing annual interest of 6.2%.
|
|
|
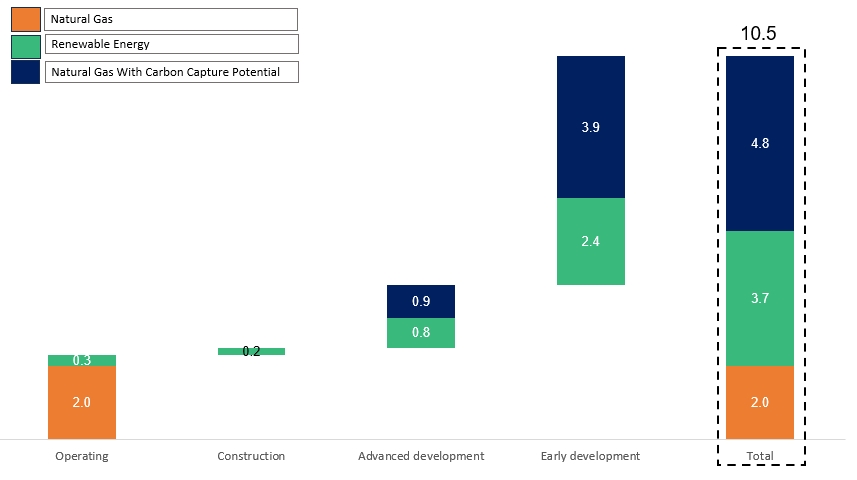
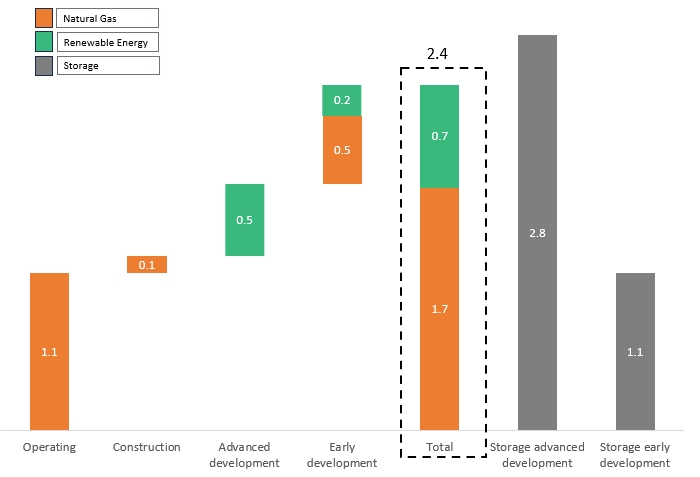
(1) |
Commencing from the fourth quarter of 2024, renewable energy projects are presented in accordance with the relative share of the CPV Group in this area of activities (about 66.7%). For details – see also Section 2(2), below.
|
|
|
(2) |
Natural gas projects are presented in accordance with the relative share of the CPV Group in each project. The above chart does not include the transaction for acquisition of additional holdings, at the rate of 20%, in the Shore power
plant, which as at the approval date of the report had not yet been completed.
|
| 1. |
Executive Summary (Cont.)
|
| (1) |
The above chart does not include the Hadera 2 project, with a capacity of 850 megawatts, in light of the Government’s decision to reject the plan. As at the approval date of the report, a petition is underway in the Supreme Court sitting
as the High Court of Justice regarding cancellation of the said Government decision. For details – see Section 6A(2) below and Section 7.3.13.4 of Part A to the Periodic Report.
|
| 2. |
Brief description of the areas of activity
|
|
|
(1) |
Israel (by means of OPC Holdings Israel Ltd.2) – as part of this area of activities, the Group is engaged in generation and supply of electricity and energy, mainly to private customers and to Noga
Electricity System Management Ltd. (“the System Manager”), as well as in initiation, development, construction and operation of power plants and facilities for generation of energy by means of natural gas and renewable energy in Israel;
|
|
|
(2) |
Renewable Energy in the U.S. (by means of the CPV Group3) – as part of this area of activities, the Group is engaged in initiation, development and operation of power plants running on renewable energy in
the U.S. (solar and wind). For details regarding an investment transaction, in the aggregate amount of $300 million, in CPV Renewable in exchange for 33.3% of the ordinary rights in the renewable energy activities in the U.S, which was
completed in the fourth quarter of 2024 – see Note 23E to the financial statements. Accordingly, starting from the completion date of the transaction, the Company includes the renewable‑energy activities in the U.S. held by the CPV Group at
the rate of about 66.7% and that constitutes an associated company (that is not consolidated in the financial statements of the CPV Group and, in turn, the Company’s financial statements);
|
|
|
(3) |
Energy transition in the U.S. (by means of the CPV Group4) – as part of this area of activities, the Group is engaged in holding and operation of power plants running on conventional energy in the U.S.
(natural gas), which efficiently and dependably supply electricity. As at the date of the report, all the power plants operating in this area are held by associated companies at various different holding rates (that are not consolidated in
the financial statements of the CPV Group and, in turn, in the Company’s financial statements). For additional details regarding the acquisition of additional holdings in Shore and Maryland in the fourth quarter of 2024 and an agreement for
acquisition of additional holdings in the Shore power plant, which was signed after the date of the report – see Note 24C to the financial statements.
|
| 2 |
As at the date of the report, the Company holds directly 80% of the shares of OPC Israel while the other 20% is held by Veridis Power Plants Ltd. (“Veridis”).
|
| 3 |
As at the date of the report, the Company holds indirectly about 70.46% of the shares of CPV (for details regarding increase of the investment commitment in the fourth quarter of 2024 – see Note 23A(3) to the financial statements). The
balance of the rights in CPV is held, indirectly, by institutional financial investors from Israel.
|
| 4 |
It is noted that the carbon capture process constitutes an additional separate component of the natural gas projects under development, which are subject to separate uncertainty and risks and could be developed or executed (if ultimately
executed) according to a different timetable.
|
| 2. |
Brief description of the areas of activity (Cont.)
|
|
|
(1) |
Initiation and development of projects for generation of electricity (highly‑efficient power plants running on natural gas) with integration of future carbon‑capture potential4 (some of the projects in this area are being
developed by associated companies);
|
|
|
(2) |
Retail activities involving sale of electricity from renewable sources to commercial customers.
|
| 5 |
It is clarified that in some of the cases additional details are provided in order to present a comprehensive picture of the matter addressed or the relevant business environment. References to reports in this report include the
information provided in the said reports by means of the reference.
|
| 3. |
Main Developments in the Business Environment
|
|
|
3.1 |
General
|
|
|
A. |
Macro‑economic environment (particularly inflation and interest) – in 2024, in the U.S. and in Israel, there was a certain moderation in the inflation rates with an increase of 2.7% and 3.4%, respectively.
|
|
Dollar/shekel exchange rate*
|
2024
|
2023
|
Change
|
||||||
|
On December 31
|
3.647
|
3.627
|
0.6
|
%
|
|||||
|
On September 30
|
3.710
|
3.824
|
(3.0
|
)%
|
|||||
|
Average January– December
|
3.699
|
3.689
|
0.3
|
%
|
|||||
|
Average October– December
|
3.703
|
3.823
|
(3.1
|
)%
|
|
|
* |
The dollar/shekel exchange rate shortly before the approval date of the report (on March 6, 2025) is 3.615.
|
| 3. |
Main Developments in the Business Environment (Cont.)
|
|
|
3.1 |
General (Cont.)
|
|
Bank of
|
|||||||
|
Israel
|
Federal
|
||||||
|
Israeli
|
U.S.
|
Interest
|
interest
|
||||
|
CPI
|
CPI
|
Rate
|
rate
|
||||
|
On March 6, 2025
|
115.4
|
317.6
|
4.5%
|
4.25%–4.50%
|
|||
|
On December 31, 2024
|
115.1
|
315.5
|
4.5%
|
4.25%–4.50%
|
|||
|
On September 30, 2024
|
115.2
|
314.8
|
4.5%
|
4.75%–5.00%
|
|||
|
On December 31, 2023
|
111.3
|
307.1
|
4.75%
|
5.25%–5.50%
|
|||
|
On September 30, 2023
|
111.2
|
307.0
|
4.75%
|
5.25%–5.50%
|
|||
|
On December 31, 2022
|
107.7
|
297.7
|
3.25%
|
4.25%–4.50%
|
|||
|
Change in 2024
|
3.4%
|
2.7%
|
(0.25)%
|
(1)%
|
|||
|
Change in 2023
|
3.3%
|
3.1%
|
1.5%
|
1%
|
|||
|
Change in the fourth quarter of 2024
|
(0.1)%
|
0.2%
|
0%
|
(0.50)%
|
|||
|
Change in the fourth quarter of 2023
|
0.1%
|
0.1%
|
0%
|
0.25%
|
|
|
B. |
Domestic and geopolitical instability in the defense (security) situation in Israel – 2023 was characterized by significant instability against the background of internal domestic events and geopolitical defense (security)
matters. On October 7, 2023, the “Iron Swords” war (“the War”) broke out in the Gaza Strip. Furthermore, during 2024 the War and the security tensions increased in additional areas, particularly in the northern part of the State, as well as
with Iran and the Houthis organization. The War and the security situation led to impacts and various restrictions for different time periods on the Israeli economy.
|
| 3. |
Main Developments in the Business Environment (Cont.)
|
| 3.1 |
General (Cont.)
|
|
|
C. |
Change of the government in the U.S. – the recent policy changes stemming from entry into office of the new Trump government has created uncertainty along with opportunities in the energy sector in the U.S. Since his entry into
the position in January 2025, President Trump has issued executive orders promoting the production of fossil fuels, including with respect to natural gas and LNG and reduction of government support in the area of renewable energies relating
to, among other things, off‑shore wind. In addition, the Trump administration has suspended plans for Federal funding of clean energy and Federal licensing processes for wind projects. In the estimation of the CPV Group, as at the approval
date of the report, the said executive orders do not have a significant impact on the activities of the CPV Group in the renewable energy area, and they may have a favorable impact on the business environment and the overall sentiment in
the area of natural gas. Furthermore, President Trump has imposed tariffs or has announced the intention to impose tariffs on imports from certain countries, in such a manner that could impact equipment costs (both in the areas of
renewable‑energy projects and natural‑gas projects) and trigger disruptions in the supply chain and, ultimately, lead to an increase in the construction costs of projects6.
|
|
|
3.2 |
Activities in Israel
|
|
|
D. |
Update of the electricity tariffs – during 2023, there were a number of updates to the electricity tariffs such that the average generation component in 2023 was set at NIS 30.53 per kilowatt hour.
|
| 6 |
That stated in this Section above constitutes “forward‑looking” information, as it is defined in the Securities Law, which is based solely on the Company’s estimates as at the approval date of the report, which are subject to uncertainty
and changes that are not under the Company’s control.
|
| 3. |
Main Developments in the Business Environment (Cont.)
|
|
|
3.2 |
Activities in Israel (Cont.)
|
|
|
D. |
(Cont.)
|
|
Period
|
2024
|
2023
|
Change
|
|||||||||
|
January–December average
|
30.10
|
30.53
|
(1.4
|
)%
|
||||||||
|
October–December average
|
30.07
|
30.39
|
(1.1
|
)%
|
||||||||
|
|
E. |
Public announcement regarding a proposal for changes in the tariff structure (the generation component) – for additional details – see Section 7.2.3 of Part A of the Periodic Report. It is clarified that the said proposal for
changes in the structure of the tariff for the generation component and the manner of its determination was published as part of a “Public Announcement” for receipt of in‑principle positions from the public prior to publication of a hearing
that will be subject to responses, changes and administrative processes and, therefore, at this early stage, there is no certainty regarding the final arrangements that will be stipulated in the decisions (if so stipulated) and the timing
thereof, which could be different – even significantly – than that stated in the “Public Announcement”. As at the approval date of the report, the Company had submitted a response as part of the “Public Announcement”, which includes a
professional opinion and comments with respect to the arrangements presented therein, and is continuing to study the proposed arrangements, their possible impacts on its activities (if they are ultimately stipulated in the decision), and
the manner of its response, and as at the present time it is not able to estimate the impact of the “Public Announcement”, if any, on its financial results. It is further clarified that changes in the generation component, including
following the Public Announcement, if approved, could have an unfavorable impact – even a significant one – on the results of the Company’s activities in Israel, as described further including in Section 19.2.1 of Part A of the Periodic
Report. In the Company’s estimation, in the present format of the generation component, in general, a change of 1 Agura in the generation component has an impact of about NIS 30 million on the segment’s EBITDA in Israel7.
|
|
|
F. |
Supplementary arrangements and granting of a supply license to Rotem – for details regarding provision of a supply license to Rotem and supplementary arrangements and imposition of certain covenants on Rotem commencing from
July 1, 2024 – see Section 7.3.7 of Part A of the Periodic Report.
|
| 7 |
That stated constitutes an indicative estimate of the impact of changes to the generation component on the Company, which is subject to changes in, among other things, as a result of the manner of determining the periodic generation
component and/or the manner of its application to the demand‑hours brackets, operating factors and/or occurrence of one or more of the risk factors to which the Company is exposed, as stated in Section 19.2 Section A of the Periodic
Report.
|
| 3. |
Main Developments in the Business Environment (Cont.)
|
|
|
3.2 |
Activities in Israel (Cont.)
|
|
|
G. |
Decision regarding assignment of household consumers to – for details – see Section 7.2.2.3 of Part A of the Periodic Report. The decision permits the Company to expand the diversity of its customers by means of sale of
electricity, directly and/or indirectly to all household consumers.
|
|
|
H. |
Hearing regarding bilateral market regulation for generation facilities in the transmission network – for details – see Section 7.3.5 of Part A of the Periodic Report. It is noted that the Ramat Beka solar project that is being
developed by the Company, might operate under this regulation, to the extent it is actually advanced and subject to the final regulations that will be determined (if any).
|
|
|
I. |
Targets of the Israeli government regarding emission of greenhouse gases and amendment of the Excise Tax on Fuel Order – for details regarding the amendment to the Excise Order on Fuel (Imposition of Excise Tax), entered into
effect commencing from January 1, 2025, particularly relating to a gradual increase in the excise tax tariff on natural gas – see Section 7.2.8 of Part A of the Periodic Report. The increase in the Excise Tax on natural gas is expected to
raise the Group’s natural gas cost in Israel, where in the Company’s estimation part of this impact will be reduced by an increase in the Group’s revenues in Israel, if and to the extent there is an increase in the generation component and
subject to the expected impact of such an increase on the natural gas price, which is linked to the generation component. As noted above, the generation component has a material impact on both the Company’s revenues from sale of energy and
on its natural‑gas costs in Israel (for details – see Section 19.2.1 of Part A of the Periodic Report and Note 26C(5) to the Financial Statements). As at the approval date of the report, the Company is not able to estimate the full impact
of the amended Excise Tax Order on the Company’s results over time due to the uncertainty involved with the manner of determining the tariff, in general, and the generation component, in particular, and the manner in which the decision is
ultimately applied, as well as in light of possible impacts of conclusion of significant natural‑gas agreements in the economy. Regarding 2025, in the Company’s estimation the amended Excise Tax Order is not expected to have a material
impact on its results8.
|
|
|
J. |
Decision regarding methodology for determination of SMP tariff and decision with respect to determination of the maximum tariff for the supplementary tariffs – for details – see Sections 7.3.2 and 7.3.3 of Part A of the Periodic
Report.
|
| 8 |
The Company’s estimate regarding the impact of the decision with respect to the amendment to the Excise Order on the Company and the possibility of its reduction constitutes “forward‑looking” information as it
is defined in the Securities Law, regarding which there is no certainty it will be realized. Ultimately, the impacts of the amendment to the Excise Order might not be reduced and may not be expressed as a part of the generation component
due to the manner of determination of the generation component, which is not under the Company’s control.
|
| 3. |
Main Developments in the Business Environment (Cont.)
|
|
|
3.3 |
Activities in the U.S.
|
|
|
K. |
Electricity and natural gas prices
|
|
For the
|
For the
|
|||||||||||||||||||||||
|
Year Ended
|
Three Months Ended
|
|||||||||||||||||||||||
|
Region
|
December 31
|
December 31
|
||||||||||||||||||||||
|
(Power Plant)
|
2024
|
2023
|
Change
|
2024
|
2023
|
Change
|
||||||||||||||||||
|
PJM West (Shore, Maryland)
|
33.83
|
33.06
|
2
|
%
|
34.71
|
36.31
|
(4
|
)%
|
||||||||||||||||
|
PJM AEP Dayton (Fairview)
|
30.73
|
30.81
|
0
|
%
|
32.48
|
31.30
|
4
|
%
|
||||||||||||||||
|
New York Zone G (Valley)
|
37.64
|
33.27
|
13
|
%
|
46.26
|
31.52
|
47
|
%
|
||||||||||||||||
|
Mass Hub (Towantic)
|
41.47
|
36.82
|
13
|
%
|
54.49
|
34.66
|
57
|
%
|
||||||||||||||||
|
PJM ComEd (Three Rivers)
|
25.55
|
26.68
|
(4
|
)%
|
24.58
|
26.31
|
(7
|
)%
|
||||||||||||||||
|
|
* |
Based on Day‑Ahead prices as published by the relevant ISO.
|
|
Power plant
|
For the year ended December 31
|
|||||||
|
2024
|
2023
|
|||||||
|
Shore
|
(6.25
|
)
|
(8.32
|
)
|
||||
|
Maryland
|
3.59
|
2.47
|
||||||
|
Fairview
|
(2.18
|
)
|
(1.90
|
)
|
||||
|
Valley
|
(1.00
|
)
|
(1.41
|
)
|
||||
|
Towantic
|
(2.77
|
)
|
(3.02
|
)
|
||||
|
Three Rivers
|
(1.01
|
)
|
(1.18
|
)
|
||||
| 3. |
Main Developments in the Business Environment (Cont.)
|
|
|
3.3 |
Activities in the U.S. (Cont.)
|
|
|
K. |
Electricity and natural gas prices (Cont.)
|
| 3. |
Main Developments in the Business Environment (Cont.)
|
|
|
3.3 |
Activities in the U.S. (Cont.)
|
|
|
K. |
Electricity and natural gas prices (Cont.)
|
|
For the Year Ended
|
For the Three Months Ended
|
|||||||||||||||||||||||
|
Region
|
December 31
|
December 31
|
||||||||||||||||||||||
|
(Power Plant)
|
2024
|
2023
|
Change
|
2024
|
2023
|
Change
|
||||||||||||||||||
|
Texas Eastern M‑3 (Shore, Valley – 70%)
|
2.07
|
1.90
|
9
|
%
|
2.37
|
1.78
|
33
|
%
|
||||||||||||||||
|
Transco Zone 5 North (Maryland)
|
2.51
|
2.74
|
(8
|
)%
|
2.38
|
2.77
|
(14
|
)%
|
||||||||||||||||
|
Texas Eastern M‑2 (Fairview)
|
1.71
|
1.63
|
5
|
%
|
1.99
|
1.61
|
24
|
%
|
||||||||||||||||
|
Dominion South Pt (Valley – 30%)
|
1.67
|
1.63
|
2
|
%
|
1.97
|
1.64
|
20
|
%
|
||||||||||||||||
|
Algonquin City Gate (Towantic)
|
3.03
|
2.94
|
3
|
%
|
4.42
|
2.69
|
64
|
%
|
||||||||||||||||
|
Chicago City Gate (Three Rivers)
|
2.12
|
2.30
|
(8
|
)%
|
2.21
|
2.28
|
(3
|
)%
|
||||||||||||||||
| 3. |
Main Developments in the Business Environment (Cont.)
|
|
|
3.3 |
Activities in the U.S. (Cont.)
|
|
|
K. |
Electricity and natural gas prices (Cont.)
|
|
|
|
The Spark Spread is calculated based on the following formula:
|
|
For the
|
For the
|
|||||||||||||||||||||||
|
Year Ended
|
Three Months Ended
|
|||||||||||||||||||||||
|
December 31
|
December 31
|
|||||||||||||||||||||||
|
Power Plant9
|
2024
|
2023
|
Change
|
2024
|
2023
|
Change
|
||||||||||||||||||
|
Shore
|
19.55
|
19.95
|
(2
|
)%
|
18.36
|
24.03
|
(24
|
)%
|
||||||||||||||||
|
Maryland
|
16.51
|
14.15
|
17
|
%
|
18.29
|
17.20
|
6
|
%
|
||||||||||||||||
|
Valley
|
24.19
|
20.72
|
17
|
%
|
30.74
|
19.53
|
57
|
%
|
||||||||||||||||
|
Towantic
|
21.78
|
17.71
|
23
|
%
|
25.76
|
17.18
|
50
|
%
|
||||||||||||||||
|
Fairview
|
19.62
|
20.22
|
(3
|
)%
|
19.55
|
20.84
|
(6
|
)%
|
||||||||||||||||
|
Three Rivers
|
11.77
|
11.73
|
0
|
%
|
10.22
|
11.49
|
(11
|
)%
|
||||||||||||||||
|
|
* |
Based on electricity prices as shown in the above table, with a discount for the thermal conversion ratio (heat rate) of 6.9 MMBtu/MWh for Maryland, Shore and Valley, and a thermal conversion ratio of 6.5 MMBtu/MWh for Three Rivers,
Towantic and Fairview. It is clarified that the actual energy margins of the power plants of the CPV Group could be significantly different due to, among other things, the existence of Power Basis and a different breakdown in the scope of
the electricity sold in the peak and off‑peak hours in CPV’s power plants and that shown above (which was calculated based on the assumption of generation in all the hours of the 24‑hour period).
|
| 3. |
Main Developments in the Business Environment (Cont.)
|
|
|
3.3 |
Activities in the U.S. (Cont.)
|
|
|
K. |
Electricity and natural gas prices (Cont.)
|
|
|
L. |
Tax on carbon emissions (RGGI)
|
|
Average for
|
Average for
|
|||||||||||||||||||||||
|
the year ended
|
the three months ended
|
|||||||||||||||||||||||
|
December 31
|
December 31
|
|||||||||||||||||||||||
|
2024
|
2023
|
Change
|
2024
|
2023
|
Change
|
|||||||||||||||||||
|
Price of carbon emission tax in the RGGI
|
||||||||||||||||||||||||
|
tenders ($ per short ton / 2,000 pounds)*
|
19.42
|
13.02
|
49
|
%
|
25.75
|
13.85
|
86
|
%
|
||||||||||||||||
|
Cost of the carbon emission tax (in terms
|
||||||||||||||||||||||||
|
of gas cost) ($ per MMBtu)**
|
1.16
|
0.77
|
49
|
%
|
1.53
|
0.82
|
86
|
%
|
||||||||||||||||
|
|
* |
The prices of the carbon emissions tax are presented on the assumption that the price of the tender that is held prior to a certain quarter represents the price of the carbon emissions tax. For example, the tender held in December 2024
will represent the price for the first quarter of 2025. It is noted that the actual price of the carbon emissions tax could be different than the tender prices as a result of transactions made in the secondary market.
|
|
|
** |
The cost of the carbon emissions tax (in terms of gas cost) is calculated under the assumption of emissions of carbon dioxide with a reference (ratio) of 119 lbs./MMBtu. It is noted that the actual carbon dioxide emissions ratio varies
between the different power plants, and in the estimation of the CPV Group a ratio of 119 lbs./MMBtu is a representative ratio for power plants running on natural gas.
|
| 3. |
Main Developments in the Business Environment (Cont.)
|
|
|
3.3 |
Activities in the U.S. (Cont.)
|
|
|
M. |
Capacity revenues
|
|
Sub-Region
|
CPV Plants10
|
2025/2026
|
2024/2025
|
2023/2024
|
2022/2023
|
|
PJM RTO
|
269.92
|
28.92
|
34.13
|
50.00
|
|
|
PJM COMED
|
Three Rivers
|
269.92
|
28.92
|
34.13
|
–
|
|
PJM MAAC
|
Fairview, Maryland, Maple Hill
|
269.92
|
49.49
|
49.49
|
95.79
|
|
PJM EMAAC
|
Shore
|
269.92
|
54.95
|
49.49
|
97.86
|
| 3. |
Main Developments in the Business Environment (Cont.)
|
|
|
3.3 |
Activities in the U.S. (Cont.)
|
|
|
M. |
Capacity revenues (Cont.)
|
| 11 |
That stated in this Section regarding the estimate of the CPV Group constitutes “forward‑looking” information as it is defined in the Securities Law, regarding which there is no certainty it will be
realized. Ultimately, the revenues of the CPV Group from capacity could be different (even significantly) as a result of, among other things, regulatory changes (including appeal processes or other processes in the PJM market or as part
of other municipal authorities), operating factors, changes in the business environment and/or the occurrence of one or more of the risk factors to which the CPV Group is exposed. In addition, as at the approval date of the report the
increase of the additional holdings in the Shore power plant had not yet been completed, the completion of which is subject to conditions that have not yet been fulfilled and there is no certainty regarding their fulfillment.
|
| 3. |
Main Developments in the Business Environment (Cont.)
|
|
|
3.3 |
Activities in the U.S. (Cont.)
|
|
|
M. |
Capacity revenues (Cont.)
|
|
Sub-Area
|
CPV
Plants
|
Winter 2024/2025
|
Summer
2024
|
Winter 2023/2024
|
|
NYISO
Rest of the Market
|
–
|
66.30
|
168.91
|
127.25
|
|
Lower Hudson Valley
|
Valley
|
66.30
|
168.91
|
128.90
|
| 3. |
Main Developments in the Business Environment (Cont.)
|
|
|
3.3 |
Activities in the U.S. (Cont.)
|
|
|
M. |
Capacity revenues (Cont.)
|
|
Sub-Region
|
CPV Power Plants
|
2027/2028
|
2026/2027
|
2025/2026
|
|
ISO-NE
Rest of the Market
|
Towantic
|
117.70
|
85.15
|
85.15
|
| 4. |
Analysis of the results of operations for the Year Ended December 31, 2024 (in millions of NIS)
|
| 4. |
Analysis of the results of operations for the Year Ended December 31, 2024 (in millions of NIS) (Cont.)
|
|
|
A. |
Statement of income
|
|
For the Year Ended
|
||||||||
|
Section
|
December 31
|
|||||||
|
|
2024
|
2023
|
||||||
|
Revenues from sales and provision of services (1)
|
2,779
|
2,552
|
||||||
|
Cost of sales and provision of services (without depreciation and amortization) (2)
|
(1,931
|
)
|
(1,827
|
)
|
||||
|
Depreciation and amortization
|
(317
|
)
|
(288
|
)
|
||||
|
Gross profit
|
531
|
437
|
||||||
|
Administrative and general expenses
|
(263
|
)
|
(212
|
)
|
||||
|
Share in earnings of associated companies
|
166
|
242
|
||||||
|
Business development expenses
|
(45
|
)
|
(58
|
)
|
||||
|
Compensation for lost revenues
|
44
|
41
|
||||||
|
Other expenses, net
|
(56
|
)
|
(16
|
)
|
||||
|
Gain on loss of control in the renewable energies segment in the U.S.
|
259
|
–
|
||||||
|
Operating income
|
636
|
434
|
||||||
|
Financing expenses, net
|
(252
|
)
|
(197
|
)
|
||||
|
Loss from extinguishment of financial liabilities
|
(49
|
)
|
–
|
|||||
|
Income before taxes on income
|
335
|
237
|
||||||
|
Taxes on income expenses
|
(138
|
)
|
(68
|
)
|
||||
|
Net income for the year*
|
197
|
169
|
||||||
|
Attributable to:
|
||||||||
|
The Company’s shareholders
|
111
|
144
|
||||||
|
Holders of non‑controlling interests
|
86
|
25
|
||||||
|
|
* |
For an analysis of the change in the net income and a definition and analysis of the change in the adjusted net income – see Section 4G below.
|
| 4. |
Analysis of the results of operations for the Year Ended December 31, 2024 (in millions of NIS) (Cont.)
|
|
|
A. |
Statement of income (Cont.)
|
|
Revenues
|
For the
|
Board’s Explanations
|
|||||||
|
Year Ended
|
|||||||||
|
December 31
|
|||||||||
|
2024
|
2023
|
||||||||
|
Revenues in Israel
|
|||||||||
|
Revenues from sale of energy to private customers
|
1,368
|
1,424
|
|||||||
|
Revenues from sale of energy to the System Operator and to other suppliers
|
165
|
120
|
Most of the increase, in the amount of about NIS 32 million, stems from the commercial operation of Zomet at the end of the second quarter of
2023.
|
||||||
|
Revenues in respect of capacity payments
|
171
|
59
|
Most of the increase stems from the commercial operation of Zomet at the end of the second quarter of 2023.
|
||||||
|
Revenues from sale of energy at cogeneration tariff
|
83
|
82
|
|||||||
|
Revenues from sale of steam
|
57
|
59
|
|||||||
|
Other revenues
|
23
|
59
|
Most of the decline derives from sales of electricity recognized in the corresponding period last year, in the amount of about NIS 26 million,
from the Zomet power plant prior to the commercial operation at the end of June 2023.
|
||||||
|
Total revenues from sale of energy and others in Israel (without infrastructure services)
|
1,867
|
1,803
|
|||||||
|
Revenues from private customers in respect of infrastructure services
|
445
|
480
|
|||||||
|
Total revenues in Israel
|
2,312
|
2,283
|
|||||||
|
Revenues in the U.S.
|
|||||||||
|
Revenues from sale of electricity from renewable energy
|
195
|
136
|
The increase derives mainly from the first‑time consolidation of the Mountain Wind project starting from the second quarter of 2023 and the
commercial operation of the Maple Hill and Stagecoach projects starting from the fourth quarter of 2023 and the second quarter of 2024, respectively. This increase was partly offset by discontinuance of consolidation of renewable energies
segment in November 2024, deriving from loss of control in CPV Renewable and as a result of transition to the equity method of accounting. For additional details – see Note 23E to the Financial Statements.
|
||||||
|
Revenues from sale of electricity (retail) activities and others
|
272
|
133
|
The increase stems mainly from an increase in the scope of the activities.
|
||||||
|
Total revenues in the U.S.
|
467
|
269
|
|||||||
|
Total revenues
|
2,779
|
2,552
|
|||||||
| 4. |
Analysis of the results of operations for the Year Ended December 31, 2024 (in millions of NIS) (Cont.)
|
|
|
A. |
Statement of income (Cont.)
|
|
|
(2) |
Changes in the cost of sales and provision of services (not including depreciation and amortization):
|
|
Cost of Sales and
Provision of Services
|
For the
Year Ended
|
Board’s Explanations
|
|||||||
|
December 31
|
|||||||||
|
2024
|
2023
|
||||||||
|
Cost of sales in Israel
|
|||||||||
|
Natural gas and diesel oil
|
645
|
663
|
|||||||
|
Expenses in respect of acquisition of energy
|
320
|
303
|
Most of the increase stems mainly from the background of the maintenance work at the Rotem power plant in the first half of 2024 and the Gat power
plant in the second half of 2024.
|
||||||
|
Cost of transmission of gas
|
55
|
41
|
The increase stems mainly from the first‑time consolidation of Gat, starting from the second quarter of 2023 and the commercial operation of Zomet
starting from the end of the second quarter of 2023.
|
||||||
|
Salaries and related expenses
|
46
|
37
|
|||||||
|
Operating expenses
|
120
|
87
|
The increase stems mainly from the first‑time consolidation of Gat commencing from the second quarter of 2023 and the commercial operation of
Zomet starting from the end second quarter of 2023.
|
||||||
|
Other expenses
|
18
|
65
|
In 2023, includes mainly natural gas and other at the Zomet power plant prior to commercial operation at the end of June 2023.
|
||||||
|
Total cost of sales in Israel without infrastructure services
|
1,204
|
1,196
|
|||||||
|
Expenses in respect of infrastructure services
|
445
|
480
|
|||||||
|
Total cost of sales in Israel
|
1,649
|
1,676
|
|||||||
| 4. |
Analysis of the results of operations for the Year Ended December 31, 2024 (in millions of NIS) (Cont.)
|
|
|
A. |
Statement of income (Cont.)
|
|
|
(2) |
Changes in the cost of sales and provision of services (not including depreciation and amortization): (Cont.)
|
|
Cost of sales and services in the U.S.
|
|||||||||
|
Cost of sales in respect of sale of electricity from renewable energy
|
60
|
49
|
The increase stems mainly from the first‑time consolidation of the Mountain Wind project, commencing from the second quarter of 2023 and
commercial operation of the Maple Hill and Stagecoach projects, starting from the fourth quarter of 2023 and the second quarter of 2024, respectively. This increase was partly offset by discontinuance of consolidation of renewable
energies segment in November 2024 deriving from loss of control in CPV Renewable and as a result of transition to the equity method of accounting. For additional details – see Note 23E to the Financial Statements.
|
||||||
|
Cost of sales in respect of sale of electricity (Retail) and others
|
222
|
102
|
The increase stems mainly from an increase in the scope of the activities.
|
||||||
|
Total cost of sales and provision of services in the U.S.
|
282
|
151
|
|||||||
|
Total cost of sales and provision of services
|
1,931
|
1,827
|
|||||||
| 4. |
Analysis of the results of operations for the Year Ended December 31, 2024 (in millions of NIS) (Cont.)
|
|
|
B. |
EBITDA, FFO and net cash flows after debt service
|
|
|
1. |
EBITDA indices
|
|
|
2. |
“FFO” (funds from operations) – with respect to active projects – cash flows from current operating activities for the period (including changes in working capital) and less investments in property, plant and equipment and
periodic maintenance costs that are not included in the operating activities and less net interest payments. With respect to the rest of the Group’s activities – cash flows from current operating activities for the period (including
changes in working capital) and less net interest payments (to the extent they do not relate to projects under construction). It is clarified that investments in property, plant and equipment (under construction and/or in development)
including the net interest payments in respect thereof, are not included in FFO.
|
|
|
3. |
“Net cash flows after service of project debt” – the “FFO” less/plus payment of principal in respect of financial debt and/or taking out of project debt and non‑project debt (loans and/or debentures), and after adjustments for a
change in other credit from banks and a change in cash, including cash restricted for debt service and deposits (including to secure transactions hedging electricity margins).
|
| 12 |
It is clarified that income in respect of lost profits is included in EBITDA in the consolidated statements.
|
| 4. |
Analysis of the results of operations for the Year Ended December 31, 2024 (in millions of NIS) (Cont.)
|
|
|
B. |
EBITDA, FFO and net cash flows after debt service (Cont.)
|
|
For the Year Ended
|
||||||||
|
December 31
|
||||||||
|
2024
|
2023
|
|||||||
|
Revenues from sales and provision of services
|
2,779
|
2,552
|
||||||
|
Cost of sales (without depreciation and amortization)
|
(1,931
|
)
|
(1,827
|
)
|
||||
|
Administrative and general expenses (without depreciation and amortization)
|
(247
|
)
|
(197
|
)
|
||||
|
Business development expenses
|
(45
|
)
|
(58
|
)
|
||||
|
Share in income of associated companies
|
166
|
242
|
||||||
|
Compensation for lost revenues
|
44
|
41
|
||||||
|
Consolidated EBITDA
|
766
|
753
|
||||||
|
Elimination of the share in income of associated companies
|
(166
|
)
|
(242
|
)
|
||||
|
Plus – Group’s share of the proportionate EBITDA of associated companies
|
||||||||
|
in the Energy Transition segment (1)
|
592
|
588
|
||||||
|
Plus – Group’s share of the proportionate EBITDA of activities in the
|
||||||||
|
renewable energies segment in the U.S. (2)
|
16
|
–
|
||||||
|
EBITDA after proportionate consolidation
|
1,208
|
1,099
|
||||||
| 13 |
It is noted that other companies might define EBITDA and FFO indices differently.
|
| 4. |
Analysis of the results of operations for the Year Ended December 31, 2024 (in millions of NIS) (Cont.)
|
|
|
B. |
EBITDA, FFO and net cash flows after debt service (Cont.)
|
|
|
(1) |
Calculation of the Group’s share in the proportionate EBITDA, FFO and net cash flows after service of project debt of associated companies in the Energy Transition segment (in millions of NIS):
|
|
For the year ended
December 31, 2024
|
Fairview
|
Towantic
|
Maryland
|
(1)
Shore |
Valley
|
Three
Rivers
|
Total
|
|||||||||||||||||||||
|
Revenues from sales of energy
|
206
|
217
|
185
|
155
|
352
|
61
|
1,176
|
|||||||||||||||||||||
|
Cost of natural gas
|
91
|
98
|
73
|
73
|
127
|
36
|
498
|
|||||||||||||||||||||
|
Carbon emissions tax (RGGI)
|
–
|
41
|
33
|
47
|
80
|
–
|
201
|
|||||||||||||||||||||
|
Cost of sales – other expenses (without
|
||||||||||||||||||||||||||||
|
depreciation and amortization)
|
2
|
4
|
8
|
6
|
7
|
2
|
29
|
|||||||||||||||||||||
|
Gain (loss) on realization of transactions
|
||||||||||||||||||||||||||||
|
hedging the electricity margins
|
21
|
(12
|
)
|
(3
|
)
|
14
|
47
|
17
|
84
|
|||||||||||||||||||
|
Net energy margin
|
134
|
62
|
68
|
43
|
185
|
40
|
532
|
|||||||||||||||||||||
|
Revenues from capacity payments
|
18
|
122
|
16
|
19
|
58
|
4
|
237
|
|||||||||||||||||||||
|
Other income
|
4
|
6
|
9
|
6
|
3
|
2
|
30
|
|||||||||||||||||||||
|
Gross profit
|
156
|
190
|
93
|
68
|
246
|
46
|
799
|
|||||||||||||||||||||
|
Fixed costs (without depreciation and
|
||||||||||||||||||||||||||||
|
amortization)
|
14
|
21
|
28
|
28
|
76
|
13
|
180
|
|||||||||||||||||||||
|
Administrative and general expenses
|
||||||||||||||||||||||||||||
|
(without depreciation and amortization)
|
5
|
4
|
5
|
5
|
8
|
2
|
29
|
|||||||||||||||||||||
|
Gain (loss) from revaluation of unrealized
|
||||||||||||||||||||||||||||
|
hedging transactions
|
10
|
(1
|
)
|
(1
|
)
|
(6
|
)
|
–
|
–
|
2
|
||||||||||||||||||
|
Group’s share in proportionate
EBITDA in the Energy
|
||||||||||||||||||||||||||||
|
Transition segment (2)
|
147
|
164
|
59
|
29
|
162
|
31
|
592
|
|||||||||||||||||||||
|
Group’s share in FFO
|
106
|
157
|
21
|
18
|
68
|
15
|
385
|
|||||||||||||||||||||
|
Net cash flows after service of
project debt (3)
|
(4)289 |
|
65
|
8
|
17
|
(1
|
)
|
10
|
388
|
|||||||||||||||||||
| (1) |
At the Shore power plant – gas transmission costs (totaling in 2024 about NIS 22 million) are classified in accordance with IFRS 16 as depreciation expenses and, accordingly, are not included in the EBITDA.
|
| (2) |
It is noted that the increase in the holdings in the Shore and Maryland power plants in the fourth quarter of 2024, as detailed in Note 24C to the financial statements, did not have a significant impact on the results of the Energy
Transition segment in the U.S. in 2024.
|
| (3) |
It is pointed out that the financing agreements of the CPV Group include arrangements for mechanisms of the “cash sweep” type, in the framework of which all or part of the free cash flows of the projects is designated for repayment of
loan principal on a current basis along with a predetermined minimum repayment schedule relating to every long‑term loan. Accordingly, there could be an acceleration of execution of repayments upon occurrence of certain events and there
are also restrictions on distributions of dividends.
|
| (4) |
The net cash flows after debt service in Fairview include taking out of additional financing for the project as part of a refinancing made in the third quarter of 2024 (which was distributed as a dividend to the partners in the
project). For details – see Section 8.17.4 of Part A of the Periodic Report.
|
| 4. |
Analysis of the results of operations for the Year Ended December 31, 2024 (in millions of NIS) (Cont.)
|
|
|
B. |
EBITDA, FFO and net cash flows after debt service (Cont.)
|
|
|
(1) |
Calculation of the Group’s share in the proportionate EBITDA, FFO and net cash flows after service of project debt of associated companies (in millions of NIS):
|
|
For the year ended
December 31, 2023
|
Fairview
|
Towantic
|
Maryland
|
(1)
Shore |
Valley
|
(2)
Three
Rivers
|
Total
|
|||||||||||||||||||||
|
Revenues from sales of energy
|
191
|
181
|
156
|
147
|
268
|
28
|
971
|
|||||||||||||||||||||
|
Cost of natural gas
|
81
|
90
|
77
|
71
|
107
|
17
|
443
|
|||||||||||||||||||||
|
Carbon emissions tax (RGGI)**
|
(1
|
)
|
27
|
20
|
29
|
43
|
–
|
118
|
||||||||||||||||||||
|
Cost of sales – other expenses (without
|
||||||||||||||||||||||||||||
|
depreciation and amortization)
|
2
|
3
|
7
|
6
|
6
|
–
|
24
|
|||||||||||||||||||||
|
Gain on realization of transactions hedging
|
||||||||||||||||||||||||||||
|
the electricity margins
|
32
|
(2
|
)
|
8
|
(1
|
)
|
77
|
–
|
114
|
|||||||||||||||||||
|
Net energy margin
|
141
|
59
|
60
|
40
|
189
|
11
|
500
|
|||||||||||||||||||||
|
Revenues from capacity payments
|
23
|
106
|
24
|
25
|
57
|
2
|
237
|
|||||||||||||||||||||
|
Other income
|
2
|
3
|
3
|
5
|
4
|
1
|
18
|
|||||||||||||||||||||
|
Gross profit
|
166
|
168
|
87
|
70
|
250
|
14
|
755
|
|||||||||||||||||||||
|
Fixed costs (without depreciation and
|
||||||||||||||||||||||||||||
|
amortization)
|
12
|
19
|
19
|
26
|
68
|
4
|
148
|
|||||||||||||||||||||
|
Administrative and general expenses
|
||||||||||||||||||||||||||||
|
(without depreciation and amortization)
|
4
|
5
|
4
|
5
|
8
|
1
|
27
|
|||||||||||||||||||||
|
Gain (loss) from revaluation of unrealized
|
||||||||||||||||||||||||||||
|
hedging transactions
|
(9
|
)
|
56
|
(1
|
)
|
(39
|
)
|
–
|
1
|
8
|
||||||||||||||||||
|
Group’s share in proportionate
EBITDA in the Energy
|
||||||||||||||||||||||||||||
|
Transition segment
|
141
|
200
|
63
|
–
|
174
|
10
|
588
|
|||||||||||||||||||||
|
Group’s share in FFO
|
124
|
103
|
(3)15 |
|
(4)5 |
|
75
|
–
|
322
|
|||||||||||||||||||
|
Net cash flows after service of project debt
|
11
|
(37
|
)
|
10
|
(8
|
)
|
11
|
–
|
(13
|
)
|
||||||||||||||||||
| (1) |
At the Shore power plant – gas transport costs (totaling in 2023 about NIS 22 million) are classified in accordance with IFRS 16 as depreciation expenses and, accordingly, are not included in the EBITDA.
|
| (2) |
The financial results of Three Rivers are included starting from the commercial operation date, which took place in the third quarter of 2023.
|
| (3) |
The FFO in 2023 includes a payment in respect of project for upgrading facilities in the Maryland power plant, in the amount of about NIS 8 million.
|
| (4) |
The FFO in 2023 includes a payment, in the amount of about NIS 9 million, in respect of significant maintenance work performed.
|
| 4. |
Analysis of the results of operations for the Year Ended December 31, 2024 (in millions of NIS) (Cont.)
|
|
|
B. |
EBITDA, FFO and net cash flows after debt service (Cont.)
|
|
|
(2) |
Calculation of the Group’s share in EBITDA after proportionate consolidation of the renewable energies segment (in NIS millions):
|
|
January–
|
November–
|
Total
|
||||||||||||||
|
October
|
December
|
2024
|
Total
|
|||||||||||||
|
2024
|
2024
|
Proportionate
|
2023
|
|||||||||||||
|
Consolidated
|
Associated
|
Consolidation
|
Consolidated
|
|||||||||||||
|
Revenues
|
203
|
29
|
232
|
136
|
||||||||||||
|
Fixed costs (without depreciation and
|
||||||||||||||||
|
amortization)
|
(61
|
)
|
(5
|
)
|
(66
|
)
|
(41
|
)
|
||||||||
|
Administrative and general
|
(26
|
)
|
(4
|
)
|
(30
|
)
|
(23
|
)
|
||||||||
|
EBITDA from active projects
|
126
|
20
|
142
|
72
|
||||||||||||
|
Business development and other costs
|
(26
|
)
|
(4
|
)
|
(30
|
)
|
(41
|
)
|
||||||||
|
Share of the Group in EBITDA after
|
||||||||||||||||
|
proportionate consolidation in the renewable
|
||||||||||||||||
|
energies segment in the U.S.
|
96
|
16
|
112
|
31
|
||||||||||||
| 4. |
Analysis of the results of operations for the Year Ended December 31, 2024 (in millions of NIS) (Cont.)
|
|
|
B. |
EBITDA, FFO and net cash flows after debt service (Cont.)
|
|
|
(3) |
Set forth below is a breakdown of the EBITDA after proportionate consolidation data broken down by subsidiaries (on a consolidated basis) and the associated companies (on a proportionate basis, based on the rate of the holdings of the
CPV Group therein) as well as FFO and cash flows after service of project debt data (in NIS millions):
|
|
For the year ended
|
For the year ended
|
|||||||||||||||||||||||||||
|
Main projects in operation
|
Basis of
|
December 31, 2024
|
December 31, 2023
|
|||||||||||||||||||||||||
|
presentation
|
Net cash
|
Net cash
|
||||||||||||||||||||||||||
|
in the
|
EBITDA
|
flows
|
EBITDA
|
flows
|
||||||||||||||||||||||||
|
Company’s
|
after
|
after
|
after
|
after
|
||||||||||||||||||||||||
|
financial
|
proportionate
|
debt
|
proportionate
|
debt
|
||||||||||||||||||||||||
|
statements
|
consolidation
|
FFO
|
service
|
consolidation
|
FFO
|
service
|
||||||||||||||||||||||
|
Total operating projects in Israel and
|
||||||||||||||||||||||||||||
|
accompanying business activities (1)
|
Consolidated
|
670
|
498
|
(9)(8)361 |
|
602
|
483
|
412
|
||||||||||||||||||||
|
Business development costs,
|
||||||||||||||||||||||||||||
|
headquarters in Israel and other costs
|
Consolidated
|
(31
|
)
|
(70
|
)
|
(9)(8)59 |
|
(40
|
)
|
(43
|
)
|
(43
|
)
|
|||||||||||||||
|
Total Israel
|
639
|
428
|
420
|
562
|
440
|
369
|
||||||||||||||||||||||
|
Total operating projects (2)
|
Associated
|
592
|
385
|
388
|
589
|
322
|
(13
|
)
|
||||||||||||||||||||
|
Other costs
|
Consolidated
|
(4
|
)
|
(14
|
)
|
(14
|
)
|
(4
|
)
|
(4
|
)
|
(4
|
)
|
|||||||||||||||
|
Total energy transition in the U.S.
|
588
|
371
|
374
|
585
|
318
|
(17
|
)
|
|||||||||||||||||||||
|
Total operating projects (2) (3)
|
Associated
|
142
|
74
|
14
|
72
|
54
|
6
|
|||||||||||||||||||||
|
Business development and other costs
|
Associated
|
(30
|
)
|
(23
|
)
|
(23
|
)
|
(41
|
)
|
(41
|
)
|
(41
|
)
|
|||||||||||||||
|
Total renewable energy in the U.S.
|
|
|
112
|
51
|
(9
|
)
|
31
|
13
|
(35
|
)
|
||||||||||||||||||
|
Total activities as part of the “others”
|
||||||||||||||||||||||||||||
|
segment (4)
|
Consolidated
|
(22
|
)
|
(22
|
)
|
(22
|
)
|
(26
|
)
|
(26
|
)
|
(26
|
)
|
|||||||||||||||
|
Headquarters in the United States (5) (6)
|
Consolidated
|
(89
|
)
|
(61
|
)
|
(61
|
)
|
(26
|
)
|
(41
|
)
|
(41
|
)
|
|||||||||||||||
|
Total United States
|
589
|
339
|
282
|
564
|
264
|
(119
|
)
|
|||||||||||||||||||||
|
Company headquarters (not allocated
|
||||||||||||||||||||||||||||
|
to the segments)
|
Consolidated
|
(20
|
)
|
(41
|
)
|
(37
|
)
|
(27
|
)
|
(56
|
)
|
(87
|
)
|
|||||||||||||||
|
Total consolidated (7)
|
1,208
|
726
|
665
|
1,099
|
648
|
163
|
||||||||||||||||||||||
| (1) |
The accompanying business activities in Israel include mainly virtual supply activities through OPC Israel, sale of electricity from facilities for generation of energy on the customer’s premises through a subsidiary (indirect) and
sale/purchase of natural gas, including with third parties through OPC Natural Gas.
|
| (2) |
For details regarding active projects in the Energy Transition segment in the U.S. – see Section 1 above and regarding calculation of the Group’s share in the EBITDA after proportionate consolidation of the Renewable Energies segment –
see Section 2 above.
|
| (3) |
Due to completion of the transaction for investment in the area of renewable energies in the U.S. in November 2024, the data of this segment in the U.S. is calculated from this date on the basis of proportionate consolidation where the
share of the CPV Group is 66.67%.
|
| (4) |
Includes mainly business development and other costs in the area of initiation and development of high‑efficiency power plants running on natural gas, with future carbon capture potential, and the results of the retail activities in
the U.S.
|
| (5) |
Most of the change in the year of the report compared with the same period last year, in the amount of $45 million, is with respect to a profit participation plan for employees of the CPV Group, which is measured at fair value. For
details – see Note 16 to the financial statements.
|
| (6) |
After elimination of management fees between the CPV Group and the Company, in the amounts of about NIS 31 million and about NIS 29 million for the years ended December 31, 2024 and 2023, respectively.
|
| (7) |
In the period of the report, the consolidated FFO without adjustments for changes in the working capital was about NIS 663 million (in the corresponding period last year – about NIS 606 million).
|
| (8) |
Net cash flows after debt service is presented net and includes taking out of the corporate credit in OPC Israel less early repayment of the project financing in Zomet and Gat. For details – see Note 14B(1) to the financial statements.
|
| (9) |
Not including intercompany activities between the Company and the subsidiaries in Israel.
|
| 4. |
Analysis of the results of operations for the Year Ended December 31, 2024 (in millions of NIS) (Cont.)
|
|
|
C. |
Analysis of the change in EBITDA – Israel segment
|
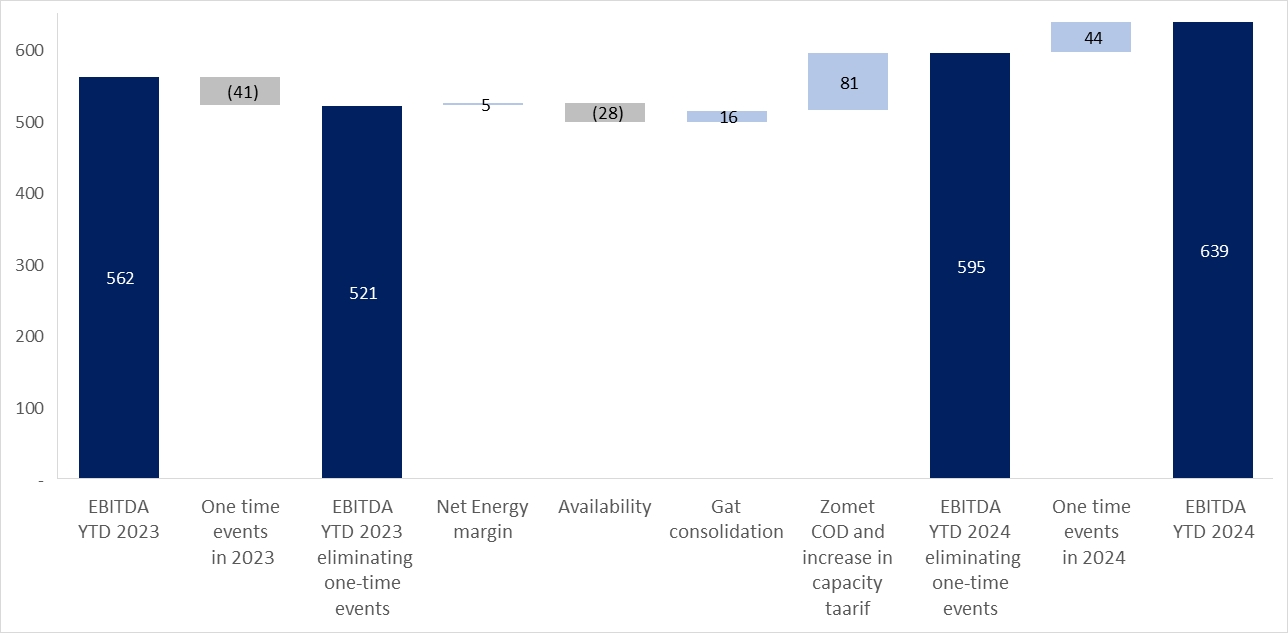
|
|
1. |
Availability (operational) – as stated in Section 7.11.1 of Part A of the Periodic Report, in the period of the report, the Rotem power plant was shut down during March 2024 for purposes of planned maintenance work, which lasted
for 17 days, which negatively impacted its results in the period of the report, including compared with the corresponding period last year. In addition, the Gat power plant was shut down in July through November 2024 for purposes of
unplanned maintenance due to a breakdown that caused a shutdown of the power plant’s activities and had a negative impact on its results in the period of the report including compared with the corresponding period last year.
|
| 4. |
Analysis of the results of operations for the Year Ended December 31, 2024 (in millions of NIS) (Cont.)
|
|
|
C. |
Analysis of the change in EBITDA – Israel segment (Cont.)
|
|
|
2. |
Commercial operation and increase in capacity tariffs in Zomet – the financial results of Zomet are included starting from the commercial operation, at the end of June 2024. For details regarding an increase in the capacity
tariffs at the Zomet power plant in January 2024 – see Section 7.13 of Part A of the Periodic Report.
|
|
|
3. |
One‑time events – in 2023, includes mainly signing of a compromise agreement with Hadera’s construction contractor whereby revenues were recognized, in the amount of about NIS 41 million in respect of lost revenues caused to
Hadera due to a delay in the commercial operation of the power plant and non‑recurring income, in the amount of about NIS 18 million, as described in Note 26C(3) to the Financial Statements, while on the other hand expenses of about
NIS 18 million are also included, relating to pre‑commercial operation of the Zomet power plant, at the end of June 2023. In addition, in the period of the report, an amendment to the agreement was signed with Zomet’s construction
contractor, in the framework of which, among other things, the construction contractor paid Zomet compensation, in the amount of about NIS 26 million (about $7 million) in respect of a loss of revenues caused to Zomet due to delay in the
commercial operation date of the power plant. For additional details – see Note 26A(3) to the Financial Statements. Furthermore, in the third quarter of 2024, Hadera received a one‑time amount from its insurers of about NIS 18 million
($5 million) in connection with lost profits that preceded the commercial operation of the power plant. For additional details – see Note 26A(2) to the Financial Statements.
|
| 14 |
That stated constitutes “forward‑looking” information as it is defined in the Securities Law. Ultimately, there could be delays in completion of the required clarification and repairs and/or other operation limitations as a result of,
among other things, technical and/or operational factors and/or factors relating to the construction contractor.
|
| 4. |
Analysis of the results of operations for the Year Ended December 31, 2024 (in millions of NIS) (Cont.)
|
|
|
D. |
Analysis of the change in EBITDA after proportionate consolidation – energy transition segment in the U.S.
|
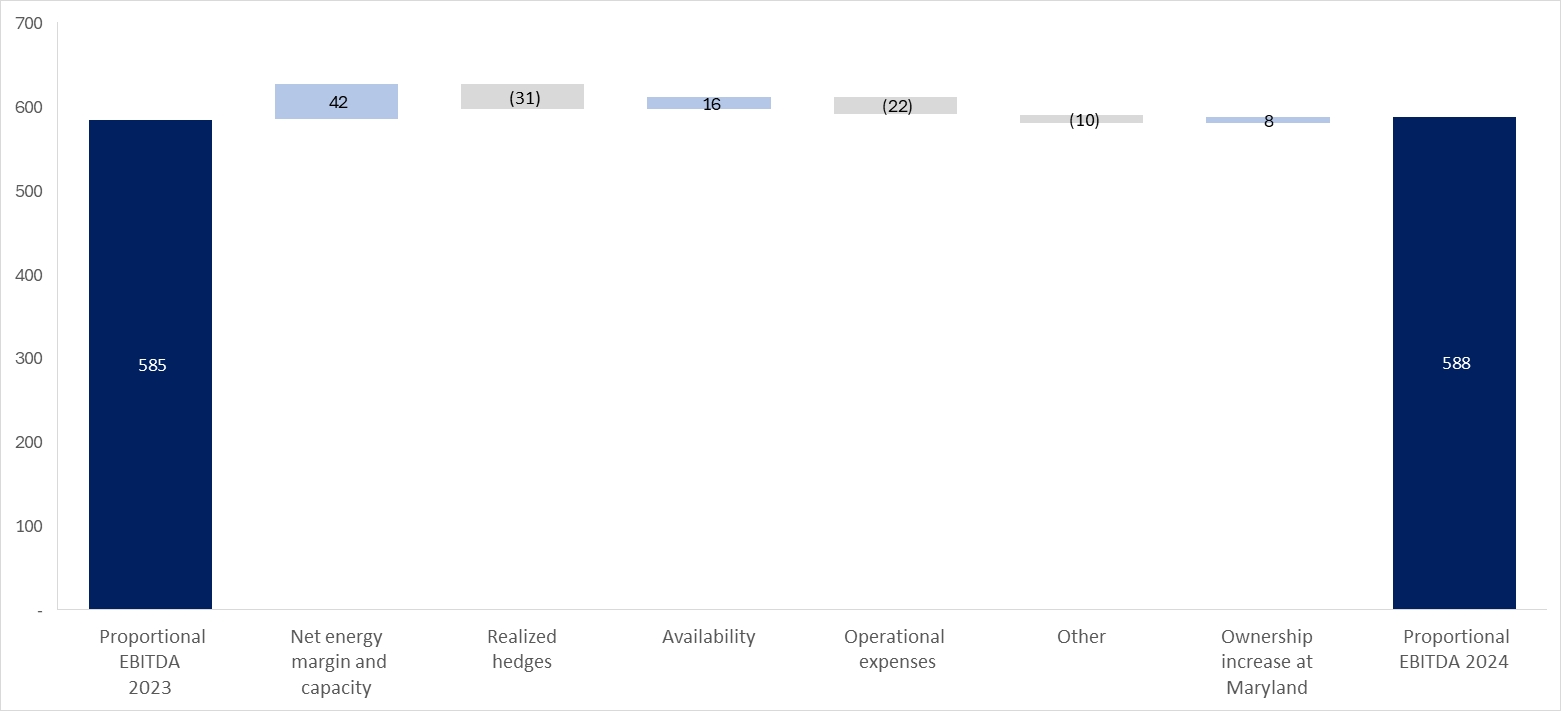
|
|
(1) |
Reflects the results of the Maryland power plant deriving from completion of two transactions for increase of the holdings in Maryland in October and December 2024 at the rate of 25% each. For details – see Note 24C to the financial
statements.
|
|
|
(2) |
The increase in the operating expenses in the year of the report compared with last year stems mainly from the commercial operation of the Three Rivers power plant in 2023 and from unplanned maintenance performed at the Maryland power
plant in 2024.
|
| 4. |
Analysis of the results of operations for the Year Ended December 31, 2024 (in millions of NIS) (Cont.)
|
|
|
E. |
Renewable energies segment in the U.S.
|
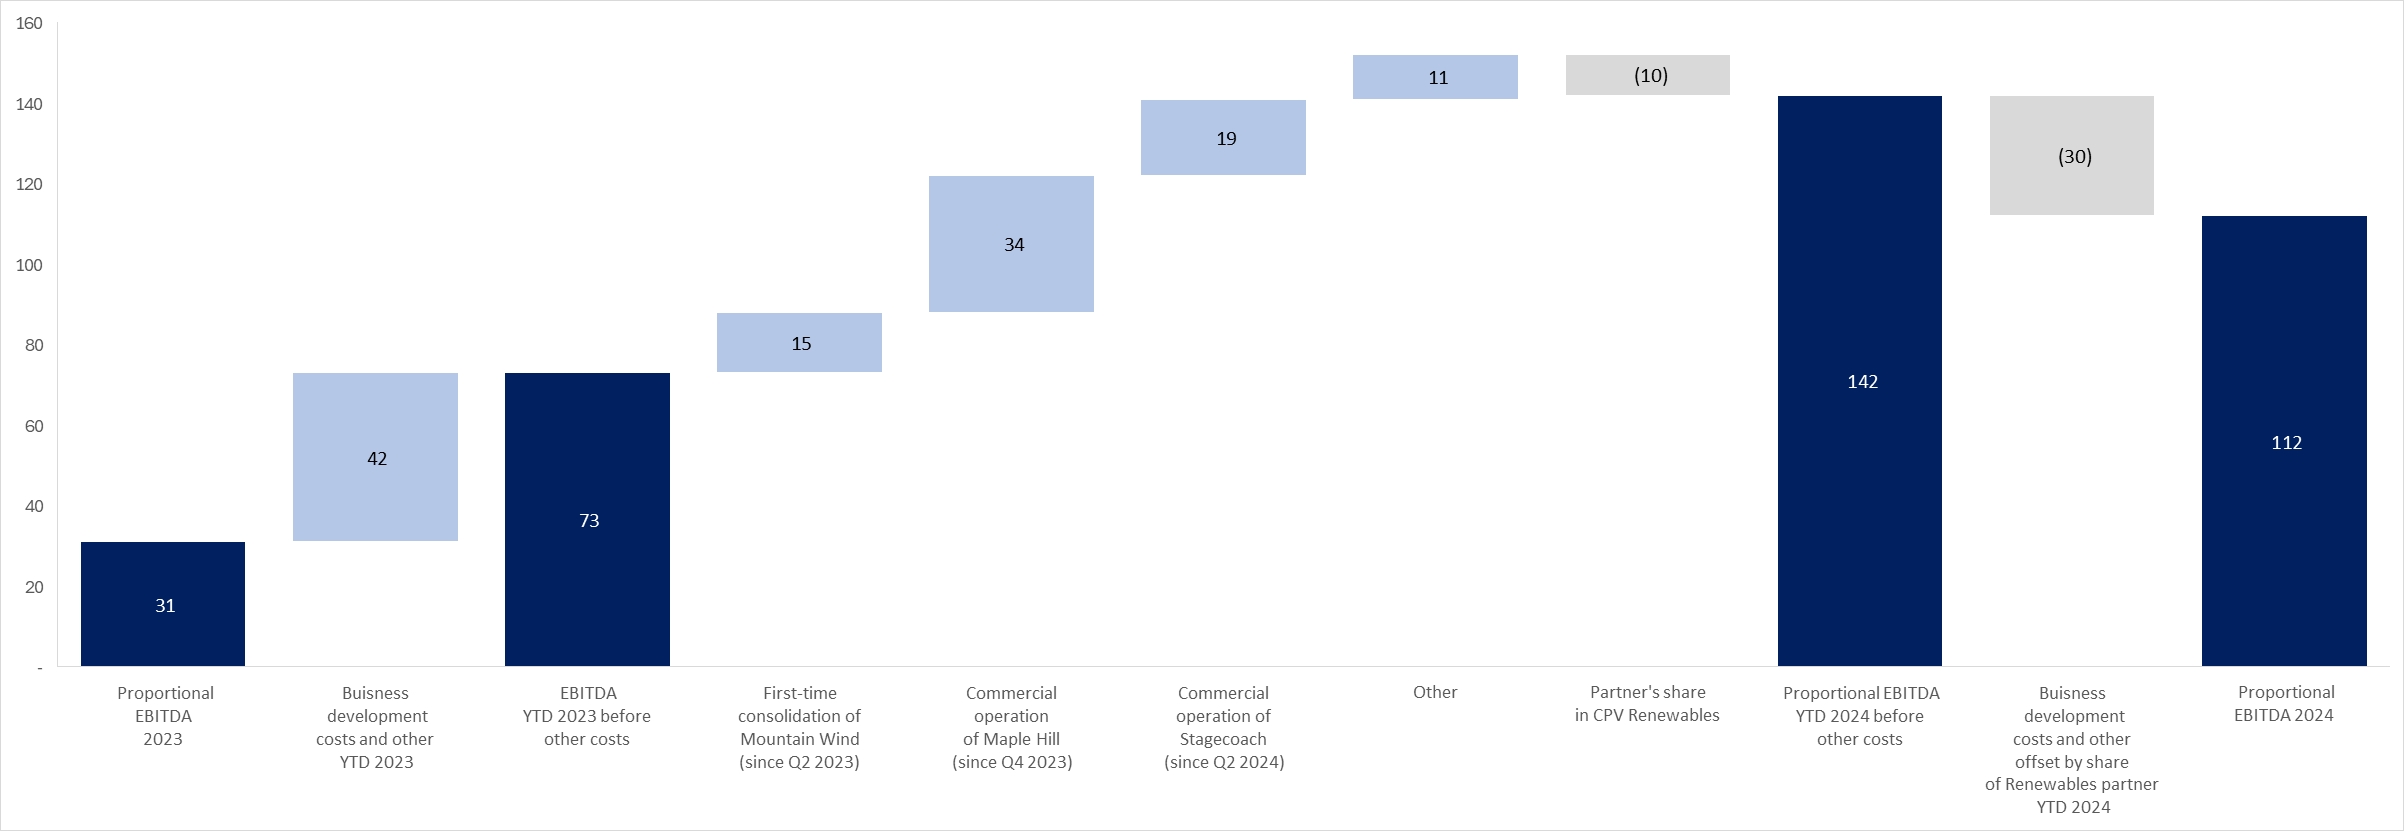
| 4. |
Analysis of the results of operations for the Year Ended December 31, 2024 (in millions of NIS) (Cont.)
|
|
|
F. |
Additional details regarding energy hedges and guaranteed capacity payments in the Energy Transition segment in the U.S.
|
|
2025
|
||||
|
Expected generation (MWh)
|
11,737,301
|
|||
|
Net scope of the hedged energy margin (% of the expected generation of the power plants) (*)
|
53%
|
|
||
|
Net hedged energy margin (millions of $)
|
|
≈ 110.2
(≈ NIS 408 million)
|
||
|
Net hedged energy margin ($/MWh)
|
17.55
|
|||
|
Net market prices of energy margin ($/MWh) (**)
|
14.53
|
|||
|
|
(*) |
Pursuant to the policy for hedging electricity margins as at the date of the report, in general the CPV Group seeks to hedge up to 50% of the scope of the expected generation. The actual hedge rate could ultimately be different.
|
|
|
(**) |
The net energy margin is the energy margin (Spark Spread) plus/minus Power Basis less carbon tax (RGGI) and other variable costs. For details regarding the manner of calculation of the electricity margin (Spark Spread) – see
Section 3.3K above. The market prices of energy margin are based on future contracts for electricity and natural gas.
|
|
15
|
The scope of the hedging and the scope of the capacity revenues in respect of a transaction for acquisition of additional holdings in Shore, which has not yet been completed, were
calculated and are presented in this Section on the basis of the estimates of the CPV Group that the transaction will be completed in April 2025.
|
|
16
|
The estimated percentages and the actual hedged energy margins could change due to new hedges and/or sales of capacity made or as a result of changes in market conditions or the hedging
policy of the CPV Group. That stated in this Section with respect to the energy margin and availability receipts constitutes “forward‑looking” information as it is defined in the Securities Law, which
may change due to, among other things, operating factors and availability of the power plant, market conditions, regulatory changes and/or occurrence of one or more of the risk factors as stated in Section 19 of Part A of the Periodic
Report.
|
| 4. |
Analysis of the results of operations for the Year Ended December 31, 2024 (in millions of NIS) (Cont.)
|
|
|
F. |
Additional details regarding energy hedges and guaranteed capacity payments in the Energy Transition segment in the U.S. (Cont.)
|
|
2025
|
||||
|
Scope of the secured capacity revenues (% of the power plant’s capacity)
|
93%
|
|
||
|
Capacity receipts (millions of $)
|
≈ 112.5
(≈ NIS 416 million)
|
|||
|
|
G. |
Net income and adjusted net income (in millions of NIS)
|
|
|
1. |
Definitions
|
|
17
|
It is noted that starting from 2024, the Company does not include in its financial statements adjusted net income after adjustments, as defined in Section 4A of the Directors’ Report
for 2023 due to the insignificance of the adjustments and, accordingly, the irrelevancy of the said index.
|
| 4. |
Analysis of the results of operations for the Year Ended December 31, 2024 (in millions of NIS) (Cont.)
|
|
|
G. |
Analysis of the change in net income and adjusted net income (in millions of NIS)
|
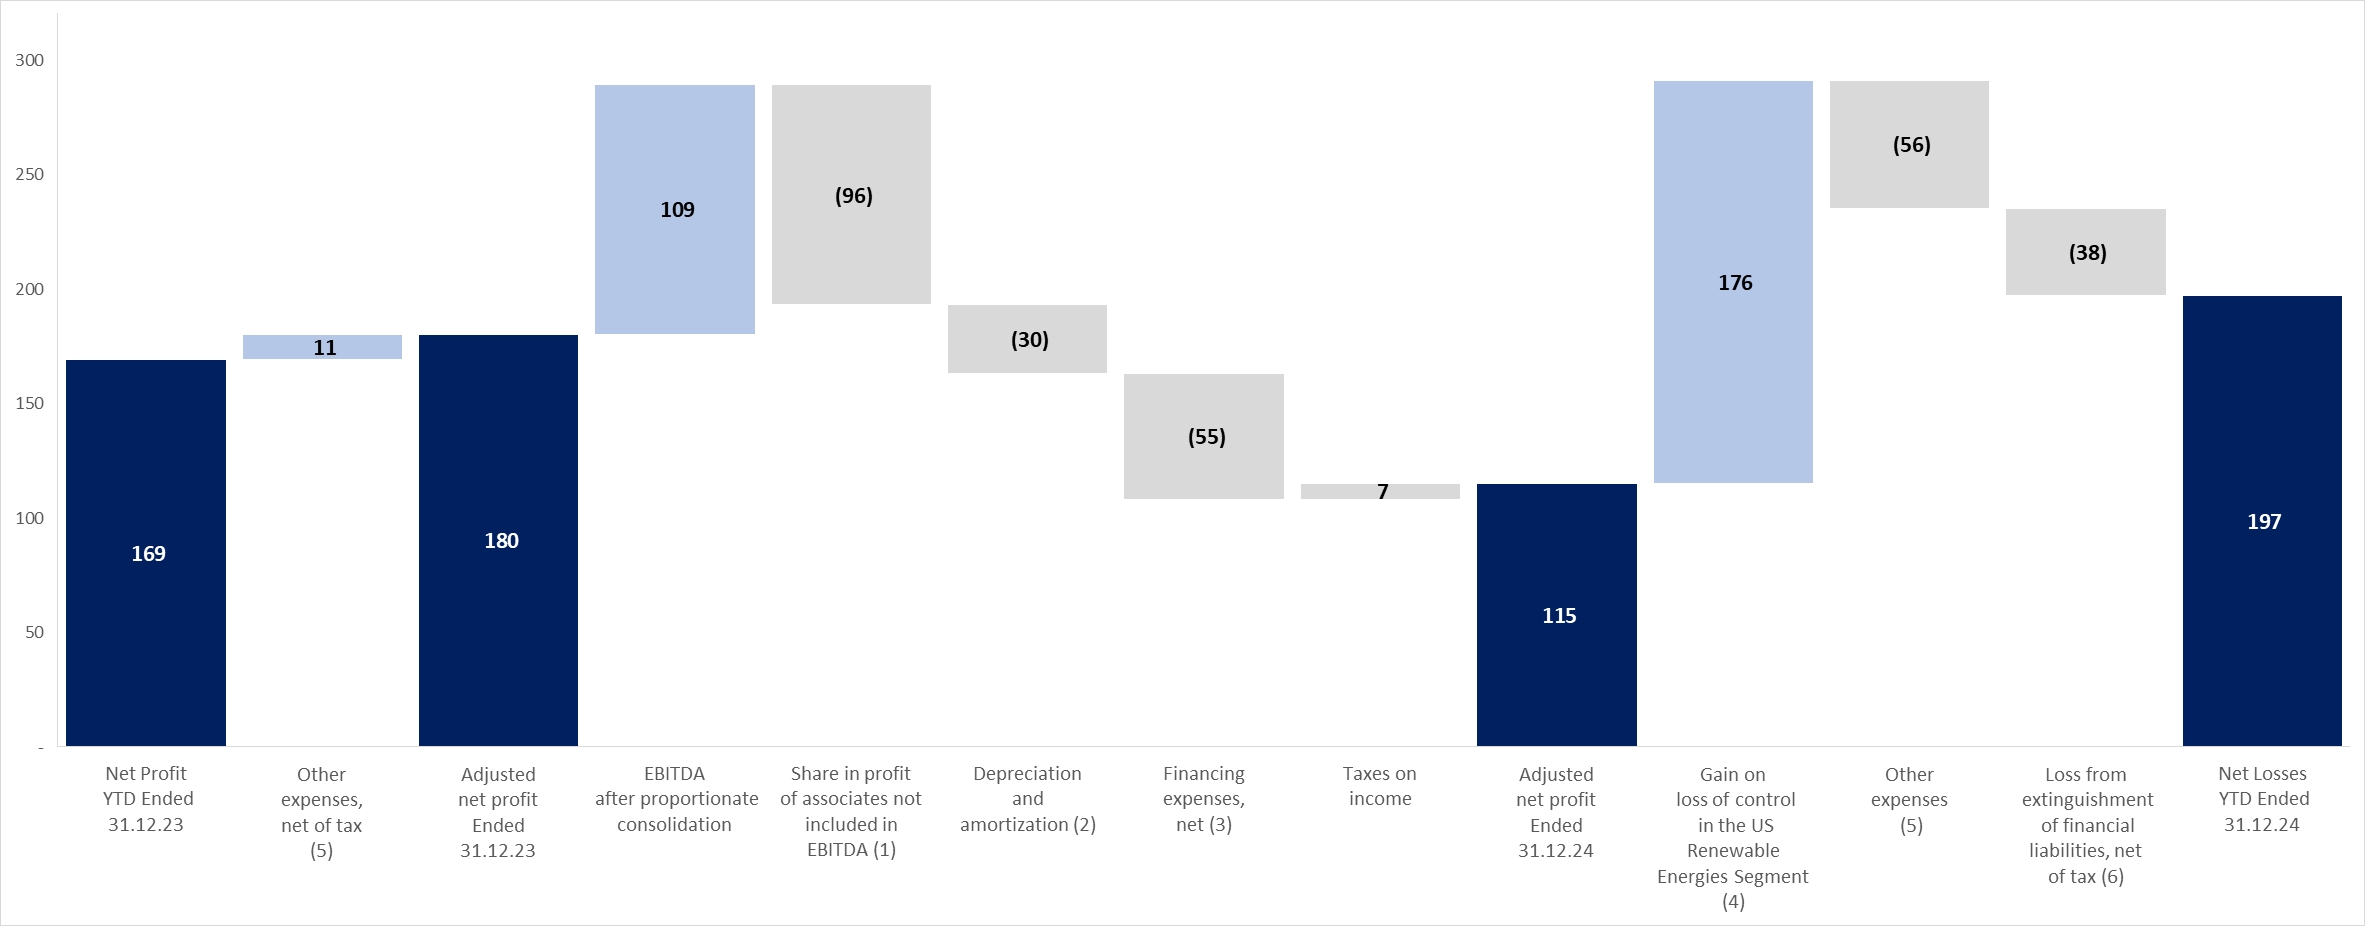
|
|
(1) |
The increase stems mainly from an increase in the financing expenses, in the amount of about NIS 24 million, of the power plants in the Energy Transition segment against the background of signing new financing agreements in 2023 and
2024, particularly in the Valley power plant (for details – see Section 9B below), an increase in depreciation and financing expenses, in the amount of about NIS 18 million, in respect of commercial operation of the Three Rivers power
plant in the third quarter of 2023, an increase in depreciation and financing expenses, in the amount of about NIS 21 million, relating to transition to presenting the investment in the renewable energies segment in the U.S. based on the
equity method of accounting, commencing from November 2024, and an increase in depreciation and financing expenses, in the amount of about NIS 10 million, due to increase in the rate of holdings in the Shore and Maryland power plants in
the fourth quarter of 2024.
|
|
|
(2) |
Most of the increase stems from depreciation expenses of the Zomet power plant (in the amount of about NIS 23 million), which was operated commercially at the end of the second quarter of 2023 and in the renewable energies segment in
the U.S. prior to the exit from the consolidation (in the amount of about NIS 27 million) mainly in respect of the Maple Hill and Stagecoach projects that were commercially operated in the fourth quarter of 2023 and during the second
quarter of 2024. On the other hand, there was a decline of about NIS 23 million, deriving from the decision of the CPV Group made in 2023 to discontinue the development of a natural gas project in the U.S.
|
|
|
(3) |
Most of the increase stems from financing expenses relating to the Zomet power plant, in the amount of about NIS 41 million, the Gat power plant, in the amount of about NIS 7 million and financing expenses that were recorded in the
statement of income in respect of the financing framework of renewable energy projects in the U.S. prior to exit from the consolidation, in the amount of about NIS 26 million. Furthermore, there was an increase in the interest expenses in
respect of the tax equity agreements in the U.S. prior to exit from the consolidation, in the amount of about NIS 15 million. On the other hand, there was an increase in the financing income, deriving from the impact of the changes in the
exchange of the dollar against the shekel, in the amount of about NIS 36 million.
|
| 4. |
Analysis of the results of operations for the Year Ended December 31, 2024 (in millions of NIS) (Cont.)
|
|
|
G. |
Analysis of the change in net income and adjusted net income (in millions of NIS) (Cont.)
|
|
|
(4) |
For details regarding loss of control, discontinuation of the consolidation and transition to the equity method of accounting in the fourth quarter of 2024 with respect to the investment in CPV Renewable – see Note 23E to the financial
statements.
|
|
|
(5) |
A loss from impairment in value of the investment in Gnrgy in 2024, in the amount of about NIS 19 million (in 2023 – about NIS 23 million) –for additional details regarding an agreement for sale of Gnrgy shares – see Note 11C to the
Financial Statements. In addition, in 2024 there was an impairment loss in Hadera 2, in the amount of about NIS 31 million, in light of the government’s decision to reject the plan, for additional details, particularly regarding the
Company’s petition to the High Court of Justice regarding this matter, see Note 10B(4) to the Financial Statements, and in 2023 there were non‑recurring revenues, net, in the amount of about NIS 12 million.
|
|
|
(6) |
Includes non‑recurring financing expenses relating to repayment of project credit in Zomet and Gat, in the amount of about NIS 49 million (about NIS 38 million, net of tax). For details – see Note 14B(1) to the Financial Statements.
|
| 4. |
Analysis of the results of operations for the Year Ended December 31, 2024 (in millions of NIS) (Cont.)
|
|
|
H. |
Detail of generation
|
|
For the Year Ended December 31, 2024
|
For the Year Ended December 31, 2023
|
|||||||||||||||||||||||||||||||||||
|
Actual
|
Actual
|
|||||||||||||||||||||||||||||||||||
|
Potential
|
Net
|
Actual
|
calculated
|
Potential
|
Net
|
Actual
|
calculated
|
|||||||||||||||||||||||||||||
|
electricity
|
electricity
|
generation
|
availability
|
electricity
|
electricity
|
generation
|
availability
|
|||||||||||||||||||||||||||||
|
Capacity
|
generation
|
generation
|
percentage
|
percentage
|
generation
|
generation
|
percentage
|
percentage
|
||||||||||||||||||||||||||||
|
(MW)
|
(GWh)(1)
|
(GWh)(2)
|
(%)(3)
|
(%)
|
(GWh)
|
(GWh)
|
(%)
|
(%)
|
||||||||||||||||||||||||||||
|
Rotem
|
466
|
3,736
|
3,332
|
89.2
|
%
|
95.1
|
%
|
3,761
|
3,514
|
93.4
|
%
|
98.5
|
%
|
|||||||||||||||||||||||
|
Hadera
|
144
|
1,048
|
943
|
90.0
|
%
|
92.6
|
%
|
1,036
|
939
|
90.6
|
%
|
90.7
|
%
|
|||||||||||||||||||||||
|
Gat
|
75
|
616
|
397
|
64.4
|
%
|
64.4
|
%
|
458
|
433
|
94.5
|
%
|
94.4
|
%
|
|||||||||||||||||||||||
|
Zomet
|
396
|
3,268
|
428
|
13.1
|
%
|
83.6
|
%
|
1,742
|
283
|
16.2
|
%
|
88.0
|
%
|
|||||||||||||||||||||||
|
|
(1) |
The generation potential is the net generation capability adjusted for temperature and humidity.
|
|
|
(2) |
The actual net generation in the period.
|
|
|
(3) |
The actual generation percentage is the net electricity generated divided by the generation potential.
|
|
|
(4) |
For details regarding planned maintenance at Rotem, unplanned maintenance at Gat and planned and unplanned work at Zomet in 2024 – see Section 4C above.
|
|
For the Year Ended December 31, 2024
|
For the Year Ended December 31, 2023
|
|||||||||||||||||||||||||||||||||||
|
Potential
|
Net
|
Actual
|
Actual
|
Potential
|
Net
|
Actual
|
Actual
|
|||||||||||||||||||||||||||||
|
electricity
|
electricity
|
generation
|
availability
|
electricity
|
electricity
|
generation
|
availability
|
|||||||||||||||||||||||||||||
|
Capacity
|
generation
|
generation
|
percentage
|
percentage
|
generation
|
generation
|
percentage
|
percentage
|
||||||||||||||||||||||||||||
|
(MW)
|
(GWh)(1)
|
(GWh)(2)
|
(%)(3)
|
(%)
|
(GWh)
|
(GWh)
|
(%)
|
(%)
|
||||||||||||||||||||||||||||
|
Energy transition projects (natural gas)
|
||||||||||||||||||||||||||||||||||||
|
Fairview
|
1,050
|
8,601
|
7,610
|
82.1
|
%
|
88.5
|
%
|
8,160
|
7,213
|
81.1
|
%
|
84.2
|
%
|
|||||||||||||||||||||||
|
Towantic
|
805
|
6,521
|
5,593
|
77.7
|
%
|
89.9
|
%
|
6,888
|
5,551
|
77.5
|
%
|
91.2
|
%
|
|||||||||||||||||||||||
|
Maryland
|
745
|
5,958
|
3,628
|
56.3
|
%
|
90.3
|
%
|
6,089
|
4,162
|
64.5
|
%
|
93.0
|
%
|
|||||||||||||||||||||||
|
Shore
|
725
|
6,130
|
3,612
|
56.9
|
%
|
92.4
|
%
|
5,333
|
4,000
|
63.3
|
%
|
83.4
|
%
|
|||||||||||||||||||||||
|
Valley
|
720
|
5,838
|
5,002
|
82.1
|
%
|
89.1
|
%
|
5,867
|
4,392
|
72.3
|
%
|
77.6
|
%
|
|||||||||||||||||||||||
|
Three
Rivers
|
1,258
|
9,792
|
6,366
|
59.9
|
%
|
76.9
|
%
|
4,220
|
2,814
|
64.0
|
%
|
74.8
|
%
|
|||||||||||||||||||||||
| (1) |
The potential generation is the gross generation capability during the period after planned maintenance and less the electricity used for the power plant’s internal purposes.
|
| (2) |
The net generation of electricity is the gross generation during the period less the electricity used for the power plant’s internal purposes.
|
| (3) |
The actual generation percentage is the quantity of the net electricity generated in the facilities compared with the maximum quantity that can be generated in the period.
|
| (*) |
It is noted that the generation data of the Gat, Zomet and Three Rivers power plants were included starting from the initial consolidation date or the commercial operation date, as applicable, which took place in 2023.
|
| 5. |
Analysis of the results of operations for the Three Months Ended December 31, 2024 (in millions of NIS)
|
|
|
A. |
Statement of income
|
|
For the Three Months Ended
|
||||||||
|
Section
|
December 31
|
|||||||
|
2024
|
2023
|
|||||||
|
Revenues from sales and provision of services (1)
|
589
|
581
|
||||||
|
Cost of sales and provision of services (without depreciation and amortization) (2)
|
(438
|
)
|
(432
|
)
|
||||
|
Depreciation and amortization
|
(72
|
)
|
(83
|
)
|
||||
|
Gross profit
|
79
|
66
|
||||||
|
Administrative and general expenses
|
(72
|
)
|
(30
|
)
|
||||
|
Share in earnings of associated companies
|
16
|
63
|
||||||
|
Business development expenses
|
(12
|
)
|
(11
|
)
|
||||
|
Compensation for lost revenues
|
–
|
41
|
||||||
|
Other expenses, net
|
(6
|
)
|
(22
|
)
|
||||
|
Gain on loss of control in the renewable energies segment in the U.S.
|
259
|
–
|
||||||
|
Operating income
|
264
|
107
|
||||||
|
Financing expenses, net
|
(52
|
)
|
(54
|
)
|
||||
|
Income before taxes on income
|
212
|
53
|
||||||
|
Taxes on income
|
(89
|
)
|
(24
|
)
|
||||
|
Net income for the period *
|
123
|
29
|
||||||
|
Attributable to:
|
||||||||
|
The Company’s shareholders
|
28
|
23
|
||||||
|
Holders of non‑controlling interests
|
95
|
6
|
||||||
| * |
For an analysis of the change in the net income and an analysis of the change in the adjusted net income – see Section 4F below.
|
| 5. |
Analysis of the results of operations for the Three Months Ended December 31, 2024 (in millions of NIS) (Cont.)
|
|
|
A. |
Statement of income (Cont.)
|
|
Revenues
|
For the Three
|
Board’s Explanations
|
|||||||
|
Months Ended
|
|||||||||
|
December 31
|
|||||||||
|
2024
|
2023
|
||||||||
|
Revenues in Israel
|
|||||||||
|
Revenues from sale of energy to private customers
|
247
|
270
|
Most of the decrease, in the amount of about NIS 15 million, stems from a decline in the consumption of customers.
|
||||||
|
Revenues from sale of energy to the System Operator and to other suppliers
|
19
|
27
|
|||||||
|
Revenues in respect of capacity payments
|
44
|
29
|
The increase stems mainly from an increase in the capacity tariff in Zomet starting from the beginning of 2024.
|
||||||
|
Revenues from sale of energy at cogeneration tariff
|
41
|
48
|
|||||||
|
Revenues from sale of steam
|
13
|
14
|
|||||||
|
Other revenues
|
–
|
9
|
|||||||
|
Total revenues from sale of energy and others in Israel (without infrastructure services)
|
364
|
397
|
|||||||
|
Revenues from private customers in respect of infrastructure services
|
113
|
107
|
|||||||
|
Total revenues in Israel
|
477
|
504
|
|||||||
|
Revenues in the U.S.
|
|||||||||
|
Revenues from sale of electricity from renewable energy
|
31
|
47
|
The decrease stems mainly from discontinuance of consolidation of the renewable energies segment in November 2024 deriving from loss of control
of CPV Renewable and as a result of transition to the equity method of accounting (for additional details – see Note 23E to the Financial Statements.
|
||||||
|
Revenues from sale of electricity from (Retail) and others
|
81
|
30
|
The increase stems mainly from an increase in the scope of the activities.
|
||||||
|
Total revenues in the U.S.
|
112
|
77
|
|||||||
|
Total revenues
|
589
|
581
|
|||||||
| 5. |
Analysis of the results of operations for the Three Months Ended December 31, 2024 (in millions of NIS) (Cont.)
|
|
|
A. |
Statement of income (Cont.)
|
|
|
(2) |
Changes in the cost of sales and provision of services (not including depreciation and amortization):
|
|
Cost of Sales and
Provision of Services
|
For the Three
Months Ended
|
Board’s Explanations
|
|||||||
|
December 31
|
|||||||||
|
2024
|
2023
|
||||||||
|
Cost of sales in Israel
|
|||||||||
|
Natural gas and diesel oil
|
150
|
174
|
Most of the decrease, in the amount of about NIS 13 million, stems from a decline in the gas consumption due to a decline in the sales of Zomet
to the System Operator.
|
||||||
|
Expenses in respect of acquisition of energy
|
40
|
54
|
|||||||
|
Cost of transmission of gas
|
14
|
12
|
|||||||
|
Salaries and related expenses
|
13
|
10
|
|||||||
|
Operating expenses
|
33
|
31
|
|||||||
|
Other expenses
|
–
|
5
|
|||||||
|
Total cost of sales in Israel without infrastructure services
|
250
|
286
|
|||||||
|
Expenses in respect of infrastructure services
|
113
|
107
|
|||||||
|
Total cost of sales in Israel
|
363
|
393
|
|||||||
|
Cost of sales and services in the U.S.
|
|||||||||
|
Cost of sales in respect of sale of electricity from renewable energy
|
7
|
14
|
The decrease stems from discontinuance of consolidation of the renewable energies segment from November 2024 deriving from loss of control of
CPV Renewable and as a result of transition to the equity method of accounting (for additional details – see Note 23E to the financial statements.
|
||||||
|
Cost of sales in respect of sale of electricity (Retail) and others
|
68
|
25
|
The increase stems mainly from an increase in the scope of the activities.
|
||||||
|
Total cost of sales and provision of services in the U.S.
|
75
|
39
|
|||||||
|
Total cost of sales and provision of services
|
438
|
432
|
|||||||
| 5. |
Analysis of the results of operations for the Three Months Ended December 31, 2024 (in millions of NIS) (Cont.)
|
|
|
B. |
EBITDA, FFO and net cash flows after debt service
|
|
For the
|
||||||||
|
Three Months Ended
|
||||||||
|
December 31
|
||||||||
|
2024
|
2023
|
|||||||
|
Revenues from sales and provision of services
|
589
|
581
|
||||||
|
Cost of sales and provision of services (without depreciation and
|
||||||||
|
amortization)
|
(438
|
)
|
(432
|
)
|
||||
|
Administrative and general expenses (without depreciation and amortization)
|
(68
|
)
|
(25
|
)
|
||||
|
Business development expenses
|
(12
|
)
|
(11
|
)
|
||||
|
Share in income of associated companies
|
16
|
63
|
||||||
|
Compensation for lost revenues
|
–
|
41
|
||||||
|
Consolidated EBITDA
|
87
|
217
|
||||||
|
Elimination of the share in income of associated companies
|
(16
|
)
|
(63
|
)
|
||||
|
Plus – Group’s share of the proportionate EBITDA of associated companies
|
||||||||
|
in the Energy Transition segment (1)
|
141
|
165
|
||||||
|
Plus – Group’s share of the proportionate EBITDA
|
||||||||
|
of associated companies in the renewable energies segment
|
||||||||
|
in the U.S. (for details – see Section B(2) in Section 4 above)
|
16
|
–
|
||||||
|
EBITDA after proportionate consolidation
|
228
|
319
|
||||||
| 5. |
Analysis of the results of operations for the Three Months Ended December 31, 2024 (in millions of NIS) (Cont.)
|
|
|
B. |
EBITDA, FFO and net cash flows after debt service (Cont.)
|
|
|
(1) |
Calculation of the Group’s share in the proportionate EBITDA, FFO and net cash flows after service of project debt of associated companies in the Energy Transition segment (in millions of NIS):
|
|
For the three months ended December 31, 2024
|
Fairview
|
Towantic
|
Maryland
|
(1)
Shore |
Valley
|
Three
Rivers |
Total
|
|||||||||||||||||||||
|
Revenues from sales of energy
|
51
|
72
|
65
|
33
|
93
|
13
|
327
|
|||||||||||||||||||||
|
Cost of natural gas
|
25
|
39
|
25
|
16
|
32
|
8
|
145
|
|||||||||||||||||||||
|
Carbon emissions tax (RGGI)
|
–
|
11
|
12
|
15
|
15
|
–
|
53
|
|||||||||||||||||||||
|
Cost of sales – other expenses (without
|
||||||||||||||||||||||||||||
|
depreciation and amortization)
|
–
|
1
|
3
|
1
|
2
|
–
|
7
|
|||||||||||||||||||||
|
Gain (loss) on realization of transactions
|
||||||||||||||||||||||||||||
|
hedging the electricity margins
|
3
|
(7
|
)
|
(2
|
)
|
7
|
2
|
5
|
8
|
|||||||||||||||||||
|
Net energy margin
|
29
|
14
|
23
|
8
|
46
|
10
|
130
|
|||||||||||||||||||||
|
Revenues from capacity payments
|
5
|
33
|
7
|
5
|
13
|
1
|
64
|
|||||||||||||||||||||
|
Other income
|
1
|
2
|
4
|
2
|
1
|
1
|
11
|
|||||||||||||||||||||
|
Gross profit
|
35
|
49
|
34
|
15
|
60
|
12
|
205
|
|||||||||||||||||||||
|
Fixed costs (without depreciation and
|
||||||||||||||||||||||||||||
|
amortization)
|
4
|
6
|
15
|
8
|
25
|
4
|
62
|
|||||||||||||||||||||
|
Administrative and general expenses
|
||||||||||||||||||||||||||||
|
(without depreciation and amortization)
|
1
|
1
|
2
|
1
|
2
|
1
|
8
|
|||||||||||||||||||||
|
Gain (loss) from revaluation of unrealized
|
||||||||||||||||||||||||||||
|
hedging transactions
|
3
|
4
|
(1
|
)
|
–
|
–
|
–
|
6
|
||||||||||||||||||||
|
Group’s share in proportionate EBITDA
|
||||||||||||||||||||||||||||
|
of associated companies (2)
|
33
|
46
|
16
|
6
|
33
|
7
|
141
|
|||||||||||||||||||||
|
Group’s share in FFO
|
16
|
49
|
17
|
14
|
13
|
5
|
114
|
|||||||||||||||||||||
|
Net cash flows after service of
project debt (3)
|
19
|
27
|
6
|
13
|
(2
|
)
|
–
|
63
|
||||||||||||||||||||
| (1) |
At the Shore power plant – gas transmission costs (totaling in the fourth quarter of 2024 about NIS 6 million) that are classified in accordance with IFRS 16 as depreciation expenses and, accordingly, are not included in the EBITDA.
|
| (2) |
For additional details – see Section 4B(1)(2), above
|
| (3) |
For additional details – see Section 4B(1)(3), above
|
| 5. |
Analysis of the results of operations for the Three Months Ended December 31, 2024 (in millions of NIS) (Cont.)
|
|
|
B. |
EBITDA, FFO and net cash flows after debt service (Cont.)
|
|
|
(1) |
Calculation of the Group’s share in the proportionate EBITDA, FFO and net cash flows after service of project debt of associated companies in the Energy Transition segment (in millions of NIS): (Cont.)
|
|
For the three months ended December 31, 2023
|
Fairview
|
Towantic
|
Maryland
|
(1)
Shore |
Valley
|
Three
Rivers
|
Total
|
|||||||||||||||||||||
|
Revenues from sales of energy
|
28
|
38
|
44
|
50
|
61
|
18
|
239
|
|||||||||||||||||||||
|
Cost of natural gas
|
13
|
19
|
19
|
23
|
26
|
11
|
111
|
|||||||||||||||||||||
|
Carbon emissions tax (RGGI)
|
–
|
7
|
6
|
11
|
11
|
–
|
35
|
|||||||||||||||||||||
|
Cost of sales – other expenses (without
|
||||||||||||||||||||||||||||
|
depreciation and amortization)
|
–
|
1
|
2
|
2
|
1
|
–
|
6
|
|||||||||||||||||||||
|
Gain (loss) on realization of transactions
|
||||||||||||||||||||||||||||
|
hedging the electricity margins
|
3
|
3
|
–
|
(2
|
)
|
24
|
–
|
28
|
||||||||||||||||||||
|
Net energy margin
|
18
|
14
|
17
|
12
|
47
|
7
|
115
|
|||||||||||||||||||||
|
Revenues from capacity payments
|
3
|
29
|
7
|
5
|
15
|
1
|
60
|
|||||||||||||||||||||
|
Other income
|
2
|
2
|
1
|
2
|
1
|
–
|
8
|
|||||||||||||||||||||
|
Gross profit
|
23
|
45
|
25
|
19
|
63
|
8
|
183
|
|||||||||||||||||||||
|
Fixed costs (without depreciation and
|
||||||||||||||||||||||||||||
|
amortization)
|
2
|
5
|
4
|
5
|
17
|
2
|
35
|
|||||||||||||||||||||
|
Administrative and general expenses
|
||||||||||||||||||||||||||||
|
(without depreciation and amortization)
|
1
|
1
|
1
|
1
|
2
|
–
|
6
|
|||||||||||||||||||||
|
Gain (loss) from revaluation of unrealized
|
||||||||||||||||||||||||||||
|
hedging transactions
|
3
|
23
|
–
|
(4
|
)
|
–
|
1
|
23
|
||||||||||||||||||||
|
Group’s share in proportionate EBITDA
|
||||||||||||||||||||||||||||
|
of associated companies
|
23
|
62
|
20
|
9
|
44
|
7
|
165
|
|||||||||||||||||||||
|
Group’s share in FFO
|
(1
|
)
|
23
|
(1
|
)
|
2
|
(8
|
)
|
–
|
15
|
||||||||||||||||||
|
Net cash flows after service of project debt
|
(18
|
)
|
(5
|
)
|
2
|
(2
|
)
|
(14
|
)
|
–
|
(37
|
)
|
||||||||||||||||
| (1) |
At the Shore power plant – gas transport costs (totaling in the fourth quarter of 2023 about NIS 6 million) that are classified in accordance with IFRS 16 as depreciation expenses and, accordingly, are not included in the EBITDA.
|
| 5. |
Analysis of the results of operations for the Three Months Ended December 31, 2024 (in millions of NIS) (Cont.)
|
|
|
B. |
EBITDA, FFO and net cash flows after debt service (Cont.)
|
|
|
(2) |
Set forth below is a breakdown of the EBITDA after proportionate consolidation data broken down by the subsidiaries (on a consolidated basis) and the associated companies (on a proportionate basis, based on the rate of the holdings
of the CPV Group therein) as well as FFO data and cash flow after project debt service (in NIS millions):
|
|
For the
|
For the
|
|||||||||||||||||||||||||||
|
three months ended
|
three months ended
|
|||||||||||||||||||||||||||
|
Main projects in operation
|
Basis of
|
December 31, 2024
|
December 31, 2023
|
|||||||||||||||||||||||||
|
presentation
|
Net cash
|
Net cash
|
||||||||||||||||||||||||||
|
in the
|
EBITDA
|
flows
|
EBITDA
|
flows
|
||||||||||||||||||||||||
|
Company’s
|
after
|
after
|
after
|
after
|
||||||||||||||||||||||||
|
financial
|
proportionate
|
debt
|
proportionate
|
debt
|
||||||||||||||||||||||||
|
statements
|
consolidation
|
FFO
|
service
|
consolidation
|
FFO
|
service
|
||||||||||||||||||||||
|
Total operating projects in Israel and
|
|
|||||||||||||||||||||||||||
|
accompanying business activities
|
Consolidated
|
106
|
(6)70
|
|
(7)59
|
|
141
|
22
|
(10
|
)
|
||||||||||||||||||
|
Business development costs and
|
||||||||||||||||||||||||||||
|
headquarters in Israel and other costs
|
Consolidated
|
(8
|
)
|
(25
|
)
|
(26
|
)
|
(6
|
)
|
(12
|
)
|
(12
|
)
|
|||||||||||||||
|
Total Israel
|
98
|
45
|
33
|
135
|
10
|
(22
|
)
|
|||||||||||||||||||||
|
Total operating projects (1)
|
Associated
|
141
|
114
|
63
|
164
|
15
|
(37
|
)
|
||||||||||||||||||||
|
Other costs
|
Consolidated
|
–
|
(12
|
)
|
(12
|
)
|
(1
|
)
|
(1
|
)
|
(1
|
)
|
||||||||||||||||
|
Total energy transition in the U.S.
|
141
|
102
|
51
|
163
|
14
|
(38
|
)
|
|||||||||||||||||||||
|
Total operating projects (1) (2)
|
Associated
|
38
|
15
|
8
|
26
|
9
|
(6
|
)
|
||||||||||||||||||||
|
Business development and other costs
|
Associated
|
(10
|
)
|
10
|
10
|
(12
|
)
|
(12
|
)
|
(12
|
)
|
|||||||||||||||||
|
Total renewable energy in the U.S.
|
28
|
25
|
18
|
14
|
(3
|
)
|
(18
|
)
|
||||||||||||||||||||
|
Total activities as part of the “others”
|
||||||||||||||||||||||||||||
|
segment
|
Consolidated
|
(4
|
)
|
(4
|
)
|
(4
|
)
|
(8
|
)
|
(8
|
)
|
(8
|
)
|
|||||||||||||||
|
Headquarters in the United States (3) (4)
|
Consolidated
|
(28
|
)
|
(12
|
)
|
(12
|
)
|
22
|
(11
|
)
|
(11
|
)
|
||||||||||||||||
|
Total United States
|
137
|
111
|
53
|
191
|
(8
|
)
|
(75
|
)
|
||||||||||||||||||||
|
Company headquarters (not allocated
|
||||||||||||||||||||||||||||
|
to the segments)
|
Consolidated
|
(7
|
)
|
(2
|
)
|
(2
|
)
|
(7
|
)
|
2
|
2
|
|||||||||||||||||
|
Total consolidated (5)
|
228
|
154
|
84
|
319
|
4
|
(95
|
)
|
|||||||||||||||||||||
| (1) |
For details regarding active projects in the Energy Transition segment in the U.S. – see Section 1 above and regarding calculation of the Group’s share in the EBITDA after proportionate consolidation of the Renewable Energies segment
– see Section 4B(2) above.
|
| (2) |
Due to completion of the transaction for investment in the area of renewable energies in the U.S. in November 2024, the data of this segment in the U.S. is calculated from this date on the basis a proportionate consolidation where
the share of the CPV Group’s is 66.67%.
|
| (3) |
Most of the change in the fourth quarter compared with the corresponding quarter last year, in the amount of $43 million, is with respect to fair value changes of a profit participation plan for employees of the CPV Group. For
details – see Note 16 to the financial statements.
|
| (4) |
After elimination of management fees between the CPV Group and the Company, in the amounts of about NIS 8 million for the three‑month periods ended December 31, 2024 and 2023.
|
| (5) |
In the period of the report, the consolidated FFO without adjustments for changes in the working capital was about NIS 109 million (in the corresponding period last year – about NIS 123 million).
|
| (6) |
The increase in the FFO in the quarter compared with the corresponding quarter last year stems mainly from a decrease in payment to the gas suppliers, in the amount of about NIS 57 million, due to timing differences.
|
| (7) |
Not including intercompany activities between the Company and the subsidiaries in Israel.
|
| 5. |
Analysis of the results of operations for the Three Months Ended December 31, 2024 (in millions of NIS) (Cont.)
|
|
|
C. |
Analysis of the change in EBITDA – Israel segment
|
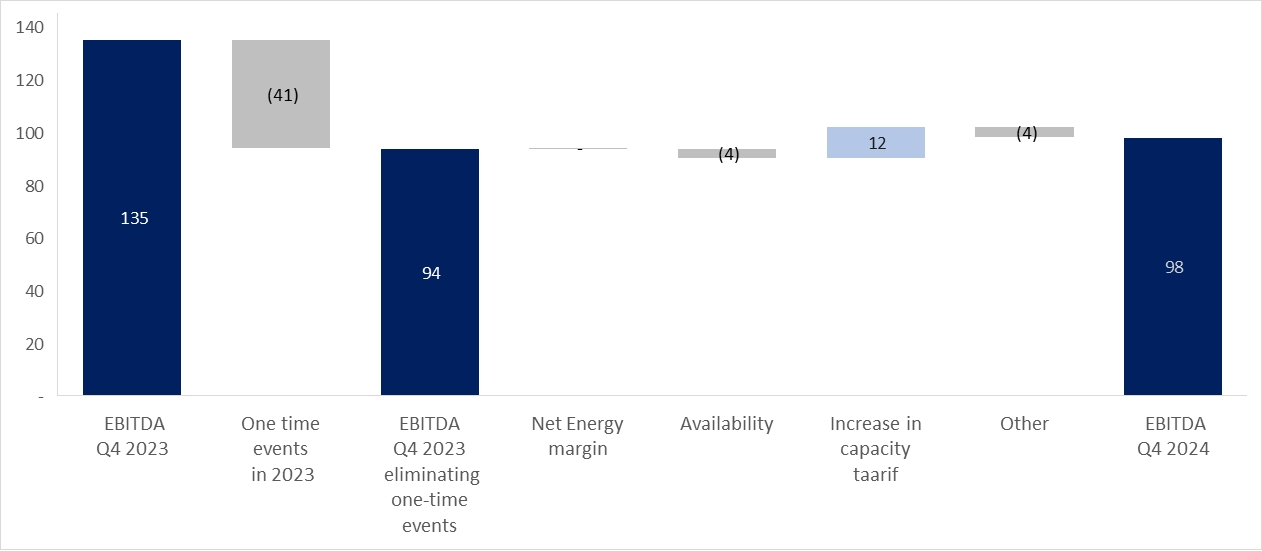
|
|
1. |
Increase in capacity tariffs in Zomet – for additional details see Section 4C(2) above.
|
|
|
2. |
Non‑recurring events – stems from non‑recurring compensation Hadera received in the corresponding quarter last year – as detailed in Section 4C(3) above.
|
| 5. |
Analysis of the results of operations for the Three Months Ended December 31, 2024 (in millions of NIS) (Cont.)
|
|
|
D. |
Analysis of the change in EBITDA after proportionate consolidation – energy transition segment in the U.S.
|
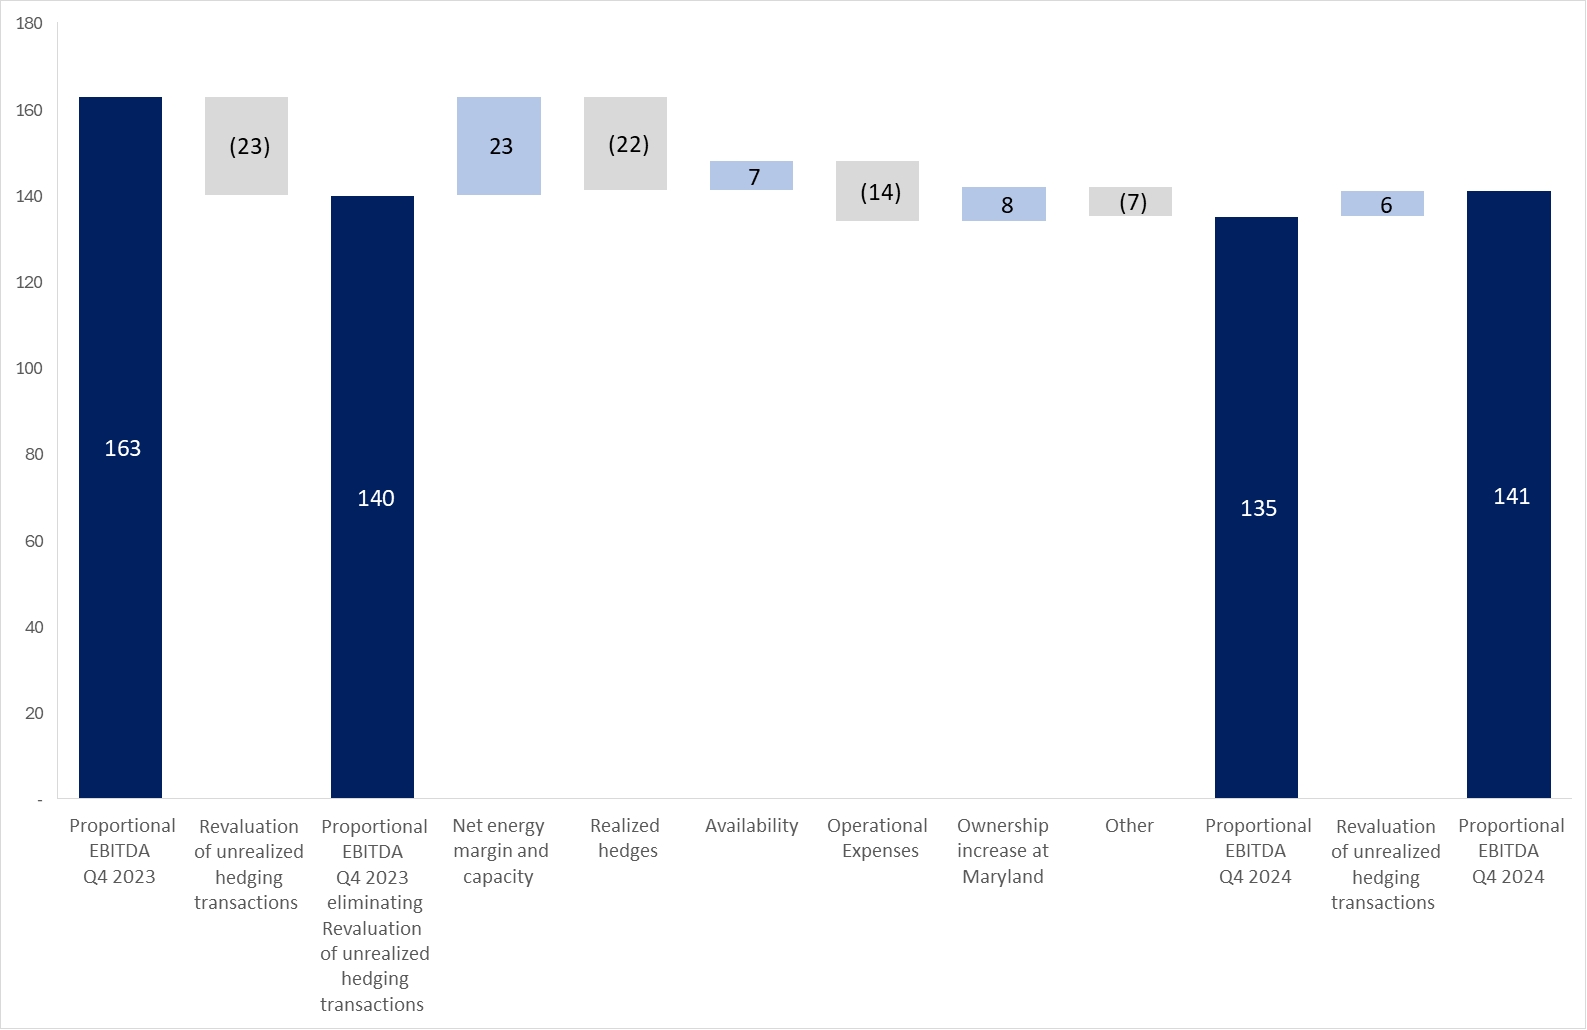
|
|
(1) |
Reflects the results of the Maryland power plant deriving from completion of two transactions for increase of the holdings in Maryland in October and December 2024 at the rate of 25% each.
|
|
|
(2) |
The increase in the rate of holding of about 31% in the Shore power plant in December 2024 did not have a significant impact on the segment’s results in the fourth quarter of 2024.
|
|
|
(3) |
Operating expenses – the increase stems from unplanned maintenance in the Valley power plant, in the amount of about NIS 7 million.
|
| 5. |
Analysis of the results of operations for the Three Months Ended December 31, 2024 (in millions of NIS) (Cont.)
|
|
|
E. |
(Cont.)
|
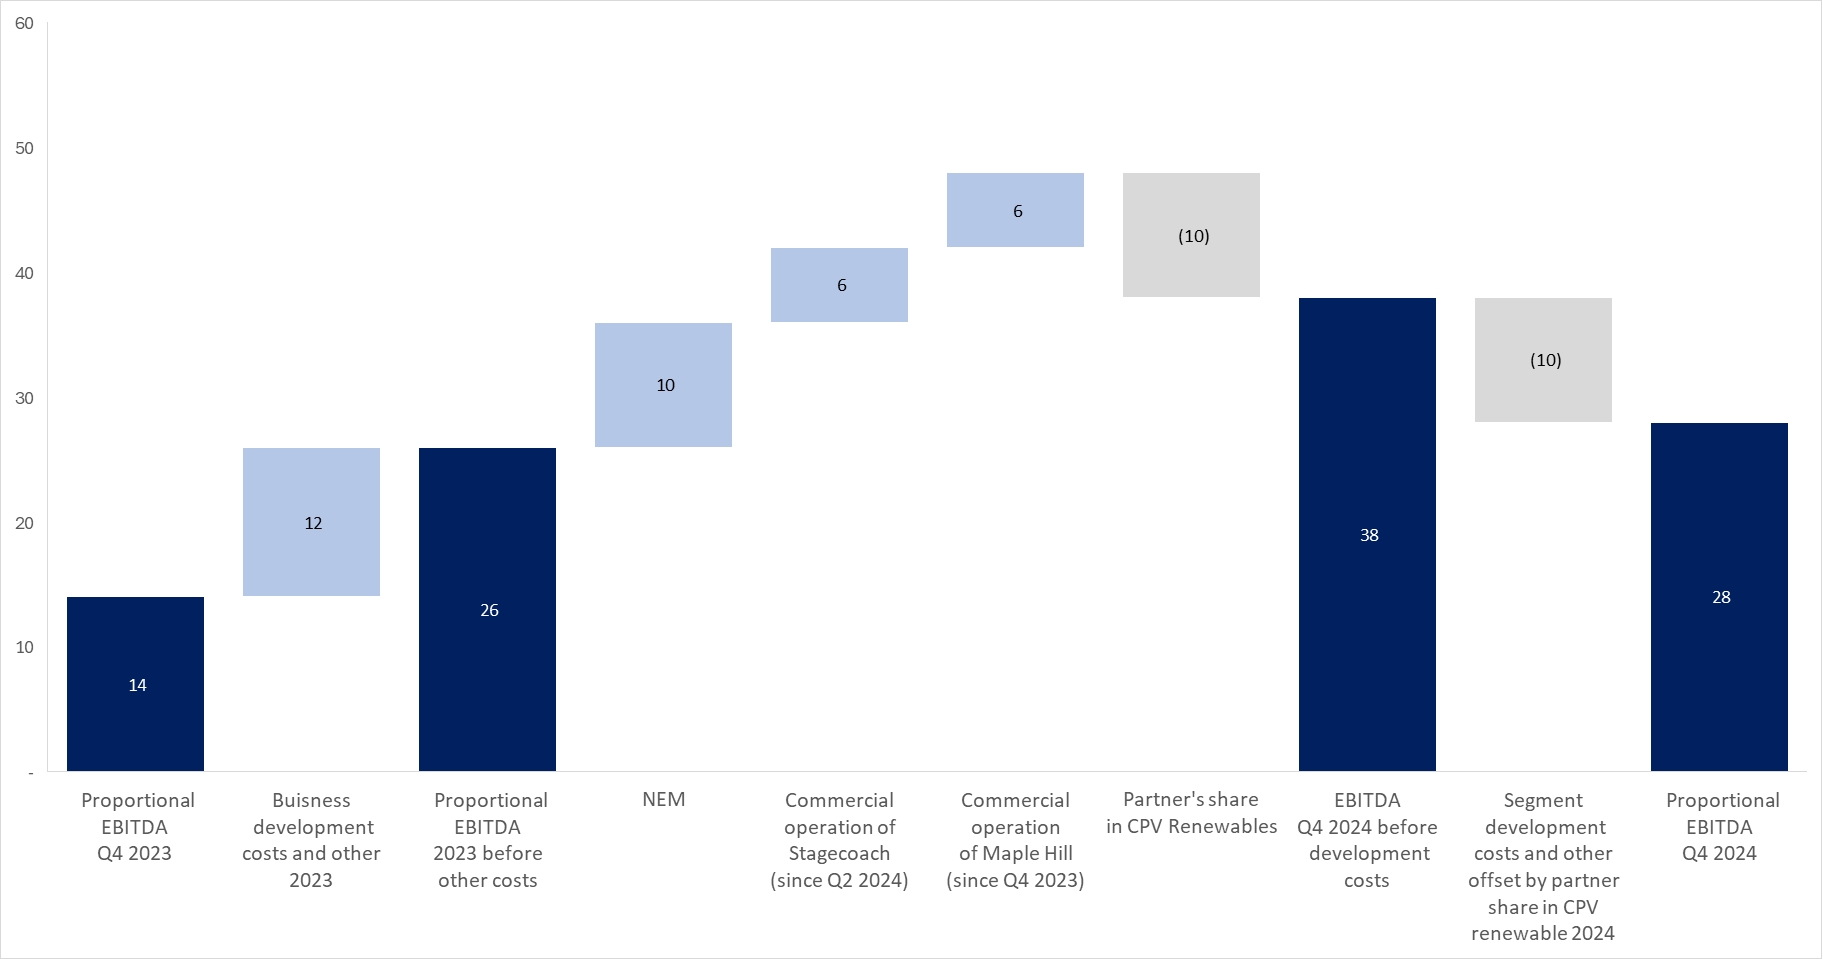
| 5. |
Analysis of the results of operations for Three Months Ended December 31, 2024 (in millions of NIS) (Cont.)
|
|
|
F. |
Analysis of the change in net income and adjusted net income (in millions of NIS)
|
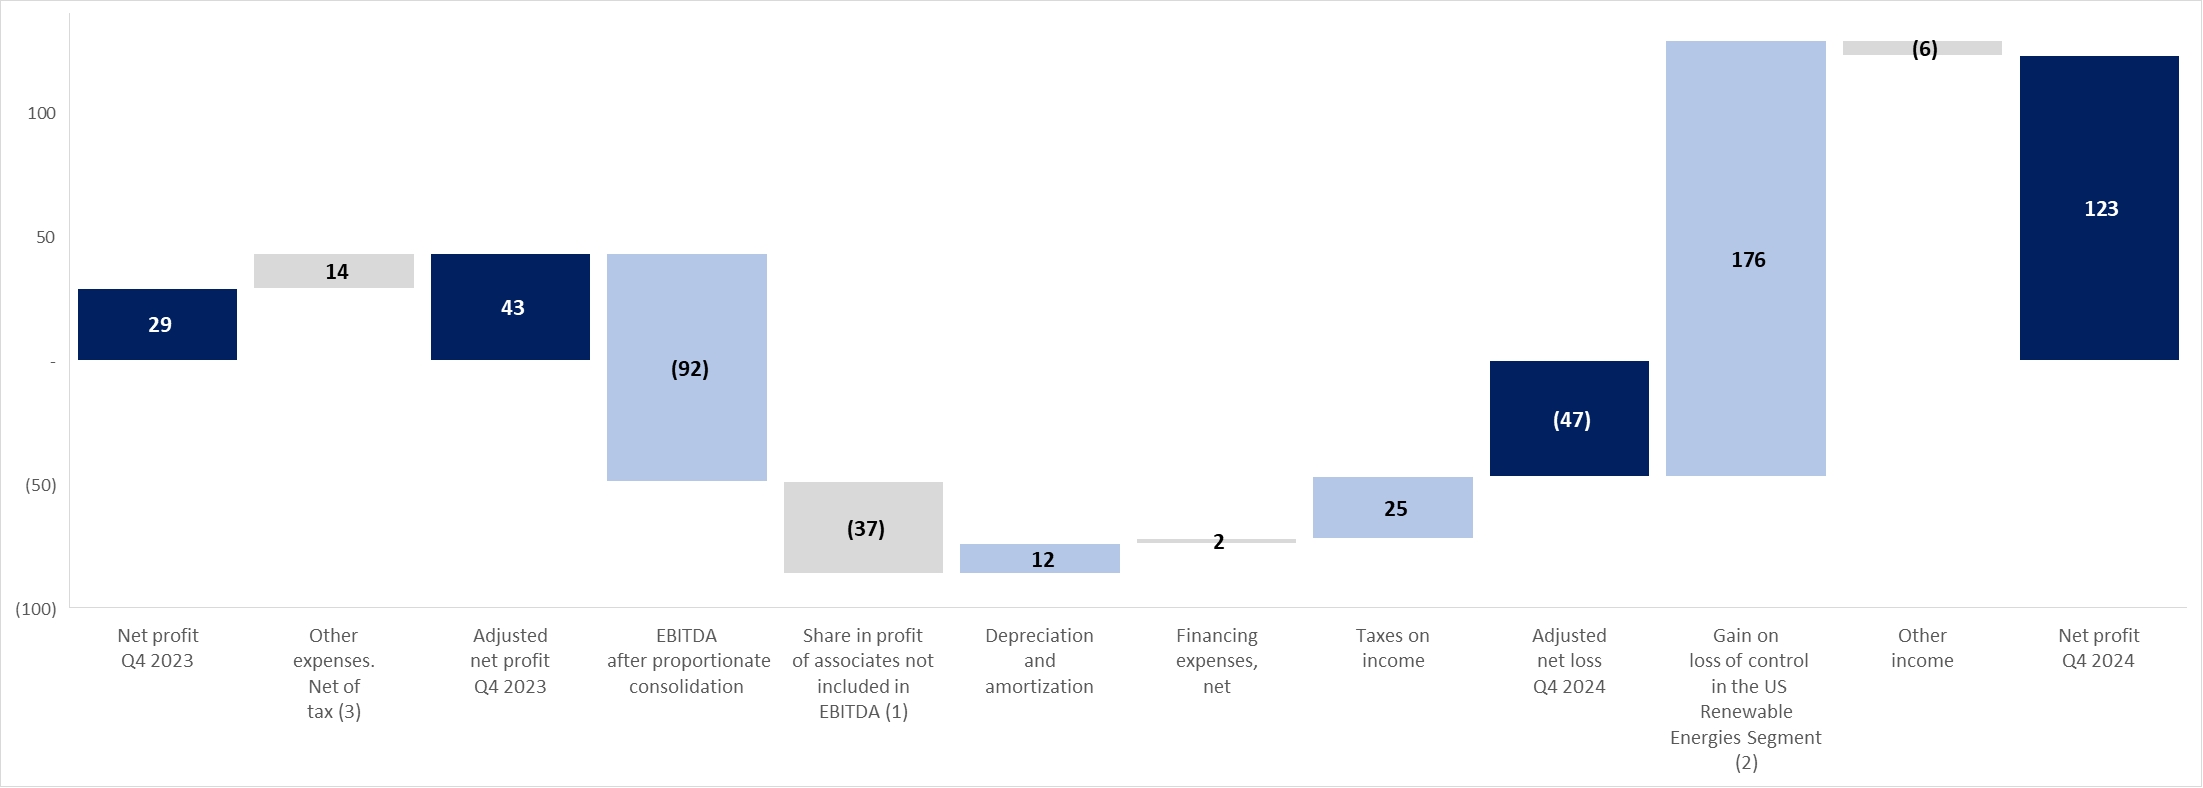
|
|
(1) |
The increase stems mostly from an increase in depreciation and financing expenses, in the amount of about NIS 21 million, in respect of transition to presentation of the investment in the renewable energies segment in the U.S. based
on the equity method of accounting starting from November 2024 and an increase in depreciation and financing expenses, in the amount of about NIS 10 million, due to an increase in the rate of holdings in the Shore and Maryland power
plants during the fourth quarter of 2024.
|
|
|
(2) |
For details regarding loss of control, deconsolidation and transition to the equity method of accounting in the fourth quarter of 2024 with respect to an investment in CPV Renewable – see Note 23E to the Financial Statements.
|
| 6. |
Initiation and Construction Projects
|
|
|
A. |
Projects under construction and in development in Israel (held at 100% ownership by OPC Israel, which is 80% held by the Company)18:
|
|
|
1. |
Main details with reference to construction projects in Israel (the data presented in the table below is in respect of 100% for each project):
|
|
Power
|
Date/
|
Total
|
||||||||||||||||||||||||||||||||
|
plants/
|
expectation
|
Total
|
construction
|
|||||||||||||||||||||||||||||||
|
facilities
|
of the start
|
expected
|
cost as at
|
|||||||||||||||||||||||||||||||
|
for
|
of the
|
Main
|
construction
|
December 31,
|
||||||||||||||||||||||||||||||
|
generation
|
Capacity
|
commercial
|
customer/
|
cost
|
2024
|
|||||||||||||||||||||||||||||
|
of energy
|
Status
|
(megawatts)
|
Location
|
Technology
|
operation
|
consumer
|
(NIS millions)
|
(NIS millions)
|
||||||||||||||||||||||||||
|
|
|
|
|
|
|
|
|
|
|
|
|
|
|
|
|
|
|
|
|
|
|
|
|
|
|
|
|
|
|
|
|
|
||
|
OPC Sorek 2 Ltd. (“Sorek 2”)
|
Under construction
|
≈ 87
|
On the premises of the Sorek B seawater desalination facility
|
Powered by natural gas, cogeneration
|
First half of 202519
|
Yard consumers and the System Operator
|
≈ 212
|
≈ 196
|
||||||||||||||||||||||||||
|
18
|
That stated in connection with projects that have not yet reached operation, including with reference to the expected operation date, the technologies
and/or the anticipated cost of the investment, is “forward‑looking” information, as it is defined in the Securities Law, which is based on, among other things, the Company’s estimates as at the approval date of the report and
regarding which there is no certainty it will be realized (in whole or in part). Completion of the said projects (or any one of them) may not occur or may occur in a manner different than that stated above, among other things due to
dependency on various factors, including those that are not under the Company’s control, including assurance of connection to the network and output of electricity from the project sites and/or connection to the infrastructures
(including gas infrastructures), receipt of permits, completion of planning processes and licensing, completion of construction work, final costs in respect of development, construction, equipment and acquisition of rights in land,
the proper functioning of the equipment and/or the terms of undertakings with main suppliers (including lenders), and there is no certainty they will be fulfilled, the manner of their fulfillment, the extent of their impact or what
their final terms will be. Ultimately technical, operational or other delays and/or breakdowns and/or an increase in expenses could be caused, this being as a result of, among other things, factors as stated above or as a result of
occurrence of one or more of the risk factors the Company is exposed to, including construction risks (including force majeure
events and the War and its impacts), regulatory, licensing or planning risks, macro‑economic changes, delays in receipt of permits or assurance of connection to the networks and infrastructures, delays and increased costs due
relating to the supply chain and changes in raw‑material prices and etc. For additional details regarding risk factors – see Section 19 of Part A of the Periodic Report. It is further clarified that delays in completion of the
above‑mentioned projects beyond the date originally planned for this could impact the ability of the Company and the Group companies to comply with their obligations to third parties (including under guarantees provided), including
authorities, conditions of permits, lenders, yard consumers, customers and others, in connection with the projects, and cause a charge for additional costs, payment of compensation or starting of proceedings (including under
guarantees provided).
|
|
19
|
It is noted that a delay in the commercial operation beyond the original contractual date, which is not considered a justified delay as defined in the project agreements, could
trigger payment of monthly compensation at a limited graduated rate (taking into account the length of the delay, where a delay after full utilization of the compensation ceiling could give rise to a cancellation right). It is
clarified that in the initial delay period, the amount of the compensation for an unjustified delay is not material. The construction work, its completion, the commercial operation date and the costs involved with the construction are
adversely impacted by the War and/or its impacts, including in the year of the report. As at the date of the report, the financial closing for the project had been completed, however completion of the construction and operation of the
Sorek 2 generation facility are subject to fulfillment of conditions and factors that have not yet been fulfilled, and to operational or technical factors that relate to completion of the construction and the work on the project’s
site, which are impacted by, among other things, the defense (security) situation in Israel and the disruptions in the year of the report regarding arrival of work teams and equipment in Israel. It is noted that in the position of the
construction contractor and the equipment supplier is that the security situation in Israel constitutes force majeure. It is emphasized that ultimately, the date expected for completion of the
construction and commencement of the operation, as shown in the table, could be delayed even beyond that stated, as a result of, among other things, a delay of the construction work and connection of the equipment (including
construction of the desalination facility), delays in receipt of the required permits all of which had not yet been received at the date of the report, disruptions in arrival of equipment, force
majeure events, and occurrence of risk factors to which the Company is exposed, including delays relating to the War or its consequences. Such delays could involve an increase in the project costs. It is clarified that delays
as stated could impact the project’s costs and could also trigger an increase in costs (beyond the expected cost indicated above) and/or could constitute non‑compliance with liabilities to third parties.
|
| 6. |
Initiation and Construction Projects (Cont.)
|
|
|
A. |
Initiation and construction projects in Israel (held at 100% ownership by OPC Israel, which is 80% held by the Company)18: (Cont.)
|
|
|
1. |
Main details with reference to construction projects in Israel (the data presented in the table below is in respect of 100% for each project): (Cont.)
|
|
Total
|
||||||||||||||||||||||||||||||||||
|
Power
|
Date/
|
Total
|
construction
|
|||||||||||||||||||||||||||||||
|
plants/
|
expectation
|
expected
|
cost at
|
|||||||||||||||||||||||||||||||
|
energy
|
of start of
|
Main
|
construction
|
December
|
||||||||||||||||||||||||||||||
|
generation
|
Capacity
|
commercial
|
customer/
|
cost
|
2024
|
|||||||||||||||||||||||||||||
|
facilities
|
Status
|
(megawatts)
|
Location
|
Technology
|
operation
|
consumer
|
(NIS millions)
|
|||||||||||||||||||||||||||
|
|
|
|
|
|
|
|
|
|
|
|
|
|
|
|
|
|
|
|
|
|
|
|
|
|
|
|
|
|
|
|
|
|
||
|
Facilities for generation of energy on the customers’ premises
|
Various development/
construction stages
|
The total scope of the agreements as at the approval date of the report is about 79 megawatts, of which about 28 megawatts20, that
are in various development and construction stages.
|
On the customers’ premises throughout Israel
|
Natural gas and renewable energy (solar, storage)
|
Gradually based on the stage of development of each project.
|
Yard (private) consumers and the System Operator
|
An average of about 4 (about $1 million) per megawatt
|
About 98
|
||||||||||||||||||||||||||
|
20
|
Every facility has a capacity of up to 16 megawatts. As stated above, as at the date of the report all of the conditions had not yet been fulfilled
for the actual execution of the projects involving construction of facilities for generation of energy on the customers’ premises (or any of them), and fulfillment thereof is subject to various factors, such as licensing processes,
connection to the infrastructures (the Electricity Authority and the gas infrastructures) and construction. It is noted that due the outbreak of the War, the Company has sent force majeure
notifications to the consumers. The War and its consequences could negatively impact the compliance with the expected dates for commercial operation and the expected costs of the projects. It is further clarified that delays in
completion of the projects, if they are not justified based on the relevant agreements, impact the project costs and could cause an increase in costs (beyond the expected cost noted above) and/or could constitute non‑compliance with
liabilities to third parties, resulting in a start of proceedings or demands for relief. It is clarified that that stated above includes “forward‑looking” information as it is defined in the
Securities Law and there is no certainty it will be realized. Ultimately, there could be delays in projects designated for execution and/or an increase in costs (including with respect to early completion of the agreements/projects)
relating to these projects or a reduction thereof.
|
| 6. |
Initiation and Construction Projects (Cont.)
|
|
|
A. |
Initiation and construction projects in Israel (held at 100% ownership by OPC Israel, which is 80% held by the Company)29: (Cont.)
|
|
|
2. |
Main details with reference to development projects in Israel:
|
|
Power plants/energy
|
|||||||||||||||
|
generation facilities
|
Status
|
Location
|
Technology21
|
Additional details
|
|||||||||||
|
|
|
|
|
|
|
|
|
|
|
|
|
|
|||
|
Ramat Beka22
|
Advanced development
|
The Local Industrial Council of Neot Hovav
|
Photovoltaic with integrated storage
|
In May 2023 and June 2024, OPC Power Plants won two tenders of the Israel Lands Authority (ILA) for planning and construction of facilities
for generation of electricity using renewable energy using photovoltaic technology with storage, on a number of adjacent sites. As at the date of the report, in the Company’s estimation, the proximity of the sites on which it won the
two tenders constitutes a significant unique advantage for it, and may permit physical project consecutiveness, allow for savings on central (joint) costs, increase the certainty with respect to the feasibility and characteristics of
the projects and advance the conditions required for ultimate execution and connection to the transmission network in the framework of an overall plan having a significant scope. Subject to advancement of appropriate development
processes, it will be possible to act in order to advance a consolidated project having about 500 megawatts per hour plus storage capacity estimated at about 2,760 megawatts per hour, and an estimated cost of about NIS 4.0 – 4.2
billion, on a cumulative basis for the sites of the two tenders.
|
|||||||||||
|
21
|
It is clarified that the characteristics (including the capacity) of initiation and construction projects, along with their advancement, are subject to, among other things, planning
and licensing processes as well as assurance of connection to the electricity grid, are subject to changes, and in light of the early stage, there is no certainty regarding the advancement and/or the ultimate execution of the projects
in the initiation stage (in whole or in part).
|
|
22
|
As at the date of the report, the development processes had not yet been completed, and the authorizations required for advancement of the projects on
the land sites (including as a consolidated project) had not yet been received, and there is no certainty that these actions, approvals or decisions will be executed and/or received (in whole or in part) and/or the estimated period
for their completion (if completed). In addition, that stated regarding, among other things, the characteristics and capacity of the solar facilities and the storage capacity, the estimated cost of the subject projects (or any of
them), the feasibility of advancement of the projects as a consolidated project the economic benefit and the cost savings due to consolidation of the projects (if consolidated), increase of the certainty regarding the development or
connection to the network processes, realization of the advantages of a consolidated project (if it will be possible) and the start date of construction of the project/s includes “forward‑looking” information as it is defined in the
Securities Law, which is based solely on the Company’s estimates and assumptions as at the date of the report, and regarding which there is no certainty they will be realized or the manner in which they will be realized. As at the
approval date of the report, construction of the generation and storage facilities and advancement of the project/s (in any of the tenders and/or the consolidated project) depend on, among other things, advancement and completion of
the planning, construction, connection to the network and licensing processes, and assurance of financing for the construction, which as at the date of the report had not yet been completed and there is no certainty regarding their
completion or the manner thereof (if completed). In addition, the costs of the projects are impacted by macro‑economic conditions and are subject to changes in the prices of energy, equipment, construction, shipping, etc. Therefore,
ultimately there could be administrative, planning, environmental, regulatory, infrastructure, operational and licensing delays/deficiencies, along with an increase in the estimated costs – this being due to, among other things,
various factors that are not under the Company’s control, or as result of the occurrence of one or more of the risk factors the Company is exposed to, as stated in Section 19 to Part A of the Company’s Periodic Report, which are
included herein by means of reference.
|
| 6. |
Initiation and Construction Projects (Cont.)
|
|
|
A. |
Initiation and construction projects in Israel (held at 100% ownership by OPC Israel, which is 80% held by the Company)29: (Cont.)
|
|
|
2. |
Main details with reference to development projects in Israel: (Cont.)
|
|
Power plants/energy
|
|||||||||||||||
|
generation facilities
|
Status
|
Location
|
Technology21
|
Additional details
|
|||||||||||
|
|
|
|
|
|
|
|
|
|
|
|
|
|
|||
|
Ramat Beka (Cont.)
|
Advanced development
|
The Local Industrial Council of Neot Hovav
|
Photovoltaic with integrated storage
|
In the Company’s estimation, at this preliminary stage, subject to completion of all the transactions, development processes, planning and
licensing along with receipt of the required approvals, the start of the construction stage is expected to be in 2026–2027. As at the approval date of the report, to the best of the Company’s knowledge, government authorization was
received for advancement of the plan to the State National Infrastructures Board. For additional details – see Section 7.3.13.1 of Part A of the Periodic Report and Note 10B(6) to the Financial Statements and the Company’s Immediate
Report dated July 1, 2024 (Reference No.: 2024‑01‑066948). For additional details regarding an agreement for acquisition of solar panels for the project that was signed in the period of the report – see Section 7.14.11 of Part A of the
Periodic Report.
|
|||||||||||
| 6. |
Initiation and Construction Projects (Cont.)
|
|
|
A. |
Initiation and construction projects in Israel (held at 100% ownership by OPC Israel, which is 80% held by the Company)29: (Cont.)
|
|
|
2. |
Main details with reference to development projects in Israel: (Cont.)
|
|
Power
|
|||||||||||||||
|
plants/
|
|||||||||||||||
|
energy
|
|||||||||||||||
|
generation
|
|||||||||||||||
|
facilities
|
Status
|
Location
|
Technology21
|
Additional details
|
|||||||||||
|
|
|
|
|
|
|
|
|
|
|
|
|
|
|||
|
Solar and storage projects
|
Initial development
|
Kibbutzim/
communities
|
Photovoltaic with integrated storage
|
The Company has signed agreements with owners of rights in lands (communities located in peripheral areas – communities and kibbutzim) that
hold rights in land sites having potential for solar projects with integrated storage. As at the approval date of the report, agreements were signed designated for construction of solar facilities estimated at a cumulative about 215
megawatts and about 1,100 megawatt hours of storage. For additional details – see Section 7.3.13.2 of Part A of the Periodic Report.
|
|||||||||||
|
Intel
|
Initial development
|
Kiryat Gat
|
Conventional
|
On March 3, 2024, OPC Power Plants signed a non‑binding memorandum of understanding with Intel Electronics (“Intel”), an existing customer of
the Group, whereby OPC Power Plants will construct and operate a power plant (“the Project”), which will supply electricity to Intel’s facilities, including expansion of the facilities presently being constructed, for a period of
20 years starting from the operation date (“the Memorandum of Understanding”).
Pursuant to the Memorandum of Understanding, OPC Power Plants will hold exclusively rights in the Project with a capacity of at least
450 megawatts (and in the Company’s estimation up to 650 megawatts). For additional details – see Section 7.3.13.2 of Part A of the Periodic Report.
The parties are operating to advance the development and planning of the project and to sign detailed agreements, while during the period of
the report there was advancement with respect to, among other things, receipt of a planning study, approval of access to the land and planning recommendation from the Planning Administration, and to the best of the Company’s knowledge,
as at the approval date of the report, government authorization for start of the process for approval of a National Infrastructures Plan was received (which has not yet been published).
As at the approval date of the report, the Company estimates the construction cost of the Project in the range of about $1.3 million – about
$1.5 million per megawatt23 and subject to completion of the development and planning processes the Project is expected to reach the construction stage in 2027.
|
|||||||||||
|
23
|
That stated regarding the estimate of the cost (which includes an estimate of the costs of equipment, construction and financing the construction
(without a land component)) constitutes “forward‑looking” information as defined in the Securities Law, which is based on the Company’s plans as at the date of the report, regarding which there is no certainty it will ultimately
materialize. As at the date of the report, advancement of the project, its development, construction, operation, cost and final characteristics are subject to fulfillment of various factors and conditions (regulatory, operational,
commercial and financing) that have not yet been fulfilled (and there is no certainty regarding their fulfillment).
|
| 6. |
Initiation and Construction Projects (Cont.)
|
|
|
A. |
Initiation and construction projects in Israel (held at 100% ownership by OPC Israel, which is 80% held by the Company)29: (Cont.)
|
|
|
2. |
Main details with reference to development projects in Israel: (Cont.)
|
| 6. |
Initiation and Construction Projects (Cont.)
|
|
|
B. |
Construction and development projects in the U.S. (including projects in the area of renewable energy area held by CPV Renewable which is held at the rate of 66.7% by the CPV Group (the CPV Group is held at the rate of 70.46% by
the Company)24:
|
|
|
1. |
Main details regarding construction projects in the area of renewable energy using solar and wind technologies in the U.S. (the data presented in the table below is in respect of 100% for each project):
|
|
24
|
Details with respect to the scope of the investments in the United States were translated from dollars and presented in NIS based on the currency rate of exchange on December 31, 2024
– $1 = NIS 3.647. The information presented below regarding projects under construction, including with respect to the expected commercial structure, the projected commercial operation date, the
expected construction cost, an undertaking with a tax partner and/or the expected results of the activities for the first full calendar year (revenues, EBITDA, investments of the tax partner and cash flows after the tax partner)
includes “forward‑looking” information, as it is defined in the Securities Law, regarding which there is no certainty it will materialize (in whole or in part), including due to factors that are not under the control of the CPV
Group. The information is based on, among other things, estimates of the CPV Group as at the approval date of the report, the realization of which is not certain, and which might not be realized due to factors, such as: regulatory
changes or legislative changes (including changes impacting main suppliers of the projects and/or import of equipment and including regulatory/legislative changes in the area of energy or import tariffs due to changes in the
government in the U.S.), delays in receipt of permits, an increase in the construction costs, delays in execution of the construction work and/or technical or operational malfunctions, problems or delays regarding signing an
agreement for connection to the network or connection of the project to transmission or other infrastructures, an increase in costs due to the commercial conditions in the agreements with main suppliers (such as equipment suppliers
and contractors), problems signing an investment agreement with a Tax Equity Partner regarding part of the cost of the project and utilization of the tax benefits (if relevant), problems signing commercial agreements sale for of the
potential revenues from the project, terms of the commercial agreements, conditions of the energy market, an increase in the financing expenses, unforeseen expenses, macro‑economic changes, weather events, delays and an increase in
costs related to the supply chain, transport and an increase in raw‑material prices, etc. Completion of the projects in accordance with the said estimates is subject to the fulfillment of conditions which as at the approval date of
the report had not yet been fulfilled (fully or partly) and, therefore, there is no certainty they will be completed in accordance with that stated. Construction delays could even impact the ability of the companies to comply with
liabilities to third parties in connection with the projects (including based on guarantees provided in favor of those third parties).
|
| 6. |
Initiation and Construction Projects (Cont.)
|
|
|
B. |
Construction and development projects in the U.S. (including projects in the area of renewable energy area held by CPV Renewable which is held at the rate of 66.7% by the CPV Group (the CPV Group is held at the rate of 70.46% by
the Company)24: (Cont.)
|
|
|
1. |
Main details regarding construction projects in the area of renewable energy using solar and wind technologies in the U.S. The data presented in the table below is in respect of 100% for each project (Cont.)
|
|
Total
|
|||||||||||
|
expected
|
Total
|
||||||||||
|
construction
|
construction
|
||||||||||
|
cost net
|
cost
|
||||||||||
|
Regulated
|
for 100%
|
as at
|
|||||||||
|
Expected
|
market
|
of the
|
Tax
|
December 31,
|
|||||||
|
commercial
|
after
|
project
|
equity
|
2024
|
|||||||
|
Capacity
|
operation
|
Commercial
|
the PPA
|
(NIS
|
(NIS
|
(NIS
|
Expectation for a first full calendar year
|
||||
|
Project
|
(megawatts)
|
Location
|
date
|
structure
|
period
|
millions)
|
millions)
|
millions)
|
in the period of the PPA agreements
|
||
|
Cash flows
|
|||||||||||
|
after tax
|
|||||||||||
|
Revenues
|
EBITDA
|
partner
|
|||||||||
|
(NIS
|
(NIS
|
(NIS
|
|||||||||
|
millions)
|
millions)
|
millions)
|
|||||||||
|
CPV Backbone Solar, LLC (“Backbone”)
|
179 MWdc
|
Maryland
|
Second half of 2025
|
Long-term PPA1
(including green
certificates)
|
PJM + MD SRECs
|
≈ 1,149
(≈ $315 million)
|
≈ 423
(≈ $116 million)2
|
≈ 886
(≈ $243 million)
|
≈ 71
(≈ $19 million)
|
≈ 49
(≈ $13 million)
|
≈ 39
(≈ $11 million)
|
|
25
|
The project has signed an agreement with a global e‑commerce company for a period of 10 years from the start of the commercial operation, for supply of 82% of the electricity expected
to be generated by the project in the said period, and sale of solar renewable energy certificates, which is valid up to 2035. The balance of the project’s capacity (18%) will be used for supply to active customers, retail supply of
electricity of the CPV Group or for sale in the market.
|
|
26
|
In October 2024, the CPV Group signed an agreement with a tax partner in the ITC (Investment Tax Credit) format, where pursuant to the agreement the investment of the tax partner in
the project will be partly (about 20%) on the mechanical completion date, and the balance (about 80%) will be paid on the commercial operation date.
|
| 6. |
Initiation and Construction Projects (Cont.)
|
|
|
B. |
Construction and development projects in the U.S. (including projects in the area of renewable energy area held by CPV Renewable which is held at the rate of 66.7% by the CPV Group (the CPV Group is held at the rate of 70.46% by
the Company)24: (Cont.)
|
|
|
1. |
Main details regarding construction projects in the area of renewable energy using solar and wind technologies in the U.S. The data presented in the table below is in respect of 100% for each project (Cont.)
|
|
Total
|
|||||||||||
|
expected
|
Total
|
||||||||||
|
construction
|
construction
|
||||||||||
|
cost net
|
cost
|
||||||||||
|
Regulated
|
for 100%
|
as at
|
|||||||||
|
Expected
|
market
|
of the
|
Tax
|
December 31,
|
|||||||
|
commercial
|
after
|
project
|
equity
|
2024
|
|||||||
|
Capacity
|
operation
|
Commercial
|
the PPA
|
(NIS
|
(NIS
|
(NIS
|
Expectation for a first full calendar year
|
||||
|
Project
|
(megawatts)
|
Location
|
date
|
structure
|
period
|
millions)
|
millions)
|
millions)
|
in the period of the PPA agreements
|
||
|
Cash flows
|
|||||||||||
|
after tax
|
|||||||||||
|
Revenues
|
EBITDA
|
partner
|
|||||||||
|
(NIS
|
(NIS
|
(NIS
|
|||||||||
|
millions)
|
millions)
|
millions)
|
|||||||||
|
CPV Rogue’s Wind, LLC (“Rogues”)1
|
114
|
Pennsylvania
|
First half of 2026
|
Long-term PPA2
(including green certificates)
|
PJM MAAC
|
≈ 1,331
(≈ $365 million)
|
≈ 584
(≈ $160 million)3
|
≈ 379
(≈ $104 million)
|
≈ 91
(≈ $25 million)
|
≈ 71
(≈ $19 million)
|
≈ 58
(≈ $16 million)
|
|
27
|
In August 2024, a Work Commencement Order was issued and a project financing agreement was signed for project financing and provision of a shareholders’ loan to the project.
|
|
28
|
In April 2021, the project signed an agreement for sale of all the electricity and the environmental consideration (including Renewable Energy Certificates (RECs), benefits relating
to availability and accompanying services), the terms of which were improved in the period of the report. The agreement was signed for a period of 10 years starting from the commercial operation date. The CPV Group has provided
collateral for assurance of its obligations under the agreement, which includes execution of certain payments to the other party if certain milestones (including the commencement date of the activities) in the project are not
completed in accordance with the timetable determined.
|
|
29
|
The project is located on a former coal mine and, therefore, it is expected to be entitled to enlarged tax benefits of 40% in accordance with the IRA Law. The CPV Group intends to act
to sign an agreement with a tax partner (Equity Tax) in an ITC format in respect of about 40% of the cost of the project and use of the tax credits that are available to the project (subject to appropriate regulatory arrangements). That stated regarding the intention of the CPV Group to sign an agreement with a tax partner (equity tax), including the scope thereof and/or the scope of the tax benefits, includes “forward‑looking”
information as it is defined in the Securities Law, which is based on estimates and intentions of the CPV Group proximate to the approval date of the report and regarding which there is no certainty they will materialize (in whole
or in part). The said estimates might not materialize or might change due to a range of circumstances, including changes in the provisions of the law or the applicable benefits, the final terms of the agreement with the tax partner,
and factors as stated in footnote 24 above.
|
| 6. |
Initiation and Construction Projects (Cont.)
|
|
|
B. |
Construction and development projects in the U.S. (including projects in the area of renewable energy area held by CPV Renewable which is held at the rate of 66.7% by the CPV Group (the CPV Group is held at the rate of 70.46% by
the Company)24: (Cont.)
|
|
|
2. |
Main details regarding development projects in the U.S.
|
|
30
|
The information presented in the Section regarding the backlog of development projects of the CPV Group, including with respect to the status of the
projects and/or their characteristics (capacity, technology, integration possibilities with carbon capture potential, expected construction date, etc.) constitutes “forward‑looking” information as it is defined in the Securities
Law, regarding which there is no certainty it will be realized or how it will be realized. As at the approval date of the report, there is no certainty regarding execution of the development projects (in whole or in part), and their
advancement and the rate thereof are subject to, among other things (as applicable), completion of development and licensing processes, assurance of control over the land (real estate), signing of agreements (such as equipment and
construction agreements), execution of construction processes, assurance of a connection process, assurance of financing and/or receipt of receipt of regulatory and other approvals. In addition, advance of the development projects
is subject to the discretion of the competent organs of the CPV Group and of the Company.
|
| 6. |
Initiation and Construction Projects (Cont.)
|
|
|
B. |
Construction and development projects in the U.S. (including projects in the area of renewable energy area held by CPV Renewable which is held at the rate of 66.7% by the CPV Group (the CPV Group is held at the rate of 70.46% by
the Company)24: (Cont.)
|
|
|
2. |
Main details regarding development projects in the U.S.
|
|
Advanced
|
Preliminary
|
|||||||||||
|
Renewable energy
|
development31
|
development
|
Total
|
|||||||||
|
PJM market
|
||||||||||||
|
Solar
|
40
|
1,330
|
1,370
|
|||||||||
|
Wind
|
150
|
–
|
150
|
|||||||||
|
Total PJM market (1)
|
190
|
1,330
|
1,520
|
|||||||||
|
Other markets
|
||||||||||||
|
Solar
|
760
|
1,330
|
2,090
|
|||||||||
|
Wind
|
300
|
900
|
1,200
|
|||||||||
|
Total other markets
|
1,060
|
2,230
|
3,290
|
|||||||||
|
Total renewable energy
|
1,250
|
3,560
|
4,810
|
|||||||||
|
Share of the CPV Group (66.67%)
|
830
|
2,370
|
3,200
|
|||||||||
|
|
(1) |
Delays in the processes for connection to the network in the PJM market
|
|
31
|
In general, the CPV Group views projects that in its estimation are in a period of up to two years or up to three years to the start of the construction as projects in the advanced
development stage (there is no certainty the development projects, including projects in the advanced stage, will be executed). That stated is impacted by, among other things, the scope of the project and the technology, and could
change based on specific characteristics of a certain project, as well as from the external circumstances that are relevant to the project, such as the anticipated activities’ market or regulatory circumstances. In general, projects
that are designated to operate in the PJM market could be impacted by the changes in the connection processes as part of the proposed change described in Section 8.1.2.2(A) of Part A to the Periodic Report, and their progress could be
delayed as a result of these proposed changes. It is clarified that in the early development stages (in particular), the scope of the projects and their characteristics are subject to changes, if and to the extent they reach advanced
stages.
|
|
32
|
That stated above in connection with the impacts of the reform of PJM on the projects of the CPV Group, includes “forward‑looking” information as it is defined in the Securities Law,
the realization of which and the manner thereof are uncertain and depend on, among other things, factors that are not under the Company’s control.
|
| 6. |
Initiation and Construction Projects (Cont.)
|
|
|
B. |
Construction and development projects in the U.S. (including projects in the area of renewable energy area held by CPV Renewable which is held at the rate of 66.7% by the CPV Group (the CPV Group is held at the rate of 70.46% by
the Company)24: (Cont.)
|
|
|
2. |
Main details regarding development projects in the U.S. (Cont.)
|
|
Natural gas projects
|
Advanced
|
Preliminary
|
||||||||||
|
with carbon capture potential*
|
development
|
development
|
Total
|
|||||||||
|
Development projects
|
(2)1,350
|
|
(3)5,000
|
|
6,350
|
|||||||
|
Share of the CPV Group
|
950
|
3,940
|
4,890
|
|||||||||
|
|
(2) |
In the third quarter of 2024, the Basin Ranch project (a natural‑gas project with an estimated capacity of about 1.35 GW located in the state of Texas with future carbon capture potential, which is held at the rate of 70% by the CPV
Group and 30% by a partner), which was chosen by TEF (Texas Energy Fund), advanced to the due diligence stage for receipt of a subsidized loan in the amount of about $1 billion having a term of about 20 years bearing fixed interest
of 3% – this being on the condition that that the construction thereof begins up to the end of 2025. As at the submission date of the report, the CPV Group estimates the total construction cost of the power plant project (100%) in the
range of about NIS 6.6 – NIS 7.3 billion ($1.8 – $2 billion), and subject to completion of the relevant development processes, particularly receipt of permits (including environmental), completion of the material undertakings and
signing of the loan agreement, as stated, an investment decision in the project to start its construction is expected in 2025. In light of that stated, as at the approval date of the report, the CPV Group is working on a private process
to raise the capital required for construction of the project.
|
|
33
|
It is clarified that that stated above with respect to execution of the project, its characteristics, expected time of the development, costs, receipt
of the said loan and/or completion of raising of the required capital includes “forward‑looking” information as it is defined in the Securities Law. As stated above, as at the submission date of the report the conditions for receipt
of the said loan as well as additional conditions required for its construction and execution of the project had not yet been fulfilled, and their fulfillment and timing thereof are subject to various factors (regulatory,
operational, commercial and financing), including factors that are not under the control of the CPV Group. Ultimately, that stated may not be realized or may be realized in a significantly different manner.
|
| 6. |
Initiation and Construction Projects (Cont.)
|
|
|
B. |
Construction and development projects in the U.S. (including projects in the area of renewable energy area held by CPV Renewable which is held at the rate of 66.7% by the CPV Group (the CPV Group is held at the rate of 70.46% by
the Company)24: (Cont.)
|
|
|
2. |
Main details regarding development projects in the U.S. (Cont.)
|
|
|
(3) |
In February 2025, FERC approved the PJM’s “Resource Reliability Initiative” (RRI), the purpose of which is to handle the expected deficiency in available capacity by accelerating connection of up to 50 projects for generation of
electricity that meet certain criteria. Qualifying projects will be advanced to the next connection round, Transition Cycle #2, which permits projects, as stated, to potentially connect up to about 14 months earlier. PJM noted that
selection of the projects as part of the RRI will be made by means of a weighted‑average point method that will focus on the size of the project, value of the availability and date of the commercial operation applications, and selection
of the projects is expected to end in the second quarter of 2025. Projects that are selected for RRI will be required to comply with fixed timetables for construction and participation in PJM’s availability tenders for a minimum
commitment period of ten years from the commercial operation date. As at the approval date of the report, the CPV Group intends to submit a request (including required collaterals) for the Oregon project (at the present time the project
is in the initial development stage) for purposes of including it as part of this accelerated connection process.34
|
|
Category
|
12/31/2024
|
12/31/2023
|
Board’s Explanations
|
||||||
|
Current Assets
|
|||||||||
|
Cash and cash equivalents
|
962
|
1,007
|
For details – see the Company’s consolidated statements of cash flows in the financial statements and Part 8 below.
|
||||||
|
Trade receivables
|
293
|
247
|
Most of the increase, in the amount of about NIS 42 million, stems from an increase in the balances of customers in Israel, mainly due to an increase in customer consumption.
|
||||||
|
Receivables and debit balances
|
90
|
406
|
Most of the decrease stems from receipt of the balance of the receivables in respect of the ITC (investment tax credit) grant in the Maple Hill project, the amount received was
transferred to the tax partner in the project.
|
||||||
|
Short-term derivative financial instruments
|
–
|
12
|
|||||||
|
Total current assets
|
1,345
|
1,672
|
|||||||
| 7. |
Financial Position as at December 31, 2024 (in millions of NIS) (Cont.)
|
|
Category
|
12/31/2024
|
12/31/2023
|
Board’s Explanations
|
||||||
|
Non-Current Assets
|
|||||||||
|
Long-term deposits and restricted cash
|
60
|
59
|
|||||||
|
Long-term receivables and debit balances
|
162
|
247
|
|||||||
|
Investments in associated companies
|
5,320
|
2,550
|
Most of the increase stems from exit from the consolidation of CPV Renewable and as a result of transition to the equity method (for additional details – see Note 23E to the Financial
Statements), in the amount of about NIS 2,225 million, the amount of about NIS 670 million in respect of transactions for acquisition of additional rights in the Shore and Maryland power plants in the fourth quarter of 2024 and the
share of the income of associated companies, in the amount of about NIS 166 million. This increase was partly offset by distribution of dividends by associated companies (particularly Fairview), in the amount of about NIS 326 million.
For additional details regarding investments in associated companies – see Section 4D above and Note 24 to the Financial Statements.
|
||||||
|
Long-term derivative financial instruments
|
44
|
51
|
|||||||
|
Property, plant and equipment
|
4,238
|
6,243
|
For details – see Note 9 to the financial statements.
|
||||||
|
Right-of use assets and long-term deferred expenses
|
637
|
631
|
For details – see Note 10 to the financial statements.
|
||||||
|
Intangible assets
|
261
|
1,165
|
For details – see Note 11 to the financial statements.
|
||||||
|
Total non-current assets
|
10,722
|
10,946
|
|||||||
|
Total assets
|
12,067
|
12,618
|
|||||||
| 7. |
Financial Position as at December 31, 2024 (in millions of NIS) (Cont.)
|
|
Category
|
12/31/2024
|
12/31/2023
|
Board’s Explanations
|
||||||
|
Current Liabilities
|
|||||||||
|
Loans and credit from banks and financial institutions (including current maturities)
|
82
|
391
|
Most of the decrease stems from a short‑term credit framework repaid by OPC Israel, in the amount of NIS 200 million, and a decrease in the current maturities of
loans in Israel, in the amount of about NIS 43 million, as a result of financing agreements signed by OPC Israel (for additional details – see Note 14B(1) to the Financial Statements). In addition, the decrease stems from exit from the
consolidation of CPV Renewable in the fourth quarter of 2024, which caused a decrease of about NIS 67 million in the current maturities.
|
||||||
|
Current maturities of debt from holders of non-controlling interests
|
14
|
32
|
|||||||
|
Current maturities of debentures
|
212
|
192
|
|||||||
|
Trade payables
|
213
|
257
|
Most of the decrease stems from suppliers in connection with construction projects in Israel, in the amount of about NIS 38 million.
|
||||||
|
Payables and other credit balances
|
123
|
411
|
See the explanation in the “receivables and debit balances” section above.
|
||||||
|
Total current liabilities
|
644
|
1,283
|
|||||||
| 7. |
Financial Position as at December 31, 2024 (in millions of NIS) (Cont.)
|
|
Category
|
12/31/2024
|
12/31/2023
|
Board’s Explanations
|
||||||
|
Non-Current Liabilities
|
|||||||||
|
Long-term loans from banks and financial institutions
|
2,150
|
2,865
|
There was an increase deriving from taking out of long‑term loans by the CPV Group, in the amount of about NIS 347 million, prior to the exit from the consolidation
in the fourth quarter of 2024. On the other hand, there was a decrease stemming from exit from the consolidation of CPV Renewable in the fourth quarter of 2024 and the resulting transition to the equity method of accounting, which
caused a decrease of about NIS 1,132 million in the long‑term loans. In addition, there was an increase deriving from financing agreements signed by OPC Israel under which loans were taken out, in the amount of about NIS 1,650 million,
while at the same time early repayment was made of the unpaid balance of the project loans of Zomet and Gat in the aggregate amount of about NIS 1,561 million – for additional details see Note 14B(1) to the financial statements.
|
||||||
|
Long-term debt from holders of non-controlling interests
|
500
|
422
|
Most of the increase derives from an increase in the balance of the long‑term loans from holders of non‑controlling interests in the CPV Group, where an increase,
in the amount of about NIS 54 million, relates to additional loans made to the Group and accrual of interest to the principal in the period of the report, and an increase, in the amount of about NIS 28 million, is due to the increase in
the shekel/dollar exchange rate.
|
||||||
|
Debentures
|
1,663
|
1,647
|
Most of the increase, in the amount of about NIS 197 million, derives from issuance of the debentures (Series D) and an increase in the linkage differences relating to the debentures
(Series B), in the amount of about NIS 32 million. On the other hand, there was a decrease deriving from repayment of debentures, in the amount of about NIS 193 million.
|
||||||
|
Long-term lease liabilities
|
31
|
204
|
Most of the decrease, in the amount of about NIS 178 million, stems from exit from the consolidation of CPV Renewable and as a result of transition to the equity method of accounting in
the fourth quarter of 2024 (for details – see Note 23E to the financial statements).
|
||||||
|
Long-term derivative financial instruments
|
–
|
58
|
The decrease stems from exit from the consolidation of CPV Renewable and as a result of transition to the equity method of accounting in the fourth quarter of 2024 (for details – see
Note 23E to the financial statements).
|
||||||
|
Other long-term liabilities
|
115
|
399
|
The decrease stems mainly from exit from the consolidation of CPV Renewable and as a result of transition to the equity method of accounting in the fourth quarter of 2024 (for details –
see Note 23E to the financial statements).
|
||||||
|
Liabilities for deferred taxes
|
543
|
498
|
The increase stems mainly from utilization of carryforward losses in Israel.
|
||||||
|
Total non-current liabilities
|
5,002
|
6,093
|
|||||||
|
Total liabilities
|
5,646
|
7,376
|
|||||||
|
Total equity
|
6,421
|
5,242
|
Most of the increase in the equity stems mainly from issuance of shares (net of issuance expenses), in the amount of about NIS 780 million, net income, in the amount of about NIS 197
million, other comprehensive income, in the amount of about NIS 30 million, and issuance of equity to holders of non‑controlling interests in the U.S. in the amount of about NIS 175 million.
|
||||||
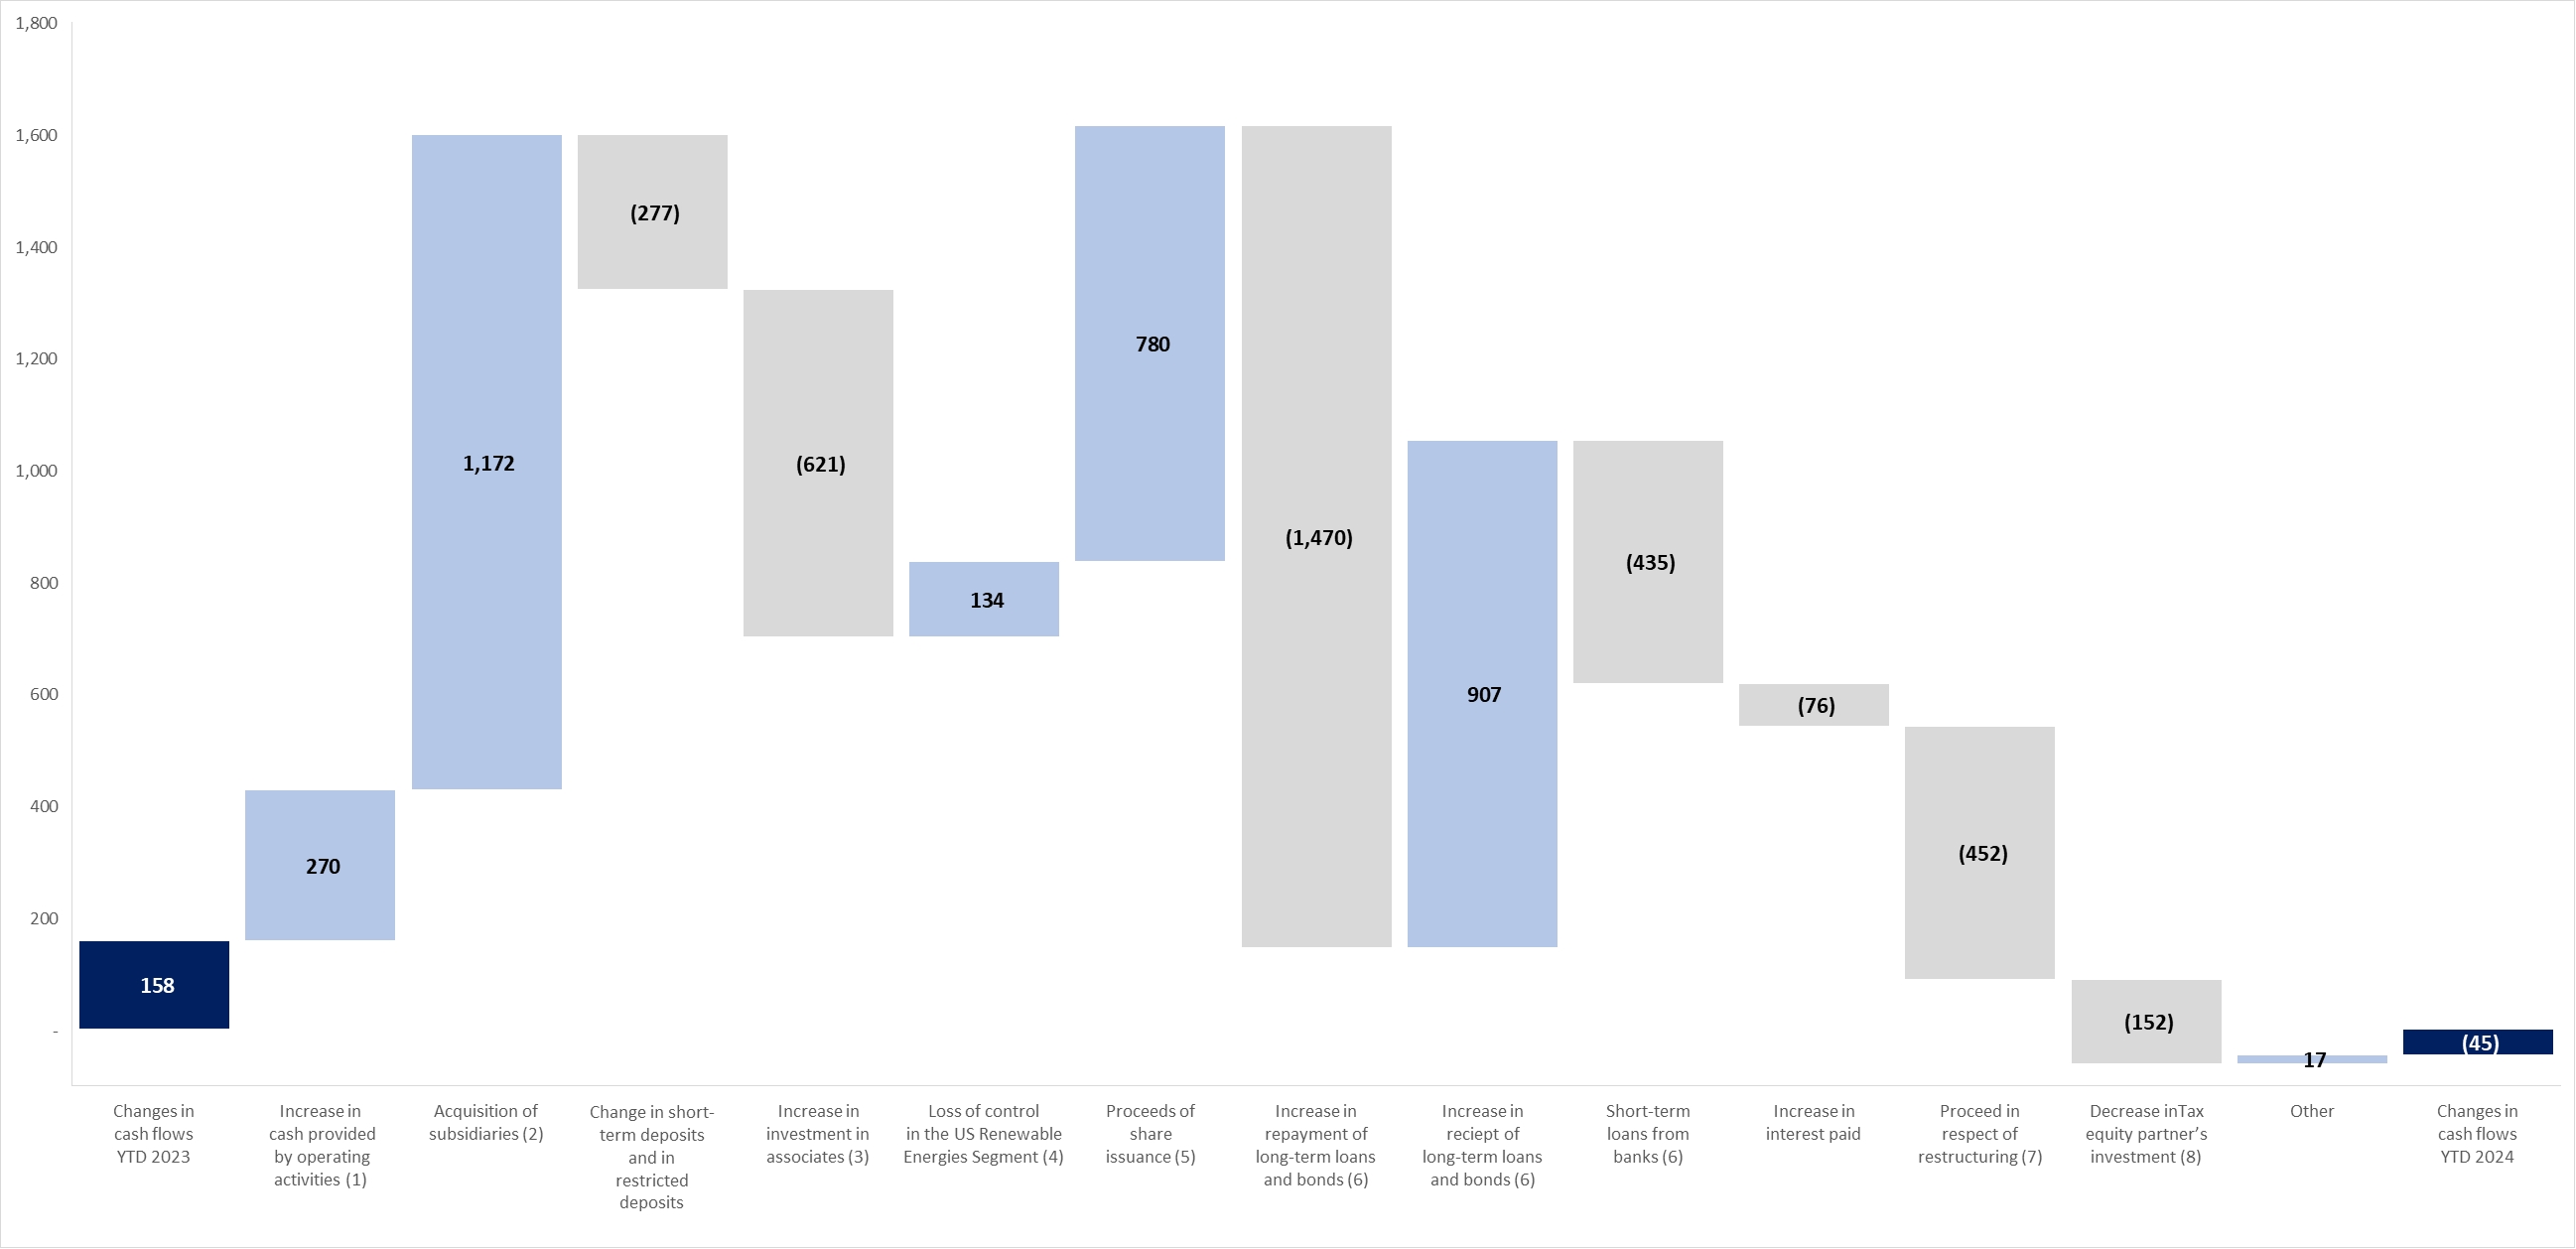
| (1) |
Most of the increase in cash provided by operating activities stems from an increase in income on a cash basis, in the amount of about NIS 124 million, and an increase in dividends from associated companies in the U.S., in the amount
of about NIS 222 million (for details – see Note 24E to the financial statements). On the other hand, there was an increase of about NIS 60 million in the tax payments mainly as a result of loss of control of CPV Renewable (for
additional details – see Note 23E to the financial statements).
|
| (2) |
For additional details regarding acquisition of subsidiaries in 2023 – see Note 23F to the financial statements.
|
| (3) |
Most of the increase stems from acquisition of additional rights in the Maryland and Shore power plants. For additional details – see Note 24C to the financial statements.
|
| (4) |
For additional details – see Note 23E to the financial statements.
|
| (5) |
For additional details – see Note 18B to the financial statements.
|
| (6) |
For additional details – see Notes 14 and 15 to the financial statements.
|
| (7) |
For additional details – see Section 4G.
|
| (8) |
For details regarding a transaction for a structural change in Israel in 2023 – see Note 23A(1) to the financial statements.
|
| (9) |
For additional details regarding investments of the tax partner in Stagecoach in the period of the report and in the Maple Hill project in 2023 – see Section 8.14.7 of Part A of the Periodic Report.
|
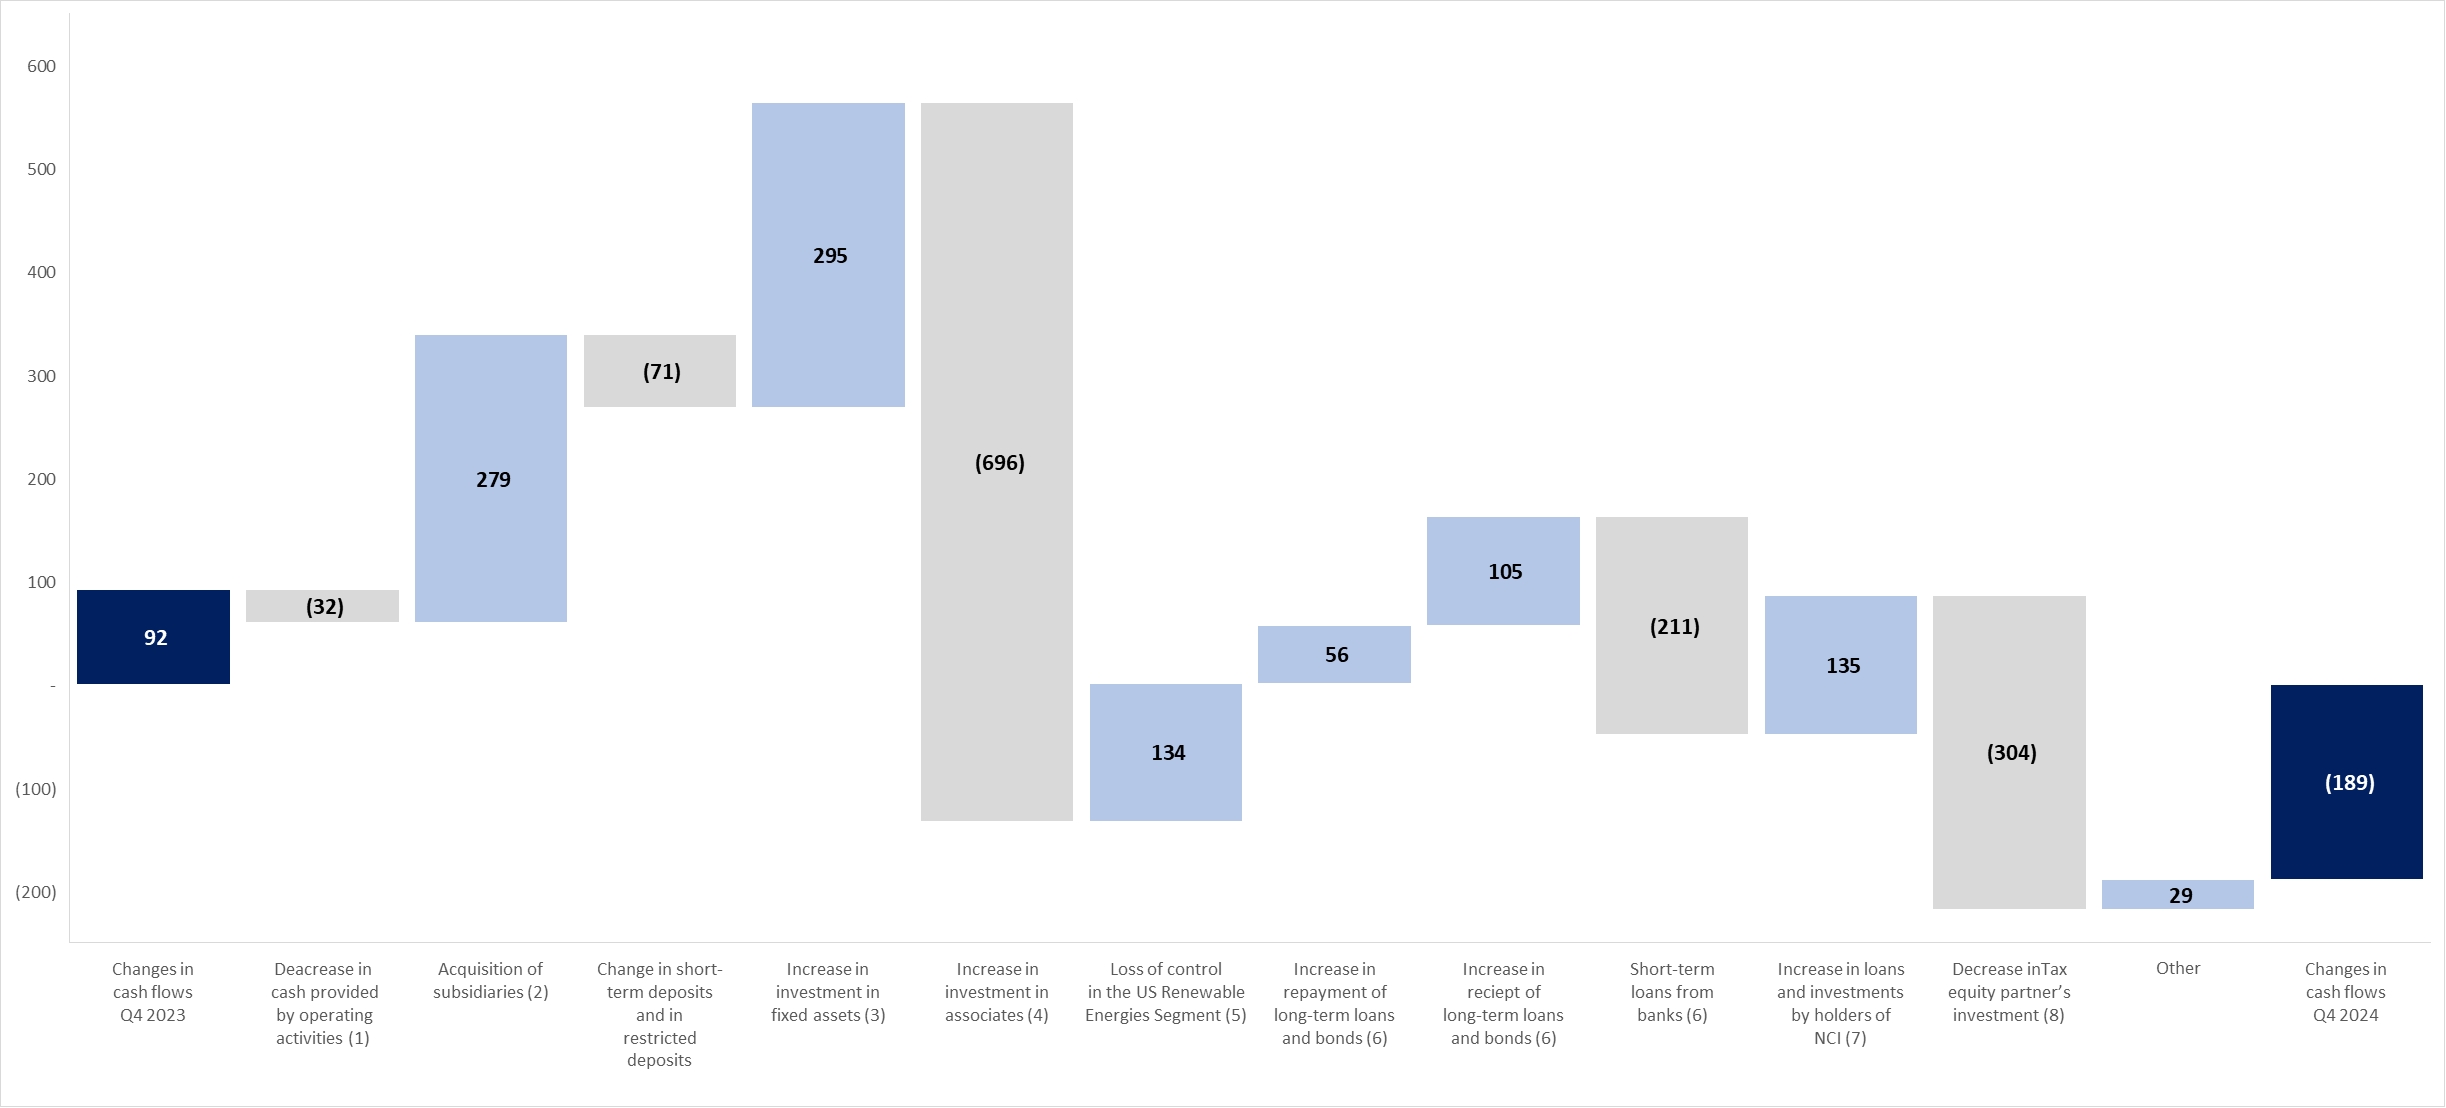
| (1) |
Most of the decrease in the cash provided by operating activities stems from an increase, in the amount of about NIS 62 million, in the tax payments as a result of loss of control of CPV Renewable (for additional details – see
Note 23E to the financial statements). On the other hand, there was an increase in dividends from associated companies in the U.S., in the amount of about NIS 24 million.
|
| (2) |
For additional details regarding acquisition of subsidiaries in 2023 – see Note 23F to the financial statements.
|
| (3) |
Most of the decrease stems from exit from the consolidation of CPV Renewable in the fourth quarter of 2024 and as a result transition to the equity method of accounting – see Note 23E to the financial statements.
|
| (4) |
Most of the increase stems from acquisition of additional rights in the Maryland and Shore power plants. For details – see Note 24C to the financial statements.
|
| (5) |
For additional details – see Note 23E to the financial statements.
|
| (6) |
For additional details – see Notes 14 and 15 to the financial statements.
|
| (7) |
For additional details regarding investments of holders of non‑controlling interests in OPC Power and in OPC Israel – see Notes 23A(3) and 23D to the financial statements, respectively.
|
| (8) |
For additional details regarding investments of the tax partner in the Maple Hill project in 2023 – see Section 8.14.7 of Part A of the Periodic Report.
|
|
|
A. |
Compositions of the adjusted financial debt, net
|
|
As at December 31, 2024(1)
|
As at December 31, 2023(2)
|
|
|
5.2
|
4.9
|
| (1) |
After elimination of debt under construction in the Renewable Energies segment in the U.S. of about NIS 132 million, as detailed in the following table.
|
|
|
(2) |
After elimination of debt under construction in the Renewable Energies segment in the U.S. of about NIS 9 million, as detailed in the following table. With respect to the power plants, the construction and/or acquisition of which was
completed in 2023 and the debt in respect thereof included in the calculation, calculation of representative EBITDA was made as follows: Zomet and Mountain Wind in accordance with projected data; and Gat and Three Rivers based on a
linear adjustment to reflect a full year of the actual results in 2023.
|
| 9. |
Adjusted financial debt, net (Cont.)
|
|
|
A. |
Compositions of the adjusted financial debt, net (Cont.)
|
|
Gross debt
|
||||||||||||||||||||||||||||
|
Debt
|
Cash and cash
|
Derivative
|
||||||||||||||||||||||||||
|
Method of
|
(including
|
equivalents
|
financial
|
|||||||||||||||||||||||||
|
presentation
|
interest
|
and deposits
|
instruments
|
|||||||||||||||||||||||||
|
in the
|
payable
|
Weighted-
|
Final
|
(including
|
for hedging
|
|||||||||||||||||||||||
|
Company’s
|
and
|
average
|
repayment
|
restricted cash
|
principal
|
|||||||||||||||||||||||
|
financial
|
deferred
|
interest
|
date of
|
used for debt
|
and/or
|
Net
|
||||||||||||||||||||||
|
Name of project
|
statements
|
expenses)
|
rate
|
the loan
|
service) (1)
|
interest
|
debt
|
|||||||||||||||||||||
|
|
||||||||||||||||||||||||||||
|
Hadera
|
Consolidated
|
585
|
4.9%
|
|
2037
|
72
|
44
|
469
|
||||||||||||||||||||
|
Israel headquarters and others (2)
|
Consolidated
|
1,649
|
6.3%–6.4%
|
|
2033
|
16
|
–
|
1,633
|
||||||||||||||||||||
|
Total Israel
|
2,234
|
6.0%
|
|
88
|
44
|
2,102
|
||||||||||||||||||||||
|
Active renewable energy
|
||||||||||||||||||||||||||||
|
projects (3)
|
Associated (66.7%)
|
323
|
4.2%
|
|
2028–2030
|
5
|
16
|
302
|
||||||||||||||||||||
|
Financing of renewable energy
|
||||||||||||||||||||||||||||
|
projects (4)
|
Associated (66.7%)
|
426
|
6.5%
|
|
2026
|
285
|
9
|
132
|
||||||||||||||||||||
|
Total renewable energy
|
749
|
5.5%
|
|
290
|
25
|
434
|
||||||||||||||||||||||
|
Fairview (Cash Sweep 50%) (5)
|
Associated (25%)
|
482
|
7.6
|
|
2030–2031
|
–
|
2
|
480
|
||||||||||||||||||||
|
Towantic (Cash Sweep 45%) (6)
|
Associated (26%)
|
215
|
8.1%
|
|
2029
|
9
|
(1
|
)
|
207
|
|||||||||||||||||||
|
Maryland (Cash Sweep 75%) (7)
|
Associated (75%)
|
891
|
6.6%
|
|
2028
|
80
|
15
|
796
|
||||||||||||||||||||
|
Shore (8) (Cash Sweep 100%)
|
Associated (69%)
|
1,114
|
5.2%
|
|
February 2025
(refinanced)
|
235
|
–
|
879
|
||||||||||||||||||||
|
Valley (Cash Sweep 100%)
|
Associated (50%)
|
686
|
10.4%
|
|
May 2026
|
104
|
–
|
582
|
||||||||||||||||||||
|
Three Rivers (Cash Sweep 100%)
|
Associate (10%)
|
252
|
5.2%
|
|
2028
|
14
|
17
|
221
|
||||||||||||||||||||
|
Total energy transition (9)
|
3,640
|
7.0%
|
|
442
|
33
|
3,165
|
||||||||||||||||||||||
|
Headquarters and others – U.S.
|
Consolidated
|
–
|
–
|
–
|
264
|
–
|
(264
|
)
|
||||||||||||||||||||
|
Total U.S.
|
4,389
|
996
|
58
|
3,335
|
||||||||||||||||||||||||
|
Total energy headquarters (11)
|
1,891
|
2.5%–6.2%
(weighted-
average
3%)
|
2028–2034
|
664
|
–
|
1,227
|
||||||||||||||||||||||
|
Total
|
8,514
|
1,748
|
102
|
6,664
|
||||||||||||||||||||||||
| (1) |
Includes restricted cash, in the amount of about NIS 53 million, in Hadera and in the energy transition segment, in the amounts of about NIS 252 million.
|
| (2) |
For details regarding signing of two financing agreements in OPC Israel in the aggregate scope of about NIS 1.65 billion and early repayment of the project financing in Zomet and Gat – see Note 14B(1) to the Financial Statements.
|
| (3) |
As at the date of the report, relates to the Keenan and Mountain Wind projects.
|
| (4) |
For details – see Section 8.17.5 of Part A of the Periodic Report. It is noted that as at the date of the report, the Maple Hill and Stagecoach projects are financed under a construction financing framework for renewable energy
projects together with the Backbone project.
|
| (5) |
On August 14, 2024, Fairview completed an undertaking in a refinancing agreement – for details see Section 8.17.4 of Part A of the Periodic Report. In February 2025, Fairview’s financing agreement was amended such that the interest
margin on the long‑term loans was reduced from 3.5% (the margin determined in August 2024) to 3%.
|
| 9. |
Adjusted financial debt, net (Cont.)
|
|
|
A. |
Compositions of the adjusted financial debt, net (Cont.)
|
| (6) |
On June 27, 2024, Towantic completed an undertaking in a refinancing agreement – for details see Section 8.17.4 of Part A of the Periodic Report.
|
| (7) |
In September 2024, Maryland’s financing agreement was revised, and the interest‑rate margin on the long‑term loan was reduced from 4.00% to 3.75%.
|
| (8) |
On February 4, 2025, Shore completed an undertaking in a new financing agreement. For details – see Section 8.17.4 of Part A of the Periodic Report. It is noted that for purposes of completion of Shore’s new financing agreement, the
amount of NIS 286 million ($80 million) was granted to Shore by all of its equity holders. The CPV Group provided about USD 72 million, including the share of the partner in the project, with which it signed an agreement for acquisition
of holdings in Shore (about 20%) in January 202536.
|
| (9) |
The rate (%) of the Cash Sweep mechanism is in accordance with the estimate of the CPV Group and it could change based on the provisions of the financing agreements of the projects.
|
| (10) |
As part of the financing agreements, financial covenants were determined for the projects. As at the date of the report, the associated companies are in compliance with the financial covenants. As part of the financing agreement, a
financial covenant was provided for Maryland requiring an historical debt service coverage ratio of 1:1 during the last four quarters. As at the date of the financial statements, Maryland is in compliance with this financial covenant
(1.81).
|
| (11) |
Includes balances of debt and cash in the Company and cash in ICG Energy Inc. (available for use for all the Group’s needs).
|
| 9. |
Adjusted financial debt, net (Cont.)
|
|
|
A. |
Compositions of the adjusted financial debt, net (Cont.)
|
|
Debt
|
Cash and cash
|
Derivative
|
||||||||||||||||||
|
Method of
|
(including
|
equivalents
|
financial
|
|||||||||||||||||
|
presentation
|
interest
|
and deposits
|
instruments
|
|||||||||||||||||
|
in the
|
payable
|
(including
|
for hedging
|
|||||||||||||||||
|
Company’s
|
and
|
restricted cash
|
principal
|
|||||||||||||||||
|
financial
|
deferred
|
used for debt
|
and/or
|
Net
|
||||||||||||||||
|
statements
|
expenses)
|
service)
|
interest
|
debt
|
||||||||||||||||
|
|
||||||||||||||||||||
|
Rotem
|
Consolidated
|
–
|
9
|
–
|
(9
|
)
|
||||||||||||||
|
Hadera
|
Consolidated
|
642
|
98
|
37
|
507
|
|||||||||||||||
|
Zomet
|
Consolidated
|
1,111
|
94
|
–
|
1,017
|
|||||||||||||||
|
Gat
|
Consolidated
|
434
|
12
|
–
|
422
|
|||||||||||||||
|
Headquarters and others – Israel
|
Consolidated
|
202
|
160
|
–
|
42
|
|||||||||||||||
|
Total Israel
|
2,389
|
373
|
37
|
1,979
|
||||||||||||||||
|
Active renewable energy projects
|
Consolidated
(100%)
|
541
|
12
|
22
|
507
|
|||||||||||||||
|
Financing construction of renewable
|
||||||||||||||||||||
|
energy projects
|
Consolidated
(100%)
|
329
|
327
|
(7
|
)
|
9
|
||||||||||||||
|
Total renewable energy
|
870
|
339
|
15
|
516
|
||||||||||||||||
|
Fairview
|
Associated
|
334
|
25
|
6
|
303
|
|||||||||||||||
|
Towantic
|
Associated
|
339
|
44
|
7
|
288
|
|||||||||||||||
|
Maryland
|
Associated (25%)
|
304
|
26
|
8
|
270
|
|||||||||||||||
|
Shore
|
Associated (37.5%)
|
599
|
105
|
19
|
475
|
|||||||||||||||
|
Valley
|
Associated
|
708
|
66
|
–
|
642
|
|||||||||||||||
|
Three Rivers
|
Associated
|
271
|
21
|
20
|
230
|
|||||||||||||||
|
Total energy transition
|
2,555
|
287
|
60
|
2,208
|
||||||||||||||||
|
Headquarters and others – U.S.
|
Consolidated
|
–
|
12
|
–
|
(12
|
)
|
||||||||||||||
|
Total U.S.
|
3,425
|
638
|
75
|
2,712
|
||||||||||||||||
|
Total Energy headquarters
|
1,853
|
336
|
–
|
1,517
|
||||||||||||||||
|
Total
|
7,667
|
1,347
|
112
|
6,208
|
||||||||||||||||
| 9. |
Adjusted financial debt, net (Cont.)
|
|
|
B. |
Interest and linkage bases
|
|
Weighted-
|
||||||||||||||||||||||||||||||||
|
Debt bearing
|
average
|
|||||||||||||||||||||||||||||||
|
unlinked
|
Debt bearing
|
interest as of
|
||||||||||||||||||||||||||||||
|
As at
|
Total
|
fixed interest/
|
fixed interest
|
Debt bearing
|
December 31
|
|||||||||||||||||||||||||||
|
December 31, 2024
|
debt
|
fixed debt
|
linked to the CPI
|
prime interest
|
2024
|
|||||||||||||||||||||||||||
|
Total
|
Interest
|
Total
|
Interest
|
Total
|
Interest
|
|||||||||||||||||||||||||||
|
The Company (debentures)
|
1,891
|
767
|
2.5
|
%
|
1,124
|
3.4
|
%
|
–
|
–
|
3.0%
|
|
|||||||||||||||||||||
|
OPC Israel (bank)
|
1,649
|
–
|
–
|
–
|
–
|
1,649
|
6.3%–6.4%
|
|
6.3%–6.4%
|
|
||||||||||||||||||||||
|
Hadera (bank)
|
585
|
484
|
5.3
|
%
|
101
|
3.5
|
%
|
–
|
–
|
4.9%
|
|
|||||||||||||||||||||
|
Weighted-
|
||||||||||||||||||||||||||||||||
|
Debt bearing
|
average
|
|||||||||||||||||||||||||||||||
|
unlinked
|
Debt bearing
|
interest as of
|
||||||||||||||||||||||||||||||
|
As at
|
Total
|
fixed interest/
|
fixed interest
|
Debt bearing
|
December 31
|
|||||||||||||||||||||||||||
|
December 31, 2023
|
debt
|
fixed debt
|
linked to the CPI
|
prime interest
|
2023
|
|||||||||||||||||||||||||||
|
Total
|
Interest
|
Total
|
Interest
|
Total
|
Interest
|
|||||||||||||||||||||||||||
|
The Company
|
||||||||||||||||||||||||||||||||
|
(debentures)
|
1,853
|
851
|
2.5
|
%
|
1,002
|
2.8
|
%
|
–
|
–
|
2.6
|
%
|
|||||||||||||||||||||
|
Hadera (bank)
|
642
|
517
|
5.3
|
%
|
125
|
3.5
|
%
|
–
|
–
|
4.9
|
%
|
|||||||||||||||||||||
|
Zomet (bank)
|
1,111
|
–
|
–
|
–
|
–
|
1,111
|
6.8
|
%
|
6.8
|
%
|
||||||||||||||||||||||
|
Gat (bank)
|
434
|
–
|
–
|
–
|
–
|
434
|
6.9
|
%
|
6.9
|
%
|
||||||||||||||||||||||
|
Short-term credit
|
||||||||||||||||||||||||||||||||
|
frameworks (bank)
|
202
|
202
|
6.9
|
%
|
–
|
–
|
–
|
–
|
6.9
|
%
|
||||||||||||||||||||||
| 9. |
Adjusted financial debt, net (Cont.)
|
|
|
B. |
(Cont.)
|
|
Interest
|
||||||||||||||||||||||||||||||||
|
Rate of
|
margin
|
Weighted-
|
||||||||||||||||||||||||||||||
|
holdings
|
on
|
average
|
||||||||||||||||||||||||||||||
|
of the
|
long-
|
interest as at
|
||||||||||||||||||||||||||||||
|
As at
|
CPV
|
Total
|
term
|
Debt bearing
|
December 31
|
|||||||||||||||||||||||||||
|
December 31, 2024
|
Group
|
debt
|
loans
|
Fixed debt
|
SOFR interest
|
2024
|
||||||||||||||||||||||||||
|
Total
|
Interest
|
Total
|
Interest
|
|||||||||||||||||||||||||||||
|
Active renewable energy
|
|
|
||||||||||||||||||||||||||||||
|
projects
|
66.7
|
%
|
322
|
1.13%–1.73
|
%
|
238
|
3.5
|
%
|
84
|
6.0
|
%
|
4.2
|
%
|
|||||||||||||||||||
|
Financing of construction of
|
|
|
||||||||||||||||||||||||||||||
|
renewable energy projects
|
66.7
|
%
|
425
|
2.10%–2.85
|
%
|
178
|
6.9
|
%
|
247
|
6.2
|
%
|
6.5
|
%
|
|||||||||||||||||||
|
Fairview*
|
25
|
%
|
481
|
3.50
|
%
|
243
|
7.2
|
%
|
238
|
8.1
|
%
|
7.6
|
%
|
|||||||||||||||||||
|
Towantic
|
26
|
%
|
213
|
3.75
|
%
|
156
|
8.0
|
%
|
57
|
8.4
|
%
|
8.1
|
%
|
|||||||||||||||||||
|
Maryland
|
75
|
%
|
893
|
3.75
|
%
|
497
|
5.6
|
%
|
396
|
7.9
|
%
|
6.6
|
%
|
|||||||||||||||||||
|
Shore**
|
69
|
%
|
1,096
|
3.75
|
%
|
803
|
4.1
|
%
|
293
|
8.4
|
%
|
5.2
|
%
|
|||||||||||||||||||
|
Valley***
|
50
|
%
|
687
|
5.50
|
%
|
–
|
–
|
687
|
10.4
|
%
|
10.4
|
%
|
||||||||||||||||||||
|
Three Rivers
|
10
|
%
|
252
|
3.75
|
%
|
212
|
4.6
|
%
|
40
|
8.4
|
%
|
5.2
|
%
|
|||||||||||||||||||
|
|
(*) |
In February 2025, the refinancing agreement of Fairview was amended in such a manner that the interest margin on the long‑term loans was reduced from 3.5% to 3.0%, as detailed in Section 9A(5) above.
|
|
|
(**) |
In February 2025, the refinancing agreement of Shore was completed wherein the terms of the debt were updated. For additional details – see Section A(8), above.
|
|
|
(***) |
The interest margin of Valley was determined taking into account the lack of the Title V permit, as at the extension date of the financing agreement in June 2023. For additional details regarding completion of the request for receipt
of the Title V permit after the date of the report and the progress of the process – see Section 8.1.4(J) of Part A of the Periodic Report.
|
|
Interest
|
||||||||||||||||||||||||||||||||
|
Rate of
|
margin
|
Weighted-
|
||||||||||||||||||||||||||||||
|
holdings
|
on
|
average
|
||||||||||||||||||||||||||||||
|
of the
|
long-
|
interest as at
|
||||||||||||||||||||||||||||||
|
As at
|
CPV
|
Total
|
term
|
Debt bearing
|
December 31
|
|||||||||||||||||||||||||||
|
December 31, 2023
|
Group
|
debt
|
loans
|
Fixed debt
|
SOFR interest
|
2023
|
||||||||||||||||||||||||||
|
Total
|
Interest
|
Total
|
Interest
|
|||||||||||||||||||||||||||||
|
Active renewable energy
|
|
|
||||||||||||||||||||||||||||||
|
projects
|
100
|
%
|
541
|
1.13%–1.73
|
%
|
397
|
3.5
|
%
|
144
|
6.7
|
%
|
4.4
|
%
|
|||||||||||||||||||
|
Financing of construction of
|
|
|
||||||||||||||||||||||||||||||
|
renewable energy projects
|
100
|
%
|
329
|
2.00%–2.85
|
%
|
275
|
6.4
|
%
|
54
|
6.4
|
%
|
6.6
|
%
|
|||||||||||||||||||
|
Fairview
|
25
|
%
|
334
|
2.75
|
%
|
305
|
5.4
|
%
|
29
|
8.2
|
%
|
5.6
|
%
|
|||||||||||||||||||
|
Towantic
|
26
|
%
|
339
|
3.25
|
%
|
267
|
5.1
|
%
|
72
|
8.7
|
%
|
5.9
|
%
|
|||||||||||||||||||
|
Maryland
|
25
|
%
|
304
|
4.00
|
%
|
187
|
5.9
|
%
|
117
|
8.9
|
%
|
7.0
|
%
|
|||||||||||||||||||
|
Shore
|
37.5
|
%
|
599
|
3.75
|
%
|
436
|
4.1
|
%
|
163
|
9.1
|
%
|
5.4
|
%
|
|||||||||||||||||||
|
Valley
|
50
|
%
|
708
|
5.50
|
%
|
–
|
–
|
708
|
10.8
|
%
|
10.8
|
%
|
||||||||||||||||||||
|
Three Rivers
|
10
|
%
|
271
|
3.75
|
%
|
224
|
4.6
|
%
|
47
|
9.1
|
%
|
5.3
|
%
|
|||||||||||||||||||
| 9. |
Adjusted financial debt, net (Cont.)
|
|
|
C. |
Financial covenants
|
| 9. |
Adjusted financial debt, net (Cont.)
|
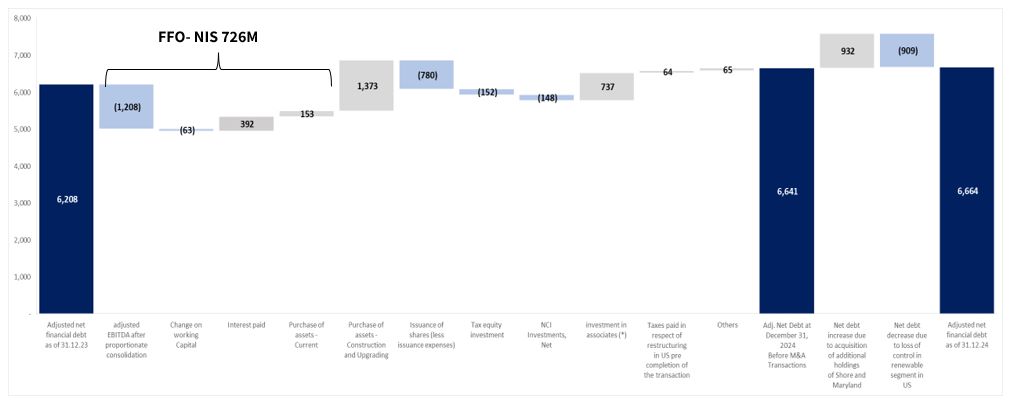
| (*) |
Derives mainly from acquisition of additional rights in the Maryland and Short power plants – for additional details see Note 24C to the financial statements.
|
| 10. |
Debentures (Series B, Series C and Series D)
|
|
Name of trustee
|
Reznik Paz Nevo Trustees Ltd.
|
|
|
Name of the party responsible for the series of liability certificates with the trustee
|
Michal Avatlon and/or Hagar Shaul
|
|
|
Contact information
|
Name: Yossi Reznik
|
|
|
Address: 14 Yad Harutzim St., Tel‑Aviv
Telephone: 03–6389200
Fax: 03–6389222
E–mail: Yossi@rpn.co.il
|
||
|
Rating of the debentures since the issuance date
|
Rating of ‘ilA–‘ by S&P Maalot Global Ratings Ltd. (“Maalot”). On July 28, 2024, the rating was reconfirmed by Maalot and the rating outlook was updated from
negative to stable due to the improvement of the financial ratios.
|
|
|
Pledged assets
|
None.
There is a future commitment that the Company will not create a general current lien on its assets and rights, existing and future, in favor of any third party
without the conditions stipulated in the trust certificate being fulfilled.
|
|
|
Is the series material
|
Series B – yes; Series C – yes; Series D – no.
|
| 11. |
Impacts of changes in the macro‑economic environment on the Group’s activities and its results
|
| 11. |
Impacts of changes in the macro‑economic environment on the Group’s activities and its results (Cont.)
|
|
38
|
The disclosure stated in this Section below is based on the Company’s estimates in accordance with assumptions and analyses made as at the date of the report only. Ultimately, the
impacts of macro‑economic events could be different than that stated, as a result of, among other things, the type and scope of the macro‑economic events, the impact thereof on third parties related to the Company and/or changes in
the relevant regulatory policies. In addition, the Company’s estimates regarding the impacts of the said factors on its results might not materialize, in whole or in part, as a result of, among other things, regulatory policies,
market conditions, operating factors and changes in the Company’s undertakings and/or due to one or more of the risk factors the Company is exposed to, as stated in Section 19 of Part A of the Periodic Report.
|
| 11. |
Impacts of changes in the macro‑economic environment on the Group’s activities and its results (Cont.)
|
| 39 |
In order to reduce part of the exposure to changes in the CPI relating to the Hadera financing agreement, in June 2019 the Group entered into transactions with a bank to hedge part of the exposure to the CPI.
|
| 11. |
Impacts of changes in the macro‑economic environment on the Group’s activities and its results (Cont.)
|
|
|
A. |
Transaction for acquisition of the Gat power plant
|
|
|
B. |
Annual examination of impairment of value of goodwill created in respect of acquisition of the Gat power plant
|
|
|
B. |
Annual examination of impairment of value of goodwill created in respect of acquisition of the Gat power plant (Cont.)
Details of the valuation:
|
|
Subject matter of the Valuation
|
Determination of the recoverable amount of the Cash Generating Units for purposes of an annual impairment of value of goodwill examination in
accordance with the provisions of IAS 36.
|
|
Date of the Valuation
|
Effective date of the valuation: December 31, 2024.
Approval date of the valuation: March 11, 2025.
|
|
Book value attributed to a Cash‑Generating Unit as at the date of the Valuation
|
Total of the Cash‑Generating Unit – about NIS 2.7 billion.
|
|
Recoverable amount of the Rotem power plant as determined pursuant to the Valuation
|
Only the Rotem power plant– about NIS 4.3 billion.
The recoverable amount of the Rotem power plant alone exceeds the book value of the entire Cash‑Generating Unit and, therefore, it is not
necessary to recognize a loss from impairment of value in the Company’s books.
|
|
Identity of the appraiser and his characteristics
|
The valuation was performed by the Company.
|
|
Valuation model
|
The recoverable amount of the cash generating unit was determined as follows: for the Rotem power plant only based on the value in use using
the DCF (discounting of cash flows) method.
|
|
The assumptions based on which the appraiser performed the Valuation
|
Set forth below are the main assumptions that were used in determination of the use value of the Rotem power plant:
– Forecast years – represent the period between 2025 and 2043, and are based on an estimate of the economic life of the power plant
and its value at the end of the forecast period.
– Forecast of the generation component and natural gas prices that are not backed by an agreement – based on market forecasts received
from external independent information sources.
– Long-term annual inflation rate of 2.5%.
– Weighted‑average cost of capital (WACC) – 8% which was determined by an external, independent appraiser.
|
|
|
B. |
Annual examination of impairment of value of goodwill created in respect of acquisition of the Gat power plant (Cont.)
Details of the valuation: (Cont.)
|
|
Sensitivity analysis for changes in the main parameters
|
An increase of 1% in the WACC (about NIS 442 million).
A decrease of 5% in the generation component tariff (about NIS 447 million).
|
|
Examination of attachment of the valuation
|
Notwithstanding that the valuation meets the quantitative thresholds for “Very Significant Valuations”, as determined in the Position of the
Securities Authority 105‑23 “Parameters for Examination of the Significance of the Valuation”, since here a periodic examination of impairment of value of goodwill is involved without there having been signs of impairment, and in the
Company’s estimation, based on sensitivity analyses performed by it, as at the date of the report, whereby every possible reasonable change in the key assumptions used in determination of the recoverable amount of the cash‑generating
unit would not lead to recognition of a significant loss from impairment of value, instead of attaching the Valuation it is permissible to disclose the Valuation as a “Significant Valuation” pursuant to Regulation 8(I) of the
Securities Regulations (Periodic and Immediate Reports), 197040.
|
| 13. |
Directors having Accounting and Financial Expertise
As at the date of this report, eight of the members of the Company’s Board of Directors have accounting and financial expertise. For details regarding the directors Aviad Kaufman,
Antoin Bonaire, Robert Rosen, Jacob Worenklein, Yosef Tene, Sarit Sagiv, Shirly Mashkif and Harel Givon who were classified as directors with accounting and financial expertise – see Regulation 26 of Chapter D (Additional Details
regarding the Company).
The Board of Directors determined that the minimum number of directors having accounting and financial expertise in accordance with Section 92(A)(12) of the Companies Law, 1999,
is two – this being taking into account the type of the Company, its size, the scope of its activities and the complexity of its activities.
|
| 14. |
Independent Directors
In addition to the external directors Yosef Tena and Shirly Mashkif, the directors Sarit Sagiv and Harel Givon, serve as independent directors of the Company.
As at the date of the report, the Company’s Articles of Association do not include a provision regarding the rate of the independent directors.
|
|
Name of the Internal Auditor
|
Mr. Eyal Baasch (“the Internal Auditor”)
|
|
Education and professional experience
|
Certified Internal Auditor (C.I.A.); Certified Risk Management Auditor (CRMA).
Bachelor’s degree in Social Sciences (Extended Economics) – Hebrew University in Jerusalem; Master’s degree in Business Administration (MBA) (specialization in
accounting and finance) from the College of Management.
Since 2012 he is a partner in the area of risk management and economics in the Office of Rosenbloom – Holzman, CPAs. Possesses extensive professional experience in
the area of internal auditing.
|
|
Start date of service
|
August 13, 2024. Up to that date, Ms. Shoshana Shidlo, CPA and CIA (US) served in this position. For details regarding the exiting internal auditor – see Section 16
of the Report of the Board of Directors for 2023 (“the Prior Internal Auditor”).
|
|
Compliance with legal requirements
|
To the best of the Company’s knowledge, according to the declaration of the Internal Auditor and the Prior Internal Auditor, the Internal Auditor and the Prior
Internal Auditor in her period of service meet the requirements of Section 146(B) of the Companies Law and the provisions of Section 8 of the Internal Audit Law, 1992 (“the Internal Audit Law”).
|
|
Employment format
|
The Internal Auditor provides the Company internal audit services and he is not an employee of the Company in a full‑time position. In addition, he does not hold an
additional position in the Company aside from his service as the Internal Auditor.
In the period of her service, the Prior Internal Auditor provided the Company internal audit services and she was not employed as an employee of the Company in a
full‑time position and, in addition, she did not fill an additional position in the Company aside from her service as internal auditor.
|
|
Manner of appointment
|
The appointment of the Internal Auditor was approved by the Board of Directors on August 13, 2024, after a recommendation of the Audit Committee on August 11, 2024.
The Company’s Audit Committee and Board of Directors examined his qualifications, education and experience in internal auditing.
|
|
Conclusion of the service of the Prior Internal Auditor
|
On August 12, 2024, the service of the Prior Internal Auditor was concluded.
|
|
The party to whom the Internal Auditor reports
|
The Chairman of the Board of Directors.
|
|
Other relationships the Internal Auditor has with the Company
|
To the best of the Company’s knowledge, the Internal Auditor does not hold securities of the Company and the Prior Internal Auditor did not hold securities of the
Company in the period of her service.
The Internal Auditor is not an interested party in the Company or a relative of an interested party in the Company and is not a relative of the auditing CPA or a
party on its behalf.
|
|
The work plan
|
The audit work plan for 2024, which was approved by the Audit Committee, is for one year. The work plan of the Company and its subsidiaries was determined based on, among others, the
following considerations: coverage of the Company’s main areas of activity, risk centers and exposures known to the Internal Auditor and to management; a corporate risks’ survey that is prepared by the Company, potential for savings and
efficiency; recurring items and monitoring correction of deficiencies; and implementation of recommendations.
The audit work plan is submitted for analysis and approval by the Company’s Audit Committee and Board of Directors. The Internal Auditor has discretion to recommend a variance from the
work plan to management and the Audit Committee, where necessary.
Audit reports were submitted to the Audit Committee and management. The Company’s Board of Directors received an update regarding the audit reports.
Meetings of the Audit Committee were held to discuss the audit reports on the following dates: March 5, 2024; August 11, 2024; November 10, 2024; and January 2, 2025.
During 2024, the Internal Auditor and the Prior Internal Auditor in the period of her service monitored the existence and appropriateness of the work of the party providing internal
audit services in the CPV Group (which operates in the U.S.) which was via outsourcing, including, receipt of updates regarding the progress of the audit work and the main findings and discrepancies and receipt of the audit reports. It
is noted that starting from 2025, the Internal Auditor will perform audits of the CPV Group.
The audit plan and audit reports of the CPV Group are submitted to the Board of Directors of the CPV Group and to the Company’s Audit Committee and are reported to the Company’s Board
of Directors. During the period of the report, no material transactions (as defined in the Fourth Addendum to the Reporting Regulations) were examined.
In the estimation of the Board of Directors, the scope, nature and continuity of the activities of the Internal Auditor and the internal audit work plan are reasonable under the
circumstances of the manner, and they are sufficient to achieve the Company’s internal audit goals.
|
|
Performance of the audit and the professional standards
|
Based on information provided to the Company, performance of the internal audit is made in accordance with the generally
accepted professional standards in and outside of Israel and in accordance with Section 4(B) of the Internal Audit Law.
The Board of Directors relied on the confirmations of the Internal Auditor and the Prior Internal Auditor in the period
of her service regarding their compliance with the requirements of the said generally accepted professional standards. In addition, the audit reports are submitted in writing and are discussed at the meetings of the Audit Committee,
where as part of the discussion the Internal Auditor reports with respect to the manner of his performance, the policies and procedures applied and the findings. The Board of Directors is satisfied, based on the reports of the Internal
Auditor and the Prior Internal Auditor in the period of her service, that the internal audit is in compliance with all the requirements provided in the said standards.
|
|
Access to information
|
The Internal Auditor and the Prior Internal Auditor in the period of her service have/had free access to information, as
stated in Section 9 of the Internal Audit Law, including constant and direct access to the Company’s information systems, including financial data.
|
|
Remuneration
|
The remuneration of the Internal Auditor in respect of services provided in 2024 amounted to about NIS 166 thousand, this
being based on a work scope of 523 audit hours (including 48 work hours in respect of the CPV Group), of which about NIS 107 thousand was paid to the Prior Internal Auditor and about NIS 59 thousand was paid to the Internal Auditor in
respect of the period of their service in 2024.
The cost of the internal audit services in the CPV Group (which are executed by means of outsourcing, as stated) in 2024
amounted to NIS 249 thousand, this being based on a work scope of 560 audit hours.
|
|
Set forth below is detail regarding the scope of the investments made, distinguishing between hours invested in
internal auditing with respect to the Company and the investee companies:
|
|
Investee
|
||||||
|
The
|
companies
|
|||||
|
Company
|
in Israel
|
CPV
|
Total
|
|||
|
|
||||||
|
231
|
244
|
560 (external service provider as noted)
48 the Internal Auditor
|
1,083
|
|
In the opinion of the Board of Directors, the remuneration for the internal audit is reasonable and does not impact or
adversely affect use of his professional judgment in performance of the audit.
The remuneration of the Internal Auditor is a function of the total number of work hours as provided in the annual work
plan that is approved by the Company’s Audit Committee and Board of Directors.
|
| 16. |
Contributions policy
|
|
Recipient of the
|
Amount of the
|
Relationship to the
|
|||||
|
Contribution
|
Contribution
|
Recipient of the Contribution
|
|||||
|
|
|
|
|
|
|||
|
“Password for Every Student” Society
|
1,000
|
“Password for Every Student” also receives contributions from parties related to the Company’s controlling shareholder, including companies in which officers serve who are directors
of the Company (including from the Israel Corporation Group and the controlling shareholders therein). The Company’s CEO is a representative of the project’s Steering Committee without compensation.
|
|||||
|
“Rahashei Lev” Society
|
300
|
For the sake of good order, it is noted that as the Company was informed, commencing from November 2022, the daughter of Mr. Yosef Tena, an external director of the Company, is
employed by the Tel‑Aviv Medical Center in the name of Sorosky.
|
|||||
|
“Running to Give” Society
|
120
|
For the sake of good order, it is noted that a relative of the Company’s CEO serves as Chairman of the Society without compensation.
|
|||||
| 17. |
Details regarding the auditing CPAs
|
|
|
17.1 |
The Company’s auditing CPAs are KPMG Somekh Chaikin (“the Auditor”).
|
|
|
17.2 |
The fee is determined in negotiations between the Company’s management and the Auditor, based on the scope of the work, nature of the work, past experience and market conditions. The fee is in respect of an audit and review of three
quarterly reviewed reports and one audited annual report. In addition, the fee includes tax services in connection with preparation of the Company’s annual tax report.
|
|
|
17.3 |
Set forth below is the Auditor’s fee (in NIS millions):
|
|
For the Year Ended December 31
|
||||||||||||||
|
2024
|
2023
|
|||||||||||||
|
Audit services (1)
|
Other services (2)
|
Audit services (1)
|
Other services (2)
|
|||||||||||
|
12.1
|
0.8
|
10.6
|
1.1
|
|||||||||||
|
|
(1) |
Audit services including services related to the audit and tax services related to the audit. Of the said amount for 2024 and 2023, the amounts of about NIS 10 million and about NIS 8.4 million, respectively, are in respect of audits
of CPV. The fees of the auditing CPAs, as stated, were determined in accordance with negotiations carried on by the management of the CPV Group and were approved by CPV’s competent organs.
|
|
|
(2) |
Other services include mainly tax consulting services in Israel. It is noted that most of the tax services in the U.S. are not provided by the Auditor.
|
|
Yair Caspi
|
Giora Almogy
|
|
|
Chairman of the Board of Directors
|
CEO
|
| – |
In the peak hours, electricity is sold in the maximum scope;
|
| – |
Sale of the balance of the electricity is made in the off‑peak hours.
|
| – |
The scope of the generation of each power plant was estimated separately on the basis of the historical generation data while taking into generation forecasts.
|
| * |
Assumption of a thermal conversion ratio (heat rate) of 6.9 MMBTU/MWh for Maryland, Shore and Valley, and a thermal conversion ratio (heat rate) of 6.5 MMBTU/MWh for Three Rivers, Towantic and Fairview.
|
|
Power Plant
|
2025
|
2026
|
2027
|
|||||||||
|
Fairview
|
||||||||||||
|
Gas price (Texas Eastern M2, as of 2026: M3)
|
2.99
|
3.74
|
3.75
|
|||||||||
|
Electricity price (AEP Dayton (AD))
|
43.56
|
47.50
|
50.98
|
|||||||||
|
Electricity margin
|
24.14
|
23.17
|
26.58
|
|||||||||
|
Towantic
|
||||||||||||
|
Gas price (Algonquin City Gate)
|
6.09
|
5.94
|
5.86
|
|||||||||
|
Electricity price (Mass Hub)
|
65.03
|
61.37
|
59.74
|
|||||||||
|
Electricity margin
|
25.42
|
22.75
|
21.67
|
|||||||||
|
Maryland
|
||||||||||||
|
Gas price (Transco Zone 5)
|
4.53
|
4.64
|
4.35
|
|||||||||
|
Electricity price (PJM West Hub)
|
50.21
|
55.24
|
60.02
|
|||||||||
|
Electricity margin
|
18.94
|
23.25
|
29.97
|
|||||||||
|
Shore
|
||||||||||||
|
Gas price (Texas Eastern M3)
|
3.81
|
3.74
|
3.75
|
|||||||||
|
Electricity price (PJM West Hub)
|
50.21
|
55.24
|
60.02
|
|||||||||
|
Electricity margin
|
23.95
|
29.41
|
34.11
|
|||||||||
|
Valley
|
||||||||||||
|
Gas price (Texas Eastern M3 – 70%, Dominion South Pt – 30%)
|
3.54
|
3.52
|
3.51
|
|||||||||
|
Electricity price (New York Zone G)
|
57.02
|
54.21
|
56.65
|
|||||||||
|
Electricity margin
|
32.57
|
29.95
|
32.43
|
|||||||||
|
Three Rivers
|
||||||||||||
|
Gas price (Chicago City Gate)
|
3.73
|
3.85
|
3.80
|
|||||||||
|
Electricity price (PJM ComEd)
|
40.04
|
43.56
|
45.87
|
|||||||||
|
Electricity margin
|
15.80
|
18.52
|
21.18
|
|||||||||
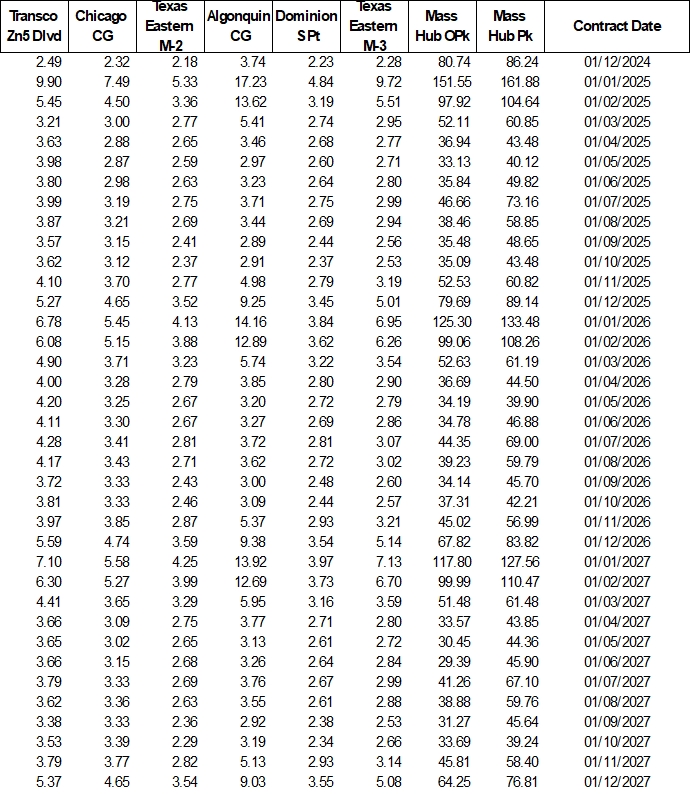
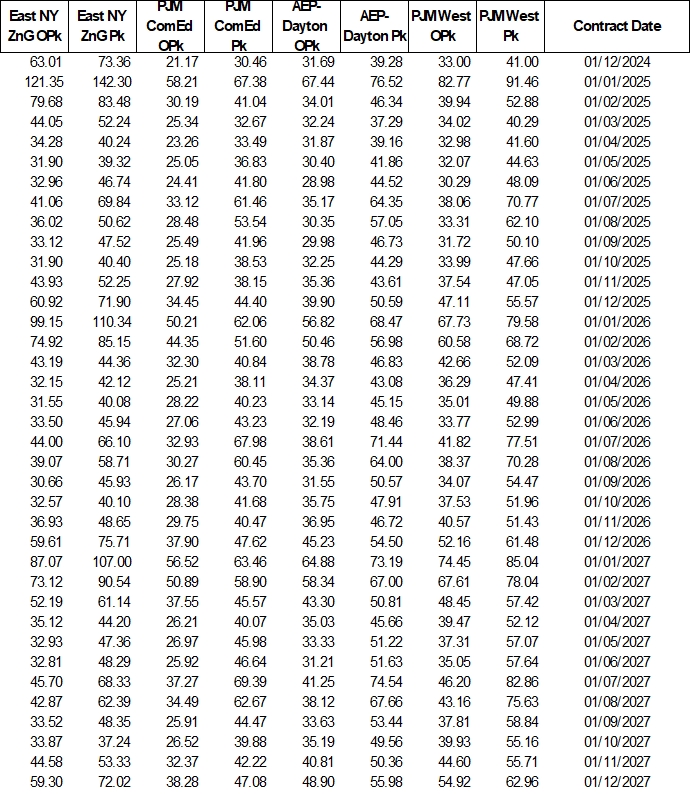
|
Table of Contents
|
|
|
Page
|
|
|
F-3 - F-6
|
|
|
F-7 - F-8
|
|
|
F-9
|
|
|
F-10
|
|
|
F-11 - F-13
|
|
|
F-14 - F-17
|
|
|
F-18
|

| • |
Discounted cash flow calculations are based on subjective assumptions of the Company's management, including estimates of projected cash flows and discount rate.
|
| • |
The audit procedures we implemented with respect to the impairment testing of the goodwill attributable to the Companies involved the exercise of the audit team’s judgement, and the use of experts who had valuation-related knowledge
and experience.
|
|
|
• |
We obtained an understanding of the process of goodwill impairment testing, and reviewed the process used by management to assess the need to record impairment. We also examined the effectiveness of the audits executed by management.
|
|
|
• |
We sought the assistance of experts possessing the required knowledge and experience in valuations in order to assess the valuation method and assess the reasonableness of the weighted average cost of capital.
|
|
|
• |
We received from the Company calculations of discounted cash flows relating to the most significant component associated with the activity of the Rotem Power Plant, and assessed the reasonableness of the significant assumptions used in
calculating the projected cash flows, by, among other things, comparing them to historical results and projections regarding the Generation Component. .
|
|
|
• |
We tested the completeness of the data included in the valuation model and their adequacy.
|
|
|
• |
We conducted a sensitivity analysis to the results of the model with respect to the key assumptions, such as the electricity tariff (generation component) and the weighted average cost of capital.
|
|
2024
|
2023
|
|||||||||||
|
Note
|
NIS million
|
NIS million
|
||||||||||
|
Current assets
|
||||||||||||
|
Cash and cash equivalents
|
5
|
962
|
1,007
|
|||||||||
|
Trade receivables
|
293
|
247
|
||||||||||
|
Receivables and debit balances
|
7
|
90
|
418
|
|||||||||
|
Total current assets
|
1,345
|
1,672
|
||||||||||
|
Non‑current assets
|
||||||||||||
|
Long-term restricted deposits and cash
|
6
|
60
|
59
|
|||||||||
|
Long-term receivables and debit balances
|
8
|
162
|
247
|
|||||||||
|
Investments in associates
|
24
|
5,320
|
2,550
|
|||||||||
|
Long-term derivative financial instruments
|
21
|
44
|
51
|
|||||||||
|
Property, plant & equipment
|
9
|
4,238
|
6,243
|
|||||||||
|
Right‑of‑use assets and deferred expenses
|
10
|
637
|
631
|
|||||||||
|
Intangible assets
|
11
|
261
|
1,165
|
|||||||||
|
Total non‑current assets
|
10,722
|
10,946
|
||||||||||
|
Total assets
|
12,067
|
12,618
|
||||||||||
|
2024
|
2023
|
|||||||||||
|
Note
|
NIS million
|
NIS million
|
||||||||||
|
Current liabilities
|
||||||||||||
|
Loans and credit from banking corporations and financial institutions (including current maturities)
|
14
|
82
|
391
|
|||||||||
|
Current maturities of debt from non‑controlling interests
|
23D
|
|
14
|
32
|
||||||||
|
Current maturities of debentures
|
15
|
212
|
192
|
|||||||||
|
Trade payables
|
213
|
257
|
||||||||||
|
Payables and credit balances
|
12
|
123
|
411
|
|||||||||
|
Total current liabilities
|
644
|
1,283
|
||||||||||
|
Non‑current liabilities
|
||||||||||||
|
Long-term loans from banking corporations and financial institutions
|
14
|
2,150
|
2,865
|
|||||||||
|
Long-term debt from non-controlling interests
|
23D
|
|
500
|
422
|
||||||||
|
Debentures
|
15
|
1,663
|
1,647
|
|||||||||
|
Long-term lease liabilities
|
10
|
31
|
204
|
|||||||||
|
Long-term derivative financial instruments
|
21
|
-
|
58
|
|||||||||
|
Other long‑term liabilities
|
13
|
115
|
399
|
|||||||||
|
Deferred tax liabilities
|
17
|
543
|
498
|
|||||||||
|
Total non-current liabilities
|
5,002
|
6,093
|
||||||||||
|
Total liabilities
|
5,646
|
7,376
|
||||||||||
|
Equity
|
18
|
|||||||||||
|
Share capital
|
3
|
2
|
||||||||||
|
Share premium
|
3,993
|
3,210
|
||||||||||
|
Capital reserves
|
532
|
523
|
||||||||||
|
Retained earnings
|
224
|
113
|
||||||||||
|
Total equity attributable to the Company’s shareholders
|
4,752
|
3,848
|
||||||||||
|
Non‑controlling interests
|
1,669
|
1,394
|
||||||||||
|
Total equity
|
6,421
|
5,242
|
||||||||||
|
Total liabilities and equity
|
12,067
|
12,618
|
||||||||||
|
Yair Caspi
|
Giora Almogy
|
Ana Berenshtein Shvartsman
|
||
|
Chairman of the Board
|
Chief Executive Officer
|
Chief Financial Officer
|
|
2024
|
2023
|
2022
|
||||||||||||||
|
Note
|
NIS million
|
NIS million
|
NIS million
|
|||||||||||||
|
Revenues from sales and provision of services
|
19A
|
|
2,779
|
2,552
|
1,927
|
|||||||||||
|
Cost of sales and services (excluding depreciation and amortization)
|
19B
|
|
(1,931
|
)
|
(1,827
|
)
|
(1,404
|
)
|
||||||||
|
Depreciation and amortization
|
(317
|
)
|
(288
|
)
|
(191
|
)
|
||||||||||
|
Gross profit
|
531
|
437
|
332
|
|||||||||||||
|
General and administrative expenses
|
19C
|
|
(263
|
)
|
(212
|
)
|
(239
|
)
|
||||||||
|
Share in profits of associates
|
24
|
166
|
242
|
286
|
||||||||||||
|
Business development expenses
|
19D
|
|
(45
|
)
|
(58
|
)
|
(50
|
)
|
||||||||
|
Compensation in respect of loss of income
|
26A
|
|
44
|
41
|
-
|
|||||||||||
|
Other expenses, net
|
19E
|
|
(56
|
)
|
(16
|
)
|
-
|
|||||||||
|
Gain on loss of control in the US Renewable Energies Segment
|
23E
|
|
259
|
-
|
-
|
|||||||||||
|
Operating profit
|
636
|
434
|
329
|
|||||||||||||
|
Finance expenses
|
19F
|
|
(339
|
)
|
(240
|
)
|
(153
|
)
|
||||||||
|
Finance income
|
19F
|
|
87
|
43
|
106
|
|||||||||||
|
Loss from extinguishment of financial liabilities
|
19F
|
|
(49
|
)
|
-
|
-
|
||||||||||
|
Finance expenses, net
|
(301
|
)
|
(197
|
)
|
(47
|
)
|
||||||||||
|
Profit before taxes on income
|
335
|
237
|
282
|
|||||||||||||
|
Expenses for income tax
|
17
|
(138
|
)
|
(68
|
)
|
(65
|
)
|
|||||||||
|
Profit for the year
|
197
|
169
|
217
|
|||||||||||||
|
Attributable to:
|
||||||||||||||||
|
The Company’s shareholders
|
111
|
144
|
167
|
|||||||||||||
|
Non-controlling interests
|
86
|
25
|
50
|
|||||||||||||
|
Profit for the year
|
197
|
169
|
217
|
|||||||||||||
|
Earnings per share attributable to the Company’s owners
|
20
|
|||||||||||||||
|
Basic and diluted earnings per share (in NIS)
|
0.46
|
0.63
|
0.79
|
|||||||||||||
|
2024
|
2023
|
2022
|
||||||||||
|
NIS million
|
NIS million
|
NIS million
|
||||||||||
|
Profit for the year
|
197
|
169
|
217
|
|||||||||
|
Components of other comprehensive income (loss) that, subsequent to initial recognition in comprehensive income, were or will be transferred to profit and loss
|
||||||||||||
|
Effective portion of the change in the fair value of cash flow hedges
|
42
|
(40
|
)
|
50
|
||||||||
|
Net change in fair value of derivatives used to hedge cash flows recognized in the cost of the hedged item
|
-
|
(5
|
)
|
(4
|
)
|
|||||||
|
Net change in fair value of derivative financial instruments used to hedge cash flows transferred to profit and loss
|
(11
|
)
|
(20
|
)
|
(14
|
)
|
||||||
|
Group’s share in other comprehensive income (loss) of associates, net of tax
|
13
|
(48
|
)
|
64
|
||||||||
|
Foreign currency translation differences in respect of foreign operations
|
(8
|
)
|
126
|
267
|
||||||||
|
Tax on other comprehensive income (loss) items
|
(6
|
)
|
1
|
(9
|
)
|
|||||||
|
Other comprehensive income for the year, net of tax
|
30
|
14
|
354
|
|||||||||
|
Total comprehensive income for the year
|
227
|
183
|
571
|
|||||||||
|
Attributable to:
|
||||||||||||
|
The Company’s shareholders
|
121
|
169
|
412
|
|||||||||
|
Non-controlling interests
|
106
|
14
|
159
|
|||||||||
|
Total comprehensive income for the year
|
227
|
183
|
571
|
|||||||||
|
Attributable to the Company’s shareholders
|
||||||||||||||||||||||||||||||||||||
|
Share capital
|
Share premium
|
Capital reserves
|
Hedge fund
|
Foreign operations translation reserve
|
Retained earnings
|
Total
|
Non‑con-trolling interests
|
Total equity
|
||||||||||||||||||||||||||||
|
NIS million
|
NIS million
|
NIS million
|
NIS million
|
NIS million
|
NIS million
|
NIS million
|
NIS million
|
NIS million
|
||||||||||||||||||||||||||||
|
For the year ended December 31, 2024
|
||||||||||||||||||||||||||||||||||||
|
Balance as of January 1, 2024
|
2
|
3,210
|
248
|
25
|
250
|
113
|
3,848
|
1,394
|
5,242
|
|||||||||||||||||||||||||||
|
Issuance of shares (less issuance expenses)
|
1
|
779
|
-
|
-
|
-
|
-
|
780
|
-
|
780
|
|||||||||||||||||||||||||||
|
Investments by holders of non-controlling interests in equity of subsidiary
|
-
|
-
|
-
|
-
|
-
|
-
|
-
|
175
|
175
|
|||||||||||||||||||||||||||
|
Share-based payment
|
-
|
-
|
7
|
-
|
-
|
-
|
7
|
1
|
8
|
|||||||||||||||||||||||||||
|
Exercised and expired options and RSUs
|
*-
|
4
|
(4
|
)
|
-
|
-
|
-
|
-
|
-
|
-
|
||||||||||||||||||||||||||
|
Other
|
-
|
-
|
(4
|
)
|
-
|
-
|
-
|
(4
|
)
|
(7
|
)
|
(11
|
)
|
|||||||||||||||||||||||
|
Other comprehensive income for the year, net of tax
|
-
|
-
|
-
|
24
|
(14
|
)
|
-
|
10
|
20
|
30
|
||||||||||||||||||||||||||
|
Profit for the year
|
-
|
-
|
-
|
-
|
-
|
111
|
111
|
86
|
197
|
|||||||||||||||||||||||||||
|
Balance as of December 31, 2024
|
3
|
3,993
|
247
|
49
|
236
|
224
|
4,752
|
1,669
|
6,421
|
|||||||||||||||||||||||||||
|
Attributable to the Company’s shareholders
|
||||||||||||||||||||||||||||||||||||
|
Share capital
|
Share premium
|
Capital reserves
|
Hedge fund
|
Foreign operations translation reserve
|
Retained earnings (retained loss)
|
Total
|
Non‑con-trolling interests
|
Total equity
|
||||||||||||||||||||||||||||
|
NIS million
|
NIS million
|
NIS million
|
NIS million
|
NIS million
|
NIS million
|
NIS million
|
NIS million
|
NIS million
|
||||||||||||||||||||||||||||
|
For the year ended December 31, 2023
|
||||||||||||||||||||||||||||||||||||
|
Balance as of January 1, 2023
|
2
|
3,209
|
77
|
91
|
159
|
(31
|
)
|
3,507
|
859
|
4,366
|
||||||||||||||||||||||||||
|
Investments by holders of non-controlling interests in equity of subsidiary
|
-
|
-
|
-
|
-
|
-
|
-
|
-
|
231
|
231
|
|||||||||||||||||||||||||||
|
Share-based payment
|
-
|
-
|
9
|
-
|
-
|
-
|
9
|
1
|
10
|
|||||||||||||||||||||||||||
|
Exercised options and RSUs
|
*-
|
1
|
(1
|
)
|
-
|
-
|
-
|
-
|
-
|
-
|
||||||||||||||||||||||||||
|
Restructuring - share exchange and investment transaction with Veridis
|
-
|
-
|
163
|
-
|
-
|
-
|
163
|
289
|
452
|
|||||||||||||||||||||||||||
|
Other comprehensive income (loss) for the year,
net of tax
|
-
|
-
|
-
|
(66
|
)
|
91
|
-
|
25
|
(11
|
)
|
14
|
|||||||||||||||||||||||||
|
Profit for the year
|
-
|
-
|
-
|
-
|
-
|
144
|
144
|
25
|
169
|
|||||||||||||||||||||||||||
|
Balance as of December 31, 2023
|
2
|
3,210
|
248
|
25
|
250
|
113
|
3,848
|
1,394
|
5,242
|
|||||||||||||||||||||||||||
|
Attributable to the Company’s shareholders
|
||||||||||||||||||||||||||||||||||||
|
Share capital
|
Share premium
|
Capital reserves
|
Hedge fund
|
Foreign operations translation reserve
|
Retained loss
|
Total
|
Non‑con-trolling interests
|
Total equity
|
||||||||||||||||||||||||||||
|
NIS million
|
NIS million
|
NIS million
|
NIS million
|
NIS million
|
NIS million
|
NIS million
|
NIS million
|
NIS million
|
||||||||||||||||||||||||||||
|
For the year ended December 31, 2022
|
||||||||||||||||||||||||||||||||||||
|
Balance as of January 1, 2022
|
2
|
2,392
|
63
|
32
|
(27
|
)
|
(198
|
)
|
2,264
|
577
|
2,841
|
|||||||||||||||||||||||||
|
Issuance of shares (less issuance expenses)
|
*-
|
815
|
-
|
-
|
-
|
-
|
815
|
-
|
815
|
|||||||||||||||||||||||||||
|
Investments by holders of non-controlling interests in equity of subsidiary
|
-
|
-
|
-
|
-
|
-
|
-
|
-
|
123
|
123
|
|||||||||||||||||||||||||||
|
Share-based payment
|
-
|
-
|
16
|
-
|
-
|
-
|
16
|
-
|
16
|
|||||||||||||||||||||||||||
|
Exercised options and RSUs
|
*-
|
2
|
(2
|
)
|
-
|
-
|
-
|
-
|
-
|
-
|
||||||||||||||||||||||||||
|
Other comprehensive income for the year, net of tax
|
-
|
-
|
-
|
59
|
186
|
-
|
245
|
109
|
354
|
|||||||||||||||||||||||||||
|
Profit for the year
|
-
|
-
|
-
|
-
|
-
|
167
|
167
|
50
|
217
|
|||||||||||||||||||||||||||
|
Balance as of December 31, 2022
|
2
|
3,209
|
77
|
91
|
159
|
(31
|
)
|
3,507
|
859
|
4,366
|
||||||||||||||||||||||||||
|
2024
|
2023
|
2022
|
||||||||||
|
NIS million
|
NIS million
|
NIS million
|
||||||||||
|
Cash flows from operating activities
|
||||||||||||
|
Profit for the year
|
197
|
169
|
217
|
|||||||||
|
Adjustments:
|
||||||||||||
|
Depreciation and amortization
|
333
|
303
|
201
|
|||||||||
|
Diesel fuel consumption
|
12
|
32
|
9
|
|||||||||
|
Finance expenses, net
|
301
|
197
|
47
|
|||||||||
|
Expenses for income tax
|
138
|
68
|
65
|
|||||||||
|
Share in profits of associates
|
(166
|
)
|
(242
|
)
|
(286
|
)
|
||||||
|
Other expenses, net
|
56
|
16
|
-
|
|||||||||
|
Gain on loss of control in the US Renewable Energies Segment
|
(259
|
)
|
-
|
-
|
||||||||
|
Share-based compensation transactions
|
35
|
(7
|
)
|
62
|
||||||||
|
647
|
536
|
315
|
||||||||||
|
Changes in trade and other receivables
|
(64
|
)
|
(22
|
)
|
(84
|
)
|
||||||
|
Changes in trade payables, service providers, payables and other long-term liabilities
|
14
|
(25
|
)
|
(19
|
)
|
|||||||
|
(50
|
)
|
(47
|
)
|
(103
|
)
|
|||||||
|
Dividends received from associates (1)
|
235
|
13
|
-
|
|||||||||
|
Income taxes paid (2)
|
(67
|
)
|
(7
|
)
|
(5
|
)
|
||||||
|
168
|
6
|
(5
|
)
|
|||||||||
|
Net cash provided by operating activities
|
765
|
495
|
207
|
|||||||||
|
Cash flows for investing activities
|
||||||||||||
|
Interest received
|
35
|
35
|
8
|
|||||||||
|
Change in short-term deposits and in restricted deposits and cash, net
|
(8
|
)
|
173
|
(116
|
)
|
|||||||
|
Provision (release) of short-term collateral, net
|
14
|
110
|
(62
|
)
|
||||||||
|
Acquisition of subsidiaries, net of cash acquired
|
-
|
(1,172
|
)
|
-
|
||||||||
|
Investment in associates (3)
|
(737
|
)
|
(29
|
)
|
(10
|
)
|
||||||
|
Subordinated long-term loans to Valley
|
-
|
(87
|
)
|
-
|
||||||||
|
Purchase of property, plant, and equipment, intangible assets and deferred expenses
|
(1,260
|
)
|
(1,223
|
)
|
(942
|
)
|
||||||
|
Loss of control in the US Renewable Energies Segment (2)
|
134
|
-
|
-
|
|||||||||
|
Proceeds for repayment of partnership capital from associates (1)
|
95
|
11
|
15
|
|||||||||
|
Other
|
15
|
16
|
5
|
|||||||||
|
Net cash used for investing activities
|
(1,712
|
)
|
(2,166
|
)
|
(1,102
|
)
|
||||||
| (1) |
For further details regarding capital and dividend distributions from Fairview - a CPV Group associate - see Note 24E.
|
| (2) |
Taxes paid during the reporting period include taxes paid for restructuring. For further details – see Note 23E.
|
| (3) |
For further details regarding the acquisition of an additional stake in the Maryland and Shore power plants, see Note 24C.
|
|
2024
|
2023
|
2022
|
|||
|
NIS million
|
NIS million
|
NIS million
|
|||
|
Cash flows for financing activities
|
|||||
|
Proceeds of share issuance, less issuance expenses (1)
|
780
|
-
|
815
|
||
|
Proceeds of debenture issuance, less issuance expenses
|
198
|
-
|
-
|
||
|
Receipt of long-term loans from banking corporations and financial institutions, net (2)
|
1,951
|
1,242
|
282
|
||
|
Receipt of long-term debt from non-controlling interests
|
104
|
110
|
46
|
||
|
Investments by holders of non-controlling interests in equity of subsidiary
|
175
|
231
|
123
|
||
|
Proceed in respect of restructuring - share exchange and investment transaction with Veridis
|
-
|
452
|
-
|
||
|
Short term loans from banking corporations, net
|
(204)
|
231
|
-
|
||
|
Tax equity partner’s investment in US-based renewable energy projects
|
152
|
304
|
-
|
||
|
Interest paid
|
(228)
|
(152)
|
(86)
|
||
|
Repayment of long-term loans from banking corporations and others(2)(3)
|
(1,755)
|
(144)
|
(74)
|
||
|
Repayment of long-term loans as part of the acquisition of Gat
|
-
|
(303)
|
-
|
||
|
Repayment of long-term loans from non-controlling interests
|
(76)
|
(123)
|
(89)
|
||
|
Repayment of debentures
|
(193)
|
(31)
|
(20)
|
||
|
Other
|
(13)
|
-
|
(11)
|
||
|
Net cash provided by financing activities
|
891
|
1,817
|
986
|
||
|
Net increase (decrease) in cash and cash equivalents
|
(56)
|
146
|
91
|
||
|
Balance of cash and cash equivalents at the beginning of the year
|
1,007
|
849
|
731
|
||
|
Effect of exchange rate fluctuations on cash and cash equivalent balances
|
11
|
12
|
27
|
||
|
Balance of cash and cash equivalents at the end of the year
|
962
|
1,007
|
849
|
| (1) |
For further details – see Note 18B.
|
| (2) |
For further details – see Note 14B1.
|
| (3) |
In the reporting period includes a partial early repayment of the long-term loans in Hadera amounting to approx. NIS 25 million, further to receipt of compensation from the Construction Contractor at the end of 2023.
|
|
Loans from banking corporations and financial institutions
|
Loans from non‑con-trolling interests
|
Debentures
|
Financial instruments designated for hedging
|
|||||||||||||
|
NIS million
|
||||||||||||||||
|
Liabilities (assets) as of January 1, 2024
|
3,259
|
454
|
1,853
|
(52
|
)
|
|||||||||||
|
Changes arising from cash flows:
|
||||||||||||||||
|
Proceeds for derivative financial instruments
|
-
|
-
|
-
|
7
|
||||||||||||
|
Receipt of loans, net from transaction costs
|
1,991
|
104
|
198
|
-
|
||||||||||||
|
Repayment of debentures and loans
|
(1,755
|
)
|
(76
|
)
|
(193
|
)
|
-
|
|||||||||
|
Short term loans from banking corporations, net
|
(204
|
)
|
-
|
-
|
-
|
|||||||||||
|
Interest paid
|
(182
|
)
|
(3
|
)
|
(41
|
)
|
-
|
|||||||||
|
Total changes arising from cash flows
|
(150
|
)
|
25
|
(36
|
)
|
7
|
||||||||||
|
Changes in foreign currency exchange rates
|
25
|
1
|
-
|
-
|
||||||||||||
|
Interest expenses
|
250
|
34
|
57
|
-
|
||||||||||||
|
Linkage differences
|
14
|
-
|
32
|
(11
|
)
|
|||||||||||
|
Deconsolidation
|
(1,163
|
)
|
-
|
-
|
(4
|
)
|
||||||||||
|
Changes in fair value, hedge accounting and other
|
(1
|
)
|
-
|
(15
|
)
|
17
|
||||||||||
|
Total changes arising from non-cash activity
|
(875
|
)
|
35
|
74
|
2
|
|||||||||||
|
Liabilities (assets) as of December 31, 2024
|
2,234
|
514
|
1,891
|
(43
|
)
|
|||||||||||
|
Loans from banking corporations and financial institutions
|
Loans from non‑con-trolling interests
|
Debentures
|
Financial instruments designated for hedging
|
|||||||||||||
|
NIS million
|
||||||||||||||||
|
Liabilities (assets) as of January 1, 2023
|
1,817
|
437
|
1,854
|
(57
|
)
|
|||||||||||
|
Changes arising from cash flows:
|
||||||||||||||||
|
Payment for derivative financial instruments
|
-
|
-
|
-
|
9
|
||||||||||||
|
Receipt of loans, net
|
1,242
|
110
|
-
|
-
|
||||||||||||
|
Repayment of debentures and loans
|
(144
|
)
|
(123
|
)
|
(31
|
)
|
-
|
|||||||||
|
Repayment of loans as part of the acquisition of Gat
|
(303
|
)
|
-
|
-
|
-
|
|||||||||||
|
Short term loans from banking corporations, net
|
231
|
-
|
-
|
-
|
||||||||||||
|
Interest paid
|
(112
|
)
|
(2
|
)
|
(23
|
)
|
-
|
|||||||||
|
Total changes arising from cash flows
|
914
|
(15
|
)
|
(54
|
)
|
9
|
||||||||||
|
First-time consolidation of limited partnership
|
303
|
-
|
-
|
-
|
||||||||||||
|
Changes in foreign currency exchange rates
|
(2
|
)
|
8
|
-
|
(1
|
)
|
||||||||||
|
Interest expenses
|
174
|
26
|
46
|
-
|
||||||||||||
|
Linkage differences
|
15
|
-
|
33
|
(11
|
)
|
|||||||||||
|
Changes in fair value, hedge accounting and other
|
38
|
(2
|
)
|
(26
|
)
|
8
|
||||||||||
|
Total changes arising from non-cash activity
|
528
|
32
|
53
|
(4
|
)
|
|||||||||||
|
Liabilities (assets) as at December 31, 2023
|
3,259
|
454
|
1,853
|
(52
|
)
|
|||||||||||
|
Loans from banking corporations and financial institutions
|
Loans from non‑con-trolling interests
|
Debentures
|
Financial instruments designated for hedging
|
|||||||||||||
|
NIS million
|
||||||||||||||||
|
Liabilities (assets) as of January 1, 2022
|
1,520
|
434
|
1,824
|
(26
|
)
|
|||||||||||
|
Changes arising from cash flows:
|
||||||||||||||||
|
Payment for derivative financial instruments
|
-
|
-
|
-
|
(3
|
)
|
|||||||||||
|
Receipt of loans, net
|
282
|
46
|
-
|
-
|
||||||||||||
|
Repayment of debentures and loans
|
(74
|
)
|
(89
|
)
|
(20
|
)
|
-
|
|||||||||
|
Interest paid
|
(38
|
)
|
(7
|
)
|
(40
|
)
|
-
|
|||||||||
|
Total changes arising from cash flows
|
170
|
(50
|
)
|
(60
|
)
|
(3
|
)
|
|||||||||
|
Changes in foreign currency exchange rates
|
39
|
29
|
-
|
(2
|
)
|
|||||||||||
|
Interest expenses
|
68
|
24
|
40
|
-
|
||||||||||||
|
Linkage differences
|
24
|
-
|
50
|
(18
|
)
|
|||||||||||
|
Changes in fair value, hedge accounting and other
|
(4
|
)
|
-
|
-
|
(8
|
)
|
||||||||||
|
Total changes arising from non-cash activity
|
127
|
53
|
90
|
(28
|
)
|
|||||||||||
|
Liabilities (assets) as of December 31, 2022
|
1,817
|
437
|
1,854
|
(57
|
)
|
|||||||||||
|
|
1. |
The Company - OPC Energy Ltd.
|
|
|
2. |
The Group - the Company and its investees.
|
|
|
3. |
Consolidated companies/subsidiaries - companies, including partnerships, whose financial statements are fully consolidated, whether directly or indirectly, in the Company’s financial statements, specifically: (1) In Israel: OPC Israel,
OPC Hadera Expansion Ltd. (hereinafter - “Hadera 2”), AGS Rotem Ltd. (hereinafter - “Rotem 2”), Gnrgy Ltd. (hereinafter - “Gnrgy”), OPC Power Plants Ltd. (hereinafter - “OPC Power Plants”), OPC Rotem Ltd. (hereinafter - “Rotem”), OPC
Hadera Ltd. (hereinafter - “Hadera”), Zomet Energy Ltd. (hereinafter - “Zomet”), OPC Sorek 2 Ltd. (hereinafter - “Sorek 2”), OPC Mevuzarot Ltd. (hereinafter - “OPC Mevuzarot”) and OPC Gat Power Plant - Limited Partnership (hereinafter -
the “Gat Partnership”).
(2) In the USA, the Company holds - through ICG Energy Inc (hereinafter - “ICG Energy”) - OPC Power Ventures LP (hereinafter - “OPC Power”), and OPC Power holds the CPV Group.
|
|
|
4. |
Investees - consolidated companies and companies, including a partnership or joint venture, the Company’s investment in which is included, directly or indirectly, in the financial statements based on the equity method, specifically:
CPV Fairview, LLC (hereinafter - “Fairview”), CPV Maryland, LLC (hereinafter - “Maryland”), CPV Shore Holdings, LLC (hereinafter - “Shore”), CPV Towantic, LLC (hereinafter - “Towantic”), CPV Valley Holdings, LLC (hereinafter - “Valley”),
CPV Three Rivers, LLC (hereinafter - “Three Rivers”) and CPV Renewable Power, LLC (hereinafter - “CPV Renewable”).
|
|
|
5. |
Related parties - as defined in IAS 24 (2009), Related Party Disclosures.
|
|
|
6. |
Interested parties - as defined in Paragraph (1) of the definition of an “interested party” in a corporation in Section 1 of the Israel Securities Law, 1968.
|
|
|
A. |
Statement of compliance with International Financial Reporting Standards (IFRS)
|
|
B.
|
Functional and presentation currency
|
|
C.
|
Basis of measurement
|
|
D.
|
The operating cycle period
|
|
E.
|
Use of estimates and judgments
|
|
|
1. |
Expected useful life of property, plant and equipment
|
|
|
2. |
Allocation of acquisition costs
|
|
|
3. |
Recoverable amount of cash-generating units that include goodwill and testing for indications of impairment of non-financial assets, including investments in equity-accounted associates
|
|
E.
|
Use of estimates and judgments (cont.)
|
|
|
3. |
Recoverable amount of cash-generating units that include goodwill and testing for indications of impairment of non-financial assets, including investments in equity-accounted associates (cont.)
|
|
|
4. |
Ability to recover development and construction costs of projects under development and construction
|
|
F.
|
Reclassification and restatement
|
|
G.
|
Seasonality
|
|
|
H. |
Changes in accounting policies
|
|
|
• |
The Amendment, together with the subsequent amendment to IAS 1 (see below) replaces certain classification requirements of current or non-current liabilities. For example, pursuant to the amendment, a liability will be classified as
non‑current if an entity has the right to defer the payment for a period of at least 12 months after the reporting period, which is “substantive” and exists at the end of the reporting period.
|
|
|
• |
The subsequent amendment, as published in October 2022, stipulated that financial covenants, which an entity is required to comply with subsequent to the reporting date, shall not affect the classification of a liability as current or
non-current.
|
|
|
• |
Furthermore, the subsequent amendment added disclosure requirements for liabilities that are subject to compliance with financial covenants within 12 months after the reporting date, such as disclosure regarding the nature of the
financial covenants, the date on which the entity is required to comply with them, and facts and circumstances indicating that an entity will find it difficult to comply with the covenants.
|
|
|
• |
In addition, the amendment clarified that a conversion right of a liability will affect its classification as current or non‑current, unless the conversion component is capital-based.
|
|
A.
|
Business combinations and investment in subsidiaries
|
|
|
1. |
Goodwill
|
|
A.
|
Business combinations and investment in subsidiaries (cont.)
|
|
|
2. |
Subsidiaries
|
|
|
3. |
Non‑controlling interests
|
|
|
4. |
Loss of control
|
|
B.
|
Investment in associates and joint ventures
|
|
|
1. |
Investment in associates and joint ventures
|
|
B.
|
Investment in associates and joint ventures (cont.)
|
|
|
1. |
Investment in associates and joint ventures (cont.)
|
|
|
2. |
Increase in holdings stake of equity-accounted companies where significant influence has been retained
|
|
C.
|
Foreign currency
|
|
|
1. |
Foreign currency transactions
|
|
|
2. |
Foreign operations
|
|
|
D. |
Financial instruments
|
|
|
1. |
Non‑derivative financial instruments
|
|
|
2. |
Derivative financial instruments, including hedge accounting
|
|
|
3. |
Derecognition of total financial liabilities
|
|
|
D. |
Financial instruments (cont.)
|
|
|
3. |
Derecognition of total financial liabilities (cont.)
|
|
|
E. |
Property, plant & equipment
|
|
|
1. |
Recognition and measurement
|
|
|
E. |
Property, plant & equipment (cont.)
|
|
|
2. |
Compensation in respect of delay in the construction of a power plant
|
|
|
3. |
Depreciation
|
|
|
Power plants
Maintenance work
Roads and buildings
Back up diesel fuel
Freehold land is not depreciated.
|
23 - 40 years
1.5 - 15 years
23 - 30 years
by consumption
|
|
|
F. |
Intangible assets
|
|
|
1. |
Goodwill
|
|
|
2 |
Other intangible assets
|
|
|
3. |
Amortization
|
|
|
F. |
Intangible assets (cont.)
|
|
|
3. |
Amortization (cont.)
|
|
|
G. |
Impairment
|
|
|
H. |
Employee benefits
|
|
|
H. |
Employee benefits (cont.)
|
|
|
I. |
Revenues
|
|
|
1. |
Revenues from the sale of electricity and steam to private customers, which are recognized in the period in which the electricity was supplied, and in accordance with the price set in the agreements with the customers.
|
|
|
2. |
Income from provision of power plants’ capacity are recognized over the period during which capacity was provided.
|
|
|
I. |
Revenues (cont.)
|
|
|
J. |
Finance income and expenses
|
|
|
K. |
Expenses for income tax
|
|
|
K. |
Expenses for income tax (cont.)
|
|
|
L. |
Capitalization of borrowing costs
|
|
|
M. |
Leases
|
|
|
1. |
Leased assets and lease liabilities
|
|
|
2. |
Lease term
|
|
|
3. |
Amortization of right-of-use asset
|
|
|
N. |
Agreements with the tax equity partner (relevant only for associates)
|
|
|
O. |
New standards and interpretations not yet adopted
|
|
|
A. |
Trade and other receivables and debit balances
|
|
|
B. |
Derivative financial instruments
|
|
|
B. |
Derivative financial instruments (cont.)
|
|
|
C. |
Non-derivative financial liabilities
|
|
|
D. |
Share-based compensation transactions
|
|
As of December 31
|
||||||||||||
|
Nominal interest
|
2024
|
2023
|
||||||||||
|
December 31, 2024
|
NIS million
|
NIS million
|
||||||||||
|
Current account balances
|
53
|
522
|
||||||||||
|
Interest-bearing current account balances
|
4.2
|
%
|
693
|
-
|
||||||||
|
Deposits
|
4.2
|
%
|
216
|
485
|
||||||||
|
962
|
1,007
|
|||||||||||
|
As of December 31
|
||||||||||||
|
Nominal interest
|
2024
|
2023
|
||||||||||
|
December 31, 2024
|
NIS million
|
NIS million
|
||||||||||
|
Cash and long-term restricted deposits (1)
|
4.6
|
%
|
60
|
59
|
||||||||
|
As of December 31
|
||||||||
|
2024
|
2023
|
|||||||
|
NIS million
|
NIS million
|
|||||||
|
Prepaid expenses
|
40
|
45
|
||||||
|
Institutions
|
39
|
30
|
||||||
|
Receivables in respect of gas agreement (1)
|
-
|
18
|
||||||
|
Receivables in respect of sale of ITC grant (2)
|
-
|
270
|
||||||
|
Deposits to a third party for collaterals
|
3
|
14
|
||||||
|
Short-term derivative financial instruments
|
-
|
12
|
||||||
|
Other
|
8
|
29
|
||||||
|
90
|
418
|
|||||||
|
|
(1) |
For further details – see Note 26C3.
|
|
|
(2) |
The balance as of December 31, 2023 is in respect of CPV Renewable. For details regarding loss of control, deconsolidation and transition to the equity method in the fourth quarter of 2024 with respect to the investment in CPV
Renewable, see Note 23E.
|
|
As of December 31
|
||||||||
|
2024
|
2023
|
|||||||
|
NIS million
|
NIS million
|
|||||||
|
Subordinated long-term loans to Valley (1)
|
117
|
109
|
||||||
|
Payments to customers (2)
|
24
|
23
|
||||||
|
Deferred tax assets
|
10
|
57
|
||||||
|
Deferred finance expenses (3)
|
-
|
28
|
||||||
|
Deposits in respect of provision of collateral to a third party (4)
|
-
|
17
|
||||||
|
Other
|
11
|
13
|
||||||
|
162
|
247
|
|||||||
|
|
(1) |
For details, see Note 22C.
|
|
|
(2) |
The balance represents compensation paid to customers in Israel due to a delay in the commercial operation date of power plants.
|
|
|
(3) |
The balance as of December 31, 2023 pertains to various fees paid under financing agreements and credit facilities by CPV Renewable - which, as of that date - have not yet been credited to the loan balance.For details regarding loss of
control, deconsolidation and transition to the equity method in the fourth quarter of 2024 with respect to the investment in CPV Renewable, see Note 23E.
|
|
|
(4) |
The balance as of December 31, 2023 is in respect of CPV Renewable. For details regarding loss of control, deconsolidation and transition to the equity method in the fourth quarter of 2024 with respect to the investment in CPV
Renewable, see Note 23E.
|
|
|
A. |
Composition
|
|
Active power plants and ancillary equipment
|
Power plants under construction and development
|
Land and other assets (1)
|
Advances on account of property, plant and equipment
|
Total
|
||||||||||||||||
|
NIS million
|
NIS million
|
NIS million
|
NIS million
|
NIS million
|
||||||||||||||||
|
Cost
|
||||||||||||||||||||
|
Balance as of January 1, 2023
|
2,680
|
1,942
|
390
|
151
|
5,163
|
|||||||||||||||
|
Acquisitions as part of a business combination
|
1,035
|
-
|
88
|
23
|
1,146
|
|||||||||||||||
|
Additions
|
15
|
994
|
92
|
(68
|
)
|
1,033
|
||||||||||||||
|
Derecognitions
|
(16
|
)
|
(41
|
)
|
(33
|
)
|
-
|
(90
|
)
|
|||||||||||
|
Classification from assets under construction due to commercial operation
|
1,826
|
(1,860
|
)
|
34
|
-
|
-
|
||||||||||||||
|
Effect of changes in exchange rates
|
2
|
17
|
-
|
1
|
20
|
|||||||||||||||
|
Balance as of December 31, 2023
|
5,542
|
1,052
|
571
|
107
|
7,272
|
|||||||||||||||
|
Additions
|
67
|
913
|
59
|
7
|
1,046
|
|||||||||||||||
|
Derecognitions
|
(24
|
)
|
-
|
(15
|
)
|
-
|
(39
|
)
|
||||||||||||
|
Classification from assets under construction due to commercial operation
|
401
|
(401
|
)
|
-
|
-
|
-
|
||||||||||||||
|
Impairment (2)
|
-
|
(31
|
)
|
-
|
-
|
(31
|
)
|
|||||||||||||
|
Deconsolidation (3)
|
(1,560
|
)
|
(1,267
|
)
|
(30
|
)
|
(28
|
)
|
(2,885
|
)
|
||||||||||
|
Effect of changes in exchange rates
|
40
|
28
|
-
|
1
|
69
|
|||||||||||||||
|
Balance as of December 31, 2024
|
4,466
|
294
|
585
|
87
|
5,432
|
|||||||||||||||
|
Accumulated depreciation
|
||||||||||||||||||||
|
Balance as of January 1, 2023
|
773
|
-
|
66
|
-
|
839
|
|||||||||||||||
|
Depreciation per year
|
192
|
-
|
15
|
-
|
207
|
|||||||||||||||
|
Derecognitions
|
(16
|
)
|
-
|
(1
|
)
|
-
|
(17
|
)
|
||||||||||||
|
Balance as of December 31, 2023
|
949
|
-
|
80
|
-
|
1,029
|
|||||||||||||||
|
Depreciation per year
|
245
|
-
|
14
|
-
|
259
|
|||||||||||||||
|
Derecognitions
|
(24
|
)
|
-
|
(2
|
)
|
-
|
(26
|
)
|
||||||||||||
|
Deconsolidation (3)
|
(64
|
)
|
-
|
(5
|
)
|
-
|
(69
|
)
|
||||||||||||
|
Effect of changes in exchange rates
|
1
|
-
|
-
|
-
|
1
|
|||||||||||||||
|
Balance as of December 31, 2024
|
1,107
|
-
|
87
|
-
|
1,194
|
|||||||||||||||
|
Amortized balance as of December 31, 2024
|
3,359
|
294
|
498
|
87
|
4,238
|
|||||||||||||||
|
Amortized balance as of December 31, 2023
|
4,593
|
1,052
|
491
|
107
|
6,243
|
|||||||||||||||
|
Amortized balance as of January 1, 2023
|
1,907
|
1,942
|
324
|
151
|
4,324
|
|||||||||||||||
|
|
(1) |
Includes land owned by the Gat Power Plant totaling approx. NIS 84 million.
|
|
|
(2) |
For details regarding impairment loss in Hadera 2, see Note 10B3.
|
|
|
(3) |
For details regarding loss of control, deconsolidation and transition to the equity method in the fourth quarter of 2024 with respect to the investment in CPV Renewable, see Note 23E.
|
|
|
B. |
Non-cash purchase of property, plant and equipment
|
|
|
D. |
Projects under construction in Israel - material construction and equipment agreements
|
|
|
D. |
Projects under construction in Israel - material construction and equipment agreements (cont.)
|
|
|
A. |
Composition of right‑of‑use assets and long-term deferred expenses
|
|
Land (b)
|
Other (1)
|
Long-term deferred expenses (2)
|
Total
|
|||||||||||||
|
NIS million
|
NIS million
|
NIS million
|
NIS million
|
|||||||||||||
|
Balance as of January 1, 2023
|
273
|
74
|
97
|
444
|
||||||||||||
|
Additions
|
122
|
19
|
117
|
258
|
||||||||||||
|
Acquisitions as part of a business combination
|
-
|
9
|
-
|
9
|
||||||||||||
|
Remeasurement (3)
|
(46
|
)
|
-
|
-
|
(46
|
)
|
||||||||||
|
Derecognitions
|
-
|
(1
|
)
|
-
|
(1
|
)
|
||||||||||
|
Depreciation
|
(14
|
)
|
(13
|
)
|
(5
|
)
|
(32
|
)
|
||||||||
|
Effect of changes in exchange rates
|
(1
|
)
|
-
|
-
|
(1
|
)
|
||||||||||
|
Balance as of December 31, 2023
|
334
|
88
|
209
|
631
|
||||||||||||
|
Additions
|
-
|
-
|
193
|
193
|
||||||||||||
|
Derecognitions
|
-
|
(2
|
)
|
-
|
(2
|
)
|
||||||||||
|
Depreciation
|
(13
|
)
|
(13
|
)
|
(5
|
)
|
(31
|
)
|
||||||||
|
Deconsolidation (4)
|
(159
|
)
|
-
|
-
|
(159
|
)
|
||||||||||
|
Effect of changes in exchange rates
|
5
|
-
|
-
|
5
|
||||||||||||
|
Balance as of December 31, 2024
|
167
|
73
|
397
|
637
|
||||||||||||
|
|
(1) |
Mainly includes costs paid with respect to the construction of the PRMS Facilities for the Hadera and Zomet power plants and leases on offices in Israel and the USA.
|
|
|
(2) |
Mainly in respect of payments in respect of infrastructure for electricity transmission lines, and payments in respect of the Ramat Beka project as described in Section B5 below.
|
|
|
(3) |
For details see Note B5.
|
|
|
(4) |
For details regarding loss of control, deconsolidation and transition to the equity method in the fourth quarter of 2024 with respect to the investment in CPV Renewable, see Note 23E.
|
|
|
B. |
Agreements in Israel
|
|
|
1. |
The Rotem Power Plant
|
|
|
2. |
Rotem 2
|
|
|
3. |
The Hadera Power Plant
|
|
|
4. |
Hadera 2
|
|
|
B. |
Agreements in Israel (cont.)
|
|
|
4. |
Hadera 2 (cont.)
|
|
|
5. |
Zomet Power Plant
|
|
|
B. |
Agreements in Israel (cont.)
|
|
|
6. |
The Ramat Beka renewable energy project
|
|
|
B. |
Agreements in Israel (cont.)
|
|
|
6. |
The Ramat Beka renewable energy project (cont.)
|
|
|
A. |
Composition
|
|
Goodwill (1)
|
PPA
|
Other
|
Total
|
|||||||||||||
|
NIS million
|
NIS million
|
NIS million
|
NIS million
|
|||||||||||||
|
Cost
|
||||||||||||||||
|
Balance as of January 1, 2023
|
412
|
388
|
59
|
859
|
||||||||||||
|
Additions
|
-
|
-
|
51
|
51
|
||||||||||||
|
Acquisitions as part of a business combination
|
295
|
93
|
-
|
388
|
||||||||||||
|
Impairment loss in respect of Gnrgy (1)
|
(23
|
)
|
-
|
-
|
(23
|
)
|
||||||||||
|
Effect of changes in exchange rates
|
13
|
14
|
-
|
27
|
||||||||||||
|
Balance as of December 31, 2023
|
697
|
495
|
110
|
1,302
|
||||||||||||
|
Additions
|
-
|
-
|
25
|
25
|
||||||||||||
|
Derecognitions
|
-
|
-
|
(2
|
)
|
(2
|
)
|
||||||||||
|
Impairment loss in respect of Gnrgy (1)
|
(19
|
)
|
-
|
(4
|
)
|
(23
|
)
|
|||||||||
|
Deconsolidation (2)
|
(471
|
)
|
(510
|
)
|
(72
|
)
|
(1,053
|
)
|
||||||||
|
Effect of changes in exchange rates
|
14
|
15
|
2
|
31
|
||||||||||||
|
`
|
||||||||||||||||
|
Balance as of December 31, 2024
|
221
|
-
|
59
|
280
|
||||||||||||
|
Amortization
|
||||||||||||||||
|
Balance as of January 1, 2023
|
-
|
75
|
7
|
82
|
||||||||||||
|
Depreciation per year
|
-
|
41
|
12
|
53
|
||||||||||||
|
Effect of changes in exchange rates
|
-
|
2
|
-
|
2
|
||||||||||||
|
Balance as of December 31, 2023
|
-
|
118
|
19
|
137
|
||||||||||||
|
Depreciation per year
|
-
|
41
|
8
|
49
|
||||||||||||
|
Derecognitions
|
-
|
-
|
(2
|
)
|
(2
|
)
|
||||||||||
|
Reclassification
|
-
|
5
|
(5
|
)
|
-
|
|||||||||||
|
Deconsolidation (2)
|
-
|
(166
|
)
|
(1
|
)
|
(167
|
)
|
|||||||||
|
Effect of changes in exchange rates
|
-
|
2
|
-
|
2
|
||||||||||||
|
Balance as of December 31, 2024
|
-
|
-
|
19
|
19
|
||||||||||||
|
Amortized balance as of December 31, 2024
|
221
|
-
|
40
|
261
|
||||||||||||
|
Amortized balance as of December 31, 2023
|
697
|
377
|
91
|
1,165
|
||||||||||||
|
Amortized balance as of January 1, 2023
|
412
|
313
|
52
|
777
|
||||||||||||
|
|
(1) |
As of December 31, 2024, it includes a balance in respect of: The Israel power plants operations (mostly Rotem, Hadera and Gat) due to the acquisition of the Gat Power Plant in 2023 for a total of approx. NIS 220 million; for further
details, see Note 23F1. For details regarding goodwill impairment loss recognized in respect of the investment in Gnrgy prior to its sale in the third quarter of 2024, see Section C below.
|
|
|
(2) |
For details regarding loss of control, deconsolidation and transition to the equity method in the fourth quarter of 2024 with respect to the investment in CPV Renewable, see Note 23E below.
|
|
|
B. |
Annual impairment testing of goodwill arising as part of the acquisition of the Gat Power Plant
|
|
|
A. |
Forecast years - represent the period spanning from 2025 to 2043 and are based on the estimate of the economic life of the power plant and its value as of the end of the forecast period.
|
|
|
B. |
Generation Component forecasts and natural gas prices, which are not backed by an agreement - are based on market forecasts received from external and independent information sources.
|
|
|
C. |
An annual long-term inflation rate of 2.5%.
|
|
|
D. |
Weighted average cost of capital (WACC) - 8%.
|
|
|
C. |
Goodwill impairment in respect of Gnrgy, which was recognized prior to its sale in the third quarter of 2024
|
|
As of December 31
|
||||||||
|
2024
|
2023
|
|||||||
|
NIS million
|
NIS million
|
|||||||
|
Employees and institutions for salaries
|
63
|
53
|
||||||
|
Institutions
|
18
|
4
|
||||||
|
Interest payable
|
20
|
18
|
||||||
|
Profit-sharing plan for CPV Group employees (1)
|
-
|
21
|
||||||
|
Current maturities of lease liabilities
|
14
|
18
|
||||||
|
Liability to tax equity partner (2)
|
-
|
270
|
||||||
|
Other
|
8
|
27
|
||||||
|
123
|
411
|
|||||||
|
|
(1) |
For further details – see Note 16C.
|
|
|
(2) |
The balance as of December 31, 2023 is in respect of CPV Renewable. For details regarding loss of control, deconsolidation and transition to the equity method in the fourth quarter of 2024 with respect to the investment in CPV
Renewable, see Note 23E.
|
|
As of December 31
|
||||||||
|
2024
|
2023
|
|||||||
|
NIS million
|
NIS million
|
|||||||
|
Profit-sharing plan for CPV Group employees (1)
|
105
|
68
|
||||||
|
Liabilities for evacuation, decommissioning, and removal (2)
|
3
|
26
|
||||||
|
Deferred income in respect of ITC grant (2)
|
-
|
287
|
||||||
|
Other liabilities
|
7
|
18
|
||||||
|
115
|
399
|
|||||||
|
|
(1) |
For further details, see Note 18C.
|
|
|
(2) |
The balances as of December 31, 2023 are mainly with respect to CPV Renewable. For details regarding loss of control, deconsolidation and transition to the equity method in the fourth quarter of 2024 with respect to the investment in
CPV Renewable, see Note 23E.
|
|
|
A. |
Composition
|
|
(1) Current maturities and short-term credit:
|
||||||||
|
As of December 31
|
||||||||
|
2024
|
2023
|
|||||||
|
NIS million
|
NIS million
|
|||||||
|
Current maturities of long-term loans in Israel
|
80
|
120
|
||||||
|
Current maturities of long-term loans in the US Renewable Energies Segment
|
-
|
67
|
||||||
|
Short-term credit in Israel
|
2
|
204
|
||||||
|
82
|
391
|
|||||||
|
(2) Long-term loans from banking corporations and financial institutions:
|
||||||||
|
As of December 31
|
||||||||
|
2024
|
2023
|
|||||||
|
NIS million
|
NIS million
|
|||||||
|
Loans to OPC Israel (1)
|
1,650
|
-
|
||||||
|
Loans to Hadera
|
592
|
652
|
||||||
|
Loans to Zomet (1)
|
-
|
1,142
|
||||||
|
Loans to Gat (1)
|
-
|
438
|
||||||
|
Loans to the US Renewable Energies segment (2)
|
-
|
895
|
||||||
|
Other loans
|
-
|
3
|
||||||
|
Total from banking corporations and financial institutions
|
2,242
|
3,130
|
||||||
|
Net of deferred finance costs (1),(2)
|
(12
|
)
|
(78
|
)
|
||||
|
Less current maturities
|
(80
|
)
|
(187
|
)
|
||||
|
2,150
|
2,865
|
|||||||
|
|
(1) |
For details regarding early repayment of project financing at Zomet and Gat and OPC Israel’s taking corporate financing in the third quarter of 2024, see section B1 below.
|
|
|
(2) |
For details regarding loss of control, termination of consolidation and transition to the equity method as from the fourth quarter of 2024 with respect to investment in CPV Renewable, see Note 23E.
|
|
|
B. |
Additional details regarding financing agreements in Israel
|
|
|
1. |
Corporate financing agreements in Israel
|
|
|
B. |
Additional details regarding financing agreements in Israel (cont.)
|
|
|
1. |
Corporate financing agreements in Israel (cont.)
|
|
Loan provision date
|
Total Financing Commitments were advanced to the Borrower on August 11, 2024. The loan grant and the execution of the Early Repayment of the Project Credit will take place on
August 15, 2024.
|
|
Principal terms
|
Principal of Financing Agreement 1: NIS 850 million.
Principal of Financing Agreement 2: NIS 800 million
.
The loans’ principal will be repaid in quarterly installments from March 25, 2025 through December 25, 2033, as follows: 0.5% in every quarter in 2025; 0.75% in every quarter in 2026; 1%
in every quarter in 2027-2029; 5% in every quarter in 2030-2032; 5.75% in every quarter in 2033.
|
|
Interest terms
|
The Financing Agreements bear annual interest at a rate based on Prime interest + a spread ranging from 0.3% to 0.4%.
The interest in respect of each loan will be repaid in quarterly installments from September 25, 2024 through December 25, 2033.
Furthermore, the Financing Agreements include additional interest as is generally accepted, which is payable upon the occurrence of default events (with respect to additional interest due
to temporary non-compliance with financial covenants which does not constitute default, see below) and in respect of failure to make payments on time (interest on arrears).
|
|
Collateral and pledges
|
Under the Financing Agreements, the Borrower undertook not to place liens on, or provide collateral for, its assets, including its holdings in subsidiaries, except for certain allowed
pledges as defined in the Financing Agreements, mostly for the purpose of existing and/or future project financing (for the Hadera Power Plant) (if any), under the defined terms and conditions.
Furthermore, the Borrower’s subsidiaries provided the Lenders with an undertaking not to take credit, excluding existing and/or future Project Credit (for the Hadera Power Plant) and
except with respect to activity in the ordinary course of business, all in accordance with the defined terms and conditions. In addition, company guarantees were provided to the Lenders by certain subsidiaries which are wholly-owned
(100%) by the Borrower (directly and/or indirectly).
|
|
Additional restrictions, liabilities and material conditions
|
The Financing Agreements include various undertakings of the Borrower and grounds, upon the fulfillment of which the Lenders will be allowed to call for immediate repayment of the loans
(subject to remediation periods or to amounts set if applicable under the circumstances),4 which include, among other things, failure to make payments in respect of the loan on the dates which were set for that purpose,
liquidation procedures, receivership, insolvency or debt arrangements of the Borrower as set forth in the Financing Agreements, change of control in the Company or the Borrower under defined circumstances and conditions, certain events
which have an adverse effect on the Borrower’s activity as set forth in the Financing Agreements, restructuring - except for certain defined exceptions, a change in the area of activity of the Borrower under set conditions, restrictions
on the sale of assets under set conditions, failure to comply with the following financial covenants in accordance with the terms and conditions which were set (except for cases where a certain deviation does not constitute grounds
subject to the provisions regarding additional interest as detailed below), and a cross-default clause where the Borrower’s debt is called for immediate repayment upon the fulfillment of certain set terms and conditions.
In addition, provisions were set with regard to fees, as is generally accepted in financing agreements, including transaction and early repayment fees. It is clarified that early
repayment fees in respect of each loan (except for fees in respect of economic damage, as applicable) were set at levels which decrease gradually over the loan term, such that within a set number of years no early repayment fees will
apply.
|
|
Conditions for distribution
|
Distribution by the Borrower (including repayment of subordinated shareholder loans provided to the Borrower and/or its investees, excluding the Rotem Loan) is subject to conditions
generally accepted in financing agreements, and to compliance with the following financial covenants:
The ratio between the net financial debt less the financial debt designated for construction of the projects that have not yet started generating EBITDA, and the adjusted EBITDA, as
defined below, shall not exceed 7.
|
| 3 |
The Financing Agreements are separate and independent of each other; however, considering their similar characteristics, they are described collectively, where relevant.
|
| 4 |
In accordance with the Financing Agreements, some of the Borrower’s undertakings and grounds for immediate repayment (as detailed below) apply in respect of events of material subsidiaries of the Borrower (which include, among other
things, OPC Power Plants, Rotem, Zomet, etc.).
|
|
|
B. |
Additional details regarding financing agreements in Israel (cont.)
|
|
|
1. |
Corporate financing agreements in Israel (cont.)
|
|
Financial covenants
|
The financial covenants will be assessed at the end of each quarter (hereinafter - the “Measurement Date”), immediately after the approval date of the financial statements of the
Borrower. Following are the financial covenants applicable to the Borrower (on a consolidated basis) on each measurement date in connection with each of the Financing Agreements:
• The ratio of the net financial debt(1) less financial debt designated for construction of the projects that have not yet started
generating EBITDA(2), and the adjusted EBITDA(3) shall not exceed 8 (hereinafter - “Debt to EBITDA Ratio”).
• The equity(4) to total assets ratio(5) shall not fall below 20%.
• The Company's equity(4) will not fall below NIS 1.1 billion.
(1) Net financial debt - Total (1) Long and short-term interest-bearing debts (including the Borrower’s share in such debts of
associates) to banking institutions, financial entities and any other entity engaged in the provision of loans; (2) Shareholder loans, excluding subordinated shareholder loans, as defined by the Financing Agreements, excluding the Rotem
Loan;5 (3) Plus and/or less principal and/or interest swaps at their nominal value (less and/or plus the deposits provided to secure them); and (4) Net of financial assets.
Financial assets - total (1) Cash and cash equivalents and (2) Deposits with banks and financial institutions (excluding restricted deposits provided against a
guarantee), provided that they are clear and free of any pledge, incumbrance and foreclosure. It is noted that cash and cash equivalents and deposits restricted to the servicing of a financial debt shall constitute part of the financial
assets.
(2) A financial debt designated for the construction of projects which have not yet started generating EBITDA - (1) Financial debt
provided to a special-purpose corporation as part of project credit; or (2) In a project that was not pledged - the outstanding balance of a financial debt provided at an amount that does not exceed the balance of actual investment in the
project, provided that the aggregate amount will not exceed - on each measurement date - NIS 200 million; all of the above - in connection with a project that has not yet reached commercial operation.
(3) Adjusted EBITDA - EBITDA in the four quarters preceding the measurement date (including the Borrower’s share in the EBITDA of
associates) net of other and/or one-off expenses or income and share-based payment. Plus:
(a) The annualized EBITDA6 of assets which commenced commercial operation during the four quarters preceding the measurement date; and
(b) The annualized EBITDA, based on assets acquired by the Borrower and/or investees as part of an acquisition and/or merger transaction, and all of the respective
financial debt was recognized upon their purchase.
(4) Equity capital - as per the Borrower’s consolidated financial statements - attributable to the parent company’s shareholders, plus
subordinated shareholder loans (but excluding the Rotem Loan).
(5) Total assets - as per the Borrower’s consolidated financial statements.
It is noted that if the Borrower fails to comply with any financial covenants in a certain quarter at a range which does not exceed 10% of the values set for the relevant covenant, the
loan will bear additional interest at a rate set in the Financing Agreements as from the quarter in which the financial statements were published, according to which the Borrower failed to comply the relevant covenants, up to a period of
two consecutive quarters. Provided that such a deviation period will not occur more often than a frequency set in the Financing Agreements, the failure to comply with such financial covenants in the said period shall not be deemed a
default event and shall not constitute grounds for calling for immediate repayment of the loan.
For details regarding the actual amounts and/or ratios in respect of the abovementioned covenants as of December 31, 2024, see Section 4 below.
|
|
|
B. |
Additional details regarding financing agreements in Israel (cont.)
|
|
|
2. |
Project financing agreement in Hadera
|
|
Loan provision date
|
July 2016
|
|
The financing entities
|
A consortium of lenders headed by Israel Discount Bank Ltd. and Harel Insurance Company Ltd.
|
|
The principal outstanding balance as of December 31, 2024
|
Approx. NIS 585 million.
|
|
Principal terms
|
Repayable in quarterly installments, starting from March 25, 2020, with the final repayment date being in 2037 (subject to the stipulated early repayment provisions in the agreement).
Linkage mechanism: Approx. 67% of the principal is CPI-linked, and approx. 33% of the principal is not CPI-linked. The Group entered into a swap to hedge up to approx. 70% of the
exposure to the CPI.
|
|
Interest terms
|
• Annual interest at rates between 2.4% and approx. 3.9% (for the linked loans) and between 3.6% and approx. 5.4% (for the unlinked loans).
• Repayment in quarterly installments, starting on March 25, 2020.
|
|
Additional credit facilities as of the report date
|
• Working capital facility of NIS 30 million;
• Guarantees facility of NIS 60 million;
• A hedge facility of NIS 68 million.
The withdrawals from the various facilities are subject to the absence of default events and to compliance with various conditions as is standard in agreements of this
type.
|
|
Collateral and pledges
|
Liens were placed in favor of Discount Bank, as a trustee for the collateral on behalf of the Hadera Lenders, on all of Hadera’s existing and future assets, on Hadera’s rights, and on the
holdings in Hadera.
|
|
Restrictions and undertakings
|
The agreements prescribe certain restrictions and liabilities as is generally accepted in agreements of this type, including:
• Restrictions on assuming financial debts and providing guarantees;
• Requirement to obtain the Lender’s approval for engagement in material agreements and other material actions;
• Undertaking in connection with holding certain reserve funds for maintenance (scheduled and unscheduled) and debt service;7
• The lender was granted veto rights and other rights in connection with certain decisions as is generally accepted in agreements of this type;
• Certain changes in ownership;
• As is generally accepted in project financing, there are certain rights that are exercisable only after obtaining the financing entities’
consent, and certain rights, which the financing entities may oblige the lender to exercise
(reserved discretion);
o Various restrictions on deviation from the project budgets;
o Restrictions on distribution and interested party transactions;
o Undertakings to provide confirmations of compliance with the terms of the agreement, including financial covenants;
o Prohibition on making material changes such as a merger;
o Undertaking to obtain rating for the project under circumstances set forth;
o Cross-default clauses are in place under certain conditions and circumstances set forth;
|
|
|
B. |
Additional details (cont.)
|
|
|
2. |
Project financing agreement in Hadera (cont.)
|
|
Conditions for distribution
|
A distribution by Hadera, as defined in the financing agreement, is subject to a number of conditions set in the agreement, including, among other things:
• Compliance with the following financial covenants: Historic DSCR, Projected DSCR and LLCR at a minimum rate of 1.25;
• Non-occurrence of a breach or potential breach;
• Maintaining a minimum pre-defined cash amount, which is required as part of the amendment to the Hadera Equity Subscription Agreement, which is
described below;
• Proven ability to comply with the take or pay undertakings as per the natural gas supply agreement until the next planned calculation date (as
defined in the agreement);
• If the Hadera Power Plant fails to meet the conditions for generation facilities using cogeneration technology as detailed in the Cogeneration
Regulations, it will be required to provide proof of its ability to meet payments to the Israel Electric Corporation and the Israeli Electricity Authority as a result of non-compliance with the said conditions;
• No more than two distributions will be carried out in a 12-month period.
|
|
Equity Subscription Agreements
|
The Hadera Equity Subscription Agreement (as amended from time to time) includes various undertakings by the shareholder to provide own capital to Hadera, including in accordance with the
regulatory rules of the Israeli Electricity Authority (provided it will not exceed 40% of the project’s normative cost), providing capital in case of deficit in own capital due to excess project costs or due to hedging agreements, and
commitments to provide various guarantees, including guarantees for debt service not paid due to termination of a PPA by the borrower up to NIS 8 million, as well as additional bank guarantees in certain cases. Furthermore, the Company
and Veridis Power Plants Ltd. (hereinafter - “Veridis”)8 are required to comply with certain covenants.
|
|
|
3. |
The Group’s credit facilities:
|
|
|
B. |
Additional details (cont.)
|
|
|
3. |
The Group’s credit facilities: (cont.)
|
|
The facility amount immediately prior to the report approval date (March 6, 2025)
|
Utilization as of the report date (1)
|
Utilization immediately prior to the report approval date (March 6, 2025)
|
||||||||||
|
The Company
|
300
|
-
|
-
|
|||||||||
|
OPC Israel
|
300
|
69
|
-
|
|||||||||
|
The Company for CPV Group (2)
|
173 (approx. USD 20 million and approx. NIS 100 million)
|
81
|
89
|
|||||||||
|
CPV Group(2)
|
274 (approx. USD
75 million)
|
149
|
113
|
|||||||||
|
Total secured facilities
|
1,047
|
299
|
202
|
|||||||||
|
|
(1) |
Mostly for the purpose of letters of credit and bank guarantees.
|
|
|
(2) |
The facilities provided for CPV Group are backed with a Company guarantee.
|
|
|
B. |
Additional details (cont.)
|
|
|
4. |
Financial covenants:
|
|
Financial covenants
|
Breach ratio
|
Actual value
|
|||
|
Covenants applicable to OPC Israel with respect to the corporate financing agreements9
|
|||||
|
OPC Israel’s equity capital
|
Will not fall below NIS 1,100 million
|
Approx. NIS 2,446 million
|
|||
|
OPC Israel’s equity to asset ratio
|
Will not fall below 20%
|
45%
|
|||
|
OPC Israel’s ratio of net debt to EBITDA
|
Will not exceed 8
|
3.5
|
|||
|
Covenants applicable to Hadera in connection with the Hadera Financing Agreement
|
|||||
|
Minimum expected DSCR (1)
|
1.10
|
1.10
|
|||
|
Average expected DSCR (1)
|
1.10
|
1.60
|
|||
|
LLCR (2)
|
1.10
|
1.51
|
|||
|
Covenants applicable to the Company in connection with binding credit facilities with Israeli banks10
|
|||||
|
The Company shareholders’ equity (separate)
|
Will not fall below NIS 1,200 million
|
Approx. NIS 4,752 million
|
|||
|
The Company’s equity to asset ratio (separate)
|
Will not fall below 30%
|
71%
|
|||
|
The Company’s net debt to EBITDA ratio
|
Will not exceed 12
|
5.3
|
|||
|
|
(1) |
DSCR - The ratio between the free cash flows for debt service and the principal and interest payments for the relevant period (all subject to the definitions and terms and conditions of the relevant financing agreement).
|
|
|
(2) |
LLCR - The ratio between the present value of the future free cash flows for debt service from projects and the balance of the loan as of the calculation date (all subject to the definitions and terms and conditions of the relevant
financing agreement).
|
|
|
C. |
Guarantees
|
|
As of December 31
|
||||||||
|
2024
|
2023
|
|||||||
|
NIS million
|
NIS million
|
|||||||
|
For operating projects in Israel (mostly Rotem, Hadera, Zomet and Gat) (1)
|
249
|
244
|
||||||
|
For projects under construction and development in Israel (Sorek and consumers’ premises) (2)
|
74
|
47
|
||||||
|
In respect of the filing of a bid in the Sorek tender (3)
|
100
|
-
|
||||||
|
For virtual supply activity in Israel
|
21
|
29
|
||||||
|
For operating projects in the US Renewable Energies Segment (4)
|
22
|
189
|
||||||
|
In respect of projects under construction and development in the USA (Group 5) (CPV)
|
339
|
148
|
||||||
|
805
|
657
|
|||||||
|
|
(1) |
Mainly in respect of: (a) bank guarantees of approx. NIS 108 million (CPI-linked) provided by OPC Israel for Rotem in favor of Noga - Independent System Operator Ltd. (hereinafter - the “System Operator”) as required under the PPA. (b)
A bank guarantee of approx. NIS 23 million (CPI-linked) provided by OPC Israel on behalf of Hadera for the benefit of the System Operator, as required in accordance with the financial covenants of the Israeli Electricity Authority. (c) A
bank guarantee of approx. NIS 67 million (CPI-linked) provided by OPC Israel for Zomet in favor of the ILA, which was released subsequent to the report date (for further details, see Note 10B5).
|
|
|
(2) |
Mainly in respect of a bank guarantee of approx. NIS 51 million (CPI-linked) provided by OPC Israel on behalf of Sorek 2 in favor of the Accountant General at the Ministry of Finance in connection with the financial closing of the
Sorek 2 project (for further details, see Note 9D).
|
|
|
(3) |
A bank guarantee provided by OPC Israel with respect to a bid submitted by OPC Power Plants for a planning, financing, build and operate tender of a new conventional electricity generation power plant. In December 2024, OPC Power
Plants was served with a notice whereby the Tenders Committee announced that a third party’s bid is the winning bid in the tender, and that OPC Power Plants’s bid is the “second eligible” bidder; therefore, the guarantee was reduced to a
total of NIS 50 million subsequent to the report date.
|
|
|
(4) |
As of December 31, 2023, the balance mainly includes guarantees provided by subsidiaries in the US Renewable Energies Segment. For details regarding loss of control, deconsolidation and transition to the equity method in the fourth
quarter of 2024 with respect to the investment in CPV Renewable, see Note 23E.
|
|
|
(5) |
The increase arises mainly from the provision of bank guarantees in connection with PPAs and connection to the electrical grid in the US Renewable Energies Segment.
|
|
|
A. |
Composition
|
|
As of December 31
|
||||||||
|
2024
|
2023
|
|||||||
|
NIS million
|
NIS million
|
|||||||
|
Marketable debentures
|
1,875
|
1,839
|
||||||
|
Less current maturities
|
(212
|
)
|
(192
|
)
|
||||
|
1,663
|
1,647
|
|||||||
|
|
B. |
Additional details regarding the Company’s public debentures as of the report date
|
|
Series
|
Original issuance date
|
p.v. at the original issuance date (2)
|
Nominal value as of the report date
|
Nominal value after revaluation based on the linkage terms
|
Fair value as of December 31,
2024 (3)
|
Interest rate
|
Principal payment dates
|
Interest payment dates
|
Linkage basis and terms (principal and interest)
|
|
Series B
|
April 26, 2020 (1)
|
Approx. NIS 956 million
|
Approx. NIS 793
million
|
Approx. NIS 909 million
|
Approx. NIS
916 million
|
2.75%
|
16 unequal semi-annual payments, to be paid on March 31 and September 30 of each of the years 2021 to 2028 (inclusive).
|
The interest on the outstanding balance of the principal of Debentures is paid - as from September 2020 - twice a year (except for 2020), on September 30, 2020, and on March 31 and
September 30 of each of the years 2021 to 2028 (inclusive).
|
Linked to the Consumer Price Index in respect of March 2020.
|
|
Series C
|
Septem-ber 9, 2021
|
Approx. NIS 851 million
|
Approx. NIS 766 million
|
The debentures are non-linked
|
Approx. NIS
711 million
|
2.5%
|
12 unequal semi-annual payments, to be paid on February 28 and August 31 of each of the years 2024 to 2030 (inclusive), except for 2028.
|
The interest is paid on the outstanding balance of the principal of Debentures (Series C), as it shall be from time to time, as from February 2022, twice a year, on February 28 and on
August 31 of each of the years 2022 to 2030 (inclusive).
|
Non-linked
|
|
Series D
|
January 22, 2024
|
Approx. NIS 200 million
|
Approx. NIS 200 million
|
The debentures are non-linked
|
Approx. NIS
210 million
|
6.2%
|
18 unequal semi-annual payments, to be paid on March 25 and September 25 of each of the years 2026 to 2034 (inclusive).
|
The interest on the outstanding balance of the principal of Debentures (Series D), as it shall be from time to time, is paid - as from September 2024 - twice a year (except for 2024), on
September 25, 2024 and on March 25 and September 25 of each of the years 2025 to 2034 (inclusive).
|
Non-linked
|
|
|
(1) |
Furthermore, as of its original issuance date, Series B was expanded in October 2020.
|
|
|
(2) |
As of the issuance date of Debentures (Series B, C and D), the issuance costs amounted to approx. NIS 7 million, approx. NIS 9 million, and approx. NIS 3 million, respectively.
|
|
|
(3) |
The fair value is based on the closing price quoted on the stock exchange.
|
|
|
(4) |
As of December 31, 2024, the balance of interest payable in respect of the Debentures (Series B, C and D) amounts to approx. NIS 16 million.
|
|
|
C. |
Additional details
|
|
|
C. |
Additional details (cont.)
|
|
Ratio
|
Required value Series B
|
Required value Series C and D
|
Actual value
|
||||
|
Net financial debt (1) to adjusted EBITDA (2)
|
Will not exceed 13 (for distribution purposes - 11)
|
Will not exceed 13 (for distribution purposes - 11)
|
5.3
|
||||
|
The Company shareholders’ equity (separate)
|
Will not fall below NIS 250 million (for distribution purposes - NIS 350 million)
|
With respect to Debentures (Series C): will not fall below NIS 1 billion (for distribution purposes - NIS 1.4 billion)
With respect to Debentures (Series D): will not fall below NIS 2 billion (for distribution purposes - NIS 2.4 billion)
|
Approx. NIS 4,752 million
|
||||
|
The Company’s equity to asset ratio (separate)
|
Will not fall below 17% (for distribution purposes: 27%)
|
Will not fall below 20% (for distribution purposes - 30%)
|
71%
|
||||
|
The Company’s equity to asset ratio (consolidated)
|
--
|
Will not fall below 17%
|
53%
|
|
|
(1) |
The consolidated net financial debt less the financial debt designated for construction of the projects that have not yet started to generate EBITDA.
|
|
|
(2) |
Adjusted EBITDA as defined in the deed of trust.
|
|
|
A. |
Post-employment benefit plans – defined contribution plan
|
|
|
B. |
Equity compensation plan in Israel
|
|
Tranche No.
|
Vesting terms and conditions
|
Expiration date
|
|
Tranche One
|
At the end of 12 months from the grant date
|
At the end of 36 months from the vesting date
|
|
Tranche Two
|
At the end of 24 months from the grant date
|
At the end of 24 months from the vesting date
|
|
Tranche Three
|
At the end of 36 months from the grant date
|
At the end of 24 months from the vesting date
|
|
Tranche Four
|
At the end of 48 months from the grant date
|
At the end of 24 months from the vesting date
|
|
|
B. |
Equity compensation plan in Israel (cont.)
|
|
Offerees and allocation dates
|
Number of RSUs at grant date (in thousand)
|
No. of unvested RSUs as of December 31, 2024 (in thousands)
|
Fair value of each RSUs at award date (in NIS)
|
No. of options at the grant date (in thousands)
|
No. of unvested options as of December 31, 2023 (in thousands)
|
No. of unvested options as of December 31, 2024 (in thousands)
|
Average fair value of each option at the grant date (in NIS)
|
Exercise price per option (in NIS, unlinked)
|
Standard deviation (1)
|
Risk-free interest rate (2)
|
|
Officers, June 2018
|
242
|
-
|
18.52
|
1,166
|
23
|
-
|
3.80
|
18.41
|
21.41% - 20.93%
|
0.88% - 1.43%
|
|
Officer, May 2020
|
29
|
-
|
26.8
|
99
|
99
|
50
|
7.76
|
25.81
|
31.48%
|
0.36% - 0.58%
|
|
Chairman of the Board, January 2021
|
-
|
N/A
|
N/A
|
367
|
367
|
367
|
13.07
|
32.78
|
38.80%
|
0.20% - 0.40%
|
|
CEO, April 2021
|
-
|
N/A
|
N/A
|
1,253
|
1,253
|
1,253
|
9.54
|
34.46
|
34.97%
|
0.35% - 0.59%
|
|
Officers, August 2021
|
-
|
N/A
|
N/A
|
663
|
331
|
-
|
8.23
|
30.24
|
34.59%
|
0.24% - 0.55%
|
|
Officer, January 2022
|
27
|
13
|
33.4
|
272
|
272
|
272
|
9.91
|
33.21
|
33.55% - 33.67%
|
0.47% - 0.75%
|
|
Executives, May 2022
|
-
|
N/A
|
N/A
|
1,649
|
1,453
|
1,177
|
10.42
|
36.60
|
33.11% - 33.53%
|
1.84% - 2.05%
|
|
Officer, September 2022
|
-
|
N/A
|
N/A
|
254
|
254
|
254
|
15.70
|
39.86
|
33.24% - 34.24%
|
2.93% - 2.94%
|
|
Executives, March 2024
|
-
|
N/A
|
N/A
|
497
|
N/A
|
497
|
9.77
|
25.19
|
33.85% - 35.79%
|
3.81% - 3.91%
|
|
Chairman of the Board, November 2024
|
-
|
N/A
|
N/A
|
204
|
N/A
|
204
|
10.21
|
30.78
|
30.33% - 35.75%
|
4.13% - 4.19%
|
|
|
(1) |
The standard deviation is calculated based on historical volatility of the Company’s share over the expected life of the option until exercise date.
|
|
|
(2) |
The rate of the risk-free interest is based on the Fair Spread database and an expected life of 4 to 6 years.
|
|
|
B. |
Equity compensation plan in Israel (cont.)
|
|
|
(1) |
Exercise of options and issuance of shares
|
|
|
A. |
Exercise of options - In the years ended December 31, 2024, 2023, and 2022, following the vesting of the RSUs, the Company issued approx. 14 thousand, approx. 14 thousand, and approx. 55 thousand ordinary shares of the Company of
NIS 0.01 par value, respectively. The weighted average price per share on the exercise dates of the options was NIS 18.84, NIS 24.42, and NIS 39.67, respectively.
|
|
|
B. |
Issuance of shares - in the years ended December 31, 2024, 2023 and 2022, the Company issued approx. 12 thousand, approx. 8 thousand, and approx. 161 thousand ordinary shares of the Company of NIS 0.01 par value, respectively,
following notices regarding the exercise of approx. 72 thousand, approx. 23 thousand and approx. 272 thousand options, respectively.
|
|
|
(2) |
Expiry of options
|
|
|
(3) |
Allotments
|
|
|
(4) |
Expenses recognized
|
|
|
C. |
Profit-sharing plan for CPV Group employees
|
|
|
C. |
Profit-sharing plan for CPV Group employees (cont.)
|
|
|
A. |
Information about the tax environment in which the Group operates
|
|
|
1. |
Corporate tax rate
|
|
|
• |
Bonus depreciation - accelerated depreciation at a rate of up to 100%. As from 2023, the accelerated depreciation rate is up to 80% (in 2024 - 60%); this rate will decline by 20% every year, unless the tax benefit will be extended. It
is noted that also in the project acquisition procedure, this depreciation may be recognized on the acquisition date.
|
|
|
• |
Investment Tax Credit (hereinafter - ”ITC”) - A tax credit of up to 30% of the amount invested in solar assets, and another credit equal to up to 10% of the construction costs of projects that integrate equipment manufactured in the
USA or constructed at certain sites (”Brownfield Sites”).
|
|
|
A. |
Information about the tax environment in which the Group operates (cont.)
|
|
|
1. |
Corporate tax rate (cont.)
|
|
|
• |
Production tax credit (hereinafter - ”PTC”) - A tax credit in respect of income from the sale of electricity generated by renewable energy facilities.
|
|
|
2. |
Benefits under the Law for Encouragement of Industry (Taxes), 1969 (hereinafter – the “Encouragement of Industry Law”)
|
|
|
B. |
Tax assessments
|
|
|
C. |
Components of expenses for income tax
|
|
For the year ended December 31
|
||||||||||||
|
2024
|
2023
|
2022
|
||||||||||
|
NIS million
|
NIS million
|
NIS million
|
||||||||||
|
Current tax expenses - for the current period
|
2
|
11
|
4
|
|||||||||
|
Current tax expenses - restructuring in the US Renewable Energies Segment prior to the investment transaction (see Note 23E)
|
53
|
-
|
-
|
|||||||||
|
Deferred tax expenses
|
83
|
57
|
61
|
|||||||||
|
Expenses for income tax
|
138
|
68
|
65
|
|||||||||
|
|
D. |
Adjustments between theoretical tax on income before taxes and tax expenses:
|
|
For the year ended December 31
|
||||||||||||
|
2024
|
2023
|
2022
|
||||||||||
|
NIS million
|
NIS million
|
NIS million
|
||||||||||
|
Profit before taxes on income
|
335
|
237
|
282
|
|||||||||
|
Statutory tax rate of the Company
|
23
|
%
|
23
|
%
|
23
|
%
|
||||||
|
Tax calculated at the statutory tax rate of the Company
|
77
|
55
|
65
|
|||||||||
|
Additional tax (savings) for:
|
||||||||||||
|
Non‑controlling interests’ share in losses of tax transparent entities (1)
|
(22
|
)
|
-
|
(4
|
)
|
|||||||
|
Temporary differences and losses for tax purposes for which deferred taxes were not created (2)
|
20
|
2
|
1
|
|||||||||
|
Effect of the creation of deferred taxes at a tax rate that is different from the main tax rate
|
12
|
2
|
5
|
|||||||||
|
Effect of restructuring and loss of control in the US Renewable Energies Segment (3)
|
40
|
-
|
-
|
|||||||||
|
Other
|
11
|
9
|
(2
|
)
|
||||||||
|
Expenses for income tax
|
138
|
68
|
65
|
|||||||||
|
|
(1) |
Includes the share of non-controlling interests in profit from loss of control in the US Renewable Energies segment.
|
|
|
(2) |
Including mainly effects due to losses from impairment in Gnrgy and Hadera 2 as detailed in Notes 11C and 10B3, respectively.
|
|
|
(3) |
For details, see Note 23E.
|
|
|
E. |
Deferred tax assets and liabilities
|
|
|
(1) |
Deferred tax assets and liabilities recognized in the books of accounts
|
|
Balance of deferred tax asset (liability)
|
As of Decem-ber 31, 2023
|
Carried to income and loss
|
Carried to other com-prehensive income
|
Effect of changes in exchange rates
|
Decon-solidation
|
As of December 31, 2024
|
||||||||||||||||||
|
NIS million
|
||||||||||||||||||||||||
|
Property, plant, and equipment and intangible assets
|
(590
|
)
|
(125
|
)
|
-
|
(2
|
)
|
58
|
(659
|
)
|
||||||||||||||
|
Carryforward losses and deductions for tax purposes
|
437
|
114
|
-
|
1
|
-
|
552
|
||||||||||||||||||
|
Investments in transparent companies
|
(320
|
)
|
(63
|
)
|
(10
|
)
|
-
|
(52
|
)
|
(445
|
)
|
|||||||||||||
|
Other
|
32
|
(9
|
)
|
3
|
-
|
(7
|
)
|
19
|
||||||||||||||||
|
(441
|
)
|
(83
|
)
|
(7
|
)
|
(1
|
)
|
(1
|
)
|
(533
|
)
|
|||||||||||||
|
|
E. |
Deferred tax assets and liabilities (cont.)
|
|
|
(1) |
Deferred tax assets and liabilities recognized in the books of accounts (cont.)
|
|
Balance of deferred tax asset (liability)
|
As of December 31, 2022
|
Commence-ment of con-solidation
|
Carried to income and loss
|
Carried to other comprehen-sive income
|
Effect of changes in exchange rates
|
As of De-cember 31, 2023
|
||||||||||||||||||
|
NIS million
|
||||||||||||||||||||||||
|
Property, plant, and equipment and intangible assets
|
(490
|
)
|
(69
|
)
|
(31
|
)
|
-
|
-
|
(590
|
)
|
||||||||||||||
|
Carryforward losses and deductions for tax purposes
|
408
|
-
|
22
|
-
|
7
|
437
|
||||||||||||||||||
|
Investments in transparent companies
|
(280
|
)
|
-
|
(53
|
)
|
21
|
(8
|
)
|
(320
|
)
|
||||||||||||||
|
Other
|
37
|
-
|
5
|
(9
|
)
|
(1
|
)
|
32
|
||||||||||||||||
|
(325
|
)
|
(69
|
)
|
(57
|
)
|
12
|
(2
|
)
|
(441
|
)
|
||||||||||||||
|
|
(2) |
Deferred taxes are recognized in the statement of financial position as follows:
|
|
As of December 31
|
||||||||
|
2024
|
2023
|
|||||||
|
NIS million
|
NIS million
|
|||||||
|
Under non-current assets (presented under the ‘other long-term receivables’ line item)
|
10
|
57
|
||||||
|
Under non-current liabilities
|
(543
|
)
|
(498
|
)
|
||||
|
Deferred tax assets, net
|
(533
|
)
|
(441
|
)
|
||||
|
|
(3) |
Loss carryforwards for tax purposes:
|
|
|
A. |
The Company - As of December 31, 2024, the Company has loss carryforwards of approx. NIS 150 million. The Company did not recognize a deferred tax asset for carryforward capital losses, since it
does not expect that there will be a taxable income against which the tax benefits can be utilized.
|
|
|
B. |
Israel (through OPC Israel and subsidiaries) - as of December 31, 2024, the Group's companies in Israel have loss carryforwards totaling approx. NIS 775 million, for which deferred taxes were
recorded.
|
|
|
C. |
USA (through ICG Energy) - In the USA, as of December 31, 2024, ICG Energy has loss carryforwards totaling approx. NIS 1,912 million (approx. USD 525 million) at the federal level. Out of the
said losses, no deferred tax assets were recognized with respect to a total of approx. NIS 324 million (approx. USD 89 million), since these losses are subject to compliance with the terms and conditions of the law, some of which are
beyond ICG Energy’s control; these losses will expire in 2032-2037. Furthermore, ICG Energy has losses at state-level amounting to approx. NIS 600 million, in respect of which deferred tax assets were recognized.
|
|
|
A. |
Composition
|
|
As of December 31, 2024
|
As of December 31, 2023
|
|||||||||||||||
|
No. of shares
|
Authorized
|
Issued and paid up
|
Authorized
|
Issued and paid up
|
||||||||||||
|
Ordinary shares of NIS 0.01 par value
|
500,000,000
|
255,713,977
|
500,000,000
|
224,437,761
|
||||||||||||
|
|
B. |
Share issuances
|
|
Transaction date
|
Transaction type
|
Scope of the transaction
|
Transaction consideration (in NIS million)
|
Issuance costs (in NIS million)
|
||||
|
July 2022 (1)
|
Shares issuance
|
9,443,800 shares
|
330.5
|
9
|
||||
|
September 2022 (2)
|
Shares issuance
|
12,500,000 shares
|
500
|
6
|
||||
|
July 2024 (3)
|
Shares issuance
|
31,250,000 shares
|
800
|
20
|
|
|
(1) |
It is noted that the Parent Company submitted bids for the tender and was issued 3,898,000 ordinary shares of the Company as part of the issuance.
|
|
|
(2) |
An issuance for qualified investors, including Migdal Insurance and Financial Holdings Ltd., The Phoenix Insurance Company Ltd. (including entities under their management), and entities managed by Altshuler Shaham Ltd. (each of which
were interested parties in the Company on the share issuance date).
|
|
|
(3) |
It is noted that the Parent Company submitted bids for the tender and was issued 16,707,400 ordinary shares of the Company as part of the issuance.
|
|
|
C. |
Dividend
|
|
|
C. |
Dividend (cont.)
|
|
|
A. |
Revenues
|
|
For the year ended December 31
|
||||||||||||
|
2024
|
2023
|
2022
|
||||||||||
|
NIS million
|
NIS million
|
NIS million
|
||||||||||
|
Revenues from sale of electricity in Israel:
|
||||||||||||
|
Revenues from the sale of energy to private customers
|
1,368
|
1,424
|
1,212
|
|||||||||
|
Revenues from energy sales to the System Operator and other suppliers
|
165
|
120
|
55
|
|||||||||
|
Income for capacity services
|
171
|
59
|
-
|
|||||||||
|
Revenues from the sale of energy to the System Operator, at cogeneration tariff
|
83
|
82
|
52
|
|||||||||
|
Revenues from sale of steam in Israel
|
57
|
59
|
62
|
|||||||||
|
Other income in Israel
|
23
|
59
|
39
|
|||||||||
|
Total income from sale of energy and others in Israel (excluding infrastructure services)
|
1,867
|
1,803
|
1,420
|
|||||||||
|
Revenues from private customers for infrastructure services
|
445
|
480
|
315
|
|||||||||
|
Total income in Israel
|
2,312
|
2,283
|
1,735
|
|||||||||
|
Revenues from sale of electricity from renewable energy (1)
|
195
|
136
|
87
|
|||||||||
|
Revenues from sale of retail electricity and other
|
272
|
133
|
105
|
|||||||||
|
Total income in the USA
|
467
|
269
|
192
|
|||||||||
|
Total income
|
2,779
|
2,552
|
1,927
|
|||||||||
|
|
(1) |
As from November 2024, the results of the US Renewable Energies Segment are presented under the ‘share in profits of associates’ line item. For further details – see Note 23E.
|
|
|
A. |
Revenues (cont.)
|
|
For the year ended December 31
|
||||||||||||||||||||||||
|
Customer
|
2024
|
2023
|
2022
|
|||||||||||||||||||||
|
Total income
|
% of the Company’s income
|
Total income
|
% of the Company’s income
|
Total income
|
% of the Company’s income
|
|||||||||||||||||||
|
Customer 1
|
370
|
13.3
|
%
|
262
|
10.3
|
%
|
-
|
-
|
||||||||||||||||
|
Customer 2
|
368
|
13.2
|
%
|
369
|
14.4
|
%
|
360
|
18.7
|
%
|
|||||||||||||||
|
Customer 3 (1)
|
-
|
-
|
291
|
11.4
|
%
|
247
|
12.8
|
%
|
||||||||||||||||
|
|
(1) |
Bazan Ltd. (hereinafter - the “Bazan Group”), which was a related party through the end of 2022. For further details – see Note 22 below.
|
|
|
B. |
Cost of sales (less depreciation and amortization)
|
|
For the year ended December 31
|
||||||||||||
|
2024
|
2023
|
2022
|
||||||||||
|
NIS million
|
NIS million
|
NIS million
|
||||||||||
|
Cost of sales in Israel:
|
||||||||||||
|
Natural gas and diesel fuel (1)
|
645
|
663
|
526
|
|||||||||
|
Energy acquisition expenses
|
320
|
303
|
295
|
|||||||||
|
Gas transmission costs
|
55
|
41
|
32
|
|||||||||
|
Salaries and related expenses
|
46
|
37
|
32
|
|||||||||
|
Operating expenses
|
120
|
87
|
54
|
|||||||||
|
Other expenses
|
18
|
65
|
40
|
|||||||||
|
Total cost of sales in Israel (excluding the cost of infrastructure services)
|
1,204
|
1,196
|
979
|
|||||||||
|
Infrastructure services expenses
|
445
|
480
|
315
|
|||||||||
|
Total cost of sales in Israel
|
1,649
|
1,676
|
1,294
|
|||||||||
|
Cost of sales and provision of services in the USA:
|
||||||||||||
|
Cost of sales in respect of income from the sale of electricity from renewable energy (2)
|
60
|
49
|
30
|
|||||||||
|
Cost of sales with respect of the sale of electricity (retail) and other
|
222
|
102
|
80
|
|||||||||
|
Total cost of sales in the USA
|
282
|
151
|
110
|
|||||||||
|
Total cost of sales
|
1,931
|
1,827
|
1,404
|
|||||||||
|
|
(1) |
After deducting third-party participation costs.
|
|
|
(2) |
As from November 2024, the results of the US Renewable Energies Segment are presented under the ‘share in profits of associates’ line item. For further details – see Note 23E.
|
|
|
C. |
General and administrative expenses
|
|
For the year ended December 31
|
||||||||||||
|
2024
|
2023
|
2022
|
||||||||||
|
NIS million
|
NIS million
|
NIS million
|
||||||||||
|
General and administrative expenses at headquarters and in Israel:
|
||||||||||||
|
Salaries and related expenses
|
37
|
51
|
50
|
|||||||||
|
Directors’ fees
|
5
|
4
|
5
|
|||||||||
|
Professional services
|
11
|
10
|
12
|
|||||||||
|
Depreciation
|
10
|
9
|
5
|
|||||||||
|
Office maintenance
|
10
|
8
|
4
|
|||||||||
|
Other
|
8
|
10
|
8
|
|||||||||
|
Total general and administrative expenses at headquarters and in Israel
|
81
|
92
|
84
|
|||||||||
|
General and administrative expenses in the U.S.:
|
||||||||||||
|
Salaries and related expenses
|
71
|
49
|
40
|
|||||||||
|
Professional services
|
30
|
38
|
25
|
|||||||||
|
Depreciation
|
6
|
6
|
5
|
|||||||||
|
Office maintenance
|
17
|
16
|
11
|
|||||||||
|
Other
|
23
|
18
|
12
|
|||||||||
|
Total general and administrative expenses in the U.S.
|
147
|
127
|
93
|
|||||||||
|
228
|
219
|
177
|
||||||||||
|
Share-based payment expenses (income) (*)
|
35
|
(7
|
)
|
62
|
||||||||
|
Total general and administrative expenses
|
263
|
212
|
239
|
|||||||||
|
|
D. |
Business development expenses
|
|
For the year ended December 31
|
||||||||||||
|
2024
|
2023
|
2022
|
||||||||||
|
NIS million
|
NIS million
|
NIS million
|
||||||||||
|
Business development in Israel
|
11
|
19
|
12
|
|||||||||
|
Business development in the USA (mainly in renewable energies)
|
34
|
39
|
38
|
|||||||||
|
45
|
58
|
50
|
||||||||||
|
|
E. |
Other expenses, net
|
|
For the year ended December 31
|
||||||||||||
|
2024
|
2023
|
2022
|
||||||||||
|
NIS million
|
NIS million
|
NIS million
|
||||||||||
|
Impairment of Hadera 2 (see Note 10B4)
|
31
|
-
|
-
|
|||||||||
|
Impairment of Gnrgy’s goodwill (see Note 11C)
|
19
|
23
|
-
|
|||||||||
|
Other
|
6
|
(7
|
)
|
-
|
||||||||
|
56
|
16
|
-
|
||||||||||
|
|
F. |
Finance income and expenses
|
|
For the year ended December 31
|
||||||||||||
|
2024
|
2023
|
2022
|
||||||||||
|
NIS million
|
NIS million
|
NIS million
|
||||||||||
|
Finance income
|
||||||||||||
|
Exchange rate differences from revaluation of intra-group loans (1)
|
-
|
-
|
79
|
|||||||||
|
Exchange rate differences
|
39
|
3
|
17
|
|||||||||
|
Interest income from deposits with banks
|
35
|
35
|
9
|
|||||||||
|
Interest income from loan to an associate
|
8
|
4
|
-
|
|||||||||
|
Other finance income
|
5
|
1
|
1
|
|||||||||
|
87
|
43
|
106
|
||||||||||
|
Finance expenses
|
||||||||||||
|
Interest expenses for debentures
|
89
|
80
|
97
|
|||||||||
|
Interest expenses for loans from banks and financial institutions
|
203
|
170
|
83
|
|||||||||
|
Interest expense for loans from non‑controlling interests
|
34
|
26
|
23
|
|||||||||
|
Interest expenses in respect of deferred consideration paid as part of the acquisition of Gat (2)
|
-
|
14
|
-
|
|||||||||
|
Interest expenses in respect of tax equity partner in the US
|
18
|
-
|
-
|
|||||||||
|
Fees and commissions and others
|
22
|
30
|
6
|
|||||||||
|
Capitalization of borrowing costs for assets under construction
|
(27
|
)
|
(80
|
)
|
(56
|
)
|
||||||
|
339
|
240
|
153
|
||||||||||
|
Loss from extinguishment of financial liabilities, net (3)
|
49
|
-
|
-
|
|||||||||
|
Finance expenses, net, recognized in the income statement (4)
|
301
|
197
|
47
|
|||||||||
|
|
(1) |
In respect of provision of NIS-denominated loans to a wholly-owned subsidiary which is a foreign operation and whose functional currency is the USD. In the fourth quarter of 2022, in view of a change in the Company’s assessments
regarding the likelihood of repayment of the said loans in the foreseeable future, they were classified as part of the net investment in the foreign operation.
|
|
|
(2) |
For further details – see Note 23F1.
|
|
|
(3) |
For further details regarding early repayment of the Zomet and Gat financing agreements, see Note 14B1.
|
|
|
(4) |
Including linkage differences in respect of CPI-linked debentures and loans totaling approx. NIS 36 million (in 2023 - approx. NIS 37 million and in 2022 - approx. NIS 56 million).
|
|
For the year ended December 31
|
||||||||||||
|
2024
|
2023
|
2022
|
||||||||||
|
Profit for the year attributable to shareholders of the Company (in NIS million)
|
111
|
144
|
167
|
|||||||||
|
Weighted average number of shares used for the basic and diluted calculation
|
238,758
|
224,461
|
210,289
|
|||||||||
|
Basic and diluted earnings per share (in NIS)
|
0.46
|
0.63
|
0.79
|
|||||||||
|
|
A. |
Financial risk management
|
|
|
1. |
General
|
|
|
2. |
Credit risk
|
|
|
A. |
Financial risk management (cont.)
|
|
|
3. |
Liquidity risk
|
|
|
4. |
Market risks
|
|
|
5. |
Currency risk
|
|
|
A. |
Financial risk management (cont.)
|
|
|
5. |
Currency risk (cont.)
|
|
|
6. |
CPI risk
|
|
|
7. |
Interest rate risk
|
|
|
8. |
Other market price risks - electricity margins and prices
|
|
|
B. |
Financial instruments
|
|
|
1. |
Credit risk
|
|
As of December 31
|
||||||||
|
2024
|
2023
|
|||||||
|
NIS million
|
NIS million
|
|||||||
|
Trade receivables in Israel
|
239
|
203
|
||||||
|
Trade receivables in the USA
|
54
|
44
|
||||||
|
293
|
247
|
|||||||
|
|
B. |
Financial instruments (cont.)
|
|
|
2. |
Liquidity risk
|
|
As of December 31, 2024
|
||||||||||||||||||||||||
|
Carrying amount
|
Contractual amount
|
12 months or less
|
One to two years
|
2-5 years (1)
|
More than 5 years
|
|||||||||||||||||||
|
NIS million
|
||||||||||||||||||||||||
|
Non-derivative financial liabilities
|
||||||||||||||||||||||||
|
Trade payables
|
213
|
213
|
213
|
-
|
-
|
-
|
||||||||||||||||||
|
Payables and credit balances
|
7
|
7
|
7
|
-
|
-
|
-
|
||||||||||||||||||
|
Debt from non‑controlling interests (including interest payable)
|
515
|
633
|
17
|
4
|
576
|
36
|
||||||||||||||||||
|
Debentures (including interest payable)
|
1,891
|
2,116
|
267
|
305
|
1,124
|
420
|
||||||||||||||||||
|
Lease liability (including interest payable)
|
45
|
57
|
16
|
10
|
21
|
10
|
||||||||||||||||||
|
Loans from banking corporations and financial institutions (including
interest payable)
|
2,234
|
3,070
|
209
|
219
|
623
|
2,019
|
||||||||||||||||||
|
Total financial liabilities
|
4,905
|
6,096
|
729
|
538
|
2,344
|
2,485
|
||||||||||||||||||
|
As of December 31, 2023
|
||||||||||||||||||||||||
|
Carrying amount
|
Contractual amount
|
12 months or less
|
One to two years
|
2-5 years
|
More than 5 years
|
|||||||||||||||||||
|
NIS million
|
||||||||||||||||||||||||
|
Non-derivative financial liabilities
|
||||||||||||||||||||||||
|
Trade payables
|
257
|
257
|
257
|
-
|
-
|
-
|
||||||||||||||||||
|
Payables and credit balances
|
289
|
289
|
289
|
-
|
-
|
-
|
||||||||||||||||||
|
Debt from non‑controlling interests (including interest payable)
|
454
|
580
|
34
|
8
|
50
|
488
|
||||||||||||||||||
|
Debentures (including interest payable)
|
1,853
|
2,029
|
238
|
250
|
1,136
|
405
|
||||||||||||||||||
|
Lease liability (including interest payable)
|
222
|
507
|
17
|
18
|
46
|
426
|
||||||||||||||||||
|
Loans from banking corporations and financial institutions (including
interest payable)
|
3,259
|
4,195
|
595
|
355
|
1,312
|
1,933
|
||||||||||||||||||
|
Financial liabilities - derivative instruments
|
||||||||||||||||||||||||
|
Long-term derivative financial instruments
|
55
|
55
|
6
|
6
|
17
|
26
|
||||||||||||||||||
|
Total financial liabilities
|
6,389
|
7,912
|
1,436
|
637
|
2,561
|
3,278
|
||||||||||||||||||
|
|
(1) |
In 2028, including a total of approx. NIS 627 million and a total of approx. NIS 559 million for debentures and debt from non‑controlling interests, respectively.
|
|
|
B. |
Financial instruments (cont.)
|
|
|
3. |
Market risk
|
|
NIS
|
Foreign currency
|
|||||||||||||||||||
|
CPI-linked
|
Non-linked
|
USD (*)
|
Other
|
Total
|
||||||||||||||||
|
NIS million
|
||||||||||||||||||||
|
December 31, 2024
|
||||||||||||||||||||
|
Assets
|
||||||||||||||||||||
|
Cash and cash equivalents
|
-
|
232
|
728
|
2
|
962
|
|||||||||||||||
|
Restricted deposits and cash
|
-
|
60
|
-
|
-
|
60
|
|||||||||||||||
|
Trade and other receivables
|
-
|
237
|
186
|
-
|
423
|
|||||||||||||||
|
Total financial assets
|
-
|
529
|
914
|
2
|
1,445
|
|||||||||||||||
|
Liabilities
|
||||||||||||||||||||
|
Trade payables
|
-
|
(91
|
)
|
(122
|
)
|
-
|
(213
|
)
|
||||||||||||
|
Payables and credit balances
|
-
|
(6
|
)
|
(1
|
)
|
-
|
(7
|
)
|
||||||||||||
|
Debentures
|
(922
|
)
|
(969
|
)
|
-
|
-
|
(1,891
|
)
|
||||||||||||
|
Lease liabilities
|
(14
|
)
|
(6
|
)
|
(25
|
)
|
-
|
(45
|
)
|
|||||||||||
|
Debt from non‑controlling interests
|
(13
|
)
|
(49
|
)
|
(453
|
)
|
-
|
(515
|
)
|
|||||||||||
|
Loans from banking corporations and financial institutions
|
(405
|
)
|
(1,829
|
)
|
-
|
-
|
(2,234
|
)
|
||||||||||||
|
Total financial liabilities
|
(1,354
|
)
|
(2,950
|
)
|
(601
|
)
|
-
|
(4,905
|
)
|
|||||||||||
|
Total financial instruments
|
(1,354
|
)
|
(2,421
|
)
|
313
|
2
|
(3,460
|
)
|
||||||||||||
|
NIS
|
Foreign currency
|
|||||||||||||||||||
|
CPI-linked
|
Non-linked
|
USD (*)
|
Other
|
Total
|
||||||||||||||||
|
NIS million
|
||||||||||||||||||||
|
December 31, 2023
|
||||||||||||||||||||
|
Assets
|
||||||||||||||||||||
|
Cash and cash equivalents
|
-
|
329
|
672
|
6
|
1,007
|
|||||||||||||||
|
Restricted deposits and cash
|
-
|
55
|
6
|
-
|
61
|
|||||||||||||||
|
Trade and other receivables
|
-
|
242
|
443
|
-
|
685
|
|||||||||||||||
|
Total financial assets
|
-
|
626
|
1,121
|
6
|
1,753
|
|||||||||||||||
|
Liabilities
|
||||||||||||||||||||
|
Trade payables
|
-
|
(103
|
)
|
(148
|
)
|
(6
|
)
|
(257
|
)
|
|||||||||||
|
Payables and credit balances
|
-
|
(18
|
)
|
(271
|
)
|
-
|
(289
|
)
|
||||||||||||
|
Debentures
|
(1,001
|
)
|
(852
|
)
|
-
|
-
|
(1,853
|
)
|
||||||||||||
|
Lease liabilities
|
(17
|
)
|
(9
|
)
|
(196
|
)
|
-
|
(222
|
)
|
|||||||||||
|
Debt from non‑controlling interests
|
(60
|
)
|
(26
|
)
|
(368
|
)
|
-
|
(454
|
)
|
|||||||||||
|
Loans from banking corporations and financial institutions
|
(440
|
)
|
(1,949
|
)
|
(870
|
)
|
-
|
(3,259
|
)
|
|||||||||||
|
Total financial liabilities
|
(1,518
|
)
|
(2,957
|
)
|
(1,853
|
)
|
(6
|
)
|
(6,334
|
)
|
||||||||||
|
Total financial instruments
|
(1,518
|
)
|
(2,331
|
)
|
(732
|
)
|
-
|
(4,581
|
)
|
|||||||||||
|
|
B. |
Financial instruments (cont.)
|
|
|
3. |
Market risk (cont.)
|
|
As of December 31, 2024
|
||||||||||||||||||||
|
Linkage receivable
|
Interest payable
|
Expiration date
|
Amount of the linked principal
|
Fair value
|
||||||||||||||||
|
NIS million
|
||||||||||||||||||||
|
CPI swap contracts
|
Index
|
1.76
|
%
|
2036
|
272
|
43
|
||||||||||||||
|
|
||||||||||||||||||||
|
As of December 31, 2023
|
||||||||||||||||||||
|
Linkage receivable
|
Interest payable
|
Expiration date
|
Amount of the linked principal
|
Fair value
|
||||||||||||||||
|
NIS million
|
||||||||||||||||||||
|
CPI swap contracts
|
Index
|
1.76
|
%
|
2036
|
294
|
37
|
||||||||||||||
|
As of December 31, 2024
|
||||||||||||||||
|
Effect on total comprehensive income (loss) and capital
|
||||||||||||||||
|
10% decrease
|
5% decrease
|
5% increase
|
10% increase
|
|||||||||||||
|
NIS million
|
NIS million
|
NIS million
|
NIS million
|
|||||||||||||
|
Non-derivative instruments USD/NIS
|
||||||||||||||||
|
USA (mainly CPV Group) (*)
|
(27
|
)
|
(13
|
)
|
13
|
27
|
||||||||||
|
Israel
|
4
|
2
|
(2
|
)
|
(4
|
)
|
||||||||||
|
(23
|
)
|
(11
|
)
|
11
|
23
|
|||||||||||
|
|
B. |
Financial instruments (cont.)
|
|
|
3. |
Market risk (cont.)
|
|
As of December 31, 2023
|
||||||||||||||||
|
Effect on total comprehensive income (loss) and capital
|
||||||||||||||||
|
10% decrease
|
5% decrease
|
5% increase
|
10% increase
|
|||||||||||||
|
NIS million
|
NIS million
|
NIS million
|
NIS million
|
|||||||||||||
|
Non-derivative instruments USD/NIS
|
||||||||||||||||
|
USA (mainly CPV Group) (*)
|
58
|
29
|
(29
|
)
|
(58
|
)
|
||||||||||
|
Israel
|
(4
|
)
|
(2
|
)
|
2
|
4
|
||||||||||
|
54
|
27
|
(27
|
)
|
(54
|
)
|
|||||||||||
|
Derivative instruments - USD/NIS
|
||||||||||||||||
|
USA (mainly CPV Group) (*)
|
3
|
1
|
(1
|
)
|
(3
|
)
|
||||||||||
|
Israel
|
(9
|
)
|
(4
|
)
|
4
|
9
|
||||||||||
|
(6
|
)
|
(3
|
)
|
3
|
6
|
|||||||||||
|
|
(*) |
Changes in the exchange rate of the USD in connection with the USA activity will be carried to other comprehensive income (loss).
|
|
As of December 31, 2024
|
||||||||||||||||
|
Effect on total comprehensive income (loss) and capital
|
||||||||||||||||
|
2% decrease
|
1% decrease
|
1% increase
|
2% increase
|
|||||||||||||
|
NIS million
|
||||||||||||||||
|
Long-term loans (CPI)
|
6
|
3
|
(3
|
)
|
(6
|
)
|
||||||||||
|
Debentures (CPI)
|
18
|
9
|
(9
|
)
|
(18
|
)
|
||||||||||
|
CPI swap contracts
|
(4
|
)
|
(2
|
)
|
2
|
4
|
||||||||||
|
As of December 31, 2023
|
||||||||||||||||
|
Effect on total comprehensive income (loss) and capital
|
||||||||||||||||
|
2% decrease
|
1% decrease
|
1% increase
|
2% increase
|
|||||||||||||
|
NIS million
|
||||||||||||||||
|
Long-term loans (CPI)
|
7
|
3
|
(3
|
)
|
(7
|
)
|
||||||||||
|
Debentures (CPI)
|
20
|
10
|
(10
|
)
|
(20
|
)
|
||||||||||
|
CPI swap contracts
|
(4
|
)
|
(2
|
)
|
2
|
4
|
||||||||||
|
|
B. |
Financial instruments (cont.)
|
|
|
3. |
Market risk (cont.)
|
|
Fixed interest instruments linked to the CPI:
|
||||||||
|
As of December 31
|
||||||||
|
2024
|
2023
|
|||||||
|
NIS million
|
NIS million
|
|||||||
|
Financial liabilities (*)
|
1,334
|
1,493
|
||||||
|
(1,334
|
)
|
(1,493
|
)
|
|||||
|
Fixed interest instruments not linked to the CPI:
|
|
As of December 31
|
||||||||
|
2024
|
2023
|
|||||||
|
NIS million
|
NIS million
|
|||||||
|
Financial assets
|
762
|
349
|
||||||
|
Financial liabilities
|
1,643
|
1,643
|
||||||
|
(881
|
)
|
(1,294
|
)
|
|||||
|
Variable interest instruments:
|
||||||||
|
As of December 31
|
||||||||
|
2024
|
2023
|
|||||||
|
NIS million
|
NIS million
|
|||||||
|
Financial assets
|
210
|
197
|
||||||
|
Financial liabilities (**)
|
1,645
|
2,413
|
||||||
|
(1,435
|
)
|
(2,216
|
)
|
|||||
|
|
B. |
Financial instruments (cont.)
|
|
|
3. |
Market risk (cont.)
|
|
As of December 31, 2024
|
||||||||||||||||
|
Effect on total comprehensive income (loss) and capital
|
||||||||||||||||
|
2% decrease
|
1% decrease
|
1% increase
|
2% increase
|
|||||||||||||
|
NIS million
|
||||||||||||||||
|
Long-term loans
|
25
|
13
|
(13
|
)
|
(25
|
)
|
||||||||||
|
As of December 31, 2023
|
||||||||||||||||
|
Effect on total comprehensive income (loss) and capital
|
||||||||||||||||
|
2% decrease
|
1% decrease
|
1% increase
|
2% increase
|
|||||||||||||
|
NIS million
|
||||||||||||||||
|
Long-term loans
|
24
|
12
|
(12
|
)
|
(24
|
)
|
||||||||||
|
|
C. |
Fair value
|
|
|
1. |
Financial instruments measured at fair value for disclosure purposes only
|
|
|
C. |
Fair value (cont.)
|
|
|
1. |
Financial instruments measured at fair value for disclosure purposes only (cont.)
|
|
As of December 31, 2024
|
||||||||||||
|
Carrying amount (*)
|
Fair value
|
Discount rate used
|
||||||||||
|
NIS million
|
NIS million
|
to determine the fair value
|
||||||||||
|
Loans from banking corporations and financial institutions (Level 2)
|
2,234
|
2,237
|
5.5%-6.2
|
%
|
||||||||
|
Loans from non‑controlling interests (Level 2)
|
514
|
508
|
5.5%-7.7
|
%
|
||||||||
|
Debentures (Level 1)
|
1,891
|
1,805
|
5.3%-5.9
|
%
|
||||||||
|
4,639
|
4,550
|
|||||||||||
|
As of December 31, 2023
|
||||||||||||
|
Carrying amount (*)
|
Fair value
|
Discount rate used
|
||||||||||
|
NIS million
|
NIS million
|
to determine the fair value
|
||||||||||
|
Loans from banking corporations and financial institutions (Level 2)
|
3,259
|
3,289
|
5.3%-6.8
|
%
|
||||||||
|
Loans from non‑controlling interests (Level 2)
|
454
|
464
|
5.6%-6.8
|
%
|
||||||||
|
Debentures (Level 1)
|
1,853
|
1,760
|
5.3%-6.1
|
%
|
||||||||
|
5,566
|
5,513
|
|||||||||||
|
|
C. |
Fair value (cont.)
|
|
|
2. |
Fair value hierarchy of financial instruments measured at fair value
|
|
As of December 31
|
||||||||
|
2024
|
2023
|
|||||||
|
NIS million
|
NIS million
|
|||||||
|
Financial assets
|
||||||||
|
Derivatives used for hedge accounting
|
||||||||
|
CPI swap contracts (Level 2) (1)
|
44
|
39
|
||||||
|
Interest rate swaps (SOFR) (Level 2) (2)
|
-
|
24
|
||||||
|
44
|
63
|
|||||||
|
Financial liabilities
|
||||||||
|
Derivatives used for hedge accounting
|
||||||||
|
CPI swap contracts (Level 2) (1)
|
(1
|
)
|
(2
|
)
|
||||
|
Interest rate swaps (SOFR) (Level 2) (2)
|
-
|
(9
|
)
|
|||||
|
Electricity price hedge contracts (the renewable energy segment in the USA) (Level 3) (2)
|
-
|
(55
|
)
|
|||||
|
(1
|
)
|
(66
|
)
|
|||||
|
|
(1) |
The nominal NIS-denominated discounted interest rate range in the value calculations is 4.1%-4.5% and the real discounted interest rate range is 0.8%-2.5%.
|
|
|
(2) |
The balances as of December 31, 2023 are in respect of CPV Renewable. For details regarding loss of control, deconsolidation and transition to the equity method in the fourth quarter of 2024 with respect to the investment in CPV
Renewable, see Note 23E.
|
|
|
A. | Compensation and benefits for key management personnel (including directors) |
|
|
A. | Compensation and benefits for key management personnel (including directors) (cont.) |
|
For the year ended December 31
|
||||||||||||||||||||||||
|
2024
|
2023
|
2022
|
||||||||||||||||||||||
|
No. of people
|
NIS million
|
No. of people
|
NIS million
|
No. of people
|
NIS million
|
|||||||||||||||||||
|
Employee benefits
|
6
|
23
|
9
|
23
|
9
|
33
|
||||||||||||||||||
|
Share-based payment
|
6
|
9
|
9
|
4
|
9
|
24
|
||||||||||||||||||
|
32
|
27
|
57
|
||||||||||||||||||||||
|
Compensation and benefits for non-employee directors in the Group:
|
||||||||||||||||||||||||
|
For the year ended December 31
|
||||||||||||||||||||||||
|
2024
|
2023
|
2022
|
||||||||||||||||||||||
|
No. of people
|
NIS million
|
No. of people
|
NIS million
|
No. of people
|
NIS million
|
|||||||||||||||||||
|
Total benefits to non-employee directors in the Group
|
9
|
2
|
10
|
2
|
7
|
2
|
||||||||||||||||||
|
|
1. |
Mr. Giora Almogy is the CEO of the Company and a director of the subsidiaries, from January 1, 2011. According to his employment agreement, which was revised in 2023, the Company’s CEO is entitled to a monthly salary, which is linked
to the CPI (the monthly salary as of December 31, 2024 stood at approx. NIS 209 thousand). Furthermore, the CEO is entitled to social benefits as is generally accepted in the Company, and to related benefits in accordance with the
compensation policy (such as vehicle, reimbursement of expenses, and 13th salary).
|
|
|
A. | Compensation and benefits for key management personnel (including directors) (cont.) |
|
|
2. |
Mr. Yair Caspi has been serving as the Company’s Chairman of the Board since January 3, 2021. On February 17, 2021, the General Meeting of the Company’s shareholders approved his terms of office and employment as Chairman of the Board
from the date of commencement of his term of office and for a period of four years since that date (Mr. Caspi serves as a director in companies related to the Company’s controlling shareholder, and the controlling shareholder in the
Company may be considered as having a vested interest in his compensation). On December 18, 2024, the general meeting of shareholders approved the terms of his tenure for an additional four-year term. According to his employment
agreement, the Chairman of the Board is entitled to a monthly salary, which is linked to the CPI (the monthly salary as of December 31, 2024 stood at approx. NIS 139 thousand). Furthermore, the Chairman of the Board is entitled to social
benefits as is generally accepted in the Company, and to related benefits in accordance with the compensation policy (such as vehicle, reimbursement of expenses, and 13th salary).
|
|
|
B. | Balances with related and interested parties |
|
As of December 31
|
||||||||
|
2024
|
2023
|
|||||||
|
NIS million
|
NIS million
|
|||||||
|
Balances in Israel (including ICG Energy):
|
||||||||
|
Cash and cash equivalents (1)
|
447
|
201
|
||||||
|
Trade receivables (2)
|
4
|
3
|
||||||
|
Other accounts receivable
|
-
|
1
|
||||||
|
Other payables (benefits for key management personnel and directors)
|
(14
|
)
|
(13
|
)
|
||||
|
Loans and credit from banking corporations and financial institutions (1)
|
-
|
(101
|
)
|
|||||
|
Balances in the USA:
|
||||||||
|
Cash and cash equivalents (1)
|
16
|
-
|
||||||
|
Trade receivables (4)
|
15
|
9
|
||||||
|
Other long-term receivables - subordinated loans to an associate (3)
|
117
|
109
|
||||||
|
Debt from non‑controlling interests (5)
|
(196
|
)
|
(157
|
)
|
||||
|
|
C. | Transactions with related parties and interested parties (*) |
|
For the year ended December 31
|
||||||||||||
|
2024
|
2023
|
2022
|
||||||||||
|
NIS million
|
NIS million
|
NIS million
|
||||||||||
|
Transactions in Israel (including ICG Energy):
|
||||||||||||
|
Sales (2)
|
42
|
37
|
252
|
|||||||||
|
Cost of sales (6)
|
-
|
(10
|
)
|
2
|
||||||||
|
General and administrative expenses
|
(2
|
)
|
-
|
-
|
||||||||
|
Other finance income, net (1)
|
17
|
22
|
6
|
|||||||||
|
Transactions in the USA:
|
||||||||||||
|
Revenues from provision of services (4)
|
91
|
80
|
65
|
|||||||||
|
Other finance income (3)
|
8
|
4
|
-
|
|||||||||
|
Other finance expenses (8)
|
(8
|
)
|
-
|
-
|
||||||||
|
Interest expenses in respect of a debt from non‑controlling interests (5)
|
(12
|
)
|
(10
|
)
|
(7
|
)
|
||||||
|
|
1. |
During the ordinary course of business and at fair market value, the Group enters into agreements with Mizrahi Tefahot Bank Group Ltd. for a wide range of banking activities, including management of cash and deposits and short term
credit facilities.
|
|
|
2. |
Mainly includes PPAs:
|
|
|
C. | Transactions with related parties and interested parties (*) |
|
|
2. |
(cont.)
|
|
|
3. |
Subordinated loans advanced to Valley by the CPV Group in April 2021 and June 2023 totaled approx. NIS 107 million. This amount was used by Valley mainly for the purpose of extending its financing agreement in June 2023.
|
|
|
4. |
As part of the asset and energy management operations, CPV Group provides management, initiation and maintenance services to specific associates.
|
|
|
5. |
For the purpose of investing in CPV Group, the Group has engaged in a partnership agreement with OPC Power, as detailed in Note 23A3, inter alia with institutional investors from Migdal Insurance Group, an interested party in the
Company.
|
|
|
6. |
In 2023 and 2022, the Company entered into engagements for the sale and purchase of natural gas surpluses of immaterial scope with ICL Group Ltd.
|
|
|
7. |
The Group also sells electricity to other related parties in Israel, and the transactions with these parties were classified as negligible transactions.
|
|
|
8. |
The Group provides bank guarantees through associates for projects under development in the US.
|
|
|
9. |
From time to time, institutional investors, which are interested parties in the Company, also purchase marketable debentures of the Company.
|
|
|
A. | Material Group subsidiaries |
|
The Group’s ownership
rights in the subsidiary
|
|||||
|
As of December 31
|
|||||
|
Main location of the
Company's operations
|
2024
|
2023
|
|||
|
Company
|
|||||
|
OPC Israel (1)
|
Israel
|
80%
|
80%
|
||
|
OPC Power Plants (2)
|
Israel
|
80%
|
80%
|
||
|
CPV Group PL (hereinafter - “CPV Group”) (3)
|
USA
|
70.46%
|
70%
|
||
|
|
A. | Material Group subsidiaries (cont.) |
|
|
(1) |
OPC Israel
|
| 12 |
In January 2023, on the eve of the transaction’s completion, the Company transferred to OPC Israel, among other things, the shares of OPC Power Plants, the holdings in Rotem 2, the holdings in Gnrgy, as well as other companies and
operations in the area of activity in Israel, such as energy generation facilities on consumers’ premises, virtual electricity supply activity, etc.
|
| 13 |
The shareholders agreement defines OPC Israel’s area of activity, which includes, among other things, electricity generation and supply in Israel, which will be carried out by OPC Israel, subject to the agreed arrangements, in
accordance with the agreement.
|
|
|
A. | Material Group subsidiaries (cont.) |
|
|
(1) |
OPC Israel (cont.)
|
|
|
(2) |
OPC Power Plants
|
|
|
(3) |
The CPV Group
|
|
|
A. | Material Group subsidiaries (cont.) |
|
|
(3) |
The CPV Group (cont.)
|
|
Immediately prior to the report approval date
|
December 31, 2024
|
December 31, 2023
|
||||||||||
|
Total investment undertakings and loan provision (a) (b)
|
1,535
|
1,535
|
1,315
|
|||||||||
|
Utilization (c)
|
(1,480
|
)
|
(1,455
|
)
|
(1,215
|
)
|
||||||
|
Balance of investment undertakings and loan provision
|
55
|
80
|
100
|
|||||||||
|
|
A. |
On December 15, 2024, after the stake in the Maryland and Shore power plants was increased, as described in Note 24C, the total amount of investment commitments and shareholders loans by all partners totals USD 220 million. The
Company's share in the said amount exceeds its proportionate share in the partnership by a total that is immaterial to the Company and accordingly the Company's holding stake as of the report date (through a subsidiary) increased to
approx. 70.46%. (the holding stake, assuming full utilization as of the report date - approx. 70.69%).
|
|
|
B. |
Excluding an additional investment commitment for backing guarantees which were or will be provided for the purpose of development and expansion of projects - each partner based on its pro rata share in the Partnership, as detailed
above, for a total of approx. USD 75 million.
|
|
|
C. |
For the purpose of acquiring all interests in CPV Group and financing additional investments. In the reporting period, the Company and non-controlling interests (both directly and indirectly) made equity investments in the Partnership
and advanced loans totaling approx. USD 156 million (approx. NIS 561 million) and approx. USD 64 million (approx. NIS 230 million), respectively. The loans are denominated in USD and bear an annual interest rate of 7%. The loan principal
will be repayable at any time as will be agreed on between the parties, but no later than January 2028. Accrued interest is payable on a quarterly basis. To the extent the payment made by OPC Power is lower than the amount of the accrued
interest, the payment in respect of the balance will be postponed to the following quarter – but not later than January 2028.
|
|
|
A. | Material Group subsidiaries (cont.) |
|
|
(3) |
The CPV Group (cont.)
|
|
|
(4) |
Gnrgy
|
|
|
B. | Significant restrictions on the transfer of resources between Group entities |
|
|
C. | Non-controlling interests in consolidated companies |
|
|
C. | Non-controlling interests in consolidated companies (cont.) |
|
As of December 31
|
As of December 31
|
|||||||
|
2024
|
2023
|
|||||||
|
NIS million
|
NIS million
|
|||||||
|
Current assets
|
320
|
614
|
||||||
|
Non-current assets
|
5,138
|
5,094
|
||||||
|
Current liabilities
|
383
|
770
|
||||||
|
Non-current liabilities
|
2,877
|
2,808
|
||||||
|
Non-controlling interests
|
439
|
437
|
||||||
|
Total assets, net
|
1,759
|
1,693
|
||||||
|
Information on results:
|
||||||||
|
For the year ended December 31
|
For the year ended December 31
|
|||||||
|
2024
|
2023
|
|||||||
|
NIS million
|
NIS million
|
|||||||
|
Sales
|
2,312
|
2,283
|
||||||
|
Profit for the year
|
76
|
129
|
||||||
|
Total comprehensive income
|
74
|
122
|
||||||
|
Profit attributable to the non-controlling interests
|
13
|
22
|
||||||
|
Cash flow data:
|
||||||||
|
For the year ended December 31
|
For the year ended December 31
|
|||||||
|
2024
|
2023
|
|||||||
|
NIS million
|
NIS million
|
|||||||
|
Cash flows from operating activities
|
631
|
631
|
||||||
|
Cash flows for investing activities
|
(424
|
)
|
(278
|
)
|
||||
|
Cash flows for financing activities
|
(498
|
)
|
(286
|
)
|
||||
|
Total increase in cash and cash equivalents
|
(291
|
)
|
67
|
|||||
|
|
C. | Non-controlling interests in consolidated companies (cont.) |
|
As of December 31
|
||||||||
|
2024
|
2023
|
|||||||
|
NIS million
|
NIS million
|
|||||||
|
Current assets
|
424
|
719
|
||||||
|
Non-current assets
|
5,485
|
5,623
|
||||||
|
Current liabilities
|
87
|
458
|
||||||
|
Non-current liabilities
|
1,658
|
2,692
|
||||||
|
Non-controlling interests
|
1,230
|
957
|
||||||
|
Total assets, net
|
2,934
|
2,235
|
||||||
|
Information on results:
|
||||||||||||
|
For the year ended December 31
|
||||||||||||
|
2024
|
2023
|
2022
|
||||||||||
|
NIS million
|
NIS million
|
NIS million
|
||||||||||
|
Sales
|
467
|
269
|
192
|
|||||||||
|
Profit for the year*
|
239
|
9
|
60
|
|||||||||
|
Total comprehensive income (loss)*
|
290
|
(107
|
)
|
153
|
||||||||
|
Profit attributable to the non-controlling interests*
|
73
|
3
|
18
|
|||||||||
|
(*) The OPC Power partnership does not file tax returns; therefore - its results are presented before the effect of taxes on income.
|
|
Cash flow data:
|
||||||||||||
|
For the year ended December 31
|
||||||||||||
|
2024
|
2023
|
2022
|
||||||||||
|
NIS million
|
NIS million
|
NIS million
|
||||||||||
|
Cash flows from operating activities (used for operating activities)
|
21
|
(72
|
)
|
(54
|
)
|
|||||||
|
Cash flows from investing activities
|
(1,602
|
)
|
(1,295
|
)
|
(403
|
)
|
||||||
|
Cash flows from financing activities
|
1,475
|
1,495
|
488
|
|||||||||
|
Effect of exchange rate fluctuations on cash and cash equivalent balances
|
18
|
(15
|
)
|
28
|
||||||||
|
Total increase (decrease) in cash and cash equivalents
|
(88
|
)
|
113
|
59
|
||||||||
|
|
D. | Loans from non‑controlling interests |
|
As of December 31
|
||||||||
|
2024
|
2023
|
|||||||
|
NIS million
|
NIS million
|
|||||||
|
Loans from non‑controlling interests (1)
|
514
|
454
|
||||||
|
Current maturities
|
(14
|
)
|
(32
|
)
|
||||
|
500
|
422
|
|||||||
|
As of December 31
|
||||||||
|
2024
|
2023
|
|||||||
|
NIS million
|
NIS million
|
|||||||
|
Loan to Rotem (see Section A below)
|
13
|
26
|
||||||
|
Loan to OPC Power Ventures (see Section A3 above)
|
452
|
368
|
||||||
|
Loan to OPC Israel (see Section B below)
|
49
|
60
|
||||||
|
514
|
454
|
|||||||
|
|
A. |
In 2021, the Company and Veridis advanced a loan to Rotem according to their share in its shares, such that the Company advanced a total of approx. NIS 904 million and Veridis advanced a total of approx. NIS 226 million.The loan is not
linked and bears the higher of: annual interest of 2.65% or interest in accordance with Section 3(j) to the Income Tax Ordinance. The loans shall be repaid in quarterly unequal installments in accordance with the free cash flow balance,
and in any case no later than October 2031.
|
|
|
B. |
On December 27, 2023, the Company and Veridis advanced a debt to OPC Israel according to their share in its shares (hereinafter - the “Debt”), such that the Company advanced a total of approx. NIS 240 million and Veridis advanced a
total of approx. NIS 60 million. The debt is CPI-linked and bears annual interest of the higher of: 2.75% or interest in accordance with Section 3(j) to the Income Tax Ordinance. The Debt’s principal and interest shall be repaid according
to an amortization schedule as set in the agreement.
|
|
|
E. | Loss of control over the US Renewable Energies Segment and transition of significant influence |
|
|
1. |
Board of Directors’ composition - the initial composition as of the completion date will include 4 board members (CPV Group and the Investor each appointing 2 directors). The voting power of the directors is based on the holding
rate of the appointing interest holder.
|
|
|
2. |
Generally accepted restrictions on the transfer of rights (including certain restriction periods), subject to agreed conditions and exclusions.
|
|
|
3. |
Actions and resolutions requiring a special majority, which includes the votes of the directors appointed by the Investor - including, among other things, changes in the corporation’s documents, mergers, allocation of securities,
liquidation, future budgets (the agreement includes arrangements regarding budgetary continuity), interested party transactions (including regarding the service agreements), certain engagements and material transactions, etc., all
subject to the applicable conditions, thresholds and definitions as per the agreement. Furthermore, the replacement of the CPV Renewable’ lead business officer shall require the consent of the Investor under certain conditions.
|
|
|
4. |
The activities of CPV Group in the field of renewable energy shall be carried out through CPV Renewable (except under certain circumstances prescribed by the Agreement).
|
| 14 |
Prior to the completion of the Transaction: (1) CPV Renewable changed its status from a Limited Partnership to a Limited Liability Company (LLC); (2) the holdings in CPV Keenan LLC (which is part of CPV Group’s renewable energy
activities) were transferred into CPV Renewable. For further details, see Section 3 below.
|
| 15 |
In accordance with the Agreement, a certain refund was set from CPV Renewable to CPV Group in respect of investments in 2024.
|
|
|
E. |
Loss of control over the US Renewable Energies Segment and transition of significant influence (cont.)
|
|
|
1. |
Following are details of assets and liabilities derecognized on deconsolidation date:
|
|
NIS million
|
||||
|
Cash and cash equivalents
|
245
|
|||
|
Trade and other receivables
|
73
|
|||
|
Restricted deposits and cash
|
9
|
|||
|
Property, plant & equipment
|
2,812
|
|||
|
Right‑of‑use assets and deferred expenses
|
204
|
|||
|
Intangible assets - PPAs and other agreements
|
412
|
|||
|
Intangible assets - goodwill
|
471
|
|||
|
Derivative financial instruments, net
|
(4
|
)
|
||
|
Trade and other payables
|
(168
|
)
|
||
|
Long-term loans from banking corporations and financial institutions
|
(1,154
|
)
|
||
|
Long-term lease liabilities
|
(178
|
)
|
||
|
Loan from ICG Energy
|
(318
|
)
|
||
|
Other long‑term liabilities
|
(461
|
)
|
||
|
Total assets, net derecognized upon deconsolidation
|
1,943
|
|||
| 16 |
The service agreements include provisions in connection with early termination by CPV Renewable under certain circumstances.
|
| 17 |
Includes undertakings regarding skilled lead business officer and development team. A breach of some of the undertakings (as the case may be) may trigger the termination of the services agreements and the appointment of a replacement
officer, and lead to other impacts on CPV Group’s rights as per the Interest Holders’ Agreement.
|
|
|
E. |
Loss of control over the US Renewable Energies Segment and transition of significant influence (cont.)
|
|
|
2. |
Gain on loss of control in the US Renewable Energies Segment
|
|
NIS million
|
||||
|
Fair value
|
2,225
|
|||
|
Net assets attributable to the Group at deconsolidation date (see Section 2 above)
|
(1,943
|
)
|
||
|
Excess fair value
|
282
|
|||
|
Transaction costs carried to profit or loss and others
|
(23
|
)
|
||
|
Pretax income on loss of control in the US Renewable Energies Segment
|
259
|
|||
|
Tax expenses due to restructuring carried out prior to completing the transaction (1)
|
(12
|
)
|
||
|
Deferred tax expenses with respect to revaluation of investment to fair value
|
(71
|
)
|
||
|
Post-tax income on loss of control in the US Renewable Energies Segment
|
176
|
|||
|
|
(1) |
Including approx. NIS 53 million in current tax expenses and approx. NIS 42 million in deferred tax revenue with respect to the transfer of the investment in CPV Keenan LLC (which is part of the renewable energy segment of CPV Group)
to CPV Renewable.
|
|
NIS million
|
||||
|
Cash and cash equivalents
|
761
|
|||
|
Receivables in respect of deferred consideration from the partner in CPV Renewable
|
363
|
|||
|
Property, plant & equipment
|
2,487
|
|||
|
Bank loans
|
(1,450
|
)
|
||
|
Other identifiable assets and liabilities
|
64
|
|||
|
Total
|
2,225
|
|||
|
|
3. |
Gain on loss of control in the US Renewable Energies Segment
|
|
|
A. |
With regard to projects under commercial operation or construction using the DCF method by discounting the expected future cash flows of each project, by the weighted average cost of capital (WACC) after tax.
|
|
|
B. |
With respect to the backlog of projects under advanced development - at estimated fair value per KW, and the likelihood of materialization as a function of the development stages.
|
|
|
C. |
With regard to the backlog of projects under initial development - at cost.
|
|
|
E. |
Loss of control over the US Renewable Energies Segment and transition of significant influence (cont.)
|
|
|
3. |
Gain on loss of control in the US Renewable Energies Segment (cont.)
|
|
|
A. |
Forecast years - represent the period spanning from 2024 to 2054 and are based on the estimate of the economic life of the power plants and their value as of the end of the forecast period.
|
|
|
B. |
Market prices and capacity - market prices (electricity, capacity, RECs, etc.) are based on PPAs and market forecasts received from external and independent information sources, taking into account the relevant area and market for each
project and the relevant regulation.
|
|
|
C. |
Estimated construction costs of the projects, and entitlement to tax benefits in respect of projects under construction (ITC or PTC, as applicable).
|
|
|
D. |
An annual long-term inflation rate of 2.2%.
|
|
|
E. |
Weighted Average Cost of Capital (WACC) - calculated for each active material project and under construction separately and ranges between approx. 6.25% and approx. 7%.
|
|
|
4. |
Cash flows arising from the transaction
|
|
NIS million
|
||||
|
Repayment of a loan granted by ICG Energy
|
318
|
|||
|
Return on investment
|
61
|
|||
|
Deconsolidation - Cash and cash equivalents of CPV Renewable
|
(245
|
)
|
||
|
134
|
||||
|
|
F. |
Business combinations that occurred during 2023
|
|
|
1. |
Acquisition of the Kiryat Gat Power Plant
|
|
|
F. |
Business combinations that occurred during 2023 (cont.)
|
|
|
2. |
Acquisition of the Mountain Wind Power Plants
|
|
|
A(1). |
Condensed financial information on the financial position as of December 31, 2024:
|
|
Fairview
|
Maryland (1)
|
Shore (1)
|
Towantic
|
Valley
|
Three Rivers
|
CPV Renewable (2)
|
Other Investments
|
Total
|
||||||||||||||||||||||||||||
|
NIS million
|
NIS million
|
NIS million
|
NIS million
|
NIS million
|
NIS million
|
NIS million
|
NIS million
|
NIS million
|
||||||||||||||||||||||||||||
|
Holding rate
|
25.0
|
%
|
75.0
|
%
|
68.8
|
%
|
26.0
|
%
|
50.0
|
%
|
10.0
|
%
|
66.7
|
%
|
||||||||||||||||||||||
|
Current assets
|
110
|
161
|
128
|
294
|
149
|
177
|
897
|
17
|
||||||||||||||||||||||||||||
|
Non-current assets
|
3,169
|
2,355
|
3,304
|
2,977
|
2,419
|
4,759
|
3,900
|
167
|
||||||||||||||||||||||||||||
|
Total assets
|
3,279
|
2,516
|
3,432
|
3,271
|
2,568
|
4,936
|
4,797
|
184
|
||||||||||||||||||||||||||||
|
Current liabilities
|
59
|
192
|
1,806
|
263
|
197
|
339
|
496
|
6
|
||||||||||||||||||||||||||||
|
Non-current liabilities
|
1,919
|
1,063
|
802
|
843
|
1,517
|
2,357
|
1,395
|
-
|
||||||||||||||||||||||||||||
|
Total liabilities
|
1,978
|
1,255
|
2,608
|
1,106
|
1,714
|
2,696
|
1,891
|
6
|
||||||||||||||||||||||||||||
|
Net assets
|
1,301
|
1,261
|
824
|
2,165
|
854
|
2,240
|
2,906
|
178
|
||||||||||||||||||||||||||||
|
Company's share
|
325
|
946
|
567
|
563
|
427
|
227
|
1,937
|
82
|
5,074
|
|||||||||||||||||||||||||||
|
Fair value adjustments made on acquisition dates
|
283
|
(16
|
)
|
(377
|
)
|
99
|
(2
|
)
|
30
|
232
|
(3
|
)
|
246
|
|||||||||||||||||||||||
|
Carrying amount of investment
|
608
|
930
|
190
|
662
|
425
|
257
|
2,169
|
79
|
5,320
|
|||||||||||||||||||||||||||
|
|
A(2). |
Condensed financial information on the operating results as of December 31, 2024:
|
|
Fairview
|
Maryland (1)
|
Shore (1)
|
Towantic
|
Valley
|
Three Rivers
|
CPV Renewable (2)
|
Other Investments
|
Total
|
||||||||||||||||||||||||||||
|
NIS million
|
NIS million
|
NIS million
|
NIS million
|
NIS million
|
NIS million
|
NIS million
|
NIS million
|
NIS million
|
||||||||||||||||||||||||||||
|
Operating income
|
1,068
|
886
|
634
|
1,550
|
969
|
1,233
|
40
|
-
|
||||||||||||||||||||||||||||
|
Net change in fair value of derivative financial instruments
|
40
|
(3
|
)
|
(16
|
)
|
(2
|
)
|
-
|
-
|
-
|
-
|
|||||||||||||||||||||||||
|
Total income
|
1,108
|
883
|
618
|
1,548
|
969
|
1,233
|
40
|
-
|
||||||||||||||||||||||||||||
|
Operating expenses (excluding depreciation and amortization)
|
(517
|
)
|
(680
|
)
|
(537
|
)
|
(919
|
)
|
(644
|
)
|
(921
|
)
|
(16
|
)
|
(1
|
)
|
||||||||||||||||||||
|
Depreciation and amortization
|
(128
|
)
|
(82
|
)
|
(154
|
)
|
(131
|
)
|
(95
|
)
|
(130
|
)
|
(18
|
)
|
-
|
|||||||||||||||||||||
|
Operating income (loss)
|
463
|
121
|
(73
|
)
|
498
|
230
|
182
|
6
|
(1
|
)
|
||||||||||||||||||||||||||
|
Finance expenses, net
|
(82
|
)
|
(79
|
)
|
(151
|
)
|
(56
|
)
|
(176
|
)
|
(147
|
)
|
(11
|
)
|
-
|
|||||||||||||||||||||
|
Net income (loss) (3)
|
381
|
42
|
(224
|
)
|
442
|
54
|
35
|
(5
|
)
|
(1
|
)
|
|||||||||||||||||||||||||
|
Other comprehensive income (loss) (3)
|
25
|
75
|
26
|
(34
|
)
|
(93
|
)
|
(35
|
)
|
6
|
-
|
|||||||||||||||||||||||||
|
Comprehensive income (loss)
|
406
|
117
|
(198
|
)
|
408
|
(39
|
)
|
-
|
1
|
(1
|
)
|
|||||||||||||||||||||||||
|
Company’s share in profit (loss)
|
95
|
6
|
(91
|
)
|
115
|
27
|
4
|
(3
|
)
|
(1
|
)
|
152
|
||||||||||||||||||||||||
|
Company’s share in other comprehensive income (loss)
|
6
|
48
|
15
|
(9
|
)
|
(47
|
)
|
(4
|
)
|
4
|
-
|
13
|
||||||||||||||||||||||||
|
Reductions of profit and loss in respect of adjustments to fair value made on the acquisition dates
|
(6
|
)
|
3
|
16
|
3
|
-
|
-
|
(2
|
)
|
-
|
14
|
|||||||||||||||||||||||||
|
Share in the profits (losses) of associates
|
89
|
9
|
(75
|
)
|
118
|
27
|
4
|
(5
|
)
|
(1
|
)
|
166
|
||||||||||||||||||||||||
|
|
(1) |
For details regarding the acquisition of additional interests in the fourth quarter of 2024, see Section C below.
|
|
|
(2) |
For details regarding loss of control, deconsolidation and transition to the equity method with respect to the investment in CPV Renewable, see Note 23E above.
|
|
|
(3) |
It should be noted that the associates do not file tax returns and therefore their results do not reflect the tax effect.
|
|
|
B(1). |
Condensed financial information on the financial position as of December 31, 2023:
|
|
Fairview
|
Maryland
|
Shore
|
Towantic
|
Valley
|
Three Rivers
|
Other Investments
|
Total
|
|||||||||||||||||||||||||
|
NIS million
|
NIS million
|
NIS million
|
NIS million
|
NIS million
|
NIS million
|
NIS million
|
NIS million
|
|||||||||||||||||||||||||
|
Holding rate
|
25.0
|
%
|
25.0
|
%
|
37.5
|
%
|
26.0
|
%
|
50.0
|
%
|
10.0
|
%
|
||||||||||||||||||||
|
Current assets
|
161
|
169
|
196
|
271
|
174
|
190
|
8
|
|||||||||||||||||||||||||
|
Non-current assets
|
3,307
|
2,360
|
3,394
|
3,194
|
2,442
|
5,056
|
88
|
|||||||||||||||||||||||||
|
Total assets
|
3,468
|
2,529
|
3,590
|
3,465
|
2,616
|
5,246
|
96
|
|||||||||||||||||||||||||
|
Current liabilities
|
235
|
233
|
233
|
730
|
382
|
437
|
7
|
|||||||||||||||||||||||||
|
Non-current liabilities
|
1,249
|
1,139
|
2,343
|
809
|
1,348
|
2,581
|
-
|
|||||||||||||||||||||||||
|
Total liabilities
|
1,484
|
1,372
|
2,576
|
1,539
|
1,730
|
3,018
|
7
|
|||||||||||||||||||||||||
|
Net assets
|
1,984
|
1,157
|
1,014
|
1,926
|
886
|
2,228
|
89
|
|||||||||||||||||||||||||
|
Company's share
|
496
|
289
|
380
|
501
|
443
|
226
|
36
|
2,371
|
||||||||||||||||||||||||
|
Fair value adjustments made on acquisition dates
|
287
|
(51
|
)
|
(178
|
)
|
96
|
(2
|
)
|
30
|
(3
|
)
|
179
|
||||||||||||||||||||
|
Carrying amount of investment
|
783
|
238
|
202
|
597
|
441
|
256
|
33
|
2,550
|
||||||||||||||||||||||||
|
|
B(2). |
Condensed financial information on the operating results as of December 31, 2023:
|
|
Fairview
|
Maryland
|
Shore
|
Towantic
|
Valley
|
Three Rivers
|
Other Investments
|
Total
|
||||||||||||||||||||||
|
NIS million
|
NIS million
|
NIS million
|
NIS million
|
NIS million
|
NIS million
|
NIS million
|
NIS million
|
||||||||||||||||||||||
|
Operating income
|
1,045
|
885
|
602
|
1,244
|
882
|
526
|
-
|
||||||||||||||||||||||
|
Net change in fair value of derivative financial instruments
|
(35
|
)
|
(4
|
)
|
(104
|
)
|
216
|
-
|
10
|
-
|
|||||||||||||||||||
|
Total income
|
1,010
|
881
|
498
|
1,460
|
882
|
536
|
-
|
||||||||||||||||||||||
|
Operating expenses
|
(444
|
)
|
(630
|
)
|
(498
|
)
|
(685
|
)
|
(536
|
)
|
(435
|
)
|
(1
|
)
|
|||||||||||||||
|
Depreciation and amortization
|
(105
|
)
|
(78
|
)
|
(141
|
)
|
(127
|
)
|
(75
|
)
|
(58
|
)
|
-
|
||||||||||||||||
|
Operating income (loss)
|
461
|
173
|
(141
|
)
|
648
|
271
|
43
|
(1
|
)
|
||||||||||||||||||||
|
Finance expenses, net
|
(70
|
)
|
(85
|
)
|
(134
|
)
|
(45
|
)
|
(152
|
)
|
(41
|
)
|
-
|
||||||||||||||||
|
Net income (loss) *
|
391
|
88
|
(275
|
)
|
603
|
119
|
2
|
(1
|
)
|
||||||||||||||||||||
|
Other comprehensive income (loss) *
|
(63
|
)
|
(95
|
)
|
(69
|
)
|
(115
|
)
|
84
|
(45
|
)
|
-
|
|||||||||||||||||
|
Comprehensive income (loss)
|
328
|
(7
|
)
|
(344
|
)
|
488
|
203
|
(43
|
)
|
(1
|
)
|
||||||||||||||||||
|
Company’s share in profit (loss)
|
98
|
22
|
(104
|
)
|
157
|
60
|
-
|
(1
|
)
|
||||||||||||||||||||
|
Company’s share in other comprehensive income (loss)
|
(16
|
)
|
(24
|
)
|
(26
|
)
|
(30
|
)
|
42
|
(5
|
)
|
-
|
|||||||||||||||||
|
Reductions of profit and loss in respect of adjustments to fair value made on the acquisition dates
|
(7
|
)
|
2
|
14
|
-
|
1
|
-
|
-
|
|||||||||||||||||||||
|
Share in the profits (losses) of associates
|
91
|
24
|
(90
|
)
|
157
|
61
|
-
|
(1
|
)
|
242
|
|||||||||||||||||||
|
|
C. |
Acquisition of additional interests in associates
|
|
NIS million
|
||||
|
Property, plant & equipment
|
1,605
|
|||
|
Loans
|
(1,091
|
)
|
||
|
Other identifiable assets and liabilities
|
167
|
|||
| 18 |
Which was signed in February 2025, as detailed in Note 28 below.
|
|
|
D. |
Investments in property, plant and equipment of associates
|
|
Fairview
|
Maryland (1)
|
Shore (2)
|
Towantic
|
Valley (3)
|
Three Rivers
|
|||||||||||||||||||
|
NIS million
|
NIS million
|
NIS million
|
NIS million
|
NIS million
|
NIS million
|
|||||||||||||||||||
|
Holding rate
|
25.0
|
%
|
75.0
|
%
|
68.8
|
%
|
26.0
|
%
|
50.0
|
%
|
10.0
|
%
|
||||||||||||
|
Investments in 2024
|
57
|
55
|
22
|
39
|
28
|
43
|
||||||||||||||||||
|
Investments in 2023
|
63
|
101
|
69
|
37
|
64
|
78
|
||||||||||||||||||
|
|
(1) |
In 2023 - includes one-off costs in respect of investments in the power plant compound totaling approx. NIS 76 million.
|
|
|
(2) |
In 2023 - includes payments in respect of major maintenance work of approx. NIS 46 million.
|
|
|
(3) |
In 2023 - includes payments in respect of major maintenance work totaling approx. NIS 17 million and investment in the power plant compound (which is one-off in nature) totaling approx. NIS 25 million.
|
|
|
E. |
Dividends and capital distributions from associates
|
|
|
F. |
Attachment of financial statements of material associates
|
|
|
• |
The Israel Segment (through OPC Israel Holdings, 80%) - Under this operating segment, the Company is engaged in the generation and supply of electricity and energy, mainly to private customers
and to the System Operator, and in the initiation, development, construction and operation in Israel of power plants and energy generation facilities powered using natural gas and renewable energy.
|
|
|
• |
US Renewable Energies Segment (through CPV Group, approx. 70.46%) - in this area of operation, the Company engages in the initiation, development, construction and operation of renewable
energy power plants (solar and wind) in the USA, and the supply of electricity from renewable sources. Upon completion of a transaction for the introduction of a partner into this segment in the fourth quarter of 2024 as detailed in
Note 23E, the activity in this segment is carried out through an associate in which CPV Group has an interest of approx. 66.7%.
|
|
|
• |
US Energy Transition Segment (through CPV Group, approx. 70.46%) - in this area of activity, the Company is engaged in maintenance and operation of conventional energy power plants (natural
gas), which supply efficient and reliable electricity in the US. The active power plants in this area of operation are held through associates (which are not consolidated in CPV Group’s financial statements, and accordingly in the
Company’s Financial Statements).
|
|
For the year ended December 31, 2024
|
||||||||||||||||||||||||
|
Israel
|
Energy Transition in the USA
|
US Renew-able Energies
|
Other activities in the USA
|
Adjustments to consoli-dated
|
Consoli-dated - total
|
|||||||||||||||||||
|
In NIS million
|
(Audited)
|
|||||||||||||||||||||||
|
Revenues from sales and provision of services
|
2,312
|
1,796
|
228
|
145
|
(1,702
|
)
|
2,779
|
|||||||||||||||||
|
Cost of sales and provision of services
|
(1,649
|
)
|
(1,154
|
)
|
(66
|
)
|
(144
|
)
|
1,082
|
(1,931
|
)
|
|||||||||||||
|
EBITDA after proportionate consolidation
|
639
|
588
|
112
|
(22
|
)
|
(608
|
)
|
709
|
||||||||||||||||
|
Adjustments:
|
||||||||||||||||||||||||
|
Share in profits of associates
|
166
|
|||||||||||||||||||||||
|
General and administrative expenses at US headquarters (not attributed to US segments)
|
(89
|
)
|
||||||||||||||||||||||
|
General and administrative expenses at Company headquarters (not attributed to the operating segments)
|
(20
|
)
|
||||||||||||||||||||||
|
Total EBITDA
|
766
|
|||||||||||||||||||||||
|
Depreciation and amortization
|
(333
|
)
|
||||||||||||||||||||||
|
Finance expenses, net
|
(301
|
)
|
||||||||||||||||||||||
|
Gain on loss of control over a subsidiary
|
259
|
|||||||||||||||||||||||
|
Other expenses, net
|
(56
|
)
|
||||||||||||||||||||||
|
(431
|
)
|
|||||||||||||||||||||||
|
Profit before taxes on income
|
335
|
|||||||||||||||||||||||
|
Expenses for income tax
|
(138
|
)
|
||||||||||||||||||||||
|
Profit for the period
|
197
|
|||||||||||||||||||||||
|
For the year ended December 31, 2023
|
||||||||||||||||||||||||
|
Israel
|
Energy Transition in the USA
|
US Renew-able Energies
|
Other activities in the USA
|
Adjustments to consoli-dated
|
Consoli-dated - total
|
|||||||||||||||||||
|
In NIS million
|
(Audited)
|
|||||||||||||||||||||||
|
Revenues from sales and provision of services
|
2,283
|
1,525
|
146
|
12
|
(1,414
|
)
|
2,552
|
|||||||||||||||||
|
Cost of sales and provision of services
|
(1,676
|
)
|
(904
|
)
|
(49
|
)
|
(22
|
)
|
824
|
(1,827
|
)
|
|||||||||||||
|
EBITDA after proportionate consolidation
|
562
|
585
|
31
|
(26
|
)
|
(588
|
)
|
564
|
||||||||||||||||
|
Adjustments:
|
||||||||||||||||||||||||
|
Share in profits of associates
|
242
|
|||||||||||||||||||||||
|
General and administrative expenses at US headquarters (not attributed to US segments)
|
(26
|
)
|
||||||||||||||||||||||
|
General and administrative expenses at Company headquarters (not attributed to the operating segments)
|
(27
|
)
|
||||||||||||||||||||||
|
Total EBITDA
|
753
|
|||||||||||||||||||||||
|
Depreciation and amortization
|
(303
|
)
|
||||||||||||||||||||||
|
Finance expenses, net
|
(197
|
)
|
||||||||||||||||||||||
|
Other expenses, net
|
(16
|
)
|
||||||||||||||||||||||
|
(516
|
)
|
|||||||||||||||||||||||
|
Profit before taxes on income
|
237
|
|||||||||||||||||||||||
|
Expenses for income tax
|
(68
|
)
|
||||||||||||||||||||||
|
Profit for the year
|
169
|
|||||||||||||||||||||||
|
For the year ended December 31, 2022
|
||||||||||||||||||||||||
|
Israel
|
Energy Transition in the USA
|
US Renew-able Energies
|
Other activities in the USA
|
Adjustments to consoli-dated
|
Consoli-dated - total
|
|||||||||||||||||||
|
In NIS million
|
(Audited)
|
|||||||||||||||||||||||
|
Revenues from sales and provision of services
|
1,735
|
1,967
|
95
|
-
|
(1,870
|
)
|
1,927
|
|||||||||||||||||
|
Cost of sales and provision of services
|
(1,294
|
)
|
(1,375
|
)
|
(29
|
)
|
-
|
1,294
|
(1,404
|
)
|
||||||||||||||
|
EBITDA after proportionate consolidation
|
357
|
554
|
26
|
(558
|
)
|
379
|
||||||||||||||||||
|
Adjustments:
|
||||||||||||||||||||||||
|
Share in profits of associates
|
286
|
|||||||||||||||||||||||
|
General and administrative expenses at US headquarters (not attributed to US segments)
|
(109
|
)
|
||||||||||||||||||||||
|
General and administrative expenses at Company headquarters (not attributed to the operating segments)
|
(26
|
)
|
||||||||||||||||||||||
|
Total EBITDA
|
530
|
|||||||||||||||||||||||
|
Depreciation and amortization
|
(201
|
)
|
||||||||||||||||||||||
|
Finance expenses, net
|
(47
|
)
|
||||||||||||||||||||||
|
(248
|
)
|
|||||||||||||||||||||||
|
Profit before taxes on income
|
282
|
|||||||||||||||||||||||
|
Expenses for income tax
|
(65
|
)
|
||||||||||||||||||||||
|
Profit for the year
|
217
|
|||||||||||||||||||||||
|
|
A. |
Lawsuits and other contingent liabilities
|
|
|
1. |
In recent years the System Operator notified Rotem that according to its approach the sale of energy to end consumers in excess of the production capacity of Rotem’s power plant, deviates from the provisions of Rotem’s PPA with the
Israel Electric Corporation. Furthermore, Rotem was informed that the System Operator disputes Rotem’s position as to the applicability of Appendix O to Rotem’s PPA with the Israel Electric Corporation and including as to Rotem’s
electricity sale options. Rotem is of the opinion that this matter was regulated as from July 1, 2024 under the complementary arrangements (including receipt of a supply license) which were stipulated by the Israeli Electricity
Authority’s resolution as detailed below.
|
|
|
2. |
On July 1, 2020, the commercial operation date of the Hadera Power Plant commenced, after a delay in power plant’s completion of construction as a result of, among other things, components replaced or repaired.
|
|
|
3. |
The commercial operation period of the Zomet Power Plant commenced on June 22, 2023. Under the Construction Agreement, the Construction Contractor of the Zomet Power Plant (hereinafter in this section - the “Construction Contractor”)
undertook to complete the construction work of the power plant, including acceptance tests by late January 2023. Furthermore, the Construction Agreement includes customary provisions for agreements of this type, including obligations
for agreed compensation that are limited in amount, in case of non-compliance with the terms and conditions set forth in the Construction Agreement, including non-compliance with certain guaranteed results and/or non-compliance with the
schedule.
|
|
|
4. |
The Group companies usually record provisions for claims which, in their management’s opinion, based on their legal counsel, will more likely than not materialize. The provision is made according to an estimate of the expected
amounts of the payments for settlement of the liability. As of the report date, additional exposure for which there is no provision amounts to approx. NIS 21 million (excluding a purchase tax assessment, as stated in Note 10B6).
|
|
|
B. |
Maintenance and service agreements
|
| 19 |
Mitsubishi Heavy Industries Ltd. (which on June 24, 2014 was assigned to Mitsubishi Hitachi Power Systems Ltd. and on March 31, 2016 - to Mitsubishi Hitachi Power Systems Europe Ltd.).
|
|
|
C. |
Agreements for acquisition of natural gas
|
|
|
1. |
Agreement between Tamar Group and Rotem
|
|
|
2. |
Agreement between the Tamar Group and Hadera
|
| 21 |
To the best of the Company’s knowledge, as of the report date, the Tamar Group includes Isramco Negev 2 Limited Partnership, Union Energy & Systems 2 Ltd. Mubadala Energy RSC Ltd., Chevron Mediterranean Ltd., Tamar Investment 2
Limited, Dor Gas Exploration Limited Partnership and Tamar Petroleum Ltd.
|
|
|
3. |
The Energean Agreements
|
| 22 |
At the time of signing the agreement, there was also an engagement with ICL Group Ltd. and Bazan Ltd. The agreements with respect to each of the Group Companies are separate and independent.
|
|
|
3. |
The Energean Agreements (cont.)
|
|
|
4. |
On March 18, 2024, a wholly-owned partnership of OPC Israel (hereinafter - the “Partnership”) engaged with a third party in an agreement for the purchase of natural gas. The agreement will terminate on June 30, 2030 or at the earlier
of: the end of the consumption of the Total Contractual Quantity of approx. 0.46 BCM as set out in the agreement.
|
|
|
5. |
Amendment to the Excise Tax on Fuel Ordinance
|
|
|
D. |
Agreement for the sale of surplus electricity in Rotem
|
|
|
A. |
For further details regarding developments in commitments, legal claims and other liabilities in the reporting period and thereafter, see Note 26.
|
|
|
B. |
For further details regarding developments in credit from banking corporations and others and debentures in the reporting period and thereafter, see Notes 14 and 15, respectively.
|
|
|
C. |
For details regarding the acquisition of additional rights in the Shore power plant subsequent to the reporting period, see Note 24C.
|
| 23 |
Non-recourse project financing, as accepted in agreements of this type.
|
| 24 |
In consideration for increasing its above holdings, subject to its completion, the CPV Group will pay the seller an amount that is immaterial to the Company. If the stake shall not be increased as aforesaid, the share of the
Deleveraging Amount attributable to that stake shall be considered a loan to the seller under the agreed upon terms and conditions.
|
|
As of December 31, 2024
|
||||||||||||||||
|
US GAAP
|
Adjustments
|
IFRS
|
||||||||||||||
|
In USD thousand
|
In USD thousand
|
In USD thousand
|
||||||||||||||
|
Cash and cash equivalents
|
D |
|
49
|
16,098
|
16,147
|
|||||||||||
|
Restricted cash
|
D |
|
18,308
|
(16,098
|
)
|
2,210
|
||||||||||
|
Property, plant & equipment
|
A, C,G
|
|
561,594
|
(67,979
|
)
|
493,615
|
||||||||||
|
Intangible assets
|
C |
|
14,151
|
(14,151
|
)
|
-
|
||||||||||
|
Right‑of‑use assets
|
E |
|
87,301
|
133,961
|
221,262
|
|||||||||||
|
Other assets
|
F |
|
100,391
|
-
|
100,391
|
|||||||||||
|
|
||||||||||||||||
|
Total assets
|
|
781,794
|
51,831
|
833,625
|
||||||||||||
|
|
||||||||||||||||
|
Accounts payable and deferred expenses
|
A |
|
39,641
|
(2,023
|
)
|
37,618
|
||||||||||
|
Long-term lease liability
|
E |
|
74,384
|
140,865
|
215,249
|
|||||||||||
|
Other liabilities
|
|
452,673
|
9,472
|
462,145
|
||||||||||||
|
|
||||||||||||||||
|
Total liabilities
|
|
566,698
|
148,314
|
715,012
|
||||||||||||
|
|
||||||||||||||||
|
Partners’ equity
|
A, E,F
|
|
215,096
|
(96,484
|
)
|
118,612
|
||||||||||
|
|
||||||||||||||||
|
Total liabilities and equity
|
|
781,794
|
51,830
|
833,624
|
||||||||||||
|
|
As of December 31, 2023
|
|||||||||||||||
|
|
US GAAP
|
Adjustments
|
IFRS
|
|||||||||||||
|
|
In USD thousand
|
In USD thousand
|
In USD thousand
|
|||||||||||||
|
|
||||||||||||||||
|
Cash and cash equivalents
|
D |
|
48
|
5,400
|
5,448
|
|||||||||||
|
Restricted cash
|
D |
|
7,529
|
(5,400
|
)
|
2,129
|
||||||||||
|
Derivatives
|
F |
|
|
-
|
14,304
|
14,304
|
||||||||||
|
Property, plant & equipment
|
A, C,F
|
|
582,326
|
(66,842
|
)
|
515,484
|
||||||||||
|
Intangible assets
|
C |
|
14,699
|
(14,699
|
)
|
-
|
||||||||||
|
Right‑of‑use assets
|
E |
|
88,979
|
141,044
|
230,023
|
|||||||||||
|
Other assets
|
126,619
|
(15,638
|
)
|
110,981
|
||||||||||||
|
Total assets
|
820,200
|
58,169
|
878,369
|
|||||||||||||
|
Accounts payable and deferred expenses
|
A |
|
21,652
|
(2,615
|
)
|
19,037
|
||||||||||
|
Long-term lease liability
|
75,775
|
144,152
|
219,927
|
|||||||||||||
|
Other liabilities
|
463,073
|
8,316
|
471,389
|
|||||||||||||
|
Total liabilities
|
560,500
|
149,853
|
710,353
|
|||||||||||||
|
Partners’ equity
|
A, E,F
|
|
259,700
|
(91,684
|
)
|
168,016
|
||||||||||
|
Total liabilities and equity
|
820,200
|
58,169
|
878,369
|
|||||||||||||
|
For the year ended December 31, 2024
|
||||||||||||||||||||
|
US GAAP
|
IFRS adjustments
|
Adjustments to the Group’s accounting policies*
|
IFRS - according to the Group’s accounting policies
|
|||||||||||||||||
|
In USD thousand
|
In USD thousand
|
In USD thousand
|
In USD thousand
|
|||||||||||||||||
|
Revenues
|
B |
|
167,618
|
(704
|
)
|
-
|
166,914
|
|||||||||||||
|
Fuels and other
|
E |
|
100,114
|
(15,946
|
)
|
-
|
84,168
|
|||||||||||||
|
Other operating expenses
|
A |
|
66,577
|
(5,536
|
)
|
-
|
61,041
|
|||||||||||||
|
Depreciation and amortization
|
A, E,H
|
|
21,982
|
15,479
|
-
|
37,461
|
||||||||||||||
|
Operating loss
|
(21,055
|
)
|
5,299
|
-
|
(15,756
|
)
|
||||||||||||||
|
Finance expenses
|
B,E
|
|
29,107
|
11,537
|
-
|
40,644
|
||||||||||||||
|
Loss for the period
|
(50,162
|
)
|
(6,238
|
)
|
-
|
(56,400
|
)
|
|||||||||||||
|
Other comprehensive loss
|
B |
|
5,558
|
1,439
|
-
|
6,997
|
||||||||||||||
|
Comprehensive loss for the period
|
(44,604
|
)
|
(4,799
|
)
|
-
|
(49,403
|
)
|
|||||||||||||
|
For the year ended December 31, 2023
|
||||||||||||||||||||
|
US GAAP
|
IFRS adjustments
|
Adjustments to the Group’s accounting policies*
|
IFRS - according to the Group’s accounting policies
|
|||||||||||||||||
|
In USD thousand
|
In USD thousand
|
In USD thousand
|
In USD thousand
|
|||||||||||||||||
|
Revenues
|
B |
|
112,217
|
749
|
-
|
112,966
|
||||||||||||||
|
Fuels and other
|
E |
|
80,782
|
(15,947
|
)
|
-
|
64,835
|
|||||||||||||
|
Other operating expenses
|
A |
|
66,611
|
(18,196
|
)
|
-
|
48,415
|
|||||||||||||
|
Depreciation and amortization
|
A,E
|
|
21,969
|
12,225
|
-
|
34,194
|
||||||||||||||
|
Operating loss
|
(57,145
|
)
|
22,667
|
-
|
(34,478
|
)
|
||||||||||||||
|
Finance expenses
|
A, E,G
|
|
27,863
|
8,312
|
-
|
36,175
|
||||||||||||||
|
Loss for the year
|
(85,008
|
)
|
14,355
|
-
|
(70,653
|
)
|
||||||||||||||
|
Other comprehensive loss
|
B |
|
(14,945
|
)
|
(3,783
|
)
|
-
|
(18,728
|
)
|
|||||||||||
|
Comprehensive loss for the year
|
(99,953
|
)
|
10,572
|
-
|
(89,381
|
)
|
||||||||||||||
|
For the year ended December 31, 2024
|
||||||||||||||||
|
US GAAP
|
Adjustments
|
IFRS
|
||||||||||||||
|
In USD thousand
|
In USD thousand
|
In USD thousand
|
||||||||||||||
|
Loss for the period
|
(50,162
|
)
|
(6,238
|
)
|
(56,400
|
)
|
||||||||||
|
Net cash provided by operating activities
|
11,635
|
-
|
11,635
|
|||||||||||||
|
Net cash used for investing activities
|
D |
|
(526
|
)
|
(5,114
|
)
|
(5,640
|
)
|
||||||||
|
Net cash provided by financing activities
|
|
4,704
|
-
|
4,704
|
||||||||||||
|
|
||||||||||||||||
|
Net increase in cash and cash equivalents
|
|
15,813
|
(5,114
|
)
|
10,699
|
|||||||||||
|
|
||||||||||||||||
|
Balance of cash and cash equivalents at the beginning of the period
|
D |
|
48
|
5,400
|
5,448
|
|||||||||||
|
|
||||||||||||||||
|
Restricted cash balance at the beginning of the period
|
D |
|
77,609
|
(77,609
|
)
|
-
|
||||||||||
| |
|
|||||||||||||||
|
Balance of cash and cash equivalents at the end of the period
|
D |
|
49
|
16,098
|
16,147
|
|||||||||||
|
|
||||||||||||||||
|
Restricted cash balance as of the end of the period
|
D |
|
93,421
|
(93,421
|
)
|
-
|
||||||||||
|
For the year ended December 31, 2023
|
||||||||||||||||
|
US GAAP
|
Adjustments
|
IFRS
|
||||||||||||||
|
In USD thousand
|
In USD thousand
|
In USD thousand
|
||||||||||||||
|
Loss for the year
|
|
|
(85,008
|
)
|
14,355
|
(70,653
|
)
|
|||||||||
|
|
|
|||||||||||||||
|
Net cash provided by operating activities
|
|
|
4,157
|
-
|
4,157
|
|||||||||||
|
Net cash provided by (used for) investing activities
|
D |
|
|
(408
|
)
|
5,763
|
5,355
|
|||||||||
|
Net cash used for financing activities
|
|
|
(16,036
|
)
|
-
|
(16,036
|
)
|
|||||||||
|
|
|
|||||||||||||||
|
Net decrease in cash and cash equivalents
|
|
|
(12,287
|
)
|
5,763
|
(6,524
|
)
|
|||||||||
|
|
|
|||||||||||||||
|
Balance of cash and cash equivalents at the beginning of the year
|
D |
|
|
39
|
11,933
|
11,972
|
||||||||||
|
|
|
|||||||||||||||
|
Restricted cash balance at the beginning of the year
|
D |
|
|
89,905
|
(89,905
|
)
|
-
|
|||||||||
|
|
|
|||||||||||||||
|
Balance of cash and cash equivalents at the end of the year
|
D |
|
|
48
|
5,400
|
5,448
|
||||||||||
|
|
|
|||||||||||||||
|
Restricted cash balance at the end of the year
|
D |
|
|
77,609
|
(77,609
|
)
|
-
|
|||||||||
|
As of December 31, 2024
|
||||||||||||||||
|
US GAAP
|
Adjustments
|
IFRS
|
||||||||||||||
|
In USD thousand
|
In USD thousand
|
In USD thousand
|
||||||||||||||
|
Cash and cash equivalents
|
D |
|
43
|
444
|
487
|
|||||||||||
|
Restricted cash
|
D |
|
4,793
|
(444
|
)
|
4,349
|
||||||||||
|
Property, plant & equipment
|
A,C
|
|
801,986
|
57,331
|
859,317
|
|||||||||||
|
Intangible assets
|
C |
|
25,883
|
(25,883
|
)
|
-
|
||||||||||
|
Other assets
|
|
34,936
|
-
|
34,936
|
||||||||||||
|
Total assets
|
867,641
|
31,448
|
899,089
|
|||||||||||||
|
Accounts payable and deferred expenses
|
A |
|
18,501
|
(6,360
|
)
|
12,141
|
||||||||||
|
Other liabilities
|
530,181
|
-
|
530,181
|
|||||||||||||
|
Total liabilities
|
548,682
|
(6,360
|
)
|
542,322
|
||||||||||||
|
Partners’ equity
|
A
|
|
318,959
|
37,808
|
356,767
|
|||||||||||
|
Total liabilities and equity
|
867,641
|
31,448
|
899,089
|
|||||||||||||
|
As of December 31, 2023
|
||||||||||||||||
|
US GAAP
|
Adjustments
|
IFRS
|
||||||||||||||
|
In USD thousand
|
In USD thousand
|
In USD thousand
|
||||||||||||||
|
Cash and cash equivalents
|
D |
|
52
|
265
|
317
|
|||||||||||
|
Restricted cash
|
D |
|
947
|
(265
|
)
|
682
|
||||||||||
|
Property, plant & equipment
|
A,C
|
|
817,316
|
57,540
|
874,856
|
|||||||||||
|
Intangible assets
|
C |
|
26,753
|
(26,753
|
)
|
-
|
||||||||||
|
Other assets
|
80,408
|
-
|
80,408
|
|||||||||||||
|
Total assets
|
925,476
|
30,787
|
956,263
|
|||||||||||||
|
Accounts payable and deferred expenses
|
A |
|
15,034
|
(5,435
|
)
|
9,599
|
||||||||||
|
Other liabilities
|
399,165
|
420
|
399,585
|
|||||||||||||
|
Total liabilities
|
414,199
|
(5,015
|
)
|
409,184
|
||||||||||||
|
Partners’ equity
|
A |
|
511,277
|
35,802
|
547,079
|
|||||||||||
|
Total liabilities and equity
|
925,476
|
30,787
|
956,263
|
|||||||||||||
|
For the year ended December 31, 2024
|
||||||||||||||||||||
|
US GAAP
|
IFRS adjustments
|
Adjustments to the Group’s accounting policies*
|
IFRS - according to the Group’s accounting policies
|
|||||||||||||||||
|
In USD thousand
|
In USD thousand
|
In USD thousand
|
In USD thousand
|
|||||||||||||||||
|
Revenues
|
B |
|
275,102
|
(2,854
|
)
|
27,083
|
299,331
|
|||||||||||||
|
Operating expenses
|
A |
|
121,590
|
(8,648
|
)
|
27,083
|
140,025
|
|||||||||||||
|
Depreciation and amortization
|
A |
|
27,485
|
7,062
|
-
|
34,547
|
||||||||||||||
|
Operating profit
|
126,027
|
(1,268
|
)
|
-
|
124,759
|
|||||||||||||||
|
Finance expenses
|
B |
|
27,325
|
(5,185
|
)
|
-
|
22,140
|
|||||||||||||
|
Profit for the period
|
98,702
|
3,917
|
-
|
102,619
|
||||||||||||||||
|
Other comprehensive loss
|
B |
|
8,080
|
(1,911
|
)
|
-
|
6,169
|
|||||||||||||
|
Comprehensive income for the period
|
106,782
|
2,006
|
-
|
108,788
|
||||||||||||||||
|
For the year ended December 31, 2023
|
||||||||||||||||||||
|
US GAAP
|
IFRS adjustments
|
Adjustments to the Group’s accounting policies*
|
IFRS - according to the Group’s accounting policies
|
|||||||||||||||||
|
In USD thousand
|
In USD thousand
|
In USD thousand
|
In USD thousand
|
|||||||||||||||||
|
Revenues
|
B |
|
256,103
|
3,898
|
17,660
|
277,661
|
||||||||||||||
|
Operating expenses
|
A |
|
119,737
|
(12,985
|
)
|
17,660
|
124,412
|
|||||||||||||
|
Depreciation and amortization
|
A |
|
27,186
|
1,177
|
-
|
28,363
|
||||||||||||||
|
Operating profit
|
109,180
|
15,706
|
-
|
124,886
|
||||||||||||||||
|
Finance expenses
|
B |
|
24,191
|
(5,416
|
)
|
-
|
18,775
|
|||||||||||||
|
Profit for the year
|
84,989
|
21,122
|
-
|
106,111
|
||||||||||||||||
|
Other comprehensive loss
|
B |
|
(8,032
|
)
|
(9,034
|
)
|
-
|
(17,066
|
)
|
|||||||||||
|
Comprehensive income for the year
|
76,957
|
12,088
|
-
|
89,045
|
||||||||||||||||
|
For the year ended December 31, 2024
|
||||||||||||||||
|
US GAAP
|
Adjustments
|
IFRS
|
||||||||||||||
|
In USD thousand
|
In USD thousand
|
In USD thousand
|
||||||||||||||
|
Profit for the period
|
98,702
|
3,917
|
102,619
|
|||||||||||||
|
Net cash provided by operating activities
|
125,851
|
-
|
125,851
|
|||||||||||||
|
Net cash provided by (used for) investing activities
|
D |
|
(11,286
|
)
|
23,714
|
12,428
|
||||||||||
|
Net cash used for financing activities
|
(138,109
|
)
|
-
|
(138,109
|
)
|
|||||||||||
|
|
||||||||||||||||
|
Net increase (decrease) in cash and cash equivalents
|
|
(23,544
|
)
|
23,714
|
170
|
|||||||||||
|
|
||||||||||||||||
|
Balance of cash and cash equivalents at the beginning of the period
|
D |
|
52
|
265
|
317
|
|||||||||||
|
|
||||||||||||||||
|
Restricted cash balance at the beginning of the period
|
D |
|
28,328
|
(28,328
|
)
|
-
|
||||||||||
|
|
||||||||||||||||
|
Balance of cash and cash equivalents at the end of the period
|
D |
|
43
|
444
|
487
|
|||||||||||
|
|
||||||||||||||||
|
Restricted cash balance as of the end of the period
|
D |
|
4,793
|
(4,793
|
)
|
-
|
||||||||||
|
For the year ended December 31, 2023
|
||||||||||||||||
|
US GAAP
|
Adjustments
|
IFRS
|
||||||||||||||
|
In USD thousand
|
In USD thousand
|
In USD thousand
|
||||||||||||||
|
Profit for the year
|
84,989
|
21,122
|
106,111
|
|||||||||||||
|
Net cash provided by operating activities
|
|
|
138,604
|
-
|
138,604
|
|||||||||||
|
Net cash provided by (used for) investing activities
|
D |
|
|
(3,967
|
)
|
8,971
|
5,004
|
|||||||||
|
Net cash used for financing activities
|
|
|
(144,750
|
)
|
-
|
(144,750
|
)
|
|||||||||
|
|
|
|||||||||||||||
|
Net decrease in cash and cash equivalents
|
|
|
(10,113
|
)
|
8,971
|
(1,142
|
)
|
|||||||||
|
|
|
|||||||||||||||
|
Balance of cash and cash equivalents at the beginning of the year
|
D |
|
|
89
|
1,370
|
1,459
|
||||||||||
|
|
|
|||||||||||||||
|
Restricted cash balance at the beginning of the year
|
D |
|
|
38,404
|
(38,404
|
)
|
-
|
|||||||||
|
|
|
|||||||||||||||
|
Balance of cash and cash equivalents at the end of the year
|
D |
|
|
52
|
265
|
317
|
||||||||||
|
|
|
|||||||||||||||
|
Restricted cash balance at the end of the year
|
D |
|
|
28,328
|
(28,328
|
)
|
-
|
|||||||||
|
As of December 31, 2024
|
||||||||||||||||
|
US GAAP
|
Adjustments
|
IFRS
|
||||||||||||||
|
In USD thousand
|
In USD thousand
|
In USD thousand
|
||||||||||||||
|
Cash and cash equivalents
|
D |
|
99
|
8,969
|
9,068
|
|||||||||||
|
Restricted cash
|
D |
|
29,631
|
(8,969
|
)
|
20,662
|
||||||||||
|
Property, plant & equipment
|
A,C
|
|
717,309
|
79,455
|
796,764
|
|||||||||||
|
Intangible assets
|
C |
|
47,824
|
(47,824
|
)
|
-
|
||||||||||
|
Other assets
|
70,362
|
-
|
70,362
|
|||||||||||||
|
Total assets
|
865,225
|
31,631
|
896,856
|
|||||||||||||
|
Accounts payable and deferred expenses
|
A |
|
39,630
|
(2,207
|
)
|
37,423
|
||||||||||
|
Other liabilities
|
266,468
|
(450
|
)
|
266,018
|
||||||||||||
|
Total liabilities
|
306,098
|
(2,657
|
)
|
303,441
|
||||||||||||
|
Partners’ equity
|
A
|
|
559,127
|
34,288
|
593,415
|
|||||||||||
|
Total liabilities and equity
|
865,225
|
31,631
|
896,856
|
|||||||||||||
|
As of December 31, 2023
|
||||||||||||||||
|
US GAAP
|
Adjustments
|
IFRS
|
||||||||||||||
|
In USD thousand
|
In USD thousand
|
In USD thousand
|
||||||||||||||
|
Cash and cash equivalents
|
D |
|
100
|
1,946
|
2,046
|
|||||||||||
|
Restricted cash
|
D |
|
2,004
|
(1,946
|
)
|
58
|
||||||||||
|
Property, plant & equipment
|
A,C
|
|
740,844
|
80,810
|
821,654
|
|||||||||||
|
Intangible assets
|
C |
|
51,333
|
(51,333
|
)
|
-
|
||||||||||
|
Other assets
|
131,405
|
-
|
131,405
|
|||||||||||||
|
Total assets
|
925,686
|
29,477
|
955,163
|
|||||||||||||
|
Accounts payable and deferred expenses
|
A |
|
14,167
|
(2,107
|
)
|
12,060
|
||||||||||
|
Other liabilities
|
412,217
|
(105
|
)
|
412,112
|
||||||||||||
|
Total liabilities
|
426,384
|
(2,212
|
)
|
424,172
|
||||||||||||
|
Partners’ equity
|
A |
|
499,302
|
31,689
|
530,991
|
|||||||||||
|
Total liabilities and equity
|
925,686
|
29,477
|
955,163
|
|||||||||||||
|
For the year ended December 31, 2024
|
||||||||||||||||||||
|
US GAAP
|
IFRS adjustments
|
Adjustments to the Group’s accounting policies*
|
IFRS - according to the Group’s accounting policies
|
|||||||||||||||||
|
In USD thousand
|
In USD thousand
|
In USD thousand
|
In USD thousand
|
|||||||||||||||||
|
Revenues
|
B |
|
437,675
|
(18,991
|
)
|
-
|
418,684
|
|||||||||||||
|
Operating expenses
|
A |
|
257,262
|
(8,779
|
)
|
-
|
248,483
|
|||||||||||||
|
Depreciation and amortization
|
A |
|
28,927
|
6,515
|
-
|
35,442
|
||||||||||||||
|
Operating profit
|
151,486
|
(16,727
|
)
|
-
|
134,759
|
|||||||||||||||
|
Finance expenses
|
B |
|
19,316
|
(4,222
|
)
|
-
|
15,094
|
|||||||||||||
|
Profit for the period
|
132,170
|
(12,505
|
)
|
-
|
119,665
|
|||||||||||||||
|
Other comprehensive loss
|
B |
|
(24,345
|
)
|
15,102
|
-
|
(9,243
|
)
|
||||||||||||
|
Comprehensive income for the period
|
107,825
|
2,597
|
-
|
110,422
|
||||||||||||||||
|
For the year ended December 31, 2023
|
||||||||||||||||||||
|
US GAAP
|
IFRS adjustments
|
Adjustments to the Group’s accounting policies*
|
IFRS - according to the Group’s accounting policies
|
|||||||||||||||||
|
In USD thousand
|
In USD thousand
|
In USD thousand
|
In USD thousand
|
|||||||||||||||||
|
Revenues
|
B |
|
380,081
|
19,039
|
15,698
|
414,818
|
||||||||||||||
|
Operating expenses
|
A |
|
198,011
|
(8,765
|
)
|
15,698
|
204,944
|
|||||||||||||
|
Depreciation and amortization
|
A
|
|
28,843
|
5,609
|
-
|
34,452
|
||||||||||||||
|
Operating profit
|
153,227
|
22,195
|
-
|
175,422
|
||||||||||||||||
|
Finance expenses
|
B |
|
19,317
|
(7,346
|
)
|
-
|
11,971
|
|||||||||||||
|
Profit for the year
|
133,910
|
29,541
|
-
|
163,451
|
||||||||||||||||
|
Other comprehensive loss
|
B
|
|
(4,815
|
)
|
(26,455
|
)
|
-
|
(31,270
|
)
|
|||||||||||
|
Comprehensive income for the year
|
129,095
|
3,086
|
-
|
132,181
|
||||||||||||||||
|
For the year ended December 31, 2024
|
||||||||||||||||
|
US GAAP
|
Adjustments
|
IFRS
|
||||||||||||||
|
In USD thousand
|
In USD thousand
|
In USD thousand
|
||||||||||||||
|
Profit for the period
|
132,170
|
(12,505
|
)
|
119,665
|
||||||||||||
|
Net cash provided by operating activities
|
164,646
|
-
|
164,646
|
|||||||||||||
|
Net cash provided by (used for) investing activities
|
D |
|
|
(1,882
|
)
|
24,159
|
22,277
|
|||||||||
|
Net cash used for financing activities
|
|
|
(179,901
|
)
|
-
|
(179,901
|
)
|
|||||||||
|
|
|
|||||||||||||||
|
Net increase (decrease) in cash and cash equivalents
|
|
|
(17,137
|
)
|
24,159
|
7,022
|
||||||||||
|
|
|
|||||||||||||||
|
Balance of cash and cash equivalents at the beginning of the period
|
D |
|
|
100
|
1,946
|
2,046
|
||||||||||
|
|
|
|||||||||||||||
|
Restricted cash balance at the beginning of the period
|
D |
|
|
46,767
|
(46,767
|
)
|
-
|
|||||||||
|
|
|
|||||||||||||||
|
Balance of cash and cash equivalents at the end of the period
|
D |
|
|
99
|
8,969
|
9,068
|
||||||||||
|
|
|
|||||||||||||||
|
Restricted cash balance as of the end of the period
|
|
|
29,631
|
(29,631
|
)
|
-
|
||||||||||
|
For the year ended December 31, 2023
|
||||||||||||||||
|
US GAAP
|
Adjustments
|
IFRS
|
||||||||||||||
|
In USD thousand
|
In USD thousand
|
In USD thousand
|
||||||||||||||
|
Profit for the year
|
133,910
|
29,541
|
163,451
|
|||||||||||||
|
Net cash provided by operating activities
|
|
122,769
|
-
|
122,769
|
||||||||||||
|
Net cash provided by (used for) investing activities
|
D |
|
(1,182
|
)
|
34,787
|
33,605
|
||||||||||
|
Net cash used for financing activities
|
|
(194,648
|
)
|
-
|
(194,648
|
)
|
||||||||||
|
|
||||||||||||||||
|
Net decrease in cash and cash equivalents
|
|
(73,061
|
)
|
34,787
|
(38,274
|
)
|
||||||||||
|
|
||||||||||||||||
|
Balance of cash and cash equivalents at the beginning of the year
|
D |
|
90
|
40,230
|
40,320
|
|||||||||||
|
|
||||||||||||||||
|
Restricted cash balance at the beginning of the year
|
D |
|
119,838
|
(119,838
|
)
|
-
|
||||||||||
|
|
||||||||||||||||
|
Balance of cash and cash equivalents at the end of the year
|
D |
|
100
|
1,946
|
2,046
|
|||||||||||
|
|
||||||||||||||||
|
Restricted cash balance at the end of the year
|
D |
|
46,767
|
(46,767
|
)
|
-
|
||||||||||
|
|
A. |
Maintenance costs under the Long Term Maintenance Plan (hereinafter - the “LTPC Agreement”): under IFRS, variable payments which were paid in accordance with the milestones as set in the LTPC
Agreement are capitalized to the cost of property, plant and equipment and amortized over the period from the date on which maintenance work was carried out until the date on which maintenance work is due to take place again. Under US
GAAP, the said payments are recognized on payment date within current expenses in the statement of profit and loss.
|
|
|
B. |
Hedge effectiveness of swaps: in accordance with the IFRS - the associates recognize adjustments relating to the ineffective portion of their cash flow hedge under profit and loss. Under US GAAP, there is no part which is not
effective, and the hedging results are recognized in full in other comprehensive income.
|
|
|
C. |
Intangible assets: Under IFRS, certain intangible assets are defined as property, plant and equipment.
|
|
|
D. |
Restricted cash: There is a difference between the presentation and classification of restricted cash in the Statements of Cash Flows and in the Statements of Financial Position.
|
|
|
E. |
Right-of-use assets: In IFRS, certain contracts are classified as leases. Under US GAAP, these contracts do not meet the definition of lease contracts, and are recorded as an operating expense.
|
|
|
F. |
Certain compound financial instruments are classified in full as derivatives in IFRS. Under US GAAP, these financial instruments are bifurcated between derivatives and non-derivative financial instruments.
|
|
|
G. |
Property, plant and equipment in Shore: In Shore’s financial statements the property, plant, and equipment is presented at historical cost. The adjustments to property, plant and equipment include, in addition to sections a and c
above, the allocation of excess cost carried out on the acquisition date of CPV Group.
|