| Exhibit |
Description
|
|
NAYAX LTD.
|
|||
|
|
By:
|
/s/ Gal Omer | |
|
Name: Gal Omer
|
|||
|
Title: Chief Legal Officer
|
|||
|
|
(1) |
Adjusted EBITDA and Free Cash Flow are non-IFRS financial measures. Please refer to the tables at the end of this press release for a reconciliation of adjusted EBITDA and Free cash flow to the most directly comparable IFRS measure.
|
|
|
(2) |
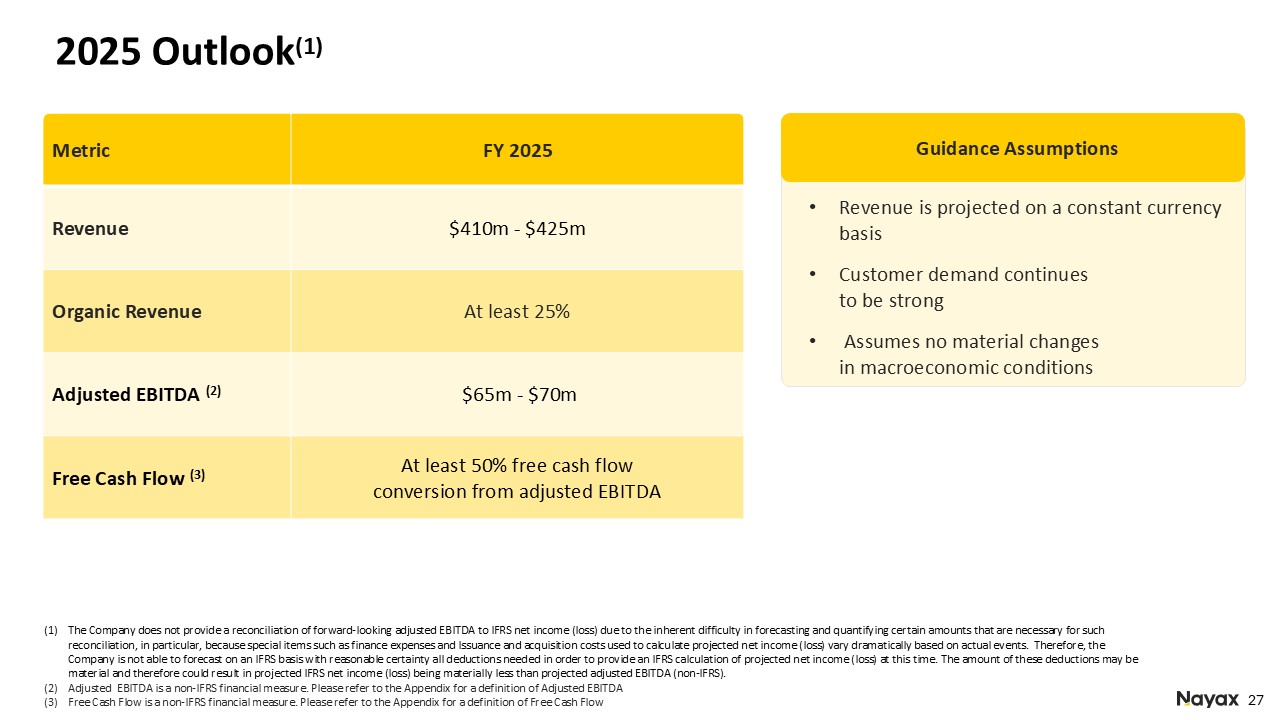
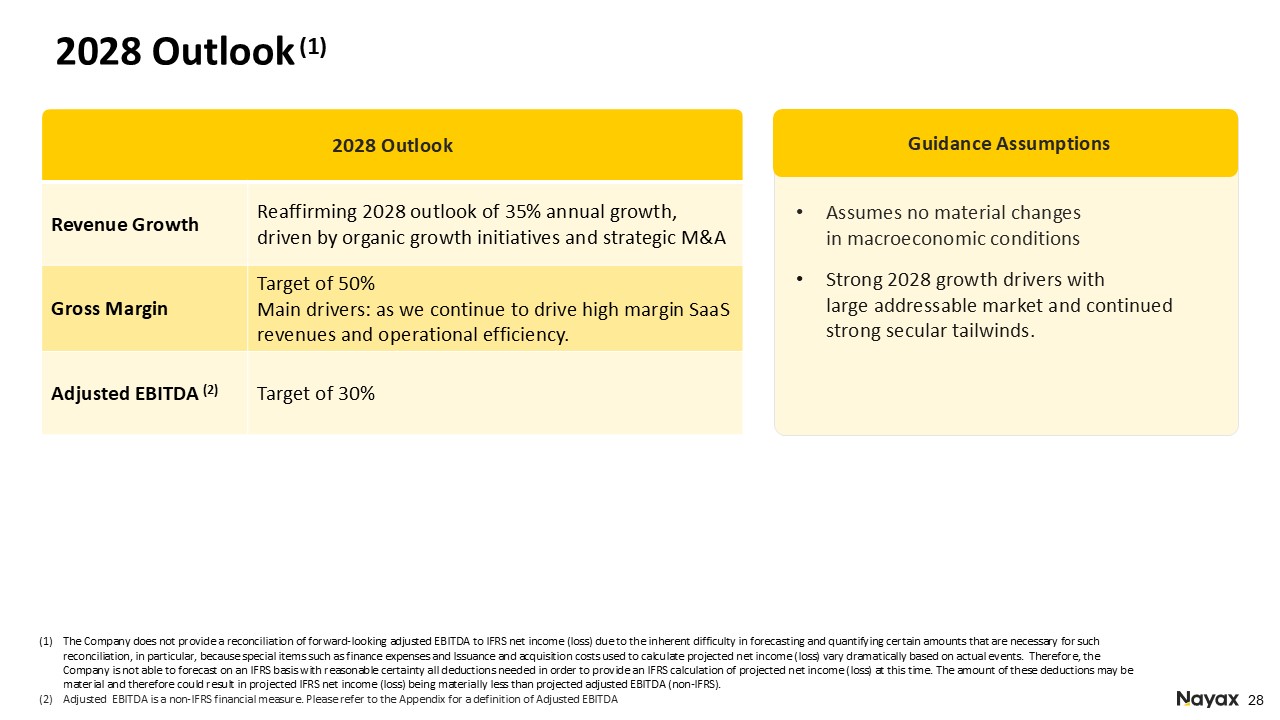
The Company does not provide a reconciliation of forward-looking adjusted EBITDA to IFRS net income (loss) due to the inherent difficulty in forecasting and quantifying certain amounts that are necessary for such reconciliation, in
particular, because special items such as finance expenses and Issuance and acquisition costs used to calculate projected net income (loss) vary dramatically based on actual events. Therefore, the Company is not able to forecast on an IFRS
basis with reasonable certainty all deductions needed in order to provide an IFRS calculation of projected net income (loss) at this time. The amount of these deductions may be material and therefore could result in projected IFRS net income
(loss) being materially less than projected adjusted EBITDA (non-IFRS).
|
|
Revenue
|
2024 ($M)
|
2023 ($M)
|
Growth (%)
|
|
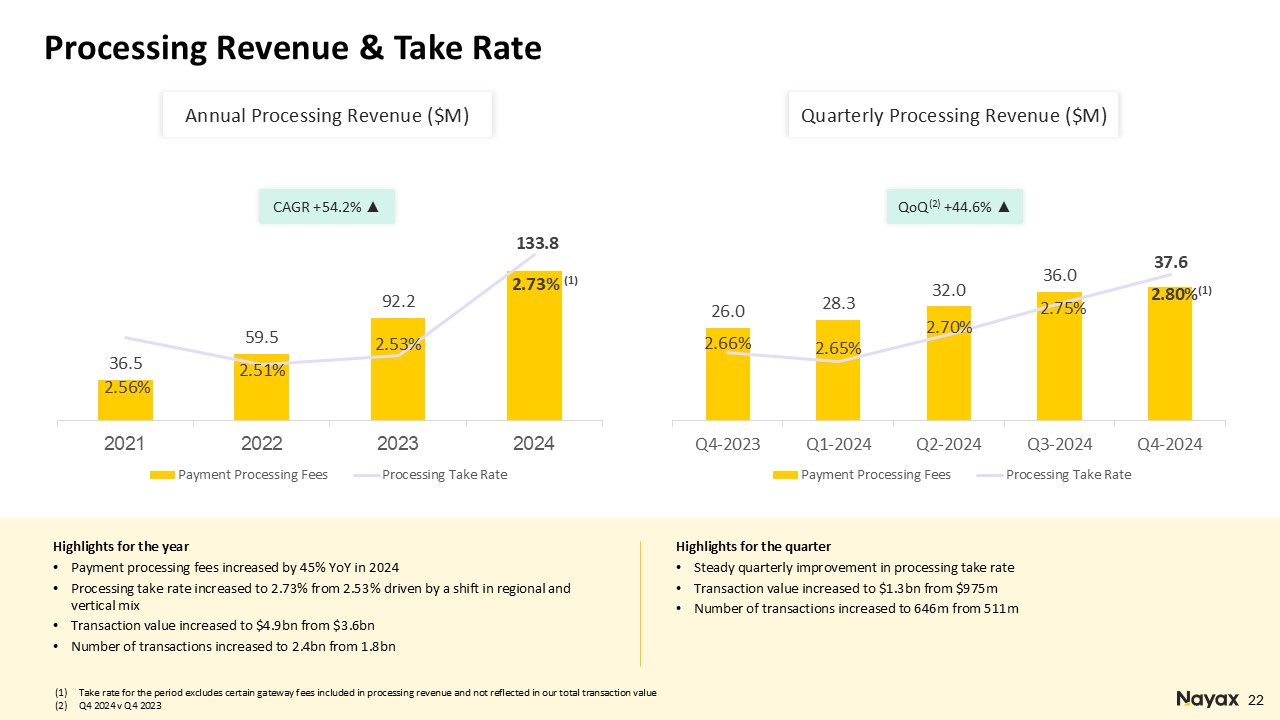
Payment processing fees
|
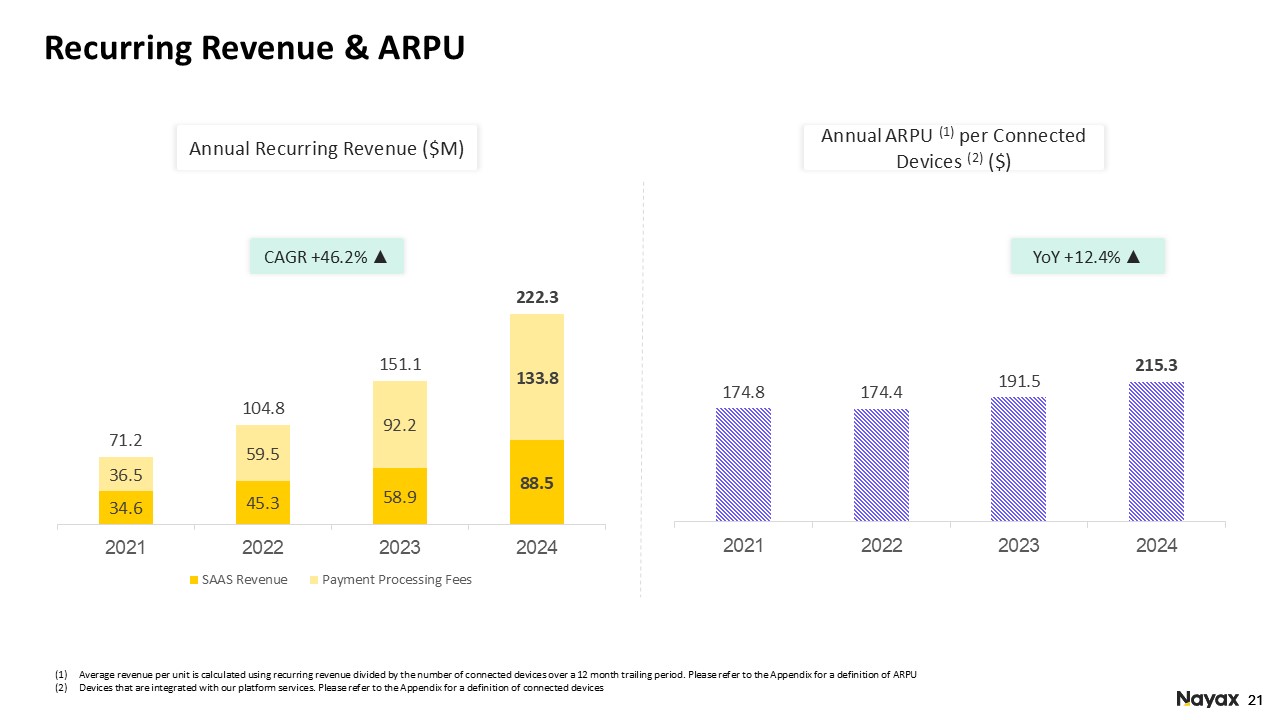
133.8
|
92.2
|
45.1%
|
|
SaaS revenue
|
88.5
|
58.9
|
50.3%
|
|
Total recurring revenue (1)
|
222.3
|
151.1
|
47.1 %
|
|
POS devices revenue (2)
|
91.7
|
84.4
|
8.6%
|
|
Total revenue (3)
|
314.0
|
235.5
|
33.3%
|
|
Margin
|
2024
|
2023
|
Variance
|
|
Payment processing margin
|
34.0%
|
29.1%
|
4.9%
|
|
SaaS margin
|
77.3%
|
77.2%
|
0.1%
|
|
Total recurring margin
|
51.3%
|
47.9%
|
3.4%
|
|
POS devices margin
|
30.1%
|
18.9%
|
11.2%
|
|
Total margin
|
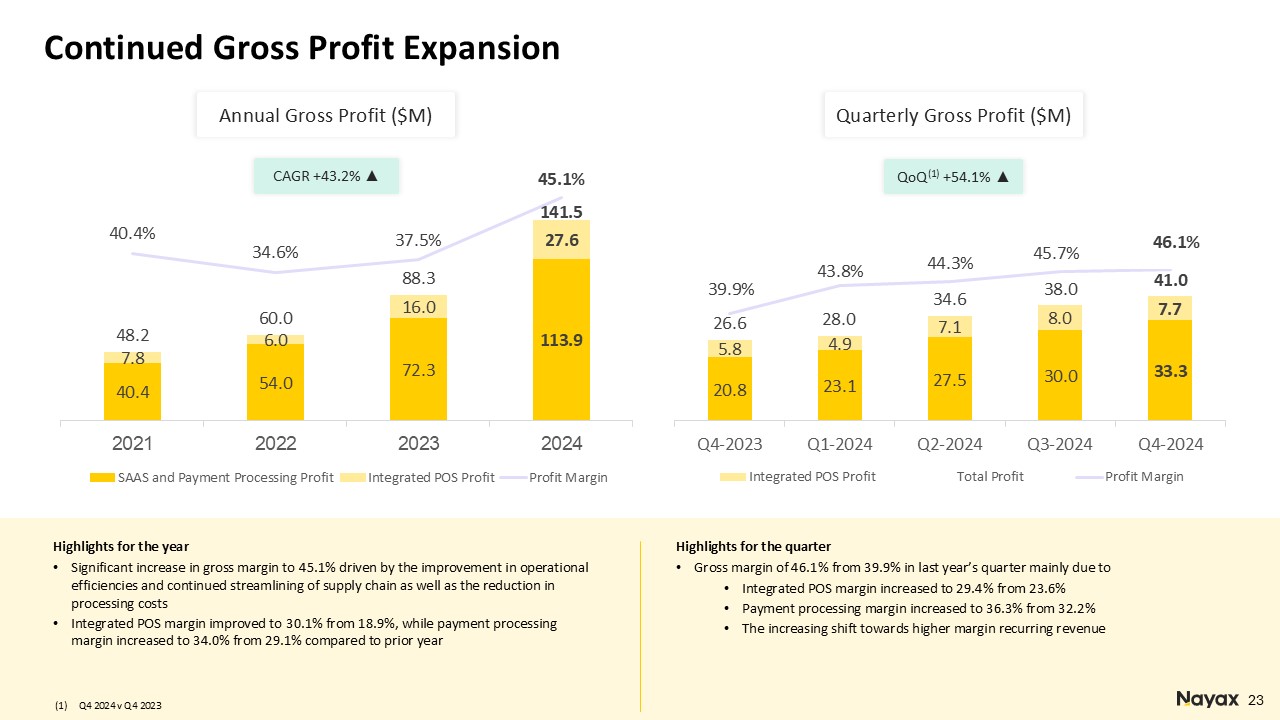
45.1%
|
37.5%
|
7.6%
|
|
|
• |
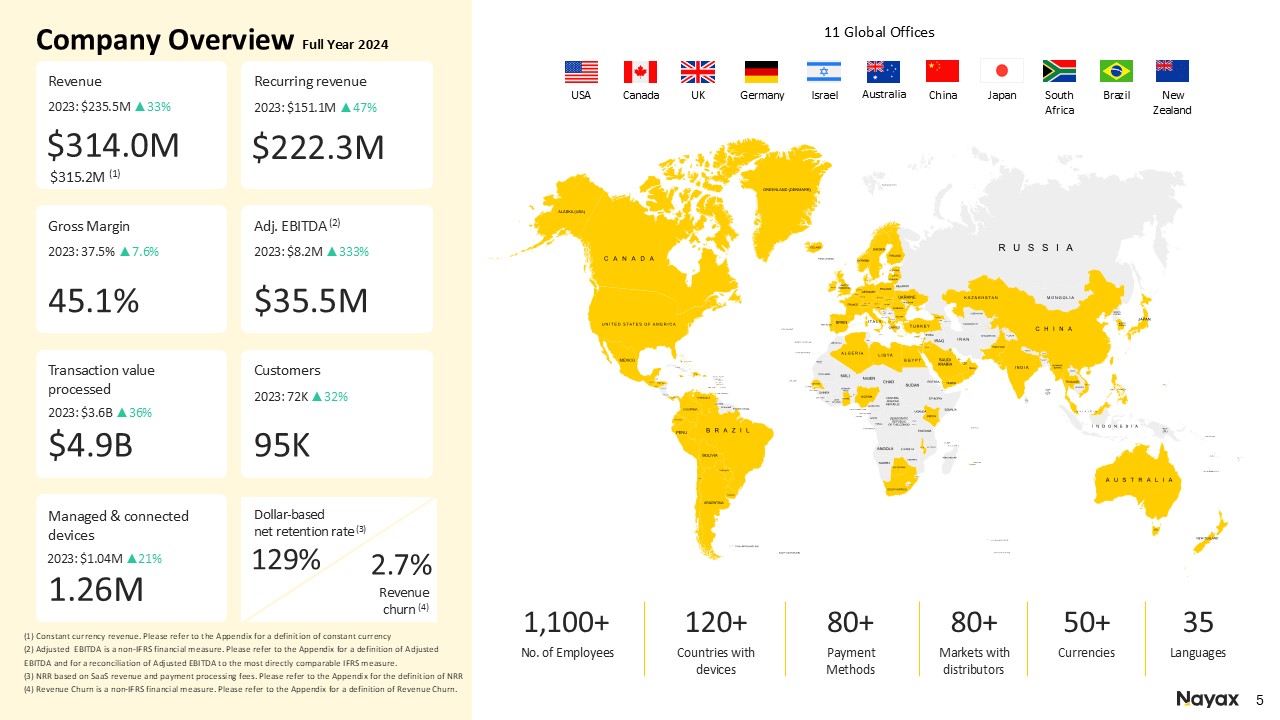
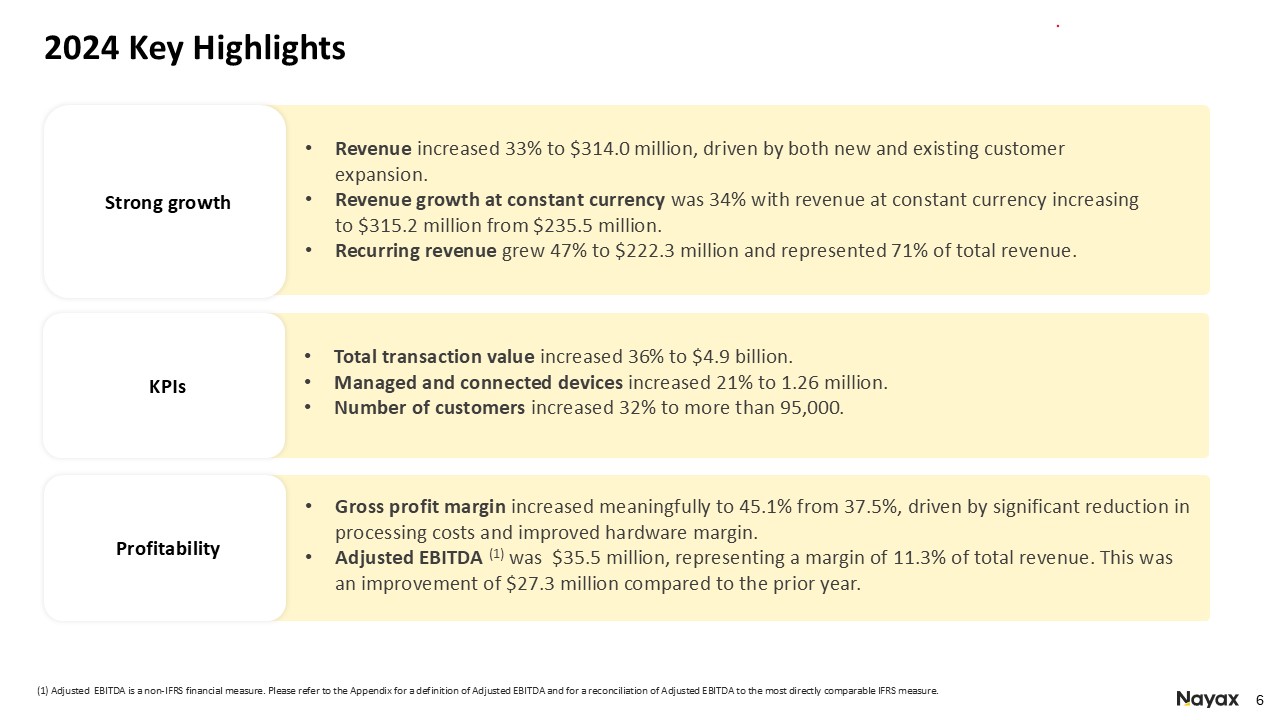
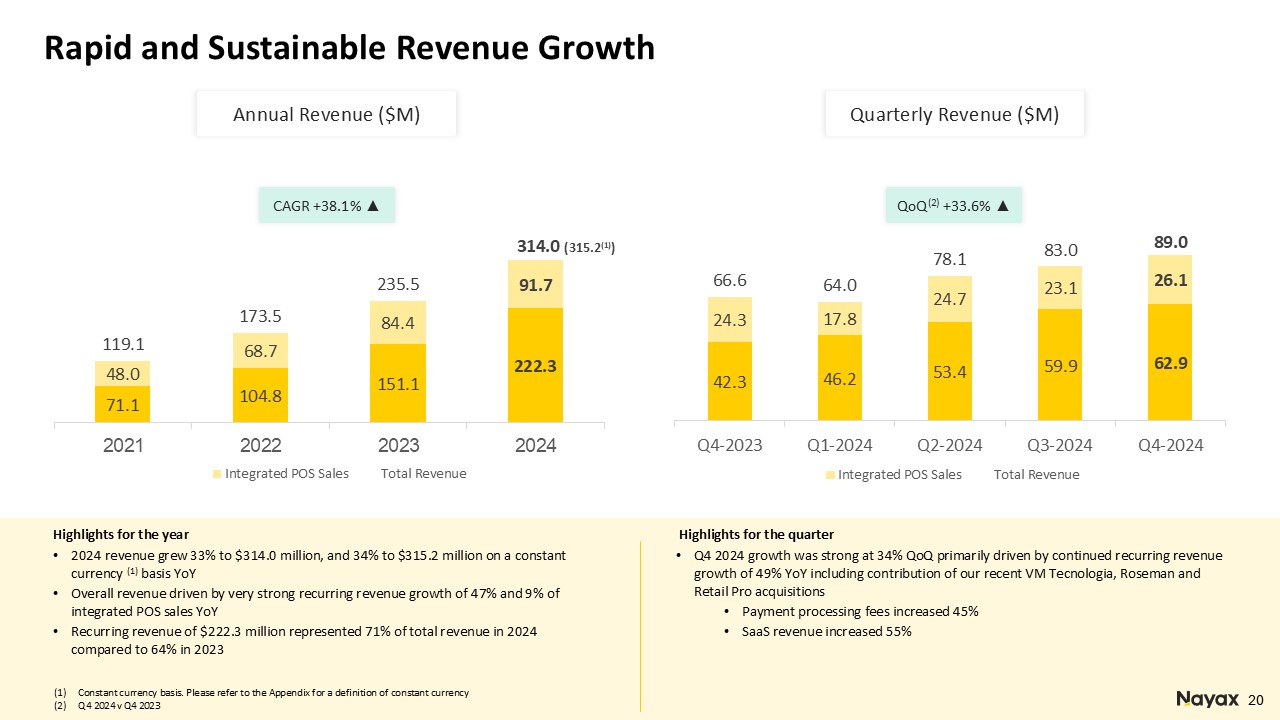
Revenue increased 33% to $314.0 million from $235.5 million in the prior year.
|
|
|
• |
Revenue at constant currency increased 34% to $315.2 million.
|
|
|
• |
Organic growth for the year was 23%.
|
|
|
• |
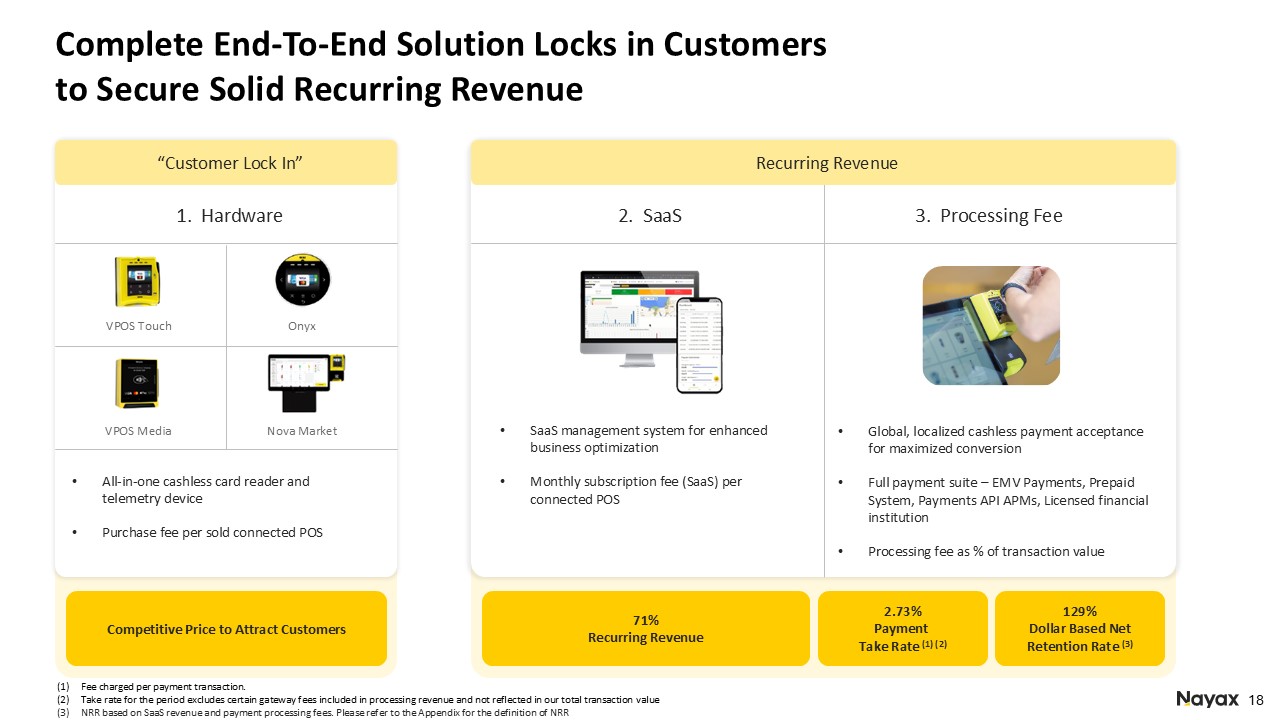
Our Recurring revenue engine remains our powerful growth driver. Payment processing fees and SaaS subscription revenues increased 47.1%, demonstrating the strength and resilience of our business model. Recurring revenue represented 71%
of total revenue.
|
|
|
• |
Hardware revenue increased by 9% with strong demand to our end-to-end automated cashless product solutions and technology, supporting both the attended and unattended markets.
|
|
|
• |
Gross margin improved significantly to 45.1% from 37.5%. This was primarily due to:
|
|
|
o |
Recurring margin improving to 51.3% from 47.9%, as we renegotiated key contracts with several bank acquirers and improved our smart-routing capabilities
|
|
|
o |
Hardware margin rose to 30.1% from 18.9%, as we continued to improve our supply chain efficiency and negotiated better component costs.
|
|
|
• |
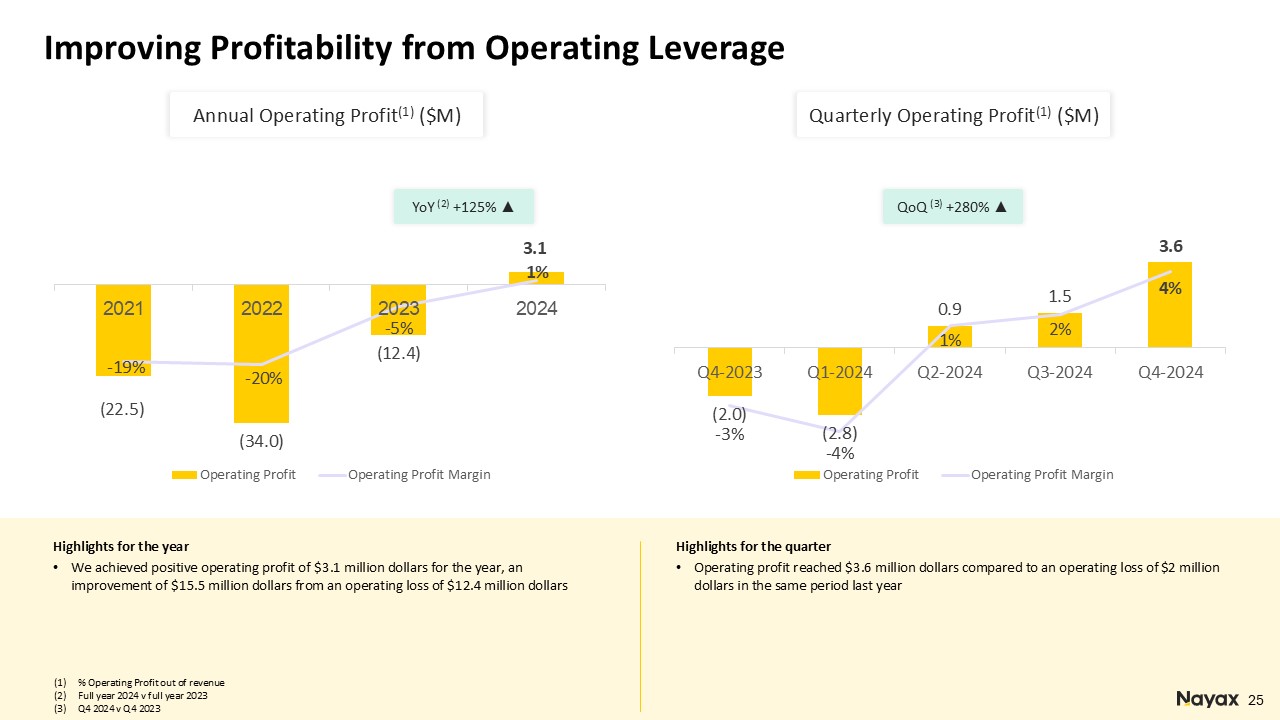
We achieved positive operating profit of $3.1 million for the year, an improvement of $15.5 million from an operating loss of $12.4 million.
|
|
|
• |
Finance expenses, Net of $7.5 million were mainly impacted by bank net interest, foreign currency volatility and earnout related to acquisitions.
|
|
|
• |
Net loss of $5.6 million compared to a net loss of $15.9 million.
|
|
|
• |
IFRS basic and diluted net loss per share was $(0.157) compared to IFRS basic and diluted net loss per share of $(0.479).
|
|
|
• |
Weighted average number of basic shares was 35,762,292 for the full year 2024 compared the weighted average number of basic shares 33,148,714 for the full year 2023
|
|
|
• |
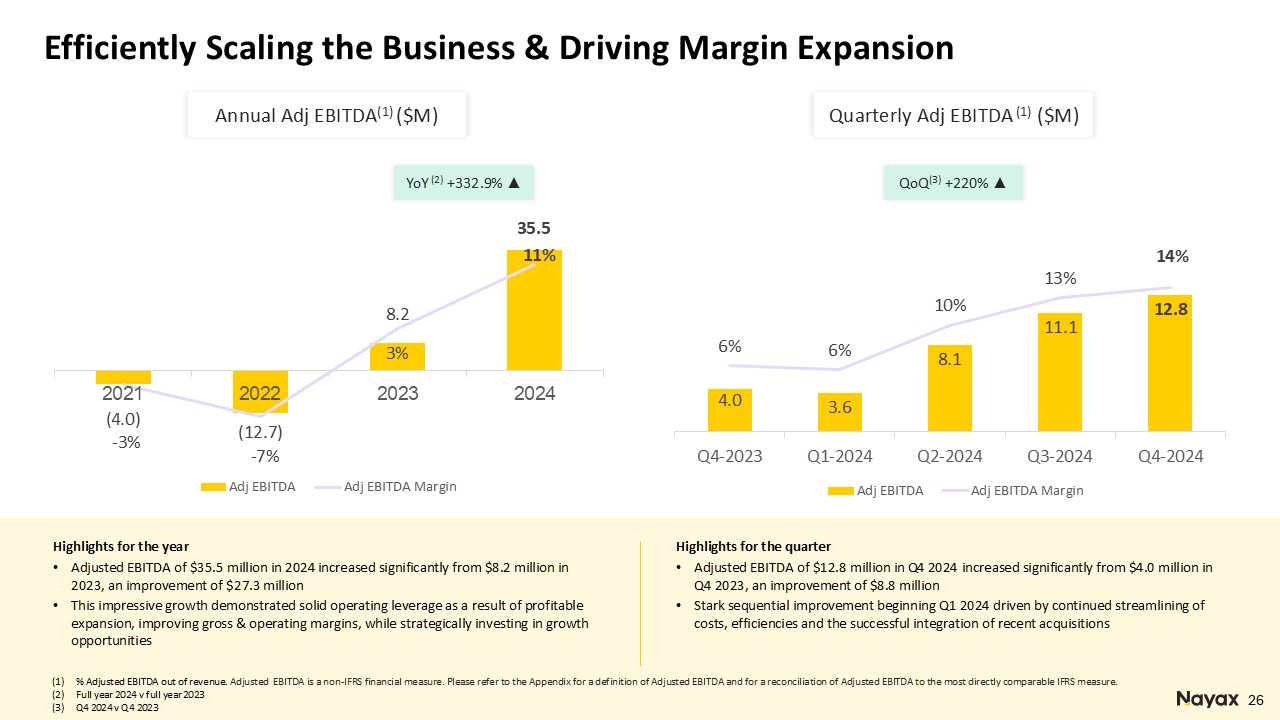
Adjusted EBITDA reached $35.5 million higher than our guidance range of $30 to $35 million, representing a margin of 11.3% from total revenue. This represented an improvement of $27.3 million compared to prior year period.
|
|
|
• |
Both revenue and adjusted EBITDA were impacted by a $3.4 million purchase accounting adjustment, related to a fair-value adjustment of deferred revenue from the Retail Pro acquisition which was closed in Q4 2023.
|
|
|
• |
Cash flow from operating activities of $42.9 million compared to $8.8 million
|
|
|
• |
Free cash flow was $18 million compared to a negative $7.8 million
|
|
Key Performance Indicators
|
2024
|
2023
|
Growth (%)
|
|
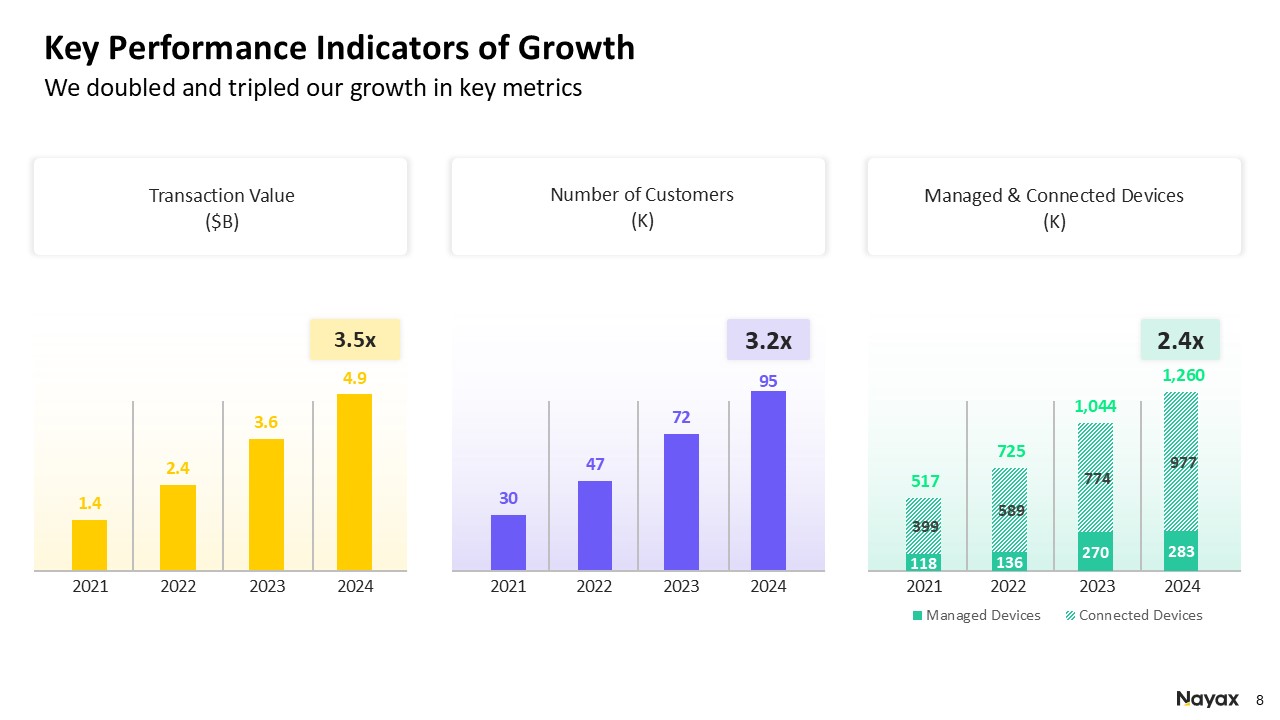
Total transaction value ($m)
|
4,900
|
3,600
|
36%
|
|
Number of processed transactions (millions)
|
2,400
|
1,800
|
33%
|
|
Take rate (payments) (1)
|
2.73%(2)
|
2.53%
|
0.2%
|
|
Managed and connected devices (thousands) (3)
|
1,260
|
1,044
|
21%
|
|
Customers (4)
|
95,060
|
72,253
|
32%
|
|
ARPU ($) (5)
|
215
|
192
|
12%
|
|
|
• |
Total transaction value grew by 36% to nearly $4.9 billion.
|
|
|
• |
Number of processed transactions increased 33% to approximately 2.4 billion.
|
|
|
• |
Take rate increased to 2.73%(2) from 2.53%.
|
|
|
• |
Total number of managed and connected devices reached approximately 1.26 million devices representing an impressive increase of 21%, driven by robust customer demand, with approximately 215,000 devices added in the year.
|
|
|
• |
Growth in the customer base continued at a healthy pace, adding about 23,000 new customers during the year, bringing the total customer base to more than 95,000, an increase of 32%.
|
|
|
• |
Average revenue per unit(5) (ARPU) for the trailing 12-month period ended December 31, 2024, increased 12% to $215, compared to $192 in the prior year period.
|
|
|
• |
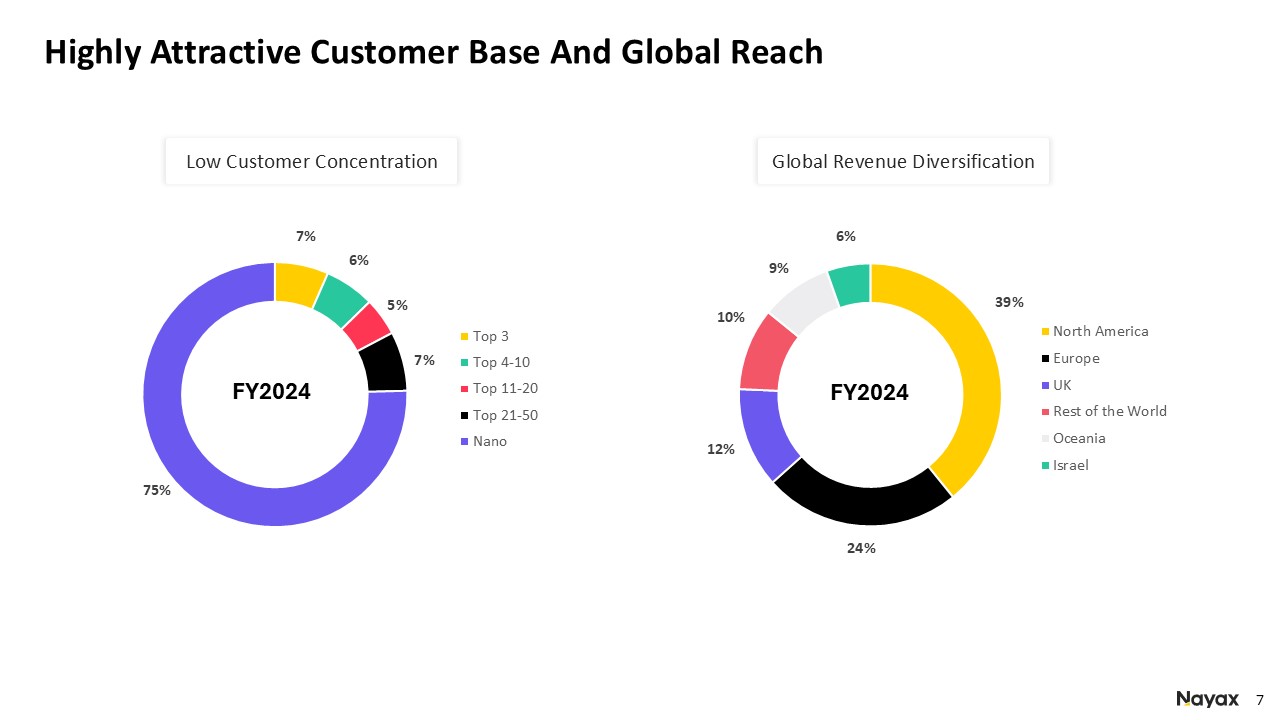
The dollar-based net retention rate remained high at 129%, reflecting strong customer satisfaction, while the customer churn rate remained low at 2.7%.
|
|
Revenue Summary
|
Q4 2024 ($M)
|
Q4 2023 ($M)
|
Growth (%)
|
|
Payment processing fees
|
37.6
|
26.0
|
44.6%
|
|
SaaS revenue
|
25.3
|
16.3
|
55.2%
|
|
Total recurring revenue (1)
|
62.9
|
42.3
|
48.7%
|
|
POS devices revenue (2)
|
26.1
|
24.3
|
7.4%
|
|
Total revenue (3)
|
89.0
|
66.6
|
33.6%
|
|
Margin Summary
|
Q4 2024
|
Q4 2023
|
Variance
|
|
Payment processing margin
|
36.3%
|
32.2%
|
4.1%
|
|
SaaS margin
|
77.6%
|
76.7%
|
0.9%
|
|
Total recurring margin
|
53.0%
|
49.3%
|
3.7%
|
|
POS devices margin
|
29.4%
|
23.6%
|
5.8%
|
|
Total margin
|
46.1%
|
39.9%
|
6.2%
|
|
|
• |
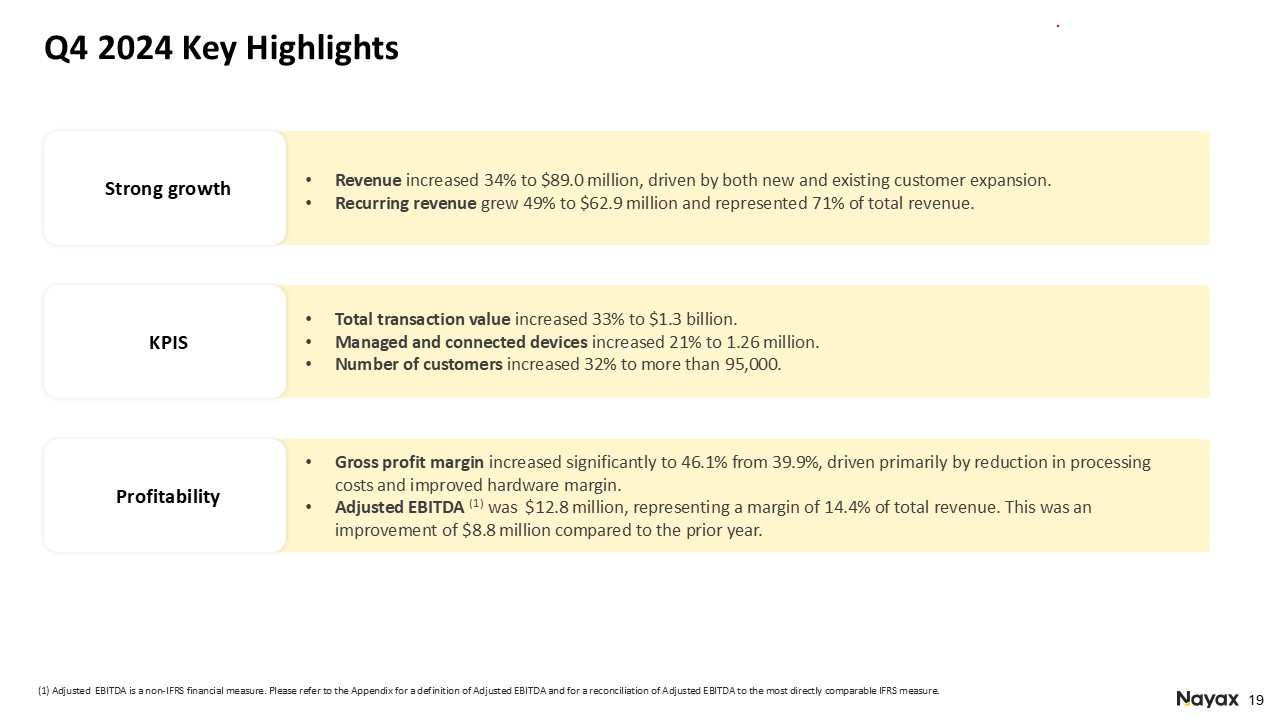
Revenue increased 33.6% to $89.0 million, driven by both new and existing customer expansion.
|
|
|
• |
Recurring revenue from SaaS and payment processing fees grew 48.7%, demonstrating the strength and resilience of our business model. Recurring revenue represented 71% of total revenue.
|
|
|
• |
Hardware revenue increased by 7.4% with strong demand to our end-to-end automated cashless product solutions and technology, supporting both the attended and unattended markets.
|
|
|
• |
Gross margin improved significantly to 46.1% from 39.9%. This was primarily due to:
|
|
|
o |
Recurring margin improving to 53.0% from 49.3%, as we renegotiated key contracts with several bank acquirers and improved our smart-routing capabilities
|
|
|
o |
Hardware margin rose to 29.4% from 23.6%, as we continued to improve our supply chain efficiency and negotiated better component costs.
|
|
|
• |
Operating profit of $3.6 million compared to an operating loss of $2.0 million.
|
|
|
• |
Net income was $1.6 million compared to a loss of $3.3 million, an improvement of $4.9 million over the period.
|
|
|
• |
IFRS basic net profit per share was $0.045 and IFRS diluted net profit per share was $0.044 compared to IFRS basic and diluted net loss per share of $(0.10).
|
|
|
• |
Weighted average number of basic and diluted shares were 36,536,969 and 37,264,185, respectively, for the fourth quarter of 2024 compared the weighted average number of basic shares 33,315,257 for the fourth quarter of 2023.
|
|
|
• |
Adjusted EBITDA was $12.8 million, representing a margin of 14.4% of total revenue. This was an improvement of $8.8 million compared to prior year period.
|
|
|
• |
Cash flow from operating activities of $17 million compared to $4.6 million in the prior year period, while free cash flow was $9.3 million compared to $0.6 million in the prior year period.
|
|
|
• |
As of December 31, 2024, the Company had $92.5 million in cash and cash equivalents and short-term deposits. Short-term and long-term debt balances stood at $47.9 million.
|
|
Key Performance Indicators
|
Q4 2024
|
Q4 2023
|
Growth (%)
|
|
Total transaction value ($m)
|
1,300
|
975
|
33%
|
|
Number of processed transactions (millions)
|
650
|
500
|
30%
|
|
Take rate (payments) (1)
|
2.80%(2)
|
2.66%
|
0.14%
|
|
Managed and connected devices (thousands) (3)
|
1,260
|
1,044
|
21%
|
|
Customers (4)
|
95,060
|
72,253
|
32%
|
|
ARPU ($) (5)
|
215
|
192
|
12%
|
|
|
• |
Total transaction value grew by 33% to more than $1.3 billion.
|
|
|
• |
Number of processed transactions increased 30% to almost 650 million.
|
|
|
• |
Take rate increased to 2.80%(2) from 2.66% as we continue to expand to additional verticals.
|
|
|
• |
Total number of managed and connected devices reached approximately 1.26 million devices representing an increase of 21% year-over-year, driven by robust customer demand, adding approximately 33,000 devices in the quarter.
|
|
|
• |
Growth in the customer base continued at a healthy pace, adding about 4,200 new customers in the quarter, bringing the total customer base to more than 95,000, an increase of 32% year-over-year.
|
|
|
• |
The dollar-based net retention rate remained high at 129%, reflecting strong customer satisfaction, while the customer churn rate remained low at 2.7%.
|
|
|
• |
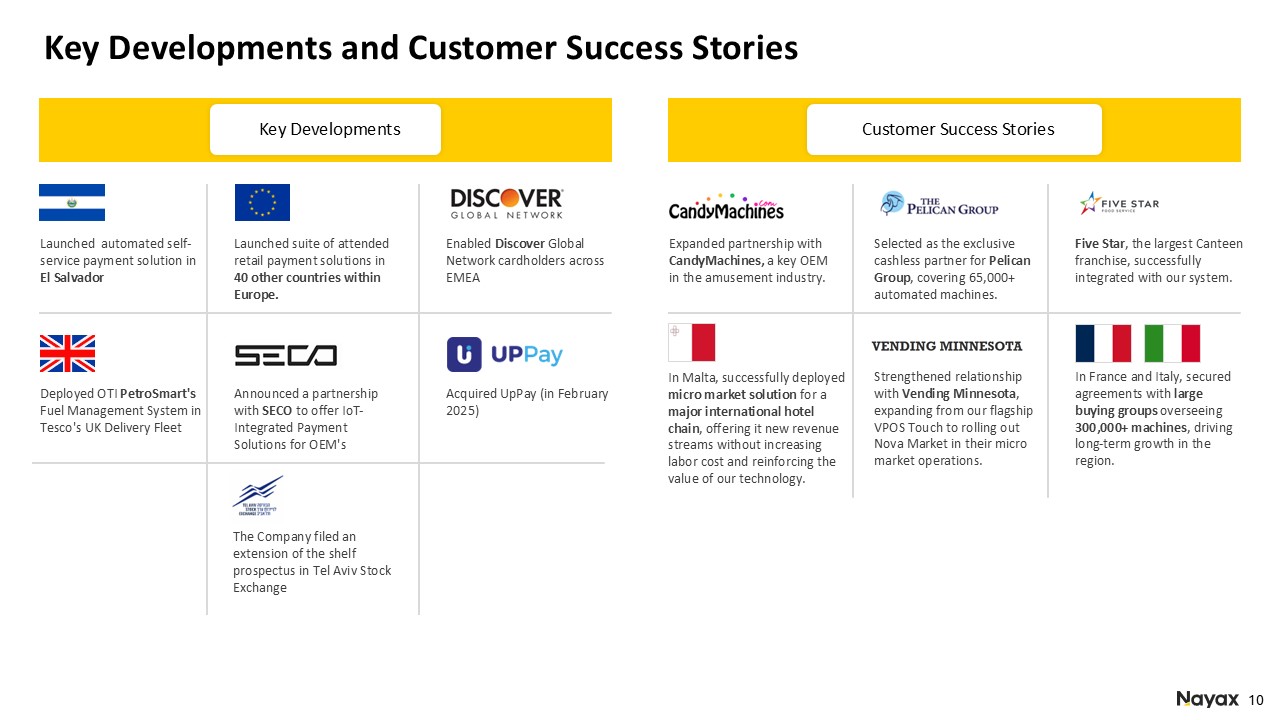
Launched Nayax’s automated self-service payment solution in El Salvador, accelerating the Company’s expansion into Latin America and improving access to secure cashless payments in an underserved market. Nayax has invested heavily
in full Spanish-language commercial and technical support to deliver exceptional customer experiences and support further regional expansion.
|
|
|
• |
Launched Nayax’s suite of attended retail payment solutions in Europe, introducing merchants in 40 new markets to our versatile and powerful retail POS devices and enabling existing customers to access a broader range of
solutions. European retailers can now streamline operations and cut costs by managing all of their points of sale, both attended and unattended, through our one powerful platform.
|
|
|
• |
Enabled Discover Global Network cardholders to make payments through Nayax across EMEA, expanding payment access for Discover’s 345+ million valued customers to tens of thousands of Nayax machines across the region.
|
|
|
• |
Deployed OTI PetroSmart’s Fuel Management System in Tesco’s UK Delivery Fleet, helping Tesco cut costs, accelerate automation, and support sustainable operations across its fleet of tractor units, refrigerated trailers, box
trucks, delivery vans, lorries, and diverse industrial vehicles. Tesco is leveraging our precise, automatic fuel dispensing to eliminate human error, reduce waste, and optimize resource use.
|
|
|
• |
Announced a partnership with SECO to offer IoT-Integrated Payment Solutions for OEM’s, which combine seamless and secure payments with remote machine management and AI-driven business intelligence. OEMs will gain access to
differentiated, cost optimized hardware which contains a combination of SECO’s industry-leading IoT capabilities and Nayax’s versatile payment platform.
|
|
|
• |
On February 11, 2025, the Company filed an extension of the shelf prospectus in Tel Aviv Stock Exchange
|
|
|
• |
On February 28, 2025, the Company announced the acquisition of UpPay: UpPay more than doubles Nayax’s connected devices footprint in Brazil, adding over 25,000 unattended devices, primarily in self-service coffee
vending machines. UpPay manages the networks of two of the largest coffee operators in Brazil and supports hundreds of other customers. Integrating UpPay with our last year’s acquisition of VMtecnologia creates a larger, more scalable
platform that accelerates Nayax’s expansion across Latin America.
|
|
|
• |
U.S. TOLL-FREE: 1-877-737-7051
|
|
|
• |
ISRAEL TOLL-FREE: 1-809-455-690
|
|
|
• |
INTERNATIONAL: 1-201-689-8878
|
|
|
• |
Replay TOLL-FREE: 1-844-512-2921
|
|
|
• |
Replay TOLL/INTERNATIONAL: 1-412-317-6671
|
|
|
• |
Replay TOLL/Israel: 1-809-458-327
|
|
|
• |
Replay Pin Number: 13751481
|
|
Public Relations Contact:
Scott Gamm
Strategy Voice Associates
Scott@strategyvoiceassociates.com
|
Investor Relations Contact:
Aaron Greenberg
Chief Strategy Officer
IR@nayax.com
|
|
Page
|
|
| 16 | |
|
Consolidated financial statements – in thousands of US Dollars:
|
|
|
17-18
|
|
|
19
|
|
|
20
|
|
|
21
|
|
|
22-23
|

|
Tel Aviv, Israel
|
/s/ Kesselman & Kesselman
|
|
March 4, 2025
|
Certified Public Accountants (Isr.)
|
|
A member firm of PricewaterhouseCoopers International Limited
|
|
Kesselman & Kesselman, Azrieli Town Tower, 146 Derech Menachem Begin St, Tel- Aviv, 6492103, Israel
|
|
P.O BOX 7187 Tel-Aviv, 6107120, Israel Telephone: +972 -3- 7954555, Fax:+972 -3- 7954556, www.pwc.com/il
|
|
December 31
|
|||||||||||
|
2024
|
2023
|
||||||||||
|
Note
|
U.S. dollars in thousands
|
||||||||||
|
ASSETS
|
|||||||||||
|
CURRENT ASSETS:
|
|||||||||||
|
Cash and cash equivalents
|
7
|
83,130
|
38,386
|
||||||||
|
Restricted cash transferable to customers for processing activity
|
8
|
60,299
|
49,858
|
||||||||
|
Short-term bank deposits
|
9,327
|
1,269
|
|||||||||
|
Receivables in respect of processing activity
|
45,071
|
43,261
|
|||||||||
|
Trade receivable, net
|
9
|
55,694
|
41,300
|
||||||||
|
Inventory
|
19,768
|
20,563
|
|||||||||
|
Other current assets
|
14,368
|
8,772
|
|||||||||
|
Total current assets
|
287,657
|
203,409
|
|||||||||
|
NON-CURRENT ASSETS:
|
|||||||||||
|
Long-term bank deposits
|
2,155
|
2,304
|
|||||||||
|
Other long-term assets
|
4,253
|
5,883
|
|||||||||
|
Investment in associates
|
3,754
|
5,024
|
|||||||||
|
Right-of-use assets, net
|
10
|
6,292
|
5,341
|
||||||||
|
Property and equipment, net
|
11
|
11,112
|
5,487
|
||||||||
|
Goodwill and intangible assets, net
|
12
|
117,670
|
96,411
|
||||||||
|
Total non-current assets
|
145,236
|
120,450
|
|||||||||
|
TOTAL ASSETS
|
432,893
|
323,859
|
|||||||||
|
December 31
|
|||||||||||
|
2024
|
2023
|
||||||||||
|
Note
|
U.S. dollars in thousands
|
||||||||||
|
LIABILITIES AND EQUITY
|
|||||||||||
|
CURRENT LIABILITIES:
|
|||||||||||
|
Short-term bank credit and short term loan
|
13a.
|
25,276
|
47,477
|
||||||||
|
Current maturities of long-term bank loans
|
13b.
|
3,978
|
1,101
|
||||||||
|
Current maturities of other long-term liabilities
|
1,353
|
5,422
|
|||||||||
|
Current maturities of leases liabilities
|
10
|
2,967
|
2,145
|
||||||||
|
Payables in respect of processing activity
|
130,958
|
104,523
|
|||||||||
|
Trade payables
|
21,059
|
17,464
|
|||||||||
|
Other payables
|
33,887
|
25,650
|
|||||||||
|
Total current liabilities
|
219,478
|
203,782
|
|||||||||
|
NON-CURRENT LIABILITIES:
|
|||||||||||
|
Long-term bank loans
|
13b.
|
18,605
|
327
|
||||||||
|
Other long-term liabilities
|
14
|
20,716
|
14,476
|
||||||||
|
Post-employment benefit obligations, net
|
497
|
427
|
|||||||||
|
Lease liabilities
|
10
|
4,078
|
4,149
|
||||||||
|
Deferred income taxes
|
15
|
4,274
|
3,108
|
||||||||
|
Total non-current liabilities
|
48,170
|
22,487
|
|||||||||
|
TOTAL LIABILITIES
|
267,648
|
226,269
|
|||||||||
|
EQUITY:
|
16
|
||||||||||
|
Shareholders Equity:
|
|||||||||||
|
Share capital
|
9
|
8
|
|||||||||
|
Additional paid in capital
|
220,715
|
153,524
|
|||||||||
|
Capital reserves
|
7,832
|
9,643
|
|||||||||
|
Accumulated deficit
|
(63,311
|
)
|
(65,585
|
)
|
|||||||
|
TOTAL EQUITY
|
165,245
|
97,590
|
|||||||||
|
TOTAL LIABILITIES AND EQUITY
|
432,893
|
323,859
|
|||||||||
|
Year ended December 31
|
|||||||||||||||
|
2024
|
2023
|
2022
|
|||||||||||||
|
U.S. dollars in thousands
|
|||||||||||||||
|
Note
|
(Excluding loss per share data)
|
||||||||||||||
|
Revenues
|
17
|
314,013
|
235,491
|
173,514
|
|||||||||||
|
Cost of revenues
|
18
|
(172,479
|
)
|
(147,198
|
)
|
(113,476
|
)
|
||||||||
|
Gross Profit
|
141,534
|
88,293
|
60,038
|
||||||||||||
|
Research and development expenses
|
19
|
(25,374
|
)
|
(21,928
|
)
|
(22,132
|
)
|
||||||||
|
Selling, general and administrative expenses
|
20
|
(98,196
|
)
|
(70,320
|
)
|
(64,092
|
)
|
||||||||
|
Depreciation and amortization in respect of technology and capitalized development costs
|
12
|
(11,566
|
)
|
(6,430
|
)
|
(4,268
|
)
|
||||||||
|
Other expenses
|
1a, 25
|
(2,023
|
)
|
(444
|
)
|
(1,790
|
)
|
||||||||
|
Share of losses of equity method investees
|
(1,270
|
)
|
(1,555
|
)
|
(1,794
|
)
|
|||||||||
|
Profit (Loss) from ordinary operations
|
3,105
|
(12,384
|
)
|
(34,038
|
)
|
||||||||||
|
Financial Income
|
21
|
3,408
|
2,493
|
438
|
|||||||||||
|
Financial Expense
|
21
|
(10,897
|
)
|
(4,781
|
)
|
(3,458
|
)
|
||||||||
|
Loss before taxes on income
|
(4,384
|
)
|
(14,672
|
)
|
(37,058
|
)
|
|||||||||
|
Tax expenses
|
15
|
(1,247
|
)
|
(1,215
|
)
|
(451
|
)
|
||||||||
|
Loss for the year
|
(5,631
|
)
|
(15,887
|
)
|
(37,509
|
)
|
|||||||||
|
Loss per share attributed to shareholders of the Company:
|
|||||||||||||||
|
Basic and diluted loss per share
|
22
|
(0.157
|
)
|
(0.479
|
)
|
(1.143
|
)
|
||||||||
|
Year ended December 31
|
||||||||||||
|
2024
|
2023
|
2022
|
||||||||||
|
U.S. dollars in thousands
|
||||||||||||
|
Loss for the year
|
(5,631
|
)
|
(15,887
|
)
|
(37,509
|
)
|
||||||
|
Other comprehensive income (loss) for the year:
|
||||||||||||
|
Items that will not be recycled to profit or loss:
|
||||||||||||
|
Gain (loss) from remeasurement of liabilities (net) in
|
||||||||||||
|
respect of post-employment benefit obligations
|
215
|
-
|
146
|
|||||||||
|
Items that may be recycled to profit or loss:
|
||||||||||||
|
Gain (loss) from translation of financial statements of foreign activities
|
(2,454
|
)
|
(170
|
)
|
(374
|
)
|
||||||
|
Gains on cash flow hedges
|
428
|
42
|
-
|
|||||||||
|
Total comprehensive loss for the year
|
(7,442
|
)
|
(16,015
|
)
|
(37,737
|
)
|
||||||
|
Equity attributed to shareholders of the Company
|
||||||||||||||||||||||||||||
|
Share
capital |
Additional paid in capital
|
Remeasurement of post-employment benefit obligations
|
Other capital reserves
|
Foreign currency translation reserve
|
Accumulated
deficit |
Total
equity |
||||||||||||||||||||||
|
U.S. dollars in thousands
|
||||||||||||||||||||||||||||
|
Balance as of January 1, 2022
|
8
|
150,366
|
102
|
9,503
|
394
|
(28,697
|
)
|
131,676
|
||||||||||||||||||||
|
Changes during the year;
|
||||||||||||||||||||||||||||
|
Loss for the year
|
(37,509
|
)
|
(37,509
|
)
|
||||||||||||||||||||||||
|
Other comprehensive income (loss) for the year
|
-
|
-
|
146
|
-
|
(374
|
)
|
-
|
(228
|
)
|
|||||||||||||||||||
|
Employee options exercised
|
*
|
1,040
|
-
|
-
|
-
|
-
|
1,040
|
|||||||||||||||||||||
|
Share-based payment
|
-
|
-
|
-
|
-
|
-
|
9,656
|
9,656
|
|||||||||||||||||||||
|
Balance as of December 31, 2022
|
8
|
151,406
|
248
|
9,503
|
20
|
(56,550
|
)
|
104,635
|
||||||||||||||||||||
|
Balance as of January 1, 2023
|
8
|
151,406
|
248
|
9,503
|
20
|
(56,550
|
)
|
104,635
|
||||||||||||||||||||
|
Changes during the year;
|
||||||||||||||||||||||||||||
|
Loss for the year
|
-
|
-
|
-
|
-
|
(15,887
|
)
|
(15,887
|
)
|
||||||||||||||||||||
|
Other comprehensive income (loss) for the year
|
-
|
-
|
-
|
42
|
(170
|
)
|
-
|
(128
|
)
|
|||||||||||||||||||
|
Employee options exercised and vesting of restricted shares
|
*
|
2,118
|
-
|
-
|
-
|
-
|
2,118
|
|||||||||||||||||||||
|
Share-based payment
|
-
|
-
|
-
|
-
|
-
|
6,852
|
6,852
|
|||||||||||||||||||||
|
Balance as of December 31, 2023
|
8
|
153,524
|
248
|
9,545
|
(150
|
)
|
(65,585
|
)
|
97,590
|
|||||||||||||||||||
|
Balance as of January 1, 2024
|
8
|
153,524
|
248
|
9,545
|
(150
|
)
|
(65,585
|
)
|
97,590
|
|||||||||||||||||||
|
Changes during the year;
|
||||||||||||||||||||||||||||
|
Loss for the year
|
-
|
-
|
-
|
-
|
(5,631
|
)
|
(5,631
|
)
|
||||||||||||||||||||
|
Other comprehensive income (loss) for the year
|
-
|
-
|
215
|
428
|
(2,454
|
)
|
-
|
(1,811
|
)
|
|||||||||||||||||||
|
Issuance of ordinary shares
|
1
|
63,190
|
-
|
-
|
-
|
-
|
63,191
|
|||||||||||||||||||||
|
Employee options exercised and vesting of restricted shares
|
*
|
4,001
|
-
|
-
|
-
|
-
|
4,001
|
|||||||||||||||||||||
|
Share-based payment
|
-
|
-
|
-
|
-
|
-
|
7,905
|
7,905
|
|||||||||||||||||||||
|
Balance as of December 31, 2024
|
9
|
220,715
|
463
|
9,973
|
(2,604
|
)
|
(63,311
|
)
|
165,245
|
|||||||||||||||||||
|
Year ended December 31
|
||||||||||||
|
2024
|
2023
|
2022
|
||||||||||
|
U.S. dollars in thousands
|
||||||||||||
|
CASH FLOWS FROM OPERATING ACTIVITIES:
|
||||||||||||
|
Loss for the year
|
(5,631
|
)
|
(15,887
|
)
|
(37,509
|
)
|
||||||
|
Adjustments required to reflect the cash flow from operating activities (see Appendix A)
|
48,533
|
24,685
|
9,962
|
|||||||||
|
Net cash provided by (used in) operating activities
|
42,902
|
8,798
|
(27,547
|
)
|
||||||||
|
CASH FLOWS FROM INVESTING ACTIVITIES:
|
||||||||||||
|
Capitalized development costs
|
(21,893
|
)
|
(15,948
|
)
|
(13,706
|
)
|
||||||
|
Acquisition of property and equipment
|
(3,081
|
)
|
(611
|
)
|
(1,518
|
)
|
||||||
|
Loans granted to related company
|
(559
|
)
|
(1,432
|
)
|
-
|
|||||||
|
Increase in bank deposits
|
(7,952
|
)
|
(2,154
|
)
|
(480
|
)
|
||||||
|
Payments for acquisitions of subsidiaries, net of cash acquired
|
(14,934
|
)
|
(18,329
|
)
|
440
|
|||||||
|
Payment of deferred consideration with respect to business combinations
|
(555
|
)
|
-
|
(4,500
|
)
|
|||||||
|
Interest received
|
3,108
|
1,683
|
76
|
|||||||||
|
Investments in financial assets
|
(283
|
)
|
(195
|
)
|
(6,856
|
)
|
||||||
|
Proceeds from sub-lessee
|
243
|
155
|
-
|
|||||||||
|
Net cash used in investing activities
|
(45,906
|
)
|
(36,831
|
)
|
(26,544
|
)
|
||||||
|
CASH FLOWS FROM FINANCING ACTIVITIES:
|
||||||||||||
|
Issuance of ordinary shares
|
62,686
|
-
|
-
|
|||||||||
|
Interest paid
|
(4,549
|
)
|
(2,651
|
)
|
(504
|
)
|
||||||
|
Changes in short-term bank credit and short term loan
|
(23,315
|
)
|
39,135
|
5,874
|
||||||||
|
Transactions with non-controlling interests
|
-
|
-
|
(186
|
)
|
||||||||
|
Receipt of long-term bank loans
|
22,835
|
-
|
-
|
|||||||||
|
Repayment of long-term bank loans
|
(3,177
|
)
|
(998
|
)
|
(2,282
|
)
|
||||||
|
Receipt of long-term loans from others
|
-
|
-
|
6,908
|
|||||||||
|
Repayment of long-term loans from others
|
(3,837
|
)
|
(3,626
|
)
|
(2,577
|
)
|
||||||
|
Repayment of other long-term liabilities
|
(1,100
|
)
|
(304
|
)
|
(328
|
)
|
||||||
|
Employee options exercised
|
3,956
|
2,177
|
1,152
|
|||||||||
|
Principal lease payments
|
(2,655
|
)
|
(2,182
|
)
|
(1,851
|
)
|
||||||
|
Net cash provided by financing activities
|
50,844
|
31,551
|
6,206
|
|||||||||
|
Increase (Decrease) in cash and cash equivalents
|
47,840
|
3,518
|
(47,885
|
)
|
||||||||
|
Balance of cash and cash equivalents at beginning of year
|
38,386
|
33,880
|
87,332
|
|||||||||
|
Gains (losses) from exchange differences on cash and cash equivalents
|
(2,688
|
)
|
906
|
(6,189
|
)
|
|||||||
|
Gains (losses) from translation of cash and cash equivalents of foreign activity
|
(408
|
)
|
82
|
622
|
||||||||
|
Balance of cash and cash equivalents at end of year
|
83,130
|
38,386
|
33,880
|
|||||||||
|
Year ended December 31
|
||||||||||||
|
2024
|
2023
|
2022
|
||||||||||
|
U.S. dollars in thousands
|
||||||||||||
|
Appendix A – adjustments required to reflect the cash flows from operating activities:
|
||||||||||||
|
Adjustments in respect of:
|
||||||||||||
|
Depreciation and amortization
|
21,370
|
12,505
|
9,028
|
|||||||||
|
Post-employment benefit obligations, net
|
(17
|
)
|
25
|
(107
|
)
|
|||||||
|
Deferred taxes
|
(1,358
|
)
|
(294
|
)
|
(181
|
)
|
||||||
|
Finance expenses, net
|
6,570
|
750
|
4,544
|
|||||||||
|
Expenses in respect of long-term employee benefits
|
634
|
237
|
245
|
|||||||||
|
Share of loss of equity method investee
|
1,270
|
1,555
|
1,794
|
|||||||||
|
Long-term deferred income
|
2,355
|
(85
|
)
|
(104
|
)
|
|||||||
|
Expenses in respect of share-based payment
|
7,187
|
6,027
|
8,747
|
|||||||||
|
Total adjustments
|
38,011
|
20,720
|
23,966
|
|||||||||
|
Changes in operating asset and liability items:
|
||||||||||||
|
Increase in restricted cash transferable to customers for processing activity
|
(10,441
|
)
|
(15,739
|
)
|
(10,424
|
)
|
||||||
|
Increase in receivables from processing activity
|
(1,810
|
)
|
(17,880
|
)
|
(10,986
|
)
|
||||||
|
Increase in trade receivables
|
(10,683
|
)
|
(12,487
|
)
|
(8,272
|
)
|
||||||
|
Increase in other current assets
|
(892
|
)
|
(1,073
|
)
|
(936
|
)
|
||||||
|
Decrease (Increase) in inventory
|
2,069
|
3,239
|
(12,592
|
)
|
||||||||
|
Increase in payables in respect of processing activity
|
26,435
|
41,187
|
20,510
|
|||||||||
|
Increase in trade payables
|
3,361
|
1,189
|
4,519
|
|||||||||
|
Increase in other payables
|
2,483
|
5,529
|
4,177
|
|||||||||
|
Total changes in operating asset and liability items
|
10,522
|
3,965
|
(14,004
|
)
|
||||||||
|
Total adjustments required to reflect the cash flow from operating activities
|
48,533
|
24,685
|
9,962
|
|||||||||
|
Appendix B – Information regarding investing and financing activities not involving cash flows:
|
||||||||||||
|
Purchase of property and equipment on credit
|
152
|
97
|
215
|
|||||||||
|
Recognition of right-of-use assets through lease liabilities
|
1,653
|
338
|
2,048
|
|||||||||
|
Recognition of Sub lease asset
|
-
|
455
|
-
|
|||||||||
|
Share based payments costs attributed to development activities, capitalized as intangible assets
|
718
|
825
|
909
|
|||||||||
|
Year ended
(U.S. dollars in thousands)
|
|||
|
Dec 31, 2024
|
Dec 31, 2023
|
Dec 31, 2022
|
|
|
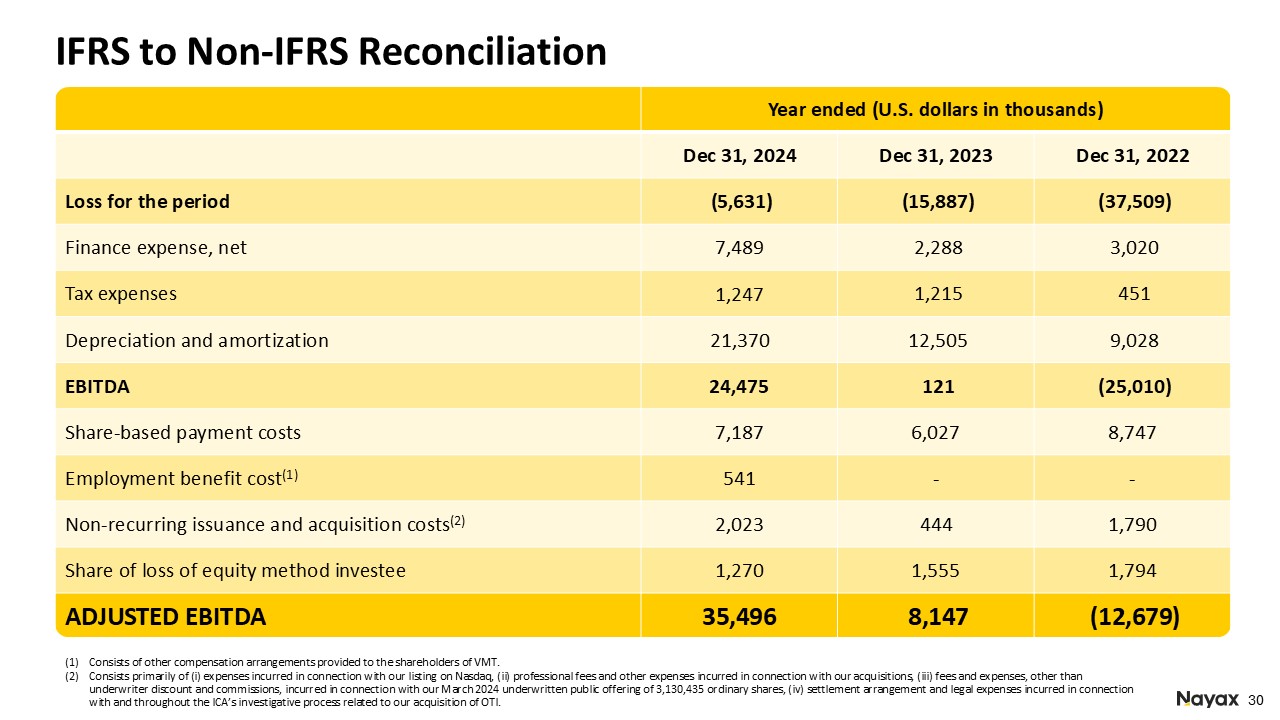
Loss for the period
|
(5,631)
|
(15,887)
|
(37,509)
|
|
Finance expense, net
|
7,489
|
2,288
|
3,020
|
|
Tax expenses
|
1,247
|
1,215
|
451
|
|
Depreciation and amortization
|
21,370
|
12,505
|
9,028
|
|
EBITDA
|
24,475
|
121
|
(25,010)
|
|
Share-based payment costs
|
7,187
|
6,027
|
8,747
|
|
Employment benefit cost(1)
|
541
|
-
|
-
|
|
Non-recurring issuance and acquisition costs(2)
|
2,023
|
444
|
1,790
|
|
Share of loss of equity method investee
|
1,270
|
1,555
|
1,794
|
|
ADJUSTED EBITDA
|
35,496
|
8,147
|
(12,679)
|
|
|
(1) |
Consists of other compensation arrangements provided to the shareholders of VMtecnologia
|
|
|
(2) |
Consists primarily of (i) expenses incurred in connection with our listing on Nasdaq, (ii) professional fees and other expenses incurred in connection with our acquisitions, (iii) fees and expenses, other than underwriter discount
and commissions, incurred in connection with our March 2024 underwritten public offering of 3,130,435 ordinary shares, (iv) settlement arrangement and legal expenses incurred in connection with and throughout the ICA’s investigative
process related to our acquisition of OTI
|
|
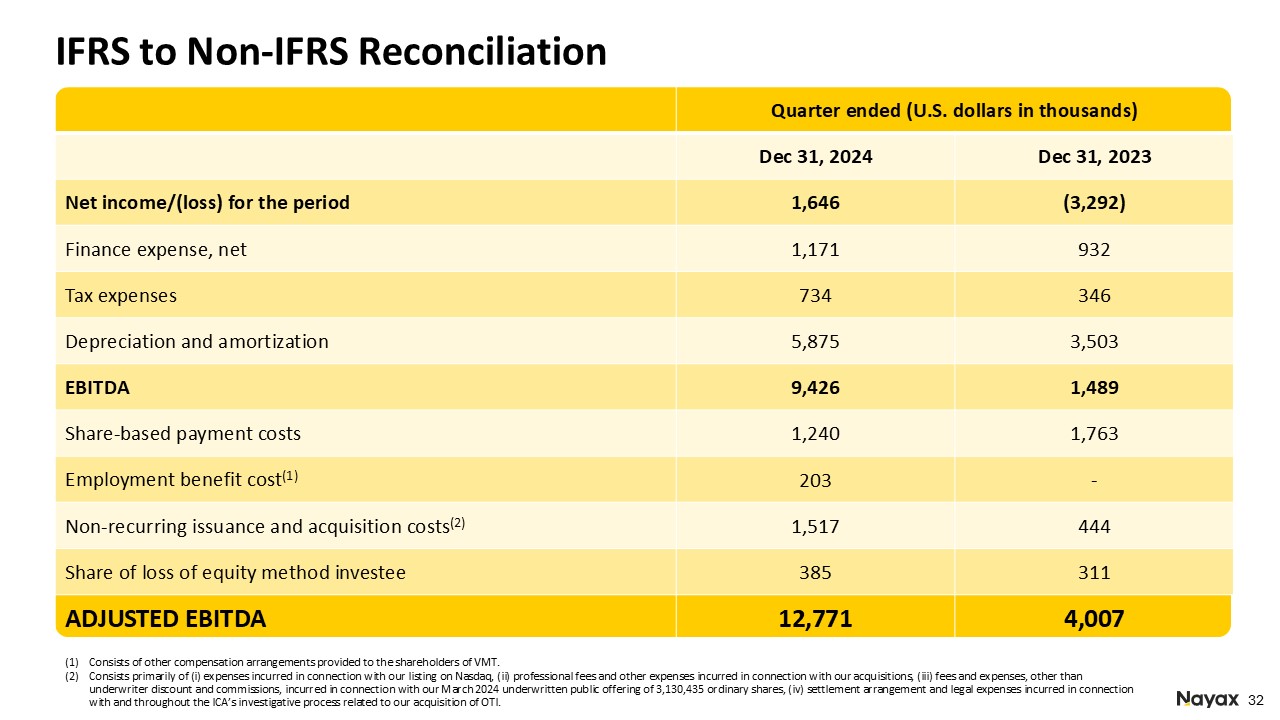
Quarter ended
(U.S. dollars in thousands)
|
||
|
Dec 31, 2024
|
Dec 31, 2023
|
|
|
Net income/loss for the period
|
1,646
|
(3,292)
|
|
Finance expense, net
|
1,171
|
932
|
|
Tax expenses
|
734
|
346
|
|
Depreciation and amortization
|
5,875
|
3,503
|
|
EBITDA
|
9,426
|
1,489
|
|
Share-based payment costs
|
1,240
|
1,763
|
|
Employment benefit cost(1)
|
203
|
-
|
|
Non-recurring issuance and acquisition costs(2)
|
1,517
|
444
|
|
Share of loss of equity method investee
|
385
|
311
|
|
ADJUSTED EBITDA
|
12,771
|
4,007
|
|
|
(1) |
Consists of other compensation arrangements provided to the shareholders of VMtecnologia
|
|
|
(2) |
Consists primarily of (i) expenses incurred in connection with our listing on Nasdaq, (ii) professional fees and other expenses incurred in connection with our acquisitions, (iii) fees and expenses, other than underwriter discount
and commissions, incurred in connection with our March 2024 underwritten public offering of 3,130,435 ordinary shares, (iv) settlement arrangement and legal expenses incurred in connection with and throughout the ICA’s investigative
process related to our acquisition of OTI
|
|
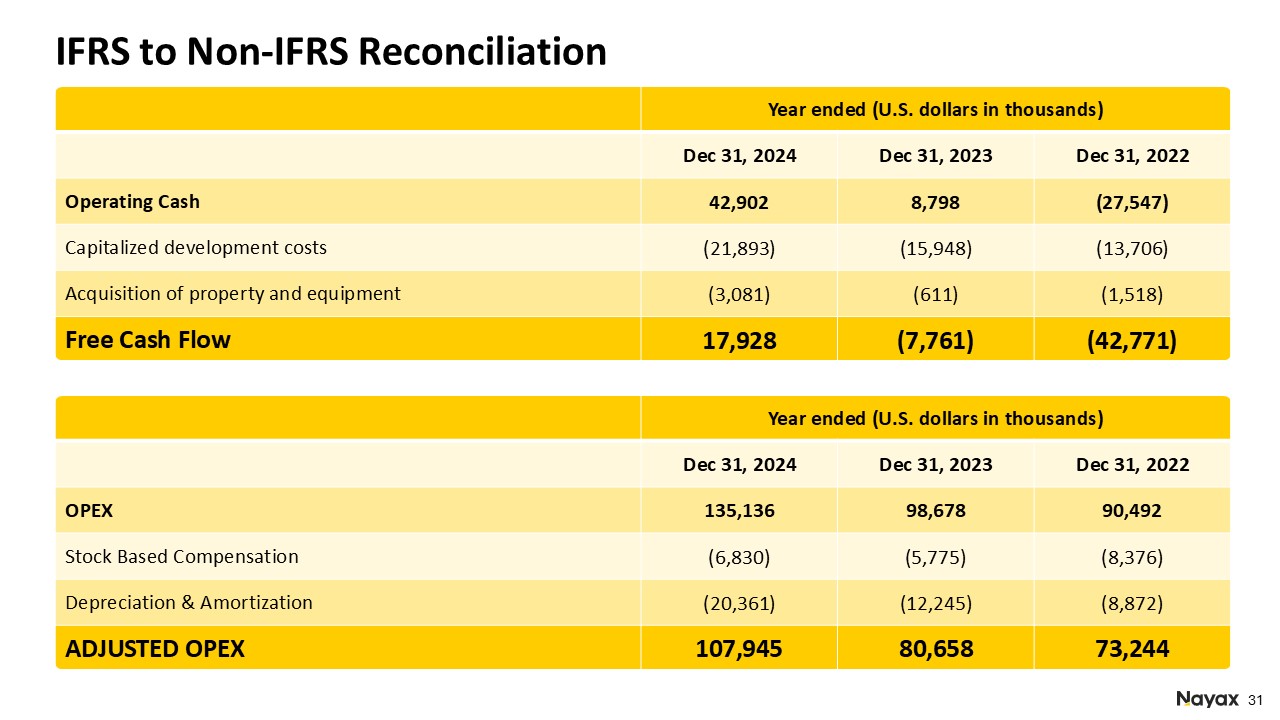
Year ended
(U.S. dollars in thousands)
|
|||
|
Dec 31, 2024
|
Dec 31, 2023
|
Dec 31, 2022
|
|
|
Operating Cash
|
42,902
|
8,798
|
(27,547)
|
|
Capitalized development costs
|
(21,893)
|
(15,948)
|
(13,706)
|
|
Acquisition of property and equipment
|
(3,081)
|
(611)
|
(1,518)
|
|
Free Cash Flow
|
17,928
|
(7,761)
|
(42,771)
|
|
Quarter ended
(U.S. dollars in thousands)
|
||
|
Dec 31, 2024
|
Dec 31, 2023
|
|
|
Operating Cash
|
17,008
|
4,582
|
|
Capitalized development costs
|
(6,435)
|
(3,698)
|
|
Acquisition of property and equipment
|
(1,296)
|
(270)
|
|
Free Cash Flow
|
9,277
|
614
|
|
Year ended
(U.S. dollars in thousands)
|
|||
|
Dec 31, 2024
|
Dec 31, 2023
|
Dec 31, 2022
|
|
|
OPEX
|
135,136
|
98,678
|
90,492
|
|
Stock Based Compensation
|
(6,830)
|
(5,775)
|
(8,376)
|
|
Depreciation & Amortization
|
(20,361)
|
(12,245)
|
(8,872)
|
|
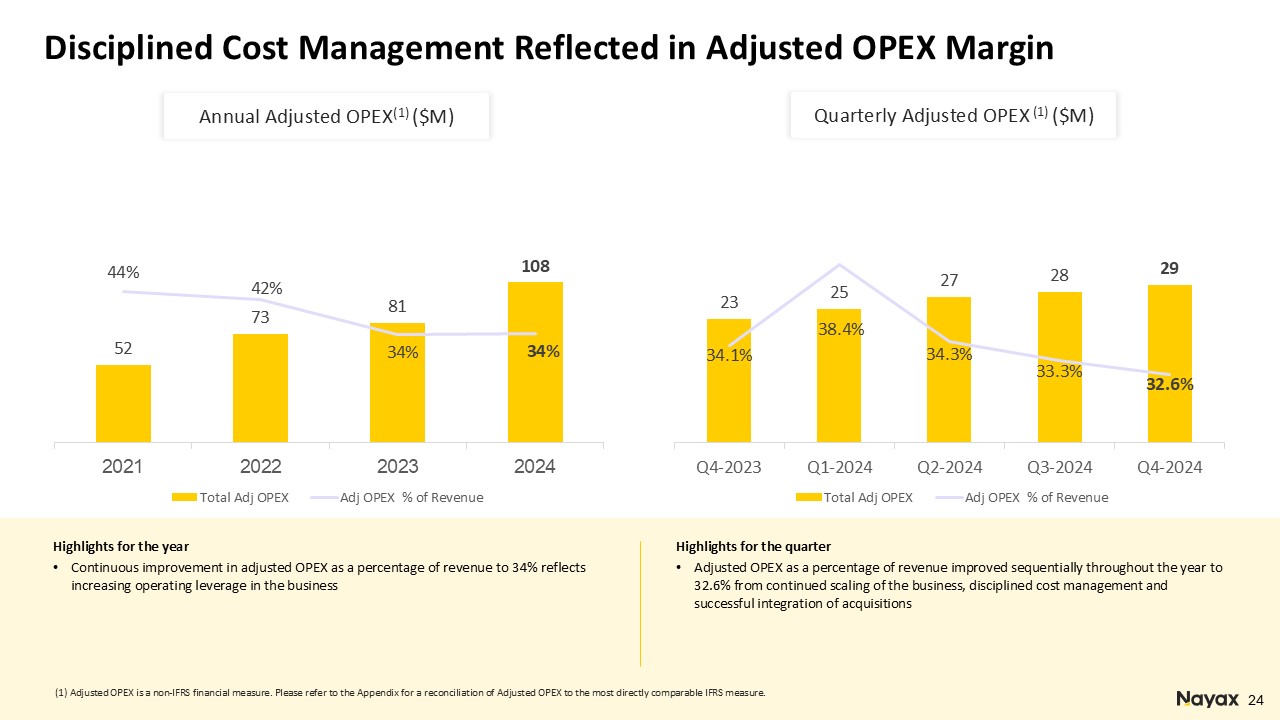
Adjusted OPEX
|
107,945
|
80,658
|
73,244
|
|
Quarter ended
(U.S. dollars in thousands)
|
||
|
Dec 31, 2024
|
Dec 31, 2023
|
|
|
OPEX
|
35,534
|
27,845
|
|
Stock Based Compensation
|
(1,182)
|
(1,702)
|
|
Depreciation & Amortization
|
(5,378)
|
(3,427)
|
|
Adjusted OPEX
|
28,974
|
22,716
|