UNITED STATES
| ☐ |
REGISTRATION STATEMENT PURSUANT TO SECTION 12(b) OR (g) OF THE SECURITIES EXCHANGE ACT OF 1934
|
| ☒ |
ANNUAL REPORT PURSUANT TO SECTION 13 OR 15(d) OF THE SECURITIES EXCHANGE ACT OF 1934
For the fiscal year ended December 31, 2024 |
| ☐ |
TRANSITION REPORT PURSUANT TO SECTION 13 OR 15(d) OF THE SECURITIES EXCHANGE ACT OF 1934
|
| ☐ |
SHELL COMPANY REPORT PURSUANT TO SECTION 13 OR 15(d) OF THE SECURITIES EXCHANGE ACT OF 1934
|
|
Title of each Class
|
|
Trading Symbol
|
|
Name of each exchange on which registered
|
|
Ordinary shares, par value NIS 0.001 per share
|
|
NYAX
|
|
The Nasdaq Stock Market LLC
|
|
Large Accelerated Filer ☐
|
Accelerated Filer ☒
|
Non-accelerated Filer ☐
|
|
|
|
Emerging Growth Company ☒
|
|
Page
| |||
|
- v - | |||
| 1 | |||
| 3 | |||
| 3 | |||
| 3 | |||
| 3 | |||
|
|
A. |
[Reserved]
|
3 |
|
|
B. |
Capitalization and Indebtedness
|
3 |
|
|
C. |
Reasons for the Offer and Use of Proceeds
|
3 |
|
|
D. |
Risk Factors
|
3 |
| 37 | |||
|
|
A. |
History and Development of the Company
|
37 |
|
|
B. |
Business Overview
|
37 |
|
|
C. |
Organizational Structure
|
55 |
|
|
D. |
Property, Plants and Equipment
|
56 |
| 56 | |||
| 56 | |||
|
|
A. |
Operating Results
|
56 |
|
|
B. |
Liquidity and Capital Resources
|
68 |
|
|
C. |
Research and Development, Patents and Licenses, etc. |
70 |
|
|
D. |
Trend Information
|
70 |
|
|
E. |
Critical Accounting Estimates
|
70 |
| 70 | |||
|
|
A. |
Directors and Senior Management
|
70 |
|
|
B. |
Compensation
|
73 |
|
|
C. |
Board Practices
|
76 |
|
|
D. |
Employees
|
87 |
|
|
E. |
Share Ownership
|
87 |
|
|
F. |
Disclosure of a Registrant’s Action to Recover Erroneously
Awarded Compensation |
87 |
| 87 | |||
|
|
A. |
Major Shareholders
|
87 |
|
|
B. |
Related Party Transactions
|
89 |
|
|
C. |
Interests of Experts and Counsel
|
91 |
| 91 | |||
|
|
A. |
Consolidated Statements and Other Financial Information
|
91 |
|
|
B. |
Significant Changes
|
92 |
| 92 | |||
|
|
A. |
Offering and Listing Details
|
92 |
|
|
B. |
Plan of Distribution
|
92 |
|
|
C. |
Markets
|
92 |
|
|
D. |
Selling Shareholders
|
92 |
|
|
E. |
Dilution
|
92 |
|
|
F. |
Expenses of the Issue
|
92 |
| 92 | |||
|
|
A. |
Share Capital
|
92 |
|
|
B. |
Memorandum and Articles of Association
|
92 |
|
|
C. |
Material Contracts
|
92 |
|
|
D. |
Exchange Controls
|
92 |
|
|
E. |
Taxation
|
93 |
|
|
F. |
Dividends and Paying Agents
|
102 |
|
|
G. |
Statement by Experts
|
102 |
|
|
H. |
Documents on Display
|
102 |
|
|
I. |
Subsidiary Information
|
102 |
|
|
J. |
Annual Report to Security Holders
|
102 |
| 102 | |||
| 103 | |||
|
|
A. |
Debt Securities
|
103 |
|
|
B. |
Warrants and Rights
|
103 |
|
|
C. |
Other Securities
|
103 |
|
|
D. |
American Depositary Shares
|
103 |
| 103 | |||
| 104 | |||
| 104 | |||
| 104 | |||
|
|
A. |
Disclosure Controls and Procedures
|
104 |
|
|
B. |
Management’s Annual Report on Internal Control Over Financial
Reporting |
104 |
|
|
C. |
Attestation Report of the Registered Public Accounting Firm
|
104 |
|
|
D. |
Changes in Internal Control Over Financial Reporting |
104 |
| 104 | ||
| 104 | ||
| 104 | ||
| 105 | ||
| 105 | ||
| 105 | ||
| 105 | ||
| 106 | ||
| 106 | ||
| 106 | ||
| 106 | ||
| 106 | ||
| 108 | ||
| 108 | ||
| 108 | ||
| 108 | ||
| 110 | ||
| F - 1 | ||
|
|
• |
our expectations regarding general market conditions and global economic trends;
|
|
|
• |
impact of the conflict in Israel on our operations and financial results;
|
|
|
• |
fluctuations in inflation, interest rates and exchange rates in the global economic
environment over the world; |
|
|
• |
our ability to implement our growth strategy; |
|
|
• |
the success of operating initiatives, including advertising and promotional efforts
and new product and concept development by us and our competitors; |
|
|
• |
our ability to compete and conduct our business in the future; |
|
|
• |
changes in consumer tastes and preferences; |
|
|
• |
the availability of qualified personnel and the ability to retain such personnel;
|
|
|
• |
changes in commodity costs, labor, distribution and other operating costs;
|
|
|
• |
changes in government regulation and tax matters; |
|
|
• |
other factors that may affect our financial condition, liquidity and results of
operations; and |
|
|
• |
other risk factors discussed under “Item 3. Key Information—D. Risk
Factors.” |
| ITEM 1. |
IDENTITY OF DIRECTORS, SENIOR MANAGEMENT AND ADVISERS |
|
ITEM 2. |
OFFER STATISTICS AND EXPECTED TIMETABLE |
|
ITEM 3. |
KEY INFORMATION |
| A. |
[Reserved] |
|
B. |
Capitalization and Indebtedness |
| C. |
Reasons for the Offer and Use of Proceeds |
| D. |
Risk Factors |
|
|
• |
unfavorable conditions in our industry or the global economy or reductions in spending
on point of sale, or POS, technology could limit our ability to grow our business and negatively affect our results of operations;
|
|
|
• |
we operate in a competitive business environment and a failure to compete effectively
may adversely affect our financial condition, results of operations and cash flows in the future; |
|
|
• |
we procure some of our key components from a single or limited number of suppliers.
Therefore, we are exposed to risks of shortages, price fluctuations, tariffs and delays in delivery of such components; |
|
|
• |
we have a limited operating history at our current scale, and our prospects and
future revenues are subject to a number of uncertainties, which limits our ability to predict them accurately; |
|
|
• |
we have a history of annual net losses and there are therefore risks related to
our ability to maintain profitability; |
|
|
• |
if we are unable to attract customers, maintain or grow our retention rates and
expand usage with existing customers, our revenue growth and any future profitability could be harmed; |
|
|
• |
we may be unable to successfully develop and expand our platform, which could limit
our ability to grow and maintain our competitive position and adversely affect our financial condition, results of operations and cash
flow; |
|
|
• |
we rely on processing service providers, credit card networks, banks and other entities
in the payment transfer system to process payments, and if they fail or no longer agree to provide their services or we fail to comply
with our obligations under those relationships, our customer relationships could be adversely affected, and we could lose business;
|
|
|
• |
any failure to offer high-quality customer support may adversely affect our relationships
with our customers and could adversely affect our business, financial condition and results of operations; |
|
|
• |
the termination of our existing relationships with commercial communications services
providers could force us to adapt our products to a new vendor; |
|
|
• |
Israel is currently at war, and the duration, scope and effects of the war are unknown;
|
|
|
• |
any past or future acquisitions, strategic investments, entries into new businesses,
joint ventures, divestitures and other transactions could fail to achieve strategic objectives, disrupt our ongoing operations or result
in operating difficulties, liabilities and expenses, harm our business and negatively impact our results of operations; |
|
|
• |
failure to maintain and enhance our brand recognition in a cost-effective manner
could harm our business, financial condition and results of operations; |
|
|
• |
information security failures or interruptions of our or our third-party partners’
or service providers’ information technology systems could adversely affect our business, financial condition and results of operations;
|
|
|
• |
operational failures, including within data transfer, could harm our reputation,
ability to retain customers and recruit new customers, as well as our business results; |
|
|
• |
our business is subject to complex and evolving regulations and oversight related
to privacy and data protection; |
|
|
• |
we are subject to substantial governmental and commercial regulations across our
areas of activity. Any failure to comply with applicable regulations or standards may lead to significant regulatory consequences and
could have an adverse effect on our business, financial condition or results of operations; |
|
|
• |
our business could suffer if we are unable to obtain, maintain, protect, defend
or enforce our intellectual property or other proprietary rights, or if others claim that we have infringed upon, misappropriated or otherwise
violated their intellectual property rights; |
|
|
• |
we rely on our key personnel and have not developed a succession plan for our senior
management; if our key personnel leave us, our results and product development could be harmed; and |
|
|
• |
we are controlled by our founding shareholders, who may make decisions with which
other shareholders may disagree. |
|
|
• |
the transaction may not advance our business strategy; |
|
|
• |
we may not be able to secure required regulatory approvals or otherwise satisfy
closing conditions for a proposed transaction in a timely manner, or at all; |
|
|
• |
the transaction may subject us to additional regulatory burdens, such as antitrust
and competition filings, that affect our business in potentially unanticipated and significantly negative ways; |
|
|
• |
we may not realize a satisfactory return or increase our revenue; |
|
|
• |
we may experience difficulty, and may not be successful in, integrating technologies,
IT or business enterprise systems, culture or management or other personnel of the acquired business; |
|
|
• |
we may incur significant acquisition costs and transition costs, including in connection
with the assumption of ongoing expenses of the acquired business; |
|
|
• |
we may not realize the expected benefits or synergies from the transaction in the
expected time period, or at all – for example, we expect opportunities to deliver additional revenue and costs synergies, as well
as accretion to net income, with the acquisition of Retail Pro and VMT, which may or may not be realized in a timely manner or at all;
|
|
|
• |
we may be unable to retain key personnel; |
|
|
• |
acquired businesses or businesses that we invest in may not have adequate controls,
processes and procedures to ensure compliance with laws and regulations, including with respect to data privacy and security, and our
due diligence process may not identify compliance issues or other liabilities – moreover, acquired businesses’ technology
may add complexity, resource constraints and failures that make it difficult and time consuming to achieve such adequate controls, processes
and procedures; |
|
|
• |
we may fail to identify or assess the magnitude of certain liabilities, shortcomings
or other circumstances prior to acquiring or investing in a business, which could result in additional financial, legal or regulatory
exposure, which may subject us to additional controls, policies, procedures, liabilities, litigation, costs of compliance or remediation
or to other adverse effects on our business, operating results or financial condition; |
|
|
• |
we may have difficulty entering into new product areas, market verticals or geographic
territories; |
|
|
• |
we may be unable to retain the customers, vendors and partners of acquired businesses;
|
|
|
• |
there may be lawsuits or regulatory actions resulting from the transaction. For
example, during 2023, the Israeli Competition Authority (the “ICA”) requested from us certain documents and other information
related mainly to our acquisition of OTI. We cooperated fully and transparently with the ICA throughout its investigative process, and,
on February 3, 2025, we entered into a consent decree (the “Consent Decree”) with the ICA to settle allegations of anticompetitive
practices and failing to obtain necessary ICA consent in connection with the acquisition. Pursuant to the Consent Decree, we and Yair
Nechmad, our CEO and Chairman, agreed to pay a sum of NIS 2,500,000 (approximately $701,000) and NIS 240,000 (approximately $67,300),
respectively, to the Israeli State Treasury, and we agreed to provide up to 6,500 OTI POS kits, comprised of the Telebox hardware units
paired with Uno 8/Uno Plus card readers, over a period of five years, to third parties who may sell, distribute, and market the OTI POS
kits under their own brands in the Israeli market. The Consent Decree is subject to public commentary and will become effective upon approval
by the Israeli Competition Court; |
|
|
• |
there may be risks associated with undetected security weaknesses, cyber-attacks
or security breaches at companies that we acquire or with which we may combine or partner; |
|
|
• |
there may be local and foreign regulations applicable to the international activities
of our business and the businesses we acquire; and |
|
|
• |
acquisitions could result in dilutive issuances of equity securities or the incurrence
of debt – for example, the acquisition of Retail Pro was financed through bank financing, which increased our debt burden, consideration
for the acquisition of VMT included an earn-out in the amount of up to approximately $5.3 million payable primarily in our ordinary shares
and consideration for the acquisition of Roseman Engineering included 19,722 of our ordinary shares. |
|
|
• |
cease selling or using solutions or services that incorporate the intellectual property
rights that we allegedly infringe, misappropriate, dilute or violate; |
|
|
• |
make payment of substantial royalty or license fees, lost profits or other damages;
|
|
|
• |
make substantial payments for legal fees, settlement payments or other costs or
damages; |
|
|
• |
discontinue some or all of the features, integrations and capabilities available
through our solutions; |
|
|
• |
indemnify our products’ users or third-party service providers; |
|
|
• |
obtain a license, which may not be available on reasonable terms or at all, to sell
or use the relevant technology; or |
|
|
• |
redesign or rebrand our allegedly infringing solutions to avoid infringement, misappropriation,
dilution or violation of third-party intellectual property rights, which could be costly, time-consuming or impossible. |
|
|
• |
actual or anticipated changes or fluctuations in our and our competitors’
results of operations; |
|
|
• |
the guidance we may provide to analysts and investors from time to time, and any
changes in, or our failure to perform in line with, such guidance; |
|
|
• |
announcements by us or our competitors of new offerings or new or terminated contracts,
commercial relationships or capital commitments; |
|
|
• |
industry or financial analyst or investor reaction to our press releases, other
public announcements, and filings with the U.S. Securities and Exchange Commission (the “SEC”); |
|
|
• |
rumors and market speculation involving us or other companies in our industry;
|
|
|
• |
future sales or expected future sales of our ordinary shares; |
|
|
• |
investor perceptions of us and the industries in which we operate; |
|
|
• |
price and volume fluctuations in the overall stock market from time to time;
|
|
|
• |
our shares generally trade at low volumes, which may increase the volatility of
our share price; |
|
|
• |
changes in operating performance and stock market valuations of other technology
companies generally, or those in our industry in particular; |
|
|
• |
failure of industry or financial analysts to maintain coverage of us, the issuance
of new or updated reports or recommendations by any analysts who follow our company, or our failure to meet the expectations of investors;
|
|
|
• |
actual or anticipated developments in our business or our competitors’ businesses
or the competitive landscape generally; |
|
|
• |
litigation involving us, other companies in our industry or both, or investigations
or sanctions by regulators regarding our operations or those of our competitors; |
|
|
• |
developments or disputes concerning our intellectual property or other proprietary
rights or our solutions, or third-party intellectual or other proprietary rights; |
|
|
• |
announced or completed acquisitions of businesses or technologies, or other strategic
transactions by us or our competitors; |
|
|
• |
actual or perceived breaches of, or failures relating to, privacy, data protection
or data security; |
|
|
• |
new laws or regulations, including new interpretations of existing laws or regulations
applicable to our business, increased enforcement efforts in our industry, or specific enforcement actions against us; |
|
|
• |
actual or anticipated changes in our management or our board of directors;
|
|
|
• |
general economic conditions and slow or negative growth of our target markets; and
|
|
|
• |
other events or factors, including those resulting from war such as the current
conflicts in Israel and Ukraine, incidents of terrorism or responses to these events. |
|
|
• |
the level of demand for our integrated POS devices; |
|
|
• |
our ability to grow or maintain our retention rates, expand usage within our customer
base, and sell our solutions to existing and future customers; |
|
|
• |
geopolitical uncertainty, including as a result of the current conflicts in Israel
and Ukraine, tensions between U.S. and China, and uncertainty as to regional economic conditions; |
|
|
• |
costs and timing of expenses related to hiring additional personnel, technologies
or intellectual property, including potentially significant amortization costs and possible write-downs; |
|
|
• |
the impact of market volatility and economic downturns caused by natural disasters
and health epidemics, such as the COVID-19 pandemic; |
|
|
• |
supply chain constraints and increases in component prices; |
|
|
• |
the timing and success of new features, integrations, capabilities and enhancements
by us to our platform or by our competitors to their products or any other change in the competitive landscape of our market; |
|
|
• |
errors in our forecasting of the demand for our products, which could lead to lower
revenue, increased costs or both; |
|
|
• |
the amount and timing of operating expenses and capital expenditures that we may
incur to maintain and expand our business and operations and to remain competitive; |
|
|
• |
security breaches, technical difficulties, disruptions or outages on our platform
resulting in service level agreement credits; |
|
|
• |
changes in the legislative or regulatory environment; |
|
|
• |
legal and regulatory compliance costs in new and existing markets; |
|
|
• |
pricing pressure as a result of competition or otherwise; and |
|
|
• |
fluctuations in foreign currency exchange rates. |
|
|
• |
we are not required to engage an auditor to report on our internal controls over
financial reporting pursuant to Section 404(b) of the Sarbanes-Oxley Act; |
|
|
• |
we are not required to comply with any requirement that may be adopted by the PCAOB
regarding mandatory audit firm rotation or a supplement to the auditor’s report providing additional information about the audit
and the financial statements (i.e., an auditor discussion and analysis); and |
|
|
• |
we are not required to disclose certain executive compensation related items such
as the correlation between executive compensation and performance and comparisons of the chief executive officer’s compensation
to median employee compensation. |
|
|
• |
Human Resources:
nearly 10% of our Israeli employees and managers were initially called to active reserve duty; it is possible that the war will require
additional reserve duty call-ups and more of our employees and managers or their family members will be called to active reserve duty,
which would prevent them from working or effectively performing their tasks for us. |
|
|
• |
Macro-economic effects:
the war has led, and may continue to lead, to negative domestic macro-economic effects in Israel that could materially impact our business
and operations, such as inflation, depreciation of the Shekel, bearish capital markets, reduced availability of credit and financing sources
and decline in growth. |
|
|
• |
Trade curtailment:
the war may lead to interruptions and curtailment of trade between Israel and its trading partners, which could result in reductions in
the demand for our offerings or disruptions in the supply of components required for our products. Certain countries and organizations
may impose trade or other trade or financial sanctions on Israel, which could impact our ability to conduct our business.
|
|
|
• |
Shipping costs:
the global shipping industry is experiencing disruptions due to various factors, including the rerouting of shipping away from the Suez
Canal due to attacks by Houthi militants from Yemen on commercial shipping vessels in the Gulf of Aden and the Red Sea, which has caused
a substantial increase in rates for some shipping routes. This and other factors have caused a worldwide increase in shipping rates, which
has impacted the Company. |
|
|
• |
Decrease in Israeli demand:
we have noticed an immaterial decrease in demand in Israel for our products and services compared to our global demand, due to reduction
in mobility and gatherings in public spaces, such as for leisure and entertainment activities during the war. |
|
|
• |
Concern about transacting business with Israeli companies:
we have received inquiries related to the war from customers concerned about
our operations in Israel. While we do not believe that any significant orders have been withdrawn or delayed as a result of such inquiries,
we cannot rule out the possibility that customers or business partners may stop doing business with us in the future, nor can we predict
the impact this might have on us. |
|
|
• |
Damage to infrastructure:
Terror, drone and missile attacks may lead to infrastructure damage, such as to various of our facilities located in Israel, including
communications networks, computer infrastructure and other cyber assets, which may lead to interruptions in our operations. Although the
Israeli government may cover the reinstatement value of certain damages that are caused by terrorist attacks or acts of war, we cannot
be sure that such government coverage will be available to us or, if available, will sufficiently cover our damages. |
|
|
• |
Reputation and international relations:
as a result of the war, public opinion in the international community towards Israel, Israeli companies and Israeli industries has deteriorated,
and may be further negatively affected in the future. In January 2024 the International Court of Justice, or ICJ, issued an interim ruling
in a case filed by South Africa against Israel alleging genocide amid and in connection with the war in Gaza. On November 21, 2024, the
International Criminal Court, or ICC, issued arrest warrants to Israeli Prime Minister Benjamin Netanyahu and former Israeli Minister
of Defense Yoav Gallant based on allegations of war crimes including using starvation as a method of warfare, murder and other inhumane
acts. It is hard to anticipate if and how such sentiments and other political developments will impact our clients, backlog of orders
or financial results; however, it is possible that a limited number of customers will hold, delay or cancel existing or future orders
as a result of the war and a shift in international relations and politics. |
|
|
• |
the Companies Law regulates the methods and processes by which mergers may be consummated
and requires tender offers to be effected for acquisitions of shares above specified thresholds in a company; |
|
|
• |
the Companies Law requires special approvals for certain transactions involving
directors, officers or significant shareholders and regulates other matters that may be relevant to these types of transactions;
|
|
|
• |
the Companies Law does not provide for shareholder action by written consent for
public companies, thereby requiring all shareholder actions to be taken at a general meeting of shareholders; |
|
|
• |
our amended and restated articles of association provide that director vacancies
may be filled by our board of directors; |
|
|
• |
our amended and restated articles of association require a vote of the holders of
our outstanding ordinary shares entitled to vote present and voting on the subject matter at a general meeting of shareholders for the
removal of directors (other than external directors regarding whom special rules apply); |
|
|
• |
We have undertaken in certain of our financing agreements not to have a change-of-control
without the lender’s approval; and |
|
|
• |
Some of our European licenses may be cancelled or suspended, or we may be subject
to other sanctions for breaches of such licenses, if holders of our shares cross certain prescribed ownership thresholds without the prior
approvals of the relevant regulators. |
| ITEM 4. |
INFORMATION ON THE COMPANY |
|
A. |
History and Development of the Company |
| B. |
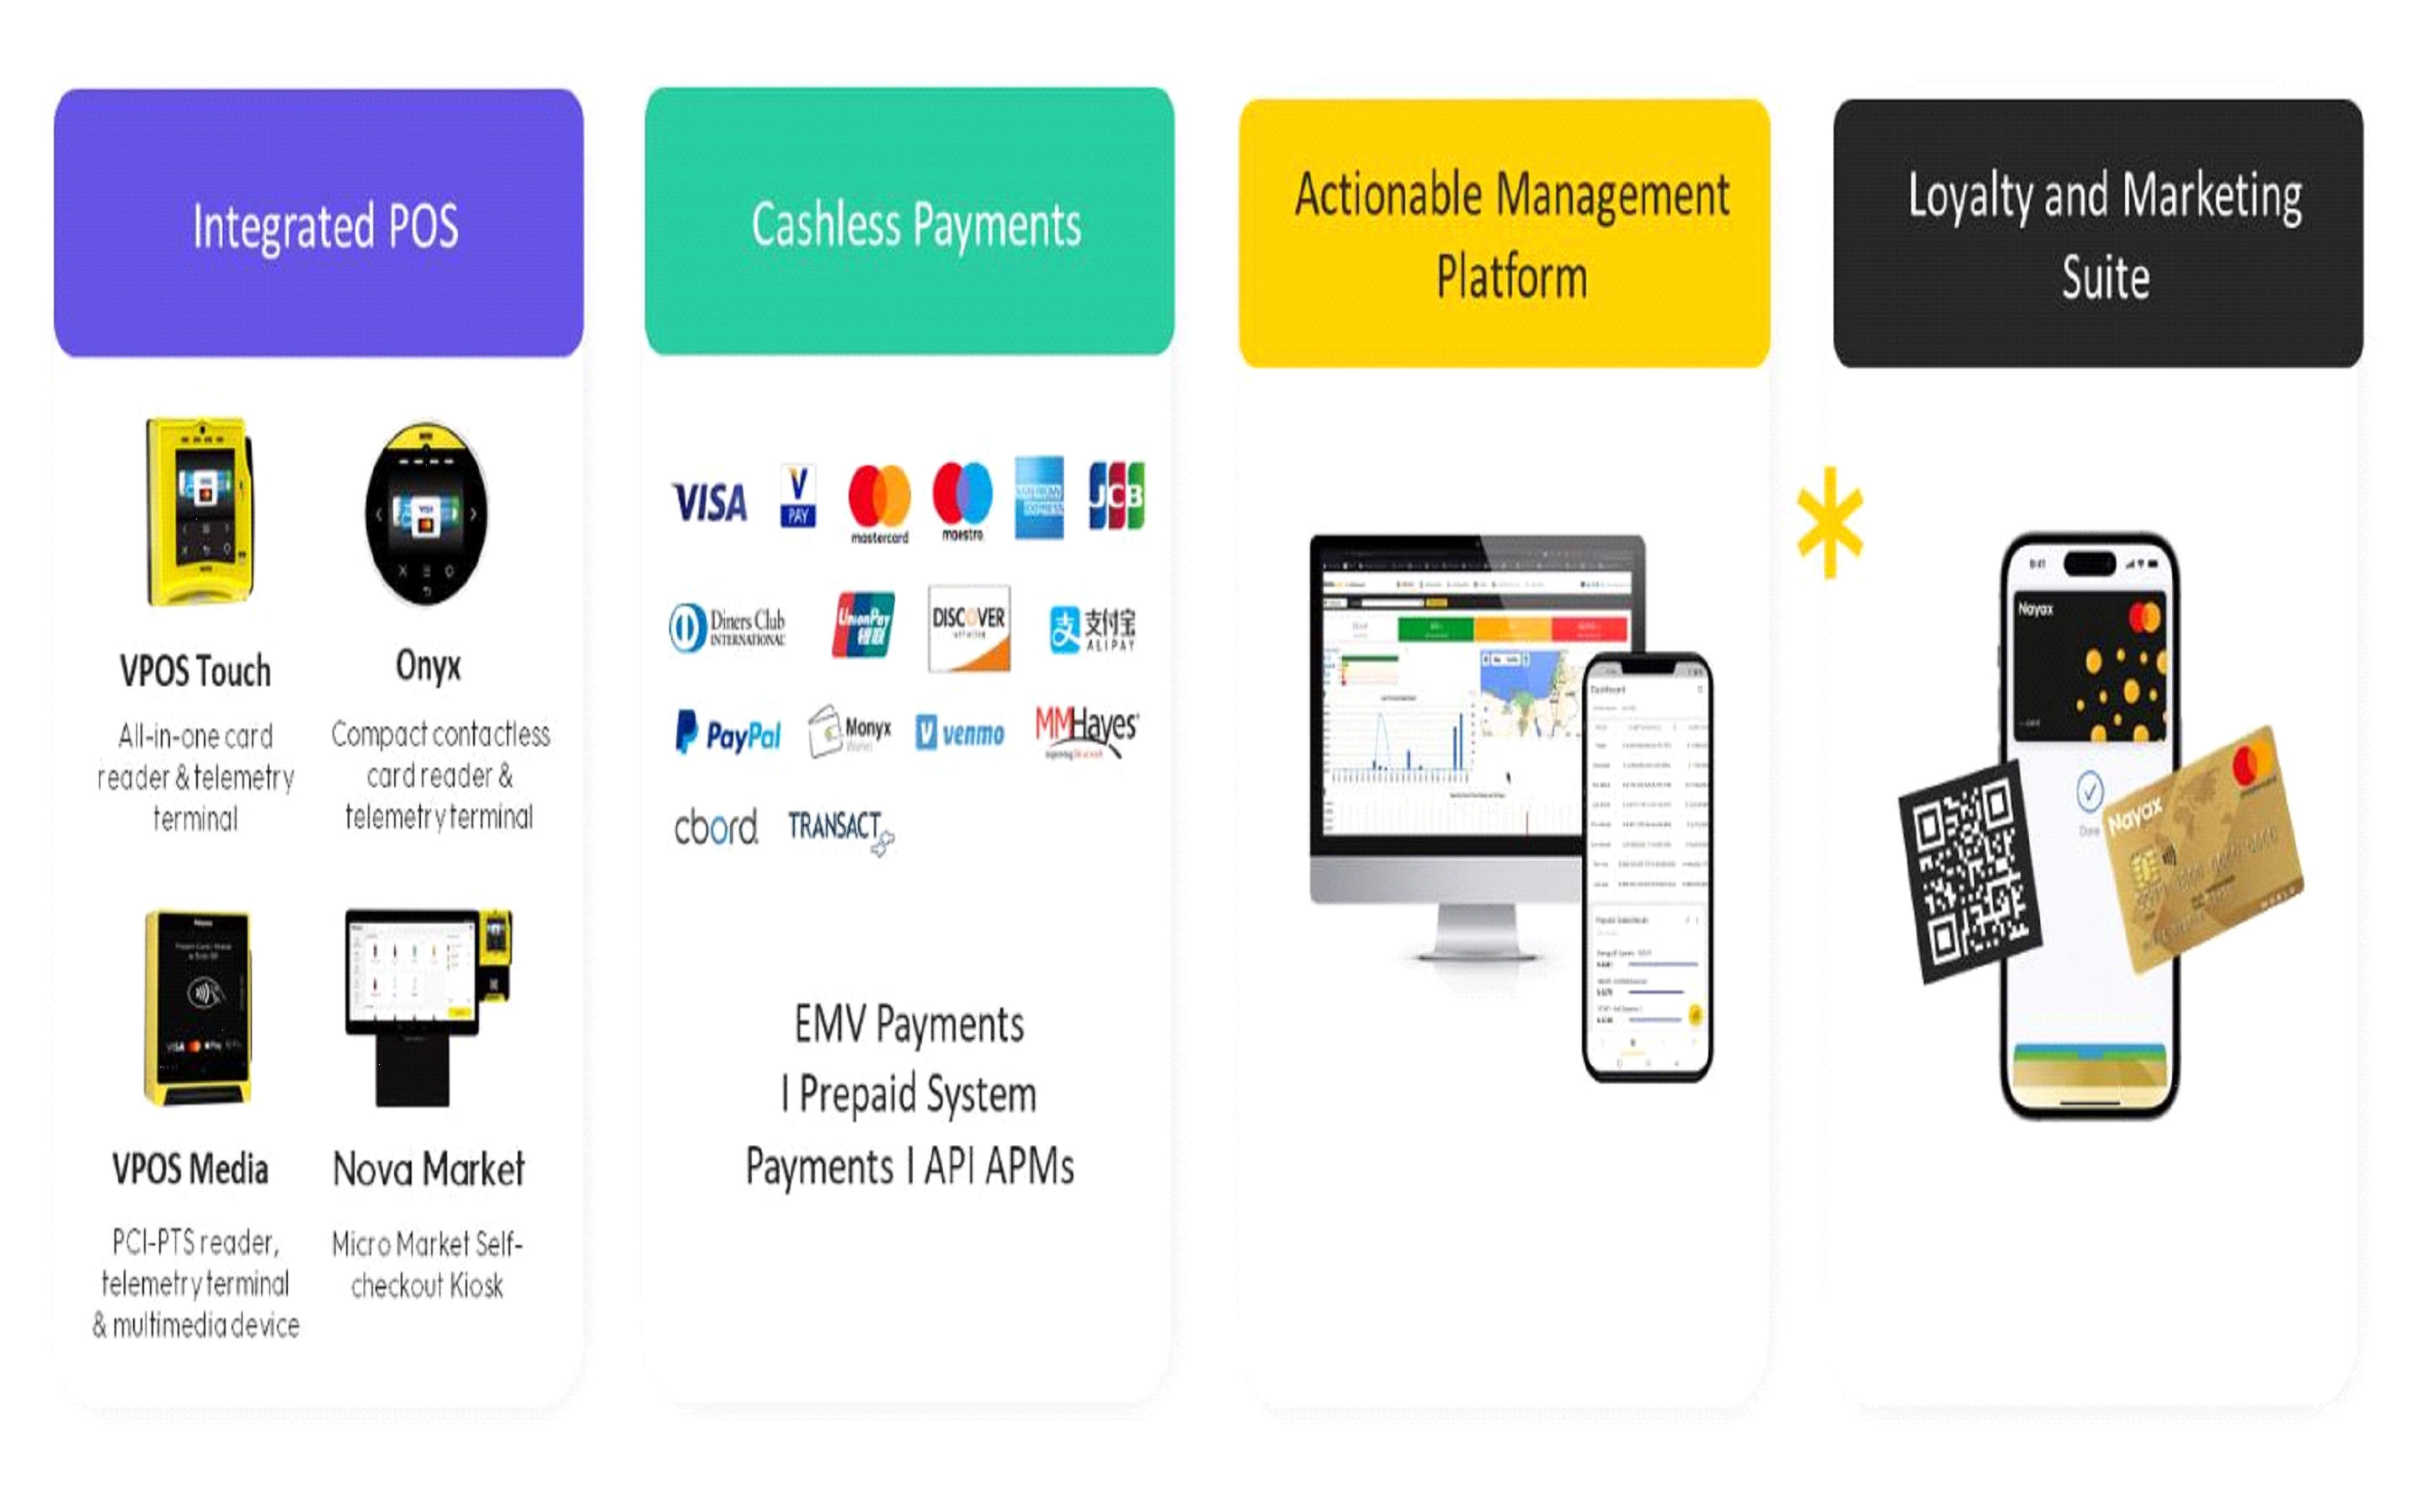
Business Overview |
|
|
• |
$4.87 billion of transaction value; |
|
|
• |
approximately 2.38 billion transactions; and |
|
|
• |
approximately 1,260,000 managed and connected devices across more than 120 countries
on every inhabited continent. |
|
|
• |
Remote Monitoring and Administration:
Our system offers comprehensive 24/7 remote monitoring and administration, featuring real-time error detection and alerts, remote price
adjustments, software updates, inventory management, promotion oversight, employee monitoring, and energy consumption control, without
requiring onsite technical support or maintenance. |
|
|
• |
Inventory Management:
Our inventory management system empowers customers to oversee stock availability, control costs, and transfer inventory across various
sites. With dynamic resupply routing, customers can streamline their supply chains, minimize waste, and cut operational costs.
|
|
|
• |
Reporting and Analytics:
Our platform collects and synthesizes data from all Nayax POS devices a business owns, delivering real-time insights into sales, cash
levels, and inventory status through automated reports, supported by powerful business intelligence tools and customizable dashboards
for data-driven decision-making. |
|
|
• |
Product Management:
We enable customers to create and manage product catalogs with customizable parameters and offer dynamic pricing tools, including multiple
price lists, currencies, and special pricing options. |
|
|
• |
Employee Management:
Our customers can manage roles, set permissions, and control access levels across POS devices and activities, organized by hierarchies
like global offices or regions. Automated self-service retailers can also track employee visits, inventory refills, and cash collections
to reduce fraud. |
|
|
• |
Loyalty:
Customers can design loyalty programs with attributes like price rules, cards, points, and wallets. Our platform simplifies campaign creation
with built-in templates and provides analytic tools to track performance and strengthen brand loyalty. |
|
|
• |
Promotions:
Customers can set up promotions such as punch cards, discounts, cashback, bonus credit, and happy hours, which we believe helps encourage
repeat visits and strengthens consumer loyalty. |
|
|
• |
Engagement Solutions:
We provide omni-channel marketing tools that bridge online and in-store consumer experiences, enabling businesses to target advertising,
enhance engagement, maximize conversions, grow revenue, and attract returning consumers. |
|
|
• |
Marketing Solutions:
We empower customers to execute marketing campaigns across social media, SMS, and email channels, leveraging their own data to maximize
impact and improve outcomes. |
|
|
• |
Universal Redemption Capability:
Customers can convert points, rewards, miles, vouchers, gift cards, and other digital assets into real currency, spendable at any merchant
worldwide that accepts major credit cards. |
|
|
• |
Seamless Integration:
Brands can incorporate CoinBridge into their existing mobile applications through a straightforward Software Development Kit, requiring
no changes to point-of-sale systems or merchant infrastructures. |
|
|
• |
Real-Time Transaction Processing:
Instant verification and approval of transactions enable customers to redeem loyalty assets effortlessly through a simple ‘Tap &
Go’ experience. |
|
|
• |
Comprehensive Data Analytics:
CoinBridge provides brands with detailed transaction data and consumer behavior insights, enabling personalized marketing strategies,
improved customer retention, and optimized business operations. |
|
|
• |
Enhanced Customer Engagement:
Flexible redemption options and a user-friendly payment experience increase customer satisfaction and loyalty, allowing consumers to utilize
rewards in ways that align with their spending habits. |
|
|
• |
Secure and Compliant Infrastructure:
Operating under stringent security protocols and complying with global financial regulations, CoinBridge ensures safe and reliable transactions
for both brands and consumers. |
|
|
• |
Single, Integrated, End-to-End Platform: We
offer a comprehensive, integrated end-to-end platform that reduces the need for customers to manage multiple vendors and systems. Customers
benefit from a 360-degree, omni-channel platform that centralizes reporting and operational tracking in one location. |
|
|
• |
Global Footprint:
Our global presence allows us to offer solutions that span multiple regions and geographies, saving our enterprise customers and SMEs
from the hassle of engaging additional local providers. Our extensive network of original equipment manufacturer, or OEM, partners pre-installs
our products in machines like vending machines, EV chargers, and arcade games, facilitating quick and efficient deployment across the
globe. Our local offices span across large regions such as the United States, the United Kingdom, Germany, Australia, Canada, China, Brazil
and Japan. We also have more than 80 distributors in multiple countries to provide local support in different languages for their local
customers. |
|
|
• |
Increased Sales:
Our solutions provide diverse payment options, improved consumer experience, and dynamic pricing capabilities, helping our customers increase
sales by responding nimbly to changing market conditions and making payments more convenient. |
|
|
• |
Reduced Costs:
Our solutions optimize operating costs by enabling better overhead management and employee efficiency. Remote diagnostics and software
updates eliminate third-party troubleshooting, while our customer service platform improves customer experience and reduces the cost of
ownership and maintenance. We streamline operations with 24/7 monitoring of connected devices, employees, and business activities, while
minimizing downtime through automated issue detection and resolution. |
|
|
• |
Enhanced Customer Engagement:
Our platform helps businesses attract and retain consumers with data-driven marketing, branded loyalty programs, and mobile solutions.
Retailers gain access to valuable consumer insights and advanced analytics, enabling them to build direct relationships and foster loyalty.
Our omni-channel marketing engine allows businesses to tailor personalized recommendations and deals, while our loyalty programs track
every transaction, helping consumers earn rewards with each purchase. |
|
|
• |
Diverse Payment Options:
Our platform provides seamless, Europay, MasterCard, and Visa-, or EMV-, certified payment processing in approximately 120 countries and
approximately 50 currencies and supports more than 80 payment methods, including most major credit and debit cards, mobile wallets, prepaid
cards, and QR-based payments, allowing consumers to pay using their preferred local method. Available methods vary by country and region.
|
|
|
• |
Advanced Loyalty Benefits:
Our platform includes loyalty features such as discounts, gifts, and special offers, providing consumers with immediate rewards at checkout
that enhance the purchasing experience and encourage repeat engagement. |
|
|
• |
Enhanced Consumer Experience:
Our platform elevates the consumer experience with features such as mobile app feedback and ratings, while our integrated solutions streamline
traditionally complex processes like instant refunds for a smoother shopping journey. |
|
|
• |
Automated Self-Service:
Solutions for the automated self-service retail market vary widely, from standalone payment, telemetry, or business intelligence products
to integrated offerings that combine telemetry, payments, and operational management tools. Our competitors include Cantaloupe, Inc.,
CPI, Ingenico, 365 Retail, traditional cash payment vendors, and many others. We believe our competitive advantage lies in providing customers
around the globe with comprehensive and scalable end-to-end POS solutions, including cashless payment capabilities, remote operation and
management services, and payment processing. Despite our extensive industry knowledge and experience, we recognize the strength of our
competition and acknowledge that past success does not guarantee future performance. |
|
|
• |
Attended Retail:
Our competition includes large, established vendors and smaller startups, spanning payment processors, POS providers, and peer-to-peer
payment platforms. We aim to expand our market share by cross-selling to our broad automated self-service customer base and offering integrated
solutions for their attended retail operations. Our competitive edge lies in providing a unified payment ecosystem that seamlessly
integrates attended and self-service commerce, enhancing efficiency and consistency across hybrid retail environments. Leveraging our
expertise in SME automation, we bring advanced tools like loyalty programs, real-time monitoring, and dynamic pricing to smaller retailers,
helping them expand margins and compete effectively in an increasingly tech-fueled and omnichannel retail landscape. |
|
|
• |
Large Enterprise:
Our proven ability to secure large accounts spans multiple industries and regions, with notable recent wins including Café+Co, Primo
Water, Canteen, FiveStar, MOL Group, Synergy Energy—Western Australia’s largest energy retailer and generator—and Turkey’s
Düzey, part of Koç Holding. |
|
|
• |
SMEs:
Our automated and scalable go-to-market platform effectively reaches SMEs via digital channels, distributors, and OEM partnerships. SMEs
represent a significant share of our revenue, and we view this channel as integral to our future growth strategy, driven by our strong
track record in this space. |
|
|
• |
Geographic Expansion:
Nayax uses M&A to accelerate regional expansion, helping us enter new markets faster, acquire strategic customers, mitigate regulatory
challenges, and expand our product reach. We target unattended market leaders with profitable operations, at least 10,000 connected devices,
and strong growth potential. Examples include our acquisitions of a leading Brazilian technology
provider for the automated self-service industry, which significantly advanced our expansion into Latin America and extended our service
offerings across Brazil; and Retail Pro, a global retail POS software leader, which brought 130,000 POS licenses and a significant, global
distribution network. |
|
|
• |
Distribution Channel Consolidation:
Nayax leverages M&A to consolidate distribution channels to secure direct access to strategic customers, reduce costs and increase
efficiency in key markets, enhance operational control, and replace poorly performing distributors. We focus on unattended market leaders
with profitable operations, at least 10,000 connected devices, and a core TAM of at least 500,000 devices. Examples include InOne Technology,
rebranded as Nayax LLC, a North American distributor now responsible for more than 35% of Nayax’s global revenue, and VendCheck,
rebranded as Nayax Australia to enhance marketing, sales, and support while offering expanded solutions and innovations to the Australian
market. |
|
|
• |
Technological Advancement: Nayax pursues M&A to accelerate technological
innovation and prowess in strategic growth verticals such as EV charging, retail kiosks, and mass transit. Acquisitions allow us to fill
technology gaps, deliver value-added revenue, and integrate complementary solutions into our platform. We target market-leading or disruptive
technologies that can be integrated within 12–18 months. Examples include Weezmo, which we acquired in early 2021 to enhance our
portfolio of marketing tools for retailers; Tigapo, in which we acquired a majority stake in 2021 to expand our platform offering for
US amusement operators; OTI, which we acquired in 2022 to strengthen our smart payment solutions for automated self-service machines;
and Roseman Engineering, which we acquired in 2024 to strengthen our energy sector offerings with advanced fleet management, cloud management,
and AVI (Automatic Vehicle Identification) tools. |
|
|
• |
Automated Self-Service:
We design and develop our integrated POS devices and software for automated self-service customers in-house. We rely upon a limited number
of manufacturing subcontractors, who purchase all necessary components and supply us with POS devices as a finished product, with certain
exceptions. We place manufacturing orders as necessary to fulfill purchases by our customers, adjusting production volumes dynamically
based upon our needs. |
|
|
• |
Attended Retail:
Nayax currently partners with four suppliers to procure standard, off-the-shelf hardware for our attended retail customers. Although we
customize color schemes, branding, and packaging to reflect our marketing strategy, we do not make any major modifications to the underlying
hardware to maximize scalability and reliability. We work with multiple suppliers, each specializing in different product categories,
to minimize our risks from supply chain disruptions or dependency on a single source. |
|
|
• |
Marshall, a simple serial protocol designed to connect our integrated POS devices
to PC-based machines; |
|
|
• |
LYNX, which provides input / output data to third-party systems; and |
|
|
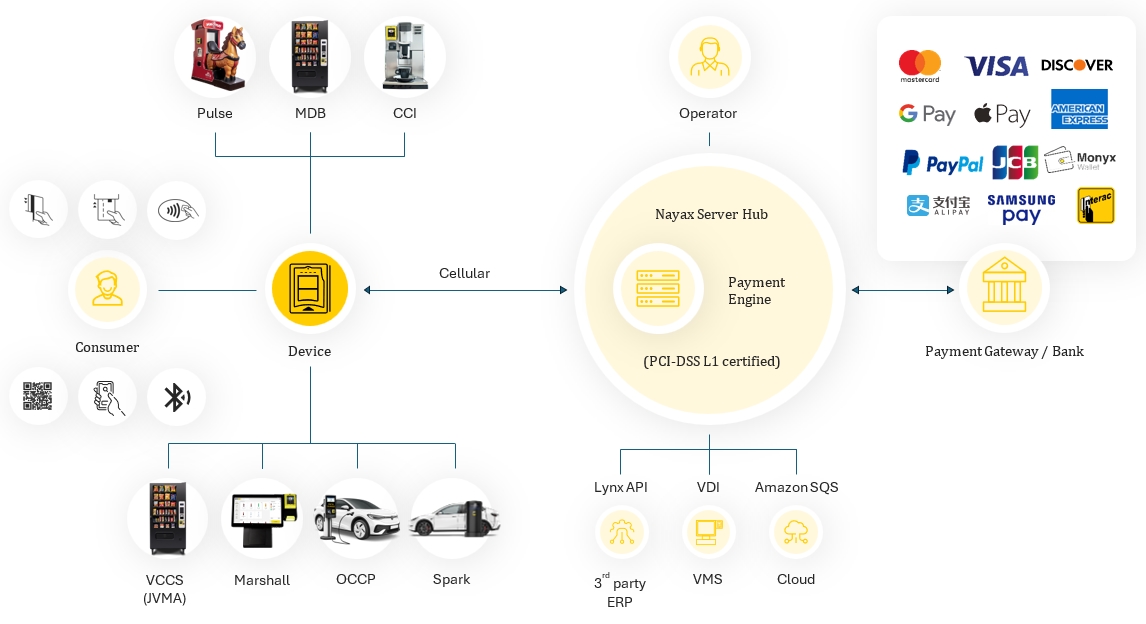
• |
Cortina, a collection of API methods which allows a third-party payment gateway
to process payments via Nayax systems as depicted in the following diagram: |
|
|
• |
Patents:
We own four issued U.S. patents, five issued Israeli patents, two issued European patents, and four patents issued in other jurisdictions.
We also have several active patents applications in various jurisdictions. |
|
|
• |
Domain Names:
We own eight registered website domains. |
|
|
• |
Trademarks:
We maintain trademarks and service marks on or in connection with our proprietary technology and services, including both unregistered
common law marks and issued trademark registrations, in jurisdictions including Israel, the United States, Japan, Australia, the European
Union, the United Kingdom, China and Mexico, and others. |
|
|
• |
Ownership:
We empower employees to take responsibility for their decisions and outcomes, fostering accountability, entrepreneurial thinking, and
meaningful results for our customers. |
|
|
• |
Listen:
We listen closely to our customers and each other, uncovering opportunities to innovate, building stronger relationships, and deliver
solutions that solve customer pain points. |
|
|
• |
Act:
We encourage employees of all levels to be decisive, challenge the status quo, and take calculated risks to better serve our customers
and meet their needs quickly and effectively. |
|
|
• |
Honesty:
We place honesty and integrity at the heart of every action we take, sustaining collaboration within our team and forging lasting, trust-based
partnerships with our customers. |
|
|
• |
We acquired VMT, a leading technology provider for the automated self-service industry
in Brazil. This strategic acquisition marks a significant step in our expansion into the Latin American market by enabling us to leverage
VMT’s established position serving thousands of retailers in diverse industries in hundreds of cities across Brazil. |
|
|
• |
We acquired Roseman Engineering, a Tel-Aviv based fuel and electric vehicle management
software solution provider that allows managers of gas stations to track fuel station income, reduce expenses and increase operational
efficiencies. This acquisition complements our existing offerings utilized by EV charging station operators worldwide. |
|
|
• |
We launched EV CloudPay, a cloud-based payments solution to facilitate payments
at EV charging stations. EV CloudPay is a single cloud-based kiosk that facilitates the payments for multiple chargers (without having
to download and use multiple mobile apps), enabling a seamless experience for charging station operators and customers. |
|
|
• |
Our VPOS Touch card reader was designated Best Payment System from The Vendies,
an annual UK-based vending industry award. VPOS Touch helps operators stay on top of their business via telemetry technology that communicates
with a vending management system and app. VPOS Touch won the same award for Best Payment System in 2021 and won the Payment System of
the Year award from The Vendies in 2016, 2017 and 2018. |
|
|
• |
We opened a new Technical Support Center for the U.S. market aimed at enhancing
our customer support quality, reducing call times and increasing customer satisfaction. We have also worked to automate several onboarding
processes, with the goal of enabling us to continue to scale without compromising on support responsiveness. |
|
|
• |
We entered into a collaboration agreement with DKV Mobility, a B2B platform for
on-the-road payment solutions that will further expand our payments acceptance across Europe. DKV Mobility offers access to the largest
energy-agnostic acceptance network in Europe, including tens of thousands of fuel service stations and hundreds of thousands of public
and semi-public EV charging stations. |
|
|
• |
We entered into a strategic partnership with Slovakia’s ASO Vending, the country’s
largest vending machine operator. This partnership will include the installation of thousands of Nayax card readers on vending machines
throughout the country, more than doubling Nayax’s active devices in Slovakia. |
|
|
• |
We entered into a strategic partnership with Ayden to globally expand its EV charging
and automated self-service payments infrastructure. This partnership introduces the world’s first global omnichannel payment service
provider solution for EV charging, integrating our payment and loyalty platform into Adyen’s international platform. Additionally,
this global partnership enables us to expand into new regions, such as Latin America and APAC, while reducing operational costs.
|
|
|
• |
We entered into a strategic partnership with A2Z Cust2Mate Solutions Corp. to integrate
our automated self-service mobile payment system with A2Z Cust2Mate’s cart platform for small retails stores. This collaboration
will enable customers to complete their shopping journey directly from their smart cart, eliminating the need for checkout lines, with
a seamless “pick-and-go” experience. |
|
|
• |
We launched the Energy EV Kiosk, a payment processing solution for EV charging stations.
The Energy EV Kiosk enables a seamless and fast payment experience for drivers charging their vehicles using credit cards, debit cards
or mobile wallets without the need for individual payment devices on each charger. |
| C. |
Organizational Structure |
|
Company |
Country of Incorporation
|
Percentage Ownership and Voting Interest |
Main Activities
| |||
|
Nayax LLC |
USA (Maryland) |
100% |
Sale of the Company’s products and
services | |||
|
Nayax Europe UAB |
Lithuania |
100% |
Processing transactions on behalf of the
Company’s customers in Europe | |||
|
Nayax AU PTY Ltd. |
Australia |
100% |
Sale of the Company’s products and
services | |||
|
Nayax (UK) Limited |
UK |
100% |
Sale of the Company’s products and
services |
| D. |
Property, Plants and Equipment |
| ITEM 4A. |
UNRESOLVED STAFF COMMENTS |
| ITEM 5. |
OPERATING AND FINANCIAL REVIEW AND PROSPECTS |
| A. |
Operating Results |
|
|
• |
Software and ongoing services,
including SaaS solutions; |
|
|
• |
Payment processing fees;
and |
|
|
• |
Hardware sales and other one-time revenues,
such as professional services. |
|
Year ended December 31,
|
||||||||||||
|
2024 |
2023 |
2022 |
||||||||||
|
SaaS Revenue ($millions)
|
88.5 |
58.9 |
45.3 |
|||||||||
|
YoY Growth
|
50 |
% |
30 |
% |
30.9 |
% | ||||||
|
Payment Processing Fees ($millions) |
133.8 |
92.1 |
59.5 |
|||||||||
|
YoY Growth
|
45 |
% |
55 |
% |
63 |
% | ||||||
|
Year ended December 31,
|
||||||||||||||||||||||||
|
2024 |
2023 |
2022 |
||||||||||||||||||||||
|
Revenue
($ millions) |
Rate of
total income |
Revenue
($ millions) |
Rate of
total income |
Revenue
($ millions) |
Rate of
total income |
|||||||||||||||||||
|
SaaS Revenue and Payment Processing Fees |
222.3 |
70.8 |
% |
151.1 |
64.1 |
% |
104.8 |
60.4 |
% | |||||||||||||||
|
Revenue from sale of integrated POS devices |
91.7 |
29.2 |
% |
84.4 |
35.9 |
% |
68.7 |
39.6 |
% | |||||||||||||||
|
Year ended December 31,
|
||||||||||||
|
2024 |
2023 |
2022 |
||||||||||
|
Net revenue retention
|
129 |
% |
144 |
% |
131 |
% | ||||||
|
|
• |
Global Economic Growth:
Slower economic expansion may lead businesses to scale back or delay investments in our integrated POS devices and services. Consumers
could also reduce discretionary spending in response to slower growth, reducing our overall transaction volumes. |
|
|
• |
Supply Chain Disruptions:
Component shortages, or anticipated or unanticipated logistical disturbances could disrupt our ability to manufacture and fulfill orders
on time, increasing the cost of essential components and shipping or impacting our ability to meet contractual commitments.
|
|
|
• |
Interest Rates:
Rising interest rates could increase borrowing costs for our customers, limiting their ability to invest in new locations, upgrade payment
infrastructure, or adopt our integrated POS solutions at the same pace. |
|
|
• |
Inflation:
Volatility in component prices has already affected production costs for our integrated POS devices, and prolonged inflation may further
strain margins. While general inflation has not yet significantly impacted customer demand for our solutions, persistent cost increases
could require adjustments in pricing or supply chain strategies to maintain affordability and competitiveness. |
|
|
• |
Tariffs:
Elevated tariffs on essential imported materials, including steel and aluminum, could lead to higher manufacturing expenses for our integrated
POS devices, potentially reducing our profit margins. Suppliers also may attempt to renegotiate or terminate contracts if tariffs unexpectedly
raise their operating costs or disrupt their own supply chains. |
|
|
• |
SaaS Subscriptions:
We charge monthly fees per billable device for access to our telemetry and management software, with pricing based on a tiered subscription
model. Customers can choose from multiple plans, each offering different levels of functionality and support, ensuring flexibility for
businesses of all sizes. Revenue is recognized over the subscription period once service begins. |
|
|
• |
Payment Processing Fees:
We charge a transaction fee for payments processed through our platform, typically calculated as a percentage of the total transaction
amount. We recognize revenue from Payment Processing Fees as gross revenue because we are responsible for facilitating, managing, and
ensuring the completion of the transaction. We recognize fees paid to our acquiring partners as cost of revenues because they are direct
expenses incurred to deliver that service. |
|
|
• |
Hardware Revenue:
We generate one-time revenue from the sale of integrated POS hardware. Although we believe that businesses can optimize their sales performance,
cost efficiency, and customer experience by deploying our integrated POS devices in conjunction with our SaaS solutions and payment processing
infrastructure, our hardware supports multiple functionalities and can be purchased as a standalone product. We recognize revenue from
hardware sales when control of the device transfers to the customer, as each sale is a distinct performance obligation separate from any
related services. |
|
|
• |
Hardware-Related Costs includes
all expenses associated with the production, sale, and distribution of our integrated POS devices, including hardware component costs,
shipping and handling expenses, external manufacturing services, salary-based and share-based compensation for employees, quality control,
and infrastructure costs related to testing and production oversight. |
|
|
• |
Payment Processing-Related Costs
includes interchange and flat fees paid to processing agencies, including merchant acquirers and card networks, for payment processing
services. |
|
|
• |
SaaS-Related Costs
includes all expenses associated with developing or maintaining our SaaS platform and device communication network, expenses related to
our Tier 1 customer support team, and relevant employee-related costs, including salary-based and share-based compensation.
|
|
Year ended December 31,
|
||||||||||||
|
2024 |
2023 |
2022 |
||||||||||
|
U.S. Dollars in thousands
|
||||||||||||
|
Interest income on cash and bank deposits |
3,110 |
1,685 |
- |
|||||||||
|
Financial income in respect of change in fair value options
|
148 |
- |
423 |
|||||||||
|
Financial income in respect of shareholders and related companies
|
150 |
24 |
15 |
|||||||||
|
Financial income in respect of finance sub-lease |
- |
17 |
- |
|||||||||
|
Financial income in respect of exchange rate differences
|
- |
767 |
- |
|||||||||
|
3,408 |
2,493 |
438 |
||||||||||
|
Year ended December 31,
|
||||||||||||
|
2024 |
2023 |
2022 |
||||||||||
|
U.S. Dollars in thousands
|
||||||||||||
|
Interest expense on bank loans and bank fees |
(6,181 |
) |
(3,389 |
) |
(993 |
) | ||||||
|
Financial expenses in respect of change in fair value options
|
- |
(310 |
) |
- |
||||||||
|
Financial expenses in respect of loans from others |
(197 |
) |
(591 |
) |
(70 |
) | ||||||
|
Financial expenses in respect of other liabilities |
(1,552 |
) |
(161 |
) |
(167 |
) | ||||||
|
Financial expenses in respect of leases liabilities |
(333 |
) |
(330 |
) |
(260 |
) | ||||||
|
Financial Expenses in respect of exchange rate differences
|
(2,634 |
) |
- |
(1,968 |
) | |||||||
|
(10,897 |
) |
(4,781 |
) |
(3,458 |
) | |||||||
|
As of December 31,
|
||||||||||||
|
2024 |
2023 |
2022 |
||||||||||
|
Number of customers
|
95,060 |
72,252 |
47,385 |
|||||||||
|
YoY growth
|
32 |
% |
52 |
% |
60 |
% | ||||||
|
As of December 31,
|
||||||||||||
|
2024 |
2023 |
2022 |
||||||||||
|
Number of managed and connected devices (in thousands)
|
1,260 |
1,044 |
725 |
|||||||||
|
YoY growth
|
21 |
% |
44 |
% |
40 |
% | ||||||
|
Year ended December 31,
|
||||||||||||
|
2024 |
2023 |
2022 |
||||||||||
|
Number of transactions (in millions) |
2,378 |
1,841 |
1,304 |
|||||||||
|
YoY growth
|
29 |
% |
41 |
% |
64 |
% | ||||||
|
Year ended December 31,
|
||||||||||||
|
2024 |
2023 |
2022 |
||||||||||
|
In USD thousands
|
||||||||||||
|
Loss for the period
|
(5,631 |
) |
(15,887 |
) |
(37,509 |
) | ||||||
|
Finance expenses,
net |
7,489 |
2,288 |
3,020 |
|||||||||
|
Tax expenses
|
1,247 |
1,215 |
451 |
|||||||||
|
Depreciation and amortization
|
21,370 |
12,505 |
9,028 |
|||||||||
|
EBITDA
|
24,475 |
121 |
(25,010 |
) | ||||||||
|
Share-based payment
costs |
7,187 |
6,027 |
8,747 |
|||||||||
|
employment benefit
cost(1)
|
541 |
- |
- |
|||||||||
|
Non-recurring issuance
and acquisition costs(2) |
2,023 |
444 |
1,790 |
|||||||||
|
Share of loss of equity
method investee |
1,270 |
1,555 |
1,794 |
|||||||||
|
Adjusted EBITDA
|
35,496 |
8,147 |
(12,679 |
) | ||||||||
|
|
(1) |
Consists of other compensation arrangements provided to the shareholders of VMT.
|
|
|
(2) |
Consists primarily of (i) expenses incurred in connection with our listing on Nasdaq,
(ii) professional fees and other expenses incurred in connection with our acquisitions, (iii) fees and expenses, other than underwriter
discount and commissions, incurred in connection with our March 2024 underwritten public offering of 3,130,435 ordinary shares, (iv) settlement
arrangement and legal expenses incurred in connection with and throughout the ICA’s investigative process related to our acquisition
of OTI. |
|
Year ended December 31, |
||||||||
|
2024 |
2023 |
|||||||
|
In USD thousands |
||||||||
|
Revenues |
314,013 |
235,491 |
||||||
|
Cost of revenues |
172,479 |
147,198 |
||||||
|
Gross Profit |
141,534 |
88,293 |
||||||
|
Research and development expenses |
25,374 |
21,928 |
||||||
|
Selling, administrative and general expenses |
98,196 |
70,320 |
||||||
|
Depreciation and amortization in respect of technology and capitalized development costs |
11,566 |
6,430 |
||||||
|
Other expenses |
2,023 |
444 |
||||||
|
Share of loss of equity method investee |
1,270 |
1,555 |
||||||
|
Profit (Loss) from ordinary operations |
3,105 |
(12,384 |
) | |||||
|
Financial Income |
3,408 |
2,493 |
||||||
|
Financial Expense |
(10,897 |
) |
(4,781 |
)
| ||||
|
Loss before taxes on income
|
(4,384 |
) |
(14,672 |
) | ||||
|
Tax expenses |
(1,247 |
) |
(1,215 |
) | ||||
|
Loss for the year
|
(5,631 |
) |
(15,887 |
) | ||||
|
Year ended December 31, |
||||||||
|
2024 |
2023 |
|||||||
|
In USD thousands |
||||||||
|
Revenue from the sale of integrated POS devices |
91,677 |
84,406 |
||||||
|
Recurring revenue |
222,336 |
151,085 |
||||||
|
Total revenue |
314,013 |
235,491 |
||||||
|
Year ended December 31, |
||||||||
|
2024 |
2023 |
|||||||
|
In USD thousands |
||||||||
|
Cost of integrated POS devices sales
|
64,106 |
68,433 |
||||||
|
Cost of recurring revenue |
108,373 |
78,765 |
||||||
|
Total cost of revenue
|
172,479 |
147,198 |
||||||
|
Year ended December 31, |
||||||||
|
2024 |
2023 |
|||||||
|
In USD thousands |
||||||||
|
United States |
123,033 |
83,528 |
||||||
|
Europe (excluding United Kingdom) |
76,000 |
72,887 |
||||||
|
United Kingdom |
38,688 |
26,391 |
||||||
|
Australia |
27,521 |
22,484 |
||||||
|
Israel |
16,967 |
13,095 |
||||||
|
Rest of the World |
31,804 |
17,106 |
||||||
|
Total |
314,013 |
235,491 |
||||||
|
Year ended December 31, |
||||||||
|
2024 |
2023 |
|||||||
|
(in USD thousands) |
||||||||
|
Net cash generated from (used in): |
||||||||
|
Net cash generated from operating activities |
42,902 |
8,798 |
||||||
|
Net cash flows used in investing activities |
(45,906 |
) |
(36,831 |
) | ||||
|
Net cash flows generated from financing activities |
50,844 |
31,551 |
||||||
|
Increase in cash and cash equivalents
|
47,840 |
3,518 |
||||||
|
B. |
Liquidity and Capital Resources |
| C. |
Research and Development, Patents and Licenses, etc. |
| D. |
Trend Information |
| E. |
Critical Accounting Estimates |
| ITEM 6. |
DIRECTORS, SENIOR MANAGEMENT AND EMPLOYEES |
| A. |
Directors and Senior Management |
|
Name |
Position(s) |
Age | ||
|
Directors |
| |||
|
Yair Nechmad |
Co-Founder, Chairman and Chief Executive Officer |
62 | ||
|
David Ben-Avi |
Co-Founder, Chief Technology Officer and Director |
51 | ||
|
Rina Shafir |
Director |
61 | ||
|
Vered Raz Avayo |
Director |
55 | ||
|
Nir Dor |
Director |
61 | ||
|
Reuven Ben Menachem |
Director |
64 | ||
|
Eran Havshush |
Director |
49 | ||
|
Executive Officers |
|
|||
|
Sagit Manor |
Chief Financial Officer |
52 | ||
|
Oren Tepper |
Chief Commercial Officer |
53 | ||
|
Keren Sharir |
President and Chief Marketing Officer |
45 | ||
|
Tami Erel |
Chief Business Operations Officer |
49 | ||
|
Gal Omer |
Chief Legal Officer |
42 | ||
|
Oded Frenkel |
Chief Customer Officer |
44 | ||
|
Moshe Shmaryahu |
Chief Information Officer |
57 | ||
|
Yaron Aharon |
Chief Operating Officer |
58 | ||
|
Aaron Greenberg |
Chief Strategy Officer |
30 | ||
|
Erez Aminpour |
Chief Product Officer |
42 | ||
|
Eden Zafrani |
Chief Human Resources Officer |
43 |
| B. |
Compensation |
|
Remuneration for services(1)
|
||||||||||||||||||||||||||||||
|
Name |
Position |
Scope of employment |
Salary |
Bonus |
Share-based payment |
Management fees |
Consulting fees |
Total |
||||||||||||||||||||||
|
In thousands |
||||||||||||||||||||||||||||||
|
Yair Nechmad |
Co-Founder, Chairman and Chief Executive Officer |
100 |
% |
$ |
483 |
— |
$ |
811 |
— |
— |
$ |
1,294 |
||||||||||||||||||
|
David Ben-Avi |
Co-Founder, Chief Technology Officer and Director |
100 |
% |
$ |
483 |
— |
$ |
811 |
— |
— |
$ |
1,294 |
||||||||||||||||||
|
Sagit Manor |
Chief Financial Officer |
100 |
% |
$ |
317 |
73 |
$ |
243 |
— |
— |
$ |
633 |
||||||||||||||||||
|
Carly Furman |
General Manager, North America |
100 |
% |
$ |
508 |
— |
$ |
80 |
— |
— |
$ |
588 |
||||||||||||||||||
|
Keren Sharir |
President and Chief Marketing Officer |
100 |
% |
$ |
277 |
32 |
$ |
92 |
— |
— |
$ |
400 |
||||||||||||||||||
| (1) |
In accordance with Israeli law and practice, all amounts reported in the above table
are in terms of cost to our Company, as recorded in our audited consolidated financial statements. All of the executive officers listed
in the above table are full-time employees, except for Yair Nechmad and David Ben-Avi, whose compensation was paid under services agreements
we have with them. See “—Services Agreements with our Founders.” |
| C. |
Board Practices |
|
|
• |
such majority includes at least a majority of the shares held by all shareholders
who are not controlling shareholders and do not have a personal interest in the election of the external director (other than a personal
interest not deriving from a relationship with a controlling shareholder) that are voted at the meeting, excluding abstentions; or
|
|
|
• |
the total number of shares voted by non-controlling shareholders and by shareholders
who do not have a personal interest in the election of the external director against the election of the external director does not exceed
2% of the aggregate voting rights in the company. |
|
|
• |
an employment relationship; |
|
|
• |
a business or professional relationship even if not maintained on a regular basis
(excluding insignificant relationships); |
|
|
• |
control; and |
|
|
• |
service as an office holder, excluding service as a director in a private company
prior to the initial public offering of its shares if such director was appointed as a director of the private company in order to serve
as an external director following the initial public offering. |
|
|
• |
he or she meets the qualifications for being appointed as an external director,
except for the requirement (i) that the director be an Israeli resident (which does not apply to companies such as ours whose securities
have been offered outside of Israel or are listed for trading outside of Israel) and (ii) for accounting and financial expertise or professional
qualifications; and |
|
|
• |
he or she has not served as a director of the company for a period exceeding nine
consecutive years. For this purpose, a break of less than two years in his or her service as a director shall not be deemed to interrupt
the continuity of the service. |
|
|
• |
retaining and terminating our independent auditors, subject to ratification by the
board of directors, and in the case of retention, to ratification by the shareholders; |
|
|
• |
pre-approving audit and non-audit services to be provided by the independent auditors
and related fees and terms; |
|
|
• |
overseeing the accounting and financial reporting processes of the Company and audits
of our financial statements, the effectiveness of our internal control over financial reporting and making such reports as may be required
of an audit committee under the rules and regulations promulgated under the Exchange Act; |
|
|
• |
reviewing with management and our independent auditor our annual and interim financial
statements prior to publication or filing (or submission, as the case may be) to the SEC; |
|
|
• |
recommending to the board of directors the retention and termination of the internal
auditor and the internal auditor’s engagement fees and terms, in accordance with the Companies Law, approving the yearly or periodic
work plan proposed by the internal auditor and examining whether the internal auditor was afforded all required resources to perform its
role; |
|
|
• |
reviewing with our general counsel and/or external counsel, as deemed necessary,
legal and regulatory matters that could have a material impact on the financial statements; |
|
|
• |
identifying irregularities in our business administration by, among other things,
consulting with the internal auditor or with the independent auditor, and suggesting corrective measures to the board of directors;
|
|
|
• |
reviewing policies and procedures with respect to transactions between the Company
and officers and directors (other than transactions related to the compensation or terms of service of the officers and directors), or
affiliates of officers or directors, or transactions that are not in the ordinary course of the Company’s business and deciding
whether to approve such acts and transactions if so required under the Companies Law; and |
|
|
• |
establishing procedures for the handling of employees’ complaints as to the
management of our business and the protection to be provided to such employees. |
|
|
• |
recommending to the board of directors the approval of the compensation policy for
office holders and, once every three years, regarding any extensions to a compensation policy that was adopted for a period of more than
three years; |
|
|
• |
monitoring the implementation of the compensation policy and periodically making
recommendations to the board of directors with respect to any amendments or updates of the compensation policy; |
|
|
• |
resolving whether or not to approve arrangements with respect to the terms of office
and employment of office holders; and |
|
|
• |
exempting, under certain circumstances, transactions with our chief executive officer
from the approval of our shareholders. |
|
|
• |
from time to time, reviewing the implementation of our compensation policy in accordance
with the requirements of the Companies Law as well as other compensation policies, incentive-based compensation plans and equity-based
compensation plans (insofar as these relate to office holders in the Company), and overseeing the development and implementation of such
policies and recommending to our board of directors any amendments or modifications the committee deems appropriate, including as required
under the Companies Law; |
|
|
• |
reviewing and approving the employment terms of our office holders, including granting
of options and other incentive awards and reviewing and approving corporate goals and objectives relevant to the compensation of our executive
officers, including evaluating their performance in light of such goals and objectives; and |
|
|
• |
approving and exempting certain transactions regarding office holders’ compensation
pursuant to the Companies Law. |
|
|
• |
such majority includes at least a majority of the shares held by shareholders who
are not controlling shareholders and shareholders who do not have a personal interest in such compensation policy which voted at the meeting,
disregarding abstentions; or |
|
|
• |
the total number of shares of non-controlling shareholders and shareholders who
do not have a personal interest in the compensation policy and who vote against the policy, does not exceed 2% of the aggregate voting
rights in the company. |
|
|
• |
the education, skills, experience, expertise and accomplishments of the relevant
office holder; |
|
|
• |
the office holder’s position and responsibilities; |
|
|
• |
prior compensation agreements with the office holder; |
|
|
• |
the ratio between the cost of the terms of employment of an office holder and the
cost of the employment of other employees of the company, including employees employed through contractors who provide services to the
company, in particular the ratio between such cost to the average and median salary of such employees of the company, as well as the impact
of disparities between them on the work relationships in the company; |
|
|
• |
if the terms of employment include variable components—the possibility of
reducing variable components at the discretion of the board of directors and the possibility of setting a limit on the value of non-cash
variable equity-based components; and |
|
|
• |
if the terms of employment include severance compensation—the term of employment
or office of the office holder, the terms of the office holder’s compensation during such period, the company’s performance
during such period, the office holder’s individual contribution to the achievement of the company goals and the maximization of
its profits and the circumstances under which he or she is leaving the company. |
|
|
• |
with regard to variable components: |
|
|
• |
with the exception of office holders who report to the chief executive officer,
a means of determining the variable components on the basis of long-term performance and measurable criteria; provided that the company
may determine that an immaterial part of the variable components of the compensation package of an office holder shall be awarded based
on non-measurable criteria, or if such amount is not higher than three months’ salary per annum, taking into account such office
holder’s contribution to the company; and |
|
|
• |
the ratio between variable and fixed components, as well as the limit of the values
of variable components at the time of their payment, or in the case of equity-based compensation, at the time of grant. |
|
|
• |
a claw-back provision under which the office holder will return to the company,
according to conditions to be set forth in the compensation policy, any amounts paid as part of the office holder’s terms of employment,
if such amounts were paid based on information later discovered to be wrong, and such information was restated in the company’s
financial statements; |
|
|
• |
the minimum holding or vesting period of variable equity-based components to be
set in the terms of office or employment, as applicable, while taking into consideration long-term incentives; and |
|
|
• |
a limit to retirement grants. |
|
|
• |
overseeing and assisting our board in reviewing and recommending nominees for election
as directors; |
|
|
• |
assessing the performance of the members of our board; and |
|
|
• |
establishing and maintaining effective corporate governance policies and practices.
|
|
|
• |
at least a majority of the shares held by all shareholders who are not controlling
shareholders and do not have a personal interest in such matter, present and voting on such matter, are voted in favor of the compensation
package, excluding abstentions; or |
|
|
• |
the total number of shares of non-controlling shareholders and shareholders who
do not have a personal interest in such matter voting against the compensation package does not exceed 2% of the aggregate voting rights
in the Company. |
|
|
• |
information on the advisability of a given action brought for his, her or its approval
or performed by virtue of his or her position; and |
|
|
• |
all other important information pertaining to such action. |
|
|
• |
refrain from any act involving a conflict of interest between the performance of
his or her duties in the company and his or her other duties or personal affairs; |
|
|
• |
refrain from any activity that is competitive with the business of the company;
|
|
|
• |
refrain from exploiting any business opportunity of the company for the purpose
of gaining a personal advantage for himself, herself or others; and |
|
|
• |
disclose to the company any information or documents relating to the company’s
affairs which the office holder received as a result of his or her position as an office holder. |
| D. |
Employees |
| E. |
Share Ownership |
| F. |
Disclosure of a Registrant’s Action to Recover Erroneously
Awarded Compensation |
| ITEM 7. |
MAJOR SHAREHOLDERS AND RELATED PARTY TRANSACTIONS |
| A. |
Major Shareholders |
|
|
• |
each person, or group of affiliated persons, known by us to own beneficially 5%
or more of our outstanding ordinary shares; |
|
|
• |
each of our executive officers and members of our board of directors; and
|
|
|
• |
all of our executive officers and members of our board of directors as a group.
|
|
Name of Beneficial Owner |
Number of
Ordinary Shares Beneficially Owned |
Percentage of Ordinary Shares Beneficially Owned |
||||||
|
5% or Greater Shareholders |
||||||||
|
Amir Nechmad(1)
|
6,927,921 |
18.86 |
% | |||||
|
Yair Nechmad(2)
|
8,732,994 |
23.63 |
% | |||||
|
David Ben-Avi(3)
|
7,149,135 |
19.34 |
% | |||||
|
Other Executive Officers and Board Members |
||||||||
|
Rina Shafir |
* |
* |
||||||
|
Vered Raz Avayo |
* |
* |
||||||
|
Nir Dor |
* |
* |
||||||
|
Reuven Ben Menachem |
* |
* |
||||||
|
Eran Havshush |
* |
* |
||||||
|
Sagit Manor |
* |
* |
||||||
|
Oren Tepper |
* |
* |
||||||
|
Keren Sharir |
* |
* |
||||||
|
Tami Erel |
* |
* |
||||||
|
Gal Omer |
* |
* |
||||||
|
Oded Frenkel |
* |
* |
||||||
|
Moshe Shmaryahu |
* |
* |
||||||
|
Yaron Aharon |
* |
* |
||||||
|
Aaron Greenberg |
* |
* |
||||||
|
Erez Aminpour |
* |
* |
||||||
|
Eden Zafrani |
* |
* |
||||||
|
All executive officers and Board members as a group (18 individuals) |
16,043,805 |
43.13 |
% | |||||
| * |
Represents beneficial ownership of less than 1% of our total outstanding ordinary
shares. |
| (1) |
Consists of 6,927,921ordinary shares held of record by Mr. Amir Nechmad. |
| (2) |
Consists of (i) 8,497,389 ordinary shares held of record by Mr. Yair Nechmad or
a company wholly owned by Mr. Yair Nechmad and (ii) 235,605 ordinary shares subject to options held by Mr. Yair Nechmad that are exercisable.
|
| (3) |
Consists of (i) 6,913,530 ordinary shares held of record by Mr. Ben-Avi and (ii)
235,605 ordinary shares subject to options held by Mr. Ben-Avi that are exercisable. |
| B. |
Related Party Transactions |
| C. |
Interests of Experts and Counsel |
| ITEM 8. |
FINANCIAL INFORMATION |
| A. |
Consolidated Statements and Other Financial Information
|
| B. |
Significant Changes |
| ITEM 9. |
THE OFFER AND LISTING |
| A. |
Offering and Listing Details |
| B. |
Plan of Distribution |
| C. |
Markets |
| D. |
Selling Shareholders |
| E. |
Dilution |
| F. |
Expenses of the Issue |
| ITEM 10. |
ADDITIONAL INFORMATION |
| A. |
Share Capital |
| B. |
Memorandum and Articles of Association |
| C. |
Material Contracts |
| D. |
Exchange Controls |
| E. |
Taxation |
|
|
• |
the expenditures are approved by the relevant Israeli government authority, determined
by the field of research; |
|
|
• |
the research and development are for the benefit of the company; and |
|
|
• |
the research and development are carried out by or on behalf of the company seeking
such tax deduction. |
|
|
• |
certain financial institutions; |
|
|
• |
insurance companies; |
|
|
• |
dealers or certain traders in securities that mark their securities to market for
U.S. income tax purposes; |
|
|
• |
persons holding ordinary shares as part of a straddle, integrated or similar transaction;
|
|
|
• |
persons who acquire ordinary shares in connection with employment; |
|
|
• |
persons whose functional currency for U.S. federal income tax purposes is not the
U.S. dollar; |
|
|
• |
entities classified as partnerships for U.S. federal income tax purposes and their
partners; |
|
|
• |
tax-exempt entities, individual retirement accounts, or “Roth IRAs”;
|
|
|
• |
persons that own or are deemed to own 10% or more of the Company’s stock by
vote or value; or |
|
|
• |
persons holding ordinary shares in connection with a trade or business outside the
United States. |
|
|
• |
a citizen (other than a resident of Israel) or individual resident of the United
States; |
|
|
• |
a corporation, or other entity taxable as a corporation, created or organized in
or under the laws of the United States, any state therein or the District of Columbia; or |
|
|
• |
an estate or trust the income of which is subject to U.S. federal income taxation
regardless of its source. |
| F. |
Dividends and Paying Agents |
| G. |
Statement by Experts |
| H. |
Documents on Display |
| I. |
Subsidiary Information |
| J. |
Annual Report to Security Holders |
| ITEM 11. |
QUANTITATIVE AND QUALITATIVE DISCLOSURES ABOUT MARKET RISK
|
| ITEM 12. |
DESCRIPTION OF SECURITIES OTHER THAN EQUITY SECURITIES |
| A. |
Debt Securities |
| B. |
Warrants and Rights |
| C. |
Other Securities |
| D. |
American Depositary Shares |
| ITEM 13. |
DEFAULTS, DIVIDEND ARREARAGES AND DELINQUENCIES |
| ITEM 14. |
MATERIAL MODIFICATIONS TO THE RIGHTS OF SECURITY HOLDERS AND USE OF PROCEEDS |
| ITEM 15. |
CONTROLS AND PROCEDURES |
| A. |
Disclosure Controls and Procedures |
| B. |
Management’s Annual Report on Internal Control Over Financial
Reporting |
| C. |
Attestation Report of the Registered Public Accounting Firm
|
| D. |
Changes in Internal Control Over Financial Reporting |
| ITEM 16. |
[RESERVED] |
| ITEM 16A. |
AUDIT COMMITTEE FINANCIAL EXPERT |
| ITEM 16B. |
CODE OF ETHICS |
| ITEM 16C. |
PRINCIPAL ACCOUNTANT FEES AND SERVICES |
|
Year ended December 31, |
||||||||
|
2024 |
2023 |
|||||||
|
(in USD thousands) |
||||||||
|
Audit (1) |
470 |
423 |
||||||
|
Audit-related fees (2) |
45 |
54 |
||||||
|
Tax fees (3) |
83 |
39 |
||||||
|
All other fees (4) |
2 |
2 |
||||||
|
Total |
600 |
518 |
||||||
|
|
(1) |
Audit fees consist of services that would normally be provided in connection with
statutory and regulatory filings or engagements, including services that generally only the independent accountant can reasonably provide.
|
|
|
(2) |
Audit-related fees for assurance and related services that were reasonably related
to the performance of the audit not reported under “Audit Fees”. |
|
|
(3) |
Tax fees consist of fees for professional services for tax compliance, tax advice
and tax audits. |
|
|
(4) |
“All other fees” consist of all other fees in the years ended December 31,
2024 and 2023 related to services in connection with non-audit compliance and review work. |
| ITEM 16D. |
EXEMPTIONS FROM THE LISTING STANDARDS FOR AUDIT COMMITTEES |
| ITEM 16E. |
PURCHASES OF EQUITY SECURITIES BY THE ISSUER AND AFFILIATED PURCHASERS |
| ITEM 16F. |
CHANGE IN REGISTRANT’S CERTIFYING ACCOUNTANT |
| ITEM 16G. |
CORPORATE GOVERNANCE |
| ITEM 16H. |
MINE SAFETY DISCLOSURE |
| ITEM 16I. |
DISCLOSURE REGARDING FOREIGN JURISDICTIONS THAT PREVENT INSPECTIONS |
|
ITEM 16J.
|
INSIDER TRADING POLICIES
|
| ITEM 16K. |
CYBERSECURITY
|
| • |
IS Policy development and approval,
|
| • |
Risk management,
|
| • |
Budgetary approval,
|
| • |
Leadership and culture,
|
| • |
Compliance oversight,
|
| • |
Crisis management, and
|
| • |
Continuous improvement.
|
| ITEM 17. |
FINANCIAL STATEMENTS
|
| ITEM 18. |
FINANCIAL STATEMENTS
|
| ITEM 19. |
EXHIBITS
|
|
Exhibit No.
|
Description
|
|
|
101
|
The following financial statements from the Company’s 20-F for the fiscal year ended December 31, 2024 formatted in Inline XBRL: (i) Inline Consolidated Statements of Comprehensive Loss, (ii) Inline Consolidated Statements of Financial Position, (iii) Inline Consolidated Statements of Changes in Equity, (iv) Inline Consolidated Statements of Cash Flows, and (v) Inline Notes to the Consolidated Financial Statements.
|
|
|
104
|
Cover Page Interactive Data File (embedded within the Inline XBRL document)
|
| * |
Filed herewith.
|
|
Nayax Ltd.
|
|||
|
Date:
|
March 4, 2025
|
By:
|
/s/ Yair Nechmad
|
|
Name: Yair Nechmad
|
|||
|
Title: Chief Executive Officer
|
|||
|
By:
|
/s/ Sagit Manor
|
||
|
Name: Sagit Manor
|
|||
|
Title: Chief Financial Officer
|
|||
|
Page
|
|
|
Report of Independent Registered Public Accounting Firm (PCAOB ID 1309)
|
F-3
|
|
Consolidated financial statements – in thousands of US Dollars:
|
|
|
F-4 - F-5
|
|
|
F-6
|
|
|
F-7
|
|
|
F-8
|
|
|
F-9 - F-10
|
|
|
F-11 - F-65
|

|
Tel Aviv, Israel
|
/s/ Kesselman & Kesselman
|
|
March 4, 2025
|
Certified Public Accountants (Isr.)
|
|
A member firm of PricewaterhouseCoopers International Limited
|
| Kesselman & Kesselman, Azrieli Town Tower, 146 Derech Menachem Begin St, Tel- Aviv, 6492103, Israel |
|
P.O BOX 7187 Tel-Aviv, 6107120, Israel Telephone: +972 -3- 7954555, Fax:+972 -3- 7954556, www.pwc.com/il
|
|
December 31
|
|||||||||||
|
2024
|
2023
|
||||||||||
|
Note
|
U.S. dollars in thousands
|
||||||||||
|
ASSETS
|
|||||||||||
|
CURRENT ASSETS:
|
|||||||||||
|
Cash and cash equivalents
|
7
|
83,130
|
38,386
|
||||||||
|
Restricted cash transferable to customers for processing activity
|
8
|
60,299
|
49,858
|
||||||||
|
Short-term bank deposits
|
9,327
|
1,269
|
|||||||||
|
Receivables in respect of processing activity
|
45,071
|
43,261
|
|||||||||
|
Trade receivable, net
|
9
|
55,694
|
41,300
|
||||||||
|
Inventory
|
19,768
|
20,563
|
|||||||||
|
Other current assets
|
14,368
|
8,772
|
|||||||||
|
Total current assets
|
287,657
|
203,409
|
|||||||||
|
NON-CURRENT ASSETS:
|
|||||||||||
|
Long-term bank deposits
|
2,155
|
2,304
|
|||||||||
|
Other long-term assets
|
4,253
|
5,883
|
|||||||||
|
Investment in associates
|
3,754
|
5,024
|
|||||||||
|
Right-of-use assets, net
|
10
|
6,292
|
5,341
|
||||||||
|
Property and equipment, net
|
11
|
11,112
|
5,487
|
||||||||
|
Goodwill and intangible assets, net
|
12
|
117,670
|
96,411
|
||||||||
|
Total non-current assets
|
145,236
|
120,450
|
|||||||||
|
TOTAL ASSETS
|
432,893
|
323,859
|
|||||||||
F - 4
|
December 31
|
|||||||||||
|
2024
|
2023
|
||||||||||
|
Note
|
U.S. dollars in thousands
|
||||||||||
|
LIABILITIES AND EQUITY
|
|||||||||||
|
CURRENT LIABILITIES:
|
|||||||||||
|
Short-term bank credit and short term loan
|
13a.
|
25,276
|
47,477
|
||||||||
|
Current maturities of long-term bank loans
|
13b.
|
3,978
|
1,101
|
||||||||
|
Current maturities of other long-term liabilities
|
1,353
|
5,422
|
|||||||||
|
Current maturities of leases liabilities
|
10
|
2,967
|
2,145
|
||||||||
|
Payables in respect of processing activity
|
130,958
|
104,523
|
|||||||||
|
Trade payables
|
21,059
|
17,464
|
|||||||||
|
Other payables
|
33,887
|
25,650
|
|||||||||
|
Total current liabilities
|
219,478
|
203,782
|
|||||||||
|
NON-CURRENT LIABILITIES:
|
|||||||||||
|
Long-term bank loans
|
13b.
|
18,605
|
327
|
||||||||
|
Other long-term liabilities
|
14
|
20,716
|
14,476
|
||||||||
|
Post-employment benefit obligations, net
|
497
|
427
|
|||||||||
|
Lease liabilities
|
10
|
4,078
|
4,149
|
||||||||
|
Deferred income taxes
|
15
|
4,274
|
3,108
|
||||||||
|
Total non-current liabilities
|
48,170
|
22,487
|
|||||||||
|
TOTAL LIABILITIES
|
267,648
|
226,269
|
|||||||||
|
EQUITY:
|
16
|
||||||||||
|
Shareholders Equity:
|
|||||||||||
|
Share capital
|
9
|
8
|
|||||||||
|
Additional paid in capital
|
220,715
|
153,524
|
|||||||||
|
Capital reserves
|
7,832
|
9,643
|
|||||||||
|
Accumulated deficit
|
(63,311
|
)
|
(65,585
|
)
|
|||||||
|
TOTAL EQUITY
|
165,245
|
97,590
|
|||||||||
|
TOTAL LIABILITIES AND EQUITY
|
432,893
|
323,859
|
|||||||||
F - 5
|
Year ended December 31
|
|||||||||||||||
|
2024
|
2023
|
2022
|
|||||||||||||
|
U.S. dollars in thousands
|
|||||||||||||||
|
Note
|
(Excluding loss per share data)
|
||||||||||||||
|
Revenues
|
17
|
314,013
|
235,491
|
173,514
|
|||||||||||
|
Cost of revenues
|
18
|
(172,479
|
)
|
(147,198
|
)
|
(113,476
|
)
|
||||||||
|
Gross Profit
|
141,534
|
88,293
|
60,038
|
||||||||||||
|
Research and development expenses
|
19
|
(25,374
|
)
|
(21,928
|
)
|
(22,132
|
)
|
||||||||
|
Selling, general and administrative expenses
|
20
|
(98,196
|
)
|
(70,320
|
)
|
(64,092
|
)
|
||||||||
|
Depreciation and amortization in respect of technology and capitalized development costs
|
12
|
(11,566
|
)
|
(6,430
|
)
|
(4,268
|
)
|
||||||||
|
Other expenses
|
1a, 25
|
(2,023
|
)
|
(444
|
)
|
(1,790
|
)
|
||||||||
|
Share of losses of equity method investees
|
(1,270
|
)
|
(1,555
|
)
|
(1,794
|
)
|
|||||||||
|
Profit (Loss) from ordinary operations
|
3,105
|
(12,384
|
)
|
(34,038
|
)
|
||||||||||
|
Financial Income
|
21
|
3,408
|
2,493
|
438
|
|||||||||||
|
Financial Expense
|
21
|
(10,897
|
)
|
(4,781
|
)
|
(3,458
|
)
|
||||||||
|
Loss before taxes on income
|
(4,384
|
)
|
(14,672
|
)
|
(37,058
|
)
|
|||||||||
|
Tax expenses
|
15
|
(1,247
|
)
|
(1,215
|
)
|
(451
|
)
|
||||||||
|
Loss for the year
|
(5,631
|
)
|
(15,887
|
)
|
(37,509
|
)
|
|||||||||
|
Loss per share attributed to shareholders of the Company:
|
|||||||||||||||
|
Basic and diluted loss per share
|
22
|
(0.157
|
)
|
(0.479
|
)
|
(1.143
|
)
|
||||||||
F - 6
|
Year ended December 31
|
||||||||||||
|
2024
|
2023
|
2022
|
||||||||||
|
U.S. dollars in thousands
|
||||||||||||
|
Loss for the year
|
(5,631
|
)
|
(15,887
|
)
|
(37,509
|
)
|
||||||
|
Other comprehensive income (loss) for the year:
|
||||||||||||
|
Items that will not be recycled to profit or loss:
|
||||||||||||
|
Gain (loss) from remeasurement of liabilities (net) in
|
||||||||||||
|
respect of post-employment benefit obligations
|
215
|
-
|
146
|
|||||||||
|
Items that may be recycled to profit or loss:
|
||||||||||||
|
Gain (loss) from translation of financial statements of foreign activities
|
(2,454
|
)
|
(170
|
)
|
(374
|
)
|
||||||
|
Gains on cash flow hedges
|
428
|
42
|
-
|
|||||||||
|
Total comprehensive loss for the year
|
(7,442
|
)
|
(16,015
|
)
|
(37,737
|
)
|
||||||
F - 7
|
Equity attributed to shareholders of the Company
|
||||||||||||||||||||||||||||
|
Share capital
|
Additional paid in capital
|
Remeasurement of post-employment benefit obligations
|
Other capital reserves
|
Foreign currency translation reserve
|
Accumulated deficit
|
Total equity
|
||||||||||||||||||||||
|
U.S. dollars in thousands
|
||||||||||||||||||||||||||||
|
Balance as of January 1, 2022
|
8
|
150,366
|
102
|
9,503
|
394
|
(28,697
|
)
|
131,676
|
||||||||||||||||||||
|
Changes during the year;
|
||||||||||||||||||||||||||||
|
Loss for the year
|
(37,509
|
)
|
(37,509
|
)
|
||||||||||||||||||||||||
|
Other comprehensive income (loss) for the year
|
-
|
-
|
146
|
-
|
(374
|
)
|
-
|
(228
|
)
|
|||||||||||||||||||
|
Employee options exercised
|
*
|
1,040
|
-
|
-
|
-
|
-
|
1,040
|
|||||||||||||||||||||
|
Share-based payment
|
-
|
-
|
-
|
-
|
-
|
9,656
|
9,656
|
|||||||||||||||||||||
|
Balance as of December 31, 2022
|
8
|
151,406
|
248
|
9,503
|
20
|
(56,550
|
)
|
104,635
|
||||||||||||||||||||
|
Balance as of January 1, 2023
|
8
|
151,406
|
248
|
9,503
|
20
|
(56,550
|
)
|
104,635
|
||||||||||||||||||||
|
Changes during the year;
|
||||||||||||||||||||||||||||
|
Loss for the year
|
-
|
-
|
-
|
-
|
(15,887
|
)
|
(15,887
|
)
|
||||||||||||||||||||
|
Other comprehensive income (loss) for the year
|
-
|
-
|
-
|
42
|
(170
|
)
|
-
|
(128
|
)
|
|||||||||||||||||||
|
Employee options exercised and vesting of restricted shares
|
*
|
2,118
|
-
|
-
|
-
|
-
|
2,118
|
|||||||||||||||||||||
|
Share-based payment
|
-
|
-
|
-
|
-
|
-
|
6,852
|
6,852
|
|||||||||||||||||||||
|
Balance as of December 31, 2023
|
8
|
153,524
|
248
|
9,545
|
(150
|
)
|
(65,585
|
)
|
97,590
|
|||||||||||||||||||
|
Balance as of January 1, 2024
|
8
|
153,524
|
248
|
9,545
|
(150
|
)
|
(65,585
|
)
|
97,590
|
|||||||||||||||||||
|
Changes during the year;
|
||||||||||||||||||||||||||||
|
Loss for the year
|
-
|
-
|
-
|
-
|
(5,631
|
)
|
(5,631
|
)
|
||||||||||||||||||||
|
Other comprehensive income (loss) for the year
|
-
|
-
|
215
|
428
|
(2,454
|
)
|
-
|
(1,811
|
)
|
|||||||||||||||||||
|
Issuance of ordinary shares
|
1
|
63,190
|
-
|
-
|
-
|
-
|
63,191
|
|||||||||||||||||||||
|
Employee options exercised and vesting of restricted shares
|
*
|
4,001
|
-
|
-
|
-
|
-
|
4,001
|
|||||||||||||||||||||
|
Share-based payment
|
-
|
-
|
-
|
-
|
-
|
7,905
|
7,905
|
|||||||||||||||||||||
|
Balance as of December 31, 2024
|
9
|
220,715
|
463
|
9,973
|
(2,604
|
)
|
(63,311
|
)
|
165,245
|
|||||||||||||||||||
F - 8
|
Year ended December 31
|
||||||||||||
|
2024
|
2023
|
2022
|
||||||||||
|
U.S. dollars in thousands
|
||||||||||||
|
CASH FLOWS FROM OPERATING ACTIVITIES:
|
||||||||||||
|
Loss for the year
|
(5,631
|
)
|
(15,887
|
)
|
(37,509
|
)
|
||||||
|
Adjustments required to reflect the cash flow from operating activities (see Appendix A)
|
48,533
|
24,685
|
9,962
|
|||||||||
|
Net cash provided by (used in) operating activities
|
42,902
|
8,798
|
(27,547
|
)
|
||||||||
|
CASH FLOWS FROM INVESTING ACTIVITIES:
|
||||||||||||
|
Capitalized development costs
|
(21,893
|
)
|
(15,948
|
)
|
(13,706
|
)
|
||||||
|
Acquisition of property and equipment
|
(3,081
|
)
|
(611
|
)
|
(1,518
|
)
|
||||||
|
Loans granted to related company
|
(559
|
)
|
(1,432
|
)
|
-
|
|||||||
|
Increase in bank deposits
|
(7,952
|
)
|
(2,154
|
)
|
(480
|
)
|
||||||
|
Payments for acquisitions of subsidiaries, net of cash acquired
|
(14,934
|
)
|
(18,329
|
)
|
440
|
|||||||
|
Payment of deferred consideration with respect to business combinations
|
(555
|
)
|
-
|
(4,500
|
)
|
|||||||
|
Interest received
|
3,108
|
1,683
|
76
|
|||||||||
|
Investments in financial assets
|
(283
|
)
|
(195
|
)
|
(6,856
|
)
|
||||||
|
Proceeds from sub-lessee
|
243
|
155
|
-
|
|||||||||
|
Net cash used in investing activities
|
(45,906
|
)
|
(36,831
|
)
|
(26,544
|
)
|
||||||
|
CASH FLOWS FROM FINANCING ACTIVITIES:
|
||||||||||||
|
Issuance of ordinary shares
|
62,686
|
-
|
-
|
|||||||||
|
Interest paid
|
(4,549
|
)
|
(2,651
|
)
|
(504
|
)
|
||||||
|
Changes in short-term bank credit and short term loan
|
(23,315
|
)
|
39,135
|
5,874
|
||||||||
|
Transactions with non-controlling interests
|
-
|
-
|
(186
|
)
|
||||||||
|
Receipt of long-term bank loans
|
22,835
|
-
|
-
|
|||||||||
|
Repayment of long-term bank loans
|
(3,177
|
)
|
(998
|
)
|
(2,282
|
)
|
||||||
|
Receipt of long-term loans from others
|
-
|
-
|
6,908
|
|||||||||
|
Repayment of long-term loans from others
|
(3,837
|
)
|
(3,626
|
)
|
(2,577
|
)
|
||||||
|
Repayment of other long-term liabilities
|
(1,100
|
)
|
(304
|
)
|
(328
|
)
|
||||||
|
Employee options exercised
|
3,956
|
2,177
|
1,152
|
|||||||||
|
Principal lease payments
|
(2,655
|
)
|
(2,182
|
)
|
(1,851
|
)
|
||||||
|
Net cash provided by financing activities
|
50,844
|
31,551
|
6,206
|
|||||||||
|
Increase (Decrease) in cash and cash equivalents
|
47,840
|
3,518
|
(47,885
|
)
|
||||||||
|
Balance of cash and cash equivalents at beginning of year
|
38,386
|
33,880
|
87,332
|
|||||||||
|
Gains (losses) from exchange differences on cash and cash equivalents
|
(2,688
|
)
|
906
|
(6,189
|
)
|
|||||||
|
Gains (losses) from translation of cash and cash equivalents of foreign activity
|
(408
|
)
|
82
|
622
|
||||||||
|
Balance of cash and cash equivalents at end of year
|
83,130
|
38,386
|
33,880
|
|||||||||
F - 9
|
Year ended December 31
|
||||||||||||
|
2024
|
2023
|
2022
|
||||||||||
|
U.S. dollars in thousands
|
||||||||||||
|
Appendix A – adjustments required to reflect the cash flows from operating activities:
|
||||||||||||
|
Adjustments in respect of:
|
||||||||||||
|
Depreciation and amortization
|
21,370
|
12,505
|
9,028
|
|||||||||
|
Post-employment benefit obligations, net
|
(17
|
)
|
25
|
(107
|
)
|
|||||||
|
Deferred taxes
|
(1,358
|
)
|
(294
|
)
|
(181
|
)
|
||||||
|
Finance expenses, net
|
6,570
|
750
|
4,544
|
|||||||||
|
Expenses in respect of long-term employee benefits
|
634
|
237
|
245
|
|||||||||
|
Share of loss of equity method investee
|
1,270
|
1,555
|
1,794
|
|||||||||
|
Long-term deferred income
|
2,355
|
(85
|
)
|
(104
|
)
|
|||||||
|
Expenses in respect of share-based payment
|
7,187
|
6,027
|
8,747
|
|||||||||
|
Total adjustments
|
38,011
|
20,720
|
23,966
|
|||||||||
|
Changes in operating asset and liability items:
|
||||||||||||
|
Increase in restricted cash transferable to customers for processing activity
|
(10,441
|
)
|
(15,739
|
)
|
(10,424
|
)
|
||||||
|
Increase in receivables from processing activity
|
(1,810
|
)
|
(17,880
|
)
|
(10,986
|
)
|
||||||
|
Increase in trade receivables
|
(10,683
|
)
|
(12,487
|
)
|
(8,272
|
)
|
||||||
|
Increase in other current assets
|
(892
|
)
|
(1,073
|
)
|
(936
|
)
|
||||||
|
Decrease (Increase) in inventory
|
2,069
|
3,239
|
(12,592
|
)
|
||||||||
|
Increase in payables in respect of processing activity
|
26,435
|
41,187
|
20,510
|
|||||||||
|
Increase in trade payables
|
3,361
|
1,189
|
4,519
|
|||||||||
|
Increase in other payables
|
2,483
|
5,529
|
4,177
|
|||||||||
|
Total changes in operating asset and liability items
|
10,522
|
3,965
|
(14,004
|
)
|
||||||||
|
Total adjustments required to reflect the cash flow from operating activities
|
48,533
|
24,685
|
9,962
|
|||||||||
|
Appendix B – Information regarding investing and financing activities not involving cash flows:
|
||||||||||||
|
Purchase of property and equipment on credit
|
152
|
97
|
215
|
|||||||||
|
Recognition of right-of-use assets through lease liabilities
|
1,653
|
338
|
2,048
|
|||||||||
|
Recognition of Sub lease asset
|
-
|
455
|
-
|
|||||||||
|
Share based payments costs attributed to development activities, capitalized as intangible assets
|
718
|
825
|
909
|
|||||||||
F - 10
NAYAX LTD.
NOTES TO CONSOLIDATED FINANCIAL STATEMENTS
| a. |
Background
|
| 1. |
Nayax Ltd. (hereafter – the “Company”) was incorporated in January 2005. The Company provides processing and software as a service (SaaS) business operations solutions and services via a global platform. The Company is marketing its POS devices and SaaS solutions it develops in more than 60 countries worldwide (including Israel) through subsidiaries (the Company and the subsidiaries, hereafter – the “Group”) and through local distributors.
|
| 2. |
On September 11, 2022 Company's shareholders approved a reverse share split in a ratio of 10:1. All issued and outstanding Company's Ordinary Shares have been retroactively adjusted to reflect the reverse share split for all periods presented in these financial statements prior the approval.
|
| 3. |
On September 21, 2022, Company's ordinary shares were listed on the Nasdaq Global Select Market under the symbol NYAX. As of that date, the company is dual listed on Nasdaq and as well as on the Tel Aviv Stock Exchange. The expenses incurred in the profit or loss report for the year ended December 31, 2022 from this listing were $1,790 thousand.
|
| 4. |
In August 2023, the company filed with the Israel Securities Authority a shelf prospectus (the “Shelf Prospectus”). Such Shelf Prospectus allows the Company to raise from time to time funds through the offering and sale of various securities including debt and equity, in Israel, at the discretion of the Company. In October 2023, the company filed with the SEC a Registration Statement on Form F-3 (the “Registration Statement”). Such Registration Statement allows the company to raise funds from time to time through the offering and sale of various securities including debt and equity, at the discretion of the Company. Under the Registration Statement, certain selling shareholders may also offer and sell ordinary shares from time to time in one or more offerings, but the Company is not entitled to any funds raised from such sales.
|
| 5. |
On March 12, 2024, the Company successfully concluded an offering of 2,600,000 ordinary shares. The net proceeds from this sale amounted to approximately $62.7 million. The expenses incrued for the year ended December 31, 2024 from this sale are $506 thousand.
|
NAYAX LTD.
NOTES TO CONSOLIDATED FINANCIAL STATEMENTS
| b. |
"Swords of Iron" - War against terror organization Hamas
|
| a. |
Basis of presentation:
|
| 1) |
The principal accounting policies set out below have been consistently applied to all periods presented, unless otherwise stated.
|
| 2) |
The preparation of financial statements in conformity with IFRS requires the use of certain critical accounting estimates. It also requires the Group’s management to exercise its judgment in the process of applying the Group’s accounting policies. Areas involving a higher degree of judgment or complexity, or areas where assumptions and estimates are significant to the consolidated financial statements are disclosed in note 3. Actual results may differ materially from estimates and assumptions used by the Group's management.
|
|
3)
|
The Group's operating cycle is 12 months.
|
| b. |
Consolidated financial statements
|
| 1) |
Subsidiaries and business combinations
|
NAYAX LTD.
NOTES TO CONSOLIDATED FINANCIAL STATEMENTS
| b. |
Consolidated financial statements (continued):
|
| 2) |
Transactions with non-controlling interests' owners which do not result in loss of control
|
|
3)
|
Associates
|
|
4)
|
The equity method
|
| c. |
Translation of foreign currency balances and transactions:
|
| 1) |
Functional and presentation currency
|
NAYAX LTD.
NOTES TO CONSOLIDATED FINANCIAL STATEMENTS
| c. |
Translation of foreign currency balances and transactions (continued):
|
| 2) |
Transactions and balances
|
| 3) |
Translation of financial statements of Group entities:
|
| (a) |
Assets and liabilities for each statement of financial position statement presented are translated at the closing rate at the date of the statement of financial position;
|
| (b) |
Income and expenses for each statement of profit or loss are translated at average exchange rates for the period (unless this average is not a reasonable approximation of the cumulative effect of the rates prevailing on the transaction dates, in which case income and expenses are translated at the rate on the dates of the transactions), and;
|
|
(c)
|
All resulting exchange differences are recognized in other comprehensive income.
|
| d. |
Cash and cash equivalents
|
NAYAX LTD.
NOTES TO CONSOLIDATED FINANCIAL STATEMENTS
| e. |
Inventory
|
| f. |
Property and equipment
|
|
%
|
||||
|
Computers and peripheral equipment
|
33
|
|||
|
Rental of POS devices
|
10-20
|
|||
|
Machinery and equipment
|
10
|
|||
| g. |
Intangible assets:
|
| 1) |
Capitalized development Costs
|
|
a)
|
The technical feasibility of completing the intangible asset so that it will be available for use exists;
|
|
b)
|
Management intends to complete the intangible asset and use or sell it;
|
| c) |
There is an ability to use or sell the intangible asset;
|
| d) |
The way the intangible asset will generate probable future economic benefits is demonstrable;
|
| e) |
The technical, financial and other resources to complete the development and to use or sell the intangible asset are available; and
|
| f) |
The expenditure attributable to the intangible asset during its development can be reliably measured.
|
|
(1)
|
Investments in new products (hardware and software), as opposed to expenses aimed at maintaining normal functionality;
|
|
(2)
|
Investment in integrations and opening markets; and
|
|
(3)
|
Investment in software for own use.
|
|
NAYAX LTD.
NOTES TO CONSOLIDATED FINANCIAL STATEMENTS
| g. |
Intangible assets (continued):
|
| 1) |
Capitalized development Costs (continued):
|
| (1) |
Payroll costs and related expenses, which are attributed by the Group to the different projects that meet the conditions for capitalization;
|
| (2) |
Cost of subcontractors, which are specifically identified to projects that meet the conditions for capitalization.
|
| (3) |
Share-based payment expenses attributed apportionately to payroll and related suppliers expenses arises from development.
|
| 2) |
Distribution rights and Brand
|
| 3) |
Customer relationships
|
NAYAX LTD.
NOTES TO CONSOLIDATED FINANCIAL STATEMENTS
| g. |
Intangible assets (continued):
|
| 4) |
Technology
|
| 5) |
Goodwill
|
| h. |
Impairment of non-financial assets
|
NAYAX LTD.
NOTES TO CONSOLIDATED FINANCIAL STATEMENTS
| i. |
Leases:
|
|
1)
|
The Group as a lessee:
|
|
2)
|
The Group as a lessor:
|
| 3) |
Subleases
|
NAYAX LTD.
NOTES TO CONSOLIDATED FINANCIAL STATEMENTS
| i. |
Leases (continued):
|
| 3) |
Subleases (continued):
|
| j. |
Financial instruments:
|
NAYAX LTD.
NOTES TO CONSOLIDATED FINANCIAL STATEMENTS
| j. |
Financial instruments (continued):
|
NAYAX LTD.
NOTES TO CONSOLIDATED FINANCIAL STATEMENTS
| j. |
Financial instruments (continued):
|
| k. |
Trade receivables
|
| l. |
Trade payables
|
| m. |
Income taxes
|
NAYAX LTD.
NOTES TO CONSOLIDATED FINANCIAL STATEMENTS
| m. |
Income taxes (continued):
|
| n. |
Revenue recognition
|
| 1) |
Revenue measurement
|
| 2) |
Timing of revenue recognition
|
NAYAX LTD.
NOTES TO CONSOLIDATED FINANCIAL STATEMENTS
| n. |
Revenue recognition (continued):
|
| 3) |
Types of revenues of the Group
|
NAYAX LTD.
NOTES TO CONSOLIDATED FINANCIAL STATEMENTS
| o. |
Share-based payments
|
| p. |
Earnings (Loss) per share
|
| q. |
Provisions
|
| r. |
New International Financial Reporting Standards:
|
| 1. |
New categories and subtotals in the statement of profit or loss: The standard requires entities to classify income and expenses into operating, investing, and financing categories, enhancing comparability across entities.
|
| 2. |
Management-defined performance measures (MPMs): Entities must disclose MPMs in a single note to the financial statements, providing transparency about measures that management uses to assess financial performance.
|
| 3. |
Enhanced aggregation and disaggregation principles: The standard provides guidance to ensure that financial information is presented in a way that is useful to users, preventing the obscuring of material information.
|
NAYAX LTD.
NOTES TO CONSOLIDATED FINANCIAL STATEMENTS
| r. |
New International Financial Reporting Standards (continued):
|
| 1) |
Capitalized development costs
|
| 2) |
Distribution rights, customer relationship and technology
|
| 3) |
Determining the lease terms
|
NAYAX LTD.
NOTES TO CONSOLIDATED FINANCIAL STATEMENTS
| 4) |
Fair value of share-based payments
|
| 5) |
Deferred tax assets
|
NAYAX LTD.
NOTES TO CONSOLIDATED FINANCIAL STATEMENTS
| 1) |
Market risks:
|
| a) |
Foreign exchange risks
|
|
Sensitivity test for changes in exchange rate
|
||||||||||
|
Foreign currency
|
Years
|
Income (loss) from change
|
||||||||
|
10% increase in exchange rate
|
10% decrease in exchange rate
|
|||||||||
|
US Dollars in thousands
|
||||||||||
|
NIS
|
2024
|
(3,524
|
)
|
3,524
|
||||||
|
2023
|
(1,762
|
)
|
1,762
|
|||||||
|
2022
|
(2,168
|
)
|
2,168
|
|||||||
|
EUR
|
2024
|
(1,644
|
)
|
1,644
|
||||||
|
2023
|
(1,698
|
)
|
1,698
|
|||||||
|
2022
|
1,288
|
(1,288
|
)
|
|||||||
|
GPB
|
2024
|
316
|
(316
|
)
|
||||||
|
2023
|
123
|
(123
|
)
|
|||||||
|
2022
|
713
|
(713
|
)
|
|||||||
|
AUD
|
2024
|
233
|
(233
|
)
|
||||||
|
2023
|
40
|
(40
|
)
|
|||||||
|
2022
|
201
|
(201
|
)
|
|||||||
| b) |
Risk in respect of interest rate change
|
NAYAX LTD.
NOTES TO CONSOLIDATED FINANCIAL STATEMENTS
| 2) |
Credit risks
|
|
December 31, 2024
|
Not overdue
|
Over 30 days overdue
|
Over 60 days overdue
|
Over 120 days overdue
|
Total
|
|||||||||||||||
|
US Dollar in thousands
|
||||||||||||||||||||
|
Gross carrying amount – trade receivables
|
45,592
|
2,629
|
465
|
10,787
|
59,473
|
|||||||||||||||
|
Less – provision of allowance for credit loss
|
-
|
-
|
-
|
(3,779
|
)
|
(3,779
|
)
|
|||||||||||||
|
Trade receivable
|
45,592
|
2,629
|
465
|
7,008
|
55,694
|
|||||||||||||||
|
December 31, 2023
|
Not overdue
|
Over 30 days overdue
|
Over 60 days overdue
|
Over 120 days overdue
|
Total
|
|||||||||||||||
|
US Dollar in thousands
|
||||||||||||||||||||
|
Gross carrying amount – trade receivables
|
25,023
|
1,818
|
3,851
|
12,474
|
43,166
|
|||||||||||||||
|
Less – provision of allowance for credit loss
|
-
|
-
|
-
|
(1,866
|
)
|
(1,866
|
)
|
|||||||||||||
|
Trade receivable
|
25,023
|
1,818
|
3,851
|
10,608
|
41,300
|
|||||||||||||||
| 3) |
Liquidity risk
|
NAYAX LTD.
NOTES TO CONSOLIDATED FINANCIAL STATEMENTS
| 3) |
Liquidity risk (continued):
|
|
Less than one year
|
Between 1 and 2 years
|
Between 3 and 5 years
|
More than 5 years
|
Total
|
||||||||||||||||
|
US Dollars in thousands
|
||||||||||||||||||||
|
December 31, 2024:
|
||||||||||||||||||||
|
Short-term loans
|
25,276
|
-
|
-
|
-
|
25,276
|
|||||||||||||||
|
Long-term bank loans
|
6,009
|
11,213
|
9,566
|
1,812
|
28,600
|
|||||||||||||||
|
Lease liabilities
|
3,072
|
3,724
|
627
|
26
|
7,449
|
|||||||||||||||
|
Payables in respect of processing activity
|
132,612
|
-
|
-
|
-
|
132,612
|
|||||||||||||||
|
Trade payables
|
21,059
|
-
|
-
|
-
|
21,059
|
|||||||||||||||
|
Other payables
|
33,887
|
-
|
-
|
-
|
33,887
|
|||||||||||||||
|
Total
|
221,915
|
14,937
|
10,193
|
1,838
|
248,883
|
|||||||||||||||
|
Less than one year
|
Between 1 and 2 years
|
Between 3 and 5 years
|
More than 5 years
|
Total
|
||||||||||||||||
|
US Dollars in thousands
|
||||||||||||||||||||
|
December 31, 2023:
|
||||||||||||||||||||
|
Short-term loans
|
47,477
|
-
|
-
|
-
|
47,477
|
|||||||||||||||
|
Long-term bank loans
|
1,110
|
370
|
-
|
-
|
1,480
|
|||||||||||||||
|
Long-term loans from others
|
3,835
|
-
|
-
|
-
|
3,835
|
|||||||||||||||
|
Liability in respect of purchase of servers
|
99
|
74
|
-
|
-
|
173
|
|||||||||||||||
|
Lease liabilities
|
2,325
|
1,897
|
2,022
|
495
|
6,739
|
|||||||||||||||
|
Payables in respect of processing activity
|
104,523
|
-
|
-
|
-
|
104,523
|
|||||||||||||||
|
Trade payables
|
17,464
|
-
|
-
|
-
|
17,464
|
|||||||||||||||
|
Other payables
|
25,650
|
-
|
-
|
-
|
25,650
|
|||||||||||||||
|
Total
|
202,483
|
2,341
|
2,022
|
495
|
207,341
|
|||||||||||||||
| 4) |
Capital risk:
|
NAYAX LTD.
NOTES TO CONSOLIDATED FINANCIAL STATEMENTS
| 4) |
Capital risk (continued):
|
|
Short-term credit
|
Long-term bank loans
|
Loans from others
|
Lease liabilities
|
Other liabilities
|
Total
|
|||||||||||||||||||
|
US Dollars in thousands
|
||||||||||||||||||||||||
|
Balance at January 1, 2024
|
47,477
|
1,428
|
3,920
|
6,294
|
170
|
59,289
|
||||||||||||||||||
|
Changes in 2024:
|
||||||||||||||||||||||||
|
Liabilities added in respect of new leases
|
-
|
-
|
-
|
1,875
|
-
|
1,875
|
||||||||||||||||||
|
Liabilities added in respect of loans from banks and others
|
-
|
22,835
|
-
|
-
|
-
|
22,835
|
||||||||||||||||||
|
Liabilities added in respect of acquisitions
|
561
|
-
|
-
|
1,519
|
-
|
2,080
|
||||||||||||||||||
|
Cash flows paid
|
(23,315
|
)
|
(3,177
|
)
|
(3,837
|
)
|
(2,655
|
)
|
(47
|
)
|
(33,031
|
)
|
||||||||||||
|
Amounts recognized in profit or loss and other changes
|
553
|
1,497
|
(83
|
)
|
12
|
(123
|
)
|
1,856
|
||||||||||||||||
|
Balance at December 31, 2024:
|
25,276
|
22,583
|
-
|
7,045
|
-
|
54,904
|
||||||||||||||||||
|
Balance at January 1, 2023
|
7,684
|
2,496
|
7,367
|
8,150
|
362
|
26,059
|
||||||||||||||||||
|
Changes in 2023:
|
|
|
|
|
|
|||||||||||||||||||
|
Liabilities added in respect of new leases
|
-
|
-
|
-
|
595
|
-
|
595
|
||||||||||||||||||
|
Liabilities added in respect of loans from banks and others
|
39,135
|
-
|
-
|
-
|
-
|
39,135
|
||||||||||||||||||
|
Cash flows paid
|
-
|
(998
|
)
|
(3,626
|
)
|
(2,182
|
)
|
(182
|
)
|
(6,988
|
)
|
|||||||||||||
|
Amounts recognized in profit or loss and other changes
|
658
|
(70
|
)
|
179
|
(269
|
)
|
(10
|
)
|
488
|
|||||||||||||||
|
Balance at December 31, 2023:
|
47,477
|
1,428
|
3,920
|
6,294
|
170
|
59,289
|
||||||||||||||||||
|
Balance at January 1 2022
|
-
|
5,166
|
3,220
|
6,895
|
721
|
16,002
|
||||||||||||||||||
|
Changes in 2022:
|
|
|
|
|
|
|||||||||||||||||||
|
Liabilities added in respect of new leases
|
-
|
-
|
-
|
2,014
|
-
|
2,014
|
||||||||||||||||||
|
Liabilities added in respect of loans from banks and others
|
5,874
|
-
|
6,908
|
-
|
-
|
12,782
|
||||||||||||||||||
|
Liabilities added in respect of acquisitions
|
2,000
|
-
|
-
|
1,696
|
-
|
3,696
|
||||||||||||||||||
|
Cash flows paid
|
-
|
(2,282
|
)
|
(2,577
|
)
|
(2,146
|
)
|
(288
|
)
|
(7,293
|
)
|
|||||||||||||
|
Amounts recognized in profit or loss and other changes
|
(190
|
)
|
(388
|
)
|
(184
|
)
|
(309
|
)
|
(71
|
)
|
(1,142
|
)
|
||||||||||||
|
Balance at December 31 2022:
|
7,684
|
2,496
|
7,367
|
8,150
|
362
|
26,059
|
||||||||||||||||||
NAYAX LTD.
NOTES TO CONSOLIDATED FINANCIAL STATEMENTS
| 5) |
Fair Value Measurement:
|
| • |
Level 1: Quoted prices in active markets for identical assets or liabilities.
|
| • |
Level 2: Inputs other than quoted prices included within Level 1 that are observable for the asset or liability, either directly or indirectly.
|
| • |
Level 3: Inputs for the asset or liability that are not based on observable market data.
|
|
Assets
|
Level 2
|
Level 3
|
Total
|
|||||||||
|
January 1, 2024
|
42
|
1,831
|
1,873
|
|||||||||
|
Initialy recognized
|
3,139
|
-
|
3,139
|
|||||||||
|
Changes in fair value
|
428
|
(1,436
|
)
|
(1,008
|
)
|
|||||||
|
December 31, 2024
|
3,609
|
395
|
4,004
|
|||||||||
|
January 1, 2023
|
-
|
-
|
-
|
|||||||||
|
Initialy recognized
|
42
|
1,918
|
1,960
|
|||||||||
|
changes in fair value
|
-
|
(87
|
)
|
(87
|
)
|
|||||||
|
December 31, 2023
|
42
|
1,831
|
1,873
|
|||||||||
|
Liabilities
|
Level 2
|
Level 3
|
Total
|
|||||||||
|
January 1, 2024
|
(1,484
|
)
|
(12,141
|
)
|
(13,625
|
)
|
||||||
|
Initialy recognized
|
-
|
(2,132
|
)
|
(2,132
|
)
|
|||||||
|
Changes in fair value
|
559
|
(1,137
|
)
|
(578
|
)
|
|||||||
|
December 31, 2024
|
(925
|
)
|
(15,410
|
)
|
(16,335
|
)
|
||||||
|
January 1, 2023
|
(1,448
|
)
|
-
|
(1,448
|
)
|
|||||||
|
Initialy recognized
|
-
|
(12,141
|
)
|
(12,141
|
)
|
|||||||
|
changes in fair value
|
(36
|
)
|
-
|
(36
|
)
|
|||||||
|
December 31, 2023
|
(1,484
|
)
|
(12,141
|
)
|
(13,625
|
)
|
||||||
| • |
Level 2: The fair value of Level 2 instruments is derived using observable inputs, including interest rates, yield curves, credit spreads, and foreign exchange rates. Valuation techniques such as discounted cash flow models, Black and Scholes and comparable market transactions are utilized, with inputs obtained from reputable market data sources.
|
| • |
Level 3: Instruments classified under Level 3 are valued using models that incorporate significant unobservable inputs. These may include company's assumptions regarding future cash flows, discount rates, market liquidity, and counterparty credit risk. The valuation process involves management judgment, and sensitivity analyses are conducted to assess the impact of changes in key assumptions.
|
NAYAX LTD.
NOTES TO CONSOLIDATED FINANCIAL STATEMENTS
|
For the year ended December 31
|
||||||||||||
|
2024
|
2023
|
2022
|
||||||||||
|
US Dollars in thousands
|
||||||||||||
|
USA
|
123,033
|
83,528
|
60,270
|
|||||||||
|
Europe (excluding UK)
|
76,000
|
72,887
|
48,664
|
|||||||||
|
UK
|
38,688
|
26,391
|
21,931
|
|||||||||
|
Australia
|
27,521
|
22,484
|
17,235
|
|||||||||
|
Israel
|
16,967
|
13,095
|
14,129
|
|||||||||
|
Rest of the world
|
31,804
|
17,106
|
11,285
|
|||||||||
|
314,013
|
235,491
|
173,514
|
||||||||||
|
Set forth below is a breakdown of the non-current assets, excluding deferred tax assets and financial assets, by geographic regions:
|
|
As of December 31
|
||||||||
|
2024
|
2023
|
|||||||
|
US Dollars in thousands
|
||||||||
|
Israel
|
106,215
|
97,209
|
||||||
|
USA
|
12,615
|
13,696
|
||||||
|
Rest of the world
|
16,247
|
1,027
|
||||||
|
135,077
|
111,932
|
|||||||
NAYAX LTD.
NOTES TO CONSOLIDATED FINANCIAL STATEMENTS
|
a.
|
Acquisition of VMtecnologia LTDA.
|
NAYAX LTD.
NOTES TO CONSOLIDATED FINANCIAL STATEMENTS
|
a.
|
Acquisition of VMtecnologia LTDA. (continued)
|
|
US Dollars in thousands
|
||||
|
Cash
|
11,345
|
|||
|
Deferred consideration
|
2,205
|
|||
|
Contingent consideration
|
1,209
|
|||
|
Total consideration
|
14,759
|
|||
|
Amounts recognized on the acquisition date:
|
||||
|
Cash and cash equivalents
|
99
|
|||
|
Trade receivables
|
669
|
|||
|
Other receivables
|
651
|
|||
|
Property and equipment
|
6,015
|
|||
|
Right of use
|
46
|
|||
|
Brand
|
1,292
|
|||
|
Customer relations
|
3,773
|
|||
|
Technology
|
2,926
|
|||
|
Trade payables
|
(407
|
)
|
||
|
Other payables
|
(710
|
)
|
||
|
Other liabilities
|
(684
|
)
|
||
|
Lease liability
|
(53
|
)
|
||
|
Long term liabilities
|
(433
|
)
|
||
|
Deferred Tax Liability
|
(2,734
|
)
|
||
|
Total identifiable assets, net
|
10,450
|
|||
|
Goodwill (*)
|
4,309
|
|||
|
Total consideration
|
14,759
|
|||
|
Cash paid upon the acquisition of a subsidiary
|
11,345
|
|||
|
Cash and cash equivalents consolidated for the first time
|
(99
|
)
|
||
|
As reported in cash flows from investing activities for the acquisition
|
11,246
|
|||
NAYAX LTD.
NOTES TO CONSOLIDATED FINANCIAL STATEMENTS
|
b.
|
Acquisition of Roseman Engineering Ltd.
|
|
US Dollars in thousands
|
||||
|
Cash
|
4,089
|
|||
|
Deferred consideration
|
555
|
|||
|
Issuance of Ordinary Shares
|
505
|
|||
|
Total consideration
|
5,149
|
|||
|
Amounts recognized on the acquisition date:
|
||||
|
Cash and cash equivalents
|
401
|
|||
|
Trade receivables
|
2,643
|
|||
|
Inventory
|
1,269
|
|||
|
Other receivables
|
284
|
|||
|
Right of use assets
|
1,466
|
|||
|
Property and equipment
|
158
|
|||
|
Customer relations
|
1,109
|
|||
|
Technology
|
665
|
|||
|
Deferred Income
|
(693
|
)
|
||
|
Trade payables
|
(635
|
)
|
||
|
Other liabilities
|
(754
|
)
|
||
|
Other payables
|
(1,744
|
)
|
||
|
Lease liabilities
|
(1,466
|
)
|
||
|
Deferred Tax Liability
|
(408
|
)
|
||
|
Total identifiable assets, net
|
2,295
|
|||
|
Goodwill (*)
|
2,854
|
|||
|
Total consideration
|
5,149
|
|||
|
Cash paid upon the acquisition of a subsidiary
|
4,089
|
|||
|
Cash and cash equivalents consolidated for the first time
|
(401
|
)
|
||
|
As reported in cash flows from investing activities for the acquisition
|
3,688
|
|||
NAYAX LTD.
NOTES TO CONSOLIDATED FINANCIAL STATEMENTS
| b. |
Acquisition of Roseman Engineering Ltd. (continued)
|
| c. |
Acquisition of Retail Pro
|
NAYAX LTD.
NOTES TO CONSOLIDATED FINANCIAL STATEMENTS
| c. |
Acquisition of Retail Pro (continued)
|
|
US Dollars in thousands
|
||||
|
Consideration paid in cash
|
18,759
|
|||
|
Contingent Consideration
|
12,141
|
|||
|
Total consideration
|
30,900
|
|||
|
Amounts recognized on the acquistion date:
|
||||
|
Cash and cash equivalents
|
430
|
|||
|
Trade receivables
|
1,854
|
|||
|
Other receivables
|
280
|
|||
|
Property and equipment
|
140
|
|||
|
Technology
|
20,148
|
|||
|
Customer relations
|
7,092
|
|||
|
Brand
|
3,031
|
|||
|
Trade payables
|
(1,339
|
)
|
||
|
Other payables
|
(924
|
)
|
||
|
Deferred Tax Liability
|
(2,626
|
)
|
||
|
Total identifiable assets, net
|
28,086
|
|||
|
Goodwill (*)
|
2,814
|
|||
|
Total consideration
|
30,900
|
|||
|
Cash paid upon the acquisition of a subsidiary
|
18,759
|
|||
|
Cash and cash equivalents consolidated for the first time
|
(430
|
)
|
||
|
As reported in cash flows from investing activities for the acquisition
|
18,329
|
|||
NAYAX LTD.
NOTES TO CONSOLIDATED FINANCIAL STATEMENTS
|
December 31,
|
||||||||
|
2024
|
2023
|
|||||||
|
US Dollars in thousands
|
||||||||
|
US Dollar
|
56,141
|
14,673
|
||||||
|
New Israeli Shekel
|
4,939
|
9,777
|
||||||
|
Euro
|
4,758
|
3,044
|
||||||
|
British pound sterling
|
5,169
|
2,026
|
||||||
|
Australian Dollar
|
1,495
|
1,078
|
||||||
|
Other currencies
|
10,628
|
7,788
|
||||||
|
83,130
|
38,386
|
|||||||
NAYAX LTD.
NOTES TO CONSOLIDATED FINANCIAL STATEMENTS
|
a.
|
Composed as follows:
|
|
|
December 31,
|
|||||||
|
2024
|
2023
|
|||||||
|
US Dollars in thousands
|
||||||||
|
Open accounts
|
59,473
|
43,166
|
||||||
|
Less – provision of allowance for credit loss
|
(3,779
|
)
|
(1,866
|
)
|
||||
|
Trade receivables - net
|
55,694
|
41,300
|
||||||
|
For information about receivable aging and calculating the impairment of accounts receivables in 2024 and 2023, see note 4(2).
|
|
b.
|
Changes in provision of allowance for credit loss:
|
|
US Dollars in thousands
|
||||
|
Balance as of January 1, 2024
|
1,866
|
|||
|
Amounts provided against profit or loss in respect of receivables for which the provision for loss is measured over the entire life of the receivable balance
|
1,913
|
|||
|
Balance as of December 31, 2024
|
3,779
|
|||
|
Balance as of January 1, 2023
|
2,432
|
|||
|
Amounts provided against profit or loss in respect of receivables for which the provision for loss is measured over the entire life of the receivable balance
|
(566
|
) | ||
|
Balance as of December 31, 2023
|
1,866
|
|||
| a. |
General
|
|
Years of depreciation
|
Interest rate
|
|||||||
|
Buildings
|
2-4
|
1.5%-5%
|
|
|||||
NAYAX LTD.
NOTES TO CONSOLIDATED FINANCIAL STATEMENTS
| b. |
Composition and movement of right-of-use assets:
|
|
Buildings
|
||||
|
US Dollars in thousands
|
||||
|
Cost:
|
||||
|
Balance as of January 1, 2024
|
11,087
|
|||
|
Additions during the year
|
1,653
|
|||
|
Additions in respect of acquisition
|
1,512
|
|||
|
Other changes
|
249
|
|||
|
Balance as of December 31, 2024
|
14,501
|
|||
|
Depreciation and amortization:
|
||||
|
Balance as of January 1, 2024
|
5,746
|
|||
|
Depreciation during the year
|
2,463
|
|||
|
Balance as of December 31, 2024
|
8,209
|
|||
|
Right-of-use assets - net
|
6,292
|
|||
|
Buildings
|
Technological equipment
|
Total
|
||||||||||
|
US Dollars in thousands
|
||||||||||||
|
Cost:
|
||||||||||||
|
Balance as of January 1, 2023
|
10,947
|
331
|
11,278
|
|||||||||
|
Additions during the year
|
338
|
-
|
338
|
|||||||||
|
Disposals
|
(455
|
)
|
(331
|
)
|
(786
|
)
|
||||||
|
Other changes
|
257
|
-
|
257
|
|||||||||
|
Balance as of December 31, 2023
|
11,087
|
-
|
11,087
|
|||||||||
|
Depreciation and amortization:
|
||||||||||||
|
Balance as of January 1, 2023
|
3,579
|
318
|
3,897
|
|||||||||
|
Depreciation during the year
|
2,167
|
11
|
2,178
|
|||||||||
|
Disposals
|
-
|
(329
|
)
|
(329
|
)
|
|||||||
|
Balance as of December 31, 2023
|
5,746
|
-
|
5,746
|
|||||||||
|
Right-of-use assets - net
|
5,341
|
-
|
5,341
|
|||||||||
NAYAX LTD.
NOTES TO CONSOLIDATED FINANCIAL STATEMENTS
|
b.
|
Composition and changes in right-of-use assets (continued):
|
|
Buildings
|
Technological equipment
|
Total
|
||||||||||
|
US Dollars in thousands
|
||||||||||||
|
Cost:
|
||||||||||||
|
Balance as of January 1, 2022
|
7,382
|
331
|
7,713
|
|||||||||
|
Additions during the year
|
2,048
|
-
|
2,048
|
|||||||||
|
Additions in respect of acquisition
|
1,722
|
-
|
1,722
|
|||||||||
|
Disposals
|
(462
|
)
|
-
|
(462
|
)
|
|||||||
|
Other changes
|
257
|
-
|
257
|
|||||||||
|
Balance as of December 31, 2022
|
10,947
|
331
|
11,278
|
|||||||||
|
Depreciation and amortization:
|
||||||||||||
|
Balance as of January 1, 2022
|
2,186
|
252
|
2,438
|
|||||||||
|
Depreciation during the year
|
1,731
|
66
|
1,797
|
|||||||||
|
Disposals
|
(338
|
)
|
-
|
(338
|
)
|
|||||||
|
Balance as of December 31, 2022
|
3,579
|
318
|
3,897
|
|||||||||
|
Right-of-use assets - net
|
7,368 | 13 | 7,381 | |||||||||
|
c.
|
Composition and changes in lease liabilities
|
|
Buildings
|
||||
|
US Dollars in thousands
|
||||
|
Balance as of January 1, 2024
|
6,294
|
|||
|
Additions during the year
|
1,653
|
|||
|
Additions in respect of acquisition
|
1,519
|
|||
|
Interest expenses
|
342
|
|||
|
Lease payments
|
(2,997
|
)
|
||
|
Other changes
|
234
|
|||
|
Balance as of December 31, 2024
|
7,045
|
|||
|
Current maturities of lease liabilities
|
2,967
|
|||
|
Long-term lease liabilities
|
4,078
|
|||
|
Balance as of December 31, 2024
|
7,045
|
|||
NAYAX LTD.
NOTES TO CONSOLIDATED FINANCIAL STATEMENTS
|
c.
|
Composition and changes in lease liabilities (continued):
|
|
Buildings
|
Technological equipment
|
Total
|
||||||||||
|
US Dollars in thousands
|
||||||||||||
|
Balance as of January 1, 2023
|
8,141
|
9
|
8,150
|
|||||||||
|
Additions during the year
|
338
|
-
|
338
|
|||||||||
|
Interest expenses
|
330
|
-
|
330
|
|||||||||
|
Lease payments
|
(2,503
|
)
|
(9
|
)
|
(2,512
|
)
|
||||||
|
Other changes
|
(12
|
)
|
-
|
(12
|
)
|
|||||||
|
Balance as of December 31, 2023
|
6,294
|
-
|
6,294
|
|||||||||
|
Current maturities of lease liabilities
|
2,145
|
-
|
2,145
|
|||||||||
|
Long-term lease liabilities
|
4,149
|
-
|
4,149
|
|||||||||
|
Balance as of December 31, 2023
|
6,294
|
-
|
6,294
|
|||||||||
|
Buildings
|
Technological equipment
|
Total
|
||||||||||
|
US Dollars in thousands
|
||||||||||||
|
Balance as of January 1, 2022
|
6,769
|
126
|
6,895
|
|||||||||
|
Additions during the year
|
2,014
|
-
|
2,014
|
|||||||||
|
Additions in respect of acquisition
|
1,696
|
-
|
1,696
|
|||||||||
|
Disposals
|
(131
|
)
|
-
|
(131
|
)
|
|||||||
|
Interest expenses
|
293
|
3
|
296
|
|||||||||
|
Lease payments
|
(2,036
|
)
|
(111
|
)
|
(2,147
|
)
|
||||||
|
Other changes
|
(464
|
)
|
(9
|
)
|
(473
|
)
|
||||||
|
Balance as of December 31, 2022
|
8,141
|
9
|
8,150
|
|||||||||
|
Current maturities of lease liabilities
|
2,197
|
9
|
2,206
|
|||||||||
|
Long-term lease liabilities
|
5,944
|
-
|
5,944
|
|||||||||
|
Balance as of December 31, 2022
|
8,141
|
9
|
8,150
|
|||||||||
|
d. |
The Group incurred expenses in the amounts of $402, $330 and $209 thousand in 2024, 2023 and 2022, respectively, related to short-term leases, which were included in research and development expenses and selling, general and administrative expenses. |
NAYAX LTD.
NOTES TO CONSOLIDATED FINANCIAL STATEMENTS
|
Leasehold improvements
|
Computers and peripheral equipment
|
Rented POS devices
|
Machines and equipment
|
Total
|
||||||||||||||||
|
US Dollars in thousands
|
||||||||||||||||||||
|
Cost:
|
||||||||||||||||||||
|
Balance as of January 1, 2024
|
3,969
|
16,071
|
639
|
586
|
21,265
|
|||||||||||||||
|
Additions
|
46
|
1,364
|
1,818
|
5
|
3,233
|
|||||||||||||||
|
Acquired through business combinations
|
49
|
273
|
5,806
|
45
|
6,173
|
|||||||||||||||
|
Disposals
|
-
|
(83
|
)
|
-
|
-
|
(83
|
)
|
|||||||||||||
|
Translation differences
|
(9
|
)
|
(41
|
)
|
(1,349
|
)
|
(3
|
)
|
(1,402
|
)
|
||||||||||
|
Balance as of December 31, 2024
|
4,055
|
17,584
|
6,914
|
633
|
29,186
|
|||||||||||||||
|
Accumulated depreciation:
|
||||||||||||||||||||
|
Balance as of January 1, 2024
|
1,194
|
13,720
|
552
|
312
|
15,778
|
|||||||||||||||
|
Depreciation during the year
|
390
|
1,284
|
937
|
75
|
2,686
|
|||||||||||||||
|
Disposals
|
-
|
(82
|
)
|
-
|
-
|
(82
|
)
|
|||||||||||||
|
Translation differences
|
(3
|
)
|
(19
|
)
|
(285
|
)
|
(1
|
)
|
(308
|
)
|
||||||||||
|
Balance as of December 31, 2024
|
1,581
|
14,903
|
1,204
|
386
|
18,074
|
|||||||||||||||
|
Net book value:
|
||||||||||||||||||||
|
As of December 31, 2024
|
2,474
|
2,681
|
5,710
|
247
|
11,112
|
|||||||||||||||
Composition of property and equipment and accumulated depreciation thereon, grouped by major classifications, and changes therein in 2023, are as follows:
|
Leasehold improvements
|
Computers and peripheral equipment
|
Rented POS devices
|
Machines and equipment
|
Total
|
||||||||||||||||
|
US Dollars in thousands
|
||||||||||||||||||||
|
Cost:
|
||||||||||||||||||||
|
Balance as of January 1, 2023
|
3,956
|
15,380
|
606
|
586
|
20,528
|
|||||||||||||||
|
Additions
|
13
|
641
|
54
|
-
|
708
|
|||||||||||||||
|
Acquired through business combinations
|
-
|
140
|
-
|
-
|
140
|
|||||||||||||||
|
Disposals
|
-
|
(83
|
)
|
-
|
-
|
(83
|
)
|
|||||||||||||
|
Translation differences
|
-
|
(7
|
)
|
(21
|
)
|
-
|
(28
|
)
|
||||||||||||
|
Balance as of December 31, 2023
|
3,969
|
16,071
|
639
|
586
|
21,265
|
|||||||||||||||
|
Accumulated depreciation:
|
||||||||||||||||||||
|
Balance as of January 1, 2023
|
883
|
12,391
|
316
|
270
|
13,860
|
|||||||||||||||
|
Depreciation during the year
|
311
|
1,414
|
237
|
42
|
2,004
|
|||||||||||||||
|
Disposals
|
-
|
(83
|
)
|
-
|
-
|
(83
|
)
|
|||||||||||||
|
Translation differences
|
-
|
(2
|
)
|
(1
|
)
|
-
|
(3
|
)
|
||||||||||||
|
Balance as of December 31, 2023
|
1,194
|
13,720
|
552
|
312
|
15,778
|
|||||||||||||||
|
Net book value:
|
||||||||||||||||||||
|
As of December 31, 2023
|
2,775
|
2,351
|
87
|
274
|
5,487
|
|||||||||||||||
NAYAX LTD.
NOTES TO CONSOLIDATED FINANCIAL STATEMENTS
|
Leasehold improvements
|
Computers and peripheral equipment
|
Rented POS devices
|
Machines and equipment
|
Total
|
||||||||||||||||
|
US Dollars in thousands
|
||||||||||||||||||||
|
Cost:
|
||||||||||||||||||||
|
Balance as of January 1, 2022
|
3,638
|
6,245
|
523
|
547
|
10,953
|
|||||||||||||||
|
Additions
|
79
|
1,388
|
227
|
39
|
1,733
|
|||||||||||||||
|
Acquired through business combinations
|
239
|
8,043
|
-
|
-
|
8,282
|
|||||||||||||||
|
Disposals
|
-
|
(269
|
)
|
-
|
-
|
(269
|
)
|
|||||||||||||
|
Translation differences
|
-
|
(27
|
)
|
(144
|
)
|
-
|
(171
|
)
|
||||||||||||
|
Balance as of December 31, 2022
|
3,956
|
15,380
|
606
|
586
|
20,528
|
|||||||||||||||
|
Accumulated depreciation:
|
||||||||||||||||||||
|
Balance as of January 1, 2022
|
511
|
3,772
|
215
|
230
|
4,728
|
|||||||||||||||
|
Depreciation during the year
|
372
|
1,271
|
113
|
40
|
1,796
|
|||||||||||||||
|
Disposals
|
-
|
(265
|
)
|
-
|
-
|
(265
|
)
|
|||||||||||||
|
Acquisitions during the year
|
-
|
7,622
|
-
|
-
|
7,622
|
|||||||||||||||
|
Translation differences
|
-
|
(9
|
)
|
(12
|
)
|
-
|
(21
|
)
|
||||||||||||
|
Balance as of December 31, 2022
|
883
|
12,391
|
316
|
270
|
13,860
|
|||||||||||||||
|
Net book value:
|
||||||||||||||||||||
|
As of December 31, 2022
|
3,073
|
2,989
|
290
|
316
|
6,668
|
|||||||||||||||
NAYAX LTD.
NOTES TO CONSOLIDATED FINANCIAL STATEMENTS
|
Capitalized development costs **
|
Distribution rights and brand*
|
Customer relationships purchased *
|
Technology **
|
Goodwill (a)
|
Patents **
|
Total
|
||||||||||||||||||||||
|
US Dollars in thousands
|
||||||||||||||||||||||||||||
|
Cost:
|
||||||||||||||||||||||||||||
|
Balance as of January 1, 2024
|
66,415
|
8,323
|
15,916
|
24,574
|
12,866
|
806
|
128,900
|
|||||||||||||||||||||
|
Additions
|
20,930
|
-
|
-
|
1,681
|
-
|
-
|
22,611
|
|||||||||||||||||||||
|
Acquired through business combinations
|
-
|
1,292
|
4,882
|
3,591
|
7,163
|
-
|
16,928
|
|||||||||||||||||||||
|
Translation differences
|
(38
|
)
|
(211
|
)
|
(644
|
)
|
(615
|
)
|
(766
|
)
|
-
|
(2,274
|
)
|
|||||||||||||||
|
Balance as of December 31, 2024
|
87,307
|
9,404
|
20,154
|
29,231
|
19,263
|
806
|
166,165
|
|||||||||||||||||||||
|
Accumulated amortization:
|
||||||||||||||||||||||||||||
|
Balance as of January 1, 2024
|
23,451
|
2,576
|
3,260
|
3,031
|
-
|
171
|
32,489
|
|||||||||||||||||||||
|
Amortization
|
6,428
|
969
|
3,684
|
5,078
|
-
|
62
|
16,221
|
|||||||||||||||||||||
|
Translation differences
|
(3
|
)
|
(12
|
)
|
(68
|
)
|
(132
|
)
|
-
|
-
|
(215
|
)
|
||||||||||||||||
|
Balance as of December 31, 2024
|
29,876
|
3,533
|
6,876
|
7,977
|
-
|
233
|
48,495
|
|||||||||||||||||||||
|
Net book value:
|
||||||||||||||||||||||||||||
|
As of December 31, 2024
|
57,431
|
5,871
|
13,278
|
21,254
|
19,263
|
573
|
117,670
|
|||||||||||||||||||||
|
Capitalized development costs **
|
Distribution rights and brand *
|
Customer relationships purchased *
|
Technology **
|
Goodwill (a)
|
Patents **
|
Total
|
||||||||||||||||||||||
|
US Dollars in thousands
|
||||||||||||||||||||||||||||
|
Cost:
|
||||||||||||||||||||||||||||
|
Balance as of January 1, 2023
|
49,806
|
5,292
|
8,884
|
4,456
|
10,196
|
806
|
79,440
|
|||||||||||||||||||||
|
Additions
|
16,773
|
-
|
-
|
-
|
-
|
-
|
16,773
|
|||||||||||||||||||||
|
Acquired through business combinations
|
-
|
3,031
|
7,092
|
20,148
|
2,814
|
-
|
33,085
|
|||||||||||||||||||||
|
Disposals
|
(138
|
)
|
-
|
-
|
-
|
-
|
-
|
(138
|
)
|
|||||||||||||||||||
|
Translation differences
|
(26
|
)
|
-
|
(60
|
)
|
(30
|
)
|
(144
|
)
|
-
|
(260
|
)
|
||||||||||||||||
|
Balance as of December 31, 2023
|
66,415
|
8,323
|
15,916
|
24,574
|
12,866
|
806
|
128,900
|
|||||||||||||||||||||
|
Accumulated amortization:
|
||||||||||||||||||||||||||||
|
Balance as of January 1, 2023
|
18,206
|
2,261
|
1,693
|
2,055
|
-
|
109
|
24,324
|
|||||||||||||||||||||
|
Amortization
|
5,386
|
315
|
1,574
|
984
|
-
|
62
|
8,321
|
|||||||||||||||||||||
|
Disposals
|
(138
|
)
|
-
|
-
|
-
|
-
|
-
|
(138
|
)
|
|||||||||||||||||||
|
Translation differences
|
(3
|
)
|
-
|
(7
|
)
|
(8
|
)
|
-
|
-
|
(18
|
)
|
|||||||||||||||||
|
Balance as of December 31, 2023
|
23,451
|
2,576
|
3,260
|
3,031
|
-
|
171
|
32,489
|
|||||||||||||||||||||
|
Net book value:
|
||||||||||||||||||||||||||||
|
As of December 31, 2023
|
42,964
|
5,747
|
12,656
|
21,543
|
12,866
|
635
|
96,411
|
|||||||||||||||||||||
NAYAX LTD.
NOTES TO CONSOLIDATED FINANCIAL STATEMENTS
|
Capitalized development costs **
|
Distribution rights *
|
Customer relationships purchased *
|
Technology **
|
Goodwill (a)
|
Patents **
|
Total
|
||||||||||||||||||||||
|
US Dollars in thousands
|
||||||||||||||||||||||||||||
|
Cost:
|
||||||||||||||||||||||||||||
|
Balance as of January 1, 2022
|
34,209
|
5,292
|
4,188
|
2,921
|
8,271
|
806
|
55,687
|
|||||||||||||||||||||
|
Additions
|
14,615
|
-
|
-
|
-
|
-
|
-
|
14,615
|
|||||||||||||||||||||
|
Acquired through business combinations
|
1,261
|
-
|
5,046
|
1,711
|
2,724
|
-
|
10,742
|
|||||||||||||||||||||
|
Translation differences
|
(279
|
)
|
-
|
(350
|
)
|
(176
|
)
|
(799
|
)
|
-
|
(1,604
|
)
|
||||||||||||||||
|
Balance as of December 31, 2022
|
49,806
|
5,292
|
8,884
|
4,456
|
10,196
|
806
|
79,440
|
|||||||||||||||||||||
|
Accumulated amortization:
|
||||||||||||||||||||||||||||
|
Balance as of January 1, 2022
|
13,454
|
1,996
|
843
|
1,546
|
-
|
47
|
17,886
|
|||||||||||||||||||||
|
Amortization
|
3,642
|
265
|
902
|
564
|
-
|
62
|
5,435
|
|||||||||||||||||||||
|
Acquisitions during the year
|
1,116
|
-
|
1,116
|
|||||||||||||||||||||||||
|
Translation differences
|
(6
|
)
|
-
|
(52
|
)
|
(55
|
)
|
-
|
-
|
(113
|
)
|
|||||||||||||||||
|
Balance as of December 31, 2022
|
18,206
|
2,261
|
1,693
|
2,055
|
-
|
109
|
24,324
|
|||||||||||||||||||||
|
Net book value:
|
||||||||||||||||||||||||||||
|
As of December 31, 2022
|
31,600
|
3,031
|
7,191
|
2,401
|
10,196
|
697
|
55,116
|
|||||||||||||||||||||
| * |
Amortization of customer relationship and distribution rights are included under selling, general and administrative expenses.
|
| ** |
Amortization of technology, patents and development costs are included in “Depreciation and amortization in respect of technology and capitalized development costs ”.
|
NAYAX LTD.
NOTES TO CONSOLIDATED FINANCIAL STATEMENTS
| (a) |
Goodwill
|
| 1. |
VMtecnologia LTDA. - During the fiscal year 2024, the Company completed the acquisition of VM Technologia LTDA (hereinafter – "VM") resulting in the recognition of goodwill (see note 6a). Under IAS 36 Impairment of Assets, the company is required to perform an annual impairment test on goodwill. As part of the business combination for the purchase of VM, the Company recognized goodwill in the total amount of $4,309 thousand. The following key assumptions were used to determine the value in use of the CGU as at December 31, 2024:
|
|
VM
|
||||
|
Growth rate
|
3.5
|
%
|
||
|
Discount rate
|
23
|
%
|
||
| 2. |
Roseman Holdings Ltd. and Roseman Engineering Ltd. (hereinafter – "Roseman") - During the fiscal year 2024, the Company completed the acquisition of Roseman resulting in the recognition of goodwill (see note 6b). Under IAS 36 Impairment of Assets, the company is required to perform an annual impairment test on goodwill. As part of the business combination for the purchase of Roseman, the Company recognized goodwill in the total amount of $2,854 thousand. The following key assumptions were used to determine the value in use of the CGU as at December 31, 2024:
|
|
Roseman
|
||||
|
Growth rate
|
3
|
%
|
||
|
Discount rate
|
16
|
%
|
||
| 3. |
On Track Innovations Ltd. - As part of the business combination for the purchase of On Track Innovations Ltd. (hereinafter – "OTI") the Company recognized goodwill in the total amount of $2,724 thousand. The following key assumptions were used to determine the value in use of the CGU as at December 31, 2024:
|
|
OTI
|
||||
|
Growth rate
|
3
|
%
|
||
|
Discount rate
|
20.1
|
%
|
||
NAYAX LTD.
NOTES TO CONSOLIDATED FINANCIAL STATEMENTS
|
(a)
|
Goodwill (continued):
|
| 4. |
Retail CGU - As part of the business combination for the purchase of Nayax Retail Ltd. (hereinafter "Nayax Retail") and Retail Pro LLC., the Company recognized goodwill in the total amount of $5,172 thousand. The following key assumptions were used to determine the value in use of the CGUs as at December 31, 2024:
|
|
Retail
|
||||
|
Growth rate
|
3
|
%
|
||
|
Discount rate
|
20.9
|
%
|
||
| 5. |
Weezmo - As part of the business combination related to the acquisition of Weezmo, a goodwill in the amount of $4,078 thousand was recognized. The following key assumptions were used to determine the value in use of the CGUs as at December 31, 2024:
|
|
Weezmo
|
||||
|
Growth rate
|
3
|
%
|
||
|
Discount rate
|
21.9
|
%
|
||
| 6. |
Vendsys - As part of the business combination related to the acquisition of Greenhithe Software Solutions Ltd (hereinafter – "VendSys") the Company recognized goodwill in the total amount of $891 thousand. The following key assumptions were used to determine the value in use of the CGU as at December 31, 2024:
|
|
Vendsys
|
||||
|
Growth rate
|
4
|
%
|
||
|
Discount rate
|
12
|
%
|
||
NAYAX LTD.
NOTES TO CONSOLIDATED FINANCIAL STATEMENTS
| a. |
Short-term bank credit(*)
|
| 1) |
The company is a party to a short-term credit facility with an Israeli bank with commitments totaling $15 million (NIS 54 million). As of December 31, 2024, a total of $11 million (NIS 42 million) was outstanding under the short-term credit facility. The short-term credit facility bears a prime based variable interest rate. (*)
|
| 2) |
In May 2023 the company received a short-term credit facility in the amount of NIS 17 million (approximately $4.8 million) from an Israeli bank that bears a prime based variable interest rate. (*)
|
| 3) |
In July 2023, the Company entered into an additional short-term credit facility with an Israeli bank in the amount of $9.75 million, which was later increased to $30 million. The short-term credit facility bears a prime based variable interest rate. In November 2023, the same bank approved an additional loan amount of $17 million that was used as a bridge loan for the purchase of Retail Pro’s intellectual property and the purchase of all of Retail Pro’s equity rights by a fully owned subsidiary of the company. (*)
|
| 4) |
As of December 31, 2024, a wholly owned subsidiary of the Company has a short-term loan of $2 million (NIS 7.2 million) from an Israeli bank. The short-term loan bears a foreign exchange market variable interest rate. The loan is renewed monthly, in the Company’s sole discretion.
|
|
b.
|
Long-term bank loans
|
|
December 31,
|
||||||||
|
2024
|
2023
|
|||||||
|
US Dollars in thousands
|
||||||||
|
Total bank loans
|
22,583
|
1,428
|
||||||
|
Less - current maturities
|
(3,978
|
)
|
(1,101
|
)
|
||||
|
Total long-term bank loans
|
18,605
|
327
|
||||||
| 1. |
In May 2020, the Company received a long-term loan from an Israeli Bank, backed by a government guarantee, in the amount of NIS 15 million ($4.25 million). The loan bears interest of Prime + 1.5%, payable monthly beginning in May 2021. The loan's principal will be returned in 48 monthly installments beginning in May 2021.
|
| 2. |
In November 2023, the Company acquired Retail Pro International LLC. The Company funded the cash portion of the consideration payable at the closing, with a short-term credit facility that the Company received (see note 6(b)). In February 25, 2024, the Company received from the same bank an approval for a long-term loan through bank financing. The long-term loan was fully executed and bears a SOFR based variable interest rates.
|
| 3. |
On December 18, 2024, a loan principal of NIS 21 million (approximately USD 5,675 thousand) was received, to be repaid in equal quarterly installments over a period of six years from the loan receipt date. The interest bears a prime based variable interest rate.
|
NAYAX LTD.
NOTES TO CONSOLIDATED FINANCIAL STATEMENTS
|
December 31,
|
||||||||
|
2024
|
2023
|
|||||||
|
US Dollars in thousands
|
||||||||
|
Contingent consideration, see note 6 (*)
|
14,290
|
12,141
|
||||||
|
Deferred consideration, see note 6 (*)
|
1,844
|
-
|
||||||
|
Liability for forward contract for acquisitions (**)
|
-
|
1,485
|
||||||
|
Other
|
4,582
|
850
|
||||||
|
20,716
|
14,476
|
|||||||
| (*) |
With regards to liability for deferred and contingent payments as of December 31, 2024, the company recognized a deferred and contingent liabilities as part of the acquisitions of Retail Pro International LLC and VMtecnologia LTDA, see note 6.
|
| (**) |
| 1. |
Put Option: The Company has issued a put option allowing for an additional investment of up to $1 million. This put option is a liability financial instrument measured at fair value through profit or loss. See note 4
|
| 2. |
Call and Put Options: one of compay's investee sellers has granted the company right to purchase all 0ption shares held by the respective seller as of the specified date through a call option. Additionally, the company has granted each seller a put option to sell all or a portion of their 0ption shares. The call and put options are financial instrument measured at fair value through profit or loss, presented on net basis. See note 4.
|
NAYAX LTD.
NOTES TO CONSOLIDATED FINANCIAL STATEMENTS
NOTE 15 - INCOME TAXES
| a. |
Taxation of the Company in Israel
|
| 1) |
Tax rates:
|
| 2) |
In December 2020, the Company received an in-agreement tax ruling, indicating that the enterprise of the Company meets the definition of a Technological Preferred Enterprise, and that the income of the Company from selling POS devices, provision of processing SaaS are deemed "technology income" as defined by Section 51 to the Encouragement of Capital Investment Law, 1959 (hereinafter - "the Law"), which are subject to 12% tax, while income attributed to production are "preferred income", as this term is defined by Section 51 to the Law, which are subject to 16% or 7.5%. tax (depending on the production activity place). This tax ruling applies to the Company beginning in the 2020 tax year through 2024. As of the date of these condensed financial statements, the company is in the process of renewing this tax status for subsequent years.
|
| b. |
Taxation of subsidiaries outside of Israel
|
| c. |
Carry forward losses
|
| d. |
Tax assessments
|
NAYAX LTD.
NOTES TO CONSOLIDATED FINANCIAL STATEMENTS
| e. |
Tax rate reconciliation:
|
|
For the year ended December 31,
|
||||||||||||
|
2024
|
2023
|
2022
|
||||||||||
|
US Dollars in thousands
|
||||||||||||
|
Loss before taxes on income
|
(4,384
|
)
|
(14,672
|
)
|
(37,058
|
)
|
||||||
|
Tax rate
|
23
|
%
|
23
|
%
|
23
|
%
|
||||||
|
Theoretical tax benefit
|
1,008
|
3,375
|
8,523
|
|||||||||
|
Share-based payment expenses which are not deductible
|
(1,660
|
)
|
(1,388
|
)
|
(2,012
|
)
|
||||||
|
Carry forward losses without deferred taxes recognition
|
(521
|
)
|
(3,176
|
)
|
(6,872
|
)
|
||||||
|
Other
|
(74
|
)
|
(26
|
)
|
(90
|
)
|
||||||
|
Effective tax expenses
|
(1,247
|
)
|
(1,215
|
)
|
(451
|
)
|
||||||
| f. |
Deferred income tax:
|
|
Intangible assets
|
Provisions for employee rights
|
Other
|
Losses for tax purposes
|
Total
|
||||||||||||||||
|
US Dollars in thousands
|
||||||||||||||||||||
|
Balance at January 1, 2024
|
(4,104
|
)
|
579
|
-
|
417
|
(3,108
|
)
|
|||||||||||||
|
Change in 2024:
|
||||||||||||||||||||
|
Recognized in income statement
|
987
|
110
|
-
|
543
|
1,640
|
|||||||||||||||
|
Deferred taxes created in acquisition of subsidiary
|
(3,142
|
)
|
-
|
-
|
-
|
(3,142
|
)
|
|||||||||||||
|
Recognized in translation currency difference reserve
|
336
|
-
|
-
|
-
|
336
|
|||||||||||||||
|
Balance at December 31, 2024
|
(5,923
|
)
|
689
|
-
|
960
|
(4,274
|
)
|
|||||||||||||
|
Balance at January 1, 2023
|
(1,074
|
)
|
44
|
44
|
193
|
(793
|
)
|
|||||||||||||
|
Change in 2023:
|
||||||||||||||||||||
|
Recognized in income statement
|
(421
|
)
|
535
|
(44
|
)
|
224
|
294
|
|||||||||||||
|
Deferred taxes created in acquisition of subsidiary
|
(2,626
|
)
|
-
|
-
|
-
|
(2,626
|
)
|
|||||||||||||
|
Recognized in translation currency difference reserve
|
17
|
-
|
-
|
-
|
17
|
|||||||||||||||
|
Balance at December 31, 2023
|
(4,104
|
)
|
579
|
-
|
417
|
(3,108
|
)
|
|||||||||||||
|
Balance at January 1, 2022
|
(1,111
|
)
|
-
|
-
|
23
|
(1,088
|
)
|
|||||||||||||
|
Change in 2022:
|
||||||||||||||||||||
|
Recognized in income statement
|
(77
|
)
|
44
|
44
|
170
|
181
|
||||||||||||||
|
Recognized in translation currency difference reserve
|
114
|
-
|
-
|
-
|
114
|
|||||||||||||||
|
Balance at December 31, 2022
|
(1,074
|
)
|
44
|
44
|
193
|
(793
|
)
|
NAYAX LTD.
NOTES TO CONSOLIDATED FINANCIAL STATEMENTS
| f. |
Deferred income tax (continued):
|
|
December 31,
|
||||||||
|
2024
|
2023
|
|||||||
|
US Dollars in thousands
|
||||||||
|
Non-current assets
|
-
|
-
|
||||||
|
Non-current liabilities
|
(4,274
|
)
|
(3,108
|
)
|
||||
|
(4,274
|
)
|
(3,108
|
)
|
|||||
| g. |
Taxes on income included in profit or loss:
|
|
For the year ended December 31,
|
||||||||||||
|
2024
|
2023
|
2022
|
||||||||||
|
US Dollars in thousands
|
||||||||||||
|
Current tax expenses
|
(2,887
|
)
|
(1,509
|
)
|
(632
|
)
|
||||||
|
Deferred tax income
|
1,640
|
294
|
181
|
|||||||||
|
(1,247
|
)
|
(1,215
|
)
|
(451
|
)
|
|||||||
| a. |
Composition:
|
|
Number of shares |
In thousands |
|||||||||||||||
|
Authorized |
Issued and paid |
Authorized |
Issued and paid |
|||||||||||||
|
December 31, 2024 |
December 31, 2024 |
|||||||||||||||
|
Ordinary shares
|
70,000,000
|
36,607,407
|
70,000
|
36,607
|
||||||||||||
|
Number of shares
|
In thousands
|
|||||||||||||||
|
Authorized
|
Issued and paid
|
Authorized
|
Issued and paid
|
|||||||||||||
|
December 31, 2023
|
December 31, 2023 | |||||||||||||||
|
Ordinary shares
|
70,000,000
|
33,326,736
|
70,000
|
33,327
|
||||||||||||
|
Number of shares
|
In thousands
|
|||||||||||||||
|
Authorized
|
Issued and paid
|
Authorized
|
Issued and paid
|
|||||||||||||
|
December 31, 2022
|
December 31, 2022
|
|||||||||||||||
|
Ordinary shares
|
70,000,000
|
32,956,004
|
70,000
|
32,956
|
||||||||||||
NAYAX LTD.
NOTES TO CONSOLIDATED FINANCIAL STATEMENTS
NOTE 16 - CAPITAL AND RESERVES (continued):
| a. |
Composition (continued):
|
| b. |
Share-based payment:
|
| 1. |
September 6, 2024 award: In October 2021, 50,000 options were granted to an employee, of which 7,625 were exercised, leaving 42,375 options as of May 26, 2024, with 25,000 vested. Following an agreement, 25,000 options were converted to 8,350 restricted shares units (RSUs) at a 3:1 ratio, with full vesting approved retroactively as of September 6, 2024. The remaining 17,375 options were replaced by 5,792 RSUs, with 1,667 vesting on September 6, 2024, and the remaining of 4,125 will be vested by August 22, 2025.
|
| 2. |
August 6, 2024 award: the company allotted 7,262 options and 5,694 RSUs to employees of the Company and subsidiaries. The vesting period of the options and RSUs is 4 years, with 25% of the options and RSUs vesting on the first anniversary of the grant date and after that, an additional 6.25% of the options and RSUs vesting on the last day of each subsequent calendar quarter. Options not exercised within 5 years of inception date will expire.
|
| 3. |
June 25, 2024 award: the company allotted 179,875 RSUs to employees of the Company and subsidiaries. The vesting period of the RSUs is 4 years, with 25% of the RSUs vesting on the first anniversary of the grant date and after that, an additional 6.25% of the RSUs vesting on the last day of each subsequent calendar quarter.
|
| 4. |
May 12, 2024 award: the company allotted 20,735 RSUs to employees of the Company and subsidiaries. An amount of 1,013 RSU's vesting over period of 4 years, with 25% vesting on the first anniversary of the grant date and after that, an additional 6.25% of the RSUs vesting on the last day of each subsequent calendar quarter. The remain 19,722 RSU's granted have the same rights in all respects as the existing ordinary shares in the company's capital as of that date.
|
NAYAX LTD.
NOTES TO CONSOLIDATED FINANCIAL STATEMENTS
| b. |
Share-based payment (continued):
|
| 5. |
February 27, 2024 award: the company allotted 51,598 RSUs to employees of the Company and subsidiaries. The vesting period of the RSUs is 4 years, with 25% of the RSUs vesting on the first anniversary of the grant date and after that, an additional 6.25% of the RSUs vesting on the last day of each subsequent calendar quarter.
|
| 6. |
February 1, 2024 award: the company allotted 11,000 RSUs to employees of the Company and subsidiaries. The vesting period of the RSUs is 4 years, with 25% of the RSUs vesting on the first anniversary of the grant date and after that, an additional 6.25% of the RSUs vesting on the last day of each subsequent calendar quarter.
|
| 7. |
November 30, 2023 award: the Company allotted 96,731 RSUs to employees of the Company and subsidiaries. The vesting period of the RSUs is 4 years, with 25% of the RSU vesting on the first anniversary of grant date, and after that, additional 6.25% of the RSU's vesting on the last day of each subsequent calendar quarter.
|
| 7. |
June 26, 2023 award: the Company allotted 27,500 options and 137,524 RSUs to employees of the Company and subsidiaries. The vesting period of the options and RSUs is 4 years, with 25% of the options vest on the first anniversary of grant date, and after that, additional 6.25% of the options vesting on the last day of each subsequent calendar quarter. Options not exercised within 5 years of inception date will expire.
|
| 8. |
December 20, 2022 award: On December, 2022, the Company allotted 10,667 RSUs to employees of the Company and subsidiaries.
|
| 9. |
September 29, 2022 award: On September, 2022, the Company allotted 54,500 options and 18,600 RSUs to employees of the Company and subsidiaries. Options not exercised within 5 years of inception date will expire.
|
| 10. |
June 30, 2022 award: On June 30, 2022, the Company allotted 170,000 options and 6,000 RSUs to employees of the Company and subsidiaries. Options not exercised within 5 years of inception date will expire.
|
| 11. |
March 28, 2022 award: On March 28, 2022, the Company allotted 215,500 options and 45,000 RSUs to employees of the Company and subsidiaries. Options not exercised within 5 years of inception date will expire.
|
NAYAX LTD.
NOTES TO CONSOLIDATED FINANCIAL STATEMENTS
| b. |
Share-based payment (continued):
|
|
Allotment date
|
Share price
|
Exercise price
|
Expected option life
|
Risk-free interest rate
|
Average standard deviation (**)
|
Option fair value
|
|
The weighted average for 2024
|
$25.78
|
$25.78
|
||||
|
The weighted average for 2023
|
$19.92
|
-
|
-
|
-
|
-
|
$19.92
|
|
The weighted average for 2022
|
$11.1
|
-
|
-
|
-
|
-
|
$11.1
|
|
September, 6, 2024 – RSUs
|
$ 23.72
|
-
|
-
|
-
|
-
|
$ 23.72
|
|
September, 6, 2024 – Options
|
$21.02
|
$22.59
|
5
|
0.0373
|
0.6374
|
$11.59
|
|
August 6, 2024 - RSU
|
$ 21.02
|
-
|
-
|
-
|
-
|
$ 21.02
|
|
June 25, 2024 - RSUs
|
$ 21.55
|
-
|
-
|
-
|
-
|
$ 21.55
|
|
May 12, 2024 - RSUs
|
$ 28.49
|
-
|
-
|
-
|
-
|
$ 28.49
|
|
February 27, 2024 - RSUs
|
$ 27.93
|
-
|
-
|
-
|
-
|
$ 27.93
|
|
February 1, 2024 - RSUs
|
$ 24.25
|
-
|
-
|
-
|
-
|
$ 24.25
|
|
November, 2023 – RSUs
|
$ 19.57
|
-
|
-
|
-
|
-
|
$ 19.57
|
|
June 26, 2023 – Options
|
$ 19.34
|
$ 18.83
|
5
|
0.0396
|
0.678
|
$11.03
|
|
June 26, 2023 – RSUs
|
$ 19.34
|
-
|
-
|
-
|
-
|
$19.34
|
|
December 20, 2022 - RSUs
|
$19.7
|
-
|
-
|
-
|
-
|
$19.7
|
|
September 29, 2022 – Options
|
$23.9
|
25.5
|
5
|
0.0398
|
0.5445
|
$11.8-$23.9
|
|
September 29, 2022 - RSUs
|
$23.9
|
-
|
-
|
-
|
-
|
$23.9
|
|
June 30, 2022 – Options
|
$18.5
|
$16.7
|
5
|
0.0301
|
0.54
|
$9.7-$10.8
|
|
June 30, 2022 – RSUs
|
$18.5
|
-
|
-
|
-
|
-
|
$18.5
|
|
March 28, 2022 – Options
|
$18.4
|
$20.4
|
5
|
0.025
|
0.56
|
$8.7
|
|
March 28, 2022 – RSUs
|
$18.4
|
-
|
-
|
-
|
-
|
$18.4
|
NAYAX LTD.
NOTES TO CONSOLIDATED FINANCIAL STATEMENTS
| b. |
Share-based payment (continued):
|
|
December 31, 2024
|
December 31, 2023
|
December 31, 2022
|
||||||||||||||||||||||
|
Number of awards
|
Weighted average exercise price
|
Number of awards
|
Weighted average exercise price
|
Number awards
|
Weighted average exercise price
|
|||||||||||||||||||
|
Number of awards outstanding at beginning of year
|
3,339,120
|
17.8
|
3,823,052
|
19.3
|
3,633,778
|
19.1
|
||||||||||||||||||
|
New granted
|
283,371
|
22.5
|
264,256
|
18.8
|
520,767
|
16.5
|
||||||||||||||||||
|
Exercised awards
|
(680,671
|
)
|
8.0
|
(370,732
|
)
|
6.57
|
(203,748
|
)
|
5.0
|
|||||||||||||||
|
Forfeited awards
|
(414,134
|
)
|
26.0
|
(366,633
|
)
|
26.1
|
(126,211
|
)
|
17.0
|
|||||||||||||||
|
Expired awards
|
(33,676
|
)
|
19.2
|
(10,823
|
)
|
14.76
|
(1,534
|
)
|
6.7
|
|||||||||||||||
|
Outstanding awards at end of year
|
2,494,010
|
18.7
|
3,339,120
|
17.84
|
3,823,052
|
19.3
|
||||||||||||||||||
|
Exercisable options at end of year
|
1,274,794
|
14.2
|
1,550,358
|
11.67
|
1,502,887
|
12.3
|
||||||||||||||||||
NAYAX LTD.
NOTES TO CONSOLIDATED FINANCIAL STATEMENTS
|
For the year ended December 31,
|
||||||||||||
|
2024
|
2023
|
2022
|
||||||||||
|
US Dollars in thousands
|
||||||||||||
|
Revenue from the sale of integrated POS devices
|
91,677
|
84,406
|
68,726
|
|||||||||
|
Recurring revenue:
|
||||||||||||
|
SaaS revenue
|
88,494
|
58,920
|
45,274
|
|||||||||
|
Payment processing fee
|
133,842
|
92,165
|
59,514
|
|||||||||
|
222,336
|
151,085
|
104,788
|
||||||||||
|
314,013
|
235,491
|
173,514
|
||||||||||
|
For the year ended December 31,
|
||||||||||||
|
2024
|
2023
|
2022
|
||||||||||
|
US Dollars in thousands
|
||||||||||||
|
Cost of integrated POS devices sales
|
64,106
|
68,433
|
62,872
|
|||||||||
|
Cost of recurring revenue:
|
||||||||||||
|
Cost of services
|
20,088
|
13,419
|
9,394
|
|||||||||
|
Cost of processing
|
88,285
|
65,346
|
41,210
|
|||||||||
|
172,479
|
147,198
|
113,476
|
||||||||||
|
For the year ended December 31,
|
||||||||||||
|
2024
|
2023
|
2022
|
||||||||||
|
US Dollars in thousands
|
||||||||||||
|
Payroll and related expenses
|
18,341
|
15,309
|
14,820
|
|||||||||
|
Suppliers and subcontractors
|
3,780
|
3,416
|
4,193
|
|||||||||
|
Office and maintenance
|
586
|
684
|
602
|
|||||||||
|
Share-based payment
|
1,355
|
1,148
|
1,279
|
|||||||||
|
Depreciation and amortization
|
1,312
|
1,371
|
1,238
|
|||||||||
|
25,374
|
21,928
|
22,132
|
||||||||||
NAYAX LTD.
NOTES TO CONSOLIDATED FINANCIAL STATEMENTS
|
For the year ended December 31,
|
||||||||||||
|
2024
|
2023
|
2022
|
||||||||||
|
US Dollars in thousands
|
||||||||||||
|
Payroll and related expenses
|
49,228
|
36,520
|
32,402
|
|||||||||
|
Share-based payment
|
5,475
|
4,627
|
7,097
|
|||||||||
|
Office and maintenance
|
3,745
|
2,749
|
2,365
|
|||||||||
|
Advertising and sales promotion
|
3,117
|
2,192
|
2,599
|
|||||||||
|
Depreciation and amortization
|
7,483
|
4,444
|
3,366
|
|||||||||
|
Computers and IT systems maintenance
|
8,260
|
5,196
|
4,452
|
|||||||||
|
Professional fees
|
12,256
|
8,443
|
5,903
|
|||||||||
|
Provision for credit losses and bad debts
|
675
|
-
|
630
|
|||||||||
|
Other expenses
|
7,957
|
6,149
|
5,278
|
|||||||||
|
98,196
|
70,320
|
64,092
|
||||||||||
|
a.
|
Financial Income
|
|
|
For the year ended December 31,
|
|||||||||||
|
2024
|
2023
|
2022
|
||||||||||
|
US Dollars in thousands
|
||||||||||||
|
Interest income on cash and bank deosits
|
3,110
|
1,685
|
-
|
|||||||||
|
Financial income in respect of change in fair value options
|
148
|
-
|
423
|
|||||||||
|
Financial income in respect of shareholders and related companies
|
150
|
24
|
15
|
|||||||||
|
Financial income in respect of finance sub-lease
|
-
|
17
|
-
|
|||||||||
|
Financial income in respect of exchange rate differences
|
-
|
767
|
-
|
|||||||||
|
3,408
|
2,493
|
438
|
||||||||||
|
b.
|
Financial Expenses
|
|
|
For the year ended December 31,
|
|||||||||||
|
2024
|
2023
|
2022
|
||||||||||
|
US Dollars in thousands
|
||||||||||||
|
Interest expense on bank loans and bank fees
|
(6,181
|
)
|
(3,389
|
)
|
(993
|
)
|
||||||
|
Financial expenses in respect of change in fair value options
|
-
|
(310
|
)
|
-
|
||||||||
|
Financial expenses in respect of loans from others
|
(197
|
)
|
(591
|
)
|
(70
|
)
|
||||||
|
Financial expenses in respect of other liabilities
|
(1,552
|
)
|
(161
|
)
|
(167
|
)
|
||||||
|
Financial expenses in respect of leases liabilities
|
(333
|
)
|
(330
|
)
|
(260
|
)
|
||||||
|
Financial Expenses in respect of exchange rate differences
|
(2,634
|
)
|
-
|
(1,968
|
)
|
|||||||
|
(10,897
|
)
|
(4,781
|
)
|
(3,458
|
)
|
|||||||
NAYAX LTD.
NOTES TO CONSOLIDATED FINANCIAL STATEMENTS
| a. |
Basic
|
|
For the year ended December 31,
|
||||||||||||
|
2024
|
2023
|
2022
|
||||||||||
|
Loss for the year attributed to holders of ordinary shares (US Dollars in thousands)
|
(5,631
|
)
|
(15,887
|
)
|
(37,509
|
)
|
||||||
|
Weighted average of number of ordinary shares in issue (in thousands)
|
35,762
|
33,149
|
32,817
|
|||||||||
|
Basic loss per ordinary share (in dollars)
|
(0.157
|
)
|
(0.479
|
)
|
(1.143
|
)
|
||||||
| b. |
Diluted
|
|
Thousands of shares
|
||||||||||||
|
As of December 31,
|
||||||||||||
|
2024
|
2023
|
2022
|
||||||||||
|
Outstanding awards at end of the year issued as part of share-based compensation
|
2,494
|
3,339
|
3,823
|
|||||||||
| a. |
Transactions with related parties:
|
|
For the year ended December 31,
|
||||||||||||
|
2024
|
2023
|
2022
|
||||||||||
|
US Dollars in thousands
|
||||||||||||
|
Payroll, options and payments to related parties employed by the Company
|
3,550
|
2,671
|
5,378
|
|||||||||
|
Payroll to directors
|
228
|
176
|
207
|
|||||||||
|
Transactions - associated companies
|
3,474
|
2,202
|
766
|
|||||||||
NAYAX LTD.
NOTES TO CONSOLIDATED FINANCIAL STATEMENTS
| b. |
Balances with related parties:
|
|
December 31,
|
||||||||
|
2024
|
2023
|
|||||||
|
US Dollars in thousands
|
||||||||
|
Receivables – associated companies
|
3,903
|
3,555
|
||||||
|
Trade payables – related companies and parties
|
83
|
97
|
||||||
|
Other payables – related companies and parties
|
37
|
41
|
||||||
NAYAX LTD.
NOTES TO CONSOLIDATED FINANCIAL STATEMENTS
| c. |
Related parties' employment terms:
|
| 1. |
Employment terms of controlling shareholder and director – Mr. Yair Nechmad – for his service as the Company’s CEO:
|
| 2. |
The employment terms of controlling shareholder and director, Mr. David Ben Avi, for his service as the Company’s CTO:
|
NAYAX LTD.
NOTES TO CONSOLIDATED FINANCIAL STATEMENTS
| c. |
Related parties' employment terms (continued):
|
| 3. |
Payments to Mr. Amir Nechmad – controlling shareholder and former director
|
| 4. |
Payments to Mr. Eran Havshush – Director of the board
|
NAYAX LTD.
NOTES TO CONSOLIDATED FINANCIAL STATEMENTS
| c. |
Related parties' employment terms (continued):
|
|
5.
|
Directors insurance:
|
| a. |
Israel Competition Authority
|
| 1. |
The company will pay a sum of approximately $701 thousands (NIS 2,500 thousands) to the State Treasury.
|
| 2. |
Yair Nechmad, CEO and Chairman of the company, will pay a sum of approximately $67 thousands (NIS 240 thousands) to the State Treasury.
|
| 3. |
The company will sale up to 6,500 OTI's Points of Sale (POS) kits over a period of five years to thirdparties who may sell, distribute, and market the OTI POS kits under their own brands in the Israeli market.
|
| b. |
Issuance of Corporate Bond
|
NAYAX LTD.
NOTES TO CONSOLIDATED FINANCIAL STATEMENTS
| c. |
Business Combinations
|
F - 65
|
Share Capital
|
|
Memorandum and Articles of Association
|
|
•
|
amendments to our articles of association;
|
|
|
•
|
appointment, terms of service and termination of service of our auditors;
|
|
|
•
|
appointment of directors, including external directors (if applicable);
|
|
|
•
|
approval of certain related party transactions;
|
|
|
•
|
increases or reductions of our authorized share capital;
|
|
|
•
|
a merger; and
|
|
|
•
|
the exercise of our board of directors’ powers by a general meeting, if our board of directors is unable to exercise its powers and the exercise of any of its powers is required for our proper management.
|
|
•
|
an amendment to the company’s articles of association;
|
|
|
•
|
an increase of the company’s authorized share capital;
|
|
|
•
|
a merger; or
|
|
|
•
|
interested party transactions that require shareholder approval.
|
|
•
|
a financial liability imposed on him or her in favor of another person pursuant to a judgment, including a settlement or arbitrator’s award approved by a court. However, if an undertaking to indemnify an office
holder with respect to such liability is provided in advance, then such an undertaking must be limited to events
|
|
|
•
|
which, in the opinion of the board of directors, can be foreseen based on the company’s activities when the undertaking to indemnify is given, and to an amount or according to criteria determined by the board of
directors as reasonable under the circumstances, and such undertaking shall detail the abovementioned events and amount or criteria;
|
|
|
•
|
reasonable litigation expenses, including legal fees, incurred by the office holder (1) as a result of an investigation or proceeding instituted against him or her by an authority authorized to conduct such
investigation or proceeding, provided that (i) no indictment was filed against such office holder as a result of such investigation or proceeding; and (ii) no financial liability, such as a criminal penalty, was imposed upon him or her as a
substitute for the criminal proceeding as a result of such investigation or proceeding or, if such financial liability was imposed, and it was imposed with respect to an offense that does not require proof of criminal intent; and (2) in
connection with a monetary sanction;
|
|
|
•
|
reasonable litigation expenses, including legal fees, incurred by the office holder or imposed by a court in proceedings instituted against him or her by the company, on its behalf or by a third party or in
connection with criminal proceedings in which the office holder was acquitted or as a result of a conviction for an offense that does not require proof of criminal intent; and
|
|
|
•
|
expenses, including reasonable litigation expenses and legal fees, incurred by an office holder in relation to an administrative proceeding instituted against such office holder, or certain compensation payments
made to an injured party imposed on an office holder by an administrative proceeding, pursuant to certain provisions of the Israeli Securities Law, 5728-1968 (the “Israeli Securities Law”).
|
|
•
|
a breach of the duty of loyalty to the company, to the extent that the office holder acted in good faith and had a reasonable basis to believe that the act would not prejudice the company;
|
|
|
•
|
a breach of the duty of care to the company or to a third party, including a breach arising out of the negligent conduct of the office holder;
|
|
|
•
|
a financial liability imposed on the office holder in favor of a third party;
|
|
|
•
|
a financial liability imposed on the office holder in favor of a third party harmed by a breach in an administrative proceeding; and
|
|
|
•
|
expenses, including reasonable litigation expenses and legal fees, incurred by the office holder as a result of an administrative proceeding instituted against him or her, pursuant to certain provisions of the
Israeli Securities Law.
|
|
•
|
a breach of the duty of loyalty, except to the extent that the office holder acted in good faith and had a reasonable basis to believe that the act would not prejudice the company;
|
|
|
•
|
a breach of the duty of care committed intentionally or recklessly, excluding a breach arising out of the negligent conduct of the office holder;
|
|
|
•
|
an act or omission committed with intent to derive illegal personal benefit; or
|
|
|
•
|
a fine, monetary sanction or forfeit levied against the office holder.
|
|
•
|
the securities issued amount to 20% or more of the company’s outstanding voting rights before the issuance;
|
|
|
•
|
some or all of the consideration is other than cash or listed securities or the transaction is not on market terms; and
|
|
|
•
|
the transaction will increase the relative holdings of a shareholder who holds 5% or more of the company’s outstanding share capital or voting rights or that will cause any person to become, as a result of the
issuance, a holder of more than 5% of the company’s outstanding share capital or voting rights.
|
|
Company
|
Country of Incorporation
|
Percentage Ownership
and Voting Interest |
Main Activities
|
|||
|
Nayax LLC
|
USA (Maryland)
|
100%
|
Sale of the Company’s products and services
|
|||
|
Nayax Europe UAB
|
Lithuania
|
100%
|
Processing transactions on behalf of the Company’s customers in Europe
|
|||
|
Nayax AU PTY Ltd.
|
Australia
|
100%
|
Sale of the Company’s products and services
|
|||
|
Nayax (UK) Limited
|
UK
|
100%
|
Sale of the Company’s products and services
|

|
Insider Trading Policy of Nayax Ltd.
|
|
|
a) |
the spouses, domestic partners, minor children (even if financially independent) and any other member of the household of such employees or directors;
|
|
|
b) |
anyone to whom such employees or directors provide significant financial support; and
|
|
|
c) |
any account over which employees, directors and the persons listed in a) and b) above have or share the power, directly or indirectly, to make investment decisions
(whether or not such persons have a financial interest in the account) and those accounts established or maintained by such persons with their consent or knowledge and in which such persons have a direct or indirect financial interest.
|
|
|
• |
Significant changes in key performance indicators of the Company,
|
|
|
• |
Actual, anticipated or targeted earnings and dividends and other financial information,
|
|
|
• |
Financial, sales and other significant internal business forecasts, or a change in previously released estimates,
|
|
|
• |
Mergers, business acquisitions or dispositions, or the expansion or curtailment of operations
|
|
|
• |
Significant events affecting the Company’s operations, including any breach of information systems that compromises the functioning of the Company’s information or
other systems or results in the exposure or loss of customer information, in particular personal information
|
|
|
• |
New equity or debt offerings or significant borrowing,
|
|
|
• |
Analyst upgrades or downgrades of the issuer or one of its securities,
|
|
|
• |
Significant changes in accounting treatment, write-offs or effective tax rate,
|
|
|
• |
Significant litigation or governmental investigation,
|
|
|
• |
Changes in top management, and
|
|
|
• |
Share splits or other corporate actions.
|
|
|
• |
trading is permitted from the start of the second business day following an earnings release with respect to the preceding fiscal period until (and including) the last
calendar day of the last month of the then current fiscal quarter (the “Window”), subject to the restrictions below;
|
|
|
• |
all trades are subject to prior review by the Chief Legal Officer or Chief Financial Officer;
|
|
|
• |
clearance for all trades must be obtained from the Company’s Chief Legal Officer or Chief Financial Officer;
|
|
|
• |
no trading is permitted outside the Window except for reasons of exceptional personal hardship and subject to prior approval by the Chief Executive Officer and Chief
Legal Officer; provided that, if one of these individuals wishes to trade outside the Window, it shall be subject to prior approval by the other; and
|
|
|
• |
individuals in the Window Group are also subject to the general restrictions on all employees.
|
|
Date: March 4, 2025
|
By: /s/ Yair Nechmad
Yair Nechmad Chief Executive Officer (Principal Executive Officer) |
|
Date: March 4, 2025
|
By: /s/ Sagit Manor
Sagit Manor Chief Financial Officer (Principal Financial Officer) |
|
Date: March 4, 2025
|
By: /s/ Yair Nechmad
Yair Nechmad Chief Executive Officer (Principal Executive Officer) |
|
Date: March 4, 2025
|
By: /s/ Sagit Manor
Sagit Manor Chief Financial Officer (Principal Financial Officer) |

|
Tel-Aviv, Israel
|
/s/ Kesselman & Kesselman
|
|
March 4, 2025
|
Certified Public Accountants (Isr.)
|
|
|
A member firm of PricewaterhouseCoopers International Limited
|