|
|
|
|
|
KENON HOLDINGS LTD.
|
|
|
|
|
|
|
Date: August 19, 2024
|
By:
|
/s/ Robert L. Rosen
|
|
|
Name:
|
Robert L. Rosen
|
|
|
Title:
|
Chief Executive Officer
|
| 1. |
Executive Summary1
|
|
For the
|
For the
|
||||||||||||||||||||||||
|
Six Months Ended
|
Three Months Ended
|
||||||||||||||||||||||||
|
June 30
|
June 30
|
||||||||||||||||||||||||
|
2024
|
2023
|
%
|
2024
|
2023
|
%
|
||||||||||||||||||||
|
Consolidated
|
Adjusted EBITDA after
|
||||||||||||||||||||||||
|
|
proportionate consolidation
|
583
|
434
|
34
|
%
|
238
|
159
|
50
|
%
|
||||||||||||||||
|
|
Net income (loss)
|
(12
|
)
|
39
|
(131
|
)%
|
(27
|
)
|
(40
|
)
|
33
|
%
|
|||||||||||||
|
|
Adjusted net income (loss)
|
(4
|
)
|
66
|
(106
|
)%
|
(30
|
)
|
(37
|
)
|
19
|
%
|
|||||||||||||
|
|
FFO
|
307
|
278
|
10
|
%
|
37
|
81
|
(54)
|
%
|
||||||||||||||||
|
Israel
|
Adjusted EBITDA
|
286
|
210
|
36
|
%
|
116
|
92
|
26
|
%
|
||||||||||||||||
|
FFO
|
218
|
169
|
29
|
%
|
9
|
28
|
(68
|
)%
|
|||||||||||||||||
|
U.S.
|
Adjusted EBITDA after
|
||||||||||||||||||||||||
|
|
proportionate consolidation
|
305
|
237
|
29
|
%
|
127
|
73
|
74
|
%
|
||||||||||||||||
|
|
FFO
|
144
|
156
|
(8
|
)%
|
54
|
49
|
10
|
%
|
||||||||||||||||
|
|
Adjusted EBITDA after
|
||||||||||||||||||||||||
|
|
proportionate consolidation –
|
||||||||||||||||||||||||
|
|
energy transition
|
288
|
268
|
7
|
%
|
109
|
87
|
25
|
%
|
||||||||||||||||
|
|
Adjusted EBITDA –
|
||||||||||||||||||||||||
|
|
renewable energies
|
63
|
19
|
232
|
%
|
35
|
12
|
192
|
%
|
||||||||||||||||
|
|
* |
Adjusted EBITDA, adjusted EBITDA after proportionate consolidation, adjusted net income and FFO are not recognized in accordance with IFRS – for definitions and the manner of their calculation – see Sections 4A and 4B to the Report of
the Board of Directors for 2023 and Section 4A below.
|
| 1 |
The Executive Summary below is presented solely for convenience and it is not a substitute for reading the full detail (including with reference to the matters referred to in the Summary) as stated in this
report with all its parts (including warnings relating to “forward‑looking” information as it is defined in the Securities Law, 1968 (“the Securities Law”) definitions or explanations with respect to the indices for measurement of the
results and including the information included by means of reference, as applicable). This Summary includes estimates, plans and assessment of the Company, which constitute “forward‑looking” information regarding which there is no certainty
it will materialize and the readers are directed to the detail presented in this report below.
|
| 1. |
Executive Summary (Cont.)
|
|
Israel
|
Increase of 26% in the adjusted EBITDA compared with the corresponding quarter last year
Win in the Ramat Beka 2 tender – in June 2024, the Group won an additional tender of Israel Lands Authority for two sites located adjacent to the sites of the
first Ramat Beka project, for an aggregate consideration of about NIS 890 million.
As at the approval date of the report, if the win is realized, the Company intends to advance a consolidated project that will amount to about 505 megawatts, plus storage capability with
an estimated cumulative capacity of about 2,760 megawatts per hour on the sites of the prior tender and the present tender. See also Section 6A(1) of the report.
Refinancing in Israel – in August 2024, OPC Holdings Israel signed two bank financing agreements, with an aggregate scope of NIS 1.65 billion, which were used mainly for purposes
of early repayment of the project financing of the Zomet and Gat power plants. See also Note 7A(2) to the interim statements.
Government Decision with respect to Hadera 2 project – in April 2024, the government of Israel rejected for plan for construction of a power plant in land
located adjacent to the Hadera power plant. The Group has submitted a petition to the High Court of Justice, which as at the approval date of the report is pending.
|
|
U.S.
|
Increase of about 74% in adjusted EBITDA after proportionate consolidation compared with the corresponding quarter last year.
Signing of an investment agreement in the area of renewable energy in the U.S. – in August 2024, an investment agreement was signed with Harrison Street, a U.S. private equity fund
in the area of infrastructures, whereby the fund will invest an aggregate amount $300 million in exchange for 33.3% of the ordinary rights in CPV’s renewable‑energy activities. The transaction reflects a value for the said activities
“before the money” of $600 million. Completion of the transaction is expected to take place within about 3 months. See also Note 10J to the interim statements.
Undertaking in acquisition agreement and a memorandum of understanding regarding increase in the holdings in the Shore and Maryland power plants in the area of
Energy Transition in the U.S. – in July 2024, the CPV Group signed a non‑binding memorandum of understanding and a binding agreement for acquisition, cumulatively, of significant holdings in the Shore and Maryland power plants.
The total amount required in connection with the transactions, including as a result of their closing (if closed) is expected to amount to about $210 million –
$240 million1. As at the approval date of the report, completion of the transactions is expected to take place in the second half of 2024. See also Section 10C below.
Availability tenders in the PJM market for the period July 2025 through June 2026 – in July 2024, the results of tenders for availability prices in PJM were
published, with a significant increase in the prices to about $270 per megawatt per day. In CPV’s estimation, the additional to its revenues from availability of the power plants active in the PJM market is estimated at about $54 million
for the period of the tender. See also Section 3.3J below.
|
|
2
|
Including the expected amount in connection with reduction of the leverage in respect of the holdings being acquired in one of the projects.
|
| 1. |
Executive Summary (Cont.)
|
|
U.S. (Cont.)
|
Start of construction of the Rogue’s Wind project (wind‑energy power plant with a capacity of 114 megawatts located in Pennsylvania) – in August 2024 a Work
Commencement Order was issued for construction of the Rogue’s Wind project. See also Section 6A(2) below.
|
|
Refinancing of Towantic – in June 2024, Towantic signed a refinancing agreement. See also Section 9 below.
|
|
|
Refinancing Fairview – in August 2024, Fairview completed a refinancing transaction. See also Section 9 below.
|
|
|
Group headquarters
|
Raising of capital – in July 2024, the Company completed raising of capital, in the amount of about NIS 800 million.
|
|
|
Credit rating – in July 2024, S&P Maalot reconfirmed the credit rating of the Company and its debentures at the level of ilA– and updated the rating outlook
from negative to stable.
|

| (*) |
The above chart does not include increase in the holdings in the Shore and Maryland power plants and the investment agreement in the renewable‑energy area, which as at
the approval date of the report had not yet been signed and/or completed.
In addition, the CPV Group has additional projects in the area of carbon capture potential with a scope about 5GW in initial development stages.
|
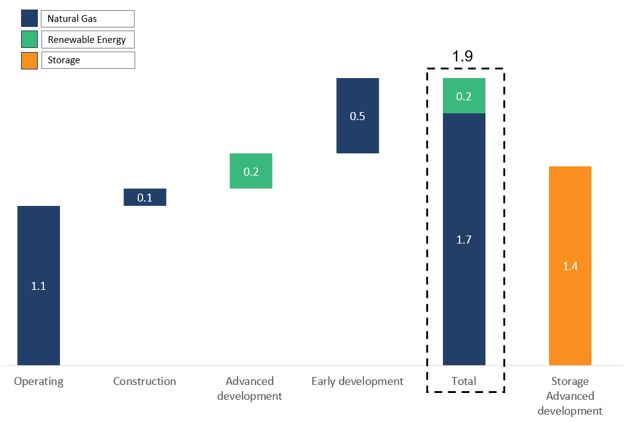
| (**) |
The early development does not include the Hadera 2 project, with a capacity of above‑mentioned 850 megawatts, in light of the Government’s decision to reject the
plan, as stated in Section 10A below. In addition, the development backlog does not include the Ramat Beka 2 project, since as at the approval date of the report the win in tender had not yet occurred, as stated in Section 6 below.
|
| 2. |
Brief description of the areas of activity
|
| 3. |
Main Developments in the Business Environment
|
|
|
3.1 |
General
|
|
|
A. |
Macro‑economic environment (particularly inflation and interest) – for details regarding the business environment and the macro‑economic situation in which the Group companies operate, significant changes that occurred in
2022–2023 and the impact thereof on the Group’s activities – see Section 3.1A of the Report of the Board of Directors for 2023.
|
|
2024
|
2023
|
Change
|
||||||||||
|
Dollar/shekel exchange rate*
|
||||||||||||
|
At the end of the prior year
|
3.627
|
3.519
|
3.1
|
%
|
||||||||
|
At June 30
|
3.759
|
3.700
|
1.6
|
%
|
||||||||
|
At March 31
|
3.681
|
3.615
|
1.8
|
%
|
||||||||
|
Average January– June
|
3.694
|
3.590
|
2.9
|
%
|
||||||||
|
Average April– June
|
3.725
|
3.649
|
2.1
|
%
|
||||||||
|
|
* |
The dollar/shekel exchange rate shortly before the approval date of the report (on August 16, 2024, is 3.683.
|
|
Bank of
|
||||||||||||||||
|
Israel
|
Federal
|
|||||||||||||||
|
Israeli
|
U.S.
|
interest
|
interest
|
|||||||||||||
|
CPI
|
CPI
|
rate
|
rate
|
|||||||||||||
|
At August 14, 2024
|
114.2
|
314.5
|
4.5
|
%
|
5.25%–5.50
|
%
|
||||||||||
|
At June 30, 2024
|
113.4
|
314.1
|
4.5
|
%
|
5.25%–5.50
|
%
|
||||||||||
|
At March 31, 2024
|
111.6
|
310.3
|
4.5
|
%
|
5.25%–5.50
|
%
|
||||||||||
|
At December 31, 2023
|
111.3
|
307.1
|
4.75
|
%
|
5.25%–5.50
|
%
|
||||||||||
|
At June 30, 2023
|
110.3
|
304.1
|
4.75
|
%
|
5.00%–5.25
|
%
|
||||||||||
|
At March 31, 2023
|
108.9
|
300.84
|
4.25
|
%
|
4.75%-5.00
|
%
|
||||||||||
|
At December 31, 2022
|
107.7
|
297.7
|
3.25
|
%
|
4.25%–4.50
|
%
|
||||||||||
|
Change in the first half of 2024
|
1.9
|
%
|
2.3
|
%
|
(0.25
|
)%
|
0
|
%
|
||||||||
|
Change in the first half of 2023
|
2.5
|
%
|
2.1
|
%
|
1.5
|
%
|
0.75
|
%
|
||||||||
|
Change in the second quarter of 2024
|
1.6
|
%
|
1.2
|
%
|
0
|
%
|
0
|
%
|
||||||||
|
Change in the second quarter of 2023
|
1.4
|
%
|
1.1
|
%
|
0.5
|
%
|
0.25
|
%
|
||||||||
| 3. |
Main Developments in the Business Environment (Cont.)
|
|
|
3.1 |
General (Cont.)
|
|
|
B. |
Domestic and geopolitical instability in the defense (security) situation in Israel – 2023 was characterized by significant instability against the
background of internal domestic events and geopolitical defense (security) matters as stated in the Report of the Board of Directors for 2023. As at the approval date of this report, the war that broke out on October 7, 2023 is still
ongoing, including increased combat activities and defense (security) tension in additional areas. In this regard, it is noted that against the background of the War and the geo‑political defense (security) instability, in April 2024, the
State of Israel withstood an air strike of missiles from Iran. The war and the security situation led to impacts and restrictions on the Israeli economy that include, among other things and based on the actual situation, reduction of
economic activities, a large call for military reserves duty (soldiers), limitations on gatherings in work places and public areas, restrictions on carrying on classes in the educational system, temporary closing of air traffic routs,
etc. As at the approval date of the report, most of the said restrictions had been gradually relaxed, according to the security situation existing in the State and the relevant combat areas
|
|
|
C. |
Global events and broad impacts on raw‑material prices and the supply chain – for details – see Section 3.1C of the Report of the Board of Directors for 2023.
|
| 3. |
Main Developments in the Business Environment (Cont.)
|
|
|
3.2 |
Activities in Israel
|
|
|
D. |
Update of the electricity tariffs – on February 1, 2024, the annual update to the tariff for 2024 for electricity consumers of Israel Electric Company entered into effect. Pursuant to the decision, the generation component was
updated to NIS 0.3007 per kilowatt hour, a decrease of 1.1% compared with the generation component at the end of 2023 – this being mainly due to the surplus receipts expected from sale of the Eshkol power plant, which led to a reduction in
the generation sector. In addition, as part of the said tariff update decision, it was noted that pursuant to the decision designation of the receipts from sale of Eshkol was determined – the surplus receipts from the sale will first be
used to cover expenses incurred during the war, including costs of diesel oil, and only thereafter will the surplus receipts be used to cover non‑recurring past expenses.
|
|
Period
|
2024
|
2023
|
Change
|
|||||||||
|
January–June average
|
30.12
|
30.66
|
(1.8
|
)%
|
||||||||
|
April–June average
|
30.07
|
30.39
|
(1.1
|
)%
|
||||||||
|
|
E. |
Supplementary arrangements and granting of a supply license to Rotem – further to that stated in Section 3.2E of the Report of the Board of Directors for 2023 regarding a proposed decision regarding the matter of supplementary
arrangements and imposition of certain covenants on Rotem (“the Hearing”), on March 13, 2024 a decision of the Electricity Authority was announced further to the Hearing (“the Decision”). In general, the arrangements in the Decision are not
significantly different than the arrangements included in the Hearing, which include, among other things, imposition of certain covenants on Rotem, including with respect to the matter of deviations from the consumption plans and the market
model, along with provision of a supply license to Rotem, this being against the background of the intention of the Electricity Authority to consolidate in many respects the regulation applicable to Rotem with that of other bilateral
electricity generators, and thus, to permit Rotem to operate in the energy market in a manner similar and equal to the said generators. The Decision entered into effect on July 1, 2024 and for the period covering Rotem’s generation license.
For additional details – see Section 7.3.18.5 of Part A of the Periodic Report for 2023.
|
|
|
F. |
Decision regarding the matter of “smart meters” – pursuant to the decision of the Electricity Authority, which entered into effect on July 1, 2024 with respect to virtual suppliers (which do not have means of generation) and will
enter into effect on November 1, 2024 with respect to conventional suppliers (which have means of generation, such as the Company) it will be possible to assign household consumers with no smart meter to private transactions based on a
normative consumption model of a household consumer. The Decision permits the Company to increase the diversity of its customers by means of selling electricity directly and/or indirectly to all households.
|
|
3.
|
Main Developments in the Business Environment (Cont.)
|
|
|
3.2 |
Activities in Israel (Cont.)
|
|
|
G. |
Public call regarding bilateral market regulation for generation facilities in the transmission network – on April 17, 2024, the Electricity Authority published a public call with respect to principles for a bilateral market
regulation for generation facilities in the transmission network. Pursuant to the public call, the Electricity Authority is considering determination of a regulation whereby facilities for generation of renewable energy and storage
facilities that are connected to the transmission network will be permitted to sell the electricity generated in bilateral transactions pursuant to a mechanism whereby the generator will sign a deal with a virtual supplier for sale of
availability, which will convey the supplier a right to acquire energy from the network at the market price, in a capacity that will conform to the facility’s technology through use of a “conformance coefficient”, as detailed in the public
call, in every year up to the amount of the capacity stated in the availability certificate it acquired from the generator, and the generator will commit to operate in accordance with the market model. In addition, the supplier and the
generator will sign a financial hedging transaction covering the energy generated in the facility. According to the public call, in the first stage it will apply solely to generation facilities using renewable energy, including with
integrated storage, and to independent storage facilities that are connected to the transmission network, provided that certain conditions specified in the public call have been met. It is noted that the Ramat Beka solar project that is
being developed by the Company (including in connection with the additional win if realized), might operate under this regulation, to the extent it is actually advanced and subject to the final regulations that will be determined (if any).
|
|
|
H. |
Additional information regarding the renewable energy activities in Israel – as part of the Company’s strategy to expand its activities in the generation and supply sector utilizing renewable sources in Israel, as stated in
Section 7.9 of Part A of the Annual Report for 2023, the Company engages in and/or attempts to engage in transactions for acquisition of rights in renewable energy projects in Israel (particularly solar and/or storage) and/or acquisition of
rights in lands designated for projects as stated, including as part of projects in the framework of joint ventures with holders of rights in projects or lands as stated.
|
|
3.
|
Main Developments in the Business Environment (Cont.)
|
|
|
3.3 |
Activities in the U.S.
|
|
|
I. |
Electricity and natural gas prices
|
|
For the
|
For the
|
|||||||||||||||||||||||
|
Six Months Ended
|
Three Months Ended
|
|||||||||||||||||||||||
|
Region
|
June 30
|
June 30
|
||||||||||||||||||||||
|
(Power Plant)
|
2024
|
2023
|
Change
|
2024
|
2023
|
Change
|
||||||||||||||||||
|
PJM West (Shore, Maryland)
|
31.72
|
31.29
|
1
|
%
|
30.83
|
29.47
|
5
|
%
|
||||||||||||||||
|
PJM AEP Dayton (Fairview)
|
29.10
|
30.04
|
(3
|
)%
|
28.63
|
29.04
|
(1
|
)%
|
||||||||||||||||
|
New York Zone G (Valley)
|
34.43
|
34.57
|
0
|
%
|
28.64
|
27.13
|
6
|
%
|
||||||||||||||||
|
Mass Hub (Towantic)
|
36.60
|
39.76
|
(8
|
)%
|
29.28
|
29.07
|
1
|
%
|
||||||||||||||||
|
PJM ComEd (Three Rivers)
|
24.29
|
N/A
|
N/A
|
22.42
|
N/A
|
N/A
|
||||||||||||||||||
|
|
* |
Based on Day‑Ahead prices as published by the relevant ISO.
|
| 3. |
Main Developments in the Business Environment (Cont.)
|
|
|
3.3 |
Activities in the U.S. (Cont.)
|
|
|
I. |
Electricity and natural gas prices (Cont.)
|
|
For the
|
For the
|
|||||||||||||||||||||||
|
Six Months Ended
|
Three Months Ended
|
|||||||||||||||||||||||
|
Region
|
June 30
|
June 30
|
||||||||||||||||||||||
|
(Power Plant)
|
2024
|
2023
|
Change
|
2024
|
2023
|
Change
|
||||||||||||||||||
|
Texas Eastern M‑3 (Shore, Valley – 70%)
|
2.21
|
2.21
|
0
|
%
|
1.53
|
1.50
|
2
|
%
|
||||||||||||||||
|
Transco Zone 5 North (Maryland)
|
2.94
|
2.67
|
10
|
%
|
2.27
|
2.17
|
5
|
%
|
||||||||||||||||
|
Texas Eastern M‑2 (Fairview)
|
1.72
|
1.82
|
(5
|
)%
|
1.42
|
1.40
|
1
|
%
|
||||||||||||||||
|
Dominion South Pt (Valley – 30%)
|
1.66
|
1.82
|
(9
|
)%
|
1.45
|
1.43
|
1
|
%
|
||||||||||||||||
|
Algonquin City Gate (Towantic)
|
2.97
|
3.57
|
(17
|
)%
|
1.68
|
2.02
|
(17
|
)%
|
||||||||||||||||
|
Chicago City Gate (Three Rivers)
|
2.25
|
N/A
|
N/A
|
1.65
|
N/A
|
N/A
|
||||||||||||||||||
| 3. |
Main Developments in the Business Environment (Cont.)
|
|
|
3.3 |
Activities in the U.S. (Cont.)
|
|
|
I. |
Electricity and natural gas prices (Cont.)
|
|
For the
|
For the
|
|||||||||||||||||||||||
|
Six Months Ended
|
Three Months Ended
|
|||||||||||||||||||||||
|
Region
|
June 30
|
June 30
|
||||||||||||||||||||||
|
Power Plant3
|
2024
|
2023
|
Change
|
2024
|
2023
|
Change
|
||||||||||||||||||
|
Shore
|
16.47
|
16.04
|
3
|
%
|
20.27
|
19.12
|
6
|
%
|
||||||||||||||||
|
Maryland
|
11.43
|
12.87
|
(11
|
)%
|
15.17
|
14.50
|
5
|
%
|
||||||||||||||||
|
Valley
|
20.32
|
20.13
|
1
|
%
|
18.25
|
16.92
|
8
|
%
|
||||||||||||||||
|
Towantic
|
17.30
|
16.56
|
4
|
%
|
18.36
|
15.94
|
15
|
%
|
||||||||||||||||
|
Fairview
|
17.92
|
18.21
|
(2
|
)%
|
19.40
|
19.94
|
(3
|
)%
|
||||||||||||||||
|
Three Rivers
|
9.67
|
N/A
|
N/A
|
11.70
|
N/A
|
N/A
|
||||||||||||||||||
|
|
* |
Based on electricity prices as shown in the above table, with a discount for the thermal conversion ratio (heat rate) of 6.9 MMBtu/MWh for Maryland, Shore and Valley, and a thermal conversion ratio of 6.5 MMBtu/MWh for Three Rivers,
Towantic and Fairview. It is clarified that the actual energy margins of the power plants of the CPV Group could be significantly different due to, among other things, the existence of Power Basis and a different breakdown in the scope of
the electricity sold in the peak and off‑peak hours in CPV’s power plants and that shown above (which was calculated based on the assumption of generation in all the hours of the 24‑hour period).
|
|
3
|
For additional details regarding the energy margin of the CPV Group – see Section 4E below.
|
|
3.
|
Main Developments in the Business Environment (Cont.)
|
|
|
3.3 |
Activities in the U.S. (Cont.)
|
|
|
J. |
Capacity revenues
|
|
Sub-Region
|
CPV Plants4
|
2025/2026
|
2024/2025
|
2023/2024
|
2022/2023
|
|
PJM RTO
|
269.92
|
28.92
|
34.13
|
50
|
|
|
PJM COMED
|
Three Rivers
|
269.92
|
28.92
|
34.13
|
–
|
|
PJM MAAC
|
Fairview, Maryland, Maple Hill
|
269.92
|
49.49
|
49.49
|
95.79
|
|
PJM EMAAC
|
Shore
|
269.92
|
54.95
|
49.49
|
97.86
|
|
4
|
The Three Rivers power plant, which commenced commercial operation in July 2023, is entitled to capacity payments, from this date.
|
| 3. |
Main Developments in the Business Environment (Cont.)
|
|
|
3.3 |
Activities in the U.S. (Cont.)
|
|
|
J. |
Capacity revenues (Cont.)
|
| 5 |
That stated in this Section regarding the estimate of the CPV Group constitutes “forward‑looking” information as it is defined in the Securities Law, regarding which there is no certainty it will be
realized. Ultimately, the revenues of the CPV Group from availability could be different (even significantly) as a result of, among other things, regulatory changes (including appeal processes or other processes in the PJM market or as
part of other municipal authorities), operating factors, changes in the business environment and/or the occurrence of one or more of the risk factors to which the CPV Group is exposed.
|
| 3. |
Main Developments in the Business Environment (Cont.)
|
|
|
3.3 |
Activities in the U.S. (Cont.)
|
|
|
J. |
Capacity revenues (Cont.)
|
|
Sub-Area
|
CPV
Plants
|
Summer 2024
|
Winter
2023/2024
|
Summer 2023
|
|
NYISO
Rest of the Market
|
–
|
168.91
|
127.25
|
153.26
|
|
Lower Hudson Valley
|
Valley
|
168.91
|
128.90
|
164.35
|
| 3. |
Main Developments in the Business Environment (Cont.)
|
|
|
3.3 |
Activities in the U.S. (Cont.)
|
|
|
J. |
Capacity revenues (Cont.)
|
|
Sub-Region
|
CPV Power Plants
|
2027/2028
|
2026/2027
|
2025/2026
|
|
ISO-NE
Rest of the Market
|
Towantic
|
117.70
|
85.15
|
85.15
|
|
|
K. |
Additional information regarding the activities in the U.S.
|
|
|
1. |
Further to that stated in Section 17.1 of Part A of the Periodic Report for 2023, as part of the activities of the CPV Group to strengthen its position as a significant player in the energy transition area through, among other things,
holding and managing effective and reliable conventional means (natural gas), which will support the rising demand for electricity in the U.S., the CPV Group is examining business possibilities/opportunities with respect to increasing its
holdings in certain of the power plants it holds, subject to formulation of appropriate terms with the other holders in the said power plants. For details regarding undertakings of the CPV Group signed in July 2024 for acquisition of
additional rights in the Shore and Maryland power plants – see Section 10C below. As at the date of the report, there is no certainty that these activities and/or additional similar activities will be executed and/or will come to fruition.
|
| 3. |
Main Developments in the Business Environment (Cont.)
|
|
|
3.3 |
Activities in the U.S. (Cont.)
|
|
|
K. |
Additional information regarding the activities in the U.S. (Cont.)
|
|
|
2. |
Further to that stated in Section 8.1.4 of Part A of the Periodic Report for 2023, in April 2024 the U.S. EPA (Environmental Protection Agency) published final
emissions’ regulations in the framework of the Clean Air Act. Pursuant to the new rules, up to January 1, 2032, a reduction of emissions will be required at a carbon‑capture rate of 90% for coal‑fired generation facilities that are
expected to operate after 2039 and new baseload natural gas-fired power plants (that were not under construction as at May 2023). Less stringent requirements were provided for, among other things, existing coal‑fired generation facilities
that integrate natural‑gas fired generation that are expected to discontinue their operations prior to 2039. For new gas turbines, the regulations require that full baseload (as defined) generation through use of natural gas combustion
will be executed with maximum utilization of efficient technologies in order to limit emissions to no more than 800 lbs. CO2/MWh-gross until January 1, 2032 and thereafter a reduction to 100 lbs. CO2/MWh-gross via 90% carbon capture or
co-firing with hydrogen. Efficiency requirements and reduced emission restrictions were provided with respect to gas turbines that generate at a partial baseload or a low baseload. The various states have two years to develop compliance
plans for the existing coal plants but compliance for new natural gas plants (the construction of which started after 2023) is immediate. In July 2024, the U.S. Appeals Court rejected a request for an injunctive order filed by several
state Attorneys General with respect to the new regulations, which is intended to stay their enforcement.
|
| 4. |
Analysis of the results of operations for the Six Months Ended June 30, 2024 (in millions of NIS)
|
| 4. |
Analysis of the results of operations for the Six Months Ended June 30, 2024 (in millions of NIS) (Cont.)
|
|
|
A. |
Statement of income6
|
|
For the Six Months Ended
|
||||||||
|
Section
|
June 30
|
|||||||
|
2024
|
2023
|
|||||||
|
Revenues from sales and provision of services (1)
|
1,311
|
1,120
|
||||||
|
Cost of sales and provision of services (without depreciation and amortization) (2)
|
(911
|
)
|
(834
|
)
|
||||
|
Depreciation and amortization
|
(155
|
)
|
(110
|
)
|
||||
|
Gross profit
|
245
|
176
|
||||||
|
Administrative and general expenses
|
(119
|
)
|
(117
|
)
|
||||
|
Share in earnings of associated companies
|
86
|
100
|
||||||
|
Business development expenses
|
(22
|
)
|
(30
|
)
|
||||
|
Compensation for lost revenues
|
26
|
–
|
||||||
|
Other expenses, net
|
(52
|
)
|
(5
|
)
|
||||
|
Operating income
|
164
|
124
|
||||||
|
Financing expenses, net
|
(149
|
)
|
(73
|
)
|
||||
|
Income before taxes on income
|
15
|
51
|
||||||
|
Taxes on income expenses
|
(27
|
)
|
(12
|
)
|
||||
|
Net income (loss) for the period
|
(12
|
)
|
39
|
|||||
|
Adjustments
|
8
|
27
|
||||||
|
Adjusted net income (loss) for the period7
|
(4
|
)
|
66
|
|||||
|
Attributable to:
|
||||||||
|
The Company’s shareholders
|
7
|
58
|
||||||
|
Holders of non‑controlling interests
|
(11
|
)
|
8
|
|||||
| 6 |
The results of the associated companies in the U.S. (mainly in the Energy Transition segment) are presented in the category “Company’s share in earnings of associated companies”.
|
|
7
|
Adjusted net income or loss – net income or loss in accordance with IFRS plus or minus the adjustments detailed in Section G below. It is emphasized that “adjusted income or loss” as
stated in this report is not a recognized data item that is recognized under IFRS or under any other set of generally accepted accounting principles as an index for measuring financial performance and should not be considered as a
substitute for income or loss or other terms provided in accordance with IFRS. It is possible that the Company’s definitions of “adjusted income or loss” are different than those used by other companies. Nonetheless, the Company believes
that the “adjusted income or loss” provides information that is useful to management and investors by means of eliminating certain line items (categories) that do not constitute an indication of the Company’s ongoing business activities.
|
| 4. |
Analysis of the results of operations for the Six Months Ended June 30, 2024 (in millions of NIS) (Cont.)
|
|
|
A. |
Statement of income (Cont.)
|
|
(1)
|
Changes in revenues:
|
|
Revenues
|
For the Six
|
Board’s Explanations
|
|||||||
|
Months Ended
|
|||||||||
|
June 30
|
|||||||||
|
2024
|
2023
|
||||||||
|
Revenues in Israel
|
|||||||||
|
Revenues from sale of energy to private customers
|
605
|
624
|
|||||||
|
Revenues from sale of energy to the System Operator and to other suppliers
|
96
|
45
|
Most of the increase, in the amount of about NIS 64 million, stems from the commercial operation of Zomet at the end of the second quarter of
2023.
|
||||||
|
Revenues in respect of capacity payments
|
88
|
–
|
Most of the increase stems from the commercial operation of Zomet at the end of the second quarter of 2023.
|
||||||
|
Revenues from sale of energy at cogeneration tariff
|
25
|
20
|
|||||||
|
Revenues from sale of steam
|
30
|
31
|
|||||||
|
Other revenues
|
23
|
43
|
Most of the decline derives from sales of electricity recognized in the corresponding period last year, in the amount of about NIS 26 million,
from the Zomet power plant prior to the commercial operation at the end of June 2023.
|
||||||
|
Total revenues from sale of energy and others in Israel (without infrastructure services)
|
867
|
763
|
|||||||
|
Revenues from private customers in respect of infrastructure services
|
207
|
235
|
|||||||
|
Total revenues in Israel
|
1,074
|
998
|
|||||||
|
Revenues in the U.S.
|
|||||||||
|
Revenues from sale of electricity from renewable energy
|
125
|
60
|
The increase derives mainly from the first‑time consolidation of the Mountain Wind project starting from the second quarter of 2023 and the
commercial operation of the Maple Hill and Stagecoach projects starting from the fourth quarter of 2023 and the second quarter of 2024, respectively.
|
||||||
|
Revenues from provision of services (as part of the other segment) and other revenues
|
112
|
62
|
The increase stems mainly from an increase in the scope of sale of electricity from renewable sources (retail) to commercial customers.
|
||||||
|
Total revenues in the U.S.
|
237
|
122
|
|||||||
|
Total revenues
|
1,311
|
1,120
|
|||||||
| 4. |
Analysis of the results of operations for the Six Months Ended June 30, 2024 (in millions of NIS) (Cont.)
|
|
|
A. |
Statement of income (Cont.)
|
|
|
(2) |
Changes in the cost of sales and provision of services (not including depreciation and amortization):
|
|
Cost of Sales and
Provision of Services
|
For the Six
Months Ended
|
Board’s Explanations
|
|||||||
|
June 30
|
|||||||||
|
2024
|
2023
|
||||||||
|
Cost of sales in Israel
|
|||||||||
|
Natural gas and diesel oil
|
331
|
286
|
The increase stems mainly from the first‑time consolidation of Gat starting from the second quarter of 2023 and the commercial operation of Zomet
starting from the end of the second quarter of 2023, in the aggregate amount of about NIS 72 million, and an increase in the natural gas tariff as a result of an increase in the shekel/dollar exchange rate, in the amount of about NIS 8
million. In addition, there was an increase of about NIS 18 million, as described in Note 28C(3) to the annual financial statements. On the other hand, there was a decrease of about NIS 27 million, deriving from a decrease in the quantity
of the gas consumed against the background of maintenance work at the Rotem power plant in the first quarter of 2024 and a decrease, in the amount of about NIS 29 million, due to entry of the Energean agreement into effect commencing from
the second quarter of 2023, and a decrease in the gas tariff deriving from a decline in the generation tariff.
|
||||||
|
Expenses in respect of acquisition of energy
|
117
|
126
|
|||||||
|
Cost of transmission of gas
|
28
|
16
|
The increase stems mainly from the first‑time consolidation of Gat, starting from the second quarter of 2023 and the commercial operation of Zomet
starting from the end of the second quarter of 2023.
|
||||||
|
Salaries and related expenses
|
21
|
14
|
|||||||
|
Operating expenses
|
57
|
30
|
The increase stems mainly from the first‑time consolidation of Gat commencing from the second quarter of 2023 and the commercial operation of
Zomet starting from the end second quarter of 2023.
|
||||||
|
Other expenses
|
18
|
56
|
Most of the decrease stems from the fact that in the corresponding period last year, pre‑commercial operation natural gas and other expenses were
recorded in the Zomet power plant at the end of June 2023.
|
||||||
|
Total cost of sales in Israel without infrastructure services
|
572
|
528
|
|||||||
|
Expenses in respect of infrastructure services
|
207
|
235
|
|||||||
|
Total cost of sales in Israel
|
779
|
763
|
|||||||
| 4. |
Analysis of the results of operations for the Six Months Ended June 30, 2024 (in millions of NIS) (Cont.)
|
|
|
A. |
Statement of income (Cont.)
|
|
|
(2) |
Changes in the cost of sales and provision of services (not including depreciation and amortization): (Cont.)
|
|
Cost of sales and services in the U.S.
|
|||||||||
|
Cost of sales in respect of sale of electricity from renewable energy
|
42
|
20
|
The increase stems mainly from the commercial operation of the Maple Hill and Stagecoach projects and the first‑time consolidation of the Mountain
Wind project.
|
||||||
|
Cost in respect provision of services (as part of the “others” segment) and other costs
|
90
|
51
|
The increase stems mainly from an increase in the scope of sale of electricity from renewable sources (retail) to commercial customers.
|
||||||
|
Total cost of sales and provision of services in the U.S.
|
132
|
71
|
|||||||
|
Total cost of sales and provision of services
|
911
|
834
|
|||||||
| 4. |
Analysis of the results of operations for the Six Months Ended June 30, 2024 (in millions of NIS) (Cont.)
|
|
|
B. |
EBITDA, FFO and net cash flows after service of the project debt
|
|
For the
|
||||||||
|
Six Months Ended
|
||||||||
|
June 30
|
||||||||
|
2024
|
2023
|
|||||||
|
Revenues from sales and provision of services
|
1,311
|
1,120
|
||||||
|
Cost of sales (without depreciation and amortization)
|
(911
|
)
|
(834
|
)
|
||||
|
Administrative and general expenses (without depreciation and amortization)
|
(112
|
)
|
(110
|
)
|
||||
|
Business development expenses
|
(22
|
)
|
(30
|
)
|
||||
|
Share in income of associated companies
|
86
|
100
|
||||||
|
Compensation for lost revenues
|
26
|
–
|
||||||
|
Consolidated EBITDA
|
378
|
246
|
||||||
|
Elimination of the share in income of associated companies
|
(86
|
)
|
(100
|
)
|
||||
|
Addition of the share of Group in proportionate EBITDA of associated companies (1)
|
281
|
254
|
||||||
|
EBITDA after proportionate consolidation
|
573
|
400
|
||||||
|
Adjustments for consolidated companies (see detail in Section G below)
|
–
|
18
|
||||||
|
Adjustments for associated companies (see detail in Section G below) (1)
|
10
|
16
|
||||||
|
Adjusted EBITDA after proportionate consolidation
|
583
|
434
|
||||||
| 4. |
Analysis of the results of operations for the Six Months Ended June 30, 2024 (in millions of NIS) (Cont.)
|
|
|
B. |
EBITDA, FFO and net cash flows after service of the project debt (Cont.)
|
|
|
(1) |
Calculation of the Group’s share in the proportionate EBITDA of associated companies (in millions of NIS):
|
|
For the six months ended June 30, 2024
|
Fairview
|
Towantic
|
Maryland
|
Shore*
|
Valley
|
Three
Rivers
|
Total
|
|||||||||||||||||||||
|
Revenues from sales of energy
|
102
|
93
|
67
|
76
|
168
|
26
|
532
|
|||||||||||||||||||||
|
Cost of natural gas
|
47
|
46
|
36
|
43
|
69
|
18
|
259
|
|||||||||||||||||||||
|
Carbon emissions tax (RGGI)**
|
–
|
16
|
11
|
22
|
35
|
–
|
84
|
|||||||||||||||||||||
|
Cost of sales – other expenses (without depreciation and amortization)
|
1
|
2
|
3
|
3
|
3
|
1
|
13
|
|||||||||||||||||||||
|
Gain on realization of transactions hedging the electricity margins
|
15
|
3
|
8
|
8
|
39
|
11
|
84
|
|||||||||||||||||||||
|
Net energy margin
|
69
|
32
|
25
|
16
|
100
|
18
|
260
|
|||||||||||||||||||||
|
Revenues from capacity payments
|
8
|
56
|
6
|
9
|
29
|
2
|
110
|
|||||||||||||||||||||
|
Other income
|
2
|
4
|
3
|
3
|
1
|
1
|
14
|
|||||||||||||||||||||
|
Gross profit
|
79
|
92
|
34
|
28
|
130
|
21
|
384
|
|||||||||||||||||||||
|
Fixed costs (without depreciation and amortization)
|
5
|
10
|
9
|
15
|
34
|
6
|
79
|
|||||||||||||||||||||
|
Administrative and general expenses (without depreciation and amortization)
|
2
|
2
|
2
|
3
|
4
|
1
|
14
|
|||||||||||||||||||||
|
Group’s share in proportionate adjusted EBITDA of associated companies
|
72
|
80
|
23
|
10
|
92
|
14
|
291
|
|||||||||||||||||||||
|
For the six months ended June 30, 2023
|
Fairview
|
Towantic
|
Maryland
|
Shore*
|
Valley
|
Three
Rivers
|
Total
|
|||||||||||||||||||||
|
Revenues from sales of energy
|
107
|
95
|
72
|
53
|
124
|
–
|
451
|
|||||||||||||||||||||
|
Cost of natural gas
|
50
|
58
|
40
|
32
|
56
|
–
|
236
|
|||||||||||||||||||||
|
Carbon emissions tax (RGGI)**
|
–
|
12
|
10
|
9
|
18
|
–
|
49
|
|||||||||||||||||||||
|
Cost of sales – other expenses (without depreciation and amortization)
|
1
|
2
|
4
|
3
|
3
|
–
|
13
|
|||||||||||||||||||||
|
Gain on realization of transactions hedging the electricity margins
|
24
|
(2
|
)
|
3
|
1
|
52
|
–
|
78
|
||||||||||||||||||||
|
Net energy margin
|
80
|
21
|
21
|
10
|
99
|
–
|
231
|
|||||||||||||||||||||
|
Revenues from capacity payments
|
15
|
49
|
10
|
16
|
25
|
–
|
115
|
|||||||||||||||||||||
|
Other income
|
2
|
4
|
2
|
2
|
1
|
–
|
11
|
|||||||||||||||||||||
|
Gross profit
|
97
|
74
|
33
|
28
|
125
|
–
|
357
|
|||||||||||||||||||||
|
Fixed costs (without depreciation and amortization)
|
5
|
9
|
9
|
16
|
36
|
–
|
75
|
|||||||||||||||||||||
|
Administrative and general expenses (without depreciation and amortization)
|
2
|
2
|
2
|
2
|
4
|
–
|
12
|
|||||||||||||||||||||
|
Group’s share in proportionate adjusted EBITDA of associated companies
|
90
|
63
|
22
|
10
|
85
|
–
|
270
|
|||||||||||||||||||||
|
|
* |
At the Shore power plant – gas transport costs (totaling in the first quarter of 2024 and 2023 about NIS 11 million) that are classified in accordance with IFRS 16 as depreciation expenses and, accordingly, are not included in the
adjusted EBITDA.
|
|
|
** |
It is noted that as at the approval date of the report, in Pennsylvania RGGI is not imposed. For details regarding a legal proceeding underway regarding the matter and possible implications of imposition of RGGI on costs of the Fairview
power plant and the electricity prices throughout the PJM – see Section 8.1.5B of Part A of the Periodic Report for 2023. In the period of the report, there was an increase of 48% in the average RGGI tariff compared with the corresponding
period last year.
|
| 4. |
Analysis of the results of operations for the Six Months Ended June 30, 2024 (in millions of NIS) (Cont.)
|
|
|
B. |
EBITDA, FFO and net cash flows after service of the project debt (Cont.)
|
|
|
(2) |
Set forth below is a breakdown of the adjusted EBITDA after proportionate consolidation data broken down by the subsidiaries (on a consolidated basis) and the associated companies (on a proportionate basis, based on the rate of the
holdings of the CPV Group therein) (in NIS millions):
|
|
For the
|
For the
|
||||||||||||||||
|
Six months ended
|
Six months ended
|
||||||||||||||||
|
|
Basis of
|
June 30, 2024
|
June 30, 2023
|
||||||||||||||
|
|
presentation
|
Adjusted
|
Adjusted
|
||||||||||||||
|
|
in the
|
EBITDA
|
EBITDA
|
||||||||||||||
|
|
Company’s
|
after
|
after
|
||||||||||||||
|
|
financial
|
proportionate
|
proportionate
|
||||||||||||||
|
|
statements
|
consolidation
|
FFO
|
consolidation
|
FFO
|
||||||||||||
|
Total operating projects and
|
|||||||||||||||||
|
accompanying business activities* **
|
Consolidated
|
299
|
231
|
224
|
183
|
||||||||||||
|
Business development costs,
|
|||||||||||||||||
|
headquarters in Israel
|
Consolidated
|
(13
|
)
|
(13
|
)
|
(14
|
)
|
(14
|
)
|
||||||||
|
Total Israel
|
286
|
218
|
210
|
169
|
|||||||||||||
|
Total operating projects*
|
Associated
|
291
|
175
|
270
|
190
|
||||||||||||
|
Other costs
|
Consolidated
|
(3
|
)
|
(9
|
)
|
(2
|
)
|
(3
|
)
|
||||||||
|
Total energy transition in the U.S.
|
288
|
166
|
268
|
187
|
|||||||||||||
|
Total operating projects*
|
Consolidated
|
77
|
58
|
36
|
41
|
||||||||||||
|
Business development and other costs
|
Consolidated
|
(14
|
)
|
(29
|
)
|
(17
|
)
|
(21
|
)
|
||||||||
|
Total renewable energy in the U.S.
|
63
|
29
|
19
|
20
|
|||||||||||||
|
Total activities as part of the “others”
|
|||||||||||||||||
|
segment
|
Consolidated
|
(3
|
)
|
(3
|
)
|
(3
|
)
|
(3
|
)
|
||||||||
|
Headquarters in the United States8
|
Consolidated
|
(43
|
)
|
(48
|
)
|
(47
|
)
|
(48
|
)
|
||||||||
|
Total United States
|
305
|
144
|
237
|
156
|
|||||||||||||
|
Company headquarters (not allocated
|
|||||||||||||||||
|
to the segments)
|
Consolidated
|
(8
|
)
|
(55
|
)
|
(13
|
)
|
(47
|
)
|
||||||||
|
Total consolidated
|
583
|
307
|
434
|
278
|
|||||||||||||
|
|
* |
See Section 3 below.
|
|
|
** |
The accompanying business activities in Israel include mainly virtual supply activities through OPC Israel, sale of electricity from facilities for generation of energy on the customer’s premises through OPC Power Plants and commerce in
natural gas, including with third parties through OPC Natural Gas.
|
|
8
|
After elimination of management fees between the CPV Group and the Company, in the amounts of about NIS 15 million and about NIS 13 million for
the six months ended June 30, 2024 and 2023, respectively.
|
| 4. |
Analysis of the results of operations for the Six Months Ended June 30, 2024 (in millions of NIS) (Cont.)
|
|
|
B. |
EBITDA, FFO and net cash flows after service of the project debt (Cont.)
|
|
|
(3) |
Set forth below is additional information regarding the revenues, net (in Israel net of infrastructure services and in the U.S. – revenues from sale of energy, availability and other), adjusted EBITDA after proportionate consolidation,
FFO and net cash flows after service of the project debt of the Group’s active power plants broken down by activity segments and subsidiaries (on a consolidated basis) and the associated companies (on a proportionate basis, based on the
rate of the holdings of the CPV Group therein) (in NIS millions):
|
|
|
For the Six Months Ended June 30, 2024
|
For the Six Months Ended June 30, 2023
|
||||||||||||||||||||||||||||||||
|
|
Basis of
|
Adjusted
|
Net cash
|
Adjusted
|
Net cash
|
|||||||||||||||||||||||||||||
|
|
presentation
|
EBITDA
|
flows
|
EBITDA
|
flows
|
|||||||||||||||||||||||||||||
|
|
in the
|
after
|
after
|
after
|
after
|
|||||||||||||||||||||||||||||
|
Main
|
Company’s
|
proportionate
|
service of
|
proportionate
|
service of
|
|||||||||||||||||||||||||||||
|
projects in
|
financial
|
Net
|
consol-
|
project
|
Net
|
consol-
|
project
|
|||||||||||||||||||||||||||
|
operation
|
statements
|
revenues
|
idation
|
FFO
|
debt
|
revenues
|
idation
|
FFO
|
debt
|
|||||||||||||||||||||||||
|
Rotem9
|
Consolidated
|
417
|
147
|
114
|
114
|
428
|
174
|
149
|
149
|
|||||||||||||||||||||||||
|
Hadera10
|
Consolidated
|
153
|
38
|
15
|
(33
|
)
|
148
|
42
|
24
|
3
|
||||||||||||||||||||||||
|
Zomet11, 12
|
Consolidated
|
153
|
87
|
65
|
48
|
4
|
2
|
–
|
–
|
|||||||||||||||||||||||||
|
Gat11
|
Consolidated
|
68
|
28
|
9
|
7
|
37
|
10
|
(1
|
)
|
(1
|
)
|
|||||||||||||||||||||||
|
Accompanying
|
||||||||||||||||||||||||||||||||||
|
business activities
|
Consolidated
|
53
|
(1
|
)
|
28
|
28
|
103
|
(4
|
)
|
11
|
11
|
|||||||||||||||||||||||
|
Total operating
|
||||||||||||||||||||||||||||||||||
|
projects in Israel and
|
||||||||||||||||||||||||||||||||||
|
accompanying
|
||||||||||||||||||||||||||||||||||
|
business activities
|
844
|
299
|
231
|
164
|
720
|
224
|
183
|
162
|
||||||||||||||||||||||||||
|
Fairview
|
Associated (25%)
|
112
|
72
|
63
|
27
|
124
|
90
|
88
|
8
|
|||||||||||||||||||||||||
|
Towantic
|
Associated (26%)
|
153
|
80
|
66
|
10
|
148
|
63
|
38
|
(30
|
)
|
||||||||||||||||||||||||
|
Maryland13
|
Associated (25%)
|
76
|
23
|
(5
|
)
|
(2
|
)
|
84
|
22
|
8
|
5
|
|||||||||||||||||||||||
|
Shore14
|
Associated (37.5%)
|
88
|
10
|
(5
|
)
|
(5
|
)
|
71
|
10
|
(9
|
)
|
(9
|
)
|
|||||||||||||||||||||
|
Valley
|
Associated (50%)
|
198
|
92
|
50
|
11
|
150
|
85
|
65
|
11
|
|||||||||||||||||||||||||
|
Three Rivers11
|
Associated (10%)
|
29
|
14
|
6
|
9
|
–
|
–
|
–
|
–
|
|||||||||||||||||||||||||
|
Total energy
|
||||||||||||||||||||||||||||||||||
|
transition in the U.S.15
|
656
|
291
|
175
|
50
|
577
|
270
|
190
|
(15
|
)
|
|||||||||||||||||||||||||
|
Keenan
|
Consolidated
|
48
|
31
|
28
|
1
|
43
|
27
|
27
|
3
|
|||||||||||||||||||||||||
|
Mountain Wind11
|
Consolidated
|
40
|
22
|
16
|
7
|
17
|
9
|
14
|
11
|
|||||||||||||||||||||||||
|
Maple Hill11
|
Consolidated
|
23
|
18
|
10
|
10
|
–
|
–
|
–
|
–
|
|||||||||||||||||||||||||
|
Stagecoach16
|
Consolidated
|
14
|
6
|
4
|
4
|
–
|
–
|
–
|
–
|
|||||||||||||||||||||||||
|
Total renewable
|
||||||||||||||||||||||||||||||||||
|
energy in the U.S.
|
125
|
77
|
58
|
22
|
60
|
36
|
41
|
14
|
||||||||||||||||||||||||||
|
9
|
Not including a deduction of repayment of loans to shareholders of Rotem before the Veridis transaction and payments of intercompany taxes in the consolidated tax reconciliation
statement. In the first quarter of 2024, planned maintenance was performed at the Rotem power plant. For details – see Section 4C(2) of the report.
|
|
10
|
In the period of the report, the net cash flows after service of the Hadera project debt includes early repayment of the long‑term loans, in the amount of about NIS 25 million, further to
receipt of compensation from the construction contractor at the end of 2023, as detailed in Note 28A(4) to the annual financial statements.
|
|
11
|
The financial results of the projects were included starting from the initial consolidation or the commercial operation dates, as applicable, which occurred in 2023. For details regarding
the capacity tariffs in the Zomet power plant, particularly in 2023, see Section 7.13 of Part A of the Periodic Report for 2023.
|
|
12
|
In the first quarter of 2024, the financial results of the Zomet power plant include compensation, in the amount of about NIS 26 million, in respect of lost revenues caused due to delay
in the commercial operation date. For additional details – see Note 8A(3) to the interim statements.
|
|
13
|
The FFO in the period of the report includes a payment for upgrading of the facilities at the Maryland power plant, in the amount of about NIS 8 million.
|
|
14
|
The FFO in the first quarter of 2023 includes a payment, in the amount of about NIS 9 million, in respect of significant planned maintenance work performed.
|
|
15
|
It is noted that the financing agreements of the CPV Group including mechanisms of the “cash sweep” type in the framework of which all or part of the free cash flows from the project is
designated for repayment of the loan principal on a current basis in addition to the predetermined minimum repayment schedule with respect to every long‑term loan. Accordingly, there could be an acceleration of execution of repayments
upon occurrence of certain events and there are limitations on distributions to the owners.
|
|
16
|
The financial results of the Stagecoach project Maple Hill were included starting from the commercial operation date, in the second quarter of 2024.
|
| 4. |
Analysis of the results of operations for the Six Months Ended June 30, 2024 (in millions of NIS) (Cont.)
|
|
|
C. |
Analysis of the change in adjusted EBITDA – Israel segment
|

|
|
1. |
Energy margin – the increase stems mainly from a decrease in the natural gas prices, in the amount of about NIS 23 million, as a result of the entry into effect of the Energean agreement commencing from the end of the first
quarter of 2023. On the other hand, there was a decrease of about NIS 10 million as a result of a decline in customer consumption and a drop in the generation tariff along with an increase in the natural gas price due to the strengthening
of the dollar against the shekel, in the amount of about NIS 8 million.
|
|
|
2. |
Availability (operational) – as stated in Section 7.11.1 of Part A of the Periodic Report for 2023, in the period of the report, the Rotem and Hadera power plants were shut down for various time periods for purposes of maintenance
work, which had a negative impact on their results in the period of the report, including compared with the corresponding period last year.
|
| 4. |
Analysis of the results of operations for the Six Months Ended June 30, 2024 (in millions of NIS) (Cont.)
|
|
|
C. |
Analysis of the change in adjusted EBITDA – Israel segment (Cont.)
|
|
|
3. |
Commercial operation of Zomet and acquisition of Gat – in the period of the report, planned maintenance was performed a number of times at the Zomet power plant which had a negative impact on the power plant’s availability (for
details – see Section 4H) and on its results accordingly. It is noted that maintenance in a similar format in Zomet is planned for the second half of 2024.
|
|
|
4. |
One‑time events – for details regarding events in the first quarter of 2023 – see Note 28C(3) to the annual financial statements.
|
| 17 |
That stated with respect to the Company’s estimate regarding completion of the maintenance work, the date thereof and its impact on the Group’s results constitutes
“forward‑looking” information as it is defined in the Securities Law, regarding which there is no certainty it will be realized. Ultimately, delays in completion of the maintenance and return of the power plant to operation could be
caused, this being due to, among other things, various factors, such as, impacts of the defense (security) situation in Israel (including in connection with movement and arrival of equipment and teams and execution of maintenance
activities), breakdowns in performance of the maintenance, operational failures and/or other factors that are not under the Company’s control.
|
| 4. |
Analysis of the results of operations for the Six Months Ended June 30, 2024 (in millions of NIS) (Cont.)
|
|
|
D. |
Analysis of the change in adjusted EBITDA after proportionate consolidation – energy transition segment in the U.S.
|


| 4. |
Analysis of the results of operations for the Six Months Ended June 30, 2024 (in millions of NIS) (Cont.)
|
|
|
E. |
Additional details regarding electricity hedges and guaranteed capacity payments in the Energy Transition segment in the U.S.
|
|
July – December
|
||||||
|
2024
|
2025
|
|||||
|
Expected generation (MWh)
|
4,874,165
|
8,749,837
|
||||
|
Net scope of the hedged energy margin (% of the expected generation of the power plants) (*)
|
60%
|
|
44%
|
|
||
|
Net hedged energy margin (millions of $)
|
≈ 43.5
(≈ NIS 161 million)
|
≈ 70.7
(≈ NIS 261 million)
|
||||
|
Net hedged energy margin (MWh/$)
|
14.95
|
18.49
|
||||
|
Net market prices of energy margin (MWh/$) (**)
|
20.50
|
22.37
|
||||
|
|
(*) |
Pursuant to the policy for hedging electricity margins as at the date of the report, in general the CPV Group seeks to hedge up to 50% of the scope of the expected generation. The actual hedge rate could ultimately be different.
|
|
|
(**) |
The net energy margin is the energy margin (Spark Spread) plus/minus Power Basis less carbon tax and other variable costs. For details regarding the manner of calculation of the electricity margin (Spark Spread) – see Section 3.3I above.
The market prices of energy margin are based on future contracts for electricity and natural gas.
|
|
July – December
|
||||||
|
2024
|
2025
|
|||||
|
Scope of the secured capacity revenues (% of the power plant’s capacity)
|
90%
|
|
46%
|
|
||
|
Capacity receipts (millions of $)
|
≈ 30.5
(≈ NIS 113 million)
|
≈ 27.2
(≈ NIS 101 million)
|
||||
|
18
|
The estimated percentages and the actual hedged energy margins could change due to new hedges and/or sales of capacity made or as a result of
changes in market conditions or the hedging policy of the CPV Group.
|
| 4. |
Analysis of the results of operations for the Six Months Ended June 30, 2024 (in millions of NIS) (Cont.)
|
|
|
F. |
Analysis of the change in net income (in millions of NIS)
|

|
|
(1) |
Most of the increase stems from depreciation expenses of the Zomet power plant (about NIS 22 million) and Maple Hill (about NIS 9 million) that were commercially operated at the end of the second and fourth quarters of 2023,
respectively, and the Mountain Wind power plant (about NIS 8 million), which was consolidated for the first time in the second quarter of 2023.
|
|
|
(2) |
Most of the increase stems from financing expenses relating to the Zomet power plant, in the amount of about NIS 41 million, the Gat power plant, in the amount of about NIS 7 million, the Mountain Wind power plant, in the amount of about
NIS 5 million, and financing expenses that were recorded in the statement of income in respect of the financing framework of a renewable energy projects in the U.S., in the amount of about NIS 14 million.
|
|
|
(3) |
An increase in other expenses in the first quarter of 2024, in the amount of about NIS 21 million, stems from an impairment of value of Gnrgy. For additional details regarding an agreement for sale of Gnrgy shares – see Note 6B to the
interim statements. In addition, there was an increase, in the amount of about NIS 31 million, stemming from a loss from impairment of value of Hadera 2 due to the government’s decision to reject the plan – for additional details see
Note 10F to the interim financial statements.
|
| 4. |
Analysis of the results of operations for the Six Months Ended June 30, 2024 (in millions of NIS) (Cont.)
|
|
|
G. |
Adjustments to EBITDA after proportionate consolidation and net income (in millions of NIS)
|
|
For the Six Months Ended
|
|||||||||
|
Section
|
June 30
|
Board’s explanations
|
|||||||
|
2024
|
2023
|
||||||||
|
Change in the fair value of derivative financial instruments (presented as part of the Company’s share of income of associated companies in the U.S.)
|
10
|
16
|
Represents the change in the fair value of derivative financial instruments that are used in programs for hedging electricity margins of the
transition generation energies segment in the U.S. and that were not designated for hedge accounting – for details see Section E above.
|
||||||
|
Net expenses, not in the ordinary course of business and/or of a non‑recurring nature
|
–
|
18
|
In 2023, represents test runs and other activities executed prior to the commercial operation of the Zomet power plant, which took place in June
2023.
|
||||||
|
Total adjustments to EBITDA after proportionate consolidation
|
10
|
34
|
|||||||
|
Tax impact in respect of the adjustments
|
(2
|
)
|
(7
|
)
|
|||||
|
Total adjustments to net income for the period
|
8
|
27
|
|||||||
| 4. |
Analysis of the results of operations for the Six Months Ended June 30, 2024 (in millions of NIS) (Cont.)
|
|
|
H. |
Detail generation
|
|
For the Six Months Ended June 30, 2024
|
For the Six Months Ended June 30, 2023
|
|||||||||||||||||||||||||||||||||||
|
Actual
|
Actual
|
|||||||||||||||||||||||||||||||||||
|
Potential
|
Net
|
Actual
|
calculated
|
Potential
|
Net
|
Actual
|
calculated
|
|||||||||||||||||||||||||||||
|
electricity
|
electricity
|
generation
|
availability
|
electricity
|
electricity
|
generation
|
availability
|
|||||||||||||||||||||||||||||
|
Capacity
|
generation
|
generation
|
percentage
|
percentage
|
generation
|
generation
|
percentage
|
percentage
|
||||||||||||||||||||||||||||
|
(MW)
|
(GWh)(1)
|
(GWh)(2)
|
(%)(3)
|
(%)
|
(GWh)
|
(GWh)
|
(%)
|
(%)
|
||||||||||||||||||||||||||||
|
Rotem
|
466
|
1,889
|
1,546
|
81.8
|
%
|
89.7
|
%
|
1,893
|
1,749
|
92.4
|
%
|
97.7
|
%
|
|||||||||||||||||||||||
|
Hadera
|
144
|
528
|
436
|
82.5
|
%
|
82.5
|
%
|
514
|
485
|
94.4
|
%
|
94.4
|
%
|
|||||||||||||||||||||||
|
Gat
|
75
|
311
|
293
|
94.2
|
%
|
94.5
|
%
|
157
|
156
|
99.4
|
%
|
100
|
%
|
|||||||||||||||||||||||
|
Zomet
|
396
|
1,638
|
279
|
17.0
|
%
|
85.2
|
%
|
–
|
–
|
–
|
–
|
|||||||||||||||||||||||||
|
|
(1) |
The generation potential is the net generation capability adjusted for temperature and humidity.
|
|
|
(2) |
The actual net generation in the period.
|
|
|
(3) |
The actual generation percentage is the net electricity generated divided by the generation potential.
|
| 4. |
Analysis of the results of operations for the Six Months Ended June 30, 2024 (in millions of NIS) (Cont.)
|
|
|
H. |
Detail generation (in millions of kilowatt/hours) (Cont.)
|
|
For the Six Months Ended June 30, 2024
|
For the Six Months Ended June 30, 2023
|
|||||||||||||||||||||||||||||||||||
|
Potential
|
Net
|
Actual
|
Actual
|
Potential
|
Net
|
Actual
|
Actual
|
|||||||||||||||||||||||||||||
|
electricity
|
electricity
|
generation
|
availability
|
electricity
|
electricity
|
generation
|
availability
|
|||||||||||||||||||||||||||||
|
Capacity
|
generation
|
generation
|
percentage
|
percentage
|
generation
|
generation
|
percentage
|
percentage
|
||||||||||||||||||||||||||||
|
(MW)
|
(GWh)(1)
|
(GWh)(2)
|
(%)(3)
|
(%)
|
(GWh)
|
(GWh)
|
(%)
|
(%)
|
||||||||||||||||||||||||||||
|
Energy transition projects (natural gas)
|
||||||||||||||||||||||||||||||||||||
|
Fairview
|
1,050
|
4,432
|
3,862
|
83.9
|
%
|
91.7
|
%
|
4,480
|
4,145
|
90.6
|
%
|
91.4
|
%
|
|||||||||||||||||||||||
|
Towantic
|
805
|
3,222
|
2,671
|
73.8
|
%
|
88.2
|
%
|
3,332
|
2,771
|
77.3
|
%
|
89.5
|
%
|
|||||||||||||||||||||||
|
Maryland
|
745
|
2,985
|
1,744
|
54.0
|
%
|
91.1
|
%
|
2,992
|
2,166
|
67.3
|
%
|
83.6
|
%
|
|||||||||||||||||||||||
|
Shore
|
725
|
2,956
|
1,856
|
58.5
|
%
|
91.8
|
%
|
2,156
|
1,471
|
46.7
|
%
|
58.2
|
%
|
|||||||||||||||||||||||
|
Valley
|
720
|
3,148
|
2,613
|
85.2
|
%
|
93.4
|
%
|
3,050
|
2,029
|
66.5
|
%
|
63.3
|
%
|
|||||||||||||||||||||||
|
Three Rivers
|
1,258
|
4,869
|
2,938
|
55.2
|
%
|
73.2
|
%
|
–
|
–
|
–
|
–
|
|||||||||||||||||||||||||
|
For the Six Months Ended
|
||||||||||||
|
June 30, 2024
|
June 30, 2023
|
|||||||||||
|
Capacity
|
Net electricity generation
|
|||||||||||
|
(MW)
|
(GWh)(2)
|
|||||||||||
|
Renewable energy projects
|
||||||||||||
|
Keenan II
|
152
|
125
|
122
|
|||||||||
|
Mountain Wind
|
82
|
104
|
48
|
|||||||||
|
Maple Hill
|
126
|
87
|
–
|
|||||||||
|
Stagecoach
|
102
|
53
|
–
|
|||||||||
| (1) |
The potential generation is the gross generation capability during the period after planned maintenance and less the electricity used for the power plant’s internal purposes.
|
| (2) |
The net generation of electricity is the gross generation during the period less the electricity used for the power plant’s internal purposes.
|
| (3) |
The actual generation percentage is the quantity of the net electricity generated in the facilities compared with the maximum quantity that can be generated in the period.
|
| (*) |
It is noted that the generation data of the Gat, Zomet, Three Rivers, Mountain Wind and Maple Hill power plants were included starting from the initial consolidation date or the commercial operation date, as applicable, which took place
in 2023. The Stagecoach power plant was operated for the first time in the second quarter of 2024.
|
| 5. |
Analysis of the results of operations for the Three Months Ended June 30, 2024 (in millions of NIS)
|
|
|
A. |
Statement of income
|
|
For the Three Months Ended
|
||||||||
|
Section
|
June 30
|
|||||||
|
2024
|
2023
|
|||||||
|
Revenues from sales and provision of services (1)
|
673
|
601
|
||||||
|
Cost of sales and provision of services (without depreciation and amortization) (2)
|
(481
|
)
|
(470
|
)
|
||||
|
Depreciation and amortization
|
(81
|
)
|
(62
|
)
|
||||
|
Gross profit
|
111
|
69
|
||||||
|
Administrative and general expenses
|
(58
|
)
|
(58
|
)
|
||||
|
Share in earnings of associated companies
|
14
|
15
|
||||||
|
Business development expenses
|
(10
|
)
|
(15
|
)
|
||||
|
Other income (expenses), net
|
4
|
(5
|
)
|
|||||
|
Operating income
|
61
|
6
|
||||||
|
Financing expenses, net
|
(88
|
)
|
(55
|
)
|
||||
|
Loss before taxes on income
|
(27
|
)
|
(49
|
)
|
||||
|
Tax benefit
|
–
|
9
|
||||||
|
Net loss for the period
|
(27
|
)
|
(40
|
)
|
||||
|
Adjustments
|
(3
|
)
|
3
|
|||||
|
Adjusted net loss for the period
|
(30
|
)
|
(37
|
)
|
||||
|
Attributable to:
|
||||||||
|
The Company’s shareholders
|
(18
|
)
|
(21
|
)
|
||||
|
Holders of non‑controlling interests
|
(12
|
)
|
(16
|
)
|
||||
| 5. |
Analysis of the results of operations for the Three Months Ended June 30, 2024 (in millions of NIS) (Cont.)
|
|
|
A. |
Statement of income (Cont.)
|
|
(1)
|
Changes in revenues:
|
|
Revenues
|
For the Three
|
Board’s Explanations
|
|||||||
|
Months Ended
|
|||||||||
|
June 30
|
|||||||||
|
2024
|
2023
|
||||||||
|
Revenues in Israel
|
|||||||||
|
Revenues from sale of energy to private customers
|
305
|
324
|
|||||||
|
Revenues from sale of energy to the System Operator and to other suppliers
|
50
|
32
|
The increase stems mainly from an increase, in the amount of about NIS 30 million, as a result of the commercial operation of Zomet at the end of
the second quarter of 2023.
|
||||||
|
Revenues in respect of capacity payments
|
46
|
–
|
The increase stems from the commercial operation of Zomet at the end of the second quarter of 2023.
|
||||||
|
Revenues from sale of energy at cogeneration tariff
|
6
|
10
|
|||||||
|
Revenues from sale of steam
|
13
|
14
|
|||||||
|
Other revenues
|
16
|
35
|
Most of the decrease derives from sale of electricity, in the amount of about NIS 26 million, from the Zomet power plan prior to the commercial operation at the end of June 2023.
|
||||||
|
Total revenues from sale of energy and others in Israel (without infrastructure services)
|
436
|
415
|
|||||||
|
Revenues from private customers in respect of infrastructure services
|
106
|
119
|
|||||||
|
Total revenues in Israel
|
542
|
534
|
|||||||
|
Revenues in the U.S.
|
|||||||||
|
Revenues from sale of electricity from renewable energy
|
69
|
36
|
The increase stems mainly from the commercial operation of the Maple Hill and Stagecoach projects commencing from the fourth quarter of 2023 and
the second quarter of 2024, respectively.
|
||||||
|
Revenues from provision of services (as part of the other segment) and other revenues
|
62
|
31
|
Most of the increase stems from the scope of the activities involving sale of electricity from renewable sources (retail) to commercial customers.
|
||||||
|
Total revenues in the U.S.
|
131
|
67
|
|||||||
|
Total revenues
|
673
|
601
|
|||||||
| 5. |
Analysis of the results of operations for the Three Months Ended June 30, 2024 (in millions of NIS) (Cont.)
|
|
|
A. |
Statement of income (Cont.)
|
|
|
(2) |
Changes in the cost of sales and provision of services (not including depreciation and amortization):
|
|
Cost of Sales and
Provision of Services
|
For the Three
Months Ended
|
Board’s Explanations
|
|||||||
|
June 30
|
|||||||||
|
2024
|
2023
|
||||||||
|
Cost of sales in Israel
|
|||||||||
|
Natural gas and diesel oil
|
177
|
153
|
The increase stems from the commercial operation of Zomet starting from the end of the second quarter of 2023, in the amount of about NIS 29
million, and an increase in the gas tariff as a result of an increase in the shekel/dollar exchange rate, in the amount of about NIS 3 million. On the other hand, there was a decrease of about NIS 11 million deriving from entry of the
Energean agreement into effect commencing from the end of the first quarter of 2023 and a decrease in the gas tariff stemming from a decline in the generation component.
|
||||||
|
Expenses in respect of acquisition of energy
|
58
|
83
|
Most of the decrease, in the amount of about NIS 30 million, is a result of a decline in customer consumption in the period of the report (most of
which as part of the virtual activities).
|
||||||
|
Cost of transmission of gas
|
14
|
9
|
|||||||
|
Salaries and related expenses
|
11
|
7
|
|||||||
|
Operating expenses
|
29
|
16
|
The increase stems mainly from the commercial operation of Zomet starting from the end of the second quarter of 2023.
|
||||||
|
Other expenses
|
13
|
44
|
Most of the decrease stems from the fact that in the corresponding quarter last year natural‑gas and other expenses were recognized in the Zomet
power plant prior to the commercial operation at the end of June 2023.
|
||||||
|
Total cost of sales in Israel without infrastructure services
|
302
|
312
|
|||||||
|
Expenses in respect of infrastructure services
|
106
|
119
|
|||||||
|
Total cost of sales in Israel
|
408
|
431
|
|||||||
| 5. |
Analysis of the results of operations for the Three Months Ended June 30, 2024 (in millions of NIS) (Cont.)
|
|
|
A. |
Statement of income (Cont.)
|
|
|
(2) |
Changes in the cost of sales and provision of services (not including depreciation and amortization): (Cont.)
|
|
Cost of sales and services in the U.S.
|
|||||||||
|
Cost of sales in respect of sale of electricity from renewable energy
|
26
|
12
|
The increase stems mainly from the commercial operation of the Maple Hill and Stagecoach projects.
|
||||||
|
Cost in respect provision of services (as part of the “others” segment) and other costs
|
47
|
27
|
Most of the increase stems from an increase in the scope of the activities involving sale of electricity from renewable sources (retail) to
commercial customers.
|
||||||
|
Total cost of sales and provision of services in the U.S.
|
73
|
39
|
|||||||
|
Total cost of sales and provision of services
|
481
|
470
|
|||||||
| 5. |
Analysis of the results of operations for the Three Months Ended June 30, 2024 (in millions of NIS) (Cont.)
|
|
|
B. |
EBITDA, FFO and net cash flows after service of the project debt
|
|
For the
|
||||||||
|
Three Months Ended
|
||||||||
|
June 30
|
||||||||
|
2024
|
2023
|
|||||||
|
Revenues from sales and provision of services
|
673
|
601
|
||||||
|
Cost of sales and provision of services (without depreciation and amortization)
|
(481
|
)
|
(470
|
)
|
||||
|
Administrative and general expenses (without depreciation and amortization)
|
(54
|
)
|
(55
|
)
|
||||
|
Business development expenses
|
(10
|
)
|
(15
|
)
|
||||
|
Share in income of associated companies
|
14
|
15
|
||||||
|
Consolidated EBITDA
|
142
|
76
|
||||||
|
Elimination of the share in income of associated companies
|
(14
|
)
|
(15
|
)
|
||||
|
Addition of the share of Group in proportionate EBITDA of associated companies (3)
|
113
|
94
|
||||||
|
EBITDA after proportionate consolidation
|
241
|
155
|
||||||
|
Adjustments for consolidated companies (see detail in Section F below)
|
–
|
11
|
||||||
|
Adjustments for associated companies (see detail in Section F below) (1)
|
(3
|
)
|
(7
|
)
|
||||
|
Adjusted EBITDA after proportionate consolidation
|
238
|
159
|
||||||
| 5. |
Analysis of the results of operations for the Three Months Ended June 30, 2024 (in millions of NIS) (Cont.)
|
|
|
B. |
EBITDA, FFO and net cash flows after service of the project debt (Cont.)
|
|
|
(1) |
Calculation of the Group’s share in the proportionate EBITDA of associated companies (in millions of NIS):
|
|
For the three months ended June 30, 2024
|
Fairview
|
Towantic
|
Maryland
|
Shore*
|
Valley
|
Three
Rivers
|
Total
|
|||||||||||||||||||||
|
Revenues from sales of energy
|
44
|
32
|
36
|
33
|
66
|
12
|
223
|
|||||||||||||||||||||
|
Cost of natural gas
|
18
|
10
|
13
|
13
|
24
|
6
|
84
|
|||||||||||||||||||||
|
Carbon emissions tax (RGGI)**
|
–
|
8
|
6
|
12
|
18
|
–
|
44
|
|||||||||||||||||||||
|
Cost of sales – other expenses (without
|
||||||||||||||||||||||||||||
|
depreciation and amortization)
|
–
|
1
|
2
|
2
|
1
|
1
|
7
|
|||||||||||||||||||||
|
Gain (loss) on realization of transactions
|
||||||||||||||||||||||||||||
|
hedging the electricity margins
|
4
|
(1
|
)
|
1
|
1
|
4
|
2
|
11
|
||||||||||||||||||||
|
Net energy margin
|
30
|
12
|
16
|
7
|
27
|
7
|
99
|
|||||||||||||||||||||
|
Revenues from capacity payments
|
4
|
28
|
3
|
5
|
15
|
1
|
56
|
|||||||||||||||||||||
|
Other income
|
1
|
1
|
2
|
2
|
–
|
1
|
7
|
|||||||||||||||||||||
|
Gross profit
|
35
|
41
|
21
|
14
|
42
|
9
|
162
|
|||||||||||||||||||||
|
Fixed costs (without depreciation and
|
||||||||||||||||||||||||||||
|
amortization)
|
2
|
6
|
6
|
10
|
18
|
2
|
44
|
|||||||||||||||||||||
|
Administrative and general expenses
|
||||||||||||||||||||||||||||
|
(without depreciation and amortization)
|
1
|
1
|
1
|
2
|
2
|
1
|
8
|
|||||||||||||||||||||
|
Group’s share in proportionate adjusted
|
||||||||||||||||||||||||||||
|
EBITDA of associated companies
|
32
|
34
|
14
|
2
|
22
|
6
|
110
|
|||||||||||||||||||||
|
For the three months ended June 30, 2023
|
Fairview
|
Towantic
|
Maryland
|
Shore*
|
Valley
|
Three
Rivers
|
Total
|
|||||||||||||||||||||
|
Revenues from sales of energy
|
48
|
38
|
32
|
19
|
42
|
–
|
179
|
|||||||||||||||||||||
|
Cost of natural gas
|
20
|
19
|
13
|
9
|
16
|
–
|
77
|
|||||||||||||||||||||
|
Carbon emissions tax (RGGI)**
|
–
|
6
|
4
|
3
|
8
|
–
|
21
|
|||||||||||||||||||||
|
Cost of sales – other expenses (without
|
||||||||||||||||||||||||||||
|
depreciation and amortization)
|
–
|
1
|
2
|
2
|
2
|
–
|
7
|
|||||||||||||||||||||
|
Gain (loss) on realization of transactions
|
||||||||||||||||||||||||||||
|
hedging the electricity margins
|
–
|
(2
|
)
|
–
|
(4
|
)
|
1
|
–
|
(5
|
)
|
||||||||||||||||||
|
Net energy margin
|
28
|
10
|
13
|
1
|
17
|
–
|
69
|
|||||||||||||||||||||
|
Revenues from capacity payments
|
7
|
25
|
4
|
8
|
14
|
–
|
58
|
|||||||||||||||||||||
|
Other income
|
2
|
4
|
1
|
1
|
–
|
–
|
8
|
|||||||||||||||||||||
|
Gross profit
|
37
|
39
|
18
|
10
|
31
|
–
|
135
|
|||||||||||||||||||||
|
Fixed costs (without depreciation and
|
||||||||||||||||||||||||||||
|
amortization)
|
2
|
6
|
6
|
8
|
20
|
–
|
42
|
|||||||||||||||||||||
|
Administrative and general expenses
|
||||||||||||||||||||||||||||
|
(without depreciation and amortization)
|
1
|
1
|
1
|
1
|
2
|
–
|
6
|
|||||||||||||||||||||
|
Group’s share in proportionate adjusted
|
||||||||||||||||||||||||||||
|
EBITDA of associated companies
|
34
|
32
|
11
|
1
|
9
|
–
|
87
|
|||||||||||||||||||||
|
|
* |
At the Shore power plant – gas transport costs (totaling in the second quarter of 2024 and 2023 about NIS 5 million) that are classified in accordance with IFRS 16 as depreciation expenses and, accordingly, are not included in the
adjusted EBITDA.
|
|
|
** |
It is noted that as at the approval date of the report, in Pennsylvania RGGI is not imposed. For details regarding a legal proceeding underway regarding the matter and possible implications of imposition of RGGI on costs of the Fairview
power plant and the electricity prices throughout the PJM – see Section 8.1.5B of Part A of the Periodic Report for 2023. In the period of the report, there was an increase of 62% in the average RGGI compared with the corresponding quarter
last year.
|
| 5. |
Analysis of the results of operations for the Three Months Ended June 30, 2024 (in millions of NIS) (Cont.)
|
|
|
B. |
EBITDA, FFO and net cash flows after service of the project debt (Cont.)
|
|
|
(2) |
Set forth below is a breakdown of the adjusted EBITDA after proportionate consolidation data broken down by the subsidiaries (on a consolidated basis) and the associated companies (on a proportionate basis, based on the rate of the
holdings of the CPV Group therein) (in NIS millions):
|
|
|
For the
|
For the
|
|||||||||||||||
|
|
Three months ended
|
Three months ended
|
|||||||||||||||
|
|
Basis of
|
June 30, 2024
|
June 30, 2023
|
||||||||||||||
|
|
presentation
|
Adjusted
|
Adjusted
|
||||||||||||||
|
|
in the
|
EBITDA
|
EBITDA
|
||||||||||||||
|
|
Company’s
|
after
|
after
|
||||||||||||||
|
|
financial
|
proportionate
|
proportionate
|
||||||||||||||
|
|
statements
|
consolidation
|
FFO
|
consolidation
|
FFO
|
||||||||||||
|
Total operating projects and
|
|||||||||||||||||
|
accompanying business activities* **
|
Consolidated
|
123
|
16
|
99
|
35
|
||||||||||||
|
Business development costs and
|
|||||||||||||||||
|
headquarters in Israel
|
Consolidated
|
(7
|
)
|
(7
|
)
|
(7
|
)
|
(7
|
)
|
||||||||
|
Total Israel
|
116
|
9
|
92
|
28
|
|||||||||||||
|
Total operating projects*
|
Associated
|
110
|
49
|
87
|
52
|
||||||||||||
|
Other costs
|
Consolidated
|
(1
|
)
|
(7
|
)
|
–
|
(4
|
)
|
|||||||||
|
Total energy transition in the U.S.
|
109
|
42
|
87
|
48
|
|||||||||||||
|
Total operating projects*
|
Consolidated
|
40
|
28
|
20
|
27
|
||||||||||||
|
Business development and other costs
|
Consolidated
|
(5
|
)
|
3
|
(8
|
)
|
(6
|
)
|
|||||||||
|
Total renewable energy in the U.S.
|
35
|
31
|
12
|
21
|
|||||||||||||
|
Total activities as part of the “others” segment
|
Consolidated
|
2
|
2
|
(3
|
)
|
(3
|
)
|
||||||||||
|
Headquarters in the United States19
|
Consolidated
|
(19
|
)
|
(21
|
)
|
(23
|
)
|
(17
|
)
|
||||||||
|
Total United States
|
127
|
54
|
73
|
49
|
|||||||||||||
|
Company headquarters (not allocated
|
|||||||||||||||||
|
to the segments)
|
Consolidated
|
(5
|
)
|
(26
|
)
|
(6
|
)
|
4
|
|||||||||
|
Total consolidated
|
238
|
37
|
159
|
81
|
|||||||||||||
|
|
* |
See Section 3 below.
|
|
|
** |
The accompanying business activities in Israel include mainly virtual supply activities through OPC Israel, sale of electricity from facilities for generation of energy on the customer’s premises through OPC Power Plants and commerce in
natural gas, including with third parties through OPC Natural Gas.
|
|
19
|
After elimination of management fees between the CPV Group and the Company, in the amounts of about NIS 8 million and about NIS 7 million for the
three months ended June 30, 2024 and 2023, respectively.
|
| 5. |
Analysis of the results of operations for the Three Months Ended June 30, 2024 (in millions of NIS) (Cont.)
|
|
|
B. |
EBITDA, FFO and net cash flows after service of the project debt (Cont.)
|
|
|
(3) |
Set forth below is additional information regarding the revenues, net (in Israel net of infrastructure services and in the U.S. – revenues from sale of energy, availability and other), adjusted EBITDA after proportionate consolidation,
FFO and net cash flows after service of the project debt of the Group’s active power plants broken down by activity segments and subsidiaries (on a consolidated basis) and the associated companies (on a proportionate basis, based on the
rate of the holdings of the CPV Group therein) (in NIS millions):
|
|
For the Three Months Ended June 30, 2024
|
For the Three Months Ended June 30, 2023
|
|||||||||||||||||||||||||||||||||
|
|
Basis of
|
Adjusted
|
Net cash
|
Adjusted
|
Net cash
|
|||||||||||||||||||||||||||||
|
|
presentation
|
EBITDA
|
flows
|
EBITDA
|
flows
|
|||||||||||||||||||||||||||||
|
|
in the
|
after
|
after
|
after
|
after
|
|||||||||||||||||||||||||||||
|
Main
|
Company’s
|
proportionate
|
service of
|
proportionate
|
service of
|
|||||||||||||||||||||||||||||
|
projects in
|
financial
|
Net
|
consol-
|
project
|
Net
|
consol-
|
project
|
|||||||||||||||||||||||||||
|
operation
|
statements
|
revenues
|
idation
|
FFO
|
debt
|
revenues
|
idation
|
FFO
|
debt
|
|||||||||||||||||||||||||
|
Rotem20
|
Consolidated
|
204
|
71
|
13
|
13
|
207
|
73
|
22
|
22
|
|||||||||||||||||||||||||
|
Hadera21
|
Consolidated
|
70
|
9
|
5
|
(5
|
)
|
68
|
16
|
6
|
(4
|
)
|
|||||||||||||||||||||||
|
Zomet22
|
Consolidated
|
79
|
30
|
26
|
9
|
4
|
2
|
–
|
–
|
|||||||||||||||||||||||||
|
Gat
|
Consolidated
|
32
|
12
|
(17
|
)
|
(19
|
)
|
37
|
10
|
(1
|
)
|
(1
|
)
|
|||||||||||||||||||||
|
Accompanying
|
||||||||||||||||||||||||||||||||||
|
business activities
|
Consolidated
|
35
|
1
|
(11
|
)
|
(11
|
)
|
64
|
(2
|
)
|
8
|
8
|
||||||||||||||||||||||
|
Total operating
|
||||||||||||||||||||||||||||||||||
|
projects in Israel
|
||||||||||||||||||||||||||||||||||
|
and accompanying
|
||||||||||||||||||||||||||||||||||
|
business activities
|
420
|
123
|
16
|
(13
|
)
|
380
|
99
|
35
|
25
|
|||||||||||||||||||||||||
|
Fairview
|
Associated (25%)
|
49
|
32
|
26
|
7
|
57
|
34
|
38
|
9
|
|||||||||||||||||||||||||
|
Towantic
|
Associated (26%)
|
61
|
34
|
26
|
11
|
67
|
32
|
21
|
(3
|
)
|
||||||||||||||||||||||||
|
Maryland23
|
Associated (25%)
|
41
|
14
|
–
|
(2
|
)
|
37
|
11
|
(8
|
)
|
(4
|
)
|
||||||||||||||||||||||
|
Shore
|
Associated (37.5%)
|
40
|
2
|
–
|
–
|
28
|
1
|
(1
|
)
|
(1
|
)
|
|||||||||||||||||||||||
|
Valley
|
Associated (50%)
|
81
|
22
|
(5
|
)
|
(6
|
)
|
56
|
9
|
2
|
(10
|
)
|
||||||||||||||||||||||
|
Three Rivers22
|
Associated (10%)
|
14
|
6
|
2
|
–
|
–
|
–
|
–
|
–
|
|||||||||||||||||||||||||
|
Total energy
|
||||||||||||||||||||||||||||||||||
|
transition in the U.S.24
|
286
|
110
|
49
|
10
|
245
|
87
|
52
|
(9
|
)
|
|||||||||||||||||||||||||
|
Keenan
|
Consolidated
|
25
|
16
|
15
|
–
|
19
|
11
|
13
|
–
|
|||||||||||||||||||||||||
|
Mountain Wind
|
Consolidated
|
17
|
7
|
5
|
10
|
17
|
9
|
14
|
11
|
|||||||||||||||||||||||||
|
Maple Hill22
|
Consolidated
|
15
|
11
|
4
|
4
|
–
|
–
|
–
|
–
|
|||||||||||||||||||||||||
|
Stagecoach25
|
Consolidated
|
14
|
6
|
4
|
4
|
–
|
–
|
–
|
–
|
|||||||||||||||||||||||||
|
Total renewable
|
||||||||||||||||||||||||||||||||||
|
energy in the U.S.
|
71
|
40
|
28
|
18
|
36
|
20
|
27
|
11
|
||||||||||||||||||||||||||
|
20
|
Not including a deduction of repayment of loans to shareholders of Rotem and payments of intercompany taxes in the consolidated tax reconciliation statement.
|
|
21
|
In the second quarter of 2024, planned maintenance was performed at the Hadera power plant. For details – see Section 4C(2).
|
|
22
|
The financial results of the projects were included starting from the initial consolidation or the commercial operation dates, as applicable, which occurred in 2023. For details regarding
the capacity tariffs in the Zomet power plant, particularly in 2023, see Section 7.13 of Part A of the Periodic Report for 2023.
|
|
23
|
The FFO in the second quarter of 2023 includes a payment for upgrading of the facilities at the Maryland power plant, in the amount of about NIS 8 million.
|
|
24
|
It is noted that the financing agreements of the CPV Group including mechanisms of the “cash sweep” type in the framework of which all or part of the free cash flows from the project is
designated for repayment of the loan principal on a current basis in addition to the predetermined minimum repayment schedule with respect to every long‑term loan. Accordingly, there could be an acceleration of execution of repayments
upon occurrence of certain events and there are limitations on distributions to the owners.
|
|
25
|
The financial results of the Stagecoach project were included starting from the commercial operation date, in the second quarter of 2024.
|
| 5. |
Analysis of the results of operations for the Three Months Ended June 30, 2024 (in millions of NIS) (Cont.)
|
|
|
C. |
Analysis of the change in adjusted EBITDA – Israel segment
|
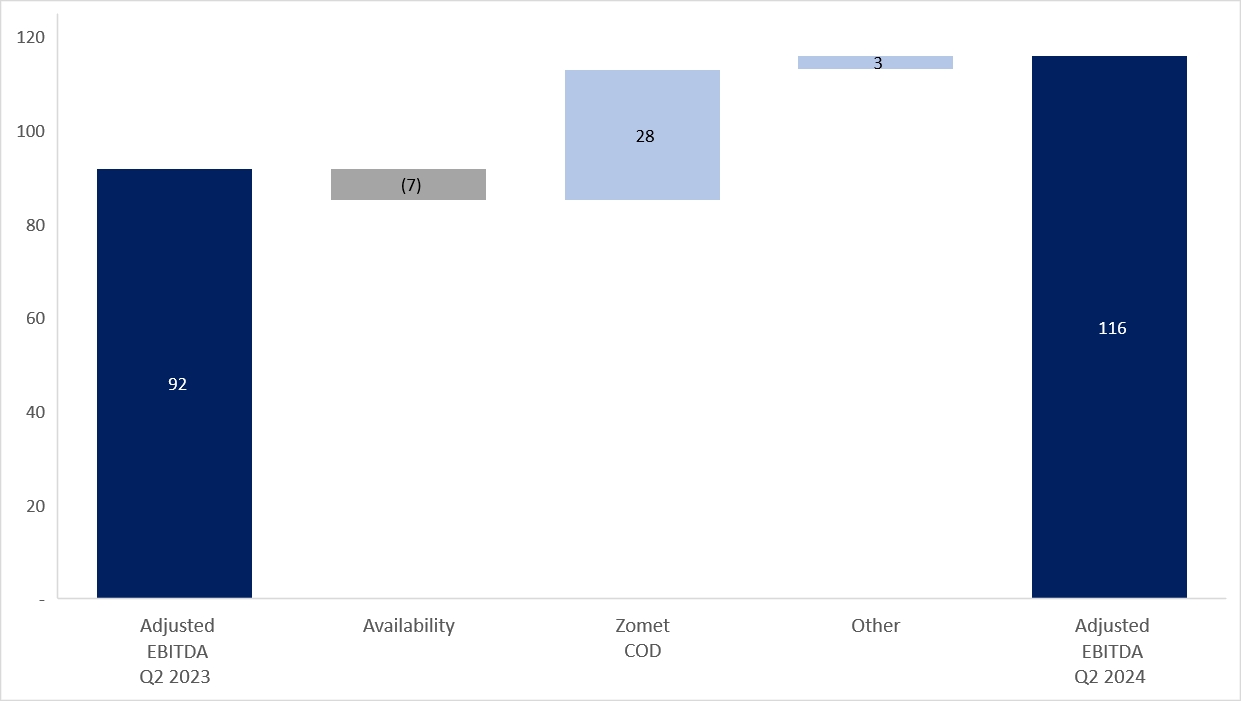
|
|
1. |
Availability (operational) – the decrease stems mainly from a partial shutdown of the Hadera power plant as described in Section 4C(2) above.
|
|
|
2. |
Commercial operation of Zomet and acquisition of Gat – for details regarding planned maintenance that was performed in the second quarter of 2024 at the Zomet power plant and maintenance work that is expected to be performed in
the second half of 2024 in the Zomet and Gat power plants – see Section 4H above.
|
| 5. |
Analysis of the results of operations for the Three Months Ended June 30, 2024 (in millions of NIS) (Cont.)
|
|
|
D. |
Analysis of the change in adjusted EBITDA after proportionate consolidation – energy transition segment in the U.S. (Cont.)
|

| 5. |
Analysis of the results of operations for the Three Months Ended June 30, 2024 (in millions of NIS) (Cont.)
|
|
|
D. |
Analysis of the change in adjusted EBITDA after proportionate consolidation – energy transition segment in the U.S.
|
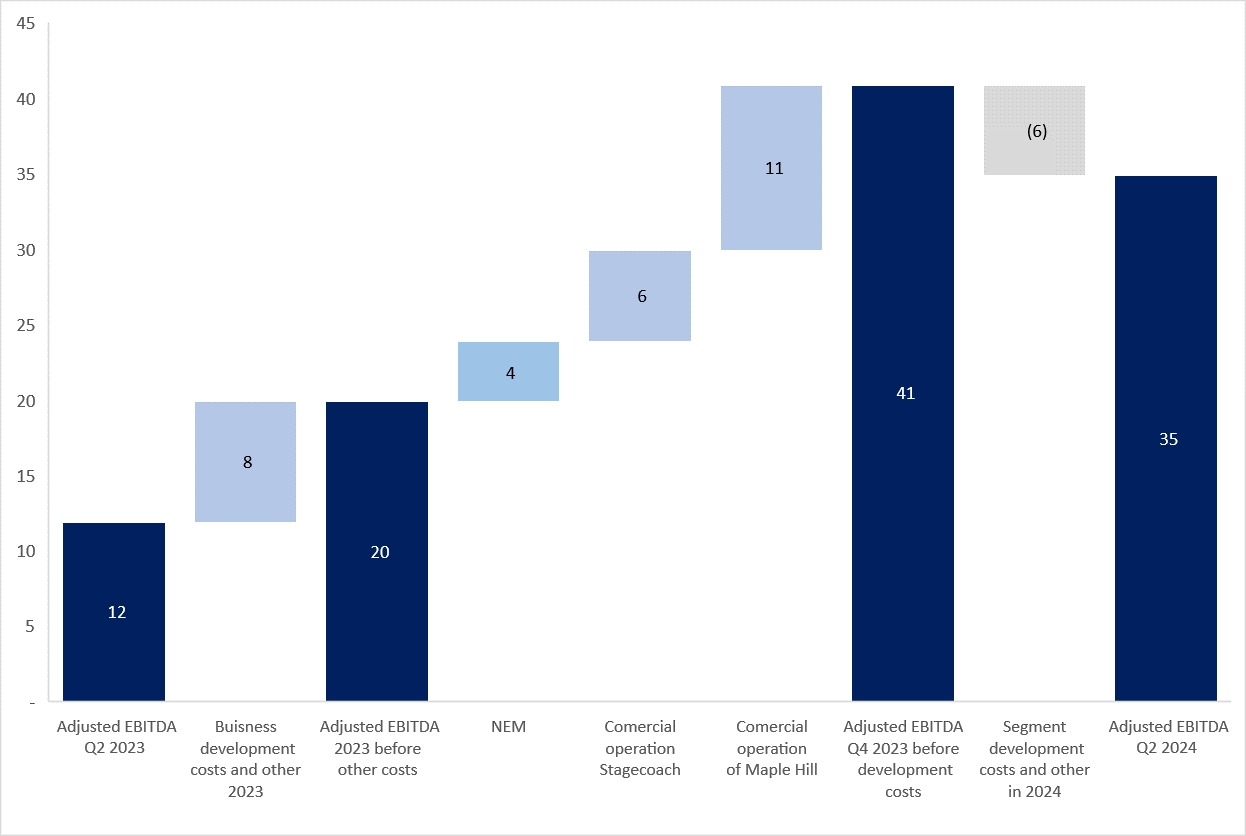
| 5. |
Analysis of the results of operations for Three Months Ended June 30, 2024 (in millions of NIS) (Cont.)
|
|
|
E. |
Analysis of the change in net income (in millions of NIS)
|

|
|
(1) |
Most of the increase stems from depreciation expenses of the Zomet power plant (about NIS 10 million) and Maple Hill (about NIS 4 million) that were commercially operated in the second and fourth quarters of 2023, respectively.
|
|
|
(2) |
Most of the increase stems from financing expenses relating to the commercial operation of the Zomet power plant, in the amount of about NIS 21 million, financing expenses that were recorded in the statement of income in respect of the
financing framework of a renewable energy project in the U.S., in the amount of about NIS 5 million, and expenses in respect of linkage differences (mainly in respect of the debentures (Series B)) in the amount of about NIS 5 million.
|
| 5. |
Analysis of the results of operations for Three Months Ended June 30, 2024 (in millions of NIS) (Cont.)
|
|
|
F. |
Adjustments to EBITDA after proportionate consolidation and net income (in millions of NIS)
|
|
For the Three Months Ended
|
|||||||||
|
Section
|
June 30
|
Board’s explanations
|
|||||||
|
2024
|
2023
|
||||||||
|
Change in the fair value of derivative financial instruments (presented as part of the Company’s share of income of associated companies in the U.S.)
|
(3
|
)
|
(7
|
)
|
Represents the change in the fair value of derivative financial instruments that are used in programs for hedging electricity margins of the
energy transition segment in the U.S. that were not designated for hedge accounting, as described in Section 4E above.
|
||||
|
Net expenses, not in the ordinary course of business and/or of a non‑recurring nature
|
–
|
11
|
In the corresponding quarter last year, represents activities in respect of a test run and the Company’s preparations for the commercial operation
of the Zomet Power Plant at the end of June 2023.
|
||||||
|
Total adjustments to EBITDA after proportionate consolidation
|
(3
|
)
|
4
|
||||||
|
Tax impact in respect of the adjustments
|
–
|
(1
|
)
|
||||||
|
Total adjustments to net loss for the period
|
(3
|
)
|
3
|
||||||
|
6.
|
Initiation and Construction Projects
|
|
A.
|
Initiation and construction projects in Israel and in the U.S.
|
|
|
1. |
Main details with reference to construction projects in Israel (held at 100% ownership by OPC Israel, which is 80% held by the Company)26:
|
|
Total
|
||||||||||||||||
|
Power
|
Date/
|
Total
|
construction
|
|||||||||||||
|
plants/
|
expectation
|
expected
|
cost as at
|
|||||||||||||
|
facilities
|
of the start
|
construction
|
June 30,
|
|||||||||||||
|
for
|
of the
|
Main
|
cost
|
2024
|
||||||||||||
|
generation
|
Capacity
|
commercial
|
customer/
|
(NIS
|
(NIS
|
|||||||||||
|
of energy
|
Status
|
(megawatts)
|
Location
|
Technology
|
operation
|
consumer
|
millions)
|
millions)
|
||||||||
|
OPC Sorek 2 Ltd. (“Sorek 2”)
|
Under construction
|
≈ 87
|
On the premises of the Sorek B seawater desalination facility
|
Powered by natural gas, cogeneration
|
Fourth quarter of 202427
|
Yard consumers and the System Operator
|
≈ 205
|
≈ 170
|
| 26 |
That stated in connection with projects that have not yet reached operation, including with reference to the expected operation date, the technologies and/or the anticipated cost of the investment, is
“forward‑looking” information, as it is defined in the Securities Law, which is based on, among other things, the Company’s estimates and assumptions as at the approval date of the report and regarding which there is no certainty it will
be realized (in whole or in part). Completion of the said projects (or any one of them) may not occur or may occur in a manner different than that stated above, among other things due to dependency on various factors, including those that
are not under the Company’s control, including assurance of connection to the network and output of electricity from the project sites and/or connection to the infrastructures (including gas infrastructures), receipt of permits,
completion of planning processes and licensing, completion of construction work, final costs in respect of development, construction, equipment and acquisition of rights in land, the proper functioning of the equipment and/or the terms of
undertakings with main suppliers (including lenders), and there is no certainty they will be fulfilled, the manner of their fulfillment, the extent of their impact or what their final terms will be. Ultimately technical, operational or
other delays and/or breakdowns and/or an increase in expenses could be caused, this being as a result of, among other things, factors as stated above or as a result of occurrence of one or more of the risk factors the Company is exposed
to, including construction risks (including force majeure events and the War and its impacts), regulatory, licensing or planning risks,
macro‑economic changes, delays and increased costs due relating to the supply chain and changes in raw‑material prices and etc. For additional details regarding risk factors – see Section 19 of Part A of the Periodic Report for 2023. It
is further clarified that delays in completion of the projects beyond the date originally planned for this could impact the ability of the Company and the Group companies to comply with their obligations to third parties, including
authorities, conditions of permits, lenders, yard consumers, customers and others, in connection with the projects, and cause a charge for additional costs, payment of compensation or starting of proceedings (including under guarantees
provided).
|
|
27
|
It is noted that a delay in the commercial operation beyond the original contractual date, which is not considered a justified delay as defined in the project agreements, could trigger
payment of monthly compensation at a limited graduated rate (taking into account the length of the delay, where a delay after full utilization of the compensation ceiling could give rise to a cancellation right). It is clarified that in
the initial delay period, the amount of the compensation for an unjustified delay is not material. The construction work, its completion the commercial operation date and the costs involved with the construction could be adversely
impacted by the War and/or its impacts. As at the date of the report, the financial closing for the project had been completed, however completion of the construction and operation of the Sorek 2 generation facility are subject to
fulfillment of conditions and factors that have not yet been fulfilled, and by operational or technical factors that relate to completion of the construction and the work on the project’s site. Ultimately, the date expected for completion
of the construction and commencement of the operation, as shown in the table could be delayed as a result of, among other things, a delay in completion of the construction work (including construction of the desalination facility),
delays in receipt of the required permits or in completion of connection to infrastructures, disruptions in arrival of equipment, force majeure events, occurrence of risk factors to which the
Company is exposed, including delays relating to the war or its consequences. It is clarified that delays as stated could impact the project’s costs and could also trigger and increase in costs (beyond the expected cost indicated above)
and/or could constitute non‑compliance with liabilities to third parties.
|
| 6. |
Initiation and Construction Projects (Cont.)
|
|
A.
|
Initiation and construction projects in Israel and in the U.S. (Cont.)
|
|
|
1. |
Main details with reference to construction projects in Israel (held at 100% ownership by OPC Israel, which is 80% held by the Company)26: (Cont.)
|
|
28
|
As at the date of the report, OPC Power Plants had not yet signed a planning authorization agreement in connection with the tender sites, had not yet started the development processes,
and had not yet received the authorizations required for the new plan and/or advancement of the projects on the land sites (including as a consolidated project), and there is no certainty that these actions, approvals or decisions will be
executed and/or received (in whole or in part) and/or the estimated period for their completion (if completed). In addition, that stated regarding, among other things, the characteristics and capacity of the solar facilities and the
storage capacity, the estimated cost of the subject projects (or any of them), the feasibility of advancement of the projects as a consolidated project the economic benefit and the cost savings due to consolidation of the projects (if
consolidated), increase of the certainty regarding the development or connection to the network processes, realization of the advantages of a consolidated project (if allowed) and the start date of construction of the project/s includes
“forward‑looking” information as it is defined in the Securities Law, which is based solely on the Company’s estimates and assumptions as at the date of the report, and regarding which there is no certainty they will be realized or the
manner in which they will be realized. As at the approval date of the report, construction of the generation and storage facilities and advancement of the project/s (in the Present Tender and the Prior Tender and/or the consolidated
project) depend on, among other things, advancement and completion of the planning, construction, connection to the network and licensing processes, and assurance of financing for the construction, which as at the date of the report had
not yet been completed and there is no certainty regarding their completion or the manner thereof (if completed). In addition, the costs of the projects are impacted by macro‑economic conditions and are subject to changes in the prices of
energy, equipment, construction, shipping, etc. Therefore, ultimately there could be administrative, planning, environmental, regulatory, infrastructure, operational and licensing delays/deficiencies, along with an increase in the
estimated costs – this being due to, among other things, various factors that are not under the Company’s control, or as result of the occurrence of one or more of the risk factors the Company is exposed to, as stated in Section 19 to
Part A of the Periodic Report, which are included herein by means of reference.
|
| 6. |
Initiation and Construction Projects (Cont.)
|
|
A.
|
Initiation and construction projects in Israel and in the U.S. (Cont.)
|
|
|
1. |
Main details with reference to construction projects in Israel (held at 100% ownership by OPC Israel, which is 80% held by the Company)26: (Cont.)
|
| 29 |
Development of the project on the land sites (in whole or in part, including in the format of a consolidated project), its construction and operation are exposed to various risk factors that generally apply to the Company’s activities,
particularly risks relating to completion of the development processes, regulatory risks, market risks (including macro conditions), dependency on infrastructures and assurance of connection to and a place in the network and the
infrastructure suppliers, and construction risks of the projects. For details regarding the Company’s risk factors – see Section 19 to Part A of the Company’s Periodic Report for 2023.
|
| 6. |
Initiation and Construction Projects (Cont.)
|
|
A.
|
Initiation and construction projects in Israel and in the U.S. (Cont.)
|
|
|
2. |
Main details regarding construction projects in the area of renewable energy as at the date of the report using solar and wind technology in the U.S. (held 100% by the CPV Group, which is 70%
held by the Company)30
|
|
30
|
Details with respect to the scope of the investments in the United States were translated from dollars and presented in NIS based on the currency rate of exchange on June 30, 2024 – $1 =
NIS 3.759. The information presented below regarding projects under construction, including with respect to the expected commercial structure, the projected commercial operation date, the expected
construction cost, an undertaking with a tax partner and/or the expected results of the activities for the first full calendar year (revenues, EBITDA, investments of the tax partner and cash flows after the tax partner) includes
“forward‑looking” information, as it is defined in the Securities Law, regarding which there is no certainty it will materialize (in whole or in part), including due to factors that are not under the control of the CPV Group. The
information is based on, among other things, estimates of the CPV Group as at the approval date of the report, the realization of which is not certain, and which might not be realized due to factors, such as: delays in receipt of
permits, an increase in the construction costs, delays in execution of the construction work and/or technical or operational malfunctions, problems or delays regarding signing an agreement for connection to the network or connection of
the project to transmission or other infrastructures, an increase in costs due to the commercial conditions in the agreements with main suppliers (such as equipment suppliers and contractors), problems signing an investment agreement
with a Tax Equity Partner regarding part of the cost of the project and utilization of the tax benefits (if relevant), problems signing commercial agreements for of the potential revenues from the project, terms of the commercial
agreements, conditions of the energy market, regulatory changes or legislative changes (including changes impacting main suppliers of the projects), an increase in the financing expenses, unforeseen expenses, macro‑economic changes,
weather events, including delays and an increase in costs of undertakings in the supply chain, transport and an increase in raw‑material prices, etc. Completion of the projects in accordance with the said estimates is subject to the
fulfillment of conditions which as at the approval date of the report had not yet been fulfilled (fully or partly) and, therefore, there is no certainty they will be completed in accordance with that stated. Construction delays could
even impact the ability of the companies to comply with liabilities to third parties in connection with the projects (including based on guarantees provided in favor of those third parties).
|
| 6. |
Initiation and Construction Projects (Cont.)
|
|
A.
|
Initiation and construction projects in Israel and in the U.S. (Cont.)
|
|
|
2. |
Main details regarding construction projects in the area of renewable energy using solar technology in the U.S. (held 100% by the CPV Group, which is 70% held by the Company)30
|
|
Total
|
||||||||||||||||||
|
expected
|
Total
|
|||||||||||||||||
|
construction
|
construction
|
|||||||||||||||||
|
cost net
|
cost
|
|||||||||||||||||
|
Regulated
|
for 100%
|
as at
|
||||||||||||||||
|
Expected
|
market
|
of the
|
Tax
|
June 30,
|
||||||||||||||
|
commercial
|
after
|
project
|
equity
|
2024
|
||||||||||||||
|
Capacity
|
operation
|
Commercial
|
the PPA
|
(NIS
|
(NIS
|
(NIS
|
Expectation for a first full calendar year
|
|||||||||||
|
Project
|
(megawatts)
|
Location
|
date
|
structure
|
period
|
millions)
|
millions)
|
millions)
|
in the period of the PPA agreements
|
|
Cash flows
|
||||||||||||||||||||||
|
after tax
|
||||||||||||||||||||||
|
Revenues
|
EBITDA
|
partner
|
||||||||||||||||||||
|
(NIS
|
(NIS
|
(NIS
|
||||||||||||||||||||
|
millions)
|
millions)
|
millions)
|
||||||||||||||||||||
|
CPV Backbone Solar, LLC (“Backbone”)
|
179 MWdc
|
Maryland
|
Second half of 2025
|
Long-term PPA31 (including green certificates)
|
PJM + MD SRECs
|
≈ 1,185
(≈ $315 million)
|
≈ 432
(≈ $115 million)32
|
≈ 635
(≈ $169 million)
|
≈ 71
(≈ $19 million)
|
≈ 49
(≈ $13 million)
|
≈ 39
(≈ $11 million)
|
|
31
|
The project has signed a connection agreement and electricity supply agreement with the global e‑commerce company for a period of 10 years from the start of the commercial operation, for
supply of 90% of the electricity expected to be generated by the project in the said period, and sale of solar renewable energy certificates, which is valid up to 2035. The balance of the project’s capacity (10%) will be used for supply
to active customers, retail supply of electricity of the CPV Group or for sale in the market.
|
|
32
|
The project is located on a former coal mine and, therefore, it is expected to be entitled to enlarged tax benefits of 40% in accordance with the IRA Law. The CPV Group intends to act to
sign an agreement with a tax partner (Equity Tax) in respect of about 40% of the cost of the project and use of the tax credits that are available to the project (subject to appropriate regulatory arrangements). That stated regarding the intention of the CPV Group to sign an agreement with a tax partner (equity tax), including the scope thereof and/or the scope of the tax benefits, includes “forward‑looking” information as it is defined
in the Securities Law, which is based on estimates of the CPV Group proximate to the date of the report and regarding which there is no certainty they will materialize (in whole or in part). The said estimates might not materialize or
might change due to a range of circumstances, including changes in the provisions of the law or regulations, the final terms of the agreement with the tax partner, which are not dependent on the Company and there is no certainty
regarding their realization.
|
| 6. |
Initiation and Construction Projects (Cont.)
|
|
A.
|
Initiation and construction projects in Israel and in the U.S. (Cont.)
|
|
|
2. |
Main details regarding construction projects in the area of renewable energy using solar technology in the U.S. (held 100% by the CPV Group, which is 70% held by the Company)30
|
|
Total
|
||||||||||||||||||
|
expected
|
Total
|
|||||||||||||||||
|
construction
|
construction
|
|||||||||||||||||
|
cost net
|
cost
|
|||||||||||||||||
|
Regulated
|
for 100%
|
as at
|
||||||||||||||||
|
Expected
|
market
|
of the
|
Tax
|
June 30,
|
||||||||||||||
|
commercial
|
after
|
project
|
equity
|
2024
|
||||||||||||||
|
Capacity
|
operation
|
Commercial
|
the PPA
|
(NIS
|
(NIS
|
(NIS
|
Expectation for a first full calendar year
|
|||||||||||
|
Project
|
(megawatts)
|
Location
|
date
|
structure
|
period
|
millions)
|
millions)
|
millions)
|
in the period of the PPA agreements
|
|
Cash flows
|
||||||||||||||||||||||
|
after tax
|
||||||||||||||||||||||
|
Revenues
|
EBITDA
|
partner
|
||||||||||||||||||||
|
(NIS
|
(NIS
|
(NIS
|
||||||||||||||||||||
|
millions)
|
millions)
|
millions)
|
||||||||||||||||||||
|
CPV Rogue’s Wind, LLC (“Rogues”)33
|
114
|
Pennsylvania
|
First half of 2026
|
Long-term PPA34 (including green certificates)
|
PJM MAAC
|
≈ 1,372
(≈ $365 million)
|
≈ 613
(≈ $163 million)35
|
≈ 64
(≈ $17 million)
|
≈ 89
(≈ $24 million)
|
≈ 67
(≈ $18 million)
|
≈ 56
(≈ $15 million)
|
|
33
|
Subsequent to the date of the report, a Work Commencement Order was issued and a project financing agreement was signed for provision of a shareholders’ loan to
the project. For details – see Note 7A(3) to the interim statements.
|
|
34
|
In April 2021, the project signed an agreement for sale of all the electricity and the environmental consideration (including Renewable Energy Certificates
(RECs), benefits relating to availability and accompanying services), the terms of which were improved in the period of the report. The agreement was signed for a period of 10 years starting from the commercial operation date. The CPV
Group has provided collateral for assurance of its obligations under the agreement, which includes execution of certain payments to the other party if certain milestones (including the commencement date of the activities) in the project
are not be completed in accordance with the timetable determined.
|
|
35
|
The project is located on a former coal mine and, therefore, it is expected to be entitled to enlarged tax benefits of 40% in accordance with the IRA Law. The CPV Group intends to act to
sign an agreement with a tax partner (Equity Tax) in respect of about 40% of the cost of the project and use of the tax credits that are available to the project (subject to appropriate regulatory arrangements). That stated regarding the intention of the CPV Group to sign an agreement with a tax partner (equity tax), including the scope thereof and/or the scope of the tax benefits, includes “forward‑looking” information as it is defined
in the Securities Law, which is based on estimates of the CPV Group proximate to the date of the report and regarding which there is no certainty they will materialize (in whole or in part). The said estimates might not materialize or
might change due to a range of circumstances, including changes in the provisions of the law or regulations, the final terms of the agreement with the tax partner, which are not dependent on the Company and there is no certainty
regarding their realization.
|
| 6. |
Initiation and Construction Projects (Cont.)
|
|
B.
|
Additional details regarding development projects in the U.S.
|
|
Advanced
|
Preliminary
|
|||||||||||
|
Technology
|
development37
|
development
|
Total*
|
|||||||||
|
Solar38
|
1,100
|
2,100
|
3,200
|
|||||||||
|
Wind (1)
|
150
|
1,200
|
1,350
|
|||||||||
|
Total renewable energy
|
1,250
|
3,300
|
4,550
|
|||||||||
|
Carbon capture projects (natural gas
|
||||||||||||
|
with reduced emissions) (2)
|
1,300
|
5,000
|
6,300
|
|||||||||
|
|
* |
It is noted that out of the total backlog of the development projects, as stated above, about 500 megawatts of renewable energy are in the PJM market in the
advanced development stage, and about 4,500 megawatts (of which about 1,000 megawatts are renewable energy) are in the preliminary development stage. The said data takes into account the publication of PJM from May 2024 regarding the
projected treatment dates of the requests submitted for connection agreements.
|
|
|
(1) |
As at the date of the report, the construction of the Rogue’s Wind wind project had started. For details – see Section 6A(2) above.
|
|
|
(2) |
For details – see Section 6C of the Report of the Board of Directors for 2023.
|
|
36
|
The information presented in this section with reference to development projects of the CPV Group, including regarding the status of the
projects and/or their characteristics (the capacity, technology, the possibility for integrated carbon capture potential, expected construction date etc.), constitutes “forward‑looking” information as it is defined in the Securities
Law, regarding which there is no certainty it will be realized or the manner in which it will be realized. It is clarified that as at the approval date of the report there is no certainty regarding the actual execution of the
development projects (in whole or in part), and their progress and the rate of their progress is subject to, among other things, completion of development and licensing processes, obtain control over the lands, signing agreements (such
as equipment and construction agreements), execution of construction processes, completion of the connection process, assurance of financing and/or receipt of various regulatory approvals and permits. In addition, advancement of the
development projects is subject to the discretion of the competent authorities of the CPV Group and of the Company.
|
|
37
|
In general, the CPV Group views projects that in its estimation are in a period of up to two years or up to three years to the start of the construction as projects in the advanced
development stage (there is no certainty the development projects, including projects in the advanced stage, will be executed). That stated is impacted by, among other things, the scope of the project and the technology, and could change
based on specific characteristics of a certain project, as well as from the external circumstances that are relevant to the project, such as the anticipated activities’ market or regulatory circumstances, including, projects that are
designated to operate in the PJM market could be impacted by the changes in the connection processes as part of the proposed change described in Section 8.1.2.2(A) of Part A to the Periodic Report for 2023, and their progress could be
delayed as a result of these proposed changes. It is clarified that in the early development stages (in particular), the scope of the projects and their characteristics are subject to changes, if and to the extent they reach advanced
stages.
|
|
38
|
The capacities in the solar technology included in this report are denominated in MWdc. The capacities in the solar technology projects in the advanced development stages and in the early
development stages are about 850 MWac and about 1,650 MWac, respectively.
|
|
7.
|
Financial Position as at June 30, 2024 (in millions of NIS)
|
|
Category
|
06/30/2024
|
12/31/2023
|
Board’s Explanations
|
||||||
|
Current Assets
|
|||||||||
|
Cash and cash equivalents
|
722
|
1,007
|
For details – see the Company’s consolidated statements of cash flows in the interim financial statements and Part 8 below.
|
||||||
|
Short-term restricted cash and deposits
|
5
|
2
|
|||||||
|
Trade receivables
|
360
|
247
|
Most of the increase, in the amount of about NIS 88 million, stems from an increase in the balances of customers in Israel, mainly due to seasonal factors in the electricity tariff.
|
||||||
|
Receivables and debit balances
|
365
|
404
|
Most of the decrease, in the amount of about NIS 20 million, stems from a decrease in the balance of the prepaid expenses.
|
||||||
|
Short-term derivative financial instruments
|
13
|
12
|
|||||||
|
Total current assets
|
1,465
|
1,672
|
|||||||
| 7. |
Financial Position as at June 30, 2024 (in millions of NIS) (Cont.)
|
|
Category
|
06/30/2024
|
12/31/2023
|
Board’s Explanations
|
||||||
|
Non-Current Assets
|
|||||||||
|
Long-term deposits and restricted cash
|
58
|
59
|
|||||||
|
Long-term prepaid expenses and other receivable
|
183
|
190
|
|||||||
|
Investments in associated companies
|
2,661
|
2,550
|
The increase stems mainly from equity earnings of the CPV Group, in the amount of about NIS 85 million and from an increase in the shekel/dollar exchange rate, in the amount of about NIS 93
million, offset by other comprehensive loss, in the amount of about NIS 69 million. For additional details regarding investments in associated companies – see Section 4D above.
|
||||||
|
Deferred tax assets
|
38
|
57
|
|||||||
|
Long-term derivative financial instruments
|
60
|
51
|
|||||||
|
Property, plant and equipment
|
6,680
|
6,243
|
Most of the increase stems from investments in Israel and the U.S. (mainly in construction and development projects), in the amount of about NIS 127 million and about NIS 390 million,
respectively, and an increase of about NIS 72 million, in property, plant and equipment in the U.S. due to an increase in the shekel/dollar exchange rate. This increase was partly offset by a loss from impairment of value with respect to
the Hadera 2 project, in amount of about NIS 31 million, and was offset by depreciation expenses on property, plant and equipment.
|
||||||
|
Right-of use assets and long-term deferred expenses
|
622
|
631
|
|||||||
|
Intangible assets
|
1,168
|
1,165
|
|||||||
|
Total non-current assets
|
11,470
|
10,946
|
|||||||
|
Total assets
|
12,935
|
12,618
|
|||||||
| 7. |
Financial Position as at June 30, 2024 (in millions of NIS) (Cont.)
|
|
Category
|
06/30/2024
|
12/31/2023
|
Board’s Explanations
|
||||||
|
Current Liabilities
|
|||||||||
|
Loans and credit from banks and financial institutions (including current maturities)
|
146
|
391
|
Most of the decrease stems from a short‑term credit framework repaid by OPC Israel Holdings, in the amount of NIS 200 million, and a decrease in the current maturity of
the Zomet loan, in the amount of about NIS 40 million.
|
||||||
|
Current maturities of debt from holders of non-controlling interests
|
29
|
32
|
|||||||
|
Current maturities of debentures
|
202
|
192
|
|||||||
|
Trade payables
|
319
|
257
|
Most of the increase stems from an increase in the scope of the activities in the renewable energies segment and supply to customers (retail) activities in the U.S.
|
||||||
|
Payables and other credit balances
|
438
|
403
|
Most of the increase stems from an increase, in the amount of about NIS 29 million, in the balance of VAT payable.
|
||||||
|
Short-term derivative financial instruments
|
7
|
8
|
|||||||
|
Total current liabilities
|
1,141
|
1,283
|
|||||||
| 7. |
Financial Position as at June 30, 2024 (in millions of NIS) (Cont.)
|
|
Category
|
06/30/2024
|
12/31/2023
|
Board’s Explanations
|
||||||
|
Non-Current Liabilities
|
|||||||||
|
Long-term loans from banks and financial institutions
|
2,880
|
2,865
|
|||||||
|
Long-term debt from holders of non-controlling interests
|
469
|
422
|
Most of the increase derives from an increase in the balance of the long‑term loans from holders of non‑controlling interests in the CPV Group, where an increase of
about NIS 24 million relates to new loans and accumulation of principal, and an increase of about NIS 14 million due to an increase in the shekel/dollar exchange rate.
|
||||||
|
Debentures
|
1,756
|
1,647
|
Most of the increase, in the amount of about NIS 197 million, derives from issuance of the debentures (Series D) and an increase in the linkage differences relating to the debentures
(Series B), in the amount of about NIS 18 million. On the other hand, there was a decrease deriving from repayment of debentures, in the amount of about NIS 96 million.
|
||||||
|
Long-term lease liabilities
|
201
|
204
|
|||||||
|
Long-term derivate financial instruments
|
45
|
58
|
|||||||
|
Other long-term liabilities
|
567
|
399
|
Most of the increase, in the amount of about NIS 151 million, stems from a commitment in respect of an agreement with a tax partner in the Stagecoach project. For details – see Note 8A(4)
to the interim statements.
|
||||||
|
Liabilities for deferred taxes
|
495
|
498
|
|||||||
|
Total non-current liabilities
|
6,413
|
6,093
|
|||||||
|
Total liabilities
|
7,554
|
7,376
|
|||||||
|
Total equity
|
5,381
|
5,242
|
The increase in the equity stems mainly from other comprehensive income, in the amount of about NIS 113 million, deriving mostly from translation differences in respect of the activities in
the U.S., in the amount of about NIS 159 million, offset by the share in the other comprehensive loss of associated companies, in the amount of about NIS 56 million, stemming primarily from application of hedge accounting to transactions
hedging electricity margins in the U.S., issuance of equity to holders of non‑controlling interests in the U.S., in the amount of about NIS 34 million, net of a net loss of about NIS 12 million.
|
||||||
|
8.
|
Liquidity and sources of financing (in NIS millions)
|
|
For the
|
|||||||||
|
Six Months Ended
|
|||||||||
|
Category
|
06/30/2024
|
06/30/2023
|
Board’s Explanations
|
||||||
|
Cash flows provided by operating activities
|
327
|
160
|
Most of the increase in the cash flows provided by operating activities stems from an increase in cash‑basis income, in the amount of about NIS 133 million, an increase
in the Group’s working capital, in the amount of about NIS 11 million, and an increase in dividends from associated companies in the U.S., in the amount of about NIS 22 million.
|
||||||
|
Cash flows used in investing activities
|
(514
|
)
|
(1,316
|
)
|
Most of the decrease in the cash used in investing activities in the period of the report stems from the fact that in the corresponding period last year the Gat power plant and the Mountain
Wind project were acquired, for a consideration of about NIS 268 million and about NIS 625 million, respectively, and a subordinated loan was granted to an associated company in the U.S., in the amount of about NIS 87 million. On the other
hand, in the corresponding period last year the Group received cash, in the amounts of about NIS 125 million and about NIS 73 million, in respect of release of short‑term deposits and release of collaterals relating to hedging electricity
margins in the CPV Group, respectively.
|
||||
|
Cash flows provided by (used in) financing activities
|
(119
|
)
|
1,089
|
Most of the increase in the cash flows used financing activities stems from amounts received in the corresponding period last year: (1) about NIS 452 million, in respect of a swap of shares
of transaction and investment with Veridis; (2) long‑term loans, in the amounts of about NIS 450 million and about NIS 270 million, for purposes of financing the acquisition of the Gat power plant transaction and the acquisition of the
Mountain Wind transaction, respectively; and (3) a receipt, in the amount of about NIS 197 million, relating to withdrawals from Zomet’s financing agreement framework.
In addition, in the period of the report the Group repaid short‑term loans and frameworks, in the amount of about NIS 204 million, there was an increase in payments of debentures of about
NIS 80 million, there was an increase of about NIS 89 million relating to repayment of long‑term loans (including repayment of debt in Zomet, which started commercial operation at the end of the second quarter of 2023 and including early
repayment in Hadera, in the amount of about NIS 25 million), and there was also a decrease of about NIS 197 million in respect of investments and loans received from holders of non‑controlling interests (in the CPV Group).
On the other hand, in the corresponding period last year, the Group repaid a loan to the prior holders of the rights in the Gat power plant, in the amount of about NIS 303 million. In
addition, in the period of the report the Company raised about NIS 198 million, resulting from an issuance of debentures (Series D), received about NIS 152 million in respect of the investment of the tax partner in the Stagecoach project,
and there was a decline of about NIS 70 million in repayment of long‑terms loans to holders of non‑controlling interests in Israel.
|
|||||
|
8.
|
Liquidity and sources of financing (in NIS millions) (Cont.)
|
|
For the
|
|||||||||
|
Three Months Ended
|
|||||||||
|
Category
|
06/30/2024
|
06/30/2023
|
Board’s Explanations
|
||||||
|
Cash flows provided by operating activities
|
64
|
57
|
Most of the increase in the cash provided by operating activities stems from an increase in the income on a cash basis, in the amount of about NIS 50 million and an
increase in dividends from associated companies, in the amount of about NIS 4 million. On the other hand, there was a decrease in the Group’s working capital, in the amount of about NIS 49 million.
|
||||||
|
Cash flows used in investing activities
|
(267
|
)
|
(1,053
|
)
|
Most of the decrease in the cash flows used in investing activities stems from the fact that in the corresponding quarter last year the Company acquired the Mountain Wind project for a
consideration of about NIS 625 million and provided a subordinated loan to an associated company in the U.S., in the amount of about NIS 87 million. In addition, in the period of the report there was a decrease of about NIS 140 million in
investments in property, plant and equipment in Israel (mainly, in the Zomet project, the commercial operation of which started at the end of the second quarter of 2023). On the other hand, there was an increase in investments in fixed
assets in the U.S., in the amount of NIS 80 million.
|
||||
|
Cash flows provided by financing activities
|
78
|
310
|
Most of the decrease in the cash flows provided by financing activities stems from long‑term loans, in the amount of about NIS 270 million, for purposes of financing the Mountain Wind
acquisition transaction in the corresponding quarter last year, and from a receipt, in the amount of about NIS 97 million, relating to a withdrawal from the Zomet financing agreement framework in the corresponding quarter last year. On the
other hand, in the current quarter the Company received about NIS 152 million in respect of the signing of an agreement with a tax partner in the Stagecoach project.
|
||||||
|
9.
|
Adjusted financial debt, net
|
|
|
A. |
Compositions of the adjusted financial debt, net
|
|
As at June 30, 2024(1)
|
As at December 31, 2023(2)
|
|
|
4.9
|
4.9
|
|
|
(1) |
After elimination of debt under construction in the Renewable Energies segment in the U.S. of about NIS 235 million, as detailed in the following table.
|
|
|
(2) |
For details of the manner of the calculation – see Section 9A of the Report of the Board of Directors for 2023.
|
| 9. |
Adjusted financial debt, net (Cont.)
|
|
|
A. |
Compositions of the adjusted financial debt, net (Cont.)
|
|
Gross debt
|
||||||||||||||||||||||||||
|
Debt
|
Cash and cash
|
Derivative
|
||||||||||||||||||||||||
|
|
Method of
|
(including
|
equivalents
|
financial
|
||||||||||||||||||||||
|
|
presentation
|
interest
|
and deposits
|
instruments
|
||||||||||||||||||||||
|
|
in the
|
payable
|
Weighted-
|
Final
|
(including
|
for hedging
|
||||||||||||||||||||
|
|
Company’s
|
and
|
average
|
repayment
|
restricted cash
|
principal
|
||||||||||||||||||||
|
|
financial
|
deferred
|
interest
|
date of
|
used for debt
|
and/or
|
Net
|
|||||||||||||||||||
|
Name of project
|
statements
|
expenses)
|
rate
|
the loan
|
service) (1)
|
interest
|
debt
|
|||||||||||||||||||
|
Rotem
|
Consolidated
|
–
|
–
|
–
|
32
|
–
|
(32
|
)
|
||||||||||||||||||
|
Hadera
|
Consolidated
|
602
|
4.9
|
%
|
2037
|
69
|
41
|
492
|
||||||||||||||||||
|
Zomet (2)
|
Consolidated
|
1,093
|
6.55
|
%
|
2042
|
76
|
–
|
1,017
|
||||||||||||||||||
|
Gat (2)
|
Consolidated
|
433
|
6.65
|
%
|
2039
|
19
|
–
|
414
|
||||||||||||||||||
|
Headquarters and others – Israel (3)
|
Consolidated
|
9
|
57
|
–
|
(48
|
)
|
||||||||||||||||||||
|
Total Israel
|
2,137
|
6.1
|
%
|
253
|
41
|
1,843
|
||||||||||||||||||||
|
Keenan
|
Consolidated
|
269
|
3.4
|
%
|
2030
|
2
|
19
|
248
|
||||||||||||||||||
|
Mountain Wind
|
Consolidated
|
258
|
5.4
|
%
|
2028
|
13
|
9
|
236
|
||||||||||||||||||
|
Financing of renewable energy
|
||||||||||||||||||||||||||
|
projects (4)
|
Consolidated
|
364
|
7.1
|
%
|
2026
|
128
|
1
|
235
|
||||||||||||||||||
|
Total renewable energy
|
891
|
5.5
|
%
|
143
|
29
|
719
|
||||||||||||||||||||
|
Fairview (Cash Sweep 50%) (5)
|
Associate (25%)
|
308
|
6.7
|
%
|
06/2025
|
28
|
4
|
276
|
||||||||||||||||||
|
Towantic (Cash Sweep 100%) (6)
|
Associate (26%)
|
250
|
5.8
|
%
|
06/2025
|
12
|
–
|
238
|
||||||||||||||||||
|
Maryland (Cash Sweep 75%)
|
Associate (25%)
|
319
|
7.1
|
%
|
2028
|
25
|
9
|
285
|
||||||||||||||||||
|
Shore (7) (Cash Sweep 100%)
|
Associate (37.5%)
|
627
|
5.4
|
%
|
03+12/2025
|
|
113
|
11
|
503
|
|||||||||||||||||
|
Valley (Cash Sweep 100%)
|
Associate (50%)
|
741
|
10.8
|
%
|
05/2026
|
124
|
–
|
617
|
||||||||||||||||||
|
Three Rivers (Cash Sweep 100%)
|
Associate (10%)
|
270
|
5.3
|
%
|
2028
|
16
|
22
|
232
|
||||||||||||||||||
|
Total energy transition (8)
|
2,515
|
7.4
|
%
|
318
|
46
|
2,151
|
||||||||||||||||||||
|
Headquarters and others – U.S.
|
Consolidated
|
–
|
–
|
–
|
74
|
–
|
(74
|
)
|
||||||||||||||||||
|
Total U.S.
|
3,406
|
535
|
75
|
2,796
|
||||||||||||||||||||||
|
Total Energy headquarters (9)
|
1,977
|
2.5%–6.2% (weighted-average
3%)
|
306
|
–
|
1,671
|
|||||||||||||||||||||
|
Total
|
7,520
|
1,094
|
116
|
6,310
|
||||||||||||||||||||||
| (1) |
Includes restricted cash, in the amount of about NIS 53 million, in Hadera and in the energy transition segment, the amounts of about NIS 289 million.
|
| (2) |
For details regarding signing of two financing agreements in OPC Israel in the aggregate scope of about NIS 1.65 billion and early repayment of the project financing in Zomet and Gat subsequent to the date of the report – see Note 7A(2)
to the interim statements.
|
| (3) |
Includes mainly balances of cash and cash equivalents in OPC Israel Holdings and OPC Power Plants.
|
| (4) |
For details – see Note 16B(5) to the annual financial statements.
|
|
39
|
In addition, the Group has a liability to holders of non‑controlling interests, the balance of which as at June 30, 2024 is about NIS 498 million.
|
| 9. |
Adjusted financial debt, net (Cont.)
|
|
|
A. |
Compositions of the adjusted financial debt, net (Cont.)
|
| (5) |
Subsequent to the date of the report, on August 14, 2024, Fairview completed an undertaking in a refinancing agreement that includes the following main terms:
|
|
|
a. |
The scope of the liabilities is about NIS 2,325 million ($625 million – the share of the CPV Group is about NIS 581 million (about $156 million)) which is composed
of the following loan and frameworks: a long‑term loan in the amount of $550 million, and accompanying credit frameworks in the amount of $75 million (working capital frameworks, letters of credit frameworks, etc.). The scope of the
long‑term loan granted under the new financing agreements includes the amount of about NIS 930 million (about U.S.$250 million) beyond the balance of the debt as at June 30, 2024. After payment of the transaction costs use of the cash
balances available for distribution, the amount of about NIS 955 million (about $257 million) will be distributed as a dividend to the partners that hold the project – the share of CPV is about NIS 238 million (about $64 million).
|
|
|
|
The final repayment dates of the long‑term loan and accompanying credit frameworks are August 14, 2031 and August 14, 2030, respectively.
|
|
|
b. |
The rate and scope of the repayment of the loan principal changes up to the final repayment date, based on a combination of the repayment (amortization) schedule (1% every year) and a “leveraged‑based cash sweep mechanism” (in the range
of 25%–75% based on the ratio of the leverage in the project), which in the estimation of the CPV Group as at the approval date of the report amounts to, cumulatively, about 69% over the entire period of the loan40.
|
|
|
c. |
The interest rate on the long‑term loan principal is a SOFR‑based rate plus a margin of 3.5% and the interest rate on the accompanying credit frameworks is a SOFR‑based rate plus a margin of
3%.
|
|
|
d. |
The rest of the main conditions of the new financing agreement (grounds for calling for repayment, collaterals and additonal factors), are essentially the same as the conditions as stated in the prior financing agreement, as detailed in
Section 8.17.4 of Part A in the Periodic Report, however with an adjustment of the hedging requirement of a minimum interest rate to 50% of the nominal projected balance of the loan for a period of three years starting from the date of the
undertaking. Addition of a requirement for coverage of the debt service with a ratio of 1.10 in the last four quarters (pro‑rated) for the measurement periods ending December 2024, March 2025 and June 2025, and cancellation of the
requirement of compliance with a minimum debt coverage ratio for distribution.
|
| 40 |
It is clarified that the said estimate of the CPV Group includes “forward‑looking” information as it is defined in the Securities Law, regarding which there is no certainty it will be realized and its realization depends on market terms,
energy prices, availability of hedging transactions as well as additional factors that are not under the CPV Group’s control.
|
| 9. |
Adjusted financial debt, net (Cont.)
|
|
|
A. |
Compositions of the adjusted financial debt, net (Cont.)
|
| (6) |
The data shown in the above table relates to the financing agreement that ended on June 27, 2024, on which date Towantic completed an undertaking in a new financing agreement pursuant to the following main terms:
|
|
|
a. |
The scope of the liabilities is about NIS 1,360 million (U.S.$363 million – the share of the CPV Group is about U.S.$94 million), which is composed of the following loans and frameworks: a Term A loan in the amount of $265 million, and
accompanying credit frameworks in the amount of $98 million (working capital frameworks, letters of credit frameworks, etc.).
|
|
|
b. |
The final repayment date of the loans and accompanying credit frameworks is June 30, 2029.
|
|
|
c. |
The rate and scope of the repayment of the loan principal changes up to the final repayment date, based on a combination of the repayment schedule and a “targeted debt balance cash sweep” that cumulatively amounts to about 30.5% over the
period of the loan. In addition, an additional cash sweep mechanism (from 25% up to 100%) will enter into effect during the period if Towantic does not comply with the cumulative defined minimum revenue requirements pursuant to the new
financing agreement. As at the date of the report, Towantic estimates that it will comply with the said defined revenue requirements41.
|
|
|
d. |
The interest rate on the loan principal and the accompanying credit frameworks is a SOFR‑based rate plus a margin of 3.75% (4% in the fifth year from the closing date of the agreement42.
|
| (7) |
It is noted that as part of the financing agreements, an historical debt‑service coverage ratio financial covenant of 1:1 during the last four quarters was determined for Shore. As at the date of the report, Shore is in compliance with
the covenant (1.24).
For details regarding disclosure included in the financial statements of Shore as at June 30, 2024, which are attached to the Company’s interim financial statements, relating to
circumstances that raise material doubts with respect to the ability of Shore to continue to operate as a “going concern” – see Note 11 to the interim financial statements.
|
| (8) |
The rate (%) of the Cash Sweep mechanism is in accordance with the estimate of the CPV Group and it could change based on the provisions of the financing agreements of the projects.
|
| (9) |
Includes balances of debt and cash in the Company and cash in ICG Energy Inc. (available for use for all the Group’s needs).
|
|
41
|
It is clarified that the said estimate of the CPV Group includes “forward‑looking” information as it is defined in the Securities Law, regarding which there is no certainty it will be
realized and its realization depends on market terms, energy prices, availability of hedging transactions as well as additional factors that are not under the CPV Group’s control. Ultimately, the scope of the cash‑sweep could apply in
full and there could also be an increase in the margin, as stated below.
|
| 42 |
An additional cumulative margin could be added during the period if Towantic does not comply with the defined minimum revenue requirements under the new financing agreement.
|
| 9. |
Adjusted financial debt, net (Cont.)
|
|
|
A. |
Compositions of the adjusted financial debt, net (Cont.)
|
|
Debt
|
Cash and cash
|
Derivative
|
||||||||||||||||
|
|
Method of
|
(including
|
equivalents
|
financial
|
||||||||||||||
|
|
presentation
|
interest
|
and deposits
|
instruments
|
||||||||||||||
|
|
in the
|
payable
|
(including
|
for hedging
|
||||||||||||||
|
|
Company’s
|
and
|
restricted cash
|
principal
|
||||||||||||||
|
|
financial
|
deferred
|
used for debt
|
and/or
|
Net
|
|||||||||||||
|
Name of project
|
statements
|
expenses)
|
service)
|
interest
|
debt
|
|||||||||||||
|
Rotem
|
Consolidated
|
–
|
9
|
–
|
(9
|
)
|
||||||||||||
|
Hadera
|
Consolidated
|
642
|
98
|
37
|
507
|
|||||||||||||
|
Zomet
|
Consolidated
|
1,111
|
94
|
–
|
1,017
|
|||||||||||||
|
Gat
|
Consolidated
|
434
|
12
|
–
|
422
|
|||||||||||||
|
Headquarters and others – Israel
|
Consolidated
|
202
|
160
|
–
|
42
|
|||||||||||||
|
Total Israel
|
2,389
|
373
|
37
|
1,979
|
||||||||||||||
|
Keenan
|
Consolidated
|
285
|
1
|
18
|
266
|
|||||||||||||
|
Mountain Wind
|
Consolidated
|
256
|
11
|
4
|
241
|
|||||||||||||
|
Financing construction of renewable
|
||||||||||||||||||
|
energy projects
|
Consolidated
|
329
|
327
|
(7
|
)
|
9
|
||||||||||||
|
Total renewable energy
|
870
|
339
|
15
|
516
|
||||||||||||||
|
Fairview
|
Associate
|
334
|
25
|
6
|
303
|
|||||||||||||
|
Towantic
|
Associate
|
339
|
44
|
7
|
288
|
|||||||||||||
|
Maryland
|
Associate
|
304
|
26
|
8
|
270
|
|||||||||||||
|
Shore
|
Associate
|
599
|
105
|
19
|
475
|
|||||||||||||
|
Valley
|
Associate
|
708
|
66
|
–
|
642
|
|||||||||||||
|
Three Rivers
|
Associate
|
271
|
21
|
20
|
230
|
|||||||||||||
|
Total energy transition
|
2,555
|
287
|
60
|
2,208
|
||||||||||||||
|
Headquarters and others – U.S.
|
Consolidated
|
–
|
12
|
–
|
(12
|
)
|
||||||||||||
|
Total U.S.
|
3,425
|
638
|
75
|
2,712
|
||||||||||||||
|
Total Energy headquarters
|
1,853
|
336
|
–
|
1,517
|
||||||||||||||
|
Total
|
7,667
|
1,347
|
112
|
6,208
|
||||||||||||||
|
|
B. |
Interest and linkage bases
|
|
|
C. |
Financial covenants
|
|
43
|
For a description of the main provisions of material loans of the Company and the investee companies – see Note 16 to the annual financial
statements.
|
| 9. |
Adjusted financial debt, net (Cont.)
|

| (*) |
Includes the amount of about NIS 101 million in respect of current payments and the amount of about NIS 495 million in respect of payments relating to construction projects.
|
| (**) |
In respect of translation of the net financial debt of the U.S. which is denominated in dollars into the Company’s functional currency.
|
|
10.
|
Additional events in the Company’ areas of activities in the period of the report and thereafter
|
|
|
Activities in Israel
|
|
|
A. |
Hadera 2 – further to that stated in Section 7.3.15 of Part A of the Periodic Report for 2023, on April 17, 2024 the Government of Israel rejected the plan. Subsequent to the period of the report, Hadera 2 submitted a petition to
the High Court of Justice for cancellation of the Government’s decision. For additional details – see Note 10F to the interim statements.
|
|
|
B. |
Sorek tender – further to that stated in Section 7.3.6 of Part A of the Periodic Report for 2023, on March 18, 2024 the Electricity Authority published a decision regarding “qualification of bidders in the Sorek tender to receive
a generation license considering sectorial and economy‑wide business concentration aspects” whereby it was decided that OPC Power Plants is in compliance with the requirements of the Electricity Sector Regulations (Advancement of
Competition in the Generation Sector) (Temporary Order), 2021 regarding the Sorek tender, and the Authority accepted the recommendation of the Business Concentration Committee and determines that the bidders (including OPC Power Plants)
comply with the requirements regarding considerations of economy‑wide business concentration considerations. In addition, the submission date for the tender was updated by the Tenders Committee to September 26, 2024.
|
|
|
Activities in the U.S.
|
|
|
C. |
Undertaking in an agreement for acquisition and a memorandum of understanding with an increase in holdings in two power plants in the energy transition area in
the U.S. – on July 19, 2024, the CPV Group signed a non‑binding memorandum of understanding with another party that includes a binding exclusivity period of 90 days (“the Memorandum of Understanding”) and also signed a binding
acquisition agreement with another party (“the Acquisition Agreement”) for acquisition, on a cumulative basis, of additional holdings in the Shore power plant (which should bring the total holdings of the CPV Group in the project to
about 70%) and the Maryland power plant (which should bring the total holdings of the CPV Group in the project to about 75%1) (“the Transactions”).
|
|
|
D. |
Undertaking in binding agreements with Harrison Street for investment of $300 million in renewable energy activities in the U.S. – for details, see Note 10J to the interim statements.
|
|
44
|
As at the date of the report, the Acquisition Agreement was signed with reference to acquisition of 25% of the Maryland power plant.
|
|
45
|
The above‑mentioned amount includes an estimated amount for purposes of reduction of the leverage expected to be provided by the CPV Group (including amounts from the Company), as the
holder of the equity rights in the enlarged holdings in Shore (if completed). As at the date of the report, there is no certainty regarding the amount that will be provided by the holders of the equity rights in order to reduce the
leverage as stated. For additional details – see Note 11 to the interim financial statements.
|
| 11. |
Debentures (Series B, Series C and Series D)
|
| 12. |
Impacts of changes in the macro‑economic environment on the Group’s activities and its results
|
| 13. |
The significance of the war in Israel to the Group’s business activities
|
|
14.
|
Corporate Governance
|
|
|
A. |
Internal Auditor
|
|
Name of the Internal Auditor
|
Mr. Eyal Baasch (“the Internal Auditor”)
|
|
Education and professional experience
|
Certified Internal Auditor (C.I.A.); Certified Risk Management Auditor (CRMA).
Bachelor’s degree in Corporate Sciences (Extended Economics) – Hebrew University in Jerusalem; Master’s degree in Business Administration (MBA) (specialization in
accounting and finance) from the College of Administration.
Since 2012 he is a partner in the area of risk management and economics in the Office of Rosenbloom – Holzman, CPAs. Possesses extensive professional experience in
the area of internal auditing.
|
|
Start date of service
|
August 13, 2024.
|
|
Compliance with legal requirements
|
To the best of the Company’s knowledge, according to the declaration of the Internal Auditor, the Internal Auditor meets the requirements of Section 146(B) of the
Companies Law and the provisions of Section 8 of the Internal Audit Law, 1992.
|
|
Employment format
|
The Internal Auditor provides the Company internal audit services and he is not an employee of the Company in a full‑time position. In addition, he does not hold an
additional position in the Company aside from his service as the Internal Auditor.
|
|
Manner of appointment
|
The appointment of the Internal Auditor was approved by the Board of Directors on August 13, 2024, after a recommendation of the Audit Committee on August 11, 2024.
The Company’s Audit Committee and Board of Directors examined his qualifications, education and experience in internal auditing.
|
|
Other relationships the Internal Auditor has with the Company
|
To the best of the Company’s knowledge, the Internal Auditor does not hold securities of the Company.
The Internal Auditor is not an interested party in the Company or a relative of an interested party in the Company and is not a relative of the auditing CPA or a
party on its behalf.
|
|
Remuneration
|
The fee of the Internal Auditor in respect of the services he will provide to the Company, will be paid to him on an hourly basis and the scope thereof that will be
determined based on the scope of the work hours determined in accordance with the annual work plan.
|
|
14.
|
Corporate Governance (Cont.)
|
|
|
B. |
Further to that stated in Section 8.18 of Part A of the Periodic Report (Human Resources of the CPV Group):
|
|
|
C. |
Undertaking to purchase an insurance policy covering directors and officers – on March 31, 2024, a decision of the Board of Directors entered into effect (after approval by the Remuneration Committee) in connection with renewal of
the Company’s undertaking to purchase an insurance policy covering directors and officers46, this being in accordance with the provisions of the Companies Regulations (Leniencies in Transactions with Interested Parties), 200047
and the provisions of the Company’s remuneration policy48. For additional details – see the Company’s Immediate Report dated March 31, 2024 (Reference No.: 2024‑01‑035499).
|
| 46 |
Including Side A coverage.
|
|
47
|
Regulation 1B(1) and Regulations 1A(1)–1B(5) of the Leniency Regulations with respect to the Company’s CEO and officers that the controlling shareholder could be considered as having a
personal interest in their remuneration.
|
|
48
|
Regarding the Company’s remuneration policy, including provisions relating insurance of officers’ liability – see Appendix A (including Section 17.1 of the policy) to the Report Summoning
the General Meeting published by the Company on June 6, 2021 (Reference No.: 2021‑01‑035761), which is included herein by means of reference.
|
| 15. |
Contributions policy
|
|
Recipient of the
|
Amount of the
|
Relationship to the
|
|||
|
Contribution
|
Contribution
|
Recipient of the Contribution
|
|||
|
“Password for Every Student” Society
|
1,000
|
“Password for Every Student” also receives contributions from parties related indirectly to the Company’s controlling
shareholder (including from the Israel Corporation Group). The Company’s CEO is a representative of the project’s Steering Committee without compensation.
|
|||
|
“Rahashei Lev” Society
|
300
|
For the sake of good order, it is noted that as the Company was informed, commencing from November 2022, the daughter of Mr. Yosef Tena, an external director of the
Company, is employed by the Tel‑Aviv Medical Center in the name of Sorosky.
|
|||
|
“Running to Give” Society
|
120
|
For the sake of good order, it is noted that a relative of the Company’s CEO serves as Chairman of the Society without compensation.
|
|||
|
16.
|
Material valuations
|
|
|
Acquisition of the Gat power plant transaction
|
|
Yair Caspi
|
Giora Almogy
|
|||
|
Chairman of the Board of Directors
|
CEO
|
| * |
Assumption of a thermal conversion ratio (heat rate) of 6.9 MMBTU/MWh for Maryland, Shore and Valley, and a thermal conversion ratio (heat rate) of 6.5 MMBTU/MWh for Three Rivers, Towantic and Fairview.
|
|
49
|
EOX is a subsidiary of a commodity broker, OTC Global Holdings, which publishes forward prices for the electricity and natural gas markets based on trading data in the futures markets.
The futures prices are an objective way of estimating the future expectation with respect to electricity and natural gas prices since they represent transactions with entities operating in these markets involving buying and selling
futures contracts at specific prices.
|
|
For the
|
||||||||||||
|
six-month
|
||||||||||||
|
period
|
For
|
For
|
||||||||||
|
July –
|
the
|
the
|
||||||||||
|
December
|
year
|
year
|
||||||||||
|
Power Plant
|
2024
|
2025
|
2026
|
|||||||||
|
Fairview
|
||||||||||||
|
Gas price (Texas Eastern M2, as of 2026: M3)
|
1.86
|
2.56
|
3.51
|
|||||||||
|
Electricity price (AEP Dayton (AD))
|
42.56
|
44.68
|
46.70
|
|||||||||
|
Electricity margin
|
30.47
|
28.02
|
23.87
|
|||||||||
|
Towantic
|
||||||||||||
|
Gas price (Algoniquin City Gate)
|
3.62
|
5.64
|
5.92
|
|||||||||
|
Electricity price (Mass Hub)
|
54.33
|
66.92
|
62.97
|
|||||||||
|
Electricity margin
|
30.81
|
30.25
|
24.51
|
|||||||||
|
Maryland
|
||||||||||||
|
Gas price (Transco Zone 5)
|
2.95
|
3.99
|
4.36
|
|||||||||
|
Electricity price (PJM West Hub)
|
48.22
|
50.81
|
53.95
|
|||||||||
|
Electricity margin
|
27.86
|
23.30
|
23.87
|
|||||||||
|
Shore
|
||||||||||||
|
Gas price (Texas Eastern M3)
|
2.13
|
3.16
|
3.51
|
|||||||||
|
Electricity price (PJM West Hub)
|
48.22
|
50.81
|
53.95
|
|||||||||
|
Electricity margin
|
33.51
|
29.02
|
29.72
|
|||||||||
|
Valley
|
||||||||||||
|
Gas price (Texas Eastern M3 – 70%, Dominion South Pt – 30%)
|
2.05
|
2.96
|
3.28
|
|||||||||
|
Electricity price (New York Zone G)
|
47.30
|
56.65
|
59.97
|
|||||||||
|
Electricity margin
|
33.15
|
39.21
|
37.31
|
|||||||||
|
Three Rivers
|
||||||||||||
|
Gas price (Chicago City Gate)
|
2.52
|
3.40
|
3.69
|
|||||||||
|
Electricity price (PJM ComEd)
|
41.47
|
42.49
|
43.97
|
|||||||||
|
Electricity margin
|
25.10
|
20.40
|
19.97
|
|||||||||
|
Transco
Zn5 Dlvd
M2M Fwd
|
Chicago
CG M2M
|
Texas
Eastern
M-2 M2M
Fwd
|
Algonqui n CG M2M Fwd
|
Dominion
S Pt
M2M Fwd
|
Texas
East ern M-3 M2M
Fwd
|
Mass
Hub M2M
OPk
|
Mass
Hub M2M
Pk
|
Contract Date
|
|
2.93
|
1.98
|
1.59
|
1.77
|
1.65
|
1.68
|
28.14
|
47.22
|
01/06/24
|
|
3.09
|
2.11
|
1.76
|
2.71
|
1.77
|
1.90
|
39.40
|
64.77
|
01/07/24
|
|
2.85
|
2.19
|
1.72
|
2.22
|
1.73
|
1.86
|
37.96
|
58.23
|
01/08/24
|
|
2.62
|
2.10
|
1.40
|
2.14
|
1.43
|
1.52
|
31.58
|
46.76
|
01/09/24
|
|
2.62
|
2.10
|
1.36
|
1.82
|
1.40
|
1.47
|
32.37
|
40.50
|
01/10/24
|
|
2.86
|
2.74
|
2.05
|
4.13
|
2.07
|
2.25
|
47.98
|
56.64
|
01/11/24
|
|
3.67
|
3.86
|
2.88
|
8.69
|
2.78
|
3.80
|
83.31
|
92.44
|
01/12/24
|
|
5.61
|
4.73
|
3.41
|
13.65
|
3.06
|
5.75
|
120.70
|
134.51
|
01/01/25
|
|
5.56
|
4.56
|
3.34
|
12.36
|
3.02
|
5.09
|
104.94
|
117.13
|
01/02/25
|
|
3.70
|
3.17
|
2.82
|
5.30
|
2.75
|
2.99
|
58.46
|
64.71
|
01/03/25
|
|
3.27
|
2.80
|
2.34
|
3.37
|
2.34
|
2.36
|
42.29
|
50.81
|
01/04/25
|
|
3.62
|
2.74
|
2.15
|
2.76
|
2.17
|
2.29
|
35.46
|
43.74
|
01/05/25
|
|
3.50
|
2.90
|
2.20
|
2.91
|
2.22
|
2.41
|
38.80
|
50.65
|
01/06/25
|
|
3.61
|
3.06
|
2.33
|
3.47
|
2.35
|
2.55
|
48.47
|
79.24
|
01/07/25
|
|
3.53
|
3.07
|
2.27
|
3.31
|
2.27
|
2.57
|
39.39
|
63.75
|
01/08/25
|
|
3.20
|
2.93
|
2.01
|
2.55
|
2.03
|
2.13
|
32.98
|
48.99
|
01/09/25
|
|
3.28
|
2.91
|
1.99
|
2.68
|
2.01
|
2.13
|
36.16
|
44.69
|
01/10/25
|
|
3.94
|
3.41
|
2.54
|
5.76
|
2.57
|
2.89
|
59.16
|
71.71
|
01/11/25
|
|
5.02
|
4.51
|
3.37
|
9.58
|
3.30
|
4.74
|
82.29
|
98.01
|
01/12/25
|
|
6.30
|
5.36
|
4.04
|
14.23
|
3.65
|
6.66
|
116.22
|
135.760
|
01/01/26
|
|
5.65
|
5.11
|
3.82
|
12.99
|
3.48
|
6.04
|
110.19
|
117.60
|
01/02/26
|
|
4.60
|
3.57
|
3.15
|
6.11
|
3.06
|
3.36
|
48.27
|
62.12
|
01/03/26
|
|
3.70
|
3.03
|
2.49
|
3.62
|
2.49
|
2.58
|
37.68
|
43.76
|
01/04/26
|
|
3.88
|
2.88
|
2.29
|
3.01
|
2.35
|
2.47
|
34.11
|
40.39
|
01/05/26
|
|
3.85
|
3.03
|
2.36
|
3.12
|
2.39
|
2.58
|
35.59
|
47.19
|
01/06/26
|
|
4.08
|
3.24
|
2.56
|
3.60
|
2.56
|
2.85
|
44.27
|
73.68
|
01/07/26
|
|
3.97
|
3.26
|
2.46
|
3.51
|
2.47
|
2.81
|
42.05
|
66.59
|
01/08/26
|
|
3.52
|
3.20
|
2.11
|
2.90
|
2.16
|
2.37
|
36.67
|
46.90
|
01/09/26
|
|
3.52
|
3.20
|
2.21
|
3.00
|
2.18
|
2.34
|
39.16
|
42.11
|
01/10/26
|
|
3.75
|
3.72
|
2.77
|
5.33
|
2.78
|
3.06
|
48.07
|
60.87
|
01/11/26
|
|
5.47
|
4.71
|
3.59
|
9.60
|
3.47
|
5.01
|
65.22
|
79.99
|
01/12/26
|
|
East NY
ZnG M2M
OPk
|
East NY
ZnG M2M
Pk
|
PJM
ComEd
M2MS
OPk
|
PJM
ComEd
M2MS Pk
|
AEP-
Dayton
M2M OPk
|
AEP-
Dayton
M2M Pk
|
PJM
West
M2M OPk
|
PJM
West
M2M Pk
|
Contract Date
|
|
27.49
|
44.33
|
18.96
|
36.27
|
23.17
|
39.27
|
22.53
|
40.75
|
01/06/24
|
|
36.32
|
61.63
|
30.02
|
59.94
|
31.12
|
62.93
|
32.70
|
65.84
|
01/07/24
|
|
34.66
|
56.18
|
28.63
|
54.38
|
30.12
|
56.54
|
31.20
|
60.03
|
01/08/24
|
|
28.61
|
43.58
|
22.17
|
42.41
|
27.09
|
46.93
|
29.22
|
50.26
|
01/09/24
|
|
28.09
|
37.08
|
24.12
|
37.99
|
29.86
|
43.21
|
31.45
|
46.09
|
01/10/24
|
|
39.99
|
48.52
|
30.35
|
39.39
|
36.28
|
44.12
|
38.79
|
47.76
|
01/11/24
|
|
57.51
|
68.06
|
33.18
|
44.04
|
39.92
|
48.04
|
43.62
|
52.81
|
01/12/24
|
|
91.77
|
103.16
|
44.53
|
57.46
|
50.25
|
62.17
|
57.75
|
70.05
|
01/01/25
|
|
77.79
|
92.15
|
35.18
|
48.09
|
40.89
|
52.19
|
48.39
|
60.37
|
01/02/25
|
|
45.37
|
52.79
|
30.32
|
39.43
|
37.70
|
44.22
|
38.26
|
47.90
|
01/03/25
|
|
37.89
|
45.80
|
24.77
|
36.83
|
32.66
|
42.41
|
33.32
|
44.79
|
01/04/25
|
|
32.63
|
41.87
|
25.79
|
39.99
|
31.17
|
45.37
|
31.79
|
48.11
|
01/05/25
|
|
34.43
|
44.71
|
24.66
|
44.71
|
28.26
|
48.62
|
30.32
|
51.52
|
01/06/25
|
|
41.78
|
76.31
|
33.49
|
66.61
|
35.49
|
68.79
|
37.85
|
72.60
|
01/07/25
|
|
35.94
|
56.54
|
29.43
|
60.65
|
31.23
|
61.72
|
33.13
|
64.52
|
01/08/25
|
|
31.92
|
48.90
|
25.72
|
45.69
|
30.19
|
51.13
|
32.35
|
53.62
|
01/09/25
|
|
33.47
|
40.94
|
25.14
|
39.67
|
31.10
|
46.17
|
34.08
|
49.43
|
01/10/25
|
|
45.42
|
58.27
|
30.35
|
41.16
|
36.87
|
46.70
|
40.61
|
50.35
|
01/11/25
|
|
66.90
|
73.98
|
33.74
|
43.11
|
41.40
|
49.62
|
46.85
|
55.32
|
01/12/25
|
|
94.83
|
114.87
|
45.04
|
58.91
|
51.26
|
65.32
|
60.56
|
75.14
|
01/01/26
|
|
90.56
|
95.72
|
41.09
|
49.49
|
46.80
|
54.54
|
56.05
|
64.86
|
01/02/26
|
|
45.31
|
53.74
|
29.32
|
40.54
|
34.43
|
45.16
|
41.01
|
50.68
|
01/03/26
|
|
36.78
|
44.16
|
26.97
|
38.59
|
31.58
|
42.30
|
34.27
|
46.98
|
01/04/26
|
|
35.02
|
43.06
|
25.70
|
41.85
|
29.56
|
45.87
|
32.50
|
50.24
|
01/05/26
|
|
38.30
|
49.30
|
28.27
|
47.54
|
31.61
|
51.06
|
32.37
|
54.42
|
01/06/26
|
|
49.39
|
76.44
|
32.82
|
69.27
|
37.98
|
73.63
|
40.77
|
77.35
|
01/07/26
|
|
46.82
|
70.85
|
30.58
|
61.17
|
35.29
|
65.43
|
37.92
|
69.85
|
01/08/26
|
|
36.82
|
50.22
|
26.42
|
46.85
|
31.43
|
53.53
|
33.92
|
56.64
|
01/09/26
|
|
38.10
|
42.57
|
25.75
|
40.66
|
33.89
|
47.73
|
36.07
|
50.89
|
01/10/26
|
|
44.36
|
55.35
|
30.33
|
41.75
|
38.18
|
48.62
|
41.22
|
52.34
|
01/11/26
|
|
63.76
|
76.47
|
35.59
|
45.62
|
45.17
|
53.26
|
50.55
|
58.94
|
01/12/26
|
|
OPC Energy Ltd.
Condensed Consolidated Interim
Financial Statements
As of June 30, 2024
(Unaudited)
|
| Page | |
|
F - 3
|
|
|
F - 4
|
|
|
F - 5
|
|
|
F - 7
|
|
|
F - 8
|
|
|
F - 9
|
|
|
F - 12
|
|
|
F - 14
|

|
|
(1) |
Independent auditors’ review report of August 18, 2024 on the Company’s condensed consolidated financial information as of June 30, 2024 and for the six- and three-month periods then ended.
|
|
|
(2) |
Independent auditors’ special report of August 18, 2024 on the Company’s separate interim financial information as of June 30, 2024, in accordance with Regulation 38D to the Securities Regulations (Periodic and Immediate Reports), 1970
and for the six- and three-month periods then ended.
|
|
June 30
|
June 30
|
December 31
|
||||||||||
|
2024
|
2023
|
2023
|
||||||||||
|
(Unaudited)
|
(Unaudited)
|
(Audited)
|
||||||||||
|
NIS million
|
NIS million
|
NIS million
|
||||||||||
|
Current assets
|
||||||||||||
|
Cash and cash equivalents
|
722
|
818
|
1,007
|
|||||||||
|
Short-term restricted deposits and cash
|
5
|
60
|
2
|
|||||||||
|
Trade receivables
|
360
|
277
|
247
|
|||||||||
|
Other receivables and debit balances
|
365
|
169
|
404
|
|||||||||
|
Short-term derivatives
|
13
|
14
|
12
|
|||||||||
|
Total current assets
|
1,465
|
1,338
|
1,672
|
|||||||||
|
Non‑current assets
|
||||||||||||
|
Long-term restricted deposits and cash
|
58
|
58
|
59
|
|||||||||
|
Long-term receivables and debit balances
|
183
|
187
|
190
|
|||||||||
|
Investments in associates
|
2,661
|
2,496
|
2,550
|
|||||||||
|
Deferred tax assets
|
38
|
25
|
57
|
|||||||||
|
Long-term derivatives
|
60
|
63
|
51
|
|||||||||
|
Property, plant & equipment
|
6,680
|
6,135
|
6,243
|
|||||||||
|
Right‑of‑use assets and deferred expenses
|
622
|
601
|
631
|
|||||||||
|
Intangible assets
|
1,168
|
1,067
|
1,165
|
|||||||||
|
Total non‑current assets
|
11,470
|
10,632
|
10,946
|
|||||||||
|
Total assets
|
12,935
|
11,970
|
12,618
|
|||||||||
|
June 30
|
June 30
|
December 31
|
||||||||||
|
2024
|
2023
|
2023
|
||||||||||
|
(Unaudited)
|
(Unaudited)
|
(Audited)
|
||||||||||
|
NIS million
|
NIS million
|
NIS million
|
||||||||||
|
Current liabilities
|
||||||||||||
|
Loans and credit from banking corporations and financial institutions (including current maturities)
|
146
|
183
|
391
|
|||||||||
|
Current maturities of debt from non‑controlling interests
|
29
|
33
|
32
|
|||||||||
|
Current maturities of debentures
|
202
|
113
|
192
|
|||||||||
|
Trade payables
|
319
|
377
|
257
|
|||||||||
|
Payables and credit balances
|
438
|
487
|
403
|
|||||||||
|
Short-term derivatives
|
7
|
3
|
8
|
|||||||||
|
Total current liabilities
|
1,141
|
1,196
|
1,283
|
|||||||||
|
Non‑current liabilities
|
||||||||||||
|
Long-term loans from banking corporations and financial institutions
|
2,880
|
2,555
|
2,865
|
|||||||||
|
Long-term debt from non-controlling interests
|
469
|
400
|
422
|
|||||||||
|
Debentures
|
1,756
|
1,735
|
1,647
|
|||||||||
|
Long-term lease liabilities
|
201
|
209
|
204
|
|||||||||
|
Long-term derivatives
|
45
|
-
|
58
|
|||||||||
|
Other long‑term liabilities
|
567
|
146
|
399
|
|||||||||
|
Deferred tax liabilities
|
495
|
479
|
498
|
|||||||||
|
Total non-current liabilities
|
6,413
|
5,524
|
6,093
|
|||||||||
|
Total liabilities
|
7,554
|
6,720
|
7,376
|
|||||||||
|
Equity
|
||||||||||||
|
Share capital
|
2
|
2
|
2
|
|||||||||
|
Share premium
|
3,211
|
3,210
|
3,210
|
|||||||||
|
Capital reserves
|
619
|
645
|
523
|
|||||||||
|
Retained earnings
|
115
|
8
|
113
|
|||||||||
|
Total equity attributable to the Company’s shareholders
|
3,947
|
3,865
|
3,848
|
|||||||||
|
Non‑controlling interests
|
1,434
|
1,385
|
1,394
|
|||||||||
|
Total equity
|
5,381
|
5,250
|
5,242
|
|||||||||
|
Total liabilities and equity
|
12,935
|
11,970
|
12,618
|
|||||||||
|
Yair Caspi
|
Giora Almogy
|
Ana Berenshtein Shvartsman
|
||
|
Chairman of the Board of Directors
|
CEO
|
CFO
|
|
For the six-month period ended June 30
|
For the three-month period ended June 30
|
For the year ended
December 31
|
||||||||||||||||||
|
2024
|
2023
|
2024
|
2023
|
2023
|
||||||||||||||||
|
(Unaudited)
|
(Unaudited)
|
(Unaudited)
|
(Unaudited)
|
(Audited)
|
||||||||||||||||
|
NIS million
|
NIS million
|
NIS million
|
NIS million
|
NIS million
|
||||||||||||||||
|
Revenues from sales and provision of services
|
1,311
|
1,120
|
673
|
601
|
2,552
|
|||||||||||||||
|
Cost of sales and services (excluding depreciation and amortization)
|
(911
|
)
|
(834
|
)
|
(481
|
)
|
(470
|
)
|
(1,827
|
)
|
||||||||||
|
Depreciation and amortization
|
(155
|
)
|
(110
|
)
|
(81
|
)
|
(62
|
)
|
(288
|
)
|
||||||||||
|
Gross income
|
245
|
176
|
111
|
69
|
437
|
|||||||||||||||
|
General and administrative expenses
|
(119
|
)
|
(117
|
)
|
(58
|
)
|
(58
|
)
|
(212
|
)
|
||||||||||
|
Share in profits of associates
|
86
|
100
|
14
|
15
|
242
|
|||||||||||||||
|
Business development expenses
|
(22
|
)
|
(30
|
)
|
(10
|
)
|
(15
|
)
|
(58
|
)
|
||||||||||
|
Compensation for loss of income
|
26
|
-
|
-
|
-
|
41
|
|||||||||||||||
|
Other income (expenses), net
|
(52
|
)
|
(5
|
)
|
4
|
(5
|
)
|
(16
|
)
|
|||||||||||
|
Operating profit
|
164
|
124
|
61
|
6
|
434
|
|||||||||||||||
|
Finance expenses
|
(172
|
)
|
(110
|
)
|
(96
|
)
|
(63
|
)
|
(240
|
)
|
||||||||||
|
Finance income
|
23
|
37
|
8
|
8
|
43
|
|||||||||||||||
|
Finance expenses, net
|
(149
|
)
|
(73
|
)
|
(88
|
)
|
(55
|
)
|
(197
|
)
|
||||||||||
|
Profit (loss) before taxes on income
|
15
|
51
|
(27
|
)
|
(49
|
)
|
237
|
|||||||||||||
|
Tax benefit (income tax expenses)
|
(27
|
)
|
(12
|
)
|
-
|
9
|
(68
|
)
|
||||||||||||
|
Profit (loss) for the period
|
(12
|
)
|
39
|
(27
|
)
|
(40
|
)
|
169
|
||||||||||||
|
Attributable to:
|
||||||||||||||||||||
|
The Company’s shareholders
|
2
|
39
|
(16
|
)
|
(24
|
)
|
144
|
|||||||||||||
|
Non‑controlling interests
|
(14
|
)
|
-
|
(11
|
)
|
(16
|
)
|
25
|
||||||||||||
|
Profit (loss) for the period
|
(12
|
)
|
39
|
(27
|
)
|
(40
|
)
|
169
|
||||||||||||
|
Earnings (loss) per share attributable to the Company’s owners
|
||||||||||||||||||||
|
Basic and diluted earnings (loss) per share (in NIS)
|
0.01
|
0.18
|
(0.07
|
)
|
(0.10
|
)
|
0.63
|
|||||||||||||
|
For the six-month period ended June 30
|
For the three-month period ended June 30
|
For the year ended
December 31
|
||||||||||||||||||
|
2024
|
2023
|
2024
|
2023
|
2023
|
||||||||||||||||
|
(Unaudited)
|
(Unaudited)
|
(Unaudited)
|
(Unaudited)
|
(Audited)
|
||||||||||||||||
|
NIS million
|
NIS million
|
NIS million
|
NIS million
|
NIS million
|
||||||||||||||||
|
Profit (loss) for the period
|
(12
|
)
|
39
|
(27
|
)
|
(40
|
)
|
169
|
||||||||||||
|
Other comprehensive income items that, subsequent to initial recognition in comprehensive income, were or will be transferred to profit and loss
|
||||||||||||||||||||
|
Effective portion of the change in the fair value of cash flow hedges
|
25
|
17
|
7
|
13
|
(40
|
)
|
||||||||||||||
|
Net change in fair value of derivatives used to hedge cash flows recognized in the cost of the hedged item
|
-
|
(4
|
)
|
-
|
(1
|
)
|
(5
|
)
|
||||||||||||
|
Net change in fair value of derivatives used to hedge cash flows transferred to profit and loss
|
(8
|
)
|
(11
|
)
|
(6
|
)
|
(7
|
)
|
(20
|
)
|
||||||||||
|
Group’s share in other comprehensive loss of associates, net of tax
|
(56
|
)
|
(14
|
)
|
5
|
4
|
(48
|
)
|
||||||||||||
|
Foreign currency translation differences in respect of foreign operations
|
159
|
215
|
94
|
102
|
126
|
|||||||||||||||
|
Tax on other comprehensive income (loss) items
|
(7
|
)
|
(12
|
)
|
(3
|
)
|
(6
|
)
|
1
|
|||||||||||
|
Other comprehensive income for the period, net of tax
|
113
|
191
|
97
|
105
|
14
|
|||||||||||||||
|
Total comprehensive income for the period
|
101
|
230
|
70
|
65
|
183
|
|||||||||||||||
|
Attributable to:
|
||||||||||||||||||||
|
The Company’s shareholders
|
95
|
190
|
58
|
56
|
169
|
|||||||||||||||
|
Non‑controlling interests
|
6
|
40
|
12
|
9
|
14
|
|||||||||||||||
|
Comprehensive income for the period
|
101
|
230
|
70
|
65
|
183
|
|||||||||||||||
|
Attributable to the Company’s shareholders
|
||||||||||||||||||||||||||||||||||||
|
Share capital
|
Share premium
|
Capital reserves
|
Hedge fund
|
Foreign operations translation reserve
|
Retained earnings (retained loss)
|
Total
|
Non‑con-
trolling interests
|
Total equity
|
||||||||||||||||||||||||||||
|
NIS million
|
NIS million
|
NIS million
|
NIS million
|
NIS million
|
NIS million
|
NIS million
|
NIS million
|
NIS million
|
||||||||||||||||||||||||||||
|
(Unaudited)
|
||||||||||||||||||||||||||||||||||||
|
For the six-month period ended June 30, 2024
|
||||||||||||||||||||||||||||||||||||
|
Balance as of January 1, 2024
|
2
|
3,210
|
248
|
25
|
250
|
113
|
3,848
|
1,394
|
5,242
|
|||||||||||||||||||||||||||
|
Investments by holders of non-controlling interests in equity of subsidiary
|
-
|
-
|
-
|
-
|
-
|
-
|
-
|
34
|
34
|
|||||||||||||||||||||||||||
|
Share-based payment
|
-
|
-
|
4
|
-
|
-
|
-
|
4
|
-
|
4
|
|||||||||||||||||||||||||||
|
Exercised options and RSUs
|
*-
|
1
|
(1
|
)
|
-
|
-
|
-
|
-
|
-
|
-
|
||||||||||||||||||||||||||
|
Other comprehensive income (loss) for the period, net of tax
|
-
|
-
|
-
|
(27
|
)
|
120
|
-
|
93
|
20
|
113
|
||||||||||||||||||||||||||
|
Profit (loss) for the period
|
-
|
-
|
-
|
-
|
-
|
2
|
2
|
(14
|
)
|
(12
|
)
|
|||||||||||||||||||||||||
|
Balance as of June 30, 2024
|
2
|
3,211
|
251
|
(2
|
)
|
370
|
115
|
3,947
|
1,434
|
5,381
|
||||||||||||||||||||||||||
|
For the six-month period ended June 30, 2023
|
||||||||||||||||||||||||||||||||||||
|
Balance as of January 1, 2023
|
2
|
3,209
|
77
|
91
|
159
|
(31
|
)
|
3,507
|
859
|
4,366
|
||||||||||||||||||||||||||
|
Investments by holders of non-controlling interests in equity of subsidiary
|
-
|
-
|
-
|
-
|
-
|
-
|
-
|
196
|
196
|
|||||||||||||||||||||||||||
|
Share-based payment
|
-
|
-
|
5
|
-
|
-
|
-
|
5
|
1
|
6
|
|||||||||||||||||||||||||||
|
Exercised options and RSUs
|
*-
|
1
|
(1
|
)
|
-
|
-
|
-
|
-
|
-
|
-
|
||||||||||||||||||||||||||
|
Restructuring - share exchange and investment transaction with Veridis
|
-
|
-
|
163
|
-
|
-
|
-
|
163
|
289
|
452
|
|||||||||||||||||||||||||||
|
Other comprehensive income (loss) for the period, net of tax
|
-
|
-
|
-
|
(8
|
)
|
159
|
-
|
151
|
40
|
191
|
||||||||||||||||||||||||||
|
Profit for the period
|
-
|
-
|
-
|
-
|
-
|
39
|
39
|
-
|
39
|
|||||||||||||||||||||||||||
|
Balance as of June 30, 2023
|
2
|
3,210
|
244
|
83
|
318
|
8
|
3,865
|
1,385
|
5,250
|
|||||||||||||||||||||||||||
|
Attributable to the Company’s shareholders
|
||||||||||||||||||||||||||||||||||||
|
Share capital
|
Share premium
|
Capital reserves
|
Hedge fund
|
Foreign operations translation reserve
|
Retained earnings
|
Total
|
Non‑con-
trolling interests
|
Total equity
|
||||||||||||||||||||||||||||
|
NIS million
|
NIS million
|
NIS million
|
NIS million
|
NIS million
|
NIS million
|
NIS million
|
NIS million
|
NIS million
|
||||||||||||||||||||||||||||
|
(Unaudited)
|
||||||||||||||||||||||||||||||||||||
|
For the three-month period ended June 30, 2024
|
||||||||||||||||||||||||||||||||||||
|
Balance as of April 1, 2024
|
2
|
3,210
|
249
|
(5
|
)
|
299
|
131
|
3,886
|
1,388
|
5,274
|
||||||||||||||||||||||||||
|
Investments by holders of non-controlling interests in equity of subsidiary
|
-
|
-
|
-
|
-
|
-
|
-
|
-
|
34
|
34
|
|||||||||||||||||||||||||||
|
Share-based payment
|
-
|
-
|
3
|
-
|
-
|
-
|
3
|
-
|
3
|
|||||||||||||||||||||||||||
|
Exercised options and RSUs
|
*-
|
1
|
(1
|
)
|
-
|
-
|
-
|
-
|
-
|
-
|
||||||||||||||||||||||||||
|
Other comprehensive income for the period, net of tax
|
-
|
-
|
-
|
3
|
71
|
-
|
74
|
23
|
97
|
|||||||||||||||||||||||||||
|
Loss for the period
|
-
|
-
|
-
|
-
|
-
|
(16
|
)
|
(16
|
)
|
(11
|
)
|
(27
|
)
|
|||||||||||||||||||||||
|
Balance as of June 30, 2024
|
2
|
3,211
|
251
|
(2
|
)
|
370
|
115
|
3,947
|
1,434
|
5,381
|
||||||||||||||||||||||||||
|
For the three-month period ended June 30, 2023
|
||||||||||||||||||||||||||||||||||||
|
Balance as of April 1, 2023
|
2
|
3,209
|
244
|
78
|
243
|
32
|
3,808
|
1,341
|
5,149
|
|||||||||||||||||||||||||||
|
Investments by holders of non-controlling interests in equity of subsidiary
|
-
|
-
|
-
|
-
|
-
|
-
|
-
|
34
|
34
|
|||||||||||||||||||||||||||
|
Share-based payment
|
-
|
-
|
1
|
-
|
-
|
-
|
1
|
1
|
2
|
|||||||||||||||||||||||||||
|
Exercised options and RSUs
|
*-
|
1
|
(1
|
)
|
-
|
-
|
-
|
-
|
-
|
-
|
||||||||||||||||||||||||||
|
Other comprehensive income for the period, net of tax
|
-
|
-
|
-
|
5
|
75
|
-
|
80
|
25
|
105
|
|||||||||||||||||||||||||||
|
Loss for the period
|
-
|
-
|
-
|
-
|
-
|
(24
|
)
|
(24
|
)
|
(16
|
)
|
(40
|
)
|
|||||||||||||||||||||||
|
Balance as of June 30, 2023
|
2
|
3,210
|
244
|
83
|
318
|
8
|
3,865
|
1,385
|
5,250
|
|||||||||||||||||||||||||||
|
Attributable to the Company’s shareholders
|
||||||||||||||||||||||||||||||||||||
|
Share capital
|
Share premium
|
Capital reserves
|
Hedge fund
|
Foreign operations translation reserve
|
Retained earnings (retained loss)
|
Total
|
Non‑con-
trolling interests
|
Total equity
|
||||||||||||||||||||||||||||
|
NIS million
|
NIS million
|
NIS million
|
NIS million
|
NIS million
|
NIS million
|
NIS million
|
NIS million
|
NIS million
|
||||||||||||||||||||||||||||
|
(Audited)
|
||||||||||||||||||||||||||||||||||||
|
For the year ended December 31, 2023
|
||||||||||||||||||||||||||||||||||||
|
Balance as of January 1, 2023
|
2
|
3,209
|
77
|
91
|
159
|
(31
|
)
|
3,507
|
859
|
4,366
|
||||||||||||||||||||||||||
|
Investments by holders of non-controlling interests in equity
of subsidiary |
-
|
-
|
-
|
-
|
-
|
-
|
-
|
231
|
231
|
|||||||||||||||||||||||||||
|
Share-based payment
|
-
|
-
|
9
|
-
|
-
|
-
|
9
|
1
|
10
|
|||||||||||||||||||||||||||
|
Exercised options and RSUs
|
*-
|
1
|
(1
|
)
|
-
|
-
|
-
|
-
|
-
|
-
|
||||||||||||||||||||||||||
|
Restructuring - share exchange and investment transaction with Veridis
|
-
|
-
|
163
|
-
|
-
|
-
|
163
|
289
|
452
|
|||||||||||||||||||||||||||
|
Other comprehensive income (loss) for the year, net of tax
|
-
|
-
|
-
|
(66
|
)
|
91
|
-
|
25
|
(11
|
)
|
14
|
|||||||||||||||||||||||||
|
Profit for the year
|
-
|
-
|
-
|
-
|
-
|
144
|
144
|
25
|
169
|
|||||||||||||||||||||||||||
|
Balance as of December 31, 2023
|
2
|
3,210
|
248
|
25
|
250
|
113
|
3,848
|
1,394
|
5,242
|
|||||||||||||||||||||||||||
|
For the six-month period ended June 30
|
For the three-month period ended June 30
|
For the year ended
December 31
|
||||||||||||||||||
|
2024
|
2023
|
2024
|
2023
|
2023
|
||||||||||||||||
|
(Unaudited)
|
(Unaudited)
|
(Unaudited)
|
(Unaudited)
|
(Audited)
|
||||||||||||||||
|
NIS million
|
NIS million
|
NIS million
|
NIS million
|
NIS million
|
||||||||||||||||
|
Cash flows from operating activities
|
||||||||||||||||||||
|
Profit (loss) for the period
|
(12
|
)
|
39
|
(27
|
)
|
(40
|
)
|
169
|
||||||||||||
|
Adjustments:
|
||||||||||||||||||||
|
Depreciation and amortization
|
162
|
117
|
85
|
66
|
303
|
|||||||||||||||
|
Diesel fuel consumption
|
8
|
19
|
4
|
18
|
32
|
|||||||||||||||
|
Finance expenses, net
|
149
|
73
|
88
|
55
|
197
|
|||||||||||||||
|
Income tax expense (tax benefit)
|
27
|
12
|
-
|
(9
|
)
|
68
|
||||||||||||||
|
Share in profits of associates
|
(86
|
)
|
(100
|
)
|
(14
|
)
|
(15
|
)
|
(242
|
)
|
||||||||||
|
Other income (expenses), net
|
52
|
5
|
(4
|
)
|
5
|
16
|
||||||||||||||
|
Share-based payment transactions
|
10
|
17
|
4
|
8
|
(7
|
)
|
||||||||||||||
|
310
|
182
|
136
|
88
|
536
|
||||||||||||||||
|
Changes in trade and other receivables
|
(101
|
)
|
17
|
(140
|
)
|
(75
|
)
|
(22
|
)
|
|||||||||||
|
Changes in trade payables, service providers, other payables and long-term liabilities
|
96
|
(38
|
)
|
64
|
44
|
(25
|
)
|
|||||||||||||
|
(5
|
)
|
(21
|
)
|
(76
|
)
|
(31
|
)
|
(47
|
)
|
|||||||||||
|
Dividends received from associates
|
26
|
4
|
8
|
4
|
13
|
|||||||||||||||
|
Income tax paid
|
(4
|
)
|
(5
|
)
|
(4
|
)
|
(4
|
)
|
(7
|
)
|
||||||||||
|
Net cash provided by operating activities
|
327
|
160
|
64
|
57
|
495
|
|||||||||||||||
|
Cash flows used for investing activities
|
||||||||||||||||||||
|
Interest received
|
12
|
15
|
5
|
9
|
35
|
|||||||||||||||
|
Change in restricted deposits and cash, net
|
(1
|
)
|
(18
|
)
|
(1
|
)
|
(33
|
)
|
48
|
|||||||||||
|
Withdrawals into short-term deposits
|
-
|
125
|
-
|
-
|
125
|
|||||||||||||||
|
Release (provision) of short-term collateral, net
|
7
|
73
|
(3
|
)
|
-
|
110
|
||||||||||||||
|
Acquisition of subsidiaries, net of cash acquired
|
-
|
(893
|
)
|
-
|
(625
|
)
|
(1,172
|
)
|
||||||||||||
|
Investment in associates
|
(28
|
)
|
(8
|
)
|
(18
|
)
|
(4
|
)
|
(29
|
)
|
||||||||||
|
Subordinated long-term loans to Valley
|
-
|
(87
|
)
|
-
|
(87
|
)
|
(87
|
)
|
||||||||||||
|
Purchase of property, plant, and equipment, intangible assets and long-term deferred expenses
|
(505
|
)
|
(540
|
)
|
(251
|
)
|
(317
|
)
|
(1,223
|
)
|
||||||||||
|
Proceeds for derivatives, net
|
1
|
9
|
1
|
3
|
8
|
|||||||||||||||
|
Other
|
-
|
8
|
-
|
1
|
19
|
|||||||||||||||
|
Net cash used for investing activities
|
(514
|
)
|
(1,316
|
)
|
(267
|
)
|
(1,053
|
)
|
(2,166
|
)
|
||||||||||
|
For the six-month period ended June 30
|
For the three-month period ended June 30
|
For the year ended
December 31
|
||||||||||||||||||
|
2024
|
2023
|
2024
|
2023
|
2023
|
||||||||||||||||
|
(Unaudited)
|
(Unaudited)
|
(Unaudited)
|
(Unaudited)
|
(Audited)
|
||||||||||||||||
|
NIS million
|
NIS million
|
NIS million
|
NIS million
|
NIS million
|
||||||||||||||||
|
Cash flows provided by financing activities
|
||||||||||||||||||||
|
Proceeds of debenture issuance, net of issuance costs
|
198
|
-
|
-
|
-
|
-
|
|||||||||||||||
|
Receipt of long-term loans from banking corporations and financial institutions, net
|
35
|
895
|
2
|
351
|
1,242
|
|||||||||||||||
|
Receipt of long-term debt from non-controlling interests
|
24
|
45
|
11
|
10
|
110
|
|||||||||||||||
|
Investments by holders of non-controlling interests in equity of subsidiary
|
34
|
196
|
34
|
34
|
231
|
|||||||||||||||
|
Proceed in respect of restructuring - share exchange and investment transaction with Veridis
|
-
|
452
|
-
|
-
|
452
|
|||||||||||||||
|
Change in short term loans from banking corporations, net
|
(205
|
)
|
-
|
(2
|
)
|
-
|
231
|
|||||||||||||
|
Tax equity partner’s investment in US-based renewable energy projects
|
152
|
-
|
152
|
-
|
304
|
|||||||||||||||
|
Interest paid
|
(119
|
)
|
(59
|
)
|
(53
|
)
|
(25
|
)
|
(152
|
)
|
||||||||||
|
Repayment of long-term loans from banking corporations and others (*)
|
(126
|
)
|
(46
|
)
|
(64
|
)
|
(22
|
)
|
(144
|
)
|
||||||||||
|
Repayment of long-term loans as part of the acquisition of Gat
|
-
|
(303
|
)
|
-
|
-
|
(303
|
)
|
|||||||||||||
|
Repayment of long-term debt from non-controlling interests
|
(9
|
)
|
(74
|
)
|
-
|
(38
|
)
|
(123
|
)
|
|||||||||||
|
Repayment of debentures
|
(96
|
)
|
(16
|
)
|
-
|
-
|
(31
|
)
|
||||||||||||
|
Proceeds for derivatives, net
|
5
|
3
|
3
|
2
|
9
|
|||||||||||||||
|
Repayment of principal in respect of lease liabilities
|
(5
|
)
|
(4
|
)
|
(3
|
)
|
(2
|
)
|
(9
|
)
|
||||||||||
|
Other
|
(7
|
)
|
-
|
(2
|
)
|
-
|
-
|
|||||||||||||
|
Net cash provided by (used for) financing activities
|
(119
|
)
|
1,089
|
78
|
310
|
1,817
|
||||||||||||||
|
Net increase (decrease) in cash and cash equivalents
|
(306
|
)
|
(67
|
)
|
(125
|
)
|
(686
|
)
|
146
|
|||||||||||
|
Balance of cash and cash equivalents of the beginning of period
|
1,007
|
849
|
838
|
1,503
|
849
|
|||||||||||||||
|
Effect of exchange rate fluctuations on cash and cash equivalent balances
|
21
|
36
|
9
|
1
|
12
|
|||||||||||||||
|
Balance of cash and cash equivalents as of the end of the period
|
722
|
818
|
722
|
818
|
1,007
|
|||||||||||||||
|
|
A. |
Statement of compliance with International Financial Reporting Standards (IFRS)
|
|
|
B. |
Functional and presentation currency
|
|
|
C. |
Use of estimates and judgments
|
|
|
D. |
Reclassification
|
|
|
E. |
Seasonality
|
| A. |
The Group’s accounting policies in these condensed consolidated interim financial statements are the same as the policies applied to the Annual Financial Statements.
|
| B. |
New standards not yet adopted
|
|
For the six-month period ended June 30, 2024
|
||||||||||||||||||||||||
|
Israel
|
Energy Transition in the US
|
Renewable energies in the USA
|
Other activities in the USA
|
Adjust-ments to consoli-dated
|
Consoli-dated - total
|
|||||||||||||||||||
|
In NIS million
|
(Unaudited)
|
|||||||||||||||||||||||
|
|
||||||||||||||||||||||||
|
Revenues from sales and provision of services
|
1,074
|
880
|
139
|
98
|
(880
|
)
|
1,311
|
|||||||||||||||||
|
|
||||||||||||||||||||||||
|
EBITDA after adjusted proportionate consolidation1
|
286
|
288
|
63
|
(3
|
)
|
(291
|
)
|
343
|
||||||||||||||||
|
|
||||||||||||||||||||||||
|
Adjustments:
|
||||||||||||||||||||||||
|
Share in profits of associates
|
86
|
|||||||||||||||||||||||
|
General and administrative expenses at the US headquarters (not attributed to US segments)
|
(43
|
)
|
||||||||||||||||||||||
|
General and administrative expenses at the Company’s headquarters (not attributed to the operating segments)
|
(8
|
)
|
||||||||||||||||||||||
|
Total EBITDA
|
378
|
|||||||||||||||||||||||
|
|
||||||||||||||||||||||||
|
Depreciation and amortization
|
(162
|
)
|
||||||||||||||||||||||
|
Finance expenses, net
|
(149
|
)
|
||||||||||||||||||||||
|
Other expenses, net
|
(52
|
)
|
||||||||||||||||||||||
|
|
(363
|
)
|
||||||||||||||||||||||
|
|
||||||||||||||||||||||||
|
Profit before taxes on income
|
15
|
|||||||||||||||||||||||
|
|
||||||||||||||||||||||||
|
Expenses for income tax
|
(27
|
)
|
||||||||||||||||||||||
|
|
||||||||||||||||||||||||
|
Loss for the period
|
(12
|
)
|
||||||||||||||||||||||
|
For the six-month period ended June 30, 2023
|
||||||||||||||||||||||||
|
Israel
|
Energy Transition in the US
|
Renewable energies in the USA
|
Other activities in the USA
|
Adjust-ments to consoli-dated
|
Consoli-dated - total
|
|||||||||||||||||||
|
In NIS million
|
(Unaudited)
|
|||||||||||||||||||||||
|
|
||||||||||||||||||||||||
|
Revenues from sales and provision of services
|
998
|
748
|
67
|
55
|
(748
|
)
|
1,120
|
|||||||||||||||||
|
|
||||||||||||||||||||||||
|
EBITDA after adjusted proportionate consolidation1
|
210
|
268
|
19
|
(3
|
)
|
(270
|
)
|
224
|
||||||||||||||||
|
|
||||||||||||||||||||||||
|
Adjustments:
|
||||||||||||||||||||||||
|
Share in profits of associates
|
100
|
|||||||||||||||||||||||
|
Net pre-commissioning expenses of Zomet
|
(18
|
)
|
||||||||||||||||||||||
|
General and administrative expenses at the US headquarters (not attributed to US segments)
|
(47
|
)
|
||||||||||||||||||||||
|
General and administrative expenses at the Company’s headquarters (not attributed to the operating segments)
|
(13
|
)
|
||||||||||||||||||||||
|
Total EBITDA
|
246
|
|||||||||||||||||||||||
|
|
||||||||||||||||||||||||
|
Depreciation and amortization
|
(117
|
)
|
||||||||||||||||||||||
|
Finance expenses, net
|
(73
|
)
|
||||||||||||||||||||||
|
Other expenses, net
|
(5
|
)
|
||||||||||||||||||||||
|
|
(195
|
)
|
||||||||||||||||||||||
|
|
||||||||||||||||||||||||
|
Profit before taxes on income
|
51
|
|||||||||||||||||||||||
|
|
||||||||||||||||||||||||
|
Expenses for income tax
|
(12
|
)
|
||||||||||||||||||||||
|
|
||||||||||||||||||||||||
|
Profit for the period
|
39
|
|||||||||||||||||||||||
|
|
1 |
For a definition of EBITDA following adjusted proportionate consolidation, see Note 27 to the Annual Financial Statements.
|
|
For the three-month period ended June 30, 2024
|
||||||||||||||||||||||||
|
Israel
|
Energy Transition in the US
|
Renewable energies in the USA
|
Other activities in the USA
|
Adjust-ments to consoli-dated
|
Consoli-dated - total
|
|||||||||||||||||||
|
In NIS million
|
(Unaudited)
|
|||||||||||||||||||||||
|
Revenues from sales and provision of services
|
542
|
362
|
79
|
52
|
(362
|
)
|
673
|
|||||||||||||||||
|
EBITDA after adjusted proportionate consolidation1
|
116
|
109
|
35
|
2
|
(110
|
)
|
152
|
|||||||||||||||||
|
Adjustments:
|
||||||||||||||||||||||||
|
Share in profits of associates
|
14
|
|||||||||||||||||||||||
|
General and administrative expenses at the US headquarters (not allocated to segments)
|
(19
|
)
|
||||||||||||||||||||||
|
General and administrative expenses at the Company’s headquarters (not allocated to segments)
|
(5
|
)
|
||||||||||||||||||||||
|
Total EBITDA
|
142
|
|||||||||||||||||||||||
|
Depreciation and amortization
|
(85
|
)
|
||||||||||||||||||||||
|
Finance expenses, net
|
(88
|
)
|
||||||||||||||||||||||
|
Other income, net
|
4
|
|||||||||||||||||||||||
|
(169
|
)
|
|||||||||||||||||||||||
|
Loss before income taxes
|
(27
|
)
|
||||||||||||||||||||||
|
Loss for the period
|
(27
|
)
|
||||||||||||||||||||||
|
For the three-month period ended June 30, 2023
|
||||||||||||||||||||||||
|
Israel
|
Energy Transition in the US
|
Renewable energies in the USA
|
Other activities in the USA
|
Adjust-ments to consoli-dated
|
Consoli-dated - total
|
|||||||||||||||||||
|
In NIS million
|
(Unaudited)
|
|||||||||||||||||||||||
|
Revenues from sales and provision of services
|
534
|
251
|
40
|
27
|
(251
|
)
|
601
|
|||||||||||||||||
|
EBITDA after adjusted proportionate consolidation1
|
92
|
87
|
12
|
(3
|
)
|
(87
|
)
|
101
|
||||||||||||||||
|
Adjustments:
|
||||||||||||||||||||||||
|
Share in profits of associates
|
15
|
|||||||||||||||||||||||
|
Net pre-commissioning expenses of Zomet
|
(11
|
)
|
||||||||||||||||||||||
|
General and administrative expenses at the US headquarters (not allocated to segments)
|
(23
|
)
|
||||||||||||||||||||||
|
General and administrative expenses at the Company’s headquarters (not allocated to segments)
|
(6
|
)
|
||||||||||||||||||||||
|
Total EBITDA
|
76
|
|||||||||||||||||||||||
|
Depreciation and amortization
|
(65
|
)
|
||||||||||||||||||||||
|
Finance expenses, net
|
(55
|
)
|
||||||||||||||||||||||
|
Other expenses, net
|
(5
|
)
|
||||||||||||||||||||||
|
(125
|
)
|
|||||||||||||||||||||||
|
Loss before income taxes
|
(49
|
)
|
||||||||||||||||||||||
|
Tax benefit
|
9
|
|||||||||||||||||||||||
|
Loss for the period
|
(40
|
)
|
||||||||||||||||||||||
|
For the year ended December 31, 2023
|
||||||||||||||||||||||||
|
Israel
|
Energy Transition in the US
|
Renewable energies in the USA
|
Other activities in the USA
|
Adjust-ments to consoli-dated
|
Consoli-dated - total
|
|||||||||||||||||||
|
In NIS million
|
(Audited)
|
|||||||||||||||||||||||
|
Revenues from sales and provision of services
|
2,283
|
1,525
|
146
|
123
|
(1,525
|
)
|
2,552
|
|||||||||||||||||
|
EBITDA after adjusted proportionate consolidation1
|
580
|
577
|
31
|
6
|
(580
|
)
|
614
|
|||||||||||||||||
|
Adjustments:
|
||||||||||||||||||||||||
|
Share in profits of associates
|
242
|
|||||||||||||||||||||||
|
Net pre-commissioning expenses of Zomet
|
(18
|
)
|
||||||||||||||||||||||
|
General and administrative expenses at the US headquarters (not attributed to US segments)
|
(58
|
)
|
||||||||||||||||||||||
|
General and administrative expenses at the Company’s headquarters (not attributed to the operating segments)
|
(27
|
)
|
||||||||||||||||||||||
|
Total EBITDA
|
753
|
|||||||||||||||||||||||
|
Depreciation and amortization
|
(303
|
)
|
||||||||||||||||||||||
|
Finance expenses, net
|
(197
|
)
|
||||||||||||||||||||||
|
Other expenses, net
|
(16
|
)
|
||||||||||||||||||||||
|
(516
|
)
|
|||||||||||||||||||||||
|
Profit before taxes on income
|
237
|
|||||||||||||||||||||||
|
Expenses for income tax
|
(68
|
)
|
||||||||||||||||||||||
|
Profit for the year
|
169
|
|||||||||||||||||||||||
|
For the six-month period ended June 30
|
For the three-month period ended June 30
|
For the year ended
December 31
|
||||||||||||||||||
|
2024
|
2023
|
2024
|
2023
|
2023
|
||||||||||||||||
|
In NIS million
|
(Unaudited)
|
(Unaudited)
|
(Audited)
|
|||||||||||||||||
|
Revenues from sale of energy in Israel:
|
||||||||||||||||||||
|
Revenues from the sale of energy to private customers
|
605
|
624
|
305
|
324
|
1,424
|
|||||||||||||||
|
Revenues from energy sales to the System Operator and other suppliers
|
96
|
45
|
50
|
32
|
120
|
|||||||||||||||
|
Revenues from the sale of energy to the System Operator, at cogeneration tariff
|
25
|
20
|
6
|
10
|
82
|
|||||||||||||||
|
Income for capacity services
|
88
|
-
|
46
|
-
|
59
|
|||||||||||||||
|
Revenues from sale of steam in Israel
|
30
|
31
|
13
|
14
|
59
|
|||||||||||||||
|
Other income in Israel
|
23
|
43
|
16
|
35
|
59
|
|||||||||||||||
|
Total income from sale of energy and others in Israel (excluding infrastructure services)
|
867
|
763
|
436
|
415
|
1,803
|
|||||||||||||||
|
Revenues from private customers for infrastructure services
|
207
|
235
|
106
|
119
|
480
|
|||||||||||||||
|
Total income in Israel
|
1,074
|
998
|
542
|
534
|
2,283
|
|||||||||||||||
|
Revenues from sale of energy from renewable sources in the United States
|
125
|
60
|
69
|
36
|
136
|
|||||||||||||||
|
Revenues from provision of services and other revenues in the United States
|
112
|
62
|
62
|
31
|
133
|
|||||||||||||||
|
Total income in the USA
|
237
|
122
|
131
|
67
|
269
|
|||||||||||||||
|
Total income
|
1,311
|
1,120
|
673
|
601
|
2,552
|
|||||||||||||||
|
|
A. |
Further to Note 25E1 to the Annual Financial Statements regarding the completion of the transaction for the acquisition of the Gat Power Plant on March 30, 2023, during the reporting period, the Company completed the attribution of
the acquisition cost of the acquired identifiable assets and liabilities and no change took place therein compared with the amounts reported in the Annual Financial Statements.
|
|
|
B. |
Further to Notes 12D and 25A4 to the Financial Statements regarding the signing of a separation agreement between OPC Israel, the Founder and the additional shareholder in Gnrgy, and further to OPC Israel’s signing a non-binding
memorandum of understanding for the sale of Gnrgy’s shares to a third party, the memorandum of understanding with the third party did not amount to an agreement, and OPC Israel did not issue a notice about the purchase of the
Founder’s Gnrgy shares within the period set in the agreement, and on May 4, 2024 the right to purchase OPC Israel’s Gnrgy shares within the period and under the conditions set in the agreement was transferred to the Founder.
|
|
|
A. |
Significant events during and subsequent to the reporting period
|
|
|
1. |
Issuance of Debentures (Series D)
|
|
|
2. |
Banking financing agreements in OPC Israel
|
|
|
A. |
Significant events during and subsequent to the reporting period (cont.)
|
|
|
2. |
Banking financing agreements in OPC Israel (cont.)
|
|
Loan provision date
|
The Total Financing Commitments were advanced to the Borrower on the Financial Closing Date. The financing withdrawal and the actual execution of the Early Repayment of the Project
Credit will take place on August 15, 2024.
|
|
Principal terms
|
Principal of Financing Agreement 1: NIS 850 million.
Principal of Financing Agreement 2: NIS 800 million.
The loans’ principal will be repaid in quarterly installments from March 25, 2025 through December 25, 2033, as follows:0.5% in every
quarter in 2025; 0.75% in every quarter in 2026; 1% in every quarter in 2027-2029; 5% in every quarter in 2030-2032; 5.75% in every quarter in 2033.
|
|
Interest terms
|
The Financing Agreements bear annual interest at a rate based on Prime interest + a spread ranging from 0.3% to 0.4%.
The interest in respect of each loan will be repaid in quarterly installments from September 25, 2024 through December 25, 2033.
Furthermore, the Financing Agreements include additional interest as is generally accepted, which is payable upon the occurrence of default
events (with respect to additional interest due to temporary non-compliance with financial covenants which does not constitute default, see below) and in respect of failure to make payments on time (interest on arrears).
|
|
Collateral and pledges
|
Under the Financing Agreements, the Borrower undertook not to place liens on, or provide
collateral for, its assets, including its holdings in subsidiaries, except for certain allowed pledges as defined in the Financing Agreements, mostly for the
purpose of existing and/or future project financing (for the Hadera Power Plant) (if any), under the
defined terms and conditions.
Furthermore, the Borrower’s subsidiaries provided the Lenders with an undertaking not to take credit, excluding existing and/or future Project Credit (for the Hadera Power Plant) and except with
respect to activity in the ordinary course of business, all in accordance with the defined terms and conditions. In addition, company guarantees were provided to the Lenders by certain subsidiaries in which the Borrower has a 100%
stake (directly and/or indirectly).
|
|
Additional restrictions, liabilities and material conditions
|
The Financing Agreements include various undertakings of the Borrower and grounds, upon the fulfillment of which the Lenders will be allowed
to call for immediate repayment of the loans (subject to remediation periods or to amounts set if applicable under the circumstances),3 which include, among other things, failure to make payments in
respect of the loan on the dates which were set for that purpose, liquidation procedures, receivership, insolvency or debt arrangements of the Borrower at set forth in the Financing Agreements, change of control in the Company or the
Borrower under defined circumstances and conditions, certain events which have an adverse effect on the Borrower’s activity as set forth in the Financing Agreements, restructuring - except for certain defined exceptions, a change in the
area of activity of the Borrower under set conditions, restrictions on the sale of assets under set conditions, failure to comply with the following financial covenants in accordance with the terms and conditions which were set (except
for cases where a certain deviation does not constitute grounds subject to the provisions regarding additional interest as detailed below), and a cross-default clause where the Borrower’s debt is called for immediate repayment upon the
fulfillment of certain set terms and conditions.
In addition, provisions were set with regard to fees, as is generally accepted in financing agreements, including transaction and early
repayment fees. It is clarified that early repayment fees in respect of each loan (except for fees in respect of economic damage, as applicable) were set at levels which decrease gradually over the loan term, such that within a set
number of years no early repayment fees will apply.
|
|
Conditions for distribution
|
Distribution by the Borrower (including repayment of subordinated shareholder loans provided to the Borrower and/or its investees, excluding
the Rotem Loan) is subject to conditions generally accepted in financing agreements, and to compliance with the following financial covenants:
The ratio between the net financial debt less the financial debt designated for construction of the projects that have not yet started
generating EBITDA, and the adjusted EBITDA, as defined below, shall not exceed 7.
|
| 2 |
The Financing Agreements are separate and independent of each other; however, considering their similar characteristics, they are described collectively, where relevant.
|
|
3
|
In accordance with the Financing Agreements, some of the Borrower’s undertakings and grounds for immediate repayment (as detailed below) apply in respect of events of material
subsidiaries of the Borrower (which include, among other things, OPC Power Plants, Rotem, Zomet, etc.).
|
|
|
A. |
Significant events during and subsequent to the reporting period (cont.)
|
|
|
2. |
Banking financing agreements in OPC Israel (cont.)
|
|
Financial covenants
|
The financial covenants will be assessed at the end of each quarter (hereinafter - the “Measurement Date”), immediately after the approval
date of the financial statements of the Borrower. Following are the financial covenants applicable to the Borrower (on a consolidated basis) on each
measurement date in connection with each of the Financing Agreements:
• The ratio of the net financial debt(1) less financial debt designated for construction of the projects that have not yet started
generating EBITDA(2), and the adjusted EBITDA(3) shall not exceed 8 (hereinafter - “Debt to EBITDA Ratio”).
• The equity(4) to total assets(5) shall not fall below 20%.
• The Company's equity(4) will not fall below NIS 1.1 billion.
(1) Net financial debt - Total (1) long and short-term
interest-bearing debts (including the Borrower’s share in such debts of associates) to banking corporations, financial entities and any other entity engaged in the provision of loans; (2) shareholder loans, excluding subordinated
shareholder loans, as defined by the financing agreements, excluding the Rotem Loan;4 (3) plus and/or less principal and/or interest swaps at their nominal value (less and/or plus the deposits provided to secure them); and
(4) net of financial assets.
Financial assets - total (1) cash and cash equivalents and (2) deposits with banks and
financial institutions (excluding restricted deposits provided against a guarantee), provided that they are clear and free of any pledge, incumbrance and foreclosure. It is noted that cash and cash equivalents and deposits restricted
to the servicing of a financial debt shall constitute part of the financial assets.
(2) A financial debt designated for the construction of projects which
have not yet started generating EBITDA - (1) financial debt provided to a special-purpose corporation as part of project credit; or (2) in a project that was not pledged - the outstanding balance of a financial debt provided at
an amount that does not exceed the balance of actual investment in the project, provided that the aggregate amount will not exceed - on each measurement date - NIS 200 million; all of the above - in connection with a project that has
not yet reached commercial operation.
(3) Adjusted EBITDA - EBITDA in the four quarters preceding the
measurement date (including the Borrower’s share in the EBITDA of associates) net of other and/or one-off expenses or income and share-based payment. Plus:
(a) The annualized EBITDA5 of assets which commenced commercial operation during the four
quarters preceding the measurement date; and
(b) The annualized EBITDA of assets, which were purchased by the Borrower and/or investees as
part of an acquisition and/or merger transaction, the financial debt in respect of which was recognized upon their purchase.
(4) Equity capital - as per the Borrower’s consolidated financial
statements - attributable to the parent company’s shareholders, plus subordinated shareholder loans (but excluding the Rotem Loan).
(5) Total assets - as per the Borrower’s consolidated financial
statements.
It is noted that if the Borrower fails to comply with any financial covenants in a certain quarter at a range which does not exceed 10% of
the values set for the relevant covenant, the loan will bear additional interest at a rate set in the Financing Agreements as from the quarter in which the financial statements were published, according to which the Borrower failed to
comply the relevant covenants, up to a period of 2 (two) consecutive quarters. Provided that such a deviation period will not occur more often than a frequency set in the Financing Agreements, the failure to comply with such financial
covenants in the said period shall not be deemed a default event and shall not constitute grounds for calling for immediate repayment of the loan.
The actual amounts and/or ratios in respect of the abovementioned covenants as of June 30, 2024 are as follows:
|
|
Financial covenants (consolidated)1
|
Actual value
|
|
|
Borrower’s equity capital
|
Approx. NIS 2,486 million
|
|
|
The Borrower’s equity to asset ratio
|
45%
|
|
|
The Borrower’s net debt to adjusted EBITDA ratio
|
3.0
|
|
4
|
For details regarding the shareholder loan advanced to Rotem see Note 25D2 to the Annual Financial Statements.
|
|
5
|
Annualized EBITDA - the EBITDA divided by the number of days during the period commencing on the commercial operation/purchase date and ending
on the relevant measurement date, multiplied by 365.
|
|
6
|
The Borrower has a short term bank credit facility that include financial covenants that are not more stringent than the covenants detailed above.
|
|
A.
|
Significant events during and subsequent to the reporting period (cont.)
|
|
2.
|
Bank financing agreements in the US Renewable Energies Segment
|
|
Lenders
|
International financial corporations (hereinafter - the “Lenders”)
|
|
|
Total loans and credit facilities
|
Financing of construction (construction term loan) (will be converted into a loan on the commercial operation date (hereinafter - the
“Loan Conversion Date”): Up to approx. NIS 330 million (up to approx. USD 89 million).
Ancillary credit facilities: Up to approx. NIS 105 million (approx. USD 28 million).
Bridge loan (for the investment of the tax equity partner)2: Up to approx. NIS 580 million (up to approx. USD 157
million).
The withdrawal of the credit facilities is subject to compliance with the capital requirements as defined in the Financing Agreement.
|
|
|
Repayment dates
|
The final repayment date of the loan principal and credit facilities: 3 years from the Loan
Conversion Date.
The loan’s principal shall be paid in semi-annual payments in accordance with predefined amortization schedule and amounts, over a
period of three years after the Loan Conversion Date.
The final repayment date of the bridge loan (for the investment of the tax equity partner):
In principle, the date is in line with the Loan Conversion Date.
|
|
|
Interest terms and other costs
|
The interest is accrued during the construction period and paid in semi-annual payments during the commercial operation period. The
loans bear annual interest based on SOFR plus a spread, as follows:
Financing of construction: SOFR+1.75%.
Term loan: SOFR+1.875%.
Ancillary credit facilities: If they will be withdrawn - interest similar to that payable on the financing of construction or the
term loan, as applicable.
Bridge loan (for the investment of the tax equity partner): SOFR+1.50%.
Furthermore, fees and transaction costs will apply as is generally accepted in financing agreements of this type.
|
|
|
Additional material conditions
|
•
|
The financing agreement includes grounds for immediate repayment that are standard in project financing agreements of this type, including, inter alia – default events,
non‑compliance with certain obligations, various insolvency events, winding down of the project or termination of significant parties in the project (as defined in the agreement), occurrence of certain events relating to the
regulatory status of the project and holding approvals, certain changes in ownership of the project, certain events in connection with the project, and a situation wherein the project is not entitled to receive payments for capacity
and electricity – all in accordance with and subject to the terms and conditions, definitions and remediation periods detailed in the financing agreement. |
| • |
The project is pledged in favor of the Lenders in order to secure the liabilities in accordance with the Financing Agreement. |
|
| • |
It should be noted that the Keenan Financing Agreement includes, among other things, and as customary in agreements of this type, provisions regarding mandatory prepayments, fees and commissions in respect of credit facilities, annual fees relating to the issuance of LC and additional customary terms and conditions, including partial hedging of the base interest rate (SOFR) in accordance with the terms and conditions set forth in the Financing Agreement. | |
| • |
The execution of distributions is conditional upon the project’s compliance with certain conditions, including compliance with a minimum debt service coverage ratio of 1.20 during the four quarters that preceded the distribution (proportionately to the measurement period which is shorter than four quarters), and a condition whereby no grounds for repayment or default event exist (as defined in the Financing Agreement). | |
|
Collaterals, liens, guarantees
|
Collaterals and liens will be provided in favor of the Lenders on all of the projects’ assets and the rights arising therefrom, subject
to the terms and conditions set forth in the Financing Agreement.
|
|
| 7 |
As of the report approval date, the project is wholly-owned by CPV Group.
|
|
8
|
Furthermore, the Financing Agreement includes Tax Credit arrangements as an alternative to Tax Equity.
|
|
3.
|
(cont.)
Furthermore, the Company advanced to the project an interest-bearing shareholder loan at the total amount of up to approx. NIS 370 million (up to approx. USD 100 million), which was designated to
finance some of the project’s costs to be financed from own sources, and the said Company loan is expected to be repaid after the completion of the transaction in CPV Renewables as detailed in Note 10J below, if it is indeed
completed.
|
|
4.
|
On July 28, 2024, Maalot (S&P) reiterated the rating of the Company and its debentures at ‘ilA-’, and upgraded the outlook from negative to stable due to improvement in the
financial ratios.
|
|
|
5. |
Short-term credit facilities from Israeli banks:
|
|
Facility amount
|
Utilization as of the report date
|
|||||||
|
The Company
|
300
|
2021
|
||||||
|
OPC Israel
|
250
|
-
|
||||||
|
The Company for CPV Group (1)
|
Approx. 75 (approx. USD 20 million)
|
Approx. 60 (approx. USD 16 million)
|
||||||
|
CPV Group(1)
|
Approx. 282 (approx. USD 75 million)
|
Approx. 228 (approx. USD 61 million)
|
||||||
|
Total
|
907
|
309
|
||||||
|
|
(1) |
For the purpose of letters of credit and bank guarantees. The facilities provided for CPV Group are backed with a Company guarantee.
|
|
|
B. |
Changes in the Group’s material guarantees:
|
|
As of June 30, 2024
|
As of December 31, 2023
|
|||||||
|
NIS million
|
NIS million
|
|||||||
|
For operating projects in Israel (Rotem, Hadera, Zomet and the Gat Power Plant)
|
269
|
244
|
||||||
|
For projects under construction and development in Israel (Sorek 2 and consumers’ premises) (1)
|
108
|
47
|
||||||
|
For virtual supply activity in Israel
|
30
|
29
|
||||||
|
For operating projects in the US Renewable Energies Segment
|
172
|
189
|
||||||
|
For projects under construction and development in the USA (CPV Group) (2)
|
307
|
148
|
||||||
|
Total
|
886
|
657
|
||||||
|
|
(1) |
The increase arises mainly from the provision - to the Accountant General - of a NIS 45 million bank guarantee in connection with the financial closing of the Sorek 2 project.
|
|
|
(2) |
The increase arises mainly from the provision of bank guarantees in connection with PPAs and connection to the electrical grid in the Renewable Energies segment.
|
|
|
C. |
Financial covenants:
|
|
Ratio
|
Required value - Series B
|
Required value - Series C and D
|
Actual value
|
|||
|
Net financial debt (1) to adjusted EBITDA (2)
|
Will not exceed 13 (for distribution purposes - 11)
|
Will not exceed 13 (for distribution purposes - 11)
|
5.5
|
|||
|
The Company shareholders’ equity (separate)
|
Will not fall below NIS 250 million (for distribution purposes - NIS 350 million)
|
With respect to Debentures (Series C): will not fall below NIS 1 billion (for distribution purposes - NIS 1.4 billion)
With respect to Debentures (Series D): will not fall below NIS 2 billion (for distribution purposes - NIS 2.4 billion)
|
Approx. NIS 3,947 million
|
|||
|
The Company’s equity to asset ratio (separate)
|
Will not fall below 17% (for distribution purposes: 27%)
|
Will not fall below 20% (for distribution purposes - 30%)
|
66%
|
|||
|
The Company’s equity to asset ratio (consolidated)
|
--
|
Will not fall below 17%
|
42%
|
|
|
C. |
Financial covenants: (cont.)
|
|
Financial covenants
|
Breach ratio
|
Actual value
|
|||
|
Covenants applicable to Hadera in connection with the Hadera Financing Agreement
|
|||||
|
Minimum expected DSCR
|
1.10
|
1.18
|
|||
|
Average expected DSCR
|
1.10
|
1.89
|
|||
|
LLCR
|
1.10
|
1.84
|
|||
|
Covenants applicable to the Company in connection with the Hadera Equity Subscription Agreement
|
|||||
|
The Company shareholders’ equity (separate)
|
Will not fall below NIS 200 million
|
Approx. NIS 3,947 million
|
|||
|
The Company’s equity to asset ratio (separate)
|
Will not fall below 20%
|
66%
|
|||
|
Covenants applicable to Zomet in connection with the Zomet Financing Agreement
|
|||||
|
Historic ADSCR
|
1.05
|
1.30
|
|||
|
Expected ADSCR
|
1.05
|
1.37
|
|||
|
LLCR
|
1.05
|
1.45
|
|||
|
Covenants applicable to the Gat Partnership in connection with the Gat Financing Agreement
|
|||||
|
Historic DSCR
|
1.05
|
1.18
|
|||
|
Minimum expected DSCR
|
1.05
|
1.29
|
|||
|
Average expected DSCR
|
1.05
|
1.32
|
|||
|
LLCR
|
1.05
|
1.33
|
|||
|
Covenants applicable to OPC Power Plants (consolidated) in connection with the Gat Equity Subscription Agreement
|
|||||
|
OPC Power Plants’ total assets balance
|
Will not fall below than NIS 2,500 million
|
Approx. NIS 5,443 million
|
|||
|
OPC Power Plants’ equity to asset ratio
|
Will not fall below 15%
|
36%
|
|||
|
Ratio of net debt to adjusted EBITDA of OPC Power Plants
|
Will not exceed 12
|
3.4
|
|||
|
OPC Power Plants’ minimum cash balance
|
Will not fall below NIS 30 million
|
Approx. NIS 234 million
|
|||
|
OPC Power Plants’ minimum cash balance (”separate”)
|
Will not fall below NIS 20 million
|
Approx. NIS 26 million
|
|||
|
Covenants applicable to Rotem in connection with the Gat Equity Subscription Agreement
|
|||||
|
Rotem’s net debt to adjusted EBITDA ratio
|
Will not exceed 10
|
0.6
|
|||
|
Covenants applicable to the Company in connection with the Discount credit facility
|
|||||
|
The Company shareholders’ equity (separate)
|
Will not fall below NIS 1,000 million
|
Approx. NIS 3,947 million
|
|||
|
The Company’s equity to asset ratio (separate)
|
Will not fall below 20%
|
66%
|
|||
|
Covenants applicable to the Company in connection with the Mizrahi and Hapoalim credit facilities
|
|||||
|
The Company shareholders’ equity (separate)
|
Will not fall below NIS 1,200 million
|
Approx. NIS 3,947 million
|
|||
|
The Company’s equity to asset ratio (separate)
|
Will not fall below 30%
|
66%
|
|||
|
The Company’s net debt to adjusted EBITDA ratio
|
Will not exceed 12
|
5.5
|
|||
|
Covenants applicable to OPC Israel in connection with the Mizrahi and Hapoalim credit facilities
|
|||||
|
OPC Israel’s equity capital, including non-controlling interests
|
Will not fall below NIS 500 million
|
Approx. NIS 2,141 million
|
|||
|
OPC Israel’s equity to asset ratio (consolidated)
|
Will not fall below 20%
|
39%
|
|||
|
Ratio of net debt to adjusted EBITDA of OPC Israel
|
Will not exceed 10
|
3.4
|
|||
|
|
D. |
Shares issuance
|
|
|
E. |
Equity compensation plans
|
|
|
1. |
Below is information about allotments of offered securities in the reporting period:
|
|
Offerees and allotment date
|
No. of options at the grant date (in thousands)
|
Average fair value of each option at the grant date (in NIS) (*)
|
Exercise price per option (in NIS, unlinked)
|
Standard deviation (**)
|
Rate of risk-free interest rate (***)
|
Cost of benefit (in NIS million) (****)
|
||||||||||||||||
|
Executives, March 2024
|
497
|
9.77
|
25.19
|
33.85%-35.79
|
%
|
3.81%-3.91
|
%
|
Approx. 5
|
||||||||||||||
|
|
2. |
Issuance of shares in respect of share-based payment:
|
|
|
F. |
Profit participation plan for CPV Group employees
|
|
|
A. |
Commitments
|
|
|
1. |
On March 18, 2024, a wholly-owned partnership of OPC Israel (hereinafter - the “Partnership”) engaged with a third party in an agreement for the purchase of natural gas. The agreement will terminate on June 30, 2030 or at the
earlier of: the end of the consumption of the Total Contractual Quantity of approx. 0.46 BCM as set out in the agreement.
|
|
|
2. |
Further to Note 10E(1)A to the Annual Financial Statements regarding an agreement for the construction of the Zomet Power Plant (hereinafter - the “Construction Agreement”), in March 2024 an amendment to the Construction Agreement
was signed, under which, among other things, the Construction Contractor paid Zomet an approx. NIS 26 million (approx. USD 7 million) as compensation due to a delay in the commercial operation, and on the other hand Zomet paid approx.
NIS 43 million in respect of milestone payments, which were delayed, net of amounts that will serve as a collateral for an additional period as set out in the agreement.
|
|
|
3. |
On May 13, 2024, a CPV Group subsidiary entered into a binding tax equity agreement with a tax equity partner in respect of the Stagecoach project (hereinafter - the “Project”), at the total amount of approx. NIS 193 million
(approx. USD 52 million) (hereinafter - the “Investment Agreement”), which was completed on its signing date, after the project reached commercial operation in the second quarter of 2024.
|
|
|
B. |
Claims and other liabilities
|
|
|
1. |
Further to Note 11B1f to the Annual Financial Statements regarding its successful bid in an Israel Land Authority tender for design and option to acquire lease rights in land for the construction of renewable energy electricity
generation facilities in relation to three compounds of May 10, 2023, on July 23, 2024 OPC Power Plants received purchase tax assessments in connection with the project amounting to approx. NIS 29 million. OPC Power Plants disagrees
with the Israel Tax Authority’s position and its financial demands as included in the purchase tax assessments, due to, among other things, the Company’s position that the arrangement as per the Israel Land Authority’s tender does not
establish a “right in land”. OPC Power Plants intends to appeal the purchase tax assessment. As of the report date, the Company is of the opinion that since the chances of its position being allowed are higher than the chances that it
will be dismissed, no provision was made in respect of the assessment amount.
|
|
|
2. |
Further to Note 28A3 to the Annual Financial Statements regarding the proposed resolution on complementary arrangements and the imposition of certain criteria on Rotem (hereinafter - the “Hearing”), in March 2024, the Israeli
Electricity Authority’s resolution was delivered further to the Hearing (hereinafter - the “Resolution”). Generally, the arrangements as per the Resolution are not materially different from the arrangements included in the Hearing,
which comprise, among other things, the application of certain criteria on Rotem, including regarding deviations from consumption plans and the market model, alongside the award of a supply license to Rotem (if it applies for one and
complies with the conditions for receipt thereof), in view of the Israeli Electricity Authority’s intention to consolidate, in many respects, the regulation that applies to Rotem with the regulation that applies to other bilateral
electricity producers, thereby allowing Rotem to operate in the energy market in a manner that is similar and equal to that of producers. The Resolution came into force on July 1, 2024 for the period that coincides with that of
Rotem’s generation license.
|
|
|
A. |
Financial instruments measured at fair value for disclosure purposes only
|
|
As of June 30, 2024
|
||||||||
|
|
Carrying amount (*)
|
Fair value
|
||||||
|
|
(Unaudited)
|
(Unaudited)
|
||||||
|
|
NIS million
|
NIS million
|
||||||
|
|
|
|||||||
|
Loans from banks and financial institutions (Level 2)
|
3,028
|
3,065
|
||||||
|
Debt from non‑controlling interests (Level 2)
|
498
|
501
|
||||||
|
Debentures (Level 1)
|
1,978
|
1,876
|
||||||
|
5,504
|
5,442
|
|
|
As of June 30, 2023
|
|||||||
|
|
Carrying amount (*)
|
Fair value
|
||||||
|
|
(Unaudited)
|
(Unaudited)
|
||||||
|
|
NIS million
|
NIS million
|
||||||
|
|
|
|
||||||
|
Loans from banks and financial institutions (Level 2)
|
2,740
|
2,740
|
||||||
|
Debt from non‑controlling interests (Level 2)
|
433
|
403
|
||||||
|
Debentures (Level 1)
|
1,861
|
1,720
|
||||||
|
5,034
|
4,863
|
|
|
As of December 31, 2023
|
|||||||
|
|
Carrying amount (*)
|
Fair value
|
||||||
|
|
(Audited)
|
(Audited)
|
||||||
|
|
NIS million
|
NIS million
|
||||||
|
|
|
|
||||||
|
Loans from banks and financial institutions (Level 2)
|
3,055
|
3,085
|
||||||
|
Short-term credit (Level 2)
|
204
|
204
|
||||||
|
Debt from non‑controlling interests (Level 2)
|
454
|
464
|
||||||
|
Debentures (Level 1)
|
1,853
|
1,760
|
||||||
|
5,566
|
5,513
|
|
|
B. |
Fair value hierarchy of financial instruments measured at fair value
|
|
As of June 30
|
As of
December 31 |
|||||||||||
|
2024
|
2023
|
2023
|
||||||||||
|
In NIS million
|
(Unaudited)
|
(Audited)
|
||||||||||
|
Financial assets
|
||||||||||||
|
Derivatives used for hedge accounting
|
||||||||||||
|
CPI swap contracts (Level 2)
|
42
|
41
|
(*) 39
|
|
||||||||
|
Cross-currency interest rate swaps (USA) (Level 2)
|
31
|
30
|
24
|
|||||||||
|
Forwards on exchange rates (Level 2)
|
-
|
1
|
-
|
|||||||||
|
Total
|
73
|
72
|
63
|
|||||||||
|
Financial liabilities
|
||||||||||||
|
Derivatives used for hedge accounting
|
||||||||||||
|
CPI swap contracts (Level 2)
|
(2
|
)
|
(3
|
)
|
(*) (2)
|
|
||||||
|
Cross-currency interest rate swaps (USA) (Level 2)
|
(2
|
)
|
-
|
(9
|
)
|
|||||||
|
Electricity price hedge contracts (the US renewable energy segment) (Level 3)
|
(48
|
)
|
-
|
(55
|
)
|
|||||||
|
Total
|
(52
|
)
|
(3
|
)
|
(66
|
)
|
||||||
|
|
A. |
As of the report approval date there was no material change in the Company’s assessments regarding the Iron Swords War, compared to Note 1 to the Annual Financial Statements.
|
|
|
B. |
In the six‑month periods ended June 30, 2024 and 2023 the Group purchased property, plant and equipment for a total of approx. NIS 512 million and approx. NIS 1,820 million, respectively, including property, plant and equipment
purchased under a business combination during the six-month period ended June 30, 2023, for a total of approx. NIS 1,321 million. Furthermore, these amounts include non-cash purchases totaling approx. NIS 32 million and approx. NIS 72
million during these periods, respectively.
|
|
|
C. |
Further to Note 25A3 to the annual financial statements, in the reporting period, the Company and non-controlling interests made equity investments in OPC Power Ventures LP (both directly and indirectly) totaling approx. NIS 113
million (approx. USD 30 million) and extended loans totaling approx. NIS 38 million (approx. USD 10 million), respectively, based on their stake in the Partnership. As of the report approval date, the balance of the investment
commitments and advanced shareholder loans of all Partners is approx. NIS 226 million (approx. USD 60 million); the Company’s share is approx. NIS 158 million (approx. USD 42 million).
|
|
|
D. |
For further details regarding developments in credit from banking corporations and others, debentures, guarantees and equity in the reporting period and thereafter, see Note 7.
|
|
|
E. |
For further details regarding developments in commitments, legal claims and other liabilities in the reporting period and thereafter, see Note 8.
|
|
|
F. |
Further to Note 11B1 to the Financial Statements regarding an option to a lease agreement with Infinya Ltd. in respect of an area of approx. 6.8 hectares (adjacent to the Hadera Power Plant) for the purpose of constructing a power
plant, on April 17, 2024, the Israeli government rejected National Infrastructures Plan (NIP) 20B, for the construction of a natural gas-fired power generation plant (hereinafter - “Hadera 2 Project”) on the said land.
|
|
|
G. |
Further to Note 11b1 to the Annual Financial Statements regarding the Ramat Beka Project (hereinafter - the “Previous Tender”), on June 30, 2024, it was announced that the Group - through OPC Power Plants - won a further tender
issued by the Israel Land Authority for planning and an option to purchase leasehold rights in land for the construction of renewable energy electricity generation facilities using photovoltaic technology in combination with storage
in relation to two compounds with an aggregate area of approx. 161.7 hectares (hereinafter - the “Two Compounds”), which are adjacent to the compounds in respect of which the Group won the previous tender. The Group’s bids in this
Tender total approx. NIS 890 million, in the aggregate, for the two Compounds.
|
|
|
H. |
Subsequent to the Reporting Period, Hadera signed a settlement agreement with its insurers in the construction period, under which it received a lump sum of approx. NIS 19 million (USD 5 million) in connection with events, which
took place prior to the commercial operation of the Hadera Power Plant. This amount will be recognized as a revenue in the financial statements for the third quarter of 2024.
|
|
|
I. |
On July 19, 2024, CPV Group entered into a non-binding memorandum of understanding with a binding exclusivity period of 90 days (hereinafter - the “Memorandum of Understanding”) with one party and a binding acquisition agreement
(hereinafter - the “Acquisition Agreement”) with another party to acquire aggregate significant interests in the Shore power plant (which may result in CPV Group owning approx. 70% of the project) and in the Maryland power plant
(which may result in CPV Group owning approx. 75% of the project) (hereinafter - the “Transactions”).
|
|
|
J. |
On August 16, 2024, investees of CPV
Group entered into binding agreements with Harrison Street, an American private equity fund operating in the field of infrastructures (hereinafter - the “Investor”), where under the Investor will invest a total of USD 300 million
(hereinafter - the “Total Investment Amount”) in CPV Renewables Power LP (hereinafter - “CPV Renewables”)1 in consideration for 33.33% of the ordinary interest in CPV Renewables (hereinafter - the “Investor’s Interest”), in
accordance with and subject to the main terms and conditions as detailed below (hereinafter - the “Agreement” and the “Transaction”, as the case may be).8 The Transaction reflects a pre-money valuation of approx. USD 600 million for CPV Renewables.
|
|
|
(1) |
Board of Directors composition - the initial composition as of the completion date will include 4 board members (CPV Group and the Investor each appointing 2 directors). The voting power of the directors is based on the holding rate of the appointing interest holder.
|
|
|
(2) |
Generally accepted restrictions on
the transfer of rights (including certain restriction periods), subject to agreed conditions and exclusions.
|
|
|
(3) |
Actions and resolutions requiring a special majority, which includes the votes of the directors appointed by the
Investor - including, among other things, changes in the corporation’s documents, mergers, allocation of securities, liquidation, future budgets (the agreement includes arrangements regarding budgetary continuity), interested party
transactions (including regarding the service agreements), certain engagements and material transactions, etc., all subject to the applicable conditions, thresholds and definitions as per the agreement. Furthermore, the replacement of
the CPV Renewables’ lead business officer shall require the consent of the Investor under certain conditions.
|
|
|
(4) |
The activities of CPV Group in the field of renewable energy shall be carried out through CPV Renewables.8
|
| 6 |
As of the report approval date, a corporation wholly-owned by CPV Group. Prior to the completion of the Transaction: (1) CPV Renewables will change its status
from a Limited Partnership to a Limited Liability Company (LLC); (2) the holdings in CPV Keenan LLC (which is part of CPV Group’s renewable energy activities) shall be transferred to CPV Renewables. As of the report approval date,
CPV Group is of the opinion that such a transfer is expected to trigger tax consequences, at an amount which is under assessment.
|
| 7 |
In accordance with the Agreement, a certain refund was set from CPV Renewables to CPV Group in respect of investments in 2024.
|
| 8 | Except under certain circumstances defined in the agreement. |
|
|
J. |
(cont.)
|
| 9 |
The service agreements include provisions in connection with early termination by CPV Renewables under certain circumstances.
|
| 10 |
Includes undertakings regarding skilled lead business officer and development team. A breach of some of the undertakings (as the case may be) may trigger the
termination of the services agreements and the appointment of a replacement officer, and lead to other impacts on CPV Group’s rights as per the interest holders agreement.
|
|
As of June 30, 2024
|
||||||||||||||||
|
US GAAP
|
Adjustments
|
IFRS
|
||||||||||||||
|
In USD thousand
|
In USD thousand
|
In USD thousand
|
||||||||||||||
|
Cash and cash equivalents
|
D |
|
91
|
6,797
|
6,888
|
|||||||||||
|
Restricted cash
|
D |
|
6,802
|
(6,797
|
)
|
5
|
||||||||||
|
Property, plant & equipment
|
A, C,G
|
|
756,963
|
(147,481
|
)
|
609,482
|
||||||||||
|
Intangible assets
|
C |
|
19,600
|
(19,600
|
)
|
-
|
||||||||||
|
Other assets
|
|
92,231
|
-
|
92,231
|
||||||||||||
|
|
||||||||||||||||
|
Total assets
|
|
875,687
|
(167,081
|
)
|
708,606
|
|||||||||||
|
|
||||||||||||||||
|
Accounts payable and deferred expenses
|
A |
|
10,639
|
(1,605
|
)
|
9,034
|
||||||||||
|
Other liabilities
|
|
464,935
|
(2,025
|
)
|
462,910
|
|||||||||||
|
|
||||||||||||||||
|
Total liabilities
|
|
475,574
|
(3,630
|
)
|
471,944
|
|||||||||||
|
|
||||||||||||||||
|
Partners’ equity
|
A,G
|
|
400,113
|
(163,451
|
)
|
236,662
|
||||||||||
|
Total liabilities and equity
|
875,687
|
(167,081
|
)
|
708,606
|
||||||||||||
|
As of June 30, 2023
|
||||||||||||||||
|
US GAAP
|
Adjustments
|
IFRS
|
||||||||||||||
|
In USD thousand
|
In USD thousand
|
In USD thousand
|
||||||||||||||
|
Cash and cash equivalents
|
D |
|
93
|
1,498
|
1,591
|
|||||||||||
|
Restricted cash
|
D |
|
1,498
|
(1,498
|
)
|
-
|
||||||||||
|
Property, plant & equipment
|
A, C,G
|
|
775,365
|
(159,747
|
)
|
615,618
|
||||||||||
|
Intangible assets
|
C |
|
20,269
|
(20,269
|
)
|
-
|
||||||||||
|
Other assets
|
|
|
57,986
|
-
|
57,986
|
|||||||||||
|
|
|
|||||||||||||||
|
Total assets
|
|
|
855,211
|
(180,016
|
)
|
675,195
|
||||||||||
|
|
|
|||||||||||||||
|
Accounts payable and deferred expenses
|
A |
|
12,647
|
(1,093
|
)
|
11,554
|
||||||||||
|
Other liabilities
|
|
|
458,554
|
(3,109
|
)
|
455,445
|
||||||||||
|
|
|
|||||||||||||||
|
Total liabilities
|
|
|
471,201
|
(4,202
|
)
|
466,999
|
||||||||||
|
|
|
|||||||||||||||
|
Partners’ equity
|
A,G
|
|
384,010
|
(175,814
|
)
|
208,196
|
||||||||||
|
Total liabilities and equity
|
855,211
|
(180,016
|
)
|
675,195
|
||||||||||||
|
As of December 31, 2023
|
||||||||||||||||
|
US GAAP
|
Adjustments
|
IFRS
|
||||||||||||||
|
In USD thousand
|
In USD thousand
|
In USD thousand
|
||||||||||||||
|
Cash and cash equivalents
|
D |
|
98
|
1,059
|
1,157
|
|||||||||||
|
Restricted cash
|
D |
|
1,074
|
(1,059
|
)
|
15
|
||||||||||
|
Property, plant & equipment
|
A, C,G
|
|
768,584
|
(150,434
|
)
|
618,150
|
||||||||||
|
Intangible assets
|
C |
|
19,935
|
(19,935
|
)
|
-
|
||||||||||
|
Other assets
|
|
|
102,031
|
-
|
102,031
|
|||||||||||
|
|
|
|||||||||||||||
|
Total assets
|
|
|
891,722
|
(170,369
|
)
|
721,353
|
||||||||||
|
|
|
|||||||||||||||
|
Accounts payable and deferred expenses
|
A |
|
13,750
|
(1,155
|
)
|
12,595
|
||||||||||
|
Other liabilities
|
|
|
467,005
|
(2,513
|
)
|
464,492
|
||||||||||
|
|
|
|||||||||||||||
|
Total liabilities
|
|
|
480,755
|
(3,668
|
)
|
477,087
|
||||||||||
|
|
|
|||||||||||||||
|
Partners’ equity
|
A,G
|
|
410,967
|
(166,701
|
)
|
244,266
|
||||||||||
|
Total liabilities and equity
|
891,722
|
(170,369
|
)
|
721,353
|
||||||||||||
|
For the six-month period ended June 30, 2024
|
||||||||||||||||
|
US GAAP
|
Adjustments
|
IFRS
|
||||||||||||||
|
In USD thousand
|
In USD thousand
|
In USD thousand
|
||||||||||||||
|
Revenues
|
137,422
|
-
|
137,422
|
|||||||||||||
|
Operating expenses
|
A |
|
90,807
|
(3,358
|
)
|
87,449
|
||||||||||
|
Depreciation and amortization
|
G |
|
13,158
|
(380
|
)
|
12,778
|
||||||||||
|
|
|
|||||||||||||||
|
Operating profit
|
|
|
33,457
|
3,738
|
37,195
|
|||||||||||
|
|
|
|||||||||||||||
|
Finance expenses
|
B |
|
23,490
|
248
|
23,738
|
|||||||||||
|
|
|
|||||||||||||||
|
Profit for the period
|
|
|
9,967
|
3,490
|
13,457
|
|||||||||||
|
|
|
|||||||||||||||
|
Other comprehensive loss
|
B |
|
(20,820
|
)
|
(240
|
)
|
(21,060
|
)
|
||||||||
|
|
||||||||||||||||
|
Comprehensive income (loss) for the period
|
|
(10,853
|
)
|
3,250
|
(7,603
|
)
|
||||||||||
|
For the six-month period ended June 30, 2023
|
||||||||||||||||
|
US GAAP
|
Adjustments
|
IFRS
|
||||||||||||||
|
In USD thousand
|
In USD thousand
|
In USD thousand
|
||||||||||||||
|
Revenues
|
107,951
|
-
|
107,951
|
|||||||||||||
|
Operating expenses
|
A |
|
63,235
|
(2,515
|
)
|
60,720
|
||||||||||
|
Depreciation and amortization
|
G |
|
13,030
|
(3,355
|
)
|
9,675
|
||||||||||
|
|
|
|||||||||||||||
|
Operating profit
|
|
|
31,686
|
5,870
|
37,556
|
|||||||||||
|
|
|
|||||||||||||||
|
Finance expenses
|
B |
|
21,224
|
(5,202
|
)
|
16,022
|
||||||||||
|
|
|
|||||||||||||||
|
Profit for the period
|
|
|
10,462
|
11,072
|
21,534
|
|||||||||||
|
|
|
|||||||||||||||
|
Other comprehensive loss
|
B |
|
(350
|
)
|
(2,094
|
)
|
(2,444
|
)
|
||||||||
|
|
||||||||||||||||
|
Comprehensive income for the period
|
|
10,112
|
8,978
|
19,090
|
||||||||||||
|
For the three-month period ended June 30, 2024
|
||||||||||||||||
|
US GAAP
|
Adjustments
|
IFRS
|
||||||||||||||
|
In USD thousand
|
In USD thousand
|
In USD thousand
|
||||||||||||||
|
Revenues
|
46,693
|
-
|
46,693
|
|||||||||||||
|
Operating expenses
|
A |
|
36,426
|
(1,605
|
)
|
34,821
|
||||||||||
|
Depreciation and amortization
|
G |
|
6,589
|
(190
|
)
|
6,399
|
||||||||||
|
|
|
|||||||||||||||
|
Operating profit
|
|
|
3,678
|
1,795
|
5,473
|
|||||||||||
|
|
|
|||||||||||||||
|
Finance expenses
|
B |
|
11,638
|
176
|
11,814
|
|||||||||||
|
|
|
|||||||||||||||
|
Profit for the period
|
|
|
(7,960
|
)
|
1,619
|
(6,341
|
)
|
|||||||||
|
|
|
|||||||||||||||
|
Other comprehensive loss
|
B |
|
(2,630
|
)
|
(67
|
)
|
(2,697
|
)
|
||||||||
|
Comprehensive income for the period
|
(10,590
|
)
|
1,552
|
(9,038
|
)
|
|||||||||||
|
For the three-month period ended June 30, 2023
|
||||||||||||||||
|
US GAAP
|
Adjustments
|
IFRS
|
||||||||||||||
|
In USD thousand
|
In USD thousand
|
In USD thousand
|
||||||||||||||
|
Revenues
|
30,033
|
-
|
30,033
|
|||||||||||||
|
Operating expenses
|
A |
|
26,687
|
(1,092
|
)
|
25,595
|
||||||||||
|
Depreciation and amortization
|
G |
|
6,515
|
(1,678
|
)
|
4,837
|
||||||||||
|
|
|
|||||||||||||||
|
Operating loss
|
|
|
(3,169
|
)
|
2,770
|
(399
|
)
|
|||||||||
|
|
|
|||||||||||||||
|
Finance expenses
|
B |
|
12,097
|
(3,668
|
)
|
8,429
|
||||||||||
|
|
|
|||||||||||||||
|
Loss for the period
|
|
|
(15,266
|
)
|
6,438
|
(8,828
|
)
|
|||||||||
|
|
|
|||||||||||||||
|
Other comprehensive loss
|
B |
|
(1,101
|
)
|
(560
|
)
|
(1,661
|
)
|
||||||||
|
|
||||||||||||||||
|
Comprehensive loss for the period
|
(16,367
|
)
|
5,878
|
(10,489
|
)
|
|||||||||||
|
For the year ended December 31, 2023
|
||||||||||||||||
|
US GAAP
|
Adjustments
|
IFRS
|
||||||||||||||
|
In USD thousand
|
In USD thousand
|
In USD thousand
|
||||||||||||||
|
Revenues
|
219,128
|
-
|
219,128
|
|||||||||||||
|
Operating expenses
|
A |
|
135,898
|
(9,860
|
)
|
126,038
|
||||||||||
|
Depreciation and amortization
|
G |
|
26,077
|
(5,718
|
)
|
20,359
|
||||||||||
|
|
|
|||||||||||||||
|
Operating profit
|
|
|
57,153
|
15,578
|
72,731
|
|||||||||||
|
|
|
|||||||||||||||
|
Finance expenses
|
B |
|
45,029
|
(4,666
|
)
|
40,363
|
||||||||||
|
|
|
|||||||||||||||
|
Profit for the year
|
|
|
12,124
|
20,244
|
32,368
|
|||||||||||
|
|
|
|||||||||||||||
|
Other comprehensive income
|
B |
|
24,791
|
(2,153
|
)
|
22,638
|
||||||||||
|
Comprehensive income for the year
|
36,915
|
18,091
|
55,006
|
|||||||||||||
|
For the six-month period ended June 30, 2024
|
||||||||||||||||
|
US GAAP
|
Adjustments
|
IFRS
|
||||||||||||||
|
In USD thousand
|
In USD thousand
|
In USD thousand
|
||||||||||||||
|
Profit for the period
|
9,967
|
3,490
|
13,457
|
|||||||||||||
|
Net cash provided by operating activities
|
28,148
|
-
|
28,148
|
|||||||||||||
|
Net cash used for investing activities
|
D |
|
(935
|
)
|
(24,262
|
)
|
(25,197
|
)
|
||||||||
|
Net cash used for financing activities
|
|
|
2,780
|
-
|
2,780
|
|||||||||||
|
|
|
|||||||||||||||
|
Net increase (decrease) in cash and cash equivalents
|
|
|
29,993
|
(24,262
|
)
|
5,731
|
||||||||||
|
|
|
|||||||||||||||
|
Balance of cash and cash equivalents of the beginning of period
|
D |
|
98
|
1,059
|
1,157
|
|||||||||||
|
|
|
|||||||||||||||
|
Restricted cash balance as of the beginning of the period
|
D |
|
36,114
|
(36,114
|
)
|
-
|
||||||||||
|
|
|
|||||||||||||||
|
Balance of cash and cash equivalents as of the end of the period
|
D |
|
91
|
6,797
|
6,888
|
|||||||||||
|
|
|
|||||||||||||||
|
Restricted cash balance as of the end of the period
|
D |
|
66,114
|
(66,114
|
)
|
-
|
||||||||||
|
For the six-month period ended June 30, 2023
|
||||||||||||||||
|
US GAAP
|
Adjustments
|
IFRS
|
||||||||||||||
|
In USD thousand
|
In USD thousand
|
In USD thousand
|
||||||||||||||
|
Profit for the period
|
10,462
|
11,072
|
21,534
|
|||||||||||||
|
Net cash provided by operating activities
|
36,835
|
-
|
36,835
|
|||||||||||||
|
Net cash provided by (used for) investing activities
|
D |
|
(1,426
|
)
|
18,630
|
17,204
|
||||||||||
|
Net cash used for financing activities
|
|
|
(53,635
|
)
|
-
|
(53,635
|
)
|
|||||||||
|
|
|
|||||||||||||||
|
Net increase (decrease) in cash and cash equivalents
|
|
|
(18,226
|
)
|
18,630
|
404
|
||||||||||
|
|
|
|||||||||||||||
|
Balance of cash and cash equivalents of the beginning of period
|
D |
|
145
|
1,042
|
1,187
|
|||||||||||
|
|
|
|||||||||||||||
|
Restricted cash balance as of the beginning of the period
|
D |
|
57,680
|
(57,680
|
)
|
-
|
||||||||||
|
|
|
|||||||||||||||
|
Balance of cash and cash equivalents as of the end of the period
|
D |
|
93
|
1,498
|
1,591
|
|||||||||||
|
|
|
|||||||||||||||
|
Restricted cash balance as of the end of the period
|
D |
|
39,506
|
(39,506
|
)
|
-
|
||||||||||
|
For the three-month period ended June 30, 2024
|
||||||||||||||||
|
US GAAP
|
Adjustments
|
IFRS
|
||||||||||||||
|
In USD thousand
|
In USD thousand
|
In USD thousand
|
||||||||||||||
|
Profit for the period
|
(7,960
|
)
|
1,619
|
(6,341
|
)
|
|||||||||||
|
Net cash provided by operating activities
|
|
(2,577
|
)
|
-
|
(2,577
|
)
|
||||||||||
|
Net cash provided by (used for) investing activities
|
|
D |
|
(596
|
)
|
(24,255
|
)
|
(24,851
|
)
|
|||||||
|
Net cash used for financing activities
|
|
|
|
23,680
|
-
|
23,680
|
||||||||||
|
|
|
|
||||||||||||||
|
Net decrease in cash and cash equivalents
|
|
|
|
20,507
|
(24,255
|
)
|
(3,748
|
)
|
||||||||
|
|
|
|
||||||||||||||
|
Balance of cash and cash equivalents of the beginning of period
|
|
D |
|
89
|
10,547
|
10,636
|
||||||||||
|
|
|
|
||||||||||||||
|
Restricted cash balance as of the beginning of the period
|
|
D |
|
45,609
|
(45,609
|
)
|
-
|
|||||||||
|
|
|
|
||||||||||||||
|
Balance of cash and cash equivalents as of the end of the period
|
|
D |
|
91
|
6,797
|
6,888
|
||||||||||
|
|
|
|
||||||||||||||
|
Restricted cash balance as of the end of the period
|
|
D |
|
66,114
|
(66,114
|
)
|
-
|
|||||||||
|
For the three-month period ended June 30, 2023
|
||||||||||||||||
|
US GAAP
|
Adjustments
|
IFRS
|
||||||||||||||
|
In USD thousand
|
In USD thousand
|
In USD thousand
|
||||||||||||||
|
Loss for the period
|
(15,266
|
)
|
6,438
|
(8,828
|
)
|
|||||||||||
|
Net cash provided by operating activities
|
851
|
-
|
851
|
|||||||||||||
|
Net cash used for investing activities
|
D |
|
(1,200
|
)
|
(1,359
|
)
|
(2,559
|
)
|
||||||||
|
Net cash used for financing activities
|
|
|
(8,915
|
)
|
-
|
(8,915
|
)
|
|||||||||
|
|
|
|||||||||||||||
|
Net decrease in cash and cash equivalents
|
|
|
(9,264
|
)
|
(1,359
|
)
|
(10,623
|
)
|
||||||||
|
|
|
|||||||||||||||
|
Balance of cash and cash equivalents of the beginning of period
|
D |
|
92
|
12,122
|
12,214
|
|||||||||||
|
|
|
|||||||||||||||
|
Restricted cash balance as of the beginning of the period
|
D |
|
48,771
|
(48,771
|
)
|
-
|
||||||||||
|
|
|
|||||||||||||||
|
Balance of cash and cash equivalents as of the end of the period
|
D |
|
93
|
1,498
|
1,591
|
|||||||||||
|
|
|
|||||||||||||||
|
Restricted cash balance as of the end of the period
|
D |
|
39,506
|
(39,506
|
)
|
-
|
||||||||||
|
For the year ended December 31, 2023
|
||||||||||||||||
|
US GAAP
|
Adjustments
|
IFRS
|
||||||||||||||
|
In USD thousand
|
In USD thousand
|
In USD thousand
|
||||||||||||||
|
Profit for the year
|
12,124
|
20,244
|
32,368
|
|||||||||||||
|
Net cash provided by operating activities
|
48,123
|
-
|
48,123
|
|||||||||||||
|
Net cash provided by (used for) investing activities
|
D |
|
(7,601
|
)
|
21,585
|
13,984
|
||||||||||
|
Net cash used for financing activities
|
|
|
(62,135
|
)
|
-
|
(62,135
|
)
|
|||||||||
|
|
|
|||||||||||||||
|
Net decrease in cash and cash equivalents
|
|
|
(21,613
|
)
|
21,585
|
(28
|
)
|
|||||||||
|
|
|
|||||||||||||||
|
Balance of cash and cash equivalents as of the beginning of the year
|
D |
|
145
|
1,041
|
1,186
|
|||||||||||
|
|
|
|||||||||||||||
|
Restricted cash balance as of the beginning of the year
|
D |
|
57,680
|
(57,680
|
)
|
-
|
||||||||||
|
|
|
|||||||||||||||
|
Balance of cash and cash equivalents as of the end of the year
|
D |
|
98
|
1,059
|
1,157
|
|||||||||||
|
|
|
|||||||||||||||
|
Restricted cash balance as of the end of the year
|
D |
|
36,114
|
(36,114
|
)
|
-
|
||||||||||
|
|
As of June 30, 2024
|
|||||||||||||||
|
US GAAP
|
Adjustments
|
IFRS
|
||||||||||||||
|
In USD thousand
|
In USD thousand
|
In USD thousand
|
||||||||||||||
|
Cash and cash equivalents
|
D |
|
73
|
2,569
|
2,642
|
|||||||||||
|
Restricted cash
|
D |
|
2,674
|
(2,569
|
)
|
105
|
||||||||||
|
Property, plant & equipment
|
A,C
|
|
806,261
|
54,706
|
860,967
|
|||||||||||
|
Intangible assets
|
C |
|
26,318
|
(26,318
|
)
|
-
|
||||||||||
|
Other assets
|
|
|
68,235
|
-
|
68,235
|
|||||||||||
|
|
|
|||||||||||||||
|
Total assets
|
|
|
903,561
|
28,388
|
931,949
|
|||||||||||
|
|
|
|||||||||||||||
|
Accounts payable and deferred expenses
|
A |
|
18,733
|
(8,743
|
)
|
9,990
|
||||||||||
|
Other liabilities
|
|
|
345,495
|
280
|
345,775
|
|||||||||||
|
|
|
|||||||||||||||
|
Total liabilities
|
|
|
364,228
|
(8,463
|
)
|
355,765
|
||||||||||
|
|
|
|||||||||||||||
|
Partners’ equity
|
A |
|
539,333
|
36,851
|
576,184
|
|||||||||||
|
|
||||||||||||||||
|
Total liabilities and equity
|
903,561
|
28,388
|
931,949
|
|||||||||||||
|
As of June 30, 2023
|
||||||||||||||||
|
US GAAP
|
Adjustments
|
IFRS
|
||||||||||||||
|
In USD thousand
|
In USD thousand
|
In USD thousand
|
||||||||||||||
|
Cash and cash equivalents
|
D |
|
65
|
6,823
|
6,888
|
|||||||||||
|
Restricted cash
|
D |
|
9,205
|
(6,823
|
)
|
2,382
|
||||||||||
|
Property, plant & equipment
|
A,C
|
|
827,155
|
47,242
|
874,397
|
|||||||||||
|
Intangible assets
|
C |
|
27,189
|
(27,189
|
)
|
-
|
||||||||||
|
Other assets
|
|
|
74,925
|
-
|
74,925
|
|||||||||||
|
|
|
|||||||||||||||
|
Total assets
|
|
|
938,539
|
20,053
|
958,592
|
|||||||||||
|
|
|
|||||||||||||||
|
Accounts payable and deferred expenses
|
A |
|
15,468
|
(8,790
|
)
|
6,678
|
||||||||||
|
Other liabilities
|
|
|
420,505
|
560
|
421,065
|
|||||||||||
|
|
|
|||||||||||||||
|
Total liabilities
|
|
|
435,973
|
(8,230
|
)
|
427,743
|
||||||||||
|
|
|
|||||||||||||||
|
Partners’ equity
|
A |
|
502,566
|
28,283
|
530,849
|
|||||||||||
|
|
||||||||||||||||
|
Total liabilities and equity
|
938,539
|
20,053
|
958,592
|
|||||||||||||
|
As of December 31, 2023
|
||||||||||||||||
|
US GAAP
|
Adjustments
|
IFRS
|
||||||||||||||
|
In USD thousand
|
In USD thousand
|
In USD thousand
|
||||||||||||||
|
Cash and cash equivalents
|
D |
|
52
|
265
|
317
|
|||||||||||
|
Restricted cash
|
D |
|
947
|
(265
|
)
|
682
|
||||||||||
|
Property, plant & equipment
|
A,C
|
|
817,316
|
57,540
|
874,856
|
|||||||||||
|
Intangible assets
|
C |
|
26,753
|
(26,753
|
)
|
-
|
||||||||||
|
Other assets
|
|
|
80,408
|
-
|
80,408
|
|||||||||||
|
|
|
|||||||||||||||
|
Total assets
|
|
|
925,476
|
30,787
|
956,263
|
|||||||||||
|
|
|
|||||||||||||||
|
Accounts payable and deferred expenses
|
A |
|
15,034
|
(5,435
|
)
|
9,599
|
||||||||||
|
Other liabilities
|
|
|
399,165
|
420
|
399,585
|
|||||||||||
|
|
|
|||||||||||||||
|
Total liabilities
|
|
|
414,199
|
(5,015
|
)
|
409,184
|
||||||||||
|
|
|
|||||||||||||||
|
Partners’ equity
|
A |
|
511,277
|
35,802
|
547,079
|
|||||||||||
|
Total liabilities and equity
|
925,476
|
30,787
|
956,263
|
|||||||||||||
|
For the six-month period ended June 30, 2024
|
||||||||||||||||||||
|
US GAAP
|
IFRS adjustments
|
Adjustments to the Group’s accounting policies*
|
IFRS - according to the Group’s accounting policies
|
|||||||||||||||||
|
In USD thousand
|
In USD thousand
|
In USD thousand
|
In USD thousand
|
|||||||||||||||||
|
Revenues
|
B |
|
143,616
|
(1,381
|
)
|
9,841
|
152,076
|
|||||||||||||
|
Operating expenses
|
A |
|
65,084
|
(4,440
|
)
|
9,841
|
70,485
|
|||||||||||||
|
Depreciation and amortization
|
A |
|
13,724
|
3,531
|
-
|
17,255
|
||||||||||||||
|
|
||||||||||||||||||||
|
Operating profit
|
|
64,808
|
(472
|
)
|
-
|
64,336
|
||||||||||||||
|
|
||||||||||||||||||||
|
Finance expenses
|
B |
|
7,714
|
(3,197
|
)
|
-
|
4,517
|
|||||||||||||
|
|
||||||||||||||||||||
|
Profit for the period
|
|
57,094
|
2,725
|
-
|
59,819
|
|||||||||||||||
|
|
||||||||||||||||||||
|
Other comprehensive loss
|
B |
|
(2,038
|
)
|
(1,676
|
)
|
-
|
(3,714
|
)
|
|||||||||||
|
Comprehensive income for the period
|
55,056
|
1,049
|
-
|
56,105
|
||||||||||||||||
|
For the six-month period ended June 30, 2023
|
||||||||||||||||||||
|
US GAAP
|
IFRS adjustments
|
Adjustments to the Group’s accounting policies*
|
IFRS - according to the Group’s accounting policies
|
|||||||||||||||||
|
In USD thousand
|
In USD thousand
|
In USD thousand
|
In USD thousand
|
|||||||||||||||||
|
Revenues
|
150,875
|
-
|
9,389
|
160,264
|
||||||||||||||||
|
Operating expenses
|
A |
|
82,293
|
(4,430
|
)
|
9,389
|
87,252
|
|||||||||||||
|
|
||||||||||||||||||||
|
Operating profit
|
|
68,582
|
4,430
|
-
|
73,012
|
|||||||||||||||
|
|
||||||||||||||||||||
|
Finance expenses
|
B |
|
13,350
|
(2,768
|
)
|
-
|
10,582
|
|||||||||||||
|
|
||||||||||||||||||||
|
Profit for the period
|
|
55,232
|
7,198
|
-
|
62,430
|
|||||||||||||||
|
|
||||||||||||||||||||
|
Other comprehensive income
|
B |
|
4,014
|
(2,627
|
)
|
-
|
1,387
|
|||||||||||||
|
|
||||||||||||||||||||
|
Comprehensive income for the period
|
59,246
|
4,571
|
-
|
63,817
|
||||||||||||||||
|
For the three-month period ended June 30, 2024
|
||||||||||||||||||||
|
US GAAP
|
IFRS adjustments
|
Adjustments to the Group’s accounting policies*
|
IFRS - according to the Group’s accounting policies
|
|||||||||||||||||
|
In USD thousand
|
In USD thousand
|
In USD thousand
|
In USD thousand
|
|||||||||||||||||
|
Revenues
|
B |
|
60,690
|
92
|
6,520
|
67,302
|
||||||||||||||
|
Operating expenses
|
A |
|
25,792
|
(2,021
|
)
|
6,520
|
30,291
|
|||||||||||||
|
Depreciation and amortization
|
A |
|
6,864
|
1,765
|
-
|
8,629
|
||||||||||||||
|
|
|
|||||||||||||||||||
|
Operating profit
|
|
|
28,034
|
348
|
-
|
28,382
|
||||||||||||||
|
|
|
|||||||||||||||||||
|
Finance expenses
|
B |
|
4,816
|
(1,030
|
)
|
-
|
3,786
|
|||||||||||||
|
|
|
|||||||||||||||||||
|
Profit for the period
|
|
|
23,218
|
1,378
|
-
|
24,596
|
||||||||||||||
|
|
|
|||||||||||||||||||
|
Other comprehensive income
|
B |
|
3,549
|
(1,052
|
)
|
-
|
2,497
|
|||||||||||||
|
|
||||||||||||||||||||
|
Comprehensive income for the period
|
|
26,767
|
326
|
-
|
27,093
|
|||||||||||||||
|
For the three-month period ended June 30, 2023
|
||||||||||||||||||||
|
US GAAP
|
IFRS adjustments
|
Adjustments to the Group’s accounting policies*
|
IFRS - according to the Group’s accounting policies
|
|||||||||||||||||
|
In USD thousand
|
In USD thousand
|
In USD thousand
|
In USD thousand
|
|||||||||||||||||
|
Revenues
|
61,780
|
-
|
1,336
|
63,116
|
||||||||||||||||
|
Operating expenses
|
A |
|
34,068
|
(2,179
|
)
|
1,336
|
33,225
|
|||||||||||||
|
|
|
|||||||||||||||||||
|
Operating profit
|
|
|
27,712
|
2,179
|
-
|
29,891
|
||||||||||||||
|
|
|
|||||||||||||||||||
|
Finance expenses
|
B |
|
5,960
|
(1,389
|
)
|
-
|
4,571
|
|||||||||||||
|
|
|
|||||||||||||||||||
|
Profit for the period
|
|
|
21,752
|
3,568
|
-
|
25,320
|
||||||||||||||
|
|
|
|||||||||||||||||||
|
Other comprehensive income
|
B |
|
7,360
|
(1,318
|
)
|
-
|
6,042
|
|||||||||||||
|
Comprehensive income for the period
|
29,112
|
2,250
|
-
|
31,362
|
||||||||||||||||
|
For the year ended December 31, 2023
|
||||||||||||||||||||
|
US GAAP
|
IFRS adjustments
|
Adjustments to the Group’s accounting policies*
|
IFRS - according to the Group’s accounting policies
|
|||||||||||||||||
|
In USD thousand
|
In USD thousand
|
In USD thousand
|
In USD thousand
|
|||||||||||||||||
|
Revenues
|
B |
|
256,103
|
3,898
|
17,660
|
277,661
|
||||||||||||||
|
Operating expenses
|
A |
|
119,737
|
(12,985
|
)
|
17,660
|
124,412
|
|||||||||||||
|
Depreciation and amortization
|
A |
|
27,186
|
1,177
|
-
|
28,363
|
||||||||||||||
|
|
|
|||||||||||||||||||
|
Operating profit
|
|
|
109,180
|
15,706
|
-
|
124,886
|
||||||||||||||
|
|
|
|||||||||||||||||||
|
Finance expenses
|
B |
|
24,191
|
(5,416
|
)
|
-
|
18,775
|
|||||||||||||
|
|
|
|||||||||||||||||||
|
Profit for the year
|
|
|
84,989
|
21,122
|
-
|
106,111
|
||||||||||||||
|
|
|
|||||||||||||||||||
|
Other comprehensive loss
|
B |
|
(8,032
|
)
|
(9,034
|
)
|
-
|
(17,066
|
)
|
|||||||||||
|
|
||||||||||||||||||||
|
Comprehensive income for the year
|
76,957
|
12,088
|
-
|
89,045
|
||||||||||||||||
|
|
For the six-month period ended June 30, 2024
|
|||||||||||||||
|
|
US GAAP
|
Adjustments
|
IFRS
|
|||||||||||||
|
|
In USD thousand
|
In USD thousand
|
In USD thousand
|
|||||||||||||
|
|
||||||||||||||||
|
Profit for the period
|
|
57,094
|
2,725
|
59,819
|
||||||||||||
|
|
||||||||||||||||
|
Net cash provided by operating activities
|
|
70,472
|
-
|
70,472
|
||||||||||||
|
Net cash provided by (used for) investing activities
|
D |
|
(2,234
|
)
|
1,219
|
(1,015
|
)
|
|||||||||
|
Net cash used for financing activities
|
|
|
(67,132
|
)
|
-
|
(67,132
|
)
|
|||||||||
|
|
|
|||||||||||||||
|
Net increase in cash and cash equivalents
|
|
|
1,106
|
1,219
|
2,325
|
|||||||||||
|
|
|
|||||||||||||||
|
Balance of cash and cash equivalents of the beginning of period
|
D |
|
52
|
265
|
317
|
|||||||||||
|
|
|
|||||||||||||||
|
Restricted cash balance as of the beginning of the period
|
D |
|
28,328
|
(28,328
|
)
|
-
|
||||||||||
|
|
|
|||||||||||||||
|
Balance of cash and cash equivalents as of the end of the period
|
D |
|
73
|
2,569
|
2,642
|
|||||||||||
|
|
|
|||||||||||||||
|
Restricted cash balance as of the end of the period
|
D |
|
29,413
|
(29,413
|
)
|
-
|
||||||||||
|
For the six-month period ended June 30, 2023
|
||||||||||||||||
|
US GAAP
|
Adjustments
|
IFRS
|
||||||||||||||
|
In USD thousand
|
In USD thousand
|
In USD thousand
|
||||||||||||||
|
Profit for the period
|
55,232
|
7,198
|
62,430
|
|||||||||||||
|
Net cash provided by operating activities
|
98,824
|
-
|
98,824
|
|||||||||||||
|
Net cash provided by (used for) investing activities
|
D |
|
(633
|
)
|
9,275
|
8,642
|
||||||||||
|
Net cash used for financing activities
|
|
|
(102,037
|
)
|
-
|
(102,037
|
)
|
|||||||||
|
|
|
|||||||||||||||
|
Net increase (decrease) in cash and cash equivalents
|
|
|
(3,846
|
)
|
9,275
|
5,429
|
||||||||||
|
|
|
|||||||||||||||
|
Balance of cash and cash equivalents of the beginning of period
|
D |
|
89
|
1,370
|
1,459
|
|||||||||||
|
|
|
|||||||||||||||
|
Restricted cash balance as of the beginning of the period
|
D |
|
38,404
|
(38,404
|
)
|
-
|
||||||||||
|
|
|
|||||||||||||||
|
Balance of cash and cash equivalents as of the end of the period
|
D |
|
65
|
6,823
|
6,888
|
|||||||||||
|
|
|
|||||||||||||||
|
Restricted cash balance as of the end of the period
|
D |
|
34,582
|
(34,582
|
)
|
-
|
||||||||||
|
For the three-month period ended June 30, 2024
|
||||||||||||||||
|
US GAAP
|
Adjustments
|
IFRS
|
||||||||||||||
|
In USD thousand
|
In USD thousand
|
In USD thousand
|
||||||||||||||
|
Profit for the period
|
23,218
|
1,378
|
24,596
|
|||||||||||||
|
Net cash provided by operating activities
|
29,305
|
-
|
29,305
|
|||||||||||||
|
Net cash used for investing activities
|
D |
|
(1,327
|
)
|
(1,607
|
)
|
(2,934
|
)
|
||||||||
|
Net cash used for financing activities
|
|
|
(26,462
|
)
|
-
|
(26,462
|
)
|
|||||||||
|
|
|
|||||||||||||||
|
Net increase in cash and cash equivalents
|
|
|
1,516
|
(1,607
|
)
|
(91
|
)
|
|||||||||
|
|
|
|||||||||||||||
|
Balance of cash and cash equivalents of the beginning of period
|
D |
|
82
|
2,651
|
2,733
|
|||||||||||
|
|
|
|||||||||||||||
|
Restricted cash balance as of the beginning of the period
|
D |
|
27,888
|
(27,888
|
)
|
-
|
||||||||||
|
|
|
|||||||||||||||
|
Balance of cash and cash equivalents as of the end of the period
|
D |
|
73
|
2,569
|
2,642
|
|||||||||||
|
|
|
|||||||||||||||
|
Restricted cash balance as of the end of the period
|
D |
|
29,413
|
(29,413
|
)
|
-
|
||||||||||
|
For the three-month period ended June 30, 2023
|
||||||||||||||||
|
US GAAP
|
Adjustments
|
IFRS
|
||||||||||||||
|
In USD thousand
|
In USD thousand
|
In USD thousand
|
||||||||||||||
|
Profit for the period
|
21,752
|
3,568
|
25,320
|
|||||||||||||
|
Net cash provided by operating activities
|
|
41,687
|
-
|
41,687
|
||||||||||||
|
Net cash used for investing activities
|
|
D |
|
|
(473
|
)
|
146
|
(327
|
)
|
|||||||
|
Net cash used for financing activities
|
|
|
|
|
(35,305
|
)
|
-
|
(35,305
|
)
|
|||||||
|
|
|
|
|
|||||||||||||
|
Net increase in cash and cash equivalents
|
|
|
|
|
5,909
|
146
|
6,055
|
|||||||||
|
|
|
|
|
|||||||||||||
|
Balance of cash and cash equivalents of the beginning of period
|
|
D |
|
|
57
|
776
|
833
|
|||||||||
|
|
|
|
|
|||||||||||||
|
Restricted cash balance as of the beginning of the period
|
|
D |
|
|
28,681
|
(28,681
|
)
|
-
|
||||||||
|
|
|
|
|
|||||||||||||
|
Balance of cash and cash equivalents as of the end of the period
|
|
D |
|
|
65
|
6,823
|
6,888
|
|||||||||
|
|
|
|
|
|||||||||||||
|
Restricted cash balance as of the end of the period
|
|
D |
|
|
34,582
|
(34,582
|
)
|
-
|
||||||||
|
For the year ended December 31, 2023
|
||||||||||||||||
|
US GAAP
|
Adjustments
|
IFRS
|
||||||||||||||
|
In USD thousand
|
In USD thousand
|
In USD thousand
|
||||||||||||||
|
Profit for the year
|
84,989
|
21,122
|
106,111
|
|||||||||||||
|
Net cash provided by operating activities
|
|
138,604
|
-
|
138,604
|
||||||||||||
|
Net cash provided by (used for) investing activities
|
D |
|
(3,967
|
)
|
8,971
|
5,004
|
||||||||||
|
Net cash used for financing activities
|
|
|
(144,750
|
)
|
-
|
(144,750
|
)
|
|||||||||
|
|
|
|||||||||||||||
|
Net decrease in cash and cash equivalents
|
|
|
(10,113
|
)
|
8,971
|
(1,142
|
)
|
|||||||||
|
|
|
|||||||||||||||
|
Balance of cash and cash equivalents as of the beginning of the year
|
D |
|
89
|
1,370
|
1,459
|
|||||||||||
|
|
|
|||||||||||||||
|
Restricted cash balance as of the beginning of the year
|
D |
|
38,404
|
(38,404
|
)
|
-
|
||||||||||
|
|
|
|||||||||||||||
|
Balance of cash and cash equivalents as of the end of the year
|
D |
|
52
|
265
|
317
|
|||||||||||
|
|
|
|||||||||||||||
|
Restricted cash balance as of the end of the year
|
D |
|
28,328
|
(28,328
|
)
|
-
|
||||||||||
|
As of June 30, 2024
|
||||||||||||||||
|
US GAAP
|
Adjustments
|
IFRS
|
||||||||||||||
|
In USD thousand
|
In USD thousand
|
In USD thousand
|
||||||||||||||
|
Cash and cash equivalents
|
D |
|
99
|
12,160
|
12,259
|
|||||||||||
|
Restricted cash
|
D |
|
12,660
|
(12,160
|
)
|
500
|
||||||||||
|
Property, plant & equipment
|
A,C
|
|
728,721
|
80,725
|
809,446
|
|||||||||||
|
Intangible assets
|
C |
|
49,578
|
(49,578
|
)
|
-
|
||||||||||
|
Other assets
|
|
|
74,561
|
-
|
74,561
|
|||||||||||
|
|
|
|||||||||||||||
|
Total assets
|
|
|
865,619
|
31,147
|
896,766
|
|||||||||||
|
|
|
|||||||||||||||
|
Accounts payable and deferred expenses
|
A |
|
12,084
|
(1,910
|
)
|
10,174
|
||||||||||
|
Other liabilities
|
|
|
325,753
|
(510
|
)
|
325,243
|
||||||||||
|
|
|
|||||||||||||||
|
Total liabilities
|
|
|
337,837
|
(2,420
|
)
|
335,417
|
||||||||||
|
|
|
|||||||||||||||
|
Partners’ equity
|
A |
|
527,782
|
33,567
|
561,349
|
|||||||||||
|
|
||||||||||||||||
|
Total liabilities and equity
|
|
865,619
|
31,147
|
896,766
|
||||||||||||
|
As of June 30, 2023
|
||||||||||||||||
|
US GAAP
|
Adjustments
|
IFRS
|
||||||||||||||
|
In USD thousand
|
In USD thousand
|
In USD thousand
|
||||||||||||||
|
Cash and cash equivalents
|
D |
|
100
|
8,328
|
8,428
|
|||||||||||
|
Restricted cash
|
D |
|
8,371
|
(8,328
|
)
|
43
|
||||||||||
|
Property, plant & equipment
|
A,C
|
|
752,496
|
80,820
|
833,316
|
|||||||||||
|
Intangible assets
|
C |
|
53,087
|
(53,087
|
)
|
-
|
||||||||||
|
Other assets
|
|
|
135,796
|
-
|
135,796
|
|||||||||||
|
|
|
|||||||||||||||
|
Total assets
|
|
|
949,850
|
27,733
|
977,583
|
|||||||||||
|
|
|
|||||||||||||||
|
Accounts payable and deferred expenses
|
A |
|
13,486
|
(2,189
|
)
|
11,297
|
||||||||||
|
Other liabilities
|
|
|
496,760
|
(140
|
)
|
496,620
|
||||||||||
|
|
|
|||||||||||||||
|
Total liabilities
|
|
|
510,246
|
(2,329
|
)
|
507,917
|
||||||||||
|
|
|
|||||||||||||||
|
Partners’ equity
|
A |
|
439,604
|
30,062
|
469,666
|
|||||||||||
|
|
||||||||||||||||
|
Total liabilities and equity
|
|
949,850
|
27,733
|
977,583
|
||||||||||||
|
As of December 31, 2023
|
||||||||||||||||
|
US GAAP
|
Adjustments
|
IFRS
|
||||||||||||||
|
In USD thousand
|
In USD thousand
|
In USD thousand
|
||||||||||||||
|
Cash and cash equivalents
|
D |
|
100
|
1,946
|
2,046
|
|||||||||||
|
Restricted cash
|
D |
|
2,004
|
(1,946
|
)
|
58
|
||||||||||
|
Property, plant & equipment
|
A,C
|
|
740,844
|
80,810
|
821,654
|
|||||||||||
|
Intangible assets
|
C |
|
51,333
|
(51,333
|
)
|
-
|
||||||||||
|
Other assets
|
|
|
131,405
|
-
|
131,405
|
|||||||||||
|
|
|
|||||||||||||||
|
Total assets
|
|
|
925,686
|
29,477
|
955,163
|
|||||||||||
|
|
|
|||||||||||||||
|
Accounts payable and deferred expenses
|
A |
|
14,167
|
(2,107
|
)
|
12,060
|
||||||||||
|
Other liabilities
|
|
|
412,217
|
(105
|
)
|
412,112
|
||||||||||
|
|
|
|||||||||||||||
|
Total liabilities
|
|
|
426,384
|
(2,212
|
)
|
424,172
|
||||||||||
|
|
|
|||||||||||||||
|
Partners’ equity
|
A |
|
499,302
|
31,689
|
530,991
|
|||||||||||
|
|
||||||||||||||||
|
Total liabilities and equity
|
|
925,686
|
29,477
|
955,163
|
||||||||||||
|
For the six-month period ended June 30, 2024
|
||||||||||||||||||||
|
US GAAP
|
IFRS adjustments
|
Adjustments to the Group’s accounting policies*
|
IFRS - according to the Group’s accounting policies
|
|||||||||||||||||
|
In USD thousand
|
In USD thousand
|
In USD thousand
|
In USD thousand
|
|||||||||||||||||
|
Revenues
|
B |
|
218,992
|
(17,292
|
)
|
-
|
201,700
|
|||||||||||||
|
Operating expenses
|
A |
|
130,903
|
(4,277
|
)
|
-
|
126,626
|
|||||||||||||
|
Depreciation and amortization
|
A |
|
14,454
|
2,804
|
-
|
17,258
|
||||||||||||||
|
|
|
|||||||||||||||||||
|
Operating profit
|
|
|
73,635
|
(15,819
|
)
|
-
|
57,816
|
|||||||||||||
|
|
|
|||||||||||||||||||
|
Finance expenses
|
B |
|
10,149
|
(2,611
|
)
|
-
|
7,538
|
|||||||||||||
|
|
|
|||||||||||||||||||
|
Profit for the period
|
|
|
63,486
|
(13,208
|
)
|
-
|
50,278
|
|||||||||||||
|
|
|
|||||||||||||||||||
|
Other comprehensive loss
|
B |
|
(35,006
|
)
|
15,085
|
-
|
(19,921
|
)
|
||||||||||||
|
|
||||||||||||||||||||
|
Comprehensive income for the period
|
28,480
|
1,877
|
-
|
30,357
|
||||||||||||||||
|
For the six-month period ended June 30, 2023
|
||||||||||||||||||||
|
US GAAP
|
IFRS adjustments
|
Adjustments to the Group’s accounting policies*
|
IFRS - according to the Group’s accounting policies
|
|||||||||||||||||
|
In USD thousand
|
In USD thousand
|
In USD thousand
|
In USD thousand
|
|||||||||||||||||
|
Revenues
|
|
186,658
|
1,838
|
5,309
|
193,805
|
|||||||||||||||
|
Operating expenses
|
|
A |
|
93,402
|
(4,298
|
)
|
5,309
|
94,413
|
||||||||||||
|
Depreciation and amortization
|
|
A |
|
14,415
|
2,804
|
-
|
17,219
|
|||||||||||||
|
|
|
|
||||||||||||||||||
|
Operating profit
|
|
|
|
78,841
|
3,332
|
-
|
82,173
|
|||||||||||||
|
|
|
|
||||||||||||||||||
|
Finance expenses
|
|
B |
|
12,677
|
(2,885
|
)
|
-
|
9,792
|
||||||||||||
|
|
|
|
||||||||||||||||||
|
Profit for the period
|
|
|
|
66,164
|
6,217
|
-
|
72,381
|
|||||||||||||
|
|
|
|
||||||||||||||||||
|
Other comprehensive income (loss)
|
|
B |
|
3,433
|
(4,758
|
)
|
-
|
(1,325
|
)
|
|||||||||||
|
|
|
|
||||||||||||||||||
|
Comprehensive income for the period
|
69,597
|
1,459
|
-
|
71,056
|
||||||||||||||||
|
For the three-month period ended June 30, 2024
|
||||||||||||||||||||
|
US GAAP
|
IFRS adjustments
|
Adjustments to the Group’s accounting policies*
|
IFRS - according to the Group’s accounting policies
|
|||||||||||||||||
|
In USD thousand
|
In USD thousand
|
In USD thousand
|
In USD thousand
|
|||||||||||||||||
|
Revenues
|
84,648
|
(2,085
|
)
|
-
|
82,563
|
|||||||||||||||
|
Operating expenses
|
A |
|
47,511
|
(1,910
|
)
|
-
|
45,601
|
|||||||||||||
|
Depreciation and amortization
|
A |
|
7,227
|
1,402
|
-
|
8,629
|
||||||||||||||
|
|
|
|||||||||||||||||||
|
Operating profit
|
|
|
29,910
|
(1,577
|
)
|
-
|
28,333
|
|||||||||||||
|
|
|
|||||||||||||||||||
|
Finance expenses
|
B |
|
5,710
|
(1,529
|
)
|
-
|
4,181
|
|||||||||||||
|
|
|
|||||||||||||||||||
|
Profit for the period
|
|
|
24,200
|
(48
|
)
|
-
|
24,152
|
|||||||||||||
|
|
|
|||||||||||||||||||
|
Other comprehensive loss
|
B |
|
(15,862
|
)
|
978
|
-
|
(14,884
|
)
|
||||||||||||
|
Comprehensive income for the period
|
8,338
|
930
|
-
|
9,268
|
||||||||||||||||
|
For the three-month period ended June 30, 2023
|
||||||||||||||||||||
|
US GAAP
|
IFRS adjustments
|
Adjustments to the Group’s accounting policies*
|
IFRS - according to the Group’s accounting policies
|
|||||||||||||||||
|
In USD thousand
|
In USD thousand
|
In USD thousand
|
In USD thousand
|
|||||||||||||||||
|
Revenues
|
72,772
|
1,838
|
6,805
|
81,415
|
||||||||||||||||
|
Operating expenses
|
A |
|
36,852
|
(2,189
|
)
|
6,805
|
41,468
|
|||||||||||||
|
Depreciation and amortization
|
A |
|
7,206
|
1,402
|
-
|
8,608
|
||||||||||||||
|
|
|
|||||||||||||||||||
|
Operating profit
|
|
|
28,714
|
2,625
|
-
|
31,339
|
||||||||||||||
|
|
|
|||||||||||||||||||
|
Finance expenses
|
B |
|
6,007
|
(1,495
|
)
|
-
|
4,512
|
|||||||||||||
|
|
|
|||||||||||||||||||
|
Profit for the period
|
|
|
22,707
|
4,120
|
-
|
26,827
|
||||||||||||||
|
|
|
|||||||||||||||||||
|
Other comprehensive income
|
B |
|
7,399
|
(3,351
|
)
|
-
|
4,048
|
|||||||||||||
|
Comprehensive income for the period
|
30,106
|
769
|
-
|
30,875
|
||||||||||||||||
|
For the year ended December 31, 2023
|
||||||||||||||||||||
|
US GAAP
|
IFRS adjustments
|
Adjustments to the Group’s accounting policies*
|
IFRS - according to the Group’s accounting policies
|
|||||||||||||||||
|
In USD thousand
|
In USD thousand
|
In USD thousand
|
In USD thousand
|
|||||||||||||||||
|
Revenues
|
B |
|
380,081
|
19,039
|
15,698
|
414,818
|
||||||||||||||
|
Operating expenses
|
A |
|
198,011
|
(8,765
|
)
|
15,698
|
204,944
|
|||||||||||||
|
Depreciation and amortization
|
A |
|
28,843
|
5,609
|
-
|
34,452
|
||||||||||||||
|
|
|
|||||||||||||||||||
|
Operating profit
|
|
|
153,227
|
22,195
|
-
|
175,422
|
||||||||||||||
|
|
|
|||||||||||||||||||
|
Finance expenses
|
B |
|
19,317
|
(7,346
|
)
|
-
|
11,971
|
|||||||||||||
|
|
|
|||||||||||||||||||
|
Profit for the year
|
|
|
133,910
|
29,541
|
-
|
163,451
|
||||||||||||||
|
|
|
|||||||||||||||||||
|
Other comprehensive loss
|
B |
|
(4,815
|
)
|
(26,455
|
)
|
-
|
(31,270
|
)
|
|||||||||||
|
Comprehensive income for the year
|
129,095
|
3,086
|
-
|
132,181
|
||||||||||||||||
|
For the six-month period ended June 30, 2024
|
||||||||||||||||
|
US GAAP
|
Adjustments
|
IFRS
|
||||||||||||||
|
In USD thousand
|
In USD thousand
|
In USD thousand
|
||||||||||||||
|
Profit for the period
|
63,486
|
(13,208
|
)
|
50,278
|
||||||||||||
|
Net cash provided by operating activities
|
69,401
|
-
|
69,401
|
|||||||||||||
|
Net cash provided by (used for) investing activities
|
D |
|
(575
|
)
|
44,087
|
43,512
|
||||||||||
|
Net cash used for financing activities
|
|
|
(102,700
|
)
|
-
|
(102,700
|
)
|
|||||||||
|
|
|
|||||||||||||||
|
Net increase (decrease) in cash and cash equivalents
|
|
|
(33,874
|
)
|
44,087
|
10,213
|
||||||||||
|
|
|
|||||||||||||||
|
Balance of cash and cash equivalents of the beginning of period
|
D |
|
100
|
1,946
|
2,046
|
|||||||||||
|
|
|
|||||||||||||||
|
Restricted cash balance as of the beginning of the period
|
D |
|
46,767
|
(46,767
|
)
|
-
|
||||||||||
|
|
|
|||||||||||||||
|
Balance of cash and cash equivalents as of the end of the period
|
D |
|
99
|
12,160
|
12,259
|
|||||||||||
|
|
|
|||||||||||||||
|
Restricted cash balance as of the end of the period
|
D |
|
12,894
|
(12,894
|
)
|
-
|
||||||||||
|
For the six-month period ended June 30, 2023
|
||||||||||||||||
|
US GAAP
|
Adjustments
|
IFRS
|
||||||||||||||
|
In USD thousand
|
In USD thousand
|
In USD thousand
|
||||||||||||||
|
Profit for the period
|
66,164
|
6,217
|
72,381
|
|||||||||||||
|
Net cash provided by operating activities
|
54,710
|
-
|
54,710
|
|||||||||||||
|
Net cash provided by (used for) investing activities
|
D |
|
(75
|
)
|
29,267
|
29,192
|
||||||||||
|
Net cash used for financing activities
|
|
|
(115,794
|
)
|
-
|
(115,794
|
)
|
|||||||||
|
|
|
|||||||||||||||
|
Net decrease in cash and cash equivalents
|
|
|
(61,159
|
)
|
29,267
|
(31,892
|
)
|
|||||||||
|
|
|
|||||||||||||||
|
Balance of cash and cash equivalents of the beginning of period
|
D |
|
90
|
40,230
|
40,320
|
|||||||||||
|
|
|
|||||||||||||||
|
Restricted cash balance as of the beginning of the period
|
D |
|
119,838
|
(119,838
|
)
|
-
|
||||||||||
|
|
|
|||||||||||||||
|
Balance of cash and cash equivalents as of the end of the period
|
D |
|
100
|
8,328
|
8,428
|
|||||||||||
|
|
|
|||||||||||||||
|
Restricted cash balance as of the end of the period
|
D |
|
58,669
|
(58,669
|
)
|
-
|
||||||||||
|
For the three-month period ended June 30, 2024
|
||||||||||||||||
|
US GAAP
|
Adjustments
|
IFRS
|
||||||||||||||
|
In USD thousand
|
In USD thousand
|
In USD thousand
|
||||||||||||||
|
Profit for the period
|
24,200
|
(48
|
)
|
24,152
|
||||||||||||
|
Net cash provided by operating activities
|
27,618
|
-
|
27,618
|
|||||||||||||
|
Net cash provided by (used for) investing activities
|
D |
|
(457
|
)
|
45,397
|
44,940
|
||||||||||
|
Net cash used for financing activities
|
|
|
(61,263
|
)
|
-
|
(61,263
|
)
|
|||||||||
|
|
|
|||||||||||||||
|
Net increase (decrease) in cash and cash equivalents
|
|
|
(34,102
|
)
|
45,397
|
11,295
|
||||||||||
|
|
|
|||||||||||||||
|
Balance of cash and cash equivalents of the beginning of period
|
D |
|
98
|
866
|
964
|
|||||||||||
|
|
|
|||||||||||||||
|
Restricted cash balance as of the beginning of the period
|
D |
|
46,997
|
(46,997
|
)
|
-
|
||||||||||
|
|
|
|||||||||||||||
|
Balance of cash and cash equivalents as of the end of the period
|
D |
|
99
|
12,160
|
12,259
|
|||||||||||
|
|
|
|||||||||||||||
|
Restricted cash balance as of the end of the period
|
D |
|
12,894
|
(12,894
|
)
|
-
|
||||||||||
|
For the three-month period ended June 30, 2023
|
||||||||||||||||
|
US GAAP
|
Adjustments
|
IFRS
|
||||||||||||||
|
In USD thousand
|
In USD thousand
|
In USD thousand
|
||||||||||||||
|
Profit for the period
|
22,707
|
4,120
|
26,827
|
|||||||||||||
|
Net cash provided by operating activities
|
|
22,267
|
-
|
22,267
|
||||||||||||
|
Net cash provided by (used for) investing activities
|
|
D |
|
(75
|
)
|
25,073
|
24,998
|
|||||||||
|
Net cash used for financing activities
|
|
|
|
(49,815
|
)
|
-
|
(49,815
|
)
|
||||||||
|
|
|
|
||||||||||||||
|
Net decrease in cash and cash equivalents
|
|
|
|
(27,623
|
)
|
25,073
|
(2,550
|
)
|
||||||||
|
|
|
|
||||||||||||||
|
Balance of cash and cash equivalents of the beginning of period
|
|
D |
|
100
|
10,878
|
10,978
|
||||||||||
|
|
|
|
||||||||||||||
|
Restricted cash balance as of the beginning of the period
|
|
D |
|
86,292
|
(86,292
|
)
|
-
|
|||||||||
|
|
|
|
||||||||||||||
|
Balance of cash and cash equivalents as of the end of the period
|
|
D |
|
100
|
8,328
|
8,428
|
||||||||||
|
|
|
|
||||||||||||||
|
Restricted cash balance as of the end of the period
|
|
D |
|
58,669
|
(58,669
|
)
|
-
|
|||||||||
|
For the year ended December 31, 2023
|
||||||||||||||||
|
US GAAP
|
Adjustments
|
IFRS
|
||||||||||||||
|
In USD thousand
|
In USD thousand
|
In USD thousand
|
||||||||||||||
|
Profit for the year
|
133,910
|
29,541
|
163,451
|
|||||||||||||
|
Net cash provided by operating activities
|
122,769
|
-
|
122,769
|
|||||||||||||
|
Net cash provided by (used for) investing activities
|
D |
|
(1,182
|
)
|
34,787
|
33,605
|
||||||||||
|
Net cash used for financing activities
|
|
|
(194,648
|
)
|
-
|
(194,648
|
)
|
|||||||||
|
|
|
|||||||||||||||
|
Net decrease in cash and cash equivalents
|
|
|
(73,061
|
)
|
34,787
|
(38,274
|
)
|
|||||||||
|
|
|
|||||||||||||||
|
Balance of cash and cash equivalents as of the beginning of the year
|
D |
|
90
|
40,230
|
40,320
|
|||||||||||
|
|
|
|||||||||||||||
|
Restricted cash balance as of the beginning of the year
|
D |
|
119,838
|
(119,838
|
)
|
-
|
||||||||||
|
|
|
|||||||||||||||
|
Balance of cash and cash equivalents as of the end of the year
|
D |
|
100
|
1,946
|
2,046
|
|||||||||||
|
|
|
|||||||||||||||
|
Restricted cash balance as of the end of the year
|
D |
|
46,767
|
(46,767
|
)
|
-
|
||||||||||
|
As of June 30, 2024
|
||||||||||||||||
|
US GAAP
|
Adjustments
|
IFRS
|
||||||||||||||
|
In USD thousand
|
In USD thousand
|
In USD thousand
|
||||||||||||||
|
Cash and cash equivalents
|
D |
|
49
|
1,610
|
1,659
|
|||||||||||
|
Restricted cash
|
D |
|
3,780
|
(1,610
|
)
|
2,170
|
||||||||||
|
Derivatives
|
F |
|
223
|
7,863
|
8,086
|
|||||||||||
|
Property, plant & equipment
|
A, C,H
|
|
571,913
|
(67,091
|
)
|
504,822
|
||||||||||
|
Intangible assets
|
C |
|
14,425
|
(14,425
|
)
|
-
|
||||||||||
|
Right‑of‑use assets
|
E |
|
88,151
|
137,496
|
225,647
|
|||||||||||
|
Other assets
|
F |
|
105,607
|
(8,027
|
)
|
97,580
|
||||||||||
|
|
|
|||||||||||||||
|
Total assets
|
|
|
784,148
|
55,816
|
839,964
|
|||||||||||
|
|
|
|||||||||||||||
|
Accounts payable and deferred expenses
|
A |
|
29,660
|
(1,303
|
)
|
28,357
|
||||||||||
|
Long-term lease liability
|
E |
|
75,114
|
142,524
|
217,638
|
|||||||||||
|
Other liabilities
|
|
|
455,975
|
8,667
|
464,642
|
|||||||||||
|
|
|
|||||||||||||||
|
Total liabilities
|
|
|
560,749
|
149,888
|
710,637
|
|||||||||||
|
|
|
|||||||||||||||
|
Partners’ equity
|
A, E,F
|
|
223,399
|
(94,072
|
)
|
129,327
|
||||||||||
|
Total liabilities and equity
|
784,148
|
55,816
|
839,964
|
|||||||||||||
|
As of June 30, 2023
|
||||||||||||||||
|
US GAAP
|
Adjustments
|
IFRS
|
||||||||||||||
|
In USD thousand
|
In USD thousand
|
In USD thousand
|
||||||||||||||
|
|
||||||||||||||||
|
Cash and cash equivalents
|
|
D |
|
41
|
4,947
|
4,988
|
||||||||||
|
Restricted cash
|
|
D |
|
4,947
|
(4,947
|
)
|
-
|
|||||||||
|
Property, plant & equipment
|
A, C,H
|
|
593,026
|
(65,942
|
)
|
527,084
|
||||||||||
|
Intangible assets
|
C |
|
14,973
|
(14,973
|
)
|
-
|
||||||||||
|
Right‑of‑use assets
|
E |
|
89,790
|
144,614
|
234,404
|
|||||||||||
|
Other assets
|
|
|
130,158
|
(808
|
)
|
129,350
|
||||||||||
|
|
|
|||||||||||||||
|
Total assets
|
|
|
832,935
|
62,891
|
895,826
|
|||||||||||
|
|
|
|||||||||||||||
|
Accounts payable and deferred expenses
|
A |
|
11,462
|
(976
|
)
|
10,486
|
||||||||||
|
Long-term lease liability
|
|
|
76,466
|
145,745
|
222,211
|
|||||||||||
|
Other liabilities
|
|
|
452,702
|
7,864
|
460,566
|
|||||||||||
|
|
|
|||||||||||||||
|
Total liabilities
|
|
|
540,630
|
152,633
|
693,263
|
|||||||||||
|
|
|
|||||||||||||||
|
Partners’ equity
|
A,E
|
|
292,305
|
(89,742
|
)
|
202,563
|
||||||||||
|
Total liabilities and equity
|
832,935
|
62,891
|
895,826
|
|||||||||||||
|
As of December 31, 2023
|
||||||||||||||||
|
US GAAP
|
Adjustments
|
IFRS
|
||||||||||||||
|
In USD thousand
|
In USD thousand
|
In USD thousand
|
||||||||||||||
|
Cash and cash equivalents
|
D |
|
48
|
5,400
|
5,448
|
|||||||||||
|
Restricted cash
|
D |
|
7,529
|
(5,400
|
)
|
2,129
|
||||||||||
|
Derivatives
|
F |
|
-
|
14,304
|
14,304
|
|||||||||||
|
Property, plant & equipment
|
A, C,H
|
|
582,326
|
(66,842
|
)
|
515,484
|
||||||||||
|
Intangible assets
|
C |
|
14,699
|
(14,699
|
)
|
-
|
||||||||||
|
Right‑of‑use assets
|
E |
|
88,979
|
141,044
|
230,023
|
|||||||||||
|
Other assets
|
|
|
126,619
|
(15,638
|
)
|
110,981
|
||||||||||
|
|
|
|||||||||||||||
|
Total assets
|
|
|
820,200
|
58,169
|
878,369
|
|||||||||||
|
|
|
|||||||||||||||
|
Accounts payable and deferred expenses
|
A |
|
21,652
|
(2,615
|
)
|
19,037
|
||||||||||
|
Long-term lease liability
|
|
|
75,775
|
144,152
|
219,927
|
|||||||||||
|
Other liabilities
|
|
|
463,073
|
8,316
|
471,389
|
|||||||||||
|
|
|
|||||||||||||||
|
Total liabilities
|
|
|
560,500
|
149,853
|
710,353
|
|||||||||||
|
|
|
|||||||||||||||
|
Partners’ equity
|
A, E,F
|
|
259,700
|
(91,684
|
)
|
168,016
|
||||||||||
|
Total liabilities and equity
|
820,200
|
58,169
|
878,369
|
|||||||||||||
|
For the six-month period ended June 30, 2024
|
||||||||||||||||||||
|
US GAAP
|
IFRS adjustments
|
Adjustments to the Group’s accounting policies*
|
IFRS - according to the Group’s accounting policies
|
|||||||||||||||||
|
In USD thousand
|
In USD thousand
|
In USD thousand
|
In USD thousand
|
|||||||||||||||||
|
Revenues
|
B |
|
83,882
|
(737
|
)
|
-
|
83,145
|
|||||||||||||
|
Fuels and other
|
E |
|
57,681
|
(7,973
|
)
|
-
|
49,708
|
|||||||||||||
|
Other operating expenses
|
A |
|
33,587
|
(2,880
|
)
|
-
|
30,707
|
|||||||||||||
|
Depreciation and amortization
|
A, E,H
|
|
10,985
|
7,739
|
-
|
18,724
|
||||||||||||||
|
|
||||||||||||||||||||
|
Operating loss
|
|
(18,371
|
)
|
2,377
|
-
|
(15,994
|
)
|
|||||||||||||
|
|
||||||||||||||||||||
|
Finance expenses
|
B,E
|
|
14,096
|
5,902
|
-
|
19,998
|
||||||||||||||
|
|
||||||||||||||||||||
|
Loss for the period
|
|
(32,467
|
)
|
(3,525
|
)
|
-
|
(35,992
|
)
|
||||||||||||
|
|
||||||||||||||||||||
|
Other comprehensive loss
|
B |
|
(3,834
|
)
|
1,138
|
-
|
(2,696
|
)
|
||||||||||||
|
Comprehensive loss for the period
|
(36,301
|
)
|
(2,387
|
)
|
-
|
(38,688
|
)
|
|||||||||||||
|
For the six-month period ended June 30, 2023
|
||||||||||||||||||||
|
US GAAP
|
IFRS adjustments
|
Adjustments to the Group’s accounting policies*
|
IFRS - according to the Group’s accounting policies
|
|||||||||||||||||
|
In USD thousand
|
In USD thousand
|
In USD thousand
|
In USD thousand
|
|||||||||||||||||
|
Revenues
|
B |
|
28,788
|
1,443
|
-
|
30,231
|
||||||||||||||
|
Fuels and other
|
E |
|
31,604
|
(7,973
|
)
|
-
|
23,631
|
|||||||||||||
|
Other operating expenses
|
A |
|
37,477
|
(14,636
|
)
|
-
|
22,841
|
|||||||||||||
|
Depreciation and amortization
|
A, E,H
|
|
10,983
|
4,485
|
-
|
15,468
|
||||||||||||||
|
|
||||||||||||||||||||
|
Operating loss
|
|
(51,276
|
)
|
19,567
|
-
|
(31,709
|
)
|
|||||||||||||
|
|
||||||||||||||||||||
|
Finance expenses
|
B,E
|
|
13,381
|
3,977
|
-
|
17,538
|
||||||||||||||
|
|
||||||||||||||||||||
|
Loss for the period
|
|
(64,657
|
)
|
15,590
|
-
|
(49,067
|
)
|
|||||||||||||
|
|
||||||||||||||||||||
|
Other comprehensive loss
|
B |
|
(2,691
|
)
|
(3,076
|
)
|
-
|
(5,767
|
)
|
|||||||||||
|
Comprehensive loss for the period
|
(67,348
|
)
|
12,514
|
-
|
(54,834
|
)
|
||||||||||||||
|
For the three-month period ended June 30, 2024
|
||||||||||||||||||||
|
US GAAP
|
IFRS adjustments
|
Adjustments to the Group’s accounting policies*
|
IFRS - according to the Group’s accounting policies
|
|||||||||||||||||
|
In USD thousand
|
In USD thousand
|
In USD thousand
|
In USD thousand
|
|||||||||||||||||
|
Revenues
|
B |
|
39,330
|
(297
|
)
|
-
|
39,033
|
|||||||||||||
|
Fuels and other
|
E |
|
25,878
|
(3,987
|
)
|
-
|
21,891
|
|||||||||||||
|
Other operating expenses
|
A |
|
18,718
|
(1,281
|
)
|
-
|
17,743
|
|||||||||||||
|
Depreciation and amortization
|
A, E,H
|
|
5,495
|
3,870
|
-
|
9,365
|
||||||||||||||
|
|
||||||||||||||||||||
|
Operating loss
|
|
(10,761
|
)
|
1,101
|
-
|
(9,660
|
)
|
|||||||||||||
|
|
||||||||||||||||||||
|
Finance expenses
|
B,E
|
|
7,161
|
2,897
|
-
|
10,058
|
||||||||||||||
|
|
||||||||||||||||||||
|
Loss for the period
|
|
(17,922
|
)
|
(1,796
|
)
|
-
|
(19,718
|
)
|
||||||||||||
|
|
||||||||||||||||||||
|
Other comprehensive loss
|
B |
|
4,790
|
479
|
-
|
5,269
|
||||||||||||||
|
Comprehensive loss for the period
|
(13,132
|
)
|
(1,317
|
)
|
-
|
(14,449
|
)
|
|||||||||||||
|
For the three-month period ended June 30, 2023
|
||||||||||||||||||||
|
US GAAP
|
IFRS adjustments
|
Adjustments to the Group’s accounting policies*
|
IFRS - according to the Group’s accounting policies
|
|||||||||||||||||
|
In USD thousand
|
In USD thousand
|
In USD thousand
|
In USD thousand
|
|||||||||||||||||
|
Revenues
|
B |
|
16,614
|
1,443
|
-
|
(18,057
|
)
|
|||||||||||||
|
Fuels and other
|
E |
|
10,309
|
(3,987
|
)
|
6,322
|
||||||||||||||
|
Other operating expenses
|
A |
|
18,757
|
(8,227
|
)
|
-
|
10,530
|
|||||||||||||
|
Depreciation and amortization
|
A, E,H
|
|
5,489
|
2,966
|
-
|
8,455
|
||||||||||||||
|
|
||||||||||||||||||||
|
Operating loss
|
|
(17,941
|
)
|
10,691
|
-
|
(7,250
|
)
|
|||||||||||||
|
|
||||||||||||||||||||
|
Finance expenses
|
B,E
|
|
6,764
|
1,990
|
-
|
8,754
|
||||||||||||||
|
|
||||||||||||||||||||
|
Loss for the period
|
|
(24,705
|
)
|
8,701
|
-
|
(16,004
|
)
|
|||||||||||||
|
|
||||||||||||||||||||
|
Other comprehensive loss
|
B |
|
150
|
(2,242
|
)
|
-
|
(2,092
|
)
|
||||||||||||
|
Comprehensive loss for the period
|
(24,555
|
)
|
6,459
|
-
|
(18,096
|
)
|
||||||||||||||
|
For the year ended December 31, 2023
|
||||||||||||||||||||
|
US GAAP
|
IFRS adjustments
|
Adjustments to the Group’s accounting policies*
|
IFRS - according to the Group’s accounting policies
|
|||||||||||||||||
|
In USD thousand
|
In USD thousand
|
In USD thousand
|
In USD thousand
|
|||||||||||||||||
|
Revenues
|
B |
|
112,217
|
749
|
-
|
122,966
|
||||||||||||||
|
Fuels and other
|
E |
|
80,782
|
(15,947
|
)
|
-
|
64,835
|
|||||||||||||
|
Other operating expenses
|
A |
|
66,611
|
(18,196
|
)
|
-
|
48,415
|
|||||||||||||
|
Depreciation and amortization
|
A, E,H
|
|
21,969
|
12,225
|
-
|
34,194
|
||||||||||||||
|
|
||||||||||||||||||||
|
Operating loss
|
|
(57,145
|
)
|
22,667
|
-
|
(34,478
|
)
|
|||||||||||||
|
|
||||||||||||||||||||
|
Finance expenses
|
B,E
|
|
27,863
|
8,312
|
-
|
36,175
|
||||||||||||||
|
|
||||||||||||||||||||
|
Loss for the year
|
|
(85,008
|
)
|
14,355
|
-
|
(74,653
|
)
|
|||||||||||||
|
|
||||||||||||||||||||
|
Other comprehensive loss
|
B |
|
(14,945
|
)
|
(3,783
|
)
|
-
|
(18,728
|
)
|
|||||||||||
|
Comprehensive loss for the year
|
(99,953
|
)
|
10,572
|
-
|
(89,381
|
)
|
||||||||||||||
|
For the six-month period ended June 30, 2024
|
||||||||||||||||
|
US GAAP
|
Adjustments
|
IFRS
|
||||||||||||||
|
In USD thousand
|
In USD thousand
|
In USD thousand
|
||||||||||||||
|
Loss for the period
|
(32,467
|
)
|
(3,525
|
)
|
(35,992
|
)
|
||||||||||
|
Net cash used for operating activities
|
(3,417
|
)
|
-
|
(3,417
|
)
|
|||||||||||
|
Net cash used for investing activities
|
D |
|
(298
|
)
|
(6,043
|
)
|
(6,341
|
)
|
||||||||
|
Net cash provided by financing activities
|
|
|
5,969
|
-
|
5,969
|
|||||||||||
|
|
|
|||||||||||||||
|
Net increase (decrease) in cash and cash equivalents
|
|
|
2,254
|
(6,043
|
)
|
(3,789
|
)
|
|||||||||
|
|
|
|||||||||||||||
|
Balance of cash and cash equivalents of the beginning of period
|
D |
|
48
|
5,400
|
5,448
|
|||||||||||
|
|
|
|||||||||||||||
|
Restricted cash balance as of the beginning of the period
|
D |
|
77,610
|
(77,610
|
)
|
-
|
||||||||||
|
|
|
|||||||||||||||
|
Balance of cash and cash equivalents as of the end of the period
|
D |
|
49
|
1,610
|
1,659
|
|||||||||||
|
|
|
|||||||||||||||
|
Restricted cash balance as of the end of the period
|
D |
|
79,864
|
(79,864
|
)
|
-
|
||||||||||
|
For the six-month period ended June 30, 2023
|
||||||||||||||||
|
US GAAP
|
Adjustments
|
IFRS
|
||||||||||||||
|
In USD thousand
|
In USD thousand
|
In USD thousand
|
||||||||||||||
|
Loss for the period
|
(64,657
|
)
|
15,590
|
(49,067
|
)
|
|||||||||||
|
Net cash used for operating activities
|
(6,541
|
)
|
-
|
(6,541
|
)
|
|||||||||||
|
Net cash used for investing activities
|
D |
|
(395
|
)
|
(1,048
|
)
|
(1,443
|
)
|
||||||||
|
Net cash provided by financing activities
|
|
|
1,000
|
-
|
1,000
|
|||||||||||
|
|
|
|||||||||||||||
|
Net decrease in cash and cash equivalents
|
|
|
(5,936
|
)
|
(1,048
|
)
|
(6,984
|
)
|
||||||||
|
|
|
|||||||||||||||
|
Balance of cash and cash equivalents of the beginning of period
|
D |
|
39
|
11,933
|
11,972
|
|||||||||||
|
|
|
|||||||||||||||
|
Restricted cash balance as of the beginning of the period
|
D |
|
89,905
|
(89,905
|
)
|
-
|
||||||||||
|
|
|
|||||||||||||||
|
Balance of cash and cash equivalents as of the end of the period
|
D |
|
41
|
4,947
|
4,988
|
|||||||||||
|
|
|
|||||||||||||||
|
Restricted cash balance as of the end of the period
|
D |
|
83,967
|
(83,967
|
)
|
-
|
||||||||||
|
For the three-month period ended June 30, 2024
|
||||||||||||||||
|
US GAAP
|
Adjustments
|
IFRS
|
||||||||||||||
|
In USD thousand
|
In USD thousand
|
In USD thousand
|
||||||||||||||
|
Loss for the period
|
(17,992
|
)
|
(1,796
|
)
|
(19,788
|
)
|
||||||||||
|
Net cash provided by operating activities
|
442
|
-
|
442
|
|||||||||||||
|
Net cash used for investing activities
|
D |
|
(298
|
)
|
(5,125
|
)
|
(5,423
|
)
|
||||||||
|
Net cash provided by financing activities
|
|
|
5,100
|
-
|
5,100
|
|||||||||||
|
|
|
|||||||||||||||
|
Net increase in cash and cash equivalents
|
|
|
5,244
|
(5,125
|
)
|
119
|
||||||||||
|
|
|
|||||||||||||||
|
Balance of cash and cash equivalents of the beginning of period
|
D |
|
48
|
1,492
|
1,540
|
|||||||||||
|
|
|
|||||||||||||||
|
Restricted cash balance as of the beginning of the period
|
D |
|
77,618
|
(77,618
|
)
|
-
|
||||||||||
|
|
|
|||||||||||||||
|
Balance of cash and cash equivalents as of the end of the period
|
D |
|
49
|
1,609
|
1,658
|
|||||||||||
|
|
|
|||||||||||||||
|
Restricted cash balance as of the end of the period
|
D |
|
79,862
|
(79,862
|
)
|
-
|
||||||||||
|
For the three-month period ended June 30, 2023
|
||||||||||||||||
|
US GAAP
|
Adjustments
|
IFRS
|
||||||||||||||
|
In USD thousand
|
In USD thousand
|
In USD thousand
|
||||||||||||||
|
Loss for the period
|
(24,705
|
)
|
8,701
|
(16,004
|
)
|
|||||||||||
|
Net cash used for operating activities
|
(460
|
)
|
-
|
(460
|
)
|
|||||||||||
|
Net cash provided by (used for) investing activities
|
D |
|
(368
|
)
|
4,014
|
3,646
|
||||||||||
|
Net cash used for financing activities
|
|
|
(4,000
|
)
|
-
|
(4,000
|
)
|
|||||||||
|
|
|
|||||||||||||||
|
Net decrease in cash and cash equivalents
|
|
|
(4,828
|
)
|
(4,014
|
) |
(814
|
)
|
||||||||
|
|
|
|||||||||||||||
|
Balance of cash and cash equivalents of the beginning of period
|
D |
|
41
|
5,761
|
5,802
|
|||||||||||
|
|
|
|||||||||||||||
|
Restricted cash balance as of the beginning of the period
|
D |
|
88,794
|
(88,794
|
)
|
-
|
||||||||||
|
|
|
|||||||||||||||
|
Balance of cash and cash equivalents as of the end of the period
|
D |
|
41
|
4,947
|
4,988
|
|||||||||||
|
|
|
|||||||||||||||
|
Restricted cash balance as of the end of the period
|
D |
|
83,967
|
(83,967
|
)
|
-
|
||||||||||
|
For the year ended December 31, 2023
|
||||||||||||||||
|
US GAAP
|
Adjustments
|
IFRS
|
||||||||||||||
|
In USD thousand
|
In USD thousand
|
In USD thousand
|
||||||||||||||
|
Loss for the year
|
(85,008
|
)
|
14,355
|
(70,653
|
)
|
|||||||||||
|
Net cash provided by operating activities
|
4,157
|
-
|
4,157
|
|||||||||||||
|
Net cash provided by (used for) investing activities
|
D |
|
(408
|
)
|
5,763
|
5,355
|
||||||||||
|
Net cash used for financing activities
|
|
|
(16,036
|
)
|
-
|
(16,036
|
)
|
|||||||||
|
|
|
|||||||||||||||
|
Net decrease in cash and cash equivalents
|
|
|
(12,287
|
)
|
5,763
|
(6,524
|
)
|
|||||||||
|
|
|
|||||||||||||||
|
Balance of cash and cash equivalents as of the beginning of the year
|
D |
|
39
|
11,933
|
11,972
|
|||||||||||
|
|
|
|||||||||||||||
|
Restricted cash balance as of the beginning of the year
|
D |
|
89,905
|
(89,905
|
)
|
-
|
||||||||||
|
|
|
|||||||||||||||
|
Balance of cash and cash equivalents as of the end of the year
|
D |
|
48
|
5,400
|
5,448
|
|||||||||||
|
|
|
|||||||||||||||
|
Restricted cash balance as of the end of the year
|
D |
|
77,609
|
(77,609
|
)
|
-
|
||||||||||
|
|
A. |
Maintenance costs under the Long Term Maintenance Plan (hereinafter - the “LTPC Agreement”): under IFRS, variable payments which were paid in accordance with the milestones as set in the LTPC Agreement are capitalized to the cost
of property, plant and equipment and amortized over the period from the date on which maintenance work was carried out until the date on which maintenance work is due to take place again. Under US GAAP, the said payments are
recognized on payment date within current expenses in the statement of profit and loss.
|
|
|
B. |
Hedge effectiveness of swaps: in accordance with the IFRS - the associates recognize adjustments relating to the ineffective portion of their cash flow hedge under profit and loss. Under US GAAP, there is no part which is not
effective, and the hedging results are recognized in full in other comprehensive income.
|
|
|
C. |
Intangible assets: Under IFRS, certain intangible assets are defined as property, plant and equipment.
|
|
|
D. |
Restricted cash: There is a difference between the presentation and classification of restricted cash in the cash flow statements and in the statements of financial position.
|
|
|
E. |
Right-of-use assets: In IFRS, certain contracts are classified as leases. Under US GAAP, these contracts do not meet the definition of lease contracts and are recorded as an operating expense.
|
|
|
F. |
Certain compound financial instruments are classified in full as derivatives in IFRS. Under US GAAP, these financial instruments are bifurcated between derivatives and non-derivative financial instruments.
|
|
|
G. |
Impairment of property, plant and equipment in Valley: In 2021, prior to the acquisition date of CPV Group, indications of impairment of the property, plant and equipment were identified. Under IFRS, the carrying amount exceeded
the recoverable amount (the discounted cash flows that Valley expects to generate from the asset), and consequently an impairment loss was recognized. Under US GAAP, the non-discounted cash flows that Valley expects to generate from
the asset exceeded the carrying amount, and therefore no impairment loss was recognized. Since the impairment loss was taken into account as part of the excess cost allocation work as of the acquisition date of CPV Group, its
subsequent reversal in Valley’s financial statements, if recognized, shall not affect the Company's results.
|
|
|
H. |
Property, plant and equipment in Shore: In Shore’s financial statements the property, plant, and equipment is presented at historical cost. The adjustments to property, plant and equipment include, in addition to sections a and c
above, the allocation of excess cost carried out on the acquisition date of CPV Group.
|