|
|
KENON HOLDINGS LTD.
|
|||
|
Date: March 12, 2024
|
By:
|
/s/ Robert L. Rosen
|
||
|
|
Name:
|
Robert L. Rosen
|
||
|
|
Title:
|
Chief Executive Officer
|
||
| 1. |
Executive Summary1
|
|
For the
|
For the
|
||||||||||||||||||||||||
|
Year Ended
|
Three Months Ended
|
||||||||||||||||||||||||
|
December 31
|
December 31
|
||||||||||||||||||||||||
|
2023
|
2022
|
%
|
2023
|
2022
|
%
|
||||||||||||||||||||
|
Consolidated
|
Adjusted EBITDA after
|
||||||||||||||||||||||||
|
|
proportionate consolidation
|
1,109
|
818
|
36
|
%
|
296
|
219
|
35
|
%
|
||||||||||||||||
|
|
Net income
|
169
|
217
|
(22
|
%)
|
29
|
37
|
(22
|
%)
|
||||||||||||||||
|
|
Adjusted net income
|
177
|
171
|
4
|
%
|
11
|
51
|
(78
|
%)
|
||||||||||||||||
|
|
FFO
|
636
|
298
|
113
|
%
|
4
|
(27
|
)
|
31
|
M
|
|||||||||||||||
|
Israel
|
Adjusted EBITDA
|
580
|
367
|
58
|
%
|
135
|
102
|
32
|
%
|
||||||||||||||||
|
|
FFO
|
428
|
202
|
112
|
%
|
10
|
30
|
(133
|
%)
|
||||||||||||||||
|
U.S.
|
Adjusted EBITDA after
|
||||||||||||||||||||||||
|
|
proportionate consolidation
|
556
|
477
|
17
|
%
|
168
|
126
|
33
|
%
|
||||||||||||||||
|
|
FFO
|
264
|
201
|
31
|
%
|
(8
|
)
|
34
|
(42M
|
)
|
|||||||||||||||
|
|
Adjusted EBITDA renewable
|
||||||||||||||||||||||||
|
|
energies
|
31
|
26
|
19
|
%
|
14
|
4
|
250
|
%
|
||||||||||||||||
|
|
Leverage ratio*
|
||||||||||||||||||||||||
|
|
Adjusted EBITDA after
|
||||||||||||||||||||||||
|
|
proportionate consolidation
|
||||||||||||||||||||||||
|
|
energy transition
|
577
|
562
|
3
|
%
|
140
|
173
|
(19
|
%)
|
||||||||||||||||
| * |
Adjusted EBITDA, EBITDA after adjusted proportionate consolidation, adjusted net income, FFO and leverage ratio are not recognized in accordance with IFRS – for definitions and the manner of the calculation – see Sections 4B and 9 below.
|
| 1 |
The Executive Summary below is presented solely for convenience and it is not a substitute for reading the full detail (including with reference to the matters referred to in the Summary) as stated in this report
with all its parts (including warnings relating to “forward‑looking” information as it is defined in the Securities Law, 1968 (“the Securities Law”) definitions or explanations with respect to the indices for measurement of the results and
including the information included by means of reference, as applicable). This Summary includes estimates, plans and assessment of the Company, which constitute “forward‑looking” information regarding which there is no certainty it will
materialize and the readers are directed to the detail presented in this report below.
|
| 1. |
Executive Summary (Cont.)
|
|
Israel
|
Increase of 58% in the EBITDA
compared with last year – including a negative impact of the of the hourly demand brackets, in the amount of about NIS 33 million.
Completion of the Veridis
transaction and structural change in Israel – investment of capital of about NIS 452 million for continued growth in Israel.
Acquisition of the Gat power plant
(75 megawatts) and closing of the project financing at the end of March – for a consideration of about NIS 870 million, of which financing of about
NIS 450 million.
Commercial operation of the Karish
reservoir starting from the end of the first quarter – annual savings estimated at about NIS 60 million2 in respect of Rotem and Hadera.
Significant foothold in the
renewable energy area – the Ramat Bikah project (245 megawatts with integration of storage of 1,375 megawatts). Expectation of continued development on
the National Infrastructures Committee, after the government has approved the consent to advance the project.
Commercial operation of the Zomet
power plant (396 megawatts) in June – additional EBITDA for the activities in Israel for a representative year estimated at about NIS 145 million.
Signing of a non‑binding memorandum
of understanding with Intel for construction of a power plant having a capacity of 450 – 650 megawatts – supply of electricity to Intel’s facilities in
Kiryat Gat, including expansion of the facilities presently being constructed, for a period of 20 years from the operation date. Subject to completion of the development and planning processes, commencement of the construction is expected
to take place in 2026.
|
| 2 |
Estimates, as stated, constitute “forward‑looking” information, within the meaning thereof in the Securities Law, which are based on information and estimates of the Group as at
the date of the report. There is no certainty regarding the realization or the manner of the realization of such estimates, which are dependent on, among other things, factors that are not under the Company’s control.
|
| 1. |
Executive Summary (Cont.)
|
|
U.S.
|
Increase of about 17% in EBITDA
compared with last year – the electricity margins declined at a relatively moderate rate, despite the sharp drop in in the natural gas prices.
Commencement of construction of the
Backbone solar project in Maryland (179 megawatts) – expected increased ITC rate of 40% due to the IRA Law.
Acquisition of Mountain Wind wind
projects (81.5 megawatts) and closing of the project financing in the beginning of April – for a consideration of about NIS 625 million (about $175
million3), of which about NIS 270 million (about $75 million).
Revision and extension of the Valley
financing agreement – extension of the loan’s repayment date by about 3 years along with reduction of the debt by about $55 million (CPV’s share – 50%)
and update of the interest margin.
Commercial operation of the Three
Rivers project with a scope of 1,258 megawatts July – (CPV holds a 10% interest in the power plant).
Signing of a financing agreement for
construction of projects in the renewable energy segment – in the aggregate scope of about $370 million.
Commercial operation of the Maple
Hill solar project in the scope of 126 megawatts and realization of the investment of the tax partner (ITC 40%) – receipt of the entire proceeds of the
investment of the tax partner, in the amount of about NIS 304 million (about $82 million).
|
|
Group headquarters
|
Reconfirmation of a credit rating for the Company and its debentures of ‘ilA–’ and an update of the rating outlook to negative by S&P Maalot.
|
|
Renewal of binding credit frameworks – in the amount of NIS 550 million and LC frameworks for the CPV Group in the amount of $95 million (about NIS 345 million), which are valid up to the second half of
2024.
|
|
|
Issuance of a new series of
debentures – in January 2024, debentures (Series D) were issued, in the amount of NIS 200 million with an average of life of 6.4 years and coupon
(stated interest rate) of 6.2%.
|
| 3 |
In this report – the dollar means of the U.S. dollar.
|
| 1. |
Executive Summary (Cont.)
|

| (*) |
For additional information – see Section 6 below. That stated with respect to the stages of development, capacities and the expectation regarding construction of the development projects constitutes
“forward‑looking” information as it is defined in the Securities Law, which is based on the Company’s estimates at the date of the report and regarding which there is no certainty they will be realized. Ultimately, there could be changes in
the characteristics of the projects and/or delays due to regulatory and/or operating factors and/or realization of one or more of the risk factors to which the Company is exposed, as stated in Section A of the report. Advancement of the
development projects is subject to the discretion of the Company’s competent organs and existence (fulfillment) of additional conditions, as stated in Part A of the Periodic Report.
|
| (**) |
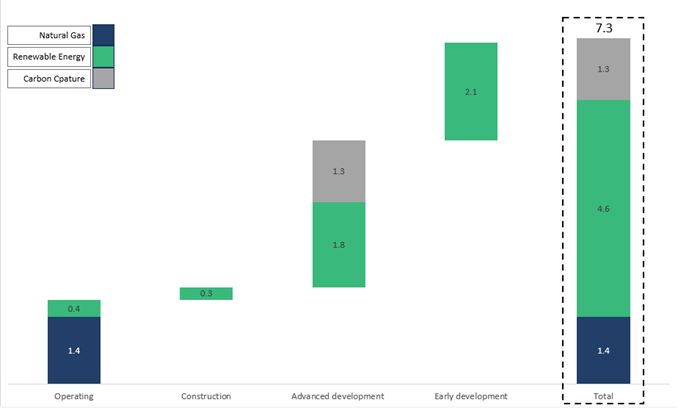
In addition, the CPV Group has additional project with a scope about 4GW in initial development stages.
|
| 2. |
Brief description of the areas of activity
|
|
|
(1) |
Israel (through OPC Holdings Israel Ltd. (80%4)) – as part of this area of activities, the Group is involved in generation and supply of electricity and
energy mainly to private customers and Noga Electricity Systems Ltd. (hereinafter – “the System Operator”), and in initiation, development, construction and operation of power plants and facilities for generation of energy by means of
natural gas and renewable energy in Israel.
|
|
|
(2) |
Renewable energy in the U.S. (through the CPV Group (70%)) – as part of this area of activities, the Group is engaged in the initiation, development, construction and operation of power plants running on renewable energy in the
U.S. (solar and wind) and supply of electricity from renewable sources to customers.
|
|
|
(3) |
Energy transition in the U.S. (through the CPV Group (70%)) – as part of this area of activities, the Group is engaged in the initiation, development, construction and operation of power plants running on conventional energy in
the U.S (natural gas), which supply efficient and reliable electricity. The active power plants in this area of activities are held by associated companies (which are not consolidated in the financial statements of the CPV Group and thus
not in the Company’s financial statements).
|
|
|
(1) |
Initiation and development of projects for generation of electricity (highly‑efficient power plants running on natural gas) with integration of carbon capture capabilities (some of the projects in this area are being developed by
associated companies);
|
|
|
(2) |
Provision of asset‑management and energy services to power plants running on conventional energy in the U.S (natural gas) that are partly owned by the CPV Group and partly by third parties;
|
|
|
(3) |
Retail sale activities of electricity from renewable sources to commercial customers that are designed to supplement the generation activities of electricity from renewable sources of the CPV Group. These activities are just beginning
(started in the beginning of 2023), and in the upcoming years they are expected to generate an operating loss and negative cash flows that are immaterial to the CPV Group and the Company.
|
| 4 |
Upon completion of the Veridis transaction in January 2023 (for details – see Note 25A(1) to the financial statements), the other 20% in OPC Israel is held by Veridis Power Plants Ltd. (“Veridis”). In addition, as at the date of the
report, OPC Israel holds 51% of the shares of Gnrgy Ltd. (“Gnrgy”), which operates in the area of charging electric vehicles and energy management in Israel.
|
| 5 |
It is clarified that in some cases an additional description has been provided in order to present a comprehensive picture of the matter described or of the relevant business environment. References to reports included in this report
include the information included therein by means of reference.
|
| 3. |
Main Developments in the Business Environment
|
|
|
3.1 |
General
|
|
|
A. |
Macro‑economic environment (particularly inflation and interest) – in 2022, there was a
significant macro‑economic trend, in both Israel and globally, that was characterized by a sharp rise in the rates of inflation and rising prices in Israel and the U.S, particularly energy and electricity prices and, in turn, a large jump
in the interest rates. This took place, among other things, against the background of geo‑political events – mainly the war in the Ukraine and the global energy crisis, along with the long‑term impacts of the Coronavirus epidemic,
particularly continuing disruptions (complications) in the supply chain.
|
| 3. |
Main Developments in the Business Environment (Cont.)
|
|
|
3.1 |
General (Cont.)
|
|
|
A. |
(Cont.)
|
|
2023
|
2022
|
Change
|
||||||||||
|
Dollar/shekel exchange rate*
|
||||||||||||
|
As at December 31
|
3.627
|
3.519
|
3.1
|
%
|
||||||||
|
Average January– December
|
3.687
|
3.360
|
9.7
|
%
|
||||||||
|
Average October– December
|
3.823
|
3.489
|
9.6
|
%
|
||||||||
|
|
* |
The dollar/shekel exchange rate on March 7, 2024, is 3.59.
|
|
Bank of
|
||||||||||||||||
|
Israel
|
Federal
|
|||||||||||||||
|
Israeli
|
U.S.
|
interest
|
interest
|
|||||||||||||
|
CPI
|
CPI
|
rate
|
rate
|
|||||||||||||
|
Proximate to the approval
|
||||||||||||||||
|
date of the financial statements
|
111.2
|
308.4
|
4.5
|
%
|
5.25%–5.50
|
%
|
||||||||||
|
At December 31, 2023
|
111.3
|
307.1
|
4.75
|
%
|
5.25%–5.50
|
%
|
||||||||||
|
At December 31, 2022
|
107.7
|
297.7
|
3.25
|
%
|
4.25%–4.50
|
%
|
||||||||||
|
Change in 2023
|
3.3
|
%
|
3.1
|
%
|
1.5
|
%
|
1
|
%
|
||||||||
|
|
* |
As at March 7, 2024.
|
|
|
B. |
Domestic and geopolitical instability in the defense (security) situation in Israel – 2023
was characterized by significant instability against the background of internal domestic events and geopolitical defense (security) matters. In the beginning of the year, the Israeli government began to advance a plan for making changes in
Israel’s judicial system – a move that impacted the stability of the State’s population and economy. On October 7, 2023, the Iron Swords war (hereinafter – “the War”) broke out, which as at the approval date of the report is still ongoing.
The War led to impacts and restrictions on the Israeli economy that included, among other things, reduction of economic activities, a large call for military reserves duty (soldiers), limitations on gatherings in work places and public
areas, restrictions on carrying on classes in the educational system, etc. As at the approval date of the report, most of the said restrictions had been gradually relaxed, according to the security situation existing in the State and the
combat areas.
|
| 3. |
Main Developments in the Business Environment (Cont.)
|
|
|
3.1 |
General (Cont.)
|
|
|
B. |
(Cont.)
|
|
|
C. |
Global events and broad impacts on raw‑material prices and the supply chain – in general, in
2023 the raw‑material prices were lower than the level thereof in 2022 and the disruptions in the supply chain were not as severe as they were in 2022. Nonetheless, certain aspects of the Group’s activities are still being impacted by the
disruptions in the supply chain, where regional conflicts affecting marine transport could trigger additional complications. The said events could have a negative impact on the Group’s activities, both in Israel and in the U.S.,
particularly with respect to the construction costs of projects and maintenance activities, as well as on the timetables for their completion. As at the approval date of the report, there is no certainty with respect to the continuation of
the trends and the scope of the impact thereof on the Group’s activities, if any at all.
|
| 3. |
Main Developments in the Business Environment (Cont.)
|
|
|
3.2 |
Activities in Israel
|
|
|
D. |
Update of tariffs in 2022 – 2023, including the brackets of the demand hours – during 2022,
there were a number of updates to the electricity tariff, in such a manner that the average generation component in 2022 was set at NIS 0.2927 per kilowatt hour.
|
|
Period
|
2023
|
2022
|
Change
|
|||||||||
|
January–December average
|
30.53
|
29.27
|
+4
|
%
|
||||||||
|
October– December average
|
30.39
|
31.40
|
–3
|
%
|
||||||||
| 3. |
Main Developments in the Business Environment (Cont.)
|
|
|
3.2 |
Activities in Israel (Cont.)
|
|
|
D. |
Update of tariffs in 2022 – 2023, including the brackets of the demand hours (Cont.)
|
|
|
E. |
Supplementary arrangements and granting of a supply license to Rotem – in February 2023, the
Electricity Authority published a proposed decision that includes granting of a supplier license to Rotem with language (terms) similar to the existing suppliers along with imposition of covenants on Rotem, including covenants relating to a
deviation from the consumption plans plus arrangements and covenants relating to this.
|
| 6 |
It is noted that without detracting from its principle position, the System Operator contends, among other things, that according to its position the consumption deviations will be charged at a tariff that is based on a TOAZ high‑voltage
tariff plus 25%, a tariff that, in the Company’s estimate, the impact of which on the Group’s results compared with the prior periods, as at the date of the report, is not material.
|
|
|
3.2 |
Activities in Israel (Cont.)
|
|
|
E. |
Supplementary arrangements and granting of a supply license to Rotem (Cont.)
|
|
|
F. |
Market model for generation and storage facilities connected to or integrated with the distribution grid
|
|
|
G. |
Targets of the Israeli government in connection with greenhouse gas emissions and amendment of the order for excise tax on fuel
|
| 7 |
For additional details – see Section 7.3.18.5 of Part A of the Periodic Report.
|
| 8 |
The Company’s estimates regarding the possible impacts of the Excise Tax on Fuel Order and offset of the impact of the government decision constitute “forward‑looking” information as it is defined in the
Securities Law, regarding which there is no certainty it will materialize and it depends on, among other things, the regulatory arrangements that will be provided and their effective dates, as well as on undertakings that apply to the
Company.
|
| 3. |
Main Developments in the Business Environment (Cont.)
|
|
|
3.3 |
Activities in the U.S.
|
|
|
H. |
Electricity and natural gas prices
|
|
For the Year Ended
|
For the Three Months Ended
|
|||||||||||||||||||||||
|
December 31
|
December 31
|
|||||||||||||||||||||||
|
Region
|
||||||||||||||||||||||||
|
(Power Plant)
|
2023
|
2022
|
Change
|
2023
|
2022
|
Change
|
||||||||||||||||||
|
PJM West (Shore, Maryland)
|
33.06
|
73.09
|
(55
|
%)
|
36.31
|
68.74
|
(47
|
%)
|
||||||||||||||||
|
PJM AEP Dayton (Fairview)
|
30.81
|
69.42
|
(56
|
%)
|
31.30
|
64.70
|
(52
|
%)
|
||||||||||||||||
|
New York Zone G (Valley)
|
33.27
|
82.21
|
(60
|
%)
|
31.52
|
73.04
|
(57
|
%)
|
||||||||||||||||
|
Mass Hub (Towantic)
|
36.82
|
85.56
|
(57
|
%)
|
34.66
|
76.92
|
(55
|
%)
|
||||||||||||||||
|
PJM ComEd (Three Rivers)
|
26.68
|
60.40
|
(56
|
%)
|
26.31
|
52.30
|
(50
|
%)
|
||||||||||||||||
|
|
* |
Based on Day‑Ahead prices as published by the relevant ISO.
|
|
For the year ended December 31
|
||||||||||||
|
Power plant
|
2023
|
2022
|
2021
|
|||||||||
|
Shore
|
(8.32
|
)
|
(8.90
|
)
|
(6.45
|
)
|
||||||
|
Maryland
|
2.47
|
5.27
|
2.29
|
|||||||||
|
Fairview
|
(1.90
|
)
|
(4.14
|
)
|
(4.03
|
)
|
||||||
|
Valley
|
(1.41
|
)
|
(4.74
|
)
|
(2.04
|
)
|
||||||
|
Towantic
|
(3.02
|
)
|
(4.11
|
)
|
(2.83
|
)
|
||||||
|
Three Rivers
|
(1.18
|
)
|
(0.99
|
)
|
(0.44
|
)
|
||||||
| 3. |
Main Developments in the Business Environment (Cont.)
|
|
|
3.3 |
Activities in the U.S. (Cont.)
|
|
|
H. |
Electricity and natural gas prices (Cont.)
|
|
For the
|
For the
|
|||||||||||||||||||||||
|
Year Ended
|
Three Months Ended
|
|||||||||||||||||||||||
|
Region
|
December 31
|
December 31
|
||||||||||||||||||||||
|
(Power Plant)
|
2023
|
2022
|
Change
|
2023
|
2022
|
Change
|
||||||||||||||||||
|
Texas Eastern M‑3 (Shore, Valley – 70%)
|
1.90
|
6.80
|
(72
|
%)
|
1.78
|
6.59
|
(73
|
%)
|
||||||||||||||||
|
Transco Zone 5 North (Maryland)
|
2.74
|
8.55
|
(68
|
%)
|
2.77
|
8.97
|
(69
|
%)
|
||||||||||||||||
|
Texas Eastern M‑2 (Fairview)
|
1.63
|
5.53
|
(71
|
%)
|
1.61
|
4.55
|
(65
|
%)
|
||||||||||||||||
|
Dominion South Pt (Valley – 30%)
|
1.63
|
5.51
|
(70
|
%)
|
1.64
|
4.42
|
(63
|
%)
|
||||||||||||||||
|
Algonquin City Gate (Towantic)
|
2.94
|
9.15
|
(68
|
%)
|
2.69
|
8.24
|
(67
|
%)
|
||||||||||||||||
|
Chicago City Gate (Three Rivers)
|
N/A
|
N/A
|
N/A
|
2.28
|
N/A
|
N/A
|
||||||||||||||||||
| 3. |
Main Developments in the Business Environment (Cont.)
|
|
|
3.3 |
Activities in the U.S. (Cont.)
|
|
|
H. |
Electricity and natural gas prices (Cont.)
|
|
For the
|
For the
|
|||||||||||||||||||||||
|
Year Ended
|
Three Months Ended
|
|||||||||||||||||||||||
|
December 31
|
December 31
|
|||||||||||||||||||||||
|
Power Plant9
|
2023
|
2022
|
Change
|
2023
|
2022
|
Change
|
||||||||||||||||||
|
Shore
|
19.95
|
26.17
|
(24
|
%)
|
24.03
|
23.27
|
3
|
%
|
||||||||||||||||
|
Maryland
|
14.15
|
14.10
|
–
|
17.20
|
6.85
|
151
|
%
|
|||||||||||||||||
|
Valley
|
20.72
|
37.96
|
(45
|
%)
|
19.53
|
32.06
|
(39
|
%)
|
||||||||||||||||
|
Towantic
|
17.71
|
26.09
|
(32
|
%)
|
17.18
|
23.36
|
(26
|
%)
|
||||||||||||||||
|
Fairview
|
20.22
|
33.48
|
(40
|
%)
|
20.84
|
35.13
|
(41
|
%)
|
||||||||||||||||
|
Three Rivers
|
–
|
–
|
–
|
11.49
|
–
|
–
|
||||||||||||||||||
|
|
* |
Based on electricity prices as shown in the above table, with a discount for the thermal conversion ratio (heat rate) of 6.9 MMBtu/MWh for Maryland, Shore and Valley, and a thermal conversion ratio of 6.5 MMBtu/MWh for Three Rivers,
Towantic and Fairview. It is clarified that the actual energy margins of the power plants of the CPV Group could be significantly different due to, among other things, the existence of Power Basis as described in the above table.
|
| 9 |
For additional details regarding the energy margin of the CPV Group – see Section 4E below.
|
| 3. |
Main Developments in the Business Environment (Cont.)
|
|
|
3.3 |
Activities in the U.S. (Cont.)
|
|
|
I. |
Capacity revenues
|
|
Sub-Region
|
CPV Plants10
|
2024/2025
|
2023/2024
|
2022/2023
|
2021/2022
|
|
PJM RTO
|
28.92
|
34.13
|
50
|
140
|
|
|
PJM COMED
|
Three Rivers
|
28.92
|
34.13
|
–
|
–
|
|
PJM MAAC
|
Fairview, Maryland, Maple Hill
|
49.49
|
49.49
|
95.79
|
140
|
|
PJM EMAAC
|
Shore
|
54.95
|
49.49
|
97.86
|
165.73
|
| 10 |
The Three Rivers power plant, which commenced commercial operation in July 2023, is entitled to capacity payments, from this date.
|
| 3. |
Main Developments in the Business Environment (Cont.)
|
|
|
3.3 |
Activities in the U.S. (Cont.)
|
|
|
I. |
Capacity revenues (Cont.)
|
|
Sub-Area
|
CPV
Plants
|
Winter 2023/2024
|
Summer 2023
|
Winter 2022/2023
|
Summer 2022
|
|
NYISO
Rest of the Market
|
–
|
127.25
|
153.26
|
39.12
|
110.87
|
|
Lower Hudson Valley
|
Valley
|
128.9
|
164.35
|
43.43
|
151.63
|
| 11 |
That stated in this Section regarding the estimate of the CPV Group constitutes “forward‑looking” information as it is defined in the Securities Law, regarding which there
is no certainty it will be realized and that depends on the content of the arrangements that will be provided (if any) and the manner of their application.
|
| 3. |
Main Developments in the Business Environment (Cont.)
|
|
|
3.3 |
Activities in the U.S. (Cont.)
|
|
|
I. |
Capacity revenues (Cont.)
|
|
Sub-Region
|
CPV Power Plants
|
2027/2028
|
2026/2027
|
2025/2026
|
|
ISO-NE
Rest of the Market
|
Towantic
|
117.70
|
85.15
|
85.15
|
|
|
J. |
The Inflation Reduction Act (“the IRA Law”)
|
| 3. |
Main Developments in the Business Environment (Cont.)
|
|
|
3.3 |
Activities in the U.S. (Cont.)
|
|
|
J. |
The Inflation Reduction Act (“the IRA Law”) (Cont.)
|
| 12 |
That stated in connection with the main impacts of the IRA Law and its application to projects of the CPV Group and their entitlement to the benefits is “forward‑looking” information as it is defined in the
Securities Law, and it constitutes solely an estimate that is based on the language of the legislation published and the existing business plans. Ultimately, the impacts of the IRA Law could be impacted by, among other things, the detailed
regulatory arrangements that will be determined, the extent of the compliance with the conditions for entitlement and the progress of the relevant project (if any), legislative updates, if any, with respect to the manner of implementation of
the benefits or their demarcation, changes in the legislation or policies of the governmental, legislative and regulatory entities as they will be from time to time. Accordingly, information as stated above might not be realized and/or might
be realized in a manner different than that described above.
|
| 4. |
Analysis of the results of operations for the year ended December 31, 2023 (in millions of NIS)
|
| 4. |
Analysis of the results of operations for the year ended December 31, 2023 (in millions of NIS) (Cont.)
|
|
|
A. |
Statement of income13
|
|
For the Year Ended
|
||||||||
|
Section
|
December 31
|
|||||||
|
2023
|
2022
|
|||||||
|
Revenues from sales and provision of services (1)
|
2,552
|
1,927
|
||||||
|
Cost of sales and provision of services (without depreciation and amortization) (2)
|
(1,827
|
)
|
(1,404
|
)
|
||||
|
Depreciation and amortization
|
(288
|
)
|
(191
|
)
|
||||
|
Gross profit
|
437
|
332
|
||||||
|
Administrative and general expenses
|
(212
|
)
|
(239
|
)
|
||||
|
Share in earnings of associated companies
|
242
|
286
|
||||||
|
Business development expenses
|
(58
|
)
|
(50
|
)
|
||||
|
Compensation for lost revenues
|
41
|
–
|
||||||
|
Other expenses, net
|
(16
|
)
|
–
|
|||||
|
Operating income
|
434
|
329
|
||||||
|
Financing expenses, net
|
(197
|
)
|
(47
|
)
|
||||
|
Income before taxes on income
|
237
|
282
|
||||||
|
Taxes on income expenses
|
(68
|
)
|
(65
|
)
|
||||
|
Net income for the year
|
169
|
217
|
||||||
|
Adjustments
|
8
|
(46
|
)
|
|||||
|
Adjusted net income for the year14
|
177
|
171
|
||||||
|
Attributable to:
|
||||||||
|
The Company’s shareholders
|
152
|
119
|
||||||
|
Holders of non‑controlling interests
|
25
|
52
|
||||||
| 13 |
The results of the associated companies in the U.S. (mainly in the Energy Transition segment) are presented in the category “Company’s share in earnings of associated companies”.
|
| 14 |
Adjusted net income or loss – net income or loss in accordance with IFRS plus or minus the adjustments detailed in Section G below. It is emphasized that “adjusted income or loss” as
stated in this report is not a recognized data item that is recognized under IFRS or under any other set of generally accepted accounting principles as an index for measuring financial performance and should not be considered as a
substitute for income or loss or other terms provided in accordance with IFRS. It is possible that the Company’s definitions of “adjusted income or loss” are different than those used by other companies. Nonetheless, the Company
believes that the “adjusted income or loss” provides information that is useful to management and investors by means of eliminating certain line items (categories) that do not constitute an indication of the Company’s ongoing business
activities.
|
| 4. |
Analysis of the results of operations for the year ended December 31, 2023 (in millions of NIS) (Cont.)
|
|
|
A. |
Statement of income (Cont.)
|
|
Revenues
|
For the
|
Board’s Explanations
|
|||||||
|
Year Ended
|
|||||||||
|
December 31
|
|||||||||
|
2023
|
2022
|
||||||||
|
Revenues in Israel
|
|||||||||
|
Revenues from sale of energy to private customers
|
1,424
|
1,212
|
The increase stems mainly from an increase in the generation component and an increase in customer consumption, in the aggregate amount of about NIS 181 million, and an increase, in the
amount of about NIS 87 million, due to consolidation of Gat for the first time starting from the second quarter of 2023. On the other hand, there was a decrease of about NIS 33 million deriving from the impact of the change in the demand‑hour
brackets (as detailed in Section 3.2D above and in Section C below).
|
||||||
|
Revenues from sale of energy to the System Operator and to other suppliers
|
120
|
55
|
Most of the increase, in the amount of about NIS 68 million, stems from the commercial operation of Zomet at the end of the second quarter of 2023, and an increase of about NIS 13 million due
to the initial consolidation of Gat starting from the second quarter of 2023.
|
||||||
|
Revenues in respect of capacity payments
|
59
|
–
|
The increase stems from the commercial operation of Zomet at the end of the second quarter of 2023.
|
||||||
|
Revenues from sale of energy at cogeneration tariff
|
82
|
52
|
Most of the increase stems from an increase in the quantity generated
|
||||||
|
Revenues from sale of steam
|
59
|
62
|
|||||||
|
Other revenues
|
59
|
39
|
Most of the increase stems from sales of electricity, in the amount of about NIS 26 million, from the Zomet power plant prior to the commercial operation at the end of June 2023.
|
||||||
|
Total revenues from sale of energy and others in Israel (without infrastructure services)
|
1,803
|
1,420
|
|||||||
|
Revenues from private customers in respect of infrastructure services
|
480
|
315
|
The increase, stems mainly from an increase in the infrastructure tariff and an increase in customer consumption, in the amounts of about NIS 97 million and about NIS 45 million,
respectively, and an increase of about NIS 28 million due to consolidation of Gat for the first time starting from the second quarter of 2023.
|
||||||
|
Total revenues in Israel
|
2,283
|
1,735
|
|||||||
|
Revenues in the U.S.
|
|||||||||
|
Revenues from sale of electricity from renewable energy
|
136
|
87
|
The increase derives mainly from the first‑time consolidation of the results of Mountain Wind project in the second quarter of 2023.
|
||||||
|
Revenues from provision of services (as part of others) and other revenues
|
133
|
105
|
The increase stems mainly from an increase in the scope of the services provided to projects.
|
||||||
|
Total revenues in the U.S.
|
269
|
192
|
|||||||
|
Total revenues
|
2,552
|
1,927
|
|||||||
| 4. |
Analysis of the results of operations for the year ended December 31, 2023 (in millions of NIS) (Cont.)
|
|
|
A. |
Statement of income (Cont.)
|
|
|
(2) |
Changes in the cost of sales and provision of services (not including depreciation and amortization):
|
|
Cost of Sales and
Provision of Services
|
For the
Year Ended
|
Board’s Explanations
|
|||||||
|
December 31
|
|||||||||
|
2023
|
2022
|
||||||||
|
Cost of sales in Israel
|
|||||||||
|
Natural gas and diesel oil
|
663
|
526
|
The increase stems mainly from an increase in the natural gas tariff as a result of an increase in the generation component and the shekel/dollar exchange rate, in the amount of about NIS 50
million, from an increase in the quantity of the gas consumed against the background of maintenance work at the Rotem and Hadera power plants in 2022, in the amount of about NIS 39 million, and an increase due to consolidation of the results
of Gat for the first time and commercial operation of Zomet starting from the second quarter of 2023, in the amount of about NIS 116 million. On the other hand, there was a decrease of about NIS 51 million, deriving from the start of
execution of the Energean agreement commencing from the second quarter of 2023 (and the amount of about NIS 18 million stemming from a contractual monetary amount that Rotem and Hadera are entitled to from Energean that was recognized in the
first quarter, as described in Note 28C(3) to the financial statements).
|
||||||
|
Expenses in respect of acquisition of energy
|
303
|
295
|
The increase stems mainly from an increase of about NIS 89 million in customer consumption in the period of the report. On the other hand, there was a decrease, in the amount of about NIS 81
million, against the background of maintenance work at the Rotem and Hadera power plants in 2022.
|
||||||
|
Cost of transmission of gas
|
41
|
32
|
|||||||
|
Salaries and related expenses
|
37
|
32
|
|||||||
|
Operating expenses
|
87
|
54
|
The increase stems mainly from the first‑time consolidation of Gat and the commercial operation of Zomet starting from the second quarter of 2023.
|
||||||
|
Other expenses
|
65
|
40
|
Most of the increase stems from natural gas and other expenses at the Zomet power plant prior to the commercial operation at the end of June 2023.
|
||||||
|
Total cost of sales in Israel without infrastructure services
|
1,196
|
979
|
|||||||
|
Expenses in respect of infrastructure services
|
480
|
315
|
The increase stems mainly from an increase in the infrastructure tariff and an increase in customer consumption, in the amounts of about NIS 97
million and about NIS 45 million, respectively, and an increase of about NIS 28 million due to consolidation of Gat for the first time in the second quarter of 2023.
|
||||||
|
Total cost of sales in Israel
|
1,676
|
1,294
|
|||||||
| 4. |
Analysis of the results of operations for the year ended December 31, 2023 (in millions of NIS) (Cont.)
|
|
|
A. |
Statement of income (Cont.)
|
|
|
(2) |
Changes in the cost of sales and provision of services (not including depreciation and amortization): (Cont.)
|
|
Cost of sales and services in the U.S.
|
|||||||||
|
Cost of sales in respect of sale of electricity from renewable energy
|
49
|
30
|
The increase stems mainly from the first‑time consolidation of the Mountain Wind project starting from the second quarter of 2023.
|
||||||
|
Cost in respect provision of services (as part of others) and other costs
|
102
|
80
|
Most of the increase is parallel to the increase in the scope of the services provided to projects.
|
||||||
|
Total cost of sales and provision of services in the U.S.
|
151
|
110
|
|||||||
|
Total cost of sales and provision of services
|
1,827
|
1,404
|
|||||||
| 4. |
Analysis of the results of operations for the year ended December 31, 2023 (in millions of NIS) (Cont.)
|
|
|
B. |
EBITDA, FFO and net cash flows after service of the project debt
|
|
|
1. |
EBITDA indices
|
|
|
– |
“EBITDA in the consolidated statements”15: net income (loss) for the period before depreciation and amortization, net financing expenses or income, taxes on income and other income (expenses), net.
|
|
|
– |
“EBITDA after proportionate consolidation”: “EBITDA in the consolidated statements” after eliminating the share in the income (losses) of associated companies and after a proportionate consolidation of the EBITDA of the associated
companies based on the rate of holdings of the CPV Group therein.
|
|
|
2. |
“EBITDA after adjusted proportionate consolidation: “EBITDA after proportionate consolidation” after adjustments in respect of changes in the fair value of derivative financial instruments with respect to which hedge accounting was not
applied and items that are not in the ordinary course of the Group’s business (for details regarding adjustments in the period – Section G below).
|
|
|
3. |
FFO (Funds From Operations) – with reference to the active projects – cash flows from
operating activities for the period (including changes in the working capital) less investments in property, plant and equipment and periodic maintenance costs that are not included in the current operating activities and less net interest
payments. Regarding the rest of the Group’s activities – cash flows from operating activities for the period (including changes in the working capital) and less net interest payments (to the extent they do not relate to projects under
construction). It is clarified that investments in property, plant and equipment (under construction and/or in development), including net interest expenses in respect thereof, are not included in FFO.
|
|
|
4. |
Net cash flows after service of the project debt – FFO less payment of principal on project
loans, and after adjustments in respect of change in other credit from banks and change in restricted cash and deposits (including for securing transactions hedging electricity margins) as part of the project credit.
|
| 15 |
It is clarified that revenues in respect of lost profits are included in EBITDA in the consolidated statements.
|
| 4. |
Analysis of the results of operations for the year ended December 31, 2023 (in millions of NIS) (Cont.)
|
|
|
B. |
EBITDA, FFO and net cash flows after service of the project debt (Cont.)
|
| 16 |
It is noted that other companies might define the EBITDA and FFO indices differently.
|
| 4. |
Analysis of the results of operations for the year ended December 31, 2023 (in millions of NIS) (Cont.)
|
|
|
B. |
EBITDA, FFO and net cash flows after service of the project debt (Cont.)
|
|
For the Year Ended
|
||||||||
|
December 31
|
||||||||
|
2023
|
2022
|
|||||||
|
Revenues from sales and provision of services
|
2,552
|
1,927
|
||||||
|
Cost of sales (without depreciation and amortization)
|
(1,827
|
)
|
(1,404
|
)
|
||||
|
Administrative and general expenses (without depreciation and
|
||||||||
|
amortization)
|
(197
|
)
|
(229
|
)
|
||||
|
Business development expenses
|
(58
|
)
|
(50
|
)
|
||||
|
Share in income of associated companies
|
242
|
286
|
||||||
|
Compensation for lost revenues
|
41
|
–
|
||||||
|
Consolidated EBITDA
|
753
|
530
|
||||||
|
Elimination of the share in income of associated companies
|
(242
|
)
|
(286
|
)
|
||||
|
Addition of the share of Group in proportionate EBITDA of
|
||||||||
|
associated companies (1)
|
588
|
556
|
||||||
|
EBITDA after proportionate consolidation
|
1,099
|
800
|
||||||
|
Adjustments in the consolidation (see detail in Section G below)
|
18
|
10
|
||||||
|
Adjustments for associated companies (see detail in Section G below)
|
(8
|
)
|
8
|
|||||
|
Adjusted EBITDA after proportionate consolidation
|
1,109
|
818
|
||||||
|
|
(1) |
Calculation of the Group’s share in the proportionate EBITDA of associated companies (in millions of NIS):
|
|
Three
|
||||||||||||||||||||||||||||
|
For the year ended December 31, 2023
|
Fairview
|
Towantic
|
Maryland
|
Shore*
|
Valley
|
Rivers
|
Total
|
|||||||||||||||||||||
|
Revenues from sales of energy
|
191
|
181
|
156
|
147
|
268
|
28
|
971
|
|||||||||||||||||||||
|
Cost of natural gas
|
81
|
90
|
77
|
71
|
107
|
17
|
443
|
|||||||||||||||||||||
|
Carbon emissions tax (RGGI)
|
**(1 |
)
|
27
|
20
|
29
|
43
|
–
|
118
|
||||||||||||||||||||
|
Cost of sales – other expenses (without
|
||||||||||||||||||||||||||||
|
depreciation and amortization)
|
2
|
3
|
7
|
6
|
6
|
–
|
24
|
|||||||||||||||||||||
|
Gain (loss) on realization of transactions
|
||||||||||||||||||||||||||||
|
hedging the electricity margins
|
32
|
(2
|
)
|
8
|
(1
|
)
|
77
|
–
|
114
|
|||||||||||||||||||
|
Net energy margin
|
141
|
59
|
60
|
40
|
189
|
11
|
500
|
|||||||||||||||||||||
|
Revenues from capacity payments
|
23
|
106
|
24
|
25
|
57
|
2
|
237
|
|||||||||||||||||||||
|
Other income
|
2
|
3
|
3
|
5
|
4
|
1
|
18
|
|||||||||||||||||||||
|
Gross profit
|
166
|
168
|
87
|
70
|
250
|
14
|
755
|
|||||||||||||||||||||
|
Fixed costs (without depreciation and
|
||||||||||||||||||||||||||||
|
amortization)
|
12
|
19
|
19
|
26
|
68
|
4
|
149
|
|||||||||||||||||||||
|
Administrative and general expenses
|
||||||||||||||||||||||||||||
|
(without depreciation and amortization)
|
4
|
4
|
4
|
5
|
8
|
1
|
26
|
|||||||||||||||||||||
|
Group’s share in proportionate adjusted
|
||||||||||||||||||||||||||||
|
EBITDA of associated companies
|
150
|
145
|
64
|
39
|
174
|
9
|
580
|
|||||||||||||||||||||
| * |
At the Shore power plant – gas transport costs (totaling in 2023 about NIS 22 million) that are classified in accordance with IFRS 16 as depreciation expenses and, accordingly, are not included in the adjusted EBITDA.
|
| ** |
It is noted that as at the approval date of the report, in Pennsylvania RGGI is not imposed. For details regarding a legal proceeding underway regarding the matter and possible implications of imposition of RGGI on costs of the Fairview
power plant and the electricity prices throughout the PJM – see Section 8.1.5B of Part A of the Periodic Report.
|
| 4. |
Analysis of the results of operations for the year ended December 31, 2023 (in millions of NIS) (Cont.)
|
|
|
B. |
EBITDA, FFO and net cash flows after service of the project debt (Cont.)
|
|
|
(1) |
Calculation of the Group’s share in the proportionate EBITDA of associated companies (in millions of NIS) (Cont.):
|
|
Three
|
||||||||||||||||||||||||||||
|
For the year ended December 31, 2022
|
Fairview
|
Towantic
|
Maryland
|
Shore*
|
Valley
|
Rivers
|
Total
|
|||||||||||||||||||||
|
Revenues from sales of energy
|
422
|
352
|
283
|
384
|
641
|
–
|
2,082
|
|||||||||||||||||||||
|
Cost of natural gas
|
242
|
248
|
170
|
250
|
358
|
–
|
1,268
|
|||||||||||||||||||||
|
Carbon emissions tax (RGGI)
|
**1
|
23
|
14
|
31
|
46
|
–
|
115
|
|||||||||||||||||||||
|
Cost of sales – other expenses (without
|
||||||||||||||||||||||||||||
|
depreciation and amortization)
|
2
|
4
|
7
|
6
|
6
|
–
|
25
|
|||||||||||||||||||||
|
Gain (loss) on realization of transactions
|
||||||||||||||||||||||||||||
|
hedging the electricity margins
|
(95
|
)
|
(44
|
)
|
(25
|
)
|
(45
|
)
|
13
|
–
|
(196
|
)
|
||||||||||||||||
|
Net energy margin
|
82
|
33
|
67
|
52
|
244
|
–
|
478
|
|||||||||||||||||||||
|
Revenues from capacity payments
|
43
|
86
|
11
|
41
|
41
|
–
|
222
|
|||||||||||||||||||||
|
Other income
|
2
|
1
|
4
|
6
|
3
|
–
|
16
|
|||||||||||||||||||||
|
Gross profit
|
127
|
120
|
82
|
99
|
288
|
–
|
716
|
|||||||||||||||||||||
|
Fixed costs (without depreciation and
|
||||||||||||||||||||||||||||
|
amortization)
|
11
|
21
|
14
|
20
|
64
|
–
|
130
|
|||||||||||||||||||||
|
Administrative and general expenses
|
||||||||||||||||||||||||||||
|
(without depreciation and amortization)
|
3
|
3
|
3
|
4
|
7
|
–
|
20
|
|||||||||||||||||||||
|
Group’s share in proportionate adjusted
|
||||||||||||||||||||||||||||
|
EBITDA of associated companies
|
113
|
96
|
65
|
75
|
217
|
–
|
566
|
|||||||||||||||||||||
| * |
At the Shore power plant – gas transport costs (totaling in 2023 about NIS 22 million) that are classified in accordance with IFRS 16 as depreciation expenses and, accordingly, are not included in the adjusted EBITDA.
|
| ** |
It is noted that as at the approval date of the report, in Pennsylvania RGGI is not imposed. For details regarding a legal proceeding underway regarding the matter and possible implications of imposition of RGGI on costs of the Fairview
power plant and the electricity prices throughout the PJM – see Section 8.1.5B of Part A of the Periodic Report.
|
| 4. |
Analysis of the results of operations for the year ended December 31, 2023 (in millions of NIS) (Cont.)
|
|
|
B. |
EBITDA, FFO and net cash flows after service of the project debt (Cont.)
|
|
|
(2) |
Set forth below is a breakdown of the adjusted EBITDA after proportionate consolidation data broken down by the subsidiaries (on a consolidated basis) and the associated companies (on a proportionate basis, based on the rate of the
holdings of the CPV Group therein) (in NIS millions):
|
|
For the Year Ended
|
For the Year Ended
|
||||||||||||||||
|
|
Basis of
|
December 31, 2023
|
December 31, 2022
|
||||||||||||||
|
|
presentation
|
Adjusted
|
Adjusted
|
||||||||||||||
|
|
in the
|
EBITDA
|
EBITDA
|
||||||||||||||
|
|
Company’s
|
after
|
after
|
||||||||||||||
|
|
financial
|
proportionate
|
proportionate
|
||||||||||||||
|
|
statements
|
consolidation
|
FFO
|
consolidation
|
FFO
|
||||||||||||
|
Total operating projects (1)
|
Consolidated
|
611
|
506
|
391
|
232
|
||||||||||||
|
Business development costs,
|
|||||||||||||||||
|
headquarters in Israel and others
|
Consolidated
|
(31
|
)
|
(78
|
)
|
(24
|
)
|
(30
|
)
|
||||||||
|
Total Israel
|
580
|
428
|
367
|
202
|
|||||||||||||
|
Total operating projects (1)
|
Associate
|
581
|
322
|
566
|
253
|
||||||||||||
|
Other costs
|
Consolidated
|
(4
|
)
|
(4
|
)
|
(4
|
)
|
(4
|
)
|
||||||||
|
Total energy transition in the U.S.
|
577
|
318
|
562
|
249
|
|||||||||||||
|
Total operating projects in Israel (1)
|
Consolidated
|
72
|
54
|
55
|
44
|
||||||||||||
|
Business development and other costs
|
Consolidated
|
(41
|
)
|
(41
|
)
|
(29
|
)
|
(29
|
)
|
||||||||
|
Total renewable energy in the U.S.
|
31
|
13
|
26
|
15
|
|||||||||||||
|
Total activities as part of the “others”
|
|||||||||||||||||
|
segment
|
Consolidated
|
6
|
6
|
–
|
–
|
||||||||||||
|
Headquarters in the United States17 (2)
|
Consolidated
|
(58
|
)
|
(73
|
)
|
(111
|
)
|
(63
|
)
|
||||||||
|
Total United States
|
556
|
264
|
477
|
201
|
|||||||||||||
|
Company headquarters (not allocated
|
|||||||||||||||||
|
to the segments)
|
Consolidated
|
(27
|
)
|
(56
|
)
|
(26
|
)
|
(105
|
)
|
||||||||
|
Total consolidated
|
1,109
|
636
|
818
|
298
|
|||||||||||||
| (1) |
See Section 4B(3) below.
|
| (2) |
Most of the change in the 2023 is in respect of a profit‑sharing plan for employees of the CPV Group, which is measured at fair value. For details – see Note 18 to the financial statements.
|
| 17 |
After elimination of management fees between the CPV Group and the Company, in the amounts of about NIS 29 million and about NIS 21 million for the years ended December
31, 2023 and 2022, respectively.
|
| 4. |
Analysis of the results of operations for the year ended December 31, 2023 (in millions of NIS) (Cont.)
|
|
|
B. |
EBITDA, FFO and net cash flows after service of the project debt (Cont.)
|
|
|
(3) |
Set forth below is additional information regarding the revenues (net of infrastructure services), adjusted EBITDA after proportionate consolidation, FFO and net cash flows after service of the project debt of the Group’s active power
plants broken down by activity segments and subsidiaries (on a consolidated basis) and the associated companies (on a proportionate basis, based on the rate of the holdings of the CPV Group therein) (in NIS millions):
|
|
For the year ended December 31, 2023
|
For the year ended December 31, 2022
|
|||||||||||||||||||||||||||||||||
|
|
Basis of
|
|
Adjusted
|
Net cash
|
|
Adjusted
|
Net cash
|
|||||||||||||||||||||||||||
|
|
presentation
|
Net
|
EBITDA
|
flows
|
Net
|
EBITDA
|
flows
|
|||||||||||||||||||||||||||
|
|
in the
|
revenues
|
after
|
after
|
revenues
|
after
|
after
|
|||||||||||||||||||||||||||
|
Main
|
Company’s
|
from |
proportionate
|
service of
|
from
|
proportionate |
service of
|
|||||||||||||||||||||||||||
|
projects in
|
financial
|
infrastructure
|
consol-
|
project
|
infrastructure
|
consol-
|
project
|
|||||||||||||||||||||||||||
|
operation
|
statements
|
services
|
idation
|
FFO
|
debt
|
services
|
idation
|
FFO
|
debt
|
|||||||||||||||||||||||||
|
Rotem18
|
Consolidated
|
936
|
391
|
395
|
395
|
889
|
343
|
210
|
210
|
|||||||||||||||||||||||||
|
Hadera19
|
Consolidated
|
347
|
144
|
79
|
34
|
322
|
48
|
22
|
(15
|
)
|
||||||||||||||||||||||||
|
Zomet20
|
Consolidated
|
127
|
27
|
21
|
(18
|
)
|
–
|
–
|
–
|
–
|
||||||||||||||||||||||||
|
Gat21 22
|
Consolidated
|
101
|
49
|
11
|
–
|
–
|
–
|
–
|
–
|
|||||||||||||||||||||||||
|
Total operating
|
||||||||||||||||||||||||||||||||||
|
projects in Israel
|
1,511
|
611
|
506
|
411
|
1,211
|
391
|
232
|
195
|
||||||||||||||||||||||||||
|
Fairview
|
Associated (25%)
|
261
|
150
|
124
|
11
|
315
|
113
|
74
|
6
|
|||||||||||||||||||||||||
|
Towantic
|
Associated (26%)
|
323
|
145
|
103
|
(37
|
)
|
438
|
96
|
80
|
34
|
||||||||||||||||||||||||
|
Maryland23
|
Associated (25%)
|
221
|
64
|
15
|
10
|
203
|
65
|
27
|
12
|
|||||||||||||||||||||||||
|
Shore24
|
Associated (37.5%)
|
226
|
39
|
5
|
(8
|
)
|
314
|
75
|
4
|
12 | ||||||||||||||||||||||||
|
Valley
|
Associated (50%)
|
441
|
174
|
75
|
11
|
704
|
217
|
68
|
3
|
|||||||||||||||||||||||||
|
Three Rivers20
|
Associated (10%)
|
53
|
9
|
–
|
–
|
–
|
–
|
–
|
–
|
|||||||||||||||||||||||||
|
Total energy
|
||||||||||||||||||||||||||||||||||
|
transition in the U.S.25
|
1,525
|
581
|
322
|
(13
|
)
|
1,974
|
566
|
253
|
67
|
|||||||||||||||||||||||||
|
Keenan
|
Consolidated
|
85
|
48
|
35
|
–
|
87
|
55
|
44
|
9
|
|||||||||||||||||||||||||
|
Mountain Wind21
|
Consolidated
|
46
|
23
|
20
|
7
|
–
|
–
|
–
|
–
|
|||||||||||||||||||||||||
|
Maple Hill26
|
Consolidated
|
5
|
1
|
(1
|
)
|
(1
|
)
|
–
|
–
|
–
|
–
|
|||||||||||||||||||||||
|
Total renewable
|
||||||||||||||||||||||||||||||||||
|
energy in the U.S.
|
136
|
72
|
54
|
6
|
87
|
55
|
44
|
9
|
||||||||||||||||||||||||||
|
18
|
Not including a deduction of repayment of loans to shareholders of Rotem before the Veridis transaction (see
Note 25D(2) to the financial statements) and payments of intercompany taxes in the consolidated tax reconciliation statement. In 2022, the FFO was significantly impacted by maintenance performed.
|
|
19
|
In 2023, the financial results of the Hadera power plant includes compensation of about NIS 41 million in respect of
lost profits caused to Hadera as a result of delay of the commercial operation date of the power plant. For additional details – see Note 28A(4) to the financial statements.
|
|
20
|
The financial results of the Zomet and Three Rivers power plants were included starting from the commercial
operation date at the end of June 2023 and during July 2023, respectively. For details regarding the capacity tariffs in the Zomet power plant, particularly in 2023, see Section 7.13 of Part A of the Periodic Report.
|
|
21
|
The financial results of the projects were included starting from the date of the initial consolidation in the
second quarter of 2023. The estimated EBITDA for a full calendar year of the Mountain Wind project in the period of the PPA agreement is about NIS 47 million (about $13 million). That stated regarding the estimated EBITDA
calendar year is “forward‑looking” information as it is defined in the Securities Law, which is based on estimates of the CPV Group as at the date of the report that might not materialize.
|
|
22
|
The FFO in the year of the report includes a payment of about NIS 8 million for significant planned maintenance work
that was performed at Gat in the first quarter of 2023.
|
|
23
|
The FFO in the year of the report includes a payment in respect of the project for upgrade of facilities of the
Maryland power plant, in the amount of about NIS 8 million.
|
|
24
|
The FFO in the year of the report includes a payment, in the amount of about NIS 17 million, in respect of
significant planned maintenance work performed at Shore, in the first half of 2023.
|
|
25
|
It is noted that the financing agreements of the CPV Group including mechanisms of the “cash sweep” type in the
framework of which all or part of the free cash flows from the project is designated for repayment of the loan principal on a current basis in addition to the predetermined minimum repayment schedule with respect to every
long‑term loan. Accordingly, there could be an acceleration of execution of repayments upon occurrence of certain events and there are limitations on distributions to the owners. For additional details – see Section 9
below.
|
|
26
|
The financial results of Maple Hill were included starting from the commercial operation date, from November
2023. The estimated EBITDA for a full calendar year of the Maple Hill project in the period of the PPA agreement is about NIS 42 million
(about $11 million). That stated regarding the estimated EBITDA calendar year is “forward‑looking” information as it is defined in the
Securities Law, which is based on estimates of the CPV Group as at the date of the report that might not materialize.
|
| 4. |
Analysis of the results of operations for the year ended December 31, 2023 (in millions of NIS) (Cont.)
|
|
|
C. |
Analysis of the change in adjusted EBITDA – Israel segment
|

|
|
1. |
Energy margin – the increase stems mainly from an increase in the generation tariff, in the
amount of about NIS 30 million, an increase in the sales of energy, in the amount of about NIS 22 million, as a result of an increase of consumer consumption, and a decrease in the natural gas prices, in the amount of about NIS 51 million,
as a result of the start of execution of the Energean agreement commencing from the end of the first quarter of 2023. On the other hand, there was an increase in the natural gas price due to the strengthening of the dollar against shekel,
in the amount of about NIS 42 million. In addition, there was a decline in the revenues due to the revision of the hourly demand brackets, in the aggregate amount of about NIS 33 million (for additional details – see Section 3.2(D)).
|
| 4. |
Analysis of the results of operations for the year ended December 31, 2023 (in millions of NIS) (Cont.)
|
|
|
C. |
Analysis of the change in adjusted EBITDA – Israel segment (Cont.)
|
|
|
2. |
Availability (operational) – last year the Rotem and Hadera power plants were shut down for
different periods of time for purposes of maintenance work, which had a negative impact on their results compared with the year of the report. In addition, the operating results of the Hadera power plant were negatively impacted in the
third quarter of 2023 due to advancement of planned maintenance work in one of the gas turbines. For details regarding planned maintenance of about 15 days at Rotem in 2024 – see Section 7.11.1 of Part A of the Periodic Report.
|
|
|
3. |
One‑time events – in the fourth quarter of 2023, a compromise agreement was signed with the
Hadera construction contractor whereby revenues were recognized in the amount of about NIS 41 million (about $11 million) in respect of a loss of revenues caused to Hadera due to delay in the commercial operation date of the power plant.
For additional details – see Note 28A(4) to the financial statements. In addition, in the first quarter of 2023, Rotem and Hadera recognized a contractual monetary amount it is entitled to from Energean, in the aggregate amount of about
NIS 18 million further to amendment of the agreements from May 2022. The said amount is expected to actually be received in installments in the first half of 2024. For additional details – see Note 28C(3) to the financial statements.
|
| 4. |
Analysis of the results of operations for the year ended December 31, 2023 (in millions of NIS) (Cont.)
|
|
|
D. |
Analysis of the change in adjusted EBITDA after proportionate consolidation – energy transition segment in the U.S.
|

|
|
1. |
Energy margin – as stated in Section 3.3H above, in the year of the report there was a
significant decline in the energy margins compared with 2022, and correspondingly there was a decline, in the amount of about NIS 392 million, in the electricity margins of the CPV Group (on the assumption of full capacity). In addition,
there was a decline of about NIS 6 million in revenues from availability.
|
|
|
2. |
Energy hedges27 – the said decline in the electricity margins was offset, in the
amount of about NIS 329 million, mainly due to utilization of a loss on hedges in 2022 and realization of income from hedges in 2023, as detailed in Section 3.3H. For details regarding energy hedges for 2024 – see Section E below.
|
|
|
3. |
Availability (operational) – the increase stems mainly from maintenance work at the Valley
power plant in 2022. In addition, in the fourth quarter of 2023, planned maintenance work was performed in the Fairview power plant, which extended beyond the expectation and had a negative impact on the results in this quarter.
|
|
27
|
For details relating to the policies for management of the exposures in the CPV Group, and particularly with reference to
hedging of part of the electricity margins – see Note 23 to the financial statements.
|
| 4. |
Analysis of the results of operations for the year ended December 31, 2023 (in millions of NIS) (Cont.)
|
|
|
D. |
Analysis of the change in adjusted EBITDA after proportionate consolidation – energy transition
segment in the U.S. (Cont.)
|

| 4. |
Analysis of the results of operations for the year ended December 31, 2023 (in millions of NIS) (Cont.)
|
|
|
E. |
Additional details regarding electricity hedges and guaranteed capacity payments in the Energy Transition segment in the U.S.
|
|
2024
|
|
|
Expected generation (MWh)
|
9,773,754
|
|
Net scope of the hedged energy margin (% of the power plant’s capacity based on the expected generation) (*)
|
50%
|
|
Net hedged energy margin (millions of $)
|
≈ 74.9 (≈ NIS 276 million)
|
|
Net hedged energy margin (MWh/$)
|
15.30
|
|
Net market prices of energy margin (MWh/$) (**)
|
16.49
|
|
|
(*) |
Pursuant to the policy for hedging electricity margins as at the date of the report, in general the CPV Group seeks to hedge up to 50% of the scope of the expected generation. The actual hedge rate could ultimately be different. In
general, the hedge is made for a period of 24 months and most of it is for a period of 12 months forward and, accordingly, as at December 31, 2023, the scope of the hedges made for 2025 is not material.
|
|
|
(**) |
The net energy margin is the energy margin (Spark Spread) plus/minus Power Basis less carbon tax and other variable costs. For details regarding the manner of calculation of the electricity margin (Spark Spread) – see Section 3.3H above.
The market prices of the net hedged energy are based on future contracts for electricity and natural gas.
|
|
2024
|
|
|
Scope of the secured capacity revenues (% of the power plant’s capacity)
|
89%
|
|
Capacity payments (millions of $)
|
≈ 56 (≈ NIS 205 million)
|
|
28
|
The estimated percentages and the actual hedged energy margins could change due to new hedges and/or sales of capacity made or as a result of market conditions or the hedging policy of the CPV Group.
|
| 4. |
Analysis of the results of operations for the year ended December 31, 2023 (in millions of NIS) (Cont.)
|
|
|
F. |
Analysis of the change in net income (in millions of NIS)
|

|
|
(1) |
Most of the increase stems from depreciation expenses of the Gat power plant (about NIS 27 million) and Mountain Wind (about NIS 13 million) power plant which were consolidated for the first time in the second quarter of 2023, the
commercial operation of the Zomet power plant (about NIS 28 million) that took place in the second quarter of 2023 and an increase of about NIS 23 million due to a decision of the CPV Group made in the third quarter of 2023 to discontinue
development of a natural gas project in the United States.
|
|
|
(2) |
Most of the increase in the other expenses stems from a loss from impairment of value of goodwill in Gnrgy, in the amount of about NIS 23 million, as detailed in Note 12D to the financial statements.
|
|
|
(3) |
Most of the increase stems from financing expenses relating to acquisition of the Gat power plant, in the amount of about NIS 24 million, to acquisition of the Mountain Wind power plant, in the amount of about NIS 14 million, and the
commercial operation of the Zomet power plant, in the amount of about NIS 44 million. On the other hand, the interest income from deposits increased by the amount of about NIS 26 million.
|
| 4. |
Analysis of the results of operations for the year ended December 31, 2023 (in millions of NIS) (Cont.)
|
|
|
G. |
Adjustments to EBITDA after proportionate consolidation and net income (in millions of NIS)
|
|
For the Year Ended
|
|||||||||
|
Section
|
December 31
|
Board’s explanations
|
|||||||
|
2023
|
2022
|
||||||||
|
Change in the fair value of derivative financial instruments in the U.S. (presented as part of the Company’s share of income of associated companies in the U.S.)
|
(8
|
)
|
8
|
Represents the change in the fair value of derivative financial instruments that are used in programs for hedging electricity margins of the transition generation energies segment in the U.S.
and that were not designated for hedge accounting – for details see Section E above.
|
|||||
|
Change in net expenses, not in the ordinary course of business and/or of a non‑recurring nature
|
18
|
10
|
In the year of the report and in 2022, represents test runs and other activities executed prior to the commercial operation of the Zomet power plant, which took place in June 2023.
|
||||||
|
Total adjustments to EBITDA after proportionate consolidation
|
10
|
18
|
|||||||
|
Income from exchange rate differences in respect of intercompany loans (*)
|
–
|
(82
|
)
|
||||||
|
Tax impact in respect of the adjustments
|
(2
|
)
|
18
|
||||||
|
Total adjustments to net income for the period
|
8
|
(46
|
)
|
||||||
| (*) |
For purposes of improving the comparability between the periods with respect to the adjusted net income data, the Company made a reconciliation to the net income for 2022 in respect of income that is not cash (cash flow) income from
exchange rate differences from revaluation of intercompany loans that occurred from October 1, 2022 that were classified as part of the Group’s net investment in CPV in the U.S. and exchange rate differences in respect thereof are recorded,
commencing from that date, to other comprehensive income as part of the translation reserve.
|
| 4. |
Analysis of the results of operations for the year ended December 31, 2023 (in millions of NIS) (Cont.)
|
|
|
H. |
Detail generation (in millions of kilowatt/hours)
|
|
For the year ended December 31, 2023
|
For the year ended December 31, 2022
|
|||||||||||||||||||||||||||||||||||
|
Actual
|
Actual
|
|||||||||||||||||||||||||||||||||||
|
Potential
|
Net
|
calculated
|
Actual
|
Potential
|
Net
|
Actual
|
calculated
|
|||||||||||||||||||||||||||||
|
electricity
|
electricity
|
generation
|
availability
|
electricity
|
electricity
|
generation
|
availability
|
|||||||||||||||||||||||||||||
|
Capacity
|
generation
|
generation
|
percentage
|
percentage
|
generation
|
generation
|
percentage
|
percentage
|
||||||||||||||||||||||||||||
|
(MW)
|
(GWh)(1)
|
(GWh)(2)
|
(%)(3)
|
(%)
|
(GWh)
|
(GWh)
|
(%)
|
(%)
|
||||||||||||||||||||||||||||
|
Rotem
|
466
|
3,761
|
3,514
|
93.4
|
%
|
98.5
|
%
|
3,765
|
3,283
|
87.2
|
%
|
88.0
|
%
|
|||||||||||||||||||||||
|
Hadera
|
144
|
1,036
|
939
|
90.7
|
%
|
90.7
|
%
|
1,026
|
790
|
77.0
|
%
|
77.0
|
%
|
|||||||||||||||||||||||
|
Gat29
|
75
|
458
|
433
|
94.4
|
%
|
94.1
|
%
|
–
|
–
|
–
|
–
|
|||||||||||||||||||||||||
|
Zomet30
|
396
|
1,742
|
283
|
16.3
|
%
|
88.0
|
%
|
–
|
–
|
–
|
–
|
|||||||||||||||||||||||||
|
|
(1) |
The generation potential is the net generation capability adjusted for temperature and humidity.
|
|
|
(2) |
The actual net generation in the period.
|
|
|
(3) |
The actual generation percentage is the net electricity divided by the generation potential.
|
|
29
|
Data of the generation of the Gat and Mountain Wind power plants are included from the date of the initial consolidation in the second quarter of 2023.
|
| 30 |
Data of the generation of the Zomet and Three Rivers power plants are included starting from the date of the commercial operation at the end of June 2023 and during July 2023, respectively.
Regarding the Maple Hill project, generation data was not included due to the short period from the commercial operation date during November 2023 up to the endo of the year.
|
| 4. |
Results of operations for the year ended December 31, 2023 (in millions of NIS) (Cont.)
|
|
|
H. |
Detail generation (in millions of kilowatt/hours) (Cont.)
|
|
For the year ended December 31, 2023
|
For the year ended December 31, 2022
|
|||||||||||||||||||||||||||||||||||
|
Potential
|
Net
|
Actual
|
Actual
|
Potential
|
Net
|
Actual
|
Actual
|
|||||||||||||||||||||||||||||
|
electricity
|
electricity
|
generation
|
availability
|
electricity
|
electricity
|
generation
|
availability
|
|||||||||||||||||||||||||||||
|
Capacity
|
generation
|
generation
|
percentage
|
percentage
|
generation
|
generation
|
percentage
|
percentage
|
||||||||||||||||||||||||||||
|
(MW)
|
(GWh)(1)
|
(GWh)(2)
|
(%)(3)
|
(%)
|
(GWh)
|
(GWh)
|
(%)
|
(%)
|
||||||||||||||||||||||||||||
|
Energy transition projects (natural gas)
|
||||||||||||||||||||||||||||||||||||
|
Fairview
|
1,050
|
8,160
|
7,213
|
81.1
|
%
|
84.2
|
%
|
8,806
|
7,607
|
85.6
|
%
|
87.3
|
%
|
|||||||||||||||||||||||
|
Towantic
|
805
|
6,888
|
5,551
|
77.5
|
%
|
91.2
|
%
|
6,133
|
4,960
|
69.3
|
%
|
83.5
|
%
|
|||||||||||||||||||||||
|
Maryland
|
745
|
6,089
|
4,162
|
64.5
|
%
|
93.0
|
%
|
6,089
|
3,779
|
69.8
|
%
|
90.9
|
%
|
|||||||||||||||||||||||
|
Shore
|
725
|
5,333
|
4,000
|
63.3
|
%
|
83.4
|
%
|
6,285
|
4,422
|
69.8
|
%
|
96.0
|
%
|
|||||||||||||||||||||||
|
Valley
|
720
|
5,867
|
4,392
|
72.3
|
%
|
77.6
|
%
|
6,192
|
4,831
|
80.0
|
%
|
88.6
|
%
|
|||||||||||||||||||||||
|
Three Rivers30
|
1,258
|
4,220
|
2,814
|
64.0
|
%
|
74.8
|
%
|
–
|
–
|
–
|
–
|
|||||||||||||||||||||||||
|
Renewable energy projects
|
||||||||||||||||||||||||||||||||||||
|
Keenan II
|
152
|
1,322
|
271
|
20.4
|
%
|
93.6
|
%
|
1,330
|
286
|
21.5
|
%
|
92.3
|
%
|
|||||||||||||||||||||||
|
Mountain Wind29
|
82
|
481
|
140
|
22.0
|
%
|
79.6
|
%
|
–
|
–
|
–
|
–
|
|||||||||||||||||||||||||
| (1) |
The potential generation is the gross generation capability during the period after planned maintenance and less the electricity used for the power plant’s internal purposes.
|
| (2) |
The net generation of electricity is the gross generation during the period less the electricity used for the power plant’s internal purposes.
|
| (3) |
The actual generation percentage is the quantity of the net electricity generated in the facilities compared with the maximum quantity that can be generated in the period.
|
| 5. |
Analysis of the results of operations for the three‑month period ended December 31, 2023 (in millions of NIS)
|
|
|
A. |
Statement of income
|
|
For the Three Months Ended
|
||||||||
|
Section
|
December 31
|
|||||||
|
2023
|
2022
|
|||||||
|
Revenues from sales and provision of services (1)
|
581
|
504
|
||||||
|
Cost of sales and provision of services (without depreciation and amortization) (2)
|
(432
|
)
|
(368
|
)
|
||||
|
Depreciation and amortization
|
(83
|
)
|
(59
|
)
|
||||
|
Gross profit
|
66
|
77
|
||||||
|
Administrative and general expenses
|
(30
|
)
|
(84
|
)
|
||||
|
Share in earnings of associated companies
|
63
|
96
|
||||||
|
Business development expenses
|
(11
|
)
|
(15
|
)
|
||||
|
Compensation in respect of lost revenues
|
41
|
–
|
||||||
|
Other expenses, net
|
(22
|
)
|
–
|
|||||
|
Operating income
|
107
|
74
|
||||||
|
Financing expenses, net
|
(54
|
)
|
(29
|
)
|
||||
|
Income before taxes on income
|
53
|
45
|
||||||
|
Taxes on income expenses
|
(24
|
)
|
(8
|
)
|
||||
|
Net income for the period
|
29
|
37
|
||||||
|
Adjustments
|
(18
|
)
|
14
|
|||||
|
Adjusted net income for the period
|
11
|
51
|
||||||
|
Attributable to:
|
||||||||
|
The Company’s shareholders
|
12
|
36
|
||||||
|
Holders of non‑controlling interests
|
(1
|
)
|
15
|
|||||
| 5. |
Analysis of the results of operations for the three‑month period ended December 31, 2023 (in millions of NIS) (Cont.)
|
|
|
A. |
Statement of income (Cont.)
|
|
Revenues
|
For the
|
Board’s Explanations
|
|||||||
|
Three Months Ended
|
|||||||||
|
December 31
|
|||||||||
|
2023
|
2022
|
||||||||
|
Revenues in Israel
|
|||||||||
|
Revenues from sale of energy to private customers
|
270
|
321
|
The decrease stems mainly from the change in the brackets for the demand hours (as detailed in in Section 3.2D above and in Section C below), and
offset of an increase of about NIS 21 million deriving from consolidation of the results of Gat for the first time starting from the second quarter of 2023.
|
||||||
|
Revenues from sale of energy to the System Operator and to other suppliers
|
27
|
7
|
The increase stems mainly from an increase, in the amount of about NIS 19 million, as a result of the commercial operation of Zomet at the end of the
second quarter of 2023.
|
||||||
|
Revenues in respect of capacity payments
|
29
|
–
|
The increase stems from the commercial operation of Zomet at the end of the second quarter of 2023.
|
||||||
|
Revenues from sale energy at a cogeneration tariff
|
48
|
21
|
Most of the increase stems from an increase in the quantity generated.
|
||||||
|
Revenues from sale of steam
|
14
|
18
|
|||||||
|
Other revenues
|
9
|
11
|
|||||||
|
Total revenues from sale of energy and others in Israel (without infrastructure services)
|
397
|
378
|
|||||||
|
Revenues from private customers in respect of infrastructure services
|
107
|
78
|
The increase stems mainly from an increase in the infrastructure tariffs and an increase in customer consumption, in the amounts of about NIS 20
million and about NIS 5 million, respectively, and an increase of about NIS 8 million due to consolidation of Gat for the first time starting from the second quarter of 2023.
|
||||||
|
Total revenues in Israel
|
504
|
456
|
|||||||
|
Revenues in the U.S.
|
|||||||||
|
Revenues from sale of electricity from renewable energy
|
47
|
22
|
The increase stems mainly from the first‑time consolidation of the Mountain Wind project in the second quarter of 2023.
|
||||||
|
Revenues from provision of services (as part of others) and other revenues
|
30
|
26
|
|||||||
|
Total revenues in the U.S.
|
77
|
48
|
|||||||
|
Total revenues
|
581
|
504
|
|||||||
| 5. |
Analysis of the results of operations for the three‑month period ended December 31, 2023 (in millions of NIS) (Cont.)
|
|
|
A. |
Statement of income (Cont.)
|
|
|
(2) |
Changes in the cost of sales and provision of services (not including depreciation and amortization):
|
|
Cost of Sales and
Provision of Services
|
For the
|
Board’s Explanations
|
|||||||
|
Three Months Ended
|
|||||||||
|
December 31
|
|||||||||
|
2023
|
2022
|
||||||||
|
Cost of sales in Israel
|
|||||||||
|
Natural gas and diesel oil
|
174
|
154
|
The increase stems from an increase in the gas tariff as a result of an increase in the shekel/dollar exchange rate, in the amount of about NIS 10
million, and an increase due to the initial consolidation of Gat and the commercial operation of Zomet starting from the second quarter of 2023, in the aggregate amount of about NIS 31 million. On the other hand, there was a decrease in the
gas expenses of about NIS 17 million, deriving from execution of the Energean agreement commencing from the end of the first quarter of 2023.
|
||||||
|
Expenses in respect of acquisition of energy
|
54
|
55
|
|||||||
|
Cost of transmission of gas
|
12
|
8
|
|||||||
|
Salaries and related expenses
|
10
|
8
|
|||||||
|
Operating expenses
|
31
|
17
|
The increase in the operating expenses stems mainly from the initial consolidation of Gat and the commercial operation of Zomet in the second quarter
of 2023.
|
||||||
|
Other expenses
|
5
|
15
|
Most of the decrease stems from operating expenses at the Zomet power plant prior to the commercial operation.
|
||||||
|
Total cost of sales in Israel without infrastructure services
|
286
|
257
|
|||||||
|
Expenses in respect of infrastructure services
|
107
|
78
|
The increase stems mainly from an increase in the infrastructure tariff and an increase in customer consumption, in the amounts of about NIS 20
million and about NIS 5 million, respectively, and an increase of about NIS 8 million due to consolidation of Gat for the first time starting from the second quarter of 2023.
|
||||||
|
Total cost of sales in Israel
|
393
|
335
|
|||||||
|
Cost of sales and services in the U.S.
|
|||||||||
|
Cost of sales in respect of sale of electricity from renewable energy
|
14
|
8
|
The increase stems mainly from the first‑time consolidation of the Mountain Wind project.
|
||||||
|
Cost in respect provision of services (as part of others) and other costs
|
25
|
25
|
|||||||
|
Total cost of sales and provision of services in the U.S.
|
39
|
33
|
|||||||
|
Total cost of sales and provision of services
|
432
|
368
|
|||||||
| 5. |
Analysis of the results of operations for the three‑month period ended December 31, 2023 (in millions of NIS) (Cont.)
|
|
|
B. |
EBITDA calculations, including EBITDA after adjusted proportionate consolidation31
(in millions of NIS):
|
|
For the
|
||||||||
|
Three Months Ended
|
||||||||
|
December 31
|
||||||||
|
2023
|
2022
|
|||||||
|
Revenues from sales and provision of services
|
581
|
504
|
||||||
|
Cost of sales and services (without depreciation and amortization)
|
(432
|
)
|
(368
|
)
|
||||
|
Administrative and general expenses (without depreciation and
|
||||||||
|
amortization)
|
(25
|
)
|
(82
|
)
|
||||
|
Business development expenses
|
(11
|
)
|
(15
|
)
|
||||
|
Share in income of associated companies
|
63
|
96
|
||||||
|
Compensation in respect of lost revenues
|
41
|
–
|
||||||
|
Consolidated EBITDA
|
217
|
135
|
||||||
|
Elimination of the share of income of associated companies
|
(63
|
)
|
(96
|
)
|
||||
|
Addition of the Group’s share in proportionate EBITDA of associated
|
||||||||
|
companies (1)
|
165
|
163
|
||||||
|
EBITDA after proportionate consolidation
|
319
|
202
|
||||||
|
Adjustments in the consolidation (see detail in Section F below)
|
–
|
7
|
||||||
|
Adjustments for associated companies (see detail in Section F below)
|
(23
|
)
|
10
|
|||||
|
Adjusted EBITDA after proportionate consolidation
|
296
|
219
|
||||||
|
|
(1) |
Calculation of the Group’s share in proportionate EBITDA of associated companies (in millions of NIS):
|
|
For the three months ended
|
Three
|
|||||||||||||||||||||||||||
|
December 31, 2023
|
Fairview
|
Towantic
|
Maryland
|
Shore
|
Valley
|
Rivers
|
Total
|
|||||||||||||||||||||
|
Revenues from sales of energy
|
28
|
38
|
44
|
50
|
61
|
18
|
239
|
|||||||||||||||||||||
|
Cost of natural gas
|
13
|
19
|
19
|
23
|
26
|
11
|
111
|
|||||||||||||||||||||
|
Carbon emissions tax (RGGI)
|
–
|
7
|
6
|
11
|
11
|
–
|
35
|
|||||||||||||||||||||
|
Cost of sales – other expenses (without
|
||||||||||||||||||||||||||||
|
depreciation and amortization)
|
–
|
1
|
2
|
2
|
1
|
–
|
6
|
|||||||||||||||||||||
|
Gain (loss) on realization of transactions
|
||||||||||||||||||||||||||||
|
hedging the electricity margins
|
3
|
3
|
–
|
(2
|
)
|
24
|
–
|
28
|
||||||||||||||||||||
|
Net energy margin
|
18
|
14
|
17
|
12
|
47
|
7
|
115
|
|||||||||||||||||||||
|
Revenues from capacity payments
|
3
|
29
|
7
|
5
|
15
|
1
|
60
|
|||||||||||||||||||||
|
Other income
|
2
|
2
|
1
|
2
|
1
|
–
|
8
|
|||||||||||||||||||||
|
Gross profit
|
23
|
45
|
25
|
19
|
63
|
8
|
183
|
|||||||||||||||||||||
|
Fixed costs (without depreciation and
|
||||||||||||||||||||||||||||
|
amortization)
|
2
|
6
|
4
|
5
|
17
|
2
|
36
|
|||||||||||||||||||||
|
Administrative and general expenses
|
||||||||||||||||||||||||||||
|
(without depreciation and amortization)
|
1
|
1
|
1
|
1
|
2
|
–
|
6
|
|||||||||||||||||||||
|
Group’s share in proportionate adjusted
|
||||||||||||||||||||||||||||
|
EBITDA of associated companies
|
20
|
38
|
20
|
13
|
44
|
6
|
141
|
|||||||||||||||||||||
| * |
At the Shore power plant, gas transmission costs are classified in accordance with IFRS 16 as depreciation expenses, and accordingly are not included in the adjusted EBITDA.
|
| 31 |
For details regarding the definitions of the “EBITDA” indices, “FFO” and “cash flow after service of project debt” – see Section 4B above.
|
| 5. |
Analysis of the results of operations for the three‑month period ended December 31, 2023 (in millions of NIS) (Cont.)
|
|
|
B. |
EBITDA calculations, including EBITDA after adjusted proportionate consolidation31
(in millions of NIS): (Cont.)
|
|
|
(1) |
Calculation of the Group’s share in proportionate EBITDA of associated companies (in millions of NIS): (Cont.)
|
|
For the three months ended
|
Three
|
|||||||||||||||||||||||||||
|
December 31, 2022
|
Fairview
|
Towantic
|
Maryland
|
Shore
|
Valley
|
Rivers
|
Total
|
|||||||||||||||||||||
|
Revenues from sales of energy
|
103
|
67
|
72
|
104
|
144
|
–
|
490
|
|||||||||||||||||||||
|
Cost of natural gas
|
56
|
46
|
37
|
65
|
83
|
–
|
287
|
|||||||||||||||||||||
|
Carbon emissions tax (RGGI)
|
–
|
5
|
3
|
8
|
10
|
–
|
26
|
|||||||||||||||||||||
|
Cost of sales – other expenses (without
|
||||||||||||||||||||||||||||
|
depreciation and amortization)
|
1
|
1
|
2
|
2
|
1
|
–
|
7
|
|||||||||||||||||||||
|
Gain (loss) on realization of transactions
|
||||||||||||||||||||||||||||
|
hedging the electricity margins
|
(19
|
)
|
(5
|
)
|
2
|
(2
|
)
|
14
|
–
|
(10
|
)
|
|||||||||||||||||
|
Net energy margin
|
27
|
10
|
32
|
27
|
64
|
–
|
160
|
|||||||||||||||||||||
|
Revenues from capacity payments
|
15
|
21
|
(9
|
)
|
8
|
9
|
–
|
44
|
||||||||||||||||||||
|
Other income
|
2
|
–
|
2
|
3
|
–
|
–
|
7
|
|||||||||||||||||||||
|
Gross profit
|
44
|
31
|
25
|
38
|
73
|
–
|
211
|
|||||||||||||||||||||
|
Fixed costs (without depreciation and
|
||||||||||||||||||||||||||||
|
amortization)
|
3
|
5
|
4
|
4
|
16
|
–
|
32
|
|||||||||||||||||||||
|
Administrative and general expenses
|
||||||||||||||||||||||||||||
|
(without depreciation and amortization)
|
1
|
1
|
1
|
1
|
2
|
–
|
6
|
|||||||||||||||||||||
|
Group’s share in proportionate adjusted
|
||||||||||||||||||||||||||||
|
EBITDA of associated companies
|
40
|
25
|
20
|
33
|
55
|
–
|
173
|
|||||||||||||||||||||
| * |
At the Shore power plant, gas transmission costs are classified in accordance with IFRS 16 as depreciation expenses, and accordingly are not included in the adjusted EBITDA.
|
| 5. |
Analysis of the results of operations for the three‑month period ended December 31, 2023 (in millions of NIS) (Cont.)
|
|
|
B. |
EBITDA calculations, including EBITDA after adjusted proportionate consolidation31
(in millions of NIS): (Cont.)
|
|
|
(2) |
Set forth below is a breakdown of the adjusted EBITDA after proportionate consolidation data broken down by the subsidiaries (on a consolidated basis) and the associated companies (on a proportionate basis, based on the rate of the
holdings of the CPV Group therein) (in NIS millions). It is noted that the activities of the Group’s activities are impacted by seasonality, and the fourth quarter particularly is characterized by relatively low profitability due to the
transition season.
|
|
For the Three Months Ended
|
|||||||||||||||||
|
|
Basis of
|
December 31, 2023
|
December 31, 2022
|
||||||||||||||
|
|
presentation
|
Adjusted
|
Adjusted
|
||||||||||||||
|
|
in the
|
EBITDA
|
EBITDA
|
||||||||||||||
|
|
Company’s
|
after
|
after
|
||||||||||||||
|
|
financial
|
proportionate
|
proportionate
|
||||||||||||||
|
|
statements
|
consolidation
|
FFO
|
consolidation
|
FFO
|
||||||||||||
|
Total operating projects (1)
|
Consolidated
|
140
|
76
|
109
|
(6
|
)
|
|||||||||||
|
Business development costs,
|
|||||||||||||||||
|
headquarters in Israel and others
|
Consolidated
|
(5
|
)
|
(66
|
)
|
(7
|
)
|
(24
|
)
|
||||||||
|
Total Israel
|
135
|
10
|
102
|
30
|
|||||||||||||
|
Total operating projects (1)
|
Associate
|
141
|
15
|
173
|
61
|
||||||||||||
|
Other costs
|
Consolidated
|
(1
|
)
|
(1
|
)
|
–
|
–
|
||||||||||
|
Total energy transition in the U.S.
|
140
|
14
|
173
|
61
|
|||||||||||||
|
Total operating projects (1)
|
Consolidated
|
26
|
9
|
14
|
6
|
||||||||||||
|
Business development and other costs
|
Consolidated
|
(12
|
)
|
(12
|
)
|
(10
|
)
|
(10
|
)
|
||||||||
|
Total renewable energy in the U.S.
|
14
|
(3
|
)
|
4
|
(4
|
)
|
|||||||||||
|
Total activities in the “others” segment
|
Consolidated
|
–
|
–
|
(4
|
)
|
(4
|
)
|
||||||||||
|
Headquarters in the United States32 (2)
|
Consolidated
|
14
|
(19
|
)
|
(47
|
)
|
(19
|
)
|
|||||||||
|
Total United States
|
168
|
(8
|
)
|
126
|
34
|
||||||||||||
|
Company headquarters (not allocated
|
|||||||||||||||||
|
to the segments)
|
Consolidated
|
(7
|
)
|
2
|
(9
|
)
|
(31
|
)
|
|||||||||
|
Total consolidated
|
296
|
4
|
219
|
(27
|
)
|
||||||||||||
| (1) |
See Section 5B(3) below.
|
| (2) |
Most of the change in the 2023 is in respect of a profit‑sharing plan for employees of the CPV Group, which is measured at fair value. For details – see Note 18 to the financial statements.
|
| 32 |
After eliminating management fees between the CPV Group and the Company, in the amounts of about NIS 8 million and about NIS 6 million for the three‑month periods
ended December 31, 2023 and 2022, respectively.
|
| 5. |
Analysis of the results of operations for the three‑month period ended December 31, 2023 (in millions of NIS) (Cont.)
|
|
|
B. |
EBITDA calculations, including EBITDA after adjusted proportionate consolidation31
(in millions of NIS): (Cont.)
|
|
|
(3) |
Set forth below is additional information regarding the revenues (net of infrastructure services), EBITDA after adjusted proportionate consolidation, FFO and net cash flows after project debt service of the Group’s active power plants
broken down by operating segments and subsidiaries (on a consolidated basis) and associated companies (on a proportionate basis, based on the rate of the holdings of the CPV Group therein) (in NIS millions):
|
|
|
|
For the three months ended
|
For the three months ended
|
|||||||||||||||||||||||||||||||
|
December 31, 2023
|
December 31, 2022
|
|||||||||||||||||||||||||||||||||
|
|
Basis of
|
Adjusted
|
Net cash
|
Adjusted
|
Net cash
|
|||||||||||||||||||||||||||||
|
|
presentation
|
Net
|
EBITDA
|
flows
|
Net
|
EBITDA
|
flows
|
|||||||||||||||||||||||||||
|
|
in the
|
revenues
|
after
|
after
|
revenues
|
after
|
after
|
|||||||||||||||||||||||||||
|
Main
|
Company’s
|
from
|
proportionate
|
service of
|
from
|
proportionate
|
service of
|
|||||||||||||||||||||||||||
|
projects in
|
financial
|
infrastructure
|
consol-
|
project
|
infrastructure
|
consol-
|
project
|
|||||||||||||||||||||||||||
|
operation
|
statements
|
services
|
idation
|
FFO
|
debt
|
services
|
idation
|
FFO
|
debt
|
|||||||||||||||||||||||||
|
Rotem33
|
Consolidated
|
177
|
47
|
61
|
61
|
236
|
99
|
7
|
7
|
|||||||||||||||||||||||||
|
Hadera34
|
Consolidated
|
99
|
66
|
14
|
2
|
92
|
10
|
(13
|
)
|
(23
|
)
|
|||||||||||||||||||||||
|
Zomet35
|
Consolidated
|
48
|
13
|
2
|
(37
|
)
|
–
|
–
|
–
|
–
|
||||||||||||||||||||||||
|
Gat36
|
Consolidated
|
23
|
14
|
(1
|
)
|
(6
|
)
|
–
|
–
|
–
|
–
|
|||||||||||||||||||||||
|
Total operating
|
||||||||||||||||||||||||||||||||||
|
projects in Israel
|
347
|
140
|
76
|
20
|
328
|
109
|
(6
|
)
|
(16
|
)
|
||||||||||||||||||||||||
|
Fairview
|
Associated (25%)
|
38
|
20
|
(1
|
)
|
(18
|
)
|
101
|
40
|
27
|
(1
|
)
|
||||||||||||||||||||||
|
Towantic
|
Associated (26%)
|
88
|
38
|
23
|
(5
|
)
|
89
|
25
|
19
|
15
|
||||||||||||||||||||||||
|
Maryland
|
Associated (25%)
|
59
|
20
|
(1
|
)
|
2
|
50
|
20
|
5
|
6
|
||||||||||||||||||||||||
|
Shore
|
Associated (37.5%)
|
63
|
13
|
2
|
(2
|
)
|
92
|
33
|
2
|
2
|
||||||||||||||||||||||||
|
Valley
|
Associated (50%)
|
109
|
44
|
(8
|
)
|
(14
|
)
|
174
|
55
|
8
|
(7
|
)
|
||||||||||||||||||||||
|
Three Rivers35
|
Associated (10%)
|
31
|
6
|
–
|
–
|
–
|
–
|
–
|
–
|
|||||||||||||||||||||||||
|
Total energy transition
|
||||||||||||||||||||||||||||||||||
|
in the U.S.37
|
388
|
141
|
15
|
(37
|
)
|
506
|
173
|
61
|
15
|
|||||||||||||||||||||||||
|
Keenan
|
Consolidated
|
23
|
14
|
5
|
(12
|
)
|
22
|
14
|
6
|
(1
|
)
|
|||||||||||||||||||||||
|
Mountain Wind36
|
Consolidated
|
19
|
11
|
5
|
7
|
–
|
–
|
–
|
–
|
|||||||||||||||||||||||||
|
Maple Hill38
|
Consolidated
|
5
|
1
|
(1
|
)
|
(1
|
)
|
–
|
–
|
–
|
–
|
|||||||||||||||||||||||
|
Total renewable
|
||||||||||||||||||||||||||||||||||
|
energy in the U.S.
|
47
|
26
|
9
|
(6
|
)
|
22
|
14
|
6
|
(1
|
)
|
||||||||||||||||||||||||
| 33 |
Not including a deduction of repayment of loans to the shareholders in Rotem before the Veridis transaction (see Note 25D(2) of the financial statements) and intercompany tax payments as part of the
consolidated tax reconciliation statement.
|
| 34 |
The financial results of the Hadera power plant includes compensation of about NIS 41 million in respect of lost revenues caused to Hadera as a result of delay of the commercial operation date of
the power plant. For additional details – see Note 28A(4) to the financial statements.
|
| 35 |
The financial results of the Zomet and Three Rivers power plants were included starting from the commercial operation date, from the end of June 2023 and during July 2023, respectively.
|
| 36 |
The financial results of the projects were included starting from the initial consolidation date, in the second quarter of 2023.
|
| 37 |
It is noted that the financing agreements of the CPV Group including mechanisms of the “cash sweep” type in the framework of which all or part of the free cash flows from the project is
designated for repayment of the loan principal on a current basis plus the predetermined minimum repayment schedule with respect to every long‑term loan. Accordingly, there could be an acceleration of execution of
repayments upon occurrence of certain events and there are limitations on distributions to the owners. For additional details – see Section 9 below.
|
| 38 |
The financial results of Maple Hill were included commencing from the commercial operation date, from November 2023.
|
| 5. |
Analysis of the results of operations for the three‑month period ended December 31, 2023 (in millions of NIS) (Cont.)
|
|
|
C. |
Analysis of the change in adjusted EBITDA – segment in Israel
|

|
|
1. |
Energy margin – the decrease in energy margin in the quarter compared with the corresponding
quarter last year stems mainly from a decrease in the amount of about NIS 56 million due to a revision of the brackets for the demand hours (for additional details – see Section 3.2D) and a decrease in the generation tariff. On the other
hand, there was a decrease in the natural gas price, in the amount of about NIS 17 million, due to the start of execution of the Energean agreement (commencing from the end of the first quarter of 2023), net of an increase in the natural
gas price due to the strengthening of the dollar against the shekel, in the amount of about NIS 12 million. In addition, there was an increase, in the amount of about NIS 4 million, as a result of an increase in customer consumption.
|
|
|
2. |
One‑time events – in the fourth quarter of 2023, a compromise agreement was signed with the
Hadera construction contractor whereby revenues were recognized in the amount of about NIS 41 million (about $11 million) in respect of a loss of revenues caused to Hadera due to delay in the commercial operation date of the power plant.
For additional details – see Note 28A(4) to the financial statements.
|
| 5. |
Analysis of the results of operations for the three‑month period ended December 31, 2023 (in millions of NIS) (Cont.)
|
|
|
D. |
Analysis of the change in EBITDA after adjusted proportionate consolidation – energy transition segment in the U.S.
|
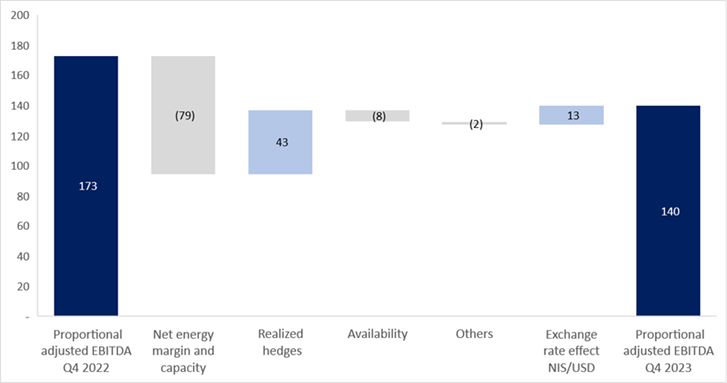
|
|
1. |
Energy margin – as stated in Section 3.3H above, in the fourth quarter of 2023 there was a
decrease in the energy margins, compared with the corresponding quarter last year, and correspondingly there was a decline, in the amount of about NIS 90 million, in the electricity margins of the CPV Group (on the assumption of full
capacity). In addition, there was a decrease in revenues from availability, in the amount of about NIS 11 million.
|
|
|
2. |
Energy hedges – the said decline in the electricity margins in some of the power plants was
offset, in the amount of about NIS 43 million, compared with the corresponding quarter last year, mainly due to realization of a loss on hedges in the fourth quarter of 2022 and realization of income from hedges in the fourth quarter of
2023, as detailed in Section 3.3H above.
|
|
|
3. |
Availability (operational) – for details regarding maintenance at the Fairview power plant in
the fourth quarter of 2023 – see Section 4D above.
|
| 5. |
Analysis of the results of operations for the three‑month period ended December 31, 2023 (in millions of NIS) (Cont.)
|
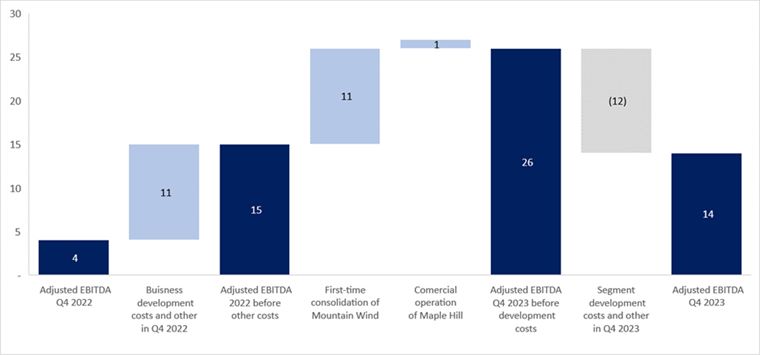
| 5. |
Analysis of the results of operations for the three‑month period ended December 31, 2023 (in millions of NIS) (Cont.)
|
|
|
E. |
Analysis of the change in net income (in NIS millions)
|
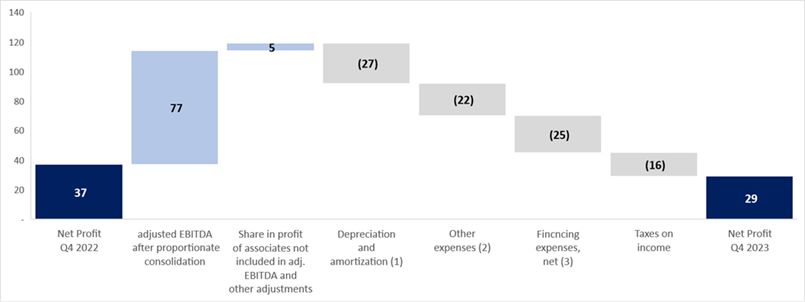
|
|
(1) |
Most of the increase stems from depreciation expenses of the Gat (about NIS 6 million) and Mountain Wind (about NIS 4 million) power plants which were consolidated for the first time in the second quarter of 2023, and the commercial
operation of the Zomet power plant (about NIS 10 million) in the second quarter of 2023.
|
|
|
(2) |
Most of the increase stems from a loss from impairment of value of goodwill in Gnrgy, in the amount of about NIS 23 million, as detailed in Note 12D to the financial statements.
|
|
|
(3) |
Most of the increase stems from financing expenses relating to acquisition of the Gat power plant, in the amount of about NIS 8 million, acquisition of the Mountain Wind power plant, in the amount of about NIS 7 million, and the commercial
operation of the Zomet power plant, in the amount of about NIS 22 million.
|
| 5. |
Analysis of the results of operations for the three‑month period ended December 31, 2023 (in millions of NIS) (Cont.)
|
|
|
F. |
Adjustments to EBITDA after proportionate consolidation and net income (in millions of NIS)
|
|
For the three months ended
|
|||||||||
|
Section
|
December 31
|
Board’s explanations
|
|||||||
|
2023
|
2022
|
||||||||
|
Change in the fair value of derivative financial instruments (which are presented as part of the Company’s share of income of associated companies in the U.S.)
|
(23
|
)
|
10
|
Represents the change in the fair value of derivative financial instruments that are used in programs for hedging electricity margins of the natural gas segment in the U.S. that were not
designated for hedge accounting, as described in Section 4E above.
|
|||||
|
Net expenses, not in the ordinary course of business and/or of a non‑recurring natures
|
–
|
7
|
In the corresponding quarter last year, represents activities in respect of a test run and the Company’s preparations for the commercial operation of the Zomet Power Plant at the end of June
2023.
|
||||||
|
Total adjustments to EBITDA after proportionate consolidation
|
(23
|
)
|
17
|
||||||
|
Tax impact in respect of the adjustments
|
5
|
(3
|
)
|
||||||
|
Total adjustments to the income for the period
|
(18
|
)
|
14
|
||||||
| 5. |
Analysis of the results of operations for the three‑month period ended December 31, 2023 (in millions of NIS) (Cont.)
|
|
|
G. |
Detail generation (in millions of kilowatt/hours)
|
|
For the three months ended December 31, 2023
|
For the three months ended December 31, 2022
|
|||||||||||||||||||||||||||||||||||
|
Actual
|
Actual
|
|||||||||||||||||||||||||||||||||||
|
Potential
|
Net
|
Actual
|
calculated
|
Potential
|
Net
|
Actual
|
calculated
|
|||||||||||||||||||||||||||||
|
electricity
|
electricity
|
generation
|
availability
|
electricity
|
electricity
|
generation
|
availability
|
|||||||||||||||||||||||||||||
|
Capacity
|
generation
|
generation
|
percentage
|
percentage
|
generation
|
generation
|
percentage
|
percentage
|
||||||||||||||||||||||||||||
|
(MW)
|
(GWh)(1)
|
(GWh)(2)
|
(%)(3)
|
(%)
|
(GWh)
|
(GWh)
|
(%)
|
(%)
|
||||||||||||||||||||||||||||
|
Rotem
|
466
|
950
|
858
|
90.3
|
%
|
98.6
|
%
|
956
|
876
|
91.6
|
%
|
97.2
|
%
|
|||||||||||||||||||||||
|
Hadera
|
144
|
261
|
260
|
99.6
|
%
|
99.6
|
%
|
262
|
207
|
78.9
|
%
|
78.9
|
%
|
|||||||||||||||||||||||
|
Gat39
|
75
|
149
|
125
|
84.2
|
%
|
82.3
|
%
|
|||||||||||||||||||||||||||||
|
Zomet40
|
396
|
835
|
59
|
7.0
|
%
|
86.5
|
%
|
|||||||||||||||||||||||||||||
|
|
|
For the three months ended December 31, 2023
|
For the three months ended December 31, 2022
|
|||||||||||||||||||||||||||||||||
|
|
|
Potential
|
Net
|
Actual
|
Actual
|
Potential
|
Net
|
Actual
|
Actual
|
|||||||||||||||||||||||||||
|
|
electricity
|
electricity
|
generation
|
availability
|
electricity
|
electricity
|
generation
|
availability
|
||||||||||||||||||||||||||||
|
|
Capacity
|
generation
|
generation
|
percentage
|
percentage
|
generation
|
generation
|
percentage
|
percentage
|
|||||||||||||||||||||||||||
|
(MW)
|
(GWh)(1)
|
(GWh)(2)
|
(%)(3)
|
(%)
|
(GWh)
|
(GWh)
|
(%)
|
(%)
|
||||||||||||||||||||||||||||
|
Energy transition projects (natural gas)
|
||||||||||||||||||||||||||||||||||||
|
Fairview
|
1,050
|
1,312
|
1,008
|
44.3
|
%
|
46.5
|
%
|
2,114
|
1,839
|
81.4
|
%
|
82.7
|
%
|
|||||||||||||||||||||||
|
Towantic
|
805
|
1,780
|
1,240
|
67.4
|
%
|
80.9
|
%
|
1,679
|
1,222
|
66.6
|
%
|
82.6
|
%
|
|||||||||||||||||||||||
|
Maryland
|
745
|
1,441
|
1,111
|
67.9
|
%
|
99.3
|
%
|
1,441
|
921
|
55.9
|
%
|
85.5
|
%
|
|||||||||||||||||||||||
|
Shore
|
725
|
1,606
|
1,311
|
81.7
|
%
|
100.0
|
%
|
1,616
|
1,171
|
72.2
|
%
|
98.9
|
%
|
|||||||||||||||||||||||
|
Valley
|
720
|
1,160
|
970
|
61.6
|
%
|
66.2
|
%
|
1,676
|
1,193
|
77.6
|
%
|
90.2
|
%
|
|||||||||||||||||||||||
|
Three Rivers40
|
1,258
|
2,681
|
1,758
|
65.8
|
%
|
85.2
|
%
|
–
|
–
|
–
|
–
|
|||||||||||||||||||||||||
|
Renewable energy projects
|
||||||||||||||||||||||||||||||||||||
|
Keenan II
|
152
|
335
|
77
|
23.0
|
%
|
94.8
|
%
|
335
|
58
|
17.3
|
%
|
90.6
|
%
|
|||||||||||||||||||||||
|
Mountain Wind39
|
82
|
180
|
60
|
20.4
|
%
|
59.9
|
%
|
–
|
–
|
–
|
–
|
|||||||||||||||||||||||||
| 39 |
Details of the generation of the Gat and Mountain Wind power plants are included from the date of the initial consolidation in the second quarter of 2023.
|
| 40 |
Details of the generation of the Zomet and Three Rivers power plants are included starting from the date of the commercial operation at the end of June 2023 and during July 2023, respectively.
Details of the generation of the Maple Hill power plant are included starting from the date of the commercial operation during November 2023.
|
| 6. |
Initiation and Construction Projects (Cont.)
|
|
|
1. |
Main details with reference to construction projects in Israel (held at 100% ownership by OPC Israel, which is 80% held by the Company)41:
|
|
Total
|
||||||||||||||||
|
Power
|
Date/
|
Total
|
construction
|
|||||||||||||
|
plants/
|
expectation
|
expected
|
cost as at
|
|||||||||||||
|
facilities
|
of the start
|
construction
|
December 31,
|
|||||||||||||
|
for
|
of the
|
Main
|
cost
|
2023
|
||||||||||||
|
generation
|
Capacity
|
commercial
|
customer/
|
(NIS
|
(NIS
|
|||||||||||
|
of energy
|
Status
|
(megawatts)
|
Location
|
Technology
|
operation
|
consumer
|
millions)
|
millions)
|
||||||||
|
OPC Sorek 2 Ltd. (“Sorek 2”)
|
Under construction
|
≈ 87
|
On the premises of the Sorek B seawater desalination facility
|
Powered by natural gas, cogeneration
|
The second half of 202442
|
Yard consumers and the System Operator
|
≈ 200
|
≈ 138
|
| 41 |
That stated in connection with projects that have not yet reached operation (including
generation facilities on the premises of the consumers) including with reference to the expected operation date, the technologies and/or the anticipated cost of the investment, is “forward‑looking” information, as it is
defined in the Securities Law, which is based on, among other things, the Company’s estimates and assumptions as at the approval date of the report and regarding which there is no certainty it will be realized (in whole
or in part). Completion of the said projects (or any one of them) may not occur or may occur in a manner different than that stated above, among other things due to dependency on various factors, including those that are
not under the Company’s control, including assurance of connection to the network and output of electricity from the project sites and/or connection to the infrastructures (including gas infrastructures), receipt of
permits, completion of planning processes and licensing, completion of construction work, final costs in respect of development, construction, equipment and acquisition of rights in land, the proper functioning of the
equipment and/or the terms of undertakings with main suppliers (including lenders), and there is no certainty they will be fulfilled, the manner of their fulfillment, the extent of their impact or what their final terms
will be. Ultimately technical, operational or other delays and/or breakdowns and/or an increase in expenses could be caused, this being as a result of, among other things, factors as stated above or as a result of
occurrence of one or more of the risk factors the Company is exposed to, including construction risks (including force
majeure events and the War and its impacts), regulatory, licensing or planning risks, macro‑economic changes, delays and increased costs
due relating to the supply chain and changes in raw‑material prices and etc. For additional details regarding risk factors – see Section 19 of Part A of the Periodic Report. It is further clarified that delays in
completion of the projects beyond the date originally planned for this could impact the ability of the Company and the Group companies to comply with their obligations to third parties (including by force of guarantees
provided), including authorities, conditions of permits, lenders, yard consumers, customers and others, in connection with the projects, and cause a charge for compensation or starting of proceedings (including under
guarantees provided)
|
| 42 |
It is noted that a delay in the commercial operation beyond the original contractual date, which is not considered a justified delay as defined in the project agreements, could trigger
payment of monthly compensation at a limited graduated rate (taking into account the length of the delay, where a delay after full utilization of the compensation ceiling could give rise to a cancellation right). It is
clarified that in the initial delay period, the amount of the compensation for an unjustified delay is not material. It is noted that the construction contractor of the Sorek 2 project delivered a force majeure notification due to the outbreak of the War, and Sorek 2 project delivered on its behalf a force majeure notification to the
initiator of the desalination facility. The construction work, its completion the commercial operation date and the costs involved with the construction could be adversely impacted by the War and/or its impacts. It is
further noted that based on a decision of the Electricity Authority, dates were extended, among other things, as part of the arrangement that applies to the project due to the defense (security) such that an extension of
two months was allowed for date of the financial closing. As at the date of the report, completion of the construction and operation of the Sorek 2 generation facility are subject to fulfillment of conditions and factors
that do not yet exist, including receipt of permits and reaching a financial closing. Ultimately, the date expected for completion of the construction and commencement of the operation, as shown in the table could be
delayed as a result of, among other things, a delay in completion of the construction work (including construction of the desalination facility), delays in receipt of the required permits, disruptions in arrival of
equipment force majeure events, occurrence of risk factors to which the Company is exposed, including delays relating to the war or its consequences. It is clarified that delays
as stated could impact the project’s costs and could also trigger and increase in costs (beyond the expected cost indicated above) and/or could constitute non‑compliance with liabilities to third parties.
|
| 6. |
Initiation and Construction Projects (Cont.)
|
|
|
1. |
Main details with reference to construction projects in Israel (held at 100% ownership by OPC Israel, which is 80% held by the Company)41: (Cont.)
|
|
Total
|
||||||||||||||||
|
Power
|
Date/
|
Total
|
construction
|
|||||||||||||
|
plants/
|
expectation
|
expected
|
cost as at
|
|||||||||||||
|
facilities
|
of the start
|
construction
|
December 31,
|
|||||||||||||
|
for
|
of the
|
Main
|
cost
|
2023
|
||||||||||||
|
generation
|
Capacity
|
commercial
|
customer/
|
(NIS
|
(NIS
|
|||||||||||
|
of energy
|
Status
|
(megawatts)
|
Location
|
Technology
|
operation
|
consumer
|
millions)
|
millions)
|
||||||||
|
Facilities for generation of energy located on the consumer’s premises
|
In various stages of development / construction
|
As at the approval date of the report, the cumulative amount of the agreements is about 127 megawatts43, of which about 20 megawatts have completed that construction work (the
commercial operation has not yet started, except for an immaterial part that is in commercial operation); about 25 megawatts are in the construction stages; the balance of the capacity (about 83 megawatts) is in various development stages.
|
On the premises of consumers throughout Israel
|
Natural gas and renewable energy (solar, storage)
|
Gradually starting from the second half of 2023 and up to the end of 2025
|
Yard consumers and the System Operator.
|
An average of about 4 per megawatt (a total of about 480)
|
≈ 154
|
| 43 |
Every facility with a capacity of up to 16 megawatts. As stated, as at the approval date of the report, all of the preconditions for execution of the
projects for construction of facilities for generation of electricity on the customer’s premises (or any of them) had not yet been fulfilled, and the fulfillment thereof is subject to various factors, such as,
licensing, connection to infrastructures and construction. It is noted that due to the outbreak of the War, the Company has delivered a force majeure notification to
the customers. The war and its impacts could have an adverse impact on the compliance with the expected dates for the commercial operation and the expected costs of the projects. It is further clarified that delays in
completion of the projects could have an impact of the project costs and could cause an increase in costs (beyond the cost shown in the table above) and/or could constitute a lack of compliance with the commitments to
third parties, and could give rise to starting of proceedings or demands for relief.
|
| 6. |
Initiation and Construction Projects (Cont.)
|
|
|
1. |
Main details with reference to construction projects in Israel (held at 100% ownership by OPC Israel, which is 80% held by the Company)41: (Cont.)
|
|
Power
|
||||||||
|
plants/
|
||||||||
|
facilities
|
||||||||
|
for
|
||||||||
|
generation
|
||||||||
|
of energy
|
Status
|
Location
|
Technology44
|
Additional information
|
||||
|
Ramat Bikah
|
Advanced development
|
Industrial Local Council of Naot Hovav
|
Photovoltaic with integration of storage
|
In May 2023, OPC Power Plants was declared the winner in a tender of Israel Lands Authority for planning and an option to
acquire lease rights in land for construction of facilities for generation of electricity using renewable energy with a capacity of about 245 megawatts with integration of storage of about 1,375 megawatts per hour with reference to three
sites in Industrial Local Regional Council of Naot Hovav. In the Company’s estimation, as at the date of the report, the estimated construction cost of the project is in the range of NIS 1.93 to NIS 2.0 billion45. For additional
details – see Section 2.4.4 of Part A of the Periodic Report and Note 11B(1)(f) to the financial statements.
In February 2024, a decision of the government was received authorizing OPC Power Plants to prepare National Infrastructures
Plans for photovoltaic projects for generation of electricity for submission to the National Board for Building and Planning National Infrastructures.
|
| 44 |
It is clarified that the characteristics (including the capacity) of projects in initiation and development, including the Ramat Bikah and
Hadera 2 projects, which are in the advanced initiation and initial initiation stages, respectively, and the advancement of which is subject to, among other things, planning and licensing processes and connection
assurance, are subject to changes and in light of the early stage, there is no certainty regarding the advancement / actual execution of the projects in the initiation stages (in whole or in part).
|
| 45 |
As stated above, the Company’s estimates regarding the expected cost of projects that have not yet started operation is “forward‑looking” information as at the approval date of the report
only, regarding which there is no certainty is will materialize, as stated in footnote 41 above.
|
| 6. |
Initiation and Construction Projects (Cont.)
|
|
|
1. |
Main details with reference to construction projects in Israel (held at 100% ownership by OPC Israel, which is 80% held by the Company)41: (Cont.)
|
|
Power
|
||||||||
|
plants/
|
||||||||
|
facilities
|
||||||||
|
for
|
||||||||
|
generation
|
||||||||
|
of energy
|
Status
|
Location
|
Technology45
|
Additional information
|
||||
|
OPC Hadera Expansion Ltd. (“Hadera 2”)
|
Preliminary development
|
Hadera, adjacent to the Hadera Power Plant
|
Conventional with storage capability
|
On December 27, 2021, the plenary National Infrastructures Committee decided to submit NIP 20B for government approval
pursuant to Section 76C(9) of the Planning and Building Law, 1965 (“the Planning and Building Law”). In December 2022 an annual option agreement was signed with Infinia that may be renewed for a period of up to 5 years for lease of the land
for the project. For additional details – see Section 7.1.2 of Part A of the Periodic Report and Note 11B to the financial statements.
On May 28, 2023, a government decision was made not to approve National Infrastructures Plan 20B (NIP 20B), with respect to the Hadera 2 power
plant, and to return it for reconsideration to the National Infrastructures Committee. Further to this, the Company filed a petition for issuance of a conditional order to the government to provide reasons for non‑approval of NIP 20B, which
was summarily rejected on July 19, 2023, due to a failure to exhaust the processes. As at the approval date of the report, the Company is continuing to advance NIP 20B and is awaiting the holding of a hearing, as stated. For additional
details – see Section 7.3.15.3.1 of Part A of the Periodic Report.
|
| 6. |
Initiation and Construction Projects (Cont.)
|
|
|
1. |
Main details with reference to construction projects in Israel (held at 100% ownership by OPC Israel, which is 80% held by the Company)41: (Cont.)
|
|
Power
|
||||||||
|
plants/
|
||||||||
|
facilities
|
||||||||
|
for
|
||||||||
|
generation
|
||||||||
|
of energy
|
Status
|
Location
|
Technology45
|
Additional information
|
||||
|
Intel
|
Preliminary development
|
Kiryat Gat
|
Conventional
|
On March 3, 2024, OPC Power Plants signed a non‑binding memorandum of understanding with Intel Electronics (“Intel”), an
existing customer of the Company, whereby OPC Israel will construct and operate a power plant (“the Project”), which will supply electricity to Intel’s facilities, including expansion of the facilities being constructed at the present time,
for a period of 20 years from the operation date (the “Memorandum of Understanding”).
Pursuant to the Memorandum of Understanding, OPC Israel will hold exclusively the rights in a project having a capacity of at least 450 megawatts
(and in the Company’s estimation up to 650 megawatts) and will bear the construction cost, which is estimated in the range of $1.3 – $1.4 million per megawatt46. The Memorandum of Understanding sets forth provisions regarding the
matter of advancement the development and planning of the Project, acquisition of rights in the land in accordance with arrangements determined for cooperation between the parties for purposes of receiving the required permits in connection
with the Project. In addition, included as part of the Memorandum of Understanding are, among other things, arrangements for the tariff to be paid to OPC Israel, which is based on discount rates from the generation component and additional
provisions that will be included in a detailed agreement the parties will formulate (including preconditions that are customary in projects of this type, which include determination of an appropriate arrangement by the Electricity Authority,
arrangement of rights in the land, completion of a planning survey and receipt of regulatory approvals)
|
| 46 |
Estimate of the projected cost includes an estimate of the costs of equipment, construction and financing of the construction (without a land component). That stated constitutes “forward‑looking” information, regarding which there is no certainty that it will materialize, as stated in footnote 41 above.
|
| 6. |
Initiation and Construction Projects (Cont.)
|
|
|
2. |
Main details regarding construction projects in the area of renewable energy using solar technology in the U.S. (held 100% by the CPV Group, which is 70% held by the Company)47:
|
| 47 |
Details with respect to the scope of the investments in the United States were translated from dollars and presented in NIS based on the currency rate of exchange on December 31,
2023 – $1 = NIS 3.627. The information presented below regarding projects under construction and, including regarding the expected commercial structure, the projected
commercial operation date and the expected construction cost, an undertaking with a tax partner and/or expected results of activities for the first full calendar year (revenues, EBITDA, investments of the tax
partner and cash flows after the tax partner) includes “forward‑looking” information, as it is defined in the Securities Law, regarding which there is no certainty it will materialize (in whole or in part),
including due to factors that are not under the control of the CPV Group. The information is based on, among other things, estimates of the CPV Group as at the approval date of the report, the realization of
which is not certain, and which might not be realized due to factors, such as: delays in receipt of permits, an increase in the construction costs, delays in execution of the construction work and/or
technical or operational malfunctions, problems or delays regarding signing an agreement for connection to the network or connection of the project to transmission or other infrastructures, an increase in
costs due to the commercial conditions in the agreements with main suppliers (such as equipment suppliers and contractors), problems signing an investment agreement with a Tax Equity Partner regarding part of
the cost of the project and utilization of the tax benefits (if relevant), problems signing commercial agreements for of the potential revenues from the project, terms of the commercial agreements, conditions
of the energy market, regulatory changes or legislative changes (including changes impacting main suppliers of the projects), an increase in the financing expenses, unforeseen expenses, macro‑economic
changes, weather events, including delays and an increase in costs of undertakings in the supply chain, transport and an increase in raw‑material prices, etc. Completion of the projects in accordance with the
said estimates is subject to the fulfillment of conditions which as at the approval date of the report had not yet been fulfilled (fully or partly) and, therefore, there is no certainty they will be completed
in accordance with that stated. Construction delays could even impact the ability of the companies to comply with liabilities to third parties in connection with the projects (including based on guarantees
provided in favor of those third parties).
|
| 6. |
Initiation and Construction Projects (Cont.)
|
|
|
2. |
Main details regarding construction projects in the area of renewable energy using solar technology in the U.S. (held 100% by the CPV Group, which is 70% held by the Company)48 (Cont.)
|
|
Project
|
Capacity
(megawatts)
|
Location |
Expected
commercial
operation
date
|
Commercial
structure
|
Regulated
market
after
the PPA
period
|
Total
expected
construction
cost48
for 100%
of the project
(NIS
millions)
|
Tax
equity
(NIS
millions)
|
Total
construction
cost
as at
December 31,
2023
(NIS
millions)
|
Expectation for a first full calendar year
in the period of the PPA agreements
|
|||||||||||||
|
Cash flows
|
||||||||||||||||||||||
|
after tax
|
||||||||||||||||||||||
|
Revenues
|
EBITDA
|
partner
|
||||||||||||||||||||
|
(NIS
|
(NIS
|
(NIS
|
||||||||||||||||||||
|
millions)
|
millions)
|
millions)
|
||||||||||||||||||||
|
CPV Stagecoach Solar LLC (“Stagecoach”)
|
102 MWdc
|
Georgia
|
Second quarter of 2024
|
Long-term PPA (including
green certificates)49
|
SREC
|
≈ 408
(≈ $112 million)
|
≈ 190
(≈ $52 million)50
|
≈ 368
(≈ $101 billion)
|
≈ 24
(≈ $7 million)
|
≈ 17
(≈ $5 million)
|
≈ 16
(≈ $4 million)
|
|||||||||||
| 48 |
Not including initiation fees and reimbursement of pre‑construction development expenses to the CPV Group. In projects that are entitled to tax benefits of the ITC type, the
Company’s estimate regarding the scope of the investment of the tax partner also includes the initiation fees and reimbursement of the development expenses on the basis of calculations that are customary in
agreements with tax partners. The expected cost of the investment in the project is subject to changes as a result of, among other things, the final costs involved with supply of the solar panels, the
construction work and/or the connection, including financing costs of projects in the construction period deriving from financing of the development, as detailed in Note 16B(5) to the financial statements.
|
| 49 |
The project has signed an agreement for supply of electricity with a local utility company for a period of 30 years from the start of the commercial operation, for supply
of all of the electricity expected to be generated by the project in the said period. In addition, the project contracted with a global company for sale of 100% of the solar renewable energy
certificates and hedging of the electricity price with a fixed price for a period of 20 years from the start date of the commercial operation.
|
| 50 |
As at the date of the report, the CPV Group has signed a non‑binding memorandum of understanding with a tax partner in a PTC format, where about $43 million out of
the said amount is expected to be received on the project’s commercial operation date and the balance over a period of 10 years. As at the date of the report, the investment of the tax partner is
subject to negotiations and signing of binding agreements. Regarding projects that are entitled to tax benefits of the PTC type, the Company’s estimate with respect the scope of the tax partner’s
investment is based on the IRA Law and usual calculations with tax partners, a tax benefit for every KW/hr. of generation, and does not depend on the anticipated cost of the investment (does not
depend of initiation fees and reimbursement of pre‑construction development expenses). The estimate of the CPV Group regarding the expectation of contracting with
a tax partner, in a PTC format for the undertaking, is “forward‑looking” information as it is defined in the Securities Law, which is based on estimates of the Company proximate to the
publication date of the report. The said estimates might not materialize or could change due a wide range of circumstances, including changes in the provisions of law or the regulations, the
final terms of the undertaking with the tax partner (if concluded) or other entities that are not under the Company’s control and there is no certainty they will materialize.
|
| 6. |
Initiation and Construction Projects (Cont.)
|
|
|
2. |
Main details regarding construction projects in the area of renewable energy using solar technology in the U.S. (held 100% by the CPV Group, which is 70% held by the Company)51 (Cont.)
|
|
Project
|
Capacity
(megawatts)
|
Location
|
Expected
commercial
operation
date
|
Commercial
structure |
Regulated
market
after
the PPA
period
|
Total
expected
construction
cost net48
for 100%
of the
project
(NIS
millions)
|
Tax
equity
(NIS
millions)
|
Total
construction
cost
as at
December 31,
2023
(NIS
millions)
|
Expectation for a first full calendar year
in the period of the PPA agreements |
|||||||||||||
|
Cash flows
|
||||||||||||||||||||||
|
after tax
|
||||||||||||||||||||||
|
Revenues
|
EBITDA
|
partner
|
||||||||||||||||||||
|
(NIS
|
(NIS
|
(NIS
|
||||||||||||||||||||
|
millions)
|
millions)
|
millions)
|
||||||||||||||||||||
|
CPV Backbone Solar, LLC (“Backbone”)
|
179 MWdc
|
Maryland
|
Second half of 2025
|
Long-term PPA52 (including green certificates)
|
PJM + MD SRECs
|
≈ 1.103
(≈ $304 million)
|
≈ 473
(≈ $130 million)52
|
≈ 325
(≈ $90 million)
|
≈ 79
(≈ $21 million)
|
≈ 56
(≈ $15 million)
|
≈ 45
(≈ $12 million)
|
|||||||||||
| 51 |
The project has signed a connection agreement and electricity supply agreement with the global e‑commerce company for a period of 10 years from the start of the commercial
operation, for supply of 90% of the electricity expected to be generated by the project in the said period, and sale of solar renewable energy certificates, which is valid up to 2035. The balance of the
project’s capacity (10%) will be used for supply to active customers, retail supply of electricity of the CPV Group or for sale in the market.
|
| 52 |
The project is located on a former coal mine and, therefore, it is expected to be entitled to enlarged tax benefits of 40% in accordance with the IRA Law. The CPV Group
intends to act to sign an agreement with a tax partner (Equity Tax) in respect of about 40% of the cost of the project and use of the tax credits that are available to the project (subject to
appropriate regulatory arrangements). That stated regarding the intention of the CPV Group to sign an agreement with a tax partner (equity tax), including the scope
thereof and/or the scope of the tax benefits, includes “forward‑looking” information as it is defined in the Securities Law, which based on estimates, assessments and plans of the CPV Group
proximate to the date of the report and regarding which there is no certainty they will materialize (in whole or in part). The said estimates and assessment might not materialize or might change due
to a range of circumstances, including changes in the provisions of the law or regulations and locating a tax partner that will be interested in contracting with the project, which are not dependent
on the Company and there is no certainty regarding their realization.
|
| 6. |
Initiation and Construction Projects (Cont.)
|
|
Technology
|
Advanced54
|
Early stage
|
Total*
|
|||||||||
|
Solar (1)55
|
1,550
|
1,050
|
2,600
|
|||||||||
|
Wind (2)
|
250
|
1,000
|
1,250
|
|||||||||
|
Total renewable energy
|
1,800
|
2,050
|
3,850
|
|||||||||
|
Carbon capture projects (natural gas
|
||||||||||||
|
with reduced emissions) (3) (6C)
|
1,300
|
4,000
|
5,300
|
|||||||||
|
|
* |
It is noted that out of the total of the development projects, as stated above, a scope of about 1,100 megawatts (of renewable energy) and about 4,650 megawatts (of which about 1,250 megawatts are renewable energy) are in the PJM market in
an advanced stage and in an initial stage, respectively.
|
|
|
(1) |
For details regarding a framework agreement for acquisition of solar panels of the CPV Group, in the aggregate scope of about 530 megawatts – see Section 8.14.2 of Part A of the Periodic Report.
|
| 53 |
The information presented in this section with reference to development projects of the CPV Group, including regarding the status of the
projects and/or their characteristics (the capacity, technology, the possibility for integrated carbon capture, expected construction date etc.), constitutes “forward‑looking” information as it is
defined in the Securities Law, regarding which there is no certainty it will be realized or the manner in which it will be realized. It is clarified that as at the approval date of the report there is
no certainty regarding the actual execution of the development projects (in whole or in part), and their progress and the rate of their progress is subject to, among other things, completion of
development and licensing processes, obtain control over the lands, signing agreements (such as equipment and construction agreements), execution of construction processes and completion of the
connection process, assurance of financing and/or receipt of various regulatory approvals and permits. In addition, advancement of the development projects is subject to the discretion of the
competent authorities of the CPV Group and of the Company.
|
| 54 |
In general, the CPV Group views projects that in its estimation are in a period of up to two years or up to three years to the start of the construction as projects
in the advanced development stage (there is no certainty the development projects, including projects in the advanced stage, will be executed). That stated is impacted by, among other things, the
scope of the project and the technology, and could change based on specific characteristics of a certain project, as well as from external circumstances that are relevant to a certain project,
such as the anticipated activities’ market or regulatory circumstances, including, projects that are designated to operate in the PJM market could be impacted by the changes in the connection
processes as part of the proposed change described in Section 8.1.2.2(A) of Part A to the Periodic Report, and their progress could be delayed as a result of this proposal. It is clarified that in
the early development stages (in particular), the scope of the projects and their characteristics are subject to changes, if and to the extent they reach advanced stages.
|
| 55 |
The capacities in the solar technology included in this report are denominated in MWdc. The capacities in the solar technology projects in the advanced development
stages and in the early development stages are about 1,200 MWac and about 850 MWac.
|
| 6. |
Initiation and Construction Projects (Cont.)
|
|
|
(2) |
Includes the Rogue’s Wind wind project, with a capacity of 114 megawatts in Pennsylvania, which signed a long‑term PPA agreement, which as at the approval date of the report the terms have which have been improved and which is in an
advanced stage of development, the start date of which is expected to be in the first half of 2024. In the estimation of the CPV Group, the expected cost of the investment in the project is estimated at about NIS 1.2 billion (about $0.3
billion), the investment of the tax partner is estimated at about NIS 0.5 million (about $0.1 billion). The EBITDA for a full calendar year in the period of the project’s PPA agreement is estimated at about NIS 68 million (about $18 million)56.
|
|
|
(3) |
In the third quarter of 2023, the CPV Group has decided not to continue development of a natural gas project having a scope of 650 megawatts, in the advanced stage, mainly due to the desire to focus its attention and resources on projects
having technological feasibility for generation of electricity with a process of low carbon emissions, such as, generation using renewable energy or generation using carbon capture technology, as well as due to economic considerations
relating to the project at the present time.
|
| 56 |
The information stated with reference to the projected start date of the construction, the expected cost of the investment, investment of a tax partner and/or the scope of the EBITDA estimated for the Rogues
Wind wind project constitutes “forward‑looking” information as it is defined in the Securities Law, which is based on estimates and assessments of the CPV Group as at the date of the report, and regarding which there is no certainty they will
materialize. The actual said parameters (to the extent the project is completed) could be different (in whole or in part) due to, among other things, changes in the project’s commercial structure, changes in the terms of the PPA, changes in
the conditions in the energy market, delays in the start date or the completion date of the construction, regulatory changes, or as a result of realization of one or more of the risk factors to which the CPV Group is exposed. Completion of
the project is subject to various conditions, including, development and licensing processes, signing of agreements (such as equipment and construction agreements), execution of construction processes, assurance of a (grid) connection
process, assurance of financing and/or receipt of regulatory approvals and various permits. It is noted that non‑compliance with dates (timetables) or a lack of progress of the project could impact, among other things, compliance with
obligations under the PPA agreement (which are secured by guarantees).
|
| 6. |
Initiation and Construction Projects (Cont.)
|
| 57 |
That stated in this subsection regarding the development projects that are based on a strategy of reducing emissions or carbon capture, the capacity of the projects, scope of the reduction of the emissions,
integrated of advanced technologies, conformance of the geological and economic conditions, estimate of the construction costs, entitlement to benefits expected construction and/or operation dates (timetables), includes “forward‑looking”
information as it is defined in the Securities Law, which is based on estimates and plans of the CPV Group solely as at the approval date of the report and there is no certainty it will materialize or regarding the manner of its
realization. As at the approval date of the report, the projects are in the development stages and their advancement as well as the speed thereof are subject to existence of various conditions (including receipt of permits, licensing
processes, completion of the development project and technological capabilities, assurance of financing, formulation of final costs, etc.), including those that are not under the control of the CPV Group and that had not yet been
fulfilled as at the approval date of the report. In addition, advancement and approval of the projects is subject to the discretion of the competent organs of the CPV Group and of the Company and the non‑realization of one or more of the
risk factors to which the CPV Group or the Company is exposes, as stated in Section 8.22 of Part A of the Periodic Report. Therefore, as at the approval date of this report, there is no certainty regarding execution of the projects (in
whole or in part).
|
|
Category
|
12/31/2023
|
12/31/2022
|
Board’s Explanations
|
|||||
|
Current Assets
|
||||||||
|
Cash and cash equivalents
|
1,007
|
849
|
For additional information – see the Company’s consolidated statements of cash flows in the financial statements and Part 8 below.
|
|||||
|
Short-term deposits
|
–
|
125
|
The decrease stems from release of short-term deposits.
|
|||||
|
Short-term restricted cash and deposits
|
2
|
36
|
The decrease derives from release of restricted cash that was used for projects under construction in the U.S. and utilization of credit frameworks in place thereof.
|
|||||
|
Trade receivables
|
247
|
260
|
Most of the decrease stems from a decrease in trade receivables in Israel, in the amount of about NIS 54 million, mainly as a result of timing differences and update of the brackets for
demand hours, as detailed in Section 3.2D above. On the other hand, there was an increase in accrued income, in the amount of about NIS 13 million, as a result of the consolidation of Gat power plant commencing from the second quarter of 2023
and an increase of about NIS 12 million due to commercial operation of Zomet from the end of the second quarter of 2023.
|
|||||
|
Receivables and debit balances
|
404
|
197
|
Most of the increase, in the amount of about NIS 270 million, stems from receivables in respect of sale of an ITC grant in respect of the Maple Hill project that was received subsequent to
the period of the report (for details – see Note Note 28D to the financial statements) and an increase, in the amount of about NIS 18 million, relating to an amount receivable from Energean (for details – see Note 28C(3) to the financial
statements). On the other hand, there was a decrease, in the amount of about NIS 90 million, in the U.S., mainly as a result of release of collaterals in connection with transactions hedging electricity margins in Valley.
|
|||||
|
Short-term derivative financial instruments
|
12
|
10
|
||||||
|
Total current assets
|
1,672
|
1,477
|
||||||
| 7. |
Financial Position as at December 31, 2023 (in millions of NIS) (Cont.)
|
|
Category
|
12/31/2023
|
12/31/2022
|
Board’s Explanations
|
|||||
|
Non-Current Assets
|
||||||||
|
Long-term deposits and restricted cash
|
59
|
53
|
||||||
|
Long-term prepaid expenses and other receivable
|
190
|
82
|
Most of the increase stems from a subordinated loan granted to an associated company in the U.S., in the amount of about NIS 87 million, as detailed in Note 26D to the financial statements,
and an increase of about NIS 28 million in deferred financing expenses in respect of loans in the U.S..
|
|||||
|
Investments in associated companies
|
2,550
|
2,296
|
The increase stems mainly from equity earnings of the CPV Group, in the amount of about NIS 253 million and from an increase in the shekel/dollar exchange rate, in the amount of about NIS 67
million, offset by other comprehensive loss, in the amount of about NIS 69 million. For additional details regarding investments in associated companies – see Sections 4D and 5D above.
|
|||||
|
Deferred tax assets
|
57
|
22
|
||||||
|
Long-term derivative financial instruments
|
51
|
57
|
||||||
|
Property, plant and equipment
|
6,243
|
4,324
|
Most of the increase, in the amounts of about NIS 694 million and about NIS 451 million, stems from the initial consolidation of the Gat power plant (for additional details – see Note 25E(1)
to the financial statements) and the Mountain Wind project (see Note 25E(2) to the financial statements), respectively, an increase deriving from investments in Israel and the U.S. (mainly in construction and development projects), in the
amount of about NIS 260 million and about NIS 671 million, respectively, and an increase of about NIS 23 million, in property, plant and equipment in the U.S. due to an increase in the shekel/dollar exchange rate. This increase was partly
offset by depreciation expenses on property, plant and equipment.
|
|||||
|
Right-of use assets and long-term deferred expenses
|
631
|
444
|
Most of the increase, in the amount of about NIS 121 million, derives from lease of land in the U.S. (the Backbone project), an increase of about NIS 97 million from consideration paid for a
tender of Israel Lands Authority for construction of facilities for generation of electricity from renewable energy in Israel and an increase in an investment in infrastructures of Zomet, in the amount of about NIS 19 million.
|
|||||
|
Intangible assets
|
1,165
|
777
|
Most of the increase derives from recognition of goodwill, in the amounts of about NIS 220 million and about NIS 75 million, in respect of acquisition of the Gat power plant and the Mountain
Wind project, respectively, recognition of intangible assets in respect of agreements for sale of electricity in the Mountain Wind project, in the amount of about NIS 93 million, and an increase of about NIS 24 million due to the increase in
the shekel/dollar exchange rate. On the other hand, there was a decrease of about NIS 22 million due to a decline in the value of goodwill in respect of Gnrgy.
|
|||||
|
Total non-current assets
|
10,946
|
8,055
|
||||||
|
Total assets
|
12,618
|
9,532
|
||||||
| 7. |
Financial Position as at December 31, 2023 (in millions of NIS) (Cont.)
|
|
Category
|
12/31/2023
|
12/31/2022
|
Board’s Explanations
|
|||||
|
Current Liabilities
|
||||||||
|
Loans and credit from banks and financial institutions (including current maturities)
|
391
|
92
|
Most of the increase stems from a short‑term credit framework taken out by OPC Israel Holdings, in the amount of NIS 200 million, and an increase in current maturities of
the Zomet, Gat and Mountain Wind projects, in the amounts of about NIS 54 million, about NIS 14 million and about NIS 30 million respectively.
|
|||||
|
Current maturities of loans from holders of non-controlling interests
|
32
|
13
|
||||||
|
Current maturities of debentures
|
192
|
33
|
The increase stems from update of the current maturities of the debentures based on the repayment schedules.
|
|||||
|
Trade payables
|
257
|
335
|
Most of the decrease stems from an increase, in the amount of about NIS 49 million, derives from payment to the Hadera construction contractor as a result of a compromise agreement signed
with it in December 2023 (for additional details – see Note 28A(4) to the financial statements), and payment to the Zomet construction contractor, in the amount of about NIS 54 million.
|
|||||
|
Payables and other credit balances
|
385
|
112
|
Most of the increase derives from a liability to transfer the consideration from sale of the ITC of Maple Hill in the period of the report (for additional details – see – Note 28D to the
financial statements).
|
|||||
|
Short-term derivative financial instruments
|
8
|
3
|
||||||
|
Current maturities of lease liabilities
|
18
|
61
|
||||||
|
Total current liabilities
|
1,283
|
649
|
||||||
| 7. |
Financial Position as at December 31, 2023 (in millions of NIS) (Cont.)
|
|
Category
|
12/31/2023
|
12/31/2022
|
Board’s Explanations
|
|||||
|
Non-Current Liabilities
|
||||||||
|
Long-term loans from banks and financial institutions
|
2,865
|
1,724
|
Most of the increase stems from receipt of long-term loans, in the amounts of about NIS 450 million, for financing acquisition of the Gat power plant (for additional
details – see Note 16B(1) to the financial statements), about NIS 270 million for financing acquisition of the Mountain Wind project (for additional details – see Note 16B(4) to the financial statements), and about NIS 359 million in respect
of the commercial operation of the Maple Hill project and financing projects under construction in the renewable energy segment in the U.S. (for additional details – see Note 16B(5) to the financial statements), the amounts of about NIS 242
million and about NIS 51 million relating to receipt of financing and accrual of interest on the principal in Zomet. This increase was partly offset by repayment of loans and an increase in current maturities, in the aggregate amount of about
NIS 197 million.
|
|||||
|
Long-term loans and debentures from holders of non-controlling interests
|
422
|
424
|
||||||
|
Debentures
|
1,647
|
1,807
|
The decrease stems from repayment of debentures, in the amount of about NIS 31 million, and update of current maturities, in the amount of about NIS 159 million. On the other hand, there was
an increase deriving from linkage differences in respect of the debentures (Series B), in the amount of about NIS 33 million.
|
|||||
|
Long-term lease liabilities
|
204
|
69
|
Most of the increase stems from lease of land in the Backbone project, in the amount of about NIS 122 million (against a right‑of‑use asset).
|
|||||
|
Long-term derivate financial instruments
|
58
|
–
|
Most of the increase stems from a change in the fair value of a contract for hedging revenues from sale of electricity in the Maple Hill project.
|
|||||
|
Other long-term liabilities
|
399
|
146
|
Most of the increase, in the amount of about NIS 270 million, stems from deferred income in respect of ITC in the Maple Hill project (for additional details – see Note 28D to the financial
statements).
|
|||||
|
Liabilities for deferred taxes
|
498
|
347
|
Most of the increase, in the amount of about NIS 68 million, stems from the initial consolidation of the Gat power plant (for additional details – see Note 25E(1) to the financial statements)
and an increase of about NIS 73 million stemming mainly from utilization of carryforward losses in Israel.
|
|||||
|
Total non-current liabilities
|
6,093
|
4,517
|
||||||
|
Total liabilities
|
7,376
|
5,166
|
||||||
|
For the Year Ended
|
||||||||
|
Category
|
12/31/2023
|
12/31/2022
|
Board’s Explanations
|
|||||
|
Cash flows provided by operating activities
|
495
|
207
|
Most of the increase in the cash flows provided by operating activities stems from an increase in cash‑basis income, in the amount of about NIS 210 million, and an
increase in the Group’s working capital, in the amount of about NIS 67 million.
|
|||||
|
Cash flows used in investing activities
|
(2,166
|
) |
(1,102
|
)
|
Most of the increase in the cash used in investing activities in the period of the report stems from acquisition of the Gat power plant, for a consideration of about NIS 547 million (for
additional details – see Note 25E(1) to the financial statements), and the Mountain Wind project, for a consideration of about NIS 625 million (for additional details – see Note 25E(2) to the financial statements). In addition, the
investments in property, plant and equipment in the U.S. increased by about NIS 403 million and the Company provided a subordinated loan to an associated company in the U.S., in the amount of about NIS 87 million. The increase was partly
offset by a release of short‑term deposits, in the amount of about NIS 125 million, which were deposited in 2022. In addition, there was an increase of about NIS 172 million, in respect of release of collaterals, net, relating to hedging
electricity margins in the CPV Group, and there was a decrease, in the amount of about NIS 115 million, in investments in property, plant and equipment in Israel, mainly in connection with commercial operation of Zomet at the end of the
second quarter of 2023.
|
|||
|
Cash flows provided by financing activities
|
1,817
|
986
|
Most of the increase in the cash flows provided by financing activities stems from a receipt in the period of the report, in the amount of about NIS 452 million, in respect of a swap of
shares of transaction and investment with Veridis (for additional details – see Note 25A(1) to the financial statements), long‑term loans, in the amounts of about NIS 450 million and about NIS 270 million, for purposes of financing a
transaction for acquisition of the Gat power plant and a transaction for acquisition of the Mountain Wind project, respectively, taking out of a long‑term loan, in the amount of about NIS 359 million, in connection with the commercial
operation of the Maple Hill project and for financing construction of projects in the renewable energy segment in the U.S. (for additional details – see Note 16B(5) to the financial statements), from an increase of about NIS 120 million, in
investments and loans from holders of non‑controlling interests (in the CPV Group and Veridis), from taking out of short‑term loans and credit frameworks, in the amount of about NIS 205 million, and from a receipt, in the amount of about
NIS 304 million, relating to a commitment of the tax partner in the Maple Hill project. On the other hand, in the year of the report the Group repaid a loan to the prior holders of the rights in the Gat power plant, in the amount of about
NIS 303 million (for additional details – see Note 25E(1) of the financial statements), there was an increase, in the amount of about NIS 159 million, in the Group’s repayments to banks and others (mainly in respect of new loans taken out in
Israel and the U.S., as detailed above, and in respect of the start of repayment of the senior debt in Zomet commencing from the fourth quarter of 2023) and there was an increase of about NIS 65 million in costs paid in advance in respect of
loans (mainly relating to loans in the U.S.). Furthermore, in 2022 the Group raised about NIS 815 million, resulting from an issuance of shares.
|
|||||
| 8. |
Liquidity and sources of financing (in NIS millions)
|
|
For the
|
||||||||
|
Three Months Ended
|
||||||||
|
Category
|
12/31/2023
|
12/31/2022
|
Board’s Explanations
|
|||||
|
Cash flows provided by (used in) operating activities
|
52
|
(64
|
)
|
Most of the increase in the cash flows provided by operating activities stems from an increase in income on a cash basis, in the amount of about NIS 58 million, and an
increase in the Group’s working capital, in the amount of about NIS 49 million.
|
||||
|
Cash flows used in investing activities
|
(559
|
)
|
(312
|
)
|
Most of the increase in the cash flows used in investing activities stems from the fact that during the fourth quarter of 2023 the Company paid deferred consideration, in the amount of about
NIS 279 million, for acquisition of Gat (for additional details – see Note 25E(1) to the financial statements). In addition, during the fourth quarter there was an increase in the investments in property, plant and equipment in the U.S. by
about NIS 175 million. On the other hand, there was a decrease of about NIS 125 million as a result of making short‑term investments in 2022. Also, there was a decrease of about NIS 71 million relating to release of restricted cash, net.
|
|||
|
Cash flows provided by financing activities
|
630
|
14
|
Most of the increase in the cash flows provided by financing activities stems from construction financing, in the amount of about NIS 136 million, in respect of the Maple Hill project and for
financing projects under construction in the renewable energy segment in the U.S. (for additional details – see Note 16B(5) to the financial statements), from taking out of short‑term loans and credit frameworks, in the amount of about
NIS 205 million, in the fourth quarter of 2023 and from a receipt, in the amount of about NIS 304 million, relating to a commitment of the tax partner in the Maple Hill project.
|
|||||
| 9. |
Adjusted financial debt, net
|
|
|
A. |
Compositions of the adjusted financial debt, net
|
|
As at December 31, 2023(1)
|
As at December 31, 2022(2)
|
|
|
4.9
|
5.0
|
|
|
(1) |
After elimination of debt under construction in the Renewable Energies segment in the U.S. of about NIS 9 million, as detailed in the following table. With respect to the power plants the construction and/or acquisition of which was
completed in 2023 and the debt in respect thereof included in the calculation, calculation of representative EBITDA was made as follows: Zomet and Mountain Wind in accordance with projected data, as detailed in Section 1 above and
footnote 21, respectively; and Gat and Three Rivers based on linear articles of the actual results in 2023 as detailed in Section 4B(3) above.
|
|
|
(2) |
After elimination of debt under construction in Israel (the Zomet power plant) and in the U.S., mainly in the Energy Transition segment (mainly the Three Rivers power plant) of about NIS 1,045 million, as shown in the following table.
|
| 9. |
Adjusted financial debt, net (Cont.)
|
|
|
A. |
Compositions of the adjusted financial debt, net (Cont.)
|
|
|
|
Gross debt
|
||||||||||||||||||||||||
|
|
Weighted-
|
Cash and cash
|
Derivative
|
|||||||||||||||||||||||
|
|
Method of
|
average
|
equivalents
|
financial
|
||||||||||||||||||||||
|
|
presentation
|
interest
|
and deposits
|
instruments
|
||||||||||||||||||||||
|
|
in the
|
Debt
|
rate
|
Final
|
(including
|
for hedging
|
||||||||||||||||||||
|
Company’s
|
(including
|
(and
|
repayment
|
restricted cash
|
principal
|
|||||||||||||||||||||
|
financial
|
interest
|
deferred
|
date of
|
used for debt
|
and/or
|
Net
|
||||||||||||||||||||
|
Name of project
|
statements
|
payable)
|
costs)
|
the loan
|
service) (1)
|
interest
|
debt
|
|||||||||||||||||||
|
Rotem
|
Consolidated
|
–
|
–
|
–
|
9
|
–
|
(9
|
)
|
||||||||||||||||||
|
Hadera
|
Consolidated
|
642
|
4.9
|
%
|
2037
|
98
|
37
|
507
|
||||||||||||||||||
|
Zomet
|
Consolidated
|
1,111
|
6.8
|
%
|
2042
|
94
|
–
|
1,017
|
||||||||||||||||||
|
Gat
|
Consolidated
|
434
|
6.9
|
%
|
2039
|
12
|
–
|
422
|
||||||||||||||||||
|
Headquarters and others – Israel (2)
|
Consolidated
|
202
|
160
|
–
|
42
|
|||||||||||||||||||||
|
Total Israel
|
2,389
|
5.7
|
%
|
373
|
37
|
1,979
|
||||||||||||||||||||
|
Keenan
|
Consolidated
|
285
|
3.4
|
%
|
2030
|
1
|
18
|
266
|
||||||||||||||||||
|
Mountain Wind
|
Consolidated
|
256
|
5.4
|
%
|
2028
|
11
|
4
|
241
|
||||||||||||||||||
|
Financing of renewable energy
|
||||||||||||||||||||||||||
|
projects under construction (5)
|
Consolidated
|
329
|
6.6
|
%
|
2027
|
327
|
(7
|
)
|
9
|
|||||||||||||||||
|
Total renewable energy
|
870
|
5.2
|
%
|
339
|
15
|
516
|
||||||||||||||||||||
|
Fairview (Cash Sweep 90%)
|
Associate 25%
|
334
|
5.6
|
%
|
2025
|
25
|
6
|
303
|
||||||||||||||||||
|
Towantic (Cash Sweep 100%)
|
Associate 26%
|
339
|
5.9
|
%
|
2025
|
44
|
7
|
288
|
||||||||||||||||||
|
Maryland (3) (Cash Sweep 60%)
|
Associate 25%
|
304
|
7.0
|
%
|
2028
|
26
|
8
|
270
|
||||||||||||||||||
|
Shore (3) (Cash Sweep 100%)
|
Associate 37.5%
|
599
|
5.4
|
%
|
2025
|
105
|
19
|
475
|
||||||||||||||||||
|
Valley (4) (Cash Sweep 100%)
|
Associate 50%
|
708
|
10.8
|
%
|
2026
|
66
|
–
|
642
|
||||||||||||||||||
|
Three Rivers
|
Associate 10%
|
271
|
5.3
|
%
|
2028
|
21
|
20
|
230
|
||||||||||||||||||
|
Total energy transition59
|
2,555
|
7.2
|
%
|
287
|
60
|
2,208
|
||||||||||||||||||||
|
Headquarters and others – U.S.
|
Consolidated
|
–
|
–
|
–
|
12
|
–
|
(12
|
)
|
||||||||||||||||||
|
Total U.S.
|
3,425
|
638
|
75
|
2,712
|
||||||||||||||||||||||
|
Total Energy headquarters (6)
|
|
1,853
|
2.5%–2.75% (weighted-average
2.6%)
|
336
|
–
|
1,517
|
||||||||||||||||||||
|
Total
|
7,667
|
|
1,347
|
112
|
6,208
|
|||||||||||||||||||||
| 58 |
In addition, the Group has a liability to holders of non‑controlling interests, the balance of which as at December 31, 2023 is about NIS 454 million.
|
| 59 |
The rate regarding the Cash Sweep mechanism is in accordance with the estimate of the CPV Group for 2023 and could change based on the provisions of the financing
agreements of the projects.
|
| 9. |
Adjusted financial debt, net (Cont.)
|
|
|
A. |
Compositions of the adjusted financial debt, net (Cont.)
|
| (1) |
Includes restricted cash, in the amount of about NIS 52 million, in Hadera and in the energy transition segment, the amounts of about NIS 272 million.
|
| (2) |
Includes mainly balances of cash and cash equivalents in OPC Israel Holdings and OPC Power Plants.
|
| (3) |
As part of the financial agreements, an historical debt‑service coverage ratio financial covenant of 1:1 during the last four quarters was determined for Shore and Maryland. As at the date of the financial statements, Maryland and Shore
are in compliance with the covenant (2.62 and 1.11, respectively). In the period of the report, the credit frameworks accompanying the Shore project were extended up to March 31, 2025.
|
| (4) |
For details regarding signing of an amendment and extension agreement with respect to the financing agreement of Valley on June 28, 2023 – see Note 26D to the financial statements. The balance in the above table does not include
subordinated shareholders’ loans.
|
| (5) |
For details regarding signing in the third quarter of 2023 of an agreement for financing projects under construction in the renewable energy segment in the U.S. (Maple Hill, Stagecoach and Backbone) – see Note 16B(5) to the financial
statements.
|
| (6) |
Includes balances of debt and cash in the Company and cash in ICG Energy Inc. (available for use for all the Group’s needs).
|
| 9. |
Adjusted financial debt, net (Cont.)
|
|
|
A. |
Compositions of the adjusted financial debt, net (Cont.)
|
|
Cash
|
|||||||||||||||||
|
Debt
|
and cash
|
Derivative
|
|||||||||||||||
|
|
Method of
|
(including
|
equivalents
|
financial
|
|||||||||||||
|
|
presentation
|
interest
|
and deposits
|
instruments
|
|||||||||||||
|
|
in the
|
payable)
|
(including
|
for hedging
|
|||||||||||||
|
|
Company’s
|
(and
|
restricted cash
|
principal
|
|||||||||||||
|
|
financial
|
deferred
|
used for
|
and/or
|
Net
|
||||||||||||
|
|
statements
|
costs)
|
debt service)
|
interest
|
debt
|
||||||||||||
|
Rotem
|
Consolidated
|
–
|
25
|
–
|
(25
|
)
|
|||||||||||
|
Hadera
|
Consolidated
|
670
|
58
|
33
|
579
|
||||||||||||
|
Zomet
|
Consolidated
|
833
|
9
|
–
|
824
|
||||||||||||
|
Headquarters and others in Israel
|
Consolidated
|
4
|
107
|
–
|
(103
|
)
|
|||||||||||
|
Total Israel
|
1,507
|
199
|
33
|
1,275
|
|||||||||||||
|
Keenan
|
Consolidated
|
310
|
3
|
24
|
283
|
||||||||||||
|
Maple Hill
|
Consolidated
|
–
|
11
|
–
|
(11
|
)
|
|||||||||||
|
Total renewable energy
|
310
|
14
|
24
|
272
|
|||||||||||||
|
Fairview
|
Associate
|
442
|
9
|
17
|
416
|
||||||||||||
|
Towantic
|
Associate
|
509
|
110
|
17
|
382
|
||||||||||||
|
Maryland
|
Associate
|
300
|
32
|
12
|
256
|
||||||||||||
|
Shore
|
Associate
|
607
|
119
|
27
|
461
|
||||||||||||
|
Valley
|
Associate
|
895
|
95
|
4
|
796
|
||||||||||||
|
Three Rivers
|
Associate
|
290
|
32
|
26
|
232
|
||||||||||||
|
Total energy transition
|
3,043
|
397
|
103
|
2,543
|
|||||||||||||
|
Headquarters and others in the U.S.
|
Consolidated
|
–
|
226
|
–
|
(226
|
)
|
|||||||||||
|
Total U.S.
|
3,353
|
637
|
127
|
2,589
|
|||||||||||||
|
Total Energy headquarters
|
1,854
|
586
|
–
|
1,268
|
|||||||||||||
|
Total Company
|
6,714
|
1,422
|
160
|
5,132
|
|||||||||||||
|
|
B. |
Interest and linkage bases
|
|
Weighted-
|
||||||||||||||||||||||||||||||||
|
Debt with
|
Debt with
|
average
|
||||||||||||||||||||||||||||||
|
|
unlinked
|
fixed interest
|
interest
|
|||||||||||||||||||||||||||||
|
|
Total
|
fixed interest /
|
linked to
|
Debt bearing
|
as at
|
|||||||||||||||||||||||||||
|
|
debt
|
fixed debt
|
the CPI
|
prime interest
|
12/31/2023
|
|||||||||||||||||||||||||||
|
|
Total
|
Interest
|
Total
|
Interest
|
Total
|
Interest
|
||||||||||||||||||||||||||
|
The Company
|
||||||||||||||||||||||||||||||||
|
(debentures)
|
1,853
|
851
|
2.5
|
%
|
1,002
|
2.8
|
%
|
–
|
–
|
2.6
|
%
|
|||||||||||||||||||||
|
Hadera (bank)
|
642
|
517
|
5.3
|
%
|
125
|
3.5
|
%
|
–
|
–
|
4.9
|
%
|
|||||||||||||||||||||
|
Zomet (bank)
|
1,111
|
–
|
–
|
–
|
–
|
1,111
|
6.8
|
%
|
6.8
|
%
|
||||||||||||||||||||||
|
Gat (bank)
|
434
|
–
|
–
|
–
|
–
|
434
|
6.9
|
%
|
6.9
|
%
|
||||||||||||||||||||||
|
Short-term
|
||||||||||||||||||||||||||||||||
|
financing
|
||||||||||||||||||||||||||||||||
|
frameworks
|
||||||||||||||||||||||||||||||||
|
(bank)
|
202
|
202
|
6.9
|
%
|
–
|
–
|
–
|
–
|
6.9
|
%
|
||||||||||||||||||||||
|
Rate of
|
Weighted-
|
|||||||||||||||||||||||||||
|
holdings
|
average
|
|||||||||||||||||||||||||||
|
of the
|
interest
|
|||||||||||||||||||||||||||
|
CPV
|
Total
|
Debt bearing
|
as at
|
|||||||||||||||||||||||||
|
Group
|
debt
|
Fixed debt
|
SOFR interest
|
12/31/2023
|
||||||||||||||||||||||||
|
Total
|
Interest
|
Total
|
Interest
|
|||||||||||||||||||||||||
|
Keenan
|
100
|
%
|
285
|
199
|
2.0
|
%
|
86
|
6.5
|
%
|
3.0
|
%
|
|||||||||||||||||
|
Mountain Wind
|
100
|
%
|
256
|
198
|
4.9
|
%
|
58
|
7.0
|
%
|
5.4
|
%
|
|||||||||||||||||
|
Construction financing
|
||||||||||||||||||||||||||||
|
of renewable projects
|
100
|
%
|
329
|
275
|
6.4
|
%
|
54
|
7.9
|
%
|
6.6
|
%
|
|||||||||||||||||
|
Fairview
|
25
|
%
|
334
|
305
|
5.4
|
%
|
29
|
8.2
|
%
|
5.6
|
%
|
|||||||||||||||||
|
Towantic
|
26
|
%
|
339
|
267
|
5.1
|
%
|
72
|
8.7
|
%
|
5.9
|
%
|
|||||||||||||||||
|
Maryland
|
25
|
%
|
304
|
187
|
5.9
|
%
|
117
|
8.9
|
%
|
7.0
|
%
|
|||||||||||||||||
|
Shore
|
37.53
|
%
|
599
|
436
|
4.1
|
%
|
163
|
9.1
|
%
|
5.4
|
%
|
|||||||||||||||||
|
Valley
|
50
|
%
|
708
|
–
|
–
|
708
|
10.8
|
%
|
10.8
|
%
|
||||||||||||||||||
|
Three Rivers
|
10
|
%
|
271
|
224
|
4.6
|
%
|
47
|
9.1
|
%
|
5.3
|
%
|
|||||||||||||||||
|
|
C. |
Financial covenants
|
| 60 |
For a description of the main provisions of material loans of the Company and the investee companies – see Note 16 to the financial statements.
|
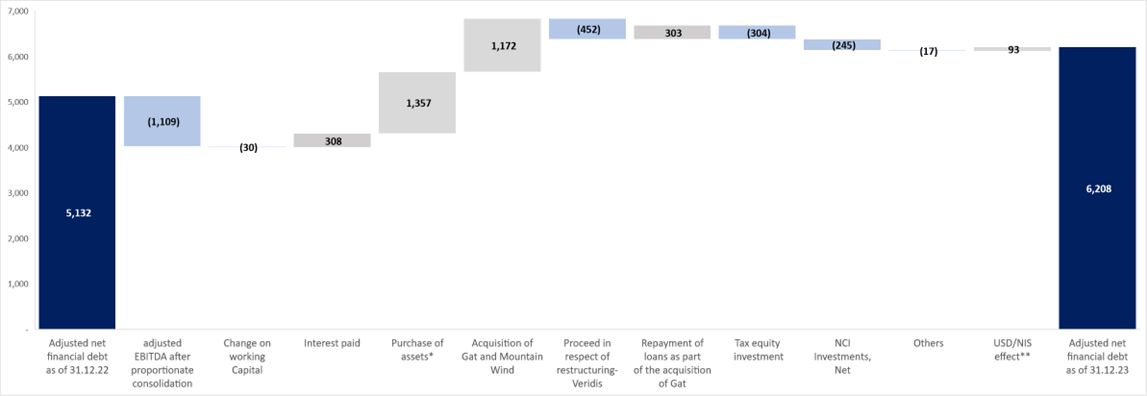
| (*) |
Includes the amount of about NIS 195 million in respect of current payments and the amount of about NIS 1,162 million in respect of payments relating to construction projects.
|
| (**) |
In respect of translation of the net financial debt of the U.S. which is denominated in dollars into the Company’s functional currency.
|
| 10. |
Details regarding the Company’s debentures
|
|
Name of trustee
|
Reznik Paz Nevo Trustees Ltd.
|
|
|
Name of the party responsible for the series of liability certificates with the trustee
|
Michal Avatlon and/or Hagar Shaul
|
|
|
Contact information
|
Name: Yossi Reznik
|
|
|
Address: 14 Yad Harutzim St., Tel‑Aviv
Telephone: 03–6389200
Fax: 03–6389222
E–mail: Yossi@rpn.co.il
|
||
|
Rating of the debentures since the issuance date
|
Rating of ilA– by S&P Maalot Global Ratings Ltd. (“Maalot”). On August 1, 2023, the rating was reconfirmed by Maalot and the rating outlook was updated to negative.
For details – see the Immediate Report of that date (Reference No.: 2023‑01‑071929), where the details presented therein are included herein by means of reference. For details regarding rating of the debentures (Series D) – see the
Immediate Report dated January 4, 2024 (Reference No.: 2024‑01‑002071), where the details presented therein are included herein by means of reference.
|
|
|
Pledged assets
|
None.
There is a future commitment that the Company will not create a general floating lien on its assets and rights, existing and
future, in favor of any third party without the conditions stipulated in the trust certificate being fulfilled.
|
|
|
Is the series material
|
Series B – yes; Series C – yes; Series D – no.
|
|
| 11. |
Impacts of changes in the macro‑economic environment on the Group’s activities and its results
|
| 11. |
Impacts of changes in the macro‑economic environment on the Group’s activities and its results (Cont.)
|
| 61 |
The disclosure stated in this Section below is based on the Company’s estimates in accordance with assumptions and analyses made as at the date of the report only. Ultimately, the impacts of
macro‑economic events could be different than that stated, as a result of, among other things, the type and scope of the macro‑economic events, the impact thereof on third parties related to the Company and/or changes in the
relevant regulatory policies.
|
| 11. |
Impacts of changes in the macro‑economic environment on the Group’s activities and its results (Cont.)
|
| 62 |
In order to reduce part of the exposure to changes in the CPI relating to the Hadera financing agreement, in June 2019 the Group entered into transactions with a bank to hedge part of the exposure to the CPI.
|
| 12. |
The significance of the Iron Swords war (hereinafter – “the War”) in Israel to the Group’s business activities
|
|
|
1. |
Uninterrupted activity of the power plants – the Group’s power plants in Israel are continuing their electricity generation
activities pursuant to the provisions of the electricity generation licenses granted to them and based on the directives of the relevant authorities and the Ministry of Energy and Infrastructures (“the Ministry of Energy”). The Group makes
the required adjustments on an ongoing basis, in order to permit uninterrupted activities at all times. The Group’s sites (similar to most private business activities in Israel) could be exposed to physical damage as a result of the War,
where in this regard it is noted that in addition to the rights provided by the Property Tax and Compensation Fund Law, 1961, the Group companies in Israel (Rotem, Hadera, Gat and Zomet) have acquired insurance policies that provide certain
coverage in accordance with the amounts and conditions stipulated in the policies, in connection with direct physical harm and consequential damages (lost profits directly or in respect of War damages to other significant parties, such as
suppliers, subject to certain conditions) deriving from terrorist and war activities. The scope of the coverage and the self‑participation (deductible) provided in the policies is that which is customary in the power‑plant market in Israel63.
The validity of the policies for Rotem and Hadera is up to the end of July 2024, for Zomet up to the end of May 2024 and for Gat up to the end of April 2024.
|
|
|
2. |
Uninterrupted supply of natural gas to the power plants – the Group’s power plants in Israel acquire natural gas in a quantity
that is sufficient for all their operational requirements. The Group companies in Israel have signed long‑term agreements for acquisition of natural gas – both with Tamar and with Energean (for additional details – see Note 28C to the
annual financial statements). From the beginning of the War and up to November 12, 2023, supply of the natural gas from the Tamar reservoir was suspended, whereas as at the date of the report there has been no change in the activities of
the Karish reservoir belonging to Energean as a result of the War64. In addition, as at the approval date of the report the Leviathan reservoir is continuing its supply of gas to the Israeli economy. It is noted that continuation
of the activities of the Karish reservoir and the Leviathan reservoir is impacted to a significant extent by the scope of the War and a worsening of the defense (security) situation in Israel, particularly in the north.
|
| 63 |
As is usual in policies of this type in Israel, the insurance coverage is subject to exceptions, self‑participation (a deductible) and conditions. Accordingly, there is no certainty that the insurance coverage will
compensate the Company for the harm it suffers (in whole or in part) in a case of an attack on its facilities (if any). Furthermore, there is no certainty regarding the renewal terms of the policies upon their expiration (if
renewed). For details regarding risk factors relating to insurance – see Section 20.2.10 of Part A of the Periodic Report.
|
| 64 |
Shortages of or disruptions in the supply of natural gas could negatively impact, even significantly, the Company’s activities and its results. Regarding the risk factor stemming from
disruptions in the supply of natural gas – see Section 20.2.2 of Part A of the Periodic Report.
|
| 12. |
The significance of the Iron Swords war (hereinafter – “the War”) in Israel to the Group’s business activities
(Cont.)
|
|
|
2. |
Uninterrupted supply of natural gas to the power plants (Cont.)
|
| 65 |
The Gat power plant is a “single‑fuel” generator powered by natural gas, which is entitled to an availability tariff, as stated in Section 7.13 of Part A of the Periodic Report. Pursuant to Standard 125 referred to below, a
generator will be considered available even in certain circumstances of a shortage of natural gas as provided in the Standard, However, there is no certainty that the mentioned arrangements will apply to the circumstances as
they will be (as many as they may be).
|
| 66 |
Published in the Record of Covenants in the Internet site of the Electricity Authority.
|
| 67 |
As stated in Section 7.3.14.3 of Part A of the Periodic Report for 2021, the Professional Team of the Electricity Authority notified Rotem that its position regarding application of the
Regulation to Rotem is different and that the Regulation does not apply to Rotem. As stated above, the Company has presented its position to the Electricity Authority. That stated with
respect to the Company’s estimate constitutes “forward‑looking” information as it is defined in the Securities Law, regarding which there is no certainty it will materialize, where ultimately Rotem’s entitlement to
supplier arrangements in a case of a shortage of natural gas, including to compensation for the difference between the cost of operation using natural gas and the cost of operation using diesel oil could be limited
considering that stated above. As stated in Section 7.15.5.1B of Part A of the Periodic Report, pursuant to the provisions of Rotem’s PPA with Israel Electricity Authority (IEC), in a case of a continuing
failure in the supply of natural gas, subject to the provisions of the PPA, Rotem is entitled to provide the power plant’s availability (capacity) to the System Operator against receipt of a reimbursement for the cost of
the use of diesel oil (for which Rotem pays an annual premium) and receipt of a payment for provision of the availability. As stated in the Periodic Report, provision of the availability to the System Operator has
significantly less worthwhile economically than the benefits of selling to consumers.
|
| 68 |
That stated with respect to arrangements applying in a case of a shortage of natural gas is based on the Company’s estimates as at the date of the
report. Nonetheless, there is no certainty that such arrangements will partly or fully compensate the Group for the shortage or the disruption in the supply of natural gas, and there is no certainty regarding
the manner of their actual implementation by the System Operator and the authorities, particularly in light of the emergency situation. In addition, these arrangements could change and/or be cancelled as a
practical result of the severity of the emergency situation, duration of the period of the War, circumstances of the shortage of natural gas and pressures of the economy and the combat needs.
|
| 12. |
The significance of the Iron Swords war (hereinafter – “the War”) in Israel to the Group’s business activities
(Cont.)
|
|
|
3. |
Demand for electricity and by the Group’s customers in particular – as at the approval date of the report, in general no
material impact of the War on the level of demand for electricity on the part of the Group’s customers in Israel is discernable. It is noted that the Group’s customers (including significant customers as stated in Section 7.6.2 of Part A of
the Periodic Report) have facilities in Israel that could be exposed to physical (actual) damage or to economic and other consequences of the War, and their continued regular operation (and, in turn, the Company’s revenues therefrom) could
also be negatively impacted by the War.
|
|
|
4. |
Strengthening of the dollar against the shekel – for details regarding the impact of a change in the currency exchange rate of the dollar against the shekel – see Section 3.1A above.
|
|
|
5. |
Financial strength and liquidity – as at the date of the report, the Group’s headquarters and companies in Israel have cash
balances (without restricted cash) along with unutilized binding credit frameworks in significant amounts (for details – see Note 16B(2) to the financial statements). In addition, some of the guarantees granted in connection with the
activities in Israel were provided in the form of non‑binding credit frameworks, and some of the Company’s guarantees relating to the activities of the CPV Group in the U.S. were granted by Israeli banks (and are contingent on a minimum
rating for the bank). Furthermore, as at the date of the report, the CPV Group has an unutilized balance under a financing agreement for construction of renewable energy projects, as detailed in Note 16B(5) to the financial statements,
which is expected to be used for further construction of the solar projects detailed in Section 6 above.
|
| 12. |
The significance of the Iron Swords war (hereinafter – “the War”) in Israel to the Group’s business activities
(Cont.)
As a group operating in Israel, continuation of the War, expansion of the scope thereof and/or a worsening of the defense (security) situation in
Israel could well have an unfavorable impact on the Group’s activities, results and liquidity, including due to impacts, as stated, on significant suppliers and customers of the Group and/or on macro‑economic factors and the capital market.
For additional details regarding the risk factors to which the Company is exposed, including as a result of risks relating the defense (security) situation in Israel, changes in the currency exchange rates, instability and/or access to the
capital market and macro‑economic changes – see Section 19 of Part A of the Periodic Report.
|
|
|
A. |
Transaction for acquisition of the Gat power plant
|
|
Subject matter of the valuation
|
Determination of the fair value of the identified assets and liabilities of the Gat power plant and determination of the amount of the goodwill and the method for allocation thereof to the
cash‑generating units pursuant to the provisions of IFRS 3.
|
|
|
Date of the valuation
|
March 30, 2023.
|
|
|
Value of the identified assets and liabilities and the amount of the goodwill as at the valuation date
|
About NIS 552 million.
|
|
|
Identity of the appraiser and his characteristics
|
The valuation was performed by a team headed by Mr. Sagiv Mizrahi, CPA, a partner and team manager in the Corporate Finance Department of the Office of BDO (Ziv Haft). Sagiv has a
Bachelor’s degree in applied mathematics from Bar Ilan University and a Master’s degree in business administration (MBA), with honors, and a specialization in financial management from Tel‑Aviv University. Sagiv has more than 10 years of
experience in the areas of business and economic consulting, valuations of companies and financial instruments and economic–accounting work of various types in accordance with International Financial Reporting Standards (IFRS) and generally
accepted accounting principles in the U.S. (U.S GAAP). In the past, Sagiv was a lecturer at Bar Ilan University regarding accounting and valuation matters.
|
|
|
Valuation model
|
The fair value of the power plant was estimated using the revenues’ method, the multi‑period excess earnings method (MPEEM). The fundamental assumption of this method is that the value of
the asset being estimated equals the present value of the free cash flows allocable to the asset less the fair rate of return of the required assets (the contributing assets) for purposes of realization of these cash flows.
|
|
|
The assumptions based on which the appraiser performed the valuation
|
– The nominal shekel weighted‑average cost of capital (WACC) rates ranges between 8%
and 8.75%.
– Forecast years – represents the period between March 31, 2023 and up to December 31,
2059, and is based on an estimate of the economic useful life of the power plant.
|
|
|
B. |
Transaction for acquisition of the Mountain Wind wind plants
|
|
Subject matter of the valuation
|
Estimation of the fair value of certain assets and liabilities of a renewable energy project pursuant to the provisions of IFRS 3.
|
|
|
Date of the valuation
|
April 5, 2023.
|
|
|
Value of the identified assets and liabilities and the amount of the goodwill as at the valuation date
|
About NIS 625 million.
|
|
|
Identity of the appraiser and his characteristics
|
The valuation was performed by a team headed by Mr. Gil Mor, CPA, Partner, and Manager of the Economics Department in the Office of Price Waterhouse Coopers Advisory Ltd. Mr. Mor holds a
bachelor’s degree in accounting and economics and a master’s degree in business administration (with honors) from Tel‑Aviv University.
|
|
|
Valuation model
|
The fair value was estimated using the DCF method by means of discounting the project’s future cash flows at the weighted‑average cost of capital (WACC), after tax.
|
|
|
The assumptions based on which
the appraiser performed the
valuation
|
– The nominal dollar weighted‑average cost of capital (WACC) rates range between 5.75%
and 6.25%.
– Prices – the prices in the forecast (electricity, availability of RECs, etc.) are
based PPA agreements and market forecasts received from external, independent information sources, taking into account the region and the relevant market for each project and the relevant regulation.
– Forecast years – between 20 and 29 years, and is based on an estimate of the
economic useful life of the project’s power plant.
|
|
|
C. |
Annual examination of impairment of value of goodwill in the Renewable Energies segment in the United States
|
|
Subject matter of the Valuation
|
Determination of the recoverable amount of the Segment for purposes of an annual impairment of value of goodwill examination in accordance with the
provisions of IAS 36.
|
|
|
Date of the Valuation
|
Effective date of the valuation: December 31, 2023.
Date of the engagement: December 2023.
Signing date of the valuation: March 11, 2024.
|
|
|
Book value attributed to the
Segment’s assets as at the date
of the Valuation |
About $687 million.
|
|
|
Recoverable amount as
determined pursuant to the
Valuation
|
About $783 million, composed of the following:
– Renewable energy projects (projects under construction and in the development stage
that are expected to begin construction in the upcoming year): $1,000 million.
– Less – allocation of headquarters costs and taxes to the Segment: $(217) million.
The recoverable amount exceeds the book value attributed to the Segment’s assets and, therefore, it is not necessary to recognize a loss from
impairment of value in the Company’s books.
|
|
|
Identity of the appraiser and his
characteristics
|
The valuation was performed by a team headed by Mr. Sagiv Mizrahi, CPA, a partner and team manager in the Corporate Finance Department of the Office of BDO (Ziv Haft). Sagiv has a
Bachelor’s degree in applied mathematics from Bar Ilan University and a Master’s degree in business administration (MBA), with honors, and a specialization in financial management from Tel‑Aviv University. Sagiv has more than 10 years of
experience in the areas of business and economic consulting, valuations of companies and financial instruments and economic–accounting work of various types in accordance with International Financial Reporting Standards (IFRS) and generally
accepted accounting principles in the U.S. (U.S GAAP). In the past, Sagiv was a lecturer at Bar Ilan University regarding accounting and valuation matters.
|
|
|
C. |
Annual examination of impairment of value of goodwill in the Renewable Energies segment in the United States (Cont.)
|
|
Valuation model
|
The recoverable amount was determined based on the fair value less selling costs.
Regarding projects in commercial operation, under construction or being developed that are expected to begin construction in the upcoming year –
using the DCF method by means of discounting the future cash flows of each project, at the weighted‑average cost of capital (WACC), after tax.
Regarding projects awaiting development that are expected to begin construction at a later date (including those in the advanced development
stage) – based on an estimate of the fair value per kilowatt and the probability of realization based on the stages of development (early/advanced). The fair value per kilowatt was estimated for a typical project by use of discounting
future after‑tax cash flows, at the weighted‑average cost of capital (WACC), after tax.
|
|
|
The assumptions based on which
the appraiser performed the
Valuation
|
The dollar weighted‑average cost of capital (WACC) for every material project was calculated separately and ranges between 6% (an active project
with PPA agreements for sale of the full electricity capacity) and 7.25% depending on the status of the project (under construction or awaiting construction and depending on existence of a PPA agreement for sale of all or part of the
electricity capacity).
Additional assumptions:
– Forecast years – represent the output in the years 2024 through 2054 and are based on
an estimate of the economic useful life of the power plants and their value at the end of the forecast period.
– Market prices and capacity – the market prices (electricity, availability of RECs,
etc.) are based PPA agreements and market forecasts received from external, independent information sources, taking into account the region and the relevant market for each project and the relevant regulation.
– Estimate of the construction costs of the projects and entitlement to tax benefits
for projects under construction (ITC or PTC, as applicable)
– Long-term annual inflation rate of 2.2%.
|
|
|
Sensitivity analysis for changes
in the main parameters
|
An increase of 1% WACC (about $101 million).
A decrease of 10% in the price of electricity (about $35 million).
A decrease of 10% in the price of the RECs (about $53 million).
In the Company’s estimation, a possible reasonable change in the key assumptions used in determination of the recoverable amount of the unit as
at the date of the report would not lead to recognition of a significant loss from impairment of value.
|
|
|
D. |
Annual examination of impairment of value of goodwill created in respect of acquisition of the Gat power plant
|
|
|
D. |
Annual examination of impairment of value of goodwill created in respect of acquisition of the Gat power plant (Cont.)
|
|
Subject matter of the Valuation
|
Determination of the recoverable amount of the Cash Generating Units for purposes of an annual impairment of value of goodwill examination in
accordance with the provisions of IAS 36.
|
|
|
Date of the Valuation
|
Effective date of the valuation: December 31, 2023.
Approval date of the valuation: March 11, 2024.
|
|
|
Book value attributed to the Segment’s assets as at the date of the Valuation
|
About NIS 2,781 million.
|
|
|
Recoverable amount as determined pursuant to the Valuation
|
About NIS 5,861 million.
The recoverable amount exceeds the book value attributed to the Segment’s assets and, therefore, it is not necessary to recognize a loss from
impairment of value in the Company’s books.
|
|
|
Identity of the appraiser and his characteristics
|
The valuation was performed by the Company.
|
|
|
Valuation model
|
The recoverable amount of the cash generating units was determined as follows: for the Rotem power plant using the method of fair value less selling costs based on the EV/EBITDA multiple;
for the Hadera and Gat power plants based on their book values – this being due the significant difference between the recoverable amount of the unit and its book value.
|
|
|
The assumptions based on which the appraiser performed the Valuation
|
Set forth below are the main assumptions that were used in determination of the fair value of the Rotem
power plant:
– Adjusted EBITDA for 2023 of NIS 391 million (which in the Company’s estimation is
representative).
– EV/EBITDA multiple of 11.4, which in the Company’s estimation is representative for
a power plant such as Rotem, based on the Company’s experience and transactions executed in the Israeli market in the area of power plants.
|
|
|
Sensitivity analysis for changes in the main parameters
|
A decrease of 1.0 in the EV/EBITDA multiple (about NIS 383 million).
A decrease of 10% in the representative EBITDA (about NIS 439 million).
In the Company’s estimation, a possible reasonable change in the key assumptions used in determination of the recoverable amount of the unit as
at the date of the report would not lead to recognition of a loss from impairment of value.
|
| 69 |
After an examination, as stated, in accordance with that stated in Section 3 of the Clarification to a Legal Position No. 23‑105 “Parameters for
Examination of the Significance of Valuations: Questions and Answers”.
|
| 14. |
Directors having Accounting and Financial Expertise
|
| 15. |
Independent Directors
|
| 16. |
The Internal Auditor
|
|
Summary of Details
|
The Company
|
|
Name of the Internal Auditor
|
Ms. Shoshana Shidlo (“the Internal Auditor”).
|
|
Education and professional experience
|
Certified Public Accountant and Certified Internal Auditor C.I.A. (U.S.)
Holder of a degree in accounting and economics from Tel‑Aviv University.
Has more than 20 years’ experience in the area of internal auditing.
|
|
Commencement date of service
|
January 17, 2019.
|
|
Compliance with legal requirements
|
To the best of the Company's knowledge, based on the Internal Auditor’s declaration, the Internal Auditor meets the requirements of Section 146(b) of the Companies Law, 1999 and the
provisions of Section 8 of the Internal Audit Law, 1992 (“the Internal Audit Law”).
|
|
Employment status
|
The Internal Auditor provides the Company internal audit services and is not employed by the Company in a full-time time position and, in addition, she does not hold an additional position
in the Company other than her position as Internal Auditor.
|
| 16. |
The Internal Auditor (Cont.)
|
|
Manner of appointment
|
The appointment of the Internal Auditor was approved by the Board of Directors on January 17, 2019, following the recommendation of the Audit Committee on December 27, 2018. The Audit
Committee and the Company’s Board of Directors examined Internal Auditor’s qualifications, education and experience in internal auditing.
|
|
The part to whom the Internal Auditor reports
|
The Chairman of the Board of Directors.
|
|
Other relationships the Internal Auditor has with the Company
|
To the best of the Company's knowledge, the Internal Auditor does not hold
securities of the Company.
The Internal Auditor is not an interested party in the Company or a relative of an interested party in the Company, nor is he a relative of the
external auditor or a party acting on its behalf.
|
|
The work plan
|
The audit work plan for 2023 prepared by the Internal Auditor is for one year and is based on a multi‑year work plan (which is not limited as to
time). The work plan of the Company and its subsidiaries was determined based on, among others, the following considerations: coverage of the Company’s main areas of activity, risk centers and exposures known to the Internal Auditor and to
management; a risks’ survey that is prepared by the Company, potential for savings and efficiency; recurring items and monitoring correction of deficiencies; and implementation of recommendations. The audit work plan also includes the
companies in which the Company has significant holdings in Israel.
It is noted that in 2023, the made by itself and without accompaniment of the Internal Auditor, an enterprise risk assessment study, with the
accompaniment of an external advisor, which was presented to the Audit Committee, and is expected to constitute the basis for a discussion with the Internal Auditor regarding continuation of the internal audit plan in the upcoming years.
The audit work plan is submitted for analysis and approval by the Company’s Audit Committee and Board of Directors. The Internal Auditor has
discretion to recommend a variance from the work plan to management and the Audit Committee, where necessary.
Audit reports were submitted to the Audit Committee and management. The Company’s Board of Directors received an update regarding the audit
reports.
Meetings of the Audit Committee were held to discuss the audit reports on the following dates: March 12, 2023; August 20, 2023; November 14, 2023;
and December 24, 2023.
In October 2022, a provider of internal audit services was appointed in the CPV Group by means of outsourcing.
|
| 16. |
The Internal Auditor (Cont.)
|
|
The work plan (Cont.)
|
The Internal Auditor monitors the existence and appropriateness of the activities of the provider of the internal audit services in the CPV Group,
including: receipt of updates regarding the progress of the audit work and the main findings and nonconformances and receipt of the audit reports.
The audit plan and audit reports of the CPV Group are submitted to CPV’s Board of Directors and to the Company’s Audit Committee and are reported
to the Company’s Board of Directors.
During the period of the report, no material transactions (as defined in the Fourth Addendum to the Reporting Regulations) were examined.
In in the estimation of the Board of Directors, the scope, nature and continuity of the activities of the Internal Auditor and the internal audit
work plan are reasonable under the circumstances of the manner, and they are sufficient to achieve the Company’s internal audit goals.
|
|
Performance of the audit and the professional standards
|
Based on information provided to the Company, performance of the internal audit is made in accordance with the generally accepted professional
standards in and outside of Israel and in accordance with Section 4(B) of the Internal Audit Law.
The Board of Directors relied on the confirmations of the Internal Auditor regarding her compliance with the requirements of the said generally
accepted professional standards. In addition, the audit reports are submitted in writing and are discussed at the meetings of the Audit Committee, where as part of the discussion the Internal Auditor reports with respect to the manner of her
performance, the policies and procedures applied and the findings. The Board of Directors is satisfied, based on the Internal Auditor’s reports, that the Internal Auditor is in compliance with all the requirements provided in the said
standards.
|
|
Access to information
|
The Internal Auditor has free access to information, as stated in Section 9 of the Internal Audit Law, including constant and direct access to the Company’s information systems, including
financial data.
|
|
Remuneration
|
The remuneration of the Internal Auditor in respect of services she provided in 2023 amounted to NIS 211 thousand (not including VAT), this being
based on a work scope of 576 audit hours (including 120 work hours in respect of the CPV Group).
The cost of the internal audit services in the CPV Group (which are executed by means of outsourcing, as stated) in 2023 amounted to
NIS 169 thousand, this being based on a work scope of 370 audit hours.
|
| 16. |
The Internal Auditor (Cont.)
|
|
The work plan (Cont.)
|
Set forth below is detail regarding the scope of the investments made, distinguishing between hours invested in internal auditing with respect
to the Company and the investee companies:
|
||||||
|
|
The
Company
|
Investee
companies
in Israel
|
CPV
|
Total
|
|||
|
166
|
290
|
370 (external service provider as noted)
120 the Internal Auditor
|
946
|
||||
|
In the opinion of the Board of Directors, the remuneration of the Internal Auditor is reasonable and does not impact or adversely affect use of
her professional judgment in performance of the audit.
The remuneration of the Internal Auditor is a function of the total number of work hours as provided in the annual work plan that is approved by the Company’s Audit Committee and Board of Directors.
|
|||||||
| 17. |
Contributions policy
|
|
Relationship to the
|
||||
|
Recipient of the
|
Amount of the
|
Recipient of the
|
||
|
Contribution
|
Contribution
|
Contribution
|
||
|
“Password for Every Student” Society
|
1,000
|
“Password for Every Student” also receives contributions from parties related indirectly to the Company’s controlling shareholder (including from the Israel Corporation Group). The
Company’s CEO is a representative of the project’s Steering Committee without compensation.
|
||
|
“Rahashei Lev” Society
|
660
|
For the sake of good order, it is noted that Ms. Michal Marom Brickman, who served as an external director of the Company up to July 13, 2023, serves as a director and
a member of the Investments Committee of the Management Committee of the Tel‑Aviv Medical Center in the name of Sorosky (without pay). It is further noted that, as the Company was informed, commencing from November 2022, the daughter of Mr.
Yosef Tena, an external director of the Company, is employed by the Tel‑Aviv Medical Center in the name of Sorosky.
|
||
|
“Hakfar Hayarok in the Name of Levi Eshkol”
|
50
|
For the sake of good order, it is noted that a family member of the Company’s CEO studies at Hakfar Hayarok.
|
||
|
“Running to Give” Society
|
50
|
For the sake of good order, it is noted that a relative of the Company’s CEO serves as Chairman of the Society without compensation.
|
| 18. |
Details regarding the Auditing Certified Public Accountants (CPAs)
|
|
|
18.1 |
The Company’s auditing CPAs are KPMG (“the Auditor”).
|
|
|
18.2 |
The fee is determined in negotiations between the Company’s management and the Auditor, based on the scope of the work, nature of the work, past experience and market conditions. The fee is in respect of an audit and review of three
quarterly reviewed reports and one audited annual report. In addition, the fee includes tax services in connection with preparation of the Company’s annual tax report.
|
|
|
18.3 |
Set forth below is the Auditor’s fee (in NIS millions):
|
|
For the Year Ended December 31
|
||||||
|
2023
|
2022
|
|||||
|
Audit services*
|
Other services**
|
Audit services*
|
Other services**
|
|||
|
(1)10.6
|
1.1
|
(1)9.4
|
1
|
|||
| (1) |
Of the said amount for 2022–2023, the amounts of about NIS 8.4 million and about NIS 6.5 million, respectively, are in respect of audits of CPV. The fees of the auditing CPAs, as stated, were determined in accordance with negotiations
carried on by the management of CPV and were approved by the competent organs of CPV.
|
|
|
* |
Audit services including services related to the audit and tax services related to the audit.
|
|
|
** |
Other services include mainly tax consulting services.
|
|
Yair Caspi
|
Giora Almogy
|
|
Chairman of the Board of Directors
|
CEO
|
| * |
Assumption of a thermal conversion ratio (heat rate) of 6.9 MMBTU/MWh for Maryland, Shore and Valley, and a thermal conversion ratio (heat rate) of 6.5 MMBTU/MWh for Three Rivers, Towantic and Fairview.
|
| 70 |
EOX is a subsidiary of a commodity broker, OTC Global Holdings, which publishes forward prices for the electricity and natural gas markets based on trading data in the futures markets. The
futures prices are an objective way of estimating the future expectation with respect to electricity and natural gas prices since they represent transactions with entities operating in these markets involving buying and
selling futures contracts at specific prices.
|
|
Power Plant
|
2024
|
2025
|
2026
|
|||||||||
|
Fairview
|
||||||||||||
|
Gas price (Texas Eastern M2, as of 2026 M3)
|
1.79
|
2.47
|
3.44
|
|||||||||
|
Electricity price AEP Dayton (AD))
|
39.73
|
44.91
|
47.43
|
|||||||||
|
Electricity margin
|
28.10
|
28.86
|
25.07
|
|||||||||
|
Towantic
|
||||||||||||
|
Gas price (Algoniquin City Gate)
|
4.38
|
5.77
|
6.35
|
|||||||||
|
Electricity price Mass Hub)
|
51.77
|
59.95
|
60.48
|
|||||||||
|
Electricity margin
|
23.30
|
22.45
|
19.21
|
|||||||||
|
Maryland
|
||||||||||||
|
Gas price (Transco Zone 5)
|
3.40
|
3.82
|
4.06
|
|||||||||
|
Electricity price (PJM West Hub)
|
43.66
|
49.36
|
52.14
|
|||||||||
|
Electricity margin
|
20.20
|
23.00
|
24.13
|
|||||||||
|
Shore
|
||||||||||||
|
Gas price (Texas Eastern M3)
|
2.35
|
3.13
|
3.44
|
|||||||||
|
Electricity price (PJM West Hub)
|
43.66
|
49.36
|
52.14
|
|||||||||
|
Electricity margin
|
27.45
|
27.76
|
28.40
|
|||||||||
|
Valley
|
||||||||||||
|
Gas price (Texas Eastern M3 – 70%, Dominion South Pt – 30%)
|
2.18
|
2.92
|
3.22
|
|||||||||
|
Electricity price (New York Zone G)
|
44.35
|
50.15
|
58.70
|
|||||||||
|
Electricity margin
|
29.31
|
30.00
|
36.48
|
|||||||||
|
Three Rivers
|
||||||||||||
|
Gas price (Chicago City Gate)
|
2.55
|
3.45
|
3.78
|
|||||||||
|
Electricity price (PJM ComEd)
|
35.40
|
39.67
|
42.47
|
|||||||||
|
Electricity margin
|
18.81
|
17.26
|
17.93
|
|||||||||
|
Transco
|
|
Texas
|
|
|
Texas
|
|
|
|
|
Zn5
|
|
Eastern
|
Algonqu
|
Dominio
|
Eastern
|
Mass
|
|
|
|
Dlvd
|
Chicago
|
M-2
|
in CG
|
n S Pt
|
M-3
|
Hub
|
Mass | |
|
M2M
|
CG |
M2M
|
M2M | M2M |
M2M
|
M2M
|
Hub
|
Contract
|
| Fwd |
M2M
|
Fwd
|
Fwd
|
Fwd
|
Fwd
|
OPk |
M2M Pk
|
Date
|
|
2.65
|
2.03
|
1.60
|
1.91
|
1.60
|
1.70
|
31.50
|
44.62
|
1/12/2023
|
|
7.04
|
2.71
|
2.09
|
7.56
|
1.97
|
3.81
|
70.28
|
73.49
|
1/1/2024
|
|
5.73
|
2.76
|
1.99
|
8.93
|
1.91
|
3.93
|
75.98
|
79.41
|
1/2/2024
|
|
2.65
|
2.28
|
1.76
|
4.38
|
1.74
|
2.08
|
46.00
|
52.22
|
1/3/2024
|
|
2.43
|
2.20
|
1.67
|
2.70
|
1.68
|
1.83
|
33.00
|
38.06
|
1/4/2024
|
|
2.68
|
2.21
|
1.66
|
2.13
|
1.68
|
1.76
|
29.18
|
34.16
|
1/5/2024
|
|
2.72
|
2.35
|
1.69
|
2.31
|
1.72
|
1.82
|
32.28
|
40.48
|
1/6/2024
|
|
2.99
|
2.43
|
1.73
|
2.97
|
1.75
|
2.05
|
42.94
|
60.30
|
1/7/2024
|
|
2.95
|
2.47
|
1.65
|
2.86
|
1.69
|
2.04
|
34.52
|
50.35
|
1/8/2024
|
|
2.67
|
2.33
|
1.39
|
1.88
|
1.39
|
1.45
|
30.12
|
39.69
|
1/9/2024
|
|
2.72
|
2.31
|
1.35
|
2.10
|
1.35
|
1.43
|
31.39
|
39.88
|
1/10/2024
|
|
2.46
|
2.83
|
1.84
|
4.93
|
1.87
|
2.19
|
52.71
|
59.90
|
1/11/2024
|
|
3.75
|
3.75
|
2.69
|
9.86
|
2.60
|
3.86
|
84.03
|
90.09
|
1/12/2024
|
|
5.64
|
4.57
|
3.23
|
12.28
|
2.97
|
5.73
|
107.92
|
118.59
|
1/1/2025
|
|
5.50
|
4.47
|
3.18
|
11.64
|
2.95
|
5.59
|
95.78
|
105.14
|
1/2/2025
|
|
3.86
|
3.30
|
2.81
|
7.36
|
2.69
|
2.97
|
63.02
|
69.19
|
1/3/2025
|
|
3.15
|
2.97
|
2.25
|
3.75
|
2.26
|
2.39
|
38.66
|
45.47
|
1/4/2025
|
|
3.47
|
2.91
|
2.15
|
2.92
|
2.17
|
2.31
|
31.58
|
37.79
|
1/5/2025
|
|
3.29
|
3.04
|
2.17
|
2.96
|
2.24
|
2.35
|
33.11
|
42.54
|
1/6/2025
|
|
3.38
|
3.11
|
2.33
|
3.28
|
2.26
|
2.49
|
42.52
|
63.50
|
1/7/2025
|
|
3.31
|
3.15
|
2.26
|
3.25
|
2.21
|
2.49
|
38.89
|
59.57
|
1/8/2025
|
|
2.97
|
2.98
|
1.85
|
2.62
|
1.87
|
2.04
|
31.73
|
39.91
|
1/9/2025
|
|
2.95
|
3.01
|
1.75
|
2.72
|
1.85
|
2.00
|
31.60
|
39.43
|
1/10/2025
|
|
3.60
|
3.48
|
2.41
|
5.95
|
2.42
|
2.69
|
58.47
|
59.41
|
1/11/2025
|
|
4.75
|
4.37
|
3.25
|
10.50
|
3.15
|
4.50
|
74.05
|
83.81
|
1/12/2025
|
|
6.05
|
5.22
|
3.86
|
15.33
|
3.66
|
6.70
|
117.07
|
125.53
|
1/1/2026
|
|
5.71
|
5.08
|
3.73
|
14.45
|
3.54
|
6.52
|
109.65
|
116.92
|
1/2/2026
|
|
4.25
|
3.68
|
3.25
|
6.23
|
3.10
|
2.93
|
52.83
|
63.50
|
1/3/2026
|
|
3.67
|
3.19
|
2.41
|
3.57
|
2.36
|
2.59
|
36.25
|
43.31
|
1/4/2026
|
|
3.64
|
3.08
|
2.23
|
3.00
|
2.32
|
2.47
|
34.30
|
39.67
|
1/5/2026
|
|
3.64
|
3.21
|
2.41
|
3.14
|
2.38
|
2.60
|
34.08
|
44.86
|
1/6/2026
|
|
3.77
|
3.38
|
2.51
|
3.47
|
2.45
|
2.75
|
43.07
|
59.58
|
1/7/2026
|
|
3.72
|
3.41
|
2.47
|
3.42
|
2.43
|
2.74
|
41.06
|
53.48
|
1/8/2026
|
|
3.03
|
3.38
|
2.07
|
2.65
|
2.08
|
2.14
|
33.91
|
43.80
|
1/9/2026
|
|
2.85
|
3.32
|
2.05
|
2.72
|
2.06
|
2.08
|
36.17
|
42.29
|
1/10/2026
|
|
3.63
|
3.74
|
2.69
|
6.66
|
2.70
|
2.97
|
48.77
|
58.00
|
1/11/2026
|
|
4.71
|
4.64
|
3.55
|
11.55
|
3.45
|
4.80
|
69.52
|
77.86
|
1/12/2026
|
|
4.09
|
3.98
|
2.97
|
7.21
|
3.04
|
3.33
|
49.47
|
58.07
|
1/11/2026
|
|
4.96
|
4.86
|
3.85
|
11.79
|
3.75
|
5.05
|
72.78
|
87.45
|
1/12/2026
|
|
|
|
|
|
|
|
|
|
|
|
East NY
|
|
PJM
|
PJM
|
AEP-
|
AEP-
|
PJM
|
PJM
|
|
|
ZnG
|
East NY
|
ComEd
|
ComEd
|
Dayton
|
Dayton |
West
|
West | |
|
M2M
|
ZnG |
M2MS
|
M2MS
|
M2M |
M2M
|
M2M
|
M2M
|
Contract
|
| OPk | M2M Pk |
OPk
|
Pk |
OPk
|
Pk
|
OPk |
Pk
|
Date
|
|
27.12
|
37.24
|
19.26
|
28.11
|
23.12
|
30.41
|
24.92
|
38.06
|
1/12/2023
|
|
55.02
|
60.48
|
32.64
|
38.55
|
37.95
|
44.03
|
44.35
|
50.02
|
1/1/2024
|
|
57.1
|
63.58
|
31.41
|
37.32
|
35.46
|
42.12
|
42.33
|
48.21
|
1/2/2024
|
|
37.68
|
42.84
|
27.49
|
33.55
|
33.49
|
36.37
|
35.19
|
40.22
|
1/3/2024
|
|
29.99
|
34.42
|
24.22
|
33.64
|
30.47
|
37.29
|
31.88
|
39.43
|
1/4/2024
|
|
28.48
|
34.55
|
27.2
|
36.95
|
30.21
|
40.17
|
30.7
|
41.98
|
1/5/2024
|
|
29.12
|
37.78
|
29.01
|
42.59
|
28.62
|
43.77
|
29.35
|
44.26
|
1/6/2024
|
|
40.15
|
54.45
|
38.09
|
55.83
|
36.82
|
58.44
|
37.9
|
58.59
|
1/7/2024
|
|
30.49
|
47.25
|
31.57
|
49.82
|
31.57
|
51.35
|
32.94
|
52.78
|
1/8/2024
|
|
29.35
|
37.67
|
28.06
|
41.92
|
29.39
|
44.19
|
30.86
|
45.43
|
1/9/2024
|
|
30.76
|
38.01
|
27.02
|
39.49
|
32.97
|
42.36
|
32.48
|
43.79
|
1/10/2024
|
|
40.43
|
47.36
|
31.79
|
40.12
|
36.82
|
42.4
|
37.32
|
45.23
|
1/11/2024
|
|
62.5
|
66.34
|
35.88
|
44.31
|
43.9
|
46.75
|
46.13
|
51.47
|
1/12/2024
|
|
67.63
|
82.58
|
40.44
|
49.62
|
47.01
|
53.26
|
52.53
|
61.24
|
1/1/2025
|
|
65.78
|
84.01
|
36.6
|
44.05
|
43.16
|
46.89
|
48.88
|
55.31
|
1/2/2025
|
|
45.66
|
52.03
|
32.33
|
40.64
|
37.88
|
44.62
|
40.18
|
47.65
|
1/3/2025
|
|
31.08
|
39.4
|
29.88
|
39.2
|
34.69
|
43.33
|
35.94
|
45.32
|
1/4/2025
|
|
32.61
|
41.21
|
29.92
|
42.9
|
33.72
|
46.48
|
34.72
|
47.57
|
1/5/2025
|
|
30.62
|
42.43
|
28.31
|
45.61
|
32.36
|
48.74
|
33.16
|
49.58
|
1/6/2025
|
|
37.93
|
59.98
|
38.28
|
59.24
|
40.18
|
62.76
|
40.98
|
64.54
|
1/7/2025
|
|
36.86
|
51.58
|
35.53
|
53.42
|
37.12
|
56.69
|
37.82
|
57.93
|
1/8/2025
|
|
29.33
|
42.24
|
28.63
|
45.42
|
32.82
|
49.38
|
34.02
|
50.57
|
1/9/2025
|
|
32.04
|
36.26
|
31.04
|
41.02
|
34.58
|
46.38
|
36.13
|
48.46
|
1/10/2025
|
|
39.15
|
53.65
|
36.2
|
42.73
|
40.09
|
47.3
|
42.39
|
49.83
|
1/11/2025
|
|
56.98
|
67.52
|
43.63
|
47.06
|
47.84
|
51.99
|
51.4
|
56.57
|
1/12/2025
|
|
91.12
|
95.92
|
42.74
|
52.76
|
50.21
|
57.95
|
58.19
|
65.77
|
1/1/2026
|
|
82.81
|
87.17
|
39.21
|
47.05
|
46.28
|
51.15
|
54.41
|
59.61
|
1/2/2026
|
|
54.45
|
68.41
|
37.54
|
44.38
|
41.56
|
48.5
|
44.93
|
52.67
|
1/3/2026
|
|
37.9
|
44.89
|
30.99
|
40.66
|
34.97
|
44.29
|
35.83
|
46.62
|
1/4/2026
|
|
37.54
|
43.95
|
31.38
|
41.81
|
34.61
|
45.64
|
35.47
|
47.63
|
1/5/2026
|
|
38.63
|
48.83
|
30.76
|
47.68
|
33.33
|
51.35
|
34.03
|
52.89
|
1/6/2026
|
|
51.45
|
68.12
|
40.67
|
65.24
|
42.69
|
68.12
|
43.65
|
69.41
|
1/7/2026
|
|
48.98
|
62.91
|
38.13
|
57.4
|
39.89
|
60.47
|
40.9
|
62.46
|
1/8/2026
|
|
36.33
|
48.17
|
30.69
|
47.92
|
33.31
|
52.19
|
34.52
|
53.24
|
1/9/2026
|
|
37.68
|
41.44
|
32.37
|
44.37
|
35.35
|
48.65
|
36.25
|
49.94
|
1/10/2026
|
|
48.08
|
54.76
|
38.61
|
44.94
|
40.73
|
48.95
|
42.49
|
50.84
|
1/11/2026
|
|
71.25
|
76.16
|
50.41
|
51.42
|
52.62
|
55.54
|
55.7
|
59.02
|
1/12/2026
|
|
46.41
|
57.21
|
34.48
|
41.31
|
37.27
|
45.48
|
39.29
|
47.09
|
1/11/2026
|
|
68.89
|
89.31
|
44.71
|
53.03
|
48.01
|
57.04
|
51.66
|
60.46
|
1/12/2026
|
|
Table of Contents
|
|
|
|
Page
|
|
|
|
|
F-3 - F-6
|
|
|
|
|
|
F-7 - F-8
|
|
|
|
|
|
F-9
|
|
|
|
|
|
F-10
|
|
|
|
|
|
F-11 - F-13
|
|
|
F-14 - F-17
|
|
|
F-18
|

| • |
The estimate of the recoverable amount is based on subjective assumptions of the Company’s management, including the projected cash flow and discount rate.
|
| • |
The audit procedures we implemented in connection with the assessment of the estimate of the Segment’s recoverable amount involved subjective judgment of the audit team,
and the use of experts on behalf of the audit team, who had knowledge and experience in connection with appraisals.
|
|
|
• |
We obtained an understanding of the process of goodwill impairment testing, and reviewed the process used by management to estimate the Segment’s recoverable amounts.
|
|
|
• |
We sought the assistance of experts possessing the required knowledge and experience in fair value valuations in order to assess the valuation method, and the
reasonableness of the weighted average cost of capital.
|
|
|
• |
We received the appraisal of the expert on behalf of the Company, and assessed the reasonableness of the significant assumptions used by the expert in developing the
projected cash flows, by, among other things, comparing them to historical results and updated market input.
|
|
|
• |
We tested the completeness of the data included in the valuation model and their adequacy.
|
|
|
• |
We conducted a sensitivity analysis to the results of the model in connection with the key assumptions, such as energy prices and weighted average cost of capital.
|
| (1) |
Report of the independent auditors of March 11, 2024 regarding the consolidated financial statements of the Company as of December 31, 2023 and 2022, and for each of the three years in the
period ended December 31, 2023.
|
| (2) |
Report of the independent auditors of March 11, 2024 regarding the Company’s separate financial information in accordance with Regulation 9C to the Securities Regulations (Periodic and
Immediate Reports), 1970 as of December 31, 2023 and 2022, and for each of the three years in the period ended December 31, 2023.
|
| (3) |
Report of the independent auditors of March 11, 2024 regarding the audit of the components of internal control over financial reporting of the Company as of December 31, 2023.
|
|
2023
|
2022
|
||||||||||
|
Note
|
NIS million
|
NIS million
|
|||||||||
|
Current assets
|
|||||||||||
|
Cash and cash equivalents
|
5A
|
|
1,007
|
849
|
|||||||
|
Short term deposits
|
5B
|
|
-
|
125
|
|||||||
|
Short-term restricted deposits and cash
|
6
|
2
|
36
|
||||||||
|
Trade receivables
|
7
|
247
|
260
|
||||||||
|
Other receivables and debit balances
|
8
|
404
|
197
|
||||||||
|
Short-term derivative financial instruments
|
23
|
12
|
10
|
||||||||
|
Total current assets
|
1,672
|
1,477
|
|||||||||
|
Non‑current assets
|
|||||||||||
|
Long-term restricted deposits and cash
|
6
|
59
|
53
|
||||||||
|
Prepaid expenses and other long-term receivables
|
9
|
190
|
82
|
||||||||
|
Investments in associates
|
26
|
2,550
|
2,296
|
||||||||
|
Deferred tax assets
|
19
|
57
|
22
|
||||||||
|
Long-term derivative financial instruments
|
23
|
51
|
57
|
||||||||
|
Property, plant & equipment
|
10
|
6,243
|
4,324
|
||||||||
|
Right‑of‑use assets and long-term deferred expenses
|
11
|
631
|
444
|
||||||||
|
Intangible assets
|
12
|
1,165
|
777
|
||||||||
|
Total non‑current assets
|
10,946
|
8,055
|
|||||||||
|
Total assets
|
12,618
|
9,532
|
|||||||||
|
2023
|
2022
|
||||||||||
|
Note
|
NIS million
|
NIS million
|
|||||||||
|
Current liabilities
|
|||||||||||
|
Loans and credit from banks and financial institutions (including current maturities)
|
16
|
391
|
92
|
||||||||
|
Current maturities of debt from non‑controlling interests
|
25D
|
|
32
|
13
|
|||||||
|
Current maturities of debentures
|
17
|
192
|
33
|
||||||||
|
Trade payables
|
13
|
257
|
335
|
||||||||
|
Payables and credit balances
|
14
|
385
|
112
|
||||||||
|
Short-term derivative financial instruments
|
23
|
8
|
3
|
||||||||
|
Current maturities of lease liabilities
|
11
|
18
|
61
|
||||||||
|
Total current liabilities
|
1,283
|
649
|
|||||||||
|
Non‑current liabilities
|
|||||||||||
|
Long-term loans from banks and financial institutions
|
16
|
2,865
|
1,724
|
||||||||
|
Long-term debt from non-controlling interests
|
25D
|
|
422
|
424
|
|||||||
|
Debentures
|
17
|
1,647
|
1,807
|
||||||||
|
Long-term lease liabilities
|
11
|
204
|
69
|
||||||||
|
Long-term derivative financial instruments
|
23
|
58
|
-
|
||||||||
|
Other long‑term liabilities
|
15
|
399
|
146
|
||||||||
|
Deferred tax liabilities
|
19
|
498
|
347
|
||||||||
|
Total non-current liabilities
|
6,093
|
4,517
|
|||||||||
|
Total liabilities
|
7,376
|
5,166
|
|||||||||
|
Equity
|
20
|
||||||||||
|
Share capital
|
2
|
2
|
|||||||||
|
Share premium
|
3,210
|
3,209
|
|||||||||
|
Capital reserves
|
523
|
327
|
|||||||||
|
Retained earnings (loss)
|
113
|
(31
|
)
|
||||||||
|
Total equity attributable to the Company’s shareholders
|
3,848
|
3,507
|
|||||||||
|
Non‑controlling interests
|
1,394
|
859
|
|||||||||
|
Total equity
|
5,242
|
4,366
|
|||||||||
|
Total liabilities and equity
|
12,618
|
9,532
|
|||||||||
|
Yair Caspi
|
Giora Almogy
|
Ana Berenshtein Shvartsman
|
||
|
Chairman of the Board of Directors
|
Chief Executive Officer
|
Chief Financial Officer
|
|
2023
|
2022
|
2021
|
|||||||||||||
|
Note
|
NIS million
|
NIS million
|
NIS million
|
||||||||||||
|
Income from sales and provision of services
|
21A
|
|
2,552
|
1,927
|
1,575
|
||||||||||
|
Cost of sales and services (excluding depreciation and amortization)
|
21B
|
|
(1,827
|
)
|
(1,404
|
)
|
(1,086
|
)
|
|||||||
|
Depreciation and amortization
|
|
(288
|
)
|
(191
|
)
|
(171
|
)
|
||||||||
|
|
|||||||||||||||
|
Gross profit
|
|
437
|
332
|
318
|
|||||||||||
|
|
|||||||||||||||
|
General and administrative expenses
|
21C
|
|
(212
|
)
|
(239
|
)
|
(177
|
)
|
|||||||
|
Share in the profits (losses) of associates
|
26
|
|
242
|
286
|
(35
|
)
|
|||||||||
|
Business development expenses
|
21D
|
|
(58
|
)
|
(50
|
)
|
(27
|
)
|
|||||||
|
Compensation in respect of loss of income
|
28A4
|
|
41
|
-
|
-
|
||||||||||
|
Other expenses, net
|
12D
|
|
(16
|
)
|
-
|
(2
|
)
|
||||||||
|
|
|||||||||||||||
|
Operating profit
|
|
434
|
329
|
77
|
|||||||||||
|
|
|||||||||||||||
|
Finance expenses
|
21E
|
|
(240
|
)
|
(153
|
)
|
(187
|
)
|
|||||||
|
Finance income
|
21E
|
|
43
|
106
|
2
|
||||||||||
|
Loss from extinguishment of financial liabilities, net
|
21E
|
|
-
|
-
|
(272
|
)
|
|||||||||
|
|
|||||||||||||||
|
Finance expenses, net
|
|
(197
|
)
|
(47
|
)
|
(457
|
)
|
||||||||
|
|
|||||||||||||||
|
Profit (loss) before income taxes
|
|
237
|
282
|
(380
|
)
|
||||||||||
|
|
|||||||||||||||
|
Tax benefit (income tax expenses)
|
19
|
(68
|
)
|
(65
|
)
|
77
|
|||||||||
|
Profit (loss) for the year
|
169
|
217
|
(303
|
)
|
|||||||||||
|
Attributable to:
|
|||||||||||||||
|
The Company’s shareholders
|
144
|
167
|
(219
|
)
|
|||||||||||
|
Non-controlling interests
|
25
|
50
|
(84
|
)
|
|||||||||||
|
Profit (loss) for the year
|
169
|
217
|
(303
|
)
|
|||||||||||
|
Earnings (loss) per share attributed to the Company’s owners
|
22
|
||||||||||||||
|
Basic and diluted earnings (loss) per share (in NIS)
|
0.63
|
0.79
|
(1.15
|
)
|
|||||||||||
|
2023
|
2022
|
2021
|
||||||||||
|
NIS million
|
NIS million
|
NIS million
|
||||||||||
|
Profit (loss) for the year
|
169
|
217
|
(303
|
)
|
||||||||
|
Components of other comprehensive income (loss) that, subsequent to initial recognition in comprehensive income, were or will be
transferred to profit and loss
|
||||||||||||
|
Effective portion of the change in the fair value of cash flow hedges
|
(40
|
)
|
50
|
28
|
||||||||
|
Net change in fair value of derivative financial instruments used to hedge cash flows recognized in the cost of the hedged item
|
(5
|
)
|
(4
|
)
|
120
|
|||||||
|
Net change in fair value of derivative financial instruments used to hedge cash flows transferred to profit and loss
|
(20
|
)
|
(14
|
)
|
(7
|
)
|
||||||
|
Group’s share in other comprehensive income (loss) of associates, net of tax
|
(48
|
)
|
64
|
40
|
||||||||
|
Foreign currency translation differences in respect of foreign operations
|
126
|
267
|
(40
|
)
|
||||||||
|
Tax on other comprehensive income (loss) items
|
1
|
(9
|
)
|
(1
|
)
|
|||||||
|
Other comprehensive income for the year, net of tax
|
14
|
354
|
140
|
|||||||||
|
Total comprehensive income (loss) for the year
|
183
|
571
|
(163
|
)
|
||||||||
|
Attributable to:
|
||||||||||||
|
The Company’s shareholders
|
169
|
412
|
(82
|
)
|
||||||||
|
Non-controlling interests
|
14
|
159
|
(81
|
)
|
||||||||
|
Total comprehensive income (loss) for the year
|
183
|
571
|
(163
|
)
|
||||||||
|
Attributable to the Company’s shareholders
|
||||||||||||||||||||||||||||||||||||||||||||
|
Share capital
|
Share premium
|
Capital reserve from transactions with non-controlling interests and merger
|
Hedge fund
|
Foreign operations translation reserve
|
Capital reserve from transactions with sharehold-ers
|
Capital reserve for share-based payment
|
Retained earnings (loss)
|
Total
|
Non‑con-trolling
interests
|
Total equity
|
||||||||||||||||||||||||||||||||||
|
NIS million
|
NIS million
|
NIS million
|
NIS million
|
NIS million
|
NIS million
|
NIS million
|
NIS million
|
NIS million
|
NIS million
|
NIS million
|
||||||||||||||||||||||||||||||||||
|
For the year ended December 31, 2023
|
||||||||||||||||||||||||||||||||||||||||||||
|
Balance as at January 1, 2023
|
2
|
3,209
|
(25
|
)
|
91
|
159
|
78
|
24
|
(31
|
)
|
3,507
|
859
|
4,366
|
|||||||||||||||||||||||||||||||
|
Investments by holders of non-controlling interests in equity of subsidiary
|
-
|
-
|
-
|
-
|
-
|
-
|
-
|
-
|
-
|
231
|
231
|
|||||||||||||||||||||||||||||||||
|
Share-based payment
|
-
|
-
|
(1
|
)
|
-
|
-
|
-
|
10
|
-
|
9
|
1
|
10
|
||||||||||||||||||||||||||||||||
|
Exercised options and RSUs
|
*-
|
1
|
-
|
-
|
-
|
-
|
(1
|
)
|
-
|
-
|
-
|
-
|
||||||||||||||||||||||||||||||||
|
Restructuring - share exchange and investment transaction with Veridis
|
-
|
-
|
163
|
-
|
-
|
-
|
-
|
-
|
163
|
289
|
452
|
|||||||||||||||||||||||||||||||||
|
Other comprehensive income for the year
|
-
|
-
|
-
|
(66
|
)
|
91
|
-
|
-
|
-
|
25
|
(11
|
)
|
14
|
|||||||||||||||||||||||||||||||
|
Profit for the year
|
-
|
-
|
-
|
-
|
-
|
-
|
-
|
144
|
144
|
25
|
169
|
|||||||||||||||||||||||||||||||||
|
Balance as at December 31, 2023
|
2
|
3,210
|
137
|
25
|
250
|
78
|
33
|
113
|
3,848
|
1,394
|
5,242
|
|||||||||||||||||||||||||||||||||
|
Attributable to the Company’s shareholders
|
||||||||||||||||||||||||||||||||||||||||||||
|
Share capital
|
Share premium
|
Capital reserve from transactions with non-controlling interests and merger
|
Hedge fund
|
Foreign operations translation reserve
|
Capital reserve from transac-tions with share-holders
|
Capital reserve for share-based payment
|
Retained loss
|
Total
|
Non‑control-ling interests
|
Total equity
|
||||||||||||||||||||||||||||||||||
|
NIS million
|
NIS million
|
NIS million
|
NIS million
|
NIS million
|
NIS million
|
NIS million
|
NIS million
|
NIS million
|
NIS million
|
NIS million
|
||||||||||||||||||||||||||||||||||
|
For the year ended December 31, 2022
|
||||||||||||||||||||||||||||||||||||||||||||
|
Balance as at January 1 2022
|
2
|
2,392
|
(25
|
)
|
32
|
(27
|
)
|
78
|
10
|
(198
|
)
|
2,264
|
577
|
2,841
|
||||||||||||||||||||||||||||||
|
Issuance of shares (less issuance expenses)
|
*-
|
815
|
-
|
-
|
-
|
-
|
-
|
-
|
815
|
-
|
815
|
|||||||||||||||||||||||||||||||||
|
Investments by holders of non-controlling interests in equity of subsidiary
|
-
|
-
|
-
|
-
|
-
|
-
|
-
|
-
|
-
|
123
|
123
|
|||||||||||||||||||||||||||||||||
|
Share-based payment
|
-
|
-
|
-
|
-
|
-
|
-
|
16
|
-
|
16
|
-
|
16
|
|||||||||||||||||||||||||||||||||
|
Exercised options and RSUs
|
*-
|
2
|
-
|
-
|
-
|
-
|
(2
|
)
|
-
|
-
|
-
|
-
|
||||||||||||||||||||||||||||||||
|
Other comprehensive income for the year
|
-
|
-
|
-
|
59
|
186
|
-
|
-
|
-
|
245
|
109
|
354
|
|||||||||||||||||||||||||||||||||
|
Profit for the year
|
-
|
-
|
-
|
-
|
-
|
-
|
-
|
167
|
167
|
50
|
217
|
|||||||||||||||||||||||||||||||||
|
Balance as at December 31, 2022
|
2
|
3,209
|
(25
|
)
|
91
|
159
|
78
|
24
|
(31
|
)
|
3,507
|
859
|
4,366
|
|||||||||||||||||||||||||||||||
|
Attributable to the Company’s shareholders
|
||||||||||||||||||||||||||||||||||||||||||||
|
Share capital
|
Share premium
|
Capital reserve from transactions with non-controlling interests and merger
|
Hedge fund
|
Foreign operations translation reserve
|
Capital reserve from transac-tions with sharehold-ers
|
Capital reserve for share-based payment
|
Retained earnings (loss)
|
Total
|
Non‑control-ling interests
|
Total equity
|
||||||||||||||||||||||||||||||||||
|
NIS million
|
NIS million
|
NIS million
|
NIS million
|
NIS million
|
NIS million
|
NIS million
|
NIS million
|
NIS million
|
NIS million
|
NIS million
|
||||||||||||||||||||||||||||||||||
|
For the year ended December 31, 2021
|
||||||||||||||||||||||||||||||||||||||||||||
|
Balance as at January 1, 2021
|
2
|
1714
|
(25
|
)
|
(132
|
)
|
-
|
78
|
5
|
21
|
1,663
|
41
|
1,704
|
|||||||||||||||||||||||||||||||
|
Issuance of shares (less issuance expenses)
|
*-
|
674
|
-
|
-
|
-
|
-
|
-
|
-
|
674
|
-
|
674
|
|||||||||||||||||||||||||||||||||
|
Investments by holders of non-controlling interests in equity of subsidiary
|
-
|
-
|
-
|
-
|
-
|
-
|
-
|
-
|
-
|
629
|
629
|
|||||||||||||||||||||||||||||||||
|
Non-controlling interests in respect of business combinations
|
-
|
-
|
-
|
-
|
-
|
-
|
-
|
-
|
-
|
21
|
21
|
|||||||||||||||||||||||||||||||||
|
Share-based payment
|
-
|
-
|
-
|
-
|
-
|
-
|
9
|
-
|
9
|
-
|
9
|
|||||||||||||||||||||||||||||||||
|
Exercised options and RSUs
|
*-
|
4
|
-
|
-
|
-
|
-
|
(4
|
)
|
-
|
-
|
-
|
-
|
||||||||||||||||||||||||||||||||
|
Dividend to non-controlling interests
|
-
|
-
|
-
|
-
|
-
|
-
|
-
|
-
|
-
|
(33
|
)
|
(33
|
)
|
|||||||||||||||||||||||||||||||
|
Other comprehensive income (loss) for the year
|
-
|
-
|
-
|
164
|
(27
|
)
|
-
|
-
|
-
|
137
|
3
|
140
|
||||||||||||||||||||||||||||||||
|
Loss for the year
|
-
|
-
|
-
|
-
|
-
|
-
|
-
|
(219
|
)
|
(219
|
)
|
(84
|
)
|
(303
|
)
|
|||||||||||||||||||||||||||||
|
Balance as at December 31, 2021
|
2
|
2,392
|
(25
|
)
|
32
|
(27
|
)
|
78
|
10
|
(198
|
)
|
2,264
|
577
|
2,841
|
||||||||||||||||||||||||||||||
|
2023
|
2022
|
2021
|
||||||||||
|
NIS million
|
NIS million
|
NIS million
|
||||||||||
|
Cash flows from operating activities
|
||||||||||||
|
Profit (loss) for the year
|
169
|
217
|
(303
|
)
|
||||||||
|
Adjustments:
|
||||||||||||
|
Depreciation and amortization
|
303
|
201
|
179
|
|||||||||
|
Diesel fuel consumption
|
32
|
9
|
6
|
|||||||||
|
Finance expenses, net
|
197
|
47
|
457
|
|||||||||
|
Taxes on income (tax benefit)
|
68
|
65
|
(77
|
)
|
||||||||
|
Share in losses (profits) of associates
|
(242
|
)
|
(286
|
)
|
35
|
|||||||
|
Other expenses, net
|
16
|
-
|
-
|
|||||||||
|
Share-based compensation transactions
|
(7
|
)
|
62
|
58
|
||||||||
|
536
|
315
|
355
|
||||||||||
|
Changes in inventory, trade and other receivables
|
(22
|
)
|
(84
|
)
|
(2
|
)
|
||||||
|
Changes in trade payables, other payables and long-term liabilities
|
(25
|
)
|
(19
|
)
|
1
|
|||||||
|
(47
|
)
|
(103
|
)
|
(1
|
)
|
|||||||
|
Dividends received from associates
|
13
|
-
|
32
|
|||||||||
|
Income tax paid
|
(7
|
)
|
(5
|
)
|
(1
|
)
|
||||||
|
6
|
(5
|
)
|
31
|
|||||||||
|
Net cash from operating activities
|
495
|
207
|
385
|
|||||||||
|
Cash flows from investing activities
|
||||||||||||
|
Interest received
|
35
|
8
|
-
|
|||||||||
|
Short-term restricted deposits and cash, net
|
47
|
(33
|
)
|
207
|
||||||||
|
Withdrawal from (deposits into) short-term deposits
|
125
|
(125
|
)
|
1,607
|
||||||||
|
Provision of short-term collateral(1)
|
-
|
(79
|
)
|
(34
|
)
|
|||||||
|
Release of short-term collateral(1)
|
110
|
17
|
-
|
|||||||||
|
Withdrawals from long-term restricted cash
|
1
|
44
|
172
|
|||||||||
|
Deposits to long-term restricted cash
|
-
|
(2
|
)
|
(31
|
)
|
|||||||
|
Acquisition of subsidiaries, net of cash acquired(2)
|
(1,172
|
)
|
-
|
(2,152
|
)
|
|||||||
|
Investment in associates
|
(29
|
)
|
(10
|
)
|
(28
|
)
|
||||||
|
Subordinate long-term loans to Valley (3)
|
(87
|
)
|
-
|
(17
|
)
|
|||||||
|
Proceeds for repayment of partnership capital from associates
|
11
|
15
|
154
|
|||||||||
|
Purchase of property, plant, and equipment, intangible assets and long-term deferred expenses
|
(1,223
|
)
|
(942
|
)
|
(774
|
)
|
||||||
|
Proceeds (payment) for derivative financial instruments, net
|
8
|
5
|
(18
|
)
|
||||||||
|
Other
|
8
|
-
|
16
|
|||||||||
|
Net cash used in investing activities
|
(2,166
|
)
|
(1,102
|
)
|
(898
|
)
|
||||||
| 1. |
Including mainly a collateral provided to secure transactions to hedge energy margins in Valley in 2022, and which was released in the reporting period.
|
| 2. |
For further details, see Notes 16B1, 16B4 and 25E.
|
| 3. |
For further details – see Note 26D.
|
|
2023
|
2022
|
2021
|
||||||||||
|
NIS million
|
NIS million
|
NIS million
|
||||||||||
|
Cash flows for financing activities
|
||||||||||||
|
Proceeds of share issuance, less issuance expenses
|
-
|
815
|
674
|
|||||||||
|
Proceeds of debenture issuance, less issuance expenses
|
-
|
-
|
842
|
|||||||||
|
Receipt of long-term loans from banks and financial institutions, net(1)
|
1,242
|
282
|
666
|
|||||||||
|
Receipt of long-term debt from non-controlling interests
|
110
|
46
|
421
|
|||||||||
|
Investments by holders of non-controlling interests in equity of subsidiary
|
231
|
123
|
629
|
|||||||||
|
Proceeds in respect of restructuring - share exchange and investment transaction with Veridis(2)
|
452
|
-
|
-
|
|||||||||
|
Short term loans from banking corporations, net
|
231
|
-
|
-
|
|||||||||
|
Tax equity partner’s investment in the Maple Hill project (3)
|
304
|
-
|
-
|
|||||||||
|
Interest paid
|
(152
|
)
|
(86
|
)
|
(102
|
)
|
||||||
|
Dividend paid to non-controlling interests
|
-
|
-
|
(33
|
)
|
||||||||
|
Repayment of long-term loans from banks and others
|
(144
|
)
|
(74
|
)
|
(1,936
|
)
|
||||||
|
Repayment of long-term loans as part of the acquisition of Gat(4)
|
(303
|
)
|
-
|
-
|
||||||||
|
Repayment of long-term loans from non-controlling interests
|
(123
|
)
|
(89
|
)
|
-
|
|||||||
|
Repayment of debentures
|
(31
|
)
|
(20
|
)
|
(19
|
)
|
||||||
|
Repayment of other long‑term liabilities
|
-
|
-
|
(94
|
)
|
||||||||
|
Payment for derivative financial instruments, net
|
9
|
(3
|
)
|
(45
|
)
|
|||||||
|
Repayment of principal in respect of lease liabilities
|
(9
|
)
|
(8
|
)
|
(6
|
)
|
||||||
|
Net cash provided by financing activities
|
1,817
|
986
|
997
|
|||||||||
|
Net increase in cash and cash equivalents
|
146
|
91
|
484
|
|||||||||
|
Balance of cash and cash equivalents at the beginning of the year
|
849
|
731
|
200
|
|||||||||
|
Effect of exchange rate fluctuations on cash and cash
equivalent balances |
12
|
27
|
47
|
|||||||||
|
Balance of cash and cash equivalents at the end of the year
|
1,007
|
849
|
731
|
|||||||||
| 1. |
For further details, see Note 16B1, 16B4, 16B5.
|
| 2. |
For further details – see Note 25A1.
|
| 3. |
For further details, see Note 28D.
|
| 4. |
For further details – see Note 25E1.
|
|
Loans from banks and financial institutions
|
Loans from non‑controlling interests
|
Debentures
|
Financial instruments designated for hedging
|
|||||||||||||
|
NIS million
|
||||||||||||||||
|
Liabilities (assets) as at January 1, 2023
|
1,817
|
437
|
1,854
|
(57
|
)
|
|||||||||||
|
Changes arising from cash flows:
|
||||||||||||||||
|
Proceeds for derivative financial instruments
|
-
|
-
|
-
|
9
|
||||||||||||
|
Receipt of loans, net
|
1,473
|
110
|
-
|
-
|
||||||||||||
|
Repayment of debentures and loans
|
(144
|
)
|
(123
|
)
|
(31
|
)
|
-
|
|||||||||
|
Repayment of loans as part of the acquisition of Gat
|
(303
|
)
|
-
|
-
|
-
|
|||||||||||
|
Interest paid
|
(112
|
)
|
(2
|
)
|
(23
|
)
|
-
|
|||||||||
|
Total changes arising from cash flows
|
914
|
(15
|
)
|
(54
|
)
|
9
|
||||||||||
|
First-time consolidation of limited partnership
|
303
|
-
|
-
|
-
|
||||||||||||
|
Effect of changes in foreign currency exchange rates
|
(2
|
)
|
8
|
-
|
(1
|
)
|
||||||||||
|
Interest expenses
|
174
|
26
|
46
|
-
|
||||||||||||
|
Linkage differences
|
15
|
-
|
33
|
(11
|
)
|
|||||||||||
|
Changes in fair value, application of hedge accounting and other
|
38
|
(2
|
)
|
(26
|
)
|
8
|
||||||||||
|
Total changes arising from non-cash activity
|
528
|
32
|
53
|
(4
|
)
|
|||||||||||
|
Liabilities (assets) as at December 31, 2023
|
3,259
|
454
|
1,853
|
(52
|
)
|
|||||||||||
|
Loans from banks and financial institutions
|
Loans from non‑controlling interests
|
Debentures
|
Financial instruments designated for hedging
|
|||||||||||||
|
NIS million
|
||||||||||||||||
|
Liabilities as at January 1, 2022
|
1,520
|
434
|
1,824
|
(26
|
)
|
|||||||||||
|
Changes arising from cash flows:
|
||||||||||||||||
|
Payment for derivative financial instruments
|
-
|
-
|
-
|
(3
|
)
|
|||||||||||
|
Receipt of loans, net
|
282
|
46
|
-
|
-
|
||||||||||||
|
Repayment of debentures and loans
|
(74
|
)
|
(89
|
)
|
(20
|
)
|
-
|
|||||||||
|
Interest paid
|
(38
|
)
|
(7
|
)
|
(40
|
)
|
-
|
|||||||||
|
Total changes arising from cash flows
|
170
|
(50
|
)
|
(60
|
)
|
(3
|
)
|
|||||||||
|
Effect of changes in foreign currency exchange rates
|
39
|
29
|
-
|
(2
|
)
|
|||||||||||
|
Interest expenses
|
68
|
24
|
40
|
-
|
||||||||||||
|
Linkage differences
|
24
|
-
|
50
|
(18
|
)
|
|||||||||||
|
Changes in fair value, application of hedge accounting and other
|
(4
|
)
|
-
|
-
|
(8
|
)
|
||||||||||
|
Total changes arising from non-cash activity
|
127
|
53
|
90
|
(28
|
)
|
|||||||||||
|
Liabilities (assets) as at December 31, 2022
|
1,817
|
437
|
1,854
|
(57
|
)
|
|||||||||||
|
Loans from banks and financial institutions
|
Loans from non‑controlling interests
|
Debentures
|
Financial instruments designated for hedging
|
|||||||||||||
|
NIS million
|
||||||||||||||||
|
Liabilities as at January 1, 2021
|
1,979
|
1
|
980
|
35
|
||||||||||||
|
Changes arising from cash flows:
|
||||||||||||||||
|
Payment for derivative financial instruments
|
-
|
-
|
-
|
(45
|
)
|
|||||||||||
|
Issuance of debentures and receipt of loans, net
|
666
|
421
|
842
|
-
|
||||||||||||
|
Repayment of debentures and loans
|
(1,936
|
)
|
-
|
(19
|
)
|
-
|
||||||||||
|
Interest paid
|
(81
|
)
|
-
|
(20
|
)
|
-
|
||||||||||
|
Total changes arising from cash flows
|
(1,351
|
)
|
421
|
803
|
(45
|
)
|
||||||||||
|
First-time consolidation of CPV Group
|
556
|
-
|
-
|
39
|
||||||||||||
|
Effect of changes in foreign currency exchange rates
|
(19
|
)
|
(5
|
)
|
-
|
-
|
||||||||||
|
Interest expenses
|
91
|
14
|
23
|
-
|
||||||||||||
|
Linkage differences
|
34
|
-
|
18
|
(25
|
)
|
|||||||||||
|
Changes in fair value, application of hedge accounting and other
|
230
|
3
|
-
|
(30
|
)
|
|||||||||||
|
Total changes arising from non-cash activity
|
892
|
12
|
41
|
(16
|
)
|
|||||||||||
|
Liabilities (assets) as at December 31, 2021
|
1,520
|
434
|
1,824
|
(26
|
)
|
|||||||||||
|
|
1. |
The Company - OPC Energy Ltd.
|
|
|
2. |
The Group - the Company and its investees.
|
|
|
3. |
Consolidated companies/subsidiaries - companies, including partnerships, whose financial statements are fully consolidated, whether directly or indirectly, in the Company’s
financial statements, specifically: (1) In Israel: OPC Israel, OPC Hadera Expansion Ltd. (hereinafter - the “Hadera 2”), AGS Rotem Ltd. (hereinafter - “Rotem 2”), Gnrgy Ltd. (hereinafter - “Gnrgy”), OPC Power Plants Ltd. (hereinafter -
“OPC Power Plants”), OPC Rotem Ltd. (hereinafter - “Rotem”), OPC Hadera Ltd. (hereinafter - “Hadera”), Zomet Energy Ltd. (hereinafter - “Zomet”), OPC Sorek 2 Ltd. (hereinafter - “Sorek 2”) and OPC Gat Power Plant - Limited Partnership
(hereinafter - the “Gat Partnership”). (2) In the USA, the Company holds - through ICG Energy Inc (hereinafter - “ICG Energy”) - OPC Power Ventures LP (hereinafter - “OPC Power”), and OPC Power holds the CPV Group, that wholly-owns, among
other things, CPV Keenan II Renewable Energy Company, LLC (hereinafter - “Keenan”), CPV Maple Hill Solar, LLP (hereinafter - “Maple Hill”), CPV Stagecoach Solar, LLC (hereinafter - “Stagecoach”), CPV Backbone Solar, LLC (hereinafter -
“Backbone”), and Mountain Wind Holdings, LLC (hereinafter - “Mountain Wind”).
|
|
|
4. |
Investees - consolidated companies and companies, including a partnership or joint venture, the Company’s investment in which is included, directly or indirectly, in the
financial statements based on the equity method, specifically: CPV Fairview, LLC (hereinafter - “Fairview”), CPV Maryland, LLC (hereinafter - “Maryland”), CPV
Shore Holdings, LLC (hereinafter - “Shore”), CPV Towantic, LLC (hereinafter - “Towantic”), CPV Valley Holdings, LLC (hereinafter - “Valley”) and CPV Three Rivers, LLC (hereinafter - “Three Rivers”).
|
|
|
5. |
Related parties - as defined in IAS 24 (2009), Related Party Disclosures.
|
|
|
6. |
Interested parties - as defined in Paragraph (1) of the definition of an “interested party” in a corporation in Section 1 of the Israel Securities Law, 1968.
|
|
|
A. |
Statement of compliance with International Financial Reporting Standards (IFRS)
|
|
|
B. |
Functional and presentation currency
|
|
|
C. |
Basis of measurement
|
|
|
D. |
The operating cycle period
|
|
|
E. |
Use of estimates and judgments
|
|
|
1. |
Expected useful life of property, plant and equipment
|
|
|
2. |
Allocation of acquisition costs
|
|
|
3. |
Recoverable amount of cash-generating units that include goodwill and testing for indications of impairment of non-financial assets, including investments in
equity-accounted associates
|
|
|
3. |
Recoverable amount of cash-generating units that include goodwill and testing for indications of impairment of non-financial assets, including investments in
equity-accounted associates (cont.)
|
|
|
4. |
Ability to recover development and construction costs of projects under development
|
|
|
1. |
Goodwill
|
|
|
2. |
Subsidiaries
|
|
|
A. |
Business combinations and investment in investees (cont.)
|
|
|
3. |
Non‑controlling interests
|
|
|
4. |
Investment in associates and joint ventures
|
|
|
5. |
Business combinations under common control
|
|
|
1. |
Foreign currency transactions
|
|
|
2. |
Foreign operations
|
|
|
C. |
Financial instruments
|
|
|
2. |
Derivative financial instruments, including hedge accounting
|
|
|
C. |
Financial instruments (cont.)
|
|
|
2. |
Derivative financial instruments, including hedge accounting (cont.)
|
|
|
D. |
Property, plant & equipment
|
|
|
1. |
Recognition and measurement
Property, plant and equipment items are measured at cost less accumulated depreciation.
The cost of property, plant and equipment includes expenditure that is directly attributable to the purchase of the asset. The cost of self-constructed assets includes the cost of materials, direct labor
costs, any additional costs directly attributable to bringing the asset to the location and the condition necessary for it to be capable of operating in the manner intended by management, the estimated cost for decommissioning and
removing the items and restoring the site on which they are located, as well as capitalized borrowing costs. Advance payments made in respect of self-constructed assets are recognized as part of the cost of the said equipment.
The Company recognized in the statement of income, all development costs in respect of projects that it develops until a stage at which, in the management’s opinion, the feasibility of construction of the
project has been proven. From the stage at which the project is feasible, the development costs and subsequently the construction costs are capitalized to the project costs. A project is considered feasible when the Company’s management
believes that the likelihood of the project materializing and generating future economic benefits is greater than the likelihood that it will not materialize.
Purchased software that is integral to the functionality of the related equipment is recognized under the cost of that equipment.
Spare parts, auxiliary equipment, emergency inventory and backup equipment are classified as property, plant and equipment when they meet the definition of property, plant and equipment under IAS 16,
Property, Plant and Equipment.
When major parts of a property, plant and equipment item (including costs of periodic tests) have different useful lives, they are accounted for as separate items (major components) of property, plant and
equipment.
The Company has BOT service concession arrangements in accordance with the provisions of IFRIC 12 (hereinafter - the “Interpretation”); for each arrangement, the Company assesses whether it falls within the
scope of the Interpretation. When the grantor does not control the arrangement, the Company classifies the infrastructure, which is the subject matter of the arrangement, as property, plant & equipment in accordance with the
provisions of IAS 16.
|
|
|
2. |
Compensation in respect of delay in the construction of a power plant
In cases where the Group is entitled to compensation in respect of delay in the construction of a power plant, the Group assesses the economic substance of the compensation. If the compensation is intended
to cover losses incurred to the Company in practice, or loss of income, it is recognized in profit and loss. On other cases, the compensation amount is generally offset against the cost of property, plant and equipment.
|
|
|
D. |
Property, plant & equipment (cont.)
|
|
|
1. |
Recognition and measurement (cont.)
|
|
|
3. |
Depreciation
Depreciation is a systematic allocation of the depreciable amount of an asset over its useful life. The amortizable amount is the cost of the asset, or another amount that replaces the cost, less its
residual value. An asset is depreciated from the date it is ready for use, meaning the date it reaches the location and condition required for it to operate in the manner intended by management.
Amortization is recognized in the income statement (unless included in the carrying amount of another asset) on a straight-line basis over the estimated useful life of each part of the property, plant and
equipment items, since this method reflects the expected consumption pattern of the future economic benefits inherent in the asset in the best way possible.
Estimates regarding depreciation methods, useful life and residual value are reviewed at the end of each reporting year and adjusted as needed.
The estimated useful life of the principal assets (including in associates) for the current period is as follows:
|
|
Power plants
|
23 - 40 years
|
| Maintenance work |
1.5 - 15 years
|
|
Roads and buildings
|
23 - 30 years
|
|
Back up diesel fuel
|
by consumption
|
|
Freehold land is not depreciated.
|
|
|
|
E. |
Intangible assets
|
|
|
1. |
Goodwill
Goodwill resulting from the acquisition of subsidiaries is presented under intangible assets. For information regarding measurement of goodwill upon initial recognition, see Section A1 above.
In subsequent periods, goodwill is measured at cost less accumulated impairment losses. For further details, see Notes 12B, 12C and 12D.
|
|
|
2 |
Other intangible assets
Other intangible assets acquired by the Group that have a defined useful life are measured at cost less amortization.
|
|
|
3. |
Amortization
Amortization is the systematic allocation of the amortizable amount of an intangible asset over its useful life. The amortizable amount is the cost of the asset, less its residual value.
Amortization is recognized in the income statement on a straight-line basis, over the estimated useful lives of the intangible assets from the date they are available for use, since these methods most
closely reflect the expected pattern of consumption of the future economic benefits best embodied in each asset. Goodwill is not amortized systematically unless tested for impairment at least once a year.
The estimated useful life for the current period of PPAs in the renewable energy segment in the USA is 10-17 years, which reflects the remaining agreement period from the acquisition date.
Estimates regarding the amortization method and the useful life are reviewed at the end of each reporting year and adjusted as needed.
|
|
|
F. |
Impairment
|
|
|
G. |
Employee benefits
|
|
|
H. |
Income
|
|
|
1. |
Income from the sale of electricity and steam to private customers, which are recognized in the period in which the electricity was supplied, and in accordance with the price set in the
agreements with the customers.
|
|
|
2. |
Income from provision of power plants’ capacity are recognized over the period during which capacity was provided.
|
|
|
3. |
Income from provision of services, including asset management services to power plants in the USA, according to the service provision rate.
|
|
|
I. |
Finance income and expenses
|
|
|
J. |
Expenses for income tax
|
|
|
J. |
Expenses for income tax (cont.)
|
|
|
K. |
Agreements with the tax equity partner
|
|
|
L. |
Capitalization of borrowing costs
|
|
|
M. |
Leases
|
|
|
1. |
Leased assets and lease liabilities
|
|
|
2. |
Lease term
|
|
|
3. |
Amortization of right-of-use asset
|
|
|
• |
Land 19 - 49 years
|
|
|
• |
Other 12 - 16 years
|
|
|
N. |
New standards and interpretations not yet adopted
|
|
|
• |
The Amendment, together with the subsequent amendment to IAS 1 (see below) replaces certain classification requirements of current or non-current liabilities. For example, pursuant to the
amendment, a liability will be classified as non‑current if an entity has the right to defer the payment for a period of at least 12 months after the reporting period, which is “substantive” and exists at the end of the reporting period.
|
|
|
• |
The subsequent amendment, as published in October 2022, stipulated that financial covenants, which an entity is required to comply with subsequent to the reporting date, shall not affect
the classification of a liability as current or non-current.
|
|
|
• |
Furthermore, the subsequent amendment added disclosure requirements for liabilities that are subject to compliance with financial covenants within 12 months after the reporting date, such
as disclosure regarding the nature of the financial covenants, the date on which the entity is required to comply with them, and facts and circumstances indicating that an entity will find it difficult to comply with the covenants.
|
|
|
• |
In addition, the amendment clarified that a conversion right of a liability will affect its classification as current or non‑current, unless the conversion component is capital-based.
|
|
|
N. |
New standards and interpretations not yet adopted (cont.)
|
|
|
A. |
Trade and other receivables
|
|
|
B. |
Derivative financial instruments
|
|
|
C. |
Non-derivative financial liabilities
|
|
|
D. |
Share-based compensation transactions
|
|
|
E. |
Determining the recoverable amount of cash-generating units that include goodwill using a fair value model net of costs to sell
|
|
|
A. |
Cash and cash equivalents with banks
|
|
As at December 31
|
||||||||||||
|
Nominal interest
|
2023
|
2022
|
||||||||||
|
December 31, 2023
|
NIS million
|
NIS million
|
||||||||||
|
Current account balances
|
522
|
327
|
||||||||||
|
Deposits
|
4.8
|
%
|
485
|
522
|
||||||||
|
1,007
|
849
|
|||||||||||
|
|
B. |
Short-term bank deposits
|
|
As at December 31
|
||||||||||||
|
Nominal interest
|
2023
|
2022
|
||||||||||
|
December 31, 2023
|
NIS million
|
NIS million
|
||||||||||
|
Short term deposits
|
-
|
-
|
125
|
|||||||||
|
As at December 31
|
||||||||
|
2023
|
2022
|
|||||||
|
NIS million
|
NIS million
|
|||||||
|
Stated in current assets
|
||||||||
|
Restricted cash and short-term deposits (1)
|
2
|
36
|
||||||
|
Stated in non‑current assets
|
||||||||
|
Cash and long-term restricted deposits (2)
|
59
|
53
|
||||||
|
As at December 31
|
||||||||
|
2023
|
2022
|
|||||||
|
NIS million
|
NIS million
|
|||||||
|
Receivables in respect of sale of ITC grant (1)
|
270
|
-
|
||||||
|
Deposits to a third party for collaterals (2)
|
14
|
125
|
||||||
|
Prepaid expenses
|
45
|
33
|
||||||
|
Institutions
|
30
|
16
|
||||||
|
Receivables in respect of gas agreement (3)
|
18
|
-
|
||||||
|
Other
|
27
|
23
|
||||||
|
404
|
197
|
|||||||
|
|
(1) |
For further details regarding an agreement for the sale of ITC grant as part of an arrangement with the Tax Equity Partner in the Maple Hill project, see Note 28D.
|
|
|
(2) |
The balance as of December 31, 2022 mainly includes a collateral provided to secure electricity margin hedge transactions in Valley at the total amount of approx. NIS 70
million (USD 20 million), and collateral provided in connection with renewable energy projects under development in the USA, at a total amount of approx. NIS 52 million (approx. USD 15 million). It is noted that as of December 31, 2023,
transactions for hedging the electricity margins in Valley are carried out in accordance with the exposure management policy of CPV Group (for further details see Note 23), while using dedicated credit facilities in the project (which
were extended as part of the amendment and extension of the long-term financing agreement in June 2023; for further details see Note 26D). In addition, most of the collaterals that were provided in connection with renewable energy
projects under development in the USA were released against the utilization of bank credit facilities, which are backed with the Company’s guarantee (for further details, see Note 16C).
|
|
|
(3) |
For additional details – see Note 28C3.
|
|
As at December 31
|
||||||||
|
2023
|
2022
|
|||||||
|
NIS million
|
NIS million
|
|||||||
|
Subordinate long-term loans to Valley (1)
|
109
|
18
|
||||||
|
Payments to customers (2)
|
23
|
25
|
||||||
|
Deferred finance expenses (3)
|
28
|
19
|
||||||
|
Deposits in respect of provision of collateral to a third party
|
17
|
8
|
||||||
|
Other
|
13
|
12
|
||||||
|
190
|
82
|
|||||||
|
|
(1) |
For further details, see Note 26D3.
|
|
|
(2) |
The balance represents compensation paid to customers in previous years due to a delay in the commercial operation date of the Hadera Power Plant, and participation in
Infinya Ltd.’s costs.
|
|
|
(3) |
The Group has financing agreements and credit facilities under financing agreements as stated in Note 16B, under which, various fees were paid such as financial closing fee
and periodic fee in respect of an unutilized credit facilities (hereinafter - the “Fees”). The fees and commissions are carried to the balance of the loans from banks in accordance with the rate of withdrawal from the Financing
Agreements, and are part of the effective interest rate.
|
|
|
A. |
Composition
|
|
Active power plants and ancillary equipment
|
Power plants under construction and development
|
Land and other assets (1)
|
Advances on account of property, plant and equipment
|
Total
|
||||||||||||||||
|
NIS million
|
NIS million
|
NIS million
|
NIS million
|
NIS million
|
||||||||||||||||
|
Cost
|
||||||||||||||||||||
|
Balance as at January 1 2022
|
2,650
|
1,273
|
376
|
37
|
4,336
|
|||||||||||||||
|
Additions
|
62
|
624
|
23
|
110
|
819
|
|||||||||||||||
|
Derecognitions
|
(44
|
)
|
(7
|
)
|
(11
|
)
|
-
|
(62
|
)
|
|||||||||||
|
Effect of changes in exchange rates
|
12
|
52
|
2
|
4
|
70
|
|||||||||||||||
|
Balance as at December 31, 2022
|
2,680
|
1,942
|
390
|
151
|
5,163
|
|||||||||||||||
|
Acquisitions as part of a business combination
|
1,035
|
-
|
88
|
23
|
1,146
|
|||||||||||||||
|
Additions
|
15
|
994
|
92
|
(68
|
)
|
1,033
|
||||||||||||||
|
Derecognitions
|
(16
|
)
|
(41
|
)
|
(33
|
)
|
-
|
(90
|
)
|
|||||||||||
|
Classification from assets under construction due to commercial operation
|
1,826
|
(1,860
|
)
|
34
|
-
|
-
|
||||||||||||||
|
Effect of changes in exchange rates
|
2
|
17
|
-
|
1
|
20
|
|||||||||||||||
|
Balance as at December 31, 2023
|
5,542
|
1,052
|
571
|
107
|
7,272
|
|||||||||||||||
|
Accumulated depreciation
|
||||||||||||||||||||
|
Balance as at January 1 2022
|
689
|
-
|
53
|
-
|
742
|
|||||||||||||||
|
Depreciation per year
|
128
|
-
|
13
|
-
|
141
|
|||||||||||||||
|
Derecognitions
|
(44
|
)
|
-
|
-
|
-
|
(44
|
)
|
|||||||||||||
|
Balance as at December 31, 2022
|
773
|
-
|
66
|
-
|
839
|
|||||||||||||||
|
Depreciation per year (2)
|
192
|
-
|
15
|
-
|
207
|
|||||||||||||||
|
Derecognitions
|
(16
|
)
|
-
|
(1
|
)
|
-
|
(17
|
)
|
||||||||||||
|
Balance as at December 31, 2023
|
949
|
-
|
80
|
-
|
1,029
|
|||||||||||||||
|
Amortized balance as at December 31, 2023
|
4,593
|
1,052
|
491
|
107
|
6,243
|
|||||||||||||||
|
Amortized balance as at December 31, 2022
|
1,907
|
1,942
|
324
|
151
|
4,324
|
|||||||||||||||
|
Amortized balance as at January 1, 2022
|
1,961
|
1,273
|
323
|
37
|
3,594
|
|||||||||||||||
|
|
A. |
Composition (cont.)
|
|
|
(1) |
Includes land owned by the Gat Power Plant totaling approx. NIS 84 million.
|
|
|
(2) |
Includes a total of approx. NIS 23 million in respect of a decision of CPV Group in the third quarter of 2023, not to continue the development a natural gas project with a
capacity of 650 MW, mainly due its wish to focus its attention and resources on projects with technological feasibility for low-carbon electricity generation, such as generation using renewable energy, or generation using carbon capture
technology, and due to considerations pertaining to the project’s current economic feasibility.
|
|
|
B. |
Non-cash purchase of property, plant and equipment
|
|
|
C. |
Significant scheduled and other maintenance works
|
|
|
D. |
Material construction and equipment agreements in respect of projects under construction
|
|
|
D. |
Material construction and equipment agreements in respect of projects under construction (cont.)
|
|
|
1. |
Israel (cont.)
(a) The Zomet Power Plant (cont.)
It is noted that, the Construction Contractor has notified Zomet, the continuity of construction work was affected, inter alia, by the Covid-19 Crisis, in light of the need for equipment and
foreign work teams to arrive, and by delays in the global supply chain of components and equipment required for the project. As of the approval date of the Financial Statements, Zomet is in advanced negotiations with the
Construction Contractor in connection with, among other things, in connection with compensation for failure to meet time tables, where a total of approx. NIS 48 million have not yet been paid, and the guarantees have not yet
been released.
(b) Sorek 2
In May 2020, Sorek 2 (a special-purpose company wholly‑owned by OPC Power Plants) signed an agreement with SMS IDE Ltd. (hereinafter - “IDE”), that won a tender of the State of Israel for the
construction, operation, maintenance and transfer of a seawater desalination facility on the Sorek 2 site, whereby Sorek is to supply equipment, construct, operate, and maintain a (natural gas-fired) energy generation facility
on the site of the Desalination Facility, with a production capacity of approx. 87 MW (hereinafter – the “Generation Facility”). Sorek 2’s engagement with IDE includes, among other things, undertakings by Sorek 2 to construct
the Generation Facility within the time frames set in the agreement (when, among other things, deviation from the time frames may require compensation subject to the provisions of the agreement), and an undertaking to supply
energy at a certain capacity and scope to the desalination facility over a period that will end 25 years from the commercial operation date of the desalination facility. At the end of the aforesaid period, ownership of the
Generation Facility will be transferred to the State. To secure Sorek 2’s commitments under the construction agreement of the generation facility, the Company provided IDE guarantees that will remain valid throughout the term
of the construction agreement.
In June 2021, Sorek 2 contracted with BHI CO. Ltd. a South Korean-owned corporation that will serve as the project’s construction contractor entered into a “lump sum turn-key” EPC agreement, under
which the Construction Contractor will build the said generation facility, all in accordance with the milestones, terms and dates set in relation to each of the agreement’s components. An IDE group corporation is also a party
to the Construction Agreement (in its capacity as the commissioning party), under which systems are supplied to the desalination facility, for which the said corporation is required to pay.
Sorek 2’s share in the amount payable to the Construction Contractor is estimated at approx. USD 42 million (as of the signing date of the agreement); this amount also includes the amount payable
for the purchase of the gas turbines.1 The consideration as per the agreement is paid in various foreign currencies, specifically the USD and the EUR. In addition, the construction agreement includes provisions that are
generally accepted in agreements of this type, including with regard to capped agreed compensation in respect of delays, non-compliance with execution and availability requirements; the agreement also sets the scope of
liability and requirements for provision of guarantees in the various stages of the project.
|
|
|
D. |
Material construction and equipment agreements in respect of projects under construction (cont.)
|
|
|
1. |
Israel (cont.)
(b) Sorek 2 (cont.)
It should be noted that the Construction Contractor served Sorek 2 with a force majeure notice following the outbreak of the War, and Sorek 2 served on its behalf a force majeure
notice to IDE.
|
|
|
2. |
Renewable energies in the USA
(a) The Maple Hill project
Maple Hill entered into a number of agreements with suppliers and international contractors in relation to the construction of the project: (1) Engineering, procurement and
construction agreement (EPC). Pursuant to the agreement (as amended from time to time), the Construction Contractor is to plan and construct the required components for the power plant in order to integrate all the required equipment
into the power plant. The total consideration to the contractor is a fixed amount of approx. NIS 330 million (approx. USD 91 million) (as of the agreement signing date), and it was paid in accordance with a milestone schedule, subject
to changes in orders; (2) agreement to acquire, supply and install a transformer in consideration for an immaterial amount.
The commercial operation period of the project commenced in November 2023.
(b) The Stagecoach project
In May 2022., an engineering, procurement and construction EPC agreement was signed with the project's construction contractor. In accordance with the agreement (as amended from time
to time), the contractor is required to plan, conduct engineering work, purchase, install, build, test, and operate the solar project in full based on a secured completion on the set date (Turnkey). The total consideration payable to
the contractor as of the report date was set at a fixed amount of approx. NIS 181 million (approx. USD 50 million) that will be paid in accordance with milestones.
(c) The Backbone project
In June 2023, CPV Group entered into an EPC agreement with a construction contractor in respect of the construction of a solar-powered project with a capacity of 179 MWdc located in
Maryland, United States. In accordance with the agreement, the contractor is required to plan, purchase, install, build, test, and operate the solar project in full, on a turnkey basis. As of the Report date, the total consideration
in the construction agreement was set at a fixed amount of approx. NIS 640 million (approx. USD 175 million), which will be paid in accordance with the milestones set in the construction agreement.
(d) Other projects under development
In October 2021, the CPV Group entered into a transaction to acquire all rights in two solar projects under development, located in the PJM market. In consideration for the purchase
of the rights in the two projects, as of the transaction completion date, the seller was paid a total of approx. NIS 33 million (approx. USD 9 million). In addition, the transaction includes a contingent consideration mechanism, such
that the total consideration in respect of the transaction (plus the amount that was paid on completion date as stated above) may amount to approx. NIS 167 million (approx. USD 46 million). The contingent consideration will be paid in
installments, subject to meeting the Projects’ development milestones, which - as of the Report date - have yet to be met.
|
|
|
D. |
Material construction and equipment agreements in respect of projects under construction (cont.)
|
|
|
2. |
Renewable energies in the USA (cont.)
(e) Agreements for the purchase of solar panels
In March 2022, CPV Group entered into a master agreement for the purchase of solar panels (as amended from time to time) with a total capacity of approx. 530 MW (hereinafter - the
“Agreement”). Pursuant to the agreement (as amended from time to time), the solar panels will be supplied in accordance with orders to be placed with the supplier by the CPV Group in 2025-2023. The CPV Group has an early termination
right in accordance with the dates set in the agreement, by paying a proportionate share of the consideration payable to the supplier, as derived from the early repayment date. Furthermore, the agreement sets, among other things,
provisions regarding the panels’ quantities and model and the manner of their supply, as well as provisions regarding the termination of the agreement. The total consideration in respect of the (revised) agreement may amount to
approx. NIS 672 million (approx. USD 185 million) (assuming that the maximum quantity specified in the agreement will be purchased).
|
|
|
A. |
Composition of right‑of‑use assets and long-term deferred expenses
|
|
Land (b)
|
Other (1)
|
Long-term deferred expenses (2)
|
Total
|
|||||||||||||
|
NIS million
|
NIS million
|
NIS million
|
NIS million
|
|||||||||||||
|
Balance as at January 1 2022
|
255
|
47
|
104
|
406
|
||||||||||||
|
Additions
|
27
|
3
|
27
|
57
|
||||||||||||
|
Depreciation
|
(12
|
)
|
(9
|
)
|
(3
|
)
|
(24
|
)
|
||||||||
|
Classification in respect of operation of PRMS facility
|
-
|
31
|
(31
|
)
|
-
|
|||||||||||
|
Effect of changes in exchange rates
|
3
|
2
|
-
|
5
|
||||||||||||
|
Balance as at December 31, 2022
|
273
|
74
|
97
|
444
|
||||||||||||
|
Additions
|
122
|
19
|
117
|
258
|
||||||||||||
|
Acquisitions as part of a business combination
|
-
|
9
|
-
|
9
|
||||||||||||
|
Remeasurement (3)
|
(46
|
)
|
-
|
-
|
(46
|
)
|
||||||||||
|
Derecognitions
|
-
|
(1
|
)
|
-
|
(1
|
)
|
||||||||||
|
Depreciation
|
(14
|
)
|
(13
|
)
|
(5
|
)
|
(32
|
)
|
||||||||
|
Effect of changes in exchange rates
|
(1
|
)
|
-
|
-
|
(1
|
)
|
||||||||||
|
Balance as at December 31, 2023
|
334
|
88
|
209
|
631
|
||||||||||||
|
|
(1) |
Mainly includes costs paid to Israel Natural Gas Lines Ltd. with respect to the construction of the PRMS Facilities for the Hadera and Zomet power plants and leases on
offices in Israel and the USA.
|
|
|
(2) |
Mainly in respect of payments to the Israel Electric Corporation in respect of infrastructure for electricity transmission lines, and payments in respect of the Ramat Beka
project as described in Section B(1)f below.
|
|
|
(3) |
For further details, see Note B1(e).
|
|
|
B. |
Agreements
|
|
|
1. |
Israel
(a) The Rotem Power Plant
Rotem has a lease agreement for a 5.5 hectare plot of land in Mishor Rotem. Under the conditions set out in the agreement, the lease is for a term of 49 years as
from November 4, 2010, with an option to extend the lease for one additional term of 49 years, subject to advance notice. In the event of rezoning of the plot during the Lease Term, the Lessor will not be required to extend the Lease
Term. The lessor may cancel the lease agreement in events defined in the Agreement as a fundamental breach.
(b) Rotem 2
Rotem 2 has a lease agreement for plots with a total area of approx. 5.5 hectares. Land adjacent to the Rotem Power Plant. Under the conditions set out in the
agreement, the lease is for a term of 49 years as from March 9, 2014, with an option to extend the lease for one additional term of 49 years, subject to the terms and conditions of the agreement. The lessor may cancel the lease
agreement in events defined in the Agreement as a fundamental breach. In August 2022, an extension was received from the Israel Lands Administration (hereinafter - “ILA”) an extension for the period to complete the construction work
on the land in accordance with the lease agreement (free of charge), up until March 9, 2025, in consideration for the payment of an amount, which is immaterial to the Company.
It should be noted that as part of a meeting of the plenum of the National Infrastructures Committee (hereinafter - “NIC”) of December 2021, the NIC plenum
decided to reject the plan promoted by the Company/Rotem 2 for the construction of natural gas-fired power plant on the said land. As part of the resolution it was noted that the National Infrastructures Committee advises Rotem 2 to
check whether the area may be used for a different technology, and if relevant contact the government in order to amend the authorization. As of the approval date of the financial statements, Rotem 2 assesses the options as to the
potential ways of utilizing the area including the building of a power plant using alternative technologies.
(c) The Hadera Power Plant
Hadera leases land covering approx. 2.8 hectares (including an emergency road) from Infinya. The monthly rent amounts to approx. NIS 118 thousand (linked to the
CPI), subject to adjustments in certain cases, and the lease term is 24 years and 11 months starting from December 2018. The agreement grants the parties a termination right, inter alia, in various default events, and grants Infinya a
termination right in the event of a material breach by Hadera, including breach of the commitment to pay rent, subject to remediation periods and as determined in the agreement.
(d) Hadera 2
Hadera 2 has an agreement with Infinya to lease of a plot of approx. 6.8 hectares adjacent to the Hadera Power Plant, whereby an annual option was awarded to
Hadera 2 to exercise a lease agreement regarding land designated for the construction of a power plant, for an average payment of approx. NIS 6 million per year (assuming that the option was renewed on each exercise of the entire
option period as stated above). The option may be renewed every year for a period of up to 5 years (end of 2027), under the terms set in the agreement. In December 2023, Hadera 2 renewed the option in respect of 2024 and paid approx.
NIS 8 million.
|
|
|
B. |
Agreements (cont.)
|
|
|
1. |
Israel (cont.)
(d) Hadera 2 (cont.)
If the option is exercised and a lease agreement will be signed, it will be for a period of 24 years and 11 months, commencing on exercise date. Furthermore, it
provided that the Company will bear all the fees, taxes and payments that will be imposed with regard to the construction of a power plant on the leased property.
In May 2023, the Government decided not to approve NIP 20B - a plan for the construction of a power plant for the generation of electricity using natural gas on
the said land, and return it to be discussed by the National Infrastructures Committee. Further to what is stated above, Hadera 2 submitted a petition for the issuance of an order nisi to provide reasons for the non-approval of NIP
20B, which was dismissed in limine on July 19, 2023. As of the Financial Statements approval date, the Company continues to promote NIP plan 20B, and awaits the discussion as stated above.
(e) Zomet Power Plant
In January 2020, ILA approved the allotment of an area of approx. 8.5 hectares for construction of a power plant for electricity generation by Zomet. In January
2020, the ILA and Kibbutz Netiv HLH (hereinafter - the “Kibbutz”) signed a development agreement for the Land, effective until November 5, 2024, and after fulfillment of its terms, a lease agreement will be signed for a term of 24
years and 11 months from approval of the transaction, namely until November 4, 2044. The lease contract allows the extension of the lease term subject to the extension of the electricity generation license, and accordingly subject to
ILA’s procedures that will be in effect at that time.
In addition, in January 2020, Zomet and the Kibbutz signed an agreement of principles for the founding of a joint corporation, which was established
by Zomet and the Kibbutz as a limited partnership,2 to which the rights to the Land were transferred upon approval of the transaction by ILA in May 2020.
The consideration for the rights of the Kibbutz to the land under which a development agreement with the ILA can be signed amounted to NIS 30 million. In February 2020, an updated lease agreement was also signed according to which
the Joint Corporation, as the owner of the Land, will lease the Land to Zomet in favor of the project.
In January 2020, the ILA issued a financial specification of the capitalization fees, according to which the value of the Land (excluding development expenses)
was estimated at approx. NIS 207 million (hereinafter - the “Initial Assessment"). In order to complete the Land transaction, in January 2020 Zomet settled the payment of 75% of the Initial Assessment on behalf of the Joint
Corporation and through the Kibbutz. The Agreement in Principle clarified that the Kibbutz acted as a trustee of the Joint Corporation when it signed the Development Agreement with the ILA, and acted as an agent of the Joint Company
when it signed the financial specification. Furthermore, the Company provided the remaining balance (25%) of the Initial Assessment as a bank guarantee in favor of ILA (effective as of the report date); for further details regarding
the guarantee, see Note 16C).
|
|
|
B. |
Agreements (cont.)
|
|
|
1. |
Israel (cont.)
|
|
|
B. |
Agreements (cont.)
|
|
|
2. |
Renewable energies in the USA
|
|
|
C. |
Lease liability
|
|
|
A. |
Composition
|
|
Goodwill (1)
|
PPA (2)
|
Other
|
Total
|
|||||||||||||
|
NIS million
|
NIS million
|
NIS million
|
NIS million
|
|||||||||||||
|
Cost
|
||||||||||||||||
|
Balance as at January 1 2022
|
370
|
344
|
22
|
736
|
||||||||||||
|
Additions
|
-
|
-
|
36
|
36
|
||||||||||||
|
Effect of changes in exchange rates
|
42
|
44
|
1
|
87
|
||||||||||||
|
Balance as at December 31, 2022
|
412
|
388
|
59
|
859
|
||||||||||||
|
Additions
|
-
|
-
|
51
|
51
|
||||||||||||
|
Acquisitions as part of a business combination
|
295
|
93
|
-
|
388
|
||||||||||||
|
Impairment loss in respect of Gnrgy
|
(23
|
)
|
-
|
-
|
(23
|
)
|
||||||||||
|
Effect of changes in exchange rates
|
13
|
14
|
-
|
27
|
||||||||||||
|
`
|
||||||||||||||||
|
Balance as at December 31, 2023
|
697
|
495
|
110
|
1,302
|
||||||||||||
|
Amortization
|
||||||||||||||||
|
Balance as at January 1 2022
|
-
|
34
|
4
|
38
|
||||||||||||
|
Depreciation per year
|
-
|
35
|
3
|
38
|
||||||||||||
|
Effect of changes in exchange rates
|
-
|
6
|
-
|
6
|
||||||||||||
|
Balance as at December 31, 2022
|
-
|
75
|
7
|
82
|
||||||||||||
|
Depreciation per year
|
-
|
41
|
12
|
53
|
||||||||||||
|
Effect of changes in exchange rates
|
-
|
2
|
-
|
2
|
||||||||||||
|
Balance as at December 31, 2023
|
-
|
118
|
19
|
137
|
||||||||||||
|
Amortized balance as at December 31, 2023
|
697
|
377
|
91
|
1,165
|
||||||||||||
|
Amortized balance as at December 31, 2022
|
412
|
313
|
52
|
777
|
||||||||||||
|
Amortized balance as at January 1, 2022
|
370
|
310
|
18
|
698
|
||||||||||||
|
|
(1) |
As of December 31, 2023 mainly includes balances in respect of: (a) The renewable energy segment of CPV Group at the total amount of approx. NIS 457 million (approx.
USD 126 million). For further details regarding the acquisition of the Mountain Wind project in the reporting period see Note 25E2; (b) the activity of the power plants in Israel (Rotem, Hadera and Gat) as part of the acquisition of the
Gat Power Plant during the reporting period at the total amount of approx. NIS 220 million; for further details, see Note 25E1; (c) Gnrgy at the total amount of approx. NIS 20 million; for further details regarding impairment loss
recorded in respect of goodwill that was recognized in the reporting period, see Section D below.
|
|
|
(2) |
In respect of excess cost in respect of PPAs in the wind farms Keenan and Mountain Wind.
|
|
|
B. |
Annual impairment testing of goodwill of the Renewable Energy segment in the USA
|
|
|
A. |
With regard to projects under commercial operation, construction or development, whose construction is expected to start in the forthcoming year - using the discounted cash
flow method (DCF) by discounting the expected future cash flows of each project, by the weighted average cost of capital (WACC) after tax.
|
|
|
B. |
In relation to the backlog of projects under development, whose construction is expected to start at a later date (including projects under early development stages) - at
estimated fair value per KW, and the likelihood of materialization as a function of the development stages (early/advanced). The fair value per KW was estimated for a typical project by discounting expected future cash flows at the
weighted average cost of capital (WACC) after tax.
|
|
|
A. |
Forecast years - represent the period spanning from 2024 to 2054 and are based on the estimate of the economic life of the power plants and their value as at the end of the forecast
period.
|
|
|
B. |
Market prices and capacity - market prices (electricity, capacity, RECs, etc.) are based on PPAs and market forecasts received from external and independent information sources, taking
into account the relevant area and market for each project and the relevant regulation.
|
|
|
C. |
Estimated construction costs of the projects, and entitlement to tax benefits in respect of projects under construction (ITC or PTC, as applicable).
|
|
|
D. |
The annual long-term inflation rate of 2.2% equals the derived 10-year inflation rate as of the estimate date.
|
|
|
E. |
The WACC - calculated for each material project separately, and ranges between 6% (project with PPAs for sale of the entire capacity) and 7.25%.
|
|
|
C. |
Annual impairment testing of goodwill arising as part of the acquisition of the Gat Power Plant
|
|
|
A. |
EBITDA for 2023 at the total amount of NIS 391 million (which is representative in the Company’s opinion)
|
|
|
B. |
An EV/EBITDA multiple of 11.4, which in the Company’s opinion is representative of power plants such as Rotem, based on the Company’s experience in transactions carried out
in the Israeli market in the field of power plants.
|
|
|
D. |
Annual impairment testing of goodwill arising as part of the acquisition of Gnrgy
|
|
As at December 31
|
||||||||
|
2023
|
2022
|
|||||||
|
NIS million
|
NIS million
|
|||||||
|
Liability to tax equity partner (1)
|
270
|
-
|
||||||
|
Employees and institutions for salaries
|
53
|
51
|
||||||
|
Interest payable
|
18
|
15
|
||||||
|
Profit-sharing plan for CPV Group employees (2)
|
21
|
-
|
||||||
|
Liability for a project under construction
|
-
|
10
|
||||||
|
Other
|
23
|
36
|
||||||
|
|
385
|
112
|
||||||
|
|
(1) |
Undertaking to transfer the proceeds from the sale of ITC grant to the Tax Equity Partner in the Maple Hill project; for further details see Note 28D.
|
|
|
(2) |
For further details, see Note 18C.
|
|
As at December 31
|
||||||||
|
2023
|
2022
|
|||||||
|
NIS million
|
NIS million
|
|||||||
|
Deferred income in respect of ITC grant (1)
|
287
|
-
|
||||||
|
Profit-sharing plan for CPV Group employees (2)
|
68
|
102
|
||||||
|
Liabilities for evacuation, decommissioning, and removal
|
26
|
24
|
||||||
|
Other liabilities
|
18
|
20
|
||||||
|
399
|
146
|
|||||||
|
|
(1) |
For further details regarding an engagement with the Tax Equity Partner in the Maple Hill project, see Note 28D.
|
|
|
(2) |
For further details, see Note 18C.
|
|
|
A. |
Composition
|
|
(1) Current maturities and short-term credit:
|
|
As at December 31
|
||||||||
|
2023
|
2022
|
|||||||
|
NIS million
|
NIS million
|
|||||||
|
Current maturities of long-term loans
|
187
|
92
|
||||||
|
Short-term credit
|
204
|
-
|
||||||
|
391
|
92
|
|||||||
|
(2) Long-term loans from banks and financial institutions:
|
|
As at December 31
|
||||||||
|
2023
|
2022
|
|||||||
|
NIS million
|
NIS million
|
|||||||
|
Loans to Hadera
|
652
|
682
|
||||||
|
Loans to Zomet
|
1,142
|
865
|
||||||
|
Loans to Gat
|
438
|
-
|
||||||
|
Loans to Keenan
|
286
|
313
|
||||||
|
Loans to Mountain Wind
|
265
|
-
|
||||||
|
Loans to finance projects in the US Renewable Energies segment
|
344
|
-
|
||||||
|
Loans in Gnrgy
|
3
|
4
|
||||||
|
Total from banking corporations and financial institutions
|
3,130
|
1,864
|
||||||
|
Net of deferred finance costs
|
(78
|
)
|
(48
|
)
|
||||
|
Less current maturities
|
(187
|
)
|
(92
|
)
|
||||
|
2,865
|
1,724
|
|||||||
|
|
B. |
Additional details
|
|
|
1. |
Project financing agreements in Israel
|
|
Senior debt
financing
agreement |
Hadera
|
Zomet
|
Gat
|
|
Loan provision date
|
July 2016
|
December 2019
|
March 2023
|
|
The financing entities
|
A consortium of lenders headed by Israel Discount Bank Ltd. and Harel Insurance Company Ltd.
|
A syndication of financing entities headed by Bank Hapoalim Ltd.
|
Bank Leumi le-Israel B.M.
|
|
The outstanding principal balance as at December 31, 2023
|
Approx. NIS 652 million.
|
Approx. NIS 1,142 million.
|
Approx. NIS 438 million.
|
|
Principal terms
|
Repayable in quarterly installments, starting from March 25, 2020, with the final repayment date being in 2037 (subject to the stipulated early repayment provisions in
the agreement).
Linkage mechanism: Approx. 67% of the principal is CPI-linked, and approx. 33% of the principal is not CPI-linked. The Group entered into a swap to hedge up to
approx. 70% of the exposure to the CPI.
|
Repayable in quarterly installments, starting from December 25, 2023, with the final repayment date being in 2042.
Zomet has the right to make early repayment of the loans within 6 years after signing the Zomet Financing Agreement, subject to a reduced one-off
payment (without an early repayment fees), provided that up to the early repayment date, the loans were not converted into loans bearing fixed interest or CPI-linked fixed interest, as described below.
Linkage mechanism: The loan principal is not CPI-linked.
|
Repayable in quarterly installments, starting from September 25, 2023, with the final repayment date being May 10, 2039 (subject to the stipulated
early repayment provisions in the agreement).
Linkage mechanism: The loan principal is not CPI-linked.
|
|
|
B. |
Additional details (cont.)
|
|
|
1. |
Project financing agreements in Israel (cont.)
|
|
Senior debt
financing
agreement |
Hadera
|
Zomet
|
Gat
|
|
Interest terms
|
• Annual interest at rates
between 2.4% and approx. 3.9% (for the linked loans) and between 3.6% and approx. 5.4% (for the unlinked loans).
• Repayment in quarterly
installments, starting on March 25, 2020.
|
• Annual interest of
prime + 0.55%.
• Repayment in quarterly
installments, starting on December 25, 2023.
• A mechanism is in place
to convert the loans’ interest from variable interest to fixed NIS interest or CPI-linked interest, provided that the total amount in loans that will be provided at NIS interest will not exceed NIS 750 million. This is carried out
automatically, within 6 years from the agreement’s signing date, or prior to that date at the request of Zomet, or, in certain cases set out in the agreement, at the request of the bank. Such loans that will be converted shall bear NIS
government bond interest, or CPI-linked government bond interest (as defined in the agreement) plus a 2%-3% spread.
|
• Prime interest + a spread of 0.65%.
• Repayment in quarterly
installments, starting on June 25, 2023.
• Conversion from a
variable interest to unlinked fixed interest, in accordance with the conversion mechanism (unlinked interest of government bonds as defined in the agreement + a spread ranging from 2.05% to 2.55%), according to the earliest of: four
years from the date of the first withdrawal or at the Gat Partnership’s discretion, or at the Bank’s discretion, in accordance with the forced conversion mechanism, as stipulated in the agreement.
|
|
Additional credit facilities as of the report date (*)
|
• Working capital facility of NIS 30 million;
• Guarantees facility of NIS 60 million;
• A hedge facility of NIS 68 million.
|
• Working capital
facility and VAT of NIS 25 million;
• A debt service reserve
facility at the total amount of NIS 20 million;
• Guarantees facility of
NIS 15 million;
• A hedge facility in the
amount of USD 5 million;
|
|
(*)
|
The withdrawals from the various facilities are subject to the absence of default events and to compliance with various conditions as is
standard in agreements of this type.
|
|
|
B. |
Additional details (cont.)
|
|
|
1. |
Project financing agreements in Israel (cont.)
|
|
Senior debt
financing
agreement
|
Hadera
|
Zomet
|
Gat
|
|
Collateral and pledges
|
• Liens were placed in
favor of Discount Bank, as a trustee for the collateral on behalf of the Hadera Lenders, on all of Hadera’s existing and future assets, on Hadera’s rights, and on the holdings and rights in Hadera.
|
Liens were provided in favor of Resnick Paz Nevo Trustee Company (PSN) 1950 Ltd. (formerly - Poalim Trust services Ltd.) as a trustee for the
collaterals on behalf of the Lenders, on all of Zomet's existing and future assets, on Zomet’s rights, and on the Company’s holdings and rights in Zomet.
|
• Collateral were provided
on all of the Gat Partnership’s assets and rights in it, including the real estate, bank accounts, insurances, the Gat Partnership’s assets and rights in connection with the Project Agreements (as defined in the agreement). In addition,
a lien was placed on the rights of the entities holding the Gat Partnership.
|
|
Restrictions and undertakings
|
The agreements prescribe certain restrictions and liabilities as is generally accepted in agreements of this type, including:
• Restrictions on assuming
financial debts and providing guarantees;
• Requirement to obtain the
Lender’s approval for engagement in material agreements and other material actions;
• Undertaking in connection
with holding certain reserve funds for maintenance (scheduled and unscheduled) and debt service;3
• The lender was granted veto
rights and other rights in connection with certain decisions as is generally accepted in agreements of this type;
• Certain changes in
ownership;
• As is generally accepted in
project financing, there are certain rights that are exercisable only after obtaining the financing entities’ consent, and certain rights, that the financing entities may oblige the lenders to exercise (reserved discretion);
• Various restrictions on
deviation from the project budgets;
• Restrictions on distribution
and interested party transactions;
• Undertakings to provide
confirmations of compliance with the terms of the agreement, including financial covenants;
• Prohibition on making
material changes such as a merger;
• Undertaking to obtain rating
for the project under circumstances set forth;
• Liabilities in connection
with the operation and maintenance of the project in Zomet in view of the fact that it serves as the project’s operating contractor;
• Cross-default clauses are in
place under certain conditions and circumstances that were set;
|
||
|
|
B. |
Additional details (cont.)
|
|
|
1. |
Project financing agreements in Israel (cont.)
|
|
Senior debt
financing
agreement
|
Hadera
|
Zomet
|
Gat
|
|
Conditions for distribution
|
A distribution by Hadera, as defined in the financing agreement, is subject to a number of conditions that were set in the agreement, including,
among other things:
• Compliance with the following
financial covenants: Historic DSCR, Projected DSCR and LLCR at a minimum rate of 1.25;
• Non-occurrence of a breach
or potential breach;
• Maintaining a minimum
pre-defined cash amount, which is required as part of the amendment to the Hadera Equity Subscription Agreement, which is described below;
• Proven ability to comply
with the take or pay undertakings as per the natural gas supply agreement until the next planned calculation date (as defined in the agreement);
• If the Hadera Power Plant
fails to meet the conditions for generation facilities using cogeneration technology as described in the Cogeneration Regulations, it will be required to provide proof of its ability to meet payments to the Israel Electric Corporation
and the Israeli Electricity Authority as a result of non-compliance with the said conditions;
• No more than two
distributions will be carried out in a 12-month period.
|
Distribution by Zomet (including repayment of shareholder loans), which is defined in the Zomet Financing Agreement, is subject to terms and
conditions outlined in the agreement, including, among other things:
• Compliance with the
following financial covenants: Historic ADSCR, projected ADSCR and LLCR at a minimal rate of 1.2;
• The approved
end-of-construction date (as defined in the agreement) has elapsed, and one quarterly payment was made of the principal and interest payments in respect of the loans comprising the long-term credit facility and the standby credit
facility;
• At least 12 months have
elapsed since the commercial operation date (as defined in the agreement);
• Non-occurrence of a breach
or potential breach;
• Provision of reserve accounts
and third-party guarantee funds at the level set as per the agreement;
• Under certain circumstances,
maintaining minimum cash levels at the amounts set in the financing agreement;
• All the loans provided from
the debt service credit facility, the third-party guarantee facility, and the hedge facility, were repaid in full;
• No more than four
distributions will be carried out per year (and if the emissions permit that applies to the project will include limitations, which - in the opinion of the bank - may reasonably limit the capacity payments to which the project is
eligible according to the tariff approval - no more than one distribution per year).
|
Distributions by the Gat Partnership (as defined in the Gat Financing Agreement, including a repayment of shareholder loans) is subject to a number
of terms and conditions outlined in the agreement, including, among other things:
• Compliance with the
following financial covenants: Historic DSCR, Average Projected DSCR and LLCR at a minimal rate of 1.15;
• A first quarterly
principal and interest payment was made;
• The provisions of the
agreement were complied with;
• No more than four
distributions will be carried out in a one-year period.
|
|
|
B. |
Additional details (cont.)
|
|
|
1. |
Project financing agreements in Israel (cont.)
|
|
Senior debt
financing
agreement
|
Hadera
|
Zomet
|
Gat
|
|
Equity Subscription Agreements
|
The Hadera Equity Subscription Agreement (as amended from time to time) includes various undertakings by the Company to provide equity to Hadera,
including in accordance with the rules of the regulation of the Israeli Electricity Authority (provided that it will not exceed 40% of the project’s normative cost) to pay fees and commissions, hedging agreements, and commitments to
provide a number of guarantees, including guarantees for insolvency scenarios in the event of failure to collect up to NIS 8 million from customers, and additional bank guarantees in certain cases. Furthermore, the Company is required to
comply with certain covenants, as described in Section B6 below. It should be noted that as of the Financial Statements approval date, the Company operates with the financing entities to adjust the financing arrangements to the holdings
structure after the completion of the Veridis transaction.
|
The Zomet Equity Subscription Agreement includes various other undertakings of the Company in connection with the provision of approx. NIS 293
million in equity to Zomet (which was provided in full) as defined in the Zomet Financing Agreement, and additional equity under certain circumstances, including, among other things, where the capital requirements stipulated by law are
revised and up to approx. NIS 50 million in certain scenarios that have an adverse effect on the project (such as failure to obtain certain permits or the placement of certain restrictions on the power plant’s activity), resulting in the
Company’s being required to provide further equity that may also include the entire amounts required to service the debt and fund the remaining project construction and operation expenses, as the case may be. In addition, the Company
undertook to provide, in certain cases, certain additional bank guarantees required for the project, to the extent they are not issued out of the guarantee facility provided under the Zomet Financing Agreement.
|
In March 2023, the Gat Partnership, the Entities Holding the Gat Partnership, including OPC Power Plants and Bank Leumi signed an equity
subscription agreement, under which the said entities made certain undertakings, among other things, in connection with the Gat Partnership's activity, including undertakings to bear 6 months of debt service at the terms set forth in the
said agreement; to provide equity capital; an undertaking to make certain guarantees in favor of third parties in connection with the Gat Power Plant’s activity, to the extent required; certain financial covenants of OPC Power Plants and
other Group companies; payment of certain amounts in connection with the arbitration proceeding between the Gat Partnership and the Operator (as defined in the agreement); bearing capacity payments under certain circumstances
prescribed in the said agreement.
|
|
|
B. |
Additional details (cont.)
|
|
|
2. |
The Group’s credit facilities:
|
|
Facility amount
|
Utilization as of the
report date
|
Utilization immediately prior to the report approval date (March 7, 2024)
|
|||
|
The Company
|
300
|
-
|
-
|
||
|
OPC Israel
|
250
|
200 (1)
|
-
|
||
|
The Company for CPV Group (2)
|
73 (approx.
USD 20 million)
|
Approx. 57 (approx.
USD 16 million)
|
Approx. 57 (approx. USD 16 million)
|
||
|
CPV Group(2)
|
272 (approx.
USD 75 million)
|
Approx. 128 (approx.
USD 35 million)
|
Approx. 135 (approx. USD 37 million)
|
||
|
Total
|
895
|
385
|
192
|
|
|
(1) |
Utilization in cash (short-term credit).
|
|
|
(2) |
For the purpose of letters of credit and bank guarantees. The facilities provided for CPV Group are backed with a Company guarantee.
|
|
|
(3) |
Furthermore, as at the report date and shortly before the approval date of the report, unsecured credit facilities from
banking corporations and financial institutions were utilized in Israel for the purpose of letters of credit and bank guarantees at a total amount of
approx. NIS 320 million and approx. NIS 301 million, respectively. The utilization of unsecured facilities is subject to the discretion of any financing entity on a case by case basis on every utilization request date, and therefore
there is no certainty as to the ability to utilize them at any given time.
|
|
|
B. |
Additional details (cont.)
|
|
|
3. |
Keenan Financing Agreement:
|
|
|
B. |
Additional details (cont.)
|
|
|
4. |
Mountain Wind Financing Agreement:
|
|
|
5. |
Financing agreement for construction in the US Renewable Energies segment:
|
| 5 |
The classification as a “qualifying project” is conditional upon the project’s meeting generally accepted conditions for senior debt financing as part of a non-recourse project financing.
|
|
|
B. |
Additional details (cont.)
|
|
|
5. |
Financing agreement for construction in the US Renewable Energies segment: (cont.)
|
|
Lenders
|
International and Israeli banking corporations (with an option to expand the group of lenders by way of syndication) (hereinafter in this section
- the “Financing Entities”).
|
|
Financing of construction
|
On the signing date of the financing agreement (hereinafter - the “Financial Closing Date), the above maximum Financing of Construction amount was
set in accordance with the projects’ compliance with the scope of leveraging principles, such that each project is required to meet a projected minimum DSCR ratio of 1.3,6 based on the stream of income from PPAs and green
certificates, and 1.8 based on the stream of income from market sales (hereinafter - the “Leveraging Ratios”).7 It should be noted that for each project, the compliance with the Leveraging Ratios will be assessed on the date
of the first withdrawal (and as a condition thereof), and at the end of the completion of construction work (hereinafter - the “Conversion Date”). The Financing of Construction amount that may be
converted on the Conversion Date (if any) into financing for the initial commercial operation period shall be determined in accordance with the assessment of the compliance with the Leveraging Ratios as of that date.
|
|
Conditions for first withdrawal or conversion
|
The conditions for first withdrawal for each qualifying project include, among other things, compliance of the Financing of Construction amount
with the Leveraging Ratios, and the provision of a set minimum equity amount (under certain conditions, surplus amounts may be diverted from a qualifying project in favor of another qualifying project, as described below).
Furthermore, the withdrawal of financing by each project is subject to the relevant project’s compliance with financial covenants that are
generally accepted in project financing, to the submission of withdrawal requests, and to the following:
Financing of Construction: As of the report date, the Maple Hill and Stagecoach projects meet the said conditions (including the above
Leveraging Ratios).
As stated above, on each project’s Conversion Date, the project’s compliance with the Leveraging Ratios will be assessed as a condition for the
conversion of the Financing of Construction into a loan for the initial commercial operation period instead of full repayment of the Financing of Construction amount on that date if it has not been converted.
Letters of credit: - The total amount of letters of credit is based on the project’s needs in accordance with the commercial arrangement,
and on the conversion date - subject to an undertaking to provide a collateral at the amount of the projected debt service in a 6-month period, for each project and in accordance with the provisions of the Financing Agreement.
Bridge Loan is subject to the provision of the tax equity partner’s undertaking as defined in the Financing Agreement. The amount of the
Bridge Loan that may be withdrawn for a qualifying project is limited to up to 98% of the liabilities of the project’s tax equity partner.
|
|
|
B. |
Additional details (cont.)
|
|
|
5. |
Financing agreement for construction in the US Renewable Energies segment: (cont.)
|
|
Final repayment date
|
The earlier of 4 years after the Financial Closing Date or a year after the Conversion Date of the third qualifying project.
|
|
Interest and linkage, other costs
|
The loans for each project bear annual interest based on SOFR plus a margin as follows:
Financing of construction:8 approx. 2%.
Bridge loan: approx. 1.25%.
Letters of credit: Issued for an annual issuance fee as is generally accepted in facilities of this type.
In addition, a facility fee will apply to unutilized amounts as is generally accepted in financing arrangements of this type, and the projects will
bear transaction costs and other fees and commissions, including in connection with the organization of the financing and the syndication.
|
|
Early repayment dates of Financing of Construction (principal and interest)
|
Repayment of principal:
• For each project,
starting on the conversion date of each project (if it is converted), in quarterly installments in accordance with the amortization schedule set in the Financing Agreement, and on the loan repayment date - a single installment of the
outstanding principal balance. If no conversion will be carried out, the repayment date will take place at the end of the construction period.
• For each project, a
cash-sweep mechanism will apply to 50% of the quarterly free cash flow after debt service (the remaining 50% shall be retained as a reserve and may be utilized for another qualifying project subject to compliance with certain
conditions).
The interest will be repaid in monthly or quarterly installments, subject to the Borrower’s discretion.
|
|
Additional material terms and conditions
|
• The financing agreement
includes grounds for immediate repayment that are standard in project financing agreements of this type, including, inter alia – breach of representations and commitments that have a material adverse effect, default events,
non‑compliance with certain obligations, various insolvency events, winding down of the project or termination of significant parties in the project (as defined in the agreement), occurrence of certain events relating to the regulatory
status of the project and holding regulatory approvals, certain changes in ownership of the project, certain events in connection with the project, existence of legal proceedings relating to the project, and a situation wherein the
project is not entitled to receive payments for capacity and electricity – all in accordance with and subject to the terms and conditions, definitions and remediation periods detailed in the financing agreement.
• The three projects are
pledged in favor of the lenders in order to secure the undertakings under the Financing Agreement, and a cross default provision is in place between the projects.
• The Borrower may use
the surplus equity and/or surplus cash flows of a qualifying project in order to support another qualifying project’s needs and requirements, subject to the conditions that were set.
|
|
|
B. |
Additional details (cont.)
|
|
|
5. |
Financing agreement for construction in the US Renewable Energies segment: (cont.)
|
|
Collateral, pledges, guarantees
|
Collaterals and liens are provided in favor of the Financing Entities on all of the projects’ assets and the rights arising therefrom, and in respect of which a
withdrawal was made or credit letters were provided (and in respect of each qualifying asset that will be added).
CPV Group provided a guarantee to secure certain undertakings in connection with the Financing Agreement, including an undertaking to bear the
expenses that will apply to the project as a result of changes to the law in connection with the tax benefits that will arise from the projects, in respect of costs pertaining to breach of a warranty claim by the solar panels supplier, in
respect of costs incurred by the projects (if any) in connection with customs payable with respect to the solar panels, and the Maple Hill project’s failure to meet the dates-related undertakings to the tax equity partner, all in
accordance with and subject to the conditions set in the Financing Agreement.
|
|
|
B. |
Additional details (cont.)
|
|
|
6. |
Financial covenants:
|
|
Financial covenants
|
Breach ratio
|
Actual value
|
||
|
Covenants applicable to Hadera in connection with the Hadera Financing Agreement
|
||||
|
Minimum projected DSCR
|
1.10
|
1.14
|
||
|
Average projected DSCR
|
1.10
|
1.19
|
||
|
LLCR
|
1.10
|
1.79
|
||
|
Covenants applicable to the Company in connection with the Hadera Equity Subscription Agreement
|
||||
|
The Company shareholders’ equity (separate)
|
No less than NIS 200 million
|
Approx. NIS 3,848 million
|
||
|
The Company’s equity to asset ratio (separate)
|
No less than 20%
|
67%
|
||
|
Covenants applicable to Zomet in connection with the Zomet Financing Agreement (1)
|
||||
|
Expected ADSCR
|
1.05
|
1.39
|
||
|
LLCR
|
1.05
|
1.45
|
||
|
Covenants applicable to the Gat Partnership in connection with the Gat Financing Agreement
|
||||
|
Minimum projected DSCR
|
1.05
|
1.29
|
||
|
Average projected DSCR
|
1.05
|
1.30
|
||
|
LLCR
|
1.05
|
1.28
|
||
|
Covenants applicable to OPC Power Plants on a consolidated basis in connection with the Gat Equity Subscription Agreement
|
||||
|
OPC Power Plants’ total assets balance
|
No less than NIS 2,500 million
|
Approx. NIS 5,414 million
|
||
|
OPC Power Plant’s equity to asset ratio
|
No less than 15%
|
35%
|
||
|
Ratio of net debt to adjusted EBITDA of OPC Power Plants
|
Will not exceed 12
|
2.8
|
||
|
OPC Power Plants’ minimum cash balance
|
No less than NIS 30 million
|
Approx. NIS 242 million
|
||
|
OPC Power Plants’ minimum cash balance (hereinafter - ”separate”)
|
No less than NIS 20 million
|
Approx. NIS 27 million
|
||
|
Covenants applicable to Rotem in connection with the Gat Equity Subscription Agreement
|
||||
|
Rotem’s net debt to adjusted EBITDA ratio
|
Will not exceed 10
|
0.7
|
||
|
Covenants applicable to the Company in connection with the Discount credit facility
|
||||
|
The Company shareholders’ equity (separate)
|
No less than NIS 1,000 million
|
Approx. NIS 3,848 million
|
||
|
The Company’s equity to asset ratio (separate)
|
No less than 20%
|
67%
|
||
|
Covenants applicable to the Company in connection with the Mizrahi and Hapoalim credit facilities
|
||||
|
The Company shareholders’ equity (separate)
|
No less than NIS 1,200 million
|
Approx. NIS 3,848 million
|
||
|
The Company’s equity to asset ratio (separate)
|
No less than 30%
|
67%
|
||
|
The Company’s net debt to adjusted EBITDA ratio
|
Will not exceed 12
|
5.5
|
||
|
Covenants applicable to OPC Israel in connection with the Mizrahi and Hapoalim credit facilities
|
||||
|
OPC Israel’s standalone shareholders’ equity, including non-controlling interests
|
No less than NIS 500 million
|
Approx. NIS 2,130 million
|
||
|
OPC Israel’s equity to asset ratio (hereinafter - “consolidated”)
|
No less than 20%
|
37%
|
||
|
Ratio of net debt to adjusted EBITDA of OPC Israel
|
Will not exceed 10
|
3.4
|
||
|
|
B. |
Additional details (cont.)
|
|
|
6. |
Financial covenants: (cont.)
|
|
|
C. |
Guarantees
|
|
As at December 31
|
||||||||
|
2023
|
2022
|
|||||||
|
NIS million
|
NIS million
|
|||||||
|
For operating projects in Israel (Rotem, Hadera and the Gat Power Plant) (1)
|
149
|
111
|
||||||
|
For Zomet (2)
|
95
|
74
|
||||||
|
For projects under construction and development in Israel (Sorek and consumers’ premises) (3)
|
47
|
54
|
||||||
|
In respect of virtual supply activity in Israel (4)
|
29
|
62
|
||||||
|
For operating projects in the US Renewable Energies Segment (5)
|
189
|
50
|
||||||
|
In respect of projects under construction and development in the USA (Group 6) (CPV)
|
148
|
90
|
||||||
|
657
|
441
|
|||||||
|
|
(1) |
Mainly in respect of: (a) bank guarantees of approx. NIS 91 million (CPI-linked) provided by Rotem in favor of the Noga - Independent System Operator Ltd. (hereinafter -
the “System Operator”) as required under the PPA. (b) A bank guarantee of approx. NIS 20 million (CPI-linked) provided by the Company on behalf of Hadera, as required in accordance with the financial covenants of the Israeli Electricity
Authority.
|
|
|
(2) |
Mainly in respect of a bank guarantee of approx. NIS 65 million (CPI-linked) provided by the Company for Zomet in favor of ILA (for further details, see Note 11B(1)E).
|
|
|
(3) |
Mainly due to (a) Bank guarantees in the total amount of approx. NIS 21 million (most of which are CPI-linked) provided by the Company and OPC Israel for the construction
of energy generation facilities on the consumers’ premises, and are connected to the distribution grid. (b) Bank guarantees totaling approx. NIS 25 million provided by the parent company and OPC Israel on behalf of Sorek 2, which were
designed to secure Sorek 2’s undertakings by virtue of the agreement for the construction of the Sorek generation facility (for further details, see Note 10E(1)B).
|
|
|
C. |
Guarantees (cont.)
|
|
|
(4) |
In respect of a bank guarantee of approx. NIS 27 million (CPI-linked) provided in favor of the System Operator for the purpose of allocating certain customers to the
virtual supply activity.
|
|
|
(5) |
In respect of bank guarantees provided by CPV Group to secure its undertakings in connection with operating projects in the renewable energy segment. In the reporting
period, the increase stems mainly from the Maple Hill project, that started commercial operation in the reporting period, and from the Mountain Wind project, that was acquired in the reporting period.
|
|
|
(6) |
In respect of bank guarantees provided by CPV Group to secure its undertakings in connection with projects under construction in the USA. In the reporting period, the
increase stems mainly from the Backbone project.
|
|
|
A. |
Composition
|
|
As at December 31
|
||||||||
|
2023
|
2022
|
|||||||
|
NIS million
|
NIS million
|
|||||||
|
Marketable debentures
|
1,839
|
1,840
|
||||||
|
Less current maturities
|
(192
|
)
|
(33
|
)
|
||||
|
1,647
|
1,807
|
|||||||
|
|
B. |
Additional details regarding the Company’s public debentures as of the report date
|
|
Series
|
Original issuance date
|
p.v. at the original issuance date (2)
|
Nominal value as of the report date
|
Nominal value after revaluation based on the linkage terms
|
Fair value as of December 31, 2023 (3)
|
Interest rate
|
Principal payment dates
|
Interest payment dates
|
Linkage basis and terms (principal and interest)
|
|
Series B
|
April 26, 2020 (1)
|
Approx. NIS 956 million
|
Approx. NIS 889 million
|
Approx. NIS 985 million
|
Approx. NIS 983 million
|
2.75%
|
16 unequal semi-annual payments, to be paid on March 31 and September 30 of each of the years 2021 to 2028 (inclusive).
|
The interest on the outstanding balance of the principal of Debentures is paid - as from September 2020 - twice a year (except for 2020), on September 30, 2020, and on
March 31 and September 30 of each of the years 2021 to 2028 (inclusive).
|
Linked to the Consumer Price Index in respect of March 2020.
|
|
Series C
|
September 9, 2021
|
Approx. NIS 851 million
|
Approx. NIS 851 million
|
The debentures are unlinked
|
Approx. NIS 776 million
|
2.5%
|
12 unequal semi-annual payments, to be paid on February 28 and August 31 of each of the years 2024 to 2030 (inclusive), except for 2028.
|
The interest is paid on the outstanding balance of the principal of the Debentures (Series C), as it will be from time to time, as from February 2022, twice a year, on
February 28 and on August 31 of each of the years 2022 to 2030 (inclusive).
|
Unlinked
|
|
(1)
|
Furthermore, as of its original issuance date, Series B was expanded in October 2020.
|
|
(2)
|
On the issuance date of the debentures Series B and Series C, the issuance costs amounted to approx. NIS 7 million and approx. NIS 9 million, respectively.
|
|
(3)
|
The fair value is based on the closing price quoted on the stock exchange.
|
|
(4)
|
As of December 31, 2023, the balance of interest payable in respect of the Debentures (Series B and C) amounts to approx. NIS 14 million.
|
|
|
C. |
Additional details
|
|
|
C. |
Additional details (cont.)
|
|
Ratio
|
Required value Series B
|
Required value Series C and D
|
Actual value
|
|||
|
Net financial debt (1) to adjusted EBITDA (2)
|
will not exceed 13 (for distribution purposes - 11)
|
will not exceed 13 (for distribution purposes - 11)
|
5.5
|
|||
|
The Company shareholders’ equity (separate)
|
Will not fall below NIS 250 million (for distribution purposes - NIS 350 million)
|
In relation to debentures Series C: Will not fall below NIS 1 billion (for distribution purposes: NIS 1.4 billion)
In relation to debentures Series D: Will not fall below NIS 2 billion (for distribution purposes: NIS 2.4 billion)
|
Approx. NIS 3,848 million
|
|||
|
The Company’s equity to asset ratio (separate)
|
No less than 17% (for distribution purposes: 27%)
|
No less than 20% (for distribution purposes: 30%)
|
67%
|
|||
|
The Company’s equity to asset ratio (consolidated)
|
--
|
No less than 17%
|
42%
|
|
|
A. |
Post-employment benefit plans – defined contribution plan
The Group has a defined contribution plan in respect of its liabilities to employees in Israel and the USA.
|
|
For the year ended December 31
|
||||||||||||
|
2023
|
2022
|
2021
|
||||||||||
|
NIS million
|
NIS million
|
NIS million
|
||||||||||
|
Amount recognized as an expense for a defined contribution plan
|
13
|
10
|
8
|
|||||||||
|
|
B. |
Equity compensation plan in Israel
|
|
|
B. |
Equity compensation plan in Israel (cont.)
|
|
Tranche No.
|
Vesting terms and conditions
|
Expiration date
|
|
Tranche One
|
At the end of 12 months from the grant date
|
At the end of 36 months from the vesting date
|
|
Tranche Two
|
At the end of 24 months from the grant date
|
At the end of 24 months from the vesting date
|
|
Tranche Three
|
At the end of 36 months from the grant date
|
At the end of 24 months from the vesting date
|
|
Tranche Four
|
At the end of 48 months from the grant date
|
At the end of 24 months from the vesting date
|
|
Offerees and
allotment dates
|
Number of RSUs at grant date
(In thousands)
|
No. of unvested RSUs as at December 31, 2023 (in thousands)
|
Fair value of each RSUs at award date
(In NIS)*
|
No. of options at the grant date (in thousands)
|
No. of unvested options as at December 31, 2022 (in thousands)
|
No. of unvested options as at December 31, 2023 (in thousands)
|
Average fair value of each option at the grant date (in NIS)**
|
Weighted average of the share price on options’ exercise dates in 2023
|
Exercise price per option
(In NIS, non-linked)
|
Standard deviation***
|
Risk-free interest rate ****
|
|||||||||||||||||||||||||||||||||
|
Officers, June 2018
|
242
|
-
|
18.52
|
1,166
|
46
|
23
|
3.80
|
24.42
|
18.41
|
21.41% - 20.93
|
%
|
0.88% - 1.43
|
%
|
|||||||||||||||||||||||||||||||
|
Officer, May 2020
|
29
|
7
|
26.8
|
99
|
99
|
99
|
7.76
|
N/A
|
25.81
|
31.48
|
%
|
0.36% - 0.58
|
%
|
|||||||||||||||||||||||||||||||
|
Officer, October 2020
|
11
|
-
|
35.24
|
29
|
14
|
-
|
12.98
|
N/A
|
30.28
|
36.65
|
%
|
0.25% - 0.43
|
%
|
|||||||||||||||||||||||||||||||
|
Chairman of the Board, January 2021
|
-
|
N/A
|
N/A
|
367
|
367
|
367
|
13.07
|
N/A
|
32.78
|
38.80
|
%
|
0.20% - 0.40
|
%
|
|||||||||||||||||||||||||||||||
|
CEO, April 2021
|
-
|
N/A
|
N/A
|
1,253
|
1,253
|
1,253
|
9.54
|
N/A
|
34.46
|
34.97
|
%
|
0.35% - 0.59
|
%
|
|||||||||||||||||||||||||||||||
|
Officers, August 2021
|
-
|
N/A
|
N/A
|
663
|
663
|
331
|
8.23
|
N/A
|
30.24
|
34.59
|
%
|
0.24% - 0.55
|
%
|
|||||||||||||||||||||||||||||||
|
Officers, January 2022
|
27
|
20
|
33.4
|
272
|
272
|
272
|
9.91
|
N/A
|
33.21
|
33.55% - 33.67
|
%
|
0.47% - 0.75
|
%
|
|||||||||||||||||||||||||||||||
|
Employees, May 2022
|
-
|
N/A
|
N/A
|
1,649
|
1,649
|
1,453
|
10.42
|
N/A
|
36.60
|
33.11% - 33.53
|
%
|
1.84% - 2.05
|
%
|
|||||||||||||||||||||||||||||||
|
Officer, September 2022
|
-
|
N/A
|
N/A
|
254
|
254
|
254
|
15.70
|
N/A
|
39.86
|
33.24% - 34.24
|
%
|
2.93% - 2.94
|
%
|
|||||||||||||||||||||||||||||||
|
|
(1) |
In the years ended December 31, 2023, 2022, and 2021, following the vesting of the RSUs, the Company issued approx. 14 thousand, approx. 55 thousand, and approx. 55 thousand ordinary
shares of the Company of NIS 0.01 par value, respectively. In addition, in the years ended December 31, 2023, 2022 and 2021, the Company issued approx. 8 thousand, approx. 161 thousand, and approx. 161 thousand ordinary shares of the
Company of NIS 0.01 par value, respectively, following notices regarding the exercise of approx. 23 thousand, approx. 272 thousand and approx. 303 thousand options, respectively. The weighted average price per share on the exercise dates
of the options was NIS 24.42, NIS 39.67, and NIS 35.26, respectively. Subsequent to the reporting date, in January 2024, following the vesting of the RSUs, the Company issued approx. 7 thousand ordinary shares of NIS 0.01 par value each
of the Company.
|
|
|
(2) |
The value of the benefit implicit in the allotment of securities in the years ended December 31, 2022 and 2021 is approx. NIS 25 million and approx. NIS 22 million, respectively. This
amount will be recorded in profit and loss over the vesting period.
|
|
|
C. |
Profit-sharing plan for CPV Group employees
|
|
|
A. |
Information about the tax environment in which the Group operates
|
|
|
1. |
Corporate tax rate
|
|
|
• |
Bonus depreciation - accelerated depreciation at a rate of up to 100%. As from 2023, the accelerated depreciation rate is up to 80%; this rate will decline by 20% every year, unless the
tax benefit will be extended. It should be noted that also in the project acquisition procedure, this depreciation may be recognized on the acquisition date.
|
|
|
• |
Investment Tax Credit (hereinafter - ”ITC”) - A tax credit of up to 30% of the amount invested in solar assets, and another credit equal to up to 10% of the construction costs of projects
that integrate equipment manufactured in the USA or constructed at certain sites (”Brownfield Sites”).
|
|
|
• |
Production tax credit (hereinafter - ”PTC”) - A tax credit in respect of income from the sale of electricity generated by renewable energy
facilities.
|
|
|
A. |
Information about the tax environment in which the Group operates (cont.)
|
|
|
2. |
Benefits under the Law for Encouragement of Industry (Taxes), 1969 (hereinafter – the “Encouragement of Industry
Law”)
|
|
|
B. |
Tax assessments
|
|
|
C. |
Components of expenses (income) for income tax
|
|
For the year ended December 31
|
||||||||||||
|
2023
|
2022
|
2021
|
||||||||||
|
NIS million
|
NIS million
|
NIS million
|
||||||||||
|
Current tax expenses (income)
|
11
|
4
|
(1
|
)
|
||||||||
|
Deferred taxes expenses (income)
|
57
|
61
|
(76
|
)
|
||||||||
|
Expenses for taxes on income (tax benefit)
|
68
|
65
|
(77
|
)
|
||||||||
|
|
D. |
Adjustments between theoretical tax on income (loss) before tax and tax expenses (tax benefit):
|
|
For the year ended December 31
|
||||||||||||
|
2023
|
2022
|
2021
|
||||||||||
|
NIS million
|
NIS million
|
NIS million
|
||||||||||
|
Income (loss) before taxes on income
|
237
|
282
|
(380
|
)
|
||||||||
|
Statutory tax rate of the Company
|
23
|
%
|
23
|
%
|
23
|
%
|
||||||
|
Tax (tax saving) calculated at the statutory tax rate of the Company
|
55
|
65
|
(87
|
)
|
||||||||
|
Additional tax (savings) for:
|
||||||||||||
|
Non‑controlling interests’ share in losses of tax transparent entities
|
-
|
(4
|
)
|
18
|
||||||||
|
Losses for tax purposes and other tax benefits for which deferred taxes were not recorded
|
2
|
1
|
1
|
|||||||||
|
Effect of the creation of deferred taxes at a tax rate that is different from the main tax rate
|
2
|
5
|
(7
|
)
|
||||||||
|
Other
|
9
|
(2
|
)
|
(2
|
)
|
|||||||
|
Expenses for taxes on income (tax benefit)
|
68
|
65
|
(77
|
)
|
||||||||
|
|
E. |
Deferred tax assets and liabilities
|
|
|
(1) |
Deferred tax assets and liabilities recognized in the books of accounts
|
|
Balance of deferred tax asset (liability)
|
As at December 31, 2022
|
Commencement of consolidation
|
Carried to income and loss
|
Carried to other comprehensive income
|
Effect of changes in exchange rates
|
As at December 31, 2023
|
||||||||||||||||||
|
NIS million
|
||||||||||||||||||||||||
|
Property, plant, and equipment and intangible assets
|
(490
|
)
|
(69
|
)
|
(31
|
)
|
-
|
-
|
(590
|
)
|
||||||||||||||
|
Carryforward losses and deductions for tax purposes
|
408
|
-
|
22
|
-
|
7
|
437
|
||||||||||||||||||
|
Investments in tax transparent investees
|
(280
|
)
|
-
|
(53
|
)
|
21
|
(8
|
)
|
(320
|
)
|
||||||||||||||
|
Other
|
37
|
-
|
5
|
(9
|
)
|
(1
|
)
|
32
|
||||||||||||||||
|
(325
|
)
|
(69
|
)
|
(57
|
)
|
12
|
(2
|
)
|
(441
|
)
|
||||||||||||||
|
|
E. |
Deferred tax assets and liabilities (cont.)
|
|
|
(1) |
Deferred tax assets and liabilities recognized in the books of accounts (cont.)
|
|
Balance of deferred tax asset (liability)
|
As at December 31, 2021
|
Carried to income and loss
|
Carried to other comprehensive income
|
Effect of changes in exchange rates
|
As at December 31, 2022
|
|||||||||||||||
|
NIS million
|
||||||||||||||||||||
|
Property, plant, and equipment and intangible assets
|
(417
|
)
|
(67
|
)
|
-
|
(6
|
)
|
(490
|
)
|
|||||||||||
|
Carryforward losses and deductions for tax purposes
|
349
|
27
|
-
|
32
|
408
|
|||||||||||||||
|
Investments in tax transparent investees
|
(207
|
)
|
(28
|
)
|
(15
|
)
|
(30
|
)
|
(280
|
)
|
||||||||||
|
Other
|
35
|
7
|
(9
|
)
|
4
|
37
|
||||||||||||||
|
(240
|
)
|
(61
|
)
|
(24
|
)
|
-
|
(325
|
)
|
||||||||||||
|
|
(2) |
Deferred taxes are recognized in the statement of financial position as follows:
|
|
As at December 31
|
||||||||
|
2023
|
2022
|
|||||||
|
NIS million
|
NIS million
|
|||||||
|
Under non‑current assets
|
57
|
22
|
||||||
|
Under non-current liabilities
|
(498
|
)
|
(347
|
)
|
||||
|
Deferred tax assets, net
|
(441
|
)
|
(325
|
)
|
||||
|
|
(3) |
Loss carryforwards for tax purposes:
In Israel, as of December 31, 2023, the Group has loss carryforwards of approx. NIS 650 million - a total of approx. NIS 150 million in the Company and the remaining amount of approx.
NIS 500 million in all other Group companies in Israel. The Company did not recognize a deferred tax asset in respect of approx. NIS 150 million in losses for tax purposes, since it does not expect that there will be a taxable income
against which the tax benefits can be utilized.
In the USA, as of December 31, 2023 ICG Energy has loss carryforwards at the total amount of approx. NIS 1,716 million (approx. USD 470 million) on the federal level. In respect of
losses for tax purposes at a total amount of approx. NIS 322 million (approx. USD 89 million) deferred tax assets were not recognized, since these losses are subject to compliance with the terms of the law, some of which are outside the
control of ICG Energy; these losses will expire in 2027 - 2037. Furthermore, ICG Energy has losses at state-level amounting to approx. NIS 517 million, in respect of which deferred tax assets were recognized.
|
|
|
A. |
Composition
|
|
As at December 31, 2023
|
As at December 31, 2022
|
|||||||||||||||
|
No. of shares
|
Authorized
|
Issued and paid up
|
Authorized
|
Issued and paid up
|
||||||||||||
|
Ordinary shares of NIS 0.01 par value
|
500,000,000
|
224,437,761
|
500,000,000
|
224,415,769
|
||||||||||||
|
|
B. |
Share issuances
|
|
Transaction date
|
Transaction type
|
Scope of the transaction
|
Transaction consideration (in NIS million)
|
Issuance costs (in NIS million)
|
||||
|
July 2022 (1)
|
Shares issuance
|
9,443,800 shares
|
330.5
|
9
|
||||
|
September 2022 (2)
|
Shares issuance
|
12,500,000 shares
|
500
|
6
|
|
|
(1) |
It should be noted that the Parent Company submitted subscriptions as part of the tender, and was issued with 3,898,000 ordinary shares of the Company as part of the issuance.
|
|
|
(2) |
An issuance for qualified investors, including Migdal Insurance and Financial Holdings Ltd., The Phoenix Insurance Company Ltd. (including entities under their management), and entities
managed by Altshuler Shaham Ltd. (each of which were interested parties in the Company on the share issuance date).
|
|
|
C. |
Dividend
|
|
|
C. |
Dividend (cont.)
|
|
|
A. |
Income
|
|
For the year ended December 31
|
||||||||||||
|
2023
|
2022
|
2021
|
||||||||||
|
NIS million
|
NIS million
|
NIS million
|
||||||||||
|
Income from sale of electricity in Israel:
|
||||||||||||
|
Income from the sale of energy to private customers
|
1,424
|
1,212
|
966
|
|||||||||
|
Income from energy sales to the System Operator and other suppliers
|
120
|
55
|
37
|
|||||||||
|
Income for capacity services
|
59
|
-
|
-
|
|||||||||
|
Income from the sale of energy to the System Operator, at cogeneration tariff
|
82
|
52
|
54
|
|||||||||
|
Income from sale of steam in Israel
|
59
|
62
|
57
|
|||||||||
|
Other income in Israel
|
59
|
39
|
-
|
|||||||||
|
Total income from sale of energy and others in Israel (excluding infrastructure services)
|
1,803
|
1,420
|
1,114
|
|||||||||
|
Income from private customers for infrastructure services
|
480
|
315
|
298
|
|||||||||
|
Total income in Israel
|
2,283
|
1,735
|
1,412
|
|||||||||
|
Income from the sale of electricity from renewable energy in the USA
|
136
|
87
|
82
|
|||||||||
|
Income from provision of services in the US
|
133
|
105
|
81
|
|||||||||
|
Total income in the USA
|
269
|
192
|
163
|
|||||||||
|
Total income
|
2,552
|
1,927
|
1,575
|
|||||||||
|
|
A. |
Income (cont.)
|
|
For the year ended December 31
|
||||||||||||
|
Customer
|
2023
|
2022
|
2021
|
|||||||||
|
Total income
|
% of the Company’s income
|
Total income
|
% of the Company’s income
|
Total income
|
% of the Company’s income
|
|||||||
|
Customer 1
|
369
|
14.4%
|
360
|
18.7%
|
303
|
19.2%
|
||||||
|
Customer 2 (1)
|
291
|
11.4%
|
247
|
12.8%
|
229
|
14.5%
|
||||||
|
Customer 3
|
262
|
10.3%
|
-
|
-
|
-
|
-
|
||||||
|
|
(1) |
Bazan Ltd. (hereinafter - the “Bazan Group”), that was a related party through the end of 2022. For further details – see Note 24.
|
|
|
B. |
Cost of sales (less depreciation and amortization)
|
|
For the year ended December 31
|
||||||||||||
|
2023
|
2022
|
2021
|
||||||||||
|
NIS million
|
NIS million
|
NIS million
|
||||||||||
|
Cost of sales in Israel:
|
||||||||||||
|
Natural gas and diesel fuel (*)
|
663
|
526
|
495
|
|||||||||
|
Energy acquisition expenses
|
303
|
295
|
102
|
|||||||||
|
Gas transmission costs
|
41
|
32
|
32
|
|||||||||
|
Salaries and related expenses
|
37
|
32
|
27
|
|||||||||
|
Operating expenses
|
87
|
54
|
53
|
|||||||||
|
Other expenses
|
65
|
40
|
-
|
|||||||||
|
Total cost of sales in Israel (excluding the cost of infrastructure services)
|
1,196
|
979
|
709
|
|||||||||
|
Infrastructure services expenses
|
480
|
315
|
298
|
|||||||||
|
Total cost of sales in Israel
|
1,676
|
1,294
|
1,007
|
|||||||||
|
Cost of sales and provision of services in the USA:
|
||||||||||||
|
Cost of sales in respect of income from the sale of electricity from renewable energy
|
49
|
30
|
26
|
|||||||||
|
Cost in respect of provision of services (as part of other segments) and other costs
|
102
|
80
|
53
|
|||||||||
|
Total cost of sales in the USA
|
151
|
110
|
79
|
|||||||||
|
Total cost of sales
|
1,827
|
1,404
|
1,086
|
|||||||||
|
(*) After deducting third-party participation costs.
|
|
|
C. |
General and administrative expenses
|
|
For the year ended December 31
|
||||||||||||
|
2023
|
2022
|
2021
|
||||||||||
|
NIS million
|
NIS million
|
NIS million
|
||||||||||
|
Salaries and related expenses
|
100
|
90
|
51
|
|||||||||
|
Directors’ fees
|
4
|
5
|
4
|
|||||||||
|
Professional services
|
48
|
37
|
32
|
|||||||||
|
Depreciation
|
15
|
10
|
8
|
|||||||||
|
Office maintenance
|
24
|
15
|
10
|
|||||||||
|
Other
|
28
|
20
|
14
|
|||||||||
|
219
|
177
|
119
|
||||||||||
|
Share-based payment expenses (income) (*)
|
(7
|
)
|
62
|
58
|
||||||||
|
Total general and administrative expenses
|
212
|
239
|
177
|
|
|
(*) |
The main change is in respect of profit-sharing plan for CPV Group employees, which is measured at fair value; for further details, see Note 18.
|
|
For the year ended December 31
|
||||||||||||
|
2023
|
2022
|
2021
|
||||||||||
|
NIS million
|
NIS million
|
NIS million
|
||||||||||
|
Business development in Israel
|
19
|
12
|
5
|
|||||||||
|
Business development in the USA (mainly in renewable energies)
|
39
|
38
|
22
|
|||||||||
|
58
|
50
|
27
|
||||||||||
|
|
E. |
Finance income and expenses
|
|
For the year ended December 31
|
||||||||||||
|
2023
|
2022
|
2021
|
||||||||||
|
NIS million
|
NIS million
|
NIS million
|
||||||||||
|
Finance income
|
||||||||||||
|
Exchange rate differences from revaluation of inter-company loans (1)
|
-
|
79
|
-
|
|||||||||
|
Exchange rate differences
|
3
|
17
|
-
|
|||||||||
|
Interest income from deposits with banks
|
35
|
9
|
1
|
|||||||||
|
Interest income from others
|
5
|
1
|
1
|
|||||||||
|
43
|
106
|
2
|
||||||||||
|
Finance expenses
|
||||||||||||
|
Exchange rate differences
|
-
|
-
|
21
|
|||||||||
|
Interest expenses for debentures
|
80
|
97
|
47
|
|||||||||
|
Interest expenses for loans from banks and financial institutions
|
170
|
83
|
119
|
|||||||||
|
Interest expense for loans from non‑controlling interests
|
26
|
23
|
13
|
|||||||||
|
Interest expenses in respect of deferred consideration paid as part of the acquisition of Gat (2)
|
14
|
-
|
-
|
|||||||||
|
Interest expenses for lease liabilities
|
2
|
2
|
2
|
|||||||||
|
Fees and commissions and others
|
28
|
4
|
6
|
|||||||||
|
Capitalization of borrowing costs to assets under construction
|
(80
|
)
|
(56
|
)
|
(21
|
)
|
||||||
|
240
|
153
|
187
|
||||||||||
|
Loss from extinguishment of financial liabilities, net (3)
|
-
|
-
|
272
|
|||||||||
|
Finance expenses, net, recognized in the statement of income (4)
|
197
|
47
|
457
|
|||||||||
|
|
1. |
In respect of provision of NIS-denominated loans to a wholly-owned subsidiary which is a foreign operation and whose functional currency is the USD.In the fourth quarter of 2022, in view
of a change in the Company’s assessments regarding the likelihood of repayment of the said loans in the foreseeable future, they were classified as part of net investment in foreign operation. For further details regarding the accounting
policy in connection with loans extended to foreign operation, see Note 3B2.
|
|
|
2. |
For further details, see Notes 16B1 and 25E1.
|
|
|
3. |
In October 2021, early repayment of the full outstanding balance of Rotem's project financing in the amount of approx. NIS 1,292 million (including an early repayment fee)
was completed, a debt service reserve and additional restricted cash in Rotem in the amount of approx. NIS 125 million were released, and guarantees related to the Rotem Financing Agreement were canceled. In respect of the said repayment,
Rotem recognized a one-off expense in respect of an early repayment fee, totaling approx. NIS 244 million (approx. NIS 188 million, net of tax) in the loss on extinguishment of financial liabilities, net item.
|
|
|
E. |
Finance income and expenses (cont.)
|
|
|
3. |
(cont.)
|
|
|
4. |
Including linkage differences in respect of CPI-linked debentures and loans at the total amount of approx. NIS 37 million (in 2022 - approx. NIS 56 million).
|
|
For the year ended December 31
|
||||||||||||
|
2023
|
2022
|
2021
|
||||||||||
|
Profit (loss) for the year attributable to shareholders of the Company in NIS million
|
144
|
167
|
(219
|
)
|
||||||||
|
Weighted average number of shares used for the basic and diluted calculation
|
224,461
|
210,289
|
191,170
|
|||||||||
|
Basic and diluted earnings (loss) per share (in NIS)
|
0.63
|
0.79
|
(1.15
|
)
|
||||||||
|
|
A. |
Financial risk management
|
|
|
1. |
General
|
|
|
2. |
Credit risk
|
|
|
A. |
Financial risk management (cont.)
|
|
|
3. |
Liquidity risk
|
|
|
4. |
Market risks
|
|
|
5. |
Currency risk
|
|
|
A. |
Financial risk management (cont.)
|
|
|
6. |
CPI risk
|
|
|
7. |
Interest rate risk
|
|
|
A. |
Financial risk management (cont.)
|
|
|
8. |
Other market price risks - electricity margins and prices
|
|
|
B. |
Financial instruments
|
|
|
1. |
Credit risk
|
|
|
As at December 31
|
|||||||
|
2023
|
2022
|
|||||||
|
NIS million
|
NIS million
|
|||||||
|
Trade receivables in Israel
|
203
|
236
|
||||||
|
Trade receivables in the USA
|
44
|
24
|
||||||
|
247
|
260
|
|||||||
|
|
B. |
Financial instruments (cont.)
|
|
|
2. |
Liquidity risk
|
|
As at December 31, 2023
|
||||||||||||||||||||||||
|
Carrying amount
|
Contractual amount
|
12 months or less
|
One to two years
|
2-5 years
|
More than 5 years
|
|||||||||||||||||||
|
NIS million
|
||||||||||||||||||||||||
|
Non-derivative financial liabilities
|
||||||||||||||||||||||||
|
Trade payables
|
257
|
257
|
257
|
-
|
-
|
-
|
||||||||||||||||||
|
Payables and credit balances
|
289
|
289
|
289
|
-
|
-
|
-
|
||||||||||||||||||
|
Debt to holders of non-controlling interests (including interest payable)
|
454
|
580
|
34
|
8
|
50
|
488
|
||||||||||||||||||
|
Debentures (including interest payable)
|
1,853
|
2,029
|
238
|
250
|
1,136
|
405
|
||||||||||||||||||
|
Lease liability (including interest payable)
|
222
|
507
|
17
|
18
|
46
|
426
|
||||||||||||||||||
|
Loans from banks and financial institutions (including interest payable)
|
3,259
|
4,195
|
595
|
355
|
1,312
|
1,933
|
||||||||||||||||||
|
Financial liabilities - derivative instruments
|
||||||||||||||||||||||||
|
Long-term derivative financial instruments
|
55
|
55
|
6
|
6
|
17
|
26
|
||||||||||||||||||
|
Total financial liabilities
|
6,387
|
7,910
|
1,434
|
637
|
2,561
|
3,278
|
||||||||||||||||||
|
As at December 31, 2022
|
||||||||||||||||||||||||
|
Carrying amount
|
Contractual amount
|
12 months or less
|
One to two years
|
2-5 years
|
More than 5 years
|
|||||||||||||||||||
|
NIS million
|
||||||||||||||||||||||||
|
Non-derivative financial liabilities
|
||||||||||||||||||||||||
|
Trade payables
|
335
|
335
|
335
|
-
|
-
|
-
|
||||||||||||||||||
|
Payables and credit balances
|
37
|
37
|
37
|
-
|
-
|
-
|
||||||||||||||||||
|
Debt to holders of non-controlling interests (including interest payable)
|
437
|
565
|
16
|
51
|
91
|
407
|
||||||||||||||||||
|
Debentures (including interest payable)
|
1,854
|
2,073
|
79
|
234
|
788
|
972
|
||||||||||||||||||
|
Lease liability (including interest payable)
|
130
|
164
|
63
|
10
|
23
|
68
|
||||||||||||||||||
|
Loans from banks and financial institutions (including interest payable)
|
1,817
|
2,229
|
140
|
211
|
515
|
1,363
|
||||||||||||||||||
|
Total financial liabilities
|
4,610
|
5,403
|
670
|
506
|
1,417
|
2,810
|
||||||||||||||||||
|
|
B. |
Financial instruments (cont.)
|
|
|
3. |
Market risk
CPI and currency risks
|
|
NIS
|
Foreign currency
|
|||||||||||||||||||||||
|
CPI-linked
|
Non-linked
|
USD
|
EUR
|
Other
|
Total
|
|||||||||||||||||||
|
NIS million
|
||||||||||||||||||||||||
|
December 31, 2023
|
||||||||||||||||||||||||
|
Assets
|
||||||||||||||||||||||||
|
Cash and cash equivalents
|
-
|
329
|
672
|
6
|
-
|
1,007
|
||||||||||||||||||
|
Restricted deposits and cash
|
-
|
55
|
6
|
-
|
-
|
61
|
||||||||||||||||||
|
Trade and other receivables
|
-
|
242
|
443
|
-
|
-
|
685
|
||||||||||||||||||
|
Total financial assets
|
-
|
626
|
1,121
|
6
|
-
|
1,753
|
||||||||||||||||||
|
Liabilities
|
||||||||||||||||||||||||
|
Trade payables
|
-
|
(103
|
)
|
(148
|
)
|
(4
|
)
|
(2
|
)
|
(257
|
)
|
|||||||||||||
|
Payables and credit balances
|
-
|
(18
|
)
|
(271
|
)
|
-
|
-
|
(289
|
)
|
|||||||||||||||
|
Debentures
|
(1,001
|
)
|
(852
|
)
|
-
|
-
|
-
|
(1,853
|
)
|
|||||||||||||||
|
Lease liabilities
|
(17
|
)
|
(9
|
)
|
(196
|
)
|
-
|
-
|
(222
|
)
|
||||||||||||||
|
Debt from non‑controlling interests
|
(60
|
)
|
(26
|
)
|
(368
|
)
|
-
|
-
|
(454
|
)
|
||||||||||||||
|
Loans from banks and financial institutions
|
(440
|
)
|
(1,949
|
)
|
(870
|
)
|
-
|
-
|
(3,259
|
)
|
||||||||||||||
|
Total financial liabilities
|
(1,518
|
)
|
(2,957
|
)
|
(1,853
|
)
|
(4
|
)
|
(2
|
)
|
(6,334
|
)
|
||||||||||||
|
Total financial instruments
|
(1,518
|
)
|
(2,331
|
)
|
(732)
|
)*
|
2
|
(2
|
)
|
(4,581
|
)
|
|||||||||||||
|
|
B. |
Financial instruments (cont.)
|
|
|
3. |
Market risk (cont.)
CPI
and currency risks (cont.)
|
|
NIS
|
Foreign currency
|
|||||||||||||||||||||||
|
CPI-linked
|
Non-linked
|
USD
|
EUR
|
Other
|
Total
|
|||||||||||||||||||
|
NIS million
|
||||||||||||||||||||||||
|
December 31, 2022
|
||||||||||||||||||||||||
|
Assets
|
||||||||||||||||||||||||
|
Cash and cash equivalents
|
-
|
580
|
268
|
1
|
-
|
849
|
||||||||||||||||||
|
Restricted deposits and cash
|
-
|
178
|
36
|
-
|
-
|
214
|
||||||||||||||||||
|
Trade and other receivables
|
-
|
240
|
183
|
-
|
-
|
423
|
||||||||||||||||||
|
Total financial assets
|
-
|
998
|
487
|
1
|
-
|
1,486
|
||||||||||||||||||
|
Liabilities
|
||||||||||||||||||||||||
|
Trade payables
|
-
|
(129
|
)
|
(154
|
)
|
(51
|
)
|
(1
|
)
|
(335
|
)
|
|||||||||||||
|
Payables and credit balances
|
-
|
(21
|
)
|
(16
|
)
|
-
|
-
|
(37
|
)
|
|||||||||||||||
|
Debentures
|
(1,003
|
)
|
(851
|
)
|
-
|
-
|
-
|
(1,854
|
)
|
|||||||||||||||
|
Lease liabilities
|
(19
|
)
|
(52
|
)
|
(59
|
)
|
-
|
-
|
(130
|
)
|
||||||||||||||
|
Debt from non‑controlling interests
|
-
|
(151
|
)
|
(286
|
)
|
-
|
-
|
(437
|
)
|
|||||||||||||||
|
Loans from banks and financial institutions
|
(454
|
)
|
(1,053
|
)
|
(310
|
)
|
-
|
-
|
(1,817
|
)
|
||||||||||||||
|
Total financial liabilities
|
(1,476
|
)
|
(2,257
|
)
|
(825
|
)
|
(51
|
)
|
(1
|
)
|
(4,610
|
)
|
||||||||||||
|
Total financial instruments
|
(1,476
|
)
|
(1,259
|
)
|
(338)
|
)*
|
(50
|
)
|
(1
|
)
|
(3,124
|
)
|
||||||||||||
|
(*)
|
The balances as of December 31, 2023 and 2022 include net liabilities at the total amount of approx. NIS 788 million and approx. NIS 240 million,
respectively, in respect of the Group’s activity in the USA (mainly CPV Group), whose functional currency is the USD. Therefore, as of December 31, 2023 and 2023, the net exposure to the US dollar of the Group’s activity in Israel
amounted to net assets of approx. NIS 56 million and net liabilities of approx. NIS 98 million, respectively.
|
|
As at December 31, 2023
|
||||||||||||
|
In NIS million
|
Currency / linkage receivable
|
Currency / linkage payable
|
Amount receivable
|
Amount payable
|
Expiration dates
|
Fair value
|
||||||
|
Forwards on exchange rates
|
USD
|
NIS
|
21
|
76
|
2024
|
-
|
||||||
|
|
B. |
Financial instruments (cont.)
|
|
|
3. |
Market risk (cont.)
CPI and currency risks (cont.)
|
|
As at December 31, 2023
|
||||||||||||
|
In NIS million
|
Currency / linkage receivable
|
Currency / linkage payable
|
Amount receivable
|
Amount payable
|
Expiration dates
|
Fair value
|
||||||
|
Forwards on exchange rates
|
USD
|
NIS
|
10
|
35
|
2024
|
-
|
||||||
|
As at December 31, 2022
|
||||||||||||
|
In NIS million
|
Currency / linkage receivable
|
Currency / linkage payable
|
Amount receivable
|
Amount payable
|
Expiration date
|
Fair value
|
||||||
|
Forwards on exchange rates
|
USD
|
NIS
|
20
|
67
|
2023
|
2
|
||||||
|
The Group’s exposure to CPI risk for derivative financial instruments used for hedging is as follows:
|
|
|
As at December 31, 2023
|
||||||||||||||||
|
|
Linkage receivable
|
Interest payable
|
Expiration date
|
Amount of the linked principal
|
Fair value
|
||||||||||||
|
NIS million
|
|||||||||||||||||
|
CPI swap contracts
|
CPI
|
1.76
|
%
|
2036
|
294
|
37
|
|||||||||||
|
|
As at December 31, 2022
|
||||||||||||||||
|
|
Linkage receivable
|
Interest payable
|
Expiration date
|
Amount of the linked principal
|
Fair value
|
||||||||||||
|
NIS million
|
|||||||||||||||||
|
CPI swap contracts
|
CPI
|
1.76
|
%
|
2036
|
315
|
33
|
|||||||||||
|
|
B. |
Financial instruments (cont.)
|
|
|
3. |
Market risk (cont.)
CPI and currency risks (cont.)
|
|
As at December 31, 2023
|
||||||||||||||||
|
Effect on total comprehensive income (loss) and capital
|
||||||||||||||||
|
10% decrease
|
5% decrease
|
5% increase
|
10% increase
|
|||||||||||||
|
NIS million
|
NIS million
|
NIS million
|
NIS million
|
|||||||||||||
|
Non-derivative instruments USD/NIS
|
||||||||||||||||
|
USA (mainly CPV Group) (*)
|
58
|
29
|
(29
|
)
|
(58
|
)
|
||||||||||
|
Israel
|
(4
|
)
|
(2
|
)
|
2
|
4
|
||||||||||
|
54
|
27
|
(27
|
)
|
(54
|
)
|
|||||||||||
|
Derivative instruments USD/NIS
|
||||||||||||||||
|
USA (mainly CPV Group) (*)
|
3
|
1
|
(1
|
)
|
(3
|
)
|
||||||||||
|
Israel
|
(9
|
)
|
(4
|
)
|
4
|
9
|
||||||||||
|
(6
|
)
|
(3
|
)
|
3
|
6
|
|||||||||||
|
As at December 31, 2022
|
||||||||||||||||
|
Effect on total comprehensive income (loss) and capital
|
||||||||||||||||
|
10% decrease
|
5% decrease
|
5% increase
|
10% increase
|
|||||||||||||
|
NIS million
|
NIS million
|
NIS million
|
NIS million
|
|||||||||||||
|
Non-derivative instruments USD/NIS
|
||||||||||||||||
|
USA (mainly CPV Group) (*)
|
18
|
9
|
(9
|
)
|
(18
|
)
|
||||||||||
|
Israel
|
8
|
4
|
(4
|
)
|
(8
|
)
|
||||||||||
|
26
|
13
|
(13
|
)
|
(26
|
)
|
|||||||||||
|
Derivative instruments USD/NIS
|
||||||||||||||||
|
USA (mainly CPV Group) (*)
|
(2
|
)
|
(1
|
)
|
1
|
2
|
||||||||||
|
Israel
|
(5
|
)
|
(3
|
)
|
3
|
5
|
||||||||||
|
(7
|
)
|
(4
|
)
|
4
|
7
|
|||||||||||
|
(*)
|
Changes in the exchange rate of the USD in connection with the USA activity will be carried to other comprehensive income (loss).
|
|
|
B. |
Financial instruments (cont.)
|
|
As at December 31, 2023
|
||||||||||||||||
|
Effect on total comprehensive income (loss) and capital
|
||||||||||||||||
|
2% decrease
|
1% decrease
|
1% increase
|
2% increase
|
|||||||||||||
|
NIS million
|
||||||||||||||||
|
Long-term loans (CPI)
|
7
|
3
|
(3
|
)
|
(7
|
)
|
||||||||||
|
Debentures (CPI)
|
20
|
10
|
(10
|
)
|
(20
|
)
|
||||||||||
|
CPI swap contracts
|
(4
|
)
|
(2
|
)
|
2
|
4
|
||||||||||
|
As at December 31, 2022
|
||||||||||||||||
|
Effect on total comprehensive income (loss) and capital
|
||||||||||||||||
|
2% decrease
|
1% decrease
|
1% increase
|
2% increase
|
|||||||||||||
|
NIS million
|
||||||||||||||||
|
Long-term loans (CPI)
|
7
|
4
|
(4
|
)
|
(7
|
)
|
||||||||||
|
Debentures (CPI)
|
20
|
10
|
(10
|
)
|
(20
|
)
|
||||||||||
|
CPI swap contracts
|
(5
|
)
|
(2
|
)
|
2
|
5
|
||||||||||
|
As at December 31, 2023
|
||||||||||||||||
|
Effect on total comprehensive income (loss) and capital
|
||||||||||||||||
|
10% decrease
|
5% decrease
|
5% increase
|
10% increase
|
|||||||||||||
|
NIS million
|
||||||||||||||||
|
Derivative instruments
|
||||||||||||||||
|
Change in the electricity price
|
9
|
5
|
(5
|
)
|
(9
|
)
|
||||||||||
|
|
B. |
Financial instruments (cont.)
|
|
As at December 31
|
||||||||
|
2023
|
2022
|
|||||||
|
NIS million
|
NIS million
|
|||||||
|
Financial liabilities (*)
|
1,493
|
1,451
|
||||||
|
(1,493
|
)
|
(1,451
|
)
|
|||||
|
As at December 31
|
||||||||
|
2023
|
2022
|
|||||||
|
NIS million
|
NIS million
|
|||||||
|
Financial assets
|
349
|
719
|
||||||
|
Financial liabilities
|
1,643
|
1,497
|
||||||
|
(1,294
|
)
|
(778
|
)
|
|||||
|
(*)
|
Includes a total of approx. NIS 294 million and approx. NIS 315 million as of December 31, 2023 and 2022, respectively, which were
converted into unlinked loan through a CPI swap.
|
|
As at December 31
|
||||||||
|
2023
|
2022
|
|||||||
|
NIS million
|
NIS million
|
|||||||
|
Financial assets
|
197
|
17
|
||||||
|
Financial liabilities (**)
|
2,413
|
1,143
|
||||||
|
(2,216
|
)
|
(1,126
|
)
|
|||||
|
(**)
|
Includes a total of approx. NIS 673 million and approx. NIS 219 million as of December 31, 2023 and 2022, respectively, which were
converted into loans bearing fixed interest through an interest rate swap.
|
|
|
B. |
Financial instruments (cont.)
|
|
|
3. |
Market risk (cont.)
|
|
As at December 31, 2023
|
|||||||
|
Effect on total comprehensive income (loss) and capital
|
|||||||
|
2% decrease
|
1% decrease
|
1% increase
|
2% increase
|
||||
|
NIS million
|
|||||||
|
Long-term loans (Prime)
|
24
|
12
|
(12)
|
(24)
|
|||
|
The Group’s exposure to SOFR interest rate risk (LIBOR in 2022) for derivative financial instruments used for hedging is as
follows:
|
|
|
As at December 31, 2023
|
||||||||||||||||
|
|
Linkage receivable
|
Interest payable
|
Expiration date
|
Principal amount
|
Fair value
|
||||||||||||
|
NIS million
|
|||||||||||||||||
|
Interest rate swaps
|
USD SOFR interest
|
0.83%-4.0
|
%
|
2030-2041
|
673
|
15
|
|||||||||||
|
|
As at December 31, 2022
|
||||||||||||||||
|
|
Linkage receivable
|
Interest payable
|
Expiration date
|
Principal amount
|
Fair value
|
||||||||||||
|
NIS million
|
|||||||||||||||||
|
Interest rate swap
|
USD LIBOR interest
|
0.93
|
%
|
2030
|
219
|
24
|
|||||||||||
|
|
B. |
Financial instruments (cont.)
|
|
|
3. |
Market risk (cont.)
|
|
As at December 31, 2023
|
||||||||||||||||
|
Effect on total comprehensive income (loss) and capital
|
||||||||||||||||
|
1.5% decrease
|
1% decrease
|
1% increase
|
1.5% increase
|
|||||||||||||
|
NIS million
|
||||||||||||||||
|
Long-term loans (SOFR)
|
9
|
6
|
(6
|
)
|
(9
|
)
|
||||||||||
|
Interest rate swaps (SOFR)
|
(6
|
)
|
(4
|
)
|
4
|
6
|
||||||||||
|
As at December 31, 2022
|
||||||||||||||||
|
Effect on total comprehensive income (loss) and capital
|
||||||||||||||||
|
1.5% decrease
|
1% decrease
|
1% increase
|
1.5% increase
|
|||||||||||||
|
NIS million
|
||||||||||||||||
|
Long-term loans (US LIBOR)
|
5
|
3
|
(3
|
)
|
(5
|
)
|
||||||||||
|
Interest rate swaps (US LIBOR)
|
(3
|
)
|
(2
|
)
|
2
|
3
|
||||||||||
|
As at December 31, 2023
|
||||||||||||
|
Carrying amount (*)
|
Fair value
|
Discount rate
used to determine
the fair value
|
||||||||||
|
NIS million
|
NIS million
|
|||||||||||
|
Loans from banks and financial institutions (Level 2)
|
3,259
|
3,289
|
5.3%-6.8
|
%
|
||||||||
|
Loans from non‑controlling interests (Level 2)
|
454
|
464
|
5.6%-6.8
|
%
|
||||||||
|
Debentures (Level 1)
|
1,853
|
1,760
|
5.3%-6.1
|
%
|
||||||||
|
5,566
|
5,513
|
|||||||||||
|
As at December 31, 2022
|
||||||||||||
|
Carrying amount (*)
|
Fair value
|
Discount rate
used to determine
the fair value
|
||||||||||
|
NIS million
|
NIS million
|
|||||||||||
|
Loans from banks and financial institutions (Level 2)
|
1,817
|
1,859
|
4.3%-5.6
|
%
|
||||||||
|
Loans from non‑controlling interests (Level 2)
|
437
|
400
|
4.4%-9.3
|
%
|
||||||||
|
Debentures (Level 1)
|
1,854
|
1,734
|
5.4%-5.6
|
%
|
||||||||
|
4,108
|
3,993
|
|||||||||||
|
(*) Includes current maturities and interest payable.
|
||||||||||||
|
As at December 31
|
||||||||
|
2023
|
2022
|
|||||||
|
NIS million
|
NIS million
|
|||||||
|
Financial assets
|
||||||||
|
Derivatives used for hedge accounting
|
||||||||
|
CPI swap contracts (Level 2) (*)
|
37
|
33
|
||||||
|
Interest rate swaps (US LIBOR) (Level 2)
|
15
|
24
|
||||||
|
Forwards on exchange rates (Level 2)
|
-
|
2
|
||||||
|
52
|
59
|
|||||||
|
Financial liabilities
|
||||||||
|
Derivatives used for hedge accounting
|
||||||||
|
Electricity price hedge contracts (the renewable energy segment in the USA) (Level 3)
|
(55
|
)
|
-
|
|||||
|
(55
|
)
|
-
|
||||||
|
(*)
|
The nominal NIS-denominated discounted interest rate range in the value calculations is 3.6%-4.80% and the real discounted interest rate
range is 0.8%-2.8%.
|
|
For the year ended December 31
|
||||||||||||||||||||||||
|
2023
|
2022
|
2021
|
||||||||||||||||||||||
|
No. of people
|
NIS million
|
No. of people
|
NIS million
|
No. of people
|
NIS million
|
|||||||||||||||||||
|
Employee benefits
|
9
|
23
|
9
|
33
|
7
|
22
|
||||||||||||||||||
|
Share-based payment
|
9
|
4
|
9
|
24
|
7
|
21
|
||||||||||||||||||
|
27
|
57
|
43
|
||||||||||||||||||||||
|
Compensation and benefits for non-employee directors in the Group:
|
||||||||||||||||||||||||
|
For the year ended December 31
|
||||||||||||||||||||||||
|
2023
|
2022
|
2021
|
||||||||||||||||||||||
|
No. of people
|
NIS million
|
No. of people
|
NIS million
|
No. of people
|
NIS million
|
|||||||||||||||||||
|
Total benefits for non-employee directors in the Group
|
10
|
2
|
7
|
2
|
8
|
1
|
||||||||||||||||||
|
As at December 31
|
||||||||
|
2023
|
2022
|
|||||||
|
NIS million
|
NIS million
|
|||||||
|
Balances in Israel (including ICG Energy):
|
||||||||
|
Cash and cash equivalents (1)
|
201
|
620
|
||||||
|
Short term deposits (1)
|
-
|
125
|
||||||
|
Trade receivables (2)
|
3
|
29
|
||||||
|
Other accounts receivable
|
1
|
1
|
||||||
|
Other accounts payables
|
-
|
(1
|
)
|
|||||
|
Loans and credit from banks and financial institutions (1)
|
(101
|
)
|
-
|
|||||
|
Balances in the USA:
|
||||||||
|
Trade receivables (4)
|
9
|
7
|
||||||
|
Other long-term receivables - subordinated loans to an associate (3)
|
109
|
18
|
||||||
|
Debt from non‑controlling interests (5)
|
(157
|
)
|
(121
|
)
|
||||
|
For the year ended December 31
|
||||||||||||
|
2023
|
2022
|
2021
|
||||||||||
|
NIS million
|
NIS million
|
NIS million
|
||||||||||
|
Transactions in Israel (including ICG Energy):
|
||||||||||||
|
Sales (2)
|
37
|
252
|
240
|
|||||||||
|
Cost of sales (6)
|
(10
|
)
|
2
|
(3
|
)
|
|||||||
|
General and administrative expenses
|
-
|
-
|
(1
|
)
|
||||||||
|
Other finance income, net (1)
|
22
|
6
|
-
|
|||||||||
|
Interest expenses for loans from banks and financial institutions
|
-
|
-
|
(25
|
)
|
||||||||
|
Loss from extinguishment of financial liabilities, net
|
-
|
-
|
(95
|
)
|
||||||||
|
Transactions in the USA:
|
||||||||||||
|
Income from provision of services (4)
|
80
|
65
|
44
|
|||||||||
|
Other finance income, net (3)
|
4
|
-
|
-
|
|||||||||
|
Interest expenses in respect of a debt from non‑controlling interests (5)
|
(10
|
)
|
(7
|
)
|
(9
|
)
|
||||||
|
|
1. |
During the ordinary course of business and at fair market value, the Group enters into agreements with Mizrahi Tefahot Bank Group Ltd. for a wide range of banking activities, including
management of cash and deposits and short term credit facilities.
|
|
|
2. |
Mainly includes PPAs:
|
|
|
C. |
Transactions with related parties and interested parties (cont.)
|
|
|
2. |
(cont.)
|
|
|
3. |
For further details, see Note 26E.
|
|
|
4. |
As part of the asset and energy management operations, CPV Group provides management, initiation and maintenance services to specific associates.
|
|
|
5. |
For the purpose of investing in CPV Group, the Group has engaged in a partnership agreement with OPC Power, as defined in Note 25A3, inter alia with institutional investors from Migdal
Insurance Group, an interested party in the Company.
|
|
|
6. |
In 2023 and 2022, the Company entered into engagements for the sale and purchase of natural gas surpluses of immaterial scope with ICL Group Ltd.
|
|
|
7. |
It should be noted that the Group also sells electricity to other related parties in Israel, and the transactions with these parties were classified as negligible transactions.
|
|
|
The Group’s ownership rights in the subsidiary
|
||||||||
|
|
As at December 31
|
||||||||
|
|
Main location of
the Company's
operations
|
2023
|
2022
|
||||||
|
Company
|
|||||||||
|
OPC Holdings Israel Ltd. (hereinafter - “OPC Israel”) (1)
|
Israel
|
80
|
%
|
100
|
%
|
||||
|
OPC Power Plants Ltd. (hereinafter - “OPC Power Plants”) (2)
|
Israel
|
80
|
%
|
100
|
%
|
||||
|
CPV Group PL (hereinafter - “CPV Group”) (3)
|
USA
|
70
|
%
|
70
|
%
|
||||
|
|
(1) |
OPC Israel
|
|
10
|
In January 2023, on the eve of the transaction’s completion, the Company transferred to OPC Israel, among other things, the shares of OPC Power Plants, the holdings in Rotem 2, the
holdings in Gnrgy, as well as other companies and operations in the area of activity in Israel, such as energy generation facilities on consumers’ premises, virtual electricity supply activity, etc.
|
|
|
(1) |
OPC Israel (cont.)
|
|
|
(2) |
OPC Power Plants
|
|
11
|
The shareholders agreement defines OPC Israel’s area of activity, which includes, among other things, electricity generation and supply in Israel, which will be carried out by OPC Israel,
subject to the agreed arrangements, in accordance with the agreement.
|
|
|
(3) |
The CPV Group12
|
|
12
|
In January 2021, the transaction for the acquisition of 70% of the rights and holdings in CPV Group was completed. The acquisition was executed through a limited partnership, CPV
Group LP, which is held, indirectly, by the Company (approx. 70% by the limited partner). On the transaction completion date, the sellers were paid a consideration of approx. USD 648 million, and a total of approx. USD 5 million for a
deposit of an identical amount that was retained by CPV Group. The Company partially hedged its exposure to changes in the cash flows from payments in USD in connection with the agreement for acquisition of the CPV Group by means of
forward transactions and USD deposits. The Company chose to designate the forward transactions as an accounting hedge. On the Transaction Completion Date, the Company recorded an amount of approx. NIS 103 million that was accrued in a
hedge capital reserve to the investment cost in the CPV Group.
As part of allocation of the acquisition consideration and determination of the fair value of identifiable assets and liabilities, the Group consolidated for the
first time investments in associates at the total amount of approx. USD 595 million (approx. NIS 1,944 million), as well as an intangible asset in respect of Keenan's PPA at the total amount of approx. USD 111 million (approx. NIS 361
million). Furthermore, following the acquisition, goodwill of approx. USD 105 million (approx. NIS 343 million), including goodwill arising from the hedging, was recognized.
|
|
|
(4) |
Gnrgy
|
|
13
|
As from December 31, 2021, the Company includes Gnrgy’s results in its consolidated financial statements and includes it in the Israel segment.
|
|
Company
|
The Company’s holding rate (indirect) as at December 31, 2023
|
Limit
|
||
|
OPC Israel
|
80%
|
For further details, see Note 16B2
|
||
|
OPC Power Plants
|
80%
|
For further details, see Note 16B6
|
||
|
Hadera
|
80%
|
For further details, see Note 16B1 and Note 16B6
|
||
|
Zomet
|
80%
|
For further details, see Note 16B1 and Note 16B6
|
||
|
Rotem
|
80%
|
For further details, see Note 16B6
|
||
|
Gat
|
80%
|
For further details, see Note 16B1 and Note 16B6
|
||
|
Keenan
|
70%
|
For further details see Note 16B3
|
||
|
Mountain Wind
|
70%
|
For further details, see Note 16B4
|
||
|
Maple Hill
|
70%
|
For further details see Note 16B5
|
|
As at
December 31
|
||||
|
2023
|
||||
|
NIS million
|
||||
|
Current assets
|
614
|
|||
|
Non-current assets
|
5,094
|
|||
|
Current liabilities
|
770
|
|||
|
Non-current liabilities
|
2,808
|
|||
|
Non-controlling interests
|
14
|
|||
|
Total assets, net
|
2,116
|
|||
|
Information on results:
|
||||
|
For the year
ended
December 31
|
||||
|
2023
|
||||
|
NIS million
|
||||
|
Sales
|
2,283
|
|||
|
Profit for the year
|
129
|
|||
|
Total comprehensive income
|
122
|
|||
|
Profit attributable to the non-controlling interests
|
4
|
|||
|
Cash flow data:
|
||||
|
For the year
ended December 31 |
||||
|
2023
|
||||
|
NIS million
|
||||
|
Cash flows from operating activities
|
631
|
|||
|
Cash flows from investing activities
|
(278
|
)
|
||
|
Cash flows for financing activities
|
(286
|
)
|
||
|
Total increase in cash and cash equivalents
|
67
|
|||
|
As at December 31
|
||||||||
|
2023
|
2022
|
|||||||
|
NIS million
|
NIS million
|
|||||||
|
Current assets
|
719
|
443
|
||||||
|
Non-current assets
|
5,623
|
3,790
|
||||||
|
Current liabilities
|
458
|
107
|
||||||
|
Non-current liabilities
|
2,692
|
1,450
|
||||||
|
Non-controlling interests *
|
957
|
803
|
||||||
|
Total assets, net
|
2,235
|
1,873
|
||||||
|
Information on results:
|
|
For the year ended December 31
|
||||||||||||
|
|
2023
|
2022
|
2021
|
|||||||||
|
NIS million
|
NIS million
|
NIS million
|
||||||||||
|
Sales
|
269
|
192
|
164
|
|||||||||
|
Profit (loss) for the year*
|
9
|
60
|
(218
|
)
|
||||||||
|
Total comprehensive income (loss)*
|
(107
|
)
|
153
|
(164
|
)
|
|||||||
|
Profit (loss) attributable to the non-controlling interests*
|
3
|
18
|
(65
|
)
|
||||||||
|
(*) The OPC Power partnership does not file tax returns; therefore - its results are presented before the effect of taxes on income.
|
||||||||||||
|
Cash flow data:
|
|
For the year ended December 31
|
||||||||||||
|
2023
|
2022
|
2021
|
||||||||||
|
NIS million
|
NIS million
|
NIS million
|
||||||||||
|
Cash flows for operating activities (used in operating activities)
|
(72
|
)
|
(54
|
)
|
6
|
|||||||
|
Cash flows from investing activities
|
(1,295
|
)
|
(403
|
)
|
(2,229
|
)
|
||||||
|
Cash flows for financing activities
|
1,495
|
488
|
2,381
|
|||||||||
|
Effect of exchange rate fluctuations on cash and cash equivalent balances
|
(15
|
)
|
28
|
48
|
||||||||
|
Total increase in cash and cash equivalents
|
113
|
59
|
206
|
|||||||||
|
|
1. |
Composition
|
|
As at December 31
|
||||||||
|
2023
|
2022
|
|||||||
|
NIS million
|
NIS million
|
|||||||
|
Loans from non‑controlling interests (1)
|
454
|
437
|
||||||
|
Current maturities
|
(32
|
)
|
(13
|
)
|
||||
|
422
|
424
|
|||||||
|
(1) Loans from non‑controlling interests:
|
|
As at December 31
|
||||||||
|
2023
|
2022
|
|||||||
|
NIS million
|
NIS million
|
|||||||
|
Loan to Rotem (see Section 2 below)
|
26
|
145
|
||||||
|
Loan to OPC Power Ventures (see Section A3 above)
|
368
|
286
|
||||||
|
Loan to OPC Israel (see Section 3 below)
|
60
|
-
|
||||||
|
Other loans
|
-
|
6
|
||||||
|
454
|
437
|
|||||||
|
|
2. |
Loan to Rotem
|
|
|
D. |
Loans from non‑controlling interests (cont.)
|
|
|
2. |
Loan to Rotem (cont.)
|
|
|
3. |
Debt to OPC Israel
|
|
|
E. |
Business combinations that occurred during the reporting period
|
|
|
1. |
Acquisition of the Kiryat Gat Power Plant
|
|
In NIS million
|
||||
|
Cash and cash equivalents
|
2
|
|||
|
Trade and other receivables
|
24
|
|||
|
Property, plant, and equipment and right-of-use assets - facilities and electricity generation and supply license (1)
|
620
|
|||
|
Property, plant, and equipment - land owned by the Gat Partnership (2)
|
84
|
|||
|
Trade and other payables
|
(26
|
)
|
||
|
Loans from former right holders (3)
|
(303
|
)
|
||
|
Deferred tax liability
|
(69
|
)
|
||
|
Net identifiable assets
|
332
|
|||
|
Goodwill (4)
|
220
|
|||
|
Total consideration (5)
|
552
|
|||
|
|
(1) |
The Group opted to implement the expedient as per IFRS 3, and allocate the fair value of the facilities and the electricity supply license to a single asset. The fair value was estimated
using the Multi Period Excess Earning Method (MPEEM). The valuation methodology included a number of key assumptions that constituted the basis for cash flow forecasts, including, among other things, electricity and gas prices, and
nominal post-tax discount rate of 8%-8.75%. The said assets are amortized over approx. 27 years from the acquisition date, taking into account the expected residual value at the end of the assets’ useful life.
|
|
|
(2) |
The fair value of the land was determined by an external and independent land appraiser using the discounted cash flow technique, at a rate of 8%.
|
|
|
(3) |
As stated above, the loans were repaid immediately after the acquisition date.
|
|
|
(4) |
The goodwill arising as part of the business combination reflects the synergy between the activity of the Gat Power Plant and the Rotem and Hadera power plants.
|
|
|
(5) |
The consideration includes a cash payment of approx. NIS 270 million plus deferred consideration, whose present value is estimated, as of the Transaction Completion Date, at approx.
NIS 285 million less a total of approx. NIS 3 million for adjustments for working capital.
|
|
In NIS million
|
||||
|
The aggregate cash flows that were used by the Group for the acquisition transaction:
|
||||
|
Cash and cash equivalents paid
|
549
|
|||
|
Cash and cash equivalents acquired
|
(2
|
)
|
||
|
547
|
||||
|
|
2. |
Acquisition of the Mountain Wind Power Plants
|
|
In NIS million
(Based on the USD exchange rate at acquisition date)
|
In USD million
|
|||||||
|
Trade and other receivables
|
14
|
4
|
||||||
|
Property, plant & equipment (1)
|
451
|
127
|
||||||
|
Intangible assets (1)
|
93
|
26
|
||||||
|
Trade and other payables
|
(3
|
)
|
(1
|
)
|
||||
|
Liabilities in respect of evacuation and removal
|
(5
|
)
|
(2
|
)
|
||||
|
Net identifiable assets
|
550
|
154
|
||||||
|
Goodwill (2)
|
75
|
21
|
||||||
|
Total consideration
|
625
|
175
|
||||||
|
|
(1) |
The fair value was estimated using the discounted cash flow method. The valuation methodology included a number of key assumptions that constituted the basis for cash flow forecasts,
including, among other things, electricity and gas prices, and nominal post-tax discount rate of 5.75%-6.25%. Intangible assets are amortized over 13 to 17 years, and property, plant, and equipment items are depreciated over 20 to 29
years.
|
|
|
(2) |
The goodwill in the transaction reflects the business potential of the Group’s entry into the renewable energies market in New England, USA. The goodwill was allocated at the level of the
renewable energy segment in the USA, since this is the lowest level at which goodwill is subject to monitoring for internal reporting purposes. CPV Group expects that the entire amount of the goodwill will be deductible for tax purposes.
|
|
|
A. |
Condensed financial information on the financial position as at December 31, 2023 and results of operations for 2023:
|
|
Fairview
|
Maryland
|
Shore
|
Towantic
|
Valley
|
Three Rivers
|
|||||||||||||||||||
|
NIS million
|
NIS million
|
NIS million
|
NIS million
|
NIS million
|
NIS million
|
|||||||||||||||||||
|
Holding rate
|
25.0
|
%
|
25.0
|
%
|
37.5
|
%
|
26.0
|
%
|
50.0
|
%
|
10.0
|
%
|
||||||||||||
|
Current assets
|
161
|
169
|
196
|
271
|
174
|
190
|
||||||||||||||||||
|
Non-current assets
|
3,307
|
2,360
|
3,394
|
3,194
|
2,442
|
5,056
|
||||||||||||||||||
|
Total assets
|
3,468
|
2,529
|
3,590
|
3,465
|
2,616
|
5,246
|
||||||||||||||||||
|
Current liabilities
|
235
|
233
|
233
|
730
|
382
|
437
|
||||||||||||||||||
|
Non-current liabilities
|
1,249
|
1,139
|
2,343
|
809
|
1,348
|
2,581
|
||||||||||||||||||
|
Total liabilities
|
1,484
|
1,372
|
2,576
|
1,539
|
1,730
|
3,018
|
||||||||||||||||||
|
Net assets
|
1,984
|
1,157
|
1,014
|
1,926
|
886
|
2,228
|
||||||||||||||||||
|
Company's share
|
496
|
289
|
380
|
501
|
443
|
226
|
||||||||||||||||||
|
Fair value adjustments made on acquisition date
|
287
|
(51
|
)
|
(178
|
)
|
96
|
(2
|
)
|
30
|
|||||||||||||||
|
Carrying amount of investment
|
783
|
238
|
202
|
597
|
441
|
256
|
||||||||||||||||||
|
Fairview
|
Maryland
|
Shore
|
Towantic
|
Valley
|
Three Rivers
|
|||||||||||||||||||
|
NIS million
|
NIS million
|
NIS million
|
NIS million
|
NIS million
|
NIS million
|
|||||||||||||||||||
|
Operating income
|
1,045
|
885
|
602
|
1,244
|
882
|
526
|
||||||||||||||||||
|
Net change in fair value of derivative financial instruments
|
(35
|
)
|
(4
|
)
|
(104
|
)
|
216
|
-
|
10
|
|||||||||||||||
|
Total income
|
1,010
|
881
|
498
|
1,460
|
882
|
536
|
||||||||||||||||||
|
Operating expenses
|
(549
|
)
|
(708
|
)
|
(639
|
)
|
(812
|
)
|
(611
|
)
|
(493
|
)
|
||||||||||||
|
Operating income (loss)
|
461
|
173
|
(141
|
)
|
648
|
271
|
43
|
|||||||||||||||||
|
Finance expenses, net
|
(70
|
)
|
(85
|
)
|
(134
|
)
|
(45
|
)
|
(152
|
)
|
(41
|
)
|
||||||||||||
|
Net income (loss) *
|
391
|
88
|
(275
|
)
|
603
|
119
|
2
|
|||||||||||||||||
|
Other comprehensive income (loss) *
|
(63
|
)
|
(95
|
)
|
(69
|
)
|
(115
|
)
|
84
|
(45
|
)
|
|||||||||||||
|
Comprehensive income (loss)
|
328
|
(7
|
)
|
(344
|
)
|
488
|
203
|
(43
|
)
|
|||||||||||||||
|
Company’s share in profit (loss)
|
98
|
22
|
(103
|
)
|
157
|
60
|
-
|
|||||||||||||||||
|
Company’s share in other comprehensive income (loss)
|
(16
|
)
|
(24
|
)
|
(26
|
)
|
(30
|
)
|
42
|
(5
|
)
|
|||||||||||||
|
Reductions of profit and loss in respect of adjustments to fair value made on the acquisition date
|
(7
|
)
|
2
|
14
|
-
|
1
|
-
|
|||||||||||||||||
|
Share in the profits (losses) of associates
|
91
|
24
|
(89
|
)
|
157
|
61
|
-
|
|||||||||||||||||
|
Group's share in other comprehensive income (loss) of associates
|
(16
|
)
|
(24
|
)
|
(26
|
)
|
(30
|
)
|
42
|
(5
|
)
|
|||||||||||||
|
Depreciation and amortization
|
105
|
78
|
141
|
127
|
75
|
58
|
|
|
B. |
Condensed financial information on the financial position as at December 31, 2022 and results of operations for 2022:
|
|
Fairview
|
Maryland
|
Shore
|
Towantic
|
Valley
|
Three Rivers
|
|||||||||||||||||||
|
NIS million
|
NIS million
|
NIS million
|
NIS million
|
NIS million
|
NIS million
|
|||||||||||||||||||
|
Holding rate
|
25.0
|
%
|
25.0
|
%
|
37.5
|
%
|
26.0
|
%
|
50.0
|
%
|
10.0
|
%
|
||||||||||||
|
Current assets
|
348
|
260
|
327
|
305
|
208
|
115
|
||||||||||||||||||
|
Non-current assets
|
3,304
|
2,304
|
3,461
|
3,295
|
2,388
|
4,710
|
||||||||||||||||||
|
Total assets
|
3,652
|
2,564
|
3,788
|
3,600
|
2,596
|
4,825
|
||||||||||||||||||
|
Current liabilities
|
585
|
260
|
189
|
471
|
1,908
|
169
|
||||||||||||||||||
|
Non-current liabilities
|
1,409
|
1,128
|
2,287
|
1,726
|
23
|
2,889
|
||||||||||||||||||
|
Total liabilities
|
1,994
|
1,388
|
2,476
|
2,197
|
1,931
|
3,058
|
||||||||||||||||||
|
Net assets
|
1,658
|
1,176
|
1,312
|
1,403
|
665
|
1,767
|
||||||||||||||||||
|
Company's share
|
415
|
294
|
492
|
365
|
333
|
213
|
||||||||||||||||||
|
Fair value adjustments made on acquisition date
|
283
|
(51
|
)
|
(186
|
)
|
94
|
(3
|
)
|
29
|
|||||||||||||||
|
Carrying amount of investment
|
698
|
243
|
306
|
459
|
330
|
242
|
||||||||||||||||||
|
Fairview
|
Maryland
|
Shore
|
Towantic
|
Valley
|
Three Rivers
|
|||||||||||||||||||
|
NIS million
|
NIS million
|
NIS million
|
NIS million
|
NIS million
|
NIS million
|
|||||||||||||||||||
|
Operating income
|
1,231
|
813
|
836
|
1,685
|
1,409
|
-
|
||||||||||||||||||
|
Net change in fair value of derivative financial instruments
|
25
|
5
|
41
|
(25
|
)
|
(47
|
)
|
(9
|
)
|
|||||||||||||||
|
Total income
|
1,256
|
818
|
877
|
1,660
|
1,362
|
(9
|
)
|
|||||||||||||||||
|
Operating expenses
|
(873
|
)
|
(629
|
)
|
(745
|
)
|
(1,427
|
)
|
(1,040
|
)
|
(20
|
)
|
||||||||||||
|
Operating income (loss)
|
383
|
189
|
132
|
233
|
322
|
(29
|
)
|
|||||||||||||||||
|
Finance income (expenses), net
|
(50
|
)
|
(77
|
)
|
(110
|
)
|
(74
|
)
|
(89
|
)
|
3
|
|||||||||||||
|
Net income (loss) *
|
333
|
112
|
22
|
159
|
233
|
(26
|
)
|
|||||||||||||||||
|
Other comprehensive income *
|
53
|
22
|
55
|
76
|
4
|
181
|
||||||||||||||||||
|
Comprehensive income
|
386
|
134
|
77
|
235
|
237
|
155
|
||||||||||||||||||
|
Company’s share in profit (loss)
|
83
|
28
|
8
|
41
|
117
|
(3
|
)
|
|||||||||||||||||
|
Company's share in other comprehensive income
|
13
|
6
|
22
|
20
|
2
|
18
|
||||||||||||||||||
|
Share in the profits (losses) of associates
|
79
|
30
|
20
|
41
|
118
|
(3
|
)
|
|||||||||||||||||
|
Group's share in other comprehensive income of associates
|
13
|
6
|
22
|
20
|
2
|
18
|
||||||||||||||||||
|
Depreciation and amortization
|
91
|
71
|
109
|
112
|
64
|
-
|
|
|
C. |
Investments in property, plant and equipment of associates
|
|
Fairview (1)
|
Maryland (2)
|
Shore (3)
|
Towantic
|
Valley (4)
|
Three Rivers
|
|||||||||||||||||||
|
NIS million
|
NIS million
|
NIS million
|
NIS million
|
NIS million
|
NIS million
|
|||||||||||||||||||
|
Holding rate
|
25.0
|
%
|
25.0
|
%
|
37.5
|
%
|
26.0
|
%
|
50.0
|
%
|
10.0
|
%
|
||||||||||||
|
Investments in 2023
|
63
|
101
|
69
|
37
|
64
|
78
|
||||||||||||||||||
|
Investments in 2022
|
52
|
45
|
21
|
27
|
56
|
N/A
|
||||||||||||||||||
|
|
(1) |
In 2023 includes payments in respect of major maintenance work of approx. NIS 19 million.
|
|
|
(2) |
In 2023 and 2022 includes one-off costs in respect of investments in the power plant compound (which are one-off in nature) totaling approx. NIS 76 million and approx. NIS 23 million,
respectively.
|
|
|
(3) |
In 2023 includes payments in respect of major maintenance work of approx. NIS 46 million.
|
|
|
(4) |
In 2023 includes payments in respect of major maintenance work of approx. NIS 17 million. In 2023 and 2022 includes investment in the power plant compound (which is one-off in nature)
totaling approx. NIS 25 million and approx. NIS 32 million, respectively.
|
|
|
D. |
Dividends received from associates
|
|
|
E. |
Attachment of financial statements of material associates
|
|
|
A. |
The annual repayments of the loan principal until a Title V permit is received (if it is, indeed, received) and reaching a certain leveraging ratio as set in the amendment and extension
agreement shall amount to the entire free cash flow amount of Valley (100% cash sweep). After receiving the Title V permit and complying with the coverage ratio that was set, the annual repayment amount shall vary, and will be calculated
based of a combination of a fixed predetermined amortization schedule and a 50% cash sweep mechanism, such that the entire free cash flow in excess of the said amount will be available to Vally, and will be used to cover operating costs,
service the debt, and other liquidity needs.
|
|
|
B. |
On the signing date of the Amendment and Extension Agreement, Valley repaid NIS 200 million (approx. USD 55 million; CPV Group’s share - 50%) by advancing subordinated shareholder loans to
Valley (the Company’s share in the said shareholder loans is approx. NIS 61 million, approx. USD 17 million).
|
|
|
C. |
The base interest was revised to SOFR-based interest plus a weighted average interest margin of approx. 5.75% for the project).
|
|
|
• |
The Israel Segment (through OPC Israel Holdings, 80%) - Under this operating segment, the Company is engaged in the generation and supply of
electricity and energy, mainly to private customers and to the System Operator, and in the development, construction and operation in Israel of power plants and energy generation facilities powered using natural gas and renewable energy.
The Company is also engaged in the electric vehicles charging and energy management in Israel segment through Gnrgy. For further details about the completion of the Veridis transaction in the reporting period and the restructuring of the
area of activity in Israel, see Note 25A1 to the Financial Statements.
|
|
|
• |
US Renewable Energies Segment (through CPV Group, 70%) - in this area of operation, the Company engages in the initiation, development,
construction and operation of renewable energy power plants (solar and wind) in the USA, and the supply of electricity from renewable sources. The activities in this segment are held through wholly owned subsidiaries of CPV Group.
|
|
|
• |
Energy Transition in the USA (through CPV Group, 70%) - in this area of activity, the Company is engaged in the initiation, development,
construction and operation of conventional energy power plants (natural gas), which supply efficient and reliable electricity. The active power plants in this area of operation are held through associates (which are not included in CPV
Group’s financial statements, and accordingly in the Company’s Financial Statements).
|
|
For the year ended December 31, 2023
|
||||||||||||||||||||||||
|
Israel
|
Energy Transition - United States
|
Re-newable energies in the USA
|
Other activities in the USA
|
Adjust-ments to conso-lidated
|
ConsolidatedConso-lidated
- total
|
|||||||||||||||||||
|
In NIS million
|
||||||||||||||||||||||||
|
Income from sales and provision of services
|
2,283
|
1,525
|
146
|
123
|
(1,525
|
)
|
2,552
|
|||||||||||||||||
|
EBITDA after proportionate consolidation adjusted1 for the period
|
580
|
577
|
31
|
6
|
(580
|
)
|
614
|
|||||||||||||||||
|
Adjustments:
|
||||||||||||||||||||||||
|
Share in profits of associates
|
242
|
|||||||||||||||||||||||
|
Net pre-commissioning expenses of Zomet
|
(18
|
)
|
||||||||||||||||||||||
|
General and administrative expenses at the US headquarters (not allocated to segments in the USA)
|
(58
|
)
|
||||||||||||||||||||||
|
General and administrative expenses at the Company’s headquarters (not allocated to operating segments)
|
(27
|
)
|
||||||||||||||||||||||
|
Total EBITDA for the year
|
753
|
|||||||||||||||||||||||
|
Depreciation and amortization
|
(303
|
)
|
||||||||||||||||||||||
|
Finance expenses, net
|
(197
|
)
|
||||||||||||||||||||||
|
Other expenses, net
|
(16
|
)
|
||||||||||||||||||||||
|
(516
|
)
|
|||||||||||||||||||||||
|
Profit before taxes on income
|
237
|
|||||||||||||||||||||||
|
Expenses for income tax
|
(68
|
)
|
||||||||||||||||||||||
|
Profit for the year
|
169
|
|||||||||||||||||||||||
|
For the year ended December 31, 2022
|
||||||||||||||||||||||||
|
Israel
|
Energy Transition - United States
|
Re-newable energies in the USA
|
Other activities in the USA
|
Adjust-ments to conso-lidated
|
Consol-idated - total
|
|||||||||||||||||||
|
In NIS million
|
||||||||||||||||||||||||
|
Income from sales and provision of services
|
1,735
|
1,967
|
95
|
97
|
(1,967
|
)
|
1,927
|
|||||||||||||||||
|
EBITDA adjusted after proportionate consolidation for the year
|
367
|
562
|
26
|
-
|
(564
|
)
|
391
|
|||||||||||||||||
|
Adjustments:
|
||||||||||||||||||||||||
|
Share in profits of associates
|
286
|
|||||||||||||||||||||||
|
Net pre-commissioning expenses of Zomet
|
(10
|
)
|
||||||||||||||||||||||
|
General and administrative expenses at the US headquarters (not allocated to segments in the USA)
|
(111
|
)
|
||||||||||||||||||||||
|
General and administrative expenses at the Company’s headquarters (not allocated to operating segments)
|
(26
|
)
|
||||||||||||||||||||||
|
Total EBITDA for the year
|
530
|
|||||||||||||||||||||||
|
Depreciation and amortization
|
(201
|
)
|
||||||||||||||||||||||
|
Finance expenses, net
|
(47
|
)
|
||||||||||||||||||||||
|
(248
|
)
|
|||||||||||||||||||||||
|
Profit before taxes on income
|
282
|
|||||||||||||||||||||||
|
Expenses for income tax
|
(65
|
)
|
||||||||||||||||||||||
|
Profit for the year
|
217
|
|||||||||||||||||||||||
|
For the year ended December 31, 2021
|
||||||||||||||||||||||||
|
Israel
|
Energy Transition - United States
|
Re-newable energies in the
USA
|
Other activities in the USA
|
Adjust-ments to conso-lidated
|
Consol-idated
- total
|
|||||||||||||||||||
|
In NIS million
|
||||||||||||||||||||||||
|
Income from sales and provision of services
|
1,412
|
1,110
|
82
|
81
|
(1,110
|
)
|
1,575
|
|||||||||||||||||
|
EBITDA adjusted after proportionate consolidation for the year
|
352
|
339
|
29
|
8
|
(340
|
)
|
388
|
|||||||||||||||||
|
Adjustments:
|
||||||||||||||||||||||||
|
Share in losses of associates
|
(35
|
)
|
||||||||||||||||||||||
|
General and administrative expenses at the US headquarters (not allocated to segments in the USA)
|
(73
|
)
|
||||||||||||||||||||||
|
General and administrative expenses at the Company’s headquarters (not allocated to operating segments)
|
(21
|
)
|
||||||||||||||||||||||
|
Total EBITDA for the year
|
259
|
|||||||||||||||||||||||
|
Depreciation and amortization
|
(179
|
)
|
||||||||||||||||||||||
|
Finance expenses, net
|
(457
|
)
|
||||||||||||||||||||||
|
Other expenses, net
|
(3
|
)
|
||||||||||||||||||||||
|
(639
|
)
|
|||||||||||||||||||||||
|
Loss before income taxes
|
(380
|
)
|
||||||||||||||||||||||
|
Tax benefit
|
77
|
|||||||||||||||||||||||
|
Loss for the year
|
(303
|
)
|
||||||||||||||||||||||
|
|
1. |
In November 2017, a petition was filed with the Tel Aviv-Jaffa District Court for certification of a derivative claim on behalf of Bazan Ltd. (hereinafter – “Bazan” and the “Petition”,
respectively) by a Bazan shareholder. The Petition is based on the petitioner’s claim that the engagement in the electricity purchase transaction between Bazan and Rotem is an extraordinary interested party transaction that did not
receive the approval of the general meeting of Bazan shareholders on the relevant dates. The respondents to the Petition include Bazan, Rotem, Israel Corporation Ltd. and members of Bazan’s board of directors at the time of the engagement
in the electricity purchase transaction. The remedies sought include a mandatory injunction and financial remedies.
In July 2018, the Company submitted its response to the motion. The Company rejected the claims made in the motion. In August 2022, after the approval by the relevant organs in the Company, a settlement
arrangement was filed with the court for approval. In February 2023 the court handed down a judgment that approved the settlement agreement, and accordingly Rotem paid in the reporting period a total of approx. NIS 2 million, which
reflects its share as set out in the settlement arrangement.
|
|
|
2. |
In January 2018, a petition was filed with the District Court in Tel Aviv-Jaffa for certification of a derivative claim (hereinafter in this Section – the “Petition”) by a shareholder in Bazan against
former and current directors of Bazan, ICL Group Ltd., the Company, Rotem and Hadera, and against Israel Corporation Ltd and its controlling shareholders, regarding gas purchase transactions of the forgoing Group Companies, including
the inter-company aspects, in a transaction of the Companies for the purchase of natural gas from Energean (for further details see Note 28C), aspects related to the method of approval by Bazan organs of the natural gas sales
transaction from Tamar Group (for further details see Note 28C), and a transaction for sale of surplus gas to Bazan (in recent years, no such transactions were carried out). Under the motion to certify a derivative claim, the
plaintiff petitions for declaratory relief as well as restitution of benefits which it claims were awarded to the respondents, while failing to quantify their value. Therefore, this derivative claim cannot be quantified. In August
2018, the Company submitted its response to the motion. The Company rejected the claims made in the motion. Evidentiary hearings were held in the second half of 2021. Closing statements on behalf of the Company were filed to the Court
in November 2022. In a new ruling handed down in November 2023, the Court dismissed the entire motion.
|
|
|
3. |
In previous years, the Israel Electric Corporation and System Operator have contacted Rotem in connection with open issues between the parties. In this regard, the IEC raised contentions regarding
past accounting and collection differences in amounts that are immaterial to the Company. In addition, the IEC stated its position with respect to additional matters in the arrangement between the parties relating to the
acquisition price of surplus energy and the acquisition cost of energy by Rotem during performance of tests. Rotem’s position regarding the matters raised by the IEC, based on its legal counsels, was different and the parties held
discussions in order to reach agreements. In March 2022, a settlement agreement was signed between Rotem and IEC (which was consistent with the Company’s assessments and the provisions made as of that date), under which Rotem paid
the IEC a total of approx. NIS 5.5 million in respect of some of the disputes between the parties. It should be noted that the Settlement Agreement does not constitute a settlement or waiver of the claims of the parties and/or of
the System Operator regarding other existing or future open issues.
|
|
|
4. |
In January 2016, an agreement was signed between Hadera and SerIDOM Servicios Integrados IDOM, SAU (hereinafter in this Section - the "Construction Contractor”) for the design,
engineering, purchase and construction of a cogeneration power plant for consideration in an amount equivalent to an estimated total of approx. NIS 639 million (as amended several times as part of additions and modification orders), which
is payable on the basis of the progress of construction and compliance with milestones (hereinafter - the "Construction Agreement"). The Construction Contractor provided Hadera with bank guarantees (in various currencies), and a corporate
guarantee of the parent company to secure these obligations.
|
|
|
5. |
The Group companies usually record provisions for claims which, in their management’s opinion, based on their legal counsels, will more likely than not materialize. The provision is made
according to an estimate of the expected amounts of the payments for settlement of the liability. As at the report date, additional exposure for which there is no provision amounts to approx. NIS 24 million.
|
|
|
A. |
For further details regarding developments in commitments, legal claims and other liabilities in the reporting period and thereafter, see Note 28.
|
|
|
B. |
For further details regarding developments in credit from banking corporations and others and debentures in the reporting period and thereafter, see Notes 16 and 17, respectively.
|
|
|
|
As at December 31, 2023
|
|||||||||||||
|
|
|
US GAAP
|
Adjustments
|
IFRS
|
|||||||||||
|
|
|
In USD thousand
|
In USD thousand
|
In USD thousand
|
|||||||||||
|
Cash and cash equivalents
|
98
|
1,059
|
1,157
|
||||||||||||
|
Restricted cash
|
1,074
|
(1,059
|
)
|
15
|
|||||||||||
|
Property, plant & equipment
|
A, C, D
|
|
768,584
|
(150,434
|
)
|
618,150
|
|||||||||
|
Intangible assets
|
D |
|
19,935
|
(19,935
|
)
|
-
|
|||||||||
|
Other assets
|
|
102,031
|
-
|
102,031
|
|||||||||||
|
|
|||||||||||||||
|
Total assets
|
|
891,722
|
(170,369
|
)
|
721,353
|
||||||||||
|
|
|||||||||||||||
|
Accounts payable and deferred expenses
|
A |
|
13,750
|
(1,155
|
)
|
12,595
|
|||||||||
|
Other liabilities
|
|
467,005
|
(2,513
|
)
|
464,492
|
||||||||||
|
|
|||||||||||||||
|
Total liabilities
|
|
480,755
|
(3,668
|
)
|
477,087
|
||||||||||
|
|
|||||||||||||||
|
Partners’ equity
|
A, C
|
|
410,967
|
(166,701
|
)
|
244,266
|
|||||||||
|
|
|||||||||||||||
|
Total liabilities and equity
|
891,722
|
(170,369
|
)
|
721,353
|
|||||||||||
|
As at December 31, 2022
|
|||||||||||||||
|
US GAAP
|
Adjustments
|
IFRS
|
|||||||||||||
|
In USD thousand
|
In USD thousand
|
In USD thousand
|
|||||||||||||
|
Cash and cash equivalents
|
145
|
1,041
|
1,186
|
||||||||||||
|
Restricted cash
|
|
4,630
|
(1,041
|
)
|
3,589
|
||||||||||
|
Property, plant & equipment
|
A, C, D
|
|
786,365
|
(165,597
|
)
|
620,768
|
|||||||||
|
Intangible assets
|
D |
|
20,604
|
(20,604
|
)
|
-
|
|||||||||
|
Other assets
|
112,188
|
-
|
112,188
|
||||||||||||
|
Total assets
|
923,932
|
(186,201
|
)
|
737,731
|
|||||||||||
|
Accounts payable and deferred expenses
|
A |
|
31,775
|
(1,409
|
)
|
30,366
|
|||||||||
|
Other liabilities
|
518,259
|
-
|
518,259
|
||||||||||||
|
Total liabilities
|
550,034
|
(1,409
|
)
|
548,625
|
|||||||||||
|
Partners’ equity
|
A, C
|
|
373,898
|
(184,792
|
)
|
189,106
|
|||||||||
|
Total liabilities and equity
|
923,932
|
(186,201
|
)
|
737,731
|
|||||||||||
|
For the year ended December 31, 2023
|
|||||||||||||||
|
US GAAP
|
Adjustments
|
IFRS
|
|||||||||||||
|
In USD thousand
|
In USD thousand
|
In USD thousand
|
|||||||||||||
|
Income
|
219,128
|
-
|
219,128
|
||||||||||||
|
Operating expenses
|
A |
|
135,898
|
(9,860
|
)
|
126,038
|
|||||||||
|
Depreciation and amortization
|
C |
|
26,077
|
(5,718
|
)
|
20,359
|
|||||||||
|
|
|||||||||||||||
|
Operating profit
|
|
57,153
|
15,578
|
72,731
|
|||||||||||
|
|
|||||||||||||||
|
Finance expenses
|
B |
|
45,029
|
(4,666
|
)
|
40,363
|
|||||||||
|
|
|||||||||||||||
|
Profit for the year
|
|
12,124
|
20,244
|
32,368
|
|||||||||||
|
|
|||||||||||||||
|
Other comprehensive income - derivative financial instruments
|
B |
|
24,791
|
(2,153
|
)
|
22,638
|
|||||||||
|
Comprehensive income for the year
|
36,915
|
18,091
|
55,006
|
||||||||||||
|
For the year ended December 31, 2022
|
|||||||||||||||
|
US GAAP
|
Adjustments
|
IFRS
|
|||||||||||||
|
In USD thousand
|
In USD thousand
|
In USD thousand
|
|||||||||||||
|
Income
|
405,548
|
-
|
405,548
|
||||||||||||
|
Operating expenses
|
A |
|
296,645
|
(5,603
|
)
|
291,042
|
|||||||||
|
Depreciation and amortization
|
C |
|
25,714
|
(6,709
|
)
|
19,005
|
|||||||||
|
|
|||||||||||||||
|
Operating profit
|
|
83,189
|
12,312
|
95,501
|
|||||||||||
|
|
|||||||||||||||
|
Finance expenses
|
B |
|
32,913
|
(6,546
|
)
|
26,367
|
|||||||||
|
|
|||||||||||||||
|
Profit for the year
|
|
50,276
|
18,858
|
69,134
|
|||||||||||
|
|
|||||||||||||||
|
Other comprehensive income - derivative financial instruments
|
B |
|
7,724
|
(6,546
|
)
|
1,178
|
|||||||||
|
Comprehensive income for the year
|
58,000
|
12,312
|
70,312
|
||||||||||||
|
For the year ended December 31, 2023
|
|||||||||||||||
|
US GAAP
|
Adjustments
|
IFRS
|
|||||||||||||
|
In USD thousand
|
In USD thousand
|
In USD thousand
|
|||||||||||||
|
Profit for the year
|
A, B, C
|
|
12,124
|
20,244
|
32,368
|
||||||||||
|
|
|||||||||||||||
|
Net cash from operating activities
|
|
48,123
|
-
|
48,123
|
|||||||||||
|
Net cash provided by (used in) investing activities
|
E |
|
(7,601
|
)
|
21,585
|
13,984
|
|||||||||
|
Net cash used in financing activities
|
|
(62,135
|
)
|
-
|
(62,135
|
)
|
|||||||||
|
|
|||||||||||||||
|
Net decrease in cash and cash equivalents
|
|
(21,613
|
)
|
21,585
|
(28
|
)
|
|||||||||
|
|
|||||||||||||||
|
Balance of cash and cash equivalents at the beginning of the year
|
E |
|
145
|
1,041
|
1,186
|
||||||||||
|
|
|||||||||||||||
|
Restricted cash balance at beginning of year
|
E |
|
57,680
|
(57,680
|
)
|
-
|
|||||||||
|
|
|||||||||||||||
|
Balance of cash and cash equivalents at the end of the year
|
E |
|
98
|
1,059
|
1,157
|
||||||||||
|
|
|||||||||||||||
|
Restricted cash balance at end of year
|
E |
|
36,114
|
(36,113
|
)
|
1
|
|||||||||
|
For the year ended December 31, 2022
|
|||||||||||||||
|
US GAAP
|
Adjustments
|
IFRS
|
|||||||||||||
|
In USD thousand
|
In USD thousand
|
In USD thousand
|
|||||||||||||
|
|
|||||||||||||||
|
Profit for the year
|
A, B, C
|
|
50,276
|
18,858
|
69,134
|
||||||||||
|
|
|||||||||||||||
|
Net cash from operating activities
|
|
62,497
|
-
|
62,497
|
|||||||||||
|
Net cash provided by (used in) investing activities
|
E |
|
(11,226
|
)
|
19,571
|
8,345
|
|||||||||
|
Net cash used in financing activities
|
|
(69,934
|
)
|
-
|
(69,934
|
)
|
|||||||||
|
|
|||||||||||||||
|
Net increase (decrease) in cash and cash equivalents
|
|
(18,663
|
)
|
19,571
|
908
|
||||||||||
|
|
|||||||||||||||
|
Balance of cash and cash equivalents at the beginning of the year
|
E |
|
98
|
180
|
278
|
||||||||||
|
|
|||||||||||||||
|
Restricted cash balance at beginning of year
|
E |
|
76,390
|
(76,390
|
)
|
-
|
|||||||||
|
|
|||||||||||||||
|
Balance of cash and cash equivalents at the end of the year
|
E |
|
145
|
1,041
|
1,186
|
||||||||||
|
|
|||||||||||||||
|
Restricted cash balance at end of year
|
E |
|
57,680
|
(57,680
|
)
|
-
|
|||||||||
|
As at December 31, 2023
|
|||||||||||||||
|
US GAAP
|
Adjustments
|
IFRS
|
|||||||||||||
|
In USD thousand
|
In USD thousand
|
In USD thousand
|
|||||||||||||
|
Cash and cash equivalents
|
52
|
265
|
317
|
||||||||||||
|
Restricted cash
|
947
|
(265
|
)
|
682
|
|||||||||||
|
Property, plant & equipment
|
A, D
|
|
817,316
|
57,540
|
874,856
|
||||||||||
|
Intangible assets
|
D |
|
26,753
|
(26,753
|
)
|
-
|
|||||||||
|
Other assets
|
80,408
|
-
|
80,408
|
||||||||||||
|
Total assets
|
925,476
|
30,787
|
956,263
|
||||||||||||
|
Accounts payable and deferred expenses
|
A |
|
15,034
|
(5,435
|
)
|
9,599
|
|||||||||
|
Other liabilities
|
399,165
|
420
|
399,585
|
||||||||||||
|
Total liabilities
|
414,199
|
(5,015
|
)
|
409,184
|
|||||||||||
|
Partners’ equity
|
A
|
|
511,277
|
35,802
|
547,079
|
||||||||||
|
Total liabilities and equity
|
925,476
|
30,787
|
956,263
|
||||||||||||
|
As at December 31, 2022
|
|||||||||||||||
|
US GAAP
|
Adjustments
|
IFRS
|
|||||||||||||
|
In USD thousand
|
In USD thousand
|
In USD thousand
|
|||||||||||||
|
Cash and cash equivalents
|
89
|
1,370
|
1,459
|
||||||||||||
|
Restricted cash
|
10,098
|
(1,370
|
)
|
8,728
|
|||||||||||
|
Property, plant & equipment
|
A,D
|
|
839,665
|
45,684
|
885,349
|
||||||||||
|
Intangible assets
|
D |
|
27,624
|
(27,624
|
)
|
-
|
|||||||||
|
Other assets
|
142,274
|
-
|
142,274
|
||||||||||||
|
Total assets
|
1,019,750
|
18,060
|
1,037,810
|
||||||||||||
|
Accounts payable and deferred expenses
|
A |
|
38,800
|
(6,354
|
)
|
32,446
|
|||||||||
|
Other liabilities
|
533,630
|
700
|
534,330
|
||||||||||||
|
Total liabilities
|
572,430
|
(5,654
|
)
|
566,776
|
|||||||||||
|
Partners’ equity
|
A |
|
447,320
|
23,714
|
471,034
|
||||||||||
|
Total liabilities and equity
|
1,019,750
|
18,060
|
1,037,810
|
||||||||||||
|
For the year ended December 31, 2023
|
|||||||||||||||||||
|
US GAAP
|
IFRS adjustments
|
Adjustments to the Group’s accounting policies*
|
IFRS - according to the Group’s accounting policies
|
||||||||||||||||
|
In USD thousand
|
In USD thousand
|
In USD thousand
|
In USD thousand
|
||||||||||||||||
|
Income
|
256,103
|
3,898
|
17,660
|
277,661
|
|||||||||||||||
|
Operating expenses
|
A |
|
119,737
|
(12,985
|
)
|
17,660
|
124,412
|
||||||||||||
|
Depreciation and amortization
|
|
27,186
|
1,177
|
17,660
|
46,023
|
||||||||||||||
|
|
|||||||||||||||||||
|
Operating profit
|
|
109,180
|
15,706
|
(17,660
|
)
|
107,226
|
|||||||||||||
|
|
|||||||||||||||||||
|
Finance expenses
|
B |
|
24,191
|
(5,416
|
)
|
-
|
18,775
|
||||||||||||
|
|
|||||||||||||||||||
|
Profit for the period
|
|
84,989
|
21,122
|
(17,660
|
)
|
88,451
|
|||||||||||||
|
|
|||||||||||||||||||
|
Other comprehensive loss - interest rate swaps
|
B |
|
(8,032
|
)
|
(9,034
|
)
|
-
|
(17,066
|
)
|
||||||||||
|
Comprehensive income for the year
|
76,957
|
12,088
|
(17,660
|
)
|
71,385
|
||||||||||||||
|
For the year ended December 31, 2022
|
|||||||||||||||||||
|
US GAAP
|
IFRS adjustments
|
Adjustments to the Group’s accounting policies*
|
IFRS - according to the Group’s accounting policies
|
||||||||||||||||
|
In USD thousand
|
In USD thousand
|
In USD thousand
|
In USD thousand
|
||||||||||||||||
|
Income
|
450,906
|
-
|
(76,939
|
)
|
373,967
|
||||||||||||||
|
Operating expenses
|
A |
|
345,546
|
(8,251
|
)
|
(76,939
|
)
|
260,356
|
|||||||||||
|
|
|||||||||||||||||||
|
Operating profit
|
|
105,360
|
8,251
|
-
|
113,611
|
||||||||||||||
|
|
|||||||||||||||||||
|
Finance expenses
|
B |
|
21,065
|
(6,360
|
)
|
-
|
14,705
|
||||||||||||
|
|
|||||||||||||||||||
|
Profit for the period
|
|
84,295
|
14,611
|
-
|
98,906
|
||||||||||||||
|
|
|||||||||||||||||||
|
Other comprehensive income - interest rate swaps
|
B |
|
21,810
|
(6,080
|
)
|
-
|
15,730
|
||||||||||||
|
Comprehensive income for the year
|
106,105
|
8,531
|
-
|
114,636
|
|||||||||||||||
|
(*)
|
Represents adjustments to the Group’s accounting policies regarding the presentation of hedging transactions regarding energy margins.
|
|
For the year ended December 31, 2023
|
|||||||||||||||
|
US GAAP
|
Adjustments
|
IFRS
|
|||||||||||||
|
In USD thousand
|
In USD thousand
|
In USD thousand
|
|||||||||||||
|
|
|||||||||||||||
|
Profit for the year
|
A, B
|
|
84,989
|
21,122
|
106,111
|
||||||||||
|
|
|||||||||||||||
|
Net cash from operating activities
|
|
138,604
|
-
|
138,604
|
|||||||||||
|
Net cash provided by (used in) investing activities
|
E |
|
(3,967
|
)
|
8,971
|
5,004
|
|||||||||
|
Net cash used in financing activities
|
|
(144,750
|
)
|
-
|
(144,750
|
)
|
|||||||||
|
|
|||||||||||||||
|
Net decrease in cash and cash equivalents
|
|
(10,113
|
)
|
8,971
|
(1,142
|
)
|
|||||||||
|
|
|||||||||||||||
|
Balance of cash and cash equivalents at the beginning of the year
|
E |
|
89
|
1,370
|
1,459
|
||||||||||
|
|
|||||||||||||||
|
Restricted cash balance at beginning of year
|
E |
|
38,404
|
(38,404
|
)
|
-
|
|||||||||
|
|
|||||||||||||||
|
Balance of cash and cash equivalents at the end of the year
|
E |
|
52
|
265
|
317
|
||||||||||
|
|
|||||||||||||||
|
Restricted cash balance at end of year
|
E |
|
28,328
|
(28,328
|
)
|
-
|
|||||||||
|
For the year ended December 31, 2022
|
|||||||||||||||
|
US GAAP
|
Adjustments
|
IFRS
|
|||||||||||||
|
In USD thousand
|
In USD thousand
|
In USD thousand
|
|||||||||||||
|
Profit for the year
|
A, B
|
|
84,295
|
14,611
|
98,906
|
||||||||||
|
|
|||||||||||||||
|
Net cash from operating activities
|
|
140,040
|
-
|
140,040
|
|||||||||||
|
Net cash provided by (used in) investing activities
|
E |
|
(7,323
|
)
|
31,299
|
23,976
|
|||||||||
|
Net cash used in financing activities
|
|
(166,965
|
)
|
-
|
(166,965
|
)
|
|||||||||
|
|
|||||||||||||||
|
Net decrease in cash and cash equivalents
|
|
(34,248
|
)
|
31,299
|
(2,949
|
)
|
|||||||||
|
|
|||||||||||||||
|
Balance of cash and cash equivalents at the beginning of the year
|
E |
|
78
|
4,330
|
4,408
|
||||||||||
|
|
|||||||||||||||
|
Restricted cash balance at beginning of year
|
E |
|
72,663
|
(72,663
|
)
|
-
|
|||||||||
|
|
|
||||||||||||||
|
Balance of cash and cash equivalents at the end of the year
|
E |
|
89
|
1,370
|
1,459
|
||||||||||
|
|
|||||||||||||||
|
Restricted cash balance at end of year
|
E |
|
38,404
|
(38,404
|
)
|
-
|
|||||||||
|
As at December 31, 2023
|
|||||||||||||||
|
US GAAP
|
Adjustments
|
IFRS
|
|||||||||||||
|
In USD thousand
|
In USD thousand
|
In USD thousand
|
|||||||||||||
|
Cash and cash equivalents
|
100
|
1,946
|
2,046
|
||||||||||||
|
Restricted cash
|
|
2,004
|
(1,946
|
)
|
58
|
||||||||||
|
Property, plant & equipment
|
A, D
|
|
740,844
|
80,810
|
821,654
|
||||||||||
|
Intangible assets
|
D |
|
51,333
|
(51,333
|
)
|
-
|
|||||||||
|
Other assets
|
|
131,405
|
-
|
131,405
|
|||||||||||
|
|
|||||||||||||||
|
Total assets
|
|
925,686
|
29,477
|
955,163
|
|||||||||||
|
|
|||||||||||||||
|
Accounts payable and deferred expenses
|
A |
|
14,167
|
(2,107
|
)
|
12,060
|
|||||||||
|
Other liabilities
|
|
412,217
|
(105
|
)
|
412,112
|
||||||||||
|
|
|||||||||||||||
|
Total liabilities
|
|
426,384
|
(2,212
|
)
|
424,172
|
||||||||||
|
|
|||||||||||||||
|
Partners’ equity
|
A |
|
499,302
|
31,689
|
530,991
|
||||||||||
|
Total liabilities and equity
|
925,686
|
29,477
|
955,163
|
||||||||||||
|
As at December 31, 2022
|
|||||||||||||||
|
US GAAP
|
Adjustments
|
IFRS
|
|||||||||||||
|
In USD thousand
|
In USD thousand
|
In USD thousand
|
|||||||||||||
|
Cash and cash equivalents
|
90
|
40,230
|
40,320
|
||||||||||||
|
Restricted cash
|
|
42,251
|
(40,230
|
)
|
2,021
|
||||||||||
|
Property, plant & equipment
|
A, D
|
|
764,996
|
81,413
|
846,409
|
||||||||||
|
Intangible assets
|
D |
|
54,842
|
(54,842
|
)
|
-
|
|||||||||
|
Other assets
|
|
134,217
|
-
|
134,217
|
|||||||||||
|
|
|||||||||||||||
|
Total assets
|
|
996,396
|
26,571
|
1,022,967
|
|||||||||||
|
|
|||||||||||||||
|
Accounts payable and deferred expenses
|
A |
|
21,025
|
(1,857
|
)
|
19,168
|
|||||||||
|
Other liabilities
|
|
605,364
|
(175
|
)
|
605,189
|
||||||||||
|
|
|||||||||||||||
|
Total liabilities
|
|
626,389
|
(2,032
|
)
|
624,357
|
||||||||||
|
|
|||||||||||||||
|
Partners’ equity
|
A |
|
370,007
|
28,603
|
398,610
|
||||||||||
|
Total liabilities and equity
|
996,396
|
26,571
|
1,022,967
|
||||||||||||
|
For the year ended December 31, 2023
|
|||||||||||||||||||
|
US GAAP
|
IFRS adjustments
|
Adjustments to the Group’s accounting policies*
|
IFRS - according to the Group’s accounting policies
|
||||||||||||||||
|
In USD thousand
|
In USD thousand
|
In USD thousand
|
In USD thousand
|
||||||||||||||||
|
Income
|
380,081
|
19,039
|
15,698
|
414,818
|
|||||||||||||||
|
Operating expenses
|
A |
|
198,011
|
(8,765
|
)
|
15,698
|
204,944
|
||||||||||||
|
Depreciation and amortization
|
A |
|
28,843
|
5,609
|
-
|
34,452
|
|||||||||||||
|
|
|||||||||||||||||||
|
Operating profit
|
|
153,227
|
22,195
|
-
|
175,422
|
||||||||||||||
|
|
|||||||||||||||||||
|
Finance expenses
|
B |
|
19,317
|
(7,346
|
)
|
-
|
11,971
|
||||||||||||
|
|
|||||||||||||||||||
|
Profit for the year
|
|
133,910
|
29,541
|
-
|
163,451
|
||||||||||||||
|
|
|||||||||||||||||||
|
Other comprehensive loss - interest rate swaps
|
B |
|
(4,815
|
)
|
(26,455
|
)
|
-
|
(31,270
|
)
|
||||||||||
|
Comprehensive income for the year
|
129,095
|
3,086
|
-
|
132,181
|
|||||||||||||||
|
For the year ended December 31, 2022
|
|||||||||||||||||||
|
US GAAP
|
IFRS adjustments
|
Adjustments to the Group’s accounting policies*
|
IFRS - according to the Group’s accounting policies
|
||||||||||||||||
|
In USD thousand
|
In USD thousand
|
In USD thousand
|
In USD thousand
|
||||||||||||||||
|
Income
|
445,028
|
-
|
49,637
|
494,665
|
|||||||||||||||
|
Operating expenses
|
A |
|
349,588
|
(7,460
|
)
|
49,637
|
391,765
|
||||||||||||
|
Depreciation and amortization
|
A |
|
28,815
|
4,602
|
-
|
33,417
|
|||||||||||||
|
|
|||||||||||||||||||
|
Operating profit
|
|
66,625
|
2,858
|
-
|
69,483
|
||||||||||||||
|
|
|||||||||||||||||||
|
Finance expenses
|
B |
|
28,645
|
(6,597
|
)
|
-
|
22,048
|
||||||||||||
|
|
|||||||||||||||||||
|
Profit for the year
|
|
37,980
|
9,455
|
-
|
47,435
|
||||||||||||||
|
|
|||||||||||||||||||
|
Other comprehensive income - interest rate swaps
|
B |
|
29,284
|
(6,667
|
)
|
-
|
22,617
|
||||||||||||
|
Comprehensive income for the year
|
67,264
|
2,788
|
-
|
70,052
|
|||||||||||||||
|
For the year ended December 31, 2023
|
|||||||||||||||
|
US GAAP
|
Adjustments
|
IFRS
|
|||||||||||||
|
In USD thousand
|
In USD thousand
|
In USD thousand
|
|||||||||||||
|
Profit for the year
|
A, B
|
|
133,910
|
29,541
|
163,451
|
||||||||||
|
|
|||||||||||||||
|
Net cash from operating activities
|
|
122,769
|
-
|
122,769
|
|||||||||||
|
Net cash provided by (used in) investing activities
|
E |
|
(1,182
|
)
|
34,787
|
33,605
|
|||||||||
|
Net cash used in financing activities
|
|
(194,648
|
)
|
-
|
(194,648
|
)
|
|||||||||
|
|
|||||||||||||||
|
Net decrease in cash and cash equivalents
|
|
(73,061
|
)
|
34,787
|
(38,274
|
)
|
|||||||||
|
|
|||||||||||||||
|
Balance of cash and cash equivalents at the beginning of the year
|
E |
|
90
|
40,230
|
40,320
|
||||||||||
|
|
|||||||||||||||
|
Restricted cash balance at beginning of year
|
E |
|
119,838
|
(119,838
|
)
|
-
|
|||||||||
|
|
|||||||||||||||
|
Balance of cash and cash equivalents at the end of the year
|
E |
|
100
|
1,946
|
2,046
|
||||||||||
|
|
|||||||||||||||
|
Restricted cash balance at end of year
|
E |
|
46,767
|
(46,767
|
)
|
-
|
|||||||||
|
For the year ended December 31, 2022
|
|||||||||||||||
|
US GAAP
|
Adjustments
|
IFRS
|
|||||||||||||
|
In USD thousand
|
In USD thousand
|
In USD thousand
|
|||||||||||||
|
Profit for the year
|
A, B
|
|
37,980
|
9,455
|
47,435
|
||||||||||
|
|
|||||||||||||||
|
Net cash from operating activities
|
|
78,126
|
-
|
78,126
|
|||||||||||
|
Net cash used in investing activities
|
E |
|
(519
|
)
|
(2,548
|
)
|
(3,067
|
)
|
|||||||
|
Net cash used in financing activities
|
|
(36,189
|
)
|
-
|
(36,189
|
)
|
|||||||||
|
|
|||||||||||||||
|
Net increase in cash and cash equivalents
|
|
41,418
|
(2,548
|
)
|
38,870
|
||||||||||
|
|
|||||||||||||||
|
Balance of cash and cash equivalents at the beginning of the year
|
E |
|
100
|
1,350
|
1,450
|
||||||||||
|
|
|||||||||||||||
|
Restricted cash balance at beginning of year
|
E |
|
78,410
|
(78,410
|
)
|
-
|
|||||||||
|
|
|||||||||||||||
|
Balance of cash and cash equivalents at the end of the year
|
E |
|
90
|
40,230
|
40,320
|
||||||||||
|
|
|||||||||||||||
|
Restricted cash balance at end of year
|
E |
|
119,838
|
(119,838
|
)
|
-
|
|||||||||
|
|
A. |
Maintenance costs under the Long Term Control Plan agreement: under IFRS (hereinafter - the “LTPC”), variable payments which were paid in accordance with the
milestones as set in the LTCP agreement are capitalized to the cost of property, plant and equipment and depreciated over the period from the date on which maintenance work was carried out until the date on which maintenance work is
due to take place again. Under US GAAP, the said payments are recognized as expenses on the maintenance work’s execution date, and recognized in profit and loss.
|
|
|
B. |
Hedge effectiveness of interest rate swaps: in accordance with the IFRS - the associates recognize adjustments relating to the ineffective portion of its cash flow hedge under finance expenses
in profit and loss. Under US GAAP, there is no part which is not effective, and the hedging results are recognized in full in other comprehensive income.
|
|
|
C. |
Impairment of property, plant and equipment in Valley: In 2021, prior to the acquisition date of CPV Group, indications of impairment of the property, plant and equipment were identified.
Under IFRS, the carrying amount exceeded the recoverable amount (the discounted cash flows that Valley expects to generate from the asset), and consequently an impairment loss was recognized. Under US GAAP, the
non-discounted cash flows that Valley expects to generate from the asset exceeded the carrying amount, and therefore no impairment loss was recognized. Since the impairment loss was taken into account as part of the excess
cost allocation work as of the acquisition date of CPV Group, its subsequent reversal in Valley’s financial statements, if recognized, shall not affect the Company's results.
|
|
|
D. |
Intangible assets: Under IFRS, certain intangible assets are defined as property, plant and equipment.
|
|
|
E. |
Restricted cash: There is a difference between the presentation of restricted cash in the cash flow statements and in the statements of financial position.
|