|
|
☐
|
REGISTRATION STATEMENT PURSUANT TO SECTION 12(b) OR (g) OF THE SECURITIES EXCHANGE ACT OF 1934
|
|
|
☒
|
ANNUAL REPORT PURSUANT TO SECTION 13 OR 15(d) OF THE SECURITIES EXCHANGE ACT OF 1934
For the fiscal year ended December 31, 2023
|
|
|
☐
|
TRANSITION REPORT PURSUANT TO SECTION 13 OR 15(d) OF THE SECURITIES EXCHANGE ACT OF 1934
|
|
|
☐
|
SHELL COMPANY REPORT PURSUANT TO SECTION 13 OR 15(d) OF THE SECURITIES EXCHANGE ACT OF 1934
|
|
Title of each
Class
|
|
Trading
Symbol
|
|
Name of each exchange on which registered
|
|
Ordinary shares, par value NIS 0.001 per share
|
|
NYAX
|
|
The Nasdaq Stock Market LLC
|
|
Large Accelerated Filer ☐
|
Accelerated Filer ☐
|
Non-accelerated Filer ☒
|
|
|
|
Emerging Growth Company ☒
|
| - iv - | |||
| - v - | |||
| 1 | |||
| 1 | |||
|
A. |
Directors and Senior Management |
1 | |
|
B. |
Advisers |
1 | |
|
C. |
Auditors |
1 | |
| 1 | |||
|
A. |
Offer Statistics |
1 | |
|
B. |
Method And Expected Timetable |
1 | |
| 1 | |||
|
A. |
[Reserved] |
1 | |
|
B. |
Capitalization and Indebtedness |
1 | |
|
C. |
Reasons for the Offer and Use of Proceeds
|
1 | |
|
D. |
Risk Factors |
1 | |
| 32 | |||
|
A. |
History and Development of the Company
|
32 | |
|
B. |
Business Overview |
32 | |
|
C. |
Organizational Structure |
58 | |
|
D. |
Property, Plants and Equipment |
58 | |
| 59 | |||
| 59 | |||
|
A. |
Operating Results |
59 | |
|
B. |
Liquidity and Capital Resources |
72 | |
|
C. |
Research and Development, Patents and Licenses, etc.
|
73 | |
|
D. |
Trend Information |
73 | |
|
E. |
Critical Accounting Estimates |
73 | |
| 73 | |||
|
A. |
Directors and Senior Management |
73 | |
|
B. |
Compensation |
76 | |
|
C. |
Board Practices |
79 | |
|
D. |
Employees |
90 | |
|
E. |
Share Ownership |
90 | |
|
F. |
Disclosure of a Registrant’s Action to Recover Erroneously Awarded Compensation
|
90 | |
| 91 | |||
|
|
A. |
Major Shareholders |
91 |
|
|
B. |
Related Party Transactions |
92 |
|
|
C. |
Interests of Experts and Counsel |
94 |
| 94 | |||
|
A. |
Consolidated Statements and Other Financial Information
|
94 | |
|
B. |
Significant Changes |
94 | |
| 95 | |||
|
A. |
Offering and Listing Details |
95 | |
|
B. |
Plan of Distribution |
95 | |
|
C. |
Markets |
95 | |
|
D. |
Selling Shareholders |
95 | |
|
E. |
Dilution |
95 | |
|
F. |
Expenses of the Issue |
95 | |
| 95 | |||
|
A. |
Share Capital |
95 | |
|
B. |
Memorandum and Articles of Association
|
95 | |
|
C. |
Material Contracts |
95 | |
|
D. |
Exchange Controls |
95 | |
|
E. |
Taxation |
96 | |
|
F. |
Dividends and Paying Agents |
104 | |
|
G. |
Statement by Experts |
104 | |
|
H. |
Documents on Display |
104 | |
|
I. |
Subsidiary Information |
105 | |
|
J. |
Annual Report to Security Holders |
105 | |
| 105 | |||
| 106 | |||
|
A. |
Debt Securities |
106 | |
|
B. |
Warrants and Rights |
106 | |
|
C. |
Other Securities |
106 | |
|
D. |
American Depositary Shares |
106 | |
| 107 | |||
| 107 | |||
| 107 | |||
| 107 | |||
|
A. |
Disclosure Controls and Procedures |
107 | |
|
B. |
Management’s Annual Report on Internal Control Over Financial Reporting
|
107 | |
|
C. |
Attestation Report of the Registered Public Accounting Firm
|
107 | |
|
D. |
Changes in Internal Control Over Financial Reporting
|
107 | |
| 107 | |||
| 107 | |||
| 107 | |||
| 108 | |||
| 108 | |||
| 108 | |||
| 108 | |||
| 108 | |||
| 109 | |||
| 109 | |||
| 109 | |||
| 109 | |||
| 112 | |||
| 112 | |||
| 112 | |||
| 112 | |||
| 114 | |||
|
F-1 | |||
|
|
• |
our expectations regarding general market conditions and global economic trends; |
|
|
• |
impact of the war in the Gaza Strip on our operations and financial results; |
|
|
• |
fluctuations in inflation, interest rates and exchange rates in the global economic environment over the world; |
|
|
• |
our ability to implement our growth strategy; |
|
|
• |
the success of operating initiatives, including advertising and promotional efforts and new product and concept development by us
and our competitors; |
|
|
• |
our ability to compete and conduct our business in the future; |
|
|
• |
changes in consumer tastes and preferences; |
|
|
• |
the availability of qualified personnel and the ability to retain such personnel; |
|
|
• |
changes in commodity costs, labor, distribution and other operating costs; |
|
|
• |
changes in government regulation and tax matters; |
|
|
• |
other factors that may affect our financial condition, liquidity and results of operations; and |
|
|
• |
other risk factors discussed under “Item 3. Key Information—D. Risk Factors.” |
| A. |
[Reserved] |
| B. |
Capitalization and Indebtedness |
| C. |
Reasons for the Offer and Use of Proceeds |
| D. |
Risk Factors |
|
|
• |
unfavorable conditions in our industry or the global economy or reductions in spending on POS technology could limit our ability
to grow our business and negatively affect our results of operations; |
|
|
• |
we operate in a competitive business environment and a failure to compete effectively may adversely affect our financial condition,
results of operations and cash flows in the future; |
|
|
• |
we procure some of our key components from a single or limited number of suppliers. Therefore, we are exposed to risks of shortages,
price fluctuations, tariffs and delays in delivery of such components; |
|
|
• |
we have a limited operating history at our current scale, and our prospects and future revenues are subject to a number of uncertainties,
which limits our ability to predict them accurately; |
|
|
• |
we have a history of net losses and there are therefore risks related to our ability to achieve or maintain profitability;
|
|
|
• |
if we are unable to attract customers, maintain or grow our retention rates and expand usage with existing customers, our revenue
growth and any future profitability could be harmed; |
|
|
• |
we may be unable to successfully develop and expand our platform, which could limit our ability to grow and maintain our competitive
position and adversely affect our financial condition, results of operations and cash flow; |
|
|
• |
we rely on processing service providers, credit card networks and other entities in the payment transfer system to process payments,
and if they fail or no longer agree to provide their services or we fail to comply with our obligations under those relationships, our
customer relationships could be adversely affected, and we could lose business; |
|
|
• |
any failure to offer high-quality customer support may adversely affect our relationships with our customers and could adversely
affect our business, financial condition and results of operations; |
|
|
• |
the termination of our existing relationships with commercial communications services providers could force us to adapt our products
to a new vendor; |
|
|
• |
Israel is currently at war in the Gaza Strip, and the duration, scope and effects of the war are unknown; |
|
|
• |
any past or future acquisitions, strategic investments, entries into new businesses, joint ventures, divestitures and other transactions
could fail to achieve strategic objectives, disrupt our ongoing operations or result in operating difficulties, liabilities and expenses,
harm our business, and negatively impact our results of operations; |
|
|
• |
failure to maintain and enhance our brand recognition in a cost-effective manner could harm our business, financial condition and
results of operations; |
|
|
• |
information security failures or interruptions of our or our third-party partners’ or service providers’ information
technology systems could adversely affect our business, financial condition and results of operations; |
|
|
• |
operational failures, including within data transfer, could harm our reputation, ability to retain customers and recruit new customers,
as well as our business results; |
|
|
• |
our business is subject to complex and evolving regulations and oversight related to privacy and data protection; |
|
|
• |
we are subject to substantial governmental and commercial regulations across our areas of activity. Any failure to comply with applicable
regulations or standards may lead to significant regulatory consequences and could have an adverse effect on our business, financial condition
or results of operations; |
|
|
• |
our business could suffer if we are unable to obtain, maintain, protect, defend or enforce our intellectual property or proprietary
rights, or if others claim that we have infringed upon their intellectual property rights; |
|
|
• |
we rely on our key personnel and, if they leave us, our results and product development could be harmed; and |
|
|
• |
we are controlled by our founding shareholders. Our founders may make decisions with which other shareholders may disagree.
|
|
|
• |
the transaction may not advance our business strategy; |
|
|
• |
we may not be able to secure required regulatory approvals or otherwise satisfy closing conditions for a proposed transaction in
a timely manner, or at all; |
|
|
• |
the transaction may subject us to additional regulatory burdens, such as antitrust and competition filings, that affect our business
in potentially unanticipated and significantly negative ways; |
|
|
• |
we may not realize a satisfactory return or increase our revenue; |
|
|
• |
we may experience difficulty, and may not be successful in, integrating technologies, IT or business enterprise systems, culture,
or management or other personnel of the acquired business; |
|
|
• |
we may incur significant acquisition costs and transition costs, including in connection with the assumption of ongoing expenses
of the acquired business; |
|
|
• |
we may not realize the expected benefits or synergies from the transaction in the expected time period, or at all – for example,
we expect opportunities to deliver additional revenue and costs synergies, as well as accretion to net income, with the acquisition of
Retail Pro, which may or may not be realized in a timely manner or at all; |
|
|
• |
we may be unable to retain key personnel; |
|
|
• |
acquired businesses or businesses that we invest in may not have adequate controls, processes and procedures to ensure compliance
with laws and regulations, including with respect to data privacy and security, and our due diligence process may not identify compliance
issues or other liabilities—moreover, acquired businesses’ technology may add complexity, resource constraints and failures
that makes it difficult and time consuming to achieve such adequate controls, processes and procedures; |
|
|
• |
we may fail to identify or assess the magnitude of certain liabilities, shortcomings or other circumstances prior to acquiring or
investing in a business, which could result in additional financial, legal or regulatory exposure, which may subject us to additional
controls, policies, procedures, liabilities, litigation, costs of compliance or remediation or to other adverse effects on our business,
operating results or financial condition; |
|
|
• |
we may have difficulty entering into new product areas, market verticals or geographic territories; |
|
|
• |
we may be unable to retain the customers, vendors and partners of acquired businesses; |
|
|
• |
there may be lawsuits or regulatory actions resulting from the transaction – for
example, during 2023, the Israeli Competition Authority (the “ICA”) requested from us certain documents and information related
mainly to our acquisition of OTI. We have provided the ICA with the information it had requested and the dialog with the ICA continues.
While we cannot predict the outcome, it is possible that the ICA may seek to impose a fine on us and our management, the amount of which
could be material. We intend to continue to defend our position vigorously and it is difficult for us to assess when or how this process
will conclude, or what results it may have to the Company; |
|
|
• |
there may be risks associated with undetected security weaknesses, cyberattacks or security breaches at companies that we acquire
or with which we may combine or partner; |
|
|
• |
there may be local and foreign regulations applicable to the international activities of our business and the businesses we acquire;
and |
|
|
• |
acquisitions could result in dilutive issuances of equity securities or the incurrence of debt – for example, the acquisition
of Retail Pro was financed through bank financing, which increased our debt burden. |
|
|
• |
cease selling or using solutions or services that incorporate the intellectual property rights that we allegedly infringe, misappropriate,
dilute or violate; |
|
|
• |
make payment of substantial royalty or license fees, lost profits or other damages; |
|
|
• |
make substantial payments for legal fees, settlement payments or other costs or damages; |
|
|
• |
discontinue some or all of the features, integrations and capabilities available through our solutions; |
|
|
• |
indemnify our products’ users or third-party service providers; |
|
|
• |
obtain a license, which may not be available on reasonable terms or at all, to sell or use the relevant technology; or |
|
|
• |
redesign or rebrand our allegedly infringing solutions to avoid infringement, misappropriation, dilution or violation of third-party
intellectual property rights, which could be costly, time-consuming or impossible. |
|
|
• |
actual or anticipated changes or fluctuations in our and our competitors’ results of operations; |
|
|
• |
the guidance we may provide to analysts and investors from time to time, and any changes in, or our failure to perform in line with,
such guidance; |
|
|
• |
announcements by us or our competitors of new offerings or new or terminated contracts, commercial relationships or capital commitments;
|
|
|
• |
industry or financial analyst or investor reaction to our press releases, other public announcements, and filings with the U.S. Securities
and Exchange Commission (the “SEC”); |
|
|
• |
rumors and market speculation involving us or other companies in our industry; |
|
|
• |
future sales or expected future sales of our ordinary shares; |
|
|
• |
investor perceptions of us and the industries in which we operate; |
|
|
• |
price and volume fluctuations in the overall stock market from time to time; |
|
|
• |
changes in operating performance and stock market valuations of other technology companies generally, or those in our industry in
particular; |
|
|
• |
failure of industry or financial analysts to maintain coverage of us, the issuance of new or updated reports or recommendations by
any analysts who follow our company, or our failure to meet the expectations of investors; |
|
|
• |
actual or anticipated developments in our business or our competitors’ businesses or the competitive landscape generally;
|
|
|
• |
litigation involving us, other companies in our industry or both, or investigations by regulators into our operations or those of
our competitors; |
|
|
• |
developments or disputes concerning our intellectual property or proprietary rights or our solutions, or third-party intellectual
or proprietary rights; |
|
|
• |
announced or completed acquisitions of businesses or technologies, or other strategic transactions by us or our competitors;
|
|
|
• |
actual or perceived breaches of, or failures relating to, privacy, data protection or data security; |
|
|
• |
new laws or regulations, including new interpretations of existing laws or regulations applicable to our business, increased enforcement
efforts in our industry, or specific enforcement actions against us; |
|
|
• |
actual or anticipated changes in our management or our board of directors; |
|
|
• |
general economic conditions and slow or negative growth of our target markets; and |
|
|
• |
other events or factors, including those resulting from war such as the current conflicts in the Gaza Strip and Ukraine, incidents
of terrorism or responses to these events. |
|
|
• |
the level of demand for our integrated POS devices; |
|
|
• |
our ability to grow or maintain our retention rates, expand usage within our customer base, and sell our solutions to existing and
future customers; |
|
|
• |
geopolitical uncertainty, including as a result of the current conflicts in the Gaza Strip and Ukraine, and uncertainty as to the
economic conditions specifically affecting industries in which our customers participate. |
|
|
• |
costs and timing of expenses related to hiring additional personnel, technologies or intellectual property, including potentially
significant amortization costs and possible write-downs; |
|
|
• |
the impact of market volatility and economic downturns caused by natural disasters and health epidemics, such as the COVID-19 pandemic,
influenza and other highly communicable diseases or viruses; |
|
|
• |
supply chain constraints and increases in component prices; |
|
|
• |
the timing and success of new features, integrations, capabilities and enhancements by us to our platform or by our competitors to
their products or any other change in the competitive landscape of our market; |
|
|
• |
errors in our forecasting of the demand for our products, which could lead to lower revenue, increased costs or both; |
|
|
• |
the amount and timing of operating expenses and capital expenditures that we may incur to maintain and expand our business and operations
and to remain competitive; |
|
|
• |
security breaches, technical difficulties, disruptions or outages on our platform resulting in service level agreement credits;
|
|
|
• |
changes in the legislative or regulatory environment; |
|
|
• |
legal and regulatory compliance costs in new and existing markets; |
|
|
• |
pricing pressure as a result of competition or otherwise; and |
|
|
• |
fluctuations in foreign currency exchange rates. |
|
|
• |
we are not required to engage an auditor to report on our internal controls over financial reporting pursuant to Section 404(b) of
the Sarbanes-Oxley Act; |
|
|
• |
we are not required to comply with any requirement that may be adopted by the PCAOB regarding mandatory audit firm rotation or a
supplement to the auditor’s report providing additional information about the audit and the financial statements (i.e., an auditor
discussion and analysis); and |
|
|
• |
we are not required to disclose certain executive compensation related items such as the correlation between executive compensation
and performance and comparisons of the chief executive officer’s compensation to median employee compensation. |
|
|
• |
Human Resources: nearly 10% of our Israeli employees and managers have been called to active
reserve duty; it is possible that the war will require additional reserve duty call-ups and more of our employees and managers or their
family members will be called to active reserve duty, which would prevent them from working or effectively performing their tasks for
us. |
|
|
• |
Macro-economic effects: the war has led, and may continue to lead, to negative domestic macro-economic
effects that could materially impact our business and operations, such as inflation, depreciation of the Shekel, bearish capital markets,
reduced availability of credit and financing sources and decline in growth. |
|
|
• |
Trade curtailment: the war may lead to interruptions and curtailment of trade between Israel
and its trading partners, which could result in reductions in the demand for our offerings or disruptions in the supply of components
required for our products. Certain countries and organizations may impose trade or other trade or financial sanctions on Israel, which
could impact our ability to conduct our business. |
|
|
• |
Shipping costs: the global shipping industry is experiencing disruptions due to various factors,
including the rerouting of shipping away from the Suez Canal due to attacks by Houthi militants from Yemen on commercial shipping vessels
in the Gulf of Aden and the Red Sea, which has caused a substantial increase in rates for some shipping routes. This and other factors
have caused a worldwide increase in shipping rates, which has impacted the Company. |
|
|
• |
Decrease in Israeli demand: we have noticed an immaterial decrease in demand in Israel for
our products and services compared to our global demand, due to reduction in mobility and gatherings in public spaces, such as for leisure
and entertainment activities during the war. |
|
|
• |
Damage to infrastructure: Terror and missile attacks may lead to infrastructure damage, such
as to various of our facilities located in Israel, including communications networks, computer infrastructure and other cyber assets,
which may lead to interruptions in our operations. Although the Israeli government may cover the reinstatement value of certain damages
that are caused by terrorist attacks or acts of war, we cannot be sure that such government coverage will be available to us or, if available,
will sufficiently cover our damages. |
|
|
• |
Reputation and international relations: as a result of the war, public opinion in the international
community towards Israel, Israeli companies and Israeli industries may be negatively affected. It is hard to anticipate if and how such
sentiments and other political developments will impact our clients, backlog of orders or financial results; however, it is possible that
a limited number of customers will hold, delay or cancel existing or future orders as a result of the war and a shift in international
relations and politics. |
|
|
• |
the Companies Law regulates the methods and processes by which mergers may be consummated and requires tender offers to be effected
for acquisitions of shares above specified thresholds in a company; |
|
|
• |
the Companies Law requires special approvals for certain transactions involving directors, officers or significant shareholders and
regulates other matters that may be relevant to these types of transactions; |
|
|
• |
the Companies Law does not provide for shareholder action by written consent for public companies, thereby requiring all shareholder
actions to be taken at a general meeting of shareholders; |
|
|
• |
our amended and restated articles of association provide that director vacancies may be filled by our board of directors; |
|
|
• |
our amended and restated articles of association require a vote of the holders of our outstanding ordinary shares entitled to vote
present and voting on the subject matter at a general meeting of shareholders for the removal of directors (other than external directors
regarding whom special rules apply); |
|
|
• |
We have undertaken in certain of our financing agreements not to have a change-of-control without the lender’s approval; and
|
|
|
• |
Some of our European licenses may be cancelled or suspended, or we may be subject to other sanctions for breaches of such licenses,
if holders of our shares cross certain prescribed ownership thresholds without the prior approvals of the relevant regulators. |
| ITEM 4. |
INFORMATION ON THE COMPANY |
| A. |
History and Development of the Company |
| B. |
Business Overview |
|
|
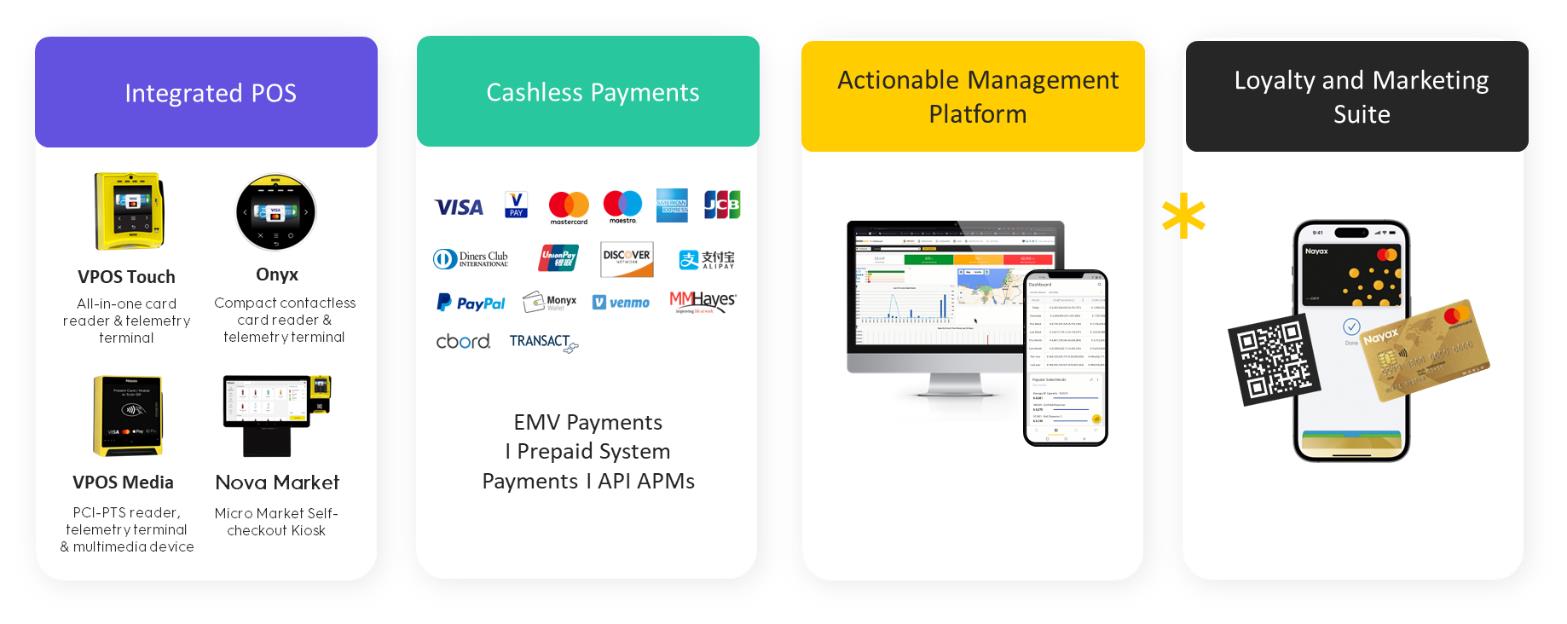
• |
Payments Suite: International payments infrastructure that enables customers to offer consumers
the ability to pay with their preferred local payment methods in their home markets. |
|
|
• |
Management Software Suite: A central intelligence hub for merchants that provides deep, real-time
insights to optimize operations. |
|
|
• |
Loyalty and Marketing Suite: A consumer engagement loyalty and marketing platform that enables
retailers to drive engagement with their target consumers. |
|
|
• |
Integrated POS: Our proprietary devices are designed to be seamlessly deployable in-store
or on new or existing machines and enable the acceptance of digital payments. |
|
|
• |
Single, integrated end-to-end platform. We provide our customers with a comprehensive, end-to-end
platform, substantially reducing the need to work with and manage multiple, disparate vendors and systems. Our omni-channel, 360-degree
platform helps customers track operations across multiple channels and access enhanced reporting in one centralized location. |
|
|
• |
Global solution, local support. We have a broad international footprint, and we are able to
offer our solutions in multiple worldwide locations, which saves our global enterprise customers the need to look for local technology
providers to serve their consumers globally. Additionally, with our large original equipment manufacturers (“OEM”) network,
our customers are able to receive their machine with our devices pre-installed and begin operating easily almost anywhere in the world.
|
|
|
• |
Increased sales. Our solutions offer a wide variety of payment options, an improved consumer
experience and enhanced dynamic pricing capabilities, which help our customers improve their sales. Our solutions also streamline our
customers’ operations with 24/7 monitoring and management of connected devices, employees and other business activities. Our technology
minimizes downtime by optimizing various processes such as automating issue detection and resolution. |
|
|
• |
Reduced costs. Our solutions optimize operating costs for our customers by enabling them to
reduce overhead and better manage their employees. In addition, our technology enables remote device diagnostic and software updates,
which save our customers the need to contact third-party providers for device troubleshooting and upgrades. Given constantly evolving
regulations and technical standards, our capital-efficient customer service platform results in enhanced customer experience and optimized
cost of ownership and maintenance for our customers. |
|
|
• |
Enhanced consumer engagement. We help our customers attract consumers through marketing, branded
loyalty programs and mobile solutions, using consumer data. Through our platform, retailers gain access to consumer insights and advanced
analytics they can use to build direct relationships with consumers and drive increased loyalty and higher sales. These capabilities have
become critical as retailers engage with consumers across multiple channels. Leveraging our omni-channel marketing engine, we help customers
tailor recommendations and deals for consumers. Our loyalty programs include every transaction, allowing consumers to start earning loyalty
funds from each purchase. |
|
|
• |
White-glove customer service. Customer success is a key focus for us through a combination
of tailored onboarding services, customer support and intuitive product design and customer experience. We strive to foster long-term
relationships with our customers by having short sales cycles, adopting a consultative approach and providing multiple support channels
in extended hours. Moreover, our ownership of the end-to-end solution provides major advantages in all aspects related to product integration,
technical support and customer service. As a result, we are able to tackle our customers’ questions and concerns efficiently, and
we maintain high-quality support levels that save our customers valuable time and effort, generating higher customer satisfaction.
|
|
|
• |
Diverse and local payment options. We provide a frictionless experience for consumers as part
of a streamlined digital payment experience. We make it possible to accept payments in more than 120 countries and more than 50 currencies,
so consumers can pay in their preferred local payment methods. |
|
|
• |
Loyalty features (discounts, gifts, coupons, and special offers). Consumers are able to benefit
from discounts at the point of sale, as well as gifts, coupons and special offers. |
|
|
• |
Enhanced consumer experience. Our solutions ensure consumers have an enhanced experience shopping
with our customers. For example, consumers can use our mobile app to provide various feedback points and ratings. In addition, our integrated
solutions enable features such as instant refunds, which simplify multiple customer processes that were traditionally complex to handle.
|
|
|
• |
Comprehensive, end-to-end proprietary technology platform. Our platform enables our customers
to handle many aspects of their consumer-facing and back-office operations, all using a single platform. We address complex, diverse and
constantly changing challenges in our customers’ journey to procure retail technology solutions. Our hardware and software platform
caters to our customers’ needs with solutions such as payment processing, telemetry and management software, loyalty and marketing
programs and integrated POS devices. In the automated self-service retail market, our key differentiation stems from our ownership of
the entire commerce value chain. Owning all components of our platform and services allows further flexibility in the deployment of our
solutions and highly effective technical support and customer service. Our integrated POS and software solutions easily integrate into
most existing automated self-service retail environments that are transitioned to cashless models, driving a higher overall installed
base. |
|
|
• |
Founder-led culture driving continuous customer-driven innovation. Since 2005, our founding
team has methodically built Nayax, creating a culture that advocates entrepreneurship, dynamic teamwork, honesty, accountability and communication,
all of which have the sole purpose of delivering the best results for our customers. We have a long-standing track record of developing
solutions to address our customers’ evolving needs. For example, we were one of the first platforms to market with emerging vertical
use cases such as cashless massage chairs, novelty wash stations (bike wash and pet wash) and EV charging stations. We continue to have
a large development pipeline for new use cases, and we believe we are well-positioned to continue developing new solutions to help our
customers grow their businesses. Given our strong history of innovation in the automated self-service retail market, we are well-positioned
to further expand into the attended retail market. |
|
|
• |
Differentiated, data-driven insights. Currently, our platform handles on average approximately
five million transactions per day across more than one million managed and connected devices. As a result, we are able to gather vast
amounts of data consisting of orders, receipts and consumer information. We leverage this data to provide advanced analytics to our customers
and help them streamline their operations. In addition, the data we collect has tremendous feedback value in other areas of our business,
such as product development and customer satisfaction tracking and improvement. |
|
|
• |
Extensive and efficient global go-to-market strategy. We have a far-reaching go-to-market
strategy tailored to both large enterprises and SMEs, at both the local and global levels. We have a broad commercial presence spanning
more than 120 countries worldwide. We have offices and commercial operations in our key markets of the United States, Canada, the United
Kingdom, Germany, Japan, China, Australia, South Africa and our home market of Israel. We also have licensed distributors in more than
80 markets across all continents, allowing us to efficiently expand our international footprint. In addition, we have established direct
relationships with over 1,900 OEMs that integrate our POS devices to their products on a global level. Lastly, we work with over 800 resellers
to serve the SME market. To capture the expanding market of nano merchants with up to 25 machines around the world, we have launched online
shops, allowing the customer to purchase their POS, go through contract signing and enjoy seamless, fast onboarding. |
|
|
• |
Robust regulatory compliance and infrastructure on a global scale. We have built specialized
capabilities to augment our platform and provide solutions in the global regulated markets in which we operate. As such, we have obtained
licenses and certifications from a large number of national and international protocols and standards covering payments security, as well
as regulators: Electronic Money Institution License in Europe, Electronic Money Institution License in the U.K., licenses for the provision
of financial asset services and credit services in Israel, Aggregator registration in Mexico, PCI, EMVCO, telecommunications security
(Felica Certified, PTCRB), Health and Safety and quality standards (FC, CE, IC, RoHS, ACMA) and data security (ISO/IEC 27001). We believe
our deep and extensive regulatory compliance expertise across different geographic regions is a key component to our success and positions
us for uninterrupted growth on a global level. |
|
|
• |
Intimate relationships with our customers founded on availability, advice and flexibility.
We have established a customer-centric approach that is focused on driving intimacy and customer satisfaction. We are keen to provide
an intuitive and superior product and service experience to all of our customers, from SMEs to large enterprises. We apply this approach
in every customer interaction, from our fast onboarding to after-sales service and support. As a result, we have had a successful track
record of growing with our customers and minimizing churn. |
|
|
• |
Strong business model combining proprietary integrated POS devices with recurring SaaS revenue and
payment processing fees. In 2023, approximately 64% of our revenue came from SaaS revenue and payment processing fees that are
highly recurring in nature. The remaining 36% of our revenue was derived from sales of
our integrated POS devices that are mission-critical to our customers across all the verticals we serve. The high switching costs associated
with these integrated POS devices enhance the retention of our solutions and provide us with substantial recurring SaaS revenue and payment
processing fees. As a result, our revenue churn rate, which we define as the percentage of revenue lost as a result of customers leaving
our platform in the previous 12 months, was 3.4% in 2023, 3.6% in 2022 and 2.6% in 2021,
despite many retailers being impacted by COVID-19 lockdowns in 2021. |
|
|
• |
Retain and grow with our existing customers. Our current installed customer base is a long-term
foundation of our revenue growth, powered by the mission-critical nature of our solutions, the limited customer churn we experience and
the substantial growth potential of our customers. We intend to continue investing in our relationships with existing customers through
our strong customer success-focused culture and grow revenue from our installed base by deploying more solutions and driving more transactions
through our platform. Our track record of organic growth with our customers is demonstrated by our dollar-based net retention rate, which
was approximately 144% as of December 31, 2023, 131% in 2022 and 137% in 2021. Given our
comprehensive, end-to-end platform, we believe we are well-positioned to offer additional solutions to existing customers, which generate
upsell and cross-sell opportunities. These opportunities are continuously expanding as we further develop and enhance our solutions. We
are able to cross-sell attended payments into our existing automated self-service customer base, with minimal additional integration effort,
replacing existing solutions from other vendors. For the year ended December 31, 2023, approximately 70% of our total revenue was attributable
to existing customers. |
|
|
• |
Win new large enterprise and SME customers globally. We believe there is a substantial opportunity
to attract new customers with our current solutions within the customer cohorts we currently serve, which we generally categorize based
upon the current and potential revenue contribution of each customer. We have a proven track record and strong momentum in winning new
and large accounts across several different verticals and markets. Examples include Café+Co, Primo Water, Canteen, FiveStar, MOL
Group, Synergy Energy, Western Australia’s largest energy retailer and generator, as a new Tier 1 customer, and most recently, Turkey’s
Düzey, part of Koç Holding. Our go-to-market platform is also built to effectively reach and address the needs of SMEs through
our highly automated and scalable go-to-market strategy. We utilize our digital sales channels, distributors and OEM partnerships to profitably
reach and address large numbers of SME customers, which represent a material portion of our revenue. We see the SME channel as core to
our growth going forward based on our proven track record with SMEs. For the year ended December 31, 2023, approximately 30% of our total
revenue was attributable to new customers. |
|
|
• |
Continue to innovate and develop new solutions. We have a proven track record of launching
new products and enhancing our solutions. For example, we have acquired and developed the capabilities to deliver in-store payments solutions.
We intend to continue to cross-sell attended payment solutions into our existing customer base and capitalize on the substantial opportunity
to deliver our complete platform to retailers in the attended market. In the near term, we see an opportunity to expand our online payment
capabilities and will opportunistically look to penetrate the broader omni-channel payments market. |
|
|
• |
Continue to expand into new markets internationally. We have a track record of geographic
expansion either through subsidiaries in countries that represent key markets for us, or through engagements with distributors in markets
where we do not have a subsidiary. Regional expansion is one of our key strategies for growth, and we have established subsidiaries in
twelve key markets and signed distribution engagements in more than 80 countries. Our sales in each of North America and Europe grew at
a CAGR rate of 41% from 2021 to 2023. We intend to continue growing our geographic footprint as we identify business opportunities in
new markets, such as Latin America, which we expect to enter in 2024. We also plan to use online sales channels to target additional markets
that do not necessarily warrant a physical presence. |
|
|
• |
Enter emerging, high-growth verticals. We intend to leverage our platform to efficiently expand
into new verticals with favorable growth characteristics. For example, we have developed solutions for the EV charging station vertical
when we identified a need for charging station operators to enable credit card payments and remotely monitor and manage EV charging stations.
We believe there are verticals ripe for disruption, such as gaming machines, small business service providers and micro markets, and we
see a large opportunity for these verticals to benefit from our technology platform and solutions. |
|
|
• |
Cross sell. Nayax’s latest comprehensive offerings for retail POS and management, along
with our new loyalty solution and EV management suite, position us to leverage our extensive customer base for further growth. Many of
our larger customers operate across multiple verticals, presenting us with the opportunity to expand our solutions into additional areas
with each customer. Our customers’ preference for receiving a single invoice and dealing with one vendor for all their POS and management
needs aligns well with Nayax’s capabilities. We are well situated to serve the market of blended retailers, offering them not only
integrated solutions but also best-in-class support. |
|
|
• |
Pursue targeted and strategic M&A. Since 2014, we have made several acquisitions to expand
our solutions to improve our commercial reach. Along with organic growth, we see ourselves strategically engaging in M&A opportunities
where they make sense for the company. We believe that the payments industry, especially in the automated self-service segment, is rapidly
consolidating, and we believe that there will be opportunities to do strategic M&A where it will be valuable to the company. We intend
to continue to pursue such targeted acquisitions in a similar approach to the successful M&A track record we have established to date.
Consistent with our acquisition strategy, we currently are active in the M&A pipeline and execution and continue to foresee opportunities
to complete strategic purchases. For example, we reinforced our in-store product offering by acquiring Weezmo in early 2021 to provide
enhanced marketing tools for retailers. In 2021, we made a series of investments in Tigapo Ltd. (“Tigapo”) to expand our platform
in the amusement parks vertical in the United States, and, in 2022, we acquired OTI, a provider of smart payment solutions for automated
self-service machines, to support our strategic business plan and further our growth opportunities in regions such as Japan. On November
30, 2023, we acquired Retail Pro, a global leader in retail POS software with Tier 1 global brand names across the world and an extensive
distribution network of over 80+ partner resellers. |


|
|
• |
Accept cashless payments: Contactless EMV & Closed loop (Mifare). |
|
|
• |
Supported protocols: Kiosk API, Reader low level API. |
|
|
• |
Physical interface: USB 2.0 FS, UART TTL. |
|
|
• |
Integrated with Kiosk CORE (Android, Windows, Linux). |
|
|
• |
Interface pins to Touch, Speaker, LEDs, SAM slots, QR scanner, Magstripe, Contact. |
|
|
• |
Remote software updates and small form factor design. |


|
|
• |
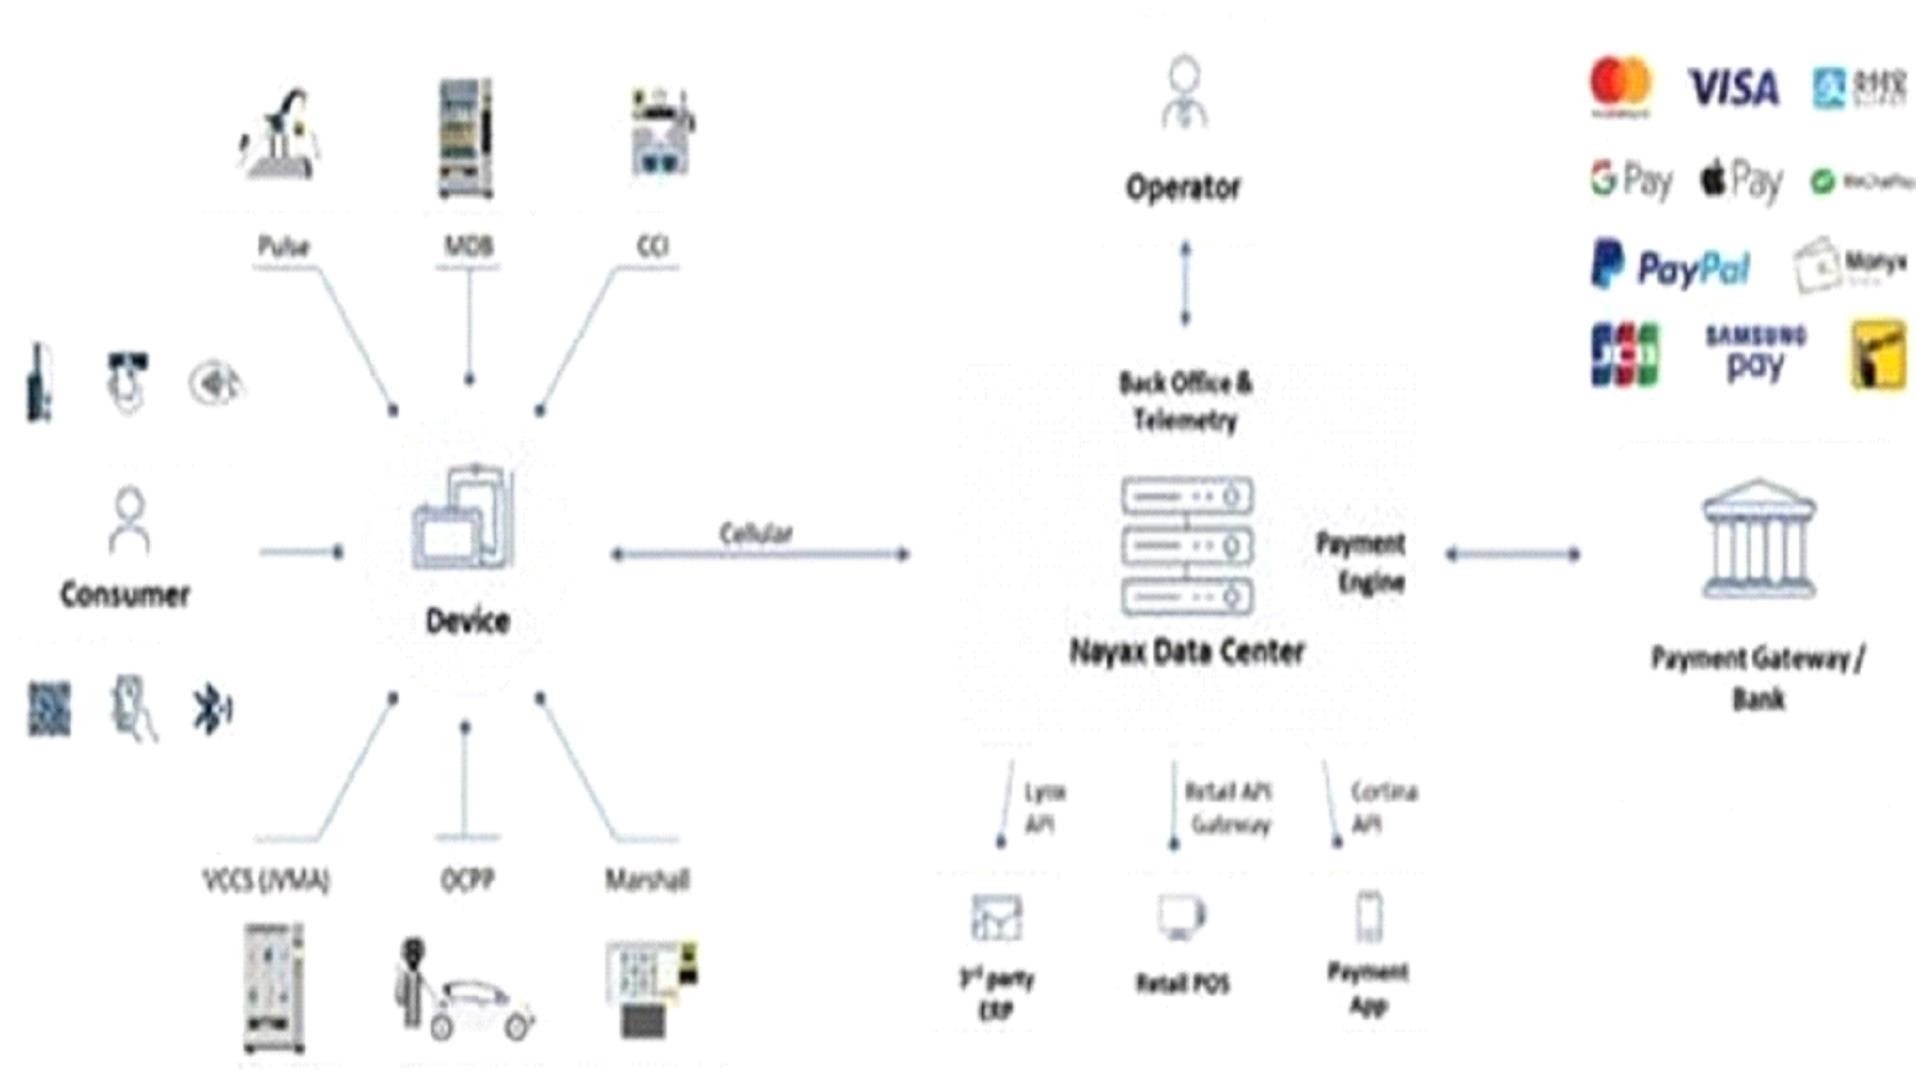
Marshall, which connects PC-based machines to our integrated POS devices; |
|
|
• |
LYNX, which provides input / output data to third-party systems; and |
|
|
• |
Cortina, which enables third-party systems to interface with our payment gateway, as depicted below. |
|
|
• |
Imperial, part of the Canteen Franchise Group for coffee services and vending machines, chose Nayax as their technology
partner for upgrading their cashless devices. |
|
|
• |
We have further developed our strategic partnership with TIBA Parking Systems, a provider of hardware and software solution
for the parking market. |
|
|
• |
We have partnered with Pandora, an Israeli jewelry brand, as a new retail customer. |
|
|
• |
We have entered into an agreement with IWG Regus Global to provide to their customers with the ability to use our payment solution
to pay for coffee services, package deliver lockers and electronic vehicle charging. |
|
|
• |
Synergy Energy, a western Australia's energy retailer and generator, chose to roll out their electric vehicle direct current chargers
with Nayax' devices embedded in their products. |
|
|
• |
We have also extended our existing relationship with Primo Water in the U.S., with additional sales and installations
of Nayax devices. |
|
|
• |
Another U.S. automated self-service retail provider extended its program with Nayax by purchasing devices
for a water refilling project at a large car manufacturer. |
|
|
• |
In Germany, we signed a new Tier 1 customer who is a full-service provider in the field of Smart Vending. For this new strategic
relationship, the Company has developed digitized vending machines, targeting high frequency locations such as shopping centres.
|
|
|
• |
We have been recognized by the U.K. Financial Conduct Authority as a financial institution which acts as a compliant payment
facilitator. This recognition will simplify certain processes for our customers. |
|
|
• |
We have entered into a strategic partnership with Turkey's Duzey, a holding company with several brands in the consumer goods
sector. The partnership was initiated with the installation of Nayax devices on vending machines in public
and factory locations throughout Turkey. The partnership was than extended to other locations in Europe. |
|
|
• |
Coinbridge, our customer loyalty solution |
|
|
o |
received a license to issue the Discover Card in the U.S. market; |
|
|
o |
completed its Apple Pay integration; |
|
|
o |
entered into a U.S. infrastructure partners’ agreement to provide service in the U.S., including as an issuer processor and an
issuing bank; and |
|
|
o |
entered into a strategic partnership with Giift, a provider of loyalty technology solutions. |
|
|
• |
We have entered into a partnership agreement with a U.S. automobile manufacturer using our technology for public EV chargers
in their dealerships. |
|
|
• |
We have implemented our first hospitality solution, in the Netherland. |
|
|
• |
We have added a new partner in Germany, Atlantis Trinkwassertechnik, which will act as a reseller for Nayax payments and
technology solutions. |
|
|
• |
On November 30, 2023, we acquired Retail Pro, a global leader in retail POS software with Tier 1 global brand names across the world
and an extensive distribution network of over 80+ partner resellers. This transaction has tripled our distributor network to over 120
partner resellers and extended our scale, providing us with meaningful opportunities to cross-sell our payment solutions to Retail Pro’s
customer base and distribution channels. |
|
|
• |
We have completed deployment of our EV payment solution for direct current fast chargers in a Las Vegas casino. |
|
|
• |
We have expended the sales of Nova Market, our cashless self-checkout solution to Vending Minnesota. |
|
|
• |
We have established a dedicated service center in Romania, aiming to reduce our technical support call and case
times. |
| C. |
Organizational Structure |
|
Company |
|
Country of Incorporation |
|
Percentage Ownership and Voting Interest |
|
Main Activities |
|
Nayax LLC |
|
USA (Maryland) |
|
100% |
|
Sale of the Company’s products and services |
|
Nayax Europe UAB |
|
Lithuania |
|
100% |
|
Processing transactions on behalf of the Company’s customers in Europe
|
|
Nayax AU PTY Ltd. |
|
Australia |
|
100% |
|
Sale of the Company’s products and services |
|
Nayax (UK) Limited |
|
U.K. |
|
100% |
|
Sale of the Company’s products and services |
| D. |
Property, Plants and Equipment |
| ITEM 4A. |
UNRESOLVED STAFF COMMENTS |
| ITEM 5. |
OPERATING AND FINANCIAL REVIEW AND PROSPECTS |
| A. |
Operating Results |
|
|
• |
Customers. We empower our customers to modernize payment processing and seamlessly adapt to
an increasingly digital ecosystem. Our omni-channel, 360-degree platform is designed to address the many needs of customers across verticals,
industries and geographies. |
|
|
• |
Consumers. Our platform is built to simplify the process for retail purchasing. Consumers
benefit from the ability to choose from a diverse set of payment methods and access loyalty rewards from their preferred merchants.
|
|
|
• |
Subscription fees for access to our SaaS solutions |
|
|
• |
Payment processing fees |
|
|
• |
One-time payment for selling our integrated POS devices |
|
Year ended December 31, |
||||||||||||
|
2023 |
2022 |
2021 |
||||||||||
|
SaaS Revenue ($ millions) |
58.9 |
45.3 |
34.6 |
|||||||||
|
YoY Growth |
30 |
% |
30.9 |
% |
37.8 |
% | ||||||
|
Payment Processing Fees ($ millions)
|
92.1 |
59.5 |
36.5 |
|||||||||
|
YoY Growth |
55 |
% |
63 |
% |
100.5 |
% | ||||||
|
Year ended December 31, |
||||||||||||||||||||||||
|
2023 |
2022 |
2021 |
||||||||||||||||||||||
|
Revenue ($ millions) |
Rate of total income |
Revenue ($ millions) |
Rate of total income |
Revenue ($ millions) |
Rate of total income |
|||||||||||||||||||
|
SaaS Revenue and Payment Processing Fees |
151.1 |
64.1 |
% |
104.8 |
60.4 |
% |
71.1 |
59.7 |
% | |||||||||||||||
|
Revenue from sale of integrated POS devices |
84.4 |
35.9 |
% |
68.7 |
39.6 |
% |
48.0 |
40.3 |
% | |||||||||||||||
|
Year ended December 31, |
||||||||||||
|
2023 |
2022 |
2021 |
||||||||||
|
Net revenue retention |
144 |
% |
131 |
% |
137 |
% | ||||||
|
Year ended December 31, |
||||||||||||
|
2023 |
2022 |
2021 |
||||||||||
|
U.S. Dollars in thousands |
||||||||||||
|
Interest on bank loans and bank fees
|
1,704 |
993 |
964 |
|||||||||
|
Change in fair value options |
310 |
(423 |
) |
414 |
||||||||
|
Finance expenses in respect of loans from others
|
591 |
70 |
217 |
|||||||||
|
Finance expenses (income) in respect of shareholders and related companies |
(24 |
) |
(15 |
) |
136 |
|||||||
|
Finance expenses in respect of other liabilities
|
161 |
167 |
202 |
|||||||||
|
Finance expenses in respect of leases liabilities
|
330 |
260 |
214 |
|||||||||
|
Financing income in respect of finance sub-lease
|
(17 |
) |
- |
(2 |
) | |||||||
|
Exchange rate differences |
(767 |
) |
1,968 |
(490 |
) | |||||||
|
2,288 |
3,020 |
1,655 |
||||||||||
|
As of December 31, |
||||||||||||
|
2023 |
2022 |
2021 |
||||||||||
|
Number of customers |
72,252 |
47,385 |
29,695 |
|||||||||
|
YoY growth |
52 |
% |
60 |
% |
58 |
% | ||||||
|
As of December 31, |
||||||||||||
|
2023 |
2022 |
2021 |
||||||||||
|
Number of managed and connected devices (in thousands) |
1,044 |
725 |
517 |
|||||||||
|
YoY growth |
44 |
% |
40 |
% |
39 |
% | ||||||
|
Year ended December 31, |
||||||||||||
|
2023 |
2022 |
2021 |
||||||||||
|
Number of transactions (in millions)
|
1,841 |
1,304 |
795 |
|||||||||
|
YoY growth |
41 |
% |
64 |
% |
69 |
% | ||||||
|
Year ended December 31, |
||||||||||||
|
2023 |
2022 |
2021 |
||||||||||
|
In USD thousands |
||||||||||||
|
Loss for the period
|
(15,887 |
) |
(37,509 |
) |
(24,769 |
) | ||||||
|
Finance expenses, net
|
2,288 |
3,020 |
1,655 |
|||||||||
|
Tax expenses
|
1,215 |
451 |
632 |
|||||||||
|
Depreciation and amortization
|
12,505 |
9,028 |
7,198 |
|||||||||
|
EBITDA |
121 |
(25,010 |
) |
(15,284 |
) | |||||||
|
Share-based payment costs
|
6,027 |
8,747 |
8,850 |
|||||||||
|
Non-recurring issuance and acquisition costs(1)
|
444 |
1,790 |
1,879 |
|||||||||
|
Share of loss of equity method investee
|
1,555 |
1,794 |
538 |
|||||||||
|
Adjusted EBITDA |
8,147 |
(12,679 |
) |
(4,017 |
) | |||||||
|
|
(1) |
Consists primarily of (i) fees and expenses, other than underwriter discount and commissions, incurred in connection with our May
2021 initial public offering on the TASE (ii) expenses incurred in connection with our listing on Nasdaq and (iii) professional fees and
other expenses incurred in connection with the acquisition of Retail Pro in the last quarter of 2023. |
|
Year ended December 31, |
||||||||
|
2023 |
2022 |
|||||||
|
In USD thousands |
||||||||
|
Revenues |
235,491 |
173,514 |
||||||
|
Cost of revenues |
147,198 |
113,476 |
||||||
|
Gross Profit |
88,293 |
60,038 |
||||||
|
Research and development expenses |
21,928 |
22,132 |
||||||
|
Selling, administrative and general expenses
|
70,320 |
64,092 |
||||||
|
Depreciation and amortization in respect of technology and capitalized development costs |
6,430 |
4,268 |
||||||
|
Other expenses |
444 |
1,790 |
||||||
|
Share of loss of equity method investee
|
1,555 |
1,794 |
||||||
|
Operating loss |
(12,384 |
) |
(34,038 |
) | ||||
|
Finance expenses, net |
2,288 |
3,020 |
||||||
|
Loss before taxes on income
|
(14,672 |
) |
(37,058 |
) | ||||
|
Tax expenses |
(1,215 |
) |
(451 |
) | ||||
|
Loss for the year
|
(15,887 |
) |
(37,509 |
) | ||||
|
Year ended December 31, |
||||||||
|
2023 |
2022 |
|||||||
|
In USD thousands |
||||||||
|
Revenue from the sale of integrated POS devices
|
84,406 |
68,726 |
||||||
|
Recurring revenue |
151,085 |
104,788 |
||||||
|
Total revenue |
235,491 |
173,514 |
||||||
|
Year ended December 31, |
||||||||
|
2023 |
2022 |
|||||||
|
In USD thousands |
||||||||
|
Cost of integrated POS devices sales
|
68,433 |
62,872 |
||||||
|
Cost of recurring revenue |
78,765 |
50,604 |
||||||
|
Total cost of revenue
|
147,198 |
113,476 |
||||||
|
Year ended December 31, |
||||||||
|
2023 |
2022 |
|||||||
|
In USD thousands |
||||||||
|
United States |
83,528 |
60,270 |
||||||
|
Europe (excluding United Kingdom) |
72,887 |
48,664 |
||||||
|
United Kingdom |
26,391 |
21,931 |
||||||
|
Australia |
22,484 |
17,235 |
||||||
|
Israel |
13,095 |
14,129 |
||||||
|
Rest of the World |
17,106 |
11,285 |
||||||
|
Total |
235,491 |
173,514 |
||||||
|
Year ended December 31, |
||||||||
|
2023 |
2022 |
|||||||
|
(in USD thousands) |
||||||||
|
Net cash provided by (used in): |
||||||||
|
Net cash provided by (used in) operating activities
|
8,798 |
(27,547 |
) | |||||
|
Net cash flows used in investing activities
|
(36,831 |
) |
(26,544 |
) | ||||
|
Net cash flows provided by financing activities
|
31,551 |
6,206 |
||||||
|
Increase (Decrease) in cash and cash equivalents
|
3,518 |
(47,885 |
) | |||||
| A. |
Directors and Senior Management |
|
Name |
Position(s) |
Age | ||
|
Directors |
||||
|
Amir Nechmad |
Co-Founder, Director |
65 | ||
|
Yair Nechmad |
Co-Founder, Chairman and Chief Executive Officer |
62 | ||
|
David Ben-Avi |
Co-Founder, Chief Technology Officer and Director |
50 | ||
|
Rina Shafir |
Director |
60 | ||
|
Vered Raz Avayo |
Director |
54 | ||
|
Nir Dor |
Director |
60 | ||
|
Reuven Ben Menachem |
Director |
63 | ||
|
Executive Officers |
||||
|
Sagit Manor |
Chief Financial Officer |
51 | ||
|
Oren Tepper |
Chief Commercial Officer |
52 | ||
|
Keren Sharir |
Chief Marketing Officer |
44 | ||
|
Tami Erel |
Chief Business Operations Officer |
48 | ||
|
Gal Omer |
Chief Legal Officer |
41 | ||
|
Moshe Orenstein |
Chief Product Officer |
47 | ||
|
Oded Frenkel |
Chief Customer Officer |
43 | ||
|
Ella Shechtman |
Chief Human Resources Officer |
53 | ||
|
Moshe Shmaryahu |
Chief Information Officer |
56 | ||
|
Yaron Aharon |
Chief Operating Officer |
58 | ||
|
Aaron Greenberg |
Chief Strategy Officer |
29 | ||
|
Oren Viner |
Vice President, R&D |
52 | ||
|
Boaz Ben David |
Vice President, Finance |
44 |
|
Remuneration for services(1)
|
||||||||||||||||||||||||||||||||
|
Name |
Position |
Scope of employment |
Salary |
Bonus |
Share-based payment |
Management fees |
Consulting fees |
Total |
||||||||||||||||||||||||
|
In thousands |
||||||||||||||||||||||||||||||||
|
Yair Nechmad |
Co-Founder, Chairman and Chief Executive Officer |
100 |
% |
$ |
483 |
– |
$ |
884 |
$ |
- |
– |
1,367 |
||||||||||||||||||||
|
David Ben-Avi |
Co-Founder, Chief Technology Officer and Director |
100 |
% |
$ |
483 |
- |
$ |
884 |
$ |
- |
– |
1,367 |
||||||||||||||||||||
|
Sagit Manor |
Chief Financial Officer |
100 |
% |
$ |
306 |
$ |
90 |
$ |
337 |
– |
– |
733 |
||||||||||||||||||||
|
Carly Furman |
General Manager, North America |
100 | % |
$ |
450 |
$ |
46 |
$ |
84 |
– |
– |
580 |
||||||||||||||||||||
|
Lewis Zimbler |
General Manager, U.K. |
100 |
% |
$ |
298 |
$ |
- |
$ |
99 |
– |
$ |
- |
397 |
|||||||||||||||||||
| (1) |
In accordance with Israeli law and practice, all amounts reported in the above table are in terms of cost to our Company, as recorded
in our audited consolidated financial statements. All of the executive officers listed in the above table are full-time employees, except
for Yair Nechmad and David Ben-Avi, whose compensation was paid under services agreements we have with them. See “—Services
Agreements with our Founders.” |
| C. |
Board Practices |
|
Board Diversity Matrix | ||||
|
Country of Principal Executive Offices: |
Israel | |||
|
Foreign Private Issuer |
Yes | |||
|
Disclosure Prohibited Under Home Country Law |
No | |||
|
Total Number of Directors |
7 | |||
|
Female |
Male |
Non-binary |
Did Not Disclose Gender | |
|
Part I: Gender Identity |
| |||
|
Directors |
2 |
5 |
- |
- |
|
Part II: Demographic Background |
| |||
|
Underrepresented Individual in Home Country Jurisdiction
|
- | |||
|
LGBTQ+ |
- | |||
|
Did Not Disclose Demographic Background |
1 | |||
|
|
• |
such majority includes at least a majority of the shares held by all shareholders who are not controlling shareholders and do not
have a personal interest in the election of the external director (other than a personal interest not deriving from a relationship with
a controlling shareholder) that are voted at the meeting, excluding abstentions; or |
|
|
• |
the total number of shares voted by non-controlling shareholders and by shareholders who do not have a personal interest in the election
of the external director against the election of the external director does not exceed 2% of the aggregate voting rights in the company.
|
|
|
• |
an employment relationship; |
|
|
• |
a business or professional relationship even if not maintained on a regular basis (excluding insignificant relationships);
|
|
|
• |
control; and |
|
|
• |
service as an office holder, excluding service as a director in a private company prior to the initial public offering of its shares
if such director was appointed as a director of the private company in order to serve as an external director following the initial public
offering. |
|
|
• |
he or she meets the qualifications for being appointed as an external director, except for the requirement (i) that the director
be an Israeli resident (which does not apply to companies such as ours whose securities have been offered outside of Israel or are listed
for trading outside of Israel) and (ii) for accounting and financial expertise or professional qualifications; and |
|
|
• |
he or she has not served as a director of the company for a period exceeding nine consecutive years. For this purpose, a break of
less than two years in his or her service as a director shall not be deemed to interrupt the continuity of the service. |
|
|
• |
retaining and terminating our independent auditors, subject to ratification by the board of directors, and in the case of retention,
to ratification by the shareholders; |
|
|
• |
pre-approving audit and non-audit services to be provided by the independent auditors and related fees and terms; |
|
|
• |
overseeing the accounting and financial reporting processes of the Company and audits of our financial statements, the effectiveness
of our internal control over financial reporting and making such reports as may be required of an audit committee under the rules and
regulations promulgated under the Exchange Act; |
|
|
• |
reviewing with management and our independent auditor our annual and interim financial statements prior to publication or filing
(or submission, as the case may be) to the SEC; |
|
|
• |
recommending to the board of directors the retention and termination of the internal auditor and the internal auditor’s engagement
fees and terms, in accordance with the Companies Law, approving the yearly or periodic work plan proposed by the internal auditor and
examining whether the internal auditor was afforded all required resources to perform its role; |
|
|
• |
reviewing with our general counsel and/or external counsel, as deemed necessary, legal and regulatory matters that could have a material
impact on the financial statements; |
|
|
• |
identifying irregularities in our business administration by, among other things, consulting with the internal auditor or with the
independent auditor, and suggesting corrective measures to the board of directors; |
|
|
• |
reviewing policies and procedures with respect to transactions between the Company and officers and directors (other than transactions
related to the compensation or terms of service of the officers and directors), or affiliates of officers or directors, or transactions
that are not in the ordinary course of the Company’s business and deciding whether to approve such acts and transactions if so required
under the Companies Law; and |
|
|
• |
establishing procedures for the handling of employees’ complaints as to the management of our business and the protection to
be provided to such employees. |
|
|
• |
recommending to the board of directors the approval of the compensation policy for office holders and, once every three years, regarding
any extensions to a compensation policy that was adopted for a period of more than three years; |
|
|
• |
monitoring the implementation of the compensation policy and periodically making recommendations to the board of directors with respect
to any amendments or updates of the compensation policy; |
|
|
• |
resolving whether or not to approve arrangements with respect to the terms of office and employment of office holders; and
|
|
|
• |
exempting, under certain circumstances, transactions with our chief executive officer from the approval of our shareholders.
|
|
|
• |
from time to time, reviewing the implementation of our compensation policy in accordance with the requirements of the Companies Law
as well as other compensation policies, incentive-based compensation plans and equity-based compensation plans (insofar as these relate
to office holders in the Company), and overseeing the development and implementation of such policies and recommending to our board of
directors any amendments or modifications the committee deems appropriate, including as required under the Companies Law; |
|
|
• |
reviewing and approving the employment terms of our office holders, including granting of options and other incentive awards and
reviewing and approving corporate goals and objectives relevant to the compensation of our executive officers, including evaluating their
performance in light of such goals and objectives; and |
|
|
• |
approving and exempting certain transactions regarding office holders’ compensation pursuant to the Companies Law. |
|
|
• |
such majority includes at least a majority of the shares held by shareholders who are not controlling shareholders and shareholders
who do not have a personal interest in such compensation policy which voted at the meeting, disregarding abstentions; or |
|
|
• |
the total number of shares of non-controlling shareholders and shareholders who do not have a personal interest in the compensation
policy and who vote against the policy, does not exceed 2% of the aggregate voting rights in the company. |
|
|
• |
the education, skills, experience, expertise and accomplishments of the relevant office holder; |
|
|
• |
the office holder’s position and responsibilities; |
|
|
• |
prior compensation agreements with the office holder; |
|
|
• |
the ratio between the cost of the terms of employment of an office holder and the cost of the employment of other employees of the
company, including employees employed through contractors who provide services to the company, in particular the ratio between such cost
to the average and median salary of such employees of the company, as well as the impact of disparities between them on the work relationships
in the company; |
|
|
• |
if the terms of employment include variable components—the possibility of reducing variable components at the discretion of
the board of directors and the possibility of setting a limit on the value of non-cash variable equity-based components; and |
|
|
• |
if the terms of employment include severance compensation—the term of employment or office of the office holder, the terms
of the office holder’s compensation during such period, the company’s performance during such period, the office holder’s
individual contribution to the achievement of the company goals and the maximization of its profits and the circumstances under which
he or she is leaving the company. |
|
|
• |
with regard to variable components: |
|
|
• |
with the exception of office holders who report to the chief executive officer, a means of determining the variable components on
the basis of long-term performance and measurable criteria; provided that the company may determine that an immaterial part of the variable
components of the compensation package of an office holder shall be awarded based on non-measurable criteria, or if such amount is not
higher than three months’ salary per annum, taking into account such office holder’s contribution to the company; and
|
|
|
• |
the ratio between variable and fixed components, as well as the limit of the values of variable components at the time of their payment,
or in the case of equity-based compensation, at the time of grant. |
|
|
• |
a claw-back provision under which the office holder will return to the company, according to conditions to be set forth in the compensation
policy, any amounts paid as part of the office holder’s terms of employment, if such amounts were paid based on information later
discovered to be wrong, and such information was restated in the company’s financial statements; |
|
|
• |
the minimum holding or vesting period of variable equity-based components to be set in the terms of office or employment, as applicable,
while taking into consideration long-term incentives; and |
|
|
• |
a limit to retirement grants. |
|
|
• |
overseeing and assisting our board in reviewing and recommending nominees for election as directors; |
|
|
• |
assessing the performance of the members of our board; and |
|
|
• |
establishing and maintaining effective corporate governance policies and practices. |
|
|
• |
at least a majority of the shares held by all shareholders who are not controlling shareholders and do not have a personal interest
in such matter, present and voting on such matter, are voted in favor of the compensation package, excluding abstentions; or |
|
|
• |
the total number of shares of non-controlling shareholders and shareholders who do not have a personal interest in such matter voting
against the compensation package does not exceed 2% of the aggregate voting rights in the Company. |
|
|
• |
information on the advisability of a given action brought for his, her or its approval or performed by virtue of his or her position;
and |
|
|
• |
all other important information pertaining to such action. |
|
|
• |
refrain from any act involving a conflict of interest between the performance of his or her duties in the company and his or her
other duties or personal affairs; |
|
|
• |
refrain from any activity that is competitive with the business of the company; |
|
|
• |
refrain from exploiting any business opportunity of the company for the purpose of gaining a personal advantage for himself, herself
or others; and |
|
|
• |
disclose to the company any information or documents relating to the company’s affairs which the office holder received as
a result of his or her position as an office holder. |
| ITEM 7. |
MAJOR SHAREHOLDERS AND RELATED PARTY TRANSACTIONS |
| A. |
Major Shareholders |
|
|
• |
each person, or group of affiliated persons, known by us to own beneficially 5% or more of our outstanding ordinary shares;
|
|
|
• |
each of our executive officers and members of our board of directors; and |
|
|
• |
all of our executive officers and members of our board of directors as a group. |
|
Name of Beneficial Owner |
Number of
Ordinary Shares Beneficially Owned |
Percentage of Ordinary Shares Beneficially Owned |
|||||
|
5% or Greater Shareholders |
|||||||
|
Amir Nechmad |
8,185,348 |
24.26 |
% | ||||
|
Yair Nechmad |
8,961,005 |
26.56 |
% | ||||
|
David Ben-Avi |
7,590,165 | 22.50 |
% | ||||
|
Other Executive Officers and Board Members |
|||||||
|
Rina Shafir |
* |
* |
|||||
|
Vered Raz Avayo |
* |
* |
|||||
|
Nir Dor |
* |
* |
|||||
|
Reuven Ben Menachem |
* |
* |
|||||
|
Sagit Manor |
* |
* |
|||||
|
Oren Tepper |
* |
* |
|||||
|
Keren Sharir |
* |
* |
|||||
|
Tami Erel |
* |
* |
|||||
|
Gal Omer |
* |
* |
|||||
|
Moshe Orenstein |
* |
* |
|||||
|
Oded Frenkel |
* |
* |
|||||
|
Ella Shechtman |
* |
* |
|||||
|
Moshe Shmaryahu |
* |
* |
|||||
|
Yaron Aharon |
* |
* |
|||||
|
Aaron Greenberg |
* |
* |
|||||
|
Oren Viner |
* |
* |
|||||
|
Boaz Ben David |
* |
* |
|||||
|
All executive officers and Board members as a group (20 individuals) |
24,736,518 | 74.32 |
% | ||||
| * |
Represents beneficial ownership of less than 1% of our total outstanding ordinary shares. |
| ITEM 8. |
FINANCIAL INFORMATION |
| A. |
Consolidated Statements and Other Financial Information |
| ITEM 9. |
THE OFFER AND LISTING |
| A. |
Offering and Listing Details |
| C. |
Markets |
| D. |
Selling Shareholders |
| E. |
Dilution |
| F. |
Expenses of the Issue |
| ITEM 10. |
ADDITIONAL INFORMATION |
| A. |
Share Capital |
| B. |
Memorandum and Articles of Association |
| C. |
Material Contracts |
| D. |
Exchange Controls |
| E. |
Taxation |
|
|
• |
the expenditures are approved by the relevant Israeli government authority, determined by the field of research; |
|
|
• |
the research and development are for the benefit of the company; and |
|
|
• |
the research and development are carried out by or on behalf of the company seeking such tax deduction. |
|
|
• |
certain financial institutions; |
|
|
• |
insurance companies; |
|
|
• |
dealers or certain traders in securities that mark their securities to market for U.S. income tax purposes; |
|
|
• |
persons holding ordinary shares as part of a straddle, integrated or similar transaction; |
|
|
• |
persons who acquire ordinary shares in connection with employment; |
|
|
• |
persons whose functional currency for U.S. federal income tax purposes is not the U.S. dollar; |
|
|
• |
entities classified as partnerships for U.S. federal income tax purposes and their partners; |
|
|
• |
tax-exempt entities, individual retirement accounts, or “Roth IRAs”; |
|
|
• |
persons that own or are deemed to own 10% or more of the Company’s stock by vote or value; or |
|
|
• |
persons holding ordinary shares in connection with a trade or business outside the United States. |
|
|
• |
a citizen (other than a resident of Israel) or individual resident of the United States; |
|
|
• |
a corporation, or other entity taxable as a corporation, created or organized in or under the laws of the United States, any state
therein or the District of Columbia; or |
|
|
• |
an estate or trust the income of which is subject to U.S. federal income taxation regardless of its source. |
| F. |
Dividends and Paying Agents |
| G. |
Statement by Experts |
| H. |
Documents on Display |
| I. |
Subsidiary Information |
| J. |
Annual Report to Security Holders |
| ITEM 11. |
QUANTITATIVE AND QUALITATIVE DISCLOSURES ABOUT MARKET RISK |
| ITEM 12. |
DESCRIPTION OF SECURITIES OTHER THAN EQUITY SECURITIES |
| A. |
Debt Securities |
| B. |
Warrants and Rights |
| C. |
Other Securities |
| D. |
American Depositary Shares |
| ITEM 13. |
DEFAULTS, DIVIDEND ARREARAGES AND DELINQUENCIES |
| ITEM 14. |
MATERIAL MODIFICATIONS TO THE RIGHTS OF SECURITY HOLDERS AND USE OF PROCEEDS |
| ITEM 15. |
CONTROLS AND PROCEDURES |
| A. |
Disclosure Controls and Procedures |
| B. |
Management’s Annual Report on Internal Control Over Financial Reporting |
| C. |
Attestation Report of the Registered Public Accounting Firm |
| D. |
Changes in Internal Control Over Financial Reporting |
| ITEM 16. |
[RESERVED] |
| ITEM 16A. |
AUDIT COMMITTEE FINANCIAL EXPERT |
| ITEM 16B. |
CODE OF ETHICS |
| ITEM 16C. |
PRINCIPAL ACCOUNTANT FEES AND SERVICES |
|
Year ended December 31, |
||||||||
|
2023 |
2022 |
|||||||
|
(in USD thousands) |
||||||||
|
Audit (1) |
423 |
592 |
||||||
|
Audit-related fees (2) |
54 |
- |
||||||
|
Tax fees (3) |
39 |
42 |
||||||
|
All other fees (4) |
2 |
- |
||||||
|
Total |
518 |
634 |
||||||
|
|
(1) |
Audit fees consist of services that would normally be provided in connection with statutory and regulatory filings or engagements,
including services that generally only the independent accountant can reasonably provide. |
|
|
(2) |
Audit-related fees for assurance and related services that were reasonably related to the performance of the audit not reported under
“Audit Fees”. |
|
|
(3) |
Tax fees consist of fees for professional services for tax compliance, tax advice and tax audits. |
|
|
(4) |
“All other fees” consist of all other fees in the years ended December 31, 2023 and 2022 related to services in
connection with non-audit compliance and review work. |
| ITEM 16D. |
EXEMPTIONS FROM THE LISTING STANDARDS FOR AUDIT COMMITTEES |
| ITEM 16E. |
PURCHASES OF EQUITY SECURITIES BY THE ISSUER AND AFFILIATED PURCHASERS |
| ITEM 16F. |
CHANGE IN REGISTRANT’S CERTIFYING ACCOUNTANT |
| ITEM 16G. |
CORPORATE GOVERNANCE |
| ITEM 16H. |
MINE SAFETY DISCLOSURE |
| ITEM 16I. |
DISCLOSURE REGARDING FOREIGN JURISDICTIONS THAT PREVENT INSPECTIONS |
| ITEM 16J. |
INSIDER TRADING POLICIES |
| ITEM 16K. |
CYBERSECURITY |
|
|
• |
IS Policy development and approval |
|
|
• |
Risk management |
|
|
• |
Budgetary approval |
|
|
• |
Leadership and culture |
|
|
• |
Compliance oversight |
|
|
• |
Crisis management |
|
|
• |
Continuous improvement |
| ITEM 17. |
FINANCIAL STATEMENTS |
| ITEM 18. |
FINANCIAL STATEMENTS |
| ITEM 19. |
EXHIBITS |
|
Nayax Ltd. | |||||
|
Date: |
February 28, 2024 |
By: |
/s/ Yair Nechmad | ||
|
Name: |
Yair Nechmad | ||||
|
Title: |
Chief Executive Officer | ||||
|
By: |
/s/ Sagit Manor | ||||
|
Name: |
Sagit Manor | ||||
|
Title: |
Chief Financial Officer | ||||

|
Tel Aviv, Israel
|
/s/ Kesselman & Kesselman
|
|
February 28, 2024
|
Certified Public Accountants (Isr.)
|
|
A member firm of PricewaterhouseCoopers International Limited
|
|
December 31
|
|||||||||||
|
2023
|
2022
|
||||||||||
|
(Audited)
|
|||||||||||
|
Note
|
U.S. dollars in thousands
|
||||||||||
|
ASSETS
|
|||||||||||
|
CURRENT ASSETS:
|
|||||||||||
|
Cash and cash equivalents
|
7
|
38,386
|
33,880
|
||||||||
|
Restricted cash transferable to customers for processing activity
|
8
|
49,858
|
34,119
|
||||||||
|
Short-term bank deposits
|
1,269
|
83
|
|||||||||
|
Receivables in respect of processing activity
|
43,261
|
25,382
|
|||||||||
|
Trade receivable, net
|
9
|
41,300
|
27,412
|
||||||||
|
Inventory
|
20,563
|
23,807
|
|||||||||
|
Other current assets
|
8,772
|
5,777
|
|||||||||
|
Total current assets
|
203,409
|
150,460
|
|||||||||
|
NON-CURRENT ASSETS:
|
|||||||||||
|
Long-term bank deposits
|
2,304
|
1,336
|
|||||||||
|
Other long-term assets
|
5,883
|
2,948
|
|||||||||
|
Investment in associate
|
|
5,024
|
6,579
|
||||||||
|
Right-of-use assets, net
|
10
|
5,341
|
7,381
|
||||||||
|
Property and equipment, net
|
11
|
5,487
|
6,668
|
||||||||
|
Goodwill and intangible assets, net
|
12
|
96,411
|
55,116
|
||||||||
|
Total non-current assets
|
120,450
|
80,028
|
|||||||||
|
TOTAL ASSETS
|
323,859
|
230,488
|
|||||||||
The accompanying notes are an integral part of these financial statements.
F - 4
NAYAX LTD.
CONSOLIDATED STATEMENTS OF FINANCIAL POSITION
|
December 31
|
|||||||||||
|
2023
|
2022
|
||||||||||
|
(Audited)
|
|||||||||||
|
Note
|
U.S. dollars in thousands
|
||||||||||
|
LIABILITIES AND EQUITY
|
|||||||||||
|
CURRENT LIABILITIES:
|
|||||||||||
|
Short-term bank credit
|
13
|
47,477
|
7,684
|
||||||||
|
Current maturities of long-term bank loans
|
13
|
1,101
|
1,052
|
||||||||
|
Current maturities of loans from others and other long-term liabilities
|
14, 15
|
5,422
|
4,126
|
||||||||
|
Current maturities of lease liabilities
|
10
|
2,145
|
2,206
|
||||||||
|
Payables in respect of processing activity
|
104,523
|
63,336
|
|||||||||
|
Trade payables
|
17,464
|
14,574
|
|||||||||
|
Other payables
|
25,650
|
17,229
|
|||||||||
|
Total current liabilities
|
203,782
|
110,207
|
|||||||||
|
NON-CURRENT LIABILITIES:
|
|||||||||||
|
Long-term bank loans
|
13
|
327
|
1,444
|
||||||||
|
Long-term loans from others and other long-term liabilities
|
14,15
|
14,476
|
7,062
|
||||||||
|
Post-employment benefit obligations, net
|
427
|
403
|
|||||||||
|
Lease liabilities
|
10
|
4,149
|
5,944
|
||||||||
|
Deferred income taxes
|
16
|
3,108
|
793
|
||||||||
|
Total non-current liabilities
|
22,487
|
15,646
|
|||||||||
|
TOTAL LIABILITIES
|
226,269
|
125,853
|
|||||||||
|
EQUITY:
|
17
|
||||||||||
|
Shareholders Equity:
|
|||||||||||
|
Share capital
|
8
|
8
|
|||||||||
|
Additional paid in capital
|
153,524
|
151,406
|
|||||||||
|
Capital reserves
|
9,643
|
9,771
|
|||||||||
|
Accumulated deficit
|
(65,585
|
)
|
(56,550
|
)
|
|||||||
|
TOTAL EQUITY
|
97,590
|
104,635
|
|||||||||
|
TOTAL LIABILITIES AND EQUITY
|
323,859
|
230,488
|
|||||||||
The accompanying notes are an integral part of these financial statements.
F - 5
|
Year ended December 31
|
|||||||||||||||
|
2023
|
2022
|
2021
|
|||||||||||||
|
(Audited)
|
|||||||||||||||
|
U.S. dollars in thousands
|
|||||||||||||||
|
Note
|
(Excluding loss per share data)
|
||||||||||||||
|
Revenues
|
18
|
235,491
|
173,514
|
119,134
|
|||||||||||
|
Cost of revenues
|
19
|
(147,198
|
)
|
(113,476
|
)
|
(70,970
|
)
|
||||||||
|
Gross Profit
|
88,293
|
60,038
|
48,164
|
||||||||||||
|
Research and development expenses
|
20
|
(21,928
|
)
|
(22,132
|
)
|
(19,040
|
)
|
||||||||
|
Selling, general and administrative expenses
|
21
|
(70,320
|
)
|
(64,092
|
)
|
(45,379
|
)
|
||||||||
|
Depreciation and amortization in respect of technology and capitalized development costs
|
12
|
(6,430
|
)
|
(4,268
|
)
|
(3,810
|
)
|
||||||||
|
Other expenses
|
1a,6b
|
|
(444
|
)
|
(1,790
|
)
|
(1,879
|
)
|
|||||||
|
Share of loss of equity method investee
|
|
(1,555
|
)
|
(1,794
|
)
|
(538
|
)
|
||||||||
|
Loss from ordinary operations
|
(12,384
|
)
|
(34,038
|
)
|
(22,482
|
)
|
|||||||||
|
Finance expenses, net
|
22
|
(2,288
|
)
|
(3,020
|
)
|
(1,655
|
)
|
||||||||
|
Loss before taxes on income
|
(14,672
|
)
|
(37,058
|
)
|
(24,137
|
)
|
|||||||||
|
Tax expenses
|
16
|
(1,215
|
)
|
(451
|
)
|
(632
|
)
|
||||||||
|
Loss for the year
|
(15,887
|
)
|
(37,509
|
)
|
(24,769
|
)
|
|||||||||
|
Attribution of loss for the year:
|
|||||||||||||||
|
To shareholders of the Company
|
(15,887
|
)
|
(37,509
|
)
|
(24,763
|
)
|
|||||||||
|
To non-controlling interests
|
-
|
-
|
(6
|
)
|
|||||||||||
|
Total
|
(15,887
|
)
|
(37,509
|
)
|
(24,769
|
)
|
|||||||||
|
Loss per share attributed to shareholders of the Company:
|
|||||||||||||||
|
Basic and diluted loss per share
|
23
|
(0.479
|
)
|
(1.143
|
)
|
(0.820
|
)
|
||||||||
F - 6
|
Year ended December 31
|
||||||||||||
|
2023
|
2022
|
2021
|
||||||||||
|
(Audited)
|
||||||||||||
|
U.S. dollars in thousands
|
||||||||||||
|
Loss for the year
|
(15,887
|
)
|
(37,509
|
)
|
(24,769
|
)
|
||||||
|
Other comprehensive income (loss) for the year:
|
||||||||||||
|
Items that will not be recycled to profit or loss:
|
||||||||||||
|
Gain (loss) from remeasurement of liabilities (net) in
|
||||||||||||
|
respect of post-employment benefit obligations
|
-
|
146
|
431
|
|||||||||
|
Items that may be recycled to profit or loss:
|
||||||||||||
|
Gain (loss) from translation of financial statements of foreign activities
|
(170
|
)
|
(374
|
)
|
87
|
|||||||
|
Gains on cash flow hedges
|
42
|
-
|
-
|
|||||||||
|
Total comprehensive loss for the year
|
(16,015
|
)
|
(37,737
|
)
|
(24,251
|
)
|
||||||
|
Attribution of total comprehensive income (loss) for the year:
|
||||||||||||
|
To shareholders of the Company
|
(16,015
|
)
|
(37,737
|
)
|
(24,181
|
)
|
||||||
|
To non-controlling interests
|
-
|
-
|
(70
|
)
|
||||||||
|
Total comprehensive loss for the year
|
(16,015
|
)
|
(37,737
|
)
|
(24,251
|
)
|
||||||
F - 7
|
Equity attributed to shareholders of the Company
|
||||||||||||||||||||||||||||||||||||
|
Share
capital |
Additional
paid in capital
|
Remeasurement of post-employment benefit obligations
|
Other capital reserves
|
Foreign currency translation reserve
|
Accumulated
deficit |
Total equity attributed to shareholders of the Company
|
Non-
controlling interests |
Total
equity |
||||||||||||||||||||||||||||
|
U.S. dollars in thousands
|
||||||||||||||||||||||||||||||||||||
|
Balance at January 1, 2021
|
7
|
16,689
|
(329
|
)
|
9,324
|
243
|
(13,433
|
)
|
12,501
|
-
|
12,501
|
|||||||||||||||||||||||||
|
Loss for the year
|
-
|
-
|
-
|
-
|
-
|
(24,763
|
)
|
(24,763
|
)
|
(6
|
)
|
(24,769
|
)
|
|||||||||||||||||||||||
|
Other comprehensive income (loss) for the year
|
-
|
-
|
431
|
-
|
151
|
-
|
582
|
(64
|
)
|
518
|
||||||||||||||||||||||||||
|
Non-controlling interests from business combination
|
-
|
-
|
-
|
-
|
-
|
-
|
-
|
1,530
|
1,530
|
|||||||||||||||||||||||||||
|
IPO (See note 1a2)
|
1
|
132,559
|
-
|
-
|
-
|
-
|
132,560
|
-
|
132,560
|
|||||||||||||||||||||||||||
|
Transactions with non-controlling interests
|
-
|
-
|
-
|
205
|
-
|
-
|
205
|
(1,460
|
)
|
(1,255
|
)
|
|||||||||||||||||||||||||
|
Business combination under common control
|
-
|
-
|
-
|
(26
|
)
|
-
|
-
|
(26
|
)
|
-
|
(26
|
)
|
||||||||||||||||||||||||
|
Employee options exercised
|
*
|
1,118
|
-
|
-
|
-
|
-
|
1,118
|
-
|
1,118
|
|||||||||||||||||||||||||||
|
Share-based payment
|
-
|
-
|
-
|
-
|
9,499
|
9,499
|
-
|
9,499
|
||||||||||||||||||||||||||||
|
Balance at December 31, 2021
|
8
|
150,366
|
102
|
9,503
|
394
|
(28,697
|
)
|
131,676
|
-
|
131,676
|
||||||||||||||||||||||||||
|
Changes during the year;
|
||||||||||||||||||||||||||||||||||||
|
Loss for the year
|
(37,509
|
)
|
(37,509
|
)
|
(37,509
|
)
|
||||||||||||||||||||||||||||||
|
Other comprehensive income (loss) for the year
|
-
|
-
|
146
|
-
|
(374
|
)
|
-
|
(228
|
)
|
-
|
(228
|
)
|
||||||||||||||||||||||||
|
Employee options exercised
|
*
|
1,040
|
-
|
-
|
-
|
-
|
1,040
|
-
|
1,040
|
|||||||||||||||||||||||||||
|
Share-based payment
|
-
|
-
|
-
|
-
|
-
|
9,656
|
9,656
|
-
|
9,656
|
|||||||||||||||||||||||||||
|
Balance at December 31, 2022
|
8
|
151,406
|
248
|
9,503
|
20
|
(56,550
|
)
|
104,635
|
-
|
104,635
|
||||||||||||||||||||||||||
|
Changes during the year;
|
||||||||||||||||||||||||||||||||||||
|
Loss for the year
|
- |
-
|
-
|
-
|
-
|
(15,887
|
)
|
(15,887
|
)
|
-
|
(15,887
|
)
|
||||||||||||||||||||||||
|
Other comprehensive (loss) for the year
|
-
|
-
|
-
|
42
|
(170
|
)
|
-
|
(128
|
)
|
-
|
(128
|
)
|
||||||||||||||||||||||||
|
Employee options exercised
|
*
|
2,118
|
-
|
-
|
-
|
-
|
2,118
|
-
|
2,118
|
|||||||||||||||||||||||||||
|
Share-based payment
|
-
|
-
|
-
|
-
|
-
|
6,852
|
6,852
|
-
|
6,852
|
|||||||||||||||||||||||||||
|
Balance at December 31, 2023
|
8
|
153,524
|
248
|
9,545
|
(150
|
)
|
(65,585
|
)
|
97,590
|
-
|
97,590
|
|||||||||||||||||||||||||
F - 8
|
Year ended December 31
|
||||||||||||
|
2023
|
2022
|
2021
|
||||||||||
|
(Audited)
|
||||||||||||
|
U.S. dollars in thousands
|
||||||||||||
|
CASH FLOWS FROM OPERATING ACTIVITIES:
|
||||||||||||
|
Net loss for the year
|
(15,887
|
)
|
(37,509
|
)
|
(24,769
|
)
|
||||||
|
Adjustments required to reflect the cash flow from operating activities (see Appendix A)
|
24,685
|
9,962
|
11,963
|
|||||||||
|
Net cash provided by (used in) operating activities
|
8,798
|
(27,547
|
)
|
(12,806
|
)
|
|||||||
|
CASH FLOWS FROM INVESTING ACTIVITIES:
|
||||||||||||
|
Capitalized development costs
|
(15,948
|
)
|
(13,706
|
)
|
(6,059
|
)
|
||||||
|
Acquisition of property and equipment
|
(611
|
)
|
(1,518
|
)
|
(2,637
|
)
|
||||||
|
Loans extended to others
|
(1,432
|
)
|
-
|
-
|
||||||||
|
Investments in associates
|
-
|
-
|
(6,449
|
)
|
||||||||
|
Loans repaid by shareholders
|
-
|
-
|
61
|
|||||||||
|
Increase in bank deposits
|
(2,154
|
)
|
(480
|
)
|
(352
|
)
|
||||||
|
Payments for acquisitions of subsidiaries, net of cash acquired
|
(18,330
|
)
|
440
|
418
|
||||||||
|
Payment of deferred consideration with respect to business combinations
|
-
|
(4,500
|
)
|
(7,335
|
)
|
|||||||
|
Interest received
|
1,684
|
76
|
2
|
|||||||||
|
Investments in financial assets
|
(195
|
)
|
(6,856
|
)
|
(446
|
)
|
||||||
|
Proceeds from sub-lessee
|
155
|
-
|
158
|
|||||||||
|
Net cash used in investing activities
|
(36,831
|
)
|
(26,544
|
)
|
(22,639
|
)
|
||||||
|
CASH FLOWS FROM FINANCING ACTIVITIES:
|
||||||||||||
|
Initial public offering (IPO)
|
-
|
-
|
132,560
|
|||||||||
|
Interest paid
|
(2,651
|
)
|
(504
|
)
|
(630
|
)
|
||||||
|
Changes in short-term bank credit
|
39,135
|
5,874
|
(11,393
|
)
|
||||||||
|
Support received (royalties paid) in respect to government assistance plans
|
(55
|
)
|
(40
|
)
|
(199
|
)
|
||||||
|
Transactions with non-controlling interests
|
-
|
(186
|
)
|
(1,069
|
)
|
|||||||
|
Repayment of long-term bank loans
|
(998
|
)
|
(2,282
|
)
|
(1,971
|
)
|
||||||
|
Receipt of long-term loans from others
|
-
|
6,908
|
-
|
|||||||||
|
Repayment of long-term loans from others
|
(3,626
|
)
|
(2,577
|
)
|
(2,175
|
)
|
||||||
|
Receipt of loans from shareholders
|
-
|
-
|
8,900
|
|||||||||
|
Repayment of loans from shareholders
|
-
|
-
|
(8,900
|
)
|
||||||||
|
Decrease in other long-term liabilities
|
(249
|
)
|
(288
|
)
|
(295
|
)
|
||||||
|
Employee options exercised
|
2,177
|
1,152
|
718
|
|||||||||
|
Principal lease payments
|
(2,182
|
)
|
(1,851
|
)
|
(1,406
|
)
|
||||||
|
Net cash provided by financing activities
|
31,551
|
6,206
|
114,140
|
|||||||||
|
Increase (Decrease) in cash and cash equivalents
|
3,518
|
(47,885
|
)
|
78,695
|
||||||||
|
Balance of cash and cash equivalents at beginning of year
|
33,880
|
87,332
|
8,195
|
|||||||||
|
Gains (losses) from exchange differences on cash and cash equivalents
|
906
|
(6,189
|
)
|
626
|
||||||||
|
Gains (losses) from translation of cash and cash equivalents of foreign activity
|
82
|
622
|
(184
|
)
|
||||||||
|
Balance of cash and cash equivalents at end of year
|
38,386
|
33,880
|
87,332
|
|||||||||
F - 9
|
Year ended December 31
|
||||||||||||
|
2023
|
2022
|
2021
|
||||||||||
|
(Audited)
|
||||||||||||
|
U.S. dollars in thousands
|
||||||||||||
|
Appendix A – adjustments required to reflect the cash flows from operating activities:
|
||||||||||||
|
Adjustments in respect of:
|
||||||||||||
|
Depreciation and amortization
|
12,505
|
9,028
|
7,198
|
|||||||||
|
Post-employment benefit obligations, net
|
25
|
(107
|
)
|
139
|
||||||||
|
Deferred taxes
|
(294
|
)
|
(181
|
)
|
25
|
|||||||
|
Finance expenses, net
|
750
|
4,544
|
269
|
|||||||||
|
Expenses in respect of long-term employee benefits
|
237
|
245
|
193
|
|||||||||
|
Share in losses of associate company
|
1,555
|
1,794
|
538
|
|||||||||
|
Long-term deferred income
|
(85
|
)
|
(104
|
)
|
(26
|
)
|
||||||
|
Expenses in respect of share-based payment
|
6,027
|
8,747
|
8,850
|
|||||||||
|
Total adjustments
|
20,720
|
23,966
|
17,186
|
|||||||||
|
Changes in operating asset and liability items:
|
||||||||||||
|
Increase in restricted cash transferable to customers for processing activity
|
(15,739
|
)
|
(10,424
|
)
|
(5,529
|
)
|
||||||
|
Increase in receivables from processing activity
|
(17,880
|
)
|
(10,986
|
)
|
(5,429
|
)
|
||||||
|
Increase in trade receivables
|
(12,487
|
)
|
(8,272
|
)
|
(5,136
|
)
|
||||||
|
Increase in other current assets
|
(1,073
|
)
|
(936
|
)
|
(1,352
|
)
|
||||||
|
Decrease (increase) in inventory
|
3,239
|
(12,592
|
)
|
(2,631
|
)
|
|||||||
|
Increase in payables in respect of processing activity
|
41,187
|
20,510
|
13,832
|
|||||||||
|
Increase (decrease) in trade payables
|
1,189
|
4,519
|
(3,775
|
)
|
||||||||
|
Increase in other payables
|
5,529
|
4,177
|
4,797
|
|||||||||
|
Total changes in operating asset and liability items
|
3,965
|
(14,004
|
)
|
(5,223
|
)
|
|||||||
|
Total adjustments required to reflect the cash flow from operating activities
|
24,685
|
9,962
|
11,963
|
|||||||||
|
Appendix B – Information regarding investing and financing activities not involving cash flows:
|
||||||||||||
|
Purchase of property and equipment on credit
|
97
|
215
|
118
|
|||||||||
|
Acquisition of right-of-use assets through lease liabilities
|
338
|
2,048
|
1,428
|
|||||||||
|
Recognition of Sub lease asset
|
455
|
-
|
-
|
|||||||||
|
Share based payments costs attributed to development activities, capitalized as intangible assets
|
825
|
909
|
649
|
|||||||||
F - 10
| a. |
Background
|
| 1. |
Nayax Ltd. (hereafter – the “Company”) was incorporated in January 2005. The Company provides processing and software as a service (SaaS) business operations solutions and services via a global platform. The Company is marketing its POS devices and SaaS solutions it developed in more than 60 countries worldwide (including Israel) through subsidiaries (the Company and the subsidiaries, hereafter – the “Group”) and through local distributors.
|
| 2. |
On May 13, 2021, the Company completed an initial public offering (IPO) on the Tel Aviv stock exchange (TASE) in which it sold 4.4 million ordinary shares of NIS 0.001 par value for a gross amount, before issuance costs, of $141.6 million and $132.5 million, net of issuance costs. The IPO was a non-uniform offering, as this term is defined by Israeli Securities Regulations (Manner of Offering Securities to the Public), 2007, to institutional investors in Israel and outside of Israel.
|
| 3. |
On September 21, 2022, Company's ordinary shares were listed on the Nasdaq Global Select Market under the symbol NYAX. As of that date, the company is dual listed on Nasdaq and as well as on the Tel Aviv Stock Exchange.
|
| 4. |
In connection with Company's May 2021 IPO on the TASE, the expenses incurred in the profit or loss report for the year ended December 31, 2021, other than underwriter discount and commissions, were $1,879 thousand and include bonuses in respect of the IPO to a number of its employees for a total of $979 thousand. In connection with Company's September 2022 listing on Nasdaq, the expenses incurred in the profit or loss report for the year ended December 31, 2022 are $1,790 thousand.
|
| 5. |
On September 11, 2022 Company's shareholders approved a reverse share split in a ratio of 10:1. All issued and outstanding Company's Ordinary Shares have been retroactively adjusted to reflect the reverse share split for all periods presented in these financial statements prior the approval.
|
|
|
|
6.
|
In August 2023, the company filed with the Israel Securities Authority a shelf prospectus (the “Shelf Prospectus”). Such Shelf Prospectus allows the Company to raise from time to time funds through the offering and sale of various securities including debt and equity, in Israel, at the discretion of the Company. In October 2023, the company filed with the SEC a Registration Statement on Form F-3 (the “Registration Statement”). Such Registration Statement allows the company to raise fund from time to time through the offering and sale of various securities including debt and equity, at the discretion of the Company. Under the Registration Statement, certain selling shareholders may also offer and sell ordinary shares from time to time in one or more offerings, but we are not entitled to any funds raised from such sales.
|
| b. |
"Swords of Iron" - War against terror organization Hamas
|
NAYAX LTD.
NOTES TO CONSOLIDATED FINANCIAL STATEMENTS
| a. |
Basis of presentation:
|
| 1) |
The principal accounting policies set out below have been consistently applied to all periods presented, unless otherwise stated.
|
| 2) |
The preparation of financial statements in conformity with IFRS requires the use of certain critical accounting estimates. It also requires the Group’s management to exercise its judgment in the process of applying the Group’s accounting policies. Areas involving a higher degree of judgment or complexity, or areas where assumptions and estimates are significant to the consolidated financial statements are disclosed in note 3. Actual results may differ materially from estimates and assumptions used by the Group's management.
|
| 3) |
The Group's operating cycle is 12 months.
|
| b. |
Consolidated financial statements
|
| 1) |
Subsidiaries and business combinations
|
NAYAX LTD.
NOTES TO CONSOLIDATED FINANCIAL STATEMENTS
| b. |
Consolidated financial statements (continued):
|
| 2) |
Transactions with non-controlling interests' owners which do not result in loss of control
|
| 3) |
Associates
|
| 4) |
The equity method
|
| c. |
Translation of foreign currency balances and transactions:
|
| 1) |
Functional and presentation currency
|
NAYAX LTD.
NOTES TO CONSOLIDATED FINANCIAL STATEMENTS
| c. |
Translation of foreign currency balances and transactions (continued):
|
| 2) |
Transactions and balances
|
| 3) |
Translation of financial statements of Group entities:
|
| (a) |
Assets and liabilities for each statement of financial position statement presented are translated at the closing rate at the date of the statement of financial position;
|
| (b) |
Income and expenses for each statement of profit or loss are translated at average exchange rates for the period (unless this average is not a reasonable approximation of the cumulative effect of the rates prevailing on the transaction dates, in which case income and expenses are translated at the rate on the dates of the transactions), and;
|
|
(c)
|
All resulting exchange differences are recognized in other comprehensive income.
|
| d. |
Cash and cash equivalents
|
NAYAX LTD.
NOTES TO CONSOLIDATED FINANCIAL STATEMENTS
| e. |
Inventory
|
| f. |
Property and equipment
|
|
%
|
||
|
Computers and peripheral equipment
|
33
|
|
|
Rental of POS devices
|
20
|
|
|
Machinery and equipment
|
10
|
| g. |
Intangible assets:
|
| 1) |
Research and development
|
|
a)
|
The technical feasibility of completing the intangible asset so that it will be available for use exists;
|
|
b)
|
Management intends to complete the intangible asset and use or sell it;
|
| c) |
There is an ability to use or sell the intangible asset;
|
| d) |
The way the intangible asset will generate probable future economic benefits is demonstrable;
|
| e) |
The technical, financial and other resources to complete the development and to use or sell the intangible asset are available; and
|
| f) |
The expenditure attributable to the intangible asset during its development can be reliably measured.
|
|
(1)
|
Investments in new products (hardware and software), as opposed to expenses aimed at maintaining normal functionality;
|
|
(2)
|
Investment in integrations and opening markets; and
|
|
(3)
|
Investment in software for own use.
|
NAYAX LTD.
NOTES TO CONSOLIDATED FINANCIAL STATEMENTS
| g. |
Intangible assets (continued):
|
| 1) |
Research and development (continued):
|
| (1) |
Payroll costs and related expenses, which are attributed by the Group to the different projects that meet the conditions for capitalization;
|
| (2) |
Cost of subcontractors, which are specifically identified to projects that meet the conditions for capitalization.
|
| (3) |
Share-based payment expenses attributed apportionately to payroll and related suppliers expenses arises from development.
|
| 2) |
Distribution rights and Brand
|
| 3) |
Customer relationships
|
NAYAX LTD.
NOTES TO CONSOLIDATED FINANCIAL STATEMENTS
| g. |
Intangible assets (continued):
|
| 4) |
Technology
|
| 5) |
Goodwill
|
| h. |
Impairment of non-financial assets
|
NAYAX LTD.
NOTES TO CONSOLIDATED FINANCIAL STATEMENTS
| i. |
Leases:
|
| 1) |
The Group as a lessee:
|
| 2) |
The Group as a lessor:
Amounts due from lessees under finance leases are recognized as receivables at the amount of the Group’s net investment in the leases. Finance lease interest income is allocated to accounting periods so as to reflect a constant periodic rate of return on the Group’s net investment outstanding in respect of the leases.
|
| 3) |
Subleases
|
NAYAX LTD.
NOTES TO CONSOLIDATED FINANCIAL STATEMENTS
| j. |
Financial instruments:
|
NAYAX LTD.
NOTES TO CONSOLIDATED FINANCIAL STATEMENTS
| j. |
Financial instruments (continued):
|
NAYAX LTD.
NOTES TO CONSOLIDATED FINANCIAL STATEMENTS
| j. |
Financial instruments (continued):
|
| k. |
Trade receivables
|
| l. |
Trade payables
|
| m. |
Income taxes
|
NAYAX LTD.
NOTES TO CONSOLIDATED FINANCIAL STATEMENTS
| m. |
Income taxes (continued):
|
| n. |
Revenue recognition
|
| 1) |
Revenue measurement
|
| 2) |
Timing of revenue recognition
|
NAYAX LTD.
NOTES TO CONSOLIDATED FINANCIAL STATEMENTS
| n. |
Revenue recognition (continued):
|
| 3) |
Types of revenues of the Group
|
| o. |
Share-based payments
|
NAYAX LTD.
NOTES TO CONSOLIDATED FINANCIAL STATEMENTS
| o. |
Share-based payments (continued):
|
| p. |
Earnings (Loss) per share
|
| q. |
Provisions
|
| r. |
New International Financial Reporting Standards, amendments to standards and new interpretations:
|
| 1. |
Amendments to IAS 1 Presentation of Financial Statements and IFRS Practice Statement 2 Making Materiality Judgements - Disclosure of Accounting Policies
|
NAYAX LTD.
NOTES TO CONSOLIDATED FINANCIAL STATEMENTS
| 1) |
Development assets
|
NAYAX LTD.
NOTES TO CONSOLIDATED FINANCIAL STATEMENTS
| 2) |
Distribution rights, customer relationship and technology
|
| 3) |
Determining the lease terms
|
| 4) |
Fair value of share-based payments
|
| 5) |
Deferred tax assets
|
| 1) |
Market risks:
|
| a) |
Foreign exchange risks
|
NAYAX LTD.
NOTES TO CONSOLIDATED FINANCIAL STATEMENTS
| 1) |
Market risks (continued):
|
| a) |
Foreign exchange risks (continued):
|
|
Sensitivity test for changes in exchange rate
|
|||
|
Foreign currency
|
Years
|
Income (loss) from change
|
|
|
10% increase in exchange rate
|
10% decrease in exchange rate
|
||
|
US Dollars in thousands
|
|||
|
NIS
|
2023
|
(1,762)
|
1,762
|
|
2022
|
(2,168)
|
2,168
|
|
|
2021
|
1,408
|
(1,408)
|
|
|
EUR
|
2023
|
(1,698)
|
1,698
|
|
2022
|
1,288
|
(1,288)
|
|
|
2021
|
788
|
(788)
|
|
|
GPB
|
2023
|
123
|
(123)
|
|
2022
|
713
|
(713)
|
|
|
2021
|
824
|
(824)
|
|
|
AUD
|
2023
|
40
|
(40)
|
|
2022
|
201
|
(201)
|
|
|
2021
|
184
|
(184)
|
|
| b) |
Risk in respect of interest rate change
|
| 2) |
Credit risks
|
NAYAX LTD.
NOTES TO CONSOLIDATED FINANCIAL STATEMENTS
NOTE 4 - FINANCIAL INSTRUMENTS AND FINANICAL RISK MANAGEMENT (continued):
| 2) |
Credit risks (continued):
|
|
December 31, 2023
|
Not overdue
|
Over 30 days overdue
|
Over 60 days overdue
|
Over 120 days overdue
|
Total
|
|||||||||||||||
|
US Dollar in thousands
|
||||||||||||||||||||
|
Gross carrying amount – trade receivables
|
25,023
|
1,818
|
3,851
|
12,473
|
43,166
|
|||||||||||||||
|
Less – provision of allowance for credit loss
|
-
|
-
|
-
|
(1,866
|
)
|
(1,866
|
)
|
|||||||||||||
|
Trade receivable
|
25,023
|
1,818
|
3,851
|
10,607
|
41,300
|
|||||||||||||||
|
December 31, 2022
|
Not overdue
|
Over 30 days overdue
|
Over 60 days overdue
|
Over 120 days overdue
|
Total
|
|||||||||||||||
|
US Dollar in thousands
|
||||||||||||||||||||
|
Gross carrying amount – trade receivables
|
17,361
|
1,439
|
1,818
|
9,226
|
29,844
|
|||||||||||||||
|
Less – provision of allowance for credit loss
|
-
|
-
|
-
|
(2,432
|
)
|
(2,432
|
)
|
|||||||||||||
|
Trade receivable
|
17,361
|
1,439
|
1,818
|
6,794
|
27,412
|
|||||||||||||||
| 3) |
Liquidity risk
|
NAYAX LTD.
NOTES TO CONSOLIDATED FINANCIAL STATEMENTS
NOTE 4 - FINANCIAL INSTRUMENTS AND FINANICAL RISK MANAGEMENT (continued):
| 3) |
Liquidity risk (continued):
|
|
Less than one year
|
Between 1 and 2 years
|
Between 3 and 5 years
|
More than 5 years
|
Total
|
||||||||||||||||
|
US Dollars in thousands
|
||||||||||||||||||||
|
December 31, 2023:
|
||||||||||||||||||||
|
Short-term loans
|
47,477
|
-
|
-
|
-
|
47,477
|
|||||||||||||||
|
Long-term bank loans
|
1,110
|
370
|
-
|
-
|
1,480
|
|||||||||||||||
|
Long-term loans from others
|
3,835
|
-
|
-
|
-
|
3,835
|
|||||||||||||||
|
Liability in respect of purchase of servers
|
99
|
74
|
-
|
-
|
173
|
|||||||||||||||
|
Lease liabilities
|
2,325
|
1,897
|
2,022
|
495
|
6,739
|
|||||||||||||||
|
Payables in respect of processing activity
|
104,523
|
-
|
-
|
-
|
104,523
|
|||||||||||||||
|
Trade payables
|
17,464
|
-
|
-
|
-
|
17,464
|
|||||||||||||||
|
Other payables
|
25,650
|
-
|
-
|
-
|
25,650
|
|||||||||||||||
|
Total
|
202,483
|
2,341
|
2,022
|
495
|
207,341
|
|||||||||||||||
|
Less than one year
|
Between 1 and 2 years
|
Between 3 and 5 years
|
More than 5 years
|
Total
|
||||||||||||||||
|
US Dollars in thousands
|
||||||||||||||||||||
|
December 31, 2022:
|
||||||||||||||||||||
|
Short-term loans
|
7,874
|
-
|
-
|
-
|
7,874
|
|||||||||||||||
|
Long-term bank loans
|
1,136
|
1,515
|
-
|
-
|
2,651
|
|||||||||||||||
|
Long-term loans from others
|
3,917
|
3,699
|
-
|
-
|
7,616
|
|||||||||||||||
|
Liability in respect of purchase of servers
|
193
|
177
|
-
|
-
|
370
|
|||||||||||||||
|
Lease liabilities
|
2,402
|
2,392
|
3,400
|
483
|
8,677
|
|||||||||||||||
|
Payables in respect of processing activity
|
63,336
|
-
|
-
|
-
|
63,336
|
|||||||||||||||
|
Trade payables
|
14,574
|
-
|
-
|
-
|
14,574
|
|||||||||||||||
|
Other payables
|
17,229
|
-
|
-
|
-
|
17,229
|
|||||||||||||||
|
Total
|
110,661
|
7,783
|
3,400
|
483
|
122,327
|
|||||||||||||||
| 4) |
Capital risk:
|
NAYAX LTD.
NOTES TO CONSOLIDATED FINANCIAL STATEMENTS
NOTE 4 - FINANCIAL INSTRUMENTS AND FINANICAL RISK MANAGEMENT (continued):
| 4) |
Capital risk (continued):
|
|
Short-term credit
|
Long-term bank loans
|
Loans from others
|
Lease liabilities
|
Other liabilities
|
Total
|
|||||||||||||||||||
|
US Dollars in thousands
|
||||||||||||||||||||||||
|
Balance at January 1, 2023
|
7,684
|
2,496
|
7,367
|
8,150
|
362
|
26,059
|
||||||||||||||||||
|
Changes in 2023:
|
||||||||||||||||||||||||
|
Liabilities added in respect of new leases
|
-
|
-
|
-
|
595
|
-
|
595
|
||||||||||||||||||
|
Liabilities added in respect of loans from banks and others
|
39,135
|
-
|
-
|
-
|
-
|
39,135
|
||||||||||||||||||
|
Cash flows paid
|
-
|
(998
|
)
|
(3,626
|
)
|
(2,182
|
)
|
(182
|
)
|
(6,988
|
)
|
|||||||||||||
|
Amounts recognized in profit or loss and other changes
|
658
|
(70
|
)
|
179
|
(269
|
)
|
(10
|
)
|
488
|
|||||||||||||||
|
Balance at December 31, 2023:
|
47,477
|
1,428
|
3,920
|
6,294
|
170
|
59,289
|
||||||||||||||||||
|
Balance at January 1 2022
|
-
|
5,166
|
3,220
|
6,895
|
721
|
16,002
|
||||||||||||||||||
|
Changes in 2022:
|
||||||||||||||||||||||||
|
Liabilities added in respect of new leases
|
-
|
-
|
-
|
2,014
|
-
|
2,014
|
||||||||||||||||||
|
Liabilities added in respect of loans from banks and others
|
5,874
|
-
|
6,908
|
-
|
-
|
12,782
|
||||||||||||||||||
|
Liabilities added in respect of acquisitions
|
2,000
|
-
|
-
|
1,696
|
-
|
3,696
|
||||||||||||||||||
|
Cash flows paid
|
-
|
(2,282
|
)
|
(2,577
|
)
|
(2,146
|
)
|
(288
|
)
|
(7,293
|
)
|
|||||||||||||
|
Amounts recognized in profit or loss and other changes
|
(190
|
)
|
(388
|
)
|
(184
|
)
|
(309
|
)
|
(71
|
)
|
(1,142
|
)
|
||||||||||||
|
Balance at December 31 2022:
|
7,684
|
2,496
|
7,367
|
8,150
|
362
|
26,059
|
||||||||||||||||||
|
Balance at January 1 2021
|
11,589
|
7,329
|
5,703
|
6,474
|
994
|
32,089
|
||||||||||||||||||
|
Changes in 2021:
|
||||||||||||||||||||||||
|
Liabilities added in respect of new leases
|
-
|
-
|
-
|
1,428
|
-
|
1,428
|
||||||||||||||||||
|
Cash flows paid
|
(11,393
|
)
|
(1,971
|
)
|
(2,175
|
)
|
(1,406
|
)
|
(295
|
)
|
(17,240
|
)
|
||||||||||||
|
Amounts recognized in profit or loss and other changes
|
(196
|
)
|
(192
|
)
|
(308
|
)
|
399
|
22
|
(275
|
)
|
||||||||||||||
|
Balance at December 31 2021:
|
-
|
5,166
|
3,220
|
6,895
|
721
|
16,002
|
||||||||||||||||||
NAYAX LTD.
NOTES TO CONSOLIDATED FINANCIAL STATEMENTS
|
For the year ended December 31
|
||||||||||||
|
2023
|
2022
|
2021
|
||||||||||
|
US Dollars in thousands
|
||||||||||||
|
USA
|
83,528
|
60,270
|
36,887
|
|||||||||
|
Europe (excluding UK)
|
72,887
|
48,664
|
36,475
|
|||||||||
|
UK
|
26,391
|
21,931
|
16,577
|
|||||||||
|
Australia
|
22,484
|
17,235
|
12,672
|
|||||||||
|
Israel
|
13,095
|
14,129
|
10,764
|
|||||||||
|
Rest of the world
|
17,106
|
11,285
|
5,759
|
|||||||||
|
235,491
|
173,514
|
119,134
|
||||||||||
|
Set forth below is a breakdown of the non-current assets, excluding deferred tax assets and financial assets, by geographic regions:
|
|
December 31
|
||||||||
|
2023
|
2022
|
|||||||
|
US Dollars in thousands
|
||||||||
|
Israel
|
97,209
|
60,459
|
||||||
|
USA
|
13,696
|
6,863
|
||||||
|
Rest of the world
|
1,027
|
2,096
|
||||||
|
111,932
|
69,418
|
|||||||
| a. |
Acquisition of Roseman Engineering Ltd.
|
| b. |
Acquisition of Retail Pro
|
NAYAX LTD.
NOTES TO CONSOLIDATED FINANCIAL STATEMENTS
| b. |
Acquisition of Retail Pro (continued):
|
|
US Dollars in thousands
|
||||
|
Consideration paid in cash
|
18,759
|
|||
|
Contingent Consideration
|
12,141
|
|||
|
Total consideration
|
30,900
|
|||
|
Amounts recognized on merger date:
|
||||
|
Cash and cash equivalents
|
430
|
|||
|
Trade receivables
|
1,854
|
|||
|
Other receivables
|
280
|
|||
|
Property and equipment
|
140
|
|||
|
Technology
|
20,148
|
|||
|
Customer relations
|
7,092
|
|||
|
Brand
|
3,031
|
|||
|
Trade payables
|
(1,339
|
)
|
||
|
Other payables
|
(924
|
)
|
||
|
Deferred Tax Liability
|
(2,626
|
)
|
||
|
Total identifiable assets, net
|
28,086
|
|||
|
Goodwill (*)
|
2,814
|
|||
|
Total Consideration
|
30,900
|
|||
|
Cash flows in respect of the acquisition
|
18,759
|
|||
|
Cash and cash equivalents of subsidiary
|
430
|
|||
|
Acquisition of subsidiary, less cash acquired
|
18,329
|
|||
NAYAX LTD.
NOTES TO CONSOLIDATED FINANCIAL STATEMENTS
| b. |
Acquisition of Retail Pro (continued):
|
NAYAX LTD.
NOTES TO CONSOLIDATED FINANCIAL STATEMENTS
| c. |
On Track Innovation Ltd.
|
NAYAX LTD.
NOTES TO CONSOLIDATED FINANCIAL STATEMENTS
| c. |
On Track Innovation Ltd. (continued):
|
|
As of June 9, 2022
|
||||
|
|
US Dollars in thousands
|
|||
|
Deferred consideration
|
4,500
|
|||
|
Total consideration
|
4,500
|
|||
|
|
||||
|
Amounts recognized on merger date:
|
||||
|
Cash and cash equivalents
|
440
|
|||
|
Trade receivables
|
983
|
|||
|
Inventory
|
3,569
|
|||
|
Other receivables
|
1,397
|
|||
|
Right of use assets
|
1,722
|
|||
|
Property and equipment
|
660
|
|||
|
Other assets
|
145
|
|||
|
Technology
|
1,711
|
|||
|
Customer relations
|
5,046
|
|||
|
Short-term bank loans
|
(2,001
|
)
|
||
|
Trade payables
|
(1,392
|
)
|
||
|
Other payables
|
(1,982
|
)
|
||
|
Lease liability
|
(1,696
|
)
|
||
|
Other long term liabilities
|
(69
|
)
|
||
|
Long term liability from the Company (*)
|
(6,757
|
)
|
||
|
Total identifiable assets, net (**)
|
1,776
|
|||
|
Goodwill (***)
|
2,724
|
|||
|
Total Consideration
|
4,500
|
|||
|
Cash flows in respect of the acquisition, as presented in cash flows from investing activities
|
||||
|
Cash and cash equivalents of subsidiary included in consolidated for the first time
|
440
|
|||
|
Acquisition of subsidiary, less cash acquired, as presented in cash flows from investing activity
|
440
|
|||
NAYAX LTD.
NOTES TO CONSOLIDATED FINANCIAL STATEMENTS
| d. |
Collaboration agreement of IoT Technology Holdings Ltd.
|
| a) |
First Call Option - a Call Option granted to the Company to buy from BHP and Feit such number of shares that following the exercise of the First Call Option, the Company will hold 50.1% of the voting rights in IoT Technology, such that the Company will be able to consolidate the Company in its financial statements. The option can be exercised by the Company between two to eleven years from signing of the New Agreement date. As of December 31, 2023, the fair value of the First Call Option was determined to be $1,822 thousand.
|
| b) |
Second Call Option - a Second Call Option granted to the Company to buy from BHP and Feit such number of shares that following the exercise option the Company will hold 100% from IoT Technology. The option can be exercised by the Company at any time during a period of ten years following the exercise of the First Call Option and in no event later than fourteen years from the signing of New Agreement.
|
| c) |
Put Option - the Put Option granted by the Company to BHP and Feit to sell the remaining shares of IoT Technology. The Put Option shall be exercisable commencing at any time following the lapse of two years following the signing of the New Agreement and ending upon the lapse of the Second Call Option period.
|
|
|
For all the three options above, the exercise consideration to be paid depends on IOT's annual revenue volume ("ARV"). Such ARV will be determined by IOT's average monthly revenue of the recent 3 months (prior to the exercising of the option) times 12. The pre-determined multipliers range from 10 to 15, times the percentage acquired for the exercising of the Call & Put Options, respectively. In exercising the Second Call Option, should the compound annual growth rate (“CAGR”) over the 3-year period preceding the notice of exercise of the Second Call Option shall be 35% or more, the ARV shall be 20 times. |
|
US Dollars in
thousands
|
||||
|
Financial assets at fair value through profit or loss (*)
|
1,822
|
|||
|
Liability for deferred consideration
|
1,500
|
|||
|
Deferred income (**)
|
418
|
|||
| (*) |
The options mentioned above are measured at fair value through profit and loss used the Monte Carlo option pricing model.
|
| (**) |
Deferred income represents an advance for providing future services by the Company to IoT Technology.
|
NAYAX LTD.
NOTES TO CONSOLIDATED FINANCIAL STATEMENTS
NOTE 7 - CASH AND CASH EQUIVALENTS:
|
December 31,
|
||||||||
|
2023
|
2022
|
|||||||
|
US Dollars in thousands
|
||||||||
|
US Dollar
|
14,673
|
11,415
|
||||||
|
New Israeli Shekel
|
9,777
|
1,498
|
||||||
|
Euro
|
3,044
|
11,182
|
||||||
|
British pound sterling
|
2,026
|
3,909
|
||||||
|
Australian Dollar
|
1,078
|
1,650
|
||||||
|
Other currencies
|
7,788
|
4,226
|
||||||
|
38,386
|
33,880
|
|||||||
NAYAX LTD.
NOTES TO CONSOLIDATED FINANCIAL STATEMENTS
NOTE 9 - TRADE RECEIVABLES
|
December 31,
|
||||||||
|
2023
|
2022
|
|||||||
|
US Dollars in thousands
|
||||||||
|
Open accounts
|
43,166
|
29,844
|
||||||
|
Less – provision of allowance for credit loss
|
(1,866
|
)
|
(2,432
|
)
|
||||
|
Trade receivables - net
|
41,300
|
27,412
|
||||||
|
b.
|
Changes in provision of allowance for credit loss:
|
|
US Dollars in thousands
|
||||
|
Balance as of January 1, 2023
|
2,432
|
|||
|
Amounts provided against profit or loss in respect of receivables for which the provision for loss is measured over the entire life of the receivable balance
|
(566
|
)
|
||
|
Balance as of December 31, 2023
|
1,866
|
|||
|
Balance as of January 1, 2022
|
1,549
|
|||
|
Amounts provided against profit or loss in respect of receivables for which the provision for loss is measured over the entire life of the receivable balance
|
883
|
|||
|
Balance as of December 31, 2022
|
2,432
|
|||
NAYAX LTD.
NOTES TO CONSOLIDATED FINANCIAL STATEMENTS
| a. |
General
|
|
Years of depreciation
|
Interest rate
|
|||||
|
Buildings
|
2-4
|
1.5%-5%
|
|
|||
|
Technological equipment
|
3-5
|
3.88%
|
|
| b. |
Composition and movement of right-of-use assets:
|
|
Buildings
|
Technological equipment
|
Total
|
||||||||||
|
US Dollars in thousands
|
||||||||||||
|
Cost:
|
||||||||||||
|
Balance as of January 1, 2023
|
10,947
|
331
|
11,278
|
|||||||||
|
Additions during the year
|
338
|
-
|
338
|
|||||||||
|
Disposals
|
(455
|
)
|
(331
|
)
|
(786
|
)
|
||||||
|
Other changes
|
257
|
-
|
257
|
|||||||||
|
Balance as of December 31, 2023
|
11,087
|
-
|
11,087
|
|||||||||
|
Depreciation and amortization:
|
||||||||||||
|
Balance as of January 1, 2023
|
3,579
|
318
|
3,897
|
|||||||||
|
Depreciation during the year
|
2,167
|
11
|
2,178
|
|||||||||
|
Disposals
|
-
|
(329
|
)
|
(329
|
)
|
|||||||
|
Balance as of December 31, 2023
|
5,746
|
-
|
5,746
|
|||||||||
|
Right-of-use assets - net
|
5,341
|
-
|
5,341
|
|||||||||
NAYAX LTD.
NOTES TO CONSOLIDATED FINANCIAL STATEMENTS
| b. |
Composition and changes in right-of-use assets (continued):
|
|
Buildings
|
Technological equipment
|
Total
|
||||||||||
|
US Dollars in thousands
|
||||||||||||
|
Cost:
|
||||||||||||
|
Balance as of January 1, 2022
|
7,382
|
331
|
7,713
|
|||||||||
|
Additions during the year
|
2,048
|
-
|
2,048
|
|||||||||
|
Additions in respect of acquisition
|
1,722
|
-
|
1,722
|
|||||||||
|
Disposals
|
(462
|
)
|
-
|
(462
|
)
|
|||||||
|
Other changes
|
257
|
-
|
257
|
|||||||||
|
Balance as of December 31, 2022
|
10,947
|
331
|
11,278
|
|||||||||
|
Depreciation and amortization:
|
||||||||||||
|
Balance as of January 1, 2022
|
2,186
|
252
|
2,438
|
|||||||||
|
Depreciation during the year
|
1,731
|
66
|
1,797
|
|||||||||
|
Disposals
|
(338
|
)
|
-
|
(338
|
)
|
|||||||
|
Balance as of December 31, 2022
|
3,579
|
318
|
3,897
|
|||||||||
|
Right-of-use assets - net
|
7,368
|
13
|
7,381
|
|||||||||
|
Buildings
|
Technological equipment
|
Total
|
||||||||||
|
US Dollars in thousands
|
||||||||||||
|
Cost:
|
||||||||||||
|
Balance as of January 1, 2021
|
5,752
|
331
|
6,083
|
|||||||||
|
Additions during the year
|
1,428
|
-
|
1,428
|
|||||||||
|
Other changes
|
202
|
-
|
202
|
|||||||||
|
Balance as of December 31, 2021
|
7,382
|
331
|
7,713
|
|||||||||
|
Depreciation and amortization:
|
||||||||||||
|
Balance as of January 1, 2021
|
1,136
|
186
|
1,322
|
|||||||||
|
Depreciation during the year
|
1,050
|
66
|
1,116
|
|||||||||
|
Balance as of December 31, 2021
|
2,186
|
252
|
2,438
|
|||||||||
|
Right-of-use assets - net
|
5,196
|
79
|
5,275
|
|||||||||
NAYAX LTD.
NOTES TO CONSOLIDATED FINANCIAL STATEMENTS
| c. |
Composition and changes in lease liabilities
|
|
Buildings
|
Technological equipment
|
Total
|
||||||||||
|
US Dollars in thousands
|
||||||||||||
|
Balance as of January 1, 2023
|
8,141
|
9
|
8,150
|
|||||||||
|
Additions during the year
|
338
|
-
|
338
|
|||||||||
|
Interest expenses
|
330
|
-
|
330
|
|||||||||
|
Lease payments
|
(2,503
|
)
|
(9
|
) |
(2,512
|
)
|
||||||
|
Other changes
|
(12
|
)
|
-
|
(12
|
)
|
|||||||
|
Balance as of December 31, 2023
|
6,294
|
-
|
6,294
|
|||||||||
|
Current maturities of lease liabilities
|
2,145
|
-
|
2,145
|
|||||||||
|
Long-term lease liabilities
|
4,149
|
-
|
4,149
|
|||||||||
|
Balance as of December 31, 2023
|
6,294
|
-
|
6,294
|
|||||||||
|
Buildings
|
Technological equipment
|
Total
|
||||||||||
|
US Dollars in thousands
|
||||||||||||
|
Balance as of January 1, 2022
|
6,769
|
126
|
6,895
|
|||||||||
|
Additions during the year
|
2,014
|
-
|
2,014
|
|||||||||
|
Additions in respect of acquisition
|
1,696
|
-
|
1,696
|
|||||||||
|
Disposals
|
(131
|
)
|
-
|
(131
|
)
|
|||||||
|
Interest expenses
|
293
|
3
|
296
|
|||||||||
|
Lease payments
|
(2,036
|
)
|
(111
|
)
|
(2,147
|
)
|
||||||
|
Other changes
|
(464
|
)
|
(9
|
)
|
(473
|
)
|
||||||
|
Balance as of December 31, 2022
|
8,141
|
9
|
8,150
|
|||||||||
|
Current maturities of lease liabilities
|
2,197
|
9
|
2,206
|
|||||||||
|
Long-term lease liabilities
|
5,944
|
-
|
5,944
|
|||||||||
|
Balance as of December 31, 2022
|
8,141
|
9
|
8,150
|
|||||||||
NAYAX LTD.
NOTES TO CONSOLIDATED FINANCIAL STATEMENTS
| c. |
Composition and changes in lease liabilities (continued):
|
|
Buildings
|
Technological equipment
|
Total
|
||||||||||
|
US Dollars in thousands
|
||||||||||||
|
Balance as of January 1, 2021
|
6,245
|
229
|
6,474
|
|||||||||
|
Additions during the year
|
1,428
|
-
|
1,428
|
|||||||||
|
Interest expenses
|
207
|
7
|
214
|
|||||||||
|
Lease payments
|
(1,506
|
)
|
(114
|
)
|
(1,620
|
)
|
||||||
|
Other changes
|
395
|
4
|
399
|
|||||||||
|
Balance as of December 31, 2021
|
6,769
|
126
|
6,895
|
|||||||||
|
Current maturities of lease liabilities
|
1,387
|
115
|
1,502
|
|||||||||
|
Long-term lease liabilities
|
5,382
|
11
|
5,393
|
|||||||||
|
Balance as of December 31, 2021
|
6,769
|
126
|
6,895
|
| d. |
The Group incurred expenses in the amounts of $330, $209 thousand and $168 thousand in 2023, 2022 and 2021, respectively, related to short-term leases, which were included in research and development expenses and selling, general and administrative expenses.
|
NAYAX LTD.
NOTES TO CONSOLIDATED FINANCIAL STATEMENTS
|
Leasehold improvements
|
Computers and peripheral equipment
|
Rented POS devices
|
Machines and equipment
|
Total
|
||||||||||||||||
|
US Dollars in thousands
|
||||||||||||||||||||
|
Cost:
|
||||||||||||||||||||
|
Balance as of January 1, 2023
|
3,956
|
15,380
|
606
|
586
|
20,528
|
|||||||||||||||
|
Additions
|
13
|
641
|
54
|
-
|
708
|
|||||||||||||||
|
Acquired through business combinations
|
-
|
140
|
-
|
-
|
140
|
|||||||||||||||
|
Disposals
|
-
|
(83
|
)
|
-
|
-
|
(83
|
)
|
|||||||||||||
|
Translation differences
|
-
|
(7
|
)
|
(21
|
)
|
-
|
(28
|
)
|
||||||||||||
|
Balance as of December 31, 2023
|
3,969
|
16,071
|
639
|
586
|
21,265
|
|||||||||||||||
|
Accumulated depreciation:
|
||||||||||||||||||||
|
Balance as of January 1, 2023
|
883
|
12,391
|
316
|
270
|
13,860
|
|||||||||||||||
|
Depreciation during the year
|
311
|
1,414
|
237
|
42
|
2,004
|
|||||||||||||||
|
Disposals
|
-
|
(83
|
)
|
-
|
-
|
(83
|
)
|
|||||||||||||
|
Translation differences
|
-
|
(2
|
)
|
(1
|
)
|
-
|
(3
|
)
|
||||||||||||
|
Balance as of December 31, 2023
|
1,194
|
13,720
|
552
|
312
|
15,778
|
|||||||||||||||
|
Net book value:
|
||||||||||||||||||||
|
As of December 31, 2023
|
2,775
|
2,351
|
87
|
274
|
5,487
|
|||||||||||||||
NAYAX LTD.
NOTES TO CONSOLIDATED FINANCIAL STATEMENTS
|
Leasehold improvements
|
Computers and peripheral equipment
|
Rented POS
devices
|
Machines and equipment
|
Total
|
||||||||||||||||
|
US Dollars in thousands
|
||||||||||||||||||||
|
Cost:
|
||||||||||||||||||||
|
Balance as of January 1, 2022
|
3,638
|
6,245
|
523
|
547
|
10,953
|
|||||||||||||||
|
Additions
|
79
|
1,388
|
227
|
39
|
1,733
|
|||||||||||||||
|
Acquired through business combinations
|
239
|
8,043
|
-
|
-
|
8,282
|
|||||||||||||||
|
Disposals
|
-
|
(269
|
)
|
-
|
-
|
(269
|
)
|
|||||||||||||
|
Translation differences
|
-
|
(27
|
)
|
(144
|
)
|
-
|
(171
|
)
|
||||||||||||
|
Balance as of December 31, 2022
|
3,956
|
15,380
|
606
|
586
|
20,528
|
|||||||||||||||
|
Accumulated depreciation:
|
||||||||||||||||||||
|
Balance as of January 1, 2022
|
511
|
3,772
|
215
|
230
|
4,728
|
|||||||||||||||
|
Depreciation during the year
|
372
|
1,271
|
113
|
40
|
1,796
|
|||||||||||||||
|
Disposals
|
-
|
(265
|
)
|
-
|
-
|
(265
|
)
|
|||||||||||||
|
Acquisitions during the year
|
-
|
7,622
|
-
|
-
|
7,622
|
|||||||||||||||
|
Translation differences
|
-
|
(9
|
)
|
(12
|
)
|
-
|
(21
|
)
|
||||||||||||
|
Balance as of December 31, 2022
|
883
|
12,391
|
316
|
270
|
13,860
|
|||||||||||||||
|
Net book value:
|
||||||||||||||||||||
|
As of December 31, 2022
|
3,073
|
2,989
|
290
|
316
|
6,668
|
|||||||||||||||
|
Leasehold improvements
|
Computers and peripheral equipment
|
Rented POS devices
|
Machines and equipment
|
Total
|
||||||||||||||||
|
US Dollars in thousands
|
||||||||||||||||||||
|
Cost:
|
||||||||||||||||||||
|
Balance as of January 1, 2021
|
2,452
|
4,889
|
407
|
450
|
8,198
|
|||||||||||||||
|
Additions
|
1,186
|
1,372
|
100
|
97
|
2,755
|
|||||||||||||||
|
Acquired through business combinations
|
3
|
-
|
-
|
3
|
||||||||||||||||
|
Disposals
|
-
|
(26
|
)
|
-
|
-
|
(26
|
)
|
|||||||||||||
|
Translation differences
|
-
|
7
|
16
|
-
|
23
|
|||||||||||||||
|
Balance as of December 31, 2021
|
3,638
|
6,245
|
523
|
547
|
10,953
|
|||||||||||||||
|
Accumulated depreciation:
|
||||||||||||||||||||
|
Balance as of January 1, 2021
|
289
|
2,646
|
154
|
62
|
3,151
|
|||||||||||||||
|
Depreciation during the year
|
222
|
1,148
|
61
|
168
|
1,599
|
|||||||||||||||
|
Disposals
|
-
|
(26
|
)
|
-
|
-
|
(26
|
)
|
|||||||||||||
|
Translation differences
|
-
|
4
|
-
|
-
|
4
|
|||||||||||||||
|
Balance as of December 31, 2021
|
511
|
3,772
|
215
|
230
|
4,728
|
|||||||||||||||
|
Net book value:
|
||||||||||||||||||||
|
As of December 31, 2021
|
3,127
|
2,473
|
308
|
317
|
6,225
|
|||||||||||||||
NAYAX LTD.
NOTES TO CONSOLIDATED FINANCIAL STATEMENTS
|
Capitalized Development costs **
|
Distribution rights and Brand*
|
Customer relationships purchased *
|
Technology **
|
Goodwill (a)
|
Patents **
|
Total
|
||||||||||||||||||||||
|
US Dollars in thousands
|
||||||||||||||||||||||||||||
|
Cost:
|
||||||||||||||||||||||||||||
|
Balance as of January 1, 2023
|
49,806
|
5,292
|
8,884
|
4,456
|
10,196
|
806
|
79,440
|
|||||||||||||||||||||
|
Additions
|
16,773
|
-
|
-
|
-
|
-
|
-
|
16,773
|
|||||||||||||||||||||
|
Acquired through business combinations
|
-
|
3,031
|
7,092
|
20,148
|
2,814
|
-
|
33,085
|
|||||||||||||||||||||
|
Disposals
|
(138
|
)
|
-
|
-
|
-
|
-
|
-
|
(138
|
)
|
|||||||||||||||||||
|
Translation differences
|
(26
|
)
|
-
|
(60
|
)
|
(30
|
)
|
(144
|
)
|
-
|
(260
|
)
|
||||||||||||||||
|
Balance as of December 31, 2023
|
66,415
|
8,323
|
15,916
|
24,574
|
12,866
|
806
|
128,900
|
|||||||||||||||||||||
|
Accumulated amortization:
|
||||||||||||||||||||||||||||
|
Balance as of January 1, 2023
|
18,206
|
2,261
|
1,693
|
2,055
|
-
|
109
|
24,324
|
|||||||||||||||||||||
|
Amortization
|
5,386
|
315
|
1,574
|
984
|
-
|
62
|
8,321
|
|||||||||||||||||||||
|
Disposals
|
(138
|
)
|
-
|
-
|
-
|
-
|
-
|
(138
|
)
|
|||||||||||||||||||
|
Translation differences
|
(3
|
)
|
-
|
(7
|
)
|
(8
|
)
|
-
|
-
|
(18
|
)
|
|||||||||||||||||
|
Balance as of December 31, 2023
|
23,451
|
2,576
|
3,260
|
3,031
|
-
|
171
|
32,489
|
|||||||||||||||||||||
|
Net book value:
|
||||||||||||||||||||||||||||
|
As of December 31, 2023
|
42,964
|
5,747
|
12,656
|
21,543
|
12,866
|
635
|
96,411
|
|||||||||||||||||||||
NAYAX LTD.
NOTES TO CONSOLIDATED FINANCIAL STATEMENTS
|
Capitalized Development costs **
|
Distribution rights *
|
Customer relationships purchased *
|
Technology **
|
Goodwill (a)
|
Patents **
|
Total
|
||||||||||||||||||||||
|
US Dollars in thousands
|
||||||||||||||||||||||||||||
|
Cost:
|
||||||||||||||||||||||||||||
|
Balance as of January 1, 2022
|
34,209
|
5,292
|
4,188
|
2,921
|
8,271
|
806
|
55,687
|
|||||||||||||||||||||
|
Additions
|
14,615
|
-
|
-
|
-
|
-
|
-
|
14,615
|
|||||||||||||||||||||
|
Acquired through business combinations
|
1,261
|
-
|
5,046
|
1,711
|
2,724
|
-
|
10,742
|
|||||||||||||||||||||
|
Translation differences
|
(279
|
)
|
-
|
(350
|
)
|
(176
|
)
|
(799
|
)
|
-
|
(1,604
|
)
|
||||||||||||||||
|
Balance as of December 31, 2022
|
49,806
|
5,292
|
8,884
|
4,456
|
10,196
|
806
|
79,440
|
|||||||||||||||||||||
|
Accumulated amortization:
|
||||||||||||||||||||||||||||
|
Balance as of January 1, 2022
|
13,454
|
1,996
|
843
|
1,546
|
-
|
47
|
17,886
|
|||||||||||||||||||||
|
Amortization
|
3,642
|
265
|
902
|
564
|
-
|
62
|
5,435
|
|||||||||||||||||||||
|
Acquisitions during the year
|
1,116
|
-
|
1,116
|
|||||||||||||||||||||||||
|
Translation differences
|
(6
|
)
|
-
|
(52
|
)
|
(55
|
)
|
-
|
-
|
(113
|
)
|
|||||||||||||||||
|
Balance as of December 31, 2022
|
18,206
|
2,261
|
1,693
|
2,055
|
-
|
109
|
24,324
|
|||||||||||||||||||||
|
Net book value:
|
||||||||||||||||||||||||||||
|
As of December 31, 2022
|
31,600
|
3,031
|
7,191
|
2,401
|
10,196
|
697
|
55,116
|
|||||||||||||||||||||
|
Capitalized Development costs **
|
Distribution rights *
|
Customer relationships purchased *
|
Technology **
|
Goodwill (a)
|
Patents **
|
Total
|
||||||||||||||||||||||
|
US Dollars in thousands
|
||||||||||||||||||||||||||||
|
Cost:
|
||||||||||||||||||||||||||||
|
Balance as of January 1, 2021
|
27,477
|
5,292
|
1,636
|
2,111
|
3,478
|
806
|
40,800
|
|||||||||||||||||||||
|
Additions
|
6,708
|
-
|
-
|
-
|
-
|
-
|
6,708
|
|||||||||||||||||||||
|
Acquired through business combinations
|
-
|
-
|
2,478
|
769
|
4,615
|
-
|
7,862
|
|||||||||||||||||||||
|
Disposals
|
(30
|
)
|
-
|
-
|
-
|
-
|
-
|
(30
|
)
|
|||||||||||||||||||
|
Translation differences
|
54
|
-
|
74
|
41
|
178
|
-
|
347
|
|||||||||||||||||||||
|
Balance as of December 31, 2021
|
34,209
|
5,292
|
4,188
|
2,921
|
8,271
|
806
|
55,687
|
|||||||||||||||||||||
|
Accumulated amortization:
|
||||||||||||||||||||||||||||
|
Balance as of January 1, 2021
|
10,244
|
1,730
|
423
|
1,015
|
-
|
-
|
13,412
|
|||||||||||||||||||||
|
Amortization
|
3,240
|
266
|
407
|
523
|
-
|
47
|
4,483
|
|||||||||||||||||||||
|
Disposals
|
(30
|
)
|
-
|
-
|
-
|
-
|
-
|
(30
|
)
|
|||||||||||||||||||
|
Translation differences
|
-
|
-
|
13
|
8
|
-
|
-
|
21
|
|||||||||||||||||||||
|
Balance as of December 31, 2021
|
13,454
|
1,996
|
843
|
1,546
|
-
|
47
|
17,886
|
|||||||||||||||||||||
|
Net book value:
|
||||||||||||||||||||||||||||
|
As of December 31, 2021
|
20,755
|
3,296
|
3,345
|
1,375
|
8,271
|
759
|
37,801
|
|||||||||||||||||||||
| * |
Amortization of customer relationship and distribution rights are included under selling, general and administrative expenses.
|
| ** |
Amortization of technology, patents and development costs are included in “depreciation and amortization in respect of technology, patents and capitalized development costs”.
|
NAYAX LTD.
NOTES TO CONSOLIDATED FINANCIAL STATEMENTS
| (a) |
Goodwill
|
| 1. |
Retail Pro International LLC. - As part of the business combination for the purchase of Retail Pro International LLC. (hereinafter – "RPI") the Company recognized goodwill in the total amount of $2,814 thousand (see note 6). The following key assumptions were used to determine the value in use of the CGU as at December 31, 2023:
|
|
RPI
|
||||
|
Growth rate
|
3
|
%
|
||
|
Discount rate
|
16.1
|
%
|
||
| 2. |
On Track Innovations Ltd. - As part of the business combination for the purchase of On Track Innovations Ltd. (hereinafter – "OTI") the Company recognized goodwill in the total amount of $2,724 thousand. The following key assumptions were used to determine the value in use of the CGU as at December 31, 2023:
|
|
OTI
|
||||
|
Growth rate
|
3
|
%
|
||
|
Discount rate
|
18.9
|
%
|
||
NAYAX LTD.
NOTES TO CONSOLIDATED FINANCIAL STATEMENTS
| (a) |
Goodwill (continued):
|
| 3. |
Nayax Retail - As part of the business combination for the purchase of Nayax Retail Ltd. (hereinafter – "Nayax Retail"). As part of the business combination related to the acquisition of Nayax Retail, the Company recognized intangible assets (goodwill) in the total amount of $2,358 thousand.
|
|
Retail
|
||||
|
Growth rate
|
3
|
%
|
||
|
Discount rate
|
22.1
|
%
|
||
| 4. |
Weezmo - As part of the business combination related to the acquisition of Weezmo, intangible assets of goodwill at $4,078 thousand were recognized.
|
|
Weezmo
|
||||
|
Growth rate
|
3
|
%
|
||
|
Discount rate
|
21
|
%
|
||
| 5. |
Vendsys - As part of the business combination related to the acquisition of Greenhithe Software Solutions Ltd (hereinafter – "VendSys") the Company recognized goodwill in the total amount of $891 thousand. The following key assumptions were used to determine the value in use of the CGU as at December 31, 2023
|
|
Vendsys
|
||||
|
Growth rate
|
4
|
%
|
||
|
Discount rate
|
12
|
%
|
||
NAYAX LTD.
NOTES TO CONSOLIDATED FINANCIAL STATEMENTS
| a. |
Short-term bank credit(*)
|
| 1) |
The company is a party to a short-term credit facility with an Israeli bank with commitments totaling $15 million (NIS 54 million). As of December 31, 2023, a total of $11 million (NIS 42 million) was outstanding under the short-term credit facility. The short-term credit facility bears a prime based variable interest rate.
|
| 2) |
In May 2023 the company received a short-term credit facility in the amount of NIS 17 million from an Israeli bank that bears a prime based variable interest rate.
|
| 3) |
In July 2023, the Company entered into an additional short-term credit facility with an Israeli bank in the amount of $9.75 million, which was later increased to $30 million. The short-term credit facility bears a prime based variable interest rate. In November 2023, the same bank approved an additional loan amount of $17 million that will be used as a bridge loan for the purchase of Retail Pro’s intellectual property and the purchase of all of Retail Pro’s equity rights by a fully owned subsidiary of the company.
|
| b. |
As of December 31, 2023, a wholly owned subsidiary of the Company has a short-term loan of $2 million (NIS 7.2 million) from an Israeli bank. The short-term loan bears a foreign exchange market variable interest rate. The loan is renewed monthly, in the Company’s sole discretion.
|
|
December 31,
|
||||||||
|
2023
|
2022
|
|||||||
|
US Dollars in thousands
|
||||||||
|
Long-term bank loans
|
1,428
|
2,496
|
||||||
|
Less - current maturities
|
(1,101
|
)
|
(1,052
|
)
|
||||
|
327
|
1,444
|
|||||||
| 1) |
In May 2020, the Company received a long-term loan from the Bank, backed by a government guarantee, in the amount of NIS 15 million ($4.25 million). The loan bears interest of Prime + 1.5%, payable monthly beginning in May 2021. The loan's principal will be returned in 48 monthly installments beginning in May 2021.
|
NAYAX LTD.
NOTES TO CONSOLIDATED FINANCIAL STATEMENTS
NOTE 14 - LONG-TERM LOANS FROM OTHERS
|
December 31,
|
||||||||
|
2023
|
2022
|
|||||||
|
US Dollars in thousands
|
||||||||
|
Long-term loans from others *
|
3,920
|
7,367
|
||||||
|
Less – current maturities
|
(3,601
|
)
|
(3,585
|
)
|
||||
|
319
|
3,782
|
|||||||
| a. |
In February 2020, the Group received a loan in the amount of Euro 3.5 million ($3.8 million). The loan bears effective annual interest of 4.74% and is being returned in 24 equal monthly instalments beginning in February 2021. In March 2021, following the COVID crisis, the Company received an approval to defer repayment of the said loan by six months and was fully repaid during 2023.
|
| b. |
In December 2, 2022 the company received an additional loan in the amount of Euro 6.5 million ($6,850 million). The additional amount bears effective annual interest rate of 10% and is being returned by an equal 25 instalments where the last payment is expected to be on January 2025.
|
NOTE 15 - OTHER LONG-TERM LIABILTIES
Composition of other long-term liabilities, net of current maturities
|
December 31,
|
||||||||
|
2023
|
2022
|
|||||||
|
US Dollars in thousands
|
||||||||
|
Contingent consideration, see note 6 (*)
|
12,141
|
1,006
|
||||||
|
Liability for forward contract for acquisitions (**)
|
1,485
|
1,536
|
||||||
|
Other
|
531
|
738
|
||||||
|
14,157
|
3,280
|
|||||||
| (*) |
With regards to liability for contingent payment as of December 31, 2023, the company recognized a contingent liability as part of the acquisition of RPI, see note 6. As of December 31, 2022 the long-term employee benefit, which was not included in the application of the purchase method to the acquisition of VendSys is estimated at $1,006 thousand.
|
| (**) |
The Company issued to Tigapo a put option enabling an additional investment of up to $1 million. The put option is a liability financial instrument measured at fair value through profit or loss. As of December 31, 2023 and 2022, the put option was valued in the amount of $1,485 and $1,536 thousands.
|
NAYAX LTD.
NOTES TO CONSOLIDATED FINANCIAL STATEMENTS
NOTE 16 - INCOME TAXES
| a. |
Taxation of the Company in Israel
|
| 1) |
Tax rates:
|
| 2) |
In December 2020, the Company received an in-agreement tax ruling, indicating that the enterprise of the Company meets the definition of a Technological Preferred Enterprise, and that the income of the Company from selling POS devices, provision of processing SaaS are deemed "technology income" as defined by Section 51 to the Encouragement of Capital Investment Law, 1959 (hereinafter - "the Law"), which are subject to 12% tax, while income attributed to production are "preferred income", as this term is defined by Section 51 to the Law, which are subject to 16% or 7.5%. tax (depending on the production activity place). This tax ruling applies to the Company beginning in the 2020 tax year through 2024.
|
| 3) |
In February 7, 2021, the Company received an in-agreement tax ruling, indicating that the restructuring that the Company completed during 2022 which holding the entire (100%) share capital of Dually, is tax exempt.
|
| b. |
Taxation of subsidiaries outside of Israel
|
| c. |
Carry forward losses
|
| d. |
Tax assessments
|
NAYAX LTD.
NOTES TO CONSOLIDATED FINANCIAL STATEMENTS
NOTE 16 - INCOME TAXES (continued):
| e. |
Tax rate reconciliation:
|
|
For the year ended December 31,
|
||||||||||||
|
2023
|
2022
|
2021
|
||||||||||
|
US Dollars in thousands
|
||||||||||||
|
Loss before taxes on income
|
(14,672
|
)
|
(37,058
|
)
|
(24,137
|
)
|
||||||
|
Tax rate
|
23
|
%
|
23
|
%
|
23
|
%
|
||||||
|
Theoretical tax benefit
|
3,375
|
8,523
|
5,551
|
|||||||||
|
Share-based payment expenses which are not deductible
|
(1,388
|
)
|
(2,012
|
)
|
(2,035
|
)
|
||||||
|
Carry forward losses without deferred taxes recognition
|
(3,176
|
)
|
(6,872
|
)
|
(3,249
|
)
|
||||||
|
Other
|
(26
|
)
|
(90
|
)
|
(899
|
)
|
||||||
|
Effective tax expenses
|
(1,215
|
)
|
(451
|
)
|
(632
|
)
|
||||||
| f. |
Deferred income tax:
|
|
Intangible assets
|
Provisions for employee rights
|
Other
|
Losses for tax purposes
|
Total
|
||||||||||||||||
|
US Dollars in thousands
|
||||||||||||||||||||
|
Balance at January 1, 2023
|
(1,074
|
)
|
44
|
44
|
193
|
(793
|
)
|
|||||||||||||
|
Change in 2023:
|
-
|
|||||||||||||||||||
|
Recognized in income statement
|
(421
|
)
|
535
|
(44
|
)
|
224
|
294
|
|||||||||||||
|
Deferred taxes created in acquisition of subsidiary
|
(2,626
|
)
|
-
|
-
|
-
|
(2,626
|
)
|
|||||||||||||
|
Recognized in translation currency difference reserve
|
17
|
-
|
-
|
-
|
17
|
|||||||||||||||
|
Balance at December 31, 2023
|
(4,104
|
)
|
579
|
-
|
417
|
(3,108
|
)
|
|||||||||||||
|
Balance at January 1, 2022
|
(1,111
|
)
|
-
|
-
|
23
|
(1,088
|
)
|
|||||||||||||
|
Change in 2022:
|
-
|
|||||||||||||||||||
|
Recognized in income statement
|
(77
|
)
|
44
|
44
|
170
|
181
|
||||||||||||||
|
Recognized in translation currency difference reserve
|
114
|
-
|
-
|
-
|
114
|
|||||||||||||||
|
Balance at December 31, 2022
|
(1,074
|
)
|
44
|
44
|
193
|
(793
|
)
|
|
Balance at January 1, 2021
|
(998
|
)
|
208
|
91
|
414
|
(285
|
)
|
|||||||||||||
|
Change in 2021:
|
||||||||||||||||||||
|
Recognized in income statement
|
665
|
(208
|
)
|
(91
|
)
|
(391
|
)
|
(25
|
)
|
|||||||||||
|
Deferred taxes created in acquisition of subsidiary
|
(747
|
)
|
-
|
-
|
-
|
(747
|
)
|
|||||||||||||
|
Recognized in translation currency difference reserve
|
(31
|
)
|
-
|
-
|
-
|
(31
|
)
|
|||||||||||||
|
Balance at December 31, 2021
|
(1,111
|
)
|
-
|
-
|
23
|
(1,088
|
)
|
NAYAX LTD.
NOTES TO CONSOLIDATED FINANCIAL STATEMENTS
NOTE 16 - INCOME TAXES (continued):
| f. |
Deferred income tax (continued):
|
|
December 31,
|
||||||||
|
2023
|
2022
|
|||||||
|
US Dollars in thousands
|
||||||||
|
Non-current assets
|
-
|
-
|
||||||
|
Non-current liabilities
|
(3,108
|
)
|
(793
|
)
|
||||
|
(3,108
|
)
|
(793
|
)
|
|||||
| g. |
Taxes on income included in profit or loss:
|
|
For the year ended December 31,
|
||||||||||||
|
2023
|
2022
|
2021
|
||||||||||
|
US Dollars in thousands
|
||||||||||||
|
Current tax expenses
|
(1,509
|
)
|
(632
|
)
|
(607
|
)
|
||||||
|
Deferred tax income (expenses)
|
294
|
181
|
(25
|
)
|
||||||||
|
(1,215
|
)
|
(451
|
)
|
(632
|
)
|
|||||||
| a. |
Composition:
|
|
Number of shares
|
In thousands
|
|||||||||||||||
|
Authorized
|
Issued and paid
|
Authorized
|
Issued and paid
|
|||||||||||||
|
December 31, 2023
|
December 31, 2023
|
|||||||||||||||
|
Ordinary shares
|
70,000,000
|
33,326,736
|
70,000
|
33,327
|
||||||||||||
|
Number of shares
|
In thousands
|
|||||||||||||||
|
Authorized
|
Issued and paid
|
Authorized
|
Issued and paid
|
|||||||||||||
|
December 31, 2022
|
December 31, 2022
|
|||||||||||||||
|
Ordinary shares
|
70,000,000
|
32,956,004
|
70,000
|
32,956
|
||||||||||||
|
Number of shares
|
In thousands
|
|||||||||||||||
|
Authorized
|
Issued and paid
|
Authorized
|
Issued and paid
|
|||||||||||||
|
December 31, 2021
|
December 31, 2021
|
|||||||||||||||
|
Ordinary shares
|
70,000,000
|
32,752,242
|
70,000
|
32,752
|
||||||||||||
NAYAX LTD.
NOTES TO CONSOLIDATED FINANCIAL STATEMENTS
NOTE 17 – CAPITAL AND RESERVES (continued):
| a. |
Composition (continued):
|
| b. |
Share-based payment:
|
| 1. |
Replacement of options allotted under the 2013 Plan by options under the 2018 Plan: On October 15, 2020, the Company's Board of Directors resolved to offer holders of options offered under the 2013 Plan in the capital gains track with a trustee under Section 102(b)(2) to the Israel Income Tax
|
NAYAX LTD.
NOTES TO CONSOLIDATED FINANCIAL STATEMENTS
| b. |
Share-based payment (continued):
|
| 2. |
January 2021 award: On January 7, 2021, the Company allotted to two employees of the Company 40,000 options each (a total of 80,000 options) under the 2018 Plan.
|
|
| The vesting period of the options is four years, where 25% of the options vest on the first anniversary of grant date, and after that, additional 6.25% of the options vest on the last day of each subsequent calendar quarter. Options not exercised by the fifth anniversary of grant date will expire. |
| 3. |
March 2021 award: On March 24, 2021, the Company allotted 282,500 options to employees of the Company and subsidiaries under the 2018 Plan. The exercise price of 253,000 options is $6.7 each (hereinafter: "Part C Options") and the exercise price of 29,500 options that were allotted to employees of subsidiaries in the US is $19.5 each (hereinafter: "Part D Options").
|
| 4. |
May 2021 award: On May 13, 2021, the Company allotted Mr. Yair Nechmad and Mr. David Ben Avi 725,000 options each, which are convertible into ordinary Company shares. The options shall vest over a five-year period (through 2025), subject to attaining the following targets:
|
| a. |
To the extent that revenue growth of the Company in any given calendar year over the preceding calendar year (beginning in 2021, relative to 2020) is at least 30%, and subject to a gross profit rate of not less than 40% in that calendar year, 75,000 options will vest and be exercisable into ordinary shares of the Company over a five-year period.
|
| b. |
Additionally to the options vested in accordance with paragraph a. above, for revenue growth of the Company in any given calendar year over the preceding calendar year (beginning in 2021, relative to 2020) of at least 30% and up to 45%, and subject to a gross profit rate of not less than 40% in that calendar year, up to 70,000 additional options will vest and be exercisable into ordinary shares of the Company over a five-year period, with the number of options vesting under this paragraph calculated linearly, based on the revenue growth rate of between 30% and 45% over the previous year.
|
NAYAX LTD.
NOTES TO CONSOLIDATED FINANCIAL STATEMENTS
| b. |
Share-based payment (continued):
|
| 5. |
August 2021 award: On August 22, 2021, the Company's board of directors approved an allotment to employees of the Company and subsidiaries and to service providers of 196,750 options under the 2018 Plan and of 50,000 restricted share units (RSUs). The vesting period of the options and RSUs is the same as March 2021 award.
|
| 6. |
November 2021 award: On November 11, 2021, the Company's board of directors approved an allotment to employees of the Company and subsidiaries of 167,500 options under the 2018 Plan. The vesting period of 127,500 options is the same as March 2021 award and the vesting period of 40,000 options is three years, with 25% of the options vest on the grant date, and after that, additional 6.25% of the options vest on the last day of each subsequent calendar quarter. Options not exercised by the end of the quarter following the end of vesting period will expire.
|
| 7. |
March 28, 2022 award: On March 28, 2022, the Company allotted 215,500 options and 45,000 restricted share units (RSUs) to employees of the Company and subsidiaries.
|
| 8. |
June 30, 2022 award: On June 30, 2022, the Company allotted 170,000 options and 6,000 restricted share units (RSUs) to employees of the Company and subsidiaries.
|
| 9. |
September 29, 2022 award: On September, 2022, the Company allotted 54,500 options and 18,600 restricted share units (RSUs) to employees of the Company and subsidiaries.
|
| 10. |
December 20, 2022 award: On December, 2022, the Company allotted 10,667 restricted share units (RSUs) to employees of the Company and subsidiaries.
|
| 11. |
June 26, 2023 award: the Company allotted 27,500 options and 137,524 restricted share units (RSUs) to employees of the Company and subsidiaries. The vesting period of the options and RSUs is 4 years, with 25% of the options vest on the first anniversary of grant date, and after that, additional 6.25% of the options vest on the last day of each subsequent calendar quarter. Options not exercised within 5 years of inception date will expire.
|
| 12. |
November 30, 2023 award: the Company allotted 96,731 restricted share units (RSUs) to employees of the Company and subsidiaries. The vesting period of the RSUs is 4 years, with 25% of the RSU will vest on the first anniversary of grant date, and after that, additional 6.25% of the RSU's will vest on the last day of each subsequent calendar quarter.
|
NAYAX LTD.
NOTES TO CONSOLIDATED FINANCIAL STATEMENTS
| b. |
Share-based payment (continued):
|
|
Allotment date
|
Share price
|
Exercise price
|
Expected option life
|
Risk-free interest rate
|
Average standard deviation (**)
|
Option fair value
|
|
November, 2023– RSUs
|
$19.57
|
-
|
-
|
-
|
-
|
$19.57
|
|
June 26, 2023 – Options
|
$19.34
|
$18.83
|
5
|
3.96%
|
67.80%
|
$11.03
|
|
June 26, 2023 – RSUs
|
$19.34
|
-
|
-
|
-
|
-
|
$19.34
|
|
The weighted average for 2023
|
$19.92
|
-
|
-
|
-
|
-
|
$19.92
|
|
The weighted average for 2022
|
$11.1
|
-
|
-
|
-
|
-
|
$11.1
|
|
The weighted average for 2021
|
$17.3
|
-
|
-
|
-
|
-
|
$17.3
|
|
December 20, 2022 - RSUs
|
$19.7
|
-
|
-
|
-
|
-
|
$19.7
|
|
September 29, 2022 – Options
|
$23.9
|
25.5
|
5
|
3.98%
|
54.45%
|
$11.8-$23.9
|
|
September 29, 2022 - RSUs
|
$23.9
|
-
|
-
|
-
|
-
|
$23.9
|
|
June 30, 2022 – Options
|
$18.5
|
$16.7
|
5
|
3.01%
|
54%
|
$9.7-$10.8
|
|
June 30, 2022 – RSUs
|
$18.5
|
-
|
-
|
-
|
-
|
$18.5
|
|
March 28, 2022 – Options
|
$18.4
|
$20.4
|
5
|
2.50%
|
56%
|
$8.7
|
|
March 28, 2022 – RSUs
|
$18.4
|
-
|
-
|
-
|
-
|
$18.4
|
|
November 11, 2021
|
$39
|
$6.7/$38.8
|
5.25
|
1.21%
|
55%
|
$19/$33.2
|
|
August 22, 2021 – Options
|
$31.7
|
$30.6
|
5.25
|
0.83%
|
55%
|
$15.5
|
|
August 22, 2021 – RSUs
|
$31.7
|
-
|
-
|
-
|
-
|
$31.7
|
|
May 13, 2021
|
$31.9
|
$31.9
|
5.88-9.88
|
1.05%-1.65%
|
53.1%-54.67%
|
$16.2-$20.1
|
|
March 24, 2021 – Part C Options
|
$19.5
|
$6.7
|
5.25
|
0.88%
|
50%
|
$14.1
|
|
March 24, 2021 – Part D Options
|
$19.5
|
$19.5
|
5.25
|
0.88%
|
50%
|
$8.7
|
|
January 7, 2021 – Part A Options
|
$9.7
|
$6.7
|
5
|
0.46%
|
51%
|
$5.3
|
|
January 7, 2021 – Part B Options
|
$9.7
|
NIS 0.001
|
5
|
0.46%
|
51%
|
$9.7
|
NAYAX LTD.
NOTES TO CONSOLIDATED FINANCIAL STATEMENTS
| b. |
Share-based payment (continued):
|
|
December 31, 2023
|
December 31, 2022
|
December 31, 2021
|
||||||||||||||||||||||
|
Number of options
|
Weighted average exercise price
|
Number of options
|
Weighted average exercise price
|
Number of options
|
Weighted average exercise price
|
|||||||||||||||||||
|
Number of options and RSU outstanding at beginning of year
|
3,823,052
|
19.3
|
3,633,778
|
19.1
|
1,830,695
|
6.0
|
||||||||||||||||||
|
Options and RSU granted (1)
|
264,256
|
18.8
|
520,767
|
16.5
|
2,226,750
|
27.5
|
||||||||||||||||||
|
Options exercised
|
(370,732
|
)
|
6.57
|
(203,748
|
)
|
5.0
|
(231,962
|
)
|
5.3
|
|||||||||||||||
|
Options forfeited
|
(366,633
|
)
|
26.1
|
(126,211
|
)
|
17.0
|
(140,719
|
)
|
8.5
|
|||||||||||||||
|
Options expired
|
(10,823
|
)
|
14.76
|
(1,534
|
)
|
6.7
|
(50,986
|
)
|
5.3
|
|||||||||||||||
|
Options and RSU outstanding at end of year
|
3,339,120
|
17.84
|
3,823,052
|
19.3
|
3,633,778
|
19.1
|
||||||||||||||||||
|
Options and RSU exercisable at end of year
|
1,550,358
|
11.67
|
1,502,887
|
12.3
|
928,970
|
5.6
|
||||||||||||||||||
NAYAX LTD.
NOTES TO CONSOLIDATED FINANCIAL STATEMENTS
NOTE 18 - REVENUES
|
For the year ended December 31,
|
||||||||||||
|
2023
|
2022
|
2021
|
||||||||||
|
US Dollars in thousands
|
||||||||||||
|
Revenue from the sale of integrated POS devices
|
84,406
|
68,726
|
47,987
|
|||||||||
|
Recurring revenue:
|
||||||||||||
|
SaaS revenue
|
58,920
|
45,274
|
34,641
|
|||||||||
|
Payment processing fee
|
92,165
|
59,514
|
36,506
|
|||||||||
|
151,085
|
104,788
|
71,147
|
||||||||||
|
235,491
|
173,514
|
119,134
|
||||||||||
NOTE 19 - COST OF REVENUES
|
For the year ended December 31,
|
||||||||||||
|
2023
|
2022
|
2021
|
||||||||||
|
US Dollars in thousands
|
||||||||||||
|
Cost of integrated POS devices sales
|
68,433
|
62,872
|
40,165
|
|||||||||
|
Cost of recurring revenue
|
78,765
|
50,604
|
30,805
|
|||||||||
|
147,198
|
113,476
|
70,970
|
||||||||||
NOTE 20 - RESEARCH AND DEVELOPMENT EXPENSES
|
For the year ended December 31,
|
||||||||||||
|
2023
|
2022
|
2021
|
||||||||||
|
US Dollars in thousands
|
||||||||||||
|
Payroll and related expenses
|
15,309
|
14,820
|
12,970
|
|||||||||
|
Suppliers and subcontractors
|
3,416
|
4,193
|
2,557
|
|||||||||
|
Office and maintenance
|
684
|
602
|
539
|
|||||||||
|
Share-based payment
|
1,148
|
1,279
|
1,846
|
|||||||||
|
Depreciation and amortization
|
1,371
|
1,238
|
1,128
|
|||||||||
|
21,928
|
22,132
|
19,040
|
||||||||||
NAYAX LTD.
NOTES TO CONSOLIDATED FINANCIAL STATEMENTS
NOTE 21 - SELLING, GENERAL AND ADMINISTRATIVE EXPENSES
|
For the year ended December 31,
|
||||||||||||
|
2023
|
2022
|
2021
|
||||||||||
|
US Dollars in thousands
|
||||||||||||
|
Payroll and related expenses
|
36,520
|
32,402
|
24,141
|
|||||||||
|
Share-based payment
|
4,627
|
7,097
|
7,004
|
|||||||||
|
Office and maintenance
|
2,749
|
2,365
|
1,814
|
|||||||||
|
Advertising and sales promotion
|
2,192
|
2,599
|
1,612
|
|||||||||
|
Depreciation and amortization
|
4,444
|
3,366
|
2,199
|
|||||||||
|
Computers and IT systems maintenance
|
5,196
|
4,452
|
2,396
|
|||||||||
|
Professional fees
|
8,443
|
5,903
|
2,718
|
|||||||||
|
Provision for credit losses and bad debts
|
-
|
630
|
1,019
|
|||||||||
|
Other expenses
|
6,149
|
5,278
|
2,476
|
|||||||||
|
70,320
|
64,092
|
45,379
|
||||||||||
|
For the year ended December 31,
|
||||||||||||
|
2023
|
2022
|
2021
|
||||||||||
|
US Dollars in thousands
|
||||||||||||
|
Interest on bank loans and bank fees
|
1,704
|
993
|
964
|
|||||||||
|
Change in fair value options
|
310
|
(423
|
)
|
414
|
||||||||
|
Finance expenses in respect of loans from others
|
591
|
70
|
217
|
|||||||||
|
Finance expenses in respect of shareholders and related companies
|
(24
|
)
|
(15
|
)
|
136
|
|||||||
|
Finance expenses in respect of other liabilities
|
161
|
167
|
202
|
|||||||||
|
Finance expenses in respect of leases liabilities
|
330
|
260
|
214
|
|||||||||
|
Financing income in respect of finance sub-lease
|
(17
|
)
|
-
|
(2
|
)
|
|||||||
|
Exchange rate differences
|
(767
|
)
|
1,968
|
(490
|
)
|
|||||||
|
2,288
|
3,020
|
1,655
|
||||||||||
NAYAX LTD.
NOTES TO CONSOLIDATED FINANCIAL STATEMENTS
NOTE 23 - LOSS PER SHARE
| a. |
Basic
|
|
For the year ended December 31,
|
||||||||||||
|
2023
|
2022
|
2021
|
||||||||||
|
Loss for the year attributed to holders of
|
||||||||||||
|
ordinary shares (US Dollars in thousands)
|
(15,887
|
)
|
(37,509
|
)
|
(24,763
|
)
|
||||||
|
Weighted average of number of ordinary shares
|
||||||||||||
|
in issue (in thousands)
|
33,149
|
32,817
|
30,191
|
|||||||||
|
Basic loss per ordinary share (in dollars)
|
(0.479
|
)
|
(1.143
|
)
|
(0.820
|
)
|
||||||
| b. |
Diluted
|
|
Thousands of shares
|
||||||||||||
|
As of December 31,
|
||||||||||||
|
2023
|
2022
|
2021
|
||||||||||
|
Options and RSU issued as part of share-based payment
|
3,339
|
3,823
|
3,634
|
|||||||||
| a. |
Transactions with related parties:
|
|
For the year ended December 31,
|
||||||||||||
|
2023
|
2022
|
2021
|
||||||||||
|
US Dollars in thousands
|
||||||||||||
|
Payroll, options and payments to related parties employed by the Company
|
2,671
|
5,378
|
6,512
|
|||||||||
|
Payroll to directors
|
176
|
207
|
25
|
|||||||||
|
Transactions - associated companies
|
2,202
|
766
|
900
|
|||||||||
|
Shareholders – interest expenses, net
|
-
|
-
|
141
|
|||||||||
NAYAX LTD.
NOTES TO CONSOLIDATED FINANCIAL STATEMENTS
| b. |
Balances with related parties:
|
|
December 31,
|
||||||||
|
2023
|
2022
|
|||||||
|
US Dollars in thousands
|
||||||||
|
Receivables – associated companies
|
3,555
|
983
|
||||||
|
Trade payables – related companies and parties
|
97
|
95
|
||||||
|
Other payables – related companies and parties
|
41
|
42
|
||||||
NAYAX LTD.
NOTES TO CONSOLIDATED FINANCIAL STATEMENTS
| c. |
Related parties' employment terms:
|
| 1) |
Employment terms of controlling shareholder and director – Mr. Yair Nechmad – for his service as the Company’s CEO:
|
| 2) |
The employment terms of controlling shareholder and director, Mr. David Ben Avi, for his service as the Company’s CTO:
|
NAYAX LTD.
NOTES TO CONSOLIDATED FINANCIAL STATEMENTS
| c. |
Related parties' employment terms: (continued):
|
| 3) |
Payments to Mr. Amir Nechmad – controlling shareholder and director
|
NAYAX LTD.
NOTES TO CONSOLIDATED FINANCIAL STATEMENTS
| c. |
Related parties' employment terms (continued):
|
| 4) |
Directors insurance:
|
| 5) |
On March 9, 2021, the Company's controlling shareholders – Mr. Amir Nechmad, Mr. Yair Nechmad, Yair Nechmad Ltd (for the purpose of the shareholders agreement, Yair Nechmad and Yair Nechmad Ltd are considered as a single shareholder) and Mr. David Ben Avi ("the Controlling Shareholders") – entered into a shareholders' agreement ("the Shareholders' Agreement"). The agreement formalizes the issue of their voting on different matters, including the appointment of directors, and sets certain limitations on the transfer of Company shares, including a first right to offer in relation to the sale of shares on and off a stock exchange, a tag along right and liens on shares. The effective date of the Shareholders' Agreement is September 30, 2020.
|
| a. |
Liens
|
NAYAX LTD.
NOTES TO CONSOLIDATED FINANCIAL STATEMENTS
NOTE 25 - LIENS, GUARANTEES AND COMMITMENTS (continued):
| b. |
Contingent liability
|
| c. |
Commitments
|
| 1. |
As part of an agreement with a European acquire payment processor for the provision of loans, the Group has undertaken in December 4, 2022 to reach, in aggregate, a minimum processing turnover of Euro 250 million ($264 million) transactions per month and to reach minimum turnover of 3.5 million transactions per annum which includes at least 55% through Visa credit. The agreement stipulates that in the event that the Group fails to meet the assignable thresholds, the event shall constitute a breach event (as defined in the agreement), which will establish a contractual right for the acquirer the right to demand of an immediate repayment of the outstanding balance of the loans.
|
| 2. |
In November 2016 and February 2018, the Company and the European acquire payment processor entered into a processing agreement where under the Group undertakes to reach a minimum processing turnover in Europe. Furthermore, under the agreement a minimum fee will be paid out of the processing funds that are cleared using the processing agency’s services. In 2020, the Company signed an agreement to extend the terms of minimum processing turnover until December 31, 2025. As of December 31, 2023 and the date of these financial statements, no changes regarding to processing agreement took place.
|
F - 66
|
Date: February 28, 2024
|
By: /s/ Yair Nechmad
Yair Nechmad
Chief Executive Officer
(Principal Executive Officer)
|
|
Date: February 28, 2024
|
By: /s/ Sagit Manor
Sagit Manor Chief Financial Officer (Principal Financial Officer) |
|
Date: February 28, 2024
|
By: /s/ Yair Nechmad
Yair Nechmad
Chief Executive Officer
(Principal Executive Officer)
|
|
Date: February 28, 2024
|
By: /s/ Sagit Manor
Sagit Manor Chief Financial Officer (Principal Financial Officer) |

|
Tel-Aviv, Israel
|
/s/Kesselman & Kesselman
|
|
February 28, 2024
|
Certified Public Accountants (Isr.)
|
|
|
A member firm of PricewaterhouseCoopers International Limited
|
| 1. |
Persons Subject to Policy
|
| 2. |
Compensation Subject to Policy
|
| 3. |
Recovery of Compensation
|
| 4. |
Manner of Recovery; Limitation on Duplicative Recovery
|
| 5. |
Administration
|
| 6. |
Interpretation
|
| 7. |
No Indemnification; No Liability
|
| 8. |
Application; Enforceability
|
| 9. |
Severability
|
| 10. |
Amendment and Termination
|
| 11. |
Definitions
|
|
___________________
Date
|
________________________________________
Signature
|
|
________________________________________
Name
|
|
|
________________________________________
Title
|