|
|
|
|
|
KENON HOLDINGS LTD.
|
||
|
|
|
|
|
|
Date: November 16, 2023
|
By:
|
/s/ Robert L. Rosen
|
|
|
|
Name:
|
Robert L. Rosen
|
|
|
|
Title:
|
Chief Executive Officer
|
|
| 1. |
Executive Summary1
|
|
For the
|
For the
|
|||||||||||||||||||||||
|
Nine Months Ended
|
Three Months Ended
|
|||||||||||||||||||||||
|
September 30
|
September 30
|
|||||||||||||||||||||||
|
2023
|
2022
|
%
|
2023
|
2022
|
%
|
|||||||||||||||||||
|
Adjusted EBITDA* after proportionate
|
||||||||||||||||||||||||
|
consolidation – consolidated
|
813
|
599
|
36
|
%
|
379
|
274
|
38
|
%
|
||||||||||||||||
|
Adjusted EBITDA* – Israel
|
445
|
265
|
68
|
%
|
235
|
119
|
97
|
%
|
||||||||||||||||
|
Adjusted EBITDA* after proportionate
|
||||||||||||||||||||||||
|
consolidation – U.S.
|
388
|
351
|
11
|
%
|
151
|
161
|
(6
|
)%
|
||||||||||||||||
|
Adjusted EBITDA* renewable energies – U.S.
|
17
|
22
|
(23
|
)%
|
(2
|
)
|
2
|
-4M
|
|
|||||||||||||||
|
Adjusted EBITDA* after proportionate
|
||||||||||||||||||||||||
|
consolidation energy transition – U.S.
|
437
|
389
|
12
|
%
|
169
|
181
|
(7
|
)%
|
||||||||||||||||
|
Net income
|
140
|
180
|
(22
|
)%
|
101
|
108
|
(6
|
)%
|
||||||||||||||||
|
Adjusted income*
|
166
|
120
|
38
|
%
|
100
|
90
|
11
|
%
|
||||||||||||||||
|
|
* |
Adjusted EBITDA, EBITDA after adjusted proportionate consolidation and adjusted net income – for definitions and the manner of the calculation – see Section 4B below.
|
|
The Swords of
Iron War2
|
Continuity of activities of the power plants – from the beginning of the War and up to the approval date of the report the power plants are continuing to operate
and there has been no significant change in the scope of generation of the electricity compared with the situation existing prior to the outbreak of the War.
Continuity of supply of natural gas to the power plants – from the beginning of the War and up to the approval date of the report the power plants are acquiring
natural gas in a scope that is sufficient for full generation activities and at a price that is not significantly different than the price in the ordinary course of business.
Sales of electricity to the Company’s customers – from the beginning of the War and up to the approval date of the report no significant impact is discernable on
the level of demand on the part of the Company’s customers.
War costs of Israel Electric Company – based on a hearing published by the Electricity Authority, the Authority designated surplus revenues from sale of the Eshkol
power plant for coverage of costs of the war.
Liquidity – proximate to the approval date of the report, the Group has cash balances in the Group’s headquarters and in Israel in the amount of about NIS 694
million, and unutilized secured credit frameworks in the amount of about NIS 540 million.
|
| 1 |
The Executive Summary below is presented solely for convenience and it is not a substitute for reading the full detail (including with reference to the matters referred to in the Summary) as stated in this report
with all its parts (including warnings relating to “forward‑looking” information as it is defined in the Securities Law, definitions or explanations with respect to the indices for measurement of the results and including the information
included by means of reference, as applicable). This Summary includes estimates, plans and assessment of the Company, which constitute “forward‑looking” information regarding which there is no certainty it will materialize and the readers are
directed to the detail presented in this report below.
|
|
2
|
For details and more information – see Section 3.1C below. That stated is based solely on the Company’s estimates as at the approval
date of the report. Continuation of the War or escalation of the security situation in Israel could have an impact on the Group, as noted in this report below and, accordingly there is no certainty regarding the impacts of the War.
|
|
Israel
|
Doubling of the EBITDA in Israel in the third quarter compared with last year
(1) Operating power plants (Rotem and Hadera) – additional EBITDA of about NIS 82 million, which constitutes an
increase of about 66% compared with the corresponding quarter last year, of which about NIS 63 million due to a change in the hourly demand brackets.
(2) Power plants that started commercial operation (Zomet and Gat) – additional EBITDA of about NIS 37 million.
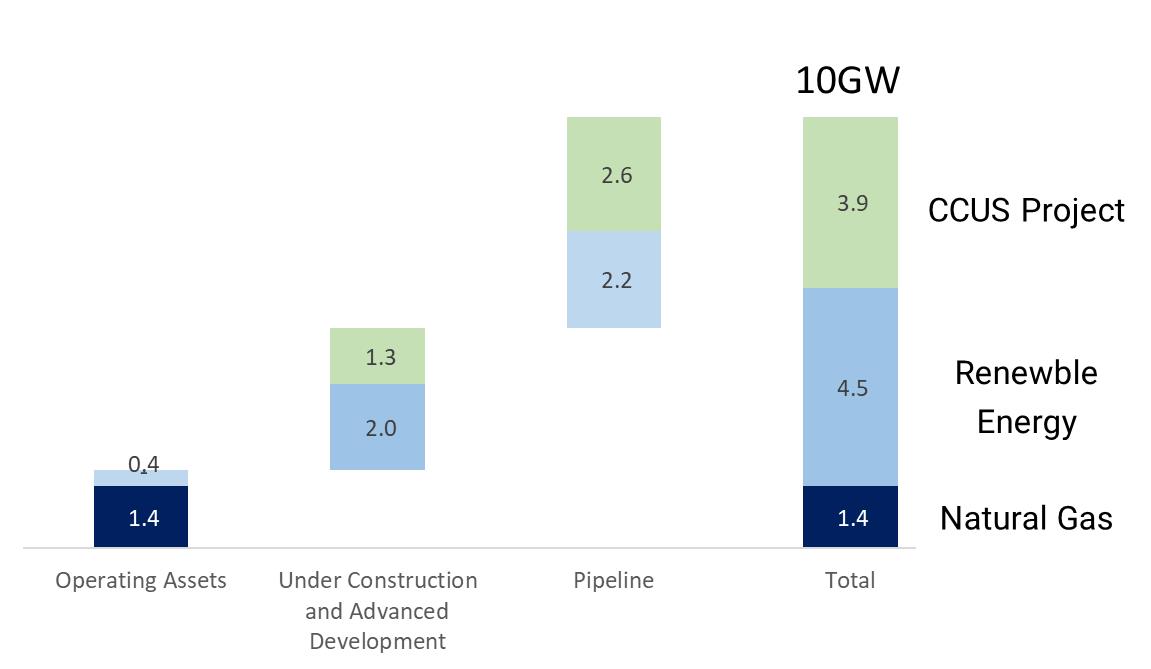
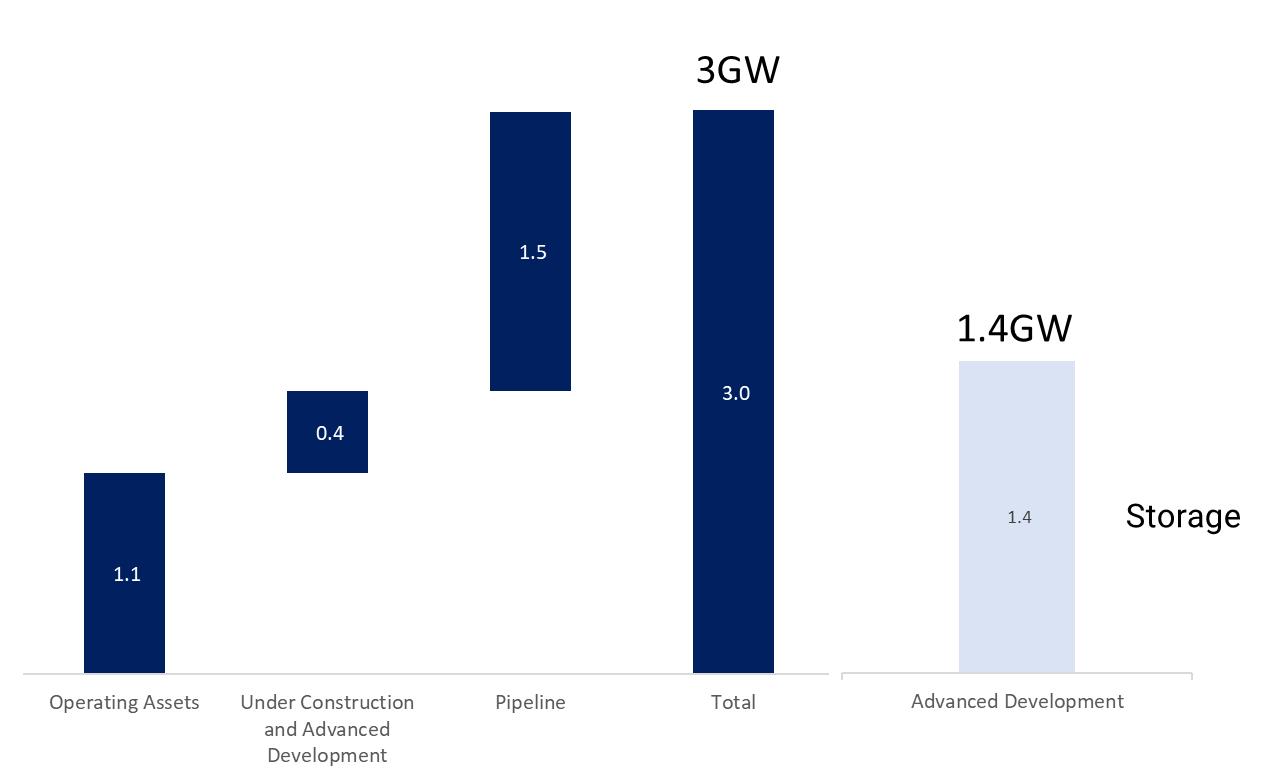
Israel Land Authority tenders – win in a land tender of Israel Lands Authority for a consideration of about NIS 484 million,
for rights in land involving construction of facilities for solar generation of electricity, with a capacity of about 245 megawatts, together with storage, with a capacity of about 1,375 megawatts/hour. In the period of the report, 20% of the
consideration was paid and an authorization agreement was signed with Israel Lands Authority. The project is expected to continue development on the National Infrastructures Committee.
|
|
|
U.S.
|
EBITDA in the U.S. of NIS 151 million in the quarter – despite the sharp drop in in the natural gas prices, the
electricity margins declined at a more moderate rate.
Commercial operation of the Three Rivers project with a scope of 1,258 megawatts – the power plant commenced its
operations in July 2023 and joined the fleet of CPV’s modern power plants (CPV holds a 10% interest in the power plant).
A financing agreement was signed for construction of projects in the renewable energy area – in the aggregate scope of
about $370 million.
The commitment framework for investment of the partners in the CPV Group was increased – by the amount of $100 million.
Completion of construction of the Maple Hill solar project in the scope of 126 megawatts – construction of the project was completed proximate to the approval
date of the report. The full amount of the consideration for the investment of the tax partner has not yet been received.
|
|
|
Group headquarters
|
Reconfirmation of a credit rating for the Company and its debentures of ‘ilA–’ and an update of the rating outlook to negative
by S&P Maalot.
|
|
|
Renewal of binding credit frameworks – in the amount of NIS 550 million and LC frameworks for the CPV Group in the
amount of NIS 365 million, which are valid up to the second half of 2024.
|
| 2. |
Brief description of the areas of activity
|
| 3. |
Main Developments in the Business Environment
|
|
|
3.1 |
General
|
|
|
A. |
Macro‑economic environment (particularly changes in inflation and interest) – for details regarding significant changes in the macro‑economic environment in Israel and in the U.S., mainly during 2023 and subsequent to the period of
the report due to the outbreak of the Swords of Iron War in Israel, as well as due to the impact of the business environment on the activities of the Group companies, among other things, the prices of energy, electricity and natural gas,
tariffs in the Israeli electricity sector, the costs of executing construction projects, financing expenses, currency exchange rates and the like – see Sections 3.1C and 12 below.
|
|
Bank of
|
||||||||||||||||||||
|
Israel
|
Federal
|
NIS/$
|
||||||||||||||||||
|
Israeli
|
U.S.
|
interest
|
interest
|
exchange
|
||||||||||||||||
|
CPI
|
CPI
|
rate
|
rate
|
rate
|
||||||||||||||||
|
Proximate to the approval
|
||||||||||||||||||||
|
date of the report*
|
111.1
|
307.8
|
4.75
|
%
|
5.25%–5.50
|
%
|
3.833
|
|||||||||||||
|
At September 30, 2023
|
111.2
|
307.0
|
4.75
|
%
|
5.25%–5.50
|
%
|
3.824
|
|||||||||||||
|
At December 31, 2022
|
107.7
|
297.7
|
3.25
|
%
|
4.25%–4.50
|
%
|
3.519
|
|||||||||||||
|
At September 30, 2022
|
106.8
|
296.2
|
2.0
|
%
|
3.00%–3.25
|
%
|
3.543
|
|||||||||||||
|
Change:
|
||||||||||||||||||||
|
January–September 2023
|
3.3
|
%
|
3.1
|
%
|
1.5
|
%
|
1.00
|
%
|
8.7
|
%
|
||||||||||
|
January–September 2022
|
4.4
|
%
|
6.6
|
%
|
1.9
|
%
|
3.00
|
%
|
13.9
|
%
|
||||||||||
|
June–September 2023
|
0.8
|
%
|
1.0
|
%
|
-
|
0.25
|
%
|
3.4
|
%
|
|||||||||||
|
June–September 2022
|
1.2
|
%
|
1.3
|
%
|
1.25
|
%
|
1.50
|
%
|
1.2
|
%
|
||||||||||
|
2022
|
5.3
|
%
|
7.1
|
%
|
3.15
|
%
|
4.25
|
%
|
13.2
|
%
|
||||||||||
|
* November 14, 2023.
|
||||||||||||||||||||
|
|
B. |
The Coronavirus and broad global impacts on raw‑material prices and the supply chain – for details regarding the impacts of the global trends that started against the background of the Coronavirus crisis and the Company’s estimate
regarding the continuation and scope thereof on the Group’s activities, if any – see Section 3.1B to the Report of the Board of Directors for 2022.
|
| 3. |
Main Developments in the Business Environment (Cont.)
|
|
|
3.1 |
General (Cont.)
|
|
|
C. |
The Iron Swords War in Israel – subsequent to the period of the report, on October 7, 2023, the Iron Swords War (hereinafter – “the War”) broke out in Israel – this coming as a result of a deadly attack by the Hamas terrorist
organization on communities skirting in the Gaza Strip in the southern part of Israel. Ultimately, the War led to consequences and restrictions with respect to the Israeli economy, including, among others, a curtailment of business activities,
a significant call‑up of military reserves, limitations on gatherings in work places and public areas, restrictions on carrying on the operation of schools in the educational system, and others. In addition, the impacts of the War include
considerable uncertainty regarding its ramifications with respect to macro‑economic factors in Israel as well as on the State of Israel’s financial position, including possible unfavorable changes of the credit rating of Israel and Israeli
financial institutions (particularly the Israeli banking system), sharp fluctuations in the currency exchange rates, particularly a strengthening of the dollar exchange rate, and instability in the Israeli capital market (including wider
trading fluctuations, falling security prices, liquidity issues and limited accessibility).
|
|
|
1. |
Uninterrupted activity of the power plants – the Group’s power plants in Israel are continuing their electricity generation activities pursuant to the provisions of the electricity generation licenses granted to them and based on the
directives of the relevant authorities and the Ministry of Energy and Infrastructures (“the Ministry of Energy”). The Group makes the required adjustments on an ongoing basis, particularly with respect to the operation and security teams, in
order to permit uninterrupted activities at all times. The Group’s sites (similar to most private business activities in Israel) could be exposed to physical damage as a result of the War, where in this regard it is noted that in addition to
the rights provided by the Property Tax and Compensation Fund Law, 1961, the Group companies in Israel (Rotem, Hadera, Gat and Zomet) have acquired insurance policies that provide certain coverage in accordance with the amounts and conditions
stipulated in the policies, in connection with direct physical harm and consequential damages (lost profits directly or in respect of War damages to other significant parties, such as suppliers, subject to certain conditions) deriving from
terrorist and war activities. The scope of the coverage and the self‑participation (deductible) provided in the policies is that which is customary in the power‑plant market in Israel3. The validity of the policies for Rotem and
Hadera is up to the end of July 2024, for Zomet up to the end of May 2024 and for Gat up to the end of April 2024.
|
| 3 |
As is usual in policies of this type in Israel, the insurance coverage is subject to exceptions, self‑participation (deductible) and conditions. Accordingly, there is no certainty that the insurance coverage will compensate the Company for
the harm it suffers (in whole or in part) in a case of an attack on its facilities (if any). Furthermore, there is no certainty regarding the renewal terms of the policies upon their expiration. For details regarding risk factors relating to
insurance – see Section 19.2.10 of Part A of the Periodic Report for 2022.
|
| 3. |
Main Developments in the Business Environment (Cont.)
|
|
|
3.1 |
General (Cont.)
|
|
|
C. |
The Iron Swords War in Israel (Cont.)
|
|
|
1. |
Uninterrupted activity of the power plants (Cont.)
|
|
|
2. |
Uninterrupted supply of natural gas to the power plants – the Group’s power plants in Israel acquire natural gas in a quantity that is sufficient for all their operational requirements. The Group companies in Israel have signed
long‑term agreements for acquisition of natural gas – both with Tamar and with Energean (for additional details – see Note 28C to the annual financial statements). From the beginning of the War and up to November 12, 2023, supply of the natural
gas from the Tamar reservoir was suspended, whereas as at the date of the report there has been no change in the activities of the Karish reservoir that belongs to Energean as a result of the War4. In addition, as at the approval
date of the report the Leviathan reservoir is continuing its supply of gas to the Israeli economy. It is noted that continuation of the activities of the Karish reservoir and the Leviathan reservoir is impacted to a significant extent by the
scope of the War and a worsening of the defense (security) situation in Israel, particularly in the north. During the suspension period of the Tamar reservoir, the Group has acquired natural gas mainly from Energean as well as under short‑term
agreements and by means of casual transactions in the secondary market, where in this period there has been no significant change in the Group’s natural gas costs compared with the situation existing prior to the start of the War. It is noted
that a shortage or interruption in the supply of natural gas from the Karish reservoir (without utilization of compensatory agreements under Standard 125 as detailed below) could have a significant negative impact on the Company’s natural gas
costs.
|
| 4 |
A shortage or interruption of the supply of natural gas could have an adverse impact, even a significant one, on the Group’s activities and its results. Regarding the risk factor involving interruptions of the supply of natural gas – see
Section 19.2.2 of Part A of the Periodic Report for 2022.
|
| 3. |
Main Developments in the Business Environment (Cont.)
|
|
|
3.1 |
General (Cont.)
|
|
|
C. |
The Iron Swords War in Israel (Cont.)
|
|
|
2. |
Uninterrupted supply of natural gas to the power plants (Cont.)
|
| 5 |
The Gat power plant is a “single‑fuel” generator powered by natural gas, which is entitled to an availability tariff, as stated in Section 7.3.14 of Part A of the Periodic Report for 2022. Pursuant to Standard 125 referred to below, a
generator will be considered available even in certain circumstances of a shortage of natural gas as provided in the Standard, However, there is no certainty that the mentioned arrangements will apply to the circumstances as they will be (as
many as they may be).
|
| 6 |
Published in the Record of Regulations in the Internet site of the Electricity Authority.
|
| 7 |
As stated in Section 7.3.14.3 of Part A of the Periodic Report for 2021. The Professional Staff of the Electricity Authority has notified Rotem that its position regarding application of the Standard to Rotem is different. As stated above,
the Company has presented its position regarding this matter to the Electricity Authority. That stated regarding the Company’s estimate constitutes “forward‑looking” information as defined in the Securities
Law, regarding which there is no certainty it will materialize, and where ultimately Rotem’s entitlement to compensatory arrangements in a case of a shortage of natural gas, including compensation for the difference between the operating cost
using natural gas and the operating cost using diesel oil, could be limited as a result of that stated. As stated in Section 7.15.5.1B of Part A the Periodic Report for 2022, pursuant to the provisions of Rotem’s PPA with Israel
Electric Authority, in a case of a continuing shortage in the supply of natural gas, subject to the provisions of the PPA, Rotem is entitled to provide the plant’s availability to the System Operator against receipt of a reimbursement in
respect of the cost of using diesel oil (in respect of which Rotem pays an annual premium) and receipt of a payment for providing the availability. As stated in the Periodic Report, provision of availability to the System Operator is much less
economically worthwhile than selling to customers.
|
| 8 |
That stated above with reference to the arrangements applying in a case of a shortage of natural gas is based on the Company’s estimates as at the date of the report. Nonetheless, there is no certainty that these
arrangements will fully or partly compensate the Group for the gas shortage or the interruption in supply of the natural gas, and there is no certainty regarding the actual manner of their implementation by the System Operator and the
authorities, particularly in light of the emergency situation. In addition, these arrangements might change and/or be cancelled as a result of a worsening of the emergency situation, length of the War, circumstances relating to the shortage of
natural gas and pressures in the economy and the combat requirements.
|
| 3. |
Main Developments in the Business Environment (Cont.)
|
|
|
3.1 |
General (Cont.)
|
|
|
C. |
The Iron Swords War in Israel (Cont.)
|
|
|
3. |
Demand for electricity and by the Group’s customers in particular – as at the approval date of the report, in general no material impact of the War on the level of demand for electricity on the part of the Group’s customers in Israel
is discernable. It is noted that the Group’s customers (including significant customers as stated in Section 7.6.2 of Part A of the Periodic Report for 2022) have facilities in Israel that could be exposed to physical (actual) damage or to
economic and other consequences of the War, and their continued regular operation (and, in turn, the Company’s revenues therefrom) could also be negatively impacted by the War.
|
|
|
4. |
Proposed decision of the Electricity Authority regarding coverage of expenses of the War of Israel Electric Company Ltd. – on October 26, 2023, the Electricity Authority published a hearing whereby the Authority will designate
revenues from sale of the Eshkol power plant (in excess of the carrying value in the books plus the costs of the land and the selling costs) for purposes of covering expenses incurred and fully realized during the War, including costs of diesel
oil in accordance with the principles provided in the hearing regarding the manner of spreading‑out the expenses and recognizing them as a derivative of the scope of the surplus revenues. As at the approval date of the report, a final decision
regarding the matter had not yet been made.
|
|
|
5. |
Strengthening of the dollar against the shekel – as detailed in Section 12 below, an increase in the exchange rate of the dollar increases the cost of the natural gas purchased by the Group companies in Israel (the gas tariff is
linked partly to the exchange rate of the dollar and/or is denominated at the dollar exchange rate and is linked to the generation tariff, and also includes dollar floor (minimum) prices. For additional details – see Section Note 28C to the
annual financial statements). Nonetheless, the structure of the activities includes a partial natural (built‑in) protection that reduces the said exposure, as a result of linkage of a significant part of the revenues of the Group companies in
Israel to the generation tariff (which is impacted, in part, by a change in the exchange rate of the dollar). Despite that stated, the generation component is generally updated once a year, and accordingly there is a timing difference between
the impact of an increase in the exchange rate of the dollar on the current cost of the gas and the impact thereof on the Company’s revenues, which has an immediate negative impact on the profits and current cash flows. In the medium term, an
increase in the exchange rate of the dollar is expected to trigger an increase in the generation tariff and, in turn, an increase in the Company’s revenues and, thus, to reduce the impact of the increase on the costs of the gas, as stated9.
|
| 9 |
It is noted that that stated above with reference to determination of the generation component, its composition and the manner of its impact on the Group constitutes “forward‑looking” information, regarding which
there is no certainty of its realization and that is impacted by factors not under the Company’s control.
|
| 3. |
Main Developments in the Business Environment (Cont.)
|
|
|
3.1 |
General (Cont.)
|
|
|
C. |
The Iron Swords War in Israel (Cont.)
|
|
|
6. |
Financial strength and liquidity – proximate to the approval date of the report, the Group’s headquarters and companies in Israel have cash balances (without restricted cash), in the amount of about NIS 140 million, and unutilized
secured credit frameworks, in the amount of about NIS 694 million, along with unutilized binding credit frameworks, in the amount of about NIS 540 million. In addition, as detailed in Note 7A(8) to the Interim statements, some of the
guarantees granted in connection with the activities in Israel were granted in non‑binding credit frameworks, and some of the guarantees granted that relate to the activities of the CPV Group in the U.S. were granted by banks in Israel (and
are contingent on a minimum rating for the bank). In addition, the CPV group has cash balances in the amount of about NIS 130 million (about USD 35 million) as well as an unused balance in a financing agreement for the construction of
renewable energy projects in the amount of about NIS 750 million (about USD 200 million). As detailed in note 7A(4) to the Interim Statements, the financing facility will be used to continue the construction of the solar projects detailed in
chapter 6 below.
|
| 3. |
Main Developments in the Business Environment (Cont.)
|
|
|
3.2 |
Activities in Israel
|
|
|
D. |
Update of the electricity tariffs in the period of the report, including the brackets of the demand hours –
|
|
Period
|
2023
|
2022
|
Change
|
|||
|
January–September average
|
30.57
|
28.56
|
+7%
|
|||
|
July–September average
|
30.39
|
30.15
|
+1%
|
| 10 |
For additional details – see Sections 7.2.4 and 7.10.2 of Part A of the Periodic Report for 2022. That stated in this Section with reference to the impacts of the update to the hourly demand brackets
constitutes “forward‑looking” information as it is defined in the Securities Law which is based on the Company’s estimates and assumptions as at the date of the report and regarding which there is no certainty it will materialize.
Ultimately, the impact could be different than that stated, this being due to, among other things, the Company’s estimates with respect to the consumption profile not materializing, the manner of its distribution and/or the actual mix of
the customers and/or occurrence of one or more of the risk factors the Company is subject to.
|
| 3. |
Main Developments in the Business Environment (Cont.)
|
|
|
3.2 |
Activities in Israel (Cont.)
|
|
|
E. |
Supplementary arrangements and granting of a supply license to Rotem – in February 2023, the Electricity Authority published a proposed decision that includes application of benchmarks and granting of a supplier license to Rotem – for
additional details – see Section 3.2E of the Report of the Board of Directors for 2022 (“the Proposed Decision”). As at the approval date of the report, a final decision had not yet been published and the arrangements included as part of the
Proposed Decision had not yet entered into effect, where to the best of the Company’s knowledge, the Electricity Authority is expected to publish a decision regarding the matter. As at the approval date of the report, there is no certainty
regarding the final language of the arrangements that will be determined (if ultimately determined) and the scope of their impact. Based on the publication, the Proposed Decision creates uniformity regarding many aspects of the regulation
applicable to Rotem with that of the generation facilities that are authorized to execute bilateral transactions, and thus the arrangements should permit Rotem to operate in the energy market in a manner similar to that of the other generation
facilities that are authorized to execute bilateral transactions. In addition, in the Company’s estimation arrangements as stated in the proposed decision are expected to settle certain disputes between Rotem and the System Operator (as stated
in Section 7.15.5.1 of Part A of the Periodic Report for 2022), and in this regard it is noted that subsequent to the date of the report the System Operator repeated its position with respect to exceptional consumption beyond the plant’s
generation capability, where without detracting from its basic position it contended, among other things, that according to its position the exceptional consumption will be charged at a tariff that is based on the high‑voltage TOAZ rate
plus 25%11. Rotem disagrees with the System Operator’s position and is holding talks with it and, as noted, to the best of Rotem’s understanding the matters are expected to be resolved as part of the overall arrangement proposed in
the proposed decision.
|
| 11 |
A tariff the impact of which, in the Company’s estimation, on the Group’s results compared to the period prior as at the date of the report is not material.
|
| 12 |
For additional details – see Section 7.3.18.5 of Part A of the Periodic Report for 2022.
|
| 3. |
Main Developments in the Business Environment (Cont.)
|
|
|
3.3 |
Activities in the U.S.
|
|
|
F. |
Natural gas prices
|
|
For the
|
For the
|
|||||||||||||||||||||||
|
Nine Months Ended
|
Three Months Ended
|
|||||||||||||||||||||||
|
Region
|
September 30
|
September 30
|
||||||||||||||||||||||
|
(Power Plant)
|
2023
|
2022
|
Change
|
2023
|
2022
|
Change
|
||||||||||||||||||
|
TETCO M3 (Shore, Valley)
|
1.94
|
6.87
|
(72
|
)%
|
1.39
|
7.10
|
(80
|
)%
|
||||||||||||||||
|
Transco Zone 5 North (Maryland)
|
2.73
|
8.41
|
(68
|
)%
|
2.83
|
9.69
|
(71
|
)%
|
||||||||||||||||
|
TETCO M2 (Fairview)
|
1.63
|
5.86
|
(72
|
)%
|
1.25
|
6.84
|
(82
|
)%
|
||||||||||||||||
|
Dominion South (Valley)
|
1.63
|
5.87
|
(72
|
)%
|
1.27
|
6.87
|
(82
|
)%
|
||||||||||||||||
|
Algonquin (Towantic)
|
3.02
|
9.46
|
(68
|
)%
|
1.93
|
7.57
|
(74
|
)%
|
||||||||||||||||
|
Chicago Citygate (Three Rivers)
|
N/A
|
N/A
|
N/A
|
2.31
|
N/A
|
N/A
|
||||||||||||||||||
| 3. |
Main Developments in the Business Environment (Cont.)
|
|
|
3.3 |
Activities in the U.S. (Cont.)
|
|
|
G. |
Electricity prices
|
|
For the
|
For the
|
|||||||||||||||||||||||
|
Nine Months Ended
|
Three Months Ended
|
|||||||||||||||||||||||
|
Region
|
September 30
|
September 30
|
||||||||||||||||||||||
|
(Power Plant)
|
2023
|
2022
|
Change
|
2023
|
2022
|
Change
|
||||||||||||||||||
|
PJM West (Shore and Maryland)
|
31.97
|
74.56
|
(57
|
)%
|
33.32
|
90.44
|
(63
|
)%
|
||||||||||||||||
|
PJM AD Hub (Fairview)
|
30.64
|
71.01
|
(57
|
)%
|
31.83
|
87.06
|
(63
|
)%
|
||||||||||||||||
|
NY‑ISO Zone G (Valley)
|
33.86
|
85.30
|
(60
|
)%
|
32.46
|
89.48
|
(64
|
)%
|
||||||||||||||||
|
ISO‑NE Mass Hub (Towantic)
|
37.55
|
88.48
|
(58
|
)%
|
33.22
|
85.74
|
(61
|
)%
|
||||||||||||||||
|
PJM ComEd (Three Rivers)
|
–
|
–
|
–
|
30.86
|
–
|
–
|
||||||||||||||||||
| 3. |
Main Developments in the Business Environment (Cont.)
|
|
|
3.3 |
Activities in the U.S. (Cont.)
|
|
|
H. |
Electricity margin in the operating markets of the CPV Group (Spark Spread)
|
|
For the
|
For the
|
|||||||||||||||||||||||
|
Nine Months Ended
|
Three Months Ended
|
|||||||||||||||||||||||
|
Power Plant
|
September 30
|
September 30
|
||||||||||||||||||||||
|
(Region)
|
2023
|
2022
|
Change
|
2023
|
2022
|
Change
|
||||||||||||||||||
|
Shore
(PJM West/TETCO M3)
|
18.61
|
27.16
|
(31
|
)%
|
23.70
|
41.46
|
(43
|
)%
|
||||||||||||||||
|
Maryland
(PJM West/Transco Zn 5N)
|
13.15
|
16.55
|
(21
|
)%
|
13.77
|
23.6
|
(42
|
)%
|
||||||||||||||||
|
Valley
(NY-ISO Zone G/30% Dominion South, 70% TETCO M3)
|
21.13
|
39.97
|
(47
|
)%
|
23.11
|
40.97
|
(44
|
)%
|
||||||||||||||||
|
Towantic
(ISO-NE Mass Hub/Algonquin)
|
17.94
|
27.01
|
(34
|
)%
|
20.67
|
36.52
|
(43
|
)%
|
||||||||||||||||
|
Fairview
(PJM AD Hub/TETCO M2)
|
20.04
|
32.94
|
(39
|
)%
|
23.67
|
42.62
|
(44
|
)%
|
||||||||||||||||
|
Three Rivers
(PJM ComEd / Chicago City Gate)
|
–
|
–
|
–
|
15.86
|
–
|
–
|
||||||||||||||||||
|
|
* |
Based on Day‑Ahead prices as shown in the above tables, with a discount for the thermal conversion ratio (heat rate) of 6.9 MMBtu/MWh for Maryland, Shore and Valley, and a thermal conversion ratio of 6.5 MMBtu/MWh for Three Rivers, Towantic
and Fairview. It is clarified that the actual energy margins of the power plants of the CPV Group could be significantly different.
|
| 3. |
Main Developments in the Business Environment (Cont.)
|
|
|
3.3 |
Activities in the U.S. (Cont.)
|
|
|
I. |
Capacity payments
|
|
Sub-Region
|
CPV Plants13
|
2024/2025
|
2023/2024
|
2022/2023
|
2021/2022
|
|
PJM RTO
|
28.92
|
34.13
|
50
|
140
|
|
|
PJM COMED
|
Three Rivers
|
28.92
|
34.13
|
-
|
-
|
|
PJM MAAC
|
Fairview, Maryland, Maple Hill
|
49.49
|
49.49
|
95.79
|
140
|
|
PJM EMAAC
|
Shore
|
54.95
|
49.49
|
97.86
|
165.73
|
| 3. |
Main Developments in the Business Environment (Cont.)
|
|
|
3.3 |
Activities in the U.S. (Cont.)
|
|
|
I. |
Capacity payments (Cont.)
|
|
Sub-Area
|
CPV
Plants
|
Winter 2023/2024
|
Summer 2023
|
Winter 2022/2023
|
Summer 2022
|
|
NYISO
Rest of the Market
|
–
|
127.25
|
153.26
|
39.12
|
110.87
|
|
Lower Hudson Valley
|
Valley
|
128.9
|
164.35
|
43.43
|
151.63
|
|
14
|
That stated in this Section regarding the estimate of the CPV Group constitutes “forward‑looking” information as
it is defined in the Securities Law, regarding which there is no certainty it will be realized and that depends on the content of the arrangements that will be provided (if any) and the manner of their application.
|
| 3. |
Main Developments in the Business Environment (Cont.)
|
|
|
3.3 |
Activities in the U.S. (Cont.)
|
|
|
I. |
Capacity payments (Cont.)
|
|
Sub-Region
|
CPV Power Plants
|
2026/2027
|
2025/2026
|
|
ISO-NE
Rest of the Market
|
Towantic
|
85.15
|
85.15
|
|
|
J. |
The Inflation Reduction Act (“the IRA Law”) – for additional details regarding the IRA Law, which grants significant tax benefits to projects involving renewable energies and carbon capture technologies, and the impact thereof on the
construction and development projects of the CPV Group – see Section 3.3H of the Report of the Board of Directors for 2022.
|
| 4. |
Results of operations for the nine‑month period ended September 30, 2023 (in millions of NIS)
|
| 4. |
Results of operations for the nine‑month period ended September 30, 2023 (in millions of NIS) (Cont.)
|
|
|
A. |
Statement of income15
|
|
For the nine months ended
|
||||||||
|
Section
|
September 30
|
|||||||
|
2023
|
2022
|
|||||||
|
Revenues from sales and provision of services (1)
|
1,971
|
1,423
|
||||||
|
Cost of sales and provision of services (without depreciation and amortization) (2)
|
(1,395
|
)
|
(1,036
|
)
|
||||
|
Depreciation and amortization
|
(205
|
)
|
(132
|
)
|
||||
|
Gross profit
|
371
|
255
|
||||||
|
Administrative and general expenses
|
(182
|
)
|
(155
|
)
|
||||
|
Share in earnings of associated companies16
|
179
|
190
|
||||||
|
Business development expenses
|
(47
|
)
|
(35
|
)
|
||||
|
Other income, net
|
6
|
–
|
||||||
|
Operating income
|
327
|
255
|
||||||
|
Financing income (expenses), net
|
(143
|
)
|
(18
|
)
|
||||
|
Income before taxes on income
|
184
|
237
|
||||||
|
Taxes on income expenses
|
(44
|
)
|
(57
|
)
|
||||
|
Net income for the period
|
140
|
180
|
||||||
|
Adjustments
|
26
|
(60
|
)
|
|||||
|
Adjusted net income for the period17
|
166
|
120
|
||||||
|
Attributable to:
|
||||||||
|
The Company’s shareholders
|
140
|
84
|
||||||
|
Holders of non‑controlling interests
|
26
|
36
|
||||||
| 15 |
The results of the associated companies in the U.S. (mainly in the Energy Transition segment) are presented in the category “Company’s share in earnings of associated companies”.
|
|
16
|
The earnings of associated companies in the U.S. include income or loss in respect of changes in the fair value of derivative
financial instruments from plans of the CPV Group that hedge electricity margins, which are not designated for application of hedge accounting and that were not yet realized as at the date of the financial statements.
|
|
17
|
Adjusted net income or loss – net income or loss in accordance with IFRS plus or minus the adjustments detailed in Section G below.
It is emphasized that “adjusted income or loss” as stated in this report is not a recognized data item that is recognized under IFRS or under any other set of generally accepted accounting principles as an index for measuring financial
performance and should not be considered as a substitute for income or loss or other terms provided in accordance with IFRS. It is possible that the Company’s definitions of “adjusted income or loss” are different than those used by other
companies. Nonetheless, the Company believes that the “adjusted income or loss” provides information that is useful to management and investors by means of eliminating certain line items (categories) that do not constitute an indication of
the Company’s ongoing business activities.
|
| 4. |
Results of operations for the nine‑month period ended September 30, 2023 (in millions of NIS) (Cont.)
|
|
|
A. |
Statement of income (Cont.)
|
|
Revenues
|
For the
|
Board’s Explanations
|
|||||||
|
Nine Months Ended
|
|||||||||
|
September 30
|
|||||||||
|
2023
|
2022
|
||||||||
|
Revenues in Israel
|
|||||||||
|
Revenues from sale of energy to private customers
|
1,154
|
891
|
The increase stems mainly from an increase in the generation component and an increase in customer consumption, in the aggregate amount of about NIS
198 million, and an increase, in the amount of about NIS 66 million, due to consolidation of Gat for the first time starting from the second quarter of 2023.
|
||||||
|
Revenues from private customers in respect of infrastructure services
|
373
|
237
|
The increase, stems mainly from an increase in the infrastructure tariff and an increase in customer consumption, in the amounts of about NIS 76
million and about NIS 40 million, respectively, and an increase of about NIS 20 million due to consolidation of Gat for the first time starting from the second quarter of 2023.
|
||||||
|
Revenues from sale of energy to the System Operator and to other suppliers
|
127
|
79
|
Most of the increase, in the amount of about NIS 49 million, stems from the commercial operation of Zomet at the end of the second quarter of 2023.
|
||||||
|
Revenues in respect of capacity payments
|
30
|
–
|
The increase stems from the commercial operation of Zomet at the end of the second quarter of 2023.
|
||||||
|
Revenues from sale of steam
|
45
|
44
|
|||||||
|
Other revenues
|
50
|
28
|
Most of the increase stems from sale of electricity from the Zomet power plant prior to the commercial operation at the end of June 2023.
|
||||||
|
Total revenues in Israel
|
1,779
|
1,279
|
|||||||
|
Revenues in the U.S.
|
|||||||||
|
Revenues from sale of electricity from renewable energy
|
89
|
65
|
The increase derives mainly from the first‑time consolidation of the results of Mountain Wind project in the second quarter of 2023.
|
||||||
|
Revenues from provision of services (under others)
|
103
|
79
|
The increase stems mainly from an increase in the scope of the services provided to projects.
|
||||||
|
Total revenues in the U.S.
|
192
|
144
|
|||||||
|
Total revenues
|
1,971
|
1,423
|
|||||||
| 4. |
Results of operations for the nine‑month period ended September 30, 2023 (in millions of NIS) (Cont.)
|
|
|
A. |
Statement of income (Cont.)
|
|
|
(2) |
Changes in the cost of sales and provision of services (not including depreciation and amortization):
|
|
Cost of Sales and
Provision of Services
|
For the
|
Board’s Explanations
|
|||||||
|
Nine Months Ended
|
|||||||||
|
September 30
|
|||||||||
|
2023
|
2022
|
||||||||
|
Cost of sales in Israel
|
|||||||||
|
Natural gas and diesel oil
|
489
|
372
|
The increase stems mainly from an increase in the natural gas tariff as a result of an increase in the generation component and the shekel/dollar
exchange rate, in the amount of about NIS 41 million, from an increase in the quantity of the gas consumed against the background of maintenance work at the Rotem and Hadera power plants in the corresponding period last year, in the amount of
about NIS 45 million, and an increase due to consolidation of the results of Gat for the first time and the commercial operation of Zomet starting from the second quarter of 2023, in the amount of about NIS 85 million. On the other hand,
there was a decrease of about NIS 52 million, deriving from entry of the Energean agreement into effect commencing from the second quarter of 2023 (of which about NIS 18 million stemming from a contractual monetary amount that Rotem and
Hadera are entitled to from Energean that was recognized in the first quarter, as described in Note 8A(3) to the Interim Statements).
|
||||||
|
Expenses in respect of acquisition of energy
|
249
|
240
|
The increase stems mainly from an increase of about NIS 89 million in customer consumption in the period of the report. On the other hand, there was a decrease, in
the amount of about NIS 81 million, against the background of maintenance work at the Rotem and Hadera power plants in the corresponding period last year.
|
||||||
|
Expenses in respect of infrastructure services
|
373
|
237
|
The increase stems mainly from an increase in the infrastructure tariff and an increase in customer consumption, in the amounts of about NIS 76
million and about NIS 40 million, respectively, and an increase of about NIS 20 million due to consolidation of Gat for the first time in the second quarter of 2023.
|
||||||
|
Cost of transmission of gas
|
29
|
24
|
|||||||
|
Operating expenses
|
83
|
61
|
The increase stems mainly from the first‑time consolidation of Gat and the commercial operation of Zomet starting from the second quarter of 2023.
|
||||||
|
Other expenses
|
60
|
25
|
Most of the increase stems from natural gas and other expenses at the Zomet power plant prior to the commercial operation at the end of June 2023.
|
||||||
|
Total cost of sales in Israel
|
1,283
|
959
|
|||||||
| 4. |
Results of operations for the nine‑month period ended September 30, 2023 (in millions of NIS) (Cont.)
|
|
|
A. |
Statement of income (Cont.)
|
|
|
(2) |
Changes in the cost of sales and provision of services (not including depreciation and amortization): (Cont.)
|
|
Cost of sales and services in the U.S.
|
|||||||||
|
Cost of sales in respect of sale of electricity from renewable energy
|
35
|
22
|
The increase stems mainly from the first‑time consolidation of the Mountain Wind project starting from the second quarter of 2023.
|
||||||
|
Cost in respect provision of services (under others)
|
77
|
55
|
Most of the increase is parallel to the increase in the scope of the services provided to projects.
|
||||||
|
Total cost of sales and provision of services in the U.S.
|
112
|
77
|
|||||||
|
Total cost of sales and provision of services
|
1,395
|
1,036
|
|||||||
| 4. |
Results of operations for the nine‑month period ended September 30, 2023 (in millions of NIS) (Cont.)
|
|
|
B. |
EBITDA, FFO and net cash flows after service of the project debt
|
|
|
1. |
EBITDA indices
|
|
|
– |
“EBITDA in the consolidated statements”: net income (loss) for the period before depreciation and amortization, net financing expenses or income, taxes on income and other income (expenses), net.
|
|
|
– |
“EBITDA after proportionate consolidation”: “EBITDA in the consolidated statements” after eliminating the share in the income (losses) of associated companies and after a proportionate consolidation of the EBITDA of the associated companies
based on the rate of holdings of the CPV Group therein.
|
|
|
– |
“EBITDA after adjusted proportionate consolidation: “EBITDA after proportionate consolidation” after adjustments in respect of changes in the fair value of derivative financial instruments and items that are not in the ordinary course of the
Group’s business and/or that are of a non‑recurring nature (for details regarding adjustments in the period – Section F below).
|
|
|
2. |
FFO (Funds From Operations) – cash flows from operating activities for the period (including changes in the working capital) less investments in property, plant and equipment and periodic maintenance costs that are not included in the
current operating activities and less net interest payments.
|
|
|
3. |
Net cash flows after service of the project debt – FFO after adjustments in respect of payment of principal on project loans, and change in other credit from banks and change in restricted cash and deposits (including for securing
transactions hedging electricity margins) as part of the project credit.
|
| 18 |
It is noted that other companies might define the EBITDA and FFO indices differently.
|
| 4. |
Results of operations for the nine‑month period ended September 30, 2023 (in millions of NIS) (Cont.)
|
|
|
B. |
EBITDA, FFO and net cash flows after service of the project debt (Cont.)
|
|
For the
|
||||||||
|
Nine Months Ended
|
||||||||
|
September 30
|
||||||||
|
2023
|
2022
|
|||||||
|
Revenues from sales and provision of services
|
1,971
|
1,423
|
||||||
|
Cost of sales (without depreciation and amortization)
|
(1,395
|
)
|
(1,036
|
)
|
||||
|
Administrative and general expenses (without depreciation and
|
||||||||
|
amortization)
|
(172
|
)
|
(147
|
)
|
||||
|
Business development expenses
|
(47
|
)
|
(35
|
)
|
||||
|
Share in income of associated companies
|
179
|
190
|
||||||
|
Consolidated EBITDA
|
536
|
395
|
||||||
|
Elimination of the share in income of associated companies
|
(179
|
)
|
(190
|
)
|
||||
|
Addition of the share of Group in proportionate EBITDA of
|
||||||||
|
associated companies (1)
|
423
|
393
|
||||||
|
EBITDA after proportionate consolidation
|
780
|
598
|
||||||
|
Adjustments – see detail in Section G below
|
33
|
1
|
||||||
|
Adjusted EBITDA after proportionate consolidation
|
813
|
599
|
||||||
|
|
(1) |
Calculation of the Group’s share in the proportionate EBITDA of associated companies (in millions of NIS):
|
|
For the
|
||||||||
|
Nine Months Ended
|
||||||||
|
September 30
|
||||||||
|
2023
|
2022
|
|||||||
|
Revenues from capacity payments
|
177
|
177
|
||||||
|
Revenues from sales of energy and other
|
741
|
1,600
|
||||||
|
Cost of sales – natural gas (without depreciation and amortization)
|
(339
|
)
|
(978
|
)
|
||||
|
Cost of sales – other expenses (without depreciation and
|
||||||||
|
amortization)
|
(209
|
)
|
(210
|
)
|
||||
|
Gain (loss) from realization of transactions hedging the electricity margins
|
85
|
(184
|
)
|
|||||
|
Changes in fair value of forward transactions in hedging plans
|
||||||||
|
of the electricity margins
|
(15
|
)
|
1
|
|||||
|
Administrative and general expenses (without depreciation and
|
||||||||
|
amortization)
|
(17
|
)
|
(13
|
)
|
||||
|
Group’s share in proportionate EBITDA of associated companies
|
423
|
393
|
||||||
|
Adjustments in respect of associated companies (see detail in
|
||||||||
|
Section G below)
|
15
|
(1
|
)
|
|||||
|
Group’s share in proportionate adjusted EBITDA of associated
|
||||||||
|
Companies
|
438
|
392
|
||||||
| 4. |
Results of operations for the nine‑month period ended September 30, 2023 (in millions of NIS) (Cont.)
|
|
|
B. |
EBITDA, FFO and net cash flows after service of the project debt (Cont.)
|
|
|
(2) |
Set forth below is a breakdown of the adjusted EBITDA after proportionate consolidation data broken down by the subsidiaries (on a consolidated basis) and the associated companies (on a proportionate basis, based on the rate of the holdings
of the CPV Group therein) (in NIS millions):
|
|
Basis of
|
||||||||||||
|
presentation
|
||||||||||||
|
in the
|
For the
|
|||||||||||
|
Company’s
|
Nine Months Ended
|
|||||||||||
|
financial
|
September 30
|
|||||||||||
|
statements
|
2023
|
2022
|
||||||||||
|
|
||||||||||||
|
Total operating projects in (see Section 4B(3) below)
|
Consolidated
|
471
|
282
|
|||||||||
|
Business development costs, headquarters in Israel and others
|
Consolidated
|
(26
|
)
|
(17
|
)
|
|||||||
|
Total Israel
|
445
|
265
|
||||||||||
|
Total operating projects (see Section 4B(3) below)
|
Associate
|
440
|
393
|
|||||||||
|
Other costs
|
Consolidated
|
(3
|
)
|
(4
|
)
|
|||||||
|
Total energy transition in the U.S.
|
437
|
389
|
||||||||||
|
Total operating projects in Israel (see Section 4B(3) below)
|
Consolidated
|
46
|
41
|
|||||||||
|
Business development and other costs
|
Consolidated
|
(29
|
)
|
(19
|
)
|
|||||||
|
Total renewable energy in the U.S.
|
17
|
22
|
||||||||||
|
Total activities under other segments
|
Consolidated
|
6
|
4
|
|||||||||
|
Headquarters in the United States19
|
Consolidated
|
(72
|
)
|
(64
|
)
|
|||||||
|
Total United States
|
388
|
351
|
||||||||||
|
Company headquarters (not allocated to the segments)
|
Consolidated
|
(20
|
)
|
(17
|
)
|
|||||||
|
Adjusted EBITDA after proportionate consolidation
|
813
|
599
|
||||||||||
|
19
|
After elimination of management fees between the CPV Group and the Company, in the amounts of about NIS 21 million and about NIS 10 million for the six‑month periods
ended September 30, 2023 and 2022, respectively.
|
| 4. |
Results of operations for the nine‑month period ended September 30, 2023 (in millions of NIS) (Cont.)
|
|
|
B. |
EBITDA, FFO and net cash flows after service of the project debt (Cont.)
|
|
|
(3) |
Set forth below is additional information regarding the revenues, adjusted EBITDA after proportionate consolidation, FFO and net cash flows after service of the project debt of the Group’s active power plants broken down by activity segments
and subsidiaries (on a consolidated basis) and the associated companies (on a proportionate basis, based on the rate of the holdings of the CPV Group therein) (in NIS millions):
|
|
For the nine months ended
|
For the nine months ended
|
|||||||||||||||||||||||||||||||||
|
September 30, 2023
|
September 30, 2022
|
|||||||||||||||||||||||||||||||||
|
Net
|
Net
|
|||||||||||||||||||||||||||||||||
|
|
Basis of
|
Adjusted
|
cash
|
Adjusted
|
cash
|
|||||||||||||||||||||||||||||
|
|
presentation
|
EBITDA
|
flows
|
EBITDA
|
flows
|
|||||||||||||||||||||||||||||
|
|
in the
|
after
|
after
|
after
|
after
|
|||||||||||||||||||||||||||||
|
Main
|
Company’s
|
proportionate
|
service of
|
proportionate
|
service of
|
|||||||||||||||||||||||||||||
|
projects in
|
financial
|
consol-
|
project
|
consol-
|
project
|
|||||||||||||||||||||||||||||
|
operation
|
statements
|
Revenues
|
idation
|
FFO
|
debt
|
Revenues
|
idation
|
FFO
|
debt
|
|||||||||||||||||||||||||
|
Rotem20
|
Consolidated
|
993
|
344
|
334
|
334
|
844
|
244
|
203
|
203
|
|||||||||||||||||||||||||
|
Hadera
|
Consolidated
|
298
|
78
|
65
|
32
|
243
|
38
|
35
|
8
|
|||||||||||||||||||||||||
|
Zomet21
|
Consolidated
|
79
|
14
|
19
|
19
|
–
|
–
|
–
|
–
|
|||||||||||||||||||||||||
|
Gat22 23
|
Consolidated
|
108
|
35
|
12
|
6
|
–
|
–
|
–
|
–
|
|||||||||||||||||||||||||
|
Total operating projects in Israel
|
1,478
|
471
|
430
|
391
|
1,087
|
282
|
238
|
211
|
||||||||||||||||||||||||||
|
Fairview
|
Associated (25%)
|
223
|
130
|
125
|
29
|
214
|
73
|
47
|
7
|
|||||||||||||||||||||||||
|
Towantic
|
Associated (26%)
|
235
|
107
|
80
|
(32
|
)
|
349
|
71
|
61
|
19
|
||||||||||||||||||||||||
|
Maryland24
|
Associated (25%)
|
162
|
44
|
16
|
8
|
153
|
45
|
22
|
6
|
|||||||||||||||||||||||||
|
Shore25
|
Associated (37.53%)
|
163
|
26
|
3
|
(6
|
)
|
222
|
42
|
2
|
10
|
||||||||||||||||||||||||
|
Valley
|
Associated (50%)
|
332
|
130
|
83
|
25
|
530
|
162
|
60
|
10
|
|||||||||||||||||||||||||
|
Three Rivers18
|
Associated (10%)
|
22
|
3
|
–
|
–
|
–
|
–
|
–
|
–
|
|||||||||||||||||||||||||
|
Total energy transition in the U.S.26
|
1,137
|
440
|
307
|
24
|
1,468
|
393
|
192
|
52
|
||||||||||||||||||||||||||
|
Keenan
|
Consolidated
|
62
|
34
|
30
|
12
|
65
|
41
|
38
|
10
|
|||||||||||||||||||||||||
|
Mountain Wind19
|
Consolidated
|
27
|
12
|
15
|
–
|
–
|
–
|
–
|
–
|
|||||||||||||||||||||||||
|
Total renewable energy in the U.S.
|
89
|
46
|
45
|
12
|
65
|
41
|
38
|
10
|
||||||||||||||||||||||||||
|
20
|
Not including a deduction of repayment of loans to shareholders of Rotem before the Veridis transaction (see Note 6A(2) of the interim statements) and intercompany taxes paid in the
consolidated tax reconciliation statement.
|
|
21
|
The financial results of the Zomet and Three Rivers power plants were included starting from the commercial operation date at the end of June 2023 and during July 2023, respectively. For
details regarding the capacity tariffs in the Zomet power plant, particularly in 2023, see Section 10B.
|
|
22
|
The financial results of the projects were included starting from the initial consolidation date in the second quarter of 2023. The estimated EBITDA for a full calendar year of the Mountain
Wind project in the period of the PPA agreements is about NIS 45 million (about $13 million). That stated above with reference to the estimated EBITDA for a full calendar year constitutes “forward‑looking” information as it is defined in
the Securities Law, which is based on estimates of the CPV Group as at the date of the report and regarding which there is no certainty it will materialize. That stated might be impacted by, among other things, changes in the PPA
agreements, operating factors (including breakdowns or wind conditions), changes in financing or in the energy market or regulatory factors or as a result of occurrence of one or more of the risk factors to which the CPV Group is exposed.
|
|
23
|
The FFO in the period of the report includes a payment of about NIS 8 million for significant planned maintenance work that was performed at Gat in the first quarter of 2023.
|
|
24
|
The FFO in the period of the report includes a payment in respect of the project for upgrade of facilities of the Maryland power plant, in the amount of about NIS 8 million.
|
|
25
|
The FFO in the period of the report includes a payment, in the amount of about NIS 17 million, in respect of significant planned maintenance work performed at Shore, in the first half of
2023.
|
|
26
|
It is noted that the financing agreements of the CPV Group including mechanisms of the “cash sweep” type in the framework of which all or part of the free cash flows from the project is
designated for repayment of the loan principal on a current basis in addition to the predetermined minimum repayment schedule with respect to every long‑term loan. Accordingly, there could be an acceleration of execution of repayments upon
occurrence of certain events and there are limitations on distributions to the owners. For additional details – see Section 9 below.
|
| 4. |
Results of operations for the nine‑month period ended September 30, 2023 (in millions of NIS) (Cont.)
|
|
|
C. |
Analysis of the change in adjusted EBITDA – Israel segment
|
|
|
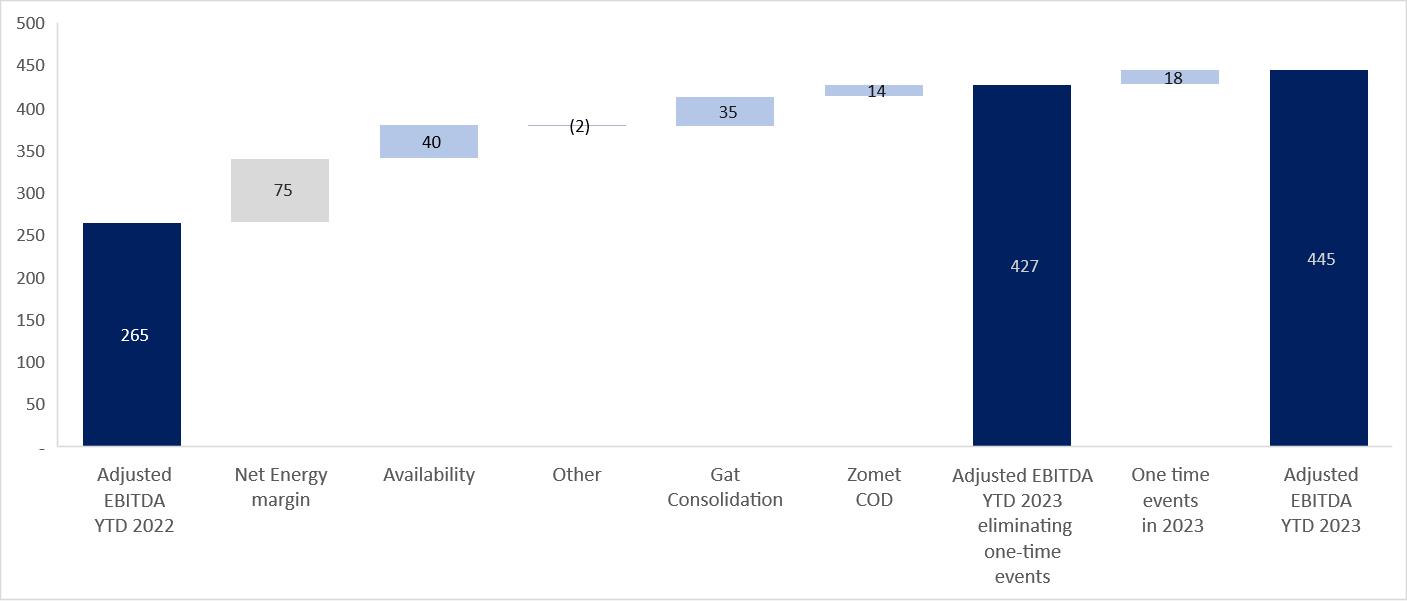
1. |
Energy margin – the increase stems mainly from an increase in the generation tariff, in the amount of about NIS 58 million, an increase in the sales of energy, in the amount of about NIS 18 million, as a result of an increase of
consumer consumption, and a decrease in the natural gas prices, in the amount of about NIS 34 million, as a result of entry into effect of the Energean agreement starting from the end of the first quarter of 202327. On the other
hand, there was an increase in the natural gas price due to the strengthening of the dollar against shekel, in the amount of about NIS 30 million. In addition, there was a decline in the revenues due to the revision of the hourly demand
brackets, in the aggregate amount of about NIS 5 million28 (for additional details – see Section 3.2(D)).
|
| 27 |
In the Company’s estimation, upon the commercial operation of the Karish reservoir, an annual monetary savings is expected estimated at about NIS 60 million, based on the average projected gas consumption of Rotem and Hadera. The Company’s estimate of the expected monetary savings upon the commercial operation of the Karish reserve constitutes “forward‑looking” information, as it is defined in the Securities Law, which is based on the
Company’s estimates, assessments and plans proximate to the publication date of the report. The said data, estimates and assessments might not materialize or could change during the relevant period due to a range of circumstances that are not
under the Company’s control, including operating factors, changes in the actual consumption of electricity and gas, changes in foreign currency, and/or occurrence of one or more of the risk factors to which the Company is exposed.
|
| 28 |
In the Company’s estimation, the expected impact for 2023 is a decrease in revenues of about NIS 35 million (of which about NIS 30 million is expected in the fourth quarter of 2023). The Company’s estimate
constitutes “forward‑looking” information, as it is defined in the Securities Law, which is based on the Company’s estimates and assessments that might not materialize or could change during the relevant period due to various factors,
including those not under the Company’s control and/or consumption of the electricity and/or occurrence of one or more of the risk factors to which the Company is exposed.
|
| 4. |
Results of operations for the nine‑month period ended September 30, 2023 (in millions of NIS) (Cont.)
|
|
|
C. |
Analysis of the change in adjusted EBITDA – Israel segment (Cont.)
|
|
|
2. |
Availability – during the corresponding period last year, the Rotem and Hadera power plants were shut down for different periods of time for purposes of maintenance work, which had a negative impact on their results compared with the
period of the report. For additional details – see Section 4C(3) to the Report of the Board of Directors for 2022.
|
|
|
3. |
One‑time events – in the first quarter of 2023, Rotem and Hadera recognized a contractual monetary amount it is entitled to from Energean, in the aggregate amount of about NIS 18 million further to amendment of the agreements from May
2022. The said amount is expected to be received in the beginning of 2024. For additional details – see Note 8A(3) to the Interim Statements.
|
| 4. |
Results of operations for the nine‑month period ended September 30, 2023 (in millions of NIS) (Cont.)
|
|
|
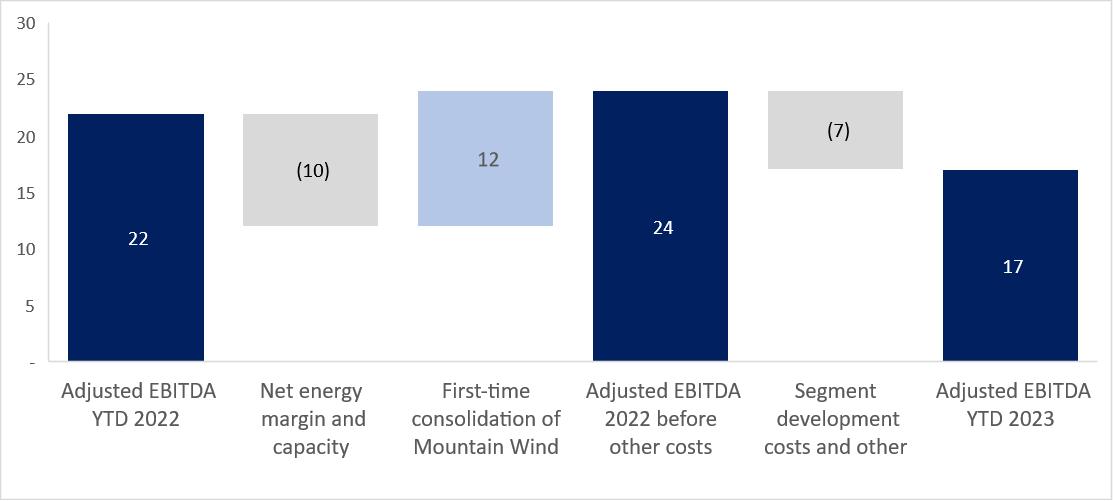
D. |
Analysis of the change in adjusted EBITDA after proportionate consolidation – energy transition segment in the U.S.
|
|
|
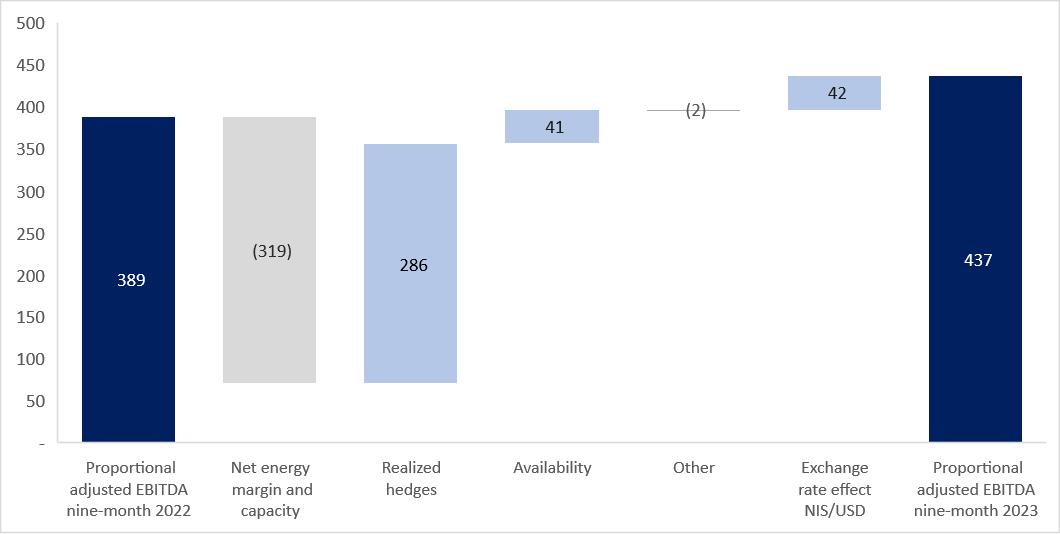
1. |
Energy margin and capacity payments – as stated in Section 3.3H above, in the period of the report there was a significant decline in the energy margins compared with the corresponding period last year, and correspondingly there was a
decline, in the amount of about NIS 302 million, in the electricity margins of the CPV Group (on the assumption of full capacity). In addition, as detailed in Section 3.3H above regarding the capacity tariffs, there was a decrease, in the
amount of about NIS 17 million, in the capacity payments in the period of the report compared with the corresponding period last year.
|
|
|
2. |
Energy hedges29 – the said decrease in the electricity margins was offset, in the aggregate amount of about NIS 286 million compared with the corresponding period last year, due to hedges of the energy margin that were made
mostly in 2022 and that were realized at a gain of about NIS 85 million in the period of the report, and hedges made in 2021 that were realized at a loss of about NIS 201 million in the corresponding period last year. For details regarding
energy hedges for the balance of 2023 and 2024 – see Section E below.
|
|
|
3. |
Availability – stems mainly from maintenance work at the Valley and Fairview power plants in the corresponding period last year. For additional details – see Section 8.8 of Part A the Company’s Periodic Report for 2022.
|
|
29
|
For details relating to the risk management policies in the CPV Group, and particularly with reference to hedging of part of the electricity margins – see Note 23 to the consolidated
financial statements for 2022.
|
| 4. |
Results of operations for the nine‑month period ended September 30, 2023 (in millions of NIS) (Cont.)
|
|
|
D. |
Analysis of the change in adjusted EBITDA after proportionate consolidation – energy transition segment in the U.S. (Cont.)
|
| 4. |
Results of operations for the nine‑month period ended September 30, 2023 (in millions of NIS) (Cont.)
|
|
|
E. |
Additional details regarding electricity hedges and guaranteed capacity payments in the Energy Transition segment in the U.S.30
|
|
October–December 2023
|
2024
|
||
|
Net scope of the hedged energy margin (% of the power plant’s capacity based on the expected generation) (*)
|
48%
|
35%
|
|
|
Net hedged energy margin (millions of $)
|
≈ 15 (≈ NIS 55 million)
|
≈ 52.4 (≈ NIS 191 million)
|
|
|
Net hedged energy margin (MWH/$)
|
15.58
|
16.04
|
|
|
Net market prices of energy margin ($/MWH) (**)
|
19.07
|
16.62
|
|
|
|
(*) |
Pursuant to the policy for hedging electricity margins, the CPV Group seeks to hedge up to 50% of the scope of the expected generation. The actual hedge rate could ultimately be different.
|
|
|
(**) |
The net energy margin is the energy margin less other variable costs, such as, variable emissions, operation and maintenance, consumable materials, etc. For details regarding the manner of calculation of the electricity margin (Spark Spread)
– see Section 3.3H above. The market prices of the net hedged energy are based on the market prices of electricity and natural gas in the future contracts.
|
|
October–December 2023
|
2024
|
|
|
Scope of the secured capacity payments (% of the power plant’s capacity)
|
92%
|
87%
|
|
Capacity payments (millions of $)
|
≈ 15 (≈ NIS 55 million)
|
≈ 54 (≈ NIS 197 million)
|
| 30 |
The estimated percentages and the actual hedged energy margins could change due to new hedges and/or sales of capacity made or as a result of market conditions.
|
| 4. |
Results of operations for the nine‑month period ended September 30, 2023 (in millions of NIS) (Cont.)
|
|
|
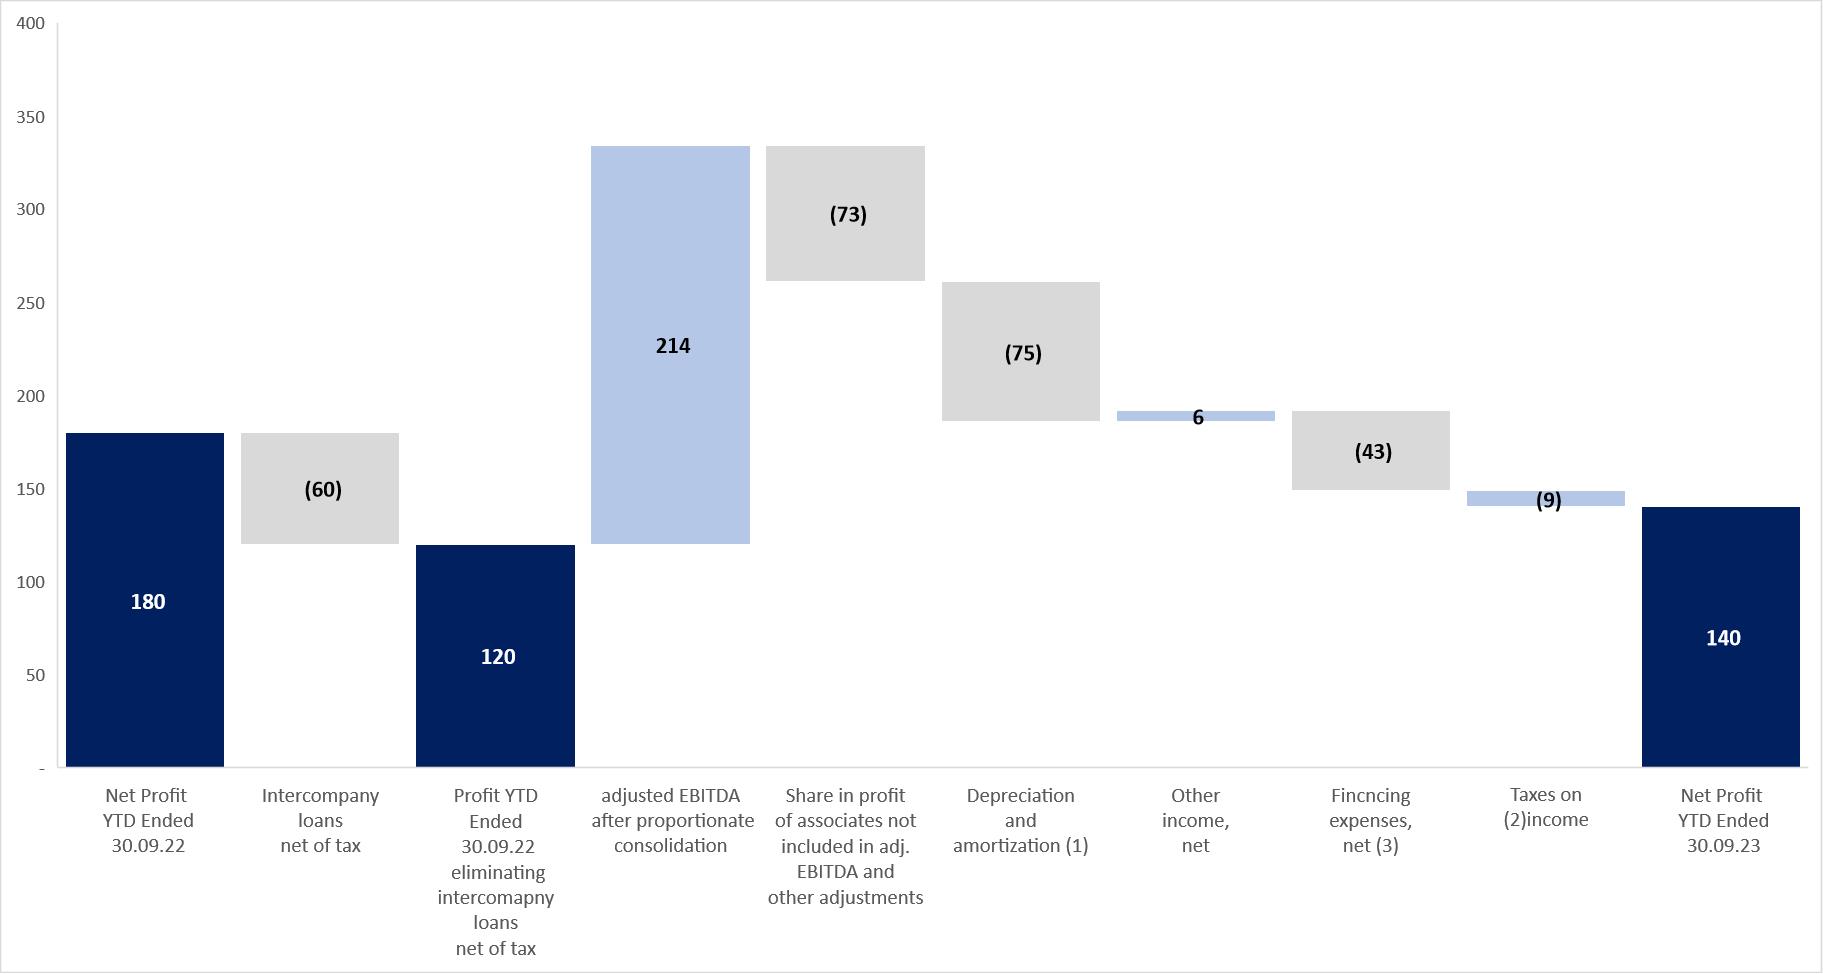
F. |
Analysis of the change in net income
|
|
|
(1) |
Most of the increase stems from depreciation expenses of the Gat (about NIS 21 million) and Mountain Wind (about NIS 9 million) power plants which were consolidated for the first time in the second quarter of 2023, the commercial operation
of the Zomet power plant (about NIS 18 million) that took place in the second quarter of 2023, and an increase in the planned maintenance in Rotem in 2022, in the amount of about NIS 10 million.
|
|
|
(2) |
The decline in the expenses for taxes on income corresponds to the decline in the pre‑tax income.
|
|
|
(3) |
Most of the increase stems from financing expenses relating to acquisition of the Gat power plant, in the amount of about NIS 16 million, to acquisition of the Mountain Wind power plant, in the amount of about NIS 7 million, and the
commercial operation of the Zomet power plant, in the amount of about NIS 22 million.
|
| 4. |
Results of operations for the nine‑month period ended September 30, 2023 (in millions of NIS) (Cont.)
|
|
|
G. |
Adjustments to EBITDA and net income
|
|
For the nine months ended
|
|||||||||
|
Section
|
September 30
|
Board’s explanations
|
|||||||
|
2023
|
2022
|
||||||||
|
Change in the fair value of derivative financial instruments in the U.S. (presented as part of the Company’s share of income of associated companies in the U.S.)
|
15
|
(2
|
)
|
Represents the change in the fair value of derivative financial instruments that are used in programs for hedging electricity margins of the
transition generation energies segment in the U.S. and that were not designated for hedge accounting – for details see Section E above.
|
|||||
|
Change in net expenses, not in the ordinary course of business and/or of a non‑recurring nature
|
18
|
3
|
In the period of the report and in the corresponding period last year, represents test runs and other activities relating to the Company’s
preparations for the commercial operation of the Zomet power plant, which took place at the end of June 2023.
|
||||||
|
Total adjustments to EBITDA after proportionate consolidation
|
33
|
1
|
|||||||
|
Income from exchange rate differences in respect of intercompany loans (*)
|
–
|
(82
|
)
|
||||||
|
Tax impact in respect of the adjustments
|
(7
|
)
|
21
|
||||||
|
Total adjustments to net income for the period
|
26
|
(60
|
)
|
||||||
| (*) |
For purposes of improving the comparability between the periods with respect to the adjusted net income data, the Company made a reconciliation to the net income in the nine months and three months ended on September 30, 2022 in respect of
income that is not cash (cash flow) income from exchange rate differences from revaluation of intercompany loans that occurred from October 1, 2022 that were classified as part of the Group’s net investment in the U.S. and exchange rate
differences in respect thereof are recorded, commencing from that date, to other comprehensive income as part of the translation reserve.
|
| 4. |
Results of operations for the nine‑month period ended September 30, 2023 (in millions of NIS) (Cont.)
|
|
|
H. |
Detail generation (in millions of kilowatt/hours)
|
|
For the nine months ended September 30, 2023
|
For the nine months ended September 30, 2022
|
|||||||||||||||||||||||||||||||||||
|
Potential
|
Net
|
Actual
|
Actual
|
Potential
|
Net
|
Actual
|
Actual
|
|||||||||||||||||||||||||||||
|
electricity
|
electricity
|
generation
|
availability
|
electricity
|
electricity
|
generation
|
availability
|
|||||||||||||||||||||||||||||
|
Capacity
|
generation
|
generation
|
percentage
|
percentage
|
generation
|
generation
|
percentage
|
percentage
|
||||||||||||||||||||||||||||
|
(MW)
|
(GWh)(1)
|
(GWh)(2)
|
(%)(3)
|
(%)
|
(GWh)
|
(GWh)
|
(%)
|
(%)
|
||||||||||||||||||||||||||||
|
Rotem
|
466
|
2,811
|
2,656
|
94.5
|
%
|
98.7
|
%
|
2,808
|
2,406
|
85.7
|
%
|
85.9
|
%
|
|||||||||||||||||||||||
|
Hadera
|
144
|
747
|
677
|
91.0
|
%
|
91.0
|
%
|
751
|
584
|
77.7
|
%
|
77.7
|
%
|
|||||||||||||||||||||||
|
Gat
|
75
|
309
|
307
|
99.3
|
%
|
100.0
|
%
|
–
|
–
|
–
|
–
|
|||||||||||||||||||||||||
|
Zomet
|
396
|
907
|
256
|
28.2
|
%
|
89.8
|
%
|
–
|
–
|
–
|
–
|
|||||||||||||||||||||||||
|
|
(1) |
The generation potential is the net generation capability adjusted for temperature and humidity.
|
|
|
(2) |
The actual net generation in the period.
|
|
|
(3) |
The actual generation percentage is the net electricity divided by the generation potential.
|
| 4. |
Results of operations for the nine‑month period ended September 30, 2023 (in millions of NIS) (Cont.)
|
|
|
H. |
Detail generation (in millions of kilowatt/hours) (Cont.)
|
|
For the nine months ended September 30, 2023
|
For the nine months ended September 30, 2022
|
|||||||||||||||||||||||||||||||||||
|
Potential
|
Net
|
Actual
|
Actual
|
Potential
|
Net
|
Actual
|
Actual
|
|||||||||||||||||||||||||||||
|
electricity
|
electricity
|
generation
|
availability
|
electricity
|
electricity
|
generation
|
availability
|
|||||||||||||||||||||||||||||
|
Capacity
|
generation
|
generation
|
percentage
|
percentage
|
generation
|
generation
|
percentage
|
percentage
|
||||||||||||||||||||||||||||
|
(MW)
|
(GWh)(1)
|
(GWh)(2)
|
(%)(3)
|
(%)
|
(GWh)
|
(GWh)
|
(%)
|
(%)
|
||||||||||||||||||||||||||||
|
Energy transition projects (natural gas)
|
||||||||||||||||||||||||||||||||||||
|
Fairview
|
1,050
|
6,848
|
6,205
|
93.5
|
%
|
96.9
|
%
|
6,692
|
5,768
|
86.9
|
%
|
88.8
|
%
|
|||||||||||||||||||||||
|
Towantic
|
805
|
5,107
|
4,310
|
81.0
|
%
|
94.7
|
%
|
4,454
|
3,737
|
70.2
|
%
|
83.8
|
%
|
|||||||||||||||||||||||
|
Maryland
|
745
|
4,648
|
3,051
|
63.4
|
%
|
90.8
|
%
|
4,648
|
2,858
|
68.9
|
%
|
92.7
|
%
|
|||||||||||||||||||||||
|
Shore
|
725
|
3,728
|
2,689
|
57.1
|
%
|
77.8
|
%
|
4,522
|
3,251
|
68.9
|
%
|
95.1
|
%
|
|||||||||||||||||||||||
|
Valley
|
720
|
4,707
|
3,422
|
75.9
|
%
|
81.5
|
%
|
4,516
|
3,638
|
80.9
|
%
|
88.0
|
%
|
|||||||||||||||||||||||
|
Three
Rivers
|
1,258
|
1,524
|
1,055
|
61.3
|
%
|
68.7
|
%
|
–
|
–
|
–
|
–
|
|||||||||||||||||||||||||
|
Renewable energy projects
|
||||||||||||||||||||||||||||||||||||
|
Keenan II
|
152
|
987
|
194
|
19.5
|
%
|
93.2
|
%
|
994
|
229
|
23.0
|
%
|
92.9
|
%
|
|||||||||||||||||||||||
|
Mountain
Wind
|
82
|
301
|
79
|
22.9
|
%
|
89.5
|
%
|
–
|
–
|
–
|
–
|
|||||||||||||||||||||||||
| (*) |
Regarding the planned maintenance – see Sections 5C(2) and 5D(3) below and Section 8.8 of Part A of the Company’s Periodic Report for 2022.
|
| (1) |
The potential generation is the gross generation capability during the period after planned maintenance and less the electricity used for the power plant’s internal purposes.
|
| (2) |
The net generation of electricity is the gross generation during the period less the electricity used for the power plant’s internal purposes.
|
| (3) |
The actual generation percentage is the quantity of the net electricity generated in the facilities compared with the maximum quantity that can be generated in the period.
|
| 5. |
Results of operations for the three‑month period ended September 30, 2023 (in millions of NIS)
|
|
|
A. |
Statement of income
|
|
For the three months ended
|
||||||||
|
Section
|
September 30
|
|||||||
|
2023
|
2022
|
|||||||
|
Revenues from sales and provision of services (1)
|
851
|
550
|
||||||
|
Cost of sales and provision of services (without depreciation and amortization) (2)
|
(561
|
)
|
(393
|
)
|
||||
|
Depreciation and amortization
|
(95
|
)
|
(46
|
)
|
||||
|
Gross profit
|
195
|
111
|
||||||
|
Administrative and general expenses
|
(65
|
)
|
(59
|
)
|
||||
|
Share in earnings of associated companies
|
79
|
124
|
||||||
|
Business development expenses
|
(17
|
)
|
(12
|
)
|
||||
|
Other income, net
|
11
|
–
|
||||||
|
Operating income
|
203
|
164
|
||||||
|
Financing expenses, net
|
(70
|
)
|
(26
|
)
|
||||
|
Income before tax benefit
|
133
|
138
|
||||||
|
Taxes on income
|
(32
|
)
|
(30
|
)
|
||||
|
Net income for the period
|
101
|
108
|
||||||
|
Adjustments
|
(1
|
)
|
(18
|
)
|
||||
|
Adjusted net income for the period
|
100
|
90
|
||||||
|
Attributable to:
|
||||||||
|
The Company’s shareholders
|
82
|
62
|
||||||
|
Holders of non‑controlling interests
|
18
|
28
|
||||||
| 5. |
Results of operations for the three‑month period ended September 30, 2023 (in millions of NIS) (Cont.)
|
|
|
A. |
Statement of income (Cont.)
|
|
Revenues
|
For the
|
Board’s Explanations
|
|||||||
|
Three Months Ended
|
|||||||||
|
September 30
|
|||||||||
|
2023
|
2022
|
||||||||
|
Revenues in Israel
|
|||||||||
|
Revenues from sale of energy to private customers
|
530
|
355
|
The increase stems mainly from an increase in the generation component and an increase in customer consumption, in the amount of about NIS 63 million,
an increase of about NIS 63 million deriving from the change in the brackets for the demand hours (as detailed in in Section 3.2D above and in Section C below), and an increase of about NIS 43 million deriving from consolidation of the results
of Gat for the first time starting from the second quarter of 2023.
|
||||||
|
Revenues from private customers in respect of infrastructure services
|
138
|
93
|
The increase stems mainly from an increase in the infrastructure tariffs and an increase in customer consumption, in the amounts of about NIS 22 million
and about NIS 11 million, respectively, and an increase of about NIS 12 million due to consolidation of Gat for the first time starting from the second quarter of 2023.
|
||||||
|
Revenues from sale of energy to the System Operator and to other suppliers
|
64
|
22
|
Most of the increase, in the amount of about NIS 45 million, stems mainly from the commercial operation of Zomet at the end of the second quarter of
2023.
|
||||||
|
Revenues in respect of capacity payments
|
28
|
–
|
The increase derives from the commercial operation of Zomet at the end of the second quarter of 2023.
|
||||||
|
Revenues from sale of steam
|
14
|
14
|
|||||||
|
Other revenues
|
7
|
14
|
|||||||
|
Total revenues in Israel
|
781
|
498
|
|||||||
|
Revenues in the U.S.
|
|||||||||
|
Revenues from sale of electricity from renewable energy
|
29
|
18
|
The increase stems mainly from the first‑time consolidation of the Mountain Wind project in the second quarter of 2023.
|
||||||
|
Revenues from provision of services (under others)
|
41
|
34
|
|||||||
|
Total revenues in the U.S.
|
70
|
52
|
|||||||
|
Total revenues
|
851
|
550
|
|||||||
| 5. |
Results of operations for the three‑month period ended September 30, 2023 (in millions of NIS) (Cont.)
|
|
|
A. |
Statement of income (Cont.)
|
|
|
(2) |
Changes in the cost of sales and provision of services (not including depreciation and amortization):
|
|
Cost of Sales and
Provision of Services
|
For the
|
Board’s Explanations
|
|||||||
|
Three Months Ended
|
|||||||||
|
September 30
|
|||||||||
|
2023
|
2022
|
||||||||
|
Cost of sales in Israel
|
|||||||||
|
Natural gas and diesel oil
|
203
|
149
|
The increase stems from an increase in the gas tariff as a result of an increase in the shekel/dollar exchange rate, in the amount of about NIS 9
million, and an increase due to the initial consolidation of Gat and the commercial operation of Zomet starting from the second quarter of 2023, in the aggregate amount of about NIS 66 million. On the other hand, there was a decrease in the
gas expenses of about NIS 20 million, deriving from entry of the Energean agreement into effect commencing from the end of the first quarter of 2023.
|
||||||
|
Expenses in respect of acquisition of energy
|
123
|
78
|
An increase of about NIS 52 million stemming from an increase in customer consumption.
|
||||||
|
Expenses in respect of infrastructure services
|
138
|
93
|
The increase stems mainly from an increase in the infrastructure tariff and an increase in customer consumption, in the amounts of about NIS 22 million and about
NIS 11 million, respectively, and an increase of about NIS 12 million due to consolidation of Gat for the first time starting from the second quarter of 2023.
|
||||||
|
Cost of transmission of gas
|
13
|
8
|
|||||||
|
Operating expenses
|
39
|
19
|
The increase in the operating expenses stems mainly from the initial consolidation of Gat and the commercial operation of Zomet in the second quarter
of 2023.
|
||||||
|
Other expenses
|
4
|
14
|
|||||||
|
Total cost of sales in Israel
|
520
|
361
|
|||||||
|
Cost of sales and services in the U.S.
|
|||||||||
|
Cost of sales in respect of sale of electricity from renewable energy
|
15
|
9
|
The increase stems mainly from the first‑time consolidation of the Mountain Wind project.
|
||||||
|
Cost in respect provision of services (under others)
|
26
|
23
|
|||||||
|
Total cost of sales and provision of services in the U.S.
|
41
|
32
|
|||||||
|
Total cost of sales and provision of services
|
561
|
393
|
|||||||
| 5. |
Results of operations for the three‑month period ended September 30, 2023 (in millions of NIS) (Cont.)
|
|
|
B. |
EBITDA calculations, including EBITDA after adjusted proportionate consolidation31 (in millions of NIS):
|
|
For the
|
||||||||
|
Three Months Ended
|
||||||||
|
September 30
|
||||||||
|
2023
|
2022
|
|||||||
|
Revenues from sales and provision of services
|
851
|
550
|
||||||
|
Cost of sales and services (without depreciation and amortization)
|
(561
|
)
|
(393
|
)
|
||||
|
Administrative and general expenses (without depreciation and
|
||||||||
|
amortization)
|
(62
|
)
|
(56
|
)
|
||||
|
Business development expenses
|
(17
|
)
|
(12
|
)
|
||||
|
Share in income of associated companies
|
79
|
124
|
||||||
|
Consolidated EBITDA
|
290
|
213
|
||||||
|
Elimination of the share of income of associated companies
|
(79
|
)
|
(124
|
)
|
||||
|
Addition of the Group’s share in proportionate EBITDA of associated
|
||||||||
|
companies (1)
|
169
|
195
|
||||||
|
EBITDA after proportionate consolidation
|
380
|
284
|
||||||
|
Adjustments – see detail in Section F below
|
(1
|
)
|
(10
|
)
|
||||
|
Adjusted EBITDA after proportionate consolidation
|
379
|
274
|
||||||
|
|
(1) |
Calculation of the Group’s share in proportionate EBITDA of associated companies (in millions of NIS):
|
|
For the
|
||||||||
|
Three Months Ended
|
||||||||
|
September 30
|
||||||||
|
2023
|
2022
|
|||||||
|
Revenues from capacity payments
|
62
|
57
|
||||||
|
Revenues from sales of energy and other
|
279
|
688
|
||||||
|
Cost of sales – natural gas (without depreciation and amortization)
|
(103
|
)
|
(399
|
)
|
||||
|
Cost of sales – other expenses (without depreciation and
|
||||||||
|
amortization)
|
(71
|
)
|
(74
|
)
|
||||
|
Profit (loss) from realization of transactions hedging the electricity
|
||||||||
|
margins
|
6
|
(85
|
)
|
|||||
|
Changes in fair value of forward transactions in hedging plans
|
||||||||
|
of the electricity margins
|
1
|
11
|
||||||
|
Administrative and general expenses (without depreciation and
|
||||||||
|
amortization)
|
(5
|
)
|
(3
|
)
|
||||
|
Group’s share of proportionate EBITDA of associated companies
|
169
|
195
|
||||||
|
Adjustments in respect of associated companies (see detail in
|
||||||||
|
Section F below)
|
(1
|
)
|
(12
|
)
|
||||
|
Group’s share of proportionate adjusted EBITDA of associated
|
||||||||
|
companies
|
168
|
183
|
||||||
| 31 |
For details regarding the definitions of the “EBITDA” indices, “FFO” and “cash flow after service of project debt” – see Section 4B above.
|
| 5. |
Results of operations for the three‑month period ended September 30, 2023 (in millions of NIS) (Cont.)
|
|
|
B. |
EBITDA and Adjusted EBITDA (Cont.)
|
|
|
(2) |
Set forth below is a breakdown of the adjusted EBITDA after proportionate consolidation data broken down by the subsidiaries (on a consolidated basis) and the associated companies (on a proportionate basis, based on the rate of the holdings
of the CPV Group therein):
|
|
Basis of
|
||||||||||||
|
presentation
|
||||||||||||
|
in the
|
For the
|
|||||||||||
|
Company’s
|
Three Months Ended
|
|||||||||||
|
financial
|
September 30
|
|||||||||||
|
statements
|
2023
|
2022
|
||||||||||
|
|
||||||||||||
|
Total operating projects (see Section 5B(3) below)
|
Consolidated
|
243
|
124
|
|||||||||
|
Business development costs, headquarters in Israel and others
|
Consolidated
|
(8
|
)
|
(5
|
)
|
|||||||
|
Total Israel
|
235
|
119
|
||||||||||
|
Total operating projects (see Section 5B(3) below)
|
Associate
|
170
|
183
|
|||||||||
|
Other
|
Consolidated
|
(1
|
)
|
(2
|
)
|
|||||||
|
Total energy transition in the U.S.
|
169
|
181
|
||||||||||
|
Total operating projects (see Section 5B(3) below)
|
Consolidated
|
10
|
9
|
|||||||||
|
Development costs of renewable energy and others
|
Consolidated
|
(12
|
)
|
(7
|
)
|
|||||||
|
Total renewable energy in the U.S.
|
(2
|
)
|
2
|
|||||||||
|
Total activities under other segments
|
Consolidated
|
9
|
3
|
|||||||||
|
Headquarters in the United States32
|
Consolidated
|
(25
|
)
|
(25
|
)
|
|||||||
|
Total United States
|
151
|
161
|
||||||||||
|
Company headquarters (not allocated to the segments)
|
Consolidated
|
(7
|
)
|
(6
|
)
|
|||||||
|
Adjusted EBITDA after proportionate consolidation
|
379
|
274
|
||||||||||
| 5. |
Results of operations for the three‑month period ended September 30, 2023 (in millions of NIS) (Cont.)
|
|
|
B. |
EBITDA and Adjusted EBITDA (Cont.)
|
|
|
(3) |
Set forth below is information regarding the revenues, EBITDA after adjusted proportionate consolidation, FFO and net cash flows after project debt service of the Group’s active power plants broken down by the subsidiaries (on a consolidated
basis) and the associated companies (on a proportionate basis, based on the rate of the holdings of the CPV Group therein) (in NIS millions):
|
|
For the three months ended
|
For the three months ended
|
|||||||||||||||||||||||||||||||||
|
September 30, 2023
|
September 30, 2022
|
|||||||||||||||||||||||||||||||||
|
Net
|
Net
|
|||||||||||||||||||||||||||||||||
|
|
Basis of
|
Adjusted
|
cash
|
Adjusted
|
cash
|
|||||||||||||||||||||||||||||
|
|
presentation
|
EBITDA
|
flows
|
EBITDA
|
flows
|
|||||||||||||||||||||||||||||
|
|
in the
|
after
|
after
|
after
|
after
|
|||||||||||||||||||||||||||||
|
Main
|
Company’s
|
proportionate
|
service of
|
proportionate
|
service of
|
|||||||||||||||||||||||||||||
|
projects in
|
financial
|
consol-
|
project
|
consol-
|
project
|
|||||||||||||||||||||||||||||
|
operation
|
statements
|
Revenues
|
idation
|
FFO
|
debt
|
Revenues
|
idation
|
FFO
|
debt
|
|||||||||||||||||||||||||
|
Rotem33
|
Consolidated
|
414
|
170
|
185
|
185
|
322
|
112
|
131
|
131
|
|||||||||||||||||||||||||
|
Hadera
|
Consolidated
|
118
|
36
|
41
|
29
|
87
|
12
|
24
|
13
|
|||||||||||||||||||||||||
|
Zomet34
|
Consolidated
|
75
|
12
|
19
|
19
|
–
|
–
|
–
|
–
|
|||||||||||||||||||||||||
|
Gat35
|
Consolidated
|
62
|
25
|
13
|
7
|
–
|
–
|
–
|
–
|
|||||||||||||||||||||||||
|
Total operating projects in Israel
|
669
|
243
|
258
|
240
|
409
|
124
|
155
|
144
|
||||||||||||||||||||||||||
|
Fairview
|
Associated (25%)
|
67
|
40
|
37
|
21
|
98
|
42
|
28
|
(1
|
)
|
||||||||||||||||||||||||
|
Towantic
|
Associated (26%)
|
86
|
44
|
42
|
(2
|
)
|
140
|
34
|
32
|
12
|
||||||||||||||||||||||||
|
Maryland
|
Associated (25%)
|
55
|
22
|
8
|
3
|
74
|
26
|
19
|
5
|
|||||||||||||||||||||||||
|
Shore
|
Associated (37.53%)
|
58
|
16
|
12
|
3
|
100
|
19
|
12
|
11
|
|||||||||||||||||||||||||
|
Valley
|
Associated (50%)
|
102
|
45
|
18
|
14
|
200
|
62
|
23
|
7
|
|||||||||||||||||||||||||
|
Three Rivers31
|
Associated (10%)
|
22
|
3
|
–
|
–
|
–
|
–
|
–
|
–
|
|||||||||||||||||||||||||
|
Total energy transition in the U.S.36
|
390
|
170
|
117
|
39
|
612
|
183
|
114
|
34
|
||||||||||||||||||||||||||
|
Keenan
|
Consolidated
|
19
|
7
|
3
|
9
|
18
|
9
|
6
|
5
|
|||||||||||||||||||||||||
|
Mountain Wind32
|
Consolidated
|
10
|
3
|
1
|
(11
|
)
|
–
|
–
|
–
|
–
|
||||||||||||||||||||||||
|
Total renewable energy in the U.S.
|
29
|
10
|
4
|
(2
|
)
|
18
|
9
|
6
|
5
|
|||||||||||||||||||||||||
|
33
|
Not including a deduction of repayment of loans to the shareholders in Rotem before the Veridis transaction (see Note 6A(2) of the interim statements) and intercompany tax payments as part of
the consolidated tax reconciliation statement.
|
|
34
|
The financial results of the Zomet and Three Rivers power plants were included starting from the commercial operation date, from the end of June 2023 and during July 2023, respectively. For
details regarding the capacity payments in the Zomet power plant, particularly in 2023 – see Section 10B.
|
|
35
|
The financial results of the projects were included starting from the initial consolidation date, in the second quarter of 2023.
|
|
36
|
It is noted that the financing agreements of the CPV Group including mechanisms of the “cash sweep” type in the framework of which all or part of the free cash flows from the project is
designated for repayment of the loan principal on a current basis plus the predetermined minimum repayment schedule with respect to every long‑term loan. Accordingly, there could be an acceleration of execution of repayments upon occurrence
of certain events and there are limitations on distributions to the owners. For additional details – see Section 9 below.
|
| 5. |
Results of operations for the three‑month period ended September 30, 2023 (in millions of NIS) (Cont.)
|
|
|
C. |
Analysis of the change in adjusted EBITDA – segment in Israel
|
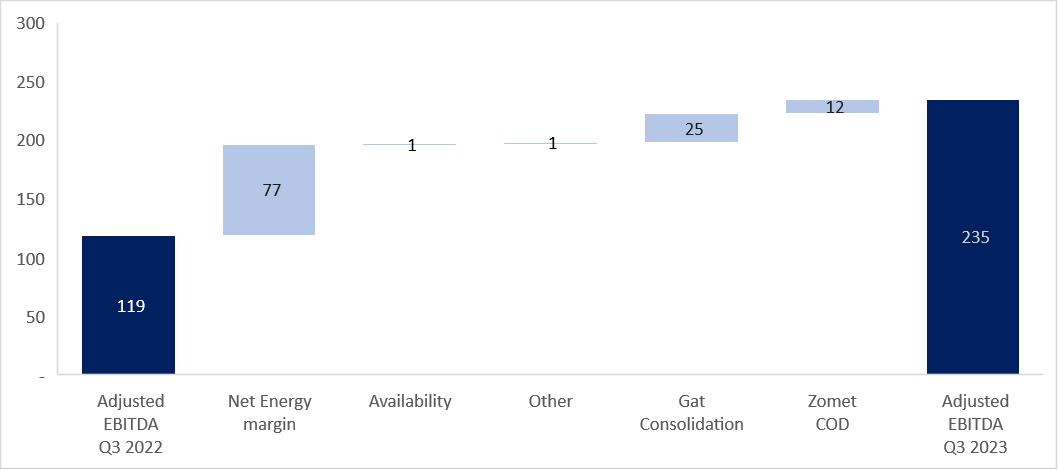
|
|
1. |
Energy margin – the increase in energy margin in the quarter compared with the corresponding quarter last year stems mainly from an increase in revenues due to a revision of the brackets for the demand hours, in the aggregate amount
of about NIS 63 million (for additional details – see Section 3.2D) and an increase in the generation tariff, in the amount of about NIS 3 million. In addition, there was a decrease in the natural gas price, in the amount of about NIS 20
million, due to entry of the Energean agreement into effect, starting from the end of the first quarter of 2023, net of an increase in the natural gas price due to the strengthening of the dollar against the shekel, in the amount of about NIS 9
million.
|
|
|
2. |
Capacity – the operating results of the Hadera power plant were negatively impacted in the third quarter of 2023 due to advancement of planned maintenance work in one of the gas turbines. For details regarding partial operations of
the Hadera power plant in the corresponding quarter last year due to maintenance performed in the steam turbine – see Section 5C of the Report of the Board of Directors for the third quarter of 2022.
|
| 5. |
Results of operations for the three‑month period ended September 30, 2023 (in millions of NIS) (Cont.)
|
|
|
D. |
Analysis of the change in EBITDA after adjusted proportionate consolidation – energy transition segment in the U.S.
|
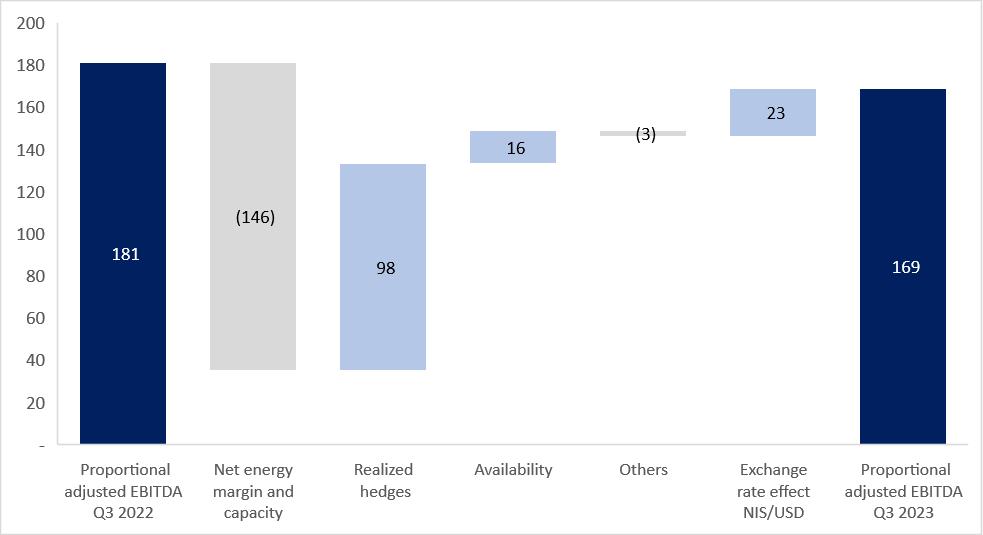
|
|
1. |
Energy margin and capacity payments – as stated in Section 3.3H above, in the third quarter of 2023 there was a decrease in the energy margins, compared with the corresponding quarter last year, and correspondingly there was a
decline, in the amount of about NIS 146 million, in the electricity margins of the CPV Group (on the assumption of full capacity).
|
|
|
2. |
Energy hedges – the said decrease in the electricity margins in some of the power plants was offset, in the amount of about NIS 98 million, compared with the corresponding quarter last year, mainly due to hedges made in the past that
were realized at a loss of about NIS 92 million in the corresponding quarter last year. For details regarding energy hedges for the balance of 2023 and 2024 – see Section 4E above.
|
|
|
3. |
Availability – most of the increase stems from unplanned maintenance work at the Fairview power plant that was performed in the corresponding quarter last year.
|
| 5. |
Results of operations for the three‑month period ended September 30, 2023 (in millions of NIS) (Cont.)
|
|
|
E. |
Analysis of the change in net income
|
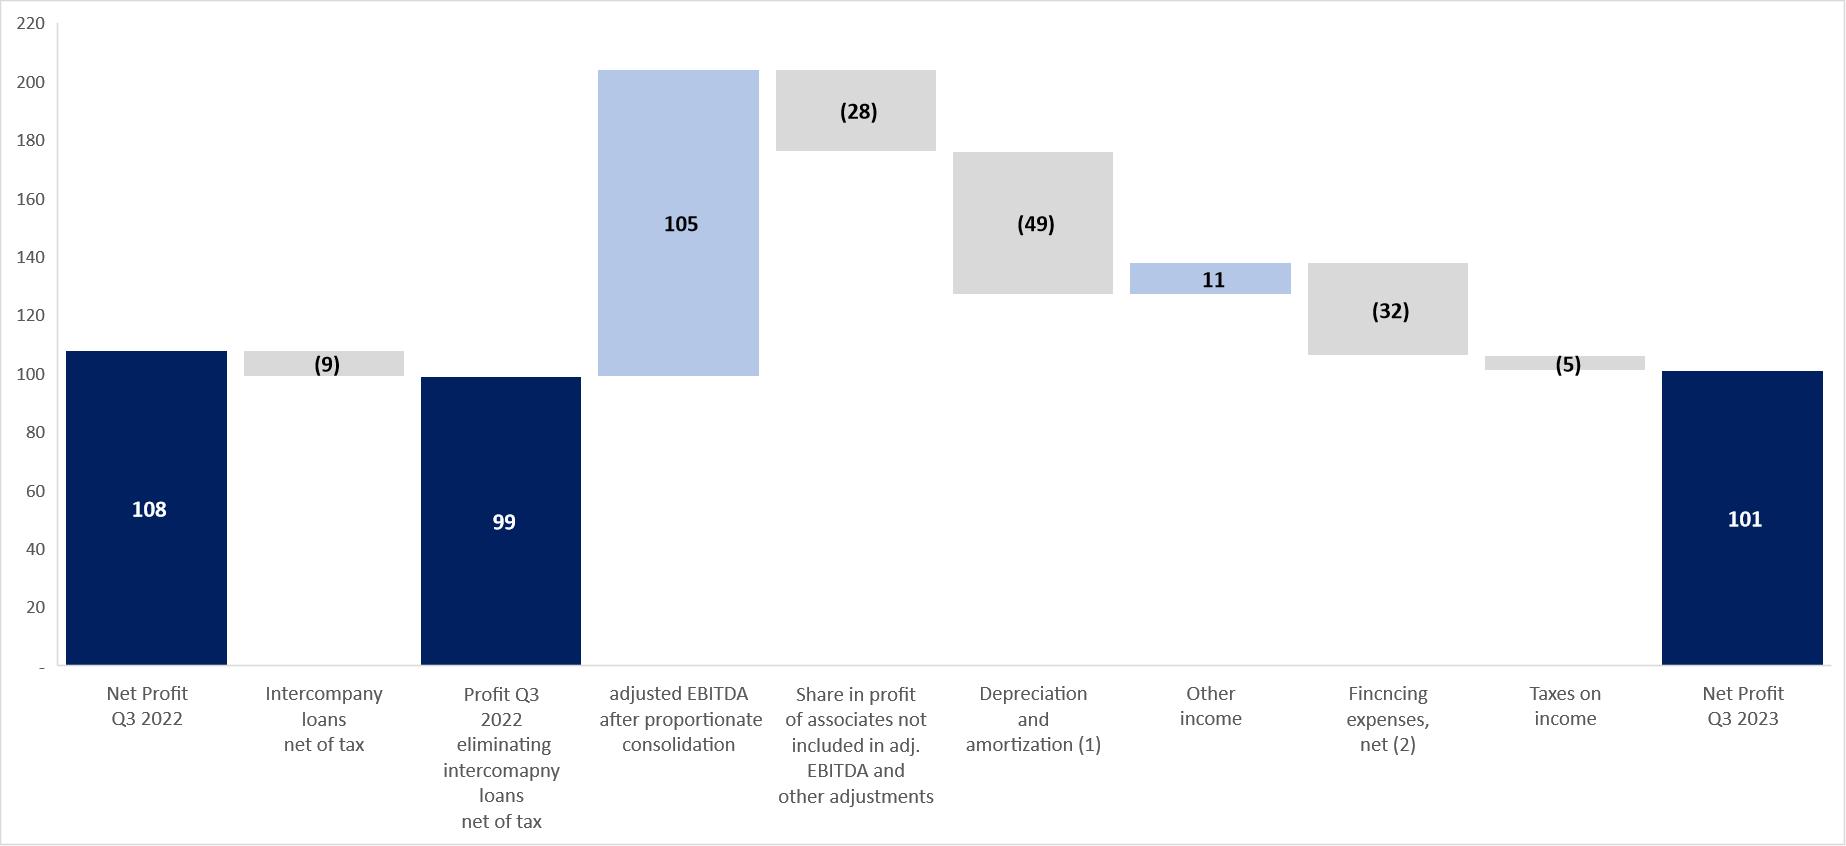
|
|
(1) |
Most of the increase stems from depreciation expenses of the Gat (about NIS 13 million) and Mountain Wind (about NIS 5 million) power plants which were consolidated for the first time in the second quarter of 2023, and the commercial
operation of the Zomet power plant (about NIS 15 million) that took place in the second quarter of 2023.
|
|
|
(2) |
Most of the increase stems from financing expenses relating to acquisition of the Gat power plant, in the amount of about NIS 8 million, acquisition of the Mountain Wind power plant, in the amount of about NIS 4 million, and the commercial
operation of the Zomet power plant, in the amount of about NIS 22 million.
|
| 5. |
Results of operations for the three‑month period ended September 30, 2023 (in millions of NIS) (Cont.)
|
|
|
F. |
Adjustments to EBITDA and net income
|
|
For the three months ended
|
|||||||||
|
Section
|
September 30
|
Board’s explanations
|
|||||||
|
2023
|
2022
|
||||||||
|
Change in the fair value of derivative financial instruments (which are presented as part of the Company’s share of income of associated companies in the U.S.)
|
(1
|
)
|
(12
|
)
|
Represents the change in the fair value of derivative financial instruments that are used in programs for hedging electricity margins of the natural
gas segment in the U.S. that were not designated for hedging, as described in Section D above.
|
||||
|
Net expenses, not in the ordinary course of business and/or of a non‑recurring natures
|
–
|
2
|
In the period of the report and in the corresponding quarter last year, represents activities in respect of a test run and the Company’s preparations
for the commercial operation of the Zomet Power Plant at the end of June 2023.
|
||||||
|
Total adjustments to EBITDA after proportionate consolidation
|
(1
|
)
|
(10
|
)
|
|||||
|
Income from exchange rate differences in respect of
intercompany loans (*)
|
–
|
(12
|
)
|
||||||
|
Tax impact in respect of the adjustments
|
–
|
4
|
|||||||
|
Total adjustments to the income for the period
|
(1
|
)
|
(18
|
)
|
|||||
| (*) |
For purposes of improving the comparability between the periods with respect to the adjusted net income data, the Company made a reconciliation to the net income in the nine months and three months ended on September 30, 2022 in respect of
income that is not cash flow income from exchange rate differences from revaluation of intercompany loans that occurred from October 1, 2022 that were classified as part of the Group’s net investment in the U.S. and exchange rate differences in
respect thereof are recorded, commencing from that date, to other comprehensive income as part of the translation reserve.
|
| 5. |
Results of operations for the three‑month period ended September 30, 2023 (in millions of NIS) (Cont.)
|
|
|
G. |
Detail generation (in millions of kilowatt/hours)
|
|
For the three months ended September 30, 2023
|
For the three months ended September 30, 2022
|
|||||||||||||||||||||||||||||||||||
|
Potential
|
Net
|
Actual
|
Actual
|
Potential
|
Net
|
Actual
|
Actual
|
|||||||||||||||||||||||||||||
|
electricity
|
electricity
|
generation
|
availability
|
electricity
|
electricity
|
generation
|
availability
|
|||||||||||||||||||||||||||||
|
Capacity
|
generation
|
generation
|
percentage
|
percentage
|
generation
|
generation
|
percentage
|
percentage
|
||||||||||||||||||||||||||||
|
(MW)
|
(GWh)(1)
|
(GWh)(2)
|
(%)(3)
|
(%)
|
(GWh)
|
(GWh)
|
(%)
|
(%)
|
||||||||||||||||||||||||||||
|
Rotem
|
466
|
917
|
907
|
98.9
|
%
|
100
|
%
|
925
|
924
|
99.9
|
%
|
100
|
%
|
|||||||||||||||||||||||
|
Hadera
|
144
|
249
|
193
|
77.8
|
%
|
77.8
|
%
|
250
|
184
|
73.6
|
%
|
73.6
|
%
|
|||||||||||||||||||||||
|
Gat
|
75
|
155
|
152
|
98.0
|
%
|
100
|
%
|
|||||||||||||||||||||||||||||
|
Zomet
|
396
|
835
|
247
|
29.6
|
%
|
89.4
|
%
|
|||||||||||||||||||||||||||||
|
For the three months ended September 30, 2023
|
For the three months ended September 30, 2022
|
|||||||||||||||||||||||||||||||||||
|
Potential
|
Net
|
Actual
|
Actual
|
Potential
|
Net
|
Actual
|
Actual
|
|||||||||||||||||||||||||||||
|
electricity
|
electricity
|
generation
|
availability
|
electricity
|
electricity
|
generation
|
availability
|
|||||||||||||||||||||||||||||
|
Capacity
|
generation
|
generation
|
percentage
|
percentage
|
generation
|
generation
|
percentage
|
percentage
|
||||||||||||||||||||||||||||
|
(MW)
|
(GWh)(1)
|
(GWh)(2)
|
(%)(3)
|
(%)
|
(GWh)
|
(GWh)
|
(%)
|
(%)
|
||||||||||||||||||||||||||||
|
Energy transition projects (natural gas)
|
||||||||||||||||||||||||||||||||||||
|
Fairview
|
1,050
|
2,368
|
2,060
|
93.5
|
%
|
99.3
|
%
|
2,376
|
1,931
|
87.6
|
%
|
88.0
|
%
|
|||||||||||||||||||||||
|
Towantic
|
805
|
1,775
|
1,539
|
88.2
|
%
|
98.6
|
%
|
1,780
|
1,611
|
91.8
|
%
|
99.9
|
%
|
|||||||||||||||||||||||
|
Maryland
|
745
|
1,656
|
885
|
55.6
|
%
|
89.4
|
%
|
1,656
|
1,067
|
66.5
|
%
|
99.4
|
%
|
|||||||||||||||||||||||
|
Shore
|
725
|
1,571
|
1,218
|
77.5
|
%
|
97.9
|
%
|
1,576
|
1,365
|
86.6
|
%
|
100.0
|
%
|
|||||||||||||||||||||||
|
Valley
|
720
|
1,657
|
1,394
|
94.3
|
%
|
97.9
|
%
|
1,549
|
1,241
|
83.6
|
%
|
91.3
|
%
|
|||||||||||||||||||||||
|
Three
Rivers
|
1,258
|
1,524
|
1,055
|
61.3
|
%
|
68.7
|
%
|
–
|
–
|
–
|
–
|
|||||||||||||||||||||||||
|
Renewable energy projects
|
||||||||||||||||||||||||||||||||||||
|
Keenan II
|
152
|
328
|
72
|
21.4
|
%
|
88.1
|
%
|
335
|
82
|
24.5
|
%
|
92.7
|
%
|
|||||||||||||||||||||||
|
Mountain
Wind
|
82
|
180
|
31
|
17.2
|
%
|
90.0
|
%
|
–
|
–
|
–
|
–
|
|||||||||||||||||||||||||
| (*) |
Regarding the planned maintenance – see Sections 5C(2) and 5D(3) above and Section 8.8 of the Company’s Periodic Report for 2022.
|
|
6.
|
Initiation and Construction Projects
|
|
|
1. |
Main details with reference to construction projects in Israel (held at 100% ownership by OPC Israel, which is 80% held by the Company)37:
|
|
Total
|
||||||||||||||||
|
construction
|
||||||||||||||||
|
Power
|
Date/
|
Total
|
cost
|
|||||||||||||
|
plants/
|
expectation
|
expected
|
as at
|
|||||||||||||
|
facilities
|
of the start
|
construction
|
September 30,
|
|||||||||||||
|
for
|
of the
|
Main
|
cost
|
2023
|
||||||||||||
|
generation
|
Capacity
|
commercial
|
customer/
|
(NIS
|
(NIS
|
|||||||||||
|
of energy
|
Status
|
(megawatts)
|
Location
|
Technology
|
operation
|
consumer
|
millions)
|
millions)
|
||||||||
|
OPC Sorek 2 Ltd. (“Sorek 2”)
|
Under construction
|
≈ 87
|
On the premises of the Sorek B seawater desalination facility
|
Powered by natural gas, cogeneration
|
The first half of 202438
|
Yard consumers and the System Operator
|
≈ 200
|
≈ 123
|
| 37 |
That stated in connection with projects that have not yet reached operation (including generation facilities on the premises of the consumers) including with reference to the expected operation date, the
technologies and/or the anticipated cost of the investment, is “forward‑looking” information, as it is defined in the Securities Law, which is based on, among other things, the Company’s estimates and assumptions as at the approval date of
the report and regarding which there is no certainty it will be realized (in whole or in part). Completion of the said projects (or any one of them) may not occur or may occur in a manner different than that stated above, among other things
due to dependency on various factors, including those that are not under the Company’s control, including assurance of connection to the network and output of electricity from the project sites and/or connection to the infrastructures
(including gas infrastructures), receipt of permits, completion of planning processes and licensing, completion of construction work, final costs in respect of development, construction, equipment and land, the proper functioning of the
equipment and/or the terms of undertakings with main suppliers (including lenders), and there is no certainty they will be fulfilled, the manner of their fulfillment, the extent of their impact or what their final terms will be. Ultimately
technical, operational or other delays and/or breakdowns and/or an increase in expenses could be caused, this being as a result of, among other things, factors as stated above or as a result of occurrence of one or more of the risk factors
the Company is exposed to, including construction risks (including force majeure events and the War and its impacts), regulatory, licensing
or planning risks, macro‑economic changes, delays and increased costs due relating to the supply chain, transport and changes in raw‑material prices and etc. For additional details regarding risk factors – see Section 19 of Part A of the
Periodic Report for 2022. It is further clarified that delays in completion of the above‑mentioned projects beyond the date originally planned for this could impact the ability of the Company and the Group companies to comply with their
obligations to third parties (including by force of guarantees provided), including authorities, conditions of permits, lenders, yard consumers, customers and others, in connection with the projects.
|
|
38
|
It is noted that a delay in the commercial operation beyond the projected contractual date, as detailed in Section 7.15.1.2 of Part A of the Periodic Report for 2022, which is not
considered a justified delay as defined in the project agreements, could trigger payment of monthly compensation at a limited graduated rate (taking into account the length of the delay, where a delay after full utilization of the
compensation ceiling could give rise to a cancellation right). It is clarified that in the initial delay period, the amount of the compensation for an unjustified delay is not material. It is noted that the construction contractor of the
Sorek 2 project delivered a force majeure notification due to the outbreak of the War, and Sorek 2 project delivered on its behalf a force majeure
notification to the initiator of the desalination facility. The construction work, its completion the commercial operation date and the costs involved with the construction could be adversely impacted by the War and/or its impacts. It is
further noted that on November 5, 2023, a hearing of the Electricity Authority was published in connection with extension of the dates, among other things, as part of the arrangement that applies to the project due to the defense (security)
by two months. If passed and subject to the final language, this should permit a postponement of the financial closing date of Sorek 2. As at the approval date of the report, a final decision has not yet been determined.
|
| 6. |
Initiation and Construction Projects (Cont.)
|
|
|
1. |
Main details with reference to construction projects in Israel (held at 100% ownership by OPC Israel, which is 80% held by the Company)31: (Cont.)
|
|
Total
|
||||||||||||||||
|
construction
|
||||||||||||||||
|
Power
|
Date/
|
Total
|
cost
|
|||||||||||||
|
plants/
|
expectation
|
expected
|
as at
|
|||||||||||||
|
facilities
|
of the start
|
construction
|
September 30,
|
|||||||||||||
|
for
|
of the
|
Main
|
cost
|
2023
|
||||||||||||
|
generation
|
Capacity
|
commercial
|
customer/
|
(NIS
|
(NIS
|
|||||||||||
|
of energy
|
Status
|
(megawatts)
|
Location
|
Technology
|
operation
|
consumer
|
millions)
|
millions)
|
||||||||
|
Facilities for generation of energy located on the consumer’s premises
|
In various stages of development / construction
|
Projects in operation: about 11, projects under construction: about about 33, projects in advanced development: about 65. The Company intends to act to expand projects with a cumulative scope
of at least 12039
|
On the premises of consumers throughout Israel
|
Natural gas and renewable energy (solar, storage)
|
Regarding projects under construction, gradually starting from the second half of 2023 and up to the end of 2025
|
Yard consumers and the System Operator.
|
An average of about NIS 4 per megawatt
|
≈ 150
|
| 6. |
Initiation and Construction Projects (Cont.)
|
| 2. |
Main details regarding construction projects in the area of renewable energy using solar technology in the U.S. (held 100% by the CPV Group)40
|
| 6. |
Initiation and Construction Projects (Cont.)
|
|
|
2. |
Main details regarding construction projects in the area of renewable energy using solar technology in the U.S. (held 100% by the CPV Group)37
|
|
Project
|
Capacity
(megawatts)
|
Location
|
Expected
commercial
operation
date
|
Commercial
structure
|
Regulated
market
after
the PPA
period
|
Total
expected
construction
cost net41
for 100%
of the project
(NIS
billions)
|
Tax
equity
(NIS
millions)
|
Total
construction
cost
as at
September 30,
2023
(NIS
billions)
|
Expectation for a full calendar year
in the period of the PPA agreements
|
|||||||||||||
|
Cash flows
|
||||||||||||||||||||||
|
after tax
|
||||||||||||||||||||||
|
Revenues
|
EBITDA
|
partner
|
||||||||||||||||||||
|
(NIS
|
(NIS
|
(NIS
|
||||||||||||||||||||
|
millions)
|
millions)
|
millions)
|
||||||||||||||||||||
|
CPV Maple Hill Solar LLC (“Maple Hill”).
|
126 MWdc
|
Pennsyl-vania
|
As at the approval date of the report, construction of the project had been completed42
|
Long-term PPA.
green certificates43
|
PJM market PA + MAAC SRECs
|
≈ 0.69
(≈ $0.18 billion)
|
≈ 298
(≈ $78 million)44
|
≈ 0.65
(≈ $0.17 billion)
|
≈ 48
(≈ $13 million)
|
≈ 37
(≈ $10 million)
|
≈ 30
(≈ $8 million)
|
|||||||||||
|
41
|
Not including initiation fees and reimbursement of pre‑construction development expenses to the CPV Group. In projects that are entitled to tax benefits of the ITC type, the Company’s
estimate regarding the scope of the investment of the tax partner also includes the initiation fees and reimbursement of the development expenses on the basis of calculations that are customary in agreements with tax partners. The expected
cost of the investment in the project is subject to changes as a result of, among other things, the final costs involved with supply of the solar panels, the construction work and/or the connection.
|
|
42
|
As at the approval date of the report, the project had been substantially completed, although the investment of the project’s tax partner had not yet
been received in full.
|
|
43
|
About half of the electricity is under a long-term PPA agreement, including hedging of the electricity price with a fixed price, in effect up to 2033, and an undertaking with an international
energy company for sale of 100% of the project’s green certificates, in effect up to 2027.
|
|
44
|
For additional details – see Note 7A(3) to the Interim Statements.
|
| 6. |
Initiation and Construction Projects (Cont.)
|
|
|
2. |
Main details regarding construction projects in the area of renewable energy using solar technology in the U.S. (held 100% by the CPV Group)37
|
|
Project
|
Capacity
(megawatts)
|
Location
|
Expected
commercial
operation
date
|
Commercial
structure
|
Regulated
market
after
the PPA
period
|
Total
expected
construction
cost net38
for 100%
of the project
(NIS
billions)
|
Tax
equity
(NIS
millions)
|
Total
construction
cost
as at
September 30,
2023
(NIS
billions)
|
Expectation for a full calendar year
in the period of the PPA agreements
|
|||||||||||||
|
Cash flows
|
||||||||||||||||||||||
|
after tax
|
||||||||||||||||||||||
|
Revenues
|
EBITDA
|
partner
|
||||||||||||||||||||
|
(NIS
|
(NIS
|
(NIS
|
||||||||||||||||||||
|
millions)
|
millions)
|
millions)
|
||||||||||||||||||||
|
CPV Stagecoach Solar, LLC (“Stagecoach”).
|
100 MWdc
|
Georgia
|
First half of 2024
|
Long-term PPA (including
green certificates)45
|
SERC
|
≈ 0.42
(≈ $0.11 billion)
|
≈ 203
(≈ $53 million)46
|
≈ 0.24
(≈ $0.06 billion)
|
≈ 24
(≈ $7 million)
|
≈ 17
(≈ $5 million)
|
≈ 17
(≈ $5 million
|
|||||||||||
|
45
|
The project signed an electricity supply agreement with a local utility company for a period of 30 years from the start of the commercial operation for supply of all the electricity expected
to be generated by the project in the said period. In addition, the project contracted with a global company for sale of 100% of the solar renewable energy certificates and hedge of the electricity price with a fixed price for a period of 20
years from the start of the commercial operation.
|
|
46
|
In the estimation of the CPV Group, the project is expected to sign an agreement with a tax partner in a PTC format, where the amount of about $43 million out of the amount stated is expected
to be received on the commercial operation date of the project and the balance over a period of 10 years. In projects that are entitled to tax benefits of the PTC type, the Company’s estimate regarding the scope of the investment of the tax
partner is based on the provisions of the IRA law and customary calculations in the agreements with the tax partner, a tax benefit for every KW/hr. of generation, and does not depend on the expected cost of the investment (and does not depend
on the initiation fees and reimbursement of pre‑construction development expenses). The estimate of the CPV Group regarding the expectation of contracting with a tax partner, including the PTC format for the
undertaking, is “forward‑looking” information as it is defined in the Securities Law, which is based on data, estimates, assessments and plans of the Company proximate to the publication date of the report. The estimates might not
materialize or might change due to a range of circumstances, including changes in the provisions of the law or regulations and locating a tax partner that will wish to contract with the project, which are not dependent on the Company and
there is no certainty regarding their realization.
|
|
|
2. |
Main details regarding construction projects in the area of renewable energy using solar technology in the U.S. (held 100% by the CPV Group)37
|
|
Project
|
Capacity
(megawatts)
|
Location
|
Expected
commercial
operation
date
|
Commercial
structure
|
Regulated
market
after
the PPA
period
|
Total
expected
construction
cost net37
for 100%
of the project
(NIS
billions)
|
Tax
equity
(NIS
millions)
|
Amount
of the cost
of the
investment
September 30,
2023
(NIS
billions)
|
Expectation for a full calendar year
in the period of the PPA agreements
|
|||||||||||||
|
Cash flows
|
||||||||||||||||||||||
|
after tax
|
||||||||||||||||||||||
|
Revenues
|
EBITDA
|
partner
|
||||||||||||||||||||
|
(NIS
|
(NIS
|
(NIS
|
||||||||||||||||||||
|
millions)
|
millions)
|
millions)
|
||||||||||||||||||||
|
CPV Backbone Solar, LLC (“Backbone”).
|
170 MWdc
|
Maryland
|
Second half of 2025
|
Long-term PPA47 (including green certificates) |
PJM + MD SRECs
|
≈ 1.07
(≈ $0.28 billion)
|
≈ 478
(≈ 125 million)48
|
≈ 0.24
(≈ $0.06 billion)
|
≈ 66
(≈ $18 million)
|
≈ 45
(≈ $13 million)
|
≈ 35
(≈ $10 million)
|
|||||||||||
|
47
|
The project has signed a connection agreement and electricity supply agreement with the global e‑commerce company for a period of 10 years from the start of the commercial operation, for
supply of 90% of the electricity expected to be generated by the project in the said period, and sale of solar renewable energy certificates, which is valid up to 2035. The balance of the project’s capacity (10%) will be used for supply to
active customers, retail supply of electricity of the CPV Group or for sale in the market.
|
|
48
|
The project is located on a former coal mine and, therefore, it is expected to be entitled to enlarged tax benefits of 40% in accordance with the IRA Law. The CPV Group intends to act to sign
an agreement with a tax partner (Equity Tax) in respect of about 40% of the cost of the project and use of the tax credits that are available to the project (subject to appropriate regulatory arrangements), such that the net cost of the
investment is estimated as about NIS 0.5 billion. The intention of the CPV Group to sign an agreement with a tax partner (equity tax), including the scope thereof and/or the scope of the tax benefits,
includes “forward‑looking” information as it is defined in the Securities Law, which based on estimates, assessments and plans of the CPV Group proximate to the date of the report and regarding which there is no certainty they will
materialize (in whole or in part). The said estimates and assessment might not materialize or might change due to a range of circumstances, including changes in the provisions of the law or regulations and locating a tax partner that will
wish to contract with the project, which are not dependent on the Company and there is no certainty regarding their realization.
|
| 6. |
Initiation and Construction Projects (Cont.)
|
|
Technology
|
Advanced50
|
Early stage
|
Total*
|
|||||||||
|
Solar51
|
1,600
|
1,050
|
2,650
|
|||||||||
|
Wind (1)
|
100
|
1,150
|
1,250
|
|||||||||
|
Total renewable energy
|
1,700
|
2,200
|
3,900
|
|||||||||
|
Carbon capture projects (natural gas
|
||||||||||||
|
with reduced emissions) (2)
|
1,300
|
2,600
|
3,900
|
|||||||||
|
|
* |
It is noted that out of the total of the development projects, as stated above, a scope of about 950 megawatts (of renewable energy) and about 3,400 megawatts (of which about 1,400 megawatts are renewable energy) are in the PJM market in an
advanced stage and in an initial stage, respectively.
|
| 6. |
Initiation and Construction Projects (Cont.)
|
|
|
(1) |
For additional details regarding the Rogue’s Wind project, with a capacity of 114 megawatts, in Pennsylvania, which signed a long‑term PPA agreement, which is in advanced development and the commencement date of its construction is expected
to be in the first half of 2024 – see Section 6A(3) of the Report of the Board of Directors for 2022 and Section 8.14.7 of Part A of the report for 2022. In the estimation of the CPV Group, the expected net cost of the investment in the project
is estimated at about NIS 1.1 billion (about $0.3 billion) and net of the investment of the tax partner about NIS 0.55 billion (about $0.15 billion). The EBITDA for a full calendar year in the period of the project’s PPA agreement is estimated
at about NIS 48 million (about $13 million)52.
|
|
|
(2) |
For additional details regarding development of two power plants with reduced emissions in natural gas that are based on use of advanced technologies for carbon capture – see Section 6A(6) of the Report of the Board of Directors for 2022.
|
|
|
(3) |
Subsequent to the period of the report, the CPV Group has decided not to continue development of a natural gas project having a scope of 650 megawatts, in the advanced stage, mainly due to the desire to focus its attention and resources on
projects having technological feasibility for generation of electricity with a process of low carbon emissions, such as, generation using renewable energy or generation using carbon capture technology, as well as due to economic considerations
relating to the project at the present time.
|
|
Category
|
9/30/2023
|
12/31/2022
|
Board’s Explanations
|
||||||
|
Current Assets
|
|||||||||
|
Cash and cash equivalents
|
915
|
849
|
For additional information – see the Company’s condensed consolidated statements of cash flows in the interim financial statements and Part 8 below.
|
||||||
|
Short-term restricted cash and deposits
|
–
|
125
|
The decrease stems from release of short-term deposits.
|
||||||
|
Short-term deposits and restricted cash
|
62
|
36
|
The increase derives mainly from provision of collaterals in favor of projects under construction in the U.S.
|
||||||
|
Trade receivables and accrued income
|
304
|
260
|
Most of the increase stems from an increase in accrued income in Israel, in the amount of about NIS 16 million, as a result of the consolidation of Gat power plant
commencing from the second quarter of 2023 (for additional details – see Note 6A(1) to the Interim Statements) and an increase of about NIS 19 million due to the commercial operation of Zomet starting from the end of the second quarter of
2023.
|
||||||
|
Receivables and debit balances
|
146
|
190
|
Most of the decrease stems from a decrease, in the amount of about NIS 90 million, in the balance of other receivables and debit balances in the U.S., mainly as a result of release of
collaterals in connection with transactions hedging electricity margins in Valley. On the other hand, there was an increase, in the amount of about NIS 18 million, in respect of the balance of the debt of Energean (for additional details –
see Note 8A(3) to the Interim Statements), and an increase of about NIS 37 million, relating to a receivable balance for a refund of excise tax on diesel oil in Zomet.
|
||||||
|
Inventory
|
8
|
7
|
|||||||
|
Short-term derivative financial instruments
|
16
|
10
|
|||||||
|
Total current assets
|
1,451
|
1,477
|
|||||||
| 7. |
Financial Position as at September 30, 2023 (in millions of NIS) (Cont.)
|
|
Category
|
9/30/2023
|
12/31/2022
|
Board’s Explanations
|
||||||
|
Non-Current Assets
|
|||||||||
|
Long-term deposits and restricted cash
|
59
|
53
|
|||||||
|
Long-term prepaid expenses and other receivable
|
424
|
179
|
Most of the increase stems from a loan granted to an associated company in the U.S., in the amount of about NIS 87 million, as detailed in Note 11 to the Interim Statements, an increase of
about NIS 28 million in deferred financing expenses in respect of loans in the U.S., an increase of about NIS 97 million relating to consideration paid for a tender of Israel Lands Authority for construction of facilities for generation of
electricity using renewable energy in Israel, and an increase in the investment in infrastructures of Zomet, in the amount of about NIS 19 million.
|
||||||
|
Investments in associated companies
|
2,661
|
2,296
|
The increase stems mainly from equity earnings of the CPV Group, in the amount of about NIS 179 million and from an increase in the shekel/dollar exchange rate, in the amount of about NIS 207
million, offset by other comprehensive loss, in the amount of about NIS 27 million. For additional details regarding investments in associated companies – see Sections 4D and 5D above.
|
||||||
|
Deferred tax assets
|
34
|
22
|
|||||||
|
Long-term derivative financial instruments
|
73
|
57
|
|||||||
|
Property, plant and equipment
|
6,306
|
4,324
|
Most of the increase, in the amounts of about NIS 870 million and about NIS 451 million, stems from the initial consolidation of the Gat power plant (for additional details – see Note 6A(1)
to the Interim Statements) and the Mountain Wind project (see Note 6B to the Interim Statements), respectively, an increase deriving from investments in Israel and the U.S. (mainly in construction and development projects), in the amount of
about NIS 208 million and about NIS 462 million, respectively, and an increase of about NIS 124 million, in property, plant and equipment in the U.S. due to an increase in the shekel/dollar exchange rate.
This increase was partly offset by depreciation expenses on property, plant and equipment.
|
||||||
|
Right-of use assets
|
487
|
347
|
The increase derives mainly from lease of land in the U.S. (the Backbone project).
|
||||||
|
Intangible assets
|
1,092
|
777
|
Most of the increase derives from recognition of goodwill, in the amounts of about NIS 85 million and about NIS 75 million, in respect of acquisition of the Gat power plant and the Mountain
Wind project, respectively, recognition of intangible assets in respect of agreements for sale of electricity in the Mountain Wind project, in the amount of about NIS 93 million, and an increase of about NIS 75 million due to the increase in
the shekel/dollar exchange rate.
|
||||||
|
Total non-current assets
|
11,136
|
8,055
|
|||||||
|
Total assets
|
12,587
|
9,532
|
|||||||
| 7. |
Financial Position as at September 30, 2023 (in millions of NIS) (Cont.)
|
|
Category
|
9/30/2023
|
12/31/2022
|
Board’s Explanations
|
||||||
|
Current Liabilities
|
|||||||||
|
Current maturities of loans from banks and financial institutions
|
216
|
92
|
Most of the increase stems from update of the current maturities of the Zomet, Gat and Mountain Wind projects, in the amounts of about NIS 46 million, about NIS 22
million and about NIS 20 million respectively, and an increase of about NIS 24 million relating to receipt of short‑term credit in Zomet.
|
||||||
|
Current maturities of loans from holders of non-controlling interests
|
30
|
13
|
Most of the increase stems from update of the current maturities of the loans based on the Company’s expectation regarding the repayment schedule of the debt from
holders of non‑controlling interests in Rotem.
|
||||||
|
Current maturities of debentures
|
192
|
33
|
The increase stems from update of the current maturities of the debentures based on the repayment schedules.
|
||||||
|
Trade payables
|
436
|
335
|
Most of the increase stems from an increase, in the amount of about NIS 50 million, relating to the gas suppliers in Israel, mainly as a result of timing differences, and an increase of
about NIS 42 million deriving from investments in projects under construction in the U.S.
|
||||||
|
Payables and other credit balances
|
432
|
110
|
Most of the increase derives from deferred consideration in respect of acquisition of the Gat power plant, as detailed in Note 6A(1) to the Interim Statements, in the amount of about
NIS 296 million, and reclassification of current maturities, in the amount of about NIS 30 million, in respect of a liability relating to a profit‑sharing plan for employees of the CPV Group.
|
||||||
|
Short-term derivative financial instruments
|
2
|
3
|
|||||||
|
Current maturities of lease liabilities
|
62
|
61
|
|||||||
|
Current tax liabilities
|
1
|
2
|
|||||||
|
Total current liabilities
|
1,371
|
649
|
|||||||
| 7. |
Financial Position as at September 30, 2023 (in millions of NIS) (Cont.)
|
|
Category
|
9/30/2023
|
12/31/2022
|
Board’s Explanations
|
||||||
|
Non-Current Liabilities
|
|||||||||
|
Long-term loans from banks and financial institutions
|
2,744
|
1,724
|
Most of the increase stems from receipt of long-term loans, in the amounts of about NIS 450 million, for financing acquisition of the Gat power plant (for additional
details – see Notes 6A(1) and 7A(1) to the Interim Statements), about NIS 270 million for financing acquisition of the Mountain Wind project (for additional details – see Notes 6B and 7A(2) to the Interim Statements), and about NIS 223
million for financing projects under construction in the renewable energy segment in the U.S. (for additional details – see Note 7A(4) to the Interim Statements), the amounts of about NIS 173 million and about NIS 51 million relating to
receipt of financing and accrual of interest on the principal in Zomet and an increase of about NIS 44 million relates to an increase in the shekel/dollar exchange rate. This increase was partly offset by repayment of loans, in the amount
of about NIS 76 million, and an increase in current maturities, in the amount of about NIS 100 million.
|
||||||
|
Long-term loans from holders of non-controlling interests
|
396
|
424
|
Most of the decrease stems from a decrease, in the amount of about NIS 122 million, in loans from the holders of non‑controlling interests in Rotem, this being as a
result of repayment and update of the current maturities of the loans. This decrease was partly offset by an increase deriving from an increase in the balance of the long‑term loans from the holders of non‑controlling interests in the CPV
Group, where an increase of about NIS 68 million is in respect of additional loans provided to the Group and accrual of interest to the principal in the period of the report, and an increase of about NIS 28 million due to an increase of the
shekel/dollar exchange rate.
|
||||||
|
Debentures
|
1,647
|
1,807
|
The decrease stems from repayment of debentures, in the amount of about NIS 31 million, and update of current maturities, in the amount of about
NIS 159 million. On the other hand, there was an increase deriving from linkage differences in respect of the debentures (Series B), in the amount of about NIS 32 million.
|
||||||
|
Long-term lease liabilities
|
217
|
69
|
Most of the increase stems from lease of land in the Backbone project, in the amount of about NIS 122 million (against a right‑of‑use asset), and a lease agreement for offices in the U.S., in
the amount of about NIS 15 million, recognized against a right‑of‑use asset.
|
||||||
|
Other long-term liabilities
|
157
|
146
|
|||||||
|
Liabilities for deferred taxes
|
525
|
347
|
Most of the increase, in the amount of about NIS 110 million, stems from the initial consolidation of the Gat power plant (for additional details – see Note 6A(1) to the Interim Statements)
and an increase of about NIS 59 million stemming from update of the deferred taxes as a result of timing differences in Israel.
|
||||||
|
Total non-current liabilities
|
5,686
|
4,517
|
|||||||
|
Total liabilities
|
7,057
|
5,166
|
|||||||
|
For the
|
|||||||||
|
Nine Months Ended
|
|||||||||
|
Category
|
9/30/2023
|
9/30/2022
|
Board’s Explanations
|
||||||
|
Cash flows provided by operating activities
|
443
|
271
|
Most of the increase in the cash flows provided by operating activities stems from an increase in cash‑basis income, in the amount of about NIS 152 million, and an
increase in the Group’s working capital, in the amount of about NIS 18 million.
|
||||||
|
Cash flows used in investing activities
|
(1,607
|
)
|
(790
|
)
|
Most of the increase in the cash used in investing activities in the period of the report stems from acquisition of the Gat power plant, for a consideration of about
NIS 268 million (for additional details – see Note 6A(1) of the Interim Statements), and the Mountain Wind project, for a consideration of about NIS 625 million (for additional details – see Note 6B of the Interim Statements). In addition,
the investments in property, plant and equipment in the U.S. increased by about NIS 228 million and the Company provided a loan to an associated company in the U.S., in the amount of about NIS 87 million. On the other hand, cash was
provided to the Group, in the amount of about NIS 125 million, relating to the release of short‑term deposits, and there was an increase of about NIS 158 million, in respect of release of collaterals, net, relating to hedging electricity
margins in the CPV Group. In addition, there was a decrease, in the amount of about NIS 106 million, in investments in property, plant and equipment in Israel, main in connection with commercial operation of Zomet at the end of the second
quarter of 2023.
|
||||
|
Cash flows provided by financing activities
|
1,187
|
972
|
Most of the increase in the cash flows provided by financing activities stems from a receipt in the period of the report, in the amount of about NIS 452 million, in respect of a swap of
shares of transaction and investment with Veridis (for additional details – see Note 6A(2) of the Interim Statements), long‑term loans, in the amounts of about NIS 450 million and about NIS 270 million, for purposes of financing a transaction
for acquisition of the Gat power plant and a transaction for acquisition of the Mountain Wind project, respectively, taking out of a long‑term loan, in the amount of about NIS 223 million, for financing construction of projects in the
renewable energy segment in the U.S. (for additional details – see Note 7A(4) to the Interim Statements), and from an increase of about NIS 184 million, in investments and loans from holders of non‑controlling interests (in the CPV Group and
Veridis). On the other hand, in the period of the report the Group repaid a loan to the prior holders of the rights in the Gat power plant, in the amount of about NIS 303 million (for additional details – see Note 6A(1) of the Interim
Statements), there was an increase, in the amount of about NIS 74 million, in repayments of Rotem to the holders of non‑controlling interests, an increase of about NIS 61 million in costs paid in advance in respect of loans (mainly relating
to loans in the U.S.) and, in addition, there was a decrease, in the amount of about NIS 56 million, in respect of withdrawals from Zomet’s financing agreement framework. Furthermore, in 2022 the Group raised about NIS 815 million, resulting
from an issuance of shares.
|
||||||
| 8. |
Liquidity and sources of financing (in NIS millions)
|
|
For the
|
|||||||||
|
Three Months Ended
|
|||||||||
|
Category
|
9/30/2023
|
9/30/2022
|
Board’s Explanations
|
||||||
|
Cash flows provided by operating activities
|
283
|
175
|
Most of the increase in the cash flows provided by operating activities stems from an increase in income on a cash basis, in the amount of about NIS 113 million, offset
by a decrease in the Group’s working capital, in the amount of about NIS 8 million.
|
||||||
|
Cash flows used in investing activities
|
(291
|
)
|
(253
|
)
|
Most of the increase in the cash flows used in investing activities stems from the fact that during the third quarter there was an increase in the investments in
property, plant and equipment in the U.S. increased by about NIS 123 million. On the other hand, collaterals were released, in the amount of about NIS 85 million, net, in connection with hedging of electricity margins in the CPV Group.
|
||||
|
Cash flows provided by financing activities
|
98
|
778
|
Most of the decrease in the cash flows provided by financing activities stems from raising of capital, in the amount of about NIS 815 million, in the corresponding quarter last year, and an
increase of about NIS 48 million in costs paid in advance in respect of loans (mainly in respect of loans in the U.S.). On the other hand, in the third quarter of 2023 the Group took out a long‑term loan, in the amount of about NIS 223
million, for financing projects under construction in the renewable energy segment in the U.S. (for additional details – see Note 7A(4) to the Interim Statements).
|
||||||
| 9. |
Adjusted financial debt, net
|
|
|
A. |
Compositions of the adjusted financial debt, net
|
|
|
Cash and cash
|
|||||||||||||||||||||
|
|
Method of
|
equivalents
|
||||||||||||||||||||
|
|
presentation
|
Gross debt
|
and deposits
|
|||||||||||||||||||
|
|
in the
|
Debt
|
Weighted-
|
Final
|
(including
|
|||||||||||||||||
|
|
Company’s
|
(including
|
average
|
repayment
|
restricted cash
|
|||||||||||||||||
|
|
financial
|
interest
|
interest
|
date of
|
used for debt
|
Net
|
||||||||||||||||
|
Name of project
|
statements
|
payable)
|
rate
|
the loan
|
service) (1)
|
debt
|
||||||||||||||||
|
Rotem
|
Consolidated
|
–
|
–
|
–
|
32
|
(32
|
)
|
|||||||||||||||
|
Hadera
|
Consolidated
|
652
|
4.9
|
%
|
2037
|
89
|
563
|
|||||||||||||||
|
Zomet
|
Consolidated
|
1,075
|
7.2
|
%
|
2042
|
55
|
1,020
|
|||||||||||||||
|
Gat
|
Consolidated
|
438
|
6.9
|
%
|
2039
|
17
|
421
|
|||||||||||||||
|
Headquarters and others – Israel (2)
|
Consolidated
|
–
|
47
|
(47
|
)
|
|||||||||||||||||
|
Total Israel
|
2,165
|
6.4
|
%
|
240
|
1,925
|
|||||||||||||||||
|
Keenan
|
Consolidated
|
317
|
3.5
|
%
|
2030
|
13
|
304
|
|||||||||||||||
|
Mountain Wind
|
Consolidated
|
268
|
5.4
|
%
|
2028
|
4
|
264
|
|||||||||||||||
|
Financing construction projects (5)
|
Consolidated
|
210
|
7.9
|
%
|
2026
|
–
|
210
|
|||||||||||||||
|
Total renewable energy
|
795
|
5.3
|
%
|
17
|
778
|
|||||||||||||||||
|
Fairview (Cash Sweep 100%)
|
Associate 25%
|
368
|
5.6
|
%
|
2025
|
24
|
344
|
|||||||||||||||
|
Towantic (Cash Sweep 100%)
|
Associate 26%
|
389
|
5.7
|
%
|
2025
|
7
|
382
|
|||||||||||||||
|
Maryland (3) (Cash Sweep 100%)
|
Associate 25%
|
316
|
6.9
|
%
|
2028
|
3
|
313
|
|||||||||||||||
|
Shore (3) (Cash Sweep 75%)
|
Associate 37.5%
|
644
|
6.9
|
%
|
2025
|
7
|
637
|
|||||||||||||||
|
Valley (4) (Cash Sweep 100%)
|
Associate 50%
|
748
|
10.8
|
%
|
2026
|
17
|
731
|
|||||||||||||||
|
Three Rivers
|
Associate 10%
|
296
|
5.3
|
%
|
2028
|
2
|
294
|
|||||||||||||||
|
Total energy transition54
|
2,761
|
7.4
|
%
|
60
|
2,701
|
|||||||||||||||||
|
Headquarters and others – U.S.
|
Consolidated
|
–
|
–
|
–
|
171
|
(171
|
)
|
|||||||||||||||
|
Total U.S.
|
3,556
|
248
|
3,308
|
|||||||||||||||||||
|
Total Energy headquarters (6)
|
1,841
|
2.5%–2.75%
(weighted-average
2.6%)55
|
538
|
1,303
|
||||||||||||||||||
|
Total
|
7,562
|
1,026
|
6,536
|
|||||||||||||||||||
| (1) |
Includes restricted cash (a debt service reserve in Hadera), in the amount of about NIS 51 million.
|
| (2) |
Includes mainly balances of cash and cash equivalents in OPC Israel Holdings and OPC Power Plants.
|
| (3) |
As part of the financial agreements, an historical debt‑service coverage ratio financial covenant of 1:1 during the last four quarters was determined for Shore and Maryland. As at the date of the financial statements, Maryland and Shore are
in compliance with the covenant (2.84 and 1.11, respectively). Subsequent to the date of the report, the credit frameworks accompanying the Shore project were extended up to March 31, 2025.
|
| (4) |
For details regarding signing of an amendment and extension agreement with respect to the financing agreement of Valley on June 28, 2023 – see Note 11 to the Interim Statements. The balance in the above table does not include subordinated
shareholders’ loans.
|
| (5) |
For details regarding signing in the third quarter of 2023 of an agreement for financing projects under construction in the renewable energy segment in the U.S. – see Note 7A(4 ) to the Interim Statements.
|
| (6) |
Includes balances of debt and cash in the Company and cash in ICG Energy Inc. (available for use for all the Group’s needs).
|
| 9. |
Adjusted financial debt, net (Cont.)
|
|
Cash
|
||||||||||||||||
|
and cash
|
||||||||||||||||
|
Method of
|
equivalents
|
|||||||||||||||
|
presentation
|
and deposits
|
|||||||||||||||
|
in the
|
Debt
|
(including
|
||||||||||||||
|
Company’s
|
(including
|
restricted cash
|
||||||||||||||
|
financial
|
interest
|
used for
|
Net
|
|||||||||||||
|
statements
|
payable)
|
debt service)
|
debt
|
|||||||||||||
|
|
||||||||||||||||
|
Rotem
|
Consolidated
|
–
|
25
|
(25
|
)
|
|||||||||||
|
Hadera
|
Consolidated
|
670
|
58
|
612
|
||||||||||||
|
Zomet
|
Consolidated
|
833
|
9
|
824
|
||||||||||||
|
Headquarters and others in Israel
|
Consolidated
|
4
|
107
|
(103
|
)
|
|||||||||||
|
Total Israel
|
1,507
|
199
|
1,308
|
|||||||||||||
|
Keenan
|
Consolidated
|
310
|
3
|
307
|
||||||||||||
|
Maple Hill
|
Consolidated
|
–
|
11
|
(11
|
)
|
|||||||||||
|
Total renewable energy
|
310
|
14
|
296
|
|||||||||||||
|
Fairview
|
Associate
|
442
|
1
|
441
|
||||||||||||
|
Towantic
|
Associate
|
509
|
39
|
470
|
||||||||||||
|
Maryland
|
Associate
|
300
|
6
|
294
|
||||||||||||
|
Shore
|
Associate
|
607
|
16
|
591
|
||||||||||||
|
Valley
|
Associate
|
895
|
2
|
893
|
||||||||||||
|
Three Rivers
|
Associate
|
290
|
–
|
290
|
||||||||||||
|
Total energy transition
|
3,043
|
64
|
2,979
|
|||||||||||||
|
Headquarters and others in the U.S.
|
Consolidated
|
–
|
226
|
(226
|
)
|
|||||||||||
|
Total U.S.
|
3,353
|
304
|
3,049
|
|||||||||||||
|
Total Energy headquarters
|
1,854
|
586
|
1,268
|
|||||||||||||
|
Total Company
|
6,714
|
1,089
|
5,625
|
|||||||||||||
|
|
A. |
Compositions of the adjusted financial debt, net (Cont.)
|
|
Cash and cash
|
||||||||||||||||
|
Method of
|
equivalents
|
|||||||||||||||
|
presentation
|
and deposits
|
|||||||||||||||
|
in the
|
Debt
|
(including
|
||||||||||||||
|
Company’s
|
(including
|
restricted cash
|
||||||||||||||
|
financial
|
interest
|
used for
|
Net
|
|||||||||||||
|
statements
|
payable)
|
debt service)
|
debt
|
|||||||||||||
|
|
||||||||||||||||
|
Rotem
|
Consolidated
|
–
|
38
|
(38
|
)
|
|||||||||||
|
Hadera
|
Consolidated
|
675
|
81
|
594
|
||||||||||||
|
Zomet
|
Consolidated
|
789
|
26
|
763
|
||||||||||||
|
Headquarters and others in Israel
|
Consolidated
|
4
|
103
|
(99
|
)
|
|||||||||||
|
Total Israel
|
1,468
|
248
|
1,220
|
|||||||||||||
|
Keenan
|
Consolidated
|
318
|
3
|
315
|
||||||||||||
|
Maple Hill
|
Consolidated
|
–
|
8
|
(8
|
)
|
|||||||||||
|
Total renewable energy
|
318
|
11
|
307
|
|||||||||||||
|
Fairview
|
Associate
|
472
|
2
|
470
|
||||||||||||
|
Towantic
|
Associate
|
523
|
27
|
496
|
||||||||||||
|
Maryland
|
Associate
|
311
|
1
|
310
|
||||||||||||
|
Shore
|
Associate
|
611
|
14
|
597
|
||||||||||||
|
Valley
|
Associate
|
917
|
11
|
906
|
||||||||||||
|
Three Rivers
|
Associate
|
278
|
–
|
278
|
||||||||||||
|
Total energy transition
|
3,112
|
55
|
3,057
|
|||||||||||||
|
Headquarters and others in the U.S.
|
Consolidated
|
–
|
167
|
(167
|
)
|
|||||||||||
|
Total U.S.
|
3,430
|
233
|
3,197
|
|||||||||||||
|
Total Energy headquarters
|
Consolidated
|
1,834
|
837
|
997
|
||||||||||||
|
Total
|
6,732
|
1,318
|
5,414
|
|||||||||||||
|
|
B. |
Interest and linkage bases
|
|
|
C. |
Financial covenants
|
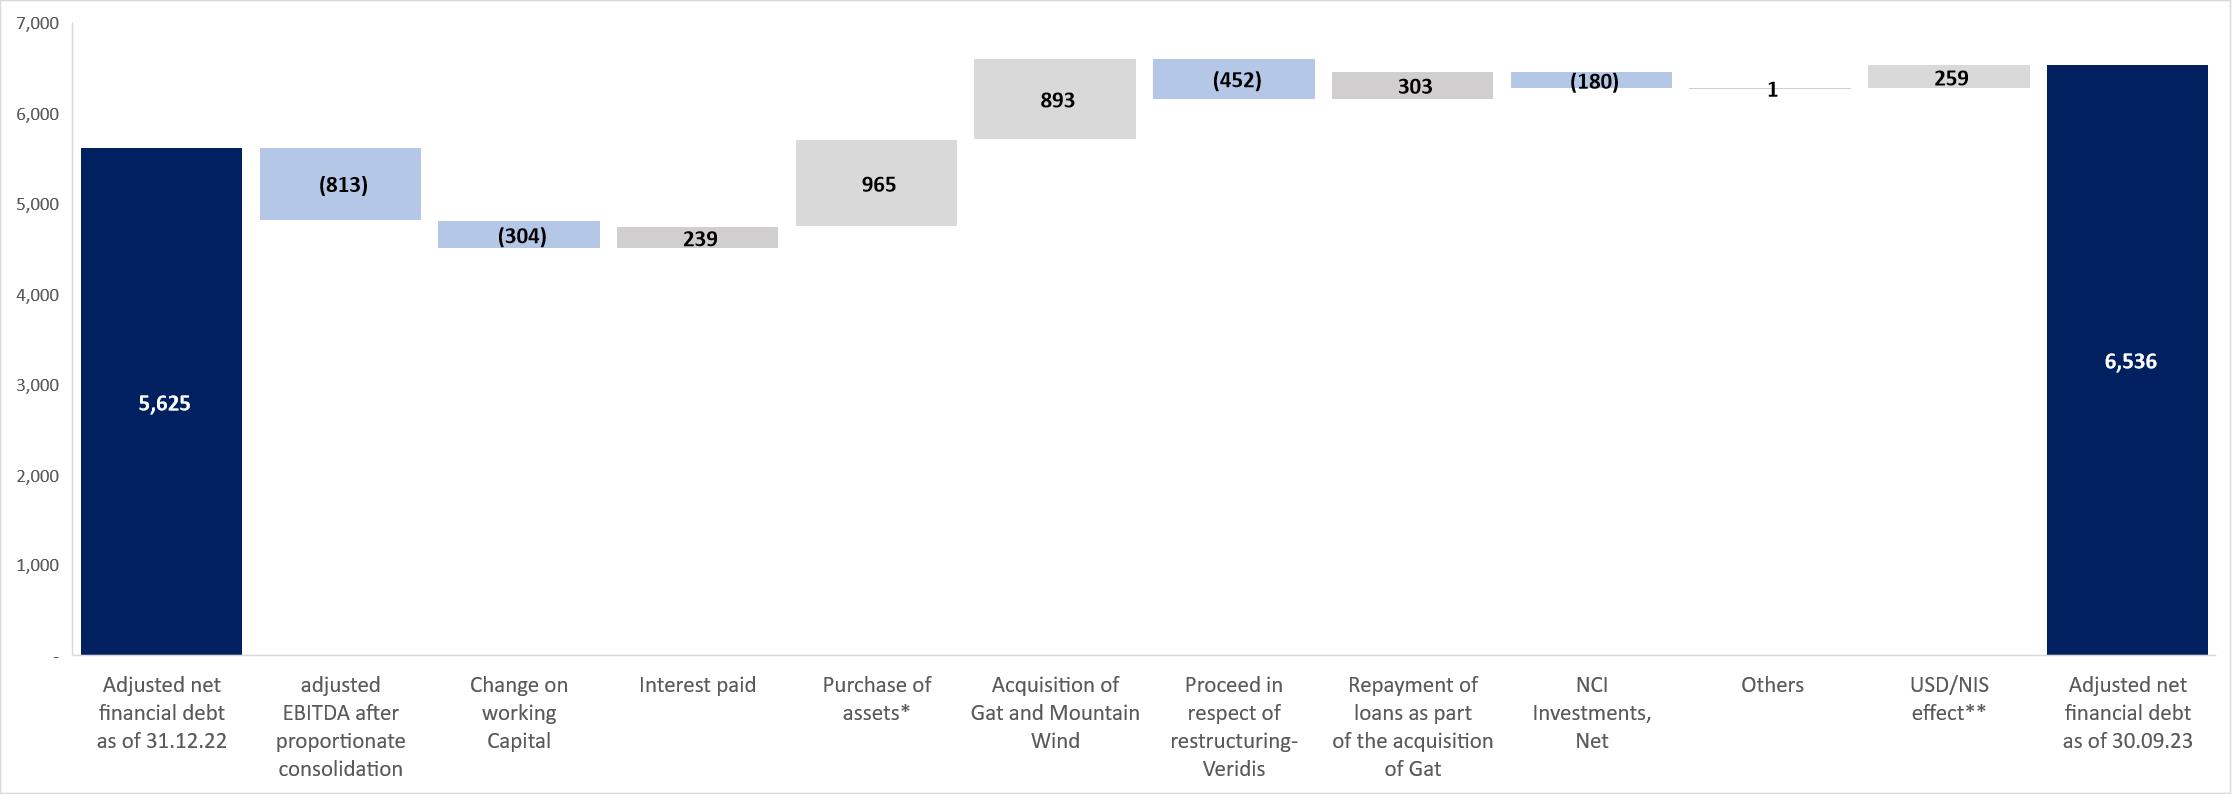
| (*) |
Includes the amount of about NIS 91 million in respect of current payments and the amount of about NIS 874 million in respect of payments relating to construction projects.
|
| (**) |
In respect of translation of the net financial debt of the U.S. which is denominated in dollars into the Company’s functional currency.
|
| 10. |
Additional Events in the Company’s Areas of Activity in the Period of the Report and Thereafter
|
|
|
A. |
Win in a tender of Israel Lands Authority for construction of facilities for generation of electricity using renewable energy in Israel
|
| 57 |
That stated above regarding the characteristics and the capacity of the solar facilities and the storage capacity, the estimated cost of the projects, the feasibility for advancement of the project as a
single (combined) project and the resulting cost savings, the commencement date of the construction of the project/s, the regulation that will apply to the facilities, the Company’s activities in the renewable area, and obtaining of the
government’s consent include “forward‑looking” information, as it is defined in the Securities Law, which is based on the Company’s estimates and assumptions as at the date of the report, regarding which there is no certainty it will be
realized or the manner of its realization. As at the submission date of the report, construction of the facilities and advancement of the project/s depends on completion of the planning processes, construction, connection to the network
(grid), licensing, and regulatory conditions, approval of the plan (which is expected to include, among other things, examination of planning, environmental, security, planning of connection to the grid and transmission capability, including
examination of objections of various parties), contracting with relevant suppliers and assurance of financing for the construction, which as at the date of the report has not yet been completed and there is no certainty regarding the
completion thereof or the manner of the said completion (if completed). Ultimately, there could be administrative, planning, environmental, regulatory, infrastructure, operating delays / problems and/or cost increases – this being, among
other things, due to factors not under the Company’s control, or as a result of the occurrence of one or more of the risk factors to which the Company is exposed.
|
| 10. |
Additional Events in the Company’s Areas of Activity (Cont.)
|
|
|
A. |
Win in a tender of Israel Lands Authority for construction of facilities for generation of electricity using renewable energy in Israel (Cont.)
|
|
|
B. |
Receipt of approval for commercial operation for the Zomet power plant – further to that stated in Section 7.1.2 of Part A of the Periodic Report for 2022, on June 22, 2023, the commercial operation of the Zomet power plant commenced.
Pursuant to the decision of the Electricity Authority published on June 21, 2023, the Electricity Authority decided to grant a permanent electricity generation license (“the License”) to the Zomet power plant using conventional technology in an
open cycle, with a capacity of about 396 megawatts. The License is for a period of 20 years (with a possibility for extension subject to the decision of the Electricity Authority). The total construction cost of Zomet amounted about NIS 1.4
billion (without the amount of the assessment issued by Israel Lands Authority, in the amount of about NIS 200 million, as detailed in Note 11B to the financial statements for 2022). Pursuant to the generation license, Zomet is entitled to
receive an availability tariff from the System Operator, as at the date of the report of between 5.7 and 6.5 agurot per kilowatt hour60, subject to the number of ignitions. In addition, Zomet is entitled to an electricity and gas
tariff based on the generation and purchase cost and pursuant to the terms of the generation license and Regulation 914 of the Electricity Authority61.
|
| 10. |
Additional Events in the Company’s Areas of Activity (Cont.)
|
|
|
B. |
(Cont.)
|
|
|
C. |
Agreement for sale of electricity (PPA) with Bazan – further to that stated in Section 7.6.2 of Part A of the Periodic Report for 2022 regarding an agreement of Rotem for sale of electricity (PPA) to Bazan, in May 2023, new PPA
agreements were signed between Rotem and Bazan for supply of electricity to the consumption facilities of the Bazan Group (“the PPA Agreements” or “the Undertaking”) for a maximum scope of 125 megawatt/hour. Supply of the electricity is in
exchange for a payment equal to the TAOZ (load time) high‑voltage tariff determined from time to time by the Electricity Authority and less a discount on the generation component in accordance with the rates and arrangements detailed in the
agreement. The period of the agreement is ten years, commencing from July 2023 (upon conclusion of the present agreement as stated in above‑mentioned Periodic Report), subject to grounds for early termination63, along with graduated
exit points commencing after the passage of 5 years from the commencement date of the supply and pursuant to the provisions agreed to. As part of the Undertaking, additional provisions were included that are customary in PPA agreements of this
type, among other things, regarding consumption in excess of the maximum quantity, a commitment for availability of the power plant and supply of the electricity from different sources.
|
| 62 |
The Company’s estimate regarding the additional EBITDA of the Zomet power plant constitutes “forward‑looking” information within the meaning thereof in the Securities Law, which is based on data, estimates,
assessments and plans of the Company regarding the characteristics of the power plant that are in the Company’s possession proximate to the publication date of the report. These data items, estimates and assessments may not materialize or could
change during the relevant period due to a range of circumstances that are not under the Company’s control, including changes in the provisions of law or regulations, unforeseen expenses, technical, operational or other malfunctions, defects in
the system, changes in the system cost and changes in the scope of the consumption or operation, which do not depend on the Company and regarding which there is no certainty they will occur.
|
| 10. |
Additional Events in the Company’s Areas of Activity (Cont.)
|
|
|
D. |
Tender for sale of Eshkol as part of the reform of Israel Electric Company (IEC)66 – on May 22, 2023, the Group submitted, through a joint designated company held in equal shares by OPC Power Plants Ltd. (a subsidiary that
is held at the rate of 80% (indirectly) by the Company) and a company held by the Noy Fund (“OPC Eshkol”) a bid for acquisition of the Eshkol power plant, in the framework of a tender of Israel Electric Company. The tender includes acquisition
of a number of generation units that operate using conventional technology (natural gas) with a cumulative capacity of about 1,680 megawatts67, and the possibility to construct additional capacity of 600 megawatts to 850 megawatts68
based on regulations of the Electricity Authority, for the Eshkol site that is located in the Ashdod area.
|
|
|
E. |
Hadera 2 – on May 28, 2023, a government decision was made not to approve National Infrastructure Plan 20B, relating to the Hadera 2 power plant, and to return it to the National Infrastructure Board for further deliberations. Further
to this, the Company submitted a petition for issuance to the Government of a conditional order to provide reasons for non‑approval of NIP 20B, which was summarily dismissed on July 19, 2023.
|
| 66 |
For additional details – see Section 7.2.11.2 of Part A of the Periodic Report for 2022.
|
| 10. |
Additional Events in the Company’s Areas of Activity (Cont.)
|
|
|
F. |
Update of remuneration of Company directors – on May 11, 2023, the Company’s Board of Directors approved, after receiving the approval of the Remuneration Committee, update of the remuneration of presently serving directors, and as
they will serve in the Company from time to time, who are classified as experts such the updated annual remuneration to be paid to an expert director69 will be in accordance with the average of the amount provided and the maximum
annual amount for an external expert director, as detailed in the Second and Fourth Addendums to the Companies Regulations (Rules regarding Remuneration and Expenses to an External Director), 2000 (“the Remuneration Regulations”), respectively,
taking into account the Company’s grade; the updated participation remuneration that will be paid to an expert director will be in accordance with the average of the amount provided and the maximum amount for participation of an expert
external, director as detailed in the Third and Fourth Addendums to the Remuneration Regulations, respectively, taking into account the Company’s grade. Update of the remuneration, as stated, applies to the all the Company’s directors, as they
will be from time to time, including external directors, independent directors and directors that could be considered as being related to the Company’s controlling shareholder. It is clarified that update of the remuneration with reference to
all the Company’s presently serving directors, will be made subject their appointments and will apply from the commencement of the service of the external directors, that is July 1, 2023.
|
|
|
G. |
Appointment of independent director – on May 11, 2023, the Company’s Board of Directors approved the appointment of Harel Givon as an independent director of the Company – this being subject to approval of the General Meeting of the
Company’s shareholders of amendment of the Company’s Articles of Association, as detailed below, commencing from July 1, 2023.
|
|
|
H. |
Decisions of Extraordinary General Meeting of the Company’s shareholders – on June 19, 2023, the Extraordinary General Meeting of the Company’s shareholders decided:
|
|
|
1. |
To reappoint Mr. Yosef Tene as an external director of the Company for an additional period of service of three years, commencing from July 1, 2023, who will be entitled to the service conditions of the Company’s directors, including
directors’ fees in accordance with his classification as an expert director.
|
|
|
2. |
To appoint Ms. Shirly Mashkif as an external director of the Company for an initial period of service of three years, commencing from July 1, 2023, who will be entitled to the service conditions of the Company’s directors, in accordance with
her classification as an expert director.
|
|
|
3. |
To approve amendment of Regulation 89 of the Company’s Articles of Association, such that the number of directors the Company’s Board of Directors is permitted to appoint to the Board of Directors (the appointment of which will be up to the
next Annual General Meeting of the Company’s shareholders), will be in accordance with a limitation of 13 directors, as provided in Regulation 83 of the Articles of Association.
|
|
|
I. |
Conclusion of the service of an external director – on July 13, 2023, the service of Michal Merom Brickman as an external director of the Company was concluded.
|
| 10. |
Additional Events in the Company’s Areas of Activity (Cont.)
|
|
|
J. |
Proposed Clean Power Plan – in May 2023, the U.S. Environmental Protection Agency announced a proposal Clean Power Plan 2.0, the goal of which is to significantly limit emission of greenhouse gases from generation of energy through
fossils. Pursuant to the proposal, the regulation will require large electricity generation facilities operating using natural gas with an output coefficient of more than 50% to integrate burning of hydrogen with natural gas or, alternatively,
carbon capture technology – this being commencing from 2032 or 2035, respectively. As at the approval date of the report, the said proposal, is not final and will be subject to comments of the public and a thorough examination process. In CPV’s
estimation, the proposed plan could undergo significant changes before its potential application in 2024.
|
|
|
K. |
Receipt of approval for commercial operation of the Three Rivers power plant
|
|
|
L. |
RGGI (Regional Greenhouse Gas Initiative)
|
| 11. |
Debentures (Series B) and (Series C)
|
| 12. |
Impacts of changes in the macro‑economic environment on the Group’s activities and its results
|
| 12. |
Impacts of changes in the macro‑economic environment on the Group’s activities and its results (Cont.)
|
| 12. |
Impacts of changes in the macro‑economic environment on the Group’s activities and its results (Cont.)
|
| 13. |
Contributions policy
|
|
Amount of the
|
Relationship to the
|
|||||||
|
Recipient of the
|
Contribution
|
Recipient of the
|
||||||
|
Contribution
|
(NIS thousands)
|
Contribution
|
||||||
|
“Password for Every Student” Society
|
1,000
|
“Password for Every Student” also receives contributions from parties related indirectly to the Company’s controlling shareholder (including from
the Israel Corporation Group). The Company’s CEO is a representative of the project’s Steering Committee without compensation.
|
||||||
|
“Rahashei Lev” Society
|
145
|
For the sake of good order, it is noted that Ms. Michal Marom Brickman, who served as an external director of the Company, serves as a director and a member of the Investments Committee of
the Management Committee of the Tel‑Aviv Medical Center in the name of Sorosky (without pay). It is further noted that, as the Company was informed, commencing from November 2022, the daughter of Mr. Yosef Tena, an external director of the
Company, is employed by the Tel‑Aviv Medical Center in the name of Sorosky.
|
||||||
|
“Nirim” Society
|
150
|
–
|
||||||
|
“Technoda Hadera Givat Olga” Society
|
300
|
–
|
||||||
|
“Running to Give” Society
|
50
|
For the sake of good order, it is noted that a relative of the Company’s CEO serves as Chairman of the Society without compensation.
|
||||||
|
Total
|
1,645
|
|||||||
|
|
– |
The cumulative amount of NIS 550 thousand through the “Provision of Investors in the Community” Society in favor of organizations engaged in providing logistical assistance through the Civilian Military War Room and supplying supporting
equipment to soldiers.
|
|
|
– |
NIS 515 thousand through the “Rachashei Lev” Society for financing of stays and operation of a motel housing set‑up for families removed from the combat areas that are not entitled to government assistance and a project involving supporting
(auxiliary) equipment for solders of the Israel Defense Force.
|
|
|
– |
NIS 50 thousand to “the Green Village in the Name of Levi Eshkol” Society that set up a logistical center for supply of equipment for support of persons removed from the Gaza Strip area.
|
| 14. |
Significant valuations
|
|
Subject matter of the valuation
|
Determination of the fair value of the identified assets and liabilities of the Gat power plant and determination of the amount of the goodwill and the
method for allocation thereof to the cash‑generating units pursuant to the provisions of IFRS 3.
|
||
|
Date of the valuation
|
March 30, 2023.
|
||
|
Value of the identified assets and liabilities and the amount of the goodwill as at the valuation date
|
About NIS 555 million.
|
||
|
Identity of the appraiser and his characteristics
|
The valuation was performed by a team headed by Mr. Sagiv Mizrahi, CPA, a partner and team manager in the Corporate Finance Department of the Office of
BDO (Ziv Haft). Sagiv has a Bachelor’s degree in applied mathematics from Bar Ilan University and a Master’s degree in business administration (MBA), with honors, and a specialization in financial management from Tel‑Aviv University. Sagiv has
more than 10 years of experience in the areas of business and economic consulting, valuations of companies and financial instruments and economic–accounting work of various types in accordance with International Financial Reporting Standards
(IFRS) and generally accepted accounting principles in the U.S. (U.S GAAP). In the past, Sagiv was a lecturer at Bar Ilan University regarding accounting and valuation matters.
|
| 14. |
Significant valuations (Cont.)
|
|
Valuation model
|
The fair value of the power plant was estimated using the revenues’ method, the multi‑period excess earnings method (MPEEM). The fundamental assumption of this method is that the value of the
asset being estimated equals the present value of the free cash flows allocable to the asset less the fair rate of return of the required assets (the contributing assets) for purposes of realization of these cash flows.
|
||
|
The assumptions based on which the appraiser performed the valuation
|
– The nominal shekel weighted‑average cost of capital (WACC) rates ranges between 8% and 8.75%.
– Forecast years – represents the period between March 31, 2023 and up to December 31, 2059, and is based on an estimate of the economic useful
life of the power plant.
|
|
Subject matter of the valuation
|
Estimation of the fair value of certain assets and liabilities of a renewable energy project pursuant to the provisions of IFRS 3.
|
||
|
Date of the valuation
|
April 5, 2023.
|
||
|
Value of the identified assets and liabilities and the amount of the goodwill as at the valuation date
|
About NIS 625 million.
|
||
|
Identity of the appraiser and his characteristics
|
The valuation was performed by a team headed by Mr. Gil Mor, CPA, Partner, and Manager of the Economics Department in the Office of Price Waterhouse Coopers Advisory Ltd. Mr. Mor holds a
bachelor’s degree in accounting and economics and a master’s degree in business administration (with honors) from Tel‑Aviv University.
|
| 14. |
Significant valuations (Cont.)
|
|
Valuation model
|
The fair value was estimated using the DCF method by means of discounting the project’s future pre‑tax cash flows, at an after‑tax weighted‑average cost
of capital (WACC).
|
||
|
The assumptions based on which the appraiser performed the valuation
|
– The nominal dollar weighted‑average cost of capital (WACC) rates range between 5.75% and 6.25%.
– Prices – the prices in the forecast (electricity, availability of RECs, etc.) are based PPA agreements and market forecasts received from
external, independent information sources, taking into account the region and the relevant market for each project and the relevant regulation.
– Forecast years – between 20 and 29 years, and is based on an estimate of the economic useful life of the project’s power plant.
|
|
Yair Caspi
|
Giora Almogy
|
|
|
Chairman of the Board of Directors
|
CEO
|
|
OPC Energy Ltd.
Condensed Consolidated Interim
Financial Statements
As at September 30, 2023
(Unaudited)
|
| Page | |
|
F-3
|
|
|
F-4
|
|
|
F-5
|
|
|
F-7
|
|
|
F-8
|
|
|
F-9
|
|
|
F-12
|
|
|
F-14
|

|
|
(1) |
Independent auditors’ review report of November 16, 2023 on the Company’s condensed consolidated financial information as of September 30, 2023 and for the nine- and three-month periods ended on that date.
|
|
|
(2) |
Independent auditors’ special report of November 16, 2023 on the Company’s separate interim financial information as of September 30, 2023, in accordance with Regulation 38D to the Securities Regulations (Periodic and Immediate
Reports), 1970 and for the nine- and three-month periods then ended.
|
|
September 30
|
September 30
|
December 31
|
||||||||||
|
2023
|
2022
|
2022
|
||||||||||
|
(Unaudited)
|
(Unaudited)
|
(Audited)
|
||||||||||
|
NIS million
|
NIS million
|
NIS million
|
||||||||||
|
Current assets
|
||||||||||||
|
Cash and cash equivalents
|
915
|
1,213
|
849
|
|||||||||
|
Short term deposits
|
-
|
-
|
125
|
|||||||||
|
Short-term restricted deposits and cash
|
62
|
36
|
36
|
|||||||||
|
Trade receivables and accrued income
|
304
|
185
|
260
|
|||||||||
|
Other receivables and debit balances
|
146
|
157
|
190
|
|||||||||
|
Inventories
|
8
|
7
|
7
|
|||||||||
|
Short-term derivative financial instruments
|
16
|
14
|
10
|
|||||||||
|
Total current assets
|
1,451
|
1,612
|
1,477
|
|||||||||
|
Non‑current assets
|
||||||||||||
|
Long-term restricted deposits and cash
|
59
|
53
|
53
|
|||||||||
|
Prepaid expenses and other long-term receivables
|
424
|
206
|
179
|
|||||||||
|
Investments in associates
|
2,661
|
2,216
|
2,296
|
|||||||||
|
Deferred tax assets
|
34
|
21
|
22
|
|||||||||
|
Long-term derivative financial instruments
|
73
|
60
|
57
|
|||||||||
|
Property, plant & equipment
|
6,306
|
4,184
|
4,324
|
|||||||||
|
Right‑of‑use assets
|
487
|
322
|
347
|
|||||||||
|
Intangible assets
|
1,092
|
786
|
777
|
|||||||||
|
Total non‑current assets
|
11,136
|
7,848
|
8,055
|
|||||||||
|
Total assets
|
12,587
|
9,460
|
9,532
|
|||||||||
|
September 30
|
September 30
|
December 31
|
||||||||||
|
2023
|
2022
|
2022
|
||||||||||
|
(Unaudited)
|
(Unaudited)
|
(Audited)
|
||||||||||
|
NIS million
|
NIS million
|
NIS million
|
||||||||||
|
Current liabilities
|
||||||||||||
|
Current maturities of long-term loans from banks and financial institutions
|
216
|
101
|
92
|
|||||||||
|
Current maturities of loans from non‑controlling interests
|
30
|
58
|
13
|
|||||||||
|
Current maturities of debentures
|
192
|
33
|
33
|
|||||||||
|
Trade payables
|
436
|
357
|
335
|
|||||||||
|
Payables and credit balances
|
432
|
98
|
110
|
|||||||||
|
Short-term derivative financial instruments
|
2
|
4
|
3
|
|||||||||
|
Current maturities of lease liabilities
|
62
|
61
|
61
|
|||||||||
|
Current tax liabilities
|
1
|
5
|
2
|
|||||||||
|
Total current liabilities
|
1,371
|
717
|
649
|
|||||||||
|
Non‑current liabilities
|
||||||||||||
|
Long-term loans from banking corporations and financial institutions
|
2,744
|
1,685
|
1,724
|
|||||||||
|
Long-term loans from non-controlling interests
|
396
|
415
|
424
|
|||||||||
|
Debentures
|
1,647
|
1,799
|
1,807
|
|||||||||
|
Long-term lease liabilities
|
217
|
72
|
69
|
|||||||||
|
Other long‑term liabilities
|
157
|
126
|
146
|
|||||||||
|
Deferred tax liabilities
|
525
|
339
|
347
|
|||||||||
|
Total non-current liabilities
|
5,686
|
4,436
|
4,517
|
|||||||||
|
Total liabilities
|
7,057
|
5,153
|
5,166
|
|||||||||
|
Equity
|
||||||||||||
|
Share capital
|
2
|
2
|
2
|
|||||||||
|
Share premium
|
3,210
|
3,209
|
3,209
|
|||||||||
|
Capital reserves
|
755
|
346
|
327
|
|||||||||
|
Retained earnings (retained loss)
|
90
|
(55
|
)
|
(31
|
)
|
|||||||
|
Total equity attributable to the Company’s shareholders
|
4,057
|
3,502
|
3,507
|
|||||||||
|
Non‑controlling interests
|
1,473
|
805
|
859
|
|||||||||
|
Total equity
|
5,530
|
4,307
|
4,366
|
|||||||||
|
Total liabilities and equity
|
12,587
|
9,460
|
9,532
|
|||||||||
|
Yair Caspi
|
Giora Almogy
|
Ana Berenshtein Shvartsman
|
||
|
Chairman of the Board of Directors
|
Chief Executive Officer
|
Chief Financial Officer
|
|
For the nine-month period ended September 30
|
For the three-month period ended September 30
|
For the year ended December 31
|
||||||||||||||||||
|
2023
|
2022
|
2023
|
2022
|
2022
|
||||||||||||||||
|
(Unaudited)
|
(Unaudited)
|
(Unaudited)
|
(Unaudited)
|
(Audited)
|
||||||||||||||||
|
NIS million
|
NIS million
|
NIS million
|
NIS million
|
NIS million
|
||||||||||||||||
|
Revenues from sales and provision of services
|
1,971
|
1,423
|
851
|
550
|
1,927
|
|||||||||||||||
|
Cost of sales and services (excluding depreciation and amortization)
|
(1,395
|
)
|
(1,036
|
)
|
(561
|
)
|
(393
|
)
|
(1,404
|
)
|
||||||||||
|
Depreciation and amortization
|
(205
|
)
|
(132
|
)
|
(95
|
)
|
(46
|
)
|
(191
|
)
|
||||||||||
|
Gross profit
|
371
|
255
|
195
|
111
|
332
|
|||||||||||||||
|
General and administrative expenses
|
(182
|
)
|
(155
|
)
|
(65
|
)
|
(59
|
)
|
(239
|
)
|
||||||||||
|
Share in the profits of associates
|
179
|
190
|
79
|
124
|
286
|
|||||||||||||||
|
Business development expenses
|
(47
|
)
|
(35
|
)
|
(17
|
)
|
(12
|
)
|
(50
|
)
|
||||||||||
|
Other income, net
|
6
|
-
|
11
|
-
|
-
|
|||||||||||||||
|
Operating profit
|
327
|
255
|
203
|
164
|
329
|
|||||||||||||||
|
Finance expenses
|
(196
|
)
|
(128
|
)
|
(85
|
)
|
(43
|
)
|
(167
|
)
|
||||||||||
|
Finance income
|
53
|
110
|
15
|
17
|
120
|
|||||||||||||||
|
Finance expenses, net
|
(143
|
)
|
(18
|
)
|
(70
|
)
|
(26
|
)
|
(47
|
)
|
||||||||||
|
Profit before taxes on income
|
184
|
237
|
133
|
138
|
282
|
|||||||||||||||
|
Expenses for income tax
|
(44
|
)
|
(57
|
)
|
(32
|
)
|
(30
|
)
|
(65
|
)
|
||||||||||
|
Profit for the period
|
140
|
180
|
101
|
108
|
217
|
|||||||||||||||
|
Attributable to:
|
||||||||||||||||||||
|
The Company’s shareholders
|
121
|
143
|
82
|
76
|
167
|
|||||||||||||||
|
Non‑controlling interests
|
19
|
37
|
19
|
32
|
50
|
|||||||||||||||
|
Profit for the period
|
140
|
180
|
101
|
108
|
217
|
|||||||||||||||
|
Profit per share attributed to the Company’s owners
|
||||||||||||||||||||
|
Basic and diluted earnings per share (in NIS)
|
0.54
|
0.70
|
0.36
|
0.36
|
0.79
|
|||||||||||||||
|
For the nine-month period ended September 30
|
For the three-month period ended September 30
|
For the year ended December 31
|
||||||||||||||||||
|
2023
|
2022
|
2023
|
2022
|
2022
|
||||||||||||||||
|
(Unaudited)
|
(Unaudited)
|
(Unaudited)
|
(Unaudited)
|
(Audited)
|
||||||||||||||||
|
NIS million
|
NIS million
|
NIS million
|
NIS million
|
NIS million
|
||||||||||||||||
|
Profit for the period
|
140
|
180
|
101
|
108
|
217
|
|||||||||||||||
|
Other comprehensive income items that, subsequent to initial recognition in comprehensive income, were or will be transferred to profit and loss
|
||||||||||||||||||||
|
Effective portion of the change in the fair value of cash flow hedges
|
33
|
51
|
16
|
12
|
50
|
|||||||||||||||
|
Net change in fair value of derivative financial instruments used to hedge cash flows recognized in the cost of the hedged item
|
(7
|
)
|
-
|
(3
|
)
|
(2
|
)
|
(4
|
)
|
|||||||||||
|
Net change in fair value of derivative financial instruments used to hedge cash flows transferred to profit and loss
|
(15
|
)
|
(11
|
)
|
(4
|
)
|
(4
|
)
|
(14
|
)
|
||||||||||
|
Share in other comprehensive income (loss) of associates, net of tax
|
(24
|
)
|
68
|
(10
|
)
|
14
|
64
|
|||||||||||||
|
Foreign currency translation differences in respect of foreign operations
|
368
|
287
|
153
|
44
|
267
|
|||||||||||||||
|
Tax on other comprehensive income (loss) items
|
(22
|
)
|
(10
|
)
|
(10
|
)
|
(1
|
)
|
(9
|
)
|
||||||||||
|
Other comprehensive income for the period, net of tax
|
333
|
385
|
142
|
63
|
354
|
|||||||||||||||
|
Total comprehensive income for the period
|
473
|
565
|
243
|
171
|
571
|
|||||||||||||||
|
Attributable to:
|
||||||||||||||||||||
|
The Company’s shareholders
|
380
|
411
|
190
|
119
|
412
|
|||||||||||||||
|
Non‑controlling interests
|
93
|
154
|
53
|
52
|
159
|
|||||||||||||||
|
Comprehensive income for the period
|
473
|
565
|
243
|
171
|
571
|
|||||||||||||||
|
Attributable to the Company’s shareholders
|
||||||||||||||||||||||||||||||||||||||||||||
|
Share capital
|
Share premium
|
Capital reserve from transactions with non-controlling interests and merger
|
Hedge fund
|
Foreign operations translation reserve
|
Capital reserve from transactions with shareholders
|
Capital reserve for share-based payment
|
Retained earnings (retained loss)
|
Total
|
Non‑controlling interests
|
Total equity
|
||||||||||||||||||||||||||||||||||
|
NIS million
|
NIS million
|
NIS million
|
NIS million
|
NIS million
|
NIS million
|
NIS million
|
NIS million
|
NIS million
|
NIS million
|
NIS million
|
||||||||||||||||||||||||||||||||||
|
(Unaudited)
|
||||||||||||||||||||||||||||||||||||||||||||
|
For the nine-month
|
||||||||||||||||||||||||||||||||||||||||||||
|
period ended September 30, 2023
|
||||||||||||||||||||||||||||||||||||||||||||
|
Balance as at January 1, 2023
|
2
|
3,209
|
(25
|
)
|
91
|
159
|
78
|
24
|
(31
|
)
|
3,507
|
859
|
4,366
|
|||||||||||||||||||||||||||||||
|
Investments by holders of non-controlling interests in equity of subsidiary
|
-
|
-
|
-
|
-
|
-
|
-
|
-
|
-
|
-
|
231
|
231
|
|||||||||||||||||||||||||||||||||
|
Share-based payment
|
-
|
-
|
(1
|
)
|
-
|
-
|
-
|
8
|
-
|
7
|
1
|
8
|
||||||||||||||||||||||||||||||||
|
Exercised options and RSUs
|
*-
|
1
|
-
|
-
|
-
|
-
|
(1
|
)
|
-
|
-
|
-
|
-
|
||||||||||||||||||||||||||||||||
|
Restructuring - share exchange and investment transaction with Veridis
|
-
|
-
|
163
|
-
|
-
|
-
|
-
|
-
|
163
|
289
|
452
|
|||||||||||||||||||||||||||||||||
|
Other comprehensive income (loss) for the period, net of tax
|
-
|
-
|
-
|
(10
|
)
|
269
|
-
|
-
|
-
|
259
|
74
|
333
|
||||||||||||||||||||||||||||||||
|
Profit for the period
|
-
|
-
|
-
|
-
|
-
|
-
|
-
|
121
|
121
|
19
|
140
|
|||||||||||||||||||||||||||||||||
|
Balance as at September 30, 2023
|
2
|
3,210
|
137
|
81
|
428
|
78
|
31
|
90
|
4,057
|
1,473
|
5,530
|
|||||||||||||||||||||||||||||||||
|
For the nine-month period
|
||||||||||||||||||||||||||||||||||||||||||||
|
ended September 30, 2022
|
||||||||||||||||||||||||||||||||||||||||||||
|
Balance as at January 1 2022
|
2
|
2,392
|
(25
|
)
|
32
|
(27
|
)
|
78
|
10
|
(198
|
)
|
2,264
|
577
|
2,841
|
||||||||||||||||||||||||||||||
|
Issuance of shares (less issuance expenses)
|
*-
|
815
|
-
|
-
|
-
|
-
|
-
|
-
|
815
|
-
|
815
|
|||||||||||||||||||||||||||||||||
|
Investments by holders of non-controlling interests in equity of subsidiary
|
-
|
-
|
-
|
-
|
-
|
-
|
-
|
-
|
-
|
74
|
74
|
|||||||||||||||||||||||||||||||||
|
Share-based payment
|
-
|
-
|
-
|
-
|
-
|
-
|
12
|
-
|
12
|
-
|
12
|
|||||||||||||||||||||||||||||||||
|
Exercised options and RSUs
|
*-
|
2
|
-
|
-
|
-
|
-
|
(2
|
)
|
-
|
-
|
-
|
-
|
||||||||||||||||||||||||||||||||
|
Other comprehensive income for the period, net of tax
|
-
|
-
|
-
|
68
|
200
|
-
|
-
|
-
|
268
|
117
|
385
|
|||||||||||||||||||||||||||||||||
|
Profit for the period
|
-
|
-
|
-
|
-
|
-
|
-
|
-
|
143
|
143
|
37
|
180
|
|||||||||||||||||||||||||||||||||
|
Balance as at September 30, 2022
|
2
|
3,209
|
(25
|
)
|
100
|
173
|
78
|
20
|
(55
|
)
|
3,502
|
805
|
4,307
|
|||||||||||||||||||||||||||||||
|
Attributable to the Company’s shareholders
|
||||||||||||||||||||||||||||||||||||||||||||
|
Share capital
|
Share premium
|
Capital reserve from transactions with non-controlling interests and merger
|
Hedge fund
|
Foreign operations translation reserve
|
Capital reserve from transactions with shareholders
|
Capital reserve for share-based payment
|
Retained earnings (retained loss)
|
Total
|
Non‑controlling interests
|
Total equity
|
||||||||||||||||||||||||||||||||||
|
NIS million
|
NIS million
|
NIS million
|
NIS million
|
NIS million
|
NIS million
|
NIS million
|
NIS million
|
NIS million
|
NIS million
|
NIS million
|
||||||||||||||||||||||||||||||||||
|
(Unaudited)
|
||||||||||||||||||||||||||||||||||||||||||||
|
For the three-month period
|
||||||||||||||||||||||||||||||||||||||||||||
|
ended September 30, 2023
|
||||||||||||||||||||||||||||||||||||||||||||
|
Balance on July 1, 2023
|
2
|
3,210
|
137
|
83
|
318
|
78
|
29
|
8
|
3,865
|
1,385
|
5,250
|
|||||||||||||||||||||||||||||||||
|
Investments by holders of non-controlling interests in equity of subsidiary
|
-
|
-
|
-
|
-
|
-
|
-
|
-
|
-
|
-
|
35
|
35
|
|||||||||||||||||||||||||||||||||
|
Share-based payment
|
-
|
-
|
-
|
-
|
-
|
-
|
2
|
-
|
2
|
-
|
2
|
|||||||||||||||||||||||||||||||||
|
Other comprehensive income for the period, net of tax
|
-
|
-
|
-
|
(2
|
)
|
110
|
-
|
-
|
-
|
108
|
34
|
142
|
||||||||||||||||||||||||||||||||
|
Profit for the period
|
-
|
-
|
-
|
-
|
-
|
-
|
-
|
82
|
82
|
19
|
101
|
|||||||||||||||||||||||||||||||||
|
Balance as at September 30, 2023
|
2
|
3,210
|
137
|
81
|
428
|
78
|
31
|
90
|
4,057
|
1,473
|
5,530
|
|||||||||||||||||||||||||||||||||
|
For the three-month
|
||||||||||||||||||||||||||||||||||||||||||||
|
period ended September 30, 2022
|
||||||||||||||||||||||||||||||||||||||||||||
|
Balance on July 1, 2022
|
2
|
2,392
|
(25
|
)
|
87
|
143
|
78
|
17
|
(131
|
)
|
2,563
|
716
|
3,279
|
|||||||||||||||||||||||||||||||
|
Issuance of shares (less issuance expenses)
|
*-
|
815
|
-
|
-
|
-
|
-
|
-
|
-
|
815
|
-
|
815
|
|||||||||||||||||||||||||||||||||
|
Investments by holders of non-controlling interests in equity of subsidiary
|
-
|
-
|
-
|
-
|
-
|
-
|
-
|
-
|
-
|
37
|
37
|
|||||||||||||||||||||||||||||||||
|
Share-based payment
|
-
|
-
|
-
|
-
|
-
|
-
|
5
|
-
|
5
|
-
|
5
|
|||||||||||||||||||||||||||||||||
|
Exercised options and RSUs
|
*-
|
2
|
-
|
-
|
-
|
-
|
(2
|
)
|
-
|
-
|
-
|
-
|
||||||||||||||||||||||||||||||||
|
Other comprehensive income for the period, net of tax
|
-
|
-
|
-
|
13
|
30
|
-
|
-
|
-
|
43
|
20
|
63
|
|||||||||||||||||||||||||||||||||
|
Profit for the period
|
-
|
-
|
-
|
-
|
-
|
-
|
-
|
76
|
76
|
32
|
108
|
|||||||||||||||||||||||||||||||||
|
Balance as at September 30, 2022
|
2
|
3,209
|
(25
|
)
|
100
|
173
|
78
|
20
|
(55
|
)
|
3,502
|
805
|
4,307
|
|||||||||||||||||||||||||||||||
|
Attributable to the Company’s shareholders
|
||||||||||||||||||||||||||||||||||||||||||||
|
Share capital
|
Share premium
|
Capital reserve from transactions with non-controlling interests and merger
|
Hedge fund
|
Foreign operations translation reserve
|
Capital reserve from transactions with shareholders
|
Capital reserve for share-based payment
|
Retained loss
|
Total
|
Non‑controlling interests
|
Total equity
|
||||||||||||||||||||||||||||||||||
|
NIS million
|
NIS million
|
NIS million
|
NIS million
|
NIS million
|
NIS million
|
NIS million
|
NIS million
|
NIS million
|
NIS million
|
NIS million
|
||||||||||||||||||||||||||||||||||
|
(Audited)
|
||||||||||||||||||||||||||||||||||||||||||||
|
For the year ended December 31, 2022
|
||||||||||||||||||||||||||||||||||||||||||||
|
Balance as at January 1 2022
|
2
|
2,392
|
(25
|
)
|
32
|
(27
|
)
|
78
|
10
|
(198
|
)
|
2,264
|
577
|
2,841
|
||||||||||||||||||||||||||||||
|
Issuance of shares (less issuance expenses)
|
*-
|
815
|
-
|
-
|
-
|
-
|
-
|
-
|
815
|
-
|
815
|
|||||||||||||||||||||||||||||||||
|
Investments by holders of non-controlling interests in equity of subsidiary
|
-
|
-
|
-
|
-
|
-
|
-
|
-
|
-
|
-
|
123
|
123
|
|||||||||||||||||||||||||||||||||
|
Share-based payment
|
-
|
-
|
-
|
-
|
-
|
-
|
16
|
-
|
16
|
-
|
16
|
|||||||||||||||||||||||||||||||||
|
Exercised options and RSUs
|
*-
|
2
|
-
|
-
|
-
|
-
|
(2
|
)
|
-
|
-
|
-
|
-
|
||||||||||||||||||||||||||||||||
|
Other comprehensive income for the year, net of tax
|
-
|
-
|
-
|
59
|
186
|
-
|
-
|
-
|
245
|
109
|
354
|
|||||||||||||||||||||||||||||||||
|
Profit for the year
|
-
|
-
|
-
|
-
|
-
|
-
|
-
|
167
|
167
|
50
|
217
|
|||||||||||||||||||||||||||||||||
|
Balance as at December 31, 2022
|
2
|
3,209
|
(25
|
)
|
91
|
159
|
78
|
24
|
(31
|
)
|
3,507
|
859
|
4,366
|
|||||||||||||||||||||||||||||||
|
For the nine-month period ended September 30
|
For the three-month period ended September 30
|
For the year ended December 31
|
||||||||||||||||||
|
2023
|
2022
|
2023
|
2022
|
2022
|
||||||||||||||||
|
(Unaudited)
|
(Unaudited)
|
(Unaudited)
|
(Unaudited)
|
(Audited)
|
||||||||||||||||
|
NIS million
|
NIS million
|
NIS million
|
NIS million
|
NIS million
|
||||||||||||||||
|
Cash flows from operating activities
|
||||||||||||||||||||
|
Profit for the period
|
140
|
180
|
101
|
108
|
217
|
|||||||||||||||
|
Adjustments:
|
||||||||||||||||||||
|
Depreciation, amortization and diesel fuel consumption
|
239
|
147
|
103
|
51
|
210
|
|||||||||||||||
|
Finance expenses, net
|
143
|
18
|
70
|
26
|
47
|
|||||||||||||||
|
Expenses for income tax
|
44
|
57
|
32
|
30
|
65
|
|||||||||||||||
|
Share in profits of associates
|
(179
|
)
|
(190
|
)
|
(79
|
)
|
(124
|
)
|
(286
|
)
|
||||||||||
|
Other income
|
(18
|
)
|
-
|
(18
|
)
|
-
|
-
|
|||||||||||||
|
Share-based payment transactions (including cash-settled transactions in subsequent periods)
|
26
|
31
|
9
|
14
|
62
|
|||||||||||||||
|
395
|
243
|
218
|
105
|
315
|
||||||||||||||||
|
Changes in inventory, trade and other receivables
|
99
|
(17
|
)
|
82
|
2
|
(84
|
)
|
|||||||||||||
|
Changes in trade payables, service providers, other payables and long-term liabilities
|
(52
|
)
|
46
|
(19
|
)
|
69
|
(19
|
)
|
||||||||||||
|
47
|
29
|
63
|
71
|
(103
|
)
|
|||||||||||||||
|
Dividends received from associates
|
7
|
-
|
3
|
-
|
-
|
|||||||||||||||
|
Income tax paid
|
(6
|
)
|
(1
|
)
|
(1
|
)
|
(1
|
)
|
(5
|
)
|
||||||||||
|
Net cash from operating activities
|
443
|
271
|
283
|
175
|
207
|
|||||||||||||||
|
Cash flows from investing activities
|
||||||||||||||||||||
|
Interest received
|
23
|
3
|
8
|
3
|
8
|
|||||||||||||||
|
Short-term restricted deposits and cash, net
|
(17
|
)
|
(33
|
)
|
-
|
1
|
(33
|
)
|
||||||||||||
|
Short term deposits, net
|
125
|
-
|
-
|
-
|
(125
|
)
|
||||||||||||||
|
Provision of short-term collateral(1)
|
-
|
(66
|
)
|
-
|
(66
|
)
|
(79
|
)
|
||||||||||||
|
Release of short-term collateral(1)
|
110
|
17
|
37
|
17
|
17
|
|||||||||||||||
|
Withdrawals from long-term restricted cash
|
-
|
44
|
-
|
-
|
44
|
|||||||||||||||
|
Deposits to long-term restricted cash
|
(1
|
)
|
(1
|
)
|
-
|
1
|
(2
|
)
|
||||||||||||
|
Acquisition of Gat and Mountain Wind, net of cash acquired(2)
|
(893
|
)
|
-
|
-
|
-
|
-
|
||||||||||||||
|
Investment in associates
|
(25
|
)
|
(6
|
)
|
(17
|
)
|
(3
|
)
|
(10
|
)
|
||||||||||
|
Subordinated long-term loans to Valley(3)
|
(87
|
)
|
-
|
-
|
-
|
-
|
||||||||||||||
|
Purchase of property, plant, and equipment, intangible assets and long-term deferred expenses
|
(872
|
)
|
(763
|
)
|
(332
|
)
|
(211
|
)
|
(942
|
)
|
||||||||||
|
Proceeds for derivative financial instruments, net
|
11
|
2
|
2
|
1
|
5
|
|||||||||||||||
|
Other
|
19
|
13
|
11
|
4
|
15
|
|||||||||||||||
|
Net cash used in investing activities
|
(1,607
|
)
|
(790
|
)
|
(291
|
)
|
(253
|
)
|
(1,102
|
)
|
||||||||||
|
|
1. |
Including mainly a collateral provided to secure transactions to hedge energy margins in Valley in 2022, and which was released in the reporting period.
|
|
|
2. |
For further details, see Notes 6A1, 6B, 7A1 and 7A2.
|
|
|
3. |
For further details, see Note 11.
|
|
For the nine-month period ended September 30
|
For the three-month period ended September 30
|
For the year ended December 31
|
||||||||||||||||||
|
2023
|
2022
|
2023
|
2022
|
2022
|
||||||||||||||||
|
(Unaudited)
|
(Unaudited)
|
(Unaudited)
|
(Unaudited)
|
(Audited)
|
||||||||||||||||
|
NIS million
|
NIS million
|
NIS million
|
NIS million
|
NIS million
|
||||||||||||||||
|
Cash flows from financing activities
|
||||||||||||||||||||
|
Proceeds of share issuance, net of issuance costs
|
-
|
815
|
-
|
815
|
815
|
|||||||||||||||
|
Receipt of long-term loans from banking corporations and financial institutions, net(1)
|
1,045
|
246
|
174
|
-
|
282
|
|||||||||||||||
|
Receipt of long-term loans from non-controlling interests
|
50
|
31
|
5
|
11
|
46
|
|||||||||||||||
|
Investments by holders of non-controlling interests in equity of subsidiary
|
231
|
74
|
35
|
37
|
123
|
|||||||||||||||
|
Proceed in respect of restructuring - share exchange and investment transaction with Veridis(2)
|
452
|
-
|
-
|
-
|
-
|
|||||||||||||||
|
Short term loans from banking corporations, net
|
29
|
-
|
5
|
-
|
-
|
|||||||||||||||
|
Interest paid
|
(105
|
)
|
(72
|
)
|
(46
|
)
|
(33
|
)
|
(86
|
)
|
||||||||||
|
Repayment of long-term loans from banking corporations and others
|
(76
|
)
|
(57
|
)
|
(30
|
)
|
(17
|
)
|
(74
|
)
|
||||||||||
|
Repayment of long-term loans as part of the acquisition of Gat(3)
|
(303
|
)
|
-
|
-
|
-
|
-
|
||||||||||||||
|
Repayment of long-term loans from non-controlling interests
|
(105
|
)
|
(35
|
)
|
(31
|
)
|
(21
|
)
|
(89
|
)
|
||||||||||
|
Repayment of debentures
|
(31
|
)
|
(20
|
)
|
(15
|
)
|
(10
|
)
|
(20
|
)
|
||||||||||
|
Proceeds (payment) for derivative financial instruments, net
|
6
|
(5
|
)
|
3
|
(2
|
)
|
(3
|
)
|
||||||||||||
|
Repayment of principal in respect of lease liabilities
|
(6
|
)
|
(5
|
)
|
(2
|
)
|
(2
|
)
|
(8
|
)
|
||||||||||
|
Net cash provided by financing activities
|
1,187
|
972
|
98
|
778
|
986
|
|||||||||||||||
|
Net increase in cash and cash equivalents
|
23
|
453
|
90
|
700
|
91
|
|||||||||||||||
|
Balance of cash and cash equivalents at beginning of period
|
849
|
731
|
818
|
506
|
731
|
|||||||||||||||
|
Effect of exchange rate fluctuations on cash and cash equivalent balances
|
43
|
29
|
7
|
7
|
27
|
|||||||||||||||
|
Balance of cash and cash equivalents at end of period
|
915
|
1,213
|
915
|
1,213
|
849
|
|||||||||||||||
| 1. |
For further details, see Notes 7A1, 7A2 and 7A4.
|
| 2. |
For further details, see Note 6A2.
|
| 3. |
For further details, see Note 6A1.
|
|
|
A. |
Statement of compliance with International Financial Reporting Standards (IFRS)
|
|
|
B. |
Functional and presentation currency
|
|
|
C. |
Use of estimates and judgments
|
|
|
D. |
Reclassification
|
|
|
E. |
Seasonality
|
|
|
A. |
Further to what is stated in Note 27 to the annual financial statements, during the reporting period there were no changes in the composition of the Group’s reportable segments, or in the manner of measuring the results of the segments
by the chief operating decision maker.
|
|
|
B. |
As to changes in the composition of the segments as from December 31, 2022, see Note 27 to the annual financial statements.
|
|
For the nine-month period ended September 30, 2023
|
||||||||||||||||||||||||
|
Israel
|
Energy transition in the USA
|
Renewable energies in the USA
|
Other activities in the USA
|
Adjustments to consolidated
|
Consolidated - total
|
|||||||||||||||||||
|
In NIS million
|
(Unaudited)
|
|||||||||||||||||||||||
|
Revenues from sales and provision of services
|
1,779
|
1,137
|
98
|
94
|
(1,137
|
)
|
1,971
|
|||||||||||||||||
|
EBITDA after proportionate consolidation adjusted1 for the period
|
445
|
437
|
17
|
6
|
(438
|
)
|
467
|
|||||||||||||||||
|
Adjustments:
|
||||||||||||||||||||||||
|
Share in profits of associates
|
179
|
|||||||||||||||||||||||
|
Net pre-commissioning expenses of Zomet
|
(18
|
)
|
||||||||||||||||||||||
|
General and administrative expenses at the US headquarters (not allocated to segments)
|
(72
|
)
|
||||||||||||||||||||||
|
General and administrative expenses at the Company’s headquarters (not allocated to segments)
|
(20
|
)
|
||||||||||||||||||||||
|
Total EBITDA for the period
|
536
|
|||||||||||||||||||||||
|
Depreciation and amortization
|
(215
|
)
|
||||||||||||||||||||||
|
Finance expenses, net
|
(143
|
)
|
||||||||||||||||||||||
|
Other income, net
|
6
|
|||||||||||||||||||||||
|
(352
|
)
|
|||||||||||||||||||||||
|
Profit before taxes on income
|
184
|
|||||||||||||||||||||||
|
Expenses for income tax
|
(44
|
)
|
||||||||||||||||||||||
|
Profit for the period
|
140
|
|||||||||||||||||||||||
|
For the nine-month period ended September 30, 2022 (*)
|
||||||||||||||||||||||||
|
Israel
|
Energy transition in the USA
|
Renewable energies in the USA
|
Other activities in the USA
|
Adjustments to consolidated
|
Consolidated - total
|
|||||||||||||||||||
|
In NIS million
|
(Unaudited)
|
|||||||||||||||||||||||
|
Revenues from sales and provision of services
|
1,279
|
1,470
|
71
|
73
|
(1,470
|
)
|
1,423
|
|||||||||||||||||
|
EBITDA after proportionate consolidation adjusted for the period
|
265
|
389
|
22
|
4
|
(391
|
)
|
289
|
|||||||||||||||||
|
Adjustments:
|
||||||||||||||||||||||||
|
Share in profits of associates
|
190
|
|||||||||||||||||||||||
|
Net pre-commissioning expenses of Zomet
|
(3
|
)
|
||||||||||||||||||||||
|
General and administrative expenses at the US headquarters (not allocated to segments)
|
(64
|
)
|
||||||||||||||||||||||
|
General and administrative expenses at the Company’s headquarters (not allocated to segments)
|
(17
|
)
|
||||||||||||||||||||||
|
Total EBITDA for the period
|
395
|
|||||||||||||||||||||||
|
Depreciation and amortization
|
(140
|
)
|
||||||||||||||||||||||
|
Finance expenses, net
|
(18
|
)
|
||||||||||||||||||||||
|
(158
|
)
|
|||||||||||||||||||||||
|
Profit before taxes on income
|
237
|
|||||||||||||||||||||||
|
Expenses for income tax
|
(57
|
)
|
||||||||||||||||||||||
|
Profit for the period
|
180
|
|||||||||||||||||||||||
| 1 |
For a definition of EBITDA following adjusted proportionate consolidation, please see Note 27 to the annual financial statements.
|
|
For the three-month period ended September 30, 2023
|
||||||||||||||||||||||||
|
Israel
|
Energy transition in the USA
|
Renewable energies in the USA
|
Other activities in the USA
|
Adjustments to consolidated
|
Consolidated - total
|
|||||||||||||||||||
|
In NIS million
|
(Unaudited)
|
|||||||||||||||||||||||
|
Revenues from sales and provision of services
|
781
|
389
|
31
|
39
|
(389
|
)
|
851
|
|||||||||||||||||
|
EBITDA after proportionate consolidation adjusted for the period
|
235
|
169
|
(2
|
)
|
9
|
(168
|
)
|
243
|
||||||||||||||||
|
Adjustments:
|
||||||||||||||||||||||||
|
Share in profits of associates
|
79
|
|||||||||||||||||||||||
|
General and administrative expenses at the US headquarters (not allocated to segments)
|
(25
|
)
|
||||||||||||||||||||||
|
General and administrative expenses at the Company’s headquarters (not allocated to segments)
|
(7
|
)
|
||||||||||||||||||||||
|
Total EBITDA for the period
|
290
|
|||||||||||||||||||||||
|
Depreciation and amortization
|
(98
|
)
|
||||||||||||||||||||||
|
Finance expenses, net
|
(70
|
)
|
||||||||||||||||||||||
|
Other income, net
|
11
|
|||||||||||||||||||||||
|
(157
|
)
|
|||||||||||||||||||||||
|
Profit before taxes on income
|
133
|
|||||||||||||||||||||||
|
Expenses for income tax
|
(32
|
)
|
||||||||||||||||||||||
|
Profit for the period
|
101
|
|||||||||||||||||||||||
|
For the three-month period ended September 30, 2022 (*)
|
||||||||||||||||||||||||
|
Israel
|
Energy transition in the USA
|
Renewable energies in the USA
|
Other activities in the USA
|
Adjustments to consolidated
|
Consolidated - total
|
|||||||||||||||||||
|
In NIS million
|
(Unaudited)
|
|||||||||||||||||||||||
|
Revenues from sales and provision of services
|
498
|
613
|
19
|
33
|
(613
|
)
|
550
|
|||||||||||||||||
|
EBITDA after proportionate consolidation adjusted for the period
|
119
|
181
|
2
|
3
|
(183
|
)
|
122
|
|||||||||||||||||
|
Adjustments:
|
||||||||||||||||||||||||
|
Share in profits of associates
|
124
|
|||||||||||||||||||||||
|
Net pre-commissioning expenses of Zomet
|
(2
|
)
|
||||||||||||||||||||||
|
General and administrative expenses at the US headquarters (not allocated to segments)
|
(25
|
)
|
||||||||||||||||||||||
|
General and administrative expenses at the Company’s headquarters (not allocated to segments)
|
(6
|
)
|
||||||||||||||||||||||
|
Total EBITDA for the period
|
213
|
|||||||||||||||||||||||
|
Depreciation and amortization
|
(49
|
)
|
||||||||||||||||||||||
|
Finance expenses, net
|
(26
|
)
|
||||||||||||||||||||||
|
(75
|
)
|
|||||||||||||||||||||||
|
Profit before taxes on income
|
138
|
|||||||||||||||||||||||
|
Expenses for income tax
|
(30
|
)
|
||||||||||||||||||||||
|
Profit for the period
|
108
|
|||||||||||||||||||||||
|
For the year ended December 31, 2022
|
||||||||||||||||||||||||
|
Israel
|
Energy transition in the USA
|
Renewable energies in the USA
|
Other activities in the USA
|
Adjustments to consolidated
|
Consolidated - total
|
|||||||||||||||||||
|
In NIS million
|
(Audited)
|
|||||||||||||||||||||||
|
Revenues from sales and provision of services
|
1,735
|
1,967
|
95
|
97
|
(1,967
|
)
|
1,927
|
|||||||||||||||||
|
EBITDA adjusted after proportionate consolidation for the year
|
367
|
562
|
26
|
-
|
(564
|
)
|
391
|
|||||||||||||||||
|
Adjustments:
|
||||||||||||||||||||||||
|
Share in profits of associates
|
286
|
|||||||||||||||||||||||
|
Net pre-commissioning expenses of Zomet
|
(10
|
)
|
||||||||||||||||||||||
|
General and administrative expenses at the US headquarters (not allocated to segments)
|
(111
|
)
|
||||||||||||||||||||||
|
General and administrative expenses at the Company’s headquarters (not allocated to segments)
|
(26
|
)
|
||||||||||||||||||||||
|
Total EBITDA for the year
|
530
|
|||||||||||||||||||||||
|
Depreciation and amortization
|
(201
|
)
|
||||||||||||||||||||||
|
Finance expenses, net
|
(47
|
)
|
||||||||||||||||||||||
|
(248
|
)
|
|||||||||||||||||||||||
|
Profit before taxes on income
|
282
|
|||||||||||||||||||||||
|
Expenses for income tax
|
65
|
|||||||||||||||||||||||
|
Profit for the year
|
217
|
|||||||||||||||||||||||
|
For the nine-month period ended September 30
|
For the three-month period ended September 30
|
For the year ended December 31
|
||||||||||||||||||
|
2023
|
2022
|
2023
|
2022
|
2022
|
||||||||||||||||
|
In NIS million
|
(Unaudited)
|
(Unaudited)
|
(Audited)
|
|||||||||||||||||
|
Revenues from sale of electricity in Israel:
|
||||||||||||||||||||
|
Revenues from the sale of energy to private customers
|
1,154
|
891
|
530
|
355
|
1,212
|
|||||||||||||||
|
Revenues from energy sales to the System Operator and other suppliers
|
127
|
79
|
64
|
22
|
107
|
|||||||||||||||
|
Revenues for capacity services
|
30
|
-
|
28
|
|||||||||||||||||
|
Revenues from sale of steam in Israel
|
45
|
44
|
14
|
14
|
62
|
|||||||||||||||
|
Other income in Israel
|
50
|
28
|
7
|
14
|
39
|
|||||||||||||||
|
Total revenues from sale of energy and others in Israel (excluding infrastructure services)
|
1,406
|
1,042
|
643
|
405
|
1,420
|
|||||||||||||||
|
Revenues from private customers for infrastructure services
|
373
|
237
|
138
|
93
|
315
|
|||||||||||||||
|
Total income in Israel
|
1,779
|
1,279
|
781
|
498
|
1,735
|
|||||||||||||||
|
Revenues from the sale of electricity from renewable energy in the USA
|
89
|
65
|
29
|
18
|
87
|
|||||||||||||||
|
Revenues from provision of services in the US
|
103
|
79
|
41
|
34
|
105
|
|||||||||||||||
|
Total income in the USA
|
192
|
144
|
70
|
52
|
192
|
|||||||||||||||
|
Total income
|
1,971
|
1,423
|
851
|
550
|
1,927
|
|||||||||||||||
|
|
1. |
Business combination that took place in the reporting period - acquisition of the Gat Power Plant
|
|
In NIS million
|
||||
|
Cash and cash equivalents
|
2
|
|||
|
Trade and other receivables
|
24
|
|||
|
Property, plant, and equipment and right-of-use assets - facilities and electricity generation and supply license (1)
|
795
|
|||
|
Property, plant, and equipment - land owned by the Gat Partnership (2)
|
84
|
|||
|
Trade and other payables
|
(23
|
)
|
||
|
Loans from former right holders (3)
|
(303
|
)
|
||
|
Deferred tax liability
|
(109
|
)
|
||
|
Identifiable assets, net
|
470
|
|||
|
Goodwill (4)
|
85
|
|||
|
Total consideration (5)
|
555
|
|||
|
|
(1) |
The Group opted to implement the expedient as per IFRS 3, and allocate the fair value of the facilities and the electricity supply license to a single asset. The fair value was estimated using the Multi Period Excess Earning Method
(MPEEM). The valuation methodology included a number of key assumptions that constituted the basis for cash flow forecasts, including, among other things, electricity and gas prices, and nominal post-tax discount rate of 8%-8.75%. The
said assets are amortized over approx. 27 years from the acquisition date, taking into account the expected residual value at the end of the assets’ useful life.
|
|
|
(2) |
The fair value of the land was determined by an external and independent land appraiser using the discounted cash flow technique, at a rate of 8%.
|
|
|
(3) |
As stated above, the loans were repaid immediately after the acquisition date.
|
|
|
(4) |
The goodwill arising as part of the business combination reflects the synergy between the activity of the Gat Power Plant and the Rotem Power Plant.
|
|
|
(5) |
The consideration includes a cash payment of approx. NIS 270 million plus deferred consideration, whose present value is estimated at approx. NIS 285 million as of the Transaction Completion Date.
|
|
In NIS million
|
||||
|
The aggregate cash flows that were used by the Group for the acquisition transaction:
|
||||
|
Cash and cash equivalents paid
|
270
|
|||
|
Cash and cash equivalents acquired
|
(2
|
)
|
||
|
268
|
||||
|
|
A. |
Israel (cont.)
|
|
|
2. |
Restructuring and investment transaction - Veridis transaction
|
|
|
B. |
USA - Renewable energies segment
|
|
In NIS million (based on the USD exchange rate at acquisition date)
|
In USD millions
|
|||||||
|
Trade and other receivables
|
14
|
4
|
||||||
|
Property, plant & equipment (1)
|
451
|
127
|
||||||
|
Intangible assets (1)
|
93
|
26
|
||||||
|
Trade and other payables
|
(3
|
)
|
(1
|
)
|
||||
|
Liabilities in respect of evacuation and removal
|
(5
|
)
|
(2
|
)
|
||||
|
Identifiable assets, net
|
550
|
154
|
||||||
|
Goodwill (2)
|
75
|
21
|
||||||
|
Total consideration
|
625
|
175
|
||||||
|
|
(1) |
The fair value was estimated using the discounted cash flow method. The valuation methodology included a number of key assumptions that constituted the basis for cash flow forecasts, including, among other things, electricity and gas
prices, and nominal post-tax discount rate of 5.75%-6.25%. Intangible assets are amortized over 13 to 17 years, and property, plant, and equipment items are depreciated over 20 to 29 years.
|
|
|
(2) |
The goodwill in the transaction reflects the business potential of the Group’s entry into the renewable energies market in New England, USA. CPV Group expects that the entire amount of the goodwill will be deductible for tax purposes.
|
|
|
A. |
Significant events during and subsequent to the reporting period
|
|
|
1. |
Gat Financing Agreement:
|
|
Loan principal
|
NIS 450 million, repayable in quarterly installments, starting from September 25, 2023, with the final repayment date being May 10, 2039
(subject to the stipulated early repayment provisions in the agreement).
|
|
Interest on the loan
|
• Prime
interest + a spread ranging from 0.4% to 0.9% per annum.
• Conversion from a variable interest to fixed unlinked interest, in accordance with the conversion mechanism (unlinked interest payable on
government bonds as defined in the agreement + a spread ranging from 2.05% to 2.55%), according to the earliest of: four years from the date of the first withdrawal or at the Gat Partnership’s discretion, or at the Bank’s discretion, in
accordance with the forced conversion mechanism, as stipulated in the agreement.
• Repayment
in quarterly installments, starting on June 25, 2023.
|
|
Collateral and pledges
|
• Collateral were provided on all of the Gat Partnership’s assets and rights in it, including the real estate, bank accounts, insurances,
the Gat Partnership’s assets and rights in connection with the Project Agreements (as defined in the agreement).
• A lien was
placed on the rights of the entities holding the Gat Partnership.
• Guarantees were provided by the Company and Veridis Power Plants, each in accordance with its proportionate share in the Gat Partnership,
as well as OPC Power Plants, to pay all principal and accrued interest payments, in connection with the completion of the registration of the collateral and the payment of the Deferred Consideration balance in the transaction for the
purchase of the Gat Power Plant under the circumstances and subject to the terms set in the letter of guarantee.
|
|
Liabilities
|
The agreement prescribes certain restrictions and liabilities as is generally accepted in agreements of this type, including:
• Prohibition on pledging
assets, and restrictions on the sale and transfer of assets;
• Restrictions on assuming
financial debts and providing guarantees;
• requirement to obtain
Bank Leumi’s approval for engagement in material agreements and other material actions;
• Undertaking in connection
with holding certain reserve deposits for maintenance and debt service;
• Bank Leumi was granted
veto rights and other rights in connection with certain decisions as is generally accepted in agreements of this type;
• Undertaking to obtain
rating for the project under certain circumstances.
|
|
Financial covenants and default events
|
The agreement prescribes standard default events as is generally accepted in agreements of this type, including:
• Various default events;
• Shutdown of the Gat Power
Plant;
• Payment default;
• Events that have a material
adverse effect;
• Cross-default events by parties
to certain project agreements;
• certain events relating to the
project (as defined in the agreement);
• Certain changes in
ownership/control;
• Certain force majeure events;
• Events associated with
insurance coverage of activity of the Gat Power Plant;
• Non‑compliance with the financial ratios as set out in Note 7C and OPC Power Plants and certain other Group entities’ non-compliance with certain financial
covenants;
• Certain legal proceedings in
connection with the Gat Partnership.
|
|
Conditions for distribution
|
Distributions by the Gat Partnership (as defined in the Gat Financing Agreement, including a repayment of shareholder loans) is subject to a
number of terms and conditions outlined in the agreement, including, among other things:
• Compliance with the following
financial covenants: Historic DSCR, Average Projected DSCR and LLCR at a minimal rate of 1.15;
• A first quarterly principal and
interest payment was made;
• The provisions of the agreement
were complied with;
• no more than four distributions
will be carried out in a 12-month period.
|
|
|
A. |
Significant events during and subsequent to the reporting period (cont.)
|
|
|
1. |
Gat Financing Agreement: (cont.)
|
|
|
2. |
Mountain Wind financing agreement
|
|
|
A. |
Significant events during and subsequent to the reporting period (cont.)
|
|
|
3. |
Tax equity partner agreement in Maple Hill
|
|
|
A. |
Significant events during and subsequent to the reporting period (cont.)
|
|
|
4. |
Financing agreement for construction in the US Renewable Energies segment
|
|
Lenders
|
International and Israeli banking corporations (with an option to expand the group of lenders by way of syndication) (hereinafter in this section - the “Financing Entities”).
|
|
Financing of Construction
|
On the Financial Closing Date of the financing agreement (hereinafter - the “Financial Closing Date), the above maximum Financing of Construction amount will be set in accordance with the
projects’ compliance with the scope of leveraging principles, such that each project is required to meet a projected minimum DSCR ratio of 1.3,4 based on the stream of revenues from PPAs and green certificates, and 1.8 based on
the stream of revenues from market sales (hereinafter - the “Leveraging Ratios”).5 It should be noted that for each project, the compliance with the Leveraging Ratios will be assessed on the date of the first withdrawal (and as
a condition thereof), and at the end of the completion of construction work (hereinafter - the “Conversion Date”). The Financing of Construction amount that may be converted on the Conversion Date (if any) into financing for the initial
commercial operation period shall be determined in accordance with the assessment of the compliance with the Leveraging Ratios as of that date.
|
| 3 |
The classification as a “qualifying project” is conditional upon the project’s meeting generally accepted conditions for senior debt financing as part of a non-recourse project
financing.
|
|
4
|
The ratio between the free cash flow for debt service and the principal and interest payments for the relevant period.
|
|
5
|
The Financing of Construction amount, as of the financial closing date, will meet the leverage ratios as of that date. If a project shall not
comply with the leverage ratios at the first withdrawal date of the Financing of Construction or at the abovementioned Conversion Date, as the case may be, the total Financing Commitment allocated thereto will be reduced to the
level at which it will comply with the Leveraging Ratios described above.
|
|
|
A. |
Significant events during and subsequent to the reporting period (cont.)
|
|
|
4. |
Financing agreement for construction in the US Renewable Energies segment (cont.)
|
|
Conditions for first withdrawal or conversion
|
The conditions for first withdrawal for each qualifying project include, among other things, compliance of the Financing of Construction amount with the Leveraging Ratios, and the
provision of a minimum equity amount (under certain conditions, surplus amounts may be diverted from a qualifying project in favor of another qualifying project, as described below).
Furthermore, the withdrawal of financing by each project is subject to the relevant project’s compliance with financial covenants that are generally accepted in project financing, to the submission of
withdrawal requests, and to the following:
Financing of Construction: As of the Financial Closing Date, the Maple Hill and Stagecoach projects meet the said conditions (including the above Leveraging Ratios).
As stated above, on each project’s Conversion Date, the project’s compliance with the Leveraging Ratios will be assessed as a condition for the conversion of the Financing of Construction
amount into a loan for the initial commercial operation period instead of full repayment of the Financing of Construction amount on that date if it has not been converted.
Letters of credit: - The total amount of letters of credit is based on the project’s needs in accordance with the commercial arrangement, and on the conversion date - subject to an
undertaking to provide a collateral at the amount of the projected debt service in a 6-month period, for each project and in accordance with the provisions of the Financing Agreement.
Bridge Loan is subject to the provision of the tax equity partner’s undertaking as defined in the Financing Agreement. The amount of the Bridge Loan that may be withdrawn for a
qualifying project is limited to up to 98% of the liabilities of the project’s tax equity partner.
|
|
Final repayment date
|
The earlier of 4 years after the Financial Closing Date or a year after the Conversion Date of the third qualifying project.
|
|
Interest and linkage, other costs
|
The loans for each project bear annual interest based on SOFR plus a margin as follows:
Financing of Construction6: approx. 2%.
Bridge Loan: approx. 1.25%.
Letters of credit: Issued for an annual issuance fee as is generally accepted in facilities of this type.
In addition, a facility fee will apply to unutilized amounts as is generally accepted in financing arrangements of this type, and the projects will bear transaction costs and other fees and commissions,
including in connection with the organization of the financing and the syndication.
|
|
Early repayment dates of Financing of Construction (principal and interest)
|
Repayment of principal:
• For each project, starting on the conversion date of each project (if it is converted), in quarterly installments in accordance with the amortization schedule set in the Financing Agreement, and on the loan
repayment date - a single installment of the outstanding principal balance. If no conversion will be carried out, the repayment date will take place at the end of the construction period.
• For each project, a cash-sweep mechanism will apply to 50% of the quarterly free cash flow after debt service (the remaining 50% shall be retained as a reserve and may be utilized for another qualifying project
subject to compliance with certain conditions).
The interest will be repaid in monthly or quarterly installments, subject to the Borrower’s discretion.
|
|
6
|
It should be noted that if CPV Group will convert the Financing of Construction amount to finance the initial commercial operation period, approx. a 2.75% margin
will apply.
|
|
|
A. |
Significant events during and subsequent to the reporting period (cont.)
|
|
|
4. |
Financing agreement for construction in the US Renewable Energies segment (cont.)
|
|
Additional material terms and conditions
|
• The financing agreement includes grounds for immediate repayment that are standard in project financing agreements of this type, including, inter alia – breach of representations and commitments that have a material
adverse effect, default events, non‑compliance with certain obligations, various insolvency events, winding down of the project or termination of significant parties in the project (as defined in the agreement), occurrence of certain
events relating to the regulatory status of the project and holding regulatory approvals, certain changes in ownership of the project, certain events in connection with the project, existence of legal proceedings relating to the
project, and a situation wherein the project is not entitled to receive payments for capacity and electricity – all in accordance with and subject to the terms and conditions, definitions and periods detailed in the financing agreement.
• The three projects are pledged in favor of the lenders in order to secure the undertakings under the Financing Agreement, and a cross default provision is in place between the projects.
• The Borrower may use the surplus equity and/or surplus cash flows of a qualifying project in order to support another qualifying project’s needs and requirements, subject to the conditions that were set.
|
|
Collateral, pledges, guarantees
|
Collaterals and liens are provided in favor of the Financing Entities on all of the projects’ assets and the rights arising therefrom, and in respect of which a withdrawal was made or
credit letters were provided (and in respect of each qualifying asset that will be added).
CPV Group provided a guarantee to secure certain undertakings in connection with the Financing Agreement, including an undertaking to bear the expenses that will apply to the project as a
result of changes to the law in connection with the tax benefits that will arise from the projects, in respect of costs pertaining to breach of a warranty claim by the solar panels supplier, in respect of costs incurred by the projects
(if any) in connection with customs payable with respect to the solar panels, and the Maple Hill project’s failure to meet the dates-related undertakings to the tax equity partner, all in accordance with and subject to the conditions set
in the Financing Agreement.
|
|
|
5. |
During the reporting period, the Company published a shelf prospectus that will be in effect through May 31, 2026.
|
|
|
6. |
On August 1, 2023, Maalot (S&P) reiterated the rating of the Company and its debentures at ‘ilA-’, and updated the outlook to negative.
|
|
|
7. |
Further to what is stated in Note 16B3 to the annual financial statements regarding the NIS 400 million credit facility agreement with Harel, in September 2023 the Company informed Harel, that it will not renew the credit facility by a
further year, and accordingly the credit facility expired at the end of October 2023.
|
|
|
A. |
Significant events during and subsequent to the reporting period (cont.)
|
|
|
8. |
Short-term credit facilities from Israeli banks:
|
|
Facility amount
|
Actual amount utilized (1), (2)
|
|||||||
|
The Company
|
300
|
10
|
||||||
|
OPC Israel
|
250
|
-
|
||||||
|
The Company for CPV Group (1)
|
365 (approx. USD 95 million)
|
155 (approx. USD 40 million)
|
||||||
|
Total
|
915
|
165
|
||||||
|
|
(1) |
For the purpose of letters of credit and bank guarantees.
|
|
|
(2) |
Furthermore, as at the report date, the Company utilized unsecured credit facilities for the purpose of letters of credit and bank guarantees at the total amount of approx. NIS 405 million. The utilization of unsecured facilities is
subject to the discretion of any financing entity on a case-by-case basis on every utilization request date, and therefore there is no certainty as to the ability to utilize them.
|
|
|
B. |
Changes in the Group’s material guarantees:
|
|
As at September 30, 2023
|
As at December 31, 2022
|
|||||||
|
For operating projects in Israel (Rotem, Hadera and the Gat Power Plant) (1)
|
145
|
111
|
||||||
|
For Zomet (2)
|
90
|
74
|
||||||
|
For projects under construction and development in Israel (Sorek and consumers’ premises)
|
47
|
54
|
||||||
|
For virtual supply activity in Israel
|
82
|
62
|
||||||
|
In respect of the Eshkol tender
|
51
|
-
|
||||||
|
For operating projects in the US Renewable Energies Segment
|
89
|
50
|
||||||
|
In respect of projects under construction and development in the USA (Group 3) (CPV)
|
195
|
90
|
||||||
|
Total
|
699
|
441
|
||||||
|
|
(1) |
The increase arises mainly from an increase in bank guarantees provided by the companies in favor of the System Operator in the ordinary course of business.
|
|
|
(2) |
The increase in the balance of guarantees stems mainly from an increase in bank guarantees provided by the Company in the name of Zomet in favor of the Israeli Electricity Authority in respect of the permanent generation license, and
in favor of Zomet’s lenders as part of the Equity Subscription Agreement (as described in Note 16B2 to the annual financial statements).
|
|
|
(3) |
The increase stems mainly from an increase in bank guarantees provided to various third parties in connection with a renewable energies project under advanced development.
|
|
|
C. |
Financial covenants:
|
|
Ratio
|
Required value Series B
|
Required value Series C
|
Actual value
|
|||
|
Net financial debt (1) to adjusted EBITDA (2)
|
will not exceed 13 (for distribution purposes - 11)
|
will not exceed 13 (for distribution purposes - 11)
|
5.6
|
|||
|
The Company shareholders’ equity (separate)
|
will not fall below NIS 250 million (for distribution purposes - NIS 350 million)
|
will not fall below NIS 1 billion (for distribution purposes - NIS 1.4 billion)
|
Approx. NIS 4,057 million
|
|||
|
The Company’s equity to asset ratio (separate)
|
will not fall below 17% (for distribution purposes - 27%)
|
will not fall below 20% (for distribution purposes - 30%)
|
68%
|
|||
|
The Company’s equity to asset ratio (consolidated)
|
--
|
will not fall below 17%
|
44%
|
|
|
C. |
Financial covenants: (cont.)
|
|
Financial covenants
|
Breach ratio
|
Actual value
|
|||
|
Covenants applicable to Hadera in connection with the Hadera Financing Agreement
|
|||||
|
Minimum projected DSCR
|
1.10
|
1.19
|
|||
|
Average projected DSCR
|
1.10
|
1.56
|
|||
|
LLCR
|
1.10
|
1.68
|
|||
|
Covenants applicable to the Company in connection with the Hadera Equity Subscription Agreement
|
|||||
|
Company’s shareholders equity (separate) (through the end of the construction contractor’s warranty period)
|
will not fall below NIS 250 million
|
Approx. NIS 4,057 million
|
|||
|
The Company’s equity to asset ratio (separate)
|
will not fall below 20%
|
68%
|
|||
|
Minimum cash balance or bank guarantee from Hadera’s commercial operation date through the end of the construction contractor’s warranty period
|
will not fall below NIS 50 million
|
Approx. NIS 332 million
|
|||
|
Covenants applicable to Zomet in connection with the Zomet Financing Agreement (1)
|
|||||
|
Expected ADSCR
|
1.05
|
1.37
|
|||
|
Historic ADSCR
|
1.05
|
N/A
|
|||
|
LLCR
|
1.05
|
1.42
|
|||
|
Covenants applicable to the Gat Partnership in connection with the Gat Financing Agreement
|
|||||
|
Minimum projected DSCR
|
1.05
|
1.35
|
|||
|
Average projected DSCR
|
1.05
|
1.35
|
|||
|
LLCR
|
1.05
|
1.36
|
|||
|
Covenants applicable to OPC Power Plants in connection with the Gat Equity Subscription Agreement
|
|||||
|
OPC Power Plants’ total assets balance
|
will not fall below NIS 2,500 million
|
Approx. NIS 5,603 million
|
|||
|
OPC Power Plant’s equity to asset ratio
|
will not fall below 15%
|
33%
|
|||
|
Ratio of net debt to adjusted EBITDA of OPC Power Plants
|
will not exceed 12
|
2.9
|
|||
|
OPC Power Plants’ minimum cash balance
|
will not fall below NIS 30 million
|
Approx. NIS 217 million
|
|||
|
OPC Power Plants’ minimum cash balance (”separate”)
|
will not fall below NIS 20 million
|
Approx. NIS 21 million
|
|||
|
Covenants applicable to the Company in connection with the Harel credit facility
|
|||||
|
The Company shareholders’ equity (separate)
|
will not fall below NIS 550 million
|
Approx. NIS 4,057 million
|
|||
|
The Company’s equity to asset ratio (separate)
|
will not fall below 20%
|
68%
|
|||
|
The Company’s net debt to adjusted EBITDA ratio
|
will not exceed 12
|
5.6
|
|||
|
The LTV of the pledged rights
|
will be less than 50%
|
N/A
|
|||
|
Covenants applicable to the Company in connection with the Discount credit facility
|
|||||
|
The Company shareholders’ equity (separate)
|
will not fall below NIS 1,000 million
|
Approx. NIS 4,057 million
|
|||
|
The Company’s equity to asset ratio (separate)
|
will not fall below 20%
|
68%
|
|||
|
Covenants applicable to the Company in connection with the Mizrahi and Hapoalim credit facilities
|
|||||
|
The Company shareholders’ equity (separate)
|
will not fall below NIS 1,200 million
|
Approx. NIS 4,057 million
|
|||
|
The Company’s equity to asset ratio (separate)
|
Will not fall below 40% (in respect of Hapoalim) and below 30% (in respect of Mizrahi)
|
68%
|
|||
|
The Company’s net debt to adjusted EBITDA ratio
|
Will not exceed 12
|
5.6
|
|||
|
Covenants applicable to OPC Israel in connection with the Mizrahi credit facility
|
|||||
|
OPC Israel’s standalone shareholders’ equity, including non-controlling interests
|
will not fall below NIS 500 million
|
Approx. NIS 2,125 million
|
|||
|
OPC Israel’s equity to asset ratio (consolidated)
|
will not fall below 20%
|
37%
|
|||
|
The Company’s net debt to adjusted EBITDA ratio
|
will not exceed 10
|
2.9
|
|||
|
|
(1) |
It should be noted that according to the Zomet Financing Agreement the historical ADSCR financial covenant shall be assessed for the first time after the first repayment date of the loans principal.
|
|
|
D. |
Issuance of shares in respect of share-based payment and exercise of options
|
|
|
1. |
Options - during the reporting period, the Company issued additional 7,975 ordinary shares of the Company of NIS 0.01 par value each to Group officers following announcements of net exercise of
22,786 options.
|
|
|
2. |
RSUs - during the reporting period, the Company issued a total of 14,017 ordinary shares of the Company of NIS 0.01 par value each to Group officers in view of the vesting of some of the RSUs
awarded to them as part of an equity-based compensation plan to Company’s employees as described in Note 18B to the Annual Financial Statements.
|
|
|
A. |
Commitments
|
|
|
1. |
In June 2023, CPV Group entered into a construction agreement with a construction contractor in respect of the construction of a solar-powered project with a capacity of 170 MWdc located in Maryland, United States (hereinafter - the
“Backbone Project”). In accordance with the agreement, the contractor is required to plan, purchase, install, build, test, and operate the solar project in full, on a turnkey basis. As of the approval date of the report, the total
consideration in the EPC agreement was set at a fixed amount of approx. NIS 650 million (approx. USD 175 million), which will be paid in accordance with the milestones set in the construction agreement.
|
|
|
2. |
In the reporting period, an agreement for the lease of land for the Backbone project entered into force in CPV Group. The term of the agreement is 37 years, with an option to extend the term by five further periods of seven years each.
During the reporting period, a lease liability and a right-of-use asset in the amount of approx. NIS 122 million (approx. USD 33 million) were recognized.
|
|
|
3. |
Further to what is stated in Note 28C3 to the annual financial statements regarding Rotem and Hadera’s natural gas purchase agreements with Energean Israel Limited (hereinafter – “Energean”), in the reporting period Energean issued
Hadera with a notice regarding the completion of the commissioning for the purpose of the Hadera agreement on February 28, 2023; Energean also issued Rotem with a notice regarding the completion of the commissioning for the purpose of the
Rotem agreement on March 25, 2023, and a notice regarding commercial operation on March 26, 2023.
|
|
|
4. |
Further to what is stated in Note 11B1(e) to the annual financial statements regarding the filing of the appraisal appeal by the joint corporation in respect of the assessment that was issued by the Israel Lands Authority (hereinafter
- “ILA”) in respect of the land of the Zomet Power Plant, in January 2023, a decision was made regarding the initial appeal, whereby the amount of the final assessment was reduced to NIS 154
million (excluding VAT). In May 2023, Zomet appealed against the decision regarding the appeal.
|
|
|
B. |
Claims and other liabilities
|
|
|
1. |
Following on Note 28A2 to the Annual Financial Statements regarding the motion to certify a derivative claim on transactions to purchase natural gas from Energean and the Tamar Group and transactions to sell excess natural gas to
Bazan, in a new ruling handed down in November 2023, the Court dismissed the entire motion.
|
|
|
2. |
Further to what is stated in Note 28A1 to the annual financial statements regarding a motion for certification of a derivative lawsuit regarding the power purchase transaction, in February 2023 the court handed down a judgment that
approved the settlement agreement, and during the reporting period, Rotem paid a total of NIS 2 million, which reflects its share as set out in the settlement agreement.
|
|
|
3. |
Further to what is stated in Note 28A4 to the annual financial statements, regarding the arbitration proceeding conducted with the Hadera construction contractor, the latter’s request to amend its pleadings was allowed, such that the
contractor may add a claim for receipt of a final acceptance certificate of the power plant under the construction agreement; the amended pleadings were subsequently filed. In April 2023, the Company filed its response to the amended
pleadings and a counter-claim. As of the approval date of the report, evidentiary hearings in the proceeding were scheduled for June 2024.
|
|
|
A. |
Financial instruments measured at fair value for disclosure purposes only
|
|
As at September 30, 2023
|
||||||||
|
Carrying amount (*)
|
Fair value
|
|||||||
|
(Unaudited)
|
(Unaudited)
|
|||||||
|
NIS million
|
NIS million
|
|||||||
|
Loans from banks and financial institutions (Level 2)
|
2,962
|
2,973
|
||||||
|
Loans from non‑controlling interests (Level 2)
|
426
|
399
|
||||||
|
Debentures (Level 1)
|
1,841
|
1,682
|
||||||
|
5,229
|
5,054
|
|||||||
|
As at September 30, 2022
|
||||||||
|
Carrying amount (*)
|
Fair value
|
|||||||
|
(Unaudited)
|
(Unaudited)
|
|||||||
|
NIS million
|
NIS million
|
|||||||
|
Loans from banks and financial institutions (Level 2)
|
1,786
|
1,838
|
||||||
|
Loans from non‑controlling interests (Level 2)
|
473
|
431
|
||||||
|
Debentures (Level 1)
|
1,834
|
1,722
|
||||||
|
4,093
|
3,991
|
|||||||
|
As at December 31, 2022
|
||||||||
|
Carrying amount (*)
|
Fair value
|
|||||||
|
(Audited)
|
(Audited)
|
|||||||
|
NIS million
|
NIS million
|
|||||||
|
Loans from banks and financial institutions (Level 2)
|
1,817
|
1,859
|
||||||
|
Loans from non‑controlling interests (Level 2)
|
437
|
400
|
||||||
|
Debentures (Level 1)
|
1,854
|
1,734
|
||||||
|
4,108
|
3,993
|
|||||||
|
|
B. |
Fair value hierarchy of financial instruments measured at fair value
|
|
As at September 30
|
As at December 31
|
|||||||||||
|
2023
|
2022
|
2022
|
||||||||||
|
In NIS million
|
(Unaudited)
|
(Audited)
|
||||||||||
|
Financial assets
|
||||||||||||
|
Derivatives used for hedge accounting
|
||||||||||||
|
CPI swap contracts (Level 2)
|
38
|
34
|
*33
|
|||||||||
|
Interest rate swaps (USA) (Level 2)
|
43
|
25
|
24
|
|||||||||
|
Forwards on exchange rates (Level 2)
|
1
|
6
|
2
|
|||||||||
|
Total
|
82
|
65
|
59
|
|||||||||
|
|
A. |
Subsequent to the reporting period, on October 7, 2023 the “Iron Swords” war (hereinafter – the “War”) broke out in Israel following a murderous attack by the terrorist organization Hamas on settlements surrounding the Gaza Strip in
the south of Israel. Naturally, the war led to consequences and restrictions that affected the Israeli economy, which include, among other things, a decline in business activity, extensive recruitment of reservists, restrictions on
gatherings in workplaces and public spaces, restrictions on the activity of the education system, and more. The effects of the War also include a significant uncertainty as to the War’s impact on macroeconomic factors in Israel and on the
financial position of the State of Israel, including potential adverse effects on the credit rating of the State of Israel and Israeli financial institutions (specifically the Israeli banking system), sharp changes in exchange rates,
specifically the strengthening of the US dollar against the shekel, and instability in the Israeli capital market (including increased volatility, slumps, and restricted liquidity and accessibility).
|
|
|
B. |
In the nine‑month periods ended September 30, 2023 and 2022 the Group purchased property, plant and equipment for a total of approx. NIS 1,991 million and approx. NIS 555 million, respectively, including property, plant and equipment
purchased under a business combination during the nine-month period ended September 30, 2023, for a total of approx. NIS 1,321 million, as detailed in Notes 6A1 and 6B.
|
|
|
C. |
On June 22, 2023 and July 20, 2023, the commercial operation period of the Zomet and Three Rivers power plants commenced (CPV Group’s share - 10%), respectively.
|
|
|
D. |
Further to what is stated in Note 18C to the annual financial statements regarding a profit-sharing plan for CPV Group employees, the Plan’s fair value as of the report date amounted to approx. NIS 159 million (approx. USD 42 million);
this value was estimated using the option pricing model (OPM), based on a standard deviation of 29%, risk-free interest of 4.9%, and remaining expected useful life until exercise of 2.3 years. In the reporting period, approx. NIS 17
million in expenses were recognized (approx. NIS 19 million in the corresponding period last year).
|
|
|
E. |
Further to Note 25A2 to the annual financial statements, in the reporting period, the Company and non-controlling interests made equity investments in OPC Power Ventures LP (both directly and indirectly) totaling approx. NIS 565
million (approx. USD 150 million) and extended loans totaling approx. NIS 175 million (approx. USD 45 million), based on their stake in the Partnership. After utilizing the entire investment commitment and shareholder loans in July 2023,
the facility was increased by USD 100 million (the Company’s share in the facility - USD 70 million).
|
|
|
F. |
For more information regarding developments in credit from banking corporations and others, debentures, guarantees and equity in the reporting period and thereafter, see note 7.
|
|
|
G. |
For more information regarding developments in commitments, legal claims and other liabilities in the reporting period and thereafter, see Note 8.
|
|
|
H. |
On May 10, 2023, it was announced that the Group through OPC Power Plants (hereinafter - the “Winner”) won the tender issued by ILA for planning and an option to purchase leasehold rights in land for the construction of renewable
energy electricity generation facilities using photovoltaic technology in combination with storage in relation to three compounds in the Neot Hovav Industrial Local Council, with a total area of approx. 227 hectares. The Group’s bids in
this Tender total approx. NIS 484 million, in the aggregate, for all three Tender Compounds.
|
| A. |
The annual repayments of the loan principal until a Title V permit is received (if it is, indeed, received) and reaching a certain leveraging ratio as set in the amendment and extension agreement shall amount to the entire free cash
flow amount of Valley (100% cash sweep). After receiving the Title V permit and complying with the coverage ratio that was set, the annual repayment amount shall vary, and will be calculated based of a combination of a fixed predetermined
amortization schedule and a 50% cash sweep mechanism, such that the entire free cash flow in excess of the said amount will be available to Vally, and will be used to cover operating costs, service the debt, and other liquidity needs.
|
| B. |
On the signing date of the Amendment and Extension Agreement, Valley repaid NIS 200 million (approx. USD 55 million; CPV Group’s share - 50%) by advancing subordinated shareholder loans to Valley (the Company’s share in the said
shareholder loans is NIS 61 million, approx. USD 17 million).
|
| C. |
The base interest was revised to SOFR-based interest plus a weighted average interest margin of 5.75% for the project).
|
|
As at September 30, 2023
|
||||||||||||||||
|
US GAAP
|
Adjustments
|
IFRS
|
||||||||||||||
|
In USD thousand
|
In USD thousand
|
In USD thousand
|
||||||||||||||
|
Cash and cash equivalents
|
97
|
8,769
|
8,866
|
|||||||||||||
|
Restricted cash
|
8,769
|
(8,769
|
)
|
-
|
||||||||||||
|
Property, plant & equipment
|
A, C, D
|
|
771,593
|
(157,143
|
)
|
614,450
|
||||||||||
|
Intangible assets
|
D |
|
20,102
|
(20,102
|
)
|
-
|
||||||||||
|
Other assets
|
66,075
|
-
|
66,075
|
|||||||||||||
|
Total assets
|
866,636
|
(177,245
|
)
|
689,391
|
||||||||||||
|
Accounts payable and deferred expenses
|
A |
|
10,533
|
(1,702
|
)
|
8,831
|
||||||||||
|
Other liabilities
|
457,411
|
(2,775
|
)
|
454,636
|
||||||||||||
|
Total liabilities
|
467,944
|
(4,477
|
)
|
463,467
|
||||||||||||
|
Partners’ equity
|
A, C
|
|
398,692
|
(172,768
|
)
|
225,924
|
||||||||||
|
Total liabilities and equity
|
866,636
|
(177,245
|
)
|
689,391
|
||||||||||||
|
As at September 30, 2022
|
||||||||||||||||
|
US GAAP
|
Adjustments
|
IFRS
|
||||||||||||||
|
In USD thousand
|
In USD thousand
|
In USD thousand
|
||||||||||||||
|
Cash and cash equivalents
|
97
|
6,312
|
6,409
|
|||||||||||||
|
Restricted cash
|
9,878
|
(6,312
|
)
|
3,566
|
||||||||||||
|
Property, plant & equipment
|
A, C, D
|
|
792,690
|
(168,991
|
)
|
623,699
|
||||||||||
|
Intangible assets
|
D |
|
20,353
|
(20,353
|
)
|
-
|
||||||||||
|
Other assets
|
79,534
|
-
|
79,534
|
|||||||||||||
|
Total assets
|
902,552
|
(189,344
|
)
|
713,208
|
||||||||||||
|
Accounts payable and deferred expenses
|
A
|
|
24,618
|
(1,466
|
)
|
23,152
|
||||||||||
|
Other liabilities
|
525,558
|
-
|
525,558
|
|||||||||||||
|
Total liabilities
|
550,176
|
(1,466
|
)
|
548,710
|
||||||||||||
|
Partners’ equity
|
A,C
|
|
352,376
|
(187,878
|
)
|
164,498
|
||||||||||
|
Total liabilities and equity
|
902,552
|
(189,344
|
)
|
713,208
|
||||||||||||
|
As at December 31, 2022
|
||||||||||||||||
|
US GAAP
|
Adjustments
|
IFRS
|
||||||||||||||
|
In USD thousand
|
In USD thousand
|
In USD thousand
|
||||||||||||||
|
Cash and cash equivalents
|
145
|
1,041
|
1,186
|
|||||||||||||
|
Restricted cash
|
4,630
|
(1,041
|
)
|
3,589
|
||||||||||||
|
Property, plant & equipment
|
A, C, D
|
|
786,365
|
(165,597
|
)
|
620,768
|
||||||||||
|
Intangible assets
|
D |
|
20,604
|
(20,604
|
)
|
-
|
||||||||||
|
Other assets
|
112,188
|
-
|
112,188
|
|||||||||||||
|
Total assets
|
923,932
|
(186,201
|
)
|
737,731
|
||||||||||||
|
Accounts payable and deferred expenses
|
A |
|
31,775
|
(1,409
|
)
|
30,366
|
||||||||||
|
Other liabilities
|
518,259
|
-
|
518,259
|
|||||||||||||
|
Total liabilities
|
550,034
|
(1,409
|
)
|
548,625
|
||||||||||||
|
Partners’ equity
|
A, C
|
|
373,898
|
(184,792
|
)
|
189,106
|
||||||||||
|
Total liabilities and equity
|
923,932
|
(186,201
|
)
|
737,731
|
||||||||||||
|
For the nine-month period ended September 30, 2023
|
||||||||||||||||
|
US GAAP
|
Adjustments
|
IFRS
|
||||||||||||||
|
In USD thousand
|
In USD thousand
|
In USD thousand
|
||||||||||||||
|
Revenues
|
162,353
|
-
|
162,353
|
|||||||||||||
|
Operating expenses
|
A |
|
96,062
|
(4,218
|
)
|
91,844
|
||||||||||
|
Depreciation and amortization
|
C |
|
19,552
|
(5,032
|
)
|
14,520
|
||||||||||
|
Operating profit
|
46,739
|
9,250
|
55,989
|
|||||||||||||
|
Finance expenses
|
B
|
|
32,815
|
(4,869
|
)
|
27,946
|
||||||||||
|
Profit for the period
|
13,924
|
14,119
|
28,043
|
|||||||||||||
|
Other comprehensive income - derivative financial instruments
|
B |
|
10,870
|
(2,094
|
)
|
8,776
|
||||||||||
|
Comprehensive income for the period
|
24,794
|
12,025
|
36,819
|
|||||||||||||
|
For the nine-month period ended September 30, 2022
|
||||||||||||||||
|
US GAAP
|
Adjustments
|
IFRS
|
||||||||||||||
|
In USD thousand
|
In USD thousand
|
In USD thousand
|
||||||||||||||
|
Revenues
|
305,725
|
-
|
305,725
|
|||||||||||||
|
Operating expenses
|
A |
|
226,620
|
(4,194
|
)
|
222,426
|
||||||||||
|
Depreciation and amortization
|
C |
|
19,367
|
(5,032
|
)
|
14,335
|
||||||||||
|
Operating profit
|
59,738
|
9,226
|
68,964
|
|||||||||||||
|
Finance expenses
|
B |
|
24,027
|
(5,030
|
)
|
18,997
|
||||||||||
|
Profit for the period
|
35,711
|
14,256
|
49,967
|
|||||||||||||
|
Other comprehensive income (loss) - derivative financial instruments
|
B |
|
767
|
(5,030
|
)
|
(4,263
|
)
|
|||||||||
|
Comprehensive income for the period
|
36,478
|
9,226
|
45,704
|
|||||||||||||
|
For the three-month period ended September 30, 2023
|
||||||||||||||||
|
US GAAP
|
Adjustments
|
IFRS
|
||||||||||||||
|
In USD thousand
|
In USD thousand
|
In USD thousand
|
||||||||||||||
|
Revenues
|
54,402
|
-
|
54,402
|
|||||||||||||
|
Operating expenses
|
A |
|
32,827
|
(1,703
|
)
|
31,124
|
||||||||||
|
Depreciation and amortization
|
C |
|
6,522
|
(1,677
|
)
|
4,845
|
||||||||||
|
Operating profit
|
15,053
|
3,380
|
18,433
|
|||||||||||||
|
Finance expenses
|
B |
|
11,591
|
333
|
11,924
|
|||||||||||
|
Profit for the period
|
3,462
|
3,047
|
6,509
|
|||||||||||||
|
Other comprehensive income - derivative financial instruments
|
B |
|
11,220
|
-
|
11,220
|
|||||||||||
|
Comprehensive income for the period
|
14,682
|
3,047
|
17,729
|
|||||||||||||
|
For the three-month period ended September 30, 2022
|
||||||||||||||||
|
US GAAP
|
Adjustments
|
IFRS
|
||||||||||||||
|
In USD thousand
|
In USD thousand
|
In USD thousand
|
||||||||||||||
|
Revenues
|
116,064
|
-
|
116,064
|
|||||||||||||
|
Operating expenses
|
A |
|
83,323
|
(1,465
|
)
|
81,858
|
||||||||||
|
Depreciation and amortization
|
C |
|
6,475
|
(1,677
|
)
|
4,798
|
||||||||||
|
Operating profit
|
26,266
|
3,142
|
29,408
|
|||||||||||||
|
Finance expenses
|
B |
|
8,413
|
(1,572
|
)
|
6,841
|
||||||||||
|
Profit for the period
|
17,853
|
4,714
|
22,567
|
|||||||||||||
|
Other comprehensive loss - derivative financial instruments
|
B |
|
(4,309
|
)
|
(1,572
|
)
|
(5,881
|
)
|
||||||||
|
Comprehensive income for the period
|
13,544
|
3,142
|
16,686
|
|||||||||||||
|
For the year ended December 31, 2022
|
||||||||||||||||
|
US GAAP
|
Adjustments
|
IFRS
|
||||||||||||||
|
In USD thousand
|
In USD thousand
|
In USD thousand
|
||||||||||||||
|
Revenues
|
405,548
|
-
|
405,548
|
|||||||||||||
|
Operating expenses
|
A |
|
296,645
|
(5,603
|
)
|
291,042
|
||||||||||
|
Depreciation and amortization
|
C |
|
25,714
|
(6,709
|
)
|
19,005
|
||||||||||
|
Operating profit
|
83,189
|
12,312
|
95,501
|
|||||||||||||
|
Finance expenses
|
B |
|
32,913
|
(6,546
|
)
|
26,367
|
||||||||||
|
Profit for the year
|
50,276
|
18,858
|
69,134
|
|||||||||||||
|
Other comprehensive income (loss) - derivative financial instruments
|
B |
|
7,724
|
(6,546
|
)
|
1,178
|
||||||||||
|
Comprehensive income for the year
|
58,000
|
12,312
|
70,312
|
|||||||||||||
|
For the nine-month period ended September 30, 2023
|
||||||||||||||||
|
US GAAP
|
Adjustments
|
IFRS
|
||||||||||||||
|
In USD thousand
|
In USD thousand
|
In USD thousand
|
||||||||||||||
|
Profit for the period
|
A, B, C
|
|
13,924
|
14,119
|
28,043
|
|||||||||||
|
Net cash from operating activities
|
49,728
|
-
|
49,728
|
|||||||||||||
|
Net cash provided by (used in) investing activities
|
E |
|
(4,229
|
)
|
21,616
|
17,387
|
||||||||||
|
Net cash used in financing activities
|
(59,435
|
)
|
-
|
(59,435
|
)
|
|||||||||||
|
Net increase (decrease) in cash and cash equivalents
|
(13,936
|
)
|
21,616
|
7,680
|
||||||||||||
|
Balance of cash and cash equivalents at beginning of period
|
E |
|
145
|
1,041
|
1,186
|
|||||||||||
|
Restricted cash balance at beginning of period
|
E |
|
57,680
|
(57,680
|
)
|
-
|
||||||||||
|
Balance of cash and cash equivalents at end of period
|
E |
|
97
|
8,769
|
8,866
|
|||||||||||
|
Restricted cash balance at end of period
|
E |
|
43,792
|
(43,792
|
)
|
-
|
||||||||||
|
For the nine-month period ended September 30, 2022
|
||||||||||||||||
|
US GAAP
|
Adjustments
|
IFRS
|
||||||||||||||
|
In USD thousand
|
In USD thousand
|
In USD thousand
|
||||||||||||||
|
Profit for the period
|
A, B, C
|
|
35,711
|
14,256
|
49,967
|
|||||||||||
|
Net cash from operating activities
|
57,273
|
-
|
57,273
|
|||||||||||||
|
Net cash provided by (used in) investing activities
|
E |
|
(10,722
|
)
|
19,684
|
8,962
|
||||||||||
|
Net cash used in financing activities
|
(60,105
|
)
|
-
|
(60,105
|
)
|
|||||||||||
|
Net increase (decrease) in cash and cash equivalents
|
(13,554
|
)
|
19,684
|
6,130
|
||||||||||||
|
Balance of cash and cash equivalents at beginning of period
|
E |
|
98
|
181
|
279
|
|||||||||||
|
Restricted cash balance at beginning of period
|
E |
|
76,390
|
(76,390
|
)
|
-
|
||||||||||
|
Balance of cash and cash equivalents at end of period
|
E |
|
97
|
6,312
|
6,409
|
|||||||||||
|
|
||||||||||||||||
|
Restricted cash balance at end of period
|
E |
|
62,837
|
(62,837
|
)
|
-
|
||||||||||
|
For the three-month period ended September 30, 2023
|
||||||||||||||||
|
US GAAP
|
Adjustments
|
IFRS
|
||||||||||||||
|
In USD thousand
|
In USD thousand
|
In USD thousand
|
||||||||||||||
|
Profit for the period
|
A, B, C
|
|
3,462
|
3,047
|
6,509
|
|||||||||||
|
Net cash from operating activities
|
12,893
|
-
|
12,893
|
|||||||||||||
|
Net cash provided by (used in) investing activities
|
E |
|
(2,803
|
)
|
2,985
|
182
|
||||||||||
|
Net cash used in financing activities
|
(5,800
|
)
|
-
|
(5,800
|
)
|
|||||||||||
|
Net decrease in cash and cash equivalents
|
4,290
|
2,985
|
7,275
|
|||||||||||||
|
Balance of cash and cash equivalents at beginning of period
|
E |
|
93
|
1,498
|
1,591
|
|||||||||||
|
|
||||||||||||||||
|
Restricted cash balance at beginning of period
|
E |
|
39,506
|
(39,506
|
)
|
-
|
||||||||||
|
|
||||||||||||||||
|
Balance of cash and cash equivalents at end of period
|
E |
|
97
|
8,769
|
8,866
|
|||||||||||
|
|
||||||||||||||||
|
Restricted cash balance at end of period
|
E |
|
43,792
|
(43,792
|
)
|
-
|
||||||||||
|
For the three-month period ended September 30, 2022
|
||||||||||||||||
|
US GAAP
|
Adjustments
|
IFRS
|
||||||||||||||
|
In USD thousand
|
In USD thousand
|
In USD thousand
|
||||||||||||||
|
Profit for the period
|
A, B, C
|
|
17,853
|
4,714
|
22,567
|
|||||||||||
|
Net cash from operating activities
|
25,981
|
-
|
25,981
|
|||||||||||||
|
Net cash provided by (used in) investing activities
|
E |
|
(6,137
|
)
|
27,746
|
21,609
|
||||||||||
|
Net cash used in financing activities
|
(42,990
|
)
|
-
|
(42,990
|
)
|
|||||||||||
|
Net increase (decrease) in cash and cash equivalents
|
(23,146
|
)
|
27,746
|
4,600
|
||||||||||||
|
Balance of cash and cash equivalents at beginning of period
|
E |
|
99
|
1,710
|
1,809
|
|||||||||||
|
|
||||||||||||||||
|
Restricted cash balance at beginning of period
|
E |
|
85,981
|
(85,981
|
)
|
-
|
||||||||||
|
|
||||||||||||||||
|
Balance of cash and cash equivalents at end of period
|
E |
|
97
|
6,312
|
6,409
|
|||||||||||
|
|
||||||||||||||||
|
Restricted cash balance at end of period
|
E |
|
62,837
|
(62,837
|
)
|
-
|
||||||||||
|
For the year ended December 31, 2022
|
||||||||||||||||
|
US GAAP
|
Adjustments
|
IFRS
|
||||||||||||||
|
In USD thousand
|
In USD thousand
|
In USD thousand
|
||||||||||||||
|
Profit for the year
|
A, B, C
|
|
50,276
|
18,858
|
69,134
|
|||||||||||
|
Net cash from operating activities
|
62,497
|
-
|
62,497
|
|||||||||||||
|
Net cash provided by (used in) investing activities
|
E |
|
(11,226
|
)
|
19,571
|
8,345
|
||||||||||
|
Net cash used in financing activities
|
(69,934
|
)
|
-
|
(69,934
|
)
|
|||||||||||
|
Net increase (decrease) in cash and cash equivalents
|
(18,663
|
)
|
19,571
|
908
|
||||||||||||
|
Balance of cash and cash equivalents at beginning of year
|
E |
|
98
|
180
|
278
|
|||||||||||
|
|
||||||||||||||||
|
Restricted cash balance at beginning of year
|
E |
|
76,390
|
(76,390
|
)
|
-
|
||||||||||
|
|
||||||||||||||||
|
Balance of cash and cash equivalents at end of year
|
E |
|
145
|
1,041
|
1,186
|
|||||||||||
|
|
||||||||||||||||
|
Restricted cash balance at end of year
|
E |
|
57,680
|
(57,680
|
)
|
-
|
||||||||||
|
As at September 30, 2023
|
||||||||||||||||
|
US GAAP
|
Adjustments
|
IFRS
|
||||||||||||||
|
In USD thousand
|
In USD thousand
|
In USD thousand
|
||||||||||||||
|
Cash and cash equivalents
|
88
|
25,103
|
25,191
|
|||||||||||||
|
Restricted cash
|
26,287
|
(25,103
|
)
|
1,184
|
||||||||||||
|
Property, plant & equipment
|
A, D
|
|
821,022
|
47,024
|
868,046
|
|||||||||||
|
Intangible assets
|
D |
|
26,971
|
(26,971
|
)
|
-
|
||||||||||
|
Other assets
|
67,263
|
-
|
67,263
|
|||||||||||||
|
Total assets
|
941,631
|
20,053
|
961,684
|
|||||||||||||
|
Accounts payable and deferred expenses
|
A |
|
16,218
|
(11,117
|
)
|
5,101
|
||||||||||
|
Other liabilities
|
406,718
|
490
|
407,208
|
|||||||||||||
|
Total liabilities
|
422,936
|
(10,627
|
)
|
412,309
|
||||||||||||
|
Partners’ equity
|
A |
|
518,695
|
30,680
|
549,375
|
|||||||||||
|
Total liabilities and equity
|
941,631
|
20,053
|
961,684
|
|||||||||||||
|
As at September 30, 2022
|
||||||||||||||||
|
US GAAP
|
Adjustments
|
IFRS
|
||||||||||||||
|
In USD thousand
|
In USD thousand
|
In USD thousand
|
||||||||||||||
|
Cash and cash equivalents
|
87
|
2,200
|
2,287
|
|||||||||||||
|
Restricted cash
|
2,346
|
(2,200
|
)
|
146
|
||||||||||||
|
Property, plant & equipment
|
A, D
|
|
844,413
|
39,672
|
884,085
|
|||||||||||
|
Intangible assets
|
D |
|
27,841
|
(27,841
|
)
|
-
|
||||||||||
|
Other assets
|
168,358
|
-
|
168,358
|
|||||||||||||
|
Total assets
|
1,043,045
|
11,831
|
1,054,876
|
|||||||||||||
|
Accounts payable and deferred expenses
|
A |
|
31,790
|
(10,551
|
)
|
21,239
|
||||||||||
|
Other liabilities
|
578,009
|
770
|
578,779
|
|||||||||||||
|
Total liabilities
|
609,799
|
(9,781
|
)
|
600,018
|
||||||||||||
|
Partners’ equity
|
A |
|
433,246
|
21,612
|
454,858
|
|||||||||||
|
Total liabilities and equity
|
1,043,045
|
11,831
|
1,054,876
|
|||||||||||||
|
As at December 31, 2022
|
||||||||||||||||
|
US GAAP
|
Adjustments
|
IFRS
|
||||||||||||||
|
In USD thousand
|
In USD thousand
|
In USD thousand
|
||||||||||||||
|
Cash and cash equivalents
|
89
|
1,370
|
1,459
|
|||||||||||||
|
Restricted cash
|
10,098
|
(1,370
|
)
|
8,728
|
||||||||||||
|
Property, plant & equipment
|
A, D
|
|
839,665
|
45,684
|
885,349
|
|||||||||||
|
Intangible assets
|
D |
|
27,624
|
(27,624
|
)
|
-
|
||||||||||
|
Other assets
|
142,274
|
-
|
142,274
|
|||||||||||||
|
Total assets
|
1,019,750
|
18,060
|
1,037,810
|
|||||||||||||
|
Accounts payable and deferred expenses
|
A |
|
38,800
|
(6,354
|
)
|
32,446
|
||||||||||
|
Other liabilities
|
533,630
|
700
|
534,330
|
|||||||||||||
|
Total liabilities
|
572,430
|
(5,654
|
)
|
566,776
|
||||||||||||
|
Partners’ equity
|
A
|
|
447,320
|
23,714
|
471,034
|
|||||||||||
|
Total liabilities and equity
|
1,019,750
|
18,060
|
1,037,810
|
|||||||||||||
|
For the nine-month period ended September 30, 2023
|
||||||||||||||||||||
|
US GAAP
|
IFRS adjustments
|
Adjustments to the Group’s accounting policies*
|
IFRS - according to the Group’s accounting policies
|
|||||||||||||||||
|
In USD thousand
|
In USD thousand
|
In USD thousand
|
In USD thousand
|
|||||||||||||||||
|
Revenues
|
218,205
|
460
|
13,195
|
231,860
|
||||||||||||||||
|
Operating expenses
|
A |
|
116,664
|
(6,756
|
)
|
13,195
|
123,103
|
|||||||||||||
|
Operating profit
|
101,541
|
7,216
|
-
|
108,757
|
||||||||||||||||
|
Finance expenses
|
B |
|
18,896
|
(4,114
|
)
|
-
|
14,782
|
|||||||||||||
|
Profit for the period
|
82,645
|
11,330
|
-
|
93,975
|
||||||||||||||||
|
Other comprehensive loss - interest rate swaps
|
B |
|
(3,270
|
)
|
(4,364
|
)
|
-
|
(7,634
|
)
|
|||||||||||
|
Comprehensive income for the period
|
79,375
|
6,966
|
-
|
86,341
|
||||||||||||||||
|
For the nine-month period ended September 30, 2022
|
||||||||||||||||||||
|
US GAAP
|
IFRS adjustments
|
Adjustments to the Group’s accounting policies*
|
IFRS - according to the Group’s accounting policies
|
|||||||||||||||||
|
In USD thousand
|
In USD thousand
|
In USD thousand
|
In USD thousand
|
|||||||||||||||||
|
Revenues
|
350,465
|
-
|
(69,413
|
)
|
281,052
|
|||||||||||||||
|
Operating expenses
|
A |
|
266,949
|
(6,219
|
)
|
(69,413
|
)
|
191,317
|
||||||||||||
|
Operating profit
|
83,516
|
6,219
|
-
|
89,735
|
||||||||||||||||
|
Finance expenses
|
B |
|
21,254
|
(4,843
|
)
|
-
|
16,411
|
|||||||||||||
|
Profit for the period
|
62,262
|
11,062
|
-
|
73,324
|
||||||||||||||||
|
Other comprehensive income - interest rate swaps
|
B |
|
29,769
|
(4,633
|
)
|
-
|
25,136
|
|||||||||||||
|
Comprehensive income for the period
|
92,031
|
6,429
|
-
|
98,460
|
||||||||||||||||
|
For the three-month period ended September 30, 2023
|
||||||||||||||||||||
|
US GAAP
|
IFRS adjustments
|
Adjustments to the Group’s accounting policies*
|
IFRS - according to the Group’s accounting policies
|
|||||||||||||||||
|
In USD thousand
|
In USD thousand
|
In USD thousand
|
In USD thousand
|
|||||||||||||||||
|
Revenues
|
67,330
|
460
|
3,806
|
71,596
|
||||||||||||||||
|
Operating expenses
|
A |
|
34,371
|
(2,326
|
)
|
3,806
|
35,851
|
|||||||||||||
|
Operating profit
|
32,959
|
2,786
|
-
|
35,745
|
||||||||||||||||
|
Finance expenses
|
B |
|
5,546
|
(1,346
|
)
|
-
|
4,200
|
|||||||||||||
|
Profit for the period
|
27,413
|
4,132
|
-
|
31,545
|
||||||||||||||||
|
Other comprehensive loss - interest rate swaps
|
B |
|
(7,284
|
)
|
(1,737
|
)
|
-
|
(9,021
|
)
|
|||||||||||
|
Comprehensive income for the period
|
20,129
|
2,395
|
-
|
22,524
|
||||||||||||||||
|
For the three-month period ended September 30, 2022
|
||||||||||||||||||||
|
US GAAP
|
IFRS adjustments
|
Adjustments to the Group’s accounting policies*
|
IFRS - according to the Group’s accounting policies
|
|||||||||||||||||
|
In USD thousand
|
In USD thousand
|
In USD thousand
|
In USD thousand
|
|||||||||||||||||
|
Revenues
|
154,943
|
-
|
(27,523
|
)
|
127,420
|
|||||||||||||||
|
Operating expenses
|
A |
|
103,251
|
(2,059
|
)
|
(27,523
|
)
|
73,669
|
||||||||||||
|
Operating profit
|
51,692
|
2,059
|
-
|
53,751
|
||||||||||||||||
|
Finance expenses
|
B |
|
6,665
|
(1,797
|
)
|
-
|
4,868
|
|||||||||||||
|
Profit for the period
|
45,027
|
3,856
|
-
|
48,883
|
||||||||||||||||
|
Other comprehensive income - interest rate swaps
|
B |
|
8,718
|
(1,727
|
)
|
-
|
6,991
|
|||||||||||||
|
Comprehensive loss for the period
|
53,745
|
2,129
|
-
|
55,874
|
||||||||||||||||
|
For the year ended December 31, 2022
|
||||||||||||||||||||
|
US GAAP
|
IFRS adjustments
|
Adjustments to the Group’s accounting policies*
|
IFRS - according to the Group’s accounting policies
|
|||||||||||||||||
|
In USD thousand
|
In USD thousand
|
In USD thousand
|
In USD thousand
|
|||||||||||||||||
|
Revenues
|
450,906
|
-
|
(76,939
|
)
|
373,967
|
|||||||||||||||
|
Operating expenses
|
A |
|
345,546
|
(8,251
|
)
|
(76,939
|
)
|
260,356
|
||||||||||||
|
Operating profit
|
105,360
|
8,251
|
-
|
113,611
|
||||||||||||||||
|
Finance expenses
|
B |
|
21,065
|
(6,360
|
)
|
-
|
14,705
|
|||||||||||||
|
Profit for the year
|
84,295
|
14,611
|
-
|
98,906
|
||||||||||||||||
|
Other comprehensive income - interest rate swaps
|
B |
|
21,810
|
(6,080
|
)
|
-
|
15,730
|
|||||||||||||
|
Comprehensive income for the year
|
106,105
|
8,531
|
-
|
114,636
|
||||||||||||||||
|
For the nine-month period ended September 30, 2023
|
||||||||||||||||
|
US GAAP
|
Adjustments
|
IFRS
|
||||||||||||||
|
In USD thousand
|
In USD thousand
|
In USD thousand
|
||||||||||||||
|
Profit for the period
|
A, B
|
|
82,645
|
11,330
|
93,975
|
|||||||||||
|
Net cash from operating activities
|
138,620
|
-
|
138,620
|
|||||||||||||
|
Net cash provided by (used in) investing activities
|
E |
|
(1,071
|
)
|
10,124
|
9,053
|
||||||||||
|
Net cash used in financing activities
|
(123,941
|
)
|
-
|
(123,941
|
)
|
|||||||||||
|
Net increase in cash and cash equivalents
|
13,608
|
10,124
|
23,732
|
|||||||||||||
|
Balance of cash and cash equivalents at beginning of period
|
E |
|
89
|
1,370
|
1,459
|
|||||||||||
|
|
||||||||||||||||
|
Restricted cash balance at beginning of period
|
E |
|
38,404
|
(38,404
|
)
|
-
|
||||||||||
|
|
||||||||||||||||
|
Balance of cash and cash equivalents at end of period
|
E |
|
88
|
25,103
|
25,191
|
|||||||||||
|
|
||||||||||||||||
|
Restricted cash balance at end of period
|
E |
|
52,013
|
(52,013
|
)
|
-
|
||||||||||
|
For the nine-month period ended September 30, 2022
|
||||||||||||||||
|
US GAAP
|
Adjustments
|
IFRS
|
||||||||||||||
|
In USD thousand
|
In USD thousand
|
In USD thousand
|
||||||||||||||
|
Profit for the period
|
A, B
|
|
62,262
|
11,062
|
73,324
|
|||||||||||
|
Net cash from operating activities
|
106,243
|
-
|
106,243
|
|||||||||||||
|
Net cash provided by (used in) investing activities
|
E |
|
(5,479
|
)
|
33,945
|
28,466
|
||||||||||
|
Net cash used in financing activities
|
(136,830
|
)
|
-
|
(136,830
|
)
|
|||||||||||
|
Net increase (decrease) in cash and cash equivalents
|
(36,066
|
)
|
33,945
|
(2,121
|
)
|
|||||||||||
|
Balance of cash and cash equivalents at beginning of period
|
E |
|
78
|
4,330
|
4,408
|
|||||||||||
|
|
||||||||||||||||
|
Restricted cash balance at beginning of period
|
E |
|
72,663
|
(72,663
|
)
|
-
|
||||||||||
|
|
||||||||||||||||
|
Balance of cash and cash equivalents at end of period
|
E |
|
87
|
2,200
|
2,287
|
|||||||||||
|
|
||||||||||||||||
|
Restricted cash balance at end of period
|
E |
|
36,588
|
(36,588
|
)
|
-
|
||||||||||
|
For the three-month period ended September 30, 2023
|
||||||||||||||||
|
US GAAP
|
Adjustments
|
IFRS
|
||||||||||||||
|
In USD thousand
|
In USD thousand
|
In USD thousand
|
||||||||||||||
|
Profit for the period
|
A, B
|
|
27,413
|
4,132
|
31,545
|
|||||||||||
|
Net cash from operating activities
|
39,796
|
-
|
39,796
|
|||||||||||||
|
Net cash provided by (used in) investing activities
|
E |
|
(438
|
)
|
849
|
411
|
||||||||||
|
Net cash used in financing activities
|
(21,904
|
)
|
-
|
(21,904
|
)
|
|||||||||||
|
Net increase in cash and cash equivalents
|
17,454
|
849
|
18,303
|
|||||||||||||
|
Balance of cash and cash equivalents at beginning of period
|
E |
|
65
|
6,823
|
6,888
|
|||||||||||
|
|
||||||||||||||||
|
Restricted cash balance at beginning of period
|
E |
|
34,582
|
(34,582
|
)
|
-
|
||||||||||
|
|
||||||||||||||||
|
Balance of cash and cash equivalents at end of period
|
E |
|
88
|
25,103
|
25,191
|
|||||||||||
|
|
||||||||||||||||
|
Restricted cash balance at end of period
|
E |
|
52,013
|
(52,013
|
)
|
-
|
||||||||||
|
For the three-month period ended September 30, 2022
|
||||||||||||||||
|
US GAAP
|
Adjustments
|
IFRS
|
||||||||||||||
|
In USD thousand
|
In USD thousand
|
In USD thousand
|
||||||||||||||
|
Profit for the period
|
A, B
|
|
45,027
|
3,856
|
48,883
|
|||||||||||
|
Net cash from operating activities
|
35,358
|
-
|
35,358
|
|||||||||||||
|
Net cash provided by (used in) investing activities
|
E |
|
(2,148
|
)
|
4,300
|
2,152
|
||||||||||
|
Net cash used in financing activities
|
(39,169
|
)
|
-
|
(39,169
|
)
|
|||||||||||
|
Net decrease in cash and cash equivalents
|
(5,959
|
)
|
4,300
|
(1,659
|
)
|
|||||||||||
|
Balance of cash and cash equivalents at beginning of period
|
E |
|
65
|
3,881
|
3,946
|
|||||||||||
|
|
||||||||||||||||
|
Restricted cash balance at beginning of period
|
E |
|
42,569
|
(42,569
|
)
|
-
|
||||||||||
|
|
||||||||||||||||
|
Balance of cash and cash equivalents at end of period
|
E |
|
87
|
2,200
|
2,287
|
|||||||||||
|
|
||||||||||||||||
|
Restricted cash balance at end of period
|
E |
|
36,588
|
(36,588
|
)
|
-
|
||||||||||
|
For the year ended December 31, 2022
|
||||||||||||||||
|
US GAAP
|
Adjustments
|
IFRS
|
||||||||||||||
|
In USD thousand
|
In USD thousand
|
In USD thousand
|
||||||||||||||
|
Profit for the year
|
A, B
|
|
84,295
|
14,611
|
98,906
|
|||||||||||
|
Net cash from operating activities
|
140,040
|
-
|
140,040
|
|||||||||||||
|
Net cash provided by (used in) investing activities
|
E |
|
(7,323
|
)
|
31,299
|
23,976
|
||||||||||
|
Net cash used in financing activities
|
(166,965
|
)
|
-
|
(166,965
|
)
|
|||||||||||
|
Net increase (decrease) in cash and cash equivalents
|
(34,248
|
)
|
31,299
|
(2,949
|
)
|
|||||||||||
|
Balance of cash and cash equivalents at beginning of year
|
E |
|
78
|
4,330
|
4,408
|
|||||||||||
|
|
||||||||||||||||
|
Restricted cash balance at beginning of year
|
E |
|
72,663
|
(72,663
|
)
|
-
|
||||||||||
|
|
||||||||||||||||
|
Balance of cash and cash equivalents at end of year
|
E |
|
89
|
1,370
|
1,459
|
|||||||||||
|
|
||||||||||||||||
|
Restricted cash balance at end of year
|
E |
|
38,404
|
(38,404
|
)
|
-
|
||||||||||
|
As at September 30, 2023
|
||||||||||||||||
|
US GAAP
|
Adjustments
|
IFRS
|
||||||||||||||
|
In USD thousand
|
In USD thousand
|
In USD thousand
|
||||||||||||||
|
Cash and cash equivalents
|
98
|
6,581
|
6,679
|
|||||||||||||
|
Restricted cash
|
6,624
|
(6,581
|
)
|
43
|
||||||||||||
|
Property, plant & equipment
|
A, D
|
|
746,449
|
80,704
|
827,153
|
|||||||||||
|
Intangible assets
|
D |
|
52,210
|
(52,210
|
)
|
-
|
||||||||||
|
Other assets
|
126,492
|
-
|
126,492
|
|||||||||||||
|
Total assets
|
931,873
|
28,494
|
960,367
|
|||||||||||||
|
Accounts payable and deferred expenses
|
A |
|
11,697
|
(2,397
|
)
|
9,300
|
||||||||||
|
Other liabilities
|
449,955
|
(123
|
)
|
449,832
|
||||||||||||
|
Total liabilities
|
461,652
|
(2,520
|
)
|
459,132
|
||||||||||||
|
Partners’ equity
|
A |
|
470,221
|
31,014
|
501,235
|
|||||||||||
|
Total liabilities and equity
|
931,873
|
28,494
|
960,367
|
|||||||||||||
|
As at September 30, 2022
|
||||||||||||||||
|
US GAAP
|
Adjustments
|
IFRS
|
||||||||||||||
|
In USD thousand
|
In USD thousand
|
In USD thousand
|
||||||||||||||
|
Cash and cash equivalents
|
100
|
23,216
|
23,316
|
|||||||||||||
|
Restricted cash
|
30,106
|
(23,216
|
)
|
6,890
|
||||||||||||
|
Property, plant & equipment
|
A, D
|
|
771,119
|
81,325
|
852,444
|
|||||||||||
|
Intangible assets
|
D |
|
55,719
|
(55,719
|
)
|
-
|
||||||||||
|
Other assets
|
138,121
|
-
|
138,121
|
|||||||||||||
|
Total assets
|
995,165
|
25,606
|
1,020,771
|
|||||||||||||
|
Accounts payable and deferred expenses
|
A |
|
19,953
|
(2,383
|
)
|
17,570
|
||||||||||
|
Other liabilities
|
621,601
|
(193
|
)
|
621,408
|
||||||||||||
|
Total liabilities
|
641,554
|
(2,576
|
)
|
638,978
|
||||||||||||
|
Partners’ equity
|
A |
|
353,611
|
28,182
|
381,793
|
|||||||||||
|
Total liabilities and equity
|
995,165
|
25,606
|
1,020,771
|
|||||||||||||
|
As at December 31, 2022
|
||||||||||||||||
|
US GAAP
|
Adjustments
|
IFRS
|
||||||||||||||
|
In USD thousand
|
In USD thousand
|
In USD thousand
|
||||||||||||||
|
Cash and cash equivalents
|
90
|
40,230
|
40,320
|
|||||||||||||
|
Restricted cash
|
42,251
|
(40,230
|
)
|
2,021
|
||||||||||||
|
Property, plant & equipment
|
A, D
|
|
764,996
|
81,413
|
846,409
|
|||||||||||
|
Intangible assets
|
D |
|
54,842
|
(54,842
|
)
|
-
|
||||||||||
|
Other assets
|
134,217
|
-
|
134,217
|
|||||||||||||
|
Total assets
|
996,396
|
26,571
|
1,022,967
|
|||||||||||||
|
Accounts payable and deferred expenses
|
A |
|
21,025
|
(1,857
|
)
|
19,168
|
||||||||||
|
Other liabilities
|
605,364
|
(175
|
)
|
605,189
|
||||||||||||
|
Total liabilities
|
626,389
|
(2,032
|
)
|
624,357
|
||||||||||||
|
Partners’ equity
|
A |
|
370,007
|
28,603
|
398,610
|
|||||||||||
|
Total liabilities and equity
|
996,396
|
26,571
|
1,022,967
|
|||||||||||||
|
For the nine-month period ended September 30, 2023
|
||||||||||||||||||||
|
US GAAP
|
IFRS adjustments
|
Adjustments to the Group’s accounting policies*
|
IFRS - according to the Group’s accounting policies
|
|||||||||||||||||
|
In USD thousand
|
In USD thousand
|
In USD thousand
|
In USD thousand
|
|||||||||||||||||
|
Revenues
|
270,449
|
(18
|
)
|
12,406
|
282,837
|
|||||||||||||||
|
Operating expenses
|
A |
|
129,571
|
(6,670
|
)
|
12,406
|
135,307
|
|||||||||||||
|
Depreciation and amortization
|
A |
|
21,625
|
4,207
|
-
|
25,832
|
||||||||||||||
|
Operating profit
|
119,253
|
2,445
|
-
|
121,698
|
||||||||||||||||
|
Finance expenses
|
B |
|
14,214
|
(6,130
|
)
|
-
|
8,084
|
|||||||||||||
|
Profit for the period
|
105,039
|
8,575
|
-
|
113,614
|
||||||||||||||||
|
Other comprehensive income (loss) - interest rate swaps
|
B |
|
(4,825
|
)
|
(6,165
|
)
|
-
|
(10,990
|
)
|
|||||||||||
|
Comprehensive income for the period
|
100,214
|
2,410
|
-
|
102,624
|
||||||||||||||||
|
For the nine-month period ended September 30, 2022
|
||||||||||||||||||||
|
US GAAP
|
IFRS adjustments
|
Adjustments to the Group’s accounting policies*
|
IFRS - according to the Group’s accounting policies
|
|||||||||||||||||
|
In USD thousand
|
In USD thousand
|
In USD thousand
|
In USD thousand
|
|||||||||||||||||
|
Revenues
|
347,948
|
-
|
44,306
|
392,254
|
||||||||||||||||
|
Operating expenses
|
A |
|
284,017
|
(5,616
|
)
|
44,306
|
322,707
|
|||||||||||||
|
Depreciation and amortization
|
A |
|
21,607
|
3,199
|
-
|
24,806
|
||||||||||||||
|
Operating profit
|
42,324
|
2,417
|
-
|
44,741
|
||||||||||||||||
|
Finance expenses
|
B |
|
21,466
|
(5,138
|
)
|
-
|
16,328
|
|||||||||||||
|
Profit for the period
|
20,858
|
7,555
|
-
|
28,413
|
||||||||||||||||
|
Other comprehensive income - interest rate swaps
|
B |
|
30,010
|
(5,191
|
)
|
-
|
24,819
|
|||||||||||||
|
Comprehensive income for the period
|
50,868
|
2,364
|
-
|
53,232
|
||||||||||||||||
|
For the three-month period ended September 30, 2023
|
||||||||||||||||||||
|
US GAAP
|
IFRS adjustments
|
Adjustments to the Group’s accounting policies*
|
IFRS - according to the Group’s accounting policies
|
|||||||||||||||||
|
In USD thousand
|
In USD thousand
|
In USD thousand
|
In USD thousand
|
|||||||||||||||||
|
Revenues
|
83,791
|
(1,856
|
)
|
7,097
|
89,032
|
|||||||||||||||
|
Operating expenses
|
A |
|
36,169
|
(2,372
|
)
|
7,097
|
40,894
|
|||||||||||||
|
Depreciation and amortization
|
A |
|
7,210
|
1,403
|
-
|
8,613
|
||||||||||||||
|
Operating profit
|
40,412
|
(887
|
)
|
-
|
39,525
|
|||||||||||||||
|
Finance expenses
|
B |
|
1,537
|
(3,245
|
)
|
-
|
(1,708
|
)
|
||||||||||||
|
Profit for the period
|
38,875
|
2,358
|
-
|
41,233
|
||||||||||||||||
|
Other comprehensive loss - interest rate swaps
|
B |
|
(8,258
|
)
|
(1,407
|
)
|
-
|
(9,665
|
)
|
|||||||||||
|
Comprehensive income for the period
|
30,617
|
951
|
-
|
31,568
|
||||||||||||||||
|
For the three-month period ended September 30, 2022
|
||||||||||||||||||||
|
US GAAP
|
IFRS adjustments
|
Adjustments to the Group’s accounting policies*
|
IFRS - according to the Group’s accounting policies
|
|||||||||||||||||
|
In USD thousand
|
In USD thousand
|
In USD thousand
|
In USD thousand
|
|||||||||||||||||
|
Revenues
|
134,122
|
-
|
24,596
|
158,718
|
||||||||||||||||
|
Operating expenses
|
A |
|
98,424
|
(2,380
|
)
|
24,596
|
120,640
|
|||||||||||||
|
Depreciation and amortization
|
A |
|
7,207
|
1,402
|
-
|
8,609
|
||||||||||||||
|
Operating profit
|
28,491
|
978
|
-
|
29,469
|
||||||||||||||||
|
Finance expenses
|
B |
|
7,408
|
(1,840
|
)
|
-
|
5,568
|
|||||||||||||
|
Profit for the period
|
21,083
|
2,818
|
-
|
23,901
|
||||||||||||||||
|
Other comprehensive income - interest rate swaps
|
B |
|
9,199
|
(1,858
|
)
|
-
|
7,341
|
|||||||||||||
|
Comprehensive income for the period
|
30,282
|
960
|
-
|
31,242
|
||||||||||||||||
|
For the year ended December 31, 2022
|
||||||||||||||||||||
|
US GAAP
|
IFRS adjustments
|
Adjustments to the Group’s accounting policies*
|
IFRS - according to the Group’s accounting policies
|
|||||||||||||||||
|
In USD thousand
|
In USD thousand
|
In USD thousand
|
In USD thousand
|
|||||||||||||||||
|
Revenues
|
445,028
|
-
|
49,637
|
494,665
|
||||||||||||||||
|
Operating expenses
|
A |
|
349,588
|
(7,460
|
)
|
49,637
|
391,765
|
|||||||||||||
|
Depreciation and amortization
|
A |
|
28,815
|
4,602
|
-
|
33,417
|
||||||||||||||
|
Operating profit
|
66,625
|
2,858
|
-
|
69,483
|
||||||||||||||||
|
Finance expenses
|
B |
|
28,645
|
(6,597
|
)
|
-
|
22,048
|
|||||||||||||
|
Profit for the year
|
37,980
|
9,455
|
-
|
47,435
|
||||||||||||||||
|
Other comprehensive income - interest rate swaps
|
B |
|
29,284
|
(6,667
|
)
|
-
|
22,617
|
|||||||||||||
|
Comprehensive income for the year
|
67,264
|
2,788
|
-
|
70,052
|
||||||||||||||||
|
For the nine-month period ended September 30, 2023
|
||||||||||||||||
|
US GAAP
|
Adjustments
|
IFRS
|
||||||||||||||
|
In USD thousand
|
In USD thousand
|
In USD thousand
|
||||||||||||||
|
Profit for the period
|
A, B
|
|
105,039
|
8,575
|
113,614
|
|||||||||||
|
Net cash from operating activities
|
98,957
|
-
|
98,957
|
|||||||||||||
|
Net cash from investing activities
|
E |
|
(413
|
)
|
31,115
|
30,702
|
||||||||||
|
Net cash used in financing activities
|
(163,300
|
)
|
-
|
(163,300
|
)
|
|||||||||||
|
Net increase (decrease) in cash and cash equivalents
|
(64,756
|
)
|
31,115
|
(33,641
|
)
|
|||||||||||
|
Balance of cash and cash equivalents at beginning of period
|
E |
|
90
|
40,230
|
40,320
|
|||||||||||
|
|
||||||||||||||||
|
Restricted cash balance at beginning of period
|
E |
|
119,838
|
(119,838
|
)
|
-
|
||||||||||
|
|
||||||||||||||||
|
Balance of cash and cash equivalents at end of period
|
E |
|
98
|
6,581
|
6,679
|
|||||||||||
|
|
||||||||||||||||
|
Restricted cash balance at end of period
|
E |
|
55,074
|
(55,074
|
)
|
-
|
||||||||||
|
For the nine-month period ended September 30, 2022
|
||||||||||||||||
|
US GAAP
|
Adjustments
|
IFRS
|
||||||||||||||
|
In USD thousand
|
In USD thousand
|
In USD thousand
|
||||||||||||||
|
Profit for the period
|
A, B
|
|
20,858
|
7,555
|
28,413
|
|||||||||||
|
Net cash from operating activities
|
54,427
|
-
|
54,427
|
|||||||||||||
|
Net cash used in investing activities
|
E |
|
(312
|
)
|
(7,307
|
)
|
(7,619
|
)
|
||||||||
|
Net cash used in financing activities
|
(24,942
|
)
|
-
|
(24,942
|
)
|
|||||||||||
|
Net increase (decrease) in cash and cash equivalents
|
29,173
|
(7,307
|
)
|
21,866
|
||||||||||||
|
Balance of cash and cash equivalents at beginning of period
|
E |
|
100
|
1,350
|
1,450
|
|||||||||||
|
|
||||||||||||||||
|
Restricted cash balance at beginning of period
|
E |
|
78,410
|
(78,410
|
)
|
-
|
||||||||||
|
|
||||||||||||||||
|
Balance of cash and cash equivalents at end of period
|
E |
|
100
|
23,216
|
23,316
|
|||||||||||
|
|
||||||||||||||||
|
Restricted cash balance at end of period
|
E |
|
107,583
|
(107,583
|
)
|
-
|
||||||||||
|
For the three-month period ended September 30, 2023
|
||||||||||||||||
|
US GAAP
|
Adjustments
|
IFRS
|
||||||||||||||
|
In USD thousand
|
In USD thousand
|
In USD thousand
|
||||||||||||||
|
Profit for the period
|
A, B
|
|
38,875
|
2,358
|
41,233
|
|||||||||||
|
Net cash from operating activities
|
44,247
|
-
|
44,247
|
|||||||||||||
|
Net cash from investing activities
|
E |
|
(338
|
)
|
1,848
|
1,510
|
||||||||||
|
Net cash used in financing activities
|
(47,506
|
)
|
-
|
(47,506
|
)
|
|||||||||||
|
Net increase (decrease) in cash and cash equivalents
|
(3,597
|
)
|
1,848
|
(1,749
|
)
|
|||||||||||
|
Balance of cash and cash equivalents at beginning of period
|
E |
|
100
|
8,328
|
8,428
|
|||||||||||
|
|
||||||||||||||||
|
Restricted cash balance at beginning of period
|
E |
|
58,669
|
(58,669
|
)
|
-
|
||||||||||
|
|
||||||||||||||||
|
Balance of cash and cash equivalents at end of period
|
E |
|
98
|
6,581
|
6,679
|
|||||||||||
|
|
||||||||||||||||
|
Restricted cash balance at end of period
|
E |
|
55,074
|
(55,074
|
)
|
-
|
||||||||||
|
For the three-month period ended September 30, 2022
|
||||||||||||||||
|
US GAAP
|
Adjustments
|
IFRS
|
||||||||||||||
|
In USD thousand
|
In USD thousand
|
In USD thousand
|
||||||||||||||
|
Profit for the period
|
A, B
|
|
21,083
|
2,818
|
23,901
|
|||||||||||
|
Net cash from operating activities
|
45,667
|
-
|
45,667
|
|||||||||||||
|
Net cash used in investing activities
|
E |
|
(57
|
)
|
(6,986
|
)
|
(7,043
|
)
|
||||||||
|
Net cash used in financing activities
|
(24,488
|
)
|
-
|
(24,488
|
)
|
|||||||||||
|
Net increase (decrease) in cash and cash equivalents
|
21,122
|
(6,986
|
)
|
14,136
|
||||||||||||
|
Balance of cash and cash equivalents at beginning of period
|
E |
|
99
|
9,081
|
9,180
|
|||||||||||
|
|
||||||||||||||||
|
Restricted cash balance at beginning of period
|
E |
|
86,462
|
(86,462
|
)
|
-
|
||||||||||
|
|
||||||||||||||||
|
Balance of cash and cash equivalents at end of period
|
E |
|
100
|
23,216
|
23,316
|
|||||||||||
|
|
||||||||||||||||
|
Restricted cash balance at end of period
|
E |
|
107,583
|
(107,583
|
)
|
-
|
||||||||||
|
For the year ended December 31, 2022
|
||||||||||||||||
|
US GAAP
|
Adjustments
|
IFRS
|
||||||||||||||
|
In USD thousand
|
In USD thousand
|
In USD thousand
|
||||||||||||||
|
Profit for the year
|
A, B
|
|
37,980
|
9,455
|
47,435
|
|||||||||||
|
Net cash from operating activities
|
78,126
|
-
|
78,126
|
|||||||||||||
|
Net cash used in investing activities
|
E |
|
(519
|
)
|
(2,548
|
)
|
(3,067
|
)
|
||||||||
|
Net cash used in financing activities
|
(36,189
|
)
|
-
|
(36,189
|
)
|
|||||||||||
|
Net increase (decrease) in cash and cash equivalents
|
41,418
|
(2,548
|
)
|
38,870
|
||||||||||||
|
Balance of cash and cash equivalents at beginning of year
|
E |
|
100
|
1,350
|
1,450
|
|||||||||||
|
|
||||||||||||||||
|
Restricted cash balance at beginning of year
|
E |
|
78,410
|
(78,410
|
)
|
-
|
||||||||||
|
|
||||||||||||||||
|
Balance of cash and cash equivalents at end of year
|
E |
|
90
|
40,230
|
40,320
|
|||||||||||
|
|
||||||||||||||||
|
Restricted cash balance at end of year
|
E |
|
119,838
|
(119,838
|
)
|
-
|
||||||||||
|
|
A. |
Maintenance costs under the Long Term Maintenance Plan (hereinafter - the “LTPC Agreement”): under IFRS, variable payments which were paid in accordance with the milestones as set in the LTPC Agreement are capitalized to the cost of
property, plant and equipment and amortized over the period from the date on which maintenance work was carried out until the date on which maintenance work is due to take place again. Under US GAAP, the said payments are recognized on
payment date within current expenses in the statement of income.
|
|
|
B. |
Hedge effectiveness of interest rate swaps: in accordance with the IFRS - the associates recognize adjustments relating to the ineffective portion of their cash flow hedge under finance expenses in profit and loss. Under GAAP US, there
is no part which is not effective, and the hedging results are recognized in full in other comprehensive income.
|
|
|
C. |
Impairment of property, plant and equipment in Valley: In 2021, prior to the acquisition date of CPV Group, indications of impairment of the property, plant and equipment were identified. Under IFRS, the carrying amount exceeded the
recoverable amount (the discounted cash flows that Valley expects to generate from the asset), and consequently an impairment loss was recognized. Under US GAAP, the non-discounted cash flows that Valley expects to generate from the asset
exceeded the carrying amount, and therefore no impairment loss was recognized. Since the impairment loss was taken into account as part of the excess cost allocation work as of the acquisition date of CPV Group, its subsequent reversal in
Valley’s financial statements, if recognized, shall not affect the Company's results.
|
|
|
D. |
Intangible assets: Under IFRS, certain intangible assets are defined as property, plant and equipment.
|
|
|
E. |
Restricted cash: There is a difference between the presentation and classification of restricted cash in the cash flow statements and in the statements of financial position.
|