|
|
||
|
|
|
|
KENON HOLDINGS LTD.
|
|||
|
Date: May 24, 2023
|
By:
|
/s/ Robert L. Rosen
|
||
|
|
Name:
|
Robert L. Rosen
|
||
|
|
Title:
|
Chief Executive Officer
|
||
| 1. |
Executive Summary1
Highlights of the results (in millions of shekels)
|
|
For the
|
||||||||||||
|
Three Months Ended
|
||||||||||||
|
March 31
|
||||||||||||
|
2022
|
2021
|
Change
|
||||||||||
|
Adjusted EBITDA* – consolidated
|
275
|
238
|
16
|
%
|
||||||||
|
Adjusted EBITDA* – Israel
|
118
|
120
|
(2
|
)%
|
||||||||
|
Adjusted EBITDA* – U.S.
|
164
|
123
|
33
|
%
|
||||||||
|
Adjusted EBITDA* renewable energies – U.S.
|
7
|
8
|
(12
|
)%
|
||||||||
|
Adjusted EBITDA* energy transition – U.S.
|
181
|
136
|
33
|
%
|
||||||||
|
Income
|
79
|
104
|
(24
|
)%
|
||||||||
|
Adjusted income*
|
103
|
85
|
21
|
%
|
||||||||
|
|
* |
Adjusted EBITDA and net income – for additional information regarding the definition and manner of the calculation – see Sections 4B, 4E and 5E of
Report of the Board of Directors which are included in the Periodic Report for 2022.
|
|
Israel
|
Eshkol tender – a bid was submitted for acquisition of the Eshkol power plant by a joint company held in equal shares by the Group and the Noy Fund.
Israel Lands Authority tenders – win in a land tender of Israel Lands Authority for a consideration of about NIS 484 million, involving construction of
facilities for solar generation of electricity, with a capacity of about 245 megawatts, together with storage, with a capacity of about 1,375 megawatts/hour.
Completion of the Veridis transaction and structural change in Israel – investment of capital in the first quarter in the amount of about NIS 452 million for
further growth in Israel and the structural change such that Veridis holds 20% of all the activities in Israel.
Completion of Gat transaction and financing of the project – acquisition of a power plant with a capacity of 75 megawatts, for a consideration of NIS 872 million
(after initial adjustments of working capital) and closing of a project financing agreement in the amount of NIS 450 million.
Increaser of the electricity tariffs – an average increase of about 12% in the generation component compared with the corresponding quarter last year.
Update of the hourly demand brackets from the beginning of the quarter – negative impact on the results in Israel activities and change in the seasonality of the
revenues – significant increase in the summer period at the expense of the other months of the year, particularly the months of the first quarter.
Commercial operation of the Karish reservoir starting from the end of the first quarter – estimated annual savings of about NIS 60 million.
Signing of agreement with the Bazan Group for supply of solar electricity – scope of 50 megawatts, graduated commencing from January 2025.
|
| 1 |
The Executive Summary below is presented solely for convenience and it is not a substitute for reading the full detail (including with reference to the matters referred to in the Summary)
as stated in this report with all its parts (including warnings relating to “forward‑looking” information, definitions or explanations with respect to the indices for measurement of the results).
|
|
U.S.
|
Decline in the energy margins
starting from the beginning of the quarter offset by hedging of the energy margins – the decline is against the background of the warm winter and high
inventory levels.
Completion of the Mountain Wind transaction and financing of the project subsequent to the date of the report – acquisition of a portfolio of active wind farms
with a capacity of 81.5 megawatts for a consideration of about NIS 625 million (about $175 million1), and closing of the project financing agreement, in the amount of about NIS 270 million (about $75 million).
Signing of an agreement with a tax partner in Maple Hill – investment of the tax partner in the aggregate amount of about NIS 280 million (about $78 million),
constituting about 40% of the construction cost, in light of the increase of the ITC rate as a result of the IRA Law.
Extension of the of Valley financing agreement – reaching of principle consents that require formal approvals and signing of final
documents for extension of the repayment date of the loan by 3 additional years along with reduction of the debt of about $55 million (CPV’s share – 50%) and update of the weighted‑average interest margin to about 5.75%.
|

| 2. |
Brief description of the Group’s area of activities
|
| 3. |
Main Developments in the Company’s Business Environment
|
| 3.1 |
General
|
|
|
A. |
Macro‑economic environment (particularly changes in inflation and interest) – for details
regarding significant changes in the macro‑economic environment in Israel and in the U.S., mainly during 2022 and as a result of the impact of the business environment on the activities of the Group companies, among other things, the prices
of energy, electricity and natural gas, tariffs in the Israeli electricity sector, the costs of executing construction projects, financing expenses, currency exchange rates and the like – see Section 11 below.
|
|
Proximate
|
||||||||||||||||||||||||||||
|
to the
|
||||||||||||||||||||||||||||
|
For the
|
For the
|
approval
|
||||||||||||||||||||||||||
|
three months ended
|
year ended
|
date of
|
||||||||||||||||||||||||||
|
3.31.23
|
Change
|
3.31.22
|
Change
|
12.31.22
|
Change
|
the report
|
||||||||||||||||||||||
|
CPI – Israel
|
108.9
|
1.1
|
%
|
103.5
|
1.2
|
%
|
107.7
|
5.3
|
%
|
110.1
|
||||||||||||||||||
|
CPI – U.S.
|
300.84
|
1.1
|
%
|
283.7
|
2.1
|
%
|
297.7
|
7.1
|
%
|
303.3
|
||||||||||||||||||
|
Interest rate – Bank
|
||||||||||||||||||||||||||||
|
of Israel
|
4.25
|
%
|
1
|
%
|
0.1
|
%
|
–
|
3.25
|
%
|
3.2
|
%
|
4.75
|
%
|
|||||||||||||||
|
Interest rate – the Fed
|
||||||||||||||||||||||||||||
|
– U.S.
|
4.75% – 5
|
%
|
0.5
|
%
|
0.25% – 0.5
|
%
|
0.25
|
%
|
4.5% – 4.25
|
%
|
4.25
|
%
|
5% – 5.25
|
%
|
||||||||||||||
|
Shekel/dollar currency
|
||||||||||||||||||||||||||||
|
exchange rate
|
3.615
|
2.73
|
%
|
3.176
|
2.12
|
%
|
3.519
|
13.15
|
%
|
3.66
|
||||||||||||||||||
|
|
|
In January 2023, the Government began advancement of a plan for making changes in Israel’s judicial system. Pursuant to the publications in the media, the changes could impact the strength of the Israeli
economy, and in particular they could lead to a reduction of the credit rating of the State of Israel (where as at the publication date of the report, the Moody’s rating company reduced the rating outlook from “positive” to “stable”),
adversely impact investments in the Israeli economy and trigger a removal of money and investments from Israel, increase the costs of the financing sources in Israel, cause of weakening of the exchange rate of the shekel against other
currencies (including the dollar) and harm the activities of the business sector. To the extent the above estimates materialize, wholly or partly, this could negatively impact the financial position and activities of the Company
customers and suppliers and could also impact the availability and cost of the capital and financing sources that are required by the Company, mainly for purposes of supporting its continued business growth.
|
|
|
B. |
The Coronavirus and broad global impacts on raw‑material prices and the supply chain – for
details regarding the impacts of the global trends that started against the background of the Coronavirus crisis and the Company’s estimate regarding the continuation and scope thereof on the Group’s activities, if any – see Section 3.1B to
the Report of the Board of Directors for 2022.
|
| 3. |
Main Developments in the Company’s Business Environment (Cont.)
|
|
|
3.2 |
Activities in Israel
|
|
|
C. |
Update of the electricity tariffs in the period of the report, including the brackets of the
demand hours –
|
|
Period
|
2023
|
2022
|
Quarterly
change
|
|||||||||
|
January
|
31.20
|
25.26
|
||||||||||
|
February
|
30.81
|
28.69
|
||||||||||
|
March
|
30.81
|
28.69
|
+12% |
|
||||||||
|
First quarter average
|
30.94
|
27.55
|
||||||||||
| 3. |
Main Developments in the Company’s Business Environment (Cont.)
|
|
|
3.2 |
Activities in Israel (Cont.)
|
|
|
D. |
Supplementary arrangements and granting of a supply license to Rotem – in February 2023, the
Electricity Authority published a proposed decision that includes application of benchmarks and granting of a supplier license to Rotem – for additional details – see Section 3.2E of the Report of the Board of Directors for 2022 (“the
Proposed Decision”). As at the approval date of the report, a final decision had not yet been published and the arrangements included as part of the Proposed Decision had not yet entered into effect, where to the best of the Company’s
knowledge, the Electricity Authority is expected to publish a decision regarding the matter. There is no certainty regarding the final language of the arrangements that will be determined (if ultimately determined) and the scope of their
impact. Based on the publication, the Proposed Decision creates uniformity regarding many aspects of the regulation applicable to Rotem with that of the generation facilities that are authorized to execute bilateral transactions, and thus
they should permit Rotem to operate in the energy market in a manner similar to that of the other generation facilities that are authorized to execute bilateral transactions. In addition, as stated in Section 7.15.5.1 of Part A of the
Periodic Report for 2022, in the Company’s estimation arrangements as stated in the proposed decision are expected to settle certain disputes between Rotem and the System Operator. Accordingly, to the extent an arrangement is not determined
regarding Rotem, as stated, and/or a different arrangement is determined or an arrangement that does not include granting a supply license to Rotem, Rotem will be required to settle the disputes with the System Operator, as stated, and as
at the approval date of the report, the Company is not able to estimate the impact of the said disputes on Rotem’s activities4.
|
|
3
|
For additional details – see Sections 7.2.4 and 7.10.2 of Part A of the Periodic Report for 2022. That stated in this Section with reference to the impacts of the update to the hourly demand
brackets constitutes “forward‑looking” information as it is defined in the Securities Law, which is based on the Company’s estimates and assumptions as at the date of the report and regarding which there is no certainty it will
materialize. Ultimately, the impact could be different than that stated, this being due to, among other things, the Company’s estimates with respect to the consumption profile not materializing, the manner of its distribution and/or
the actual mix of the customers and/or occurrence of one or more of the risk factors the Company is subject to.
|
| 4 |
For additional details – see Section 7.3.18.5 of Part A of the Periodic Report, which is presented by means of reference.
|
|
|
| 3. |
Main Developments in the Company’s Business Environment (Cont.)
|
|
|
3.3 |
Activities in the U.S.
|
|
|
E. |
Electricity and natural gas prices
|
|
For the
|
||||||||||||
|
Three Months Ended
|
||||||||||||
|
Region
|
March 31
|
|||||||||||
|
(Power Plant)
|
2023
|
2022
|
Change
|
|||||||||
|
TETCO M3 (Shore, Valley)
|
2.93
|
6.73
|
(56
|
)%
|
||||||||
|
Transco Zone 5 North (Maryland)
|
3.19
|
7.47
|
(57
|
)%
|
||||||||
|
TETCO M2 (Fairview)
|
2.25
|
4.10
|
(45
|
)%
|
||||||||
|
Dominion South (Valley)
|
2.22
|
4.06
|
(45
|
)%
|
||||||||
|
Algonquin (Towantic)
|
5.13
|
13.67
|
(62
|
)%
|
||||||||
|
For the
|
||||||||||||
|
Three Months Ended
|
||||||||||||
|
Region
|
March 31
|
|||||||||||
|
(Power Plant)
|
2023
|
2022
|
Change
|
|||||||||
|
PJM West (Shore and Maryland)
|
33.13
|
55.58
|
(40
|
)%
|
||||||||
|
PJM AD Hub (Fairview)
|
31.05
|
48.46
|
(36
|
)%
|
||||||||
|
NY‑ISO Zone G (Valley)
|
42.09
|
94.69
|
(56
|
)%
|
||||||||
|
ISO‑NE Mass Hub (Towantic)
|
50.57
|
110.72
|
(54
|
)%
|
||||||||
| 3. |
Main Developments in the Company’s Business Environment (Cont.)
|
|
|
3.3 |
Activities in the U.S. (Cont.)
|
|
|
F. |
Availability (capacity) payments
|
|
Sub-Region
|
CPV Plants5
|
2024/2025
|
2023/2024
|
2022/2023
|
2021/2022
|
|
PJM RTO
|
28.92
|
34.13
|
50
|
140
|
|
|
PJM COMED
|
Three Rivers
|
28.92
|
34.13
|
-
|
-
|
|
PJM MAAC
|
Fairview, Maryland, Maple Hill
|
49.49
|
49.49
|
95.79
|
140
|
|
PJM EMAAC
|
Shore
|
54.95
|
49.49
|
97.86
|
165.73
|
| 3. |
Main Developments in the Company’s Business Environment (Cont.)
|
|
|
3.3 |
Activities in the U.S. (Cont.)
|
|
|
F. |
Availability payments (Cont.)
|
|
Sub-Area
|
CPV
Plants
|
Summer 2023
|
Winter 2022/2023
|
Summer 2022
|
Winter 2021/2022
|
|
NYISO
Rest of the Market
|
–
|
153.26
|
39.12
|
110.87
|
33.15
|
|
Lower Hudson Valley
|
Valley
|
164.35
|
43.43
|
151.63
|
33.48
|
| 3. |
Main Developments in the Company’s Business Environment (Cont.)
|
|
|
3.3 |
Activities in the U.S. (Cont.)
|
|
|
F. |
Availability payments (Cont.)
|
|
Sub-Region
|
CPV Power Plants
|
2026/2027
|
2025/2026
|
|
ISO-NE
Rest of the Market
|
Towantic
|
85.15
|
85.15
|
|
|
G. |
For additional details regarding the IRA Law, which grants significant tax benefits to projects involving renewable energies and carbon capture technologies, and the impact thereof on the
construction and development projects of the CPV Group – see Section 3.2H of the Report of the Board of Directors for 2022.
For additional details regarding developments in the Company’s activities in the U.S. – see Sections 5 and 9 below.
|
| 4. |
Results of operations for the three‑month period ended March 31, 2023 (in millions of NIS)
|
| 4. |
Results of operations for the three‑month period ended March 31, 2023 (in millions of NIS) (Cont.)
|
|
|
A. |
Statement of income6
|
|
For the three months ended
|
|||||||||
|
Section
|
March 31
|
Board’s explanations
|
|||||||
|
2023
|
2022
|
||||||||
|
Revenues from sale and provision of services (1)
|
519
|
468
|
For details – see this Section below.
|
||||||
|
Cost of sales and provision of services (without depreciation and amortization) (2)
|
364
|
311
|
For details – see this Section below.
|
||||||
|
Depreciation and amortization
|
48
|
42
|
|||||||
|
Gross profit
|
107
|
115
|
For details – see Sections C and D below.
|
||||||
|
Administrative and general expenses
|
59
|
48
|
For details – see Sections C and D below.
|
||||||
|
Share in earnings of associated companies7
|
85
|
95
|
For details – see Section D below.
|
||||||
|
Business development expenses
|
15
|
10
|
|||||||
|
Ordinary income
|
118
|
152
|
|||||||
|
Financing expenses, net
|
18
|
21
|
|
||||||
|
Income before taxes on income
|
100
|
131
|
|||||||
|
Taxes on income
|
21
|
27
|
|||||||
|
Net income for the period *
|
79
|
104
|
|
||||||
|
Adjustments
|
24
|
(19
|
)
|
For details – see Section F below.
|
|||||
|
Adjusted income for the period8 **
|
103
|
85
|
|
||||||
|
|
* |
Net income for the period of about NIS 63 million in the period of the report and a loss of about NIS 78 million in the corresponding period last year is attributable to the Company’s shareholders and the balance is attributable to the
holders of the non‑controlling interests.
|
|
|
** |
Adjusted net income for the period of about NIS 79 million in the period of the report and about NIS 66 million in the corresponding period last year is attributable to the Company’s shareholders and the balance is attributable to the
holders of the non‑controlling interests.
|
| 6 |
The results of the associated companies in the U.S. are presented in the category “Company’s share in earnings of associated companies”.
|
| 4. |
Results of operations for the three‑month period ended March 31, 2023 (in millions of NIS) (Cont.)
|
|
|
A. |
Statement of income (Cont.)
|
|
Revenues
|
For the
|
Board’s Explanations
|
|||||||
|
Three Months Ended
|
|||||||||
|
|
March 31,
|
|
|||||||
|
2023
|
2022
|
||||||||
|
Revenues in Israel
|
|||||||||
|
Revenues from sale of energy to private customers
|
300
|
291
|
The increase stems from an increase in customer consumption, in the amount of about NIS 81 million, offset by a decrease, in the amount of about NIS 72 million, which is a result of the impact in the change of
the hourly demand brackets, net of an increase in the generation component (as detailed Section 3.2C, above).
|
||||||
|
Revenues from private customers in respect of infrastructure services
|
116
|
75
|
The increase, stems mainly from an increase in the infrastructure tariff and an increase in customer consumption, in the amounts of about NIS 33
million and about NIS 9 million, respectively.
|
||||||
|
Revenues from sale of energy to the System Operator and to other suppliers
|
23
|
40
|
Most of the decrease, in the amount of about NIS 11 million, stems from an increase in customer consumption, which decreased the revenues from surplus
electricity.
|
||||||
|
Revenues from sale of steam
|
17
|
14
|
|||||||
|
Other revenues
|
8
|
8
|
|||||||
|
Total revenues in Israel
|
464
|
428
|
|||||||
|
Revenues in the U.S.
|
|||||||||
|
Revenues from sale of electricity from renewable energy
|
24
|
22
|
|||||||
|
Revenues from provision of services (under others)
|
31
|
18
|
|||||||
|
Total revenues in the U.S.
|
55
|
40
|
|||||||
|
Total revenues
|
519
|
468
|
|||||||
|
4.
|
Results of operations for the three‑month period ended March 31, 2023 (in millions of NIS) (Cont.)
|
|
|
A. |
Statement of income (Cont.)
|
|
|
(2) |
Changes in the cost of sales and provision of services (not including depreciation and amortization) (in NIS millions):
|
|
Cost of Sales and
Provision of Services
|
For the
|
Board’s Explanations
|
|||||||
|
Three Months Ended
|
|||||||||
|
December 31
|
|||||||||
|
2023
|
2022
|
||||||||
|
Cost of sales in Israel
|
|||||||||
|
Natural gas and diesel oil
|
133
|
123
|
An increase, in the amount of about NIS 18 million, stemming from an increase in the natural gas tariff as a result of an increase in the generation component and the shekel/dollar exchange rate, an increase,
in the amount of about NIS 10 million, in the quantity of the gas consumed against the background of unplanned maintenance work at the Rotem Power Plant in the corresponding period last year, offset by a decrease, in the amount of about
NIS 18 million, deriving from compensation from Energean relating to Rotem and Hadera. (For details – see Note 8A(1) to the Interim Statements).
|
||||||
|
Expenses in respect of acquisition of energy
|
43
|
57
|
A decrease, in the amount of about NIS 22 million, against the background of unplanned maintenance work at the Rotem Power Plant in the corresponding
period last year, offset by an increase, in the amount of about NIS 10 million, deriving from an increase in consumption by customers in the period of the report.
|
||||||
|
Expenses in respect of infrastructure services
|
116
|
75
|
The increase stems mainly from an increase in the infrastructure tariff and an increase in customer consumption, in the amounts of about NIS 33
million and about NIS 9 million, respectively.
|
||||||
|
Cost of transmission of gas
|
7
|
8
|
|||||||
|
Operating expenses
|
21
|
20
|
|||||||
|
Other expenses
|
12
|
6
|
An increase, in the amount of about NIS 6 million, in respect of activities relating to the commercial operation of Zomet, which is expected to take
place in the second quarter of 2023.
|
||||||
|
Total cost of sales in Israel
|
332
|
289
|
|||||||
|
Cost of sales and services in the U.S.
|
|||||||||
|
Cost of sales in respect of sale of electricity from renewable energy
|
8
|
6
|
|||||||
|
Cost in respect provision of services (under others)
|
24
|
–
|
|||||||
|
Total cost of sales and provision of services in the U.S.
|
32
|
22
|
|||||||
|
Total cost of sales and provision of services
|
364
|
311
|
|||||||
| 4. |
Results of operations for the three‑month period ended March 31, 2023 (in millions of NIS) (Cont.)
|
|
|
B. |
Calculation of the EBITDA and Adjusted EBITDA9 (in millions of NIS):
|
|
For the
|
||||||||
|
Three Months Ended
|
||||||||
|
December 31
|
||||||||
|
2023
|
2022
|
|||||||
|
Revenues from sales and provision of services
|
519
|
468
|
||||||
|
Cost of sales (without depreciation and amortization)
|
(364
|
)
|
(311
|
)
|
||||
|
Administrative and general expenses (without depreciation and
|
||||||||
|
amortization)
|
(55
|
)
|
(46
|
)
|
||||
|
Business development expenses
|
(15
|
)
|
(10
|
)
|
||||
|
Consolidated EBITDA
|
85
|
101
|
||||||
|
Share of Group in proportionate EBITDA of associated companies (1)
|
160
|
160
|
||||||
|
EBITDA (total consolidated and the proportionate amount of
|
||||||||
|
associated companies)
|
245
|
261
|
||||||
|
Adjustments – see detail in Section F below
|
30
|
(23
|
)
|
|||||
|
Adjusted EBITDA
|
275
|
238
|
||||||
|
|
(1) |
Calculation of proportionate “EBITDA” and “Adjusted EBITDA” of associated companies10 (in millions of NIS):
|
|
For the
|
||||||||
|
Three Months Ended
|
||||||||
|
December 31
|
||||||||
|
2023
|
2022
|
|||||||
|
Revenues from availability payments
|
57
|
60
|
||||||
|
Revenues from sales of energy and other
|
275
|
475
|
||||||
|
Cost of sales – natural gas (without depreciation and amortization)
|
(158
|
)
|
(295
|
)
|
||||
|
Cost of sales – other expenses (without depreciation and
|
||||||||
|
amortization)
|
(68
|
)
|
(57
|
)
|
||||
|
Gain (loss) from realization of transactions hedging the electricity
|
||||||||
|
margins
|
83
|
(41
|
)
|
|||||
|
Changes in fair value of forward transactions in hedging plans
|
||||||||
|
of the electricity margins
|
(23
|
)
|
23
|
|||||
|
Administrative and general expenses (without depreciation and
|
||||||||
|
amortization)
|
(6
|
)
|
(5
|
)
|
||||
|
Proportionate EBITDA of associated companies
|
160
|
160
|
||||||
|
Adjustments in respect of associated companies (see detail in
|
||||||||
|
Section F below)
|
(23
|
)
|
23
|
|||||
|
Adjusted proportionate EBITDA of associated companies
|
183
|
137
|
||||||
| 9 |
For details regarding the definitions of “EBITDA” and “Adjusted EBITDA” – see Section 4B of the Report of the Board of Directors for 2022.
|
| 10 |
Represents the EBITDA of the associated companies on the basis of the rate of holdings of the CPV Group therein.
|
| 4. |
Results of operations for the three‑month period ended March 31, 2023 (in millions of NIS) (Cont.)
|
|
|
B. |
EBITDA and Adjusted EBITDA (Cont.)
|
|
|
Basis of
|
||||||||
|
|
presentation
|
||||||||
|
|
in the
|
For the
|
|||||||
|
|
Company’s
|
Three Months Ended
|
|||||||
|
|
financial
|
December 31
|
|||||||
|
|
statements
|
2023
|
2022
|
||||||
|
Rotem
|
Consolidated
|
101
|
101
|
||||||
|
Hadera
|
Consolidated
|
26
|
25
|
||||||
|
Zomet
|
Consolidated
|
(3
|
)
|
(2
|
)
|
||||
|
Business development costs, headquarters and others
|
Consolidated
|
(6
|
)
|
(4
|
)
|
||||
|
Total Israel
|
118
|
120
|
|||||||
|
Fairview
|
Associate
|
56
|
14
|
||||||
|
Towantic
|
Associate
|
31
|
23
|
||||||
|
Maryland
|
Associate
|
11
|
8
|
||||||
|
Shore
|
Associate
|
9
|
9
|
||||||
|
Valley
|
Associate
|
76
|
84
|
||||||
|
Other
|
Consolidated
|
(2
|
)
|
(2
|
)
|
||||
|
Total energy transition in the U.S.
|
181
|
136
|
|||||||
|
Keenan
|
Consolidated
|
16
|
14
|
||||||
|
Development costs of renewable energy
|
Consolidated
|
(9
|
)
|
(6
|
)
|
||||
|
Total renewable energy in the U.S.
|
7
|
8
|
|||||||
|
Total activities under other segments
|
Consolidated
|
–
|
(1
|
)
|
|||||
|
Headquarters in the United States11
|
Consolidated
|
(24
|
)
|
(20
|
)
|
||||
|
Total United States
|
164
|
123
|
|||||||
|
Company headquarters (not allocated to the
|
|||||||||
|
segments)11
|
Consolidated
|
(7
|
)
|
(5
|
)
|
||||
|
Adjusted EBITDA
|
275
|
238
|
|||||||
| 4. |
Results of operations for the three‑month period ended March 31, 2023 (in millions of NIS) (Cont.)
|
|
|
C. |
Analysis of the change in adjusted EBITDA – segment in Israel
|
|
|
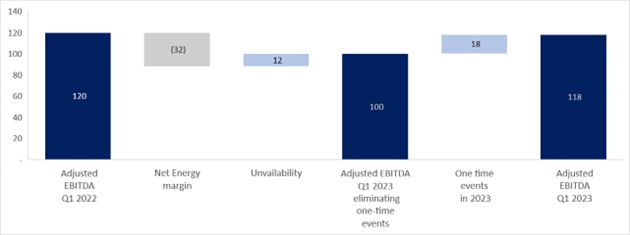
1. |
Energy margin – the decrease in energy margin in the period of the report compared with the corresponding period last year stems mainly from a negative impact on the revenues as a
result of revision of the hourly demand brackets, in the aggregate amount of about NIS 72 million, of which about NIS 61 million will be recovered mainly in the third quarter of 2023 (for additional details – see Section 3.2C above),
net of the increase in the generation tariff, in the amount of about NIS 39 million, and an increase in the natural gas prices as a result of an increase in the generation tariff, and from the weakness of the shekel against the dollar
(an increase of about NIS 14 million). On the other hand, there was an increase in sales of energy, in the amount of about NIS 13 million, due to an increase in customer consumption.
|
|
|
2. |
Unavailability due to maintenance work – during the corresponding quarter last year, the Rotem and Hadera power plants were shut down for different periods of time for purposes of
maintenance work, which had a negative impact on their results compared with the period of the report. For additional details – see Section 4C(3) to the Report of the Board of Directors for 2022. Later on in 2023 Hadera’s gas turbines
are expected to undergo maintenance, in the cumulative amount of about 45 days1.
|
|
|
3. |
One‑time events – in the period of the report, Rotem and Hadera recognized a contractual monetary amount it is entitled to from Energean, in the aggregate amount of about NIS 18 million further to amendment of
the agreements from May 2022. The said amount is expected to be received in the beginning of 2024. For additional details – see Note 8A(1) to the Interim Statements.
|
| 12 |
That stated with reference to the maintenance work and the duration of the period thereof constitutes “forward‑looking” information, as it is defined in the Securities Law, 1968 (“the Securities Law”) which is
based on the Company’s estimates as at the submission date of the report. Actually, the maintenance work could be postponed or could continue even beyond that planned due to, among other things, technical delays, disruptions or breakdowns
in the work process, and/or delay in arrival of the work teams or equipment to the site. The maintenance work and a delay and/or problems with the maintenance work (particularly a continuing delay) could have a significant negative impact
on Hadera’s results.
|
| 4. |
Results of operations for the three‑month period ended March 31, 2023 (in millions of NIS) (Cont.)
|
|
|
D. |
Analysis of the change in adjusted EBITDA – energy transition segment in the U.S.
|

|
|
1. |
Unavailability – most of the increase stems from unplanned maintenance work at the Valley
power plant in the corresponding period last year. As stated in the Periodic Report for 2022, later on in 2023, the Shore, Fairview and Valley power plants are each expected to perform significant maintenance work (significant maintenance
work generally lasts for about 30 to 40 days).14
|
|
|
2. |
Energy margin and availability (capacity) payments – as stated in Section 3.3F above, in the
period of the report the gas prices and the electricity prices declined significantly compared with the corresponding period last year, and correspondingly there was a decline, in the amount of about NIS 98 million, in the electricity
margins of the CPV Group (on the assumption of full capacity). In addition, there was a decrease, in the amount of about NIS 9 million, in the availability payments in the period of the report compared with the corresponding period last
year (for details regarding the availability tariffs – see Section 3.3(F) above).
|
|
|
3. |
Energy hedges15 – the said decrease in the electricity margins in some of the power plants was partly offset by hedging made during 2022 the realization of which led to an increase in the results of the CPV Group in the
period of the report, in the amount of about NIS 128 million, compared with the corresponding period last year. For details regarding energy hedges for the balance of 2023 – see Section E below.
|
| 13 |
For the definition of adjusted EBITDA – see Section 4B above to the Report of the Board of Directors for 2022.
|
| 14 |
That stated with reference to maintenance work, the duration thereof and the expected projects constitutes “forward‑looking” information, as it is defined in the Securities Law, 1968 (“the
Securities Law”). It is noted that additional maintenance work may be required in the power plants of the CPV Group, including unplanned maintenance work, due to a change in the timetables or breakdowns. Partial activities or a shutdown of
the power plants for extended periods would have a negative impact on the results of the CPV Group.
|
| 4. |
Results of operations for the three‑month period ended March 31, 2023 (in millions of NIS) (Cont.)
|
|
|
E. |
Additional details regarding energy hedges and guaranteed availability payments in the Energy
Transition segment in the U.S.16
|
|
April–December 2023 (**)
|
|
|
Scope of the hedged energy (% of the power plant’s capacity based on the expected generation)
|
10%
|
|
Hedged energy margin (millions of NIS) (*)
|
About 70 (about $20 million)
|
|
April–December 2023 (**)
|
|
|
Scope of the availability payments (% of the power plant’s capacity)
|
92%
|
|
Availability payments (millions of NIS) (*)
|
About 145 (about $40 million)
|
|
|
(*) |
The data presented in the above tables is on the basis of the rate of holdings of the CPV Group in the associated companies.
|
|
|
(**) |
As at the approval date of the report.
|
| 16 |
The estimated percentages and the actual hedged energy margins could change due to new hedges and/or sales of availability made or as a result of market conditions.
|
| 4. |
Results of operations for the three‑month period ended March 31, 2023 (in millions of NIS) (Cont.)
|
|
|
F. |
Adjustments to EBITDA and income for the year
|
|
For the three months ended
|
|||||||||
|
Section
|
March 31
|
Board’s explanations
|
|||||||
|
2023
|
2022
|
||||||||
|
Change in the fair value of derivative financial instruments in the U.S. (as part of the Company’s share of income of associated companies in the U.S.)
|
23
|
(23
|
)
|
Represents the change in the fair value of derivative financial instruments that are used in programs for hedging electricity margins of the transition generation
energies segment in the U.S. and that were not designated for hedge accounting – for details see Section E above.
|
|||||
|
Change in expenses, not in the ordinary course of business and/or of a non‑recurring natures
|
7
|
–
|
In the period of the report, represents activities in respect of the Company’s preparations for the commercial operation of the Zomet power plant, which is expected to
take place in the first half of 2023.
|
||||||
|
Total adjustments to EBITDA
|
30
|
(23
|
)
|
||||||
|
Tax impact in respect of the adjustments
|
(6
|
)
|
4
|
||||||
|
Total adjustments to net income for the period
|
24
|
(19
|
)
|
||||||
| 4. |
Results of operations for the three‑month period ended March 31, 2023 (in millions of NIS) (Cont.)
|
|
|
G. |
Detail regarding sales, generation and purchases of energy (in millions of kilowatt/hours)
|
|
For the period ended March 31, 2022
|
For the period ended March 31, 2023
|
|||||||||||||||||||||||||||||||||||
|
Potential
|
Net
|
Actual
|
Actual
|
Potential
|
Net
|
Actual
|
Actual
|
|||||||||||||||||||||||||||||
|
electricity
|
electricity
|
generation
|
availability
|
electricity
|
electricity
|
generation
|
availability
|
|||||||||||||||||||||||||||||
|
Capacity
|
generation
|
generation
|
percentage
|
percentage
|
generation
|
generation
|
percentage
|
percentage
|
||||||||||||||||||||||||||||
|
(MW)
|
(GWh)
|
(GWh)
|
(%)
|
(%)
|
(GWh)
|
(GWh)
|
(%)
|
(%)
|
||||||||||||||||||||||||||||
|
Rotem
|
466
|
962
|
831
|
86.4
|
%
|
87.9
|
%
|
966
|
911
|
94.3
|
%
|
100
|
%
|
|||||||||||||||||||||||
|
Hadera
|
144
|
259
|
255
|
98.5
|
%
|
98.5
|
%
|
259
|
252
|
97.3
|
%
|
97.3
|
%
|
|||||||||||||||||||||||
|
For the period ended March 31, 2022
|
For the period ended March 31, 2023
|
|||||||||||||||||||||||||||||||||||
|
Potential
|
Net
|
Actual
|
Actual
|
Potential
|
Net
|
Actual
|
Actual
|
|||||||||||||||||||||||||||||
|
electricity
|
electricity
|
generation
|
availability
|
electricity
|
electricity
|
generation
|
availability
|
|||||||||||||||||||||||||||||
|
Capacity
|
generation
|
generation
|
percentage
|
percentage
|
generation
|
generation
|
percentage
|
percentage
|
||||||||||||||||||||||||||||
|
(MW)
|
(GWh)
|
(GWh)
|
(%)
|
(%)
|
(GWh)
|
(GWh)
|
(%)
|
(%)
|
||||||||||||||||||||||||||||
|
Energy transition projects (natural gas)
|
||||||||||||||||||||||||||||||||||||
|
Fairview
|
1,050
|
2,324
|
2,107
|
94.6
|
%
|
96.7
|
%
|
2,323
|
2,166
|
97.2
|
%
|
100.0
|
%
|
|||||||||||||||||||||||
|
Towantic
|
805
|
1,740
|
1,232
|
67.8
|
%
|
95.1
|
%
|
1,681
|
1,333
|
73.1
|
%
|
95.7
|
%
|
|||||||||||||||||||||||
|
Maryland
|
745
|
1,619
|
802
|
49.0
|
%
|
95.2
|
%
|
1,619
|
1,191
|
73.4
|
%
|
99.5
|
%
|
|||||||||||||||||||||||
|
Shore
|
725
|
1,625
|
927
|
58.5
|
%
|
99.3
|
%
|
1,272
|
826
|
52.2
|
%
|
77.0
|
%
|
|||||||||||||||||||||||
|
Valley
|
720
|
1,638
|
1,349
|
88.6
|
%
|
93.9
|
%
|
1,638
|
1,161
|
74.7
|
%
|
83.1
|
%
|
|||||||||||||||||||||||
|
Renewable energy projects
|
||||||||||||||||||||||||||||||||||||
|
Keennan II
|
152
|
328
|
72
|
22.0
|
%
|
93.9
|
%
|
328
|
60
|
18.4
|
%
|
95.7
|
%
|
|||||||||||||||||||||||
| (*) |
The net generation is the gross generation during the period less the electricity used for the power plant’s internal purposes. The actual generation percentage is the quantity of the electricity generated in the facilities compared with
the maximum quantity that can be generated in the period and it is impacted by unplanned power outages or current maintenance in the power plants that are scheduled for fixed time periods. The revenues of the power plants from energy stem
from net generation of electricity.
|
| 5. |
Initiation and Construction Projects
|
|
|
1. |
Main details with reference to construction projects in Israel (held at 100% ownership by OPC Israel, which is 80% held by the Company)17:
|
| 17 |
That stated in connection with projects that have not yet reached operation including with reference to the
expected operation date, the technologies and/or characteristics and the anticipated cost of the investment, is “forward‑looking” information, as it is defined in the Securities Law, which is based on the Company’s estimates and assumptions
as at the approval date of the report and regarding which there is no certainty it will be realized (in whole or in part). Completion of the said projects (or any one of them) may not occur or may occur in a manner different than that
stated above, among other things due to dependency on various factors, including those that are not under the Company’s control, including assurance of connection to the network and output of electricity from the project sites and/or
connection to the infrastructures (including gas infrastructures), receipt of permits, completion of planning processes and licensing, completion of construction work, final costs in respect of development, construction and land, the proper
functioning of the equipment and/or the terms of undertakings with main suppliers (as applicable) and there is no certainty they will be fulfilled, the manner of their fulfillment, the extent of their impact or what their final terms will
be. Ultimately technical, operational or other delays and/or breakdowns and/or an increase in expenses could be caused, this being as a result of, among other things, factors as stated above or as a result of occurrence of one or more of
the risk factors the Company is exposed to, including construction risks (including force majeure events), regulatory risks, macro‑economic changes, delays and increased costs due relating to the supply chain, transport and changes in raw‑material prices and etc. For additional details
regarding risk factors – see Section 19 of Part A of the Periodic Report for 2022. It is further clarified that delays in completion of the above‑mentioned projects beyond the date originally planned for this could impact the ability of the
Company and the Group companies to comply with their obligations to third parties (including, authorities, conditions of permits, lenders, yard consumers and others) in connection with the projects.
|
| 5. |
Initiation and Construction Projects
|
|
|
1. |
Main details with reference to construction projects in Israel (held at 100% ownership by OPC Israel, which is 80% held by the Company):
|
|
Power
|
Date/
|
Total
|
Total
|
|||||||||||||
|
plants/
|
expectation
|
expected
|
expected
|
|||||||||||||
|
facilities
|
of the start
|
construction
|
construction
|
|||||||||||||
|
for
|
of the
|
Main
|
cost
|
cost
|
||||||||||||
|
generation
|
Capacity
|
commercial
|
customer/
|
(NIS
|
(NIS
|
|||||||||||
|
of energy
|
Status
|
(megawatts)
|
Location
|
Technology
|
operation
|
consumer
|
billions)
|
billions)
|
||||||||
|
Zomet Energy Ltd. (“Zomet”)
|
Under construction
|
≈ 396
|
Plugot Intersection
|
Conventional powered by natural gas in an open cycle
|
The first half of 2023 (1)
|
The System Operator18
|
19≈ 1.4
|
20≈ 1.3
|
| (1) |
As at the approval date of the report, the power plant is undergoing acceptance tests in anticipation of commercial operation.
|
| 5. |
Initiation and Construction Projects (Cont.)
|
|
Total cost
|
||||||||||||||||
|
of the
|
||||||||||||||||
|
Power
|
Date/
|
Average
|
Total
|
investment
|
||||||||||||
|
plants/
|
expectation
|
expected
|
expected
|
as at
|
||||||||||||
|
facilities
|
of the start
|
tariff
|
construction
|
March 31,
|
||||||||||||
|
for
|
of the
|
for
|
cost
|
2023
|
||||||||||||
|
generation
|
Capacity
|
commercial
|
sale of
|
(NIS
|
(NIS
|
|||||||||||
|
of energy
|
Status
|
(megawatts)
|
Location
|
Technology
|
operation
|
electricity
|
millions)
|
millions)
|
||||||||
|
OPC Sorek 2 Ltd. (“Sorek 2”)
|
Under construction
|
≈ 87
|
On the premises of the Sorek B seawater desalination facility
|
Powered by natural gas, cogeneration
|
The first half of 202421
|
Yard consumers and the System Operator
|
≈ 200
|
22≈ 91
|
| 5. |
Initiation and Construction Projects (Cont.)
|
|
Total cost
|
||||||||||||||||
|
of the
|
||||||||||||||||
|
Power
|
Date/
|
Average
|
Total
|
investment
|
||||||||||||
|
plants/
|
expectation
|
expected
|
expected
|
as at
|
||||||||||||
|
facilities
|
of the start
|
tariff
|
construction
|
March 31,
|
||||||||||||
|
for
|
of the
|
for
|
cost
|
2023
|
||||||||||||
|
generation
|
Capacity
|
commercial
|
sale of
|
(NIS
|
(NIS
|
|||||||||||
|
of energy
|
Status
|
(megawatts)
|
Location
|
Technology
|
operation
|
electricity
|
millions)
|
millions)
|
||||||||
|
Facilities for generation of energy located on the consumer’s premises
|
In various stages of development / construction
|
Projects with a cumulative scope of about 110 megawatts. The Company intends to act to expand projects with a cumulative scope of at least 120 megawatts23
|
On the premises of consumers throughout Israel
|
Conventional, natural gas and renewable energy (solar, storage)
|
Gradually starting from the first half of 2023
|
Yard consumers also including Group customers and the System Operator.
|
An average of about NIS 4 per megawatt
|
≈ 126
|
| 5. |
Initiation and Construction Projects (Cont.)
|
| 2. |
Main details regarding construction projects or projects that have a PPA for long‑term sale in the U.S.24
|
| 5. |
Initiation and Construction Projects (Cont.)
|
|
|
1. |
Main details with reference to the construction projects or projects that have a PPA for long‑term sale in the United States:24
|
|
Total
|
Amount
|
||||||||||||||||||||
|
estimated
|
of the
|
||||||||||||||||||||
|
construction
|
investment
|
||||||||||||||||||||
|
cost for
|
in the
|
||||||||||||||||||||
|
Rate of
|
Presentation
|
100%
|
project at
|
||||||||||||||||||
|
holdings
|
format
|
Expected
|
of the
|
March 31,
|
|||||||||||||||||
|
of the
|
in the
|
commercial
|
project
|
2023
|
|||||||||||||||||
|
Capacity
|
CPV
|
financial
|
Tech-
|
operation
|
Regulated
|
(NIS
|
NIS
|
||||||||||||||
|
Project
|
Status
|
(megawatts)
|
Group
|
statements
|
Location
|
nology
|
date
|
market
|
billions)25
|
billions)
|
|||||||||||
|
CPV Three Rivers LLC (“Three Rivers”)
|
Under construction
|
1,258
|
10%
|
Associated company
|
Illinois
|
Natural gas, combined cycle
|
The second half of 2023
|
PJM
ComEd
|
≈ 4.7 (≈ $1.3 billion)
|
≈ 4
(≈ $1.2 billion)
|
| 5. |
Initiation and Construction Projects (Cont.)
|
|
Total
|
Amount
|
|||||||||||||||||||
|
estimated
|
of the
|
|||||||||||||||||||
|
construction
|
investment
|
|||||||||||||||||||
|
cost for
|
in the
|
|||||||||||||||||||
|
Rate of
|
Presentation
|
100%
|
project at
|
|||||||||||||||||
|
holdings
|
format
|
Expected
|
of the
|
March 31,
|
||||||||||||||||
|
of the
|
in the
|
commercial
|
project
|
2023
|
||||||||||||||||
|
Capacity
|
CPV
|
financial
|
Tech-
|
operation
|
Regulated
|
(NIS
|
NIS
|
|||||||||||||
|
Project
|
(megawatts)
|
Group
|
statements
|
Location
|
nology
|
date
|
market
|
billions)27
|
billions)
|
|||||||||||
|
CPV Maple Hill Solar LLC (“Maple Hill”).
|
126 MWdc26
|
27100%
|
Consolidated
|
Pennsylvania
|
Solar
|
Second half of 202328
|
PJM MAAC market.
Long-term PPA.
Green certificates29.
|
≈ 0.8 (≈ $0.2 billion)30
|
≈ 0.5
(≈ $0.1 billion)
|
| 5. |
Initiation and Construction Projects (Cont.)
|
|
Total
|
Amount
|
||||||||||||||||||
|
estimated
|
of the
|
||||||||||||||||||
|
construction
|
investment
|
||||||||||||||||||
|
cost for
|
in the
|
||||||||||||||||||
|
Rate of
|
Presentation
|
100%
|
project at
|
||||||||||||||||
|
holdings
|
format
|
Expected
|
of the
|
March 31,
|
|||||||||||||||
|
of the
|
in the
|
commercial
|
project
|
2023
|
|||||||||||||||
|
Capacity
|
CPV
|
financial
|
Tech-
|
operation
|
Regulated
|
(NIS
|
NIS
|
||||||||||||
|
Project
|
(MW)
|
Group
|
statements
|
Location
|
nology
|
date
|
market
|
billions)
|
billions)
|
||||||||||
|
CPV Stagecoach Solar, LLC (“Stagecoach”).
|
100
|
100%
|
Consolidated
|
Georgia
|
Solar
|
First half of 2024
|
Long-term PPA agreement (including green certificates)31
|
≈ 458
(≈ $127 million)32
|
≈ 173
(≈ $48 million)
|
| 5. |
Initiation and Construction Projects (Cont.)
|
|
Technology
|
Advanced34
|
Early stage
|
Total*
|
|||||||||
|
Solar35
|
1,650
|
1,050
|
2,700
|
|||||||||
|
Wind (1)
|
100
|
450
|
550
|
|||||||||
|
Total renewable energy
|
1,750
|
1,500
|
3,250
|
|||||||||
|
Carbon capture projects (natural gas
|
||||||||||||
|
with reduced emissions) (2)
|
1,300
|
2,000
|
3,300
|
|||||||||
|
Total natural gas
|
650
|
600
|
1,250
|
|||||||||
|
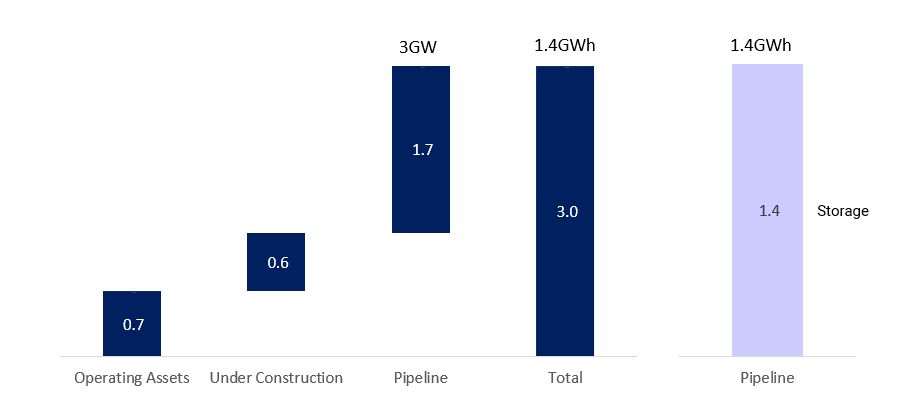
|
* |
It is noted that out of the total of the development projects, as stated above, a scope of about 1,600 megawatts (of which about 1,000 megawatts is renewable energy) and about 2,700 megawatts (of which about
700 megawatts is renewable energy) are in the PJM market in an advanced stage and in an initial stage, respectively.
|
|
|
(1) |
For additional details regarding the Rogue’s Wind project, with a capacity of 114 megawatts, in Pennsylvania, which signed a long‑term PPA agreement, which is in advanced development and the commencement date of its construction is
expected to be in the second half of 2023 – see Section 6A(3) of the Report of the Board of Directors for 2022 and Section 8.14.7 of Part A of the Periodic Report for 2022.
|
|
|
(2) |
For additional details regarding development of two power plants with reduced emissions in natural gas that are based on use of advanced technologies for carbon capture – see Section 6A(6) of the Report of the Board of Directors for 2022.
|
|
Category
|
3/31/2023
|
12/31/2022
|
Board’s Explanations
|
||||||
|
Current Assets
|
|||||||||
|
Cash and cash equivalents
|
1,503
|
849
|
For additional information – see the Company’s condensed consolidated statements of cash flows in the interim financial statements and Part 7 below.
|
||||||
|
Short-term deposits
|
–
|
125
|
The decrease stems from release of short-term deposits.
|
||||||
|
Short-term deposits and restricted cash
|
23
|
36
|
|||||||
|
Trade receivables and accrued income
|
191
|
260
|
Most of the decrease stems from a decrease in accrued income in Israel, in the amount of about NIS 85 million, mainly as a result of the timing differences and the impact of the seasonal
factor with respect the sales, which became larger in the period of the report against the background of a change in the hourly demand brackets (for details – see Section 3.2C) above.
|
||||||
|
Receivables and debit balances
|
179
|
190
|
Most of the decrease stems from a decrease, in the amount of about NIS 70 million, in the balance of other receivables and debit balances in the U.S., mainly as a result of release of
collaterals in connection with transactions hedging electricity margins in Valley, offset by an increase, in the amount of about NIS 30 million, in the balance of VAT institutions, and an increase, in the amount of about NIS 18 million, in
respect of compensation from Energean (for additional details – see Note 8A(1) to the Interim Statements).
|
||||||
|
Inventory
|
8
|
7
|
|||||||
|
Short-term derivative financial instruments
|
9
|
10
|
|||||||
|
Total current assets
|
1,913
|
1,477
|
|||||||
| 6. |
Financial Position as at March 31, 2023 (in millions of NIS) (Cont.)
|
|
Category
|
3/31/2023
|
12/31/2022
|
Board’s Explanations
|
||||||
|
Non-Current Assets
|
|||||||||
|
Long-term deposits and restricted cash
|
54
|
53
|
|||||||
|
Long-term prepaid expenses and other receivable
|
198
|
179
|
Most of the increase stems from an investment in infrastructures of Zomet, in the amount of about NIS 19 million.
|
||||||
|
Investments in associated companies
|
2,419
|
2,296
|
The increase stems mainly from equity earnings of the CPV Group and from an increase in the shekel/dollar exchange rate, in the amount of about NIS 63 million, offset by other comprehensive
loss, in the amount of about NIS 18 million. For additional details regarding investments in associated companies – see Sections 4D above.
|
||||||
|
Deferred tax assets
|
17
|
22
|
|||||||
|
Long-term derivative financial instruments
|
58
|
57
|
|||||||
|
Property, plant and equipment
|
5,385
|
4,324
|
Most of the increase, in the amount of about NIS 870 million, stems from the initial consolidation of the Gat power plant (for additional details – see Note 6A(1)
to the Interim Statements), an increase deriving from investments in Israel and the U.S. (mainly in construction and development projects), in the amount of about NIS 199 million, and an increase of about NIS 24 million, in property, plant
and equipment in the U.S. due to an increase in the shekel/dollar exchange rate.
This increase was partly offset by depreciation expenses in respect of property, plant and equipment in Israel, in the aggregate amount of about
NIS 35 million.
|
||||||
|
Right-of use assets
|
354
|
347
|
|||||||
|
Intangible assets
|
885
|
777
|
Most of the increase derives from recognition of goodwill, in the amount of about NIS 85 million, in respect of acquisition of the Gat power plant, and an increase, in the amount of about NIS 20 million, as a
result of the impact of the increase in the shekel/dollar exchange rate on the intangible assets in the U.S.
|
||||||
|
Total non-current assets
|
9,370
|
8,055
|
|||||||
|
Total assets
|
11,283
|
9,532
|
|||||||
| 6. |
Financial Position as at March 31, 2023 (in millions of NIS) (Cont.)
|
|
Category
|
3/31/2023
|
12/31/2022
|
Board’s Explanations
|
||||
|
Current Liabilities
|
|||||||
|
Current maturities of loans from banks and financial institutions
|
122
|
92
|
Most of the increase stems from update of the current maturities of the project credit in Israel and the U.S. based on the
repayment schedules, in the amounts of about NIS 40 million and about NIS 12 million, respectively.
On the other hand, there was a decrease stemming from repayment of project credit in Israel and the U.S. based on the
repayment schedules, in the amount of about NIS 11 million and about NIS 12 million, respectively.
|
||||
|
Current maturities of loans from holders of non-controlling interests
|
65
|
13
|
Most of the increase stems from update of the current maturities of the loans based on the Company’s expectation regarding the repayment schedule of the debt from holders
of non‑controlling interests in Rotem, in the amount of about NIS 52 million.
|
||||
|
Current maturities of debentures
|
112
|
33
|
The increase stems from update of the current maturities of the debentures based on the repayment schedules, in the amount of about NIS 95 million. On the other hand,
there was a decline stemming from repayment of debentures based on the repayment schedule, in the amount of about NIS 16 million.
|
||||
|
Trade payables
|
338
|
335
|
|||||
|
Payables and other credit balances
|
384
|
110
|
Most of the increase, in the amount of about NIS 286 million, derives from deferred consideration in respect of acquisition of the Gat power plant, as detailed in Note 6A(1) to the Interim
Statements, an increase, in the amount of about NIS 13 million, in the balance of VAT institutions, offset by a decrease, in the amount of about NIS 15 million, in respect of liabilities for employee wages and payroll‑related agencies, and a
decrease in the balance of interest payable, in the amount of about NIS 12 million.
|
||||
|
Short-term derivative financial instruments
|
3
|
3
|
|||||
|
Current maturities of lease liabilities
|
62
|
61
|
|||||
|
Current tax liabilities
|
2
|
2
|
|||||
|
Total current liabilities
|
1,088
|
649
|
| 6. |
Financial Position as at March 31, 2023 (in millions of NIS) (Cont.)
|
|
Category
|
3/31/2023
|
12/31/2022
|
Board’s Explanations
|
||||
|
Non-Current Liabilities
|
|||||||
|
Long-term loans from banks and financial institutions
|
2,243
|
1,724
|
Most of the increase stems from a long-term loan, in the amount of about NIS 450 million, for financing acquisition of the Gat
power plant (for additional details – see Notes 6 A(1) and 7A(1) to the Interim Statements) and withdrawals, in the amount of about NIS 100 million, in the framework of the Zomet Financing Agreement.
The increase was partly offset by a decrease, in the amounts of about NIS 40 million and about NIS 12 million, as a result of
update of the current maturities of the project credit in Israel and in the U.S., respectively.
|
||||
|
Long-term loans from holders of non-controlling interests and others
|
382
|
424
|
Most of the decrease stems from a decrease, in the amount of about NIS 88 million, in loans from the holders of non‑controlling interests in Rotem, this being as a result of repayment and update of the current
maturities of the loans. This decrease was partly offset by an increase deriving from an increase in the balance of the long‑term loans from the holders of non‑controlling interests in the CPV Group, where an increase of about NIS 37
million is in respect of additional loans provided to the Group and accrual of interest to the principal in the period of the report, and an increase of about NIS 11 million due to an increase of the shekel/dollar exchange rate.
|
||||
|
Debentures
|
1,722
|
1,807
|
The decrease stems from update of the current maturities of the debentures (Series B and Series C), in the amount of about NIS 95 million.
On the other hand, there was an increase deriving from linkage differences in respect of the debentures (Series B), in the amount of about NIS 11
million.
|
||||
|
Long-term lease liabilities
|
70
|
69
|
|||||
|
Other long-term liabilities
|
156
|
146
|
|||||
|
Liabilities for deferred taxes
|
473
|
347
|
Most of the increase, in the amount of about NIS 110 million, stems from the initial consolidation of the Gat power plant (for additional details – see Note 6A(1) to the Interim Statements).
|
||||
|
Total non-current liabilities
|
5,046
|
4,517
|
|||||
|
Total liabilities
|
6,134
|
5,166
|
| 7. |
Liquidity and sources of financing (in NIS millions)
|
|
For the
|
||||||
|
Three Months Ended
|
||||||
|
Category
|
3/31/2023
|
3/31/2022
|
Board’s Explanations
|
|||
|
Cash flows provided by operating activities
|
103
|
91
|
Most of the increase in the cash flows provided by operating activities stems from an increase in the Group’s working capital, in the amount of about NIS 33 million, offset by a decrease in the income on a cash
basis, in the amount of about NIS 20 million.
|
|||
|
Cash flows used in investing activities
|
(263)
|
|
(278)
|
|
During the period of the report, the Group acquired the Gat power plant, for a consideration of about NIS 268 million (for additional details – see Note 6A(1) of the Interim Statements). On
the other hand, cash was provided to the Group, in the amounts of about NIS 125 million and about NIS 73 million, in respect of release of short‑term deposits and in respect of release of collaterals relating to hedging electricity margins in
the CPV Group, respectively. In addition, there was a decrease, in the amount of about NIS 79 million, in investments in property, plant and equipment in Israel.
|
|
|
Cash flows provided by financing activities
|
779
|
123
|
Most of the increase in the cash flows provided by financing activities stems from a receipt in the period of the report, in the amount of about NIS 452 million, in respect of a swap of
shares of transaction and investment with Veridis (for additional details – see Note 6A(2) of the Interim Statements), a loan, in the amount of about NIS 450 million, for purposes of financing a transaction for acquisition of the Gat power
plant (for additional details – see Note 7A(1) of the Interim Statements), and an increase, in the amount of about NIS 148 million, in investments and loans from holders of non‑controlling interests in the CPV Group. On the other hand, in the
period of the report the Group repaid a loan to the prior holders of the rights in the Gat power plant, in the amount of about NIS 303 million (for additional details – see Note 6A(1) of the Interim Statements), and in addition there was a
decrease, in the amount of about NIS 56 million, in respect of withdrawals from Zomet’s financing agreement framework.
|
|||
| 8. |
Adjusted financial debt, net
|
|
|
A. |
Compositions of the adjusted financial debt, net
|
|
|
Method of
|
||||||||||||||||
|
|
presentation
|
Cash
|
Restricted
|
||||||||||||||
|
|
in the
|
Debt
|
and cash
|
cash
|
|||||||||||||
|
|
Company’s
|
(including
|
equivalents
|
used for
|
|||||||||||||
|
|
financial
|
interest
|
and
|
debt service
|
Net
|
||||||||||||
|
|
statements
|
payable)
|
deposits*
|
reserves
|
debt
|
||||||||||||
|
The Company
|
Consolidated
|
1,836
|
261
|
–
|
1,575
|
||||||||||||
|
Rotem
|
Consolidated
|
–
|
79
|
–
|
(79
|
)
|
|||||||||||
|
Hadera
|
Consolidated
|
663
|
15
|
50
|
598
|
||||||||||||
|
Zomet
|
Consolidated
|
945
|
12
|
–
|
933
|
||||||||||||
|
Gat Partnership
|
Consolidated
|
447
|
19
|
–
|
428
|
||||||||||||
|
Gnrgy
|
Consolidated
|
3
|
6
|
–
|
(3
|
)
|
|||||||||||
|
Others in Israel (1)
|
Consolidated
|
–
|
(1) 80
|
–
|
(80
|
)
|
|||||||||||
|
Total Israel and headquarters
|
3,894
|
472
|
50
|
3,372
|
|||||||||||||
|
Keenan (renewable energy)
|
Consolidated
|
307
|
3
|
–
|
304
|
||||||||||||
|
Maple Hill (renewable energy)
|
Consolidated
|
–
|
8
|
–
|
(8
|
)
|
|||||||||||
|
Fairview
|
Associate
|
394
|
1
|
–
|
393
|
||||||||||||
|
Towantic
|
Associate
|
460
|
10
|
–
|
450
|
||||||||||||
|
Maryland (2)
|
Associate
|
300
|
8
|
–
|
292
|
||||||||||||
|
Shore (2)
|
Associate
|
629
|
8
|
–
|
621
|
||||||||||||
|
Valley (3)
|
Associate
|
840
|
22
|
–
|
818
|
||||||||||||
|
Three Rivers
|
Associate
|
298
|
–
|
–
|
298
|
||||||||||||
|
Others in the U.S.
|
Consolidated
|
–
|
1,020
|
–
|
(1,020
|
)
|
|||||||||||
|
Total U.S.
|
3,228
|
1,080
|
–
|
2,148
|
|||||||||||||
|
Total adjusted financial debt, net
|
7,122
|
1,552
|
50
|
5,520
|
|||||||||||||
|
|
* |
Including balances of restricted cash that serve for financing the current ongoing activities of the associated companies.
|
|
|
(1) |
Including balances of cash and cash equivalents in OPC Power Plants.
|
|
|
|
|
|
|
(2) |
Companies in the CPV Group are subject to financial covenants by force of the various financial agreements. As at the date of the financial statements, the companies are in compliance with all the financial covenants determined. As part of
the financial agreements, an historical debt‑service coverage ratio financial covenant of 1:1 during the last four quarters was determined for Shore and Maryland. As at the date of the financial statements, Maryland and Shore are in
compliance with the benchmark (4.06 and 1.13, respectively).
|
| 8. |
Adjusted financial debt, net (Cont.)
|
|
|
A. |
Compositions of the adjusted financial debt, net (Cont.)
|
|
|
(3) |
Based on Valley’s financing agreement, the contractual repayment date of the liabilities, the balance of which as at the date of the report is about NIS 1.5 billion (about $415 million –
the share of the CPV Group – 50%) falls on June 30, 2023. In the period of the report and thereafter, Valley reached principle consents for extension of the financing agreement, the main terms of which are: (A) extension of the repayment
date of the loan up to May 31, 2026; (B) update of the weighted‑average interest margin on the loan to about 5.75%; and (C) reduction of the scope of the debt by about NIS 200 million (about $55 million), mainly by means of investment by
the shareholders (the Company’s share in the investment is about NIS 60 million (about $17 million)). As at the approval date of the report, extension of the financing agreement is contingent on receipt of formal approvals and signing of
final documents, which in the estimation of the management of the CPV Group is expected to take place in the second quarter of 2023. It is noted that in a case where the extension documents are not signed on the said date, it is not
expected that Valley will be able to repay the loan on June 30, 2023 based on its cash flows from current operating activities. As at the approval date of the report, the said circumstances have no impact on the financial results and
activities of the Group and of Valley37.
|
|
|
Method of
|
||||||||||||||||
|
|
presentation
|
Cash
|
Restricted
|
||||||||||||||
|
|
in the
|
Debt
|
and cash
|
cash
|
|||||||||||||
|
|
Company’s
|
(including
|
equivalents
|
used for
|
|||||||||||||
|
|
financial
|
interest
|
and
|
debt service
|
Net
|
||||||||||||
|
|
statements
|
payable)
|
deposits*
|
reserves
|
debt
|
||||||||||||
|
The Company
|
Consolidated
|
1,854
|
584
|
–
|
1,270
|
||||||||||||
|
Rotem
|
Consolidated
|
–
|
25
|
–
|
(25
|
)
|
|||||||||||
|
Hadera
|
Consolidated
|
670
|
8
|
50
|
612
|
||||||||||||
|
Zomet
|
Consolidated
|
833
|
9
|
–
|
824
|
||||||||||||
|
Gnrgy
|
Consolidated
|
4
|
11
|
–
|
(7
|
)
|
|||||||||||
|
Others in Israel
|
Consolidated
|
–
|
96
|
–
|
(96
|
)
|
|||||||||||
|
Total Israel and headquarters
|
3,361
|
733
|
50
|
2,578
|
|||||||||||||
|
Keenan (renewable energy)
|
Consolidated
|
310
|
2
|
1
|
307
|
||||||||||||
|
Maple Hill (renewable energy)
|
Consolidated
|
–
|
11
|
–
|
(11
|
)
|
|||||||||||
|
Fairview
|
Associate
|
442
|
1
|
–
|
441
|
||||||||||||
|
Towantic
|
Associate
|
509
|
37
|
2
|
470
|
||||||||||||
|
Maryland
|
Associate
|
300
|
6
|
–
|
294
|
||||||||||||
|
Shore
|
Associate
|
607
|
16
|
–
|
591
|
||||||||||||
|
Valley
|
Associate
|
895
|
2
|
–
|
893
|
||||||||||||
|
Three Rivers
|
Associate
|
290
|
–
|
–
|
290
|
||||||||||||
|
Others in the U.S.
|
Consolidated
|
–
|
228
|
–
|
(228
|
)
|
|||||||||||
|
Total U.S.
|
3,353
|
303
|
3
|
3,047
|
|||||||||||||
|
Total adjusted financial debt, net
|
6,714
|
1,036
|
45
|
5,625
|
|||||||||||||
|
|
* |
Including balances of restricted cash that serve for financing the current ongoing activities of the associated companies.
|
|
|
A. |
Compositions of the adjusted financial debt, net (Cont.)
|
|
|
Method of
|
||||||||||||||||
|
|
presentation
|
Cash
|
Restricted
|
||||||||||||||
|
|
in the
|
Debt
|
and cash
|
cash
|
|||||||||||||
|
|
Company’s
|
(including
|
equivalents
|
used for
|
|||||||||||||
|
|
financial
|
interest
|
and
|
debt service
|
Net
|
||||||||||||
|
|
statements
|
payable)
|
deposits*
|
reserves
|
debt
|
||||||||||||
|
The Company
|
Consolidated
|
1,814
|
157
|
–
|
1,657
|
||||||||||||
|
Rotem
|
Consolidated
|
–
|
54
|
–
|
(54
|
)
|
|||||||||||
|
Hadera
|
Consolidated
|
677
|
46
|
46
|
585
|
||||||||||||
|
Zomet
|
Consolidated
|
682
|
68
|
–
|
614
|
||||||||||||
|
Gnrgy
|
Consolidated
|
4
|
17
|
–
|
(13
|
)
|
|||||||||||
|
Others in Israel
|
Consolidated
|
–
|
90
|
–
|
(90
|
)
|
|||||||||||
|
Total Israel and headquarters
|
3,177
|
432
|
46
|
2,699
|
|||||||||||||
|
Keenan (renewable energy)
|
Consolidated
|
301
|
4
|
–
|
297
|
||||||||||||
|
Maple Hill (renewable energy)
|
Consolidated
|
–
|
16
|
–
|
(16
|
)
|
|||||||||||
|
Fairview
|
Associate
|
466
|
3
|
–
|
463
|
||||||||||||
|
Towantic
|
Associate
|
482
|
6
|
–
|
466
|
||||||||||||
|
Maryland
|
Associate
|
302
|
–
|
–
|
302
|
||||||||||||
|
Shore
|
Associate
|
551
|
3
|
–
|
548
|
||||||||||||
|
Valley
|
Associate
|
912
|
4
|
–
|
908
|
||||||||||||
|
Three Rivers
|
Associate
|
250
|
1
|
–
|
249
|
||||||||||||
|
Others in the U.S.
|
Consolidated
|
–
|
216
|
–
|
(216
|
)
|
|||||||||||
|
Total U.S.
|
3,264
|
263
|
–
|
3,001
|
|||||||||||||
|
Total adjusted financial debt, net
|
6,441
|
695
|
46
|
5,700
|
|||||||||||||
|
|
* |
Including balances of restricted cash that serve for financing the current ongoing activities of the associated companies.
|
|
|
B. |
Interest and linkage bases
|
|
|
C. |
Financial covenants
The Company and its investee companies are subject to financial covenants provided in their financing agreements and trust certificates. As at the date of the financial statements, the Company and its
investee companies were in compliance with all the financial covenants provided. For detail regarding the covenants for violation, relating to significant loans and debentures – see Note 7C to the Interim Statements38:
|
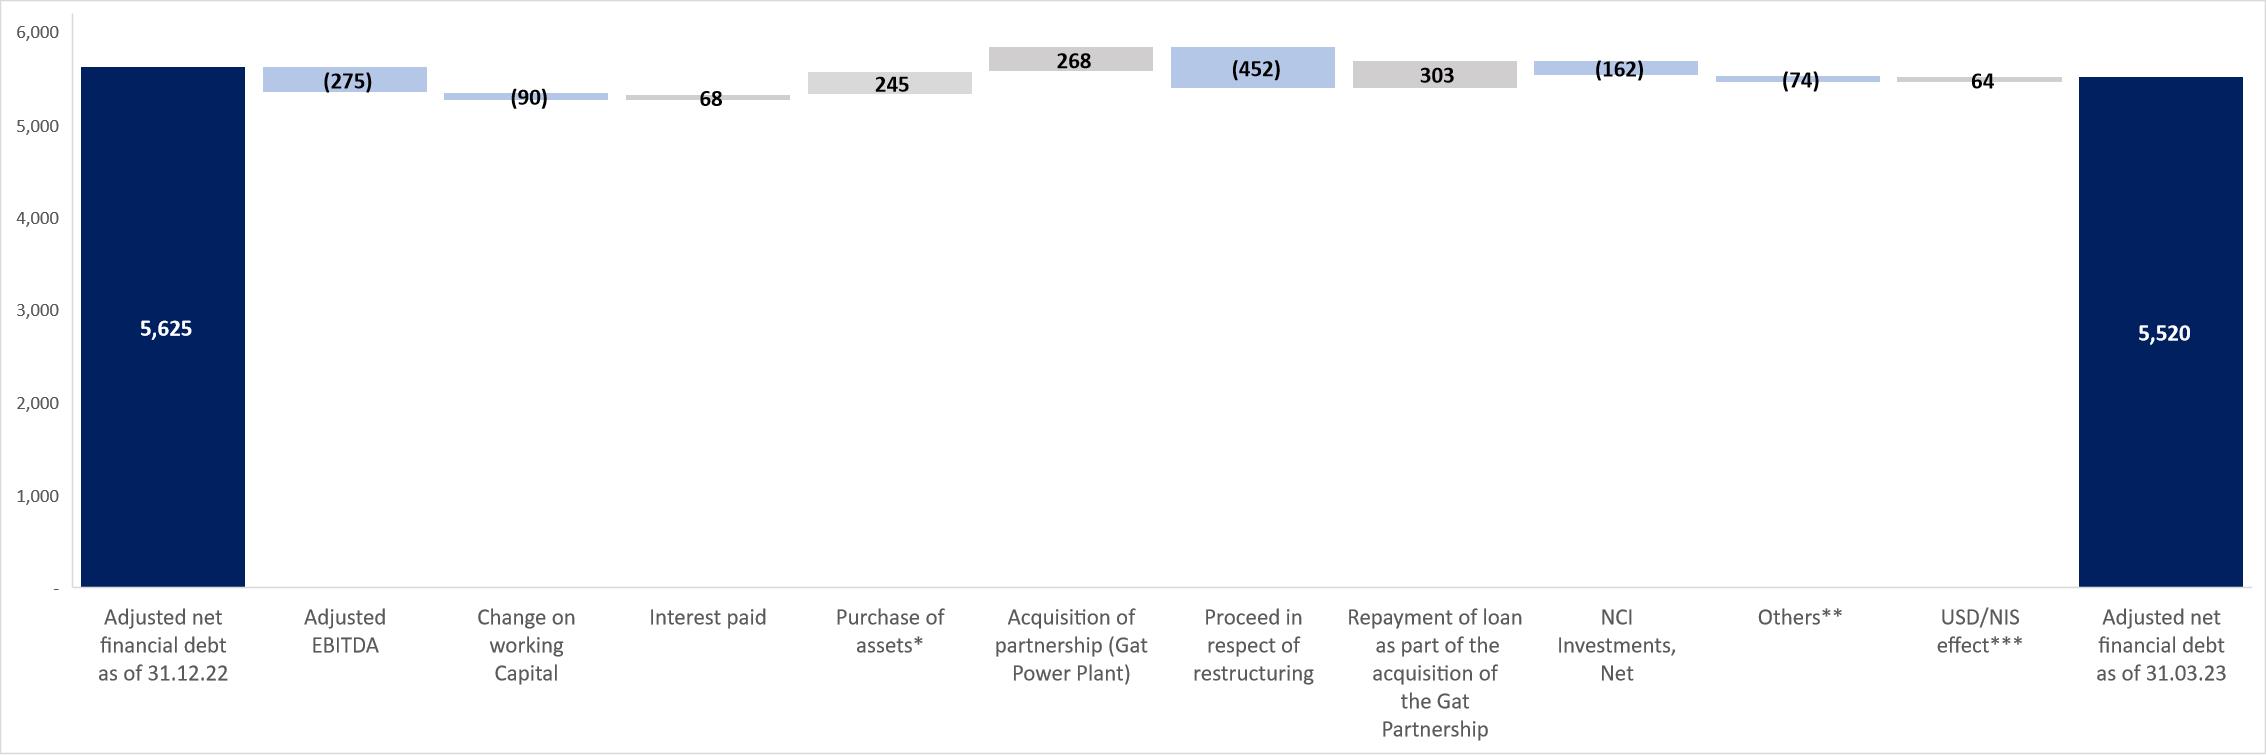
| (*) |
Includes the amount of about NIS 21 million in respect of current payments and the amount of about NIS 224 million in respect of payments relating to construction projects.
|
| (**) |
Most of the decrease, in the amount of about NIS 73 million, is a result of release of collaterals in connection with hedging of the electricity margins in the CPV Group.
|
| (***) |
In respect of translation of the net financial debt of the U.S. which is denominated in dollars into the Company’s functional currency.
|
| 9. |
Additional Events in the Company’s Areas of Activity
|
|
|
A. |
Completion of investment transaction and a structural change in the area of activities in Israel
– for additional details regarding completion of the transaction in the period of the report and the terms of the shareholders’ agreement – see Section 2.4.1 of Part A of the Periodic Report for 2022 and Note 6A(2) to the Interim
Statements.
|
|
|
B. |
Completion of transaction for acquisition of the power plant in the Kiryat Gat Industrial Zone
and the financing agreement – for additional details regarding the acquisition transaction of the Gat power plant and the related project financing agreement that was completed in the period of the report – see Notes 6A(1) and 7A(1)
to the Interim Statements and the Company’s Immediate Report dated March 30, 2023 (Reference No.: 2023‑01‑032026).
|
|
|
C. |
Commercial operations of the Karish reservoir (Energean agreement) in the end of March 2023 – for additional details regarding the commercial operation of the Karish reservoir in the period of the report – see Note 8B(1) to the Interim Statements.
|
| 9. |
Additional Events in the Company’s Areas of Activity (Cont.)
|
|
|
D. |
Win in a tender of Israel Lands Authority for construction of facilities for generation of electricity using renewable energy in Israel
|
| 9. |
Additional Events in the Company’s Areas of Activity (Cont.)
|
|
|
E. |
Tender for sale of Eshkol as part of the reform of Israel Electric Company41 – on May 22, 2023, OPC Holdings Israel submitted (through a designated company as stated below) a bid for acquisition of the Eshkol power plant as
part of a tender of Israel Electric Company. The bid was submitted by a joint company held in equal shares (50/50) by OPC Holdings Israel and the Noy Fund, after they received the required approvals for their members and after signing the
agreements governing the relationships between the parties in connection with their holdings in the Eshkol power plant. On May 22, 2023, the Group, by means of a joint designated company held in equal shares by OPC Power Plants Ltd. (a
subsidiary that is held at the rate of 80% (indirectly) by the Company) and a company held by the Noy Fund, submitted a bid for acquisition of the Eshkol power plant, in the framework of a tender of Israel Electric Company. That stated above is
after receiving the approvals for submission of the joint bid and signing of an agreement that governs the relationships between the parties in connection with their holdings in the designated company (if it is declared the winner). The tender
includes acquisition of a number of generation units that operate using conventional technology (natural gas) with a cumulative capacity of about 1,680 megawatts42, and the possibility to construct additional capacity of 600
megawatts to 850 megawatts43 based on regulations of the Electricity Authority, for the Eshkol site that is located in the Ashdod area. In order to secure the bid, the shareholders of the designated company (each one based on its
proportionate share) provided a bank guarantee, in the aggregate amount of NIS 100 million44.
|
|
|
F. |
Agreement for sale of electricity (PPA) with Bazan – further to that stated in Section 7.6.2 of the Company’s Periodic Report for 2022 regarding an agreement of Rotem for sale of electricity (PPA) to Bazan, in May 2023, new PPA
agreements were signed between Rotem and Bazan for supply of electricity to the consumption facilities of the Bazan Group (hereinafter – “the PPA Agreements” or “the Undertaking”) for a maximum scope of 125 megawatt/hour. Supply of the
electricity is in exchange for a payment equal to the TAOZ (load time) high‑voltage tariff determined from time to time by the Electricity Authority and less a discount on the generation component in accordance with the rates and arrangements
detailed in the agreement. The period of the agreement is ten years, commencing from July 2023 (upon conclusion of the present agreement as stated in above‑mentioned Periodic Report), subject to grounds for early termination45, along
with defined exit points commencing after the passage of 5 years from the commencement date of the supply and pursuant to the provisions agreed to. As part of the Undertaking, additional provisions were included that are customary in PPA
agreements of this type, among other things, regarding consumption in excess of the maximum quantity, a commitment for availability of the power plant and supply of the electricity from different sources.
|
| 9. |
Additional Events in the Company’s Areas of Activity (Cont.)
|
|
|
F. |
Agreement for sale of electricity (PPA) with Bazan – (Cont.)
|
| 9. |
Additional Events in the Company’s Areas of Activity (Cont.)
|
|
|
G. |
Completion of the transaction for acquisition of Mountain Wind subsequent to the date of the report and the financing agreement – for details regarding completion of the acquisition transaction and the related financing agreement, see
Notes 6B(1) and 7A(2) to the Interim Statements and the Company’s Immediate Report dated April 9, 2023 (Reference No.: 2023‑01‑034375).
|
|
|
H. |
Signing of a Tax Equity Partner agreement in the Maple Hill project subsequent to the date of the report – for additional details, see Note 7A(3) to the Interim Statements and the Company’s Immediate Report dated May 14, 2023
(Reference No.: 2023‑01‑043609).
|
|
|
I. |
Reaching of principle consents with Valley’s lenders for extension of the credit agreement – for additional details, see Section 8A(3) above and Note 10F to the Interim Statements.
|
|
|
J. |
Proposed Clean Power Plan – in May 2023, the U.S. Environmental Protection Agency announced a proposal Clean Power Plan 2.0, the goal of which is to significantly limit emission of greenhouse gases from generation of energy through
fossils. Pursuant to the proposal, the regulation will require large electricity generation facilities operating using natural gas with an output coefficient of more than 50% to integrate burning of hydrogen or, alternatively, carbon capture
technology – this being commencing from 2032 or 2035, respectively. As at the approval date of the report, the said proposal, is not final and will be subject to comments of the public and a thorough examination process. In CPV’s estimation,
the proposed plan could undergo significant changes before its potential application in 2024.
|
| 10. |
Debentures (Series B) and (Series C)
|
| 11. |
Impacts of changes in the macro‑economic environment on the Group’s activities and its results
|
| 11. |
Impacts of changes in the macro‑economic environment on the Group’s activities and its results (Cont.)
|
| 11. |
Impacts of changes in the macro‑economic environment on the Group’s activities and its results (Cont.)
|
| 12. |
Significant valuations
|
|
Subject matter of the valuation
|
Determination of the fair value of the identified assets and liabilities of the Gat power plant and determination of the amount of the goodwill and
the method for allocation thereof to the cash‑generating units pursuant to the provisions of IFRS 3.
|
|
Date of the valuation
|
March 30, 2023.
|
|
Value of the identified assets and liabilities and the amount of the goodwill as at the valuation date
|
About NIS 555 million.
|
|
Identity of the appraiser and his characteristics
|
The valuation was performed by a team headed by Mr. Sagiv Mizrahi, CPA, a partner and team manager in the Corporate Finance Department of the Office of BDO (Ziv Haft). Sagiv has a
Bachelor’s degree in applied mathematics from Bar Ilan University and a Master’s degree in business administration (MBA), with honors, and a specialization in financial management from Tel‑Aviv University. Sagiv has more than 10 years of
experience in the areas of business and economic consulting, valuations of companies and financial instruments and economic–accounting work of various types in accordance with International Financial Reporting Standards (IFRS) and generally
accepted accounting principles in the U.S. (U.S GAAP). In the past, Sagiv was a lecturer at Bar Ilan University in accounting and valuations.
|
|
Valuation model
|
The fair value of the power plant was estimated using the revenues’ method, the multi‑period excess earnings method (MPEEM). The fundamental assumption of this method is that the value of
the asset being estimated equals the present value of the free cash flows allocable to the asset less the fair rate of return of the required assets (the cash flow assets) for purposes of realization of these cash flows.
|
|
The assumptions based on which the appraiser performed the valuation
|
– The nominal shekel weighted‑average cost of capital (WACC) rates ranges between 8% and 8.75%.
– Forecast years – represents the period between March 31, 2023 and up to December 31, 2059, and is based on an estimate of the economic
useful life of the power plant.
|
| 12. |
Significant valuations (Cont.)
|
|
Subject matter of the valuation
|
Determination of the fair value of the identified assets and liabilities of the Mountain Wind project and determination of the amount of the goodwill
pursuant to the provisions of IFRS 3.
|
|
Date of the valuation
|
April 5, 2023.
|
|
Value of the identified assets and liabilities and the amount of the goodwill as at the valuation date
|
About NIS 625 million.
|
|
Identity of the appraiser and his characteristics
|
As at the approval date of the report, an initial allocation of the acquisition cost was made by the CPV Group
|
|
Valuation model
|
The fair value was estimated using the DCF method by means of discounting the project’s future pre‑tax cash flows, at an after‑tax weighted‑average
cost of capital (WACC).
|
|
The assumptions based on which the appraiser performed the valuation
|
– The nominal shekel weighted‑average cost of capital (WACC) rates ranges between 5.75% and 6.25%.
– Market prices – the market prices (electricity, availability of RECs, etc.) are based PPA agreements and market forecasts received from
external, independent information sources, taking into account the region and the relevant market for each project and the relevant regulation.
– Forecast years – between 20 and 39 years, and is based on an estimate of the economic useful life of the project’s power (wind) plant.
|
|
Yair Caspi
|
Giora Almogy
|
|
Chairman of the Board of Directors
|
CEO
|
|
OPC Energy Ltd.
Condensed Consolidated Interim
Financial Statements
As of March 31, 2023
(Unaudited)
|
|
Page
|
|
|
F-3
|
|
|
F-4
|
|
|
F-6
|
|
|
F-7
|
|
|
F-8
|
|
|
F-10
|
|
|
F-12
|

|
March 31
|
March 31
|
December 31
|
||||||||||
|
2023
|
2022
|
2022
|
||||||||||
|
(Unaudited)
|
(Unaudited)
|
(Audited)
|
||||||||||
|
NIS million
|
NIS million
|
NIS million
|
||||||||||
|
Current assets
|
||||||||||||
|
Cash and cash equivalents
|
1,503
|
668
|
849
|
|||||||||
|
Short term deposits
|
-
|
-
|
125
|
|||||||||
|
Short-term restricted deposits and cash
|
23
|
14
|
36
|
|||||||||
|
Trade receivables and accrued income
|
191
|
163
|
260
|
|||||||||
|
Other receivables and debit balances
|
179
|
91
|
190
|
|||||||||
|
Inventories
|
8
|
6
|
7
|
|||||||||
|
Short-term derivative financial instruments
|
9
|
2
|
10
|
|||||||||
|
Total current assets
|
1,913
|
944
|
1,477
|
|||||||||
|
Non‑current assets
|
||||||||||||
|
Long-term restricted deposits and cash
|
54
|
79
|
53
|
|||||||||
|
Prepaid expenses and other long-term receivables
|
198
|
179
|
179
|
|||||||||
|
Investments in associates
|
2,419
|
1,874
|
2,296
|
|||||||||
|
Deferred tax assets
|
17
|
39
|
22
|
|||||||||
|
Long-term derivative financial instruments
|
58
|
50
|
57
|
|||||||||
|
Property, plant & equipment
|
5,385
|
3,785
|
4,324
|
|||||||||
|
Right‑of‑use assets
|
354
|
298
|
347
|
|||||||||
|
Intangible assets
|
885
|
708
|
777
|
|||||||||
|
Total non‑current assets
|
9,370
|
7,012
|
8,055
|
|||||||||
|
Total assets
|
11,283
|
7,956
|
9,532
|
|||||||||
|
March 31
|
March 31
|
December 31
|
||||||||||
|
2023
|
2022
|
2022
|
||||||||||
|
(Unaudited)
|
(Unaudited)
|
(Audited)
|
||||||||||
|
NIS million
|
NIS million
|
NIS million
|
||||||||||
|
Current liabilities
|
||||||||||||
|
Current maturities of long-term loans from banks and financial institutions
|
122
|
70
|
92
|
|||||||||
|
Current maturities of loans from non‑controlling interests
|
65
|
34
|
13
|
|||||||||
|
Current maturities of debentures
|
112
|
27
|
33
|
|||||||||
|
Trade payables
|
338
|
359
|
335
|
|||||||||
|
Payables and credit balances
|
384
|
65
|
110
|
|||||||||
|
Short-term derivative financial instruments
|
3
|
12
|
3
|
|||||||||
|
Current maturities of lease liabilities
|
62
|
59
|
61
|
|||||||||
|
Current tax liabilities
|
2
|
-
|
2
|
|||||||||
|
Total current liabilities
|
1,088
|
626
|
649
|
|||||||||
|
Non‑current liabilities
|
||||||||||||
|
Long-term loans from banking corporations and financial institutions
|
2,243
|
1,594
|
1,724
|
|||||||||
|
Long-term loans from non-controlling interests
|
382
|
406
|
424
|
|||||||||
|
Debentures
|
1,722
|
1,785
|
1,807
|
|||||||||
|
Long-term lease liabilities
|
70
|
44
|
69
|
|||||||||
|
Other long‑term liabilities
|
156
|
101
|
146
|
|||||||||
|
Deferred tax liabilities
|
473
|
320
|
347
|
|||||||||
|
Total non-current liabilities
|
5,046
|
4,250
|
4,517
|
|||||||||
|
Total liabilities
|
6,134
|
4,876
|
5,166
|
|||||||||
|
Equity
|
||||||||||||
|
Share capital
|
2
|
2
|
2
|
|||||||||
|
Share premium
|
3,209
|
2,392
|
3,209
|
|||||||||
|
Capital reserves
|
565
|
137
|
327
|
|||||||||
|
Retained earnings (loss)
|
32
|
(120
|
)
|
(31
|
)
|
|||||||
|
Total equity attributable to the Company’s shareholders
|
3,808
|
2,411
|
3,507
|
|||||||||
|
Non‑controlling interests
|
1,341
|
669
|
859
|
|||||||||
|
Total equity
|
5,149
|
3,080
|
4,366
|
|||||||||
|
Total liabilities and equity
|
11,283
|
7,956
|
9,532
|
|||||||||
|
Yair Caspi
|
Giora Almogy
|
Ana Berenshtein Shvartsman
|
||
|
Chairman of the Board of Directors
|
Chief Executive Officer
|
Chief Financial Officer
|
|
For the three-month period
ended March 31
|
For the year ended December 31
|
|||||||||||
|
2023
|
2022
|
2022
|
||||||||||
|
(Unaudited)
|
(Unaudited)
|
(Audited)
|
||||||||||
|
NIS million
|
NIS million
|
NIS million
|
||||||||||
|
Revenues from sales and services
|
519
|
468
|
1,927
|
|||||||||
|
Cost of sales and services (excluding depreciation and amortization)
|
364
|
311
|
1,404
|
|||||||||
|
Depreciation and amortization
|
48
|
42
|
191
|
|||||||||
|
Gross profit
|
107
|
115
|
332
|
|||||||||
|
General and administrative expenses
|
59
|
48
|
239
|
|||||||||
|
Share in profits of associates
|
85
|
95
|
286
|
|||||||||
|
Business development expenses
|
15
|
10
|
50
|
|||||||||
|
Operating profit
|
118
|
152
|
329
|
|||||||||
|
Finance expenses
|
44
|
41
|
167
|
|||||||||
|
Finance income
|
26
|
20
|
120
|
|||||||||
|
Finance expenses, net
|
18
|
21
|
47
|
|||||||||
|
Profit before taxes on income
|
100
|
131
|
282
|
|||||||||
|
Expenses for income tax
|
21
|
27
|
65
|
|||||||||
|
Profit for the period
|
79
|
104
|
217
|
|||||||||
|
Attributable to:
|
||||||||||||
|
The Company’s shareholders
|
63
|
78
|
167
|
|||||||||
|
Non‑controlling interests
|
16
|
26
|
50
|
|||||||||
|
Profit for the period
|
79
|
104
|
217
|
|||||||||
|
Profit per share attributed to the Company’s owners
|
||||||||||||
|
Basic and diluted earnings per share (in NIS)
|
0.28
|
0.38
|
0.79
|
|||||||||
|
For the three-month period
ended March 31
|
For the year ended December 31
|
|||||||||||
|
2023
|
2022
|
2022
|
||||||||||
|
(Unaudited)
|
(Unaudited)
|
(Audited)
|
||||||||||
|
NIS million
|
NIS million
|
NIS million
|
||||||||||
|
Profit for the period
|
79
|
104
|
217
|
|||||||||
|
Other comprehensive income items that, subsequent to initial recognition in comprehensive income, were or will be transferred to profit and loss
|
||||||||||||
|
Effective portion of the change in the fair value of cash flow hedges
|
4
|
24
|
50
|
|||||||||
|
Net change in fair value of derivative financial instruments used to hedge cash flows recognized in the cost of the hedged item
|
(3
|
)
|
3
|
(4
|
)
|
|||||||
|
Net change in fair value of derivative financial instruments used to hedge cash flows transferred to profit and loss
|
(4
|
)
|
(2
|
)
|
(14
|
)
|
||||||
|
Share in other comprehensive income (loss) of associates, net of tax
|
(18
|
)
|
45
|
64
|
||||||||
|
Foreign currency translation differences in respect of foreign operations
|
106
|
30
|
267
|
|||||||||
|
Tax on other comprehensive income (loss) items
|
1
|
(5
|
)
|
(9
|
)
|
|||||||
|
Other comprehensive income for the period, net of tax
|
86
|
95
|
354
|
|||||||||
|
Total comprehensive income for the period
|
165
|
199
|
571
|
|||||||||
|
Attributable to:
|
||||||||||||
|
The Company’s shareholders
|
134
|
144
|
412
|
|||||||||
|
Non‑controlling interests
|
31
|
55
|
159
|
|||||||||
|
Comprehensive income for the period
|
165
|
199
|
571
|
|||||||||
|
Attributable to the Company’s shareholders
|
||||||||||||||||||||||||||||||||||||||||||||
|
Share capital
|
Share premium
|
Capital reserve from transactions with non-controlling interests and merger
|
Hedge fund
|
Foreign operations translation reserve
|
Capital reserve from transactions with shareholders
|
Capital reserve for share-based payment
|
Retained earnings (retained loss)
|
Total
|
Non‑controlling interests
|
Total equity
|
||||||||||||||||||||||||||||||||||
|
NIS
million
|
NIS
million
|
NIS
million
|
NIS
million
|
NIS
million
|
NIS
million
|
NIS
million
|
NIS
million
|
NIS
million
|
NIS
million
|
NIS
million
|
||||||||||||||||||||||||||||||||||
|
(Unaudited)
|
||||||||||||||||||||||||||||||||||||||||||||
|
For the three-month period ended March 31, 2023
|
||||||||||||||||||||||||||||||||||||||||||||
|
Balance as of January 1, 2023
|
2
|
3,209
|
(25
|
)
|
91
|
159
|
78
|
24
|
(31
|
)
|
3,507
|
859
|
4,366
|
|||||||||||||||||||||||||||||||
|
Investments by holders of non-controlling interests in equity of subsidiary
|
-
|
-
|
-
|
-
|
-
|
-
|
-
|
-
|
-
|
162
|
162
|
|||||||||||||||||||||||||||||||||
|
Share-based payment
|
-
|
-
|
-
|
-
|
-
|
-
|
4
|
-
|
4
|
-
|
4
|
|||||||||||||||||||||||||||||||||
|
Exercised options and RSUs
|
*-
|
-
|
-
|
-
|
-
|
-
|
*-
|
-
|
-
|
-
|
-
|
|||||||||||||||||||||||||||||||||
|
Restructuring - share exchange and investment transaction with Veridis
|
-
|
-
|
163
|
-
|
-
|
-
|
-
|
-
|
163
|
289
|
452
|
|||||||||||||||||||||||||||||||||
|
Other comprehensive income (loss) for the period, net of tax
|
-
|
-
|
-
|
(13
|
)
|
84
|
-
|
-
|
-
|
71
|
15
|
86
|
||||||||||||||||||||||||||||||||
|
Profit for the period
|
-
|
-
|
-
|
-
|
-
|
-
|
-
|
63
|
63
|
16
|
79
|
|||||||||||||||||||||||||||||||||
|
Balance as of March 31, 2023
|
2
|
3,209
|
138
|
78
|
243
|
78
|
28
|
32
|
3,808
|
1,341
|
5,149
|
|||||||||||||||||||||||||||||||||
|
For the three-month period ended March 31, 2022
|
||||||||||||||||||||||||||||||||||||||||||||
|
Balance as of January 1 2022
|
2
|
2,392
|
(25
|
)
|
32
|
(27
|
)
|
78
|
10
|
(198
|
)
|
2,264
|
577
|
2,841
|
||||||||||||||||||||||||||||||
|
Investments by holders of non-controlling interests in equity of subsidiary
|
-
|
-
|
-
|
-
|
-
|
-
|
-
|
-
|
-
|
37
|
37
|
|||||||||||||||||||||||||||||||||
|
Share-based payment
|
-
|
-
|
-
|
-
|
-
|
-
|
3
|
-
|
3
|
-
|
3
|
|||||||||||||||||||||||||||||||||
|
Other comprehensive income for the period, net of tax
|
-
|
-
|
-
|
47
|
19
|
-
|
-
|
-
|
66
|
29
|
95
|
|||||||||||||||||||||||||||||||||
|
Profit for the period
|
-
|
-
|
-
|
-
|
-
|
-
|
-
|
78
|
78
|
26
|
104
|
|||||||||||||||||||||||||||||||||
|
Balance as of March 31, 2022
|
2
|
2,392
|
(25
|
)
|
79
|
(8
|
)
|
78
|
13
|
(120
|
)
|
2,411
|
669
|
3,080
|
||||||||||||||||||||||||||||||
|
Attributable to the Company’s shareholders
|
||||||||||||||||||||||||||||||||||||||||||||
|
Share capital
|
Share premium
|
Capital reserve from transactions with non-controlling interests and merger
|
Hedge fund
|
Foreign operations translation reserve
|
Capital reserve from transactions with shareholders
|
Capital reserve for share-based payment
|
Retained loss
|
Total
|
Non‑controlling interests
|
Total equity
|
||||||||||||||||||||||||||||||||||
|
NIS
million
|
NIS
million
|
NIS
million
|
NIS
million
|
NIS
million
|
NIS
million
|
NIS
million
|
NIS
million
|
NIS
million
|
NIS
million
|
NIS
million
|
||||||||||||||||||||||||||||||||||
|
(Audited)
|
||||||||||||||||||||||||||||||||||||||||||||
|
For the year ended December 31, 2022
|
||||||||||||||||||||||||||||||||||||||||||||
|
Balance as of January 1 2022
|
2
|
2,392
|
(25
|
)
|
32
|
(27
|
)
|
78
|
10
|
(198
|
)
|
2,264
|
577
|
2,841
|
||||||||||||||||||||||||||||||
|
Issuance of shares (less issuance expenses)
|
*-
|
815
|
-
|
-
|
-
|
-
|
-
|
-
|
815
|
-
|
815
|
|||||||||||||||||||||||||||||||||
|
Investments by holders of non-controlling interests in equity of subsidiary
|
-
|
-
|
-
|
-
|
-
|
-
|
-
|
-
|
-
|
123
|
123
|
|||||||||||||||||||||||||||||||||
|
Share-based payment
|
-
|
-
|
-
|
-
|
-
|
-
|
16
|
-
|
16
|
-
|
16
|
|||||||||||||||||||||||||||||||||
|
Exercised options and RSUs
|
*-
|
2
|
-
|
-
|
-
|
-
|
(2
|
)
|
-
|
-
|
-
|
-
|
||||||||||||||||||||||||||||||||
|
Other comprehensive income for the year, net of tax
|
-
|
-
|
-
|
59
|
186
|
-
|
-
|
-
|
245
|
109
|
354
|
|||||||||||||||||||||||||||||||||
|
Profit for the year
|
-
|
-
|
-
|
-
|
-
|
-
|
-
|
167
|
167
|
50
|
217
|
|||||||||||||||||||||||||||||||||
|
Balance as of December 31, 2022
|
2
|
3,209
|
(25
|
)
|
91
|
159
|
78
|
24
|
(31
|
)
|
3,507
|
859
|
4,366
|
|||||||||||||||||||||||||||||||
|
For the three-month period ended March 31
|
For the year ended December 31
|
|||||||||||
|
2023
|
2022
|
2022
|
||||||||||
|
(Unaudited)
|
(Unaudited)
|
(Audited)
|
||||||||||
|
NIS million
|
NIS million
|
NIS million
|
||||||||||
|
Cash flows from operating activities
|
||||||||||||
|
Profit for the period
|
79
|
104
|
217
|
|||||||||
|
Adjustments:
|
||||||||||||
|
Depreciation, amortization and diesel fuel consumption
|
52
|
45
|
210
|
|||||||||
|
Finance expenses, net
|
18
|
21
|
47
|
|||||||||
|
Expenses for income tax
|
21
|
27
|
65
|
|||||||||
|
Share in profits of associates
|
(85
|
)
|
(95
|
)
|
(286
|
)
|
||||||
|
Share-based compensation transactions (including cash-settled transactions)
|
9
|
12
|
62
|
|||||||||
|
94
|
114
|
315
|
||||||||||
|
Changes in inventory, trade and other receivables
|
92
|
25
|
(84
|
)
|
||||||||
|
Changes in trade payables, service providers, other payables and long-term liabilities
|
(82
|
)
|
(48
|
)
|
(19
|
)
|
||||||
|
10
|
(23
|
)
|
(103
|
)
|
||||||||
|
Income tax paid
|
(1
|
)
|
-
|
(5
|
)
|
|||||||
|
Net cash from operating activities
|
103
|
91
|
207
|
|||||||||
|
Cash flows from investing activities
|
||||||||||||
|
Interest received
|
6
|
-
|
8
|
|||||||||
|
Short-term restricted deposits and cash, net
|
15
|
(13
|
)
|
(33
|
)
|
|||||||
|
Short-term deposits, net
|
125
|
-
|
(125
|
)
|
||||||||
|
Provision of short-term collateral(1)
|
-
|
-
|
(79
|
)
|
||||||||
|
Release of short-term collateral(1)
|
73
|
-
|
17
|
|||||||||
|
Withdrawals from long-term restricted cash
|
-
|
15
|
44
|
|||||||||
|
Deposits to long-term restricted cash
|
-
|
(1
|
)
|
(2
|
)
|
|||||||
|
Acquisition of partnership (Gat Power Plant), net of acquired cash(2)
|
(268
|
)
|
-
|
-
|
||||||||
|
Investment in associates
|
(4
|
)
|
(1
|
)
|
(10
|
)
|
||||||
|
Proceeds for repayment of partnership capital from associates
|
7
|
8
|
15
|
|||||||||
|
Purchase of property, plant, and equipment, intangible assets and long-term deferred expenses
|
(223
|
)
|
(284
|
)
|
(942
|
)
|
||||||
|
Receipt (payment) for derivative financial instruments, net
|
6
|
(2
|
)
|
5
|
||||||||
|
Net cash used in investing activities
|
(263
|
)
|
(278
|
)
|
(1,102
|
)
|
||||||
| 1. |
Included mainly a collateral provided to secure transactions to hedge electricity margins in Valley (an associate of CPV Group) in 2022, and which was released in the reporting period.
|
| 2. |
For further details regarding the completion of the transaction to acquire the Gat Power Plant, specifically the repayment of shareholder loans amounting to NIS 303 million (presented
under financing activity) and a NIS 300 million payment in the three-month periods ended March 31, payable by December 31, 2023, see Note 6A1.
|
|
For the three-month period
ended March 31
|
For the year ended December 31
|
|||||||||||
|
2023
|
2022
|
2022
|
||||||||||
|
(Unaudited)
|
(Unaudited)
|
(Audited)
|
||||||||||
|
NIS million
|
NIS million
|
NIS million
|
||||||||||
|
Cash flows from financing activities
|
||||||||||||
|
Proceeds of share issuance, less issuance expenses
|
-
|
-
|
815
|
|||||||||
|
Receipt of long-term loans from banking corporations and financial institutions
|
547
|
156
|
291
|
|||||||||
|
Receipt of long-term loans from non-controlling interests
|
35
|
11
|
46
|
|||||||||
|
Investments by holders of non-controlling interests in equity of subsidiary
|
162
|
37
|
123
|
|||||||||
|
Proceed in respect of restructuring - share exchange and investment transaction with Veridis
|
452
|
-
|
-
|
|||||||||
|
Interest paid
|
(34
|
)
|
(30
|
)
|
(86
|
)
|
||||||
|
Prepaid costs for loans taken
|
(3
|
)
|
(3
|
)
|
(9
|
)
|
||||||
|
Repayment of long-term loans from banking corporations and others
|
(24
|
)
|
(21
|
)
|
(74
|
)
|
||||||
|
Repayment of long-term loans as part of the acquisition of the Gat Partnership
|
(303
|
)
|
-
|
-
|
||||||||
|
Repayment of long-term loans from non-controlling interests
|
(36
|
)
|
(14
|
)
|
(89
|
)
|
||||||
|
Repayment of debentures
|
(16
|
)
|
(10
|
)
|
(20
|
)
|
||||||
|
Receipt (payment) for derivative financial instruments, net
|
1
|
(2
|
)
|
(3
|
)
|
|||||||
|
Repayment of principal in respect of lease liabilities
|
(2
|
)
|
(1
|
)
|
(8
|
)
|
||||||
|
Net cash provided by financing activities
|
779
|
123
|
986
|
|||||||||
|
Net increase (decrease) in cash and cash equivalents
|
619
|
(64
|
)
|
91
|
||||||||
|
Balance of cash and cash equivalents at beginning of period
|
849
|
731
|
731
|
|||||||||
|
Effect of exchange rate fluctuations on cash and cash equivalent balances
|
35
|
1
|
27
|
|||||||||
|
Balance of cash and cash equivalents at end of period
|
1,503
|
668
|
849
|
|||||||||
| A. |
Further to Note 27 to the annual financial statements, there was no change during the reporting period in the composition of the Group’s reportable segments nor in the manner in which the segments’ performance is measured by the
chief operating decision maker.
|
| B. |
Regarding the change in the segments’ composition as of December 31, 2022, see Note 27 to the annual financial statements.
|
|
For the three-month period ended March 31, 2023
|
||||||||||||||||||||||||
|
Israel
|
Energy transition in the USA
|
Renewable energies in the USA
|
Other activities in the USA
|
Adjustments to consolidated
|
Consolidated - total
|
|||||||||||||||||||
|
In NIS million
|
(Unaudited)
|
|||||||||||||||||||||||
|
Revenues from sales and services
|
464
|
497
|
27
|
28
|
(497
|
)
|
519
|
|||||||||||||||||
|
Adjusted EBITDA(1) for the period
|
118
|
181
|
7
|
-
|
(183
|
)
|
123
|
|||||||||||||||||
|
Adjustments:
|
||||||||||||||||||||||||
|
Non-recurring expenses
|
(7
|
)
|
||||||||||||||||||||||
|
Unattributed general and administrative expenses in the USA
|
(24
|
)
|
||||||||||||||||||||||
|
General and administrative expenses not allocated to segments
|
(7
|
)
|
||||||||||||||||||||||
|
Total EBITDA for the period
|
85
|
|||||||||||||||||||||||
|
Depreciation and amortization
|
(52
|
)
|
||||||||||||||||||||||
|
Finance expenses, net
|
(18
|
)
|
||||||||||||||||||||||
|
Share in profits of associates
|
85
|
|||||||||||||||||||||||
|
15
|
||||||||||||||||||||||||
|
Profit before taxes on income
|
100
|
|||||||||||||||||||||||
|
Expenses for income tax
|
21
|
|||||||||||||||||||||||
|
Profit for the period
|
79
|
|||||||||||||||||||||||
|
For the three-month period ended March 31, 2022(*)
|
||||||||||||||||||||||||
|
Israel
|
Energy transition in the USA
|
Renewable energies in the USA
|
Other activities in the USA
|
Adjustments to consolidated
|
Consolidated - total
|
|||||||||||||||||||
|
In NIS million
|
(Unaudited)
|
|||||||||||||||||||||||
|
Revenues from sales and services
|
428
|
473
|
22
|
18
|
(473
|
)
|
468
|
|||||||||||||||||
|
Adjusted EBITDA for the period
|
120
|
136
|
8
|
(1
|
)
|
(137
|
)
|
126
|
||||||||||||||||
|
Adjustments:
|
||||||||||||||||||||||||
|
Unattributed general and administrative expenses in the USA
|
(20
|
)
|
||||||||||||||||||||||
|
General and administrative expenses not allocated to segments
|
(5
|
)
|
||||||||||||||||||||||
|
Total EBITDA for the period
|
101
|
|||||||||||||||||||||||
|
Depreciation and amortization
|
(44
|
)
|
||||||||||||||||||||||
|
Finance expenses, net
|
(21
|
)
|
||||||||||||||||||||||
|
Share in profits of associates
|
95
|
|||||||||||||||||||||||
|
30
|
||||||||||||||||||||||||
|
Profit before taxes on income
|
131
|
|||||||||||||||||||||||
|
Expenses for income tax
|
27
|
|||||||||||||||||||||||
|
Profit for the period
|
104
|
|||||||||||||||||||||||
|
(*)
|
Restated due to the change in the segments’ composition; for additional details, see Section B above.1
|
|
(1)
|
For the definition of adjusted EBITDA, see Note 27 to the annual financial statements.
|
|
For the year ended December 31, 2022
|
||||||||||||||||||||||||
|
Israel
|
Energy transition in the USA
|
Renewable energies in the USA
|
Other activities in the USA
|
Adjustments to consolidated
|
Consolidated - total
|
|||||||||||||||||||
|
In NIS million
|
(Audited)
|
|||||||||||||||||||||||
|
Revenues from sales and services
|
1,735
|
1,967
|
95
|
97
|
(1,967
|
)
|
1,927
|
|||||||||||||||||
|
Annualized EBITDA
|
367
|
562
|
26
|
-
|
(564
|
)
|
391
|
|||||||||||||||||
|
Adjustments:
|
||||||||||||||||||||||||
|
Non-recurring expenses
|
(10
|
)
|
||||||||||||||||||||||
|
Unattributed general and administrative expenses in the USA
|
(111
|
)
|
||||||||||||||||||||||
|
General and administrative expenses not allocated to segments
|
(26
|
)
|
||||||||||||||||||||||
|
Total EBITDA for the year
|
244
|
|||||||||||||||||||||||
|
Depreciation and amortization
|
(201
|
)
|
||||||||||||||||||||||
|
Finance expenses, net
|
(47
|
)
|
||||||||||||||||||||||
|
Share in profits of associates
|
286
|
|||||||||||||||||||||||
|
38
|
||||||||||||||||||||||||
|
Profit before taxes on income
|
282
|
|||||||||||||||||||||||
|
Expenses for income tax
|
65
|
|||||||||||||||||||||||
|
Profit for the year
|
217
|
|||||||||||||||||||||||
|
For the three-month period
ended March 31
|
For the year ended December 31
|
|||||||||||
|
2023
|
2022
|
2022
|
||||||||||
|
In NIS million
|
(Unaudited)
|
(Audited)
|
||||||||||
|
Revenues from sale of electricity in Israel:
|
||||||||||||
|
Revenues from the sale of energy to private customers
|
300
|
291
|
1,212
|
|||||||||
|
Revenues from energy sales to the System Operator and other suppliers
|
23
|
40
|
107
|
|||||||||
|
Revenues from sale of steam in Israel
|
17
|
14
|
62
|
|||||||||
|
Other income in Israel
|
8
|
8
|
39
|
|||||||||
|
Total revenues from sale of energy and others in Israel (excluding infrastructure services)
|
348
|
353
|
1,420
|
|||||||||
|
Revenues from private customers for infrastructure services
|
116
|
75
|
315
|
|||||||||
|
Total income in Israel
|
464
|
428
|
1,735
|
|||||||||
|
Revenues from the sale of electricity from renewable energy in the USA
|
24
|
22
|
87
|
|||||||||
|
Revenues from provision of services in the US
|
31
|
18
|
105
|
|||||||||
|
Total revenues in the USA
|
55
|
40
|
192
|
|||||||||
|
Total income
|
519
|
468
|
1,927
|
|||||||||
|
|
A. |
Israel
|
|
|
1. |
Business combination that took place in the reporting period - acquisition of the Gat Power Plant
|
|
In NIS million
|
||||
|
Cash and cash equivalents
|
2
|
|||
|
Trade and other receivables
|
24
|
|||
|
Property, plant, and equipment and right-of-use assets - facilities and electricity generation and supply license (1)
|
795
|
|||
|
Property, plant, and equipment - land owned by the Gat Partnership (2)
|
84
|
|||
|
Trade and other payables
|
(23
|
)
|
||
|
Loans from former right holders (3)
|
(303
|
)
|
||
|
Deferred tax liability
|
(109
|
)
|
||
|
Identifiable assets, net
|
470
|
|||
|
Goodwill (4)
|
85
|
|||
|
Total consideration (5)
|
555
|
|||
|
|
(1) |
The Group opted to implement the expedient as per IFRS 3 and allocate the fair value of the facilities and the electricity supply license to a single asset. The fair value was determined
by an independent appraiser using the income approach, the MultiPeriod Excess Earning Method (MPEEM). The valuation methodology included several key assumptions that constituted the basis for cash flow forecasts, including, among other
things, electricity and gas prices, and nominal post-tax discount rate of 8%-8.75%. The said assets are amortized over 27 years from the acquisition date, considering an expected residual value at the end of the assets’ useful life.
|
|
|
(2) |
The fair value of the land was determined by an external and independent land appraiser using the discounted cash flow technique (the discount rate used is 8%).
|
|
|
(3) |
As stated above, the loans were repaid immediately after the acquisition date.
|
|
|
(4) |
The goodwill arising as part of the business combination reflects the synergy between the activity of the Gat Power Plant and the Rotem Power Plant.
|
|
|
(5) |
The consideration includes a cash payment of NIS 270 million plus deferred consideration, whose present value is estimated at NIS 285 million.
|
|
In NIS million
|
||||
|
The aggregate cash flows that were used by the Group for the acquisition transaction:
|
||||
|
Cash and other cash equivalents paid
|
270
|
|||
|
Cash and other cash equivalents acquired
|
(2
|
)
|
||
|
268
|
||||
|
|
A. |
Israel (cont.)
|
|
|
2. |
Restructuring and investment transaction - Veridis transaction
|
|
|
B. |
USA - Renewable energies segment
|
|
|
1. |
Business combination that took place subsequent to the reporting period - acquisition of the Mountain Wind Power Plants
|
|
In NIS million
(Based on the exchange rate at the acquisition date)
|
In USD millions
|
|||||||
|
Trade and other receivables
|
14
|
4
|
||||||
|
Property, plant & equipment (1)
|
451
|
127
|
||||||
|
Intangible assets (1)
|
93
|
26
|
||||||
|
Trade and other payables
|
(3
|
)
|
(1
|
)
|
||||
|
Liabilities in respect of evacuation and removal
|
(5
|
)
|
(2
|
)
|
||||
|
Identifiable assets, net
|
550
|
154
|
||||||
|
Goodwill (2)
|
75
|
21
|
||||||
|
Total consideration
|
625
|
175
|
||||||
|
|
(1) |
The fair value was determined by the CPV Group using the discounted cash flow method. The valuation methodology included a number of key assumptions that constituted the basis for cash
flow forecasts, including, among other things, electricity prices, and nominal post-tax discount rate of 5.75%-6.25%. Intangible assets are amortized over 13 to 17 years, and property, plant, and equipment items are depreciated over 20
to 29 years.
|
|
|
(2) |
The goodwill reflects the business potential embodied in the Group’s entry into the renewable energies market in New England, USA. CPV Group expects that the entire amount of the goodwill
will be deductible for tax purposes.
|
|
|
A. |
Significant events during and after the reporting period
|
|
|
1. |
Gat Financing Agreement:
|
|
Loan principal
|
NIS 450 million, repayable in quarterly installments, starting from September 25, 2023, with the final repayment date being May 10, 2039 (subject to the stipulated early repayment
provisions in the agreement).
|
|
Interest on the loan
|
• Prime interest + a spread ranging from 0.4% to 0.9% per annum.
• Conversion from a variable interest to fixed, unlinked interest, in accordance with the conversion mechanism (unlinked interest payable on
government bonds as defined in the agreement + a spread ranging from 2.05% to 2.55%), according to the earliest of: four years from the date of the first withdrawal or at the Gat Partnership’s discretion, or at the Bank’s discretion,
in accordance with the forced conversion mechanism, as stipulated in the agreement.
• Repayment in quarterly installments, starting on June 25, 2023.
|
|
Collaterals and pledges
|
• Collateral was provided on all of the Gat Partnership’s assets and rights in it, including the real estate, bank accounts, insurances, the
Gat Partnership’s assets and rights in connection with the Project Agreements (as defined in the agreement).
• A line was placed on the rights of the entities holding the Gat Partnership.
• Guarantees were provided by the Company and Veridis Power Plants, each in accordance with its proportionate share in the Gat Partnership,
as well as OPC Power Plants, to pay all principal and accrued interest payments, in connection with the completion of the registration of the collateral and the payment of the Deferred Consideration balance under the circumstances and
subject to the terms set in the letter of guarantee.
|
|
Liabilities
|
The agreement prescribes certain restrictions and liabilities as is generally accepted in agreements of this type, including:
• Prohibition on pledging assets, and restrictions on the sale and transfer of assets.
• Restrictions on assuming financial debts and providing guarantees.
• Requirement to obtain Bank Leumi’s approval for engagement in material agreements and other material actions.
• Undertaking in connection with holding certain reserve deposits for maintenance and debt service.
• Bank Leumi was granted veto rights and other rights in connection with certain decisions as is generally accepted in agreements of this
type.
• Undertaking to obtain rating for the project under certain circumstances;
|
|
Financial covenants and default events
|
The agreement prescribes standard default events as is generally accepted in agreements of this type, including:
• Various
default events.
• Shutdown
of the Gat Power Plant.
• Payment
default.
• Events
that have a material adverse effect.
• Cross-default
events by parties to certain project agreements.
• certain
events relating to the project (as defined in the agreement).
• Certain
changes in ownership/control.
• Certain
force majeure events.
• Events
associated with insurance coverage of activity of the Gat Power Plant.
• Non‑compliance
with the financial ratios as set out in Note 7C and OPC Power Plants and certain other Group entities’ non-compliance with certain financial covenants.
• Certain
legal proceedings in connection with the Gat Partnership.
|
|
Conditions for
distribution
|
Distributions by the Gat Partnership (as defined in the Gat Financing Agreement, including a repayment of shareholders’ loans) is subject
to a number of terms and conditions outlined in the agreement, including, among other things:
• Compliance
with the following financial covenants: Historic DSCR, Average Projected DSCR and LLCR at a minimal rate of 1.15.
• A first
quarterly principal and interest payment was made.
• The
provisions of the agreement were complied with.
• No more than
four distributions will be carried out in a 12-month period.
|
|
|
A. |
Significant events during and after the reporting period (cont.)
|
|
|
1. |
Gat Financing Agreement:\ (cont.):
|
|
|
2. |
The Mountain Wind financing agreement
|
|
|
3. |
Tax equity partner agreement in Maple Hill
|
|
|
B. |
Changes in the Group’s material guarantees:
|
|
As of March 31, 2023
|
As of December 31, 2022
|
|||||||
|
For operating projects in Israel (Rotem, Hadera and the Gat Power Plant) (1)
|
140
|
111
|
||||||
|
For projects under construction in Israel (Zomet, Sorek and consumers’ premises)
|
129
|
128
|
||||||
|
For virtual supply activity in Israel
|
53
|
62
|
||||||
|
For operating projects in the USA (Keenan)
|
51
|
50
|
||||||
|
In respect of projects under construction and development in the USA (CPV Group) (2)
|
185
|
90
|
||||||
|
Total
|
558
|
441
|
||||||
|
(1)
|
The increase in the bank guarantees balance stems mainly from an increase in bank guarantees provided by Rotem in favor of the System
Operator at the total amount of NIS 8 million, and the provision of NIS 15 million in bank guarantees by OPC Israel on behalf of the Gat Partnership, mainly in favor of the System Operator.
|
|
(2)
|
The increase in the guarantees balance stems mainly from the provision of bank guarantees to various parties in connection with the
Project, which is in advanced development stages.
In addition, shortly before the report’s approval date, guarantees were provided by the Company - NIS 15 million in respect of ILA tenders (for further details, see Note 10G) and NIS 50 million in
respect of the Eshkol tender (which represents 50% of total guarantee for the share of OPC Israel in the joint corporation bidding in the Eshkol tender).
|
|
|
C. |
Financial covenants:
|
|
Ratio
|
Required value Series B
|
Required value Series C
|
Actual value
|
|||
|
Net financial debt (1) to adjusted EBITDA (2)
|
will not exceed 13 (for distribution purposes - 11)
|
will not exceed 13 (for distribution purposes - 11)
|
5.2
|
|||
|
The Company shareholders’ equity (separate)
|
will not fall below NIS 250 million (for distribution purposes - NIS 350 million)
|
will not fall below NIS 1 billion (for distribution purposes - NIS 1.4 billion)
|
NIS 3,808 million
|
|||
|
The Company’s equity to asset ratio (separate)
|
will not fall below 17% (for distribution purposes - 27%)
|
will not fall below 20% (for distribution purposes - 30%)
|
67%
|
|||
|
The Company’s equity to asset ratio (consolidated)
|
--
|
will not fall below 17%
|
46%
|
|
|
C. |
Financial covenants (cont.):
|
|
Financial covenants
|
Breach ratio
|
Actual value
|
||
|
Covenants applicable to Hadera in connection with the Hadera Financing Agreement
|
||||
|
Minimum projected DSCR
|
1.10
|
1.21
|
||
|
Average projected DSCR
|
1.10
|
1.59
|
||
|
LLCR
|
1.10
|
1.70
|
||
|
Covenants applicable to the Company in connection with the Hadera Equity Subscription Agreement
|
||||
|
Company’s shareholders equity (separate) (through the end of the construction contractor’s warranty period)
|
will not fall below NIS 250 million
|
NIS 3,808 million
|
||
|
The Company’s equity to asset ratio (separate)
|
will not fall below 20%
|
67%
|
||
|
Minimum cash balance or bank guarantee from Hadera’s commercial operation date through the end of the construction contractor’s warranty period
|
will not fall below NIS 50 million
|
The cash balance is higher than NIS 50 million
|
||
|
Covenants applicable to Zomet in connection with the Zomet Financing Agreement (1)
|
||||
|
Expected ADSCR
|
1.05
|
1.18
|
||
|
Historic ADSCR
|
1.05
|
N/A
|
||
|
LLCR
|
1.05
|
1.51
|
||
|
Covenants applicable to the Gat Partnership in connection with the Gat Financing Agreement
|
||||
|
Historic ADSCR
|
1.05
|
1.35
|
||
|
Minimum projected DSCR
|
1.05
|
1.35
|
||
|
Average projected DSCR
|
1.05
|
1.36
|
||
|
LLCR
|
1.05
|
1.35
|
||
|
Covenants applicable to OPC Power Plants in connection with the Gat Equity Subscription Agreement
|
||||
|
OPC Power Plants’ total assets balance
|
will not fall below NIS 2,500 million
|
NIS 5,343 million
|
||
|
OPC Power Plant’s equity to asset ratio
|
will not fall below 15%
|
31%
|
||
|
OPC Power Plants’ net debt to adjusted EBITDA ratio
|
will not exceed 12
|
2.6
|
||
|
OPC Power Plants’ minimum cash balance
|
will not fall below NIS 30 million
|
The cash balance is higher than NIS 30 million
|
||
|
OPC Power Plants’ minimum cash balance (”standalone”)
|
will not fall below NIS 20 million
|
The cash balance is higher than NIS 20 million
|
||
|
Covenants applicable to the Company in connection with the Harel credit facility
|
||||
|
The Company shareholders’ equity (separate)
|
will not fall below NIS 550 million
|
NIS 3,808 million
|
||
|
The Company’s equity to asset ratio (separate)
|
will not fall below 20%
|
67%
|
||
|
The Company’s net debt to adjusted EBITDA ratio
|
will not exceed 12
|
5.2
|
||
|
The LTV of the pledged rights
|
will be less than 50%
|
N/A
|
||
|
Covenants applicable to the Company in connection with the Discount credit facility
|
||||
|
The Company shareholders’ equity (separate)
|
will not at any time fall below NIS 1,000 million
|
NIS 3,808 million
|
||
|
The Company’s equity to asset ratio (separate)
|
will not fall below 20%
|
67%
|
||
|
Covenants applicable to the Company in connection with the Mizrahi credit facility
|
||||
|
The Company’s shareholders’ equity
|
will not fall below NIS 550 million
|
NIS 5,150 million
|
||
|
The Company’s equity to asset ratio
|
will not fall below 20%
|
46%
|
||
|
Covenants applicable to the Company in connection with Hapoalim credit facility
|
||||
|
The Company’s shareholders’ equity (separate)
|
will not at any time fall below NIS 1,200 million
|
NIS 3,808 million
|
||
|
The Company’s equity to asset ratio
|
will not at any time fall below 40%
|
46%
|
||
|
The ratio between the net financial debt less the financial debt designated for construction of the projects that have not yet started to generate EBITDA, and the adjusted EBITDA
|
will not exceed 12
|
5.2
|
||
|
|
D. |
Issuance of shares in respect of share-based payment and exercise of options
|
|
|
A. |
Commitments
|
|
|
1. |
Further to what is stated in Note 28C3 to the annual financial statements regarding Rotem and Hadera’s natural gas purchase agreements with Energean Israel Limited (hereinafter – “Energean”), in the reporting period Energean issued
Hadera with a notice regarding the completion of the commissioning for the purpose of the Hadera agreement on February 28, 2023; Energean also issued Rotem with a notice regarding the completion of the commissioning for the purpose of the
Rotem agreement on March 25, 2023, and a notice regarding commercial operation on March 26, 2023.
|
|
|
2. |
Further to what is stated in Note 11B1(e) to the annual financial statements regarding the filing of the appraisal appeal by the joint corporation in respect of the assessment that was
issued by the Israel Lands Authority in respect of the land of the Zomet Power Plant, in January 2023, a decision was made regarding the initial appeal, whereby the amount of the final
assessment was reduced to NIS 154 million (excluding VAT). Zomet filed an appeal on the decision.
|
|
|
B. |
Claims and other liabilities
|
|
|
A. |
Financial instruments measured at fair value for disclosure purposes only.
|
|
As of March 31, 2023
|
||||||||
|
Carrying amount (*)
|
Fair value
|
|||||||
|
(Unaudited)
|
(Unaudited)
|
|||||||
|
NIS million
|
NIS million
|
|||||||
|
Loans from banks and financial institutions (Level 2)
|
2,365
|
2,388
|
||||||
|
Loans from non‑controlling interests (Level 2)
|
447
|
417
|
||||||
|
Debentures (Level 1)
|
1,836
|
1,676
|
||||||
|
4,648
|
4,481
|
|||||||
|
As of March 31, 2022
|
||||||||
|
Carrying amount (*)
|
Fair value
|
|||||||
|
(Unaudited)
|
(Unaudited)
|
|||||||
|
NIS million
|
NIS million
|
|||||||
|
Loans from banks and financial institutions (Level 2)
|
1,664
|
1,784
|
||||||
|
Loans from non‑controlling interests (Level 2)
|
434
|
417
|
||||||
|
Debentures (Level 1)
|
1,814
|
1,867
|
||||||
|
3,912
|
4,068
|
|||||||
|
As of December 31, 2022
|
||||||||
|
Carrying amount (*)
|
Fair value
|
|||||||
|
(Audited)
|
(Audited)
|
|||||||
|
NIS million
|
NIS million
|
|||||||
|
Loans from banks and financial institutions (Level 2)
|
1,817
|
1,859
|
||||||
|
Loans from non‑controlling interests (Level 2)
|
437
|
400
|
||||||
|
Debentures (Level 1)
|
1,854
|
1,734
|
||||||
|
4,108
|
3,993
|
|||||||
|
|
B. |
Fair value hierarchy of financial instruments measured at fair value.
|
|
For the three-month period ended
March 31
|
For the year ended December 31
|
|||||||||||
|
2023
|
2022
|
2022
|
||||||||||
|
(Unaudited)
|
(Audited)
|
|||||||||||
|
Financial assets
|
||||||||||||
|
Derivatives used for hedge accounting
|
||||||||||||
|
CPI swap contracts (Level 2)
|
38
|
30
|
33
|
|||||||||
|
Interest rate swaps (US LIBOR) (Level 2)
|
21
|
12
|
24
|
|||||||||
|
Forwards on exchange rates (Level 2)
|
1
|
-
|
|
2
|
||||||||
|
60
|
42
|
59
|
||||||||||
|
|
A. |
In the three-month periods ended March 31, 2023 and 2022, the Group purchased property, plant and equipment totaling NIS 1,095 million and NIS 219 million, respectively, including
property, plant and equipment purchased under a business combination in the three-month period ended March 31, 2023 totaling NIS 870 million, as set out in Note 6A1.
The said purchase amounts include credit costs capitalized to property, plant, and equipment, for a total of NIS 23 million and NIS 11 million, during the three-month periods ended March 31, 2023 and
2022, respectively. In addition, the said amounts include non-cash purchases totaling NIS 30 million and NIS 37 million during these periods, respectively.
|
|
|
B. |
Further to what is stated in Note 18C to the annual financial statements regarding a profit-sharing plan for CPV Group employees, the Plan’s fair value as of the report date amounted to NIS 150 million (approx. USD 42 million); this
value was estimated using the option pricing model (OPM), based on a standard deviation of 28%, risk-free interest of 3.77%, and expected useful life until exercise of 3 years. During the reporting period, NIS 5 million in expenses were
recognized in respect of the plan (in the first quarter of 2022 - NIS 9 million).
|
|
|
C. |
Further to what is stated in Note 25A2 to the annual financial statements, in the reporting period, the Company and non-controlling interests made equity investments in the partnership OPC
Power Ventures LP (both directly and indirectly) a total of NIS 370 million (approx. USD 103 million), and extended it NIS 115 million (USD 32 million) in loans, based on their stake in the partnership. As of the report’s approval date,
the total balance of investment undertakings and shareholders’ loans advanced by all partners is estimated at NIS 215 million (USD 60 million).
|
|
|
D. |
For more information regarding developments in credit from banking corporations and others, debentures, guarantees and equity in the reporting period and thereafter, see note 7.
|
|
|
E. |
For more information regarding developments in commitments, legal claims and other liabilities in the reporting period and thereafter, see note 8.
|
|
|
F. |
For information regarding the acquisition of the Mountain Wind wind farms subsequent to the reporting period, see Note 6B1.
|
|
|
G. |
On May 10, 2023, it was announced that the Group through OPC Power Plants (hereinafter - the “Winner”) won the tender issued by Israel Lands Administration (hereinafter - “ILA”) for
planning and an option to purchase leasehold rights in land for the construction of renewable energy electricity generation facilities using photovoltaic technology in combination with storage in relation to three compounds in the Neot
Hovav Industrial Local Council, with a total area of approx. 227 hectares. The Group’s bids on this Tender total NIS 484 million, in the aggregate, for all three Tender Compounds.
|
|
As of March 31, 2023
|
|||||||||||||
|
US GAAP
|
Adjustments
|
IFRS
|
|||||||||||
|
In USD thousand
|
In USD thousand
|
In USD thousand
|
|||||||||||
|
Property, plant & equipment
|
A, C, D
|
781,001
|
(162,678
|
)
|
618,323
|
||||||||
|
Intangible assets
|
D
|
20,437
|
(20,437
|
)
|
-
|
||||||||
|
Other assets
|
75,747
|
-
|
75,747
|
||||||||||
|
Total assets
|
877,185
|
(183,115
|
)
|
694,070
|
|||||||||
|
Accounts payable and deferred expenses
|
A
|
12,638
|
(1,423
|
)
|
11,215
|
||||||||
|
Other liabilities
|
464,170
|
-
|
464,170
|
||||||||||
|
Total liabilities
|
476,808
|
(1,423
|
)
|
475,385
|
|||||||||
|
Partners’ equity
|
A, C
|
400,377
|
(181,692
|
)
|
218,685
|
||||||||
|
Total liabilities and equity
|
877,185
|
(183,115
|
)
|
694,070
|
|||||||||
|
As of March 31, 2022
|
|||||||||||||
|
US GAAP
|
Adjustments
|
IFRS
|
|||||||||||
|
In USD thousand
|
In USD thousand
|
In USD thousand
|
|||||||||||
|
Property, plant & equipment
|
A, C, D
|
804,997
|
(180,901
|
)
|
624,096
|
||||||||
|
Intangible assets
|
D
|
14,526
|
(14,526
|
)
|
-
|
||||||||
|
Other assets
|
124,609
|
-
|
124,609
|
||||||||||
|
Total assets
|
944,132
|
(195,427
|
)
|
748,705
|
|||||||||
|
Accounts payable and deferred expenses
|
A
|
19,902
|
(1,487
|
)
|
18,415
|
||||||||
|
Other liabilities
|
575,489
|
-
|
575,489
|
||||||||||
|
Total liabilities
|
595,391
|
(1,487
|
)
|
593,904
|
|||||||||
|
Partners’ equity
|
A, C
|
348,741
|
(193,940
|
)
|
154,801
|
||||||||
|
Total liabilities and equity
|
944,132
|
(195,427
|
)
|
748,705
|
|||||||||
|
As of December 31, 2022
|
|||||||||||||
|
US GAAP
|
Adjustments
|
IFRS
|
|||||||||||
|
In USD thousand
|
In USD thousand
|
In USD thousand
|
|||||||||||
|
Property, plant & equipment
|
A, C, D
|
786,365
|
(165,597
|
)
|
620,768
|
||||||||
|
Intangible assets
|
D
|
20,604
|
(20,604
|
)
|
-
|
||||||||
|
Other assets
|
116,963
|
-
|
116,963
|
||||||||||
|
Total assets
|
923,932
|
(186,201
|
)
|
737,731
|
|||||||||
|
Accounts payable and deferred expenses
|
A
|
31,775
|
(1,409
|
)
|
30,366
|
||||||||
|
Other liabilities
|
518,259
|
-
|
518,259
|
||||||||||
|
Total liabilities
|
550,034
|
(1,409
|
)
|
548,625
|
|||||||||
|
Partners’ equity
|
A, C
|
373,898
|
(184,792
|
)
|
189,106
|
||||||||
|
Total liabilities and equity
|
923,932
|
(186,201
|
)
|
737,731
|
|||||||||
|
For the three-month period ended March 31, 2023
|
|||||||||||||
|
US GAAP
|
Adjustments
|
IFRS
|
|||||||||||
|
In USD thousand
|
In USD thousand
|
In USD thousand
|
|||||||||||
|
Revenues
|
77,918
|
-
|
77,918
|
||||||||||
|
Operating expenses
|
A
|
36,548
|
(1,423
|
)
|
35,125
|
||||||||
|
Depreciation and amortization
|
C
|
6,515
|
(1,677
|
)
|
4,838
|
||||||||
|
Operating profit
|
34,855
|
3,100
|
37,955
|
||||||||||
|
Finance expenses
|
B
|
9,127
|
(1,534
|
)
|
7,593
|
||||||||
|
Profit for the period
|
25,728
|
4,634
|
30,362
|
||||||||||
|
Other comprehensive income (loss) - derivative financial instruments
|
B
|
751
|
(1,534
|
)
|
(783
|
)
|
|||||||
|
Comprehensive income for the period
|
26,479
|
3,100
|
29,579
|
||||||||||
|
For the three-month period ended March 31, 2022
|
|||||||||||||
|
US GAAP
|
Adjustments
|
IFRS
|
|||||||||||
|
In USD thousand
|
In USD thousand
|
In USD thousand
|
|||||||||||
|
Revenues
|
115,761
|
-
|
115,761
|
||||||||||
|
Operating expenses
|
A
|
73,755
|
(1,487
|
)
|
72,268
|
||||||||
|
Depreciation and amortization
|
C
|
6,435
|
(1,677
|
)
|
4,758
|
||||||||
|
Operating profit
|
35,571
|
3,164
|
38,735
|
||||||||||
|
Finance expenses
|
B
|
7,835
|
(1,749
|
)
|
6,086
|
||||||||
|
Profit for the period
|
27,736
|
4,913
|
32,649
|
||||||||||
|
Other comprehensive income (loss) - derivative financial instruments
|
B
|
5,107
|
(1,749
|
)
|
3,358
|
||||||||
|
Comprehensive income for the period
|
32,843
|
3,164
|
36,007
|
||||||||||
|
For the year ended December 31, 2022
|
|||||||||||||
|
US GAAP
|
Adjustments
|
IFRS
|
|||||||||||
|
In USD thousand
|
In USD thousand
|
In USD thousand
|
|||||||||||
|
Revenues
|
405,548
|
-
|
405,548
|
||||||||||
|
Operating expenses
|
A
|
296,645
|
(5,603
|
)
|
291,042
|
||||||||
|
Depreciation and amortization
|
C
|
25,714
|
(6,709
|
)
|
19,005
|
||||||||
|
Operating profit
|
83,189
|
12,312
|
95,501
|
||||||||||
|
Finance expenses
|
B
|
32,913
|
(6,546
|
)
|
26,367
|
||||||||
|
Profit for the year
|
50,276
|
18,858
|
69,134
|
||||||||||
|
Other comprehensive income (loss) - derivative financial instruments
|
B
|
7,724
|
(6,546
|
)
|
1,178
|
||||||||
|
Comprehensive income for the year
|
58,000
|
12,312
|
70,312
|
||||||||||
|
For the three-month period ended March 31, 2023
|
|||||||||||||
|
US GAAP
|
Adjustments
|
IFRS
|
|||||||||||
|
In USD thousand
|
In USD thousand
|
In USD thousand
|
|||||||||||
|
Profit for the period
|
A, B, C
|
25,728
|
4,634
|
30,362
|
|||||||||
|
Net cash from operating activities
|
35,984
|
-
|
35,984
|
||||||||||
|
Net cash provided by (used in) investing activities
|
E
|
(226
|
)
|
19,989
|
19,763
|
||||||||
|
Net cash used in financing activities
|
(44,720
|
)
|
-
|
(44,720
|
)
|
||||||||
|
Net increase (decrease) in cash and cash equivalents
|
(8,962
|
)
|
19,989
|
11,027
|
|||||||||
|
Balance of cash and cash equivalents at beginning of period
|
E
|
145
|
1,042
|
1,187
|
|||||||||
|
Restricted cash balance at beginning of period
|
E
|
57,680
|
(57,680
|
)
|
-
|
||||||||
|
Balance of cash and cash equivalents at end of period
|
E
|
92
|
12,122
|
12,214
|
|||||||||
|
Restricted cash balance at end of period
|
E
|
48,771
|
(48,771
|
)
|
-
|
||||||||
|
For the three-month period ended March 31, 2022
|
|||||||||||||
|
US GAAP
|
Adjustments
|
IFRS
|
|||||||||||
|
In USD thousand
|
In USD thousand
|
In USD thousand
|
|||||||||||
|
Profit for the period
|
A, B, C
|
27,736
|
4,913
|
32,649
|
|||||||||
|
Net cash from operating activities
|
23,180
|
-
|
23,180
|
||||||||||
|
Net cash used in investing activities
|
E
|
(4,342
|
)
|
(13,383
|
)
|
(17,725
|
)
|
||||||
|
Net cash used in financing activities
|
(3,093
|
)
|
-
|
(3,093
|
)
|
||||||||
|
Net increase (decrease) in cash and cash equivalents
|
15,745
|
(13,383
|
)
|
2,362
|
|||||||||
|
Balance of cash and cash equivalents at beginning of period
|
E
|
98
|
181
|
279
|
|||||||||
|
Restricted cash balance at beginning of period
|
E
|
76,390
|
(76,390
|
)
|
-
|
||||||||
|
Balance of cash and cash equivalents at end of period
|
E
|
98
|
2,543
|
2,641
|
|||||||||
|
Restricted cash balance at end of period
|
E
|
92,135
|
(92,135
|
)
|
-
|
||||||||
|
For the year ended December 31, 2022
|
|||||||||||||
|
US GAAP
|
Adjustments
|
IFRS
|
|||||||||||
|
In USD thousand
|
In USD thousand
|
In USD thousand
|
|||||||||||
|
Profit for the year
|
A, B, C
|
50,276
|
18,858
|
69,134
|
|||||||||
|
Net cash from operating activities
|
62,497
|
-
|
62,497
|
||||||||||
|
Net cash provided by (used in) investing activities
|
E
|
(11,226
|
)
|
19,571
|
8,345
|
||||||||
|
Net cash used in financing activities
|
(69,934
|
)
|
-
|
(69,934
|
)
|
||||||||
|
Net increase (decrease) in cash and cash equivalents
|
(18,663
|
)
|
19,571
|
908
|
|||||||||
|
Balance of cash and cash equivalents at beginning of year
|
E
|
98
|
180
|
278
|
|||||||||
|
Restricted cash balance at beginning of year
|
E
|
76,390
|
(76,390
|
)
|
-
|
||||||||
|
Balance of cash and cash equivalents at end of year
|
E
|
145
|
1,041
|
1,186
|
|||||||||
|
Restricted cash balance at end of year
|
E
|
57,680
|
(57,680
|
)
|
-
|
||||||||
|
As of March 31, 2023
|
|||||||||||||
|
US GAAP
|
Adjustments
|
IFRS
|
|||||||||||
|
In USD thousand
|
In USD thousand
|
In USD thousand
|
|||||||||||
|
Property, plant & equipment
|
A, D
|
833,254
|
47,403
|
880,657
|
|||||||||
|
Intangible assets
|
D
|
27,406
|
(27,406
|
)
|
-
|
||||||||
|
Other assets
|
85,949
|
-
|
85,949
|
||||||||||
|
Total assets
|
946,609
|
19,997
|
966,606
|
||||||||||
|
Accounts payable and deferred expenses
|
A
|
16,288
|
(6,668
|
)
|
9,620
|
||||||||
|
Other liabilities
|
452,867
|
630
|
453,497
|
||||||||||
|
Total liabilities
|
469,155
|
(6,038
|
)
|
463,117
|
|||||||||
|
Partners’ equity
|
A
|
477,454
|
26,035
|
503,489
|
|||||||||
|
Total liabilities and equity
|
946,609
|
19,997
|
966,606
|
||||||||||
|
As of March 31, 2022
|
|||||||||||||
|
US GAAP
|
Adjustments
|
IFRS
|
|||||||||||
|
In USD thousand
|
In USD thousand
|
In USD thousand
|
|||||||||||
|
Property, plant & equipment
|
A, D
|
858,066
|
40,107
|
898,173
|
|||||||||
|
Intangible assets
|
D
|
28,276
|
(28,276
|
)
|
-
|
||||||||
|
Other assets
|
159,899
|
-
|
159,899
|
||||||||||
|
Total assets
|
1,046,241
|
11,831
|
1,058,072
|
||||||||||
|
Accounts payable and deferred expenses
|
A
|
33,142
|
(6,575
|
)
|
26,567
|
||||||||
|
Other liabilities
|
625,841
|
910
|
626,751
|
||||||||||
|
Total liabilities
|
658,983
|
(5,665
|
)
|
653,318
|
|||||||||
|
Partners’ equity
|
A
|
387,258
|
17,496
|
404,754
|
|||||||||
|
Total liabilities and equity
|
1,046,241
|
11,831
|
1,058,072
|
||||||||||
|
As of December 31, 2022
|
|||||||||||||
|
US GAAP
|
Adjustments
|
IFRS
|
|||||||||||
|
In USD thousand
|
In USD thousand
|
In USD thousand
|
|||||||||||
|
Property, plant & equipment
|
A, D
|
839,665
|
45,684
|
885,349
|
|||||||||
|
Intangible assets
|
D
|
27,624
|
(27,624
|
)
|
-
|
||||||||
|
Other assets
|
152,461
|
-
|
152,461
|
||||||||||
|
Total assets
|
1,019,750
|
18,060
|
1,037,810
|
||||||||||
|
Accounts payable and deferred expenses
|
A
|
38,800
|
(6,354
|
)
|
32,446
|
||||||||
|
Other liabilities
|
533,630
|
700
|
534,330
|
||||||||||
|
Total liabilities
|
572,430
|
(5,654
|
)
|
566,776
|
|||||||||
|
Partners’ equity
|
A
|
447,320
|
23,714
|
471,034
|
|||||||||
|
Total liabilities and equity
|
1,019,750
|
18,060
|
1,037,810
|
||||||||||
|
For the three-month period ended March 31, 2023
|
|||||||||||||||||
|
US GAAP
|
IFRS adjustments
|
Adjustments to the Group’s accounting policies*
|
IFRS - according to the Group’s accounting policies
|
||||||||||||||
|
In USD thousand
|
In USD thousand
|
In USD thousand
|
In USD thousand
|
||||||||||||||
|
Revenues
|
89,095
|
-
|
8,053
|
97,148
|
|||||||||||||
|
Operating expenses
|
A
|
48,225
|
(2,251
|
)
|
8,053
|
54,027
|
|||||||||||
|
Operating profit
|
40,870
|
2,251
|
-
|
43,121
|
|||||||||||||
|
Finance expenses
|
B
|
7,390
|
(1,379
|
)
|
-
|
6,011
|
|||||||||||
|
Profit for the period
|
33,480
|
3,630
|
-
|
37,110
|
|||||||||||||
|
Other comprehensive income - interest rate swaps
|
B
|
(3,346
|
)
|
(1,309
|
)
|
-
|
(4,655
|
)
|
|||||||||
|
Comprehensive income for the period
|
30,134
|
2,321
|
-
|
32,455
|
|||||||||||||
|
For the three-month period ended March 31, 2022
|
|||||||||||||||||
|
US GAAP
|
IFRS adjustments
|
Adjustments to the Group’s accounting policies*
|
IFRS - according to the Group’s accounting policies
|
||||||||||||||
|
In USD thousand
|
In USD thousand
|
In USD thousand
|
In USD thousand
|
||||||||||||||
|
Revenues
|
109,840
|
-
|
(12,268
|
)
|
97,572
|
||||||||||||
|
Operating expenses
|
A
|
72,539
|
(2,243
|
)
|
(12,268
|
)
|
58,028
|
||||||||||
|
Operating profit
|
37,301
|
2,243
|
-
|
39,544
|
|||||||||||||
|
Finance expenses
|
B
|
7,362
|
(1,488
|
)
|
-
|
5,874
|
|||||||||||
|
Profit for the period
|
29,939
|
3,731
|
-
|
33,670
|
|||||||||||||
|
Other comprehensive income - interest rate swaps
|
B
|
16,104
|
(1,418
|
)
|
-
|
14,686
|
|||||||||||
|
Comprehensive income for the period
|
46,043
|
2,313
|
-
|
48,356
|
|||||||||||||
|
For the year ended December 31, 2022
|
|||||||||||||||||
|
US GAAP
|
IFRS adjustments
|
Adjustments to the Group’s accounting policies*
|
IFRS - according to the Group’s accounting policies
|
||||||||||||||
|
In USD thousand
|
In USD thousand
|
In USD thousand
|
In USD thousand
|
||||||||||||||
|
Revenues
|
450,906
|
-
|
(76,939
|
)
|
373,967
|
||||||||||||
|
Operating expenses
|
A
|
345,546
|
(8,251
|
)
|
(76,939
|
)
|
260,356
|
||||||||||
|
Operating profit
|
105,360
|
8,251
|
-
|
113,611
|
|||||||||||||
|
Finance expenses
|
B
|
21,065
|
(6,360
|
)
|
-
|
14,705
|
|||||||||||
|
Profit for the year
|
84,295
|
14,611
|
-
|
98,906
|
|||||||||||||
|
Other comprehensive income - interest rate swaps
|
B
|
21,810
|
(6,080
|
)
|
-
|
15,730
|
|||||||||||
|
Comprehensive loss for the year
|
106,105
|
8,531
|
-
|
114,636
|
|||||||||||||
|
For the three-month period ended March 31, 2023
|
|||||||||||||
|
US GAAP
|
Adjustments
|
IFRS
|
|||||||||||
|
In USD thousand
|
In USD thousand
|
In USD thousand
|
|||||||||||
|
Profit for the period
|
A, B
|
33,480
|
3,630
|
37,110
|
|||||||||
|
Net cash from operating activities
|
57,137
|
-
|
57,137
|
||||||||||
|
Net cash provided by (used in) investing activities
|
E
|
(160
|
)
|
9,129
|
8,969
|
||||||||
|
Net cash used in financing activities
|
(66,732
|
)
|
-
|
(66,732
|
)
|
||||||||
|
Net increase (decrease) in cash and cash equivalents
|
(9,755
|
)
|
9,129
|
(626
|
)
|
||||||||
|
Balance of cash and cash equivalents at beginning of period
|
E
|
89
|
1,370
|
1,459
|
|||||||||
|
Restricted cash balance at beginning of period
|
E
|
38,404
|
(38,404
|
)
|
-
|
||||||||
|
Balance of cash and cash equivalents at end of period
|
E
|
57
|
776
|
833
|
|||||||||
|
Restricted cash balance at end of period
|
E
|
28,681
|
(28,681
|
)
|
-
|
||||||||
|
For the three-month period ended March 31, 2022
|
|||||||||||||
|
US GAAP
|
Adjustments
|
IFRS
|
|||||||||||
|
In USD thousand
|
In USD thousand
|
In USD thousand
|
|||||||||||
|
Profit for the period
|
A, B
|
29,939
|
3,731
|
33,670
|
|||||||||
|
Net cash from operating activities
|
54,557
|
-
|
54,557
|
||||||||||
|
Net cash provided by (used in) investing activities
|
E
|
(104
|
)
|
29,704
|
29,600
|
||||||||
|
Net cash used in financing activities
|
(84,524
|
)
|
-
|
(84,524
|
)
|
||||||||
|
Net increase (decrease) in cash and cash equivalents
|
(30,071
|
)
|
29,704
|
(367
|
)
|
||||||||
|
Balance of cash and cash equivalents at beginning of period
|
E
|
78
|
4,330
|
4,408
|
|||||||||
|
Restricted cash balance at beginning of period
|
E
|
72,663
|
(72,663
|
)
|
-
|
||||||||
|
Balance of cash and cash equivalents at end of period
|
E
|
76
|
3,965
|
4,041
|
|||||||||
|
Restricted cash balance at end of period
|
E
|
42,594
|
(42,594
|
)
|
-
|
||||||||
|
For the year ended December 31, 2022
|
|||||||||||||
|
US GAAP
|
Adjustments
|
IFRS
|
|||||||||||
|
In USD thousand
|
In USD thousand
|
In USD thousand
|
|||||||||||
|
Profit for the year
|
A, B
|
84,295
|
14,611
|
98,906
|
|||||||||
|
Net cash from operating activities
|
140,040
|
-
|
140,040
|
||||||||||
|
Net cash provided by (used in) investing activities
|
E
|
(7,323
|
)
|
31,299
|
23,976
|
||||||||
|
Net cash used in financing activities
|
(166,965
|
)
|
-
|
(166,965
|
)
|
||||||||
|
Net increase (decrease) in cash and cash equivalents
|
(34,248
|
)
|
31,299
|
(2,949
|
)
|
||||||||
|
Balance of cash and cash equivalents at beginning of year
|
E
|
78
|
4,330
|
4,408
|
|||||||||
|
Restricted cash balance at beginning of year
|
E
|
72,663
|
(72,663
|
)
|
-
|
||||||||
|
Balance of cash and cash equivalents at end of year
|
E
|
89
|
1,370
|
1,459
|
|||||||||
|
Restricted cash balance at end of year
|
E
|
38,404
|
(38,404
|
)
|
-
|
||||||||
|
As of March 31, 2023
|
|||||||||||||
|
US GAAP
|
Adjustments
|
IFRS
|
|||||||||||
|
In USD thousand
|
In USD thousand
|
In USD thousand
|
|||||||||||
|
Property, plant & equipment
|
A, D
|
758,664
|
80,991
|
839,655
|
|||||||||
|
Intangible assets
|
D
|
53,965
|
(53,965
|
)
|
-
|
||||||||
|
Other assets
|
127,053
|
-
|
127,053
|
||||||||||
|
Total assets
|
939,682
|
27,026
|
966,708
|
||||||||||
|
Accounts payable and deferred expenses
|
A
|
15,871
|
(2,109
|
)
|
13,762
|
||||||||
|
Other liabilities
|
514,313
|
(158
|
)
|
514,155
|
|||||||||
|
Total liabilities
|
530,184
|
(2,267
|
)
|
527,917
|
|||||||||
|
Partners’ equity
|
A
|
409,498
|
29,293
|
438,791
|
|||||||||
|
Total liabilities and equity
|
939,682
|
27,026
|
966,708
|
||||||||||
|
As of March 31, 2022
|
|||||||||||||
|
US GAAP
|
Adjustments
|
IFRS
|
|||||||||||
|
In USD thousand
|
In USD thousand
|
In USD thousand
|
|||||||||||
|
Property, plant & equipment
|
A, D
|
783,649
|
82,397
|
866,046
|
|||||||||
|
Intangible assets
|
D
|
57,474
|
(57,474
|
)
|
-
|
||||||||
|
Other assets
|
138,907
|
-
|
138,907
|
||||||||||
|
Total assets
|
980,030
|
24,923
|
1,004,953
|
||||||||||
|
Accounts payable and deferred expenses
|
A
|
25,921
|
(1,923
|
)
|
23,998
|
||||||||
|
Other liabilities
|
626,076
|
(228
|
)
|
625,848
|
|||||||||
|
Total liabilities
|
651,997
|
(2,151
|
)
|
649,846
|
|||||||||
|
Partners’ equity
|
A
|
328,033
|
27,074
|
355,107
|
|||||||||
|
Total liabilities and equity
|
980,030
|
24,923
|
1,004,953
|
||||||||||
|
As of December 31, 2022
|
|||||||||||||
|
US GAAP
|
Adjustments
|
IFRS
|
|||||||||||
|
In USD thousand
|
In USD thousand
|
In USD thousand
|
|||||||||||
|
Property, plant & equipment
|
A, D
|
764,996
|
81,413
|
846,409
|
|||||||||
|
Intangible assets
|
D
|
54,842
|
(54,842
|
)
|
-
|
||||||||
|
Other assets
|
176,558
|
-
|
176,558
|
||||||||||
|
Total assets
|
996,396
|
26,571
|
1,022,967
|
||||||||||
|
Accounts payable and deferred expenses
|
A
|
21,025
|
(1,857
|
)
|
19,168
|
||||||||
|
Other liabilities
|
605,364
|
(175
|
)
|
605,189
|
|||||||||
|
Total liabilities
|
626,389
|
(2,032
|
)
|
624,357
|
|||||||||
|
Partners’ equity
|
A
|
370,007
|
28,603
|
398,610
|
|||||||||
|
Total liabilities and equity
|
996,396
|
26,571
|
1,022,967
|
||||||||||
|
For the three-month period ended March 31, 2023
|
|||||||||||||||||
|
US GAAP
|
IFRS adjustments
|
Adjustments to the Group’s accounting policies*
|
IFRS - according to the Group’s accounting policies
|
||||||||||||||
|
In USD thousand
|
In USD thousand
|
In USD thousand
|
In USD thousand
|
||||||||||||||
|
Revenues
|
113,886
|
-
|
(1,496
|
)
|
112,390
|
||||||||||||
|
Operating expenses
|
A
|
56,550
|
(2,109
|
)
|
(1,496
|
)
|
52,945
|
||||||||||
|
Depreciation and amortization
|
A
|
7,209
|
1,402
|
-
|
8,611
|
||||||||||||
|
Operating profit
|
50,127
|
707
|
-
|
50,834
|
|||||||||||||
|
Finance expenses
|
B
|
6,670
|
(1,390
|
)
|
-
|
5,280
|
|||||||||||
|
Profit for the period
|
43,457
|
2,097
|
-
|
45,554
|
|||||||||||||
|
Other comprehensive income - interest rate swaps
|
B
|
(3,966
|
)
|
(1,407
|
)
|
-
|
(5,373
|
)
|
|||||||||
|
Comprehensive income for the period
|
39,491
|
690
|
-
|
40,181
|
|||||||||||||
|
For the three-month period ended March 31, 2022
|
|||||||||||||||||
|
US GAAP
|
IFRS adjustments
|
Adjustments to the Group’s accounting policies*
|
IFRS - according to the Group’s accounting policies
|
||||||||||||||
|
In USD thousand
|
In USD thousand
|
In USD thousand
|
In USD thousand
|
||||||||||||||
|
Revenues
|
145,992
|
-
|
8,721
|
154,713
|
|||||||||||||
|
Operating expenses
|
A
|
122,344
|
(1,923
|
)
|
8,721
|
129,142
|
|||||||||||
|
Depreciation and amortization
|
A
|
7,192
|
647
|
-
|
7,839
|
||||||||||||
|
Operating profit
|
16,456
|
1,276
|
-
|
17,732
|
|||||||||||||
|
Finance expenses
|
B
|
6,969
|
(1,679
|
)
|
-
|
5,290
|
|||||||||||
|
Profit for the period
|
9,487
|
2,955
|
-
|
12,442
|
|||||||||||||
|
Other comprehensive income - interest rate swaps
|
B
|
15,803
|
(1,696
|
)
|
-
|
14,107
|
|||||||||||
|
Comprehensive income for the period
|
25,290
|
1,259
|
-
|
26,549
|
|||||||||||||
|
For the year ended December 31, 2022
|
|||||||||||||||||
|
US GAAP
|
IFRS adjustments
|
Adjustments to the Group’s accounting policies*
|
IFRS - according to the Group’s accounting policies
|
||||||||||||||
|
In USD thousand
|
In USD thousand
|
In USD thousand
|
In USD thousand
|
||||||||||||||
|
Revenues
|
445,028
|
-
|
49,637
|
494,665
|
|||||||||||||
|
Operating expenses
|
A
|
349,588
|
(7,460
|
)
|
49,637
|
391,765
|
|||||||||||
|
Depreciation and amortization
|
A
|
28,815
|
4,602
|
-
|
33,417
|
||||||||||||
|
Operating profit
|
66,625
|
2,858
|
-
|
69,483
|
|||||||||||||
|
Finance expenses
|
B
|
28,645
|
(6,597
|
)
|
-
|
22,048
|
|||||||||||
|
Profit for the year
|
37,980
|
9,455
|
-
|
47,435
|
|||||||||||||
|
Other comprehensive income - interest rate swaps
|
B
|
29,284
|
(6,667
|
)
|
-
|
22,617
|
|||||||||||
|
Comprehensive loss for the year
|
67,264
|
2,788
|
-
|
70,052
|
|||||||||||||
|
For the three-month period ended March 31, 2023
|
|||||||||||||
|
US GAAP
|
Adjustments
|
IFRS
|
|||||||||||
|
In USD thousand
|
In USD thousand
|
In USD thousand
|
|||||||||||
|
Profit for the period
|
A, B
|
43,457
|
2,097
|
45,554
|
|||||||||
|
Net cash from operating activities
|
32,443
|
-
|
32,443
|
||||||||||
|
Net cash from investing activities
|
E
|
-
|
4,194
|
4,194
|
|||||||||
|
Net cash used in financing activities
|
(65,979
|
)
|
-
|
(65,979
|
)
|
||||||||
|
Net increase (decrease) in cash and cash equivalents
|
(33,536
|
)
|
4,194
|
(29,342
|
)
|
||||||||
|
Balance of cash and cash equivalents at beginning of period
|
E
|
90
|
40,230
|
40,320
|
|||||||||
|
Restricted cash balance at beginning of period
|
E
|
119,838
|
(119,838
|
)
|
-
|
||||||||
|
Balance of cash and cash equivalents at end of period
|
E
|
100
|
10,878
|
10,978
|
|||||||||
|
Restricted cash balance at end of period
|
E
|
86,292
|
(86,292
|
)
|
-
|
||||||||
|
For the three-month period ended March 31, 2022
|
|||||||||||||
|
US GAAP
|
Adjustments
|
IFRS
|
|||||||||||
|
In USD thousand
|
In USD thousand
|
In USD thousand
|
|||||||||||
|
Profit for the period
|
A, B
|
9,487
|
2,955
|
12,442
|
|||||||||
|
Net cash from operating activities
|
28,010
|
-
|
28,010
|
||||||||||
|
Net cash used in investing activities
|
E
|
(182
|
)
|
(269
|
)
|
(451
|
)
|
||||||
|
Net cash used in financing activities
|
(10,056
|
)
|
-
|
(10,056
|
)
|
||||||||
|
Net increase (decrease) in cash and cash equivalents
|
17,772
|
(269
|
)
|
17,503
|
|||||||||
|
Balance of cash and cash equivalents at beginning of period
|
E
|
100
|
1,350
|
1,450
|
|||||||||
|
Restricted cash balance at beginning of period
|
E
|
78,410
|
(78,410
|
)
|
-
|
||||||||
|
Balance of cash and cash equivalents at end of period
|
E
|
100
|
18,853
|
18,953
|
|||||||||
|
Restricted cash balance at end of period
|
E
|
96,182
|
(96,182
|
)
|
-
|
||||||||
|
For the year ended December 31, 2022
|
|||||||||||||
|
US GAAP
|
Adjustments
|
IFRS
|
|||||||||||
|
In USD thousand
|
In USD thousand
|
In USD thousand
|
|||||||||||
|
Profit for the year
|
A, B
|
37,980
|
9,455
|
47,435
|
|||||||||
|
Net cash from operating activities
|
78,126
|
-
|
78,126
|
||||||||||
|
Net cash used in investing activities
|
E
|
(519
|
)
|
(2,548
|
)
|
(3,067
|
)
|
||||||
|
Net cash used in financing activities
|
(36,189
|
)
|
-
|
(36,189
|
)
|
||||||||
|
Net increase (decrease) in cash and cash equivalents
|
41,418
|
(2,548
|
)
|
38,870
|
|||||||||
|
Balance of cash and cash equivalents at beginning of year
|
E
|
100
|
1,350
|
1,450
|
|||||||||
|
Restricted cash balance at beginning of year
|
E
|
78,410
|
(78,410
|
)
|
-
|
||||||||
|
Balance of cash and cash equivalents at end of year
|
E
|
90
|
40,230
|
40,320
|
|||||||||
|
Restricted cash balance at end of year
|
E
|
119,838
|
(119,838
|
)
|
-
|
||||||||
|
|
A. |
Maintenance costs under the Long Term Maintenance Plan (hereinafter - the “LTCP Agreement”): under IFRS, variable payments which were paid in accordance with the milestones as set in the LTCP Agreement are capitalized to the cost of
property, plant and equipment and amortized over the period from the date on which maintenance work was carried out until the date on which maintenance work is due to take place again. Under US GAAP, the said payments are recognized on
payment date within current expenses in the statement of income.
|
|
|
B. |
Hedge effectiveness of interest rate swaps: in accordance with the IFRS - the associates recognize adjustments relating to the ineffective portion of their cash flow hedge under finance expenses in profit and loss. Under US GAAP, there
is no part which is not effective, and the hedging results are recognized in full in other comprehensive income.
|
|
|
C. |
Impairment of property, plant and equipment in Valley: In 2021, prior to the acquisition date of CPV Group, indications of impairment of the property, plant and equipment were identified. Under IFRS, the carrying amount exceeded the
recoverable amount (the discounted cash flows that Valley expects to generate from the asset), and consequently an impairment loss was recognized. Under US GAAP, the non-discounted cash flows that Valley expects to generate from the asset
exceeded the carrying amount, and therefore no impairment loss was recognized. Since the impairment loss was taken into account as part of the excess cost allocation work as of the acquisition date of CPV Group, its subsequent reversal in
Valley’s financial statements, if recognized, shall not affect the Company's results.
|
|
|
D. |
Intangible assets: Under IFRS, certain intangible assets are defined as property, plant and equipment.
|
|
|
E. |
Restricted cash: The presentation of restricted cash in the cash flow statements varies between IFRS and US GAAP.
|