Document

ALAMOS GOLD INC.
Management’s Discussion and Analysis
(in United States dollars, unless otherwise stated)
For the Three Months ended March 31, 2024

ALAMOS GOLD INC.
For the Three months ended March 31, 2024
Table of Contents
|
|
|
|
|
|
Overview of the Business |
|
Highlight Summary |
|
First Quarter 2024 Highlights |
|
Environment, Social and Governance Summary Performance |
|
Business Developments |
|
|
|
Outlook and Strategy |
|
Young-Davidson Mine ("Young-Davidson") |
|
Island Gold Mine ("Island Gold") |
|
Mulatos Mine ("Mulatos") |
|
First Quarter 2024 Development Activities |
|
First Quarter 2024 Exploration Activities |
|
Key External Performance Drivers |
|
Summarized Financial and Operating Results |
|
Review of First Quarter Financial Results |
|
|
|
Consolidated Expenses and Other |
|
Consolidated Income Tax Expense |
|
Financial Condition |
|
Liquidity and Capital Resources |
|
Outstanding Share Data |
|
Related Party Transactions |
|
Off-Balance Sheet Arrangements |
|
Financial Instruments |
|
Summary of Quarterly Financial and Operating Results |
|
Non-GAAP Measures and Additional GAAP Measures |
|
Accounting Estimates, Policies and Changes |
|
Internal Control over Financial Reporting |
|
Changes in Internal Control over Financial Reporting |
|
Disclosure Controls |
|
Limitations of Controls and Procedures |
|
|
|
Cautionary Note to United States Investors |
|
Cautionary Note Regarding Forward-Looking Statements |
|
|
|
|
|
|
|
|
|
|
2024 Management’s Discussion and Analysis |
This Management’s Discussion and Analysis (“MD&A”), dated April 24, 2024, relates to the financial condition and results of the consolidated operations of Alamos Gold Inc. (“Alamos” or the “Company”), and should be read in conjunction with the Company’s consolidated financial statements for the years ended December 31, 2023 and unaudited condensed consolidated interim financial statements for the three months ended March 31, 2024 and notes thereto. The financial statements have been prepared in accordance with the IAS 34, Interim Financial Reporting ("IAS 34") as issued by the International Accounting Standards Board (“IFRS” or “GAAP”). All results are presented in United States dollars (“US dollars” or “$”), unless otherwise stated.
Statements are subject to the risks and uncertainties identified in the Cautionary Note Regarding Forward-Looking Statements section of this document. United States investors are also advised to refer to the section entitled Cautionary Note to United States Investors on page 35.
Overview of the Business
Alamos is a Canadian-based intermediate gold producer with diversified North American production from the Young-Davidson and Island Gold mines in Northern Ontario, Canada and the Mulatos District in Sonora State, Mexico. In addition, Alamos has a strong portfolio of growth projects, including the Phase 3+ Expansion at Island Gold, and the Lynn Lake project in Manitoba, Canada. Alamos employs more than 1,900 people and is committed to the highest standards of sustainable development and ethical business practices.
The Company’s common shares are listed on the Toronto Stock Exchange (TSX: AGI) and the New York Stock Exchange (NYSE: AGI). Further information about Alamos can be found in the Company’s regulatory filings, including the Company's Annual Information Form, available on SEDAR+ at www.sedarplus.ca, on EDGAR at www.sec.gov, and on the Company’s website at www.alamosgold.com.

3
|
|
|
|
|
|
|
|
|
2024 Management’s Discussion and Analysis |
Highlight Summary
|
|
|
|
|
|
|
|
|
|
|
|
|
Three Months Ended March 31, |
|
|
|
2024 |
|
2023 |
|
| Financial Results (in millions) |
|
|
|
|
| Operating revenues |
|
|
$277.6 |
|
$251.5 |
|
Cost of sales (1) |
|
|
$173.6 |
|
$155.2 |
|
| Earnings from operations |
|
|
$81.4 |
|
$75.0 |
|
| Earnings before income taxes |
|
|
$75.6 |
|
$72.2 |
|
| Net earnings |
|
|
$42.1 |
|
$48.4 |
|
Adjusted net earnings (2) |
|
|
$51.2 |
|
$45.4 |
|
|
Earnings before interest, taxes, depreciation and
amortization (2)
|
|
|
$125.7 |
|
$119.9 |
|
Cash provided by operations before working capital and taxes paid (2) |
|
|
$134.9 |
|
$127.2 |
|
| Cash provided by operating activities |
|
|
$108.9 |
|
$94.3 |
|
Capital expenditures (sustaining) (2) |
|
|
$26.5 |
|
$26.9 |
|
Capital expenditures (growth) (2) |
|
|
$51.6 |
|
$52.0 |
|
| Capital expenditures (capitalized exploration) |
|
|
$6.4 |
|
$4.9 |
|
Free cash flow (2) |
|
|
$24.4 |
|
$10.5 |
|
| Operating Results |
|
|
|
|
| Gold production (ounces) |
|
|
135,700 |
|
128,400 |
|
|
|
|
|
|
| Gold sales (ounces) |
|
|
132,849 |
|
132,668 |
|
|
|
|
|
|
| Per Ounce Data |
|
|
|
|
| Average realized gold price |
|
|
$2,069 |
|
$1,896 |
|
| Average spot gold price (London PM Fix) |
|
|
$2,070 |
|
$1,890 |
|
|
Cost of sales per ounce of gold sold
(includes amortization) (1)
|
|
|
$1,307 |
|
$1,170 |
|
Total cash costs per ounce of gold sold (2) |
|
|
$910 |
|
$821 |
|
All-in sustaining costs per ounce of gold sold (2) |
|
|
$1,265 |
|
$1,176 |
|
| Share Data |
|
|
|
|
| Earnings per share, basic and diluted |
|
|
$0.11 |
|
$0.12 |
|
Adjusted earnings per share, basic (2) |
|
|
$0.13 |
|
$0.12 |
|
|
|
|
|
|
| Weighted average common shares outstanding (basic) (000’s) |
|
|
396,817 |
|
393,960 |
|
|
|
|
|
|
| Financial Position (in millions) |
|
|
|
|
| Cash and cash equivalents |
|
|
$240.2 |
|
$224.8 |
|
|
|
|
|
|
|
|
|
|
|
|
|
|
|
|
|
|
|
|
|
|
|
|
|
|
(1)Cost of sales includes mining and processing costs, royalties, and amortization expense.
(2)Refer to the “Non-GAAP Measures and Additional GAAP Measures” disclosure at the end of this MD&A for a description and calculation of these measures.
4
|
|
|
|
|
|
|
|
|
2024 Management’s Discussion and Analysis |
|
|
|
|
|
|
|
|
|
|
|
|
|
Three Months Ended March 31, |
|
|
|
2024 |
|
2023 |
|
| Gold production (ounces) |
|
|
|
|
| Young-Davidson |
|
|
40,100 |
|
45,000 |
|
| Island Gold |
|
|
33,400 |
|
32,900 |
|
|
|
|
|
|
|
|
|
|
|
Mulatos District (7) |
|
|
62,200 |
|
50,500 |
|
| Gold sales (ounces) |
|
|
|
|
| Young-Davidson |
|
|
39,810 |
|
45,676 |
|
| Island Gold |
|
|
34,130 |
|
33,727 |
|
|
|
|
|
|
|
|
|
|
|
| Mulatos District |
|
|
58,909 |
|
53,265 |
|
Cost of sales (in millions) (1) |
|
|
|
|
| Young-Davidson |
|
|
$65.4 |
|
$61.9 |
|
| Island Gold |
|
|
$33.4 |
|
$30.9 |
|
|
|
|
|
|
|
|
|
|
|
| Mulatos District |
|
|
$74.8 |
|
$62.4 |
|
Cost of sales per ounce of gold sold (includes amortization) (1) |
|
|
|
| Young-Davidson |
|
|
$1,643 |
|
$1,355 |
|
| Island Gold |
|
|
$979 |
|
$916 |
|
|
|
|
|
|
|
|
|
|
|
| Mulatos District |
|
|
$1,270 |
|
$1,172 |
|
Total cash costs per ounce of gold sold (2) |
|
|
|
| Young-Davidson |
|
|
$1,188 |
|
$941 |
|
| Island Gold |
|
|
$706 |
|
$629 |
|
|
|
|
|
|
|
|
|
|
|
| Mulatos District |
|
|
$840 |
|
$839 |
|
Mine-site all-in sustaining costs per ounce of gold sold (2),(3) |
|
|
|
| Young-Davidson |
|
|
$1,482 |
|
$1,233 |
|
| Island Gold |
|
|
$1,105 |
|
$970 |
|
| Mulatos District |
|
|
$905 |
|
$914 |
|
|
|
|
|
|
Capital expenditures (sustaining, growth, and capitalized exploration) (in millions) (2) |
|
Young-Davidson (4) |
|
|
$20.2 |
|
$17.4 |
|
Island Gold (5) |
|
|
$54.6 |
|
$57.0 |
|
Mulatos District (6) |
|
|
$3.9 |
|
$5.7 |
|
| Other |
|
|
$5.8 |
|
$3.7 |
|
(1)Cost of sales includes mining and processing costs, royalties, and amortization expense.
(2)Refer to the “Non-GAAP Measures and Additional GAAP Measures” disclosure at the end of this MD&A for a description and calculation of these measures.
(3)For the purposes of calculating mine-site all-in sustaining costs, the Company does not include an allocation of corporate and administrative and share based compensation expenses.
(4)Includes capitalized exploration at Young-Davidson of $1.0 million for the three months ended March 31, 2024 ($1.4 million for the three months ended March 31, 2023).
(5)Includes capitalized exploration at Island Gold of $3.5 million for the three months ended March 31, 2024 ($2.4 million for the three months ended March 31, 2023).
(6)Includes capitalized exploration at Mulatos District of $1.9 million for the three months ended March, 2024 ($1.1 million for the three months ended March 31, 2023).
(7)The Mulatos District includes the Mulatos pit and La Yaqui Grande.
5
|
|
|
|
|
|
|
|
|
2024 Management’s Discussion and Analysis |
First Quarter 2024 Highlights
Operational and Financial Highlights
•Produced 135,700 ounces of gold, exceeding quarterly guidance and representing a 6% increase from the first quarter of 2023. This was driven by another strong performance from the Mulatos District, including record quarterly production from La Yaqui Grande
•Sold 132,849 ounces of gold at an average realized price of $2,069 per ounce, generating record quarterly revenue of $277.6 million, a 10% increase from the first quarter of 2023
•Total cash costs1 were $910 per ounce, all-in sustaining costs ("AISC"1) were $1,265 per ounce, and cost of sales were $1,307 per ounce. As previously guided, costs were above full year guidance in the first quarter, with AISC also impacted by an increase in share-based compensation reflecting the Company's higher share price in the quarter. Costs are expected to decrease through the remainder of the year to be consistent with full year guidance
•Strong ongoing free cash flow1 generation of $24.4 million, while funding the Phase 3+ Expansion at Island Gold, and net of $45.3 million of cash tax payments in Mexico
•Cash flow from operating activities of $108.9 million (including $134.9 million, or $0.34 per share before changes in working capital1)
•Realized adjusted net earnings1 for the first quarter of $51.2 million, or $0.13 per share1. Adjusted net earnings includes adjustments for net unrealized foreign exchange losses recorded within deferred taxes and foreign exchange of $4.5 million, and other adjustments, net of taxes totaling $4.6 million. Reported net earnings were $42.1 million, or $0.11 per share
•Cash and cash equivalents increased 7% from the end of 2023 to $240.2 million, with no debt and $16.3 million in equity securities
•Paid dividends of $9.8 million, or $0.025 per share for the quarter
•Reported year-end 2023 Mineral Reserves of 10.7 million ounces of gold, a 2% increase from 2022, with grades also increasing 1%. This marked the fifth consecutive year Mineral Reserves have grown for a combined increase of 10% with grades also increasing 9% over that time frame. Additionally, Measured and Indicated Mineral Resources increased 12% to 4.4 million ounces, with grades increasing 9%, and Inferred Mineral Resources increased 3% to 7.3 million ounces, at 1% higher grades
•Announced a definitive agreement to acquire Argonaut Gold Inc. ("Argonaut") and its Magino mine, located adjacent to the Company's Island Gold mine in Ontario, Canada. The integration of the two operations is expected to create one of the largest and lowest cost gold mines in Canada and unlock significant value with pre-tax synergies expected to total $515 million2 through the use of shared infrastructure
•On April 4, 2024, announced the closing of the previously announced non-brokered private placement for common shares of Argonaut, representing approximately 13.8% of Argonaut's outstanding common shares for CAD $50 million
•Completed the acquisition of Orford Mining Corporation ("Orford") on April 3, 2024, through which the Company consolidated its existing ownership of Orford shares and added the highly prospective Qiqavik Gold Project, located in Quebec, Canada
(1) Refer to the “Non-GAAP Measures and Additional GAAP Measures” disclosure at the end of this MD&A for a description and calculation of these measures.
(2) Synergies are pre-tax and undiscounted. On a discounted basis, this represents an after-tax net present value of $250 million
6
|
|
|
|
|
|
|
|
|
2024 Management’s Discussion and Analysis |
Environment, Social and Governance Summary Performance
Health and Safety
•Total recordable injury frequency rate1 ("TRIFR") of 1.79 in the first quarter of 2024, an increase from 1.45 in the fourth quarter of 2023
•Lost time injury frequency rate1 ("LTIFR") of nil, a decrease from 0.10 in the fourth quarter of 2023
•La Yaqui Grande Mine celebrated four million hours without a lost time injury
•Alamos’ Home Safe Every Day safety leadership training was implemented at the Island Gold Mine, where it will be delivered to all employees as part of the site’s safety training. This program is now available at all Alamos operations
•During the first quarter of 2024, Alamos had 18 recordable injuries across its sites and zero lost time injuries
Alamos strives to maintain a safe, healthy working environment for all, with a strong safety culture where everyone is continually reminded of the importance of keeping themselves and their colleagues healthy and injury-free. The Company’s overarching commitment is to have all employees and contractors return Home Safe Every Day.
Environment
•Zero significant environmental incidents and zero reportable spills in the first quarter of 2024
•One externally reportable non-compliance in the first quarter that resulted in a fine. At Young-Davidson, environmental testing of treated mine water determined a toxicity failure for Daphnia magna (water fleas), resulting in an environmental penalty of $14,000. The investigation determined the cause of the failure to be algae build-up in the mine water discharge pond and remediation measures were taken. Water treatment and discharge were not impacted and the mine has been in full compliance subsequent to the event
•Finalized a fish habitat compensation project for Davidson Creek at Young-Davidson
•Reclamation work underway at Mulatos focused on the closed Cerro Pelon, El Victor and San Carlos pits
The Company is committed to preserving the long-term health and viability of the natural environment that surrounds its operations and projects. This includes investing in new initiatives to reduce our environmental footprint with the goal of minimizing the environmental impacts of our activities and offsetting any impacts that cannot be fully mitigated or rehabilitated.
Community
Ongoing donations, medical support and infrastructure investments were provided to local communities, including:
•Various sponsorships to support local youth sports teams and community events, and donations to local charities and organizations around the Company's mines
•Partnered with a local foundation (Fundación Vamos Juntos a Ganar) to organize an entrepreneurship workshop for residents of Matarachi to increase their capacity for opening or improving local businesses
•Provided ongoing health services to local community members around the Mulatos Mine. During the quarter, free dental services, vaccinations, and Pap tests were provided to residents
•Upgraded public lighting in Matarachi with the installation of 96 solar street lights throughout the town
•Completed the annual Mi Matarachi evaluation and planning meeting with residents of Matarachi, working together to develop actions that promote education, health and infrastructure that improve the quality of life for residents
The Company believes that excellence in sustainability provides a net benefit to all stakeholders. The Company continues to engage with local communities to understand local challenges and priorities. Ongoing investments in local infrastructure, health care, education, cultural and community programs remain a focus of the Company.
Governance and Disclosure
•Completed annual fieldwork and assurance of Alamos’ compliance with the World Gold Council’s Responsible Gold Mining Principles (RGMPs). Alamos will publish its 2023 RGMP Report in the second quarter of 2024
•Prepared Alamos’ inaugural Modern Slavery Report in accordance with Canada’s Fighting Against Forced Labour and Child Labour in Supply Chains Act. Alamos will publish its 2023 Modern Slavery Report in May 2024
The Company maintains the highest standards of corporate governance to ensure that corporate decision-making reflects its values, including the Company’s commitment to sustainable development.
(1) Frequency rate is calculated as incidents per 200,000 hours worked.
7
|
|
|
|
|
|
|
|
|
2024 Management’s Discussion and Analysis |
2024 Business Developments
Acquisition of Argonaut
On March 27, 2024, the Company announced it had entered into a definitive agreement whereby Alamos will acquire all of the issued and outstanding shares of Argonaut pursuant to a court approved plan of arrangement (the "Transaction"). As part of the Transaction, Alamos will acquire Argonaut’s Magino mine, located adjacent to its Island Gold mine in Ontario, Canada. The integration of the two operations is expected to create one of the largest and lowest cost gold mines in Canada. Through the use of shared infrastructure, Alamos expects to unlock significant value with immediate and long-term synergies expected to total approximately US$515 million1. The addition of Magino is expected to increase Alamos’ combined gold production to over 600,000 ounces per year, with longer term production potential of over 900,000 ounces per year. The combination materially enhances Alamos’ position as a leading, Canadian focused, intermediate producer, with growing production and declining costs.
Concurrently with the Transaction, Argonaut’s assets in the United States and Mexico will be spun out to its existing shareholders as a newly created junior gold producer (“SpinCo”). SpinCo will own the Florida Canyon mine in the United States, as well as the El Castillo Complex, the La Colorada operation, and the Cerro del Gallo project, located in Mexico.
Under the terms of the Agreement, each Argonaut common share outstanding will be exchanged for 0.0185 Alamos common shares and 1 share of SpinCo2 (the “Exchange Ratio”). The Exchange Ratio implies estimated total consideration of C$0.40 per Argonaut common share, or US$325 million based on Alamos' share price on March 26, 2024. This represented a 34% premium based on Argonaut’s and Alamos’ closing prices on March 26, 2024 on the Toronto Stock Exchange (“TSX”). Total consideration includes C$0.34 of Alamos common shares, based on the closing price of Alamos common shares on the TSX on March 26, 2024, and SpinCo common shares with an estimated value of C$0.063. Alamos expects to issue approximately 20.3 million common shares as part of the Transaction, representing an equity value of approximately US$276 million on a fully diluted in-the-money basis at the time of announcement, and an enterprise value of US$516 million.
Upon completion of the Transaction, existing Alamos and Argonaut shareholders will own approximately 95% and 5% of the pro forma company, respectively.
Transaction Highlights
•Creation of one of Canada’s largest, lowest cost and most profitable gold mines – combined Magino and Island Gold mines are expected to produce approximately 280,000 ounces in 20244, and increase to over 400,000 ounces per year at first quartile costs, following the completion of the Phase 3+ Expansion in 2026. The two deposits contain Mineral Reserves of 4.1 million ounces, and total Mineral Reserves and Resources of 11.5 million ounces supporting a mine life of more than 19 years, with significant exploration upside5
•Immediate value creation – the combination of Island Gold and Magino is expected to unlock pre-tax synergies of approximately US$515 million1 over the life of mine. This includes operating synergies of US$375 million, through the use of the larger centralized mill and tailings facility at Magino, and capital savings of US$140 million with the mill and tailings expansions at Island Gold no longer required
•Enhances position as a leading intermediate gold producer – combined near-term gold production is expected to increase approximately 25% to over 600,000 ounces per year4, with longer term growth potential to over 900,000 ounces per year, at declining costs
•Leading Canadian exposure supporting a low political risk profile – with 88% of the combined Company’s net asset value6 supported by its Canadian assets, solidifying Alamos’ position as the third largest gold producer in Canada
•Longer-term upside potential – significant further upside potential at both Magino and Island Gold through an expansion of a single optimized milling complex at Magino
•Stronger financial capacity – to complete the ramp up and optimization of the Magino mine, unlocking the full potential of the operation. Stronger overall cash flow generation to support portfolio of organic growth projects, including the Phase 3+ Expansion at Island Gold, and Lynn Lake
On April 4, 2024, the Company announced the closing of the previously announced Private Placement, pursuant to which Alamos subscribed for 174,825,175 common shares of Argonaut, representing approximately 13.8% of Argonaut’s total outstanding common shares after giving effect to the Private Placement. The shares were acquired at a price of CAD $0.286 per share, for total gross proceeds to Argonaut of CAD $50,000,000.
8
|
|
|
|
|
|
|
|
|
2024 Management’s Discussion and Analysis |
Acquisition of Orford
On April 3, 2024, the Company completed the acquisition of all of the issued and outstanding shares of Orford by way of a court-approved plan of arrangement (the “Orford Agreement"). The acquisition consolidated Alamos’ existing ownership of Orford shares through which the Company has added the highly prospective Qiqavik Gold Project, located in Quebec, Canada. Under the terms of the Orford Agreement, Orford shareholders received 0.005588 of the Company's common shares for each Orford share with a total of 908,689 Alamos shares issued as consideration.
2023 Year-End Mineral Reserve and Resource Update
On February 20, 2024, the Company reported its updated Mineral Reserves and Resources as of December 31, 2023. Highlights include the following:
•Global Proven and Probable Mineral Reserves increased 2% to 10.7 million ounces of gold (202 million tonnes (“mt”) grading 1.65 grams per tonne of gold (“g/t Au”)), with grades increasing 1%, reflecting higher grade additions at Island Gold and Puerto Del Aire (“PDA”) and growth at Lynn Lake. Mineral Reserve additions more than replaced depletion at a rate of 132%
◦Island Gold’s Mineral Reserves increased 18% to 1.7 million ounces (5.2 mt grading 10.30 g/t Au), marking the 11th consecutive year of growth
◦Puerto Del Aire’s ("PDA") Mineral Reserves increased 33% to 1.0 million ounces (5.4 mt grading 5.61 g/t Au) with a 16% increase in grades
◦Lynn Lake’s Mineral Reserves increased 13% to 2.3 million ounces (47.6 mt grading 1.52 g/t Au)
•Island Gold’s Mineral Reserves and Resources increased 16% to 6.1 million ounces driven by significant high-grade additions near existing infrastructure within the main zone and recently defined zones in hanging wall and footwall
•PDA Mineral Reserves and Resources increased 26% to 1.2 million ounces. A development plan incorporating the larger and higher-grade Mineral Reserve is expected to be completed later this quarter
•Global Measured and Indicated Mineral Resources increased 12% to 4.4 million ounces (108 mt grading 1.27 g/t Au), with grades increasing 9% reflecting higher-grade additions at Island Gold and growth at Young-Davidson
•Global Inferred Mineral Resources increased 3% to 7.3 million ounces (128 mt grading 1.77 g/t Au), reflecting increases at Island Gold and Lynn Lake
(1) Synergies are pre-tax and undiscounted. On a discounted basis, this represents an after-tax net present value of $250 million
(2) Shares issued in SpinCo as part of the Exchange Ratio do not reflect a planned 10:1 share consolidation upon SpinCo going public
(3) Based on consensus analyst estimates for the underlying assets and comparable peer market multiples
(4) Based on the midpoint of Alamos’ and Argonaut’s 2024 production guidance
(5) Island Gold mine life based on 2023 Mineral Reserves and Resources assuming Phase 3+ Expansion Study Mineral Resource conversion rate. See Mineral Reserve & Resource estimates and associated footnotes in press release dated February 20, 2024. Magino’s mine life based on 2022 Feasibility study
(6) Based on consensus analyst net asset value estimates for mining assets
9
|
|
|
|
|
|
|
|
|
2024 Management’s Discussion and Analysis |
Outlook and Strategy
|
|
|
|
|
|
|
|
|
|
|
|
|
|
|
|
|
|
|
|
|
|
|
2024 Guidance (4) |
|
|
|
Young-Davidson |
Island Gold |
Mulatos |
|
|
Lynn Lake |
|
Total |
|
|
Gold production (000's ounces) |
180 - 195 |
145 - 160 |
160 - 170 |
|
|
|
|
485 - 525 |
|
|
|
|
|
|
|
|
|
|
|
|
|
|
|
|
|
|
|
|
|
|
|
|
|
|
|
|
|
|
|
|
|
|
|
|
|
|
|
|
|
|
|
|
|
|
Cost of sales, including amortization (in millions)(3) |
|
|
|
|
|
|
|
$620 |
|
|
Cost of sales, including amortization ($ per ounce)(3) |
|
|
|
|
|
|
|
$1,225 |
|
|
Total cash costs ($ per ounce)(1) |
$950 - $1,000 |
$550 - $600 |
$925 - $975 |
|
|
— |
|
$825 - $875 |
|
|
All-in sustaining costs ($ per ounce)(1) |
|
|
|
|
|
|
|
$1,125 - $1,175 |
|
|
Mine-site all-in sustaining costs ($ per ounce)(1)(2) |
$1,175 - $1,225 |
$875 - $925 |
$1,000 - $1,050 |
|
|
— |
|
|
|
|
|
|
|
|
|
|
|
|
|
|
|
Capital expenditures (in millions) |
|
|
|
|
|
|
|
|
|
|
Sustaining capital(1) |
$40 - $45 |
$50 - $55 |
$3 - $5 |
|
|
— |
|
$93 - $105 |
|
|
Growth capital(1) |
$20 - $25 |
$210 - $230 |
$2 - $5 |
|
|
— |
|
$232 - $260 |
|
|
Total Sustaining and Growth Capital (1) - producing mines |
$60 - $70 |
$260 - $285 |
$5 - $10 |
|
|
— |
|
$325 - $365 |
|
|
| Growth capital - development projects |
|
|
|
|
|
$25 |
|
$25 |
|
|
Capitalized exploration(1) |
$10 |
$13 |
$9 |
|
|
$9 |
|
$41 |
|
|
Total capital expenditures and capitalized exploration(1) |
$70 - $80 |
$273 - $298 |
$14 - $19 |
|
|
$34 |
|
$391 - $431 |
|
|
(1)Refer to the "Non-GAAP Measures and Additional GAAP" disclosure at the end of this MD&A for a description of these measures.
(2)For the purposes of calculating mine-site all-in sustaining costs at individual mine sites, the Company does not include an allocation of corporate and administrative and share based compensation expenses to the mine sites.
(3)Cost of sales includes mining and processing costs, royalties, and amortization expense, and is calculated based on the mid-point of total cash cost guidance.
(4)2024 Guidance does not reflect the proposed acquisition of the Magino Mine and will be updated following close of the transaction
The Company’s objective is to operate a sustainable business model that supports growing returns to all stakeholders over the long-term, through growing production, expanding margins, and increasing profitability. This includes a balanced approach to capital allocation focused on generating strong ongoing free cash flow while re-investing in high-return internal growth opportunities, and supporting higher returns to shareholders.
Following a record operational and financial performance in 2023, the Company continued to deliver across multiple fronts in the first quarter of 2024. Production of 135,700 ounces exceeded quarterly guidance, reflecting another strong performance from Mulatos driven by record quarterly production from La Yaqui Grande. Costs were in line with quarterly guidance and expected to decrease through the rest of the year to be consistent with annual guidance. With the strong operational performance, and higher gold prices, the Company generated record quarterly revenues, and solid ongoing free cash flow of $24.4 million while funding the Phase 3+ Expansion at Island Gold, and net of $45.3 million of cash tax payments in Mexico.
The Phase 3+ Expansion remains on track for completion during the first half of 2026 and will be a key driver of the Company's growing production base and declining cost profile over the next several years. Work on the expansion continues to advance with shaft sinking well underway and reaching a depth of 185 metres by the end of March.
Additionally, the Company continued to demonstrate its long-term track record of value creation through exploration and M&A during the quarter. Global Mineral Reserves increased to 10.7 million ounces of gold (202 mt grading 1.65 g/t Au), a 2% increase from 2022, with a further 1% increase in grades. This marked the fifth consecutive year of growth in Mineral Reserves for a combined increase of 10% over that time frame. Grades have also increased 9% over the same timeframe as Mineral Reserves continue to grow both in size and quality. The increase in 2023 was driven by higher-grade additions at Island Gold and PDA, as well as growth at Lynn Lake.
The acquisition of Argonaut's Magino mine is expected to unlock significant value given its proximity to Island Gold. The integration of the two operations is expected to create one of the largest and lowest cost gold mines in Canada and drive pre-tax synergies of approximately $515 million through the use of shared infrastructure. This includes immediate capital savings with the mill and tailings expansions at Island Gold no longer required, and significant ongoing operating savings through the use of the larger and more efficient Magino mill. This not only de-risks the Phase 3+ Expansion, but also creates opportunities for further expansions of the combined Island Gold and Magino operations. The addition of Magino is expected to increase company-wide gold production to over 600,000 ounces per year with longer term production potential of over 900,000 ounces per year. The transaction is expected to close in July 2024.
Additionally, the Company continues to invest in its longer-term portfolio of growth projects with the acquisition of Orford, adding the highly prospective Qiqavik Gold Project, located in Quebec, Canada.
The Company provided three-year production and operating guidance in January 2024 (excluding Magino), which outlined growing production at declining costs over the next three years. Refer to the Company’s January 10, 2024 guidance press release for a summary of the key assumptions and related risks associated with the comprehensive 2024 guidance and three-year production, cost and capital outlook.
10
|
|
|
|
|
|
|
|
|
2024 Management’s Discussion and Analysis |
Gold production in 2024 is expected to range between 485,000 and 525,000 ounces. Total cash costs and AISC are expected to be consistent with 2023.
Production is expected to be slightly higher during the first half of 2024, reflecting higher grades at La Yaqui Grande and stronger rates of production through residual leaching at Mulatos. Second quarter gold production is expected to be between 123,000 and 133,000 ounces with costs decreasing slightly from the first quarter driven by lower costs at both Island Gold and Young-Davidson. Consistent with annual guidance, costs are expected to decrease through the remainder of the year reflecting a declining contribution of higher cost production from residual leaching at Mulatos.
Production is expected to increase 7% by 2026 to between 520,000 and 560,000 ounces, with AISC decreasing 11% to between $975 and $1,075 per ounce reflecting low-cost production growth from Island Gold with the completion of the Phase 3+ Expansion. The three year guidance excludes the higher grade PDA project which represents potential production upside at Mulatos as early as 2026. This upside is expected to be outlined in a development plan for PDA to be released during the second quarter of 2024. Looking beyond 2026, the Lynn Lake project is expected to support further potential growth as early as the end of 2027.
The majority of capital spending in 2024 remains focused on advancing the Phase 3+ Expansion at Island Gold. Following the closing of the acquisition of Argonaut in July, the Company will revise its 2024 capital guidance to reflect the addition of Magino and lower planned capital spending on the mill and tailings expansions at Island Gold.
Other areas of focus in 2024 include a larger capital budget for Lynn Lake and increased capitalized exploration. Spending at Lynn Lake will be focused on upgrades to site access and infrastructure, including early work on the power line upgrade, in advance of a construction decision anticipated in 2025. Additionally, a portion of the 2024 exploration program will be focused on converting Mineral Resources at the Burnt Timber and Linkwood satellite deposits into a smaller, higher quality Mineral Reserve. A study incorporating these deposits into the Lynn Lake project is expected to be competed in the fourth quarter of 2024, and represents potential production and economic upside to the 2023 Feasibility Study.
Given the strong profitability of the Mulatos operation in 2023, the Company expects to pay significantly higher cash tax payments in Mexico in 2024. This included $45.3 million of cash tax payments made in the first quarter, the majority of which related to the 2023 year-end tax payment. Cash tax payments in Mexico are expected to decrease to approximately $10 million in the second quarter and remain at similar levels through the remainder of the year. The Company expects stronger company-wide free cash flow starting in the second quarter of 2024 given lower cash tax burden and an expected decrease in costs.
The global exploration budget for 2024 is $62 million, a 19% increase from $52 million spent in 2023. The increase reflects expanded budgets across all key assets following up on broad-based exploration success in 2023. Island Gold and the Mulatos District account for approximately 60% of the total budget with $19 million planned for each asset. This is followed by $12 million at Young-Davidson, $9 million at Lynn Lake and $2 million at Golden Arrow.
The Company's liquidity position remains strong, ending the quarter with $240.2 million of cash and cash equivalents, $16.3 million in equity securities, and no debt. Additionally, the Company has a $500 million undrawn credit facility, providing total liquidity of $756.5 million. Combined with strong ongoing cash flow generation, the Company remains well positioned to internally fund its organic growth initiatives including the Phase 3+ Expansion, optimization of the Magino mill, and development of PDA and Lynn Lake.
11
|
|
|
|
|
|
|
|
|
2024 Management’s Discussion and Analysis |
Young-Davidson
The Young-Davidson mine is located near the town of Matachewan in Northern Ontario, Canada. The property consists of contiguous mineral leases and claims totaling 5,720 ha and is situated on the site of two past producing mines that produced over one million ounces of gold between 1934 and 1957. The Young-Davidson mine declared commercial production in 2013.
Young-Davidson Financial and Operational Review
|
|
|
|
|
|
|
|
|
|
|
|
|
Three Months Ended March 31, |
|
|
|
2024 |
|
2023 |
|
| Gold production (ounces) |
|
|
40,100 |
|
45,000 |
|
| Gold sales (ounces) |
|
|
39,810 |
|
45,676 |
|
| Financial Review (in millions) |
|
|
|
|
| Operating Revenues |
|
|
$82.7 |
|
$86.3 |
|
Cost of sales (1) |
|
|
$65.4 |
|
$61.9 |
|
| Earnings from operations |
|
|
$16.8 |
|
$24.0 |
|
|
|
|
|
|
| Cash provided by operating activities |
|
|
$34.8 |
|
$33.7 |
|
Capital expenditures (sustaining) (2) |
|
|
$11.6 |
|
$13.2 |
|
Capital expenditures (growth) (2) |
|
|
$7.6 |
|
$2.8 |
|
Capital expenditures (capitalized exploration) (2) |
|
|
$1.0 |
|
$1.4 |
|
|
|
|
|
|
Mine-site free cash flow (2) |
|
|
$14.6 |
|
$16.3 |
|
|
|
|
|
|
Cost of sales, including amortization per ounce of gold sold (1) |
|
|
$1,643 |
|
$1,355 |
|
Total cash costs per ounce of gold sold (2) |
|
|
$1,188 |
|
$941 |
|
Mine-site all-in sustaining costs per ounce of gold sold (2),(3) |
|
|
$1,482 |
|
$1,233 |
|
| Underground Operations |
|
|
|
|
| Tonnes of ore mined |
|
|
667,062 |
|
720,927 |
|
| Tonnes of ore mined per day |
|
|
7,330 |
|
8,010 |
|
Average grade of gold (4) |
|
|
1.94 |
|
2.22 |
|
| Metres developed |
|
|
1,914 |
|
2,695 |
|
|
|
|
|
|
|
|
|
|
|
|
|
|
|
|
|
|
|
|
|
|
|
|
|
|
| Mill Operations |
|
|
|
|
| Tonnes of ore processed |
|
|
665,778 |
|
701,954 |
|
| Tonnes of ore processed per day |
|
|
7,316 |
|
7,799 |
|
Average grade of gold (4) |
|
|
1.94 |
|
2.22 |
|
| Contained ounces milled |
|
|
41,609 |
|
50,212 |
|
| Average recovery rate |
|
|
89.4 |
% |
90.0 |
% |
|
|
|
|
|
|
|
|
|
|
|
|
|
|
|
|
|
|
|
|
|
|
|
|
|
|
|
|
|
|
|
|
|
|
|
|
|
|
|
|
|
|
|
|
|
|
|
|
|
|
|
|
|
|
|
|
|
|
|
|
|
|
|
|
|
|
|
|
|
|
|
|
|
|
|
(1)Cost of sales includes mining and processing costs, royalties and amortization.
(2)Refer to the “Non-GAAP Measures and Additional GAAP Measures” disclosure at the end of this MD&A for a description and calculation of these measures.
(3)For the purposes of calculating mine-site all-in sustaining costs, the Company does not include an allocation of corporate and administrative and share based compensation expenses.
(4)Grams per tonne of gold ("g/t Au").
Operational review
Young-Davidson produced 40,100 ounces of gold in the first quarter, an 11% decrease compared to the prior year period. Underground mining rates averaged 7,330 tpd in the first quarter, lower than the prior year period reflecting temporary downtime to replace the head ropes in the Northgate shaft, which had previously been scheduled in the second quarter. Additionally, delays in receiving two production scoops also impacted mining rates earlier in the quarter. Following the completion of the head rope change and receipt of two new hybrid production scoops, mining rates returned to design capacity of 8,000 tpd in March and are expected to remain at similar rates through the rest of the year. Milling rates averaged 7,316 tpd in the quarter, as a result of the lower underground mining rates.
Grades mined averaged 1.94 g/t Au in the quarter, a 13% decrease from the prior year period, and below the range of full year guidance, due to mine sequencing. Given the lower mining rates, higher grade stopes that had been planned for March were deferred into April. Grades mined are expected to increase to within the range of annual guidance in the second quarter and through the remainder of the year. Mill recoveries averaged 89% in the quarter, at the low end of the range of annual guidance.
Financial Review
First quarter revenues of $82.7 million were 4% lower than the prior year period, resulting from lower ounces sold, partially offset by a higher realized gold price.
12
|
|
|
|
|
|
|
|
|
2024 Management’s Discussion and Analysis |
Cost of sales of $65.4 million in the first quarter were 6% higher than the prior year period, reflecting inflationary pressures on unit costs. Underground mining costs were CAD $62 per tonne in the first quarter, reflecting the lower tonnes mined.
Total cash costs and mine-site AISC were $1,188 per ounce and $1,482 per ounce, respectively in the first quarter. Both metrics were higher than the prior year period and annual guidance, resulting from the temporary downtime for the hoist rope changeover as well as lower grades. Costs are expected to decrease through the remainder of the year to be consistent with annual guidance, reflecting higher grades and mining rates.
Capital expenditures in the first quarter included $11.6 million of sustaining capital and $7.6 million of growth capital. Additionally, $1.0 million was invested in capitalized exploration in the quarter. Capital expenditures, inclusive of capitalized exploration, totaled $20.2 million in the first quarter, a 16% increase from the prior year period driven by timing of payments.
Young-Davidson continues to demonstrate operational and financial consistency with mine-site free cash flow of $14.6 million in the first quarter, and stronger free cash flow expected through the remainder of the year. Young-Davidson has generated over $100 million in mine-site free cash flow for three consecutive years. The operation is well positioned to generate similar free cash flow in 2024 and over the long-term, with a 15 year Mineral Reserve life.
13
|
|
|
|
|
|
|
|
|
2024 Management’s Discussion and Analysis |
Island Gold
The Island Gold mine is a high grade, low cost underground mining operation located just east of the town of Dubreuilville, Ontario, Canada, 83km northeast of Wawa. Alamos holds 100% of all mining titles related to the Island Gold property, which comprises approximately 55,277 ha. The mine began production in October 2007.
Island Gold Financial and Operational Review
|
|
|
|
|
|
|
|
|
|
|
|
|
Three Months Ended March 31, |
|
|
|
2024 |
2023 |
| Gold production (ounces) |
|
|
33,400 |
|
32,900 |
|
| Gold sales (ounces) |
|
|
34,130 |
|
33,727 |
|
| Financial Review (in millions) |
|
|
|
|
| Operating Revenues |
|
|
$71.0 |
|
$63.9 |
|
Cost of sales (1) |
|
|
$33.4 |
|
$30.9 |
|
| Earnings from operations |
|
|
$36.9 |
|
$32.6 |
|
|
|
|
|
|
| Cash provided by operating activities |
|
|
$40.9 |
|
$36.5 |
|
Capital expenditures (sustaining) (2) |
|
|
$13.5 |
|
$11.4 |
|
Capital expenditures (growth) (2) |
|
|
$37.6 |
|
$43.2 |
|
Capital expenditures (capitalized exploration) (2) |
|
|
$3.5 |
|
$2.4 |
|
Mine-site free cash flow (2) |
|
|
($13.7) |
|
($20.5) |
|
Cost of sales, including amortization per ounce of gold sold (1) |
|
|
$979 |
|
$916 |
|
Total cash costs per ounce of gold sold (2) |
|
|
$706 |
|
$629 |
|
Mine-site all-in sustaining costs per ounce of gold sold (2),(3) |
|
|
$1,105 |
|
$970 |
|
| Underground Operations |
|
|
|
|
| Tonnes of ore mined |
|
|
106,737 |
|
108,396 |
|
| Tonnes of ore mined per day ("tpd") |
|
|
1,173 |
|
1,204 |
|
Average grade of gold (4) |
|
|
10.53 |
|
9.56 |
|
| Metres developed |
|
|
1,787 |
|
2,103 |
|
|
|
|
|
|
|
|
|
|
|
| Mill Operations |
|
|
|
|
| Tonnes of ore processed |
|
|
107,215 |
|
107,507 |
|
| Tonnes of ore processed per day |
|
|
1,178 |
|
1,195 |
|
Average grade of gold (4) |
|
|
10.63 |
|
9.57 |
|
| Contained ounces milled |
|
|
36,651 |
|
33,082 |
|
| Average recovery rate |
|
|
97.3 |
% |
97.0 |
% |
|
|
|
|
|
(1)Cost of sales includes mining and processing costs, royalties, and amortization.
(2)Refer to the “Non-GAAP Measures and Additional GAAP Measures” disclosure at the end of this MD&A for a description and calculation of these measures.
(3)For the purposes of calculating mine-site all-in sustaining costs, the Company does not include an allocation of corporate and administrative and share based compensation expenses.
(4)Grams per tonne of gold ("g/t Au").
Operational review
Island Gold produced 33,400 ounces in the first quarter of 2024, consistent with the prior year period. Underground mining rates averaged 1,173 tpd in the first quarter, a 3% decrease from the prior year period and slightly below annual guidance of 1,200 tpd. Grades mined averaged 10.53 g/t Au in the quarter, consistent with annual guidance and 10% higher than in the prior year period.
Mill throughput averaged 1,178 tpd for the quarter, slightly lower than the prior year period reflecting mining rates in the quarter. Mill recoveries averaged 97% in the first quarter, consistent with guidance.
Financial Review
Revenues of $71.0 million in the first quarter were 11% higher than the prior year period, primarily driven by the higher realized gold price.
Cost of sales of $33.4 million in the first quarter was 8% higher than the prior year period, driven by inflationary pressures on mining and processing costs, driven mainly by labour and certain consumables.
14
|
|
|
|
|
|
|
|
|
2024 Management’s Discussion and Analysis |
Total cash costs of $706 per ounce and mine-site AISC of $1,105 per ounce in the first quarter were both higher than the prior year period, reflecting inflationary pressures. Costs are expected to decrease through the remainder of the year to be consistent with annual guidance.
Total capital expenditures were $54.6 million in the first quarter, including $37.6 million of growth capital and $3.5 million of capitalized exploration. Growth capital spending remained focused on the Phase 3+ Expansion shaft site infrastructure and shaft sinking, with the shaft reaching a depth of 185 metres by the end of the quarter. Additionally, capital spending was focused on lateral development and other surface infrastructure. Certain other capital activities planned for 2024 have been deferred as a result of the planned acquisition of Argonaut.
Mine-site free cash flow was negative $13.7 million for the first quarter given the significant capital investment related to the Phase 3+ Expansion. At current gold prices, Island Gold is expected to continue funding the majority of the Phase 3+ Expansion capital. The operation is expected to generate significant free cash flow from 2026 onward with the completion of the expansion.
15
|
|
|
|
|
|
|
|
|
2024 Management’s Discussion and Analysis |
Mulatos District
The Mulatos District (Mulatos and La Yaqui Grande mines) is located within the Salamandra Concessions in the Sierra Madre Occidental mountain range in the State of Sonora, Mexico. The Company controls a total of 28,972 hectares of mineral concessions within the Mulatos District. The Mulatos mine achieved commercial production in 2006, with La Yaqui Grande commencing operations in June 2022.
Mulatos District Financial and Operational Review
|
|
|
|
|
|
|
|
|
|
|
|
|
Three Months Ended March 31, |
|
|
|
2024 |
|
2023 |
|
|
|
|
|
|
|
|
|
|
|
| Gold production (ounces) |
|
|
62,200 |
|
50,500 |
|
| Gold sales (ounces) |
|
|
58,909 |
|
53,265 |
|
Financial Review (in millions) |
|
|
|
|
| Operating Revenues |
|
|
$123.9 |
|
$101.3 |
|
Cost of sales (1) |
|
|
$74.8 |
|
$62.4 |
|
| Earnings from operations |
|
|
$45.8 |
|
$36.6 |
|
|
|
|
|
|
| Cash provided by operating activities |
|
|
$53.6 |
|
$42.5 |
|
|
|
|
|
|
Capital expenditures (sustaining) (2) |
|
|
$1.4 |
|
$2.3 |
|
|
|
|
|
|
Capital expenditures (growth) (2) |
|
|
$0.6 |
|
$2.3 |
|
Capital expenditures (capitalized exploration) (2) |
|
|
$1.9 |
|
$1.1 |
|
Mine-site free cash flow (2) |
|
|
$49.7 |
|
$36.8 |
|
|
|
|
|
|
|
|
|
|
|
Cost of sales, including amortization per ounce of gold sold (1) |
|
|
$1,270 |
|
$1,172 |
|
|
|
|
|
|
|
|
|
|
|
Total cash costs per ounce of gold sold (2) |
|
|
$840 |
|
$839 |
|
|
|
|
|
|
|
|
|
|
|
Mine site all-in sustaining costs per ounce of gold sold (2),(3) |
|
|
$905 |
|
$914 |
|
| La Yaqui Grande Mine |
|
|
|
|
Open Pit Operations |
|
|
|
|
Tonnes of ore mined - open pit (4) |
|
|
986,214 |
|
1,032,944 |
|
Total waste mined - open pit (6) |
|
|
4,076,910 |
|
5,830,815 |
|
| Total tonnes mined - open pit |
|
|
5,063,125 |
|
6,863,759 |
|
| Waste-to-ore ratio (operating) |
|
|
4.13 |
|
5.64 |
|
Crushing and Heap Leach Operations |
|
|
|
|
| Tonnes of ore stacked |
|
|
981,740 |
|
1,019,634 |
|
Average grade of gold processed (5) |
|
|
1.31 |
|
1.55 |
|
| Contained ounces stacked |
|
|
41,398 |
|
50,922 |
|
| Average recovery rate |
|
|
120.8 |
% |
75.0 |
% |
| Ore crushed per day (tonnes) |
|
|
10,800 |
|
11,329 |
|
| Mulatos Mine |
|
|
|
|
Open Pit Operations |
|
|
|
|
Tonnes of ore mined - open pit (4) |
|
|
— |
|
1,001,785 |
|
Total waste mined - open pit (6) |
|
|
— |
|
611,755 |
|
| Total tonnes mined - open pit |
|
|
— |
|
1,613,539 |
|
| Waste-to-ore ratio (operating) |
|
|
— |
|
0.61 |
|
Crushing and Heap Leach Operations |
|
|
|
|
| Tonnes of ore stacked |
|
|
— |
|
1,229,076 |
|
Average grade of gold processed (5) |
|
|
— |
|
0.92 |
|
| Contained ounces stacked |
|
|
— |
|
36,541 |
|
|
|
|
|
|
|
|
|
|
|
|
|
|
|
|
|
|
|
|
|
|
|
|
|
|
| Average recovery rate |
|
|
— |
|
33 |
% |
| Ore crushed per day (tonnes) |
|
|
— |
|
13,700 |
|
|
|
|
|
|
|
|
|
|
|
|
|
|
|
|
|
|
|
|
|
|
|
|
|
|
|
|
|
|
|
|
|
|
|
|
|
|
|
|
|
|
|
|
|
|
|
|
|
|
|
|
|
|
|
|
|
|
|
|
|
|
|
|
|
|
|
|
|
|
|
|
|
|
|
|
|
|
|
|
|
|
|
|
|
|
|
|
|
|
|
|
|
|
|
|
|
|
|
|
|
|
|
|
|
|
|
|
|
|
|
|
|
|
|
|
|
|
|
|
|
|
|
|
|
|
|
|
|
|
|
(1)Cost of sales includes mining and processing costs, royalties, and amortization expense.
(2)Refer to the “Non-GAAP Measures and Additional GAAP Measures” disclosure at the end of this MD&A for a description and calculation of these measures.
(3)For the purposes of calculating mine-site all-in sustaining costs, the Company does not include an allocation of corporate and administrative and share based compensation expenses.
(4)Includes ore stockpiled during the quarter.
(5)Grams per tonne of gold ("g/t Au").
(6)Total waste mined includes operating waste and capitalized stripping.
16
|
|
|
|
|
|
|
|
|
2024 Management’s Discussion and Analysis |
Mulatos District Operational Review
The Mulatos District produced 62,200 ounces in the first quarter, 23% higher than the prior year period, reflecting a record quarter from La Yaqui Grande.
La Yaqui Grande produced 50,000 ounces in the first quarter, exceeding expectations, and an increase of 30% compared to the prior year period. Recovery rates averaged 121%, well above annual guidance, benefiting from the recovery of higher grade ore stacked in the latter part of 2023. Grades stacked averaged 1.31 g/t Au in the quarter, in line with guidance. Stacking rates of 10,800 tpd in the first quarter were above annual guidance, but are expected to average 10,000 tpd for the remainder of the year.
Mulatos produced 12,200 ounces in the first quarter following commencement of residual leaching in December 2023. The operation is expected to benefit from ongoing gold production at decreasing rates in 2024.
Financial Review (Mulatos District)
Revenues of $123.9 million in the first quarter were 22% higher than the prior year period, reflecting higher realized gold prices and higher ounces sold.
Cost of sales of $74.8 million in the first quarter were 20% higher than in the prior year period due to the significant increase in ounces sold. On a per ounce basis, cost of sales were slightly lower than the prior year period reflecting the greater contribution of low-cost ounces at La Yaqui Grande.
Total cash costs of $840 per ounce and mine-site AISC of $905 per ounce in the first quarter were lower than the prior year period and below annual guidance due to the greater contribution of low-cost production from La Yaqui Grande, offset in part by ongoing inflationary pressures. Both total cash costs and mine-site AISC are expected to increase through the remainder of the year to be consistent with annual guidance reflecting lower rates of production due to lower grades at La Yaqui Grande.
Capital expenditures totaled $3.9 million in the first quarter, including sustaining capital of $1.4 million, and $1.9 million of capitalized exploration focused on drilling at PDA.
The Mulatos District generated mine-site free cash flow of $49.7 million for the first quarter, net of $45.3 million of cash tax payments primarily related to 2023 income and mining taxes payable given the increased profitability of the operation. The Company expects cash tax payments to decrease to approximately $10 million per quarter for the remainder of the year, related to the 2024 tax year. The 35% increase in mine-site free cash flow as compared to the prior year period was driven by record production from La Yaqui Grande, partially offset by higher cash tax payments.
17
|
|
|
|
|
|
|
|
|
2024 Management’s Discussion and Analysis |
First Quarter 2024 Development Activities
Island Gold (Ontario, Canada)
Phase 3+ Expansion
On June 28, 2022, the Company reported results of the Phase 3+ Expansion Study (“P3+ Expansion Study”) conducted on its Island Gold mine, located in Ontario, Canada.
The Phase 3+ Expansion to 2,400 tpd from the current rate of 1,200 tpd will involve various infrastructure investments. These include the installation of a shaft, paste plant, expansion of the mill as well as accelerated development to support the higher mining rates. Following the completion of the expansion in 2026, the operation will transition from trucking ore and waste up the ramp to skipping ore and waste to surface through the new shaft infrastructure, driving production higher and costs significantly lower.
With the acquisition of Argonaut's Magino mine expected to close in July, the expansion of the Island Gold mill and tailings facility will no longer be required providing immediate capital savings. Starting in 2025, ore from Island Gold is expected to be processed through the larger and more cost effective Magino mill, providing significant ongoing operating synergies.
Construction of the Phase 3+ Expansion continued through the first quarter of 2024 with progress summarized below:
•Completed the mechanical and electrical outfitting for hoist house and headframe
•Shaft sinking advanced to a depth of 185 metres ("m") by the end of the first quarter with sinking rates increasing to 2.5 m per day in March
•Paste plant detailed engineering 85% complete; issuance of long lead time equipment procurement packages is ongoing with construction activities expected to begin in the second half of 2024
•Advanced lateral development to support higher mining rates with the Phase 3+ Expansion
The Phase 3+ Expansion remains on schedule to be completed during the first half of 2026. During the first quarter of 2024, the Company spent $37.6 million on the Phase 3+ Expansion and capital development. As of March 31, 2024, 57% of the total initial growth capital of $756 million has been spent and committed on the project. Capital spending is tracking well for work completed to date; however, continuing labour cost pressures may impact future project costs. Following the expected closing of the Magino acquisition in July 2024, the Company will provide updated capital estimates to reflect upgrades to the Magino mill and with the Island Gold mill expansion no longer required. Progress on the Expansion is detailed as follows:
|
|
|
|
|
|
|
|
|
|
|
|
|
|
|
|
(in US$M)
Growth capital (including indirects and contingency) |
P3+ 2400
Study1
|
Spent to date2 |
Committed to date |
% of Spent & Committed |
|
| Shaft & Shaft Surface Complex |
229 |
|
156 |
|
52 |
|
91 |
% |
|
Mill Expansion 4 |
76 |
|
11 |
|
7 |
|
24 |
% |
|
| Paste Plant |
52 |
|
4 |
|
24 |
|
54 |
% |
|
| Power Upgrade |
24 |
|
11 |
|
4 |
|
63 |
% |
|
| Effluent Treatment Plant |
16 |
|
— |
|
— |
|
— |
|
|
| General Indirect Costs |
64 |
|
38 |
|
6 |
|
69 |
% |
|
Contingency3 |
55 |
|
— |
|
— |
|
|
|
| Total Growth Capital |
$516 |
$220 |
$93 |
61 |
% |
|
|
|
|
|
|
|
| Underground Equipment & Infrastructure |
79 |
|
34 |
|
— |
|
43 |
% |
|
| Accelerated Capital Development |
162 |
|
82 |
|
— |
|
51 |
% |
|
| Total Growth Capital (including Accelerated Spend) |
$756 |
$336 |
$93 |
57 |
% |
|
1.Phase 3+ 2400 Study is as of January 2022. Phase 3+ capital estimate based on USD/CAD exchange $0.78:1. Spent to date based on average USD/CAD of $0.75:1 since the start of 2022. Committed to date based on the spot USD/CAD rate as at March 31, 2024 of $0.75:1.
2.Amount spent to date accounted for on an accrual basis, including working capital movements.
3.Contingency has been allocated to the various areas.
4.No further capital is expected to be incurred on the Island Gold mill expansion with the acquisition of Argonaut, expected to close in July 2024.
18
|
|
|
|
|
|
|
|
|
2024 Management’s Discussion and Analysis |
Shaft site area - April 2024
Lynn Lake (Manitoba, Canada)
On August 2, 2023, the Company reported the results of an updated Feasibility Study ("2023 Study") conducted on the project which replaces the previous Feasibility Study completed in 2017 ("2017 Study"). The 2023 Study incorporates a 44% larger Mineral Reserve and 14% increase in milling rates to 8,000 tpd supporting a larger, longer-life, low-cost operation. The 2023 Study has been updated to reflect the current costing environment, as well as a significant amount of additional engineering, on-site geotechnical investigation work, and requirements outlined during the permitting process with the EIS granted in March 2023. Highlights of the study include:
•average annual gold production of 207,000 ounces over the first five years and 176,000 ounces over the initial 10 years
•low-cost profile: average mine-site all-in sustaining costs of $699 per ounce over the first 10-years and $814 per ounce over the life of mine
•44% larger Mineral Reserve totaling 2.3 million ounces grading 1.52 g/t Au (47.6 million tonnes ("mt"))
•17-year mine life, life of mine production of 2.2 million ounces
•After-tax net present value (“NPV”) (5%) of $428 million (base case gold price assumption of $1,675 per ounce and USD/CAD foreign exchange rate of $0.75:1); after-tax internal rate of return (“IRR”) of 17%
•After-tax NPV (5%) of $670 million, and an after-tax IRR of 22%, at current gold prices of approximately $1,950 per ounce
•Payback of less than four years at the base case gold price of $1,675 per ounce and less than three years at a $1,950 per ounce gold prices
Development spending (excluding exploration) was $3.6 million in the first quarter of 2024, primarily on detailed engineering, which is 80% complete. The focus in 2024 is on further de-risking and advancing the project ahead of an anticipated construction decision in 2025. This includes completion of detailed engineering, and commencement of early works, including road construction and power line upgrades. The majority of the $25 million capital budget in 2024 is spending included as initial capital in the 2023 Feasibility Study.
Kirazlı (Çanakkale, Türkiye)
On October 14, 2019, the Company suspended all construction activities on its Kirazlı project following the Turkish government's failure to grant a routine renewal of the Company’s mining licenses, despite the Company having met all legal and regulatory requirements for their renewal. In October 2020, the Turkish government refused the renewal of the Company’s Forestry Permit.
19
|
|
|
|
|
|
|
|
|
2024 Management’s Discussion and Analysis |
The Company had been granted approval of all permits required to construct Kirazlı including the Environmental Impact Assessment approval, Forestry Permit, and GSM (Business Opening and Operation) permit, and certain key permits for the nearby Ağı Dağı and Çamyurt Gold Mines. These permits were granted by the Turkish government after the project earned the support of the local communities and passed an extensive multi-year environmental review and community consultation process.
On April 20, 2021, the Company announced that its Netherlands wholly-owned subsidiaries Alamos Gold Holdings Coöperatief U.A, and Alamos Gold Holdings B.V. (the “Subsidiaries”) would be filing an investment treaty claim against the Republic of Türkiye for expropriation and unfair and inequitable treatment. The claim was filed under the Netherlands-Türkiye Bilateral Investment Treaty (the “Treaty”). Alamos Gold Holdings Coöperatief U.A. and Alamos Gold Holdings B.V. had their claim against the Republic of Türkiye registered on June 7, 2021 with the International Centre for Settlement of Investment Disputes (World Bank Group).
Bilateral investment treaties are agreements between countries to assist with the protection of investments. The Treaty establishes legal protections for investment between Türkiye and the Netherlands. The Subsidiaries directly own and control the Company’s Turkish assets. The Subsidiaries invoking their rights pursuant to the Treaty does not mean that they relinquish their rights to the Turkish project, or otherwise cease the Turkish operations. The Company will continue to work towards a constructive resolution with the Republic of Türkiye.
The Company incurred $1.4 million in the first quarter of 2024 related to ongoing care and maintenance and arbitration costs to progress the Treaty claim, which was expensed.
First Quarter 2024 Exploration Activities
Island Gold (Ontario, Canada)
The 2024 near mine exploration program will continue to focus on defining new Mineral Reserves and Resources in proximity to existing production horizons and underground infrastructure through both underground and surface exploration drilling.
As announced on February 13, 2024, the 2023 exploration program was successful with high-grade Mineral Reserves and Resources added across all categories to now total 6.1 million ounces, a 16% increase from the end of 2022. This included an 18% increase in Mineral Reserves to 1.7 million ounces (5.2 mt grading 10.30 g/t Au), a 146% increase in Measured and Indicated Mineral Resources to 0.7 million ounces (2.6 mt grading 8.73 g/t Au) and a 4% increase in Inferred Mineral Resources to 3.7 million ounces (7.9 mt grading 14.58 g/t Au).
The majority of these high-grade Mineral Reserve and Resource additions were in proximity to existing production horizons and infrastructure. This included additions within the main Island Gold structure as well as within the hanging wall and footwall. Given their proximity to existing infrastructure, these ounces are expected to be low cost to develop and could be incorporated into the mine plan and mined within the next several years, further increasing the value of the operation.
A total of $19 million has been budgeted for exploration at Island Gold in 2024, up from $14 million in 2023, with both a larger near mine and regional exploration program. This includes 41,000 m of underground exploration drilling, 12,500 m of near-mine surface exploration drilling, and 10,000 m of surface regional exploration drilling.
To support the underground exploration drilling program, 460 m of underground exploration drift development is planned to extend drill platforms on the 850 and 1025 m levels. In addition to the exploration budget, 32,000 m of underground delineation drilling has been planned and included in sustaining capital for Island Gold which will be focused on the conversion of the large Mineral Resource base to Mineral Reserves.
The 2024 regional exploration program will follow up on high-grade mineralization intersected at the Pine-Breccia and 88-60 targets, located 4 km and 7 km, respectively, from the Island Gold mine. Drilling will also be completed in proximity to the past-producing Cline and Edwards mines, as well as at the Island Gold North Shear target. Additionally, a comprehensive data compilation project is underway across the 40,000-hectare Manitou land package that was acquired in 2023 in support of future exploration targeting.
During the first quarter, 11,967 m of underground exploration drilling was completed in 45 holes, and 2,631 m of surface drilling was completed in two holes. Additionally, a total of 9,425 m of underground delineation drilling was completed in 37 holes, focused on in-fill drilling to convert Mineral Resources to Mineral Reserves. A total of 159 m of underground exploration drift development was also completed during the first quarter.
The regional exploration drilling program also commenced in the first quarter, with 565 m completed in one hole targeting mineralization in the North Shear, Webb Lake Stock, and up-plunge of Island West (C-zone).
Total exploration expenditures during the first quarter of 2024 were $4.2 million, of which $3.5 million was capitalized.
Young-Davidson (Ontario, Canada)
A total of $12 million has been budgeted for exploration at Young-Davidson in 2024, up from $8 million spent in 2023. This includes 21,600 m of underground exploration drilling, and 1,070 m of underground exploration development to extend drill platforms on multiple levels. The majority of the underground exploration drilling program will be focused on extending mineralization within the Young-Davidson syenite, which hosts the majority of Mineral Reserves and Resources.
20
|
|
|
|
|
|
|
|
|
2024 Management’s Discussion and Analysis |
Drilling will also test the hanging wall and footwall of the deposit where higher grades have been previously intersected.
The regional program has been expanded with 7,000 m of surface drilling planned in 2024, up from 5,000 m in 2023. The focus will be on testing multiple near-surface targets across the 5,900 hectare Young-Davidson Property that could potentially provide supplemental mill feed.
During the first quarter, two underground exploration drills completed 7,753 m in 21 holes from the 9220 West exploration drift, 9025 East Footwall, and the 9620 hanging wall area. Drilling is targeting syenite-hosted mineralization as well as continuing to test mineralization in the hanging wall sediments and mafic-ultramafic stratigraphy.
In addition, 1,477 m of surface drilling was completed in four holes in the first quarter, in the Otisse NE target area.
Total exploration expenditures during the first quarter were $1.5 million of which $1.0 million was capitalized.
Mulatos District (Sonora, Mexico)
A total of $19 million has been budgeted at Mulatos for exploration in 2024, similar to spending in 2023. The near-mine and regional drilling program is expected to total 55,000 m. This includes 27,000 m of surface exploration drilling at PDA and the surrounding area. This drilling will follow up on another successful year of exploration at PDA in 2023, with Mineral Reserves increasing 33% to 1.0 million ounces (5.4 mt grading 5.61 g/t Au) and grades also increasing 16%. This growth in higher-grade Mineral Reserves will be incorporated into an updated development plan which is expected to be completed in the second quarter of 2024.
During the first quarter, exploration activities continued at PDA and the near-mine area with 10,130 m of drilling completed in 36 holes. Drilling was focused on infill drilling the GAP-Victor portion of the Mineral Resource.
Drilling also commenced at Cerro Pelon evaluating the high-grade sulphide potential to the north of the historical open pit. A total of 2,950 m in nine holes were completed in the first quarter. At Refugio, 2,165 m was drilled in eight holes to follow up drill holes 23REF012 (2.01 g/t Au over 82.45 m core length, including 4.81 g/t Au over 16.40 m and 5.38 g/t Au over 12.35m) and 23REF022 (2.73 g/t Au over 120.85 m core length, including 9.31 g/t Au over 29.05 m) which were intersected in 2023 (drill hole composite gold grades reported at Capulin as uncut). Drilling continues to test the geometry of the breccia unit and the extent of the gold mineralization, as well as targets across the broader Capulin area.
Additionally, 2,139 m was drilled in six holes, testing greenfields targets across the property
During the first quarter, exploration spending at Mulatos totaled $5.2 million of which $1.9 million was capitalized.
Lynn Lake (Manitoba, Canada)
A total of $9 million has been budgeted for exploration at the Lynn Lake project in 2024, up from $5 million in 2023. This includes 15,500 m of drilling focused on the conversion of Mineral Resources to Mineral Reserves at the Burnt Timber and Linkwood deposits, and to evaluate the potential for Mineral Resources at Maynard, an advanced stage greenfield target.
Burnt Timber and Linkwood contain Inferred Mineral Resources totaling 1.6 million ounces grading 1.1 g/t Au (44 million tonnes) as of December 31, 2023. The Company sees excellent potential for this to be converted into a smaller, higher quality Mineral Reserve which could be incorporated into the Lynn Lake Gold Project given its proximity to the planned mill. A study incorporating these deposits into the Lynn Lake project is expected to be competed in the fourth quarter of 2024, and represents potential production and economic upside to the 2023 Feasibility Study.
Surface exploration drilling in the first quarter focused on the infill drilling program at Linkwood, with 8,564 m completed in 46 holes. Following the expected completion of the Linkwood program in the second quarter, the focus will shift to complete the infill drilling program at Burnt Timber, and the exploration drilling program at Maynard.
Exploration spending totaled $1.9 million in the first quarter, all of which was capitalized.
21
|
|
|
|
|
|
|
|
|
2024 Management’s Discussion and Analysis |
Key External Performance Drivers
Gold Price
The Company’s financial performance is largely dependent on the price of gold, which directly affects the Company’s profitability and cash flow. The price of gold is subject to volatile price movements and is affected by numerous factors, such as the strength of the US dollar, supply and demand, interest rates, and inflation rates, all of which are beyond the Company’s control. During the first quarter of 2024, the Company realized an average gold price of $2,069 per ounce, $1 per ounce below the London PM Fix price, and a 9% increase compared to $1,896 per ounce in the prior year quarter.
As at March 31, 2024, the Company had 59,250 ounces hedged for 2024 which will ensure a minimum average realized gold price of $1,934 per ounce and a maximum average realized gold price of $2,359 per ounce on these hedged ounces, regardless of the movement in gold prices during the period.
Foreign Exchange Rates
At the Company’s mine sites, a significant portion of operating costs and capital expenditures are denominated in foreign currencies, primarily the Canadian dollar and Mexican peso ("MXN"). Fluctuations in the value of these foreign currencies compared to the US dollar can significantly impact the Company’s costs and cash flow. In the first quarter of 2024, the Canadian dollar averaged approximately $1.35 CAD to $1 USD, consistent with the first quarter of 2023. The Mexican peso averaged 16.97 MXN to $1 USD in the first quarter of 2024 compared to 18.66 MXN to $1 USD in the first quarter of 2023.
The Company recorded a foreign exchange loss of $0.9 million in the first quarter related to the translation of the Company's net monetary assets and liabilities, resulting primarily from the weakening of the Canadian dollar from the end of 2023 by 3%, ending at $1.36 CAD to $1 USD, offset in part by a strengthening Mexican peso which closed at 16.61 MXN to $1 USD at March 31, 2024.
Additionally, the Company is further exposed to currency risk through non-monetary assets and liabilities of subsidiaries whose taxable profit or tax loss are denominated in non-US dollar currencies. Changes in exchange rates gives rise to temporary differences resulting in deferred tax assets and liabilities with the resulting deferred tax charged or credited to income tax expense. The movement of the CAD and MXN rates generated a non-cash foreign exchange net loss of $3.6 million in the first quarter on the revaluation of monetary tax and deferred tax balances, which was recorded within deferred tax expense.
The Company actively manages its currency exposure through a hedging program, which resulted in realized foreign exchange gains of $1.7 million during the first quarter, primarily related to the Mexican Peso. The Company applies hedge accounting; accordingly, these realized gains have been applied against operating and capital costs at the operating mines.
22
|
|
|
|
|
|
|
|
|
2024 Management’s Discussion and Analysis |
Summarized Financial and Operating Results
|
|
|
|
|
|
|
|
|
|
|
|
| (in millions, except ounces, per share amounts, average realized prices, AISC and total cash costs) |
|
|
|
Three Months Ended March 31, |
|
|
|
2024 |
|
2023 |
|
|
| Gold production (ounces) |
|
|
135,700 |
|
128,400 |
|
|
|
|
|
|
|
|
Gold sales (ounces) |
|
|
132,849 |
|
132,668 |
|
|
| Operating Revenues |
|
|
$277.6 |
|
$251.5 |
|
|
Cost of sales (1) |
|
|
$173.6 |
|
$155.2 |
|
|
| Earnings from operations |
|
|
$81.4 |
|
$75.0 |
|
|
| Earnings before income taxes |
|
|
$75.6 |
|
$72.2 |
|
|
| Net earnings |
|
|
$42.1 |
|
$48.4 |
|
|
Adjusted net earnings (2) |
|
|
$51.2 |
|
$45.4 |
|
|
| Earnings per share, basic and diluted |
|
|
$0.11 |
|
$0.12 |
|
|
Adjusted earnings per share, basic (2) |
|
|
$0.13 |
|
$0.12 |
|
|
| Total assets |
|
|
$4,011.5 |
|
$3,736.0 |
|
|
| Total non-current liabilities |
|
|
851.6 |
|
774.5 |
|
|
| Cash flow from operations |
|
|
$108.9 |
|
$94.3 |
|
|
| Dividends per share, declared and paid |
|
|
0.025 |
|
0.025 |
|
|
| Average realized gold price per ounce |
|
|
$2,069 |
|
$1,896 |
|
|
Cost of sales per ounce of gold sold, including amortization (1) |
|
|
$1,307 |
|
$1,170 |
|
|
Total cash costs per ounce of gold sold (2) |
|
|
$910 |
|
$821 |
|
|
All-in sustaining costs per ounce of gold sold (2) |
|
|
$1,265 |
|
$1,176 |
|
|
|
|
|
|
|
|
|
|
|
|
|
|
|
|
|
|
|
|
|
|
|
|
|
|
|
|
|
|
|
|
|
|
|
|
|
|
|
|
|
|
|
|
|
|
|
|
|
|
|
|
|
|
|
|
|
|
|
|
|
|
|
|
|
|
|
|
|
|
|
|
|
|
|
|
|
|
|
|
(1) Cost of sales includes mining and processing costs, royalties, and amortization expense.
(2) Refer to the “Non-GAAP Measures and Additional GAAP Measures” disclosure at the end of this MD&A for a description and calculation of these measures.
Review of First Quarter Financial Results
Operating Revenue
During the first quarter of 2024, the Company sold 132,849 ounces of gold for record operating revenues of $277.6 million. This represented a 10% increase from the prior year period due primarily to a higher realized gold price.
Cost of Sales
Cost of sales were $173.6 million in the first quarter, 12% higher than the prior year period. Key drivers of changes to cost of sales as compared to the prior year period were as follows:
Mining and Processing
Mining and processing costs were $121.0 million, 14% higher than the prior year period. The increase was driven by inflationary pressures, and the inclusion of silver sales as an offset to mining and processing costs in the prior year period.
Total cash costs of $910 per ounce and AISC of $1,265 per ounce were higher than the prior year period due to inflationary pressures and lower grades mined and lower mining rates at Young-Davidson.
Royalties
Royalty expense was $2.6 million in the first quarter, slightly higher than the prior year period of $2.5 million, due to the higher average realized gold price.
Amortization
Amortization of $50.0 million, or $376 per ounce, in the first quarter was consistent with annual guidance and higher than the prior year period.
Earnings from Operations
The Company recognized earnings from operations of $81.4 million in the first quarter, 9% higher than the prior year period, primarily as a result of the higher realized gold price.
23
|
|
|
|
|
|
|
|
|
2024 Management’s Discussion and Analysis |
Net Earnings
The Company reported net earnings of $42.1 million in the first quarter, compared to $48.4 million in the prior year period. Adjusted earnings (1) were $51.2 million, or $0.13 per share, which included adjustments for other losses, primarily comprised of unrealized losses on derivatives and disposals of certain plant and equipment, and unrealized net foreign exchange losses recorded within deferred taxes.
(1) Refer to the “Non-GAAP Measures and Additional GAAP Measures” disclosure at the end of this MD&A for a description and calculation of these measures.
Consolidated Expenses and Other
|
|
|
|
|
|
|
|
|
|
|
| (in millions) |
|
|
|
|
|
Three Months Ended March 31, |
|
|
2024 |
2023 |
|
|
| Exploration expense |
($4.8) |
|
($3.5) |
|
|
|
| Corporate and administrative expense |
(7.9) |
|
(6.7) |
|
|
|
| Share-based compensation expense |
(9.9) |
|
(11.1) |
|
|
|
|
|
|
|
|
| Finance expense |
(0.1) |
|
(1.4) |
|
|
|
| Foreign exchange loss |
(0.9) |
|
(0.1) |
|
|
|
| Other loss |
(4.8) |
|
(1.3) |
|
|
|
|
|
|
|
|
|
|
|
|
|
|
|
|
|
|
|
|
|
|
|
|
|
|
|
|
|
|
|
|
|
|
|
|
|
|
|
|
|
|
|
|
|
|
|
|
Exploration
Exploration expense primarily relates to expenditures on early-stage exploration projects, regional exploration programs and corporate exploration support. The Company capitalizes near-mine exploration at its three operations and development projects. Exploration expense was higher than the prior year period driven by the larger 2024 regional exploration programs at each of the Company's operations and projects.
Corporate and administrative
Corporate and administrative costs include expenses arising from the overall management of the business that are not part of direct mine operating costs. These costs are incurred at the corporate office located in Canada. Corporate and administrative costs in the first quarter were slightly higher than the prior year period due to increased personnel costs.
Share-based compensation
Share-based compensation expense of $9.9 million in the first quarter was lower than the prior year period due to the movement in the Company's share price in the quarter and the corresponding impact on the revaluation of the liability for outstanding cash-based long-term incentives.
Finance expense
Finance expense primarily relates to standby fees on the credit facility and accretion expense arising on decommissioning liabilities, offset by interest earned on cash and cash equivalents. In the first quarter, finance expense was lower than the prior year period due to earning more interest income on an increased cash balance. This was partially offset by higher accretion expense.
Foreign exchange loss
A foreign exchange loss of $0.9 million was recorded in the first quarter compared to a foreign exchange loss of $0.1 million in the prior year period.
Other loss
Other loss in the first quarter of 2024 was primarily driven by unrealized losses on the Company's gold option contracts, holding and legal costs associated with the Company's Turkish Projects, and losses on disposal of certain plant and equipment.
24
|
|
|
|
|
|
|
|
|
2024 Management’s Discussion and Analysis |
Consolidated Income Tax Expense
The Company is subject to tax in various jurisdictions, including Mexico and Canada. There are a number of factors that can significantly impact the Company’s effective tax rate including the geographic distribution of income, varying rates in different jurisdictions, the non-recognition of tax assets, mining allowances, foreign currency exchange rate movements, changes in tax laws and the impact of specific transactions and assessments. Due to the number of factors that can potentially impact the effective tax rate and the sensitivity of the tax provision to these factors, it is expected that the Company’s effective tax rate will fluctuate in future periods.
For the three months ended March 31, 2024, the Company recognized a current tax expense of $17.0 million and a deferred tax expense of $16.5 million, compared to a current tax expense of $23.4 million and deferred tax expense of $0.4 million for the three months ended March 31, 2023.
The Company paid cash taxes of $45.3 million in the first quarter related to mining tax and income tax in Mexico in respect of the 2023 fiscal year, and installment payments for the 2024 fiscal year. Cash tax payments are expected to decrease to approximately $10 million per quarter for the remainder of the year, relating to installment payments for 2024.
The deferred tax expense was driven by the use of tax pools compared to accounting depreciation in the period given strong operating earnings in both Canada and Mexico, partially offset by foreign exchange gains on the strengthening of the Mexican peso and Canadian dollar.
The Company's Mulatos mine in Mexico, as well as the Young-Davidson and Island Gold mines in Canada, pay income taxes based on their tax functional currency which is the Mexican peso and Canadian dollar, respectively. The legal entity financial statements for Mulatos, Young-Davidson and Island Gold include foreign exchange and other income items that differ from the US dollar functional currency financial statements. The Company recognized a foreign exchange loss of $3.6 million in the first quarter due to the foreign exchange movement.
Financial Condition
|
|
|
|
|
|
|
|
|
|
|
|
|
|
March 31, 2024 |
December 31, 2023 |
|
|
| Current assets |
$568.4 |
$586.0 |
|
Current assets decreased compared to 2023, primarily driven by lower inventory amounts held at the end of the quarter and a decrease in amounts receivable, primarily being the receipt of sales tax receivables in Mexico. |
| Long-term assets |
3,443.1 |
3,415.2 |
|
Long-term assets increased primarily due to capital expenditures on the Phase 3+ Expansion at Island Gold, partially offset by amortization. |
| Total assets |
$4,011.5 |
|
$4,001.2 |
|
|
|
| Current liabilities |
203.7 |
247.9 |
|
Current liabilities are lower than 2023, primarily due to the reduction of income tax payable following payment of the 2023 income tax payable due in Mexico and lower accounts payable and accrued liabilities due to timing of payments |
| Non-current liabilities |
851.6 |
|
829.8 |
|
|
Non-current liabilities are comprised of deferred taxes and decommissioning liabilities, and have increased as compared with the prior year due to an increase in the deferred tax liability driven by the strong operating performance across the Company's sites. |
| Total liabilities |
1,055.3 |
1,077.7 |
|
|
| Shareholders’ equity |
2,956.2 |
2,923.5 |
|
The increase in Shareholders' equity was primarily driven by net earnings for the period, partially offset by dividends declared in the quarter. |
| Total liabilities and equity |
$4,011.5 |
$4,001.2 |
|
|
Liquidity and Capital Resources
The Company’s strategy is based on achieving positive cash flow from operations to internally fund operating, capital and project development requirements, generate returns for its shareholders, and bolster the balance sheet. Material increases or decreases in the Company’s liquidity and capital resources will be substantially determined by the success or failure of the Company’s operations, exploration, and development programs, the ability to obtain equity or other sources of financing, the price of gold, and currency exchange rates.
As at March 31, 2024, the Company had cash and cash equivalents of $240.2 million and $16.3 million in equity securities, compared to $224.8 million and $13.0 million, respectively, at December 31, 2023. The Company has access to an undrawn credit facility (the "Facility") of $500.0 million, not including the uncommitted $100.0 million accordion feature to increase the credit facility up to $600.0 million.
25
|
|
|
|
|
|
|
|
|
2024 Management’s Discussion and Analysis |
The Facility bears interest at a rate of Adjusted Term SOFR Rate plus 1.875% on drawn amounts and stand-by fees of 0.42% on undrawn amounts. In February 2024, the Company extended the term of the revolving credit facility by one year to February 2028.
The Credit Facility is secured against all of the material present and future assets, property and undertakings of the Company. The Facility contains various covenants customary for a loan facility of this nature, including limits on indebtedness, asset sales and liens. It contains financial covenant tests that include (a) a minimum interest coverage ratio of 3.0:1.0 and (b) a maximum net leverage ratio of 3.5:1.0, both as defined in the agreement. As at March 31, 2024, the Company is in compliance with the covenants.
Subsequent to quarter end, the Company completed a CAD $50,000,000 private placement with Argonaut in conjunction with the proposed acquisition announced in March, 2024. Argonaut had a total debt position of $267.0 million as of December 31, 2023 which will be assumed by Alamos when the acquisition closes.
In the opinion of management, the Company's liquidity position of $740.2 million at March 31, 2024, comprised of cash and cash equivalents and availability under the credit facility, together with cash flows from operations, is sufficient to support the Company's normal operating requirements and capital commitments on an ongoing basis, and service any debt obligations incurred as a result of the Argonaut acquisition.
Cash Flow
|
|
|
|
|
|
|
|
|
|
|
| (in millions) |
|
|
|
|
|
|
Three Months Ended March 31, |
|
|
|
2024 |
2023 |
| Cash flow provided by operating activities |
|
|
$108.9 |
|
$94.3 |
|
| Cash flow used in investing activities |
|
|
(84.5) |
|
(84.8) |
|
| Cash flow used in financing activities |
|
|
(9.1) |
|
(5.6) |
|
| Effect of foreign exchange rates on cash |
|
|
0.1 |
|
0.1 |
|
| Net increase (decrease) in cash |
|
|
15.4 |
|
4.0 |
|
| Cash and cash equivalents, beginning of period |
|
|
224.8 |
|
129.8 |
|
| Cash and cash equivalents, end of period |
|
|
$240.2 |
|
$133.8 |
|
|
|
|
|
|
|
|
|
|
|
|
|
|
|
|
|
|
|
|
|
|
|
|
|
|
|
|
|
|
|
|
|
|
|
|
|
|
|
|
|
Cash flow provided by operating activities
In the first quarter of 2024, operating activities generated cash flow of $108.9 million compared to $94.3 million in the same period of 2023, representing a 15% increase. Cash flow from operations increased due to a higher realized gold price, partially offset by cash tax payments of $45.3 million. Cash flow provided by operations before working capital and taxes paid was $134.9 million in the first quarter compared to $127.2 million in the prior year period.
Cash flow used in investing activities
In the first quarter of 2024, capital expenditures of $84.5 million were consistent with expenditures of $83.8 million in the prior year quarter, with the majority related to the Phase 3+ expansion at Island Gold.
Cash flow used in financing activities
During the first quarter, the Company declared a dividend of $0.025 per share, totaling $9.8 million. Of this amount, $8.7 million was paid in cash and the remainder was issued in shares pursuant to the Company's dividend reinvestment plan.
Outstanding Share Data
|
|
|
|
|
|
|
April 23, 2024 |
| Common shares |
397,958,711 |
|
| Stock options |
3,202,112 |
|
| Deferred share units |
1,093,292 |
|
| Performance share units |
1,086,498 |
|
| Restricted share units |
2,530,952 |
|
|
405,871,565 |
|
26
|
|
|
|
|
|
|
|
|
2024 Management’s Discussion and Analysis |
Related party transactions
There were no related party transactions during the period other than those disclosed in the Company’s consolidated financial statements for the three months ended March 31, 2024.
Off-Balance Sheet Arrangements
The Company does not have any off-balance sheet arrangements.
Financial Instruments
The Company seeks to manage its exposure to fluctuations in commodity prices, fuel prices and foreign exchange rates by entering into derivative financial instruments from time to time.
Commodity option and forward contracts
As at March 31, 2024, the Company held option contracts to protect against the risk of a decrease in the value of the gold price on a portion of gold sales. These option contracts totaling 59,250 ounces, ensure a minimum average realized gold price of $1,934 per ounce and a maximum average realized gold price of $2,359 per ounce, regardless of the movement in gold prices during 2024. The fair value of these contracts was a liability of $2.3 million at March 31, 2024 (December 31, 2023 - liability of $0.8 million). These options mature monthly throughout 2024.
The Company realized a gain of nil related to the settlement of option contracts which is recorded in operating revenues for the three months ended March 31, 2024 (three months ended March 31, 2023 - realized loss of $0.1 million). The Company recorded an unrealized loss of $1.5 million for the three months ended March 31, 2024 (three months ended March 31, 2023 - unrealized loss of $1.7 million). The Company has elected to not apply hedge accounting to gold option contracts, with changes in fair value recorded in net earnings.
Foreign currency contracts
As at March 31, 2024, the Company held option contracts to protect against the risk of an increase in the value of the Canadian dollar and Mexican peso versus the US dollar. These option contracts are for the purchase of local currencies and the sale of US dollars, which settle on a monthly basis, and are summarized as follows:
Canadian dollar contracts:
|
|
|
|
|
|
|
|
|
|
|
|
|
|
|
|
| Period Covered |
Contract type |
Contracts
(CAD$ Millions) |
Average minimum rate (USD/CAD) |
Average maximum
rate (USD/CAD) |
|
|
|
|
|
|
|
|
|
|
|
|
|
|
|
|
|
|
|
|
|
|
|
|
|
| 2024 |
Bought Puts |
399.0 |
1.33 |
1.39 |
|
| 2024 |
Collars |
6.0 |
1.35 |
— |
|
Mexican Peso contracts:
|
|
|
|
|
|
|
|
|
|
|
|
|
|
|
|
| Period Covered |
Contract type |
Contracts
(MXN Millions) |
Average minimum rate (MXN/USD) |
Average maximum
rate (MXN/USD) |
|
|
|
|
|
|
|
| 2024 |
Collars |
270.0 |
18.11 |
20.58 |
|
|
|
|
|
|
|
|
|
|
|
|
|
The fair value of these contracts was an asset of $1.5 million at March 31, 2024 (December 31, 2023 - asset of $6.6 million). For the three months ended March 31, 2024, the Company realized net gains of $1.7 million on the foreign currency contracts (for the three months ended March 31, 2023 - realized net gains of $0.6 million).
As at March 31, 2024, the Company held contracts to protect against the risk of an increase in the price of fuel. These collars totallng 1,134,000 gallons, ensure a minimum purchase call option of $2.71 per gallon and a maximum average sold put options of $2.50 per gallon, regardless of the movement in fuel prices during 2024. The fair value of these contracts was nil at March 31, 2024 (December 31, 2023 - liability of $0.2 million).
27
|
|
|
|
|
|
|
|
|
2024 Management’s Discussion and Analysis |
Summary of Quarterly Financial and Operating Results
|
|
|
|
|
|
|
|
|
|
|
|
|
|
|
|
|
|
|
|
|
|
|
|
|
|
|
|
|
|
|
|
|
|
|
|
|
|
|
|
|
|
|
|
|
|
|
|
|
|
|
|
|
|
|
|
|
Q1 2024 |
Q4 2023 |
Q3 2023 |
Q2 2023 |
Q1 2023 |
Q4 2022 |
Q3 2022 |
Q2 2022 |
|
|
|
|
|
|
|
|
|
|
Gold ounces produced |
135,700 |
|
129,500 |
|
135,400 |
|
136,000 |
|
128,400 |
|
134,200 |
|
123,400 |
|
103,900 |
|
|
|
|
|
|
|
|
|
|
|
Gold ounces sold |
132,849 |
|
129,005 |
|
132,633 |
|
131,952 |
|
132,668 |
|
133,164 |
|
122,780 |
|
102,164 |
|
|
|
|
|
|
|
|
|
|
|
|
|
|
|
|
|
|
|
|
|
|
|
|
|
|
|
|
|
|
|
|
|
|
|
|
|
|
|
|
|
|
|
|
|
|
|
|
|
|
|
|
|
|
|
|
|
|
|
|
|
|
|
|
|
|
|
|
| Operating Revenues |
$277.6 |
|
$254.6 |
|
$256.2 |
|
$261.0 |
|
$251.5 |
|
$231.9 |
|
$213.6 |
|
$191.2 |
|
|
|
|
|
|
|
|
|
|
|
| Earnings from operations |
$81.4 |
|
$71.9 |
|
$82.6 |
|
$88.6 |
|
$75.0 |
|
$61.6 |
|
$29.9 |
|
$25.7 |
|
|
|
|
|
|
|
|
|
|
|
| Net earnings (loss) |
$42.1 |
|
$47.1 |
|
$39.4 |
|
$75.1 |
|
$48.4 |
|
$40.6 |
|
($1.4) |
|
$6.4 |
|
|
|
|
|
|
|
|
|
|
|
| Earnings per share, basic |
$0.11 |
|
$0.12 |
|
$0.10 |
|
$0.19 |
|
$0.12 |
|
$0.10 |
|
$0.00 |
|
$0.02 |
|
|
|
|
|
|
|
|
|
|
|
Adjusted net earnings (1) |
$51.2 |
|
$49.2 |
|
$54.5 |
|
$59.3 |
|
$45.4 |
|
$33.7 |
|
$26.9 |
|
$29.3 |
|
|
|
|
|
|
|
|
|
|
|
Adjusted earnings per share, basic (1) |
$0.13 |
|
$0.12 |
|
$0.14 |
|
$0.15 |
|
$0.12 |
|
$0.09 |
|
$0.07 |
|
$0.07 |
|
|
|
|
|
|
|
|
|
|
|
Earnings before interest, taxes, depreciation and amortization (1) |
$125.7 |
|
$101.6 |
|
$126.0 |
|
$138.9 |
|
$119.9 |
|
$100.4 |
|
$96.4 |
|
$92.0 |
|
|
|
|
|
|
|
|
|
|
|
| Cash provided by operating activities |
$108.9 |
|
$124.1 |
|
$112.5 |
|
$141.8 |
|
$94.3 |
|
$102.3 |
|
$74.0 |
|
$75.7 |
|
|
|
|
|
|
|
|
|
|
|
| Average realized gold price |
$2,069 |
|
$1,974 |
|
$1,932 |
|
$1,978 |
|
$1,896 |
|
$1,741 |
|
$1,740 |
|
$1,871 |
|
|
|
|
|
|
|
|
|
|
|
|
|
|
|
|
|
|
|
|
|
|
|
|
|
|
|
|
|
|
|
|
|
|
|
|
|
|
|
|
|
|
|
|
|
|
|
|
|
(1)Refer to the “Non-GAAP Measures and Additional GAAP Measures” disclosure at the end of this MD&A for a description and calculation of these measures.
Production and gold sales increased significantly following commencement of commercial production at La Yaqui Grande in June 2022, which has contributed low cost production growth.
Earnings from operations and cash flow from operating activities have consistently increased since mid-2022, as a result of a higher realized gold price, increased gold ounce production following achievement of commercial production at La Yaqui Grande, and margin expansion as the Company has focused on cost containment strategies across operations and the corporate office, despite ongoing inflationary pressures. In the first quarter of 2024, the Company realized record revenues given the stronger gold price environment and the second highest quarterly production in history.
In the second and third quarters of 2022, the Company recorded a non-cash net realizable adjustment on the Mulatos heap leach inventory of $22.3 million and $11.6 million, respectively, which negatively impacted earnings from operations in those periods.
Non-GAAP Measures and Additional GAAP Measures
The Company has included certain non-GAAP financial measures to supplement its Consolidated Financial Statements, which are presented in accordance with IFRS, including the following:
•adjusted net earnings and adjusted earnings per share;
•cash flow from operating activities before changes in working capital and taxes received;
•company-wide free cash flow;
•total mine-site free cash flow;
•mine-site free cash flow;
•total cash cost per ounce of gold sold;
•AISC per ounce of gold sold;
•Mine-site AISC per ounce of gold sold;
•sustaining and non-sustaining capital expenditures; and
•earnings before interest, taxes, depreciation, and amortization ("EBITDA")
The Company believes that these measures, together with measures determined in accordance with IFRS, provide investors with an improved ability to evaluate the underlying performance of the Company. Non-GAAP financial measures do not have any standardized meaning prescribed under IFRS, and therefore they may not be comparable to similar measures employed by other companies. The data is intended to provide additional information and should not be considered in isolation or as a substitute for measures of performance prepared in accordance with IFRS. Management's determination of the components of non-GAAP and additional measures are evaluated on a periodic basis influenced by new items and transactions, a review of investor uses and new regulations as applicable. Any changes to the measures are dully noted and retrospectively applied as applicable.
28
|
|
|
|
|
|
|
|
|
2024 Management’s Discussion and Analysis |
Adjusted Net Earnings and Adjusted Earnings per Share
“Adjusted net earnings” and “adjusted earnings per share” are non-GAAP financial measures with no standard meaning under IFRS which exclude the following from net earnings (loss):
•Foreign exchange loss
•Items included in other loss
•Certain non-recurring items
•Foreign exchange loss recorded in deferred tax expense
•The income and mining tax impact of items included in other loss
Net earnings have been adjusted, including the associated tax impact, for the group of costs in “other loss” on the consolidated statement of comprehensive income. Transactions within this grouping are: the fair value changes on non-hedged derivatives; loss on disposal of assets; and Turkish Projects care and maintenance and arbitration costs. The adjusted entries are also impacted for tax to the extent that the underlying entries are impacted for tax in the unadjusted net earnings.
The Company uses adjusted net earnings for its own internal purposes. Management’s internal budgets and forecasts and public guidance do not reflect the items which have been excluded from the determination of adjusted net earnings. Consequently, the presentation of adjusted net earnings enables shareholders to better understand the underlying operating performance of the core mining business through the eyes of management. Management periodically evaluates the components of adjusted net earnings based on an internal assessment of performance measures that are useful for evaluating the operating performance of our business and a review of the non-GAAP measures used by mining industry analysts and other mining companies.
Adjusted net earnings is intended to provide additional information only and does not have any standardized meaning under IFRS and may not be comparable to similar measures presented by other companies. It should not be considered in isolation or as a substitute for measures of performance prepared in accordance with IFRS. The measure is not necessarily indicative of operating profit or cash flows from operations as determined under IFRS. The following table reconciles this non-GAAP measure to the most directly comparable IFRS measure.
|
|
|
|
|
|
|
|
|
|
|
|
| (in millions) |
|
|
|
|
|
|
|
Three Months Ended March 31, |
|
|
|
2024 |
2023 |
|
| Net earnings |
|
|
$42.1 |
|
$48.4 |
|
|
| Adjustments: |
|
|
|
|
|
|
|
|
|
|
|
|
|
|
|
|
|
| Foreign exchange loss |
|
|
0.9 |
|
0.1 |
|
|
| Other loss |
|
|
4.8 |
|
1.3 |
|
|
| Unrealized foreign exchange loss (gain) recorded in deferred tax expense |
|
|
3.6 |
|
(4.2) |
|
|
| Other income and mining tax adjustments |
|
|
(0.2) |
|
(0.2) |
|
|
| Adjusted net earnings |
|
|
$51.2 |
|
$45.4 |
|
|
| Adjusted earnings per share - basic |
|
|
$0.13 |
|
$0.12 |
|
|
|
|
|
|
|
|
|
|
|
|
|
|
Cash Flow from Operating Activities before Changes in Working Capital and Cash Taxes
“Cash flow from operating activities before changes in working capital and cash taxes” is a non-GAAP performance measure that could provide an indication of the Company’s ability to generate cash flows from operations, and is calculated by adding back the change in working capital and taxes received to “Cash provided by (used in) operating activities” as presented on the Company’s consolidated statements of cash flows. “Cash flow from operating activities before changes in working capital” is a non-GAAP financial measure with no standard meaning under IFRS.
The following table reconciles the non-GAAP measure to the consolidated statements of cash flows.
|
|
|
|
|
|
|
|
|
|
|
| (in millions) |
|
|
|
|
|
|
Three Months Ended March 31, |
|
|
|
2024 |
2023 |
| Cash flow from operating activities |
|
|
$108.9 |
|
$94.3 |
|
| Add: Changes in working capital and taxes paid |
|
|
26.0 |
|
32.9 |
|
|
|
|
|
|
| Cash flow from operating activities before changes in working capital and taxes paid |
|
|
$134.9 |
|
$127.2 |
|
|
|
|
|
|
|
|
|
|
|
|
|
|
|
|
29
|
|
|
|
|
|
|
|
|
2024 Management’s Discussion and Analysis |
Company-wide Free Cash Flow
“Company-wide free cash flow" is a non-GAAP performance measure calculated from the consolidated operating cash flow, less consolidated mineral property, plant and equipment expenditures. The Company believes this to be a useful indicator of our ability to operate without reliance on additional borrowing or usage of existing cash company-wide. Company-wide free cash flow is intended to provide additional information only and does not have any standardized meaning under IFRS and may not be comparable to similar measures of performance presented by other mining companies. Company-wide free cash flow should not be considered in isolation or as a substitute for measures of performance prepared in accordance with IFRS.
|
|
|
|
|
|
|
|
|
|
|
| (in millions) |
|
|
|
|
|
|
Three Months Ended March 31, |
|
|
|
2024 |
2023 |
| Cash flow from operating activities |
|
|
$108.9 |
|
$94.3 |
|
| Less: mineral property, plant and equipment expenditures |
|
|
(84.5) |
|
(83.8) |
|
|
|
|
|
|
| Company-wide free cash flow |
|
|
$24.4 |
|
$10.5 |
|
Mine-site Free Cash Flow
"Mine-site free cash flow" is a non-GAAP financial performance measure calculated as cash flow from mine-site operating activities, less mineral property, plant and equipment expenditures. The Company believes this to be a useful indicator of our ability to operate without reliance on additional borrowing or usage of existing cash. Mine-site free cash flow is intended to provide additional information only and does not have any standardized meaning under IFRS and may not be comparable to similar measures of performance presented by other mining companies. Mine-site free cash flow should not be considered in isolation or as a substitute for measures of performance prepared in accordance with IFRS.
|
|
|
|
|
|
|
|
|
|
|
|
|
|
|
|
| Consolidated Mine-Site Free Cash Flow |
|
Three Months Ended March 31, |
|
|
|
2024 |
2023 |
| (in millions) |
|
|
|
|
| Cash flow from operating activities |
|
|
$108.9 |
|
$94.3 |
|
| Add: operating cash flow used by non-mine site activity |
|
|
20.4 |
|
18.4 |
|
| Cash flow from operating mine-sites |
|
|
$129.3 |
|
$112.7 |
|
|
|
|
|
|
| Mineral property, plant and equipment expenditure |
|
|
$84.5 |
|
$83.8 |
|
|
|
|
|
|
| Less: capital expenditures from development projects, and corporate |
|
|
(5.8) |
|
(3.7) |
|
|
|
|
|
|
| Capital expenditure and capital advances from mine-sites |
|
|
$78.7 |
|
$80.1 |
|
|
|
|
|
|
| Total mine-site free cash flow |
|
|
$50.6 |
|
$32.6 |
|
|
|
|
|
|
|
|
|
|
|
|
|
|
|
|
|
|
|
|
|
|
|
|
|
|
|
| Young-Davidson Mine-Site Free Cash Flow |
|
Three Months Ended March 31, |
|
|
|
2024 |
2023 |
| (in millions) |
|
|
|
|
| Cash flow from operating activities |
|
|
$34.8 |
|
$33.7 |
|
|
|
|
|
|
|
|
|
|
|
| Mineral property, plant and equipment expenditure |
|
|
(20.2) |
|
(17.4) |
|
| Mine-site free cash flow |
|
|
$14.6 |
|
$16.3 |
|
|
|
|
|
|
|
|
|
|
|
|
|
|
|
|
|
|
|
|
|
|
|
|
|
|
|
| Island Gold Mine-Site Free Cash Flow |
|
Three Months Ended March 31, |
|
|
|
2024 |
2023 |
| (in millions) |
|
|
|
|
| Cash flow from operating activities |
|
|
$40.9 |
|
$36.5 |
|
|
|
|
|
|
|
|
|
|
|
| Mineral property, plant and equipment expenditure |
|
|
(54.6) |
|
(57.0) |
|
| Mine-site free cash flow |
|
|
($13.7) |
|
($20.5) |
|
|
|
|
|
|
|
|
|
|
|
|
|
|
|
|
30
|
|
|
|
|
|
|
|
|
2024 Management’s Discussion and Analysis |
|
|
|
|
|
|
|
|
|
|
|
|
|
|
|
|
| Mulatos District Free Cash Flow |
|
Three Months Ended March 31, |
|
|
|
2023 |
2023 |
| (in millions) |
|
|
|
|
| Cash flow from operating activities |
|
|
$53.6 |
|
$42.5 |
|
|
|
|
|
|
|
|
|
|
|
| Mineral property, plant and equipment expenditure |
|
|
(3.9) |
|
(5.7) |
|
|
|
|
|
|
|
|
|
|
|
| Mine-site free cash flow |
|
|
$49.7 |
|
$36.8 |
|
|
|
|
|
|
|
|
|
|
|
|
|
|
|
|
|
|
|
|
|
|
|
|
|
|
Total Cash Costs per ounce
Total cash costs per ounce is a non-GAAP term typically used by gold mining companies to assess the level of gross margin available to the Company by subtracting these costs from the unit price realized during the period. This non-GAAP term is also used to assess the ability of a mining company to generate cash flow from operations. Total cash costs per ounce includes mining and processing costs plus applicable royalties, and net of by-product revenue and net realizable value adjustments. Total cash costs per ounce is exclusive of exploration costs.
Total cash costs per ounce is intended to provide additional information only and does not have any standardized meaning under IFRS and may not be comparable to similar measures presented by other mining companies. It should not be considered in isolation or as a substitute for measures of performance prepared in accordance with IFRS. The measure is not necessarily indicative of cash flow from operations under IFRS or operating costs presented under IFRS.
All-in Sustaining Costs per ounce and Mine-site All-in Sustaining Costs
The Company adopted an “all-in sustaining costs per ounce” non-GAAP performance measure in accordance with the World Gold Council published in June 2013. The Company believes the measure more fully defines the total costs associated with producing gold; however, this performance measure has no standardized meaning. Accordingly, there may be some variation in the method of computation of “all-in sustaining costs per ounce” as determined by the Company compared with other mining companies. In this context, “all-in sustaining costs per ounce” for the consolidated Company reflects total mining and processing costs, corporate and administrative costs, share-based compensation, exploration costs, sustaining capital, and other operating costs.
For the purposes of calculating "mine-site all-in sustaining costs" at the individual mine-sites, the Company does not include an allocation of corporate and administrative costs and share-based compensation, as detailed in the reconciliations below.
Sustaining capital expenditures are expenditures that do not increase annual gold ounce production at a mine site and excludes all expenditures at the Company’s development projects as well as certain expenditures at the Company’s operating sites that are deemed expansionary in nature. Non-sustaining capital expenditures are expenditures primarily incurred at development projects and costs related to major projects at existing operations, where the these projects will materially benefit the mine site. Capitalized exploration expenditures are expenditures that meet the IFRS definition for capitalization, and are incurred to further expand the known Mineral Reserve and Resource at existing operations or development projects. For each mine-site reconciliation, corporate and administrative costs, and non-site specific costs are not included in the all-in sustaining cost per ounce calculation.
All-in sustaining costs per gold ounce is intended to provide additional information only and does not have any standardized meaning under IFRS and may not be comparable to similar measures presented by other mining companies. It should not be considered in isolation or as a substitute for measures of performance prepared in accordance with IFRS.
The measure is not necessarily indicative of cash flow from operations under IFRS or operating costs presented under IFRS.
Total Cash Costs and All-in Sustaining Costs per Ounce Reconciliation Tables
The following tables reconciles these non-GAAP measures to the most directly comparable IFRS measures on a Company-wide and individual mine-site basis.
31
|
|
|
|
|
|
|
|
|
2024 Management’s Discussion and Analysis |
|
|
|
|
|
|
|
|
|
|
|
|
| Total Cash Costs and AISC Reconciliation - Company-wide |
|
|
|
Three Months Ended March 31, |
|
|
|
2024 |
2023 |
|
| (in millions, except ounces and per ounce figures) |
|
|
|
|
|
| Mining and processing |
|
|
$121.0 |
|
$106.4 |
|
|
| By-product credits |
|
|
(2.7) |
|
— |
|
|
| Royalties |
|
|
2.6 |
|
2.5 |
|
|
|
|
|
|
|
|
| Total cash costs |
|
|
120.9 |
|
108.9 |
|
|
| Gold ounces sold |
|
|
132,849 |
|
132,668 |
|
|
| Total cash costs per ounce |
|
|
$910 |
|
$821 |
|
|
|
|
|
|
|
|
| Total cash costs |
|
|
$120.9 |
|
$108.9 |
|
|
Corporate and administrative (1) |
|
|
7.9 |
|
6.7 |
|
|
Sustaining capital expenditures (2) |
|
|
26.5 |
|
26.9 |
|
|
| Share-based compensation |
|
|
9.9 |
|
11.1 |
|
|
| Sustaining exploration |
|
|
0.8 |
|
0.7 |
|
|
| Accretion of decommissioning liabilities |
|
|
2.0 |
|
1.7 |
|
|
|
|
|
|
|
|
| Total all-in sustaining costs |
|
|
$168.0 |
|
$156.0 |
|
|
| Gold ounces sold |
|
|
132,849 |
|
132,668 |
|
|
| All-in sustaining costs per ounce |
|
|
$1,265 |
|
$1,176 |
|
|
|
|
|
|
|
|
|
|
|
|
|
|
|
|
|
|
|
|
(1)Corporate and administrative expenses exclude expenses incurred at development properties.
(2)Sustaining capital expenditures are defined as those expenditures which do not increase annual gold ounce production at a mine site and exclude all expenditures at growth projects and certain expenditures at operating sites which are deemed expansionary in nature. Total sustaining capital expenditures for the period are as follows:
|
|
|
|
|
|
|
|
|
|
|
|
|
|
Three Months Ended March 31, |
|
|
|
2024 |
2023 |
|
| (in millions) |
|
|
|
|
|
| Capital expenditures per cash flow statement |
|
|
$84.5 |
|
$83.8 |
|
|
| Less: non-sustaining capital expenditures at: |
|
|
|
|
|
| Young-Davidson |
|
|
(8.6) |
|
(4.2) |
|
|
| Island Gold |
|
|
(41.1) |
|
(45.6) |
|
|
| Mulatos District |
|
|
(2.5) |
|
(3.4) |
|
|
|
|
|
|
|
|
| Corporate and other |
|
|
(5.8) |
|
(3.7) |
|
|
| Sustaining capital expenditures |
|
|
$26.5 |
|
$26.9 |
|
|
|
|
|
|
|
|
|
|
|
|
|
|
|
|
|
|
|
|
|
|
|
|
|
|
|
|
|
|
|
|
|
|
|
|
|
|
|
|
|
|
|
|
|
|
|
|
|
|
|
|
|
|
|
| Young-Davidson Total Cash Costs and Mine-site AISC Reconciliation |
|
|
|
|
Three Months Ended March 31, |
|
|
|
2024 |
2023 |
| (in millions, except ounces and per ounce figures) |
|
|
|
|
| Mining and processing |
|
|
$46.6 |
|
$41.6 |
|
| By-product credits |
|
|
(0.6) |
|
— |
|
| Royalties |
|
|
1.3 |
|
1.4 |
|
|
|
|
|
|
| Total cash costs |
|
|
$47.3 |
|
$43.0 |
|
| Gold ounces sold |
|
|
39,810 |
|
45,676 |
|
| Total cash costs per ounce |
|
|
$1,188 |
|
$941 |
|
|
|
|
|
|
| Total cash costs |
|
|
$47.3 |
|
$43.0 |
|
| Sustaining capital expenditures |
|
|
11.6 |
|
13.2 |
|
|
|
|
|
|
| Accretion of decommissioning liabilities |
|
|
0.1 |
|
0.1 |
|
| Total all-in sustaining costs |
|
|
$59.0 |
|
$56.3 |
|
| Gold ounces sold |
|
|
39,810 |
|
45,676 |
|
| Mine-site all-in sustaining costs per ounce |
|
|
$1,482 |
|
$1,233 |
|
|
|
|
|
|
|
|
|
|
|
|
|
|
|
|
32
|
|
|
|
|
|
|
|
|
2024 Management’s Discussion and Analysis |
|
|
|
|
|
|
|
|
|
|
|
| Island Gold Total Cash Costs and Mine-site AISC Reconciliation |
|
|
|
|
Three Months Ended March 31, |
|
|
|
2024 |
2023 |
| (in millions, except ounces and per ounce figures) |
|
|
|
|
| Mining and processing |
|
|
$23.6 |
|
$20.6 |
|
| By-product credits |
|
|
(0.2) |
|
— |
|
| Royalties |
|
|
0.7 |
|
0.6 |
|
|
|
|
|
|
| Total cash costs |
|
|
$24.1 |
|
$21.2 |
|
| Gold ounces sold |
|
|
34,130 |
|
33,727 |
|
| Total cash costs per ounce |
|
|
$706 |
|
$629 |
|
|
|
|
|
|
| Total cash costs |
|
|
$24.1 |
|
$21.2 |
|
| Sustaining capital expenditures |
|
|
13.5 |
|
11.4 |
|
|
|
|
|
|
| Accretion of decommissioning liabilities |
|
|
0.1 |
|
0.1 |
|
| Total all-in sustaining costs |
|
|
$37.7 |
|
$32.7 |
|
| Gold ounces sold |
|
|
34,130 |
|
33,727 |
|
| Mine-site all-in sustaining costs per ounce |
|
|
$1,105 |
|
$970 |
|
|
|
|
|
|
|
|
|
|
|
|
|
|
|
|
|
|
|
|
|
|
|
|
|
|
|
|
|
|
|
|
| Mulatos District Total Cash Costs and Mine-site AISC Reconciliation |
|
|
|
|
Three Months Ended March 31, |
|
|
|
2024 |
2023 |
| (in millions, except ounces and per ounce figures) |
|
|
|
|
| Mining and processing |
|
|
$50.8 |
|
$44.2 |
|
| By-product credits |
|
|
(1.9) |
|
— |
|
| Royalties |
|
|
0.6 |
|
0.5 |
|
|
|
|
|
|
| Total cash costs |
|
|
$49.5 |
|
$44.7 |
|
| Gold ounces sold |
|
|
58,909 |
|
53,265 |
|
| Total cash costs per ounce |
|
|
$840 |
|
$839 |
|
|
|
|
|
|
| Total cash costs |
|
|
$49.5 |
|
$44.7 |
|
| Sustaining capital expenditures |
|
|
1.4 |
|
2.3 |
|
| Sustaining exploration |
|
|
0.6 |
|
0.2 |
|
| Accretion of decommissioning liabilities |
|
|
1.8 |
|
1.5 |
|
| Total all-in sustaining costs |
|
|
$53.3 |
|
$48.7 |
|
| Gold ounces sold |
|
|
58,909 |
|
53,265 |
|
| Mine-site all-in sustaining costs per ounce |
|
|
$905 |
|
$914 |
|
|
|
|
|
|
|
|
|
|
|
|
|
|
|
|
EBITDA
EBITDA represents net earnings before impairment charges, interest, taxes, depreciation, and amortization. EBITDA is an indicator of the Company’s ability to generate liquidity by producing operating cash flow to fund working capital needs, service debt obligations, and fund capital expenditures.
EBITDA does not have any standardized meaning under IFRS and may not be comparable to similar measures presented by other mining companies. It should not be considered in isolation or as a substitute for measures of performance prepared in accordance with IFRS.
33
|
|
|
|
|
|
|
|
|
2024 Management’s Discussion and Analysis |
The following is a reconciliation of EBITDA to the consolidated financial statements:
|
|
|
|
|
|
|
|
|
|
|
| (in millions) |
|
|
|
|
|
|
Three Months Ended March 31, |
|
|
|
2024 |
2023 |
| Net earnings |
|
|
$42.1 |
|
$48.4 |
|
| Add back: |
|
|
|
|
|
|
|
|
|
|
|
|
|
|
| Finance expense |
|
|
0.1 |
|
1.4 |
|
| Amortization |
|
|
50.0 |
|
46.3 |
|
|
|
|
|
|
|
|
|
|
|
| Deferred income tax expense |
|
|
16.5 |
|
0.4 |
|
| Current income tax expense |
|
|
17.0 |
|
23.4 |
|
| EBITDA |
|
|
$125.7 |
|
$119.9 |
|
|
|
|
|
|
|
|
|
|
|
|
|
|
|
|
|
|
|
|
|
|
|
|
|
|
Additional GAAP Measures
Additional GAAP measures are presented on the face of the Company’s consolidated statements of comprehensive income (loss) and are not meant to be a substitute for other subtotals or totals presented in accordance with IFRS, but rather should be evaluated in conjunction with such IFRS measures. The following additional GAAP measures are used and are intended to provide an indication of the Company’s mine and operating performance:
•Earnings from operations - represents the amount of earnings before net finance income/expense, foreign exchange gain/loss, other income/loss, loss on redemption of senior secured notes and income tax expense
Accounting Estimates, Policies and Changes
The preparation of the Company's consolidated financial statements in accordance with IFRS requires management to make estimates and judgments that affect the amounts reported in the consolidated financial statements and accompanying notes. The
critical estimates and judgments applied in the preparation of the Company's condensed interim consolidated financial statements for the three months ended March 31, 2024 are consistent with those used in the Company's consolidated financial statements for the year ended December 31, 2023.
Accounting Policies and Changes
The accounting policies applied in the condensed interim consolidated financial statements for the three months ended March 31, 2024 are consistent with those used in the Company's consolidated financial statements for the year ended December 31, 2023 with the exception of the following:
The Company adopted the following accounting standards and amendments to accounting standards, effective January 1, 2024:
On January 23, 2020, the IASB issued amendments to IAS 1 Presentation of Financial Statements, to clarify the classification of liabilities as current or non-current. For the purposes of non-current classification, the amendments removed the requirement for a right to defer settlement or roll over of a liability for at least twelve months to be unconditional. Instead, such a right must have substance and exist at the end of the reporting period. The amendments also clarify how a company classifies a liability that includes a counterparty conversion option. The amendments state that:
•settlement of a liability includes transferring a company’s own equity instruments to the counterparty, and
•when classifying liabilities as current or non-current a company can ignore only those conversion options that are recognized as equity
The amendments have been adopted by the Company, however the amendments did not result in any changes to the financial statements.
Internal Control over Financial Reporting
Management is responsible for the design, implementation and operating effectiveness of internal control over financial reporting. Under the supervision of the Chief Executive Officer and Chief Financial Officer, management evaluated the design and effectiveness of the Company’s internal control over financial reporting as of March 31, 2024. In making the assessment, management used the criteria set forth in Internal Control - Integrated Framework (2013), issued by the Committee of Sponsoring Organizations of the Treadway Commission. Based on a review of internal control procedures at the end of the period covered by this MD&A, management determined internal control over financial reporting was appropriately designed as at March 31, 2024.
34
|
|
|
|
|
|
|
|
|
2024 Management’s Discussion and Analysis |
Changes in Internal Control over Financial Reporting
There were no material changes in the Company’s internal control over financial reporting that occurred during the three months ended March 31, 2024 that have materially affected, or are reasonably likely to materially affect, the Company’s internal control over financial reporting.
Disclosure Controls
Management is also responsible for the design and effectiveness of disclosure controls and procedures. The Company’s Chief Executive Officer and Chief Financial Officer have each evaluated the effectiveness of the Company’s disclosure controls and procedures as at March 31, 2024 and have concluded that these disclosure controls and procedures were appropriately designed as at March 31, 2024.
Limitations of Controls and Procedures
The Company’s management, including the Chief Executive Officer and Chief Financial Officer, believe that internal controls over financial reporting and disclosure controls and procedures, no matter how well designed and operated, have inherent limitations. Therefore, even those systems determined to be properly designed and effective can provide only reasonable assurance that the objectives of the control system are met.
Cautionary Note to United States Investors
Measured, Indicated and Inferred Resources: All resource and reserve estimates included in this MD&A or documents referenced in this MD&A have been prepared in accordance with Canadian National Instrument 43-101 - Standards of Disclosure for Mineral Projects ("NI 43-101") and the Canadian Institute of Mining, Metallurgy and Petroleum (the "CIM") - CIM Definition Standards on Mineral Resources and Mineral Reserves, adopted by the CIM Council, as amended (the "CIM Standards"). NI 43-101 is a rule developed by the Canadian Securities Administrators, which established standards for all public disclosure an issuer makes of scientific and technical information concerning mineral projects. Mining disclosure in the United States was previously required to comply with SEC Industry Guide 7 (“SEC Industry Guide 7”) under the United States Securities Exchange Act of 1934, as amended. The U.S. Securities and Exchange Commission (the “SEC”) has adopted final rules, to replace SEC Industry Guide 7 with new mining disclosure rules under sub-part 1300 of Regulation S-K of the U.S. Securities Act (“Regulation S-K 1300”) which became mandatory for U.S. reporting companies beginning with the first fiscal year commencing on or after January 1, 2021. Under Regulation S-K 1300, the SEC now recognizes estimates of “Measured Mineral Resources”, “Indicated Mineral Resources” and “Inferred Mineral Resources”. In addition, the SEC has amended its definitions of “Proven Mineral Reserves” and “Probable Mineral Reserves” to be substantially similar to international standards.
Investors are cautioned that while the above terms are “substantially similar” to CIM Definitions, there are differences in the definitions under Regulation S-K 1300 and the CIM Standards. Accordingly, there is no assurance any mineral reserves or mineral resources that the Company may report as “proven mineral reserves”, “probable mineral reserves”, “measured mineral resources”, “indicated mineral resources” and “inferred mineral resources” under NI 43-101 would be the same had the Company prepared the mineral reserve or mineral resource estimates under the standards adopted under Regulation S-K 1300. U.S. investors are also cautioned that while the SEC recognizes “measured mineral resources”, “indicated mineral resources” and “inferred mineral resources” under Regulation S-K 1300, investors should not assume that any part or all of the mineralization in these categories will ever be converted into a higher category of mineral resources or into mineral reserves. Mineralization described using these terms has a greater degree of uncertainty as to its existence and feasibility than mineralization that has been characterized as reserves. Accordingly, investors are cautioned not to assume that any measured mineral resources, indicated mineral resources, or inferred mineral resources that the Company reports are or will be economically or legally mineable.
International Financial Reporting Standards: The consolidated financial statements of the Company have been prepared by management in accordance with International Financial Reporting Standards, as issued by the International Accounting Standards Board (note 2 and 3 to the consolidated financial statements for the year ended December 31, 2023). These accounting principles differ in certain material respects from accounting principles generally accepted in the United States of America. The Company’s reporting currency is the United States dollar unless otherwise noted.
35
|
|
|
|
|
|
|
|
|
2024 Management’s Discussion and Analysis |
Cautionary Note Regarding Forward-Looking Statements
This MD&A contains or incorporates by reference “forward-looking statements” and “forward-looking information” as defined under applicable Canadian and U.S. securities legislation. All statements, other than statements of historical fact, which address events, results, outcomes or developments that the Company expects to occur are, or may be deemed, to be, forward-looking statements and are based on expectations, estimates and projects as at the date of this MD&A. Forward-looking statements are generally, but not always, identified by the use of forward-looking terminology such as "expect", “assume”, "believe", "anticipate", "intend", "objective", "estimate", “potential”, "forecast", "budget", “target”, "goal", “on track”, "on pace", “outlook”, “continue”, “ongoing”, “plan” or variations of such words and phrases and similar expressions or statements that certain actions, events or results “may”, “could”, “would”, “might” or “will” be taken, occur or be achieved or the negative connotation of such terms.
Such statements include, but may not be limited to, guidance and expectations pertaining to: gold production, production potential, gold grades, gold prices, free cash flow, total cash costs, all-in sustaining costs, mine-site all-in sustaining costs, capital expenditures, total sustaining and growth capital, capitalized exploration, future fluctuations in the Company’s effective tax rate and other statements related to the payment of taxes, including cash tax payments in Mexico; achieving annual guidance; expected completion of the acquisition of Argonaut Gold Inc. and its Magino mine by Alamos and the expectation that the integration of the Company’s Island Gold mine with the Magino mine will create one of the largest and lowest cost gold mines in Canada, unlock significant value with pre-tax synergies, result in capital savings, operating savings and synergies and de-risking of the Phase 3+ Expansion project at Island Gold, increase Company-wide gold production and longer term production potential and create opportunities for further expansions of the combined Island Gold and Magino operations; the intended spinout of Argonaut’s assets in the United States and Mexico and the creation of a new junior gold producer (SpinCo); expected timing of closing of the Argonaut acquisition transaction; increases to production, value of operation and decreases to costs resulting from intended completion of the Phase 3+ Expansion at Island Gold; intended infrastructure investments in, method of funding for, and timing of the completion of, the Phase 3+ Expansion; timing of construction decision for the Lynn Lake project; the expectation that the Lynn Lake project will be an attractive, low-cost long-life growth project in Canada with significant exploration upside; expenditures on the development of the Lynn Lake project; exploration potential, budgets, focuses, programs, targets and projected exploration results; returns to stakeholders; potential for further growth from PDA, a new development plan for PDA and the expected timing of its completion; mine life, including an anticipated mine life extension at Mulatos; Mineral Reserve life; Mineral Reserve and Resource grades; reserve and resource estimates; mining and milling rates; the Company’s approach to reduction of its environmental footprint, community relations and governance; as well as other general information as to strategy, plans or future financial or operating performance, such as the Company’s expansion plans, project timelines, production plans and expected sustainable productivity increases, expected increases in mining activities and corresponding cost efficiencies, forecasted cash shortfalls and the Company’s ability to fund them, cost estimates, sufficiency of working capital for future commitments and other statements that express management’s expectations or estimates of future plans and performance.
Alamos cautions that forward-looking statements are necessarily based upon a number of factors and assumptions that, while considered reasonable by the Company at the time of making such statements, are inherently subject to significant business, economic, technical, legal, political and competitive uncertainties and contingencies. Known and unknown factors could cause actual results to differ materially from those projected in the forward-looking statements and undue reliance should not be placed on such statements and information.
Risk factors that may affect Alamos’ ability to achieve the expectations set forth in the forward-looking statements in this document include, but are not limited to: changes to current estimates of mineral reserves and resources; changes to production estimates (which assume accuracy of projected ore grade, mining rates, recovery timing and recovery rate estimates which may be impacted by unscheduled maintenance, weather issues, labour and contractor availability and other operating or technical difficulties); operations may be exposed to illnesses, diseases, epidemics and pandemics, including any ongoing effects and potential further effects of COVID-19; the impact of any illness, disease, epidemic or pandemic on the broader market and the trading price of the Company's shares; provincial and federal orders or mandates (including with respect to mining operations generally or auxiliary businesses or services required for the Company’s operations) in Canada, Mexico, the United States and Türkiye; the duration of any regulatory responses to any illness, disease, epidemic or pandemic; government and the Company’s attempts to reduce the spread of any illness, disease, epidemic or pandemic which may affect many aspects of the Company's operations including the ability to transport personnel to and from site, contractor and supply availability and the ability to sell or deliver gold doré bars; fluctuations in the price of gold or certain other commodities such as, diesel fuel, natural gas, and electricity; changes in foreign exchange rates (particularly the Canadian Dollar, Mexican peso, U.S. dollar and Turkish lira); the impact of inflation; changes in the Company's credit rating; any decision to declare a quarterly dividend; employee and community relations; not receiving the requisite approvals for completion of the transaction pursuant to which Alamos would acquire Argonaut Gold Inc.; litigation and administrative proceedings (including but not limited to the investment treaty claim announced on April 20, 2021 against the Republic of Türkiye by the Company’s wholly-owned Netherlands subsidiaries, Alamos Gold Holdings Coöperatief U.A, and Alamos Gold Holdings B.V., the application for judicial review of the positive Decision Statement issued by the Department of Environment and Climate Change Canada commenced by the Mathias Colomb Cree Nation (MCCN) in respect of the Lynn Lake project and the MCCN’s corresponding internal appeal of the Environment Act Licenses issued by the Province of Manitoba for the project); disruptions affecting operations; risks associated with the startup of new mines; availability of and increased costs associated with mining inputs and labour; delays with the Phase 3+ expansion project at the Island Gold mine; court or other administrative decisions impacting the Company’s approved Environmental Impact Study and/or issued project permits, construction decisions and any development of the Lynn Lake project; delays in the development or updating of mine plans; changes with respect to the intended method of accessing and mining the deposit at PDA and changes related to the intended method of processing any ore from the deposit of PDA; the risk that the Company’s mines may not perform as planned; uncertainty with the Company’s ability to secure additional capital to execute its business plans; the speculative nature of mineral exploration and development, including the risks of obtaining and maintaining necessary licenses and permits, including the necessary licenses, permits, authorizations and/or approvals from the appropriate regulatory authorities for the Company’s development stage and operating assets; labour and contractor availability (and being able to secure the same on favourable terms); contests over title to properties; expropriation or nationalization of property; inherent risks and hazards associated with mining and mineral processing including environmental hazards, industrial hazards, industrial accidents, unusual or unexpected formations, pressures and cave-ins; changes in national and local government legislation, controls or regulations in Canada, Mexico, Türkiye, the United States and other jurisdictions in which the Company does or may carry on business in the future; increased costs and risks related to the potential impact of climate change; failure to comply with environmental and health and safety laws and regulations; disruptions in the maintenance or provision of required infrastructure and information technology systems; risk of loss due to sabotage, protests and other civil disturbances; the impact of global liquidity and credit availability and the values of assets and liabilities based on projected future cash flows; risks arising from holding derivative instruments; and business opportunities that may be pursued by the Company.
36
|
|
|
|
|
|
|
|
|
2024 Management’s Discussion and Analysis |
The litigation against the Republic of Türkiye, described above, results from the actions of the Turkish government in respect of the Company’s projects in the Republic of Türkiye. Such litigation is a mitigation effort and may not be effective or successful. If unsuccessful, the Company’s projects in Türkiye may be subject to resource nationalism and further expropriation; the Company may lose any remaining value of its assets and gold mining projects in Türkiye and its ability to operate in Türkiye. Even if the litigation is successful, there is no certainty as to the quantum of any damages award or recovery of all, or any, legal costs. Any resumption of activities in Türkiye, or even retaining control of its assets and gold mining projects in Türkiye can only result from agreement with the Turkish government. The investment treaty claim described in this MD&A may have an impact on foreign direct investment in the Republic of Türkiye which may result in changes to the Turkish economy, including but not limited to high rates of inflation and fluctuation of the Turkish Lira which may also affect the Company’s relationship with the Turkish government, the Company’s ability to effectively operate in Türkiye, and which may have a negative effect on overall anticipated project values.
Additional risk factors and details with respect to risk factors that may affect the Company’s ability to achieve the expectations set forth in the forward-looking statements contained in this MD&A are set out in the Company's latest 40-F/Annual Information Form under the heading “Risk Factors”, which is available on the SEDAR+ website at www.sedarplus.ca or on EDGAR at www.sec.gov. The foregoing should be reviewed in conjunction with the information, risk factors and assumptions found in this MD&A.
The Company disclaims any intention or obligation to update or revise any forward-looking statements whether as a result of new information, future events or otherwise, except as required by applicable law.
Qualified Persons
Chris Bostwick, FAusIMM, Alamos’ Senior Vice President, Technical Services, who is a qualified person within the meaning of National Instrument 43-101 ("Qualified Person"), has reviewed and approved the scientific and technical information contained in this MD&A.
37

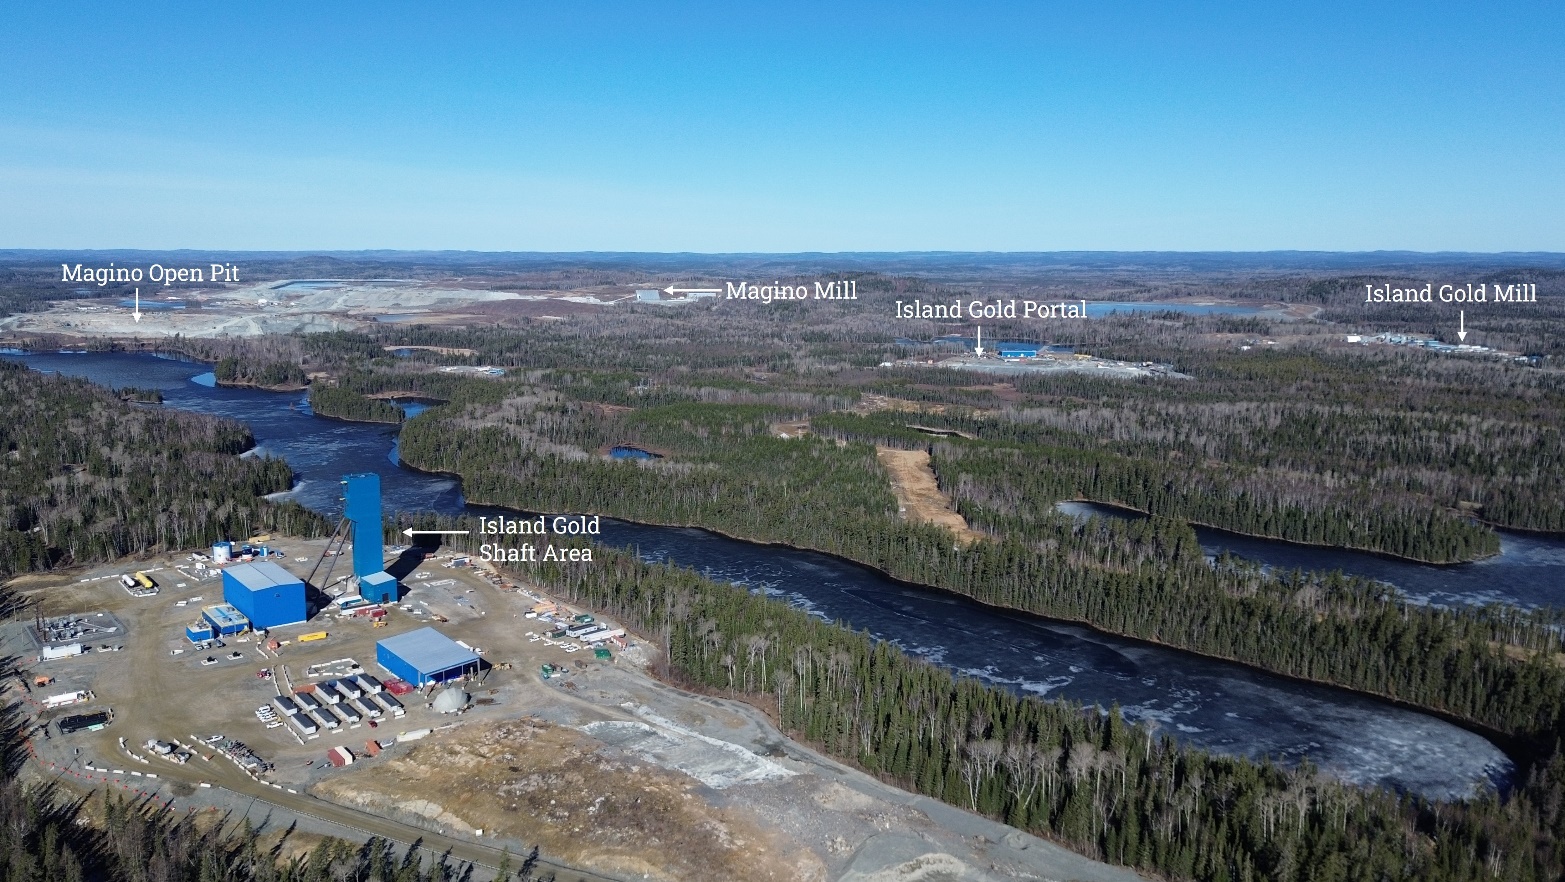

 ALAMOS GOLD INC.