| Algonquin Power & Utilities Corp. | ||
| Exhibit | Description | ||||
| Unaudited Financial Statements for the quarter ended June 30, 2025 | |||||
| Management's Discussion & Analysis for quarter ended June 30, 2025 | |||||
| Certification of Chief Executive Officer | |||||
| Certification of Chief Financial Officer | |||||
| Earnings Press Release for the quarter ended June 30, 2025 | |||||
| Q3 2025 Common Share & Preferred Share Dividend Press Release | |||||
| ALGONQUIN POWER & UTILITIES CORP. | |||||
| (registrant) | |||||
| Date: August 8, 2025 | By: /s/ Brian Chin |
||||
| Name: Brian Chin | |||||
| Title: Interim Chief Financial Officer and Vice President, Investor Relations | |||||
| Three months ended | Six months ended | |||||||||||||||||||
| (millions of U.S. dollars, except per share amounts) | June 30 | June 30 | ||||||||||||||||||
| 2025 | 2024 | 2025 | 2024 | |||||||||||||||||
| Revenue | ||||||||||||||||||||
| Regulated electricity distribution | $ | 292.0 | $ | 304.2 | $ | 622.4 | $ | 610.1 | ||||||||||||
| Regulated natural gas distribution | 109.0 | 94.2 | 355.7 | 328.2 | ||||||||||||||||
| Regulated water reclamation and distribution | 103.3 | 92.8 | 193.7 | 177.8 | ||||||||||||||||
| Non-regulated energy sales | 10.2 | 9.6 | 19.7 | 18.3 | ||||||||||||||||
| Other revenue | 13.3 | 14.5 | 28.7 | 27.1 | ||||||||||||||||
| 527.8 | 515.3 | 1,220.2 | 1,161.5 | |||||||||||||||||
| Expenses | ||||||||||||||||||||
| Operating expenses | 217.4 | 214.1 | 426.7 | 420.6 | ||||||||||||||||
| Regulated electricity purchased | 78.3 | 81.7 | 174.0 | 179.7 | ||||||||||||||||
| Regulated natural gas purchased | 32.8 | 22.9 | 130.5 | 118.9 | ||||||||||||||||
| Regulated water purchased | 7.7 | 4.3 | 12.6 | 8.2 | ||||||||||||||||
| Other cost of sales | 5.8 | 6.3 | 12.5 | 10.9 | ||||||||||||||||
| Depreciation and amortization | 107.0 | 102.6 | 202.3 | 196.7 | ||||||||||||||||
| Loss (gain) on foreign exchange | 14.0 | (2.1) | 17.9 | (2.6) | ||||||||||||||||
| 463.0 | 429.8 | 976.5 | 932.4 | |||||||||||||||||
| Operating income | 64.8 | 85.5 | 243.7 | 229.1 | ||||||||||||||||
Interest expense (note 7) |
(67.8) | (93.2) | (139.2) | (182.8) | ||||||||||||||||
Income from long-term investments (note 6) |
6.7 | 193.7 | 9.5 | 69.7 | ||||||||||||||||
Other income (note 5) |
5.7 | 6.0 | 11.3 | 12.7 | ||||||||||||||||
Other net losses (note 12) |
(0.5) | (6.0) | (14.2) | (10.4) | ||||||||||||||||
Pension and other post-employment non-service costs (note 8) |
(2.8) | (4.0) | (0.5) | (7.4) | ||||||||||||||||
Gain (loss) on derivative financial instruments (note 17(b)(iv)) |
0.3 | 0.1 | (6.9) | 0.2 | ||||||||||||||||
| (58.4) | 96.6 | (140.0) | (118.0) | |||||||||||||||||
| Earnings before income taxes | 6.4 | 182.1 | 103.7 | 111.1 | ||||||||||||||||
Income tax expense from continuing operations (note 11) |
||||||||||||||||||||
| Current | (3.6) | (8.3) | (9.5) | (13.4) | ||||||||||||||||
| Deferred | (3.4) | (17.0) | (17.3) | (13.5) | ||||||||||||||||
| (7.0) | (25.3) | (26.8) | (26.9) | |||||||||||||||||
| Earnings (loss) from continuing operations | (0.6) | 156.8 | 76.9 | 84.2 | ||||||||||||||||
Earnings (loss) from discontinued operations, net of tax (note 18) |
6.7 | 2.2 | 8.1 | (45.5) | ||||||||||||||||
| Net earnings | 6.1 | 159.0 | 85.0 | 38.7 | ||||||||||||||||
| Net effect of non-controlling interest from continuing operations | 18.0 | 23.3 | 35.9 | 39.1 | ||||||||||||||||
Net effect of non-controlling interest from discontinued operations (note 18) |
— | 18.4 | — | 33.8 | ||||||||||||||||
| Net earnings attributable to shareholders of Algonquin Power & Utilities Corp. | $ | 24.1 | $ | 200.7 | $ | 120.9 | $ | 111.6 | ||||||||||||
Series A Shares and Series D Shares dividend (note 9) |
2.6 | 2.7 | 5.2 | 5.1 | ||||||||||||||||
| Net earnings attributable to common shareholders of Algonquin Power & Utilities Corp. | $ | 21.5 | $ | 198.0 | $ | 115.7 | $ | 106.5 | ||||||||||||
Basic and diluted net earnings per share from continuing operations (note 13) |
$ | 0.02 | $ | 0.26 | $ | 0.14 | $ | 0.17 | ||||||||||||
Basic and diluted net earnings (loss) per share from discontinued operations (note 13) |
$ | 0.01 | $ | 0.02 | $ | 0.01 | $ | (0.02) | ||||||||||||
Basic and diluted net earnings per share (note 13) |
$ | 0.03 | $ | 0.28 | $ | 0.15 | $ | 0.15 | ||||||||||||
| Three months ended | Six months ended | ||||||||||||||||||||||
| (millions of U.S. dollars) | June 30 | June 30 | |||||||||||||||||||||
| 2025 | 2024 | 2025 | 2024 | ||||||||||||||||||||
| Net earnings | $ | 6.1 | $ | 159.0 | $ | 85.0 | $ | 38.7 | |||||||||||||||
| Other comprehensive income (loss) ("OCI"): | |||||||||||||||||||||||
Foreign currency translation adjustment, net of tax expense of $nil and $nil (2024 - tax expense of $1.3 and $3.2) (notes 17(b)(iii) and 17(b)(iv)) |
16.3 | 10.9 | 48.0 | 4.4 | |||||||||||||||||||
Change in fair value of cash flow hedges, net of tax recovery of $0.4 and $0.5 (2024 - tax expense of $2.2 and $7.0) (note 17(b)(ii)) |
(2.3) | 29.2 | (23.2) | 38.7 | |||||||||||||||||||
Change in pension and other post-employment benefits, net of tax recovery of $0.4 and $0.7 (2024 - tax recovery of $0.4 and $1.8) |
(1.9) | (1.0) | (2.5) | (5.2) | |||||||||||||||||||
OCI, net of tax (note 10) |
12.1 | 39.1 | 22.3 | 37.9 | |||||||||||||||||||
Derecognition on sale of the renewable energy business (note 18) |
— | — | (71.6) | — | |||||||||||||||||||
| Comprehensive income | 18.2 | 198.1 | 35.7 | 76.6 | |||||||||||||||||||
| Comprehensive loss attributable to the non-controlling interests | (18.0) | (42.0) | (35.9) | (73.9) | |||||||||||||||||||
| Comprehensive income attributable to shareholders of Algonquin Power & Utilities Corp. | $ | 36.2 | $ | 240.1 | $ | 71.6 | $ | 150.5 | |||||||||||||||
| (millions of U.S. dollars) | June 30, | December 31, | |||||||||
| 2025 | 2024 | ||||||||||
| ASSETS | |||||||||||
| Current assets: | |||||||||||
| Cash and cash equivalents | $ | 54.3 | $ | 34.8 | |||||||
Trade and other receivables, net (note 4) |
480.4 | 422.6 | |||||||||
| Fuel and natural gas in storage | 34.0 | 43.7 | |||||||||
| Supplies and consumables inventory | 180.1 | 179.9 | |||||||||
Regulatory assets (note 5) |
189.0 | 194.9 | |||||||||
| Prepaid expenses | 57.5 | 68.8 | |||||||||
Derivative instruments (note 17) |
10.0 | 11.1 | |||||||||
| Other assets | 7.5 | 12.8 | |||||||||
Assets held for sale (note 18) |
— | 166.5 | |||||||||
| 1,012.8 | 1,135.1 | ||||||||||
| Property, plant and equipment, net | 9,589.8 | 9,450.1 | |||||||||
| Intangible assets, net | 69.5 | 69.1 | |||||||||
| Goodwill | 1,318.7 | 1,312.2 | |||||||||
Regulatory assets (note 5) |
1,166.7 | 1,126.1 | |||||||||
Long-term investments (note 6) |
215.0 | 67.8 | |||||||||
Derivative instruments (note 17) |
71.2 | 97.4 | |||||||||
| Deferred income taxes | 24.3 | 11.2 | |||||||||
| Other assets | 225.4 | 163.6 | |||||||||
Assets held for sale (note 18) |
— | 3,529.1 | |||||||||
| $ | 13,693.4 | $ | 16,961.7 | ||||||||
| (millions of U.S. dollars) | June 30, | December 31, | |||||||||
| 2025 | 2024 | ||||||||||
| LIABILITIES AND EQUITY | |||||||||||
| Current liabilities: | |||||||||||
| Accounts payable | $ | 89.9 | $ | 164.2 | |||||||
| Accrued liabilities | 372.7 | 503.3 | |||||||||
| Dividends payable | 50.0 | 49.7 | |||||||||
Regulatory liabilities (note 5) |
71.9 | 76.7 | |||||||||
Long-term debt (note 7) |
308.2 | 491.7 | |||||||||
| Other long-term liabilities | 16.6 | 36.3 | |||||||||
Derivative instruments (note 17) |
0.9 | 1.9 | |||||||||
| Other liabilities | 16.6 | 20.7 | |||||||||
Liabilities associated with assets held for sale (note 18) |
— | 153.0 | |||||||||
| 926.8 | 1,497.5 | ||||||||||
Long-term debt (note 7) |
6,020.6 | 6,207.0 | |||||||||
Regulatory liabilities (note 5) |
548.2 | 559.6 | |||||||||
| Deferred income taxes | 680.1 | 577.2 | |||||||||
Derivative instruments (note 17) |
11.2 | 17.5 | |||||||||
| Pension and other post-employment benefits obligation | 62.7 | 73.6 | |||||||||
| Other long-term liabilities | 317.6 | 273.8 | |||||||||
Liabilities associated with assets held for sale (note 18) |
— | 1,574.3 | |||||||||
| 7,640.4 | 9,283.0 | ||||||||||
| Redeemable non-controlling interests | — | 5.0 | |||||||||
| Equity: | |||||||||||
| Preferred shares | 184.3 | 184.3 | |||||||||
Common shares (note 9(a)) |
7,400.1 | 7,391.3 | |||||||||
| Additional paid-in capital | (19.4) | (19.2) | |||||||||
| Deficit | (2,915.1) | (2,929.9) | |||||||||
Accumulated other comprehensive income ("AOCI") (note 10) |
32.1 | 81.4 | |||||||||
| Total equity attributable to shareholders of Algonquin Power & Utilities Corp. | 4,682.0 | 4,707.9 | |||||||||
| Non-controlling interests | |||||||||||
| Non-controlling interests - tax equity partnership units | 366.0 | 1,099.3 | |||||||||
| Other non-controlling interests | 78.2 | 369.0 | |||||||||
| 444.2 | 1,468.3 | ||||||||||
| Total equity | 5,126.2 | 6,176.2 | |||||||||
Commitments and contingencies (note 15) |
|||||||||||
Subsequent events (notes 7(a), 7(b) and 7(c)) |
|||||||||||
| $ | 13,693.4 | $ | 16,961.7 | ||||||||
|
(millions of U.S. dollars)
For the three months ended June 30, 2025
|
|||||||||||||||||||||||||||||||||||||||||
| Algonquin Power & Utilities Corp. Shareholders | |||||||||||||||||||||||||||||||||||||||||
| Common shares |
Preferred shares |
Additional paid-in capital |
Deficit | AOCI | Non- controlling interests |
Total | |||||||||||||||||||||||||||||||||||
| Balance, March 31, 2025 | $ | 7,398.6 | $ | 184.3 | $ | (22.6) | $ | (2,886.2) | $ | 20.0 | $ | 455.5 | $ | 5,149.6 | |||||||||||||||||||||||||||
| Net earnings (loss) | — | — | — | 24.1 | — | (18.0) | 6.1 | ||||||||||||||||||||||||||||||||||
| OCI | — | — | — | — | 12.1 | — | 12.1 | ||||||||||||||||||||||||||||||||||
| Dividends declared and distributions to non-controlling interests | — | — | — | (53.1) | — | (0.2) | (53.3) | ||||||||||||||||||||||||||||||||||
Contributions received from non-controlling interests, net of cost |
— | — | — | — | — | 6.9 | 6.9 | ||||||||||||||||||||||||||||||||||
| Common shares issued under employee share purchase plan | 1.5 | — | — | — | — | — | 1.5 | ||||||||||||||||||||||||||||||||||
| Share-based compensation | — | — | 3.3 | 0.1 | — | — | 3.4 | ||||||||||||||||||||||||||||||||||
| Common shares issued pursuant to share-based awards | — | — | (0.1) | — | — | — | (0.1) | ||||||||||||||||||||||||||||||||||
| Balance, June 30, 2025 | $ | 7,400.1 | $ | 184.3 | $ | (19.4) | $ | (2,915.1) | $ | 32.1 | $ | 444.2 | $ | 5,126.2 | |||||||||||||||||||||||||||
|
(millions of U.S. dollars)
For the three months ended June 30, 2024
|
|||||||||||||||||||||||||||||||||||||||||
| Algonquin Power & Utilities Corp. Shareholders | |||||||||||||||||||||||||||||||||||||||||
| Common shares |
Preferred shares |
Additional paid-in capital |
Deficit | AOCI | Non- controlling interests |
Total | |||||||||||||||||||||||||||||||||||
| Balance, March 31, 2024 | $ | 6,235.6 | $ | 184.3 | $ | (0.4) | $ | (1,446.3) | $ | (104.5) | $ | 1,566.1 | $ | 6,434.8 | |||||||||||||||||||||||||||
| Net earnings (loss) | — | — | — | 200.8 | — | (41.8) | 159.0 | ||||||||||||||||||||||||||||||||||
| Redeemable non-controlling interests not included in equity | — | — | — | — | — | 0.3 | 0.3 | ||||||||||||||||||||||||||||||||||
| OCI | — | — | — | — | 41.1 | (2.0) | 39.1 | ||||||||||||||||||||||||||||||||||
| Dividends declared and distributions to non-controlling interests | — | — | — | (86.4) | — | (17.4) | (103.8) | ||||||||||||||||||||||||||||||||||
| Contributions received from non-controlling interests | — | — | — | — | — | 2.3 | 2.3 | ||||||||||||||||||||||||||||||||||
| Common shares issued upon public offering, net of tax effected cost | 1,150.0 | — | — | — | — | — | 1,150.0 | ||||||||||||||||||||||||||||||||||
| Issuance of common shares under employee share purchase plan | 1.0 | — | — | — | — | — | 1.0 | ||||||||||||||||||||||||||||||||||
| Share-based compensation | — | — | 1.2 | — | — | — | 1.2 | ||||||||||||||||||||||||||||||||||
| Common shares issued pursuant to share-based awards | 2.5 | — | — | 0.1 | — | — | 2.6 | ||||||||||||||||||||||||||||||||||
| Balance, June 30, 2024 | $ | 7,389.1 | $ | 184.3 | $ | 0.8 | $ | (1,331.8) | $ | (63.4) | $ | 1,507.5 | $ | 7,686.5 | |||||||||||||||||||||||||||
|
(millions of U.S. dollars)
For the six months ended June 30, 2025
|
|||||||||||||||||||||||||||||||||||||||||
| Algonquin Power & Utilities Corp. Shareholders | |||||||||||||||||||||||||||||||||||||||||
| Common shares |
Preferred shares |
Additional paid-in capital |
Deficit | AOCI | Non- controlling interests |
Total | |||||||||||||||||||||||||||||||||||
| Balance, December 31, 2024 | $ | 7,391.3 | $ | 184.3 | $ | (19.2) | $ | (2,929.9) | $ | 81.4 | $ | 1,468.3 | $ | 6,176.2 | |||||||||||||||||||||||||||
| Net earnings (loss) | — | — | — | 120.9 | — | (35.9) | 85.0 | ||||||||||||||||||||||||||||||||||
| OCI | — | — | — | — | 22.3 | — | 22.3 | ||||||||||||||||||||||||||||||||||
| Dividends declared and distributions to non-controlling interests | — | — | — | (106.1) | — | (2.6) | (108.7) | ||||||||||||||||||||||||||||||||||
Contributions received from non-controlling interests, net of cost |
— | — | — | — | — | 6.9 | 6.9 | ||||||||||||||||||||||||||||||||||
| Derecognition on sale of the renewable energy business | — | — | — | — | (71.6) | (992.5) | (1,064.1) | ||||||||||||||||||||||||||||||||||
| Common shares issued under employee share purchase plan | 2.3 | — | — | — | — | — | 2.3 | ||||||||||||||||||||||||||||||||||
| Share-based compensation | — | — | 6.2 | — | — | — | 6.2 | ||||||||||||||||||||||||||||||||||
| Common shares issued pursuant to share-based awards | 6.5 | — | (6.4) | — | — | — | 0.1 | ||||||||||||||||||||||||||||||||||
| Balance, June 30, 2025 | $ | 7,400.1 | $ | 184.3 | $ | (19.4) | $ | (2,915.1) | $ | 32.1 | $ | 444.2 | $ | 5,126.2 | |||||||||||||||||||||||||||
|
(millions of U.S. dollars)
For the six months ended June 30, 2024
|
|||||||||||||||||||||||||||||||||||||||||
| Algonquin Power & Utilities Corp. Shareholders | |||||||||||||||||||||||||||||||||||||||||
| Common shares |
Preferred shares |
Additional paid-in capital |
Deficit | AOCI | Non- controlling interests |
Total | |||||||||||||||||||||||||||||||||||
| Balance, December 31, 2023 | $ | 6,230.0 | $ | 184.3 | $ | 7.3 | $ | (1,279.7) | $ | (102.3) | $ | 1,584.8 | $ | 6,624.4 | |||||||||||||||||||||||||||
| Net earnings (loss) | — | — | — | 111.6 | — | (72.9) | 38.7 | ||||||||||||||||||||||||||||||||||
| Redeemable non-controlling interests not included in equity | — | — | — | — | — | 0.6 | 0.6 | ||||||||||||||||||||||||||||||||||
| OCI | — | — | — | — | 38.9 | (1.0) | 37.9 | ||||||||||||||||||||||||||||||||||
| Dividends declared and distributions to non-controlling interests | — | — | — | (164.3) | — | (67.1) | (231.4) | ||||||||||||||||||||||||||||||||||
| Contributions received from non-controlling interests, net of cost | — | — | — | — | — | 66.9 | 66.9 | ||||||||||||||||||||||||||||||||||
| Common shares issued upon public offering, net of tax effected cost | 1,150.0 | — | — | — | — | — | 1,150.0 | ||||||||||||||||||||||||||||||||||
| Issuance of common shares under employee share purchase plan | 2.3 | — | — | — | — | — | 2.3 | ||||||||||||||||||||||||||||||||||
| Share-based compensation | — | — | 6.5 | — | — | — | 6.5 | ||||||||||||||||||||||||||||||||||
| Common shares issued pursuant to share-based awards |
6.8 | — | (5.8) | 0.6 | — | — | 1.6 | ||||||||||||||||||||||||||||||||||
| Acquisition of redeemable non-controlling interest |
— | — | (7.2) | — | — | (3.8) | (11.0) | ||||||||||||||||||||||||||||||||||
| Balance, June 30, 2024 | $ | 7,389.1 | $ | 184.3 | $ | 0.8 | $ | (1,331.8) | $ | (63.4) | $ | 1,507.5 | $ | 7,686.5 | |||||||||||||||||||||||||||
| (millions of U.S. dollars) | Three months ended June 30 | Six months ended June 30 | |||||||||||||||||||||
| 2025 | 2024 | 2025 | 2024 | ||||||||||||||||||||
| Cash provided by (used in): | |||||||||||||||||||||||
| Operating activities | |||||||||||||||||||||||
Net earnings |
$ | 6.1 | $ | 159.0 | $ | 85.0 | $ | 38.7 | |||||||||||||||
| Adjustments and items not affecting cash: | |||||||||||||||||||||||
| Depreciation and amortization | 107.0 | 137.0 | 202.3 | 266.5 | |||||||||||||||||||
| Deferred taxes | 91.0 | 41.4 | 104.9 | 25.0 | |||||||||||||||||||
Initial value and changes in derivative financial instruments, net of amortization |
(0.3) | (1.3) | (0.6) | (3.0) | |||||||||||||||||||
| Share-based compensation | 2.6 | 5.2 | 5.7 | 10.3 | |||||||||||||||||||
| Cost of equity funds used for construction purposes | (0.5) | (0.3) | (0.9) | (1.2) | |||||||||||||||||||
| Change in value of investments carried at fair value | — | (172.9) | — | (14.6) | |||||||||||||||||||
Pension and post-employment expense in excess of (lower than) contributions |
(0.4) | (1.6) | (2.7) | 2.4 | |||||||||||||||||||
| Distributions received from equity investments, net of income | 1.0 | 9.8 | 2.3 | 34.3 | |||||||||||||||||||
Other |
(15.3) | (10.7) | (31.4) | (7.5) | |||||||||||||||||||
Net change in non-cash operating items (note 16) |
58.7 | 70.5 | (38.2) | 16.0 | |||||||||||||||||||
| 249.9 | 236.1 | 326.4 | 366.9 | ||||||||||||||||||||
| Financing activities | |||||||||||||||||||||||
| Increase in long-term debt | 47.0 | 468.2 | 279.2 | 2,383.3 | |||||||||||||||||||
| Repayments of long-term debt | (70.6) | (1,250.0) | (510.5) | (2,751.0) | |||||||||||||||||||
| Net change in commercial paper | 9.0 | (192.7) | (171.0) | (448.7) | |||||||||||||||||||
Repayment of long-term debt on disposition of renewable energy business (note 18) |
— | — | (1,374.8) | — | |||||||||||||||||||
| Issuance of common shares, net of costs | — | 1,151.0 | 0.8 | 1,152.3 | |||||||||||||||||||
| Cash dividends on common shares | (50.4) | (77.1) | (100.5) | (150.7) | |||||||||||||||||||
| Dividends on preferred shares | (2.6) | (2.7) | (5.2) | (5.1) | |||||||||||||||||||
Contributions from non-controlling interests and redeemable non-controlling interests |
6.9 | — | 6.9 | 60.5 | |||||||||||||||||||
Production-based cash contributions from non-controlling interest from discontinued operations |
— | 2.3 | — | 6.3 | |||||||||||||||||||
| Distributions to non-controlling interests | — | (18.6) | — | (25.4) | |||||||||||||||||||
| Payments upon settlement of derivatives | — | — | (36.6) | — | |||||||||||||||||||
| Shares surrendered to fund withholding taxes on exercised share options | (0.2) | (1.5) | — | (2.5) | |||||||||||||||||||
| Acquisition of non-controlling interest | — | — | — | (10.1) | |||||||||||||||||||
| Net change in other long-term liabilities | 1.4 | (19.3) | 2.0 | (34.9) | |||||||||||||||||||
| (59.5) | 59.6 | (1,909.7) | 174.0 | ||||||||||||||||||||
| Investing activities | |||||||||||||||||||||||
| Additions to property, plant and equipment and intangible assets | (185.8) | (204.4) | (408.4) | (416.9) | |||||||||||||||||||
| Increase in long-term investments | (4.9) | (62.2) | (4.9) | (78.1) | |||||||||||||||||||
| Proceeds from divestiture of operating entity | — | 11.9 | 1,973.3 | 29.6 | |||||||||||||||||||
| Transaction cost on divestiture of operating entity | — | — | (16.1) | — | |||||||||||||||||||
| Increase in other assets | (8.1) | (1.7) | (10.5) | (2.6) | |||||||||||||||||||
| (198.8) | (256.4) | 1,533.4 | (468.0) | ||||||||||||||||||||
| Effect of exchange rate differences on cash and restricted cash | 0.5 | 0.2 | 1.4 | (1.5) | |||||||||||||||||||
Increase (decrease) in cash, cash equivalents and restricted cash |
$ | (7.9) | $ | 39.5 | $ | (48.5) | $ | 71.4 | |||||||||||||||
| Cash, cash equivalents and restricted cash, beginning of period | 90.5 | 108.0 | 131.1 | 76.1 | |||||||||||||||||||
| Cash, cash equivalents and restricted cash, end of period | $ | 82.6 | $ | 147.5 | $ | 82.6 | $ | 147.5 | |||||||||||||||
| See accompanying notes to unaudited interim condensed consolidated financial statements. | |||||||||||||||||||||||
|
Algonquin Power & Utilities Corp.
Unaudited Interim Condensed Consolidated Statements of Cash Flows (continued)
| |||||||||||||||||||||||
| (millions of U.S. dollars) | Three months ended June 30 | Six months ended June 30 | |||||||||||||||||||||
| 2025 | 2024 | 2025 | 2024 | ||||||||||||||||||||
| Supplemental disclosure of cash flow information: | |||||||||||||||||||||||
| Cash paid during the period for interest expense | $ | 70.8 | $ | 96.8 | $ | 160.8 | $ | 206.4 | |||||||||||||||
| Cash paid (received) during the period for income taxes - net | $ | (98.5) | $ | (52.1) | $ | (88.1) | $ | (49.5) | |||||||||||||||
| Cash received during the period for distributions from equity investments | $ | — | $ | 27.1 | $ | — | $ | 53.5 | |||||||||||||||
| Non-cash financing and investing activities: | |||||||||||||||||||||||
| Property, plant and equipment acquisitions in accruals | $ | 32.6 | $ | 73.3 | $ | 154.7 | $ | 124.0 | |||||||||||||||
| Issuance of common shares under dividend reinvestment plan and share-based compensation plans | $ | 1.5 | $ | 3.6 | $ | 8.8 | $ | 9.1 | |||||||||||||||
| Property, plant and equipment, intangible assets and accrued liabilities in exchange of note receivable | $ | — | $ | 141.2 | $ | — | $ | 160.9 | |||||||||||||||
| Algonquin Power & Utilities Corp. | ||
Notes to the Unaudited Interim Condensed Consolidated Financial Statements | ||
| June 30, 2025 and 2024 | ||
| Algonquin Power & Utilities Corp. | ||
Notes to the Unaudited Interim Condensed Consolidated Financial Statements | ||
| June 30, 2025 and 2024 | ||
| Algonquin Power & Utilities Corp. | ||
Notes to the Unaudited Interim Condensed Consolidated Financial Statements | ||
| June 30, 2025 and 2024 | ||
| Utility | State, Province or Country | Regulatory Proceeding Type | Details | ||||||||
| Rio Rico Water & Sewer, Bella Vista Water, Beardsley Water, Cordes Lakes Water | Arizona | GRC | On December 28, 2023, filed an application seeking an increase in revenues of $6.0 million based on an ROE of 10.95% and an equity ratio of 54%. On June 26, 2024, the Arizona Corporation Commission ("ACC") granted the Company's request to extend the procedural schedule with a hearing on the merits scheduled for March 24-28, 2025. Staff testimony, which recommended an increase of $2.9 million in revenue based on an ROE of 9.4% and an equity ratio of 54%, was filed and supplemented on January 8, 2025. On February 5, 2025, the Company notified the ACC that the parties had reached a settlement in principle that would resolve all matters in the rate case. The parties filed a settlement agreement on February 21, 2025, which would result in an increase in revenues of $4.2 million. On March 25-26, 2025 the ACC held a hearing on the settlement agreement. On June 18, 2025, the ACC approved the settlement agreement with approved rates taking effect July 1, 2025. |
||||||||
| Algonquin Power & Utilities Corp. | ||
Notes to the Unaudited Interim Condensed Consolidated Financial Statements | ||
| June 30, 2025 and 2024 | ||
| June 30, | December 31, | ||||||||||
| (millions of U.S. dollars) | 2025 | 2024 | |||||||||
| Regulatory assets | |||||||||||
Securitized costs, net (a) |
$ | 275.1 | $ | 285.6 | |||||||
| Rate adjustment mechanism | 190.4 | 198.2 | |||||||||
| Deferred capitalized costs | 211.6 | 178.4 | |||||||||
| Fuel and commodity cost adjustments | 114.5 | 108.5 | |||||||||
Wildfire mitigation and vegetation management (b) |
125.3 | 128.3 | |||||||||
| Income taxes | 97.4 | 96.7 | |||||||||
| Pension and post-employment benefits | 40.9 | 51.8 | |||||||||
| Environmental remediation | 67.8 | 62.3 | |||||||||
| Clean energy and other customer programs | 42.3 | 40.5 | |||||||||
| Debt premium | 6.7 | 12.8 | |||||||||
| Retired generating plant | 14.0 | 14.6 | |||||||||
| Asset retirement obligation | 11.3 | 11.7 | |||||||||
| Cost of removal | 9.3 | 9.8 | |||||||||
| Rate review costs | 9.9 | 11.2 | |||||||||
| Long-term maintenance contract | 2.0 | 3.0 | |||||||||
| Other | 137.2 | 107.6 | |||||||||
| Total regulatory assets | $ | 1,355.7 | $ | 1,321.0 | |||||||
| Less: current regulatory assets | (189.0) | (194.9) | |||||||||
| Non-current regulatory assets | $ | 1,166.7 | $ | 1,126.1 | |||||||
| Regulatory liabilities | |||||||||||
| Income taxes | $ | 248.6 | $ | 256.7 | |||||||
| Cost of removal | 195.0 | 188.9 | |||||||||
| Pension and post-employment benefits | 130.8 | 138.8 | |||||||||
| Fuel and commodity cost adjustments | 23.2 | 30.9 | |||||||||
| Clean energy and other customer programs | 8.0 | 8.5 | |||||||||
| Rate adjustment mechanism | 1.6 | 1.8 | |||||||||
| Other | 12.9 | 10.7 | |||||||||
| Total regulatory liabilities | $ | 620.1 | $ | 636.3 | |||||||
| Less: current regulatory liabilities | (71.9) | (76.7) | |||||||||
| Non-current regulatory liabilities | $ | 548.2 | $ | 559.6 | |||||||
| Algonquin Power & Utilities Corp. | ||
Notes to the Unaudited Interim Condensed Consolidated Financial Statements | ||
| June 30, 2025 and 2024 | ||
| June 30, | December 31, | ||||||||||
| (millions of U.S. dollars) | 2025 | 2024 | |||||||||
| Long-term investments carried at fair value |
$ | 1.9 | $ | 2.1 | |||||||
| Other long-term investments | |||||||||||
| Tax equity investments (a) | $ | 139.0 | $ | — | |||||||
| Equity-method investees (b) | 46.4 | 38.1 | |||||||||
| San Antonio Water System and other | 27.7 | 27.6 | |||||||||
| $ | 213.1 | $ | 65.7 | ||||||||
| Long-term investments | $ | 215.0 | $ | 67.8 | |||||||
| Algonquin Power & Utilities Corp. | ||
Notes to the Unaudited Interim Condensed Consolidated Financial Statements | ||
| June 30, 2025 and 2024 | ||
| Three months ended | Six months ended | ||||||||||||||||||||||
| June 30 | June 30 | ||||||||||||||||||||||
| (millions of U.S. dollars) | 2025 | 2024 | 2025 | 2024 | |||||||||||||||||||
| Gain on investments carried at fair value | |||||||||||||||||||||||
| Atlantica | $ | — | $ | 169.9 | $ | — | $ | 22.1 | |||||||||||||||
| Other | — | — | — | 0.1 | |||||||||||||||||||
| $ | — | $ | 169.9 | $ | — | $ | 22.2 | ||||||||||||||||
| Dividend and interest income from investments carried at fair value | |||||||||||||||||||||||
| Atlantica | $ | — | $ | 21.8 | $ | — | $ | 43.6 | |||||||||||||||
| Other long-term investments | |||||||||||||||||||||||
| Tax equity investments (a) | $ | 1.2 | $ | — | $ | 2.6 | $ | — | |||||||||||||||
| Equity method gain (b) | 1.1 | 2.5 | 2.1 | 1.8 | |||||||||||||||||||
| Interest and other income (loss) | 4.4 | (0.5) | 4.8 | 2.1 | |||||||||||||||||||
| $ | 6.7 | $ | 2.0 | $ | 9.5 | $ | 3.9 | ||||||||||||||||
| Income from long-term investments | $ | 6.7 | $ | 193.7 | $ | 9.5 | $ | 69.7 | |||||||||||||||
| Algonquin Power & Utilities Corp. | ||
Notes to the Unaudited Interim Condensed Consolidated Financial Statements | ||
| June 30, 2025 and 2024 | ||
| (millions of U.S. dollars unless otherwise noted) | Weighted average coupon | Maturity | Par value | June 30, | December 31, | ||||||||||||||||||||||||
| Borrowing type | 2025 | 2024 | |||||||||||||||||||||||||||
| Senior unsecured revolving credit facilities (a) | — | 2025-2028 | N/A | $ | 62.4 | $ | 250.7 | ||||||||||||||||||||||
| Senior unsecured bank credit facilities and delayed draw term facility (b) |
— | 2026-2031 | N/A | 193.5 | 180.3 | ||||||||||||||||||||||||
| Commercial paper | — | 2026 | N/A | 212.0 | 383.0 | ||||||||||||||||||||||||
| U.S. dollar borrowings | |||||||||||||||||||||||||||||
| Senior unsecured notes (Green Equity Units) |
5.37 | % | 2026 | $ | 1,140.8 | 1,143.7 | 1,140.2 | ||||||||||||||||||||||
| Senior unsecured notes (c) | 4.25 | % | 2027-2047 | $ | 2,195.0 | 2,183.9 | 2,181.8 | ||||||||||||||||||||||
| Senior unsecured utility notes (d) | 6.39 | % | 2028-2035 | $ | 107.0 | 114.0 | 145.6 | ||||||||||||||||||||||
| Senior secured utility bonds | 4.81 | % | 2026-2044 | $ | 845.7 | 828.4 | 849.2 | ||||||||||||||||||||||
| Canadian dollar borrowings | |||||||||||||||||||||||||||||
| Senior unsecured notes | 3.32 | % | 2050 | C$ | 200.0 | 145.4 | 137.8 | ||||||||||||||||||||||
| Senior secured project notes | 10.21 | % | 2027 | C$ | 11.3 | 8.2 | 9.1 | ||||||||||||||||||||||
| Chilean Unidad de Fomento borrowings | |||||||||||||||||||||||||||||
| Senior unsecured utility bonds | 3.63 | % | 2028-2040 | CLF | 1.3 | 61.1 | 59.4 | ||||||||||||||||||||||
| $ | 4,952.6 | $ | 5,337.1 | ||||||||||||||||||||||||||
| Subordinated borrowings | |||||||||||||||||||||||||||||
| Subordinated unsecured notes | 5.25 | % | 2082 | C$ | 400.0 | $ | 289.5 | $ | 274.3 | ||||||||||||||||||||
| Subordinated unsecured notes | 5.96 | % | 2079-2082 | $ | 1,100.0 | 1,086.7 | 1,087.3 | ||||||||||||||||||||||
| $ | 6,328.8 | $ | 6,698.7 | ||||||||||||||||||||||||||
| Less: current portion | (308.2) | (491.7) | |||||||||||||||||||||||||||
| $ | 6,020.6 | $ | 6,207.0 | ||||||||||||||||||||||||||
| Algonquin Power & Utilities Corp. | ||
Notes to the Unaudited Interim Condensed Consolidated Financial Statements | ||
| June 30, 2025 and 2024 | ||
| June 30, | December 31, | |||||||||||||
| (millions of U.S. dollars) | 2025 | 2024 | ||||||||||||
| Revolving and term credit facilities | $ | 2,368.4 | $ | 2,380.3 | ||||||||||
| Funds drawn on facilities/commercial paper issued | (467.8) | (814.8) | ||||||||||||
| Letters of credit issued | (30.3) | (26.2) | ||||||||||||
| Liquidity available under the facilities | $ | 1,870.3 | $ | 1,539.3 | ||||||||||
| Undrawn portion of uncommitted letter of credit facilities | (67.4) | (63.3) | ||||||||||||
| Cash on hand | 54.3 | 34.8 | ||||||||||||
| Total liquidity and capital reserves | $ | 1,857.2 | $ | 1,510.8 | ||||||||||
| Three months ended | Six months ended | ||||||||||||||||||||||
| June 30 | June 30 | ||||||||||||||||||||||
| (millions of U.S. dollars) | 2025 | 2024 | 2025 | 2024 | |||||||||||||||||||
| Long-term debt | $ | 74.7 | $ | 72.3 | $ | 150.0 | $ | 140.0 | |||||||||||||||
| Commercial paper, credit facility draws and related fees | 4.2 | 27.5 | 8.9 | 57.2 | |||||||||||||||||||
| Accretion of fair value adjustments | (1.5) | (1.1) | (3.0) | (2.4) | |||||||||||||||||||
| AFUDC capitalized on regulated property | (1.4) | (1.1) | (3.5) | (3.1) | |||||||||||||||||||
Other (a) |
(8.2) | (4.4) | (13.2) | (8.9) | |||||||||||||||||||
| $ | 67.8 | $ | 93.2 | $ | 139.2 | $ | 182.8 | ||||||||||||||||
| Algonquin Power & Utilities Corp. | ||
Notes to the Unaudited Interim Condensed Consolidated Financial Statements | ||
| June 30, 2025 and 2024 | ||
| Pension benefits | |||||||||||||||||||||||
| Three months ended June 30 | Six months ended June 30 | ||||||||||||||||||||||
| 2025 | 2024 | 2025 | 2024 | ||||||||||||||||||||
| Service cost | $ | 2.8 | $ | 3.0 | $ | 6.1 | $ | 6.1 | |||||||||||||||
| Non-service costs | |||||||||||||||||||||||
| Interest cost | 7.8 | 8.1 | 16.4 | 16.5 | |||||||||||||||||||
| Expected return on plan assets | (9.3) | (8.6) | (18.6) | (17.3) | |||||||||||||||||||
Amortization of net actuarial gains |
(0.6) | (0.3) | (1.0) | (0.7) | |||||||||||||||||||
| Amortization of prior service credits | (0.4) | (0.3) | (0.7) | (0.7) | |||||||||||||||||||
| Impact of regulatory accounts | 4.7 | 4.3 | 3.5 | 8.7 | |||||||||||||||||||
| 2.2 | 3.2 | (0.4) | 6.5 | ||||||||||||||||||||
| Net benefit cost | $ | 5.0 | $ | 6.2 | $ | 5.7 | $ | 12.6 | |||||||||||||||
| OPEB | |||||||||||||||||||||||
| Three months ended June 30 | Six months ended June 30 | ||||||||||||||||||||||
| 2025 | 2024 | 2025 | 2024 | ||||||||||||||||||||
| Service cost | $ | 0.7 | $ | 0.8 | $ | 1.4 | $ | 1.6 | |||||||||||||||
| Non-service costs | |||||||||||||||||||||||
| Interest cost | 3.1 | 2.7 | 5.7 | 5.3 | |||||||||||||||||||
| Expected return on plan assets | (2.9) | (2.7) | (5.5) | (5.3) | |||||||||||||||||||
Amortization of net actuarial gains |
(1.4) | (0.9) | (2.6) | (2.5) | |||||||||||||||||||
| Amortization of prior service credits | (0.2) | (0.2) | (0.4) | (0.4) | |||||||||||||||||||
| Impact of regulatory accounts | 2.0 | 1.9 | 3.7 | 3.8 | |||||||||||||||||||
| 0.6 | 0.8 | 0.9 | 0.9 | ||||||||||||||||||||
| Net benefit cost | $ | 1.3 | $ | 1.6 | $ | 2.3 | $ | 2.5 | |||||||||||||||
| Algonquin Power & Utilities Corp. | ||
Notes to the Unaudited Interim Condensed Consolidated Financial Statements | ||
| June 30, 2025 and 2024 | ||
| Six months ended | ||||||||||||||
| June 30 | ||||||||||||||
| 2025 | 2024 | |||||||||||||
| Common shares, beginning of period | 767,343,863 | 689,271,039 | ||||||||||||
| Settlement of purchase contracts | — | 76,909,700 | ||||||||||||
| Exercise of share-based awards | 608,405 | 749,522 | ||||||||||||
| Common shares, end of period | 767,952,268 | 766,930,261 | ||||||||||||
| Three months ended June 30 | |||||||||||||||||||||||
| 2025 | 2024 | ||||||||||||||||||||||
| (in millions except per share amounts) | Dividend | Dividend per share | Dividend | Dividend per share | |||||||||||||||||||
| Common shares | $ | 50.4 | $ | 0.0650 | $ | 83.7 | $ | 0.1085 | |||||||||||||||
| Series A Shares | C$ | 2.0 | C$ | 0.4110 | C$ | 2.0 | C$ | 0.4110 | |||||||||||||||
| Series D Shares | C$ | 1.7 | C$ | 0.4283 | C$ | 1.7 | C$ | 0.4283 | |||||||||||||||
| Six months ended June 30 | |||||||||||||||||||||||
| 2025 | 2024 | ||||||||||||||||||||||
| (in millions except per share amounts) | Dividend | Dividend per share | Dividend | Dividend per share | |||||||||||||||||||
| Common shares | $ | 100.9 | $ | 0.1300 | $ | 159.2 | $ | 0.2170 | |||||||||||||||
| Series A preferred shares | C$ | 3.9 | C$ | 0.8220 | C$ | 3.9 | C$ | 0.8220 | |||||||||||||||
| Series D preferred shares | C$ | 3.4 | C$ | 0.8566 | C$ | 3.0 | C$ | 0.7465 | |||||||||||||||
| Algonquin Power & Utilities Corp. | ||
Notes to the Unaudited Interim Condensed Consolidated Financial Statements | ||
| June 30, 2025 and 2024 | ||
| (millions of U.S. dollars) | Foreign currency cumulative translation | Unrealized gain (loss) on cash flow hedges | Pension and post-employment actuarial changes | Total | |||||||||||||||||||
| Balance, January 1, 2024 | $ | (104.9) | $ | (38.3) | $ | 40.9 | $ | (102.3) | |||||||||||||||
| OCI | 33.8 | 79.4 | 12.8 | 126.0 | |||||||||||||||||||
| Amounts reclassified from AOCI to the unaudited interim condensed consolidated statements of operations | 0.6 | (27.1) | (5.8) | (32.3) | |||||||||||||||||||
| Net current period OCI | $ | 34.4 | $ | 52.3 | $ | 7.0 | $ | 93.7 | |||||||||||||||
| OCI attributable to the non-controlling interests | (4.6) | — | — | (4.6) | |||||||||||||||||||
| Net current period OCI attributable to shareholders of AQN | $ | 29.8 | $ | 52.3 | $ | 7.0 | $ | 89.1 | |||||||||||||||
| Amounts reclassified from AOCI to non-controlling interest | — | 94.6 | — | 94.6 | |||||||||||||||||||
| Balance, December 31, 2024 | $ | (75.1) | $ | 108.6 | $ | 47.9 | $ | 81.4 | |||||||||||||||
| OCI | 48.3 | (22.2) | — | 26.1 | |||||||||||||||||||
| Amounts reclassified from AOCI to the unaudited interim condensed consolidated statements of operations | (0.3) | (1.0) | (2.5) | (3.8) | |||||||||||||||||||
| Net current period OCI | $ | 48.0 | $ | (23.2) | $ | (2.5) | $ | 22.3 | |||||||||||||||
| OCI attributable to the non-controlling interests | — | — | — | — | |||||||||||||||||||
| Net current period OCI attributable to shareholders of AQN | $ | 48.0 | $ | (23.2) | $ | (2.5) | $ | 22.3 | |||||||||||||||
Amounts derecognized on sale of the renewable energy business (note 18) |
(71.6) | — | — | (71.6) | |||||||||||||||||||
| Balance, June 30, 2025 | $ | (98.7) | $ | 85.4 | $ | 45.4 | $ | 32.1 | |||||||||||||||
| Algonquin Power & Utilities Corp. | ||
Notes to the Unaudited Interim Condensed Consolidated Financial Statements | ||
| June 30, 2025 and 2024 | ||
| Three months ended | Six months ended | ||||||||||||||||||||||
| June 30 | June 30 | ||||||||||||||||||||||
| (millions of U.S. dollars) | 2025 | 2024 | 2025 | 2024 | |||||||||||||||||||
| Expected income tax expense at Canadian statutory rate | $ | 1.7 | $ | 48.3 | $ | 27.5 | $ | 29.5 | |||||||||||||||
| Increase (decrease) resulting from: | |||||||||||||||||||||||
| Effect of differences in tax rates on transactions in and within foreign jurisdictions and change in tax rates | 0.3 | (1.7) | (1.9) | (3.5) | |||||||||||||||||||
| Adjustments from investments carried at fair value | — | (20.6) | — | (3.9) | |||||||||||||||||||
| Change in valuation allowance | 2.8 | 1.5 | 11.2 | 1.5 | |||||||||||||||||||
| Non-controlling interests share of income | 5.1 | 2.7 | 9.6 | 6.2 | |||||||||||||||||||
| Tax basis step-up | (2.5) | — | (15.9) | — | |||||||||||||||||||
| Amortization and settlement of excess deferred income tax | (1.3) | (1.8) | (5.2) | (3.3) | |||||||||||||||||||
Other |
0.9 | (3.1) | 1.5 | 0.4 | |||||||||||||||||||
| Income tax expense | $ | 7.0 | $ | 25.3 | $ | 26.8 | $ | 26.9 | |||||||||||||||
| Three months ended | Six months ended | ||||||||||||||||||||||
| June 30 | June 30 | ||||||||||||||||||||||
| 2025 | 2024 | 2025 | 2024 | ||||||||||||||||||||
| Restructuring costs (a) | $ | (6.8) | $ | (6.0) | $ | (12.4) | $ | (10.4) | |||||||||||||||
| Other (b) | 6.3 | — | (1.8) | — | |||||||||||||||||||
| $ | (0.5) | $ | (6.0) | $ | (14.2) | $ | (10.4) | ||||||||||||||||
| Algonquin Power & Utilities Corp. | ||
Notes to the Unaudited Interim Condensed Consolidated Financial Statements | ||
| June 30, 2025 and 2024 | ||
| Three months ended | Six months ended | ||||||||||||||||||||||
| June 30 | June 30 | ||||||||||||||||||||||
| (millions of U.S. dollars except number of shares and per share amounts) | 2025 | 2024 | 2025 | 2024 | |||||||||||||||||||
Net earnings from continuing operations attributable to shareholders of AQN |
$ | 17.4 | $ | 180.1 | $ | 112.8 | $ | 123.3 | |||||||||||||||
| Series A preferred share dividend | 1.4 | 1.4 | 2.8 | 2.2 | |||||||||||||||||||
| Series D preferred share dividend | 1.2 | 1.3 | 2.4 | 2.9 | |||||||||||||||||||
| Net earnings from continuing operations attributable to common shareholders of AQN | 14.8 | 177.4 | 107.6 | 118.2 | |||||||||||||||||||
| Earnings (loss) from discontinued operations | 6.7 | 20.6 | 8.1 | (11.7) | |||||||||||||||||||
| Net earnings attributable to common shareholders of AQN – basic and diluted | $ | 21.5 | $ | 198.0 | $ | 115.7 | $ | 106.5 | |||||||||||||||
| Weighted average number of shares | |||||||||||||||||||||||
| Basic | 768,056,555 | 701,593,792 | 767,864,646 | 695,700,444 | |||||||||||||||||||
| Effect of dilutive securities | 4,354,954 | 2,360,493 | 3,603,651 | 2,039,030 | |||||||||||||||||||
| Diluted average number of shares | 772,411,509 | 703,954,285 | 771,468,297 | 697,739,474 | |||||||||||||||||||
| Basic and diluted net earnings per share from continuing operations | $ | 0.02 | $ | 0.26 | $ | 0.14 | $ | 0.17 | |||||||||||||||
| Basic and diluted net earnings (loss) per share from discontinued operations | $ | 0.01 | $ | 0.02 | $ | 0.01 | $ | (0.02) | |||||||||||||||
| Basic and diluted net earnings per share | $ | 0.03 | $ | 0.28 | $ | 0.15 | $ | 0.15 | |||||||||||||||
| Algonquin Power & Utilities Corp. | ||
Notes to the Unaudited Interim Condensed Consolidated Financial Statements | ||
| June 30, 2025 and 2024 | ||
| Algonquin Power & Utilities Corp. | ||
Notes to the Unaudited Interim Condensed Consolidated Financial Statements | ||
| June 30, 2025 and 2024 | ||
| Three months ended June 30, 2025 | |||||||||||||||||||||||
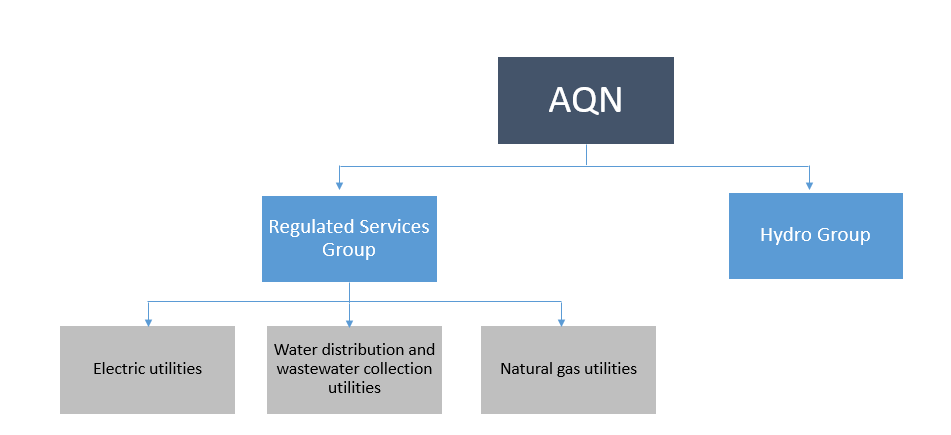
| (millions of U.S. dollars) | Regulated Services Group | Hydro Group |
Corporate Group |
Total | |||||||||||||||||||
Revenue (1) |
$ | 504.3 | $ | 10.2 | $ | — | $ | 514.5 | |||||||||||||||
| Other revenue | 12.6 | 0.4 | 0.3 | 13.3 | |||||||||||||||||||
| Fuel, power, water purchased and other cost of sales | 124.6 | — | — | 124.6 | |||||||||||||||||||
| Net revenue | 392.3 | 10.6 | 0.3 | 403.2 | |||||||||||||||||||
| Operating expenses | 211.2 | 3.0 | 3.2 | 217.4 | |||||||||||||||||||
| Depreciation and amortization | 105.0 | 1.8 | 0.2 | 107.0 | |||||||||||||||||||
Loss on foreign exchange |
— | — | 14.0 | 14.0 | |||||||||||||||||||
Operating income (loss) |
76.1 | 5.8 | (17.1) | 64.8 | |||||||||||||||||||
| Interest expense | (34.1) | (0.3) | (33.4) | (67.8) | |||||||||||||||||||
Income (loss) from long-term investments |
(0.1) | 0.1 | 6.7 | 6.7 | |||||||||||||||||||
| Other interest income | 5.7 | — | — | 5.7 | |||||||||||||||||||
| Pension and post-employment non-service costs | (2.8) | — | — | (2.8) | |||||||||||||||||||
| Other net gains (losses) | (2.9) | — | 2.4 | (0.5) | |||||||||||||||||||
| Gain on derivative financial instruments | 0.3 | — | — | 0.3 | |||||||||||||||||||
| Earnings (loss) before income taxes | 42.2 | 5.6 | (41.4) | 6.4 | |||||||||||||||||||
| Income tax recovery (expense) | (14.1) | 4.5 | 2.6 | (7.0) | |||||||||||||||||||
| Net effect of non-controlling interests | 19.0 | (1.0) | — | 18.0 | |||||||||||||||||||
| Net earnings (loss) from continuing operations attributable to shareholders | $ | 47.1 | $ | 9.1 | $ | (38.8) | $ | 17.4 | |||||||||||||||
Capital expenditures |
$ | 136.2 | $ | 0.7 | $ | — | $ | 136.9 | |||||||||||||||
| Algonquin Power & Utilities Corp. | ||
Notes to the Unaudited Interim Condensed Consolidated Financial Statements | ||
| June 30, 2025 and 2024 | ||
| Three months ended June 30, 2024 | |||||||||||||||||||||||
| (millions of U.S. dollars) | Regulated Services Group | Hydro Group |
Corporate Group |
Total | |||||||||||||||||||
Revenue (1) |
$ | 491.2 | $ | 9.6 | $ | — | $ | 500.8 | |||||||||||||||
| Other revenue | 14.0 | 0.3 | 0.2 | 14.5 | |||||||||||||||||||
| Fuel, power, water purchased and other cost of sales | 114.9 | 0.3 | — | 115.2 | |||||||||||||||||||
| Net revenue | 390.3 | 9.6 | 0.2 | 400.1 | |||||||||||||||||||
| Operating expenses | 209.6 | 2.2 | 2.3 | 214.1 | |||||||||||||||||||
| Depreciation and amortization | 100.1 | 1.7 | 0.8 | 102.6 | |||||||||||||||||||
| Gain on foreign exchange | — | — | (2.1) | (2.1) | |||||||||||||||||||
Operating income (loss) |
80.6 | 5.7 | (0.8) | 85.5 | |||||||||||||||||||
| Interest expense | (49.2) | (0.2) | (43.8) | (93.2) | |||||||||||||||||||
Income from long-term investments |
1.5 | — | 192.2 | 193.7 | |||||||||||||||||||
| Other interest income | 6.0 | — | — | 6.0 | |||||||||||||||||||
| Pension and post-employment non-service costs | (4.0) | — | — | (4.0) | |||||||||||||||||||
| Other net losses | (1.7) | — | (4.3) | (6.0) | |||||||||||||||||||
| Gain (loss) on derivative financial instruments | (0.7) | — | 0.8 | 0.1 | |||||||||||||||||||
| Earnings before income taxes | 32.5 | 5.5 | 144.1 | 182.1 | |||||||||||||||||||
| Income tax expense | (8.6) | (1.4) | (15.3) | (25.3) | |||||||||||||||||||
| Net effect of non-controlling interests | 24.1 | (0.8) | — | 23.3 | |||||||||||||||||||
| Net earnings from continuing operations attributable to shareholders | $ | 48.0 | $ | 3.3 | $ | 128.8 | $ | 180.1 | |||||||||||||||
Capital expenditures |
$ | 163.9 | $ | 1.1 | $ | — | $ | 165.0 | |||||||||||||||
| Algonquin Power & Utilities Corp. | ||
Notes to the Unaudited Interim Condensed Consolidated Financial Statements | ||
| June 30, 2025 and 2024 | ||
| Six months ended June 30, 2025 | ||||||||||||||||||||||||||
| (millions of U.S. dollars) | Regulated Services Group | Hydro Group |
Corporate Group |
Total | ||||||||||||||||||||||
Revenue (1) |
$ | 1,171.8 | $ | 19.7 | $ | — | $ | 1,191.5 | ||||||||||||||||||
| Other revenue | 27.4 | 0.5 | 0.8 | 28.7 | ||||||||||||||||||||||
| Fuel, power, water purchased and other cost of sales | 329.6 | — | — | 329.6 | ||||||||||||||||||||||
| Net revenue | 869.6 | 20.2 | 0.8 | 890.6 | ||||||||||||||||||||||
| Operating expenses | 417.3 | 5.5 | 3.9 | 426.7 | ||||||||||||||||||||||
| Depreciation and amortization | 198.3 | 3.6 | 0.4 | 202.3 | ||||||||||||||||||||||
Loss on foreign exchange |
— | — | 17.9 | 17.9 | ||||||||||||||||||||||
| Operating income (loss) | 254.0 | 11.1 | (21.4) | 243.7 | ||||||||||||||||||||||
| Interest expense | (69.2) | (0.5) | (69.5) | (139.2) | ||||||||||||||||||||||
Income from long-term investments |
2.7 | 0.2 | 6.6 | 9.5 | ||||||||||||||||||||||
| Other interest income | 11.3 | — | — | 11.3 | ||||||||||||||||||||||
| Pension and post-employment non-service costs | (0.5) | — | — | (0.5) | ||||||||||||||||||||||
Other losses |
(10.3) | — | (3.9) | (14.2) | ||||||||||||||||||||||
| Gain (loss) on derivative financial instruments | 0.6 | — | (7.5) | (6.9) | ||||||||||||||||||||||
| Earnings (loss) before income taxes | 188.6 | 10.8 | (95.7) | 103.7 | ||||||||||||||||||||||
| Income tax recovery (expense) | (53.2) | 16.9 | 9.5 | (26.8) | ||||||||||||||||||||||
| Net effect of non-controlling interests | 37.9 | (2.0) | — | 35.9 | ||||||||||||||||||||||
| Net earnings (loss) from continuing operations attributable to shareholders | $ | 173.3 | $ | 25.7 | $ | (86.2) | $ | 112.8 | ||||||||||||||||||
Capital expenditures |
$ | 236.4 | $ | 1.2 | $ | — | $ | 237.6 | ||||||||||||||||||
| June 30, 2025 | ||||||||||||||||||||||||||
| Property, plant and equipment | $ | 9,348.4 | $ | 141.9 | $ | 99.5 | $ | 9,589.8 | ||||||||||||||||||
| Investments carried at fair value | 1.9 | — | — | 1.9 | ||||||||||||||||||||||
| Equity-method investees | 42.5 | — | 3.9 | 46.4 | ||||||||||||||||||||||
| Total assets | 13,156.4 | 170.9 | 366.1 | 13,693.4 | ||||||||||||||||||||||
| Algonquin Power & Utilities Corp. | ||
Notes to the Unaudited Interim Condensed Consolidated Financial Statements | ||
| June 30, 2025 and 2024 | ||
| Six months ended June 30, 2024 | |||||||||||||||||||||||
| (millions of U.S. dollars) | Regulated Services Group | Hydro Group |
Corporate Group |
Total (2) |
|||||||||||||||||||
Revenue (1) |
$ | 1,116.1 | $ | 18.3 | $ | — | $ | 1,134.4 | |||||||||||||||
| Other revenue | 25.7 | 0.8 | 0.6 | 27.1 | |||||||||||||||||||
| Fuel, power, water purchased and other cost of sales | 317.4 | 0.3 | — | 317.7 | |||||||||||||||||||
| Net revenue | 824.4 | 18.8 | 0.6 | 843.8 | |||||||||||||||||||
| Operating expenses | 412.5 | 5.1 | 3.0 | 420.6 | |||||||||||||||||||
| Depreciation and amortization | 191.9 | 3.3 | 1.5 | 196.7 | |||||||||||||||||||
| Gain on foreign exchange | — | — | (2.6) | (2.6) | |||||||||||||||||||
| Operating income (loss) | 220.0 | 10.4 | (1.3) | 229.1 | |||||||||||||||||||
| Interest expense | (98.3) | (0.5) | (84.0) | (182.8) | |||||||||||||||||||
Income from long-term investments |
2.7 | — | 67.0 | 69.7 | |||||||||||||||||||
| Other interest income | 12.7 | — | — | 12.7 | |||||||||||||||||||
| Pension and post-employment non-service costs | (7.4) | — | — | (7.4) | |||||||||||||||||||
Other losses |
(1.4) | — | (9.0) | (10.4) | |||||||||||||||||||
| Gain (loss) on derivative financial instruments | (1.3) | — | 1.5 | 0.2 | |||||||||||||||||||
| Earnings (loss) before income taxes | 127.0 | 9.9 | (25.8) | 111.1 | |||||||||||||||||||
| Income tax recovery (expense) | (33.0) | (2.3) | 8.4 | (26.9) | |||||||||||||||||||
| Net effect of non-controlling interests | 40.9 | (1.8) | — | 39.1 | |||||||||||||||||||
| Net earnings (loss) from continuing operations attributable to shareholders | $ | 134.9 | $ | 5.8 | $ | (17.4) | $ | 123.3 | |||||||||||||||
| Capital expenditures | $ | 323.4 | $ | 1.4 | $ | — | $ | 324.8 | |||||||||||||||
| December 31, 2024 | |||||||||||||||||||||||
| Property, plant and equipment | $ | 9,284.4 | $ | 136.8 | $ | 28.9 | $ | 9,450.1 | |||||||||||||||
| Investments carried at fair value | 2.1 | — | — | 2.1 | |||||||||||||||||||
| Equity-method investees | 38.1 | — | — | 38.1 | |||||||||||||||||||
Total assets(3) |
12,927.9 | 152.3 | 185.9 | $ | 13,266.1 | ||||||||||||||||||
| Algonquin Power & Utilities Corp. | ||
Notes to the Unaudited Interim Condensed Consolidated Financial Statements | ||
| June 30, 2025 and 2024 | ||
| Three months ended June 30 | Six months ended June 30 | ||||||||||||||||||||||
| (millions of U.S. dollars) | 2025 | 2024 | 2025 | 2024 | |||||||||||||||||||
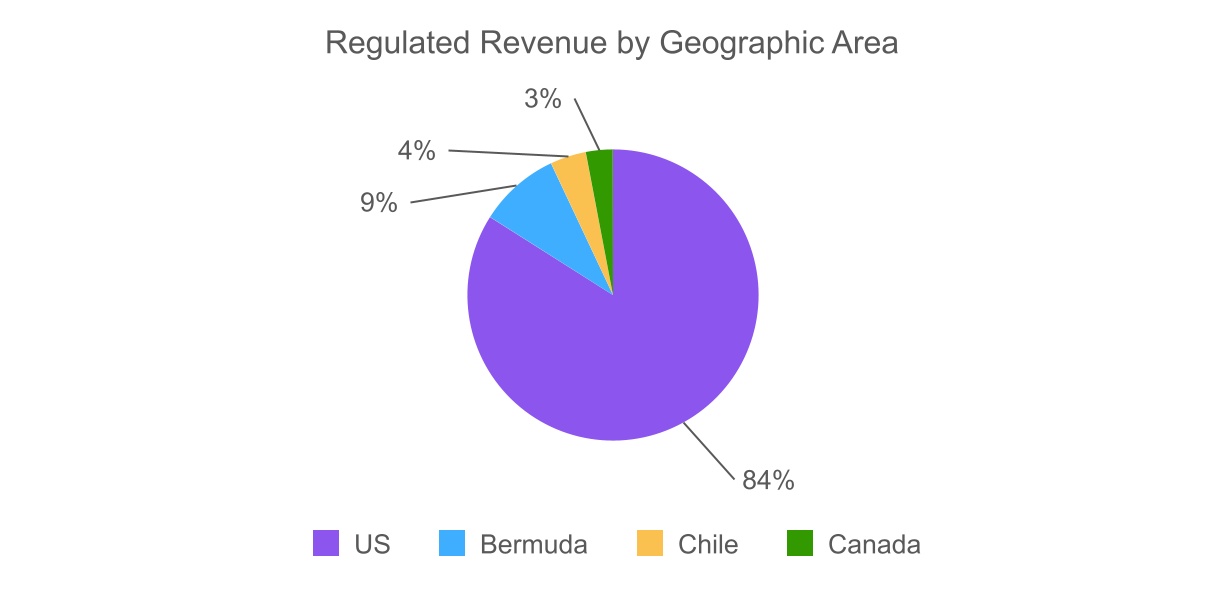
| Revenue | |||||||||||||||||||||||
| United States | $ | 416.1 | $ | 401.3 | $ | 988.9 | $ | 930.5 | |||||||||||||||
| Canada | 23.1 | 20.5 | 57.3 | 52.5 | |||||||||||||||||||
| Other regions | 88.6 | 93.5 | 174.0 | 178.5 | |||||||||||||||||||
| $ | 527.8 | $ | 515.3 | $ | 1,220.2 | $ | 1,161.5 | ||||||||||||||||
| Algonquin Power & Utilities Corp. | ||
Notes to the Unaudited Interim Condensed Consolidated Financial Statements | ||
| June 30, 2025 and 2024 | ||
| Algonquin Power & Utilities Corp. | ||
Notes to the Unaudited Interim Condensed Consolidated Financial Statements | ||
| June 30, 2025 and 2024 | ||
| Three months ended | Six months ended | ||||||||||||||||||||||
| June 30 | June 30 | ||||||||||||||||||||||
| (millions of U.S. dollars) | 2025 | 2024 | 2025 | 2024 | |||||||||||||||||||
| Accounts receivable | $ | 44.9 | $ | 107.2 | $ | 9.1 | $ | 97.3 | |||||||||||||||
| Fuel and natural gas in storage | (7.3) | (3.3) | 9.8 | (0.7) | |||||||||||||||||||
| Supplies and consumables inventory | 3.6 | (1.1) | (0.2) | (8.6) | |||||||||||||||||||
| Income taxes recoverable | 1.1 | 1.9 | 4.6 | 4.0 | |||||||||||||||||||
| Prepaid expenses | 8.6 | 21.1 | 11.9 | 18.8 | |||||||||||||||||||
| Accounts payable, accrued liabilities and other | 17.3 | (31.2) | (41.6) | (60.3) | |||||||||||||||||||
| Current income tax liability | 0.9 | 3.6 | (5.6) | 3.6 | |||||||||||||||||||
| Net regulatory assets and liabilities | (10.4) | (27.7) | (26.2) | (38.1) | |||||||||||||||||||
| $ | 58.7 | $ | 70.5 | $ | (38.2) | $ | 16.0 | ||||||||||||||||
(millions of U.S. dollars) |
|||||||||||||||||||||||||||||
| June 30, 2025 | Carrying amount |
Fair value |
Level 1 | Level 2 | Level 3 | ||||||||||||||||||||||||
| Long-term investments carried at fair value | $ | 1.9 | $ | 1.9 | $ | 1.9 | $ | — | $ | — | |||||||||||||||||||
Other receivables |
0.7 | 0.7 | — | 0.7 | — | ||||||||||||||||||||||||
| Contingent consideration | 73.4 | 73.4 | — | — | 73.4 | ||||||||||||||||||||||||
| Derivative instruments: | |||||||||||||||||||||||||||||
| Interest rate swaps designated as a hedge | 80.9 | 80.9 | — | 80.9 | — | ||||||||||||||||||||||||
| Commodity contracts for regulatory operations | 0.3 | 0.3 | — | 0.3 | — | ||||||||||||||||||||||||
| Total derivative instruments | 81.2 | 81.2 | — | 81.2 | — | ||||||||||||||||||||||||
| Total financial assets | $ | 157.2 | $ | 157.2 | $ | 1.9 | $ | 81.9 | $ | 73.4 | |||||||||||||||||||
| Long-term debt | $ | 6,020.6 | $ | 6,009.8 | $ | 1,988.8 | $ | 4,021.0 | $ | — | |||||||||||||||||||
| Convertible debentures | 0.3 | 0.3 | 0.3 | — | — | ||||||||||||||||||||||||
| Derivative instruments: | |||||||||||||||||||||||||||||
| Interest rate swaps designated as a hedge | 12.0 | 12.0 | — | 12.0 | — | ||||||||||||||||||||||||
| Commodity contracts for regulated operations | 0.1 | 0.1 | — | 0.1 | |||||||||||||||||||||||||
| Total derivative instruments | 12.1 | 12.1 | — | 12.1 | — | ||||||||||||||||||||||||
| Total financial liabilities | $ | 6,033.0 | $ | 6,022.2 | $ | 1,989.1 | $ | 4,033.1 | $ | — | |||||||||||||||||||
| Algonquin Power & Utilities Corp. | ||
Notes to the Unaudited Interim Condensed Consolidated Financial Statements | ||
| June 30, 2025 and 2024 | ||
| (millions of U.S. dollars) | |||||||||||||||||||||||||||||
| December 31, 2024 | Carrying amount |
Fair value |
Level 1 | Level 2 | Level 3 | ||||||||||||||||||||||||
| Long-term investments carried at fair value | $ | 2.1 | $ | 2.1 | $ | 2.1 | $ | — | $ | — | |||||||||||||||||||
Other receivables |
0.6 | 0.5 | — | 0.5 | — | ||||||||||||||||||||||||
| Derivative instruments: | |||||||||||||||||||||||||||||
| Interest rate swaps designated as a hedge | 108.3 | 108.3 | — | 108.3 | — | ||||||||||||||||||||||||
| Commodity contracts for regulatory operations | 0.2 | 0.2 | — | 0.2 | — | ||||||||||||||||||||||||
| Total derivative instruments | 108.5 | 108.5 | — | 108.5 | — | ||||||||||||||||||||||||
| Total financial assets | $ | 111.2 | $ | 111.1 | $ | 2.1 | $ | 109.0 | $ | — | |||||||||||||||||||
| Long-term debt | $ | 6,207.0 | $ | 6,135.5 | $ | 1,922.6 | $ | 4,213.0 | $ | — | |||||||||||||||||||
| Convertible debentures | 0.3 | 0.2 | 0.2 | — | — | ||||||||||||||||||||||||
| Derivative instruments: | |||||||||||||||||||||||||||||
| Interest rate swaps designated as a hedge | 19.1 | 19.1 | — | 19.1 | — | ||||||||||||||||||||||||
| Commodity contracts for regulated operations | 0.3 | 0.3 | — | 0.3 | — | ||||||||||||||||||||||||
| Total derivative instruments | 19.4 | 19.4 | — | 19.4 | — | ||||||||||||||||||||||||
| Total financial liabilities | $ | 6,226.7 | $ | 6,155.1 | $ | 1,922.8 | $ | 4,232.4 | $ | — | |||||||||||||||||||
| Algonquin Power & Utilities Corp. | ||
Notes to the Unaudited Interim Condensed Consolidated Financial Statements | ||
| June 30, 2025 and 2024 | ||
| (millions of dollars) | |||||||||||
| Derivative | Notional quantity | Expiry | Hedged item | ||||||||
| Forward-starting interest rate swap | US$ | 350.0 | July 2029 | US$350.0 subordinated unsecured notes |
|||||||
| Cross-currency interest rate swap | C$ | 400.0 | January 2032 | C$400.0 subordinated unsecured notes |
|||||||
| Forward-starting interest rate swap | US$ | 750.0 | April 2032 | US$750.0 subordinated unsecured notes |
|||||||
| Three months ended | Six months ended | ||||||||||||||||||||||
| June 30 | June 30 | ||||||||||||||||||||||
| (millions of U.S. dollars) | 2025 | 2024 | 2025 | 2024 | |||||||||||||||||||
| Effective portion of cash flow hedge | $ | (1.8) | $ | 29.8 | $ | (22.2) | $ | 45.7 | |||||||||||||||
| Amortization of cash flow hedge | (0.3) | (0.5) | (0.6) | (1.0) | |||||||||||||||||||
| Amounts reclassified from AOCI | (0.2) | (0.1) | (0.4) | (6.0) | |||||||||||||||||||
| $ | (2.3) | $ | 29.2 | $ | (23.2) | $ | 38.7 | ||||||||||||||||
| Algonquin Power & Utilities Corp. | ||
Notes to the Unaudited Interim Condensed Consolidated Financial Statements | ||
| June 30, 2025 and 2024 | ||
| Three months ended | Six months ended | |||||||||||||||||||
| June 30 | June 30 | |||||||||||||||||||
| (millions of U.S. dollars) | 2025 | 2024 | 2025 | 2024 | ||||||||||||||||
| Amortization of cash flow hedge | $ | (0.3) | $ | (0.5) | $ | (0.6) | $ | (1.0) | ||||||||||||
| Unrealized gain (loss) on commodity contracts | 0.6 | 0.6 | (6.3) | 1.2 | ||||||||||||||||
| Gain (loss) on derivative financial instruments | $ | 0.3 | $ | 0.1 | $ | (6.9) | $ | 0.2 | ||||||||||||
| Algonquin Power & Utilities Corp. | ||
Notes to the Unaudited Interim Condensed Consolidated Financial Statements | ||
| June 30, 2025 and 2024 | ||
| Algonquin Power & Utilities Corp. | ||
Notes to the Unaudited Interim Condensed Consolidated Financial Statements | ||
| June 30, 2025 and 2024 | ||
| December 31, | ||||||||
| (millions of U.S. dollars) | 2024 | |||||||
Assets held for sale |
||||||||
Current assets |
||||||||
| Cash and cash equivalents | $ | 56.7 | ||||||
Trade and other receivables, net |
85.4 | |||||||
| Supplies and consumables inventory | 4.2 | |||||||
Prepaid expenses |
8.6 | |||||||
Derivatives instruments |
4.3 | |||||||
Other assets |
7.3 | |||||||
| 166.5 | ||||||||
| Non-current assets | ||||||||
Property, plant and equipment, net |
3,219.8 | |||||||
Intangible assets, net |
15.6 | |||||||
| Other long-term investments | 277.6 | |||||||
Derivative instruments |
3.6 | |||||||
Other assets |
12.5 | |||||||
| 3,529.1 | ||||||||
Total assets held for sale |
$ | 3,695.6 | ||||||
Liabilities associated with assets held for sale |
||||||||
Current liabilities |
||||||||
Accounts payable |
$ | 23.0 | ||||||
Accrued liabilities |
106.8 | |||||||
| Other long-term liabilities | 0.8 | |||||||
Derivative instruments |
22.4 | |||||||
| 153.0 | ||||||||
| Non-current liabilities | ||||||||
| Long-term debt | 1,348.7 | |||||||
Derivative instruments |
98.5 | |||||||
| Pension and other post-employment benefits obligation | 0.2 | |||||||
Other long-term liabilities |
126.9 | |||||||
| 1,574.3 | ||||||||
| Total liabilities associated with assets held for sale | $ | 1,727.3 | ||||||
| Algonquin Power & Utilities Corp. | ||
Notes to the Unaudited Interim Condensed Consolidated Financial Statements | ||
| June 30, 2025 and 2024 | ||
| Three months ended | Six months ended | |||||||||||||
| June 30, | June 30 | |||||||||||||
| (millions of U.S. dollars) | 2025 | 2024 | 2025 | 2024 | ||||||||||
Revenue |
||||||||||||||
| Non-regulated energy sales | $ | — | $ | 69.1 | $ | 7.4 | $ | 145.0 | ||||||
Other revenue |
— | 14.2 | — | 29.3 | ||||||||||
| — | 83.3 | 7.4 | 174.3 | |||||||||||
Operating expenses |
— | 45.6 | 8.7 | 96.4 | ||||||||||
Non-regulated energy purchased |
— | 0.6 | — | 4.0 | ||||||||||
Depreciation and amortization |
— | 34.4 | — | 69.8 | ||||||||||
| Loss on foreign exchange | — | 6.3 | — | 18.8 | ||||||||||
| — | 86.9 | $ | 8.7 | 189.0 | ||||||||||
| Operating loss from discontinued operations | — | (3.6) | (1.3) | (14.7) | ||||||||||
Interest expense |
— | (12.6) | — | (25.5) | ||||||||||
| Income (loss) from long-term investments | — | (1.1) | 8.1 | (31.5) | ||||||||||
| Loss on disposition | — | — | (0.8) | — | ||||||||||
| Other net losses | (3.9) | (11.1) | (7.0) | (17.3) | ||||||||||
| Loss before income taxes | (3.9) | (28.4) | (1.0) | (89.0) | ||||||||||
| Income tax recovery | 10.6 | 30.6 | 9.1 | 43.5 | ||||||||||
| Earnings (loss) from discontinued operations | $ | 6.7 | $ | 2.2 | $ | 8.1 | $ | (45.5) | ||||||
| Add: Net earnings attributable to non-controlling interest included in discontinued operations | — | 18.4 | — | 33.8 | ||||||||||
| Net earnings (loss) from discontinued operations attributable to AQN | $ | 6.7 | $ | 20.6 | $ | 8.1 | $ | (11.7) | ||||||
| Algonquin Power & Utilities Corp. | ||
Notes to the Unaudited Interim Condensed Consolidated Financial Statements | ||
| June 30, 2025 and 2024 | ||
| Three months ended | Six months ended | ||||||||||||||||||||||
| June 30, | June 30, | ||||||||||||||||||||||
| (millions of U.S. dollars) | 2025 | 2024 | 2025 | 2024 | |||||||||||||||||||
| Cash flows provided by (used in) | |||||||||||||||||||||||
| Operating activities | $ | — | $ | 78.3 | $ | — | $ | 76.8 | |||||||||||||||
| Investing activities | — | (88.3) | — | (110.1) | |||||||||||||||||||
 Management Discussion & Analysis
 | Explanatory Notes | |||||
| Caution Concerning Forward-Looking Statements and Forward-Looking Information | |||||
| Caution Concerning Non-GAAP Measures | |||||
| Overview and Business Strategy | |||||
| Financial Outlook | |||||
2025 Second Quarter Results From Operations |
|||||
2025 Year-to-Date Results From Operations |
|||||
| Regulated Services Group | |||||
Corporate Group Net Earnings and Adjusted Earnings |
|||||
Hydro Group Net Earnings |
|||||
Discontinued Operations: Renewable Energy Group |
|||||
| Non-GAAP Financial Measures | |||||
| Summary of Property, Plant and Equipment Expenditures | |||||
| Liquidity and Capital Reserves | |||||
| Share-Based Compensation Plans | |||||
| Enterprise Risk Management | |||||
| Quarterly Financial Information | |||||
| Disclosure Controls and Procedures | |||||
| Critical Accounting Estimates and Policies | |||||
| Algonquin Power & Utilities Corp. - Management Discussion & Analysis | 1 |
||||
| Algonquin Power & Utilities Corp. - Management Discussion & Analysis | 2 |
||||
| Algonquin Power & Utilities Corp. - Management Discussion & Analysis | 3 |
||||
| Algonquin Power & Utilities Corp. - Management Discussion & Analysis | |||||
| Algonquin Power & Utilities Corp. - Management Discussion & Analysis | 5 |
||||
| Algonquin Power & Utilities Corp. - Management Discussion & Analysis | 6 |
||||
| Algonquin Power & Utilities Corp. - Management Discussion & Analysis | |||||
| Algonquin Power & Utilities Corp. - Management Discussion & Analysis | |||||
| Algonquin Power & Utilities Corp. - Management Discussion & Analysis | 9 |
||||
Key Financial Information1 |
Three months ended June 30 | |||||||||||||
| (all dollar amounts in $ millions except per share information) | 2025 | 2024 | Change | |||||||||||
| Revenue | $ | 527.8 | $ | 515.3 | 2 | % | ||||||||
Net Revenue |
409.0 | 406.4 | 1 | % | ||||||||||
Net earnings attributable to shareholders from continuing operations |
17.4 | 180.1 | (90) | % | ||||||||||
Net earnings attributable to shareholders from discontinued operations |
6.7 | 20.6 | (67) | % | ||||||||||
Net earnings attributable to common shareholders from continuing operations and discontinued operations |
21.5 | 198.0 | (89) | % | ||||||||||
Adjusted Net Earnings2 |
36.2 | 41.5 | (13) | % | ||||||||||
Dividends declared to common shareholders |
50.4 | 83.7 | (40) | % | ||||||||||
| Weighted average number of common shares outstanding | 768,056,555 | 701,593,792 | ||||||||||||
| Per share | ||||||||||||||
Basic and diluted net earnings from continuing operations |
$ | 0.02 | $ | 0.26 | (92) | % | ||||||||
Basic and diluted net earnings from discontinued operations |
$ | 0.01 | $ | 0.02 | (50) | % | ||||||||
Adjusted Net Earnings2 |
$ | 0.04 | $ | 0.06 | (33) | % | ||||||||
| Dividends declared to common shareholders | $ | 0.07 | $ | 0.11 | (36) | % | ||||||||
| 1 | Reflects results of continuing operations unless marked otherwise (see Explanatory Notes). |
||||
| 2 | See Caution Concerning Non-GAAP Measures. |
||||
| Three months ended | ||||||||||||||
Net Earnings by business units2 and Total Adjusted Net Earnings1 |
June 30 | |||||||||||||
| (all dollar amounts in $ millions) | 2025 | 2024 | Change |
|||||||||||
Net earnings for Regulated Services Group |
$ | 47.1 | $ | 48.0 | $ | (0.9) | ||||||||
Net earnings for Hydro Group |
9.1 | 3.3 | $ | 5.8 | ||||||||||
Net earnings (loss) for Corporate Group |
(38.8) | 128.8 | $ | (167.6) | ||||||||||
Total AQN Net Earnings |
17.4 | 180.1 | (162.7) | |||||||||||
Add: Adjusted items |
18.8 | (138.6) | 157.4 | |||||||||||
Total AQN Adjusted Net Earnings1 |
$ | 36.2 | $ | 41.5 | $ | (5.3) | ||||||||
| Algonquin Power & Utilities Corp. - Management Discussion & Analysis | 10 |
||||
Change in Net Earnings and Adjusted Net Earnings1 Breakdown2 |
Three months ended June 30, 2025 | |||||||||||||
| (all dollar amounts in $ millions) | Regulated Services | Hydro | Corporate | Total | ||||||||||
Change in Net Earnings |
||||||||||||||
Net earnings - Prior period balances |
$ | 48.0 | $ | 3.3 | $ | 128.8 | $ | 180.1 | ||||||
EBIT1,3 |
||||||||||||||
Electricity |
(9.5) | — | — | (9.5) | ||||||||||
Natural Gas |
3.5 | — | — | 3.5 | ||||||||||
Water |
4.3 | — | — | 4.3 | ||||||||||
Other |
(3.7) | 0.2 | (195.9) | (199.4) | ||||||||||
Total change in EBIT1 |
(5.4) | 0.2 | (195.9) | (201.1) | ||||||||||
Interest expense (income) |
15.1 | (0.1) | 10.4 | 25.4 | ||||||||||
Income tax expense (recovery) |
(5.5) | 5.9 | 17.9 | 18.3 | ||||||||||
Net earnings attributable to non-controlling interests |
(5.1) | (0.2) | — | (5.3) | ||||||||||
Total change in net earnings (loss) |
(0.9) | 5.8 | (167.6) | (162.7) | ||||||||||
Net earnings (loss) - Current period balances |
47.1 | 9.1 | (38.8) | 17.4 | ||||||||||
Change in Adjusted Net Earnings1 |
||||||||||||||
Adjusted Net Earnings1 - Prior period balance3 |
48.0 | 3.3 | (9.8) | 41.5 | ||||||||||
Total change in net earnings |
(0.9) | 5.8 | (167.6) | (162.7) | ||||||||||
Total change in adjusted items,3 |
— | — | 157.4 | 157.4 | ||||||||||
Adjusted Net Earnings (loss)1 - Current period balances |
$ | 47.1 | $ | 9.1 | $ | (20.0) | $ | 36.2 | ||||||
| 1 | See Caution Concerning Non-GAAP Measures. |
||||
| 2 | Reflects results of continuing operations unless marked otherwise (see Explanatory Notes). |
||||
| 3 | See Corporate Group Net Earnings and Adjusted Net Earnings. | ||||
| Algonquin Power & Utilities Corp. - Management Discussion & Analysis | |||||
| Algonquin Power & Utilities Corp. - Management Discussion & Analysis | |||||
Key Financial Information |
Six months ended June 30 | |||||||||||||||||||
| (all dollar amounts in $ millions except per share information) | 2025 | 2024 | Change | |||||||||||||||||
| Revenue | $ | 1,220.2 | $ | 1,161.5 | 5 | % | ||||||||||||||
Net Revenue |
903.1 | 854.7 | 6 | % | ||||||||||||||||
Net earnings attributable to shareholders from continuing operations |
112.8 | 123.3 | (9) | % | ||||||||||||||||
Net earnings (loss) attributable to shareholders from discontinued operations |
8.1 | (11.7) | 169 | % | ||||||||||||||||
Net earnings attributable to common shareholders from continuing operations and discontinued operations |
115.7 | 106.5 | 9 | % | ||||||||||||||||
Adjusted Net Earnings2 |
147.8 | 121.6 | 22 | % | ||||||||||||||||
| Dividends declared to common shareholders | 100.8 | 159.2 | (37) | % | ||||||||||||||||
| Weighted average number of common shares outstanding | 767,864,646 | 695,700,444 | ||||||||||||||||||
| Per share | ||||||||||||||||||||
Basic and diluted net earnings from continuing operations |
$ | 0.14 | $ | 0.17 | (18) | % | ||||||||||||||
Basic and diluted net earnings (loss) from discontinued operations |
$ | 0.01 | $ | (0.02) | 150 | % | ||||||||||||||
Adjusted Net Earnings2 |
$ | 0.19 | $ | 0.17 | 12 | % | ||||||||||||||
| Dividends declared to common shareholders | $ | 0.13 | $ | 0.22 | (41) | % | ||||||||||||||
| 1 | Reflects results of continuing operations unless marked otherwise (see Explanatory Notes). |
||||
| 2 | See Caution Concerning Non-GAAP Measures. |
||||
| Six months ended | ||||||||||||||
Net Earnings and Adjusted Net Earnings1 by business units2 |
June 30 | |||||||||||||
| (all dollar amounts in $ millions) | 2025 | 2024 | Change |
|||||||||||
Net earnings for Regulated Services Group |
$ | 173.3 | $ | 134.9 | $ | 38.4 | ||||||||
Net earnings for Hydro Group |
25.7 | 5.8 | 19.9 | |||||||||||
Net earnings for Corporate Group |
(86.2) | (17.4) | (68.8) | |||||||||||
Total AQN Net Earnings |
112.8 | 123.3 | (10.5) | |||||||||||
Add: Adjusted items |
35.0 | (1.7) | 36.7 | |||||||||||
Total AQN Adjusted Net Earnings1 |
$ | 147.8 | $ | 121.6 | $ | 26.2 | ||||||||
| Algonquin Power & Utilities Corp. - Management Discussion & Analysis | 13 |
||||
Change in Net Earnings and Adjusted Net Earnings1 Breakdown2 |
Six months ended June 30 | |||||||||||||
| (all dollar amounts in $ millions) | Regulated Services | Hydro | Corporate | Total | ||||||||||
Change in Net Earnings |
||||||||||||||
Net earnings (loss) - Prior period balances |
$ | 134.9 | $ | 5.8 | $ | (17.4) | $ | 123.3 | ||||||
EBIT1 |
||||||||||||||
Electricity |
9.5 | — | — | 9.5 | ||||||||||
Natural Gas |
17.2 | — | — | 17.2 | ||||||||||
Water |
7.0 | — | — | 7.0 | ||||||||||
Other |
(1.2) | 0.9 | (84.4) | (84.7) | ||||||||||
Total change in EBIT1 |
32.5 | 0.9 | (84.4) | (51.0) | ||||||||||
Interest expense |
29.1 | — | 14.5 | 43.6 | ||||||||||
Income tax expense (recovery) |
(20.2) | 19.2 | 1.1 | 0.1 | ||||||||||
Net earnings (loss) attributable to non-controlling interests |
(3.0) | (0.2) | — | (3.2) | ||||||||||
Total change in net earnings |
38.4 | 19.9 | (68.8) | (10.5) | ||||||||||
Net earnings (loss) - Current period balances |
173.3 | 25.7 | (86.2) | 112.8 | ||||||||||
Change in Adjusted Net Earnings1 |
||||||||||||||
Adjusted Net Earnings1 - Prior period balance3 |
134.9 | 5.8 | (19.1) | 121.6 | ||||||||||
| Total change in net earnings | 38.4 | 19.9 | (68.8) | (10.5) | ||||||||||
Total change in adjusted items3 |
— | — | 36.7 | 36.7 | ||||||||||
Adjusted Net Earnings (loss)1 - Current period balances |
$ | 173.3 | $ | 25.7 | $ | (51.2) | $ | 147.8 | ||||||
| 1 | See Caution Concerning Non-GAAP Measures. |
||||
| 2 | Reflects results of continuing operations unless marked otherwise (see Explanatory Notes). |
||||
| 3 | See Corporate Group Net Earnings and Adjusted Net Earnings. |
||||
| Algonquin Power & Utilities Corp. - Management Discussion & Analysis | |||||
| Algonquin Power & Utilities Corp. - Management Discussion & Analysis | |||||
| Utility System Type | As at June 30 | ||||||||||||||||||||||
| 2025 | 2024 | ||||||||||||||||||||||
| (all dollar amounts in $ millions) | Assets | Net Utility Sales1 |
Total Customer Connections2 |
Assets | Net Utility Sales3 |
Total Customer Connections2 |
|||||||||||||||||
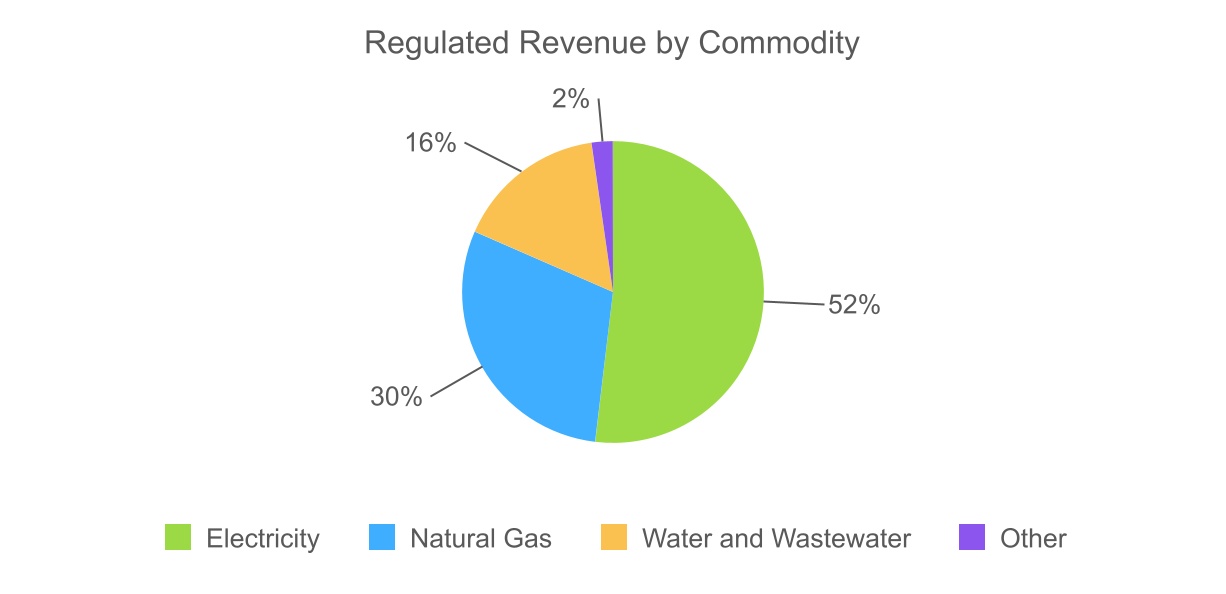
| Electricity | 5,480.3 | 448.4 | 310,000 | 5,352.3 | 430.4 | 310,000 | |||||||||||||||||
| Natural Gas | 1,946.2 | 225.2 | 378,000 | 1,866.2 | 209.3 | 376,000 | |||||||||||||||||
| Water and Wastewater | 1,819.9 | 181.1 | 580,000 | 1,692.1 | 169.6 | 574,000 | |||||||||||||||||
| Other | 114.3 | 14.9 | 140.8 | 15.1 | |||||||||||||||||||
| Other revenue | 27.4 | 25.7 | |||||||||||||||||||||
| Less: Cost of Sales | (12.5) | (10.6) | |||||||||||||||||||||
| Total | $ | 9,360.7 | $ | 869.6 | 1,268,000 | $ | 9,051.4 | $ | 824.4 | 1,260,000 | |||||||||||||
| Accumulated Deferred Income Taxes Liability | $ | 878.1 | $ | 782.4 | |||||||||||||||||||
| 1 | Net Utility Sales for the six months ended June 30, 2025. See Caution Concerning Non-GAAP Measures. |
||||
| 2 | Total Customer Connections represents the sum of all active and vacant customer connections. | ||||
| 3 | Net Utility Sales for the six months ended June 30, 2024. See Caution Concerning Non-GAAP Measures. |
||||
| Algonquin Power & Utilities Corp. - Management Discussion & Analysis | 16 |
||||
| Electric Distribution Systems | Three months ended June 30 | Six months ended June 30 | |||||||||||||||||||||
| 2025 | 2024 | 2025 | 2024 | ||||||||||||||||||||
| Average Active Electric Customer Connections For The Period | |||||||||||||||||||||||
| Residential | 263,400 | 263,500 | 263,300 | 263,300 | |||||||||||||||||||
| Commercial and industrial | 43,400 | 43,000 | 43,400 | 43,000 | |||||||||||||||||||
| Total Average Active Electric Customer Connections For The Period | 306,800 | 306,500 | 306,700 | 306,300 | |||||||||||||||||||
| Customer Usage (GW-hrs) | |||||||||||||||||||||||
| Residential | 552.6 | 586.6 | 1,417.8 | 1,383.3 | |||||||||||||||||||
| Commercial and industrial | 935.1 | 953.6 | 1,870.5 | 1,897.3 | |||||||||||||||||||
| Total Customer Usage (GW-hrs) | 1,487.7 | 1,540.2 | 3,288.3 | 3,280.6 | |||||||||||||||||||
| Natural Gas Distribution Systems | Three months ended June 30 | Six months ended June 30 | |||||||||||||||||||||
| 2025 | 2024 | 2025 | 2024 | ||||||||||||||||||||
| Average Active Natural Gas Customer Connections For The Period | |||||||||||||||||||||||
| Residential | 323,900 | 323,300 | 324,100 | 324,100 | |||||||||||||||||||
| Commercial and industrial | 40,500 | 40,000 | 40,600 | 40,100 | |||||||||||||||||||
| Total Average Active Natural Gas Customer Connections For The Period | 364,400 | 363,300 | 364,700 | 364,200 | |||||||||||||||||||
| Customer Usage (MMBTU) | |||||||||||||||||||||||
| Residential | 3,297,000 | 3,393,000 | 14,462,000 | 13,667,000 | |||||||||||||||||||
| Commercial and industrial | 4,191,000 | 4,018,000 | 13,351,000 | 12,736,000 | |||||||||||||||||||
| Total Customer Usage (MMBTU) | 7,488,000 | 7,411,000 | 27,813,000 | 26,403,000 | |||||||||||||||||||
| Algonquin Power & Utilities Corp. - Management Discussion & Analysis | 17 |
||||
| Water and Wastewater Distribution Systems | Three months ended June 30 | Six months ended June 30 | |||||||||||||||||||||
| 2025 | 2024 | 2025 | 2024 | ||||||||||||||||||||
| Average Active Customer Connections For The Period | |||||||||||||||||||||||
| Water distribution customer connections | 515,700 | 509,700 | 515,100 | 509,000 | |||||||||||||||||||
| Wastewater customer connections | 55,900 | 55,700 | 55,800 | 55,700 | |||||||||||||||||||
| Total Average Active Customer Connections For The Period | 571,600 | 565,400 | 570,900 | 564,700 | |||||||||||||||||||
| Gallons Provided (millions of gallons) | |||||||||||||||||||||||
| Water provided | 9,707 | 9,243 | 18,669 | 18,073 | |||||||||||||||||||
| Wastewater treated | 885 | 918 | 1,847 | 1,850 | |||||||||||||||||||
| Total Gallons Provided (millions of gallons) | 10,592 | 10,161 | 20,516 | 19,923 | |||||||||||||||||||
| Algonquin Power & Utilities Corp. - Management Discussion & Analysis | |||||
| Three months ended | Six months ended | ||||||||||||||||||||||
| June 30 | June 30 | ||||||||||||||||||||||
| (all dollar amounts in $ millions) | 2025 | 2024 | 2025 | 2024 | |||||||||||||||||||
| Revenue | |||||||||||||||||||||||
| Regulated electricity distribution | $ | 292.0 | $ | 304.2 | $ | 622.4 | $ | 610.1 | |||||||||||||||
| Less: Regulated electricity purchased | (78.3) | (81.7) | (174.0) | (179.7) | |||||||||||||||||||
Net Utility Sales – electricity1 |
213.7 | 222.5 | 448.4 | 430.4 | |||||||||||||||||||
| Regulated gas distribution | 109.0 | 94.2 | 355.7 | 328.2 | |||||||||||||||||||
| Less: Regulated gas purchased | (32.8) | (22.9) | (130.5) | (118.9) | |||||||||||||||||||
|
Net Utility Sales – natural gas1
|
76.2 | 71.3 | 225.2 | 209.3 | |||||||||||||||||||
| Regulated water reclamation and distribution | 103.3 | 92.8 | 193.7 | 177.8 | |||||||||||||||||||
| Less: Regulated water purchased | (7.7) | (4.3) | (12.6) | (8.2) | |||||||||||||||||||
Net Utility Sales – water reclamation and distribution1 |
95.6 | 88.5 | 181.1 | 169.6 | |||||||||||||||||||
Other revenue2 |
12.6 | 14.0 | 27.4 | 25.7 | |||||||||||||||||||
Less: Other Cost of Sales |
(5.8) | (6.0) | (12.5) | (10.6) | |||||||||||||||||||
Net Utility Sales1,3 |
392.3 | — | 390.3 | — | 869.6 | — | 824.4 | ||||||||||||||||
| Operating expenses | 211.2 | 209.6 | 417.3 | 412.5 | |||||||||||||||||||
| Depreciation and amortization | 105.0 | 100.1 | 198.3 | 191.9 | |||||||||||||||||||
| Interest, dividend and other income | 5.6 | 7.5 | 14.0 | 15.4 | |||||||||||||||||||
Other expenses |
|||||||||||||||||||||||
| Pension and post-employment non-service costs | $ | (2.8) | $ | (4.0) | (0.5) | $ | (7.4) | ||||||||||||||||
Other net losses |
$ | (2.9) | $ | (1.7) | (10.3) | $ | (1.4) | ||||||||||||||||
| Gain/(Loss) on derivative financial instruments | $ | 0.3 | $ | (0.7) | 0.6 | $ | (1.3) | ||||||||||||||||
EBIT1,4 |
$ | 76.3 | $ | 81.7 | $ | 257.8 | $ | 225.3 | |||||||||||||||
| Interest expense | (34.1) | (49.2) | (69.2) | (98.3) | |||||||||||||||||||
| Income tax expense | $ | (14.1) | $ | (8.6) | (53.2) | (33.0) | |||||||||||||||||
Net earnings attributable to non-controlling interests6 |
$ | 19.0 | $ | 24.1 | 37.9 | 40.9 | |||||||||||||||||
Net Earnings |
$ | 47.1 | $ | — | $ | 48.0 | $ | — | $ | 173.3 | $ | 134.9 | |||||||||||
| 1 | See Caution Concerning Non-GAAP Measures. |
||||
| 2 | See Note 14 in the unaudited interim condensed consolidated financial statements. |
||||
| 3 | This table contains a reconciliation of Net Utility Sales to revenue for the Regulated Services Group. The relevant sections of the table are derived from and should be read in conjunction with the unaudited interim condensed consolidated statement of operations and Note 14 in the unaudited interim condensed consolidated financial statements, "Segmented Information". This supplementary disclosure is intended to more fully explain disclosures related to Net Utility Sales and provides additional information related to the operating performance of the Regulated Services Group. Investors are cautioned that Net Utility Sales should not be construed as an alternative to revenue. |
||||
| 4 | This table contains a reconciliation of EBIT to net earnings for the Regulated Services Group. The relevant sections of the table are derived from and should be read in conjunction with the unaudited interim condensed consolidated statement of operations and Note 14 in the unaudited interim condensed consolidated financial statements, "Segmented Information". This supplementary disclosure is intended to more fully explain disclosures related to EBIT and provides additional information related to the operating performance of the Regulated Services Group. Investors are cautioned that EBIT should not be construed as an alternative to net earnings. |
||||
| 6 | Net earnings attributable to non-controlling interests primarily includes HLBV income from Empire Electric. |
||||
| Algonquin Power & Utilities Corp. - Management Discussion & Analysis | 19 |
||||
| (all dollar amounts in $ millions) | Three months ended June 30 | ||||
Prior Period Net Earnings |
$ | 48.0 | |||
Regulated Services Group EBIT1: |
|||||
|
Electricity:
Decrease is primarily due to:
–unfavourable weather compared to the prior period, which resulted in a decrease in net earnings of approximately $6.6 million
–one-time revenues of $3.9 million at the BELCO Electric System in the second quarter of 2024 from an increased revenue requirement with recoupment to the first quarter of 2024, partially offset by the implementation of approved rates at the BELCO Electric System of $1.6 million
|
(9.5) | ||||
|
Gas:
Increase is primarily due to:
–the implementation of approved rates of $3.9 million at Midstates (MO, IL) and Peach State (GA) Gas Systems
–higher revenue of approximately $1.3 million in the second quarter of 2025 relating to one-time lower revenues recorded in the second quarter of 2024 at the EnergyNorth (NH) Gas System
–lower bad debt expense of approximately $3.0 million mainly due to a one-time expense recorded in the second quarter of 2024
–one-time write off of approximately $1.3 million of accrued liabilities;
Partially offset by:
–higher operating expenses including one-time expenses of $1.0 million relating to the gas incident in Lexington, Missouri at the Empire (MO) Gas System
–higher depreciation across the majority of gas systems of $2.6 million
|
3.5 | ||||
|
Water:
Increase is primarily due to:
–the implementation of approved rates of $10.0 million at the New York (NY) (2024 approved rates were effective in the third quarter of 2024, retroactive to the second quarter of 2024), Midstates (MO, IL) and Arkansas (AR) Water Systems;
Partially offset by:
–higher depreciation of $2.0 million driven by one-time expenses at the Litchfield Park (AZ) Water and Sewer System; and
–rate case adjustment of $3.3 million at the Litchfield Park (AZ) Water and Sewer System
|
4.3 | ||||
Other: Decrease is primarily due to timing of expenses with no impact expected on the full year |
(3.7) | ||||
Interest expense: Decrease due to repayment of debt |
15.1 | ||||
| Income tax expense: Higher income tax expense due to higher earnings before tax | (5.5) | ||||
Net earnings attributable to non-controlling interests: Decrease due to lower wind production resulting in lower HLBV |
(5.1) | ||||
Current Period Net Earnings |
$ | 47.1 | |||
| 1 | See Caution Concerning Non-GAAP Measures. |
||||
| Algonquin Power & Utilities Corp. - Management Discussion & Analysis | 20 |
||||
| Algonquin Power & Utilities Corp. - Management Discussion & Analysis | 21 |
||||
| (all dollar amounts in $ millions) | Six months ended June 30 | ||||
| Prior Period Net Earnings | $ | 134.9 | |||
Regulated Services Group EBIT1: |
|||||
|
Electricity:
Increase is primarily due to:
–a one-time $7.0 million true-up recorded in the first quarter of 2024 at the Empire District Electric System
–favourable weather, which resulted in an increase of net earnings of approximately $4.4 million at the Empire District Electric System
–the implementation of approved rates at the BELCO Electric System of $2.9 million (2024 approved rates were effective in the second quarter of 2024)
–one-time depreciation adjustment of $4.2 million related to Granite State Electric partially offset by higher depreciation across all utilities of $3.8 million
Partially offset by:
–a one-time reduction of plant in service of $4.8 million related to Granite State Electric
|
9.5 | ||||
|
Gas:
Increase is primarily due to:
–the implementation of approved rates of $10.7 million at the Midstates (MO, IL) and Peach State (GA) Gas Systems
–higher revenue of approximately $2.0 million relating to one-time lower revenues recorded in the first and second quarters of 2024
–lower bad debt expense of $5.0 million including approximately $3.0 million of one-time expense recorded in the second quarter of 2024
–increase in other income of $5.6 million at the Empire (MO) Gas System relating to a one-time rate case adjustment due to over-amortization of pension and Other Post-Employment Benefits balance
Partially offset by:
–higher depreciation across the majority of gas systems of $4.7 million
–higher property tax of $1.5 million at the EnergyNorth (NH) gas system, only partially recovered through higher property tax mechanism revenues
|
17.2 | ||||
|
Water:
Increase is primarily due to:
–the implementation of approved rates of $14.8 million at the New York (NY) (2024 approved rates were effective the third quarter of 2024, retroactive to the second quarter of 2024), Midstates (MO, IL) and Arkansas (AR) Water Systems
Partially offset by:
–higher depreciation of $2.0 million
–rate case adjustment of $3.3 million at the Litchfield Park (AZ) Water and Sewer System
|
7.0 | ||||
Other: |
(1.2) | ||||
| Interest expense: Decrease due to repayment of debt | 29.1 | ||||
| Income tax expense: Increase primarily due to higher earnings before tax | (20.2) | ||||
Net earnings attributable to non-controlling interests: Decrease due to lower wind production resulting in lower HLBV |
(3.0) | ||||
| Current Period Net Earnings | $ | 173.3 | |||
1 See Caution Concerning Non-GAAP Measures. |
|||||
| Algonquin Power & Utilities Corp. - Management Discussion & Analysis | |||||
| Utility | Jurisdiction | Regulatory Proceeding Type | Rate Request (millions) |
Current Status | ||||||||||
| Completed Rate Reviews | ||||||||||||||
| BELCO | Bermuda | General Rate Case ("GRC") | $34.8 | On September 30, 2021, filed its revenue allowance application in which it requested a $34.8 million increase for 2022 and a $6.1 million increase for 2023. On March 18, 2022, the Regulatory Authority ("RA") approved an annual increase of $22.8 million, for a revenue allowance of $224.1 million for 2022 and $226.2 million for 2023. The RA authorized a 7.16% rate of return, comprised of a 62% equity and an 8.92% return on equity ("ROE"). In April 2022, BELCO filed an appeal in the Supreme Court of Bermuda challenging the decisions made by the RA through the recent Retail Tariff Review. On February 23, 2024, the Bermuda Supreme Court issued an order denying the BELCO appeal. On April 11, 2025, BELCO and the RA filed a consent order with the court thereby concluding the matter. |
||||||||||
| Midstates Gas | Missouri | GRC | $13.2 | On February 9, 2024, filed an application seeking an increase in revenues of $13.2 million based on an ROE of 10.80% and an equity ratio of 52.92%. On July 18, 2024, the Staff of the MPSC and Office of the Public Counsel ("OPC") filed direct testimony. Staff proposed a base revenue increase of $4.4 million based on a 50% equity ratio and 9.45% ROE. OPC recommended a 47.5% equity ratio and 9.50% ROE. On August 22, 2024 the parties filed rebuttal testimony. On September 19, 2024 the parties filed surrebuttal testimony. On October 9, 2024, Staff filed a motion to suspend the procedural schedule and evidentiary hearing given that the parties reached a settlement resolving all issues. The parties filed a stipulation agreement on October 22, 2024 agreeing to an increase in annual distribution revenues of $9.1 million. On November 6, 2024, the MPSC unanimously voted to approve the settlement agreement. A written order was issued January 2, 2025 with approved rates effective January 8, 2025. |
||||||||||
| Missouri Water | Missouri | GRC | $8.1 | On March 13, 2024, filed an application seeking an increase in revenues of $8.1 million based on an ROE of 10.62% and an equity ratio of 52.6%. On August 20, 2024, Staff filed direct testimony recommending an increase in annual revenues of $7.8 million based on an ROE of 9.45% and an equity ratio of 50%. The City of Bolivar recommended an increase in annual revenues of $7.5 million. On September 27, 2024, the parties filed rebuttal testimony. Surrebuttal testimony was filed on October 24, 2024. On December 6, 2024, a Unanimous Global Stipulation & Agreement was filed with the MPSC with an annual revenue increase of approximately $6.2 million. The MPSC issued an order approving the settlement on January 23, 2025. Approved rates became effective on March 1, 2025. |
||||||||||
| Algonquin Power & Utilities Corp. - Management Discussion & Analysis | 23 |
||||
| Utility | Jurisdiction | Regulatory Proceeding Type | Rate Request (millions) |
Current Status | ||||||||||
| Arkansas Water | Arkansas | GRC | $2.3 | On March 14, 2024, filed an application seeking an increase in revenues of $2.3 million based on an ROE of 10.62% and an equity ratio of 52.5%. On August 27, 2024, Staff filed testimony recommending an annual revenue increase of $1.5 million, based on an ROE of 9.80%. On September 24, 2024, the Company filed rebuttal testimony updating its proposed annual revenue increase to $1.8 million. Surrebuttal testimony was filed by the parties on October 22, 2024 and the Company's surrebuttal testimony was filed on October 29, 2024. On November 12, 2024, the Company and the Staff of the Arkansas Public Service Commission (“APSC”) filed a settlement with an annual revenue increase of $1.5 million. On January 14, 2025, the APSC issued an order approving the settlement agreement and ordered compliance tariffs to be filed within seven days of the January 14, 2025 order. The APSC approved the compliance tariffs on February 7, 2025. Approved rates became effective March 1, 2025. |
||||||||||
| New Brunswick Gas | New Brunswick | GRC | C$1.6 | On April 15, 2024, filed an application seeking an increase in revenues of C$1.6 million based on an ROE of 9.80% and an equity ratio of 45%. On August 16, 2024, the Office of the Public Intervenor filed testimony. On September 27, 2024, the Company filed rebuttal testimony. An evidentiary hearing was held on October 4, 7 and 8, 2024. On December 31, 2024, the New Brunswick Energy & Utilities Board (the "Board") issued an order authorizing an annual increase in revenue of C$1.2 million; on April 30, 2025, the Board issued its Reasons for Decision. |
||||||||||
| Rio Rico Water & Sewer, Bella Vista Water, Beardsley Water, Cordes Lakes Water | Arizona | GRC | $6.0 | On December 28, 2023, filed an application seeking an increase in revenues of $6.0 million based on an ROE of 10.95% and an equity ratio of 54%. On June 26, 2024, the Arizona Corporation Commission ("ACC") granted the Company's request to extend the procedural schedule with a hearing on the merits scheduled for March 24-28, 2025. Staff testimony, which recommends an increase of $2.9 million in revenue based on an ROE of 9.4% and an equity ratio of 54%, was filed and supplemented on January 8, 2025. On February 5, 2025, the Company notified the ACC that the parties had reached a settlement in principle that would resolve all matters in the rate case. The parties filed a settlement agreement on February 21, 2025, which would result in an increase in revenues of $4.2 million. On March 25-26, 2025 the ACC held a hearing on the settlement agreement. On June 18, 2025, the ACC approved the settlement agreement with approved rates taking effect July 1, 2025. |
||||||||||
| Algonquin Power & Utilities Corp. - Management Discussion & Analysis | |||||
| Utility | Jurisdiction | Regulatory Proceeding Type | Rate Request (millions) |
Current Status | ||||||||||
| Granite State Electric | New Hampshire | GRC | $15.5 | On May 5, 2023, filed an application seeking a permanent increase in revenues of $15.5 million based on an ROE of 10.35% and an equity ratio of 55%. Temporary rates of $5.5 million were implemented on July 1, 2023. On December 13, 2023, the Department of Energy ("DOE") filed a motion seeking to dismiss the case. An evidentiary hearing was held on January 23, 2024. The case was stayed by the New Hampshire Public Utilities Commission ("NHPUC") until May 15, 2024 so that it may contemplate the motion and the Company's third-party review of its financial information. On April 2, 2024 the NHPUC directed the Company to cooperate with the DOE and all other parties to develop a mutually-agreeable scope of work for the third-party report, to be filed with the NHPUC no later than April 15, 2024. Because there was no agreement on the scope of work, the Company filed the third-party report which concluded that the accounting information included in the rate filing provides a sufficient basis for determining the Company’s revenue requirement and that 2023 accounting data provides a sufficient basis for inclusion in the Company’s regulatory filings. On April 24, 2024, the Company filed an updated revenue requirement, seeking an increase in revenues of $14.7 million. On April 30, 2024, the NHPUC rejected the scope of the third-party report that was submitted, ordered an independent audit facilitated by the DOE with a procedural schedule for the next phase of the proceeding due no later than May 20, 2024, and deferred a ruling on the DOE motion to dismiss. The NHPUC extended the stay until September 16, 2024 to assess the issues that were raised in the docket and called for a status report required by August 30, 2024. On September 30, 2024, the Company notified the NHPUC that the parties were engaged in settlement discussions. The parties filed a settlement agreement on November 18, 2024. A hearing on the settlement agreement was held on January 15, 2025. Initial briefs on the NHPUC's authority to approve the settlement were filed January 31, 2025. A hearing was held March 20, 2025. On March 25, 2025, the NHPUC issued a Procedural Order approving the settlement agreement which resulted in a $5.5 million increase in annual revenues. Approved rates took effect April 1, 2025. On April 24, 2025, the NHPUC issued a further order stating its reasons for approval of the settlement agreement. |
||||||||||
| Algonquin Power & Utilities Corp. - Management Discussion & Analysis | |||||
| Utility | Jurisdiction | Regulatory Proceeding Type | Rate Request (millions) |
Current Status | ||||||||||
Pending Rate Reviews |
||||||||||||||
| EnergyNorth Gas | New Hampshire | GRC | $27.5 | On July 27, 2023, filed an application seeking an increase in revenues of $27.5 million based on an ROE of 10.35% and an equity ratio of 55%. Temporary rates of $8.7 million were approved by the NHPUC on October 31, 2023. The temporary increased revenue requirement is retroactive to October 1, 2023. On February 5, 2024, the Company requested that the NHPUC stay the case until April 12, 2024 so that the Company can provide the NHPUC with a third-party review of the financial information upon which the revenue requirement is predicated. On February 16, 2024, the DOE filed a motion seeking to dismiss the case. On March 14, 2024 the NHPUC issued an order staying the case until June 7, 2024, so that it may contemplate the motion and so that the Company can provide the NHPUC with a third-party review of the financial information within the rate application. On April 17, 2024, the Company filed a proposed scope for the third-party review. On August 16, 2024 the DOE filed a status update informing NHPUC that the parties met to discuss a comprehensive settlement of all issues in the case and intend to more fully engage in settlement discussions once a settlement in the Granite State Electric case is reached. On November 20, 2024, the NHPUC extended the stay of the proceeding to accommodate settlement negotiations until January 21, 2025. On April 21, 2025, the NHPUC further extended the stay of the proceeding until May 30, 2025. On June 13, 2025, a settlement agreement was filed with the NHPUC supporting a continuation of rates approved on October 31, 2023. A hearing on the settlement was held July 31, 2025. |
||||||||||
| Park Water | California | GRC | $9.3 | On January 2, 2024, filed an application seeking an increase in revenues of $9.3 million based on an ROE of 9.35% and an equity ratio of 57%. On July 24, 2024, the Public Advocates Office at the California Public Utilities Commission (the "California PUC") filed testimony recommending a $2.4 million decrease in revenues for 2025. On September 23, 2024, the Company served rebuttal testimony seeking $9.0 million revenue increase. Legal briefs were filed in December 2024. On December 5, 2024, in the Cost of Capital proceeding for Small Class A Water Utilities, the California PUC issued an order increasing Park Water's ROE to 9.57%. On May 30, 2025, the Commission authorized an interim increased revenue requirement of $0.9 million or 2.3%, effective July 1, 2025. |
||||||||||
| Apple Valley Water | California | GRC | $3.1 | On January 2, 2024, filed an application seeking an increase in revenues of $3.1 million based on an ROE of 9.35% and an equity ratio of 57%. On July 24, 2024, the Public Advocates Office at the California PUC filed testimony recommending a $3.9 million decrease in revenues for 2025. On September 23, 2024, the Company served rebuttal testimony seeking $2.9 million revenue increase. Legal briefs were filed in December 2024. On December 5, 2024, in the Cost of Capital proceeding for Small Class A Water Utilities, the California PUC issued an order increasing Apple Valley Water’s ROE to 9.57%. On May 30, 2025, the Commission authorized an interim increased revenue requirement of $0.7 million, or 2.3%, effective July 1, 2025. |
||||||||||
| Algonquin Power & Utilities Corp. - Management Discussion & Analysis | |||||
| Utility | Jurisdiction | Regulatory Proceeding Type | Rate Request (millions) |
Current Status | ||||||||||
| CalPeco Electric | California | GRC | $39.8 | On September 20, 2024, filed an application seeking a net increase in revenues of $39.8 million based on an ROE of 11% and an equity ratio of 52.5%. On March 5, 2025, the Company filed a Motion for Interim Rate Relief and Request for Expedited Treatment in which it requested an interim rate recovery of 50% of its proposed base revenue requirement on a monthly basis beginning June 1, 2025 until issuance of a final decision in the proceeding. The Utility Reform Network ("TURN") and the Public Advocates Office ("Cal Advocates") opposed the Company’s request. On July 2, 2025, Cal Advocates, TURN and other intervenors in the proceeding filed testimony. Cal Advocates recommended an overall increase of $24.8 million. The Company served rebuttal testimony on July 24, 2025. |
||||||||||
| Empire Electric | Missouri | GRC | $152.8 | On November 6, 2024, filed an application seeking an increase in net operating revenues of $92.1 million based on an ROE of 10% and an equity ratio of 53.1%. On February 3, 2025, Staff of the MPSC and the Office of the Public Counsel filed motions to dismiss the case. The Company withdrew its tariff sheets on February 26, 2025 and refiled revised tariff sheets on the same day seeking a base rate revenue increase of $152.8 million. When considering the rebasing of test year revenues for fuel and purchased power costs and the energy efficiency cost recovery rate, the filing continues to seek a net operating revenue increase of $92.1 million. On March 5, 2025, the MPSC suspended the new tariff sheets until January 2, 2026. On April 10, 2025, the MPSC approved a procedural schedule for the case and on April 23, 2025, the Commission extended the true-up period from September 30, 2024 to March 31, 2025. On July 2, 2025, the Staff of the MPSC filed direct testimony proposing a $121 million base rate revenue increase. Staff recommended an equity ratio of 53.1% and an ROE of 9.5% but with a proposed 100 basis point reduction associated with customer service and billing issues. Rebuttal Testimony is due on August 18, 2025. |
||||||||||
| St. Lawrence Gas | New York | GRC | $2.2 | On November 27, 2024, filed an application seeking an increase of revenues of $2.2 million based on an ROE of 9.9% and an equity ratio of 48%. On April 1, 2025, Staff of the New York Department of Public Service recommended a $1.19 million decrease in rates. On April 22, 2025, the Company submitted rebuttal testimony requesting approximately $2.33 million. The Company filed notice and began confidential settlement negotiations on May 6, 2025. |
||||||||||
| New England Natural Gas | Massachusetts | GRC | $55.8 | On June 13, 2025, filed an application seeking an increase of revenues of $55.8 million based on an ROE of 9.9% and an equity ratio of 53%. The request includes approximately $30 million of previously authorized Gas System Enhancement Program rate base and a 5 year performance based ratemaking plan. |
||||||||||
Litchfield Park Water & Sewer |
Arizona | GRC | $17.8 | On June 30, 2025, filed rate applications with the Arizona Corporation Commission for its water and wastewater systems, requesting a combined revenue increase of $17.8 million. The request is based on an ROE of 10.8% and an equity ratio of 54%. As part of the application, the Company is seeking approval for the implementation of an annual formula rate based adjustment mechanism. |
||||||||||
| Algonquin Power & Utilities Corp. - Management Discussion & Analysis | |||||
| Utility | Jurisdiction | Regulatory Proceeding Type | Rate Request (millions) |
Current Status | ||||||||||
CalPeco Electric |
California |
Wildfire Expense Memorandum Application |
$78.2 | On June 20, 2025, filed an application to recover $78.2M in costs associated with the 2020 Mountain View Fire recorded in the Wildfire Expense Memorandum Account. These costs include claim settlements in excess of Liberty’s wildfire insurance coverage, legal costs, and financing costs related to the Mountain View Fire. |
||||||||||
BELCO |
Bermuda |
GRC |
$2.9 | Since March 2025, BELCO has been providing data to the Bermuda Regulatory Authority to establish rates effective January 1, 2026 and January 1, 2027. BELCO has requested an increase in revenue of $1.9 million for 2026 and $1.0 million for 2027 (excluding fuel costs). This request is based on an ROE of 12.36% for both years and an equity ratio of 62%. A final order is expected in October 2025. |
||||||||||
| Algonquin Power & Utilities Corp. - Management Discussion & Analysis | |||||
2025 Second Quarter and Year-to-Date Corporate Group Net Earnings and Adjusted Net Earnings1,2 | |||||||||||||||||||||||
| Three months ended | Six months ended | ||||||||||||||||||||||
| June 30 | June 30 | ||||||||||||||||||||||
| (all dollar amounts in $ millions) | 2025 | 2024 | 2025 | 2024 | |||||||||||||||||||
| Revenue | 0.3 | 0.2 | 0.8 | 0.6 | |||||||||||||||||||
Less: Operating expenses |
3.2 | 2.3 | 3.9 | 3.0 | |||||||||||||||||||
| Less: (Gains)/Loss on foreign exchange | 14.0 | (2.1) | 17.9 | (2.6) | |||||||||||||||||||
Less: Depreciation and amortization |
0.2 | 0.8 | 0.4 | 1.5 | |||||||||||||||||||
Add: Interest, dividend and other income |
6.7 | 22.3 | 6.6 | 44.8 | |||||||||||||||||||
Add: Change in value of investments carried at fair value |
— | 169.9 | — | 22.2 | |||||||||||||||||||
Less: Other expenses |
|||||||||||||||||||||||
| Pension and post-employment non-service costs | — | — | — | — | |||||||||||||||||||
| Other gains/(losses) | 2.4 | (4.3) | (3.9) | (9.0) | |||||||||||||||||||
| Gain/(Loss) on derivative financial instruments | — | 0.8 | (7.5) | 1.5 | |||||||||||||||||||
Corporate Group EBIT1,3 |
(8.0) | 187.9 | (26.2) | 58.2 | |||||||||||||||||||
Less: Interest expense |
(33.4) | (43.8) | (69.5) | (84.0) | |||||||||||||||||||
| Less: Income tax recovery / (expense) | 2.6 | (15.3) | 9.5 | 8.4 | |||||||||||||||||||
| Corporate Group Net Earnings | (38.8) | 128.8 | (86.2) | (17.4) | |||||||||||||||||||
Add / (Less): Adjusted items |
|||||||||||||||||||||||
Loss (Gain) on derivative financial instruments |
(0.3) | (0.1) | 6.9 | (0.2) | |||||||||||||||||||
Restructuring costs4 |
6.8 | 6.0 | 12.4 | 10.4 | |||||||||||||||||||
| (Gain)/Loss on foreign exchange | 14.0 | (2.1) | 17.9 | (2.6) | |||||||||||||||||||
Change in value of investments carried at fair value |
— | (169.9) | — | (22.2) | |||||||||||||||||||
| Adjustment for taxes related to above | (1.7) | — | 27.5 | (2.2) | 12.9 | ||||||||||||||||||
Corporate Group Adjusted Net Earnings1 |
(20.0) | (9.8) | (51.2) | (19.1) | |||||||||||||||||||
| 1 | See Caution Concerning Non-GAAP Measures. |
||||
| 2 | This table contains a reconciliation of Adjusted Net Earnings to net earnings for the Corporate Group. The relevant sections of the table are derived from and should be read in conjunction with the unaudited interim condensed consolidated statement of operations and Note 14 in the unaudited interim condensed consolidated financial statements, "Segmented Information". This supplementary disclosure is intended to more fully explain disclosures related to Adjusted Net Earnings for the Corporate Group and provides additional information related to the operating performance of the Corporate Group. Investors are cautioned that Adjusted Net Earnings should not be construed as an alternative to net earnings. |
||||
| 3 | This table contains a reconciliation of EBIT to net earnings for the Corporate Group. The relevant sections of the table are derived from and should be read in conjunction with the unaudited interim condensed consolidated statement of operations and Note 14 in the unaudited interim condensed consolidated financial statements, "Segmented Information". This supplementary disclosure is intended to more fully explain disclosures related to EBIT and provides additional information related to the operating performance of the Corporate Group. Investors are cautioned that EBIT should not be construed as an alternative to net earnings. |
||||
| 4 | See Note 12 in the unaudited interim condensed consolidated financial statements. |
||||
| Algonquin Power & Utilities Corp. - Management Discussion & Analysis | 29 |
||||
2025 Second Quarter and Year-to-Date Hydro Group Net Earnings1 | |||||||||||||||||||||||
| Three months ended | Six months ended | ||||||||||||||||||||||
| June 30 | June 30 | ||||||||||||||||||||||
| (all dollar amounts in $ millions) | 2025 | 2024 | 2025 | 2024 | |||||||||||||||||||
| Revenue | $ | 10.6 | $ | 9.6 | $ | 20.2 | $ | 18.8 | |||||||||||||||
Less: Operating expenses |
3.0 | 2.2 | 5.5 | 5.1 | |||||||||||||||||||
Less: Depreciation and amortization |
$ | 1.8 | $ | 1.7 | $ | 3.6 | $ | 3.3 | |||||||||||||||
Add: Interest, dividend and other income |
0.1 | — | 0.2 | — | |||||||||||||||||||
Hydro Group EBIT2 |
5.9 | 5.7 | 11.3 | 10.4 | |||||||||||||||||||
Less: Interest expense |
(0.3) | (0.2) | (0.5) | (0.5) | |||||||||||||||||||
Less: Income tax (expense) / recovery3 |
4.5 | (1.4) | 16.9 | (2.3) | |||||||||||||||||||
Net effect of non-controlling interests |
(1.0) | (0.8) | (2.0) | (1.8) | |||||||||||||||||||
Hydro Group Net Earnings |
$ | 9.1 | $ | 3.3 | $ | 25.7 | $ | 5.8 | |||||||||||||||
| 1 | This table contains a reconciliation of EBIT to net earnings for the Hydro Group. The relevant sections of the table are derived from and should be read in conjunction with the unaudited interim condensed consolidated statement of operations and Note 14 in the unaudited interim condensed consolidated financial statements, "Segmented Information". This supplementary disclosure is intended to more fully explain disclosures related to EBIT and provides additional information related to the operating performance of the Hydro Group. Investors are cautioned that EBIT should not be construed as an alternative to net earnings. |
||||
| 2 | See Caution Concerning Non-GAAP Measures. |
||||
| 3 | For the three and six months ended June 30, 2025, income tax primarily relates to $2.5 million and $15.9 million, respectively, of income tax recovery from the tax basis step-up during Hydro Group's asset reorganization related to the Renewables Sale. |
||||
| Algonquin Power & Utilities Corp. - Management Discussion & Analysis | |||||
2025 Second Quarter and Year-to-Date Discontinued Operations Results | |||||||||||||||||||||||
| Three months ended | Six months ended | ||||||||||||||||||||||
| June 30 | June 30 | ||||||||||||||||||||||
| (all dollar amounts in $ millions) | 2025 | 2024 | 2025 | 2024 | |||||||||||||||||||
| Revenue | $ | — | $ | 83.3 | $ | 7.4 | $ | 174.3 | |||||||||||||||
| Operating loss | $ | — | $ | (3.6) | $ | (1.3) | $ | (14.7) | |||||||||||||||
| Net income (loss) attributable to AQN | $ | 6.7 | $ | 20.6 | $ | 8.1 | $ | (11.7) | |||||||||||||||
| Algonquin Power & Utilities Corp. - Management Discussion & Analysis | 31 |
||||
| Three months ended | Six months ended | ||||||||||||||||||||||
| June 30 | June 30 | ||||||||||||||||||||||
| (all dollar amounts in $ millions) | 2025 | 2024 | 2025 | 2024 | |||||||||||||||||||
Net earnings attributable to shareholders |
$ | 24.1 | $ | 200.7 | $ | 120.9 | $ | 111.6 | |||||||||||||||
| Add (deduct): | |||||||||||||||||||||||
Income tax expense |
7.0 | 25.3 | 26.8 | 26.9 | |||||||||||||||||||
Net earnings attributable to the non-controlling interest |
(18.0) | (23.3) | (35.9) | (39.1) | |||||||||||||||||||
Loss (Earnings) from discontinued operations, net of tax |
(6.7) | (20.6) | (8.1) | 11.7 | |||||||||||||||||||
| Interest expense | 67.8 | 93.2 | 139.2 | 182.8 | |||||||||||||||||||
EBIT |
$ | 74.2 | $ | 275.3 | $ | 242.9 | $ | 293.9 | |||||||||||||||
| Algonquin Power & Utilities Corp. - Management Discussion & Analysis | 32 |
||||
| Three months ended | Six months ended | ||||||||||||||||||||||
| June 30 | June 30 | ||||||||||||||||||||||
| (all dollar amounts in $ millions except per share information) | 2025 | 2024 | 2025 | 2024 | |||||||||||||||||||
Net earnings attributable to shareholders |
$ | 24.1 | $ | 200.7 | $ | 120.9 | $ | 111.6 | |||||||||||||||
| Add (deduct): | |||||||||||||||||||||||
Loss (Earnings) from discontinued operations, net of tax |
(6.7) | (20.6) | (8.1) | 11.7 | |||||||||||||||||||
Loss (Gain) on derivative financial instruments |
(0.3) | (0.1) | 6.9 | (0.2) | |||||||||||||||||||
Restructuring costs1 |
6.8 | 6.0 | 12.4 | 10.4 | |||||||||||||||||||
Loss (Gain) on foreign exchange |
14.0 | (2.1) | 17.9 | (2.6) | |||||||||||||||||||
Change in value of investments carried at fair value2 |
— | (169.9) | — | (22.2) | |||||||||||||||||||
| Adjustment for taxes related to above | (1.7) | 27.5 | (2.2) | 12.9 | |||||||||||||||||||
| Adjusted Net Earnings | $ | 36.2 | $ | 41.5 | $ | 147.8 | $ | 121.6 | |||||||||||||||
| Adjusted Net Earnings per common share | $ | 0.04 | $ | 0.06 | $ | 0.19 | $ | 0.17 | |||||||||||||||
| 1 | See Note 12 in the unaudited interim condensed consolidated financial statements. |
||||
| 2 | See Note 6 in the unaudited interim condensed consolidated financial statements. |
||||
| Algonquin Power & Utilities Corp. - Management Discussion & Analysis | 33 |
||||
| Three months ended | Six months ended | ||||||||||||||||||||||
| June 30 | June 30 | ||||||||||||||||||||||
| (all dollar amounts in $ millions) | 2025 | 2024 | 2025 | 2024 | |||||||||||||||||||
| Regulated Services Group | |||||||||||||||||||||||
Sustaining1 |
$ | 110.1 | $ | 118.1 | $ | 188.0 | $ | 230.8 | |||||||||||||||
Growth |
$ | 26.1 | $ | 45.8 | $ | 48.4 | $ | 92.6 | |||||||||||||||
| $ | 136.2 | $ | 163.9 | $ | 236.4 | $ | 323.4 | ||||||||||||||||
| Hydro Group | $ | 0.7 | $ | 1.1 | $ | 1.2 | $ | 1.4 | |||||||||||||||
| Corporate Group | $ | — | $ | — | $ | — | $ | — | |||||||||||||||
| Total Capital Expenditures | $ | 136.9 | $ | 165.0 | $ | 237.6 | $ | 324.8 | |||||||||||||||
| 1 | Refers to maintenance expenditure incurred during the period. |
||||
| Algonquin Power & Utilities Corp. - Management Discussion & Analysis | 34 |
||||
| As at | As at | ||||||||||
| June 30, 2025 | December 31, 2024 | ||||||||||
| (all dollar amounts in $ millions) | Total | Total | |||||||||
Revolving and term credit facilities1 |
$ | 2,368.4 | $ | 2,380.3 | |||||||
| Funds drawn on facilities / commercial paper issued | (467.8) | (814.8) | |||||||||
| Letters of credit issued | (30.3) | (26.2) | |||||||||
| Liquidity available under the facilities | 1,870.3 | 1,539.3 | |||||||||
| Undrawn portion of uncommitted letter of credit facilities | (67.4) | (63.3) | |||||||||
| Cash on hand | 54.3 | 34.8 | |||||||||
| Total Liquidity and Capital Reserves | $ | 1,857.2 | $ | 1,510.8 | |||||||
1 Includes a $75 million uncommitted standalone letter of credit facility and $193.5 million drawn term facilities of Suralis and BELCO as at June 30, 2025 ($180.3 million as at December 31, 2024). | |||||||||||
| Algonquin Power & Utilities Corp. - Management Discussion & Analysis | 35 |
||||
| Algonquin Power & Utilities Corp. - Management Discussion & Analysis | 36 |
||||
Q4 2024 |
Q1 2025 |
Q2 2025 |
Q3 2025 |
Total | |||||||||||||
| U.S. dollar dividend | $ | 0.0650 | $ | 0.0650 | $ | 0.0650 | $ | 0.0650 | $0.2600 | ||||||||
| Canadian dollar equivalent | $ | 0.0901 | $ | 0.0934 | $ | 0.0897 | $ | 0.0893 | $0.3625 | ||||||||
Share-based compensation awards |
Total | ||||
Options |
2,045,079 | ||||
Performance and Restricted Share Units |
5,976,203 | ||||
Director's Deferred Share Units |
703,618 | ||||
Bonus Deferral Restricted Share Units |
193,627 | ||||
| Algonquin Power & Utilities Corp. - Management Discussion & Analysis | 37 |
||||
| Algonquin Power & Utilities Corp. - Management Discussion & Analysis | 38 |
||||
| Algonquin Power & Utilities Corp. - Management Discussion & Analysis | 39 |
||||
| Algonquin Power & Utilities Corp. - Management Discussion & Analysis | 40 |
||||
| Algonquin Power & Utilities Corp. - Management Discussion & Analysis | 41 |
||||
| Algonquin Power & Utilities Corp. - Management Discussion & Analysis | 42 |
||||
| (all dollar amounts in $ millions except per share information) | 3rd Quarter 2024 | 4th Quarter 2024 | 1st Quarter 2025 | 2nd Quarter 2025 | |||||||||||||||||||
| Revenue | $ | 573.2 | $ | 584.8 | $ | 692.4 | $ | 527.8 | |||||||||||||||
| Net earnings (loss) attributable to shareholders | (1,305.7) | (186.4) | 96.8 | 24.1 | |||||||||||||||||||
Net earnings (loss) attributable to shareholders from continuing operations |
49.5 | (107.5) | 95.4 | 17.4 | |||||||||||||||||||
Net earnings (loss) attributable to shareholders from discontinued operations |
(1,355.2) | (78.9) | 1.4 | 6.7 | |||||||||||||||||||
| Net earnings (loss) per share | (1.71) | (0.25) | 0.12 | 0.03 | |||||||||||||||||||
| Net earnings (loss) per share from continuing operations | 0.06 | (0.14) | 0.12 | 0.02 | |||||||||||||||||||
Net earnings (loss) per share from discontinued operations |
(1.77) | (0.10) | — | 0.01 | |||||||||||||||||||
| Diluted net earnings (loss) per share | (1.71) | (0.25) | 0.12 | 0.03 | |||||||||||||||||||
Adjusted Net Earnings1 |
64.9 | 45.2 | 111.6 | 36.2 | |||||||||||||||||||
Adjusted Net Earnings per common share1 |
0.08 | 0.06 | 0.14 | 0.04 | |||||||||||||||||||
EBIT1 |
131.1 | 115.7 | 168.7 | 74.2 | |||||||||||||||||||
Total assets3 |
17,788.6 | 16,961.8 | 13,663.3 | 13,693.4 | |||||||||||||||||||
Long-term debt2,3 |
8,725.0 | 8,047.5 | 6,322.0 | 6,328.8 | |||||||||||||||||||
Dividends declared per common share |
$ | 0.07 | $ | 0.07 | $ | 0.07 | $ | 0.07 | |||||||||||||||
| 3rd Quarter 2023 | 4th Quarter 2023 | 1st Quarter 2024 | 2nd Quarter 2024 | ||||||||||||||||||||
| Revenue | $ | 564.8 | $ | 585.7 | $ | 646.2 | $ | 515.3 | |||||||||||||||
| Net earnings (loss) attributable to shareholders | (174.5) | 186.3 | (89.1) | 200.7 | |||||||||||||||||||
Net earnings (loss) attributable to shareholders from continuing operations |
(174.9) | 169.8 | (56.8) | 180.1 | |||||||||||||||||||
Net earnings (loss) attributable to shareholders from discontinued operations |
0.4 | 16.5 | (32.3) | 20.6 | |||||||||||||||||||
| Net earnings (loss) per share | (0.26) | 0.27 | (0.13) | 0.28 | |||||||||||||||||||
| Net earnings (loss) per share from continuing operations | (0.26) | 0.24 | (0.09) | 0.26 | |||||||||||||||||||
Net earnings (loss) per share from discontinued operations |
— | 0.02 | (0.04) | 0.02 | |||||||||||||||||||
| Diluted net earnings (loss) per share | (0.26) | 0.27 | (0.13) | 0.28 | |||||||||||||||||||
Adjusted Net Earnings1 |
68.6 | 81.3 | 80.1 | 41.5 | |||||||||||||||||||
Adjusted Net Earnings per common share1 |
0.10 | 0.12 | 0.11 | 0.06 | |||||||||||||||||||
EBIT1 |
(133.5) | 250.4 | 18.6 | 275.3 | |||||||||||||||||||
Total assets3 |
17,982.8 | 18,374.0 | 18,307.8 | 18,866.4 | |||||||||||||||||||
Long-term debt2,3 |
8,367.3 | 8,516.0 | 9,089.9 | 8,292.9 | |||||||||||||||||||
Dividends declared per common share |
$ | 0.11 | $ | 0.11 | $ | 0.11 | $ | 0.11 | |||||||||||||||
| 1 | See Caution Concerning Non-GAAP Measures. |
||||
| 2 | Includes current portion of long-term debt and long-term debt. | ||||
| 3 | Includes discontinued operations |
||||
| Algonquin Power & Utilities Corp. - Management Discussion & Analysis | 43 |
||||
| Algonquin Power & Utilities Corp. - Management Discussion & Analysis | |||||

| Three months ended | Six months ended | |||||||||||||||||||
| June 30 | June 30 | |||||||||||||||||||
| (all dollar amounts in $ millions except per share information) | 2025 | 2024 | Change | 2025 | 2024 | Change | ||||||||||||||
| Net Earnings for Regulated Services Group | $ | 47.1 | $ | 48.0 | (2) | % | $ | 173.3 | $ | 134.9 | 28 | % | ||||||||
| Net Earnings for Hydro Group | 9.1 | 3.3 | 176 | % | 25.7 | 5.8 | 343 | % | ||||||||||||
| Net Earnings for Corporate Group | (38.8) | 128.8 | (130) | % | (86.2) | (17.4) | (395) | % | ||||||||||||
| AQN Net Earnings | 17.4 | 180.1 | (90) | % | 112.8 | 123.3 | (9) | % | ||||||||||||
AQN Adjusted Net Earnings2 |
36.2 | 41.5 | (13) | % | 147.8 | 121.6 | 22 | % | ||||||||||||
AQN Adjusted Net Earnings2 per share |
0.04 | 0.06 | (33) | % | 0.19 | 0.17 | 12 | % | ||||||||||||
| Dividends per share declared to common shareholders | 0.0650 | 0.1085 | (40) | % | 0.1300 | 0.2170 | (40) | % | ||||||||||||
Date: |
Friday, August 8, 2025 | |||||||
Time: |
8:30 a.m. ET | |||||||
Conference Call: |
Toll Free Dial-In Number: | 1 (800) 715-9871 | ||||||
| Toll Dial-In Number: | 1 (647) 932-3411 | |||||||
| Conference ID: | 8782985 | |||||||
Webcast: |
https://edge.media-server.com/mmc/p/8q6zmayx/ | |||||||
Presentation also available at: www.algonquinpower.com |
||||||||
| Three months ended | Six months ended | ||||||||||||||||||||||
| June 30 | June 30 | ||||||||||||||||||||||
| (all dollar amounts in $ millions except per share information) | 2025 | 2024 | 2025 | 2024 | |||||||||||||||||||
| Net earnings attributable to shareholders | $ | 24.1 | $ | 200.7 | $ | 120.9 | $ | 111.6 | |||||||||||||||
| Add (deduct): | |||||||||||||||||||||||
| Loss (Earnings) from discontinued operations, net of tax | (6.7) | (20.6) | (8.1) | 11.7 | |||||||||||||||||||
| Loss (Gain) on derivative financial instruments | (0.3) | (0.1) | 6.9 | (0.2) | |||||||||||||||||||
Restructuring costs1 |
6.8 | 6.0 | 12.4 | 10.4 | |||||||||||||||||||
| Loss (Gain) on foreign exchange | 14.0 | (2.1) | 17.9 | (2.6) | |||||||||||||||||||
Change in value of investments carried at fair value2 |
— | (169.9) | — | (22.2) | |||||||||||||||||||
| Adjustment for taxes related to above | (1.7) | 27.5 | (2.2) | 12.9 | |||||||||||||||||||
| Adjusted Net Earnings | $ | 36.2 | $ | 41.5 | $ | 147.8 | $ | 121.6 | |||||||||||||||
| Adjusted Net Earnings per common share | $ | 0.04 | $ | 0.06 | $ | 0.19 | $ | 0.17 | |||||||||||||||
| 1 | See Note 12 in the unaudited interim condensed consolidated financial statements. |
||||
| 2 | See Note 6 in the unaudited interim condensed consolidated financial statements. |
||||
