UNITED STATES
SECURITIES AND EXCHANGE COMMISSION
Washington, D.C. 20549
FORM 6-K
REPORT OF FOREIGN PRIVATE ISSUER
PURSUANT TO RULE 13a-16 OR 15d-16 UNDER
THE SECURITIES EXCHANGE ACT OF 1934
For the month of May 2026
Commission File Number: 001-36898
COLLIERS INTERNATIONAL GROUP INC.
(Translation of registrant's name into English)
1140 Bay Street, Suite 4000
Toronto, Ontario, Canada
M5S 2B4
(Address of principal executive office)
Indicate by check mark whether the registrant files or will file annual reports under cover of Form 20-F or Form 40-F.
Form 20-F [ ] Form 40-F [ X ]
Exhibit 99.1 of this Form 6-K shall be incorporated by reference as an exhibit to the registrant’s registration statement on Form F-10 (File No. 333-294698). Pursuant to the requirements of the Securities Exchange Act of 1934, the registrant has duly caused this report to be signed on its behalf by the undersigned, hereunto duly authorized.
SIGNATURE
| COLLIERS INTERNATIONAL GROUP INC. | ||
| Date: May 5, 2026 | /s/ Christian Mayer | |
| Name: Christian Mayer | ||
| Title: Chief Financial Officer | ||
EXHIBIT INDEX
| Exhibit | Description of Exhibit | |||
| 99.1 | Press release dated May 5, 2026 announcing financial results for the first quarter ended March 31, 2026. | |||
| 99.2 | Supplemental slide presentation dated May 5, 2026. |
EXHIBIT 99.1
Colliers Reports First Quarter Results
2026 starts with solid momentum across all service lines
First quarter operating highlights:
| Three months ended | ||||||||
| March 31 | ||||||||
| (in millions of US$, except EPS) | 2026 | 2025 | ||||||
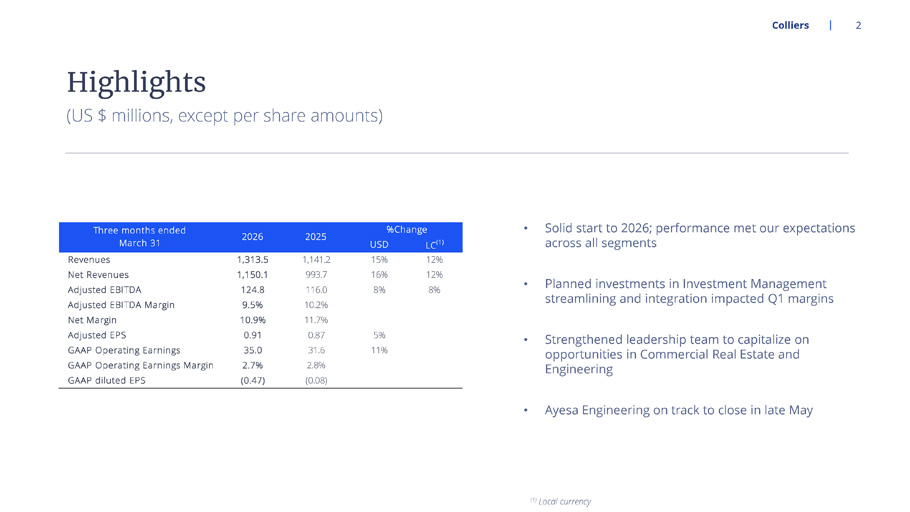
| Revenues | $ | 1,313.5 | $ | 1,141.2 | ||||
| Net Revenues (note 1) | 1,150.1 | 993.7 | ||||||
| Adjusted EBITDA (note 2) | 124.8 | 116.0 | ||||||
| Adjusted EPS (note 3) | 0.91 | 0.87 | ||||||
| GAAP operating earnings | 35.0 | 31.6 | ||||||
| GAAP diluted net loss per share | (0.47 | ) | (0.08 | ) | ||||
TORONTO, May 05, 2026 (GLOBE NEWSWIRE) -- Colliers International Group Inc. (NASDAQ and TSX: CIGI) (“Colliers” or the “Company”) today announced financial results for the first quarter ended March 31, 2026. All amounts are in US dollars.
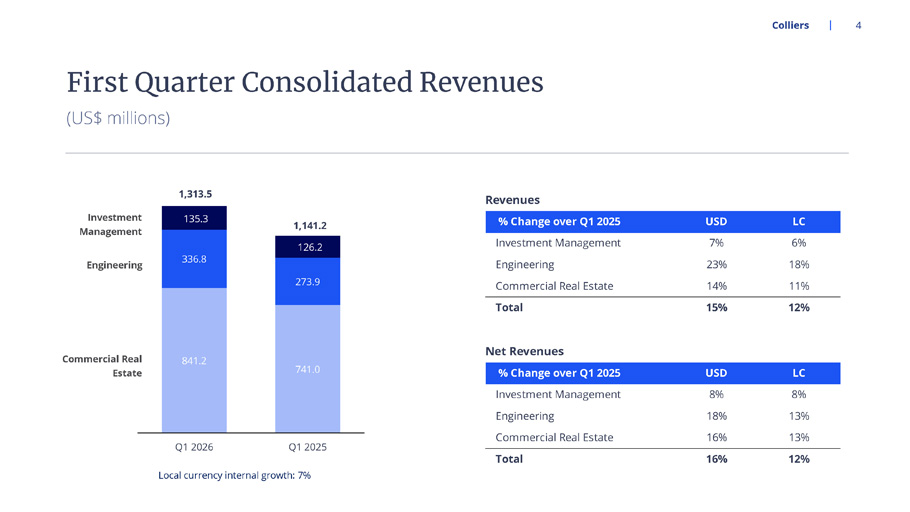
First quarter consolidated revenues were $1.31 billion, up 15% (12% in local currency), net revenues were $1.15 billion, up 16% (12% in local currency) and Adjusted EBITDA (note 2) was $124.8 million, up 8% (8% in local currency) compared to the prior year quarter. Consolidated internal revenue growth measured in local currencies was 7% (note 5) versus the prior year quarter. Adjusted EPS (note 3) was $0.91, an increase of 5% over the prior year quarter. Adjusted EPS was not significantly impacted by changes in foreign exchange rates. GAAP operating earnings were $35.0 million compared to $31.6 million in the prior year quarter. The GAAP diluted net loss per share was $0.47, compared to $0.08 in the prior year quarter. First quarter GAAP diluted net loss per share was not significantly impacted by changes in foreign exchange rates.
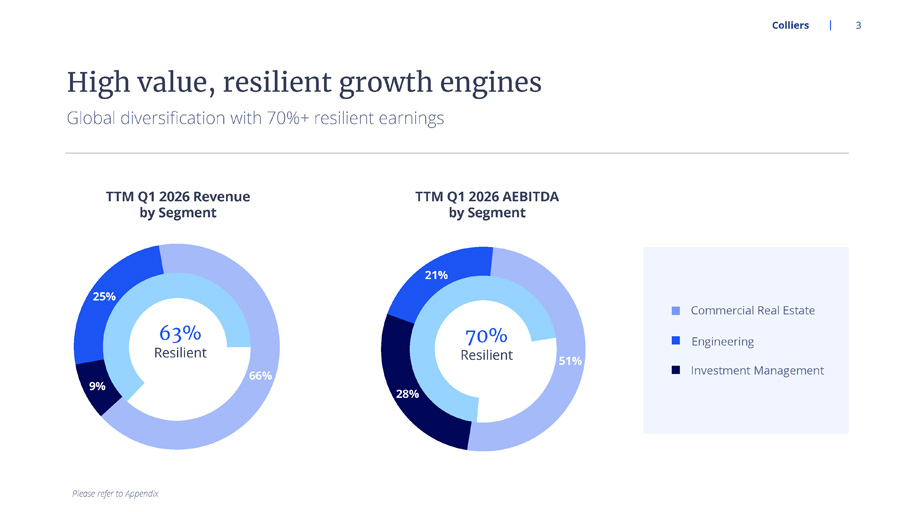
The Company generated approximately 70% of its earnings from resilient businesses – Engineering, Project Management, Investment Management, Property Management, Loan Servicing, and Valuation & Advisory (note 8). Free cash flow (note 4) was $246.7 million for the trailing twelve-month period, slightly below the Company’s target range, as a result of working capital movements during the first quarter.
“Colliers delivered a strong start to 2026, demonstrating the strength and durability of our diversified professional services and investment management platform. We executed to plan in a still-uneven operating environment, with continued momentum in our resilient businesses and ongoing improvement in Commercial Real Estate transaction activity. Importantly, our results underscore the platform we’ve built – a global business designed to perform through every stage of the economic cycle. During the quarter, we strengthened our leadership team to capitalize on expanding opportunities across Commercial Real Estate and Engineering. We enhanced our financial flexibility with $400 million of long-term debt financing and we extended our revolving credit facility – positioning us to integrate the acquisition of Ayesa Engineering, which we expect will close later this quarter. Our world-class leadership team remains focused on delivering durable growth and long-term shareholder value,” said Jay S. Hennick, Global Chairman and CEO.
About Colliers
Colliers (NASDAQ, TSX: CIGI) is a global diversified professional services and investment management company operating through three industry leading businesses: Commercial Real Estate, Engineering, and Investment Management. With greater than a 30-year track record of consistent growth and strong recurring cash flows, we scale complementary, high-value businesses that provide essential services across the full asset lifecycle.
Our unique partnership philosophy empowers exceptional leaders, preserves our entrepreneurial culture, and ensures meaningful inside ownership — driving strong alignment and sustained value creation for our shareholders.
With $5.7 billion in annual revenues, 24,000 professionals, and $109 billion in assets under management, Colliers is committed to accelerating the success of our clients, investors, and people worldwide. Learn more at corporate.colliers.com.
Segment Reporting Change
The Company has realigned its Commercial Real Estate and Engineering segments to reflect the new management reporting lines under Christian Mayer and Elias Mulamoottil effective in the first quarter of 2026. Accordingly, the legacy local project management operations, which primarily serve leasing and occupier clients, are now reported in the Commercial Real Estate segment for all periods presented. Institutional project management operations remain in the Engineering segment. Recast historical segment data can be found at corporate.colliers.com. There were no changes to the Investment Management or Corporate segments.
Segmented First Quarter Results
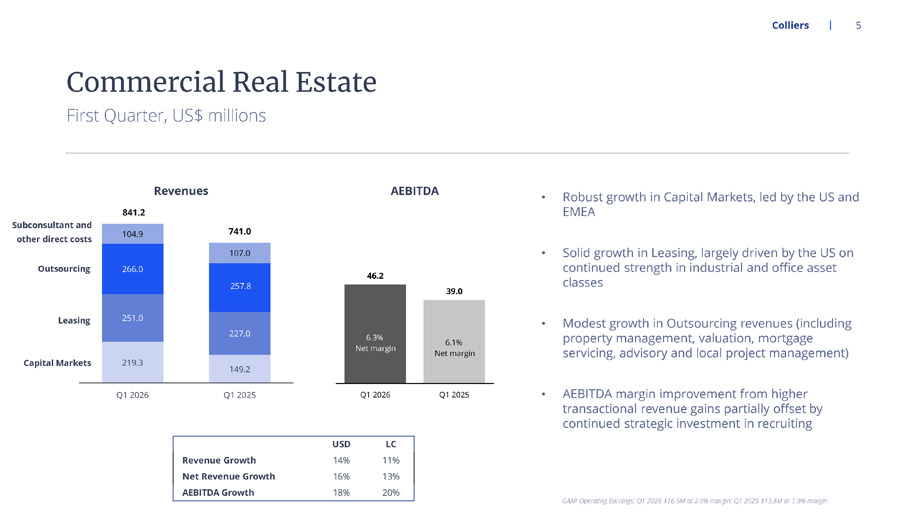
Commercial Real Estate revenues for the seasonally slow first quarter totalled $841.2 million, up 14% (up 11% in local currency) versus the prior year quarter. Net revenues were $736.3 million, up 16% (up 13% in local currency). Capital Markets revenues were up 47% with strong growth across all geographies, led by the US and EMEA. Leasing generated solid growth, up 11% largely driven by the US on continued strength in industrial and office asset classes. Taken together, transactional services were up 25% over the prior year showing meaningful recovery. Outsourcing revenues (including property management, valuation & advisory, loan servicing and local project management) were up modestly. Adjusted EBITDA was $46.2 million, up 18% (20% in local currency) versus the prior year quarter. The net margin increased on operating leverage from higher transactional revenues, partially offset by continued strategic investments in recruiting across the segment. The GAAP operating earnings were $16.5 million, relative to $13.8 million in the prior year quarter.
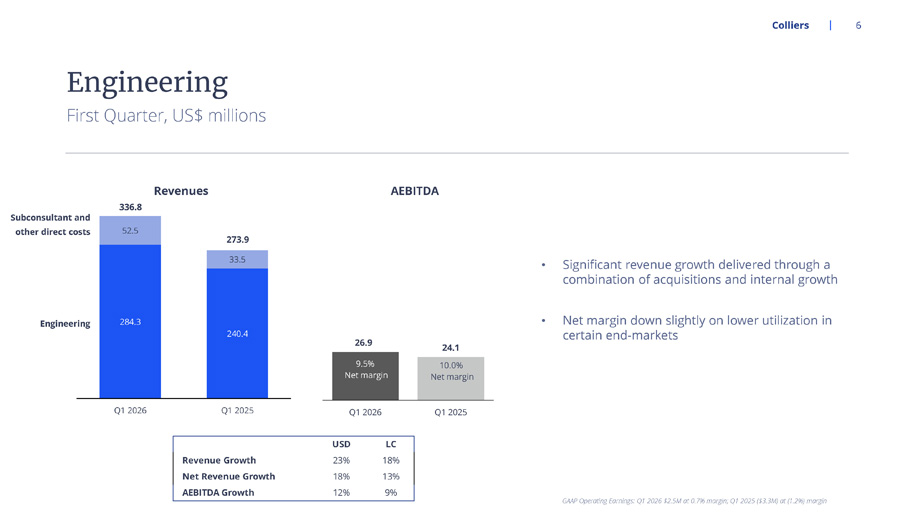
Engineering revenues totalled $336.8 million, up 23% (18% in local currency) compared to the prior year quarter. Net revenues (excluding subconsultant and other pass-through costs) were $284.3 million, up 18% (13% in local currency) driven by a combination of recent acquisitions and solid internal growth. Adjusted EBITDA was $26.9 million, up 12% (9% in local currency) over the prior year quarter, with the net margin down slightly on lower utilization in certain end-markets. The GAAP operating earnings were $2.5 million relative to a loss of $3.3 million in the prior year quarter.
Investment Management revenues were $135.3 million, up 7% (6% in local currency) relative to the prior year quarter. Net revenues (excluding pass-through performance fees) were $129.3 million, up 8% (8% in local currency) driven by the favourable impact of a recent acquisition. Adjusted EBITDA was $50.6 million, down 8% (9% in local currency) compared to the prior year quarter, reflecting planned ongoing investments in global fundraising as well as streamlining and integration initiatives to unify the business under the Harrison Street Asset Management (“HSAM”) brand, which are expected to continue for the next two quarters. These initiatives are intended to support the continued growth and scaling of HSAM, with long-standing, cycle-tested expertise and a consistent track record of success across its diverse investment strategies. GAAP operating earnings were $15.4 million in the quarter versus $32.9 million in the prior year quarter. Total assets under management were $109.3 billion as of March 31, 2026, up 9% from March 31, 2025.
Unallocated global corporate Adjusted EBITDA was $1.2 million, compared to a cost of $2.2 million in the prior year quarter. The corporate GAAP operating earnings were $0.7 million compared to a cost of $11.9 million in the prior year quarter.
2026 Outlook
The Company’s outlook for 2026 remains unchanged and includes the impact of Ayesa Engineering, which is expected to close in late May. The outlook drivers by segment are also unchanged and are described in the accompanying earnings call presentation.
The financial outlook is based on the Company’s best available information as of the date of this press release, and remains subject to change based on numerous macroeconomic, geopolitical, international trade, health, social and related factors. The outlook does not include any further acquisitions.
Conference Call
Colliers will be holding a conference call on Tuesday, May 5, 2026 at 11:00 a.m. Eastern Time to discuss the quarter’s results. The call will be simultaneously web cast and can be accessed live or after the call at corporate.colliers.com in the Events section.
Forward-looking Statements
This press release includes or may include forward-looking statements. Forward-looking statements include the Company’s financial performance outlook and statements regarding goals, beliefs, strategies, objectives, plans or current expectations. These statements involve known and unknown risks, uncertainties and other factors which may cause the actual results to be materially different from any future results, performance or achievements contemplated in the forward-looking statements. Such factors include: economic conditions, especially as they relate to commercial and consumer credit conditions and consumer spending, particularly in regions where the business may be concentrated; commercial real estate and real asset values, vacancy rates and general conditions of financial liquidity for real estate transactions; trends in pricing and risk assumption for commercial real estate services; the effect of significant movements in capitalization rates across different asset types; a reduction by companies in their reliance on outsourcing for their commercial real estate needs, which would affect revenues and operating performance; competition in the markets served by the Company; the utilization of artificial intelligence (AI) and machine learning technologies, including associated impacts on the Company’s services, competitive environment, ability to hire/retain specialized talent, cybersecurity, and legal and governance risks; the ability to attract new clients and to retain clients and renew related contracts; the ability to attract new capital commitments to Investment Management funds and retain existing capital under management; the ability to retain and incentivize employees; increases in wage and benefit costs; the effects of changes in interest rates on the cost of borrowing; unexpected increases in operating costs, such as insurance, workers’ compensation and health care; changes in the frequency or severity of insurance incidents relative to historical experience; the effects of changes in foreign exchange rates in relation to the US dollar on the Company’s Canadian dollar, Euro, Australian dollar and UK pound sterling denominated revenues and expenses; the impact of pandemics on client demand for the Company’s services, the ability of the Company to deliver its services and the health and productivity of its employees; the impact of global climate change; the impact of political events including elections, referenda, trade policy changes, immigration policy changes, hostilities, war and terrorism on the Company’s operations; the ability to identify and make acquisitions at reasonable prices and successfully integrate acquired operations; the ability to execute on, and adapt to, information technology strategies and trends; the ability to comply with laws and regulations, including real estate investment management and mortgage banking licensure, labour and employment laws and regulations, as well as the anti-corruption laws and trade sanctions; and changes in government laws and policies at the federal, state/provincial or local level that may adversely impact the business.
Additional information and risk factors identified in the Company’s other periodic filings with Canadian and US securities regulators are adopted herein and a copy of which can be obtained at www.sedarplus.ca. Forward looking statements contained in this press release are made as of the date hereof and are subject to change. All forward-looking statements in this press release are qualified by these cautionary statements. Except as required by applicable law, Colliers undertakes no obligation to publicly update or revise any forward-looking statement, whether as a result of new information, future events or otherwise.
Summary unaudited financial information is provided in this press release. This press release should be read in conjunction with the Company's consolidated financial statements and MD&A to be made available on SEDAR+ at www.sedarplus.ca.
This press release does not constitute an offer to sell or a solicitation of an offer to purchase an interest in any fund.
| Colliers International Group Inc. | ||||||||||
| Condensed Consolidated Statements of Earnings | ||||||||||
| (in thousands of US$, except per share amounts) | ||||||||||
| Three months | ||||||||||
| ended March 31 | ||||||||||
| (unaudited) | 2026 | 2025 | ||||||||
| Revenues | $ | 1,313,472 | $ | 1,141,170 | ||||||
| Cost of revenues | 789,535 | 688,490 | ||||||||
| Selling, general and administrative expenses | 405,048 | 348,293 | ||||||||
| Depreciation | 20,301 | 18,647 | ||||||||
| Amortization of intangible assets | 47,699 | 44,755 | ||||||||
| Acquisition-related items (1) | 15,353 | 9,381 | ||||||||
| Loss on disposal of operations | 531 | - | ||||||||
| Operating earnings | 35,005 | 31,604 | ||||||||
| Interest expense, net | 22,868 | 22,548 | ||||||||
| Equity earnings from non-consolidated investments | (7,271 | ) | (3,734 | ) | ||||||
| Other (income) expense | 368 | (840 | ) | |||||||
| Earnings before income tax | 19,040 | 13,630 | ||||||||
| Income tax | 8,261 | 4,712 | ||||||||
| Net earnings | 10,779 | 8,918 | ||||||||
| Non-controlling interest share of earnings | 4,291 | 5,729 | ||||||||
| Non-controlling interest redemption increment | 30,518 | 7,448 | ||||||||
| Net loss attributable to Company | $ | (24,030 | ) | $ | (4,259 | ) | ||||
| Net loss per common share | ||||||||||
| Basic | $ | (0.47 | ) | $ | (0.08 | ) | ||||
| Diluted | $ | (0.47 | ) | $ | (0.08 | ) | ||||
| Adjusted EPS (2) | $ | 0.91 | $ | 0.87 | ||||||
| Weighted average common shares (thousands) | ||||||||||
| Basic | 51,104 | 50,615 | ||||||||
| Diluted | 51,104 | 50,615 | ||||||||
Notes to Condensed Consolidated Statements of Earnings
(1) Acquisition-related items include contingent acquisition consideration fair value adjustments, contingent acquisition consideration-related compensation expense and transaction costs.
(2) See definition and reconciliation below.
| Colliers International Group Inc. | |||||||||
| Condensed Consolidated Balance Sheets | |||||||||
| (in thousands of US$) | |||||||||
| March 31, | December 31, | March 31, | |||||||
| (unaudited) | 2026 | 2025 | 2025 | ||||||
| Assets | |||||||||
| Cash and cash equivalents | $ | 201,567 | $ | 207,902 | $ | 186,319 | |||
| Restricted cash (1) | 47,028 | 48,981 | 54,942 | ||||||
| Accounts receivable and contract assets | 1,008,293 | 990,329 | 823,800 | ||||||
| Mortgage warehouse receivables (2) | 203,511 | 140,095 | 87,997 | ||||||
| Prepaids and other assets | 358,051 | 378,453 | 313,586 | ||||||
| Warehouse fund assets | 56,845 | 56,050 | 121,191 | ||||||
| Current assets | 1,875,295 | 1,821,810 | 1,587,835 | ||||||
| Other non-current assets | 268,366 | 249,040 | 229,903 | ||||||
| Warehouse fund assets | 85,162 | 73,785 | 98,455 | ||||||
| Fixed assets | 249,469 | 251,462 | 229,124 | ||||||
| Operating lease right-of-use assets | 491,775 | 443,404 | 402,007 | ||||||
| Deferred tax assets, net | 90,442 | 93,857 | 82,439 | ||||||
| Goodwill and intangible assets | 3,863,806 | 3,855,109 | 3,482,741 | ||||||
| Total assets | $ | 6,924,315 | $ | 6,788,467 | $ | 6,112,504 | |||
| Liabilities and shareholders' equity | |||||||||
| Accounts payable and accrued liabilities | $ | 1,064,611 | $ | 1,267,118 | $ | 965,253 | |||
| Other current liabilities | 116,351 | 112,963 | 110,191 | ||||||
| Long-term debt - current | 11,112 | 8,119 | 9,365 | ||||||
| Mortgage warehouse credit facilities (2) | 194,577 | 133,259 | 81,226 | ||||||
| Operating lease liabilities - current | 97,512 | 99,696 | 102,083 | ||||||
| Liabilities related to warehouse fund assets | 43,844 | 33,679 | 83,539 | ||||||
| Current liabilities | 1,528,007 | 1,654,834 | 1,351,657 | ||||||
| Long-term debt - non-current | 1,861,780 | 1,625,392 | 1,657,459 | ||||||
| Operating lease liabilities - non-current | 484,103 | 419,198 | 379,242 | ||||||
| Other liabilities | 98,455 | 129,776 | 130,121 | ||||||
| Deferred tax liabilities, net | 88,508 | 90,996 | 74,036 | ||||||
| Liabilities related to warehouse fund assets | 51,715 | 48,782 | 21,789 | ||||||
| Redeemable non-controlling interests | 1,296,493 | 1,285,046 | 1,156,652 | ||||||
| Shareholders' equity | 1,515,254 | 1,534,443 | 1,341,548 | ||||||
| Total liabilities and equity | $ | 6,924,315 | $ | 6,788,467 | $ | 6,112,504 | |||
| Supplemental balance sheet information | |||||||||
| Total debt (3) | $ | 1,872,892 | $ | 1,633,511 | $ | 1,666,824 | |||
| Total debt, net of cash and cash equivalents (3) | 1,671,325 | 1,425,609 | 1,480,505 | ||||||
| Net debt / pro forma adjusted EBITDA ratio (4) | 2.3 | 2.0 | 2.2 | ||||||
Notes to Condensed Consolidated Balance Sheets
(1) Restricted cash consists primarily of cash amounts set aside to satisfy legal or contractual requirements arising in the normal course of business.
(2) Mortgage warehouse receivables represent mortgage loans receivable, the majority of which are offset by borrowings under mortgage warehouse credit facilities which fund loans that financial institutions have committed to purchase.
(3) Excluding mortgage warehouse credit facilities.
(4) Net debt for financial leverage ratio excludes restricted cash and mortgage warehouse credit facilities, in accordance with debt agreements.
| Colliers International Group Inc. | |||||||||
| Condensed Consolidated Statements of Cash Flows | |||||||||
| (in thousands of US$) | |||||||||
| Three months ended | |||||||||
| March 31 | |||||||||
| (unaudited) | 2026 | 2025 | |||||||
| Cash provided by (used in) | |||||||||
| Operating activities | |||||||||
| Net earnings | $ | 10,779 | $ | 8,918 | |||||
| Items not affecting cash: | |||||||||
| Depreciation and amortization | 68,000 | 63,402 | |||||||
| Gains attributable to mortgage servicing rights | (11,315 | ) | (4,039 | ) | |||||
| Gains attributable to the fair value of loan | |||||||||
| premiums and origination fees | (10,790 | ) | (4,569 | ) | |||||
| Deferred income tax | (5,572 | ) | (9,184 | ) | |||||
| Other | 33,472 | 19,349 | |||||||
| 84,574 | 73,877 | ||||||||
| (Increase) decrease in accounts receivable, prepaid | |||||||||
| expenses and other assets | (76,509 | ) | 30,274 | ||||||
| Decrease in accounts payable, accrued | |||||||||
| expenses and other liabilities | (4,651 | ) | (38,392 | ) | |||||
| Decrease in accrued compensation | (220,853 | ) | (152,477 | ) | |||||
| Contingent acquisition consideration paid | (2,970 | ) | (2,268 | ) | |||||
| Mortgage origination activities, net | 7,296 | 3,485 | |||||||
| Purchases from AR Facility, net | 25,687 | 1,025 | |||||||
| Net cash used in operating activities | (187,426 | ) | (84,476 | ) | |||||
| Investing activities | |||||||||
| Acquisition of businesses, net of cash acquired | (45,042 | ) | (9,485 | ) | |||||
| Purchases of fixed assets | (18,296 | ) | (14,654 | ) | |||||
| Purchases of warehouse fund assets | (12,475 | ) | (10,813 | ) | |||||
| Cash collections on AR Facility deferred purchase price | 51,315 | 48,421 | |||||||
| Other investing activities | (28,392 | ) | (23,295 | ) | |||||
| Net cash used in investing activities | (52,890 | ) | (9,826 | ) | |||||
| Financing activities | |||||||||
| Increase in long-term debt, net | 264,715 | 141,908 | |||||||
| Purchases of non-controlling interests, net | (20,386 | ) | (5,303 | ) | |||||
| Dividends paid to common shareholders | (7,666 | ) | (7,592 | ) | |||||
| Distributions paid to non-controlling interests | (11,122 | ) | (8,458 | ) | |||||
| Other financing activities | (3,801 | ) | (1,177 | ) | |||||
| Net cash provided by financing activities | 221,740 | 119,378 | |||||||
| Effect of exchange rate changes on cash, | |||||||||
| cash equivalents and restricted cash | 10,288 | (1,796 | ) | ||||||
| Net change in cash and cash | |||||||||
| equivalents and restricted cash | (8,288 | ) | 23,280 | ||||||
| Cash and cash equivalents and | |||||||||
| restricted cash, beginning of period | 256,883 | 217,981 | |||||||
| Cash and cash equivalents and | |||||||||
| restricted cash, end of period | $ | 248,595 | $ | 241,261 | |||||
| Colliers International Group Inc. | |||||||||||||||||
| Segmented Results | |||||||||||||||||
| (in thousands of US dollars) | |||||||||||||||||
| Commercial | Investment | ||||||||||||||||
| (unaudited) | Real Estate | Engineering | Management | Corporate | Total | ||||||||||||
| Three months ended March 31 | |||||||||||||||||
| 2026 | |||||||||||||||||
| Revenues | $ | 841,171 | $ | 336,847 | $ | 135,266 | $ | 188 | $ | 1,313,472 | |||||||
| Net Revenues | 736,256 | 284,342 | 129,266 | 188 | 1,150,052 | ||||||||||||
| Adjusted EBITDA | 46,181 | 26,890 | 50,551 | 1,181 | 124,803 | ||||||||||||
| Operating earnings | 16,449 | 2,461 | 15,399 | 696 | 35,005 | ||||||||||||
| 2025 | |||||||||||||||||
| Revenues | $ | 740,976 | $ | 273,870 | $ | 126,202 | $ | 122 | $ | 1,141,170 | |||||||
| Net Revenues | 633,987 | 240,418 | 119,157 | 122 | 993,684 | ||||||||||||
| Adjusted EBITDA | 38,987 | 24,116 | 55,096 | (2,155 | ) | 116,044 | |||||||||||
| Operating earnings (loss) | 13,848 | (3,296 | ) | 32,907 | (11,855 | ) | 31,604 | ||||||||||
Non-GAAP Measures
1. Reconciliation of revenues to net revenues
Net revenues are defined as revenues excluding subconsultant and other reimbursable direct costs in Commercial Real Estate and Engineering segments as well as historical pass-through performance fees in Investment Management segment to better reflect the operating performance of the business.
| Commercial | Investment | ||||||||||||||||||
| Real Estate | Engineering | Management | Corporate | Total | |||||||||||||||
| Three months ended March 31 | |||||||||||||||||||
| 2026 | |||||||||||||||||||
| Revenues | $ | 841,171 | $ | 336,847 | $ | 135,266 | $ | 188 | $ | 1,313,472 | |||||||||
| Subconsultant and other direct costs | (104,915 | ) | (52,505 | ) | - | - | (157,420 | ) | |||||||||||
| Historical pass-through performance fees | - | - | (6,000 | ) | - | (6,000 | ) | ||||||||||||
| Net Revenues | $ | 736,256 | $ | 284,342 | $ | 129,266 | $ | 188 |
|
$ | 1,150,052 | ||||||||
| 2025 | |||||||||||||||||||
| Revenues | $ | 740,976 | $ | 273,870 | $ | 126,202 | $ | 122 | $ | 1,141,170 | |||||||||
| Subconsultant and other direct costs | (106,989 | ) | (33,452 | ) | - | - | (140,441 | ) | |||||||||||
| Historical pass-through performance fees | - | - | (7,045 | ) | - | (7,045 | ) | ||||||||||||
| Net Revenues | $ | 633,987 | $ | 240,418 | $ | 119,157 | $ | 122 | $ | 993,684 | |||||||||
2. Reconciliation of net earnings to Adjusted EBITDA
Adjusted EBITDA is defined as net earnings, adjusted to exclude: (i) income tax; (ii) other income; (iii) interest expense; (iv) loss on disposal of operations; (v) depreciation and amortization, including amortization of mortgage servicing rights (“MSRs”); (vi) gains attributable to MSRs; (vii) acquisition-related items (including contingent acquisition consideration fair value adjustments, contingent acquisition consideration-related compensation expense and transaction costs); (viii) restructuring, optimization and integration costs and (ix) stock-based compensation expense, including related to the CEO’s performance-based long-term incentive plan (“LTIP”). We use Adjusted EBITDA to evaluate our own operating performance and our ability to service debt, as well as an integral part of our planning and reporting systems. Additionally, we use this measure in conjunction with discounted cash flow models to determine the Company’s overall enterprise valuation and to evaluate acquisition targets. We present Adjusted EBITDA as a supplemental measure because we believe such measure is useful to investors as a reasonable indicator of operating performance because of the low capital intensity of the Company’s service operations. We believe this measure is a financial metric used by many investors to compare companies, especially in the services industry. This measure is not a recognized measure of financial performance of the consolidated Company under GAAP in the United States, and should not be considered as a substitute for operating earnings, net earnings or cash flow from operating activities, as determined in accordance with GAAP. Our method of calculating Adjusted EBITDA may differ from other issuers and accordingly, this measure may not be comparable to measures used by other issuers. A reconciliation of net earnings to Adjusted EBITDA appears below.
| Three months ended | ||||||||
| March 31 | ||||||||
| (in thousands of US$) | 2026 | 2025 | ||||||
| Net earnings | $ | 10,779 | $ | 8,918 | ||||
| Income tax | 8,261 | 4,712 | ||||||
| Other income, including equity earnings from non-consolidated investments | (6,903 | ) | (4,574 | ) | ||||
| Interest expense, net | 22,868 | 22,548 | ||||||
| Operating earnings | 35,005 | 31,604 | ||||||
| Loss on disposal of operations | 531 | - | ||||||
| Depreciation and amortization | 68,000 | 63,402 | ||||||
| Gains attributable to MSRs | (11,315 | ) | (4,039 | ) | ||||
| Equity earnings from non-consolidated investments | 7,271 | 3,734 | ||||||
| Acquisition-related items | 15,353 | 9,381 | ||||||
| Restructuring, optimization and integration costs | 8,783 | 5,310 | ||||||
| Stock-based compensation expense | 1,175 | 6,652 | ||||||
| Adjusted EBITDA | $ | 124,803 | $ | 116,044 | ||||
3. Reconciliation of net earnings and diluted net earnings per common share to adjusted net earnings and Adjusted EPS
Adjusted EPS is defined as diluted net earnings per share adjusted for the effect, after income tax, of: (i) the non-controlling interest redemption increment; (ii) loss on disposal of operations; (iii) amortization expense related to intangible assets recognized in connection with acquisitions and MSRs; (iv) gains attributable to MSRs; (v) acquisition-related items; (vi) restructuring, optimization and integration costs and (vii) stock-based compensation expense, including related to the CEO’s LTIP. We believe this measure is useful to investors because it provides a supplemental way to understand the underlying operating performance of the Company and enhances the comparability of operating results from period to period. Adjusted EPS is not a recognized measure of financial performance under GAAP, and should not be considered as a substitute for diluted net earnings per share from continuing operations, as determined in accordance with GAAP. Our method of calculating this non-GAAP measure may differ from other issuers and, accordingly, this measure may not be comparable to measures used by other issuers. A reconciliation of net earnings to adjusted net earnings and of diluted net earnings per share to adjusted EPS appears below.
| Three months ended | ||||||||
| March 31 | ||||||||
| (in thousands of US$) | 2026 | 2025 | ||||||
| Net earnings | $ | 10,779 | $ | 8,918 | ||||
| Non-controlling interest share of earnings | (4,291 | ) | (5,729 | ) | ||||
| Loss on disposal of operations | 531 | - | ||||||
| Amortization of intangible assets | 47,699 | 44,755 | ||||||
| Gains attributable to MSRs | (11,315 | ) | (4,039 | ) | ||||
| Acquisition-related items | 15,353 | 9,381 | ||||||
| Restructuring, optimization and integration costs | 8,783 | 5,310 | ||||||
| Stock-based compensation expense | 1,175 | 6,652 | ||||||
| Income tax on adjustments | (12,555 | ) | (13,482 | ) | ||||
| Non-controlling interest on adjustments | (9,251 | ) | (7,626 | ) | ||||
| Adjusted net earnings | $ | 46,908 | $ | 44,140 | ||||
| Three months ended | ||||||||
| March 31 | ||||||||
| (in US$) | 2026 | 2025 | ||||||
| Diluted net earnings per common share | $ | (0.47 | ) | $ | (0.08 | ) | ||
| Non-controlling interest redemption increment | 0.59 | 0.15 | ||||||
| Loss on disposal of operations, net of tax | 0.01 | - | ||||||
| Amortization expense, net of tax | 0.56 | 0.56 | ||||||
| Gains attributable to MSRs, net of tax | (0.13 | ) | (0.05 | ) | ||||
| Acquisition-related items, net of tax | 0.18 | 0.11 | ||||||
| Restructuring, optimization and integration costs, net of tax | 0.13 | 0.08 | ||||||
| Stock-based compensation expense, net of tax | 0.04 | 0.10 | ||||||
| Adjusted EPS | $ | 0.91 | $ | 0.87 | ||||
| Diluted weighted average shares for Adjusted EPS (thousands) | 51,335 | 50,978 | ||||||
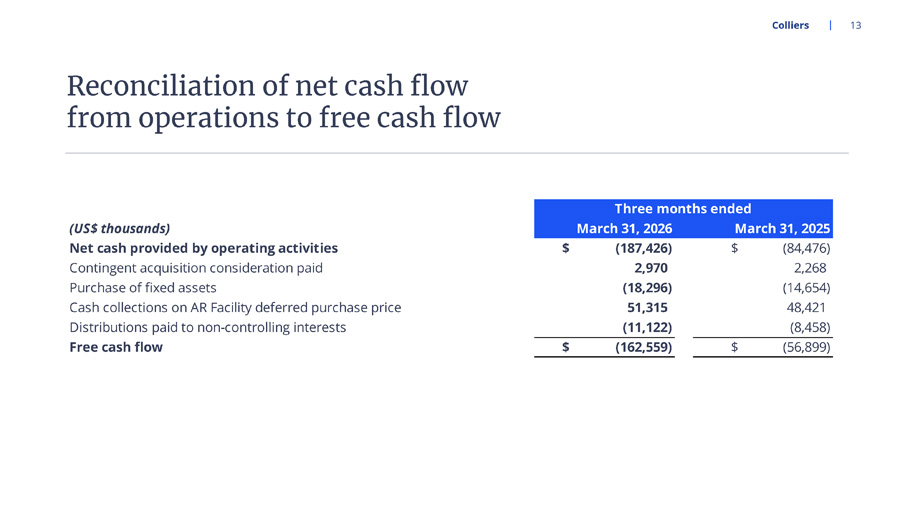
4. Reconciliation of net cash flow from operations to free cash flow
Free cash flow is defined as net cash flow from operating activities plus contingent acquisition consideration paid, less purchases of fixed assets, plus cash collections on AR Facility deferred purchase price less distributions to non-controlling interests. We use free cash flow as a measure to evaluate and monitor operating performance as well as our ability to service debt, fund acquisitions and pay dividends to shareholders. We present free cash flow as a supplemental measure because we believe this measure is a financial metric used by many investors to compare valuation and liquidity measures across companies, especially in the services industry. This measure is not a recognized measure of financial performance under GAAP in the United States, and should not be considered as a substitute for operating earnings, net earnings or cash flow from operating activities, as determined in accordance with GAAP. Our method of calculating free cash flow may differ from other issuers and accordingly, this measure may not be comparable to measures used by other issuers. A reconciliation of net cash flow from operating activities to free cash flow appears below.
| Three months ended | ||||||||
| March 31 | ||||||||
| (in thousands of US$) | 2026 | 2025 | ||||||
| Net cash used by operating activities | $ | (187,426 | ) |
|
$ | (84,476 | ) | |
| Contingent acquisition consideration paid | 2,970 | 2,268 | ||||||
| Purchases of fixed assets | (18,296 | ) | (14,654 | ) | ||||
| Cash collections on AR Facility deferred purchase price | 51,315 | 48,421 | ||||||
| Distributions paid to non-controlling interests | (11,122 | ) | (8,458 | ) | ||||
| Free cash flow | $ | (162,559 | ) | $ | (56,899 | ) | ||
| Trailing twelve months ended | |||||||
| (in thousands of US$) | March 31, 2026 | ||||||
| 2025 Annual free cash flow | $ | 352,326 | |||||
| Add: Free cash flow for three months ended March 31, 2026 | (162,559 | ) | |||||
| Less: Free cash flow for three months ended March 31, 2025 | 56,899 | ||||||
| Trailing twelve months ended March 31, 2026 free cash flow | $ | 246,666 | |||||
5. Local currency revenue and Adjusted EBITDA growth rate and internal revenue growth rate measures
Percentage revenue and Adjusted EBITDA variances presented on a local currency basis are calculated by translating the current period results of our non-US dollar denominated operations to US dollars using the foreign currency exchange rates from the periods against which the current period results are being compared. Internal growth, presented as percentage revenue variance, is calculated assuming no impact from acquired entities in the current and prior periods. Revenue from acquired entities, including any foreign exchange impacts, are treated as acquisition growth until the respective anniversaries of the acquisitions. We believe that these revenue growth rate methodologies provide a framework for assessing the Company’s performance and operations excluding the effects of foreign currency exchange rate fluctuations and acquisitions. Since these revenue growth rate measures are not calculated under GAAP, they may not be comparable to similar measures used by other issuers.
6. Assets under management
We use the term assets under management (“AUM”) as a measure of the scale of our Investment Management operations. AUM is defined as the gross market value of operating assets and the projected gross cost of development assets of the funds, partnerships and accounts to which we provide management and advisory services, including capital that such funds, partnerships and accounts have the right to call from investors pursuant to capital commitments. Our definition of AUM may differ from those used by other issuers and as such may not be directly comparable to similar measures used by other issuers.
7. Fee paying assets under management
We use the term fee paying assets under management (“FPAUM”) to represent only the AUM on which the Company is entitled to receive management fees. We believe this measure is useful in providing additional insight into the capital base upon which the Company earns management fees. Our definition of FPAUM may differ from those used by other issuers and as such may not be directly comparable to similar measures used by other issuers.
8. Adjusted EBITDA from resilient revenue percentage
Adjusted EBITDA from resilient revenue percentage is computed on a trailing twelve-month basis and represents the proportion of Adjusted EBITDA (note 2) that is derived from Engineering, Outsourcing and Investment Management service lines. All these service lines represent medium to long-term duration revenue streams that are either contractual or repeatable in nature. Adjusted EBITDA for this purpose is calculated in the same manner as for our debt agreement covenant calculation purposes, incorporating the expected full year impact of business acquisitions and dispositions.
COMPANY CONTACTS:
Jay S. Hennick
Global Chairman &
Chief Executive Officer
Christian Mayer
Global Chief Financial Officer
& Chief Executive Officer,
Commercial Real Estate
(416) 960-9500
Exhibit 99.2

First Quarter 2026 Results May 5, 2026 COMMERCIAL REAL ESTATE SERVICES | ENGINEERING | INVESTMENT MANAGEMENT 2 Colliers (US $ millions, except per share amounts) Highlights • Solid start to 2026; performance met our expectations across all segments • Planned investments in Investment Management streamlining and integration impacted Q1 margins • Strengthened leadership team to capitalize on opportunities in Commercial Real Estate and Engineering • Ayesa Engineering on track to close in late May USD LC (1) Revenues 1,313.5 1,141.2 15% 12% Net Revenues 1,150.1 993.7 16% 12% Adjusted EBITDA 124.8 116.0 8% 8% Adjusted EBITDA Margin 9.5% 10.2% Net Margin 10.9% 11.7% Adjusted EPS 0.91 0.87 5% GAAP Operating Earnings 35.0 31.6 11% GAAP Operating Earnings Margin 2.7% 2.8% GAAP diluted EPS (0.47) (0.08) Three months ended March 31 2026 2025 %Change (1) Local currency 21% 51% 28% 70% Resilient TTM Q1 2026 AEBITDA by Segment 25% 66% 9% TTM Q1 2026 Revenue by Segment 63% Resilient Colliers Commercial Real Estate Engineering Investment Management Global diversification with 70%+ resilient earnings High value, resilient growth engines Please refer to Appendix 3
4 Colliers First Quarter Consolidated Revenues Engineering Investment Management Commercial Real Estate % Change over Q1 2025 USD LC Investment Management 7% 6% Engineering 23% 18% Commercial Real Estate 14% 11% Total 15% 12% 841.2 741.0 336.8 273.9 135.3 126.2 1,313.5 1,141.2 Q1 2026 Q1 2025 (US$ millions) Local currency internal growth: 7% Revenues % Change over Q1 2025 USD LC Investment Management 8% 8% Engineering 18% 13% Commercial Real Estate 16% 13% Total 16% 12% Net Revenues 219.3 149.2 251.0 227.0 266.0 257.8 104.9 107.0 841.2 741.0 Q1 2026 Q1 2025 5 Colliers First Quarter, US$ millions Commercial Real Estate • Robust growth in Capital Markets, led by the US and EMEA • Solid growth in Leasing, largely driven by the US on continued strength in industrial and office asset classes • Modest growth in Outsourcing revenues (including property management, valuation, mortgage servicing, advisory and local project management) • AEBITDA margin improvement from higher transactional revenue gains partially offset by continued strategic investment in recruiting 46.2 39.0 Q1 2026 Q1 2025 6.3% Net margin 6.1% Net margin USD LC Revenue Growth 14% 11% Net Revenue Growth 16% 13% AEBITDA Growth 18% 20% Revenues AEBITDA Outsourcing Leasing Capital Markets Subconsultant and other direct costs GAAP Operating Earnings: Q1 2026 $16.5M at 2.0% margin; Q1 2025 $13.8M at 1.9% margin 6 Colliers First Quarter, US$ millions Engineering • Significant revenue growth delivered through a combination of acquisitions and internal growth • Net margin down slightly on lower utilization in certain end - markets 284.3 240.4 52.5 33.5 336.8 273.9 Q1 2026 Q1 2025 GAAP Operating Earnings: Q1 2026 $2.5M at 0.7% margin; Q1 2025 ($3.3M) at (1.2%) margin 26.9 24.1 Q1 2026 Q1 2025 9.5% Net margin 10.0% Net margin USD LC Revenue Growth 23% 18% Net Revenue Growth 18% 13% AEBITDA Growth 12% 9% Revenues AEBITDA Engineering Subconsultant and other direct costs
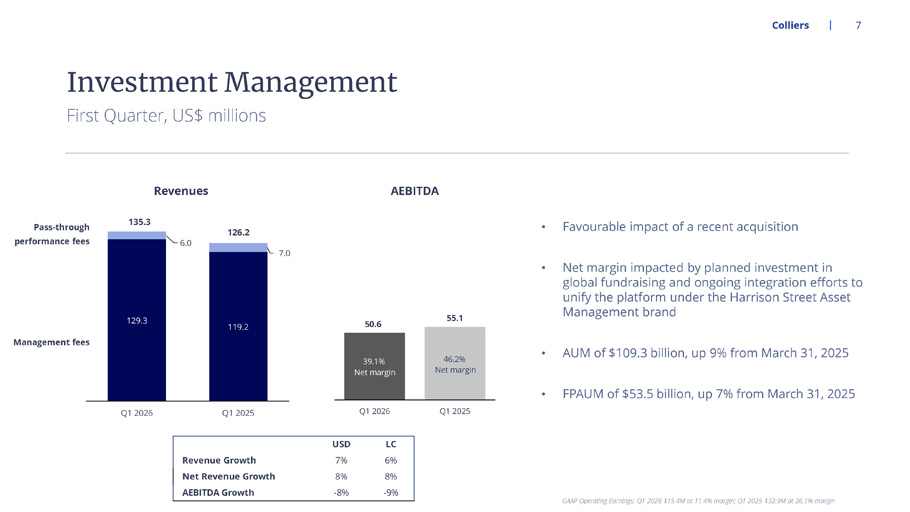
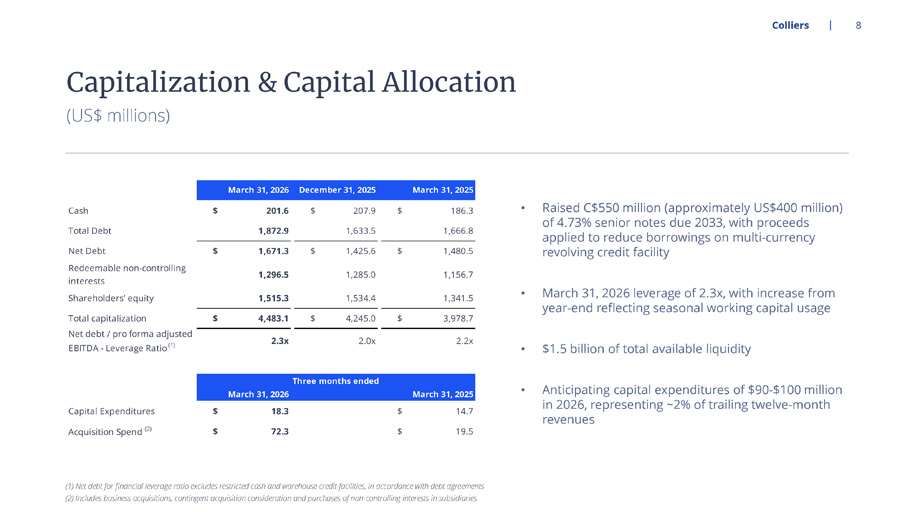
7 Colliers First Quarter, US$ millions Investment Management • Favourable impact of a recent acquisition • Net margin impacted by planned investment in global fundraising and ongoing integration efforts to unify the platform under the Harrison Street Asset Management brand • AUM of $109.3 billion, up 9% from March 31, 2025 • FPAUM of $53.5 billion, up 7% from March 31, 2025 129.3 119.2 6.0 7.0 135.3 126.2 Q1 2026 Q1 2025 GAAP Operating Earnings: Q1 2026 $15.4M at 11.4% margin; Q1 2025 $32.9M at 26.1% margin 50.6 55.1 Q1 2026 Q1 2025 39.1% Net margin 46.2% Net margin USD LC Revenue Growth 7% 6% Net Revenue Growth 8% 8% AEBITDA Growth -8% -9% Management fees Pass - through performance fees Revenues AEBITDA 8 Colliers (US$ millions) Capitalization & Capital Allocation • Raised C$550 million (approximately US$400 million) of 4.73% senior notes due 2033, with proceeds applied to reduce borrowings on multi - currency revolving credit facility • March 31, 2026 leverage of 2.3x, with increase from year - end reflecting seasonal working capital usage • $1.5 billion of total available liquidity • Anticipating capital expenditures of $90 - $100 million in 2026, representing ~2% of trailing twelve - month revenues Cash $ 201.6 $ 207.9 $ 186.3 Total Debt 1,872.9 1,633.5 1,666.8 Net Debt $ 1,671.3 $ 1,425.6 $ 1,480.5 Redeemable non-controlling interests 1,296.5 1,285.0 1,156.7 Shareholders' equity 1,515.3 1,534.4 1,341.5 Total capitalization $ 4,483.1 $ 4,245.0 $ 3,978.7 Net debt / pro forma adjusted EBITDA - Leverage Ratio (1) 2.3x 2.0x 2.2x Capital Expenditures $ 18.3 $ 14.7 Acquisition Spend (2) $ 72.3 $ 19.5 Three months ended March 31, 2026 March 31, 2025 March 31, 2026 December 31, 2025 March 31, 2025 (1) Net debt for financial leverage ratio excludes restricted cash and warehouse credit facilities, in accordance with debt a gre ements (2) Includes business acquisitions, contingent acquisition consideration and purchases of non - controlling interests in subsidiar ies Colliers 9 2026 Full Year Outlook Remains Unchanged The financial outlook is based on the Company’s best available information as of the date of this presentation, and remains s ubj ect to change based on numerous macroeconomic, geopolitical, international trade, health, social and related factors.
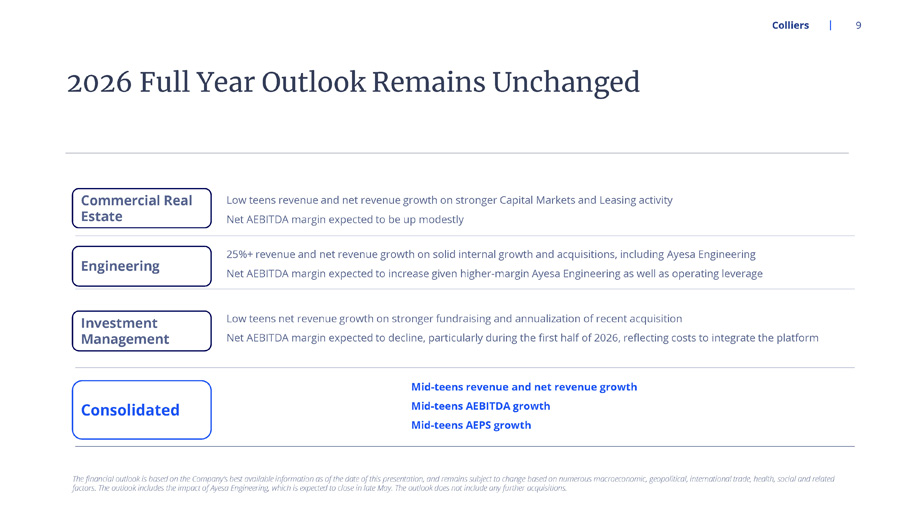
The outlook includes the impact of Ayesa Engineering, which is expected to close in late May. The outlook does not include any further acquisitions. Commercial Real Estate Engineering Investment Management Consolidated Mid - teens revenue and net revenue growth Mid - teens AEBITDA growth Mid - teens AEPS growth Low teens revenue and net revenue growth on stronger Capital Markets and Leasing activity Net AEBITDA margin expected to be up modestly 25%+ revenue and net revenue growth on solid internal growth and acquisitions, including Ayesa Engineering Net AEBITDA margin expected to increase given higher - margin Ayesa Engineering as well as operating leverage Low teens net revenue growth on stronger fundraising and annualization of recent acquisition Net AEBITDA margin expected to decline, particularly during the first half of 2026, reflecting costs to integrate the platform Appendix Colliers 10 Reconciliation of non - GAAP Measures

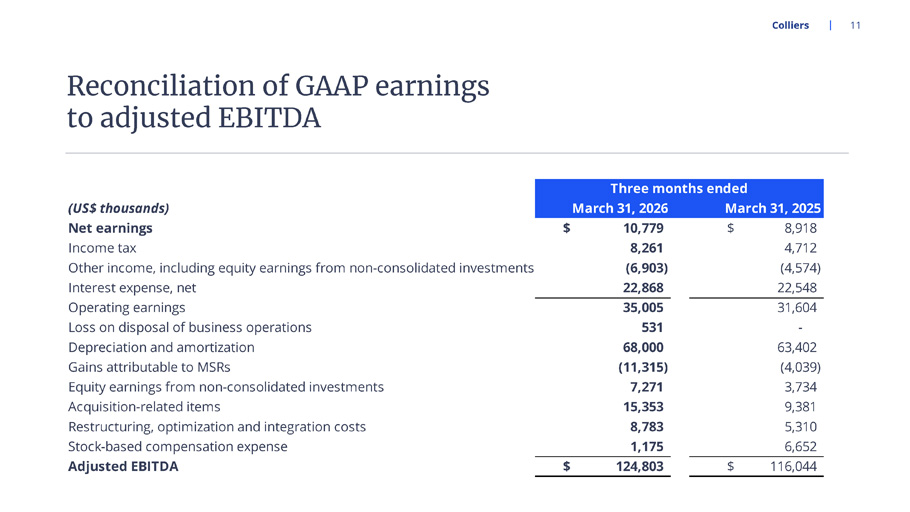
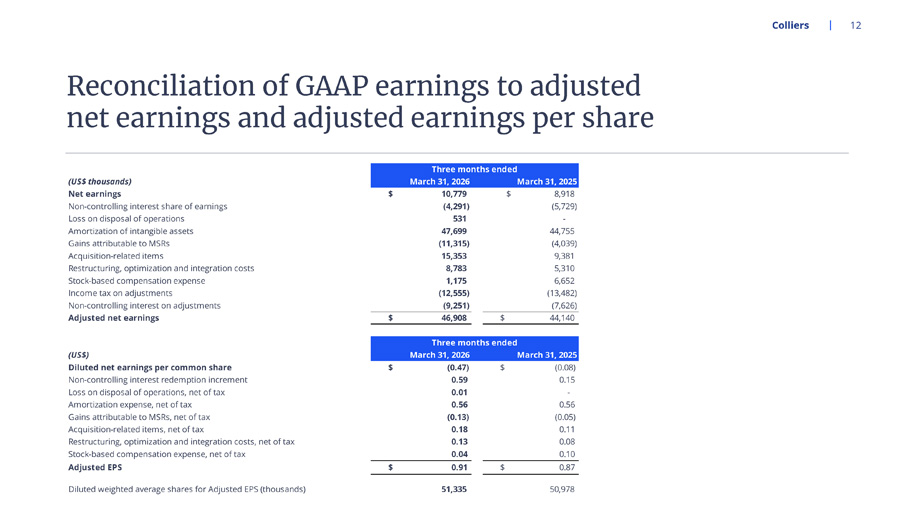
Colliers 11 (US$ thousands) Net earnings $ 10,779 $ 8,918 Income tax 8,261 4,712 Other income, including equity earnings from non-consolidated investments (6,903) (4,574) Interest expense, net 22,868 22,548 Operating earnings 35,005 31,604 Loss on disposal of business operations 531 - Depreciation and amortization 68,000 63,402 Gains attributable to MSRs (11,315) (4,039) Equity earnings from non-consolidated investments 7,271 3,734 Acquisition-related items 15,353 9,381 Restructuring, optimization and integration costs 8,783 5,310 Stock-based compensation expense 1,175 6,652 Adjusted EBITDA $ 124,803 $ 116,044 Three months ended March 31, 2026 March 31, 2025 Reconciliation of GAAP earnings to adjusted EBITDA Colliers 12 (US$ thousands) Net earnings $ 10,779 $ 8,918 Non-controlling interest share of earnings (4,291) (5,729) Loss on disposal of operations 531 - Amortization of intangible assets 47,699 44,755 Gains attributable to MSRs (11,315) (4,039) Acquisition-related items 15,353 9,381 Restructuring, optimization and integration costs 8,783 5,310 Stock-based compensation expense 1,175 6,652 Income tax on adjustments (12,555) (13,482) Non-controlling interest on adjustments (9,251) (7,626) Adjusted net earnings $ 46,908 $ 44,140 (US$) Diluted net earnings per common share $ (0.47) $ (0.08) Non-controlling interest redemption increment 0.59 0.15 Loss on disposal of operations, net of tax 0.01 - Amortization expense, net of tax 0.56 0.56 Gains attributable to MSRs, net of tax (0.13) (0.05) Acquisition-related items, net of tax 0.18 0.11 Restructuring, optimization and integration costs, net of tax 0.13 0.08 Stock-based compensation expense, net of tax 0.04 0.10 Adjusted EPS $ 0.91 $ 0.87 Diluted weighted average shares for Adjusted EPS (thousands) 51,335 50,978 Three months ended March 31, 2026 March 31, 2025 Three months ended March 31, 2026 March 31, 2025 Reconciliation of GAAP earnings to adjusted net earnings and adjusted earnings per share Colliers 13 Reconciliation of net cash flow from operations to free cash flow (US$ thousands) Net cash provided by operating activities $ (187,426) $ (84,476) Contingent acquisition consideration paid 2,970 2,268 Purchase of fixed assets (18,296) (14,654) Cash collections on AR Facility deferred purchase price 51,315 48,421 Distributions paid to non-controlling interests (11,122) (8,458) Free cash flow $ (162,559) $ (56,899) Three months ended March 31, 2026 March 31, 2025
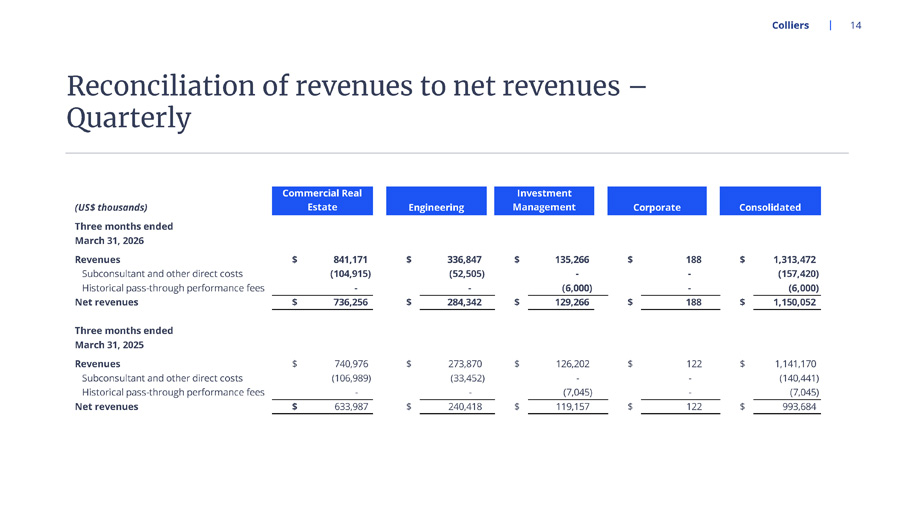
Colliers 14 Reconciliation of revenues to net revenues – Quarterly (US$ thousands) Three months ended March 31, 2026 Revenues $ 841,171 $ 336,847 $ 135,266 $ 188 $ 1,313,472 Subconsultant and other direct costs (104,915) (52,505) - - (157,420) Historical pass-through performance fees - - (6,000) - (6,000) Net revenues $ 736,256 $ 284,342 $ 129,266 $ 188 $ 1,150,052 Three months ended March 31, 2025 Revenues $ 740,976 $ 273,870 $ 126,202 $ 122 $ 1,141,170 Subconsultant and other direct costs (106,989) (33,452) - - (140,441) Historical pass-through performance fees - - (7,045) - (7,045) Net revenues $ 633,987 $ 240,418 $ 119,157 $ 122 $ 993,684 Commercial Real Estate Investment Management Engineering Corporate Consolidated Local currency revenue and adjusted EBITDA growth rate and internal revenue growth rate measures Percentage revenue and adjusted EBITDA variances presented on a local currency basis are calculated by translating the current period results of our non - US dollar denominated operations to US dollars using the foreign currency exchange rates from the periods against which the current period results are being compared.
Percentage revenue variances presented on an internal growth basis are calculated assuming no impact from acquired entities in the current and prior periods. Revenue from acquired entities, including any foreign exchange impacts, are treated as acquisition growth until the respective anniversaries of the acquisitions. We believe that these revenue growth rate methodologies provide a framework for assessing the Company’s performance and operations excluding the effects of foreign currency exchange rate fluctuations and acquisitions. Since these revenue growth rate measures are not calculated under GAAP, they may not be comparable to similar measures used by other issuers. Assets under management We use the term assets under management (“AUM”) as a measure of the scale of our Investment Management operations. AUM is defined as the gross market value of operating assets and the projected gross cost of development assets of the funds, partnerships and accounts to which we provide management and advisory services, including capital that such funds, partnerships and accounts have the right to call from investors pursuant to capital commitments. Our definition of AUM may differ from those used by other issuers and as such may not be directly comparable to similar measures used by other issuers. Fee paying assets under management We use the term fee paying assets under management (“FPAUM”) to represent only the AUM on which the Company is entitled to receive management fees. We believe this measure is useful in providing additional insight into the capital base upon which the Company earns management fees. Our definition of FPAUM may differ from those used by other issuers and as such may not be directly comparable to similar measures used by other issuers. Resilient revenue percentage Resilient revenue percentage is computed on a trailing twelve - month basis and represents the proportion that is derived from Engineering, Outsourcing and Investment Management service lines. All these service lines represent medium to long - term duration revenue streams that are either contractual or repeatable in nature. Revenue for this purpose incorporates the expected full year impact of acquisitions and dispositions. Adjusted EBITDA from resilient revenue percentage Adjusted EBITDA from Resilient for this revenue percentage is computed on a trailing twelve - month basis and represents the proportion of adjusted EBITDA that is derived from Engineering, Outsourcing and Investment Management service lines. All these service lines represent medium to long - term duration revenue streams that are either contractual or repeatable in nature. Adjusted EBITDA purpose is calculated in the same manner as calculated for our debt agreement covenant calculation purposes, incorporating the expected full year impact of business acquisitions and dispositions. Colliers 15 Other Non - GAAP Measures