UNITED STATES
SECURITIES AND EXCHANGE COMMISSION
WASHINGTON, D.C. 20549
FORM 40-F
| ☐ | REGISTRATION STATEMENT PURSUANT TO SECTION 12 OF THE SECURITIES EXCHANGE ACT OF 1934 |
| OR |
|
| ☒ | ANNUAL REPORT PURSUANT TO SECTION 13(a) OR 15(d) OF THE SECURITIES EXCHANGE ACT OF 1934 |
| For the fiscal year ended December 31, 2025 | Commission File Number: 001-38145 |
Fury Gold Mines Limited
(Exact name of Registrant as specified in its charter)
| British Columbia, Canada | 1040 | Not Applicable | ||
| (Province or Other Jurisdiction of Incorporation or Organization) | (Primary Standard Industrial Classification Code) | (I.R.S. Employer Identification No.) |
401 Bay Street, 16th Floor
Toronto, Ontario, Canada M5H 2Y4
(844) 601-0841
(Address and telephone number of Registrant’s principal executive offices)
Corporation Service Company
Suite 400, 2711 Centerville Road
Wilmington, Delaware 19808
(800) 927-9800
(Name, address (including zip code) and telephone number (including
area code) of agent for service in the United States)
Securities registered or to be registered pursuant to section 12(b) of the Act:
| Title Of Each Class |
Name Of Each Exchange On Which Registered |
| Common Shares, no par value |
NYSE American |
Securities registered or to be registered pursuant to Section 12(g) of the Act: None
Securities for which there is a reporting obligation pursuant to Section 15(d) of the Act: None
For annual reports, indicate by check mark the information filed with this Form:
| ☒ Annual Information Form |
☒ Audited Annual Financial Statements |
Indicate the number of outstanding shares of each of the Registrant’s classes of capital or common stock as of the close of the period covered by the annual report: 189,143,299 Common Shares as of December 31, 2025
Indicate by check mark whether the Registrant (1) has filed all reports required to be filed by Section 13 or 15(d) of the Exchange Act during the preceding 12 months (or for such shorter period that the Registrant was required to file such reports), and (2) has been subject to such filing requirements for the past 90 days.
Yes ☒ No ☐
Indicate by check mark whether the registrant has submitted electronically and posted on its corporate Web site, if any, every Interactive Data File required to be submitted and posted pursuant to Rule 405 of Regulation S-T (§232.405 of this chapter) during the preceding 12 months (or for such shorter period that the Registrant was required to submit and post such files).
Yes ☒ No ☐
Indicate by check mark whether the registrant is an emerging growth company as defined in Rule 12b-2 of the Exchange Act.
Emerging growth company ☐
If an emerging growth company that prepares its financial statements in accordance with U.S. GAAP, indicate by check mark if the registrant has elected not to use the extended transition period for complying with any new or revised financial accounting standards provided pursuant to Section 13(a) of the Exchange Act. ☐
†The term "new or revised financial accounting standard" refers to any update issued by the Financial Accounting Standards Board to its Accounting Standards Codification after April 5, 2012.
Indicate by check mark whether the registrant has filed a report on and attestation to its management’s assessment of the effectiveness of its internal control over financial reporting under Section 404(b) of the Sarbanes-Oxley Act (15 U.S.C. 7262(b)) by the registered public accounting firm that prepared or issued its audit report. ☒
If securities are registered pursuant to Section 12(b) of the Act, indicate by check mark whether the financial statements of the registrant included in the filing reflect the correction of an error to previously issued financial statements. ☐
Indicate by check mark whether any of those error corrections are restatements that required a recovery analysis of incentive-based compensation received by any of the registrant’s executive officers during the relevant recovery period pursuant to §240.10D-1(b). ☐
INTRODUCTORY INFORMATION
In this annual report on Form 40-F (the “Annual Report”), references to the “Company” or “Fury Gold” or the “Registrant” mean Fury Gold Mines Limited and its subsidiaries, unless the context suggests otherwise.
Fury Gold is a Canadian issuer whose common shares are registered under Section 12(b) of the United States Securities Exchange Act of 1934, as amended (the “Exchange Act”). Fury Gold is eligible to file its annual report pursuant to Section 13 of the Exchange Act on Form 40-F pursuant to the Canada/ United States multi-jurisdictional disclosure system (the “MJDS”). Fury Gold is a “foreign private issuer” as defined in Rule 3b-4 under the Exchange Act. The common shares of Fury Gold are traded in the United States on the NYSE American Stock Exchange (the “NYSE American”) under the symbol "FURY".
PRINCIPAL DOCUMENTS
Each of the documents that are filed as exhibits to this Annual Report, as set forth in the Exhibit Index attached hereto, are incorporated by reference herein.
| Document |
Exhibit No. |
|
Annual Information Form of the Company for the year ended December 31, 2025 (the "2025 AIF")
|
|
|
|
|
|
|
|
FORWARD-LOOKING STATEMENTS
This Annual Report includes or incorporates by reference certain statements that constitute “forward-looking statements” within the meaning of Section 21E under the Exchange Act and Section 27A of the United States Securities Act of 1933, as amended. These statements appear in a number of places in this Annual Report and documents incorporated by reference herein and include statements regarding the Registrant’s intent, belief or current expectation and those of the Registrant’s officers and directors. These forward-looking statements involve known and unknown risks and uncertainties that may cause the Registrant’s actual results, performance or achievements to be materially different from any future results, performance or achievements expressed or implied by such forward-looking statements. When used in this Annual Report or in documents incorporated by reference in this Annual Report, words such as “believe,” “anticipate,” “estimate,” “project,” “intend,” “expect,” “may,” “will,” “plan,” “should,” “would,” “contemplate,” “possible,” “attempts,” “seeks” and similar expressions are intended to identify these forward-looking statements. These forward-looking statements are based on various factors and were derived utilizing numerous assumptions that could cause the Registrant’s actual results to differ materially from those in the forward-looking statements. Accordingly, readers are cautioned not to put undue reliance on these forward-looking statements.
Investors are referred to the cautionary notes entitled “Cautionary Note Regarding Forward-Looking Statements” that are included in each of our 2025 AIF and 2025 Annual MD&A for a discussion of these forward-looking statements and the risks that impact these forward-looking statements. Investors are also advised to carefully review and consider the risk factors identified in the 2025 AIF under the heading “Risk Factors”, in the 2025 Annual MD&A and in the other documents incorporated by reference herein. These discussions of forward-looking statements and risk factors identify factors that could cause the Registrant’s actual results, performance and achievements to be materially different from any anticipated future results, performance or achievements expressed or implied by the forward-looking statements. The forward-looking statements contained in this Annual Report are made as of the date hereof and, accordingly, are subject to change after such date.
Although the Registrant believes that the assumptions on which the forward-looking statements are made are reasonable, based on the information available to the Registrant on the date such statements were made, no assurances can be given as to whether these assumptions will prove to be correct. Accordingly, readers should not place undue reliance on forward-looking statements. The Registrant does not undertake to update any forward-looking statements, except as, and to the extent, required by applicable securities laws, including applicable United States federal securities laws. The forward-looking statements contained in this Annual Report and the documents incorporated by reference herein are expressly qualified by this cautionary statement.
CAUTIONARY NOTE TO UNITED STATES INVESTORS CONCERNING
ESTIMATES OF MEASURED, INDICATED AND INFERRED RESOURCES
As a British Columbia corporation and a “reporting issuer” under Canadian securities laws, the Company is required to provide disclosure regarding its mineral properties in accordance with Canadian National Instrument 43-101 Standards of Disclosure for Mineral Projects (“NI 43-101”). NI 43-101 is a rule developed by the Canadian Securities Administrators that establishes standards for all public disclosure an issuer makes of scientific and technical information concerning mineral projects. In accordance with NI 43-101, the Company uses the terms mineral reserves and resources as they are defined in accordance with the CIM Definition Standards on mineral reserves and resources (the “CIM Definition Standards”) adopted by the Canadian Institute of Mining, Metallurgy and Petroleum.
Mining disclosure under U.S. securities law was previously required to comply with SEC Industry Guide 7 (“SEC Industry Guide 7”) under the Exchange Act. The United States Securities and Exchange Commission (the “SEC”) has adopted rules to replace SEC Industry Guide 7 with new mining disclosure rules under sub-part 1300 of Regulation S-K of the U.S. Securities Act (“Regulation S-K 1300”) which became mandatory for U.S. reporting companies beginning with the first fiscal year commencing on or after January 1, 2021. Under Regulation S-K 1300, the SEC now recognizes estimates of “measured mineral resources”, “indicated mineral resources” and “inferred mineral resources”. In addition, the SEC has amended its definitions of “proven mineral reserves” and “probable mineral reserves” to be substantially similar to international standards. Readers are cautioned that despite efforts to harmonize U.S. mining disclosure rules with NI 43-101 and other international requirements, there are differences between the terms and definitions used in Regulation S-K 1300 and mining terms defined by CIM and used in NI 43 101, and there is no assurance that any mineral reserves or mineral resources that an owner or operator may report as “proven mineral reserves”, “probable mineral reserves”, “measured mineral resources”, “indicated mineral resources” and “inferred mineral resources” under NI 43-101 would be the same had the owner or operator prepared the reserve or resource estimates under the standards of Regulation S-K 1300.
The Company has not included disclosure on its mineral properties under the Regulation S-K 1300 requirements as the Company is presently a “foreign private issuer” under the Exchange Act and is entitled to file this Annual Report with the SEC under the MJDS between Canada and the United States.
There is no assurance any mineral resources that the Company may report as “measured mineral resources”, “indicated mineral resources” and “inferred mineral resources” under NI 43- 101 would be the same had the Company prepared the resource estimates under the standards adopted under the Regulation S-K 1300. United States investors are also cautioned that while the SEC will now recognize “measured mineral resources”, “indicated mineral resources” and “inferred mineral resources”, investors should not assume that any part or all of the mineralization in these categories will ever be converted into a higher category of mineral resources or into mineral reserves. Mineralization described using these terms has a greater amount of uncertainty as to their existence and feasibility than mineralization that has been characterized as reserves.
The Company has no mineral reserves which require that the estimated resources be demonstrated to be economic in at least a pre-feasibility study. Accordingly, investors are cautioned not to assume that any “measured mineral resources”, “indicated mineral resources” or “inferred mineral resources” that the Company reports are or will be economically or legally mineable. Although in Canada, “inferred mineral resources” are subject to an expectation that there must be a reasonable probability of upgrading a majority of an inferred resource into a measured or indicated category, inferred resources have a greater amount of uncertainty as to their existence and as to whether they can be mined legally or economically. Therefore, United States investors are also cautioned not to assume that all or any part of the “inferred mineral resources” exist. In accordance with Canadian securities laws, estimates of “inferred mineral resources” cannot form the basis of feasibility or other economic studies, except in limited circumstances where permitted under NI 43-101.
Accordingly, information contained incorporated by reference herein describing the Company’s mineral deposits may not be comparable to similar information made public by U.S. companies subject to the reporting and disclosure requirements under the United States federal securities laws and the rules and regulations thereunder.
NOTE TO UNITED STATES READERS REGARDING DIFFERENCES
BETWEEN UNITED STATES AND CANADIAN REPORTING PRACTICES
The Company is permitted to prepare this Annual Report in accordance with Canadian disclosure requirements, which are different from those of the United States. Canadian public companies are required to prepare financial statements in accordance with IFRS® Accounting Standards as issued by the International Accounting Standards Board (IASB). Consequently, the Company’s 2025 Audited Annual Financial Statements have been prepared in accordance with IFRS® Accounting Standards as issued by the IASB and the audit is performed in accordance with Canadian auditing standards and independence standards of both Canada and the SEC / Public Company Accounting Oversight Board, each of which differ in some respects to United States generally accepted accounting principles ("US GAAP") and from practices prescribed by the SEC. Therefore, the Company’s financial statements incorporated by reference in this Annual Report may not be comparable to financial statements prepared in accordance with US GAAP.
CURRENCY
Unless otherwise indicated, all dollar amounts in this Annual Report (including the documents incorporated by reference herein) are in Canadian dollars.
DISCLOSURE CONTROLS AND PROCEDURES
Disclosure Controls and Procedures
Disclosure controls and procedures are defined in Rule 13a-15(e) and 15d-15(e) under the Exchange Act to mean controls and other procedures of an issuer that are designed to ensure that information required to be disclosed by the issuer in the reports that it files or submits under the Exchange Act is recorded, processed, summarized and reported, within the time periods specified in the SEC’s rules and forms and includes, without limitation, controls and procedures designed to ensure that such information is accumulated and communicated to the issuer’s management, including its principal executive and principal financial officers, or persons performing similar functions, as appropriate to allow timely decisions regarding required disclosure.
Management’s Evaluation of Disclosure Controls and Procedures
At the end of the period covered by this Annual Report on Form 40-F, being the fiscal year ended December 31, 2025, an evaluation was carried out under the supervision of and with the participation of the Company’s management, including the Chief Executive Officer (“CEO”) and Chief Financial Officer (“CFO”), of the effectiveness of the design and operations of the Company’s disclosure controls and procedures (as defined in Rule 13a-15(e) and 15d-15(e) under the Exchange Act). Based on that evaluation management has concluded that the Company’s disclosure controls and procedures were effective as at December 31, 2025.
The Company’s disclosure controls and procedures are designed to provide reasonable assurance of achieving their objectives and, as indicated in the preceding paragraph, the CEO and CFO believe that the Company’s disclosure controls and procedures are effective at that reasonable assurance level, although the CEO and CFO do not expect that the disclosure controls and procedures will prevent or detect all errors and all fraud.
It should be noted that a control system, no matter how well conceived or operated, can provide only reasonable, not absolute, assurance that the objectives of the control system are met. The Company will continue to periodically review its disclosure controls and procedures and may make such modifications from time to time as it considers necessary.
INTERNAL CONTROL OVER FINANCIAL REPORTING
Internal Control over Financial Reporting
Internal control over financial reporting is defined in Rule 13a-15(f) and 15d-15(f) of the Exchange Act as a process designed by, or under the supervision of, the issuer’s principal executive and principal financial officers and effected by the issuer’s board of directors, management and other personnel, to provide reasonable assurance regarding the reliability of financial reporting and the preparation of financial statements for external purposes in accordance with generally accepted accounting principles and includes those policies and procedures that:
| ● |
pertain to the maintenance of records that, in reasonable detail, accurately and fairly reflect the transactions and dispositions of the assets of the company; |
| ● |
provide reasonable assurance that transactions are recorded as necessary to permit preparation of financial statements in accordance with generally accepted accounting principles, and that receipts and expenditures of the company are being made only in accordance with authorizations of management and directors of the company; and |
| ● |
provide reasonable assurance regarding prevention or timely detection of unauthorized acquisition, use or disposition of the company’s assets that may have a material effect on the financial statements. |
Because of its inherent limitations, internal control over financial reporting may not prevent or detect misstatements. Also, projections of any evaluation of effectiveness of internal control over financial reporting to future periods are subject to risk that controls may become inadequate because of changes in conditions, or that the degree of compliance with the policies or procedures may deteriorate.
Management’s Report on Internal Control Over Financial Reporting
Management, under the supervision of the CEO and CFO, is responsible for establishing and maintaining adequate internal control over financial reporting under Rule 13a-15(f) of the Exchange Act for the Company.
Management, under the supervision of the CEO and CFO, has assessed the effectiveness of the Company’s internal control over financial reporting as of December 31, 2025 based on the criteria set forth in Internal Control - Integrated Framework (2013) issued by the Committee of Sponsoring Organizations of the Treadway Commission (“COSO”). Based on this assessment, management has concluded that the Company’s internal control over financial reporting was effective as of December 31, 2025.
Auditor’s Attestation Report
The effectiveness of the Company’s internal control over financial reporting as of December 31, 2025 has been audited by Deloitte LLP, the Company’s independent registered public accounting firm, as stated in their report included with our 2025 Audited Annual Financial Statements, filed as Exhibit 99.2 to this Annual Report, and incorporated herein by reference.
Changes in Internal Control Over Financial Reporting
There was no change in the Company’s internal control over financial reporting that occurred during the year ended December 31, 2025 that has materially affected, or is reasonably likely to materially affect, the Company’s internal control over financial reporting.
BENEFIT PLAN BLACKOUT PERIODS
The Company was not required by Rule 104 of Regulation BTR to send any notice to any of its directors or executive officers during the year ended December 31, 2025.
AUDIT COMMITTEE
The Company’s Board of Directors has established a separately designated Audit Committee of the Board in accordance with Section 3(a)(58)(A) of the Exchange Act and Section 802(B)(2) of the NYSE American Company Guide.
The Company's Audit Committee comprises three directors that the Board of Directors have determined are independent as determined under each of Rule 10A-3 under the Exchange Act and Section 803(A) of the NYSE American Company Guide:
| ● |
Steve Cook (Chair) |
| ● |
Michael Hoffman |
| ● |
Brian Christie |
AUDIT COMMITTEE FINANCIAL EXPERT
The Company’s Board of Directors has determined that Steve Cook, the Chair of the Audit Committee of the Board, is an audit committee financial expert (as that term is defined in Item 407 of Regulation S-K under the Exchange Act) and is an independent director under applicable laws and regulations and the requirements of the NYSE American. Please see “Committees of the Board – Audit Committee - Relevant Education and Experience of Audit Committee Members” in the 2025 AIF (see Exhibit 99.1).
PRINCIPAL ACCOUNTANT FEES AND SERVICES
Fees and Services
The disclosure included in the “Committees of the Board – Audit Committee - External Auditor Service Fees” section in the 2025 AIF (see Exhibit 99.1) is hereby incorporated by reference. The Company’s auditors are Deloitte LLP (PCAOB ID No. 1208).
Audit Committee Pre-Approval Policies
The disclosure included in the “Committees of the Board – Audit Committee – Pre-Approval Policies and Procedures” section in the 2025 AIF (see Exhibit 99.1) is incorporated by reference.
OFF-BALANCE SHEET ARRANGEMENTS
The Company has not entered into any off-balance sheet arrangements that have or are reasonably likely to have a current or future effect on our financial condition, changes in financial condition, revenues, expenses, results of operations, liquidity, capital expenditures or capital resources that is material to investors.
CONTRACTUAL OBLIGATIONS
The required tabular disclosure of contractual obligations is included in “Section 7: Financial position, liquidity and capital resources – 7.2 Contractual Commitments” of the 2025 Annual MD&A, filed as Exhibit 99.3 to this Annual Report, and incorporated herein by reference.
CODE OF BUSINESS CONDUCT AND ETHICS
Adoption of Code of Ethics
The Company has adopted a Code of Business Conduct and Ethics (the “Code of Ethics”) for all its directors, executive officers and employees. The Code of Ethics complies with Section 807 of the NYSE American Company Guide. The Code of Ethics meets the requirements for a “code of ethics” within the meaning of that term in Form 40-F. The text of the Code of Ethics is posted on the Company's website at “https://furygoldmines.com/about-us/governance/”.
Amendments or Waivers
No substantive amendments were made to the Company’s Code of Ethics during the fiscal year ended December 31, 2025, and no waivers of the Company’s Code of Ethics were granted to any principal officer of the Company or any person performing similar functions during the fiscal year ended December 31, 2025.
INTERACTIVE DATA FILE
The Company is submitting as Exhibit 101 to this Annual Report on Form 40-F its Interactive Data File.
NYSE AMERICAN CORPORATE GOVERNANCE
The Company’s common shares are listed for trading in the United States on the NYSE American. Section 110 of the NYSE American Company Guide permits the NYSE American to consider the laws, customs and practices of foreign issuers in relaxing certain NYSE American listing criteria, and to grant exemptions from NYSE American listing criteria based on these considerations. A foreign issuer seeking relief under these provisions is required to provide written certification from independent local counsel that the non-complying practice is not prohibited by home country law. A foreign issuer that follows home country practices in lieu of certain provision of the NYSE American Company Guide must disclose any significant ways in which its corporate governance practices differ from those followed by domestic companies either on its website or in the annual report filed with the SEC that includes its audited financial statements.
The Company has the following corporate governance practices that differ significantly from NYSE American corporate governance practices for U.S. domestic companies:
| ● |
Quorum Requirement: The Company’s quorum requirement for meetings of shareholders is two persons who are, or who represent by proxy, shareholders who, in the aggregate, hold at least 25% of the issued shares entitled to be voted at the meeting. This quorum requirement is less than the minimum recommended quorum requirement under Section 123 of the NYSE American Company Guide of one third of shareholders entitled to vote required. The Company did not meet this requirement and was granted relief from this listing standard upon listing on the NYSE American. |
| ● |
Shareholder Approval Requirement. In addition, Section 713 of the NYSE American Company Guide requires that the Company obtain the approval of its shareholders for share issuances equal to 20 percent or more of presently outstanding shares for a price which is less than the greater of book or market value of the shares. This requirement does not apply to public offerings. There is no such requirement under British Columbia law or under the Company’s home stock exchange rules (Toronto Stock Exchange) unless the dilutive financing (i) materially affects the control of the Company, or (ii) results in the issuance of 25% of the outstanding common shares of the Company, on a non-diluted basis. The Company intends to seek a waiver from NYSE American’s section 713 requirements should a dilutive private placement financing trigger the NYSE American shareholders’ approval requirement in circumstances where the same financing does not trigger such a requirement under British Columbia law or under the rules and policies of the TSX. |
The foregoing practices are consistent with laws, customs and practices in Canada.
In addition, the Company may from time-to-time seek relief from the NYSE American corporate governance requirements on specific transactions under the NYSE American Company Guide, in which case, the Company shall make the disclosure of such transactions in the manner required by the NYSE American Company Guide.
MINE SAFETY DISCLOSURE
Pursuant to Section 1503(a) of the Dodd-Frank Wall Street Reform and Consumer Protection Act 2010, issuers that are operators, or that have a subsidiary that is an operator, of a coal or other mine in the United States are required to disclose in their periodic reports filed with the SEC information regarding specified health and safety violations, orders and citations, related assessments and legal actions, and mining-related fatalities under the regulation of the Federal Mine safety and Health Administration under the Federal Mine Safety and Health Act of 1977, as amended.
The Company was not the operator of a mine in the United States during the fiscal year ended December 31, 2025.
RECOVERY OF ERRONEOUSLY AWARDED COMPENSATION
The Company has adopted a Policy for the Recovery of Erroneously Awarded Incentive-Based Compensation (the "Clawback Policy") as required by NYSE American listing standards and pursuant to Rule 10D-1 of the Exchange Act. The Clawback Policy is incorporated herein by reference to Exhibit 97.1 to the Company’s annual report on Form 20-F for the fiscal year ended December 31, 2023.
At no time during or after the fiscal year ended December 31, 2025 (as of the date of this Annual Report), was the Company required to prepare an accounting restatement that required recovery of erroneously awarded compensation pursuant to the Clawback Policy and, as of December 31, 2025, there was no outstanding balance of erroneously awarded compensation to be recovered from the application of the Clawback Policy to a prior restatement.
UNDERTAKING AND CONSENT TO SERVICES OF PROCESS
| A. |
UNDERTAKING |
The Registrant undertakes to make available, in person or by telephone, representatives to respond to inquiries made by the Commission staff, and to furnish promptly, when requested to do so by the Commission staff, information relating to the securities in relation to which the obligation to file an Annual Report on Form 40-F arises, or transactions in said securities.
| B. |
CONSENT TO SERVICE OF PROCESS |
The Company previously filed an Appointment of Agent for Service of Process and Undertaking on Form F-X signed by the Company and its agent for service of process with respect to the class of securities in relation to which the obligation to file this Annual Report arises, which Form F-X is incorporated herein by reference. Any change to the name or address of the Company’s agent for service shall be communicated promptly to the Commission by amendment to Form F-X referencing the file number of the Company.
SIGNATURES
Pursuant to the requirements of the Exchange Act, the Registrant certifies that it meets all of the requirements for filing on Form 40-F and has duly caused this Annual Report to be signed on its behalf by the undersigned, thereunto duly authorized.
| Date: March 31, 2026 |
FURY GOLD MINES LIMITED |
||
| By: | /s/ Phil van Staden | ||
| Phil van Staden | |||
| Chief Financial Officer | |||
EXHIBIT INDEX
| Exhibit Number |
Exhibit Description |
|
|
Policy for the Recovery of Erroneously Awarded Incentive-Based Compensation(1)
|
|
|
Annual Information Form of the Company for the year ended December 31, 2025
|
|
|
|
|
|
Management’s Discussion and Analysis for the fiscal year ended December 31, 2025 |
|
|
|
|
|
|
|
|
|
|
|
|
|
|
|
|
|
|
|
|
|
|
|
|
|
|
|
|
|
|
|
|
|
|
|
|
|
|
|
|
|
|
|
|
|
|
101
|
Interactive Data Files with respect to the Consolidated Audited Financial Statements for the Years Ended December 31, 2025 and 2024 |
|
104
|
Cover Page Interactive Data file (formatted as Inline XBRL and contained in Exhibit 101) |
| (1) |
Incorporated by reference to Exhibit 97.1 of the Registrant’s Annual Report on Form 20-F for the year ended December 31, 2023 dated May 7, 2024. |
Exhibit 99.1
![]()
FURY GOLD MINES LIMITED
ANNUAL INFORMATION FORM
FOR THE FINANCIAL YEAR ENDED DECEMBER 31, 2025
DATED MARCH 31, 2026
TABLE OF CONTENTS
|
INTRODUCTORY NOTES |
1 |
||
|
Cautionary Note Regarding Forward-Looking Statements |
1 |
||
|
Cautionary Note to United States Investors Regarding Mineral Disclosure |
2 |
||
|
Change in Reporting Forms for United States Investors |
4 |
||
|
Canadian Resource Category (Classification) Definitions |
4 |
||
|
CORPORATE STRUCTURE |
5 |
||
|
Name, Address and Incorporation |
5 |
||
|
Inter-corporate Relationships |
6 |
||
|
GENERAL DEVELOPMENT OF THE BUSINESS |
7 |
||
|
Business of Fury Gold and Three-year History |
7 |
||
|
Three-year Overview |
7 |
||
|
2022 Acquisition of Shares of Dolly Varden Silver Corporation |
7 |
||
|
2022 to 2024 Unification of the Éléonore South Gold Project |
7 |
||
|
2025 Acquisition of Quebec Precious Metals Corp. and its Projects |
7 |
||
|
2025 Preliminary Economic Assessment of Eau Claire Project |
7 |
||
|
Fiscal 2023 |
8 |
||
|
Eau Claire Exploration Program |
8 |
||
|
2023 Changes to Management and the Board |
8 |
||
|
2023 Financings |
9 |
||
|
2023 Corporate developments |
9 |
||
|
Fiscal 2024 |
9 |
||
|
2024 Eau Claire Exploration |
9 |
||
|
2024 Éléonore South Exploration Program |
10 |
||
|
2024 Committee Bay Exploration |
11 |
||
|
2024 Management and Board Changes |
11 |
||
|
2024 Financing |
11 |
||
|
Fiscal 2025 – March 2026 |
11 |
||
|
2025 Acquisition of Quebec Precious Metals (“QPM”) |
11 |
||
|
2025 Eau Claire Exploration |
12 |
||
|
2025 Éléonore South Exploration |
12 |
||
|
2025 Sakami and Elmer East |
13 |
||
|
2025 Elmer East Project |
14 |
||
|
2025 Committee Bay (Nunavut Territory, Canada) Exploration |
15 |
||
|
2025 Financings |
15 |
||
|
2025 Changes to the Board |
16 |
||
|
BUSINESS DESCRIPTION |
16 |
||
|
General |
16 |
||
|
Specialized Skill and Knowledge |
17 |
||
|
Competitive Conditions |
17 |
||
|
Cyclical and Seasonal |
17 |
||
|
Intangible Properties |
17 |
||
|
Environmental Protection |
17 |
||
|
Employees |
18 |
||
|
Social and Environmental Policies |
18 |
||
|
Indigenous and Local Community Engagement |
18 |
||
|
Cultural Awareness |
19 |
||
|
Ecologo Certificate |
19 |
||
|
THE COMPANY’S MINERAL PROJECTS |
19 |
||
|
Overview of Four Material Mineral Properties |
19 |
||
|
Eau Claire Property |
20 |
||
|
Land Tenure |
20 |
||
|
Local Resources and Infrastructure |
21 |
||
|
Accessibility and Climate, Physiography |
21 |
||
|
History |
22 |
||
|
Pre 2002 Exploration |
22 |
||
|
2002 – 2019 Eastmain Resources Exploration |
23 |
||
|
Geology and Mineralization |
24 |
||
|
Exploration |
25 |
||
|
Historical Drilling |
25 |
||
|
Extension Drilling |
26 |
||
|
Percival Drilling |
27 |
||
|
Historical QA/QC Sample Preparation, Analyses and Security |
27 |
||
|
Fury Sampling, Analysis, Data Management and QA/QC |
28 |
||
|
Mineral Processing and Metallurgical Testing |
29 |
||
|
2024 Mineral Resource Estimate |
30 |
||
|
Drill Hole Database |
31 |
||
|
Total Drill Hole and Channel Sample Database for the Eau Claire Project |
31 |
||
|
Combined Mineral Resource Estimate for the Eau Claire Project, May 10, 2024 |
31 |
||
|
Eau Claire Deposit Mineral Resource Estimate, May 10, 2024 |
31 |
||
|
Highlights of the 2024 Percival Mineral Resource Estimate are as follows |
32 |
||
|
2024 Eau Claire and Percival Deposits Mineral Resource Estimate Notes: |
33 |
||
|
Eau Claire Project 2025 Preliminary Economic Assessment (“PEA”) |
34 |
||
|
Highlights of the PEA |
34 |
||
|
Eau Claire PEA Sensitivity Analysis to Economic Inputs |
38 |
||
|
Qualified Person (“QP”) Recommendations from PEA |
39 |
||
|
Estimated Budget for Eau Claire Resource Expansion Drilling |
40 |
||
|
Post-PEA Eau Claire Exploration |
41 |
||
|
Eau Claire Regional Exploration- Serendipity Prospect |
41 |
||
|
Committee Bay Project |
42 |
||
|
2023 Technical Report |
42 |
||
|
Description and Location |
42 |
||
|
Access, Climate, Local Resources, Infrastructure and Physiography |
42 |
||
|
Geology, Mineralization and Deposit Types |
43 |
||
|
History |
43 |
||
|
Committee Bay Sampling, Analyses and Data Verification |
44 |
||
|
Mineral Processing and Metallurgical Testing |
45 |
||
|
2023 Committee Bay Mineral Resource Estimate |
46 |
||
|
Exploration Program Recommendations |
48 |
||
|
2015 through 2021 Committee Bay Exploration by Fury |
49 |
||
|
Raven Prospect |
50 |
||
|
Three Bluffs Deposit |
50 |
||
|
2022 and 2023 Committee Bay Project Exploration Program |
51 |
||
|
2024 Committee Bay Project Exploration Program |
51 |
||
|
2025 Committee Bay Project Exploration Program |
52 |
||
|
Éléonore South Property, Québec, Canada |
52 |
||
|
2024 Technical Report |
52 |
||
|
Location and Size |
53 |
||
|
Access, Climate, Local Resources, Infrastructure and Physiography |
54 |
||
|
Geology, Mineralization and Deposit Types |
55 |
||
|
Property History |
55 |
||
|
Royalties |
56 |
||
|
Sampling, Analyses and Data Verification |
56 |
||
|
Mineral Processing and Metallurgical Testing |
57 |
||
|
Mineral Resource Estimates |
57 |
||
|
2024 Éléonore South Exploration Program |
57 |
||
|
Éléonore South Future Exploration |
58 |
||
|
Sakami Property, Québec, Canada |
60 |
||
|
2025 Technical Report |
60 |
||
|
Property Description, Location |
60 |
||
|
Geology and Mineralization |
61 |
||
|
Location of the Project with Regional Geology |
61 |
||
|
Methodology |
62 |
||
|
Drilling and Exploration |
62 |
||
|
Mineral Resource Estimate MRE) |
62 |
||
|
RISK FACTORS |
64 |
||
|
Exploration Activities May Not Be Successful |
64 |
||
|
Commodity Price Fluctuations and Cycles |
65 |
||
|
Additional Funding Requirements and Shareholder Equity Dilution |
65 |
||
|
Negative Cash Flow |
66 |
||
|
Indirect Economic Interest in the Homestake Ridge Project |
66 |
||
|
Price Volatility of Publicly Traded Securities |
66 |
||
|
Mineral Resource Estimates |
66 |
||
|
Inflation |
67 |
||
|
Property Commitments |
67 |
||
|
Environmental Regulatory, Health & Safety Risks |
67 |
||
|
Relationships with Local Communities and Indigenous Organizations |
68 |
||
|
Environmental Protection |
68 |
||
|
Climate Change |
69 |
||
|
Changes in Government Mining, Permitting, Environmental Regulation |
69 |
||
|
Competitive Conditions |
69 |
||
|
Local Community Uncertainties |
70 |
||
|
Acquisitions May Not Be Successfully Integrated |
70 |
||
|
Changes in the Market Price of Common Shares |
70 |
||
|
Properties May Be Subject to Defects in Title |
70 |
||
|
Reliance on Contractors and Experts |
71 |
||
|
Qualified and Experienced Employees, Management, and Board Members |
71 |
||
|
Legal and Litigation Risks |
71 |
||
|
Risks Relating to Statutory and Regulatory Compliance |
71 |
||
|
Under-insured or Uninsurable Insurance Risks |
72 |
||
|
Limited Business History and No History of Earnings |
72 |
||
|
Claims by Investors Outside of Canada |
72 |
||
|
No-Dividends Policy |
72 |
||
|
Disclosure and Internal Controls |
72 |
||
|
Cybersecurity Risks |
73 |
||
|
Social Media Risks |
74 |
||
|
Liabilities relating to Past Issuances of Flow-Through Shares |
74 |
||
|
DESCRIPTION OF CAPITAL STRUCTURE |
74 |
||
|
Attributes of Common Shares |
74 |
||
|
Authorized Preferred Shares- Nil issued |
75 |
||
|
MARKET FOR SECURITIES |
75 |
||
|
Trading Price and Volume on TSX |
75 |
||
|
Trading Price and Volume of Common Shares on the NYSE American |
75 |
||
|
Prior Sales-2025 Issuances of Common Shares or Equivalents |
76 |
||
|
DIRECTORS AND EXECUTIVE OFFICERS |
76 |
||
|
Name, Principal Occupation and Province or State of Residence |
76 |
||
|
Directors and Executive Officers |
77 |
||
|
Management Security Holdings |
78 |
||
|
No Management History of Cease Trade Orders, Bankruptcies etc. |
78 |
||
|
Potential Conflicts of Interest |
79 |
||
| Audit Committee |
79 |
||
|
Audit Committee Charter |
79 |
||
|
Composition of the Audit Committee |
80 |
||
|
Relevant Education and Experience of Audit Committee Members |
80 |
||
|
Pre-Approval Policies and Procedures |
80 |
||
|
External Auditor Service Fees |
80 |
||
|
Other Board Committees |
81 |
||
|
No Legal Proceedings |
81 |
||
|
INTEREST OF MANAGEMENT AND OTHERS IN MATERIAL TRANSACTIONS |
81 |
||
|
SHARED SERVICES PROVIDER |
81 |
||
|
TRANSFER AGENT AND REGISTRAR |
82 |
||
|
AUDITOR |
82 |
||
|
MATERIAL CONTRACTS |
82 |
||
|
INTERESTS OF EXPERTS |
83 |
||
|
ADDITIONAL INFORMATION |
83 |
||
Graphics
Graphic 1 Fury Gold Mines Limited, Subsidiaries and Mineral Projects Organization Chart
Graphic 2 Eau Claire Project Location Map and Claims
Graphic 3: Long Section and Cross Section views of the proposed Eau Claire OP and UG mine plan.
Graphic 4: Eau Claire PEA Base Case Sensitivities.
Graphic 5: Eau Claire Hybrid Case Sensitivities.
Graphic 6: Eau Claire PEA Toll Milling Case Sensitivities.
Graphic 7: Committee Bay Project Location and Claims
Graphic 8: Three Bluffs Drilling - Long Section
Graphic 9: Éléonore South Project Location and Claims
Graphic 10: Sakami Local Geology
Tables
Table 1: Eau Claire Project Drill Hole Database
Table 2: 2024 Eau Claire Combine Mineral Resource Estimate
Table 3: 2024 Eau Claire Deposit Mineral Resource Estimate
Table 4: 2024 Percival Deposit Mineral Resource Estimate
Table 5: Eau Claire PEA Key Economic Assumptions and Results
Table 6: Potentially Mineable Portion of the Eau Claire Resource
Table 7: Eau Claire PEA Capital and Operating Cost Summary
Table 8: Eau Claire PEA Sensitivity Analysis
Table 9: Estimated Budget for Eau Claire Resource Expansion Drilling
Table 10: 2023 Committee Bay Mineral Resources
Table 11: CommitteeBay Future Drilling Budget
Table 12: Éléonore South Future Exploration Budget
Table 13: 2025 Sakami Inferred Resource Estimate
Table 14: 2025 TSX Trading Summary
Table 15: 2025 NYSE American Trading Summary
Table 16: 2025 Issuances of Treasury Shares or Equivalents
Table 17: Directors and Officers Summary Information
Table 18: 2024/25 External Auditor Fees
Table 19: 2023-2025 Shared Service Provider Costs In this Annual Information Form (the “AIF”) the “Company”, “Fury Gold”, “we”, “us” or “our” refers to Fury Gold Mines Limited on a consolidated basis together with its subsidiaries unless otherwise expressly provided.
INTRODUCTORY NOTES
This AIF is dated March 31, 2026. Except as otherwise indicated, all information contained herein is as at December 31, 2025. In this AIF, unless otherwise indicated, all dollar amounts and references to “C$” or “$” are to Canadian dollars and references to “US$” are to U.S. dollars. All dollar amounts are expressed in thousands (000s) of Canadian dollars unless otherwise indicated.
Cautionary Note Regarding Forward-Looking Statements
Certain statements made in this AIF contain forward-looking information within the meaning of applicable Canadian and United States securities laws (“forward-looking statements”). These forward-looking statements are presented for the purpose of assisting the Company’s securityholders and prospective investors in understanding management’s intentions and views regarding future outcomes and are inherently uncertain and should not be heavily relied upon. When used in this AIF, the words “may”, “would”, “could”, “will”, “intend”, “plan”, “anticipate”, “believe”, “seek”, “propose”, “estimate”, “expect”, and similar expressions, as they relate to the Company, identify such forward-looking statements. Specific forward-looking statements in this AIF include:
|
● |
exploration and financing plans and potential sources of financing; |
|
● |
estimated mineral resources or their potential economics; |
|
● |
estimates which reference future price of minerals, especially gold and other precious metals; |
|
● |
the potential for resource expansion and ultimately mine development of the Company’s projects, |
|
● |
ability to use harmonized disclosure forms for U.S. purposes (see 40F discussion below) |
|
● |
exploration permitting timelines and possible delays; |
|
● |
local indigenous and other affected communities engagement; and |
|
● |
any objectives, expectations, intentions, plans, results, levels of activity, goals or achievements; |
The forward-looking statements contained in this AIF represent the Company’s views as of the date hereof. The assumptions related to these plans, estimates, projections, beliefs and opinions may change without notice and in unanticipated ways. Many assumptions may prove to be incorrect, including:
|
● |
budgeting plans, expected costs, assumptions regarding capital and commodity market conditions and other factors upon which the Company has based its expenditure and funding expectations; |
|
● |
ability to raise additional capital to proceed with its exploration, development and operations plans and attracting finance for exploration studies will be possible; |
|
● |
ability to obtain or renew the licenses, permits and regulatory approvals necessary for its planned exploration and securing support of locally affected communities; |
|
● |
exploration plans will not be adversely impacted by declines in prices of precious metals, investment ,market conditions, and consequent impairment of the Company’s ability to finance its operations |
|
● |
that operations and financial markets will not in the long term be adversely impacted by wars, pandemics or other natural or man-made disasters; |
|
● |
extreme weather events, water scarcity, and seismic events, and the Company’s strategies to deal with these issues; |
|
● |
ability to recruit and retain qualified personnel to pursue its business operations; |
|
● |
mineral resource estimates, and the assumptions upon which they are based, are reasonably accurate; |
|
● |
ability to comply with current and future environmental, safety and other regulatory requirements and to obtain and maintain local community support. |
Risks and other factors are discussed in more detail in the section entitled “Risk Factors” in this AIF. Investors and others should carefully consider these risks and other factors and not place heavy reliance on the forward-looking statements. The Company only updates its forward-looking statements, to the extent required by applicable securities laws.
Cautionary Note to United States Investors Regarding Mineral Disclosure
This AIF uses the terms “mineral resource”, “measured mineral resource”, “indicated mineral resource” and “inferred mineral resource”, which are Canadian mining terms as defined in, and required to be disclosed in accordance with, National Instrument 43-101 – Standards of Disclosure for Mineral Projects (“NI 43-101”), which references the guidelines set out in the Canadian Institute of Mining, Metallurgy and Petroleum (the “CIM”) – CIM Definition Standards on mineral resources and mineral reserves (“CIM Definition Standards”), adopted by the CIM Council, as amended. Mining disclosure under U.S. securities law was previously required to comply with SEC Industry Guide 7 (“SEC Industry Guide 7”) under the United States Securities Exchange Act of 1934, as amended. The SEC has adopted rules to replace SEC Industry Guide 7 with mining disclosure rules under sub-part 1300 of Regulation S-K of the U.S. Securities Act (“Regulation S-K 1300”). Under Regulation S-K 1300, the SEC now recognizes estimates of “Measured Mineral Resources”, “Indicated Mineral Resources” and “Inferred Mineral Resources”. In addition, the SEC has amended its definitions of “Proven Mineral Reserves” and “Probable Mineral Reserves” to be substantially similar to CIM and other similar international standards. Readers are cautioned that despite efforts to harmonize U.S. mining disclosure rules with NI 43-101 and other international requirements, there remain differences between the terms and definitions used in Regulation S-K 1300 and mining terms defined by CIM and used in NI 43 101. There is no assurance that any mineral reserves or mineral resources that an owner or operator may report as “proven mineral reserves”, “probable mineral reserves”, “measured mineral resources”, “indicated mineral resources” and “inferred mineral resources” under NI 43-101 would be the same had the owner or operator prepared the reserve or resource estimates under the standards of Regulation S-K 1300.
The following is a summary of certain material differences between NI 43-101 and S-K 1300:
|
1. |
Qualified Person / Qualified Person Requirements |
Under NI 43-101, all scientific and technical disclosure must be based on, and prepared by or under the supervision of, a "Qualified Person" as defined under NI 43-101. A Qualified Person under NI 43-101 is an individual who is a member or licensee in good standing of a professional organization and has at least five years of relevant experience in the field of activity for which they are assuming responsibility. S-K 1300 also requires disclosure to be prepared by, or under the supervision of, a "Qualified Person," as defined therein; however, the specific qualifications, professional association requirements, and definitions differ between the two regimes, and the two terms are not necessarily equivalent.
|
2. |
Classification of Mineral Resources and Mineral Reserves |
Both NI 43-101 and S-K 1300 use the mineral resource and mineral reserve classification terminology of the CIM Definition Standards on Mineral Resources and Mineral Reserves ("CIM Standards") and the SEC's own corresponding standards, respectively. While S-K 1300 was largely modeled on and harmonized with international standards (including those developed by the Committee for Mineral Reserves International Reporting Standards ("CRIRSCO")), and uses categories of Measured, Indicated, and Inferred Mineral Resources, and Proven and Probable Mineral Reserves, there remain differences in the specific definitions, thresholds, and methodologies applied. Canadian issuers should note that classification and categorization of resources and reserves under NI 43-101 may not be directly comparable to those disclosed by issuers subject to S-K 1300.
|
3. |
Preliminary Economic Assessments |
NI 43-101 permits the disclosure of a "Preliminary Economic Assessment" ("PEA"), which is a study that includes an economic analysis of the potential viability of mineral resources that is prepared prior to, and without the need for, Mineral Reserve estimation. S-K 1300 does not recognize a PEA as a distinct category of technical study for purposes of SEC disclosure. Under S-K 1300, technical studies that are roughly analogous to a PEA may be disclosed only in limited circumstances and are subject to different requirements. Accordingly, PEA disclosure that may be included herein may not have a directly corresponding disclosure category under S-K 1300. The Company has filed a PEA in regards to its Eau Claire Project discussed herein.
|
4. |
Inferred Mineral Resources |
Both NI 43-101 and S-K 1300 permit the disclosure of Inferred Mineral Resources. Under NI 43-101, Inferred Mineral Resources may be cited in a PEA, subject to certain cautionary statements. Under S-K 1300, Inferred Mineral Resources may not be included in technical studies for economic analysis purposes. Accordingly, any economic analysis that includes Inferred Mineral Resources may not meet the requirements for corresponding disclosure under S-K 1300.
|
5. |
Technical Report Requirements |
NI 43-101 prescribes detailed requirements for the preparation and filing of a technical report (a "Technical Report") in specified circumstances, including upon initial disclosure of mineral resources or mineral reserves, upon the completion of certain studies, and in connection with certain securities transactions. While S-K 1300 requires an initial assessment or a pre-feasibility or feasibility study to support disclosure of mineral resources and mineral reserves, respectively, the form, content, filing trigger events, and other requirements applicable to technical reports under NI 43-101 differ materially from those applicable to technical study summaries filed under S-K 1300.
|
6. |
Feasibility and Pre-Feasibility Studies |
Under S-K 1300, disclosure of Proven or Probable Mineral Reserves must be supported by a pre-feasibility or feasibility study. Under NI 43-101, Mineral Reserves must similarly be supported by a study demonstrating, among other things, a Qualified Person's determination that economic extraction can be reasonably justified; however, the specific levels of study, definitions, and criteria applicable under the two regimes may differ in certain respects.
|
7. |
Materiality and Disclosure Thresholds |
The materiality standards and thresholds applicable to the disclosure of mineral resource and mineral reserve estimates, as well as other technical information, may differ between NI 43-101 and S-K 1300.
The Company has no mineral reserves (which require that the estimated resources be demonstrated to be economic in at least a pre-feasibility study). Accordingly, investors are cautioned not to assume that any “measured mineral resources”, “indicated mineral resources” or “inferred mineral resources” that the Company reports are or will be economically or legally mineable. Although in Canada, “inferred mineral resources” are subject to an expectation that there must be a reasonable probability of upgrading a majority of an inferred resource into a measured or indicated category, inferred resources have a greater amount of uncertainty as to their existence and as to whether they can be mined legally or economically. Therefore, United States investors are also cautioned not to assume that all or any part of the “inferred mineral resources” exist. In accordance with Canadian securities laws, estimates of “inferred mineral resources” cannot form the basis of feasibility or other economic studies, except in limited circumstances where permitted under NI 43-101. Accordingly, information contained in this AIF describing the Company’s mineral deposits may not be comparable to similar information made public by U.S. companies subject to the reporting and disclosure requirements under the United States federal securities laws and the rules and regulations thereunder.
Change in Reporting Forms for United States Investors
Previously, the Company filed its annual report with the U.S. Securities and Exchange Commission (the “SEC”) on Form 20-F as a foreign private issuer. Effective December 31, 2025, the Company determined that it satisfies the eligibility requirements to register its securities and file its annual report under the Multijurisdictional Disclosure System (“MJDS”) established jointly by the SEC and the Canadian Securities Administrators (“CSA”).
Accordingly, the Company has transitioned from filing its annual report on Form 20-F to filing on Form 40-F under the MJDS. Commencing with the annual report for the fiscal year ended December 31, 2025 the Company will file its annual report with the SEC on Form 40-F, which permits eligible Canadian issuers to satisfy their SEC reporting obligations primarily by incorporating by reference disclosure documents prepared in accordance with Canadian securities laws and filed on the System for Electronic Document Analysis and Retrieval (“SEDAR+”).
To qualify for the MJDS and file on Form 40-F, the Company must, among other things, be incorporated or organized under the laws of Canada or a Canadian province or territory, be a "reporting issuer," or the equivalent, in at least one Canadian province or territory for a minimum period of 12 months prior to filing, have an aggregate market value of its public float of at least US $75 million (as measured by the applicable threshold under General Instruction B(1) of Form 40-F); and not be an "ineligible issuer" as defined under SEC rules. The Company has confirmed that it meets each of these criteria as of the date of this filing.
Under the MJDS, the Company's annual disclosure will continue to be prepared in accordance with applicable Canadian securities laws and will be filed on SEDAR+ in Canada. That disclosure will be incorporated by reference into the Company's Form 40-F filed with the SEC and will therefore be available to U.S. investors through the SEC's Electronic Data Gathering, Analysis and Retrieval system (“EDGAR”). The transition from Form 20-F to Form 40-F is not expected to result in any material change to the nature or scope of the Company's public disclosure obligations except that for the fiscal years for which the Company filed using form 20-F, it was required to provide disclosure on its mineral properties under US Regulation S-K 1300 and will now provide technical disclosure compliant with Canadian NI 43-101 and the Canadian Institute of Mining and Metallurgy (CIM) Standards. The Company remains subject to the continuous and timely disclosure requirements of applicable Canadian securities laws, as well as the reporting obligations arising from the registration of its securities under the Securities Exchange Act of 1934, as amended (the “Exchange Act”).
The Company's common shares are registered under Section 12(g) of the Exchange Act. The Company will continue to comply with all applicable obligations arising under the Exchange Act, including the filing of annual reports on Form 40-F, the filing of Reports on Form 6-K to furnish material information to the SEC on an ongoing basis; and compliance with the applicable provisions of the Sarbanes-Oxley Act of 2002 and the rules and regulations promulgated thereunder, to the extent applicable to MJDS filers.
Canadian Resource Category (Classification) Definitions
The discussion of mineral deposit classifications in this AIF adheres to the CIM Definition Standards developed by the CIM. Estimated mineral resources fall into two broad categories dependent on whether the economic viability of them has been established and these are “mineral resources” (potential for economic viability) and “mineral reserves” (viable economic production is feasible). Resources are sub-divided into categories depending on the confidence level of the estimate based on level of detail of sampling and geological understanding of the deposit. The categories, from lowest confidence to highest confidence, are inferred mineral resource, indicated mineral resource and measured mineral resource. Reserves are similarly sub-divided by order of confidence into probable (lowest) and proven (highest). The Company at this time has not classified any of its mineral deposits as mineral reserves. These classifications can be more particularly described as follows:
A “mineral resource” is a concentration or occurrence of solid material of economic interest in or on the Earth’s crust in such form, grade or quality and quantity that there are reasonable prospects for eventual economic extraction. The location, quantity, grade or quality, continuity and other geological characteristics of a mineral resource are known, estimated or interpreted from specific geological evidence and knowledge, including sampling. The Company has no projects for which mineral reserves are claimed.
An “inferred mineral resource” is that part of a mineral resource for which quantity and grade or quality are estimated on the basis of limited geological evidence and sampling. Geological evidence is sufficient to imply but not verify geological and grade or quality continuity. It has a lower level of confidence than that applying to an indicated mineral resource and must not be converted to a mineral reserve. It is reasonably expected that the majority of inferred mineral resources could be upgraded to indicated mineral resources with continued exploration.
An “indicated mineral resource” is that part of a mineral resource for which quantity, grade or quality, densities, shape and physical characteristics are estimated with sufficient confidence to allow the application of modifying factors in sufficient detail to support mine planning and evaluation of the economic viability of the deposit. Geological evidence is derived from adequately detailed and reliable exploration, sampling and testing and is sufficient to assume geological and grade or quality continuity between points of observation. It has a lower level of confidence than that applying to a measured mineral resource and may only be converted to a probable mineral reserve.
A “measured mineral resource” is that part of a mineral resource for which quantity, grade or quality, densities, shape, and physical characteristics are estimated with confidence sufficient to allow the application of modifying factors to support detailed mine planning and final evaluation of the economic viability of the deposit. Geological evidence is derived from detailed and reliable exploration, sampling and testing and is sufficient to confirm geological and grade or quality continuity between points of observation. It has a higher level of confidence than that applying to either an indicated mineral resource or an inferred mineral resource. It may be converted to a proven mineral reserve or to a probable mineral reserve.
A “mineral reserve” is the economically mineable part of a measured and/or indicated mineral resource. It includes diluting materials and allowances for losses, which may occur when the material is mined or extracted and is defined by studies at Pre-Feasibility or Feasibility level as appropriate that include application of modifying factors, which are considerations used to convert mineral resources to mineral reserves and include, but are not restricted to, mining, processing, metallurgical, infrastructure, economic, marketing, legal, environmental, social and governmental factors. Such studies demonstrate that, at the time of reporting, extraction could reasonably be justified. The reference point at which mineral reserves are defined, usually the point where the ore is delivered to the processing plant, must be stated. It is important that, in all situations where the reference point is different, such as for a saleable product, a clarifying statement is included to ensure that the reader is fully informed as to what is being reported. The public disclosure of a mineral reserve must be demonstrated by a pre-feasibility study or feasibility study.
A “probable mineral reserve” is the economically mineable part of an indicated, and in some circumstances, a measured mineral resource. The confidence in the modifying factors applying to a probable mineral reserve is lower than that applying to a proven mineral reserve. The Company has not determined that any of its properties contain any probable mineral reserves.
A “proven mineral reserve” is the economically mineable part of a measured mineral resource. A proven mineral reserve implies a high degree of confidence in the modifying factors. The Company has not determined that any of its properties contain any proven mineral reserves.
CORPORATE STRUCTURE
Name, Address and Incorporation
The Company was incorporated under the Business Corporations Act (British Columbia) (the “BCBCA”) on June 9, 2008 the Common Shares began trading on the TSXV in 2011. On October 15, 2013, the Company changed its name to Auryn Resources Inc. On November 1, 2016, the Company completed its graduation to the TSX and the Common Shares began trading on the TSX. In connection with the Company’s graduation to the TSX, the Common Shares were voluntarily delisted from the TSXV. On July 17, 2017, the Common Shares also commenced trading on the NYSE American. On October 9, 2020 Auryn resources were renamed Fury Gold Mines Limited as part of a reorganization and acquisition transaction that closed on the same day.
Fury Gold is a reporting issuer in all of the provinces and territories of Canada. In addition, the Common Shares are registered under Section 12(b) of the U.S. Exchange Act by virtue of being listed on the NYSE American. The Company’s legal registered and records office is in care of its attorneys at 1500-1055 West Georgia Street, Vancouver, BC, V6E 4N7, and its mailing office is located at 401 Bay Street, 16th Floor, Toronto, ON M5H 2Y4.
Inter-corporate Relationships
Fury Gold conducts its business through a number of wholly-owned subsidiaries The following diagram depicts the Company’s corporate structure as of December 31, 2025, and its material subsidiaries, including the name, jurisdiction of incorporation. Each is 100% owned (graphic does not show immaterial investments in two service provider entities see- Shared Service Provider herein).

Graphic 1: Fury Subsidiaries and Mineral Projects Organization Chart
GENERAL DEVELOPMENT OF THE BUSINESS
Business of Fury Gold and Three-year History
Fury Gold Mines is a Canadian-focused high-grade gold exploration company strategically positioned in two prolific mining regions: the Eeyou Istchee James Bay Region of Quebec and the Kitikmeot Region in Nunavut. Fury Gold has a portfolio of mineral properties of which four are considered material at this time: the Eau Claire property located in the Eeyou Istchee James Bay Region of Northern Quebec (the “Eau Claire Project”), the Committee Bay gold project located in the Kitikmeot Region of Nunavut (the “Committee Bay Project”) and the Éléonore South property (“Éléonore South Project”) and Sakami project (the “Sakami Project”) both located in the Eeyou Istchee James Bay Region of Northern Quebec.
Three-year Overview
2022 Acquisition of Shares of Dolly Varden Silver Corporation
On February 25, 2022, the Company announced the completion of the sale of the Homestake Ridge project to Dolly Varden Silver Corporation (“Dolly Varden”), a publicly traded corporation listed on the TSX Venture Exchange. Pursuant to the Homestake Purchase Agreement entered into on December 6, 2021, Dolly Varden acquired 100% of Homestake Resource Corporation from Fury in exchange for a $5M cash payment and the issuance of 76,504,590 common shares of Dolly Varden. Since then, the Company has sold a number of these shares for total proceeds of $20.6M and holds as of December 31, 2025 common shares representing a 12.3% interest in Dolly Varden.
On March 17, 2026, an earlier announced merger of equals between Dolly Varden and Contango ORE Inc (“Contango”) was approved at a shareholders meeting. Dolly Varden received regulatory approval on March 23, 2026 while the merger closed on March 26, 2026. The Company’s shareholding in Dolly Varden was converted into shares of Contango at a rate of 0.1652 Contango shares for each Dolly Varden share while converting from an investment in associate to marketable securities. The fair value of the Contango shares was $43.3M as at March 23, 2026. The carrying value of the Dolly Varden investment in associate was $25.9M as at December 31, 2025. The Company's shareholding in Contango represents roughly 5.8% ownership and does not constitute significant influence.
2022 to 2024 Unification of the Éléonore South Gold Project
On September 12, 2022, the Company and its joint venture partner Newmont Corporation (“Newmont”), through their respective subsidiaries, completed the acquisition of the remaining approximately 23.77% participating interest of Azimut Exploration Inc. in the Éléonore South Joint Venture (“ESJV”), on a pro-rata basis. Following the completion of the transaction, the 100% ESJV participating interests were then held 50.022% by the Company and 49.978% by Newmont. On February 29, 2024, the Company completed the purchase of Newmont’s 49.978% interest in the Éléonore South Gold Project in Quebec (“Éléonore South”) for $3,000,000. As a result of the consolidation, Fury Gold is the 100% owner of Éléonore South.
The Company also acquired Newmont’s 30,392,372 common shares or 10.98% of Sirios Resources Inc. (“Sirios”) as part of the transaction for an additional $1,300,000. Sirios shares have been acquired for investment purposes, and Fury will evaluate its investment in Sirios on an ongoing basis with respect to any possible additional purchases or dispositions. In March 2024, the Company sold 1,514,000 common shares of Sirios, resulting in the Company’s interest in Sirios being reduced to 10.4%. Following further dilutive equity financings completed by Sirios in 2024, the Company’s holding interest in Sirios as at December 31, 2024 was less than 9.9%.
2025 Acquisition of Quebec Precious Metals Corp. and its Projects
On April 28, 2025, the Company announced the completion of its acquisition of Quebec Precious Metals Corporation (QPM), initially announced on February 26, 2025. Fury acquired all outstanding common shares of QPM by issuing 8,349,045 Fury shares at closing, valued at approximately $4.533 million. As part of the acquisition the Company paid $750,000 in cash. Through this acquisition, the Company gained three prospective projects: the Sakami gold project in Eeyou Istchee James Bay, Québec; the Elmer East gold and lithium project, also in Eeyou Istchee James Bay; and a 68% interest in the Kipawa rare earths project and full ownership of the Zeus heavy rare earths project, both located in the Témiscamingue region of Québec. These projects were not individually material to Fury at the time. Since the QPM acquisition did not meet the thresholds for a significant acquisition under National Instrument 51-102, no business acquisition report was required to be filed.
2025 Preliminary Economic Assessment of Eau Claire Project
See below under Eau Clair Project.
A more detailed three-year history is as follows:
Fiscal 2023
Eau Claire Exploration Program
On February 13, 2023, Fury Gold provided an update on targeting the wholly owned Lac Clarkie project immediately to the east of its 100% owned Eau Claire project in the Eeyou Istchee Territory in the James Bay region of Quebec. The Company has defined a total of eight gold targets through the completion of a B-horizon soil sampling program (Figure 1). Six of the targets lie along the Cannard Deformation Zone, which hosts numerous gold occurrences along its >100 kilometre (km) mapped extent, including Fury’s Eau Claire Deposit and Percival Property. Fury prioritized these newly defined targets for follow-up in 2023 with the aim of advancing a number of these targets.
In April 2023, Fury Gold commenced a drilling program at the Eau Claire Deposit, comprising of 10,000 to 15,000 metres (m), with the goals of i) continuing expansion of the high-grade Eau Claire resource; ii) following up on the 2022 success at the Percival Prospect 14 km to the east of Eau Claire; and iii) advancing several early-stage exploration targets along the Cannard Deformation Zone to the drill ready stage.
On July 10, 2023, the Company announced its 2023 summer exploration program and the restart of all exploration activities, which had been interrupted since June 5, 2023, due to a governmental emergency fire evacuation order.
On August 3, 2023, Fury announced results for the first three 2023 core drill holes at the high-grade Eau Claire gold project. The 2023 drill program focused on the continued expansion of the Hinge Target located immediately west of the Eau Claire Deposit. Drilling at the Hinge Target continues to return multiple stacked zones of gold mineralization from each drill hole, including 5.0m of 3.6 g/t Au within a broader interval of 14.0m of 2.37 g/t Au. Additional drill intercepts include 6.5m of 2.66 g/t Au, 6.0m of 2.77 g/t Au and 1.0m of 10.35 g/t Au.
On October 3, 2023, the Company reported the results for an additional two infill core drill holes from the Hinge Target at the Eau Claire Project. The 2023 drill program continued to focus on infill drilling at the Hinge Target located immediately west of the Eau Claire Deposit. Every hole completed at the Hinge Target to date had intercepted two corridors of stacked gold-bearing quartz tourmaline veins and alteration, including 3.5m of 5.73 g/t gold and 11.27 g/t Tellurium and 7.43g/t gold over 2.5m within a broader interval of 4.65g/t gold and 8.72 g/t Tellurium over 4.5m. Drill holes 23EC-065 and 23EC-068 represent the continuation of a series of infill drill holes designed to tighten up the spacing of the 2022 Hinge Target drilling to a nominal spacing of 60-80m. The stacked intercepts through these new holes continued to exhibit the overall strength of the mineralized system within the Hinge Target.
On November 28, 2023, the Company reported additional results from the 2023 infill drilling program at the Hinge Target at the Eau Claire Project. Drilling continued to intercept multiple zones of gold mineralization, including 5.5m of 4.52 g/t gold and 3.0m of 3.34 g/t gold from 23-EC-069; 1.0m of 20.20 g/t gold and 3.5m of 3.51 g/t gold from 23EC-070; 1.0m of 19.55 g/t gold from 23EC-066; and 3.5m of 3.82 g/t gold from 23EC-067.
2023 Changes to Management and the Board
On February 22, 2023, the Company announced that its Board of Directors appointed Brian Christie as an Independent Director, effective immediately. Mr. Christie most recently served as Vice President, Investor Relations at Agnico Eagle Mines Limited, prior to which Mr. Christie worked for over 17 years as a precious and base metals mining analyst and brings with him extensive experience in the capital markets and the mining industry. On May 15, 2023, the Company announced the appointment of Mr. Christie as Board Chair, replacing Mr. Jeffrey Mason, who was appointed Board Chair on January 11, 2023 and continued to serve as independent Director of Fury Gold until his resignation on June 26, 2024. The Company also announced that Michael Henrichsen, Chief Geological Officer, resigned from his role to pursue other interests.
On June 23, 2023, Phil van Staden, having previously served as the Company’s Corporate Controller since 2020, was appointed Interim Chief Financial Officer of the Company and brings over 15 years of diverse international experience in various accounting roles and industries throughout South Africa and Canada. He holds B. Commerce and B. Commerce Honours degrees, respectively, from the University of Pretoria and the University of South Africa. Mr. van Staden, took over from Dr. Lynsey Sherry, who had been the Chief Financial Officer since November 2020. Mr. van Staden was appointed (permanent) Chief Financial Officer effective January 1, 2024.
On September 5, 2023 Fury announced that it had appointed Ms. Isabelle Cadieux as an Independent Director, and she served until her resignation from the Board on March 24, 2025.
2023 Financings
In March 2023, the Company closed a bought-deal private placement of 6,076,500 Common Shares of the Company that qualify as “flow-through shares” (the “FT Shares”) at a price of C$1.44 per FT Share for aggregate gross proceeds of approximately $8.750 million. The proceeds from the March 2023 Offering are being used to incur “flow-through mining expenditures” in connection with the exploration of the Company’s Eau Claire and ESJV projects. As at December 31, 2023, the Company had approximately $544,000 available to incur flow-through mining expenditures before December 31, 2024.
2023 Corporate developments
On October 12, 2023, the Company filed a short form base shelf prospectus (the "Shelf Prospectus") with the securities commissions or similar regulatory authorities in all of the provinces and territories of Canada and has filed a corresponding registration statement on Form F-10 with the United States Securities and Exchange Commission. As a result of the completion of these filings, the Company is permitted to publicly offer up to $75 million of common shares, subscription receipts, warrants, and units or any combination thereof to investors in Canada and the United States during the 25-month period from October 12, 2023, that the Shelf Prospectus is effective.
Fiscal 2024
2024 Eau Claire Exploration
On January 17, 2024, the Company reported results from the 2023 drilling program at the Hinge Target at the Eau Claire Project. Highlights from the seven drill holes include 31.77 g/t gold over 3.50m from 23EC-077; 65.0 g/t gold over 0.50m and 14.25 g/t gold over 1.0m from 23EC-074; 2.56 g/t gold over 7.50m from 23EC-068; and 3.41 g/t gold over 6.50m and 5.0 g/t gold over 3.50m from 23EC-075.
On February 6, 2024, the Company announced the final set of results from the 12,000m 2023 drilling program at the Hinge Target, part of the high-grade Eau Claire Project. Highlights from these last five drill holes include 17.62 g/t gold over 3.50m, including 29.80 g/t gold over 2m, and 22.20 g/t gold over 0.50m from 23EC-079; and 5.49 g/t gold over 3.50m from 23-EC-078. The reported intercepts from drill hole 23EC-082 of 17.62 g/t gold over 3.50m is within 135m of surface and is completely open to surface and to the west, above the rest of the Hinge Target.
On March 13, 2024, Fury Gold announced the results for the five remaining 2023 core drill holes from the Percival
Prospect located 14 kilometers east of the Eau Claire Project. Highlights from the drill holes include 15.0 m of 0.88 g/t Au including 3.0 m of 2.81 g/t Au from 23KP-016; 18.0m of 0.50 g/t Au from 23KP-014; and 14.50m of 1.05 g/t Au including 1.0m of 10.70 g/t Au from 23KP-013.
On May 14, 2024, the Company announced an updated Mineral Resource Estimate for the high-grade Eau Claire deposit as well as a Maiden Mineral Resource Estimate for the Percival deposit. The Eau Claire project now contains a combined mineral resource of 1.16Moz gold (Au) at a grade of 5.64 g/t Au in the Measured and Indicated category as well as an additional 723koz gold at a grade of 4.13 g/t Au in the Inferred Category. The 2024 updated Mineral Resource Estimate indicates an increase in the Measured and Indicated category by 307koz (a 36.0% increase) and adds 223koz Au (a 44.6% increase) to the Inferred category.
On June 19, 2024, the Company commenced a 3,500m drill program at the Serendipity Project at Eau Claire, focusing on three target areas.
On June 28, 2024, the Company announced the filing of a Technical Report for the Increased Mineral Resource Estimate for the high-grade Eau Claire deposit as well as a Maiden Mineral Resource Estimate for the Percival deposit located in the Eeyou Istchee Territory of the James Bay region of Quebec. The Eau Claire project now contains a combined mineral resource of 1.16Moz gold (Au) at a grade of 5.64 g/t Au in the Measured and Indicated category as well as an additional 723koz gold at a grade of 4.13 g/t Au in the Inferred Category. Gold mineralization remains open for expansion in all directions at both the Eau Claire and Percival deposits through additional drilling.
On September 9, 2024, the Company announced results from the diamond drilling program at the greenfield Serendipity Prospect on its wholly owned Eau Claire project in the Eeyou Istchee Territory in the James Bay region of Quebec. The Serendipity Prospect lies within the same prospective geological setting as the Company’s Percival Deposit. In total 3,871 metres (m) were drilled in 10 holes across five distinct targets at Serendipity. Drill hole 24SD-009 targeted a biogeochemical anomaly overlying the easterly extension of the structure controlling the mineralization at Serendipity and intercepted 12.16 g/t gold over 3.0 m (Figures 1 and 2, Table 1). Drill hole 24SD-002 targeted a biogeochemical anomaly at the hinge of an interpreted fold within volcanic stratigraphy and intercepted 5.27 g/t gold over 1.0 m. The two noted intercepts above are separated by over 2 kilometres (km) indicating the potential for a large mineralizing system at Serendipity. The Company is in the process of planning follow-up drilling at Serendipity for 2025.
2024 Éléonore South Exploration Program
On March 5, 2024, Fury Gold announced that is had identified a robust geochemical gold anomaly within the same sedimentary rock package that hosts Newmont’s Éléonore Mine at the Éléonore South gold project located in the Eeyou Istchee Territory in the James Bay region of Quebec. The orientation level biogeochemical sampling survey was designed to target an interpreted fold nose within the Low Formation sediments in an area where conventional soil or till sampling was not possible due to the ground conditions. The targeted area exhibited similar geological, geophysical, and structural characteristics to those present at the nearby Éléonore Mine. The identified anomaly is up to 200x the background value in gold and outlines the folded sedimentary package
On March 20, 2024, the Company announced a drilling program at its owned Éléonore South gold project located in the Eeyou Istchee Territory in the James Bay region of Quebec, in early April 2024, comprising of 2,000 metres (m) focusing on the Moni showing trend. Previous drilling intercepted up to; 53.25 m of 4.22 g/t gold (Au); 6.0 m of 49.50 g/t Au including 1.0 m of 294 g/t Au and 23.8 m of 3.08 g/t Au including 1.5 m of 27.80 g/t Au, several of which remain open.
On June 4, 2024, Fury announced the results of its spring 2024 diamond drilling program and the summer 2024 exploration plans for the project. The 2,331.4 metres (m) drilling program was completed with seven diamond drill holes testing 2.3 kilometres (km) of strike along the JT – Moni Trend. The drilling targeted 100 to 125 m downdip extensions from historical drilling. All seven drill holes intercepted anomalous gold mineralization including 137.5 m of 0.44 g/t gold and 18.7 m of 0.97 g/t from drill hole 24ES-161, 115.5 m of 0.50 g/t gold from drill hole 24ES-162 and, 28.0 m of 0.47 g/t gold from drill hole 24ES-160. During the summer of 2024, Fury plans to complete the biogeochemical sampling grid where a robust geochemical gold anomaly within the same sedimentary rock package that hosts Newmont’s Éléonore Mine has been identified. The completion of the biogeochemical grid will allow Fury to finalize drill targeting.
On October 7, 2024, the Company announced the discovery of high-grade lithium outcrop on the western claim block of its 100% owned Éléonore South project in the Eeyou Istchee Territory in the James Bay region of Quebec. The outcrop sampling program targeted the historical Fliszar showing lepidolite bearing pegmatite as well as new rock exposures over an area of approximately 1000 x 500 metres (m) resulting in the collection of 34 samples. Seven samples returned high-grade values above 1.75% lithium oxide (Li2O) with a peak value of 4.67% Li2O. The Company’s focus remains on the gold prospectivity of the Éléonore South project. However, the announced lithium results provide additional exploration targets as the overall project is advanced.
On November 12, 2024, the Company announced the finalization of drill targeting at the Éléonore South gold project in the Eeyou Istchee Territory in the James Bay Region of Quebec. Drilling will target robust geochemical gold anomalies within the same sedimentary rock package that hosts Newmont’s Éléonore Mine. The completed biogeochemical sampling survey covered an interpreted fold nose within the Low Formation sediments where an orientation level study identified a large-scale gold anomaly in a similar geological, geophysical, and structural setting to that of the nearby Éléonore Mine. Six priority drill targets across over 3 kilometres (km) of prospective folded sedimentary stratigraphy have been identified. These six targets encompass multi point gold anomalies above the 90th percentile of the data and correlate with moderate pathfinder elemental anomalies, most notably arsenic which is associated with gold mineralization at the Éléonore Mine. The Company intends to mobilize crews in Q1 2025 for an initial fully funded 3,000 – 5,000 metre (m) diamond drilling program.
On November 20, 2024, the Company announced that it has finalized drill targeting after completing a surficial geochemical survey at the Éléonore South gold project located in the Eeyou Istchee Territory in the James Bay region of Quebec. Six priority drill targets across over 3 kilometres (km) of prospective folded sedimentary stratigraphy have been identified. These six targets encompass multi point gold anomalies above the 90th percentile of the data and correlate with moderate pathfinder elemental anomalies, most notably arsenic, which is associated with gold mineralization at the Éléonore Mine.
2024 Committee Bay Exploration
On October 24, 2024, the Company announced the results from the summer exploration program at its 100% Committee Bay project in the Kitikmeot Region of Nunavut. The 2024 exploration program defined three drill ready shear zone hosted targets advanced through a combination of till sampling, rock sampling and geological mapping:
|
■ |
Three Bluffs Shear, where drilling in 2021 intercepted 13.93 g/t Au over 10 metres (m) (see news release dated December 1, 2021); |
|
■ |
Raven Shear where 7 rock samples have averaged 16.12 g/t gold; and |
|
■ |
Burro West where a 300 by 300 m discrete >90th percentile gold in till anomaly has been defined with a peak value of 50 ppb gold. |
2024 Management and Board Changes
On January 10, 2024, the Company announced the appointment of Phil van Staden, then Interim CFO of the Company, to the position of Chief Financial Officer effective as of January 1, 2024.
On June 27, 2024, as a result of the voting at its Annual General Meeting (“AGM”) of Shareholders held on June 26, 2024, the Company confirmed that each director nominee listed in the Company’s management information circular dated May 14, 2024, pertaining to the AGM were re-elected as directors of the Company and that Deloitte LLP was re-appointed as the Company’s auditor. Mr. Mason did not stand for re-election as a director in 2024.
2024 Financing
On June 13, 2024, the Company closed the $5 million financing announced on May 23, 2024. The Company issued 5,320,000 common shares of the Company that qualify as “flow-through shares” as defined under subsection 66(15) of the Income Tax Act (Canada) and section 359.1 of the Taxation Act (Québec) (the “FT Shares”) at a price of C$0.94 per FT Share for total gross proceeds to the Company of C$5,001.
Fiscal 2025 – March 2026
2025 Acquisition of Quebec Precious Metals (“QPM”)
On April 28, 2025, the Company announced the completion of the corporate acquisition of QPM originally announced on February 26, 2025. Fury acquired all of the issued and outstanding common shares of QPM by issuing an aggregate of 8,349,045 Fury shares on close, valued at $4.533M. As part of the acquisition the Company paid $750,000 in cash. The Company thereby acquired three prospective projects (one precious metal, one critical mineral and one base metal) which were not individually material to Fury at the time. The QPM acquisition is not a significant acquisition in accordance with National Instrument 51-102 and therefore, no business acquisition report was filed.
On October 27, 2025 Benz Mining Corp (“Benz”) exercised their option to acquire the remaining 25% of the Eastmain Gold and Ruby Hill project from the Company. The additional 25% of the Eastmain Mine property was acquired by settling a cash payment of $750 and issuing common shares of Benz to the value of $250, while the acquisition of the remaining 25% of Ruby Hill was settled by a $100 cash payment.
2025 Eau Claire Exploration
On September 2, 2025, the Company announced the results of a PEA for the Eau Claire gold deposit. The PEA represents an initial conceptual evaluation of the economic potential of Eau Claire’s mineral resources and was prepared in accordance with National Instrument 43-101 (“NI 43-101”) by SGS Geological Services. Three scenarios, all based on the same mine plan, were evaluated, each returning an after-tax net present value at a 5% discount rate (“NPV5”) and after-tax internal rate of return (“IRR”) at a gold price of US$2,400 per ounce (“oz”). The authors of this report are further described below.
The first scenario, a full standalone operation with processing conducted entirely on site (the “Base Case”), has an after-tax net present value at a 5% discount rate (NPV5) of $554 million and an after-tax internal rate of return (IRR) of 41%. The second scenario, a hybrid case involving two years of toll milling followed by full onsite crushing, milling, and processing, resulted in an after-tax NPV5 of $610 million and an IRR of 53%. The third scenario, a full toll milling operation processing mineralized material off-site at a third-party facility, produced an after-tax NPV5 of $639 million and an IRR of 84%. On October 17, 2025, the Company filed on SEDAR.com a Technical Report in support of the September 2, 2025 PEA news release.
On October 21, 2025, the Company announced that it had commenced a 10,000m drilling program at Eau Claire and provided an update on the Kipawa Rare Earths Project. The 10,000m drilling program was based on recommendations from the Eau Claire Preliminary Economic Assessment (PEA) focusing on resource growth and enhancing the mine plan.
On March 17, 2026, the Company announced initial results from its Phase 1 13,000-metre exploration drill program at Eau Claire. The key highlight was infill drill hole 26EC-099, which targeted an inferred portion of the Eau Claire resource and intercepted 11.74 g/t gold over 6.63m approximately 40m down plunge from previous drilling. The company also announced the Phase 2 program which is anticipated to comprise of an additional 15,000 – 25,000m of drilling and is expected to continue through the spring and summer of 2026.
At Kipawa, the Company is currently reviewing the project and engaging with local stakeholders.
2025 Éléonore South Exploration
On February 3, 2025, the Company announced the commencement of a diamond drilling program on the greenfield exploration Éléonore South gold project located in the Eeyou Istchee Territory in the James Bay region of Northern Quebec. Drilling targeted robust multi-faceted geological, geophysical, and geochemical gold anomalies within the same sedimentary rock package that hosts the Éléonore Mine. The fully funded first phase drilling campaign comprised approximately 4,000 – 6,000 metres (m) targeting an interpreted fold nose within the Low Formation sediments. Within the prospective folded stratigraphy were six undrilled priority targets spanning over 3 kilometres (km) of strike length that had been identified through a combination of biogeochemical sampling and interpretation of magnetics and electromagnetics survey data. The first phase of drilling was focused within a northwest-southeast structural corridor where a strong correlation between anomalous gold, stratigraphy, and structure had been identified. The drill targets occurred in a structurally complex setting with little to no outcrop exposure and the targeting model evolved with each hole drilled. The Company planned to complete approximately 15 of the 77 permitted drill holes as part of the first phase of drilling and guided additional drilling based on the results and observations from this phase.
On June 16, 2025, the Company announced the results of the Spring 2025 diamond drilling program. The first phase of drilling targeted axial planar structures within the core of a fold within the prospective Low Formation sediments. The program comprised 12 diamond drill holes totaling approximately 4,930 m of drilling within a 2x3 km target area. Four of the twelve drill holes intercepted low-grade gold mineralization across widths of up to 5 m with up to five zones in a single drill hole (25ES-170). The low-grade gold mineralization intercepted lies within an east-west, steeply southerly dipping structural corridor with quartz veining and associated strong, broad zones of carbonate + silica + tourmaline +/- diopside alteration. The structural corridor is interpreted to be an axial planar feature related to broad regional scale folding within the favourable Low Formation sedimentary package. Gold is associated with bismuth and tellurium within altered bedded wackes and argillites of the Low Formation.
The first phase of drilling did not intercept arsenopyrite, which is a primary indicator of gold mineralization at the Éléonore Mine. Moderate arsenic anomalism was used in the targeting of the initial drilling in order to filter out the high background arsenic in the regional sedimentary package. Future drilling will target moderate to high arsenic anomalism with associated gold anomalism within the identified structural corridor in order to filter out the right concentration of arsenic associated with mineralization and not primary arsenic associated with lithology.
In addition to the Éléonore style biogeochemical targets, several gold in-till anomalies remain undrilled throughout the project. These gold in-till anomalies have similar geological and geochemical characteristics to the Cheechoo style of mineralization.
2025 Sakami and Elmer East
The Sakami project was acquired as part of the Quebec Precious Metals Corp acquisition completed in 2025. The winter road accessible Sakami project covers approximately 14,250 hectares (ha), 30 km to the east of the paved Billy Diamond Highway. The Project straddles the prospective structural corridor marking the contact between the Opinaca and La Grande Geological sub-provinces, where gold mineralization has been identified across over 23 km. Gold mineralization is located at the base of a sulphide rich horizon located along and proximal to regional-scale shearing, marking the contact between the two geological sub-provinces.
On June 16, 2025, the Company announced that it had finalized a number of drill targets at the Sakami gold project. The initial phase of drilling is scheduled to start in late June 2025, with approximately 3,000 to 5,000 metres planned. The three priorities include evaluating a 23-kilometre-long gold-bearing structural corridor at the Juliette target, confirming previous mineralized intercepts at the La Pointe and La Pointe Extension targets, and conducting step-out drilling along strike and down plunge of a high-grade corridor identified at La Pointe Extension.
On August 12, 2025, the Company announced the initial results from the inaugural drill campaign at the Sakami gold project. Drill hole 25SK-001, the first of six holes drilled to date, was designed to test the down plunge extension of gold mineralization intercepted in historical drilling and intercepted five distinct zones of gold mineralization across a 140-metre drilled length; 4.7 m of 2.72 g/t gold; 0.5 m of 10.2 g/t gold; 1.5 m of 5.17 g/t gold and; 11.8 m of 1.28 g/t gold and; 41.5 m of 1.23 g/t gold. Within the two broader intercepts of 11.8 m and 41.5 m, hosted within intense pervasive silicification, there is a high-grade core that includes intercepts of up to 7 m of 3.15 g/t gold.
On September 4, 2025, the Company announced the results from two additional drill holes at the Sakami gold project. Drill hole 25SK-002 was drilled 140 m below drill hole 25SK-001, where drill hole 25SK-003 was drilled 200 m below previous shallow drilling and 100 m to the west of the previously announced drill hole 25SK-001. Highlights from the additional two drill holes include 49.5 m of 0.6 g/t gold and 22.7 m at 1.47 g/t gold from drill hole 25SK-002, as well as 59 m of 1.59 g/t gold and 9.1 m of 0.92 g/t gold from drill hole 25SK-003. The reported intercepts leave the mineralization at La Pointe Extension open at depth and along strike to the west. Results from the remaining four drill holes are pending.
On November 24, 2025, the Company announced final results from its inaugural drill campaign at the Sakami gold project located in the Eeyou Istchee Territory of the James Bay region of Northern Quebec. The 2025 diamond drill program resulted in the completion of 3,685m in seven holes of which six drill holes totaling 2,965m targeted extensions and gaps at the La Pointe Extension prospect and one hole (720m) targeted an induced Polarization chargeability anomaly at the Juliette prospect. Drill hole 25SK-005, the southwestern most drill hole completed by the Company, intercepted 26.0m of 0.71 g/t gold including 6.5m of 1.76g/t gold. The intercept in drill hole 25SK-005 is 185m to the SW of drill hole 25SK-003, which intercepted 59m of 1.59 g/t gold. Drill hole 25SK-007 intercepted 22.2m of 0.83g/t gold including 2.9m of 1.71g/t gold and 1m of 8.62g/t gold in a shallow gap between two pods of mineralization.
In addition to the drilling results the Company also announced the results of the regional 2025 soil sampling program which was completed along a regional fault splay some 10km to the west of La Pointe Extension. The soil grid resulted in the collection of 237 samples identifying six structurally controlled gold anomalies for potential follow up.
On December 8, 2025, the Company announced an initial inferred mineral resource estimate for the La Pointe Extension target on the Sakami gold project, located in the Eeyou Istchee Territory of the James Bay region in Northern Quebec. The initial inferred mineral resource comprised 23.9 million tonnes grading 1.07 g/t gold for 825,000 gold ounces. The entirety of the inferred mineral resource is contained within a conceptual open pit with a maximum depth of 400m. The La Pointe inferred resource remains open in all directions with immediate opportunities for expansion to the NE and SW as well as below the shallow portion of the conceptual open pit where drilling is limited to 175m below surface.
In addition to the inferred mineral resource at La Pointe Extension, the Company released a Mineral Exploration Target for the La Pointe prospect which ranges between 8.1 and 14.7 million tonnes grading from 1.11 to 1.57 g/t gold.
La Pointe Extension Resource Estimate technical report: The La Pointe Extension resource estimation was completed in a technical report authored by Olivier Vadnai-Leblanc, P. Geo., Geologist with SGS Geological Services (“Initial Mineral Resource Estimate for the Sakami Project, Eeyou Istchee Territory, James Bay Region of Quebec, Canada” which is dated January 21, 2026, has an effective date of November 11, 2025, and is filed on SEDAR+).
2025 Elmer East Project
The Elmer East property, also acquired as part of the QPM acquisition, covers approximately 45,735 ha and is easily accessible from the paved Billy Diamond highway. The project is located approximately 60 km north of the “km 381” rest stop where accommodations, fuel catering and power are available. The property is host to an undrilled 4.2 km long east–west oriented gold and base metal bearing structural trends known as the Lloyd showing where grab samples have returned results of up to 68.10 g/t gold, 7.99% Zinc and 7,660 ppm Copper.
Spodumene bearing pegmatites have been identified throughout the QPM land package with a recently completed drilling campaign at the Ninaaskumuwin project where +20 m spodumene bearing pegmatites with vertical continuity of up to 150 m were intercepted in drilling late 2024.
On July 9, 2025, the Company announced the results of the 2024 diamond drilling campaign targeting spodumene bearing pegmatites at Elmer East. The program comprised 825 m of diamond drilling in 5 drill holes. The drilling targeted a spodumene-bearing pegmatite outcrop, which returned surface samples of up to 3.92% Li2O. Highlights from the drill campaign include 32.35 m of 1.16% Li2O from EE24-003 and 22.48 m of 1.19% Li2O from EE24-002. Drilling confirmed the vertical continuity of lithium mineralization from surface down to 150 m. The lithium mineralized spodumene-bearing pegmatite intercepted remains open at depth and along strike. This new lithium discovery sits approximately 50 km north of Rio Tinto plc’s Galaxy Lithium project, acquired in March 2025 as part of the broader acquisition of Arcadium Lithium plc for US$ 6.7 billion.
On July 22, 2025, the Company announced the results from metallurgical test work completed on the lithium mineralized pegmatite intercepted in the 2024 drill campaign. The objective of the metallurgical test work was to characterize the mineralogy and metallurgical properties of the spodumene-bearing pegmatite intercepted in drilling. Results from the preliminary test work indicate that the Ninaaskumuwin lithium mineralization is amenable to conventional lithium extraction techniques with Heavy Liquid Separation resulting in recovery of 62.2% Lithium and a concentrate grade of 5.59% Li2O from a single composite sample.
Results from the recent test work indicate that the analyzed samples contain up to 42% spodumene, with spodumene identified as the sole lithium-bearing mineral. The intercepted pegmatite is free of impurities, suggesting that lithium concentrates suitable for lithium carbonate and lithium hydroxide battery-grade products could potentially be produced. The Ninaaskumuwin pegmatite is characterized as a highly fractionated and fertile lithium-cesium-tantalum (LCT) pegmatite. The grades of the 85 samples analyzed range from 0.02% to 3.71% Li₂O and from 0.36% to 6.30% Fe₂O₃. Additionally, a single composite sample yielded lithium recoveries of 62.2% with a concentrate grade of 5.59% Li₂O.
The drilling program completed in 2024, along with the metallurgical test work carried out in 2025, was partially funded through a government grant covering 50% of eligible costs awarded to QPM.
2025 Committee Bay (Nunavut Territory, Canada) Exploration
The Committee Bay project comprises of a series of mineral claims and leases covering approximately 250,000 hectares situated along the entire 300 km long Committee Bay Greenstone Belt, located in the eastern Kitikmeot region of Nunavut, Canada and located 180 km northeast of the Meadowbank mine operated by Agnico Eagle Mines Limited. The Committee Bay belt comprises one of a number of Archean-aged greenstone belts occurring within the larger Western Churchill province of northeastern Canada. The Committee Bay project is held 100% by the Company, subject to a 1% Net Smelter Return (“NSR”), and an additional 1.5% NSR payable on only 7,596 hectares which may be purchased within two years of the commencement of commercial production for $2,000 for each one-third (0.5%) of the NSR.
Three Bluffs MRE was completed by APEX Geoscience Ltd. (“APEX”) (see the Technical Report on the Committee Bay Project, Nunavut Territory, Canada, dated September 11, 2023, and filed under Fury’s SEDAR+ profile). It supersedes all previous Committee Bay technical reports.
On June 3, 2025, the Company announced its 2025 exploration plans for the Committee Bay project, which commenced in early July 2025 and comprised of 7 – 10 diamond drill holes totaling approximately 5,000 metres (m).
Drilling had three primary goals, including the expansion of the Three Bluffs Shear Zone target, testing regional shear zones along the southern contact of the 8 kilometre (km) long Raven shear zone, and testing regional shear zones at Burro West.
On July 14, 2025 Fury announced that the 2025 exploration drilling program had commenced at the Committee Bay project, located in the eastern Kitikmeot region of Nunavut, Canada. The 2025 drilling program comprised 7 – 10 diamond drill holes totaling approximately 5,000 metres (m) focused on: expansion of the Three Bluffs Shear Zone target, testing regional shear zones along the southern contact of the 8 kilometre (km) long Raven shear zone, and testing regional shear zones at Burro West.
On November 10, 2025, the Company announced the results from the 2025 exploration drilling program at the Committee Bay project. The 2025 drilling program comprised six (6) diamond drill holes totaling approximately 2,778 metres (m). Four of the drill holes (2,041m), targeting expansion of the Three Bluffs Shear Zone intercepted gold mineralization across 315m of strike with mineralized widths of up to 19.5m, including 5.73 grams per tonne (g/t) gold across 3.0m within a broader interval of 1.18 g/t gold over 19.5m (Hole 25TB155), which ended in the mineralized zone. The remaining two drill holes, which totaled 737m, tested the southern contact of the 8 kilometre (km) long Raven Shear Zone, which historically returned drill intercepts of up to 12.60 g/t gold over 5.49m and 31.1 g/t gold across 2.8m with outcropping gold mineralization defined over 1.4 km. Hole 25RV015, which was a 330m step-out from previous drilling intercepted 4.59 g/t gold over 1.5m.
2025 Financings
On May 27, 2025, the Company entered into a subscription agreement with Agnico Eagle pursuant to which Agnico Eagle had acquired, on a non-brokered private placement basis, 6,728,000 units in the capital of the Company (“Units”) at C$0.64 per Unit for gross proceeds of $4,306 (the “AEM Private Placement”). Each Unit consists of one common share of Fury and one common share purchase warrant. Each common share purchase warrant is exercisable to purchase one Share at C$0.80 for a 36-month period from the date of issuance on May 26, 2025, subject to accelerated expiry after 24 months if the market price of the Shares closes above C$0.80 for twenty consecutive trading days. This investment increased Agnico Eagle’s basic ownership to 6.3% of Fury’s issued shares and its defined “ownership interest” to 9.9% calculated on a “partially diluted” basis. $3.9 Million of this investment is allocated for exploration under the Company’s 2025 exploration program at the Committee Bay project and the remainder is available for other projects and general corporate purposes.
On June 20, 2025, the Company closed a $3.08 Million financing (the “June 2025 Offering”) previously announced on June 5, 2025. The Company issued 3,999,701 common shares of the Company that qualify as “flow-through shares” as defined under subsection 66(15) of the Income Tax Act (Canada) (“FT Shares”) at a price of C$0.77 per FT Share.
In connection with the June 2025 Offering, Agnico Eagle Mines Limited (“Agnico Eagle”) exercised its existing participation right and acquired 440,000 common shares of the Company at a price of C$0.67 per Share for gross proceeds of $295 (“AEM June Private Placement”). The Common Shares acquired in AEM June Private Placement do not qualify as “flow-through shares”. AEM June Private Placement, together with the June 2025 Offering, resulted in the Company raising aggregate gross proceeds of $3,375. The proceeds from AEM June Private Placement was used to advance the Company’s Committee Bay exploration program.
On October 14, 2025, the Company closed a brokered private placement which it initially announced on September 22, 2025. There was 9,915,000 flow-through units sold to charity purchasers (the “Charity FT Units”) at a price per Charity FT Unit of C$1.21; and 6,003,000 flow-through shares (the “FT Shares”) at a price per FT Share of C$1.00, for total aggregate gross proceeds of $18 million. The Charity FT Units are comprised of one “flow-through” share (each, a “Charity FT Share”), and one-half of one common share purchase warrant (each whole warrant, a “Warrant”). Each Warrant will entitle the holder to purchase one non-flow through common share (a “Warrant Share”) at a price of $1.20 per Warrant Share for a period of 24 months from the date of the closing.
On November 12, 2025 the Company closed a private placement of 1,494,253 units of the Company (the “Units”) at a price of $0.87 per Unit for gross proceeds of $1.3 million. The Units were comprised of one share, and one-half of one common share purchase warrant (each whole warrant, a “Warrant”). Each Warrant entitles the holder to purchase one common share (a “Warrant Share”) at a price of $1.20 per Warrant Share for a period of 24 months from the date of the closing.
2025 Changes to the Board
On March 26, 2025, the Company announced that director Isabelle Cadieux had resigned from the Fury Board of directors to pursue other opportunities. On June 27, 2025, the Company announced the voting results from its Annual General Meeting (“Meeting”) of Shareholders held on June 26, 2025. The Company confirmed that each director nominee listed in the Company’s management information circular dated May 12, 2025 were re-elected as directors of the Company and that Deloitte LLP was re-appointed as the Company’s auditor.
On January 26, 2026, the Company announced the appointment of Mr. Phillips Baker to its Board of Directors as an independent director.
BUSINESS DESCRIPTION
General
Fury Gold Mines is a Canadian-focused high-grade gold exploration company strategically positioned in two prolific mining regions: the Eeyou Istchee James Bay Region of Quebec and the Kitikmeot Region in Nunavut.
Fury Gold has a portfolio of mineral properties, four of which are currently considered material: the Eau Claire property (the “Eau Claire Project”), the Éléonore South property (the “Éléonore South Project”), and the Sakami property (the “Sakami Project”), all situated in the Eeyou Istchee James Bay Region of Northern Quebec, and the Committee Bay gold project located in the Kitikmeot Region of Nunavut (the “Committee Bay Project”). Fury’s portfolio of mineral properties also includes the Elmer East gold and lithium project, located in Eeyou Istchee James Bay territory in Québec; and the Kipawa-Zeus rare earths project, both situated in the Témiscamingue region of Québec, which are currently not considered material.
The Company has been actively exploring its mineral projects with the goal of identifying new areas of significant mineralization. As discussed in relevant project sections below, the majority of this work has taken place away from the known deposit areas in the form of regional exploration and prospect drilling at satellite targets. Though this work has yet to lead to the discovery of any commercial mineral deposits, it has strengthened the Company’s understanding of the geological systems and provided new evidence with respect to the projects’ continued perspectivity. The Company expects to continue its exploration on the Eau Claire Project and Committee Bay this year.
The Company has not yet determined whether any of its mineral property interests contain economically recoverable mineral reserves. The Company’s continuing operations and the underlying value of the Company’s mineral property interests are entirely dependent upon the existence of economically recoverable mineral reserves, the ability of the Company to obtain the necessary financing to complete the exploration of its mineral property interests, obtaining the necessary mining permits, and on future profitable production or the proceeds from the disposition of the exploration and evaluation assets. See “Risk Factors” for further information.
Specialized Skill and Knowledge
Most aspects of the Company’s business require specialized skills and knowledge. Such skills and knowledge include the areas of geology, mining, metallurgy, engineering, environment issues, permitting, social issues, capital markets, financing and accounting. While competition in the resource mining industry can make it difficult to locate and retain competent employees in such fields, the Company has been successful in finding and retaining personnel for the majority of its key processes. See “Risk Factors – Specialized Skill and Knowledge”.
In addition, Fury Gold’s technical and management teams have a track record of successfully monetizing assets for all stakeholders and local communities in which it operates. Fury Gold conducts itself to the highest standards of corporate governance and sustainability.
Competitive Conditions
The mineral exploration industry is competitive, and Fury Gold will be required to compete for the acquisition of project opportunities. As a result of this competition Fury Gold may not be able to acquire or retain prospective mineral projects, technical experts that can find, develop and mine such mineral properties and interests, workers to operate its mineral properties, and capital to finance exploration, development and future operations. The Company competes with other mining companies, some of which have greater financial resources and technical facilities, for the acquisition of mineral property interests, the recruitment and retention of qualified employees and for necessary investment capital with which to fund its operations and projects. See “Risk Factors – Competitive Conditions”.
Cyclical and Seasonal
The Company’s mineral exploration activities may be subject to seasonality due to adverse weather conditions affecting exploration including, without limitation, incremental weather, frozen ground and restricted access due to snow, ice or other weather-related factors. Further, the mining business, and particularly the precious metals industry, including the gold industry, is subject to metal price cycles. Moreover, the mining and mineral exploration business is subject to global economic cycles effecting, among other things, the marketability and price of gold products in the global marketplace. See “Risk Factors – Commodity Price Fluctuations and Cycles”.
Intangible Properties
The Company’s intangible property, including its mineral and surface rights, is described elsewhere in this AIF. The Company’s business is not materially affected by intangibles such as business or commercial licenses, patents and trademarks or other intellectual property.
Environmental Protection
Exploration activities are subject to numerous and often stringent environmental laws and regulations. Compliance with such laws and regulations increases the costs of, and delays planning, designing, drilling and developing the Company’s properties. To the best of management’s knowledge, the Company is in compliance in all material respects with all environmental laws and regulations applicable to its exploration and drilling activities. Fury Gold is committed to meeting or surpassing all applicable environmental legislation, regulations, permit and license requirements, and to continuously improving its environmental performance and practices. The Company embraces safe, socially and environmentally responsible and sustainable work practices during all activities. Fury Gold seeks to utilize innovative technologies and techniques to reduce its environmental footprint across all of the Company’s projects. This includes awarding drill contracts to an EcoLogo certified contractor at Eau Claire, the use of Rotary Air Blast (RAB) drilling at the Committee Bay Project, which reduces water usage, footprint and time on the ground, and the use of drone imagery to allow targeted ground-based follow up of outcrop. Current costs associated with compliance are considered to be normal. See “Risk Factors – Environmental Regulatory, Health & Safety Risks and “Risk Factors – Environmental Protection”.
Employees
As at December 31, 2025, the Company had approximately 9 equivalent full-time employees located primarily in Canada. The Company shares certain technical and administrative functions provided by Vancouver-based Universal Mineral Services Ltd on a full-cost recovery basis (See “Agreement with Universal Mineral Services Ltd.). The Company also relies on consultants and contractors to carry on many of its business activities and, in particular, to supervise and carry out mineral exploration and drilling on its mineral properties. No management functions of Fury Gold are performed to any substantial degree by a person other than the directors or executive officers of Fury Gold.
Social and Environmental Policies
Building and maintaining good corporate citizenship is an important component of Fury Gold’s business practices. The Company has adopted several social and environmental policies and codes of conduct that are essential to its operations. The Company’s operating practices are governed by the principles set out in its Code of Business Conduct and Ethics, Diversity Policy, Insider Trading Policy, Indigenous Relations Policy, Disclosure Policy and Whistle-Blower Policy.
Fury Gold endeavours to contribute to the communities in which it operates by focusing on activities that can make meaningful, positive and lasting differences to the lives of those affected by its presence. Fury Gold prioritizes creating mutually beneficial and long-term partnerships with the communities where it operates, respecting their interests as our own. Fury Gold establishes constructive local partnerships to contribute to local priorities and interests and to have communities benefit both socially and economically from its activities. The Company seeks opportunities to maximize employment and procurement for local communities through the provision of suitable training opportunities and resources.
Fury Gold endeavours to engage in open and transparent dialogue with governments, local communities, Indigenous peoples, organizations and individuals on the basis of respect, fairness and meaningful consultation and participation.
Further information regarding Fury Gold’s corporate governance policies and charters can be found on its website at www.furygoldmines.com/about -us/governance.
Indigenous and Local Community Engagement
Fury Gold respects and engages meaningfully with Indigenous and local communities at all of its operations. The Company is committed to working constructively with local communities, government agencies and Indigenous groups to ensure that exploration work is conducted in a culturally and environmentally sensitive manner. The Company’s engagement with Indigenous and local communities is governed by the principles set out in its Indigenous and Community Relations Committee Charter. Moreover, Fury Gold is committed to:
|
● |
sharing information about its projects and operations, providing meaningful opportunities for input and dialogue and involving local and Indigenous communities in archaeological work, environmental assessments and related studies; |
|
● |
making meaningful efforts to reach agreements with local and Indigenous groups on the preferred method of participation and engagement processes; |
|
● |
exploring opportunities for local and Indigenous communities to benefit from its projects and activities, which may include employment, contracting, training, community benefits and agreements, as appropriate to the type and stage of activity being undertaken; and |
|
● |
engaging in candid and respectful dialogue with a view to resolving or minimizing any disagreements and ensuring full communication in respect of any unresolved issues. |
Fury Gold is committed to responsible mineral exploration. The Company is dedicated to collaborating with Indigenous peoples and communities to establish and maintain effective, lasting, and mutually beneficial relationships. To achieve this commitment, we strive for relationships based on transparency, mutual respect, and trust. Accordingly, Fury implemented an Indigenous Relations Policy in 2025, which can be found on the Company’s website at www.furygoldmines.com/about-us/governance. In 2026 Fury hired a full time Community Liaison Officer who is a Cree speaking aboriginal.
Cultural Awareness
In 2024, employees and the board of directors completed additional cultural awareness training which focused on the Indigenous communities in the regions of its projects in Quebec. Fury, in partnership with the Cree Hunters Economic Security Board and 15 other mining and exploration companies, contributed to a voluntary fund totaling C$750,000 for the Reconstruction Initiative Forest Fires Fund 2023. This initiative aimed to support the rebuilding of cabins destroyed by the 2023 wildfires in the Eeyou Istchee James Bay territory of Quebec.
Ecologo Certificate
Additionally, during the first quarter of 2022, the Company undertook a qualitative environmental, social and governance (“ESG”) assessment with Digbee, a technology company which provides qualitative assessment tools to mining companies to track their ESG achievements. Fury Gold received an overall score of BB with a range of CC to A broken down into a corporate score of BB with a range of B to A and a project score of BB with a range of CC to A for both the Eau Claire and Committee Bay projects. These results are considered strong for an exploration company and the Company is continually evaluating and implementing initiatives to improve future scores. Fury Gold conducted a second annual Digbee ESG Certification in 2024, and achieved an overarching score of BBB with a range of CC to AA as of June 2024. A corporate score of A with a range of BB to A was obtained, which is considered to be strong for an Exploration company. The Eau Claire project achieved a score of BB with a range of CC to AA. Fury achieved an overarching score of BBB with a range of CCC to AA as of April 2025. A corporate score of BBB with a range of BB to A was obtained, which is considered to be strong for an Exploration company. The Eau Claire project achieved a score of BBB with a range of CCC to AA. The Company continues to evaluate and implement initiatives to improve future scores.
During the year ended December 31, 2025, the Company received its Ecologo certification for mineral exploration. Ecologo is the first comprehensive certification for mineral exploration companies and their service providers that features third-party certification of environmental, social and economic practices in Quebec.
During 2023, 2024 and 2025, the Company’s subsidiary Eastmain entered into a Services Agreement with Stajune Ventures Inc., a business entity of the Cree Nation of Eastmain, which provided for the local First Nation personnel to provide services for the summer exploration activities at the Eau Claire project during those years.
Fury Gold’s Indigenous and Community Relations Committee Charter can be viewed on its website at www.furygoldmines.com/about -us/governance.
THE COMPANY’S MINERAL PROJECTS
Overview of Four Material Mineral Properties
At December 31, 2025, the Company had four material mineral projects: Eau Claire, Sakami and Éléonore South all in Quebec, Canada and Committee Bay in Nunavut territory, Canada.
The Eau Claire Project is a resource stage project, 100% held and operated by Fury, comprised of 446 claims, totaling 23,284 hectares(ha). Located in 1:50,000 scale NTS map sheets 33B04 and 33B05, approximately 320 km northwest of the town of Chibougamau and 800 km north of Montreal in the Eeyou Istchee James Bay Region of Quebec. The centre of the property is located at approximately 75.78 degrees longitude west and 52.22 degrees latitude north.
The Sakami project is a winter road accessible project which covers approximately 14,250 hectares (ha), 30 km to the east of the paved Billy Diamond Highway in Quebec. The Project straddles the prospective structural corridor marking the contact between the Opinaca and La Grande Geological subprovinces, where gold mineralization has been identified across over 23 km. Gold mineralization is located at the base of a sulphide rich horizon located along and proximal to regional-scale shearing, marking the contact between the two geological subprovinces.
The early exploration stage Éléonore South Project, 100% held and operated by Fury, comprises 282 claims, totaling 14,760 hectares (ha). Located in 1:50,000 scale NTS map sheets 33B12 and 33C09, approximately 200 km east of the Cree community of Wemindji, 330 km northwest of the town of Chibougamau and 800 km north of Montreal in the Eeyou Istchee James Bay Region of Quebec. The centre of the property is located at approximately 75.98 degrees longitude west and 52.58 degrees latitude north. It is located in the immediate vicinity of the Éléonore gold mine and mill now owned by Dhilmar Ltd.
The Committee Bay Project, 100% held by Fury, is a resource stage project comprising 156 claims and 57 crown leases, totaling 254,623.05 hectares (ha). located in 1:250,000 scale NTS map sheets 56J, 56K, 59O and 56P, approximately 430 km northwest of the town of Rankin Inlet in Canada’s north The approximate centre of the Project is located at Universal Transverse Mercator (UTM) co-ordinates 7,400,000m N and 570,000m E (NAD 83, Zone 15N).
Eau Claire Property
The Eau Claire Project is located in the Eeyou Istchee James Bay Territory of Northern Quebec, approximately 320 km northwest of the town of Chibougamau and 800 km north of Montreal.
Its approximate center is located at Universal Transverse Mercator (UTM) coordinates 5,786,800 m N and 453,000 m E (NAD 83, Zone 18N). The approximate UTM coordinates for the centre of the currently defined Eau Claire deposit are 5,785,100 m N and 444,600 m E. The Project is located within National Topographic System (NTS) 1:50,000 scale map-areas; 33B04 and 33B05.
Land Tenure
As of December 31, 2025, the Project consisted of 446 map-designated Quebec mineral claims covering 23,284.5 ha, 100% owned by Eastmain Resources Inc., a wholly owned subsidiary. The claims are in good standing as of the date of this AIF. The boundaries of the claims have not been legally surveyed. The mineral rights exclude surface rights, which belong to the Quebec government.
The Eau Claire Project is located north of the 52nd parallel (52ºN) and as such is subject to the provisions of the James Bay and Northern Quebec Agreement (1975), and the Paix des Braves Agreement (2002). The Eau Claire Project falls within the Eeyou Istchee Territory of the Eastmain Cree First Nation, including trap line VC36 held by Dr. Ted Moses as the Cree Tallyman. The Eau Claire project is located on Category III lands, as established under the James Bay and Northern Quebec Agreement.
The figure below presents property location and claims comprising the Eau Claire Deposit:
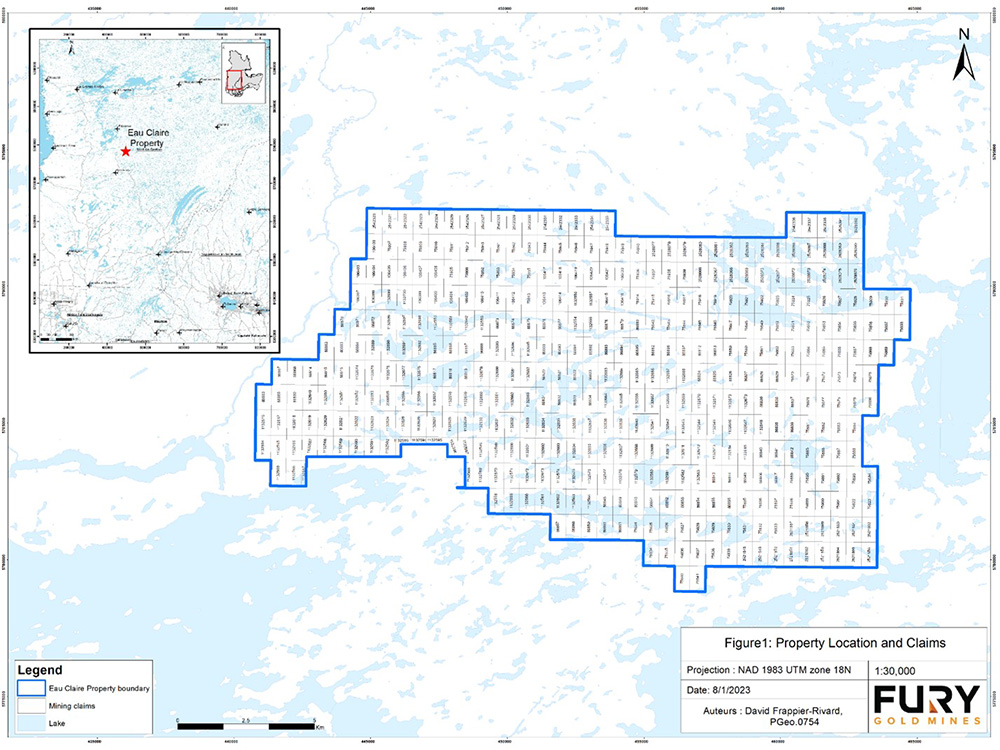
Graphic 2: Eau Claire Project Location Map and Claims
Local Resources and Infrastructure
Fury, through its Eastmain subsidiary, maintains a forty-person camp to support exploration activities at the Eau Claire project. The closest infrastructure to the Eau Claire deposit includes a number of hydroelectric complexes and associated infrastructure, including the EM-1 hydroelectric complex. The EM-1 complex is located within 15 km of the Eau Claire gold deposit. Hydro Québec has established a 600-person camp at EM-1 that includes fuel and medical services. More major necessities such as skilled labour and specialized equipment are sourced from Val-d’Or or Chibougamau. Many services are now available through numerous Cree owned businesses and partnerships in Mistissini, Eastmain and Nemaska.
Accessibility and Climate, Physiography
The Project is located 350 km north of the town of Chibougamau and borders the northern shore of the EM-1 Hydro Quebec reservoir in the James Bay region (NTS Map sheet 33B04 and 33B05). The exploration camp is located 2.5 km east of the Eau Claire deposit at 52.22 degrees north and 75.79 degrees west. A Property location map is illustrated in Figure 5-1 below.
The property is accessible, year-round, by the Route du Nord and is located 100 km north of Nemaska, serviced by commercial flights twice per week. The Route du Nord from the town of Chibougamau is a 350 km all-season gravel road extending from the town of Chibougamau to the Cree village of Nemaska (and onto Hydro Québec's installation at EM-1). Beyond EM-1, road access to the project involves crossing the Eastmain Reservoir and the EM-1 spillway via an all-season road installed by Hydro Québec.
The climate is typical of northern Quebec and is characterized by temperate to subarctic conditions. The average summer temperatures vary from 10 to 25 degrees Celsius during the day and 5 to 15 degrees Celsius at night (June to September). Winter temperatures range from -35 to -10 degrees Celsius. Winter season can start in late October and can continue until May. Precipitation varies during the year reaching an average of 2 metres annually and is characterized by snow cover in the winter months and moderate rainfall in the summer months. Exploration activities can be carried out year-round.
History
The following is taken from Armitage and Hafez (2017) and describes work completed in the general vicinity of the Project prior to 2017. Work completed after 2017 is summarized from previously submitted assessment reports.
Pre 2002 Exploration
Exploration on the Project dates back to the early 1970s when SEREM Quebec Inc. (SEREM) and Société de Développement de la Baie-James (SDBJ) completed airborne electromagnetic surveys and limited core drilling in search for volcanogenic massive base metal sulphide deposits (Chartier and Ravenelle, 2015).
In 1984, Westmin and Eastmain initiated a comprehensive gold and base metal exploration program that covered the former Eastmain Greenstone Belt. From 1984 through 1989, Westmin and Eastmain completed a multi-staged exploration program which included airborne geophysical surveys, line cutting, geochemical rock and soil surveys, ground geophysical surveys, prospecting, geological mapping, and core drilling.
A property-wide airborne electromagnetic and magnetic survey contracted by Westmin formed the basis of a comprehensive exploration program that led to the discovery of the Eau Claire gold deposit in 1987. The joint venture conducted a systematic soil sampling program over all known electromagnetic anomalies on the property. Flagged and cut grids were completed on isolated electromagnetic anomalies along with prospecting, geological mapping, and rock sampling. A large gold-in-soil geochemical anomaly was detected in the south-western portion of the property proximal to the outcropping gold-bearing quartz- tourmaline vein, currently identified as the B Vein in the 450 West zone.
Sampling and mapping were conducted on local area cut grids focusing on short strike-length airborne geophysical conductors. Westmin collected 1,036 rock samples that were assayed for gold only. The rock sample data ranges from less than 5 parts per billion to 22.2 g/t Au.
Soil surveys were completed over small, localized grids using a grub hoe to sample the soil’s B-horizon. Samples were assayed for gold only.
Westmin completed a total of 54 core boreholes (5,922 metres) from 1987 to 1989, which resulted in the discovery of several gold-bearing quartz-tourmaline veins. The presence of these veins (including veins currently known as VEIN B, C, D, F and G) demonstrated continuity in three dimensions within the upper portion of the Eau Claire gold deposit.
The property was dormant from 1990 to 1995.
From 1996 through 2001, SOQUEM managed the exploration activities on the Clearwater property, which included ground geophysical surveys, line cutting, prospecting, geological mapping, trenching and core drilling. A comprehensive soil sampling program covered the entire property on a 100 by 500 metre grid. In 1996, SOQUEM commissioned Sigma Geophysics Inc. (Sigma) to complete ground magnetic and induced polarization (IP) surveys over four grid areas. The surveys were completed over the Rosemary, Eau Claire, Aupapiskach, and Natel areas. In total, Sigma completed 168.5 line km of ground magnetic survey and 130.9 line km of IP surveys. The magnetic data were collected on 100 metre line and 12.5 metre station spacing using an EDA Omniplus instrument. Magnetic, resistivity, and chargeability data were presented on 1:5,000 scale map sheets for each grid area. The Eau Claire Deposit was not detected from the geophysical surveys.
Between 1996 and 2001, SOQUEM collected 556 rock samples for analysis. The principal area of interest defined by the SOQUEM rock sampling was the surface expression of the 450 West Zone. SOQUEM also found gold-bearing quartz-tourmaline veins 2 km east of Eau Claire at the Snake Lake prospect.
In 1999, a backhoe was brought to the property to expedite surface trenching. Extensive surface trenching in 1999 exposed multiple high-grade, quartz-tourmaline veins (currently known as VEIN P, JQ, R, and S) at the 450 West zone. Surface stripping demonstrated lateral continuity of these veins for up to 200 metres and variable thicknesses, from less than 0.5 metres to 3.2 metres. Systematic channel sampling across these veins at 5 to 10 metre intervals yielded gold intercepts ranging from less than 1.0 to 406.5 g/t Au. SOQUEM completed 95 core boreholes (19,639 metres) on the property between 1996 and 2001.
2002 – 2019 Eastmain Resources Exploration
On October 9, 2020, Fury acquired all the issued and outstanding shares of Eastmain Resources Inc. which was a publicly traded company at the time. Eastmain had completed campaign style ground exploration programs from 2002 through to 2013. Little groundwork aside from drilling was completed post 2013. The groundwork completed by Eastmain included outcrop and trench mapping, soil sampling, ground and airborne geophysical surveying and trenching.
Soil sampling across the Project identified a number of anomalous targets. Several of these targets; Rosemary, Spider, Boomerang, Snake Lake and Clovis are located along the Cannard Deformation Zone within the Eau Claire deposit trend. On the eastern side of the property the Natel, Knight and Serendipity prospects were identified early on. The Percival prospect was not identified until 2018 through prospecting. Percival does not have a gold in soil anomaly associated with the near surface gold mineralization from the historical Eastmain work.
Airborne geophysical surveys were completed in 2005 (VTEM and magnetics with 100 m line spacing), 2012 (Magnetics with 25 – 50 m line spacing) across the entire property. A VTEM and magnetics grid targeting the Knight – Serendipity trend which includes Percival was completed in 2019. The airborne geophysical data was utilized to refine the structural and geologic models for the entire property.
In 2012 an airborne light detection and ranging (LiDAR) and aerial photography survey was flown over the entire Project. Digital elevation models and high resolution orthophoto imagery was provided. The LiDAR survey identified several new structural and stratigraphic features while also providing confirmation of the structural interpretations based off of the airborne geophysical data.
The combined LiDAR and magnetics interpretation showed the main stratigraphic units within the Project area are controlled by east-west oriented D2 structures.
From 2002 to 2019 Eastmain completed a substantial amount of exploration and resource delineation drilling on the Eau Claire Project. In total, Eastmain completed 877 drill holes for 302,610.5 metres during this period.
2023
In 2023 Fury and SGS restated the Mineral Resource Estimate, for the portion of the deposit considered in the previous 2018 MRE and PEA, reporting approximately 0.9 Mt of Measured Mineral Resources grading 6.63 g/t Au containing 193,000 ounces gold, Indicated Mineral Resources of 3.39 Mt grading 6.06 g/t Au containing 660,000 ounces gold and 2.38 Mt of inferred Mineral Resources at an average grade of 6.53 g/t Au containing 500,000 ounces gold.
2024
In 2024, Fury released its Mineral Resource Estimate update for the Eau Claire Project and in 2025 the PEA.
Geology and Mineralization
The Eau Claire project is contained within the La Grande volcano-plutonic Sub-province (2,752 to 2,696 Ma) of the Superior Province approximately 30 km south of the contact with the metasedimentary Opinaca Subprovince (2700 to 2648 Ma). Portions of the La Grande Subprovince were formerly referred to as the Eastmain Greenstone Belt. Depending on the literature, the Eastmain Greenstone Belt has retained its title as a distinct greenstone belt lying within the La Grande Subprovince.
The La Grande Subprovince consists of four volcanic cycles erupted between 2,752 and 2,705 Ma (Kauputauch, Natel, Anatacau-Pivert, and Komo-Kasak formations). The supracrustal rocks of the region are intruded by syn-volcanic (2747 to 2710 Ma) and post or late-tectonic (2,697 to 2,618 Ma) tonalitetrondhjemite- granodiorite (TTG) suites.
The Eastmain Greenstone Belt consists of a 5 to 10 km wide by 150 km long succession of Archean bimodal volcanic rocks. The volcanic sequence includes lowermost mafic volcanic rocks overlain by felsic pyroclastic to volcaniclastic rocks, intercalated facies of iron formation, shaly and graphitic sedimentary units.
The Eau Claire deposit straddles the contact on the south limb of an anticline between lowermost felsic volcaniclastic rocks overlain by mafic volcanic flows. Gold-bearing quartz-tourmaline veins from the Eau Claire deposit crosscut the volcanic/sedimentary rock contact and in turn are crosscut by late northeast trending mafic dikes. The contact between volcanic and sedimentary rocks is a marker horizon that forms a broad open fold along the north limb and a tight fold closure immediately west of the deposit, as well as an east-west trending south limb that has been traced for several kilometres. Iron formation occurs along the southern limb of the antiform east of Eau Claire and is locally isoclinally folded.
Gold mineralization at the Eau Claire gold deposit is generally located within approximately EW trending structurally controlled, high-grade en-echelon quartz-tourmaline veins and adjacent altered wall rocks, as well as variable width ESE trending sheared and foliated alteration zones. The alteration zones are parallel to the overall foliation and are thus believed to represent an altered stratigraphic unit. The vein systems are predominantly hosted within a thick sequence of massive and locally pillowed mafic volcanic flows, interbedded with narrow intervals of volcaniclastic meta-sedimentary rocks. Both gold bearing vein sets may occur with as narrow intervals with tourmaline and develop into thick quartz-tourmaline veins with zoned tourmaline+/-actinolite+/-biotite+/-carbonate alteration halos which can measure up to several metres in thickness.
The Eau Claire deposit is a structurally controlled gold deposit. Mineralization occurs primarily in a series of sheeted en-echelon quartz-tourmaline veins and associated metre scale alteration zones. Carbonate within the veins is associated with gold mineralization. The overall trend of the mineralized veins is controlled by a structural corridor sub-parallel to the D2 Cannard Deformation Zone. Individual veins are up to 1 metre thick and extent for at least 100 metres along strike.
Veins are composed of quartz and tourmaline; the ratio between quartz with accessory calcite to tourmaline can vary from 100 percent quartz to 100 percent tourmaline. The quartz-tourmaline veins are massive, banded and/or brecciated. Pyrite, pyrrhotite, chalcopyrite and rare molybdenite generally constitute less than 1.5 percent of the composition of these veins but can be upwards of 20% locally. Commonly, brecciated veins contain angular blocks of tourmaline, ranging in size from less than one to more than 25 centimetres in size. Fragments are cemented by a quartz-carbonate matrix. Breccia textures locally form a “piano key” pattern with angular tourmaline blocks aligned perpendicular to the vein walls. This texture is due to protracted deformation that affected already formed veins and generated new veins (tension gash veins developed on pre-existing laminated veins). The piano-key breccia has been observed throughout the deposit at all scales in tourmaline veins of less than 1 centimetre to more than 1 metre thick. A “ladder vein” texture has also been observed in outcrop at the 450 West Zone consisting of massive tourmaline layers with quartz-carbonate “ladders” aligned perpendicular to the vein walls.
Gold occurs as isolated grains or as clusters of fine-grained particles. Irregular to sub-angular shaped gold grains range in size from less than 10 micrometres to 1 millimetre. In rare instances, grains up to 1 centimetre in size have been observed. Locally, veins contain micrometre-size clusters of visible gold particles. Tellurobismuthite (Bi2Te3) occurs throughout the deposit. Gold and tellurides occur within micro fractures in quartz, interstitial to granular tourmaline grains, at the contact between massive aphanitic tourmaline and quartz bands, and along tourmaline laminations.
Gold mineralization also occurs within altered host rock without veining, occurring as centimetre to several metre wide tourmaline-actinolite ± biotite ± calcite replacement zones around vein selvages. The two major vein areas discovered to date in the resource area (the 450 West and 850 West zones) forma crescent-shaped mineralized, surface projected footprint 1.8 km long by more than 100 metres wide, which has been traced to date to a vertical depth of 900 metres. Veins within the 450 West zone typically strike 85 degrees and dip 50 to 65 degrees to the south. Veins within the 850 West zone typically strike 60 degrees and dip subvertically.
Exploration
From 2020 to 2023, Fury Gold has completed systematic exploration programs with the goals of advancing known prospects through to the drill stage and identifying new prospects. The Company deployed biogeochemical sampling techniques to image the Percival mineralization, completed ground geophysical surveys at the Eau Claire Deposit Trend and along the Percival trend. Additionally, Fury compiled all historic exploration data into a single accessible database, reprocessed and reinterpreted the historical property scale geophysics data. The work completed by Fury to date has resulted in a refined targeting process and identification of areas and targets overlooked by previous explorers. The Company to continue its exploration with the testing of regional targets like Percival, Serendipity and Agua Clara and with a view to seeking to expand the Eau Claire deposit area with the 2020-2023 drilling at the Hinge.
Historical Drilling
Drilling throughout the Eau Claire Project has taken place intermittently from 1972 through 2023. A total of 406,376.8 metres of drilling has been completed in 1,204 diamond drill holes across the entire Project area.
2002 – 2013 Drilling
Between 2002 and 2013 Eastmain completed 177,713 metres of diamond core drilling in 534 drill holes. The drilling was completed within an area measuring approximately 2,200 metres east-west and 900 metres north-south has. The drilling pattern was designed to intersect the gold-tellurium mineralization. The majority of boreholes were drilled with a dip between 45 and 60 degrees, and an azimuth of 355 degrees. The 2007 and 2009 drill campaign focussed on tightly spaced, 12.5 metre infill drilling at the 450 West Zone. 2010 drilling successfully confirmed the lateral continuity of the 850 West Zone underneath surface quartztourmaline veining identified in surface trenching. Regional drilling at Boomerang and Snake Lake was also completed in 2010. Broad zones of 1 g/t Au were intersected from the 2010 regional program. Drilling in 2011 through to 2013 focused on the 450 West Zone and proximal strike extensions.
2015 Drilling
Eastmain completed 29 drill holes (ER15-553 to -581) totaling 12,898 metres at Eau Claire in 2015. The drilling was focused on expanding Measured & Indicated Open Pit and Ramp Accessible Underground gold resources, within the upper portion (top third) of the Eau Claire Deposit. Assay data from holes 553 to 573 confirms 45 gold-bearing intercepts ranging from 0.50 to 25.6 grams gold per tonne (g/t) over widths ranging from 2.0 to 11.5 metres (see Eastmain news release dated December 22, 2015 posted on SEDAR). Nineteen assay intervals exceeded cut-off grade for underground resources (2.5 g/t Au) at Eau Claire, with an average grade of 8.78 grams gold per tonne over an average width of 2.78 metres. 2015 drilling confirmed the continuation of gold mineralization laterally to the east Measured and Indicated gold resources identified in the SRK Report at Eau Claire. Several half-metre-wide high-grade vein intersections from ten of the drill holes reported herein contain very-fine-grade visible gold and range in grade from 24.5 to 98.8 g/t. Infill core sampling of previous drill holes was also completed. Infill sampling confirmed a high-grade interval from hole ER08-131, which assayed 6.65 g/t Au over 5.0 metres, from within the JQ Vein at a depth of 66.0 metres. When combined with assay results from the adjacent P Vein, the intersection provides a composite interval grading 6.75 g/t Au across 13.8 metres, lying within the 450 West Zone. A total of 1,438 infill core samples were taken during the 2015 exploration program. Infill sampling of near-surface intervals within potential open-pit areas may contribute to current mineral resources.
2016 – 2017 Drilling
The 2016 through 2017 drilling program was designed to improve upon the resource classification of the 2015 SRK Mineral Resource Estimation as well as testing the Snake Lake prospect to the east of the Eau Claire deposit. A total of 90,448.9 m was drilled in 236 drill holes. Of the total 2016-2017 drilling, 82,180 m in 206 drill holes targeted the Eau Claire deposit, the remaining 30 holes tested the Snake Lake prospect.
2018 – 2019 Drilling
The 2018 and 2019 drilling programs were mostly focus on the newly discovered Percival Prospect. A total of 16,468.6 m was drilled in 53 drill holes. Of the total 2018-2019 drilling, 13,182.6 m in 47 drill holes targeted the Percival Prospect. The remaining drilling were collared in the Serendipity area (3 DDH) and the Eau Claire deposit (3 DDH). The best results were from Hole ER18-822, ER18-823 ER19-832 returned broad intercepts of respectively 78.5 m of 1.456 g/t Au, including 8.2 m of 4.45 g/t Au, 87.0 m of 2.35 g/t Au, including 31.5 m of 3.13 g/t Au and 52.75 m of 1.8 g/t Au, including 22.0 m of 3.21 g/t Au. ER18-829 with 34.1 m of 2.05 g/t Au, including 4.5 m of 11.95 g/t Au, ER19-839 with 12.0 m of 3.04 g/t Au, including 7.0 m of 4.66 g/t Au, ER19-845 with 7.0 m of 3.13 g/t Au, including 2.0 m of 8.47 g/t Au, ER19-852 with 22.85 m of 1.18 g/t Au, including 14.85 m of 2.05 g/t Au.
2020 – 2023 Drilling (Fury Gold Mines)
From 2020 through to 2023, Fury completed a total of 110 diamond drill holes for approximately 71,774.3 m on the Project. Table 10-4 summarizes the drill holes completed by Fury. The drill program consisted of i) an extension phase focused on extensions to the known vein corridors along strike from the previous resource (“Extension Program”); ii) an exploration phase designed to test targets along the 4.5 km long deposit trend (“Exploration Program”) and iii) an exploration phase of drilling designed to test targets at the Percival prospect 14 km east of the Eau Claire Deposit. Large step out drilling in 2022 increased the mineralized footprint of the Eau Claire deposit by over 450 m to the west. At Percival Fury drilling returned intersections up to 13.5 metres at 8.05 g/t gold and outlined a 500x100x300 m zone of gold mineralization. The 2020 through 2023 drilling has expanded the footprint of the Eau Claire mineralization and drilling was completed outside of the previous Eau Claire resource area. This new extension drilling by Fury, still in progress in 2023, was excluded from the August 30, 2023, MRE and has now been included in the current Mineral Resource Estimate.
The 2023 drilling campaign focused on the Hinge Target, which is located west of the deposit, adjacent to the 850 W zone, and the Percival prospect area. Results from the 2023 Hinge drilling expanded the Hinge Target gold mineralization 50 m up-dip and 75 m to the west respectively, over 450 m from the defined Eau Claire Resource as well as intercepting high grade shallow mineralization on the eastern edge of the Hinge target.
Extension Drilling
The Extension Program at the Eau Claire deposit is designed to target strike extensions of the known vein corridors to the west and southeast of the current mineral resource. To date, Fury Gold has drilled twenty one holes targeting the southeast extension of the Eau Claire Resource with intercepts including: 23.27 g/t Au over 7.09 m, 11.56 g/t Au over 6.04 m, 59.3 g/t Au over 0.96 m and 4.89 g/t Au over 2.94 m. Results from the four holes completed in the second quarter of 2022 were released on August 3, 2022 including 4.43 g/t Au over 1.43 m and 4.60 g/t Au over 1.25 m. Two additional holes were completed in October 2022 with results released on January 23, 2023 including 3.91 g/t Au over 2.50 m. The exploration drilling program along the Eau Claire deposit trend continues to demonstrate the potential to significantly expand the Eau Claire deposit to the west. The focus has been on the Western Hinge, and Gap Zone as well as along the north limb of the anticline. All exploration targets within the Deposit Trend have the potential to significantly expand the Eau Claire mineralized footprint. To date the footprint of gold mineralization has been increased by over 455 m or 25% at the Hinge Target alone and remains open to further expansion to the West The Company completed 11,497.8 m in 18 diamond drill holes in 2022 and 2023 at Percival.
Percival Drilling
Five holes targeted the parallel hinge 500 m to the east of Percival proper. All holes intercepted silicified sulphide rich breccias, however only narrow low grade gold values were returned. The remainder of the drilling tested extensions of the historical gold mineralization at Percival proper. The results from the Percival proper drilling program confirm that the high-grade core of the Percival mineralization plunges steeply to the west and remains open in all directions. Highlights included an 85 m step out from historical high-grade mineralization which intercepted 13.5 m of 8.05 g/t Au, (including 3.00 m of 25.8 g/t Au) in drill hole 22KP- 008 and a 150 m step out which intercepted 7.5 m of 4.38 g/t Au, (including 3 m of 8.7 g/t Au, and 3 m of 5.5 g/t Au) in drill hole 22KP-005 (Table 10-6). As well as 279 g/t Au over 1.5 m along the eastern edge of the defined mineralization. With the recent drilling the gold mineralization at Percival Main is represented by a 500 m by 100 m footprint with high-grade gold being defined to 300 m below surface hosted within folded sulphidized, silicified, and brecciated sediments.
Historical QA/QC Sample Preparation, Analyses and Security
Since initiating exploration on the Eau Claire Property in 2020, Fury has maintained a comprehensive and consistent system for the sample preparation, analysis, and security of all surface samples and drill core samples, including the implementation of an extensive QA/QC program. The current MRE includes drilling data collected by Fury and previous explorers.
The following describes sample preparation, analyses and security protocols implemented by Fury and previous explorers with analytical labs and analysis methods for gold
Aspects of sample preparation, analyses and security for the work completed during the 1972 to 2014 programs is summarized from the technical report on the Property by Chartier and Ravenelle (2015) and for the 2015 to 2017 programs from Armitage and Hafez (2017).
Since the beginning of drilling by Fury in 2020 samples have dominantly been shipped to ALS in either Val d’Or or Montreal, Quebec for preparation and sample pulps analyzed at ALS Val d’Or, Quebec or North Vancouver, British Columbia. The ALS Val d’Or, Montreal, and North Vancouver facilities are ISO 9001 and ISO/IEC 17025 certified.
Samples are dried, weighed, crushed to at least 70% passing 2mm, and a 1000 g split is pulverized to at least 85% passing 75 μm (ALS Method Code PREP-31B). Gold is assayed by 50- gram fire assay with an AAS finish (ALS Method Code Au-AA24). During 2020 and 2021, samples with greater than 5 ppm gold were re-analysed by 50-gram fire assay with a gravimetric finish (ALS Method Code Au-GRA22). Since 2022, the Au-AA24 overlimit threshold for Au-GRA22 analysis was increased to 10 ppm gold. A multi-element geochemical suite is obtained using a four-acid digest with an ICP-MS analysis (ALS Method Code ME-MS61). Approximately 25% of the samples collected during this period have been sent to either Activation Laboratories (“ACT”) in Val d’Or, Quebec and Thunder Bay, Ontario or to Bureau Veritas (“BV”) in Timmons, Ontario and Vancouver, British Columbia where the preparation and analysis methods used have been replicated as closely as possible. Control samples comprising certified reference samples, blanks, and duplicate samples were systematically inserted into the sample stream and analyzed as part of the Company’s QA/QC protocol. Check assaying of selected sample rejects and pulps has been completed at both ALS and ACT as umpire laboratories. ALS, ACT, and BV laboratories are independent of Fury and the Authors.
Sampling QA/QC programs are set in place to ensure the reliability and trustworthiness of exploration data. They include written field procedures and independent verifications of drilling, surveying, sampling, assaying, data management, and database integrity. Appropriate documentation of quality control measures and regular analysis of quality-control data are essential for the project data and form the basis for the quality-assurance program implemented during exploration.
Analytical quality control measures typically involve internal and external laboratory control measures implemented to monitor sampling, preparation, and assaying precision and accuracy. They are also essential to prevent sample mix-up and monitor the voluntary or inadvertent contamination of samples. Sampling QA/QC protocols typically involve regular duplicate and replicate assays as well as the insertion of blanks and standards (certified reference materials - “CRMs”). Routine monitoring of quality control samples is undertaken to ensure that the analytical process remains in control and confirms the accuracy and precision of laboratory analyses. In addition to laboratory internal quality control protocols, sample batches should be evaluated for evidence of suspected cross-sample contamination, certified reference material performance evaluated relative to established warning and failure limits to ensure the analytical process remains in control while maintaining an acceptable level of accuracy and precision, duplicate and replicate assay performance evaluated, and any concerns communicated to the laboratory in a timely fashion. Check assaying is typically performed as an additional reliability test of assaying results. These checks involve re-assaying a set number of coarse rejects and pulps at a second umpire laboratory.
Fury Sampling, Analysis, Data Management and QA/QC
Fury Gold has adopted the historical Analytical Quality Assurance Program at Eau Claire to control and assure the analytical quality of assays. This protocol includes the systematic addition of blank samples and certified standards to each batch of samples sent for analysis at commercial laboratories. Blank samples are used to check for possible contamination in laboratories, while certified standards determine the analytical accuracy and precision of the laboratory procedure. Generally, check sample inserts approximately 10% of sample flow from project sites.
For the exploration conducted by Fury from 2020 to 2023, all drilling assay samples were collected by Fury personnel. Once verified, samples were kept in the exploration camp.
Split core samples were placed in fibre rice bags in batches and labelled for shipment to ALS, ACT, or BV laboratories. These sacks were sealed with cable ties and fibre tape and shipped by commercial transport companies directly to the lab. A control file, the laboratory sample dispatch form, includes the sample-bag numbers in each shipment. The laboratory sample dispatch form accompanies the sample shipment and is used to control and monitor the shipment. The lab sends a confirmation email with detail of samples received upon delivery.
Assay samples were collected by appropriately qualified staff at the laboratories. Sample security involved two aspects: maintaining the chain of custody of samples to prevent inadvertent contamination or mixing of samples and rendering active tampering as difficult as possible.
At ALS samples are dried, weighed, crushed to at least 70% passing 2mm, and a 1000 g split is pulverized to at least 85% passing 75 μm (ALS Method Code PREP-31B). Gold is assayed by 50-gram fire assay with an AAS finish (ALS Method Code Au-AA24). During 2020 and 2021, samples with greater than 5 ppm gold were re-analysed by 50-gram fire assay with a gravimetric finish (ALS Method Code Au-GRA22). Since 2022, the Au-AA24 overlimit threshold for Au-GRA22 analysis was increased to 10 ppm gold. A multielement geochemical suite is obtained using a four-acid digest with an ICP-MS analysis (ALS Method CodeME-MS61).
Approximately 25% of the samples collected during this period have been sent to either Activation Laboratories (“ACT”) in Val d’Or, Quebec and Thunder Bay, Ontario or to Bureau Veritas (“BV”) in Timmons, Ontario and Vancouver, British Columbia where the preparation and analysis methods used have been replicated as closely as possible. The ACT Val d’Or and Thunder Bay, and BV Timmons and Vancouver facilities are ISO/IEC 17025 certified.
At ACT samples are dried, weighed, crushed to at least 80% passing 2mm, and a 1000 g split is pulverized to at least 95% passing 105 μm (ACT Method Code RX1+1000). Gold is assayed by 50-gram fire assay with an AAS finish (ACT Method Code 1A2B-50). Samples with greater than 5 ppm gold are re-analysed by 50-gram fire assay with a gravimetric finish (ACT Method Code 1A3-50). A multi-element geochemical suite is obtained using a four-acid digest with an ICP-OES analysis (ACT Method Code 1F2-Tbay).
At BV samples are dried, weighed, crushed to at least 70% passing 2mm, and a 1000 g split is pulverized to at least 85% passing 75 μm (BV Method Code PRP90-1KG). Gold is assayed by 50-gram fire assay with an AAS finish (BV Method Code FA450). Samples with greater than 5 ppm gold are re-analysed by 50-gram fire assay with a gravimetric finish (BV Method Code FA550). A multi-element geochemical suite is obtained using a four-acid digest with an ICP-MS analysis (BV Method Code MA200).
Data are verified and double-checked by senior geologists on site for data entry verification, error analysis, and adherence to strict analytical quality control protocols. Data is logged directly into the cloud-hosted MX Deposit logging software produced by Minalytix Inc. with point-of-entry data validation controls.
The QA/QC program comprises the systematic insertion of standards or CRMs, blanks, as well as field, coarse reject, and pulp duplicates. QC samples have been inserted into the sample sequence at a frequency of approximately 1 sample per 25 samples for CRMs and blanks, 1 sample per 50 samples for field duplicate samples, 1 sample per 75 samples for coarse reject duplicates, and 1 sample per 25 samples for pulp duplicates. Approximately 15.1% of samples assayed have been QC samples in the drilling programs from 2020 to 2023. All QC samples listed were analyzed by the primary analytical lab (ALS). Check sampling of selected rejects and pulps has also been completed at both ALS and ACT laboratories in 2022 and 2023.
Mineral Processing and Metallurgical Testing
Metallurgical test programs conducted on the Clearwater Gold Project have demonstrated that the ore is amenable to a gravity plus cyanidation (CIL) processing strategy, achieving consistently high gold recoveries and confirming the robustness of the selected flowsheet. The most recent comprehensive testwork, led by SGS Minerals Services in 2017 and supported by earlier programs in 2010 (SGS) and 2016 (ASL), confirms that gravity concentration followed by cyanidation is preferred over flotation, particularly for representative run-of-mine materials.
The 2017 SGS study, based on a master composite of ore and hanging wall–footwall dilution, provided recovery estimates that are more aligned with actual operational expectations. Overall gold recoveries of 96%–98% were achieved under optimized cyanidation conditions, with rapid leaching kinetics (within 8 to 24 hours), moderate reagent consumption 1.25 kg/t NaCN, and minimal preg-robbing risk. Gravity recovery tests showed a GRG value of 39%, with bulk gravity separation recovering 24% of the gold, underscoring the importance of including a gravity circuit as a primary step in the flowsheet.
Comminution testing yielded a Bond Ball Mill Work Index (BWI) of 11.2 kWh/t, classifying the ore as moderately soft and suitable for conventional grinding circuits with low energy requirements. Environmental assessments confirmed that the tailings are potentially non-acid-generating (NP/AP = 3.4), with strong alkaline buffering, low metal mobility, and negligible leaching risks. These findings support the potential safe re-use of tailings as paste backfill under both neutral and acidic conditions, complying with Canadian and international environmental standards.
Metallurgical Testing:
The findings from the metallurgical tests highlight the following key recommendations:
|
• |
Gravity Separation: Implementing this method in the primary circuit would recover approximately 24% of coarse gold. |
|
• |
Cyanidation of Gravity Tailings: This approach provides a superior overall recovery rate of about 96%, outperforming flotation. |
|
• |
Further Testwork: Additional investigations are required to optimize leaching parameters, examine preg-robbing behavior, and evaluate variability based on ore zones, lithology, and grade. |
These recommendations aim to enhance recovery efficiency and overall process effectiveness.
Environmental:
Tailings from the cyanidation test were subjected to acid-base accounting. The modified acid base accounting (ABA) results shows a paste pH of 9.21, NP/AP ratio of 3.4, and high neutralization capacity, indicating strong buffering against acid generation. The Net Acid generation (NAG) testing confirms this classification, with a final pH of 10.7 and zero sulfuric acid consumption. The tailings are therefore categorized as Non-Acid Forming (NAF). Therefore, the metal concentrations are within acceptable environmental criteria for paste-fill reuse (based on Canadian and EU standards).
TCLP 1311 results confirm the tailings are non-hazardous, with Pb of 0.445 mg/L and other elements well below EPA thresholds.
Shake Flask Extraction (SFE) also shows negligible leaching in neutral conditions, i.e.,
|
• |
Confirms intrinsic metal immobility |
|
• |
<0.01 mg/L for all hazardous elements |
|
• |
Mimics underground neutral pH environments |
Implying, there is no leaching risk in paste backfill stopes or mine water recirculation.
2024 Mineral Resource Estimate
The report on which the 2025 PEA relies for a mineral resource estimate for eau Claire is titled “Mineral Resource Estimate Update for the Eau Claire Project, Eeyou Istchee James Bay Region of Quebec, Canada” dated June 25, 2024, with an effective date of May 10, 2024. It supports the disclosure made by Fury in its news release titled “Fury Updates Mineral Resources at Eau Claire, Increasing Measured and Indicated Gold Ounces By 36%, And Inferred Gold Ounces by 45%”. The May 2024 Mineral Resource Estimate was prepared by Maxime Dupéré, P. Geo. And essentially incorporated into the 2025 PEA which Mr Dupéré is a co-author of.
The MREs for the Project include MREs for the Eau Claire and Percival deposits. The Eau Claire project contains a combined Mineral Resource of 1,160,000 oz of Au at a grade of 5.65 g/t in the Measured and Indicated category, and an additional 723,000 oz of Au at a grade of 4.13 g/t Au in the Inferred Category
The following section describes the MREs for Eau Claire and Percival. Completion of the MREs involved the assessment of a validated drill hole and channel sample database, which included all data for surface drilling and surface and channel sampling completed through the end of 2023. Completion of the MREs also included the assessment of updated three-dimensional (3D) mineral resource models (mineral resource domains), 3D topographic surface models and 3D overburden surface models.
The Inverse Distance Cubed (“ID3”) and Inverse Distance Squared (“ID2”) calculation methods restricted to the mineral resource domains were used to interpolate grades for Au (g/t) into block models for all deposit areas. Measured, Indicated, and Inferred mineral resources are reported in the summary tables in Section 14.11. The MREs presented below takes into consideration that the deposits may be mined by either open pit or underground mining methods.
The reporting of the MREs complies with all disclosure requirements for Mineral Resources set out in the NI 43-101 Standards of Disclosure for Mineral Projects (2016). The classification of the MREs is consistent with the 2014 Canadian Institute of Mining, Metallurgy and Petroleum (CIM) Definition Standards (2014 CIM Definitions) and adheres to the 2019 CIM Estimation of Mineral Resources & Mineral Reserves Best Practice Guidelines (2019 CIM Guidelines).
Drill Hole Database
To complete the current MREs for the Project, a database comprising a series of comma delimited spreadsheets containing surface diamond drill hole information was provided by Fury. The database included hole location information, down-hole survey data, assay data, lithology data and density data. After review of the database, the validated data was then imported into GEOVIA GEMS version 6.8.3 software (“GEMS”) for statistical analysis, block modeling and resource estimation. No errors were identified when importing the data. The data was validated in GEMS and no erroneous data, data overlaps or duplication of data was identified.
The database provided by Fury and used for the MREs included data for 1,202 surface diamond drill holes totaling 406,431 m, and 426 surface channels (Eau Claire deposit) for 1,345 m (Table 14-1, Figure 14-2 to Figure 14-5. The resource database totals 273,402 drill hole assay intervals representing 267,721 m of data and 2,254 channel assays for 1,316 m. The average assay sample length from drilling is 0.98 m, and from channel sampling is 0.58 m.
Total Drill Hole and Channel Sample Database for the Eau Claire Project
|
Eau Claire Project Drill Hole Database |
|
|
Coordinate System |
NAD83 UTM Zone 18 |
|
Total Number of drill holes (diamond) |
1,202 |
|
Total metres of drilling |
406,431 m |
|
Total number of drill assay samples |
273,402 |
|
Total drill assay sample length |
267,721 m |
|
Average drill assay sample length |
0.98 m |
|
Total Number of channels (Eau Claire) |
426 |
|
Total metres of channels |
1,345 m |
|
Total number of channel assay samples |
2,254 |
|
Total channel assay sample length |
1,316 m |
|
Average channel sample length |
0.58 m |
|
Total number of SG Samples |
649 |
Table 1: Eau Claire Project Drill Hole Database
Combined Mineral Resource Estimate for the Eau Claire Project, May 10, 2024
|
Category |
Tonnes |
(g/t Au) |
Contained Au (oz) |
|
Measured |
1,612,000 |
5.67 |
294,000 |
|
Indicated |
4,781,000 |
5.64 |
866,000 |
|
Total Measured & Indicated |
6,393,000 |
5.65 |
1,160,000 |
|
Inferred |
5,445,000 |
4.13 |
723,000 |
Table 2: 2024 Eau Claire Combine Mineral Resource Estimate
Eau Claire Deposit Mineral Resource Estimate, May 10, 2024
|
Category |
Tonnes |
Au g/t |
Contained Au (oz) |
|
|
Open Pit (base case cut-off grade of 0.5 g/t Au) |
Measured |
1,157,000 |
5.19 |
193,000 |
|
Indicated |
1,291,000 |
4.19 |
174,000 |
|
|
Measured & Indicated |
2,448,000 |
4.66 |
367,000 |
|
|
Inferred |
69,000 |
4.39 |
10,000 |
|
|
Underground (base case cut-off grade of 2.5 g/t Au) |
Measured |
455,000 |
6.90 |
101,000 |
|
Indicated |
3,490,000 |
6.17 |
692,000 |
|
|
Measured & Indicated |
3,945,000 |
6.25 |
793,000 |
|
|
Inferred |
2,566,000 |
6.08 |
502,000 |
|
|
Combined open pit and Underground |
Measured |
1,612,000 |
5.67 |
294,000 |
|
Indicated |
4,781,000 |
5.64 |
866,000 |
|
|
Measured & Indicated |
6,393,000 |
5.65 |
1,160,000 |
|
|
Inferred |
2,635,000 |
6.04 |
512,000 |
Table 3: 2024 Eau Claire Deposit Mineral Resource Estimate
|
• |
The Eau Claire deposit contains mineral resources of 1,160,000 oz of gold (6.39 million tonnes at an average grade of 5.65 g/t Au) in the Measured and Indicated category, and 512,000 ounces of gold (2.64 million tonnes at an average grade 6.04 g/t Au) in the Inferred category. |
|
• |
The open pit mineral resource includes, at a base case cut-off grade of 0.5 g/t Au, 367,000 ounces of gold (2.45 million tonnes at an average grade of 4.66 g/t Au) in the Measured and Indicated category, and 10,000 ounces of gold (69 thousand tonnes at an average grade of 4.39 g/t Au) in the Inferred category. |
|
• |
The underground mineral resource includes, at a base case cut-off grade of 2.5 g/t Au, 793,000 ounces of gold (3.95 million tonnes at an average grade of 6.25 g/t Au) in the Measured and Indicated category, and 502,000 ounces of gold (2.57 million tonnes at an average grade of 6.08 g/t Au) in the Inferred category. |
Highlights of the 2024 Percival Mineral Resource Estimate are as follows
|
Category |
Tonnes |
Au g/t |
Contained Au (oz) |
|
|
Open Pit (base case cut-off grade of 0.5 g/t Au) |
Inferred |
2,253,000 |
1.81 |
131,000 |
|
Underground (base case cut-off grade of 2.5 g/t Au) |
Inferred |
557,000 |
4.47 |
80,000 |
|
Combined open pit and Underground |
Inferred |
2,810,000 |
2.34 |
211,000 |
Table 4: 2024 Percival Deposit Mineral Resource Estimate
|
• |
The Percival deposit contains an inferred mineral resource of 211,000 oz of gold (2.81 million tonnes at an average grade of 2.34 g/t Au) |
|
• |
The open pit inferred mineral resource includes, at a base case cut-off grade of 0.5 g/t Au, 131,000 ounces of gold (2.25 million tonnes at an average grade of 1.81 g/t Au). |
|
• |
The underground inferred mineral resource includes, at a base case cut-off grade of 2.5 g/t Au, 80,000 ounces of gold (557,000 tonnes at an average grade of 4.47 g/t Au). |
2024 Eau Claire and Percival Deposits Mineral Resource Estimate Notes:
(1) The effective date of the Eau Claire project Mineral Resource Estimates (“MREs”), including the Eau Claire and Percival deposit estimates, is May 10, 2024.
(2) The Mineral Resource Estimates were estimated by Maxime Dupéré, B.Sc., géo. of SGS Geological Services and is an independent Qualified Person as defined by NI 43-101.
(3) The classification of the current Mineral Resource Estimates into Measured, Indicated and Inferred mineral resources is consistent with current 2014 CIM Definition Standards - For Mineral Resources and Mineral Reserves.
(4) All figures are rounded to reflect the relative accuracy of the estimate and numbers may not add due to rounding.
(5) The mineral resources are presented undiluted and in situ, constrained by continuous 3D wireframe models, and are considered to have reasonable prospects for eventual economic extraction.
(6) Mineral resources which are not mineral reserves do not have demonstrated economic viability. An Inferred Mineral Resource has a lower level of confidence than that applying to an Indicated Mineral Resource and must not be converted to a Mineral Reserve. It is reasonably expected that most Inferred Mineral Resources could be upgraded to Indicated Mineral Resources with continued exploration.
(7) The Project mineral resource estimates are based on a validated database which includes data from 1202 surface diamond drill holes totalling 406,431 m, and 426 surface channels (Eau Claire deposit) for 1,345 m. The resource database totals 273,402 drill hole assay intervals representing 267,721 m of data and 2,254 channel assays for 1,316 m.
(8) The MRE for the Eau Claire deposit is based on 280 three-dimensional (“3D”) resource models representing the 450, 850 and hinge zones. The MRE for the Percival deposit is based on 29 3D resource models representing high grade and lower grade halo zones.
(9) Grades for Au were estimated for each mineralization domain using 1.0 metre capped composites assigned to that domain. To generate grade within the blocks, the inverse distance cubed (ID3) interpolation method was used for all domains. An average density value was assigned to each domain.
(10) Based on the location, surface exposure, size, shape, general true thickness, and orientation, it is envisioned that parts of the Eau Claire and Percival deposits may be mined using open-pit mining methods. In-pit mineral resources are reported at a base case cut-off grade of 0.5 g/t Au. The in-pit resource grade blocks are quantified above the base case cut-off grade, above the constraining pit shell, below topography and within the constraining mineralized domains (the constraining volumes).
(11) The pit optimization and base-case cut-off grade consider a gold price of $1,900/oz and considers a gold recovery of 95%. The pit optimization and base case cut-off grade also considers a mining cost of US$2.80/t mined, pit slope of 55⁰ degrees, and processing, treatment, refining, G&A and transportation cost of USD$19.00/t of mineralized material.
(12) The results from the pit optimization, using the pseudoflow optimization method in Whittle 4.7.4, are used solely for the purpose of testing the “reasonable prospects for economic extraction” by an open pit and do not represent an attempt to estimate mineral reserves. There are no mineral reserves on the Property. The results are used as a guide to assist in the preparation of a Mineral Resource statement and to select an appropriate resource reporting cut-off grade. A Whittle pit shell at a revenue factor of 0.52 was selected as the ultimate pit shell for the purposes of this mineral resource estimate.
(13) Based on the size, shape, general true thickness, and orientation, it is envisioned that parts of the Eau Claire and Percival deposits may be mined using underground mining methods. Underground mineral resources are reported at a base case cut-off grade of 2.5 g/t Au. The mineral resource grade blocks were quantified above the base case cut-off grade, below surface/pit surface and within the constraining mineralized wireframes (considered mineable shapes). Based on the size, shape, general thickness, and orientation of the mineralized structures, it is envisioned that the deposits may be mined using a combination of underground mining methods including sub-level stoping (SLS) and/or cut and fill (CAF) mining.
(14) The underground base case cut-off grade of 2.5 g/t Au considers a mining cost of US$65.00/t mined, and processing, treatment, refining, G&A and transportation cost of USD$19.00/t of mineralized material.
(15) The estimate of Mineral Resources may be materially affected by environmental, permitting, legal, title, taxation, socio-political, marketing, or other relevant issues.
Eau Claire Project 2025 Preliminary Economic Assessment (“PEA”)
The following disclosure relates to the Eau Claire Project which includes the Percival deposit. Disclosure regarding this is based on information derived largely from the NI 43-101 compliant technical report on the Eau Claire Project entitled “Preliminary Economic Assessment of the Eau Claire Project, Eeyou Istchee James Bay Region of Quebec, Canada” prepared by Maxime Dupéré, P.Geo, Sarah Dean, P.Geo., William van Breugel, P. Eng., Henri Gouin, P. Eng., Johnny Canosa, P. Eng., and Joseph Keane, P.E. of SGS Geological Services with an effective date of August 25, 2025 (the “PEA”). Reference should be made to the full text of the PEA, which is available electronically on the SEDAR+ website at www.sedarplus.ca under our SEDAR profile, filed on October 17, 2025, as the PEA contains additional assumptions, qualifications, references, reliance and procedures which are not fully described herein. The PEA, dated August 25, 2025, supersedes all previous technical reports.
The PEA is based on a 2024 Mineral Resource Estimate (“MRE”) described above as well as an initial MRE for Percival. Eau Claire contains a combined mineral resource of 1.16 Moz Au at a grade of 5.64 g/t Au in the Measured and Indicated category, as well as an additional 723 koz gold at a grade of 4.13 g/t Au in the Inferred Category. Accordingly, it is presently estimated to contain mineral resources of 1,160,000 oz of gold (6.39 million tonnes at an average grade of 5.65 g/t Au) in the Measured and Indicated category, and 512,000 ounces of gold (2.64 million tonnes at an average grade of 6.04 g/t Au) in the Inferred category. The Eau Claire MRE includes an open pit and underground resource.
Highlights of the PEA
The PEA for the Eau Claire Gold Deposit which was conducted by the independent engineering firm of SGS Geological Services contemplates a primary underground mining operation complemented by 2 small open pits. Production from the underground (“UG”) mine will start in year minus 1 with a small bulk sample, with full UG operations continuing through to year 11. In total, the underground would produce 702koz gold at an average diluted head grade of 5.22 g/t gold from 4.40Mt of material. The conventional open pits (“OP”) would operate for 8 years, recovering a total of 132koz old at an average diluted grade of 2.50 g/t gold from 1.73Mt of material.
|
Production |
||||
|
PEA Life of Mine (LOM) |
Years |
11 |
||
|
LOM Production Resource Tonnes |
Tonnes |
6.1M |
||
|
LOM diluted head grade |
g/t Au |
4.46 |
||
|
Average Diluted Grade (OP) |
g/t Au |
2.5 |
||
|
Average Diluted Grade (UG) |
g/t Au |
5.22 |
||
|
Average Gold Recovery |
% |
95 |
||
|
Contained Gold |
oz |
878,281 |
||
|
Recovered Gold |
oz |
834,367 |
||
|
Average Annual production |
oz |
75,852 |
||
|
OP LOM Strip Ratio |
|
7.73 |
||
|
Capital Costs |
||||
|
Base Case |
Hybrid |
Toll Milling |
||
|
Initial Capital Cost Expense (“CapEx”) (incl UG development) |
C$ |
$217M |
$216M |
$117M |
|
Sustaining Capital |
C$ |
$66M |
$66M |
$66M |
|
Contingency included in Capital |
C$ |
$36M |
$36M |
$10M |
|
Total Capital |
C$ |
$283M |
$282M |
$184M |
|
Total Operating Costs |
C$ |
$1,019M |
$1,036M |
$1,153M |
|
Cash Costs (LOM) |
USD/oz |
$892 |
$906 |
1,009 |
|
AISC (LOM)1 |
USD/oz |
$1,140 |
$1,153 |
$1,170 |
|
Financial Summary |
||||
|
Assumed long-term Gold Price |
USD |
$2,400 |
||
|
Exchange Rate |
USD/C$ |
0.73 |
||
|
After-Tax Net Present Value NPV(5%) |
C$ |
$554M |
$610M |
$639M |
|
After-Tax Internal rate of return (IRR) |
% |
41 |
53 |
84 |
|
After-Tax Payback |
Years |
2.5 |
1.5 |
1.15 |
Table 5: Eau Claire PEA Key Economic Assumptions and Results
Note to Table: AISC is calculated as the sum of treatment and refining charges, onsite operating costs, sustaining capital costs, and closure costs, divided by the quantity of ounces produced.
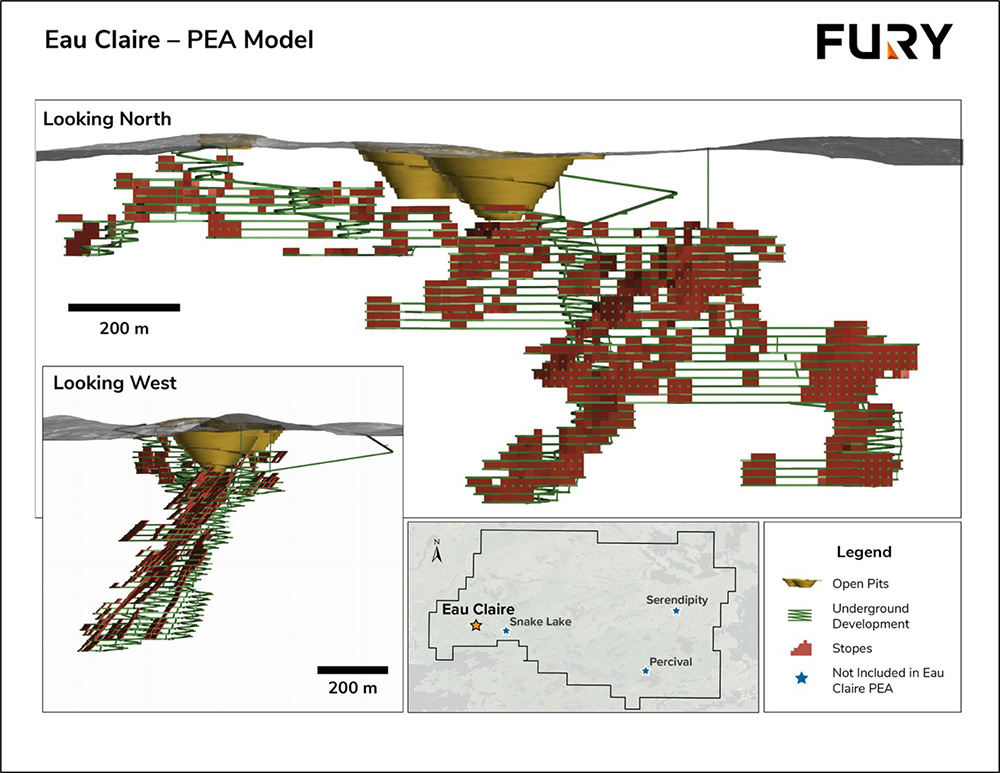
Graphic 3: Section views of the PEA open pit and underground mine plan.
The PEA is subject to a number of assumptions and risks, including, among others, that all required permits and other rights will be obtained in a timely manner, that development of the Eau Claire deposit will have the support of the First Nations, stakeholders, and government, and that geotechnical, hydrogeological, and metallurgical assumptions will be confirmed. The Company cannot determine at this time whether any toll milling arrangements will be reached with any facility within a reasonable distance from the project. The Toll milling assumptions used in the PEA includes provision for on-site crushing, an on-site sample tower, one-way 205 km road haulage, and toll milling costs with life
|
Category |
Tonnes |
Diluted Au g/t |
Contained Ounces Au (oz) |
|
|
Underground |
Measured Resource |
549k |
4.83 |
85k |
|
Indicated Resource |
2,711k |
5.11 |
446k |
|
|
Measured & Indicated |
3,260k |
5.06 |
531k |
|
|
Inferred Resource |
1,143k |
5.68 |
209k |
|
|
In-pit |
Measured Resource |
1,292k |
2.55 |
106k |
|
Indicated Resource |
423k |
2.40 |
33k |
|
|
Measured & Indicated |
1,715k |
2.51 |
139k |
|
|
Inferred Resource |
12k |
1.59 |
597 |
Table 6: Potentially Mineable Portion of the Eau Claire Resource
Capital and Operating Cost Estimates
The initial capital is estimated to range between $117M and $217M with an additional $66M in sustaining capital (Table 4). The PEA is based on contract mining. Operating costs were developed from unit costs for projects of a similar scale in Canada (Table 5).
|
Input |
Base Case |
Hybrid |
Toll Milling |
|
Initial Capital |
|||
|
Pre-Production Engineering & Design |
$9M |
$9M |
$2M |
|
Process Plant |
$86M |
$86M |
|
|
Tailings |
$5M |
$5M |
|
|
Site Facilities |
$16M |
$17M |
$17M |
|
Power Line from Quebec Hydro 18 km |
$13M |
$13M |
$13M |
|
Surface Support Equipment |
$2.3M |
$2.3M |
$2.3M |
|
OP Mining |
$549k |
$549k |
$549k |
|
UG Non-Development Capital |
$6.4M |
$6M |
$6M |
|
UG Development Capital |
$66M |
$66M |
$66M |
|
Non-Mining Development Contingency |
$10M |
$10M |
$10M |
|
Pre-Production G&A |
$3M |
||
|
Initial Capital Sub-total |
$217M |
$216M |
$117M |
|
Sustaining Capital |
|||
|
OP Mining |
$155k |
$155k |
$155k |
|
UG Non-Development Capital |
$240k |
$245k |
$245k |
|
UG Development Capital |
$61M |
$61M |
$61M |
|
Site Closure |
$5M |
$5M |
$5M |
|
Sustaining Capital Sub-total |
$66M |
$66M |
$66M |
|
Total Capital Costs |
$283M |
$282M |
$184M |
|
Operating Costs |
|||
|
OP Direct Mining Costs |
$86M |
$86M |
$86M |
|
UG Direct Mining Costs |
$504M |
$504M |
$504M |
|
Indirect Mining Costs |
$70M |
$70M |
$70M |
|
Process Costs |
$212M |
$224M |
$360M |
|
Site G&A |
$148M |
$153M |
$133M |
|
Total Operating Costs |
$1,019M |
$1,036M |
$1,153M |
|
OP Cost per Resource Tonne |
$49.64 |
$49.64 |
$49.64 |
|
UG Cost per Resource Tonne |
$114.50 |
$114.50 |
$114.50 |
|
LOM Process Cost per Resource Tonne |
$34.64 |
$36.56 |
$58.80 |
|
LOM G&A per Resource Tonne |
$24.10 |
$24.93 |
$21.77 |
|
AISC USD/oz1 |
$1,140 |
$1,153 |
$1,170 |
Table 7: Eau Claire PEA Capital and Operating Cost Summary
Notes
|
1. |
AISC is calculated as the sum of treatment and refining charges, onsite operating costs, sustaining capital costs, and closure costs, divided by the quantity of ounces sold. |
|
2. |
Values may not add due to rounding. |
Eau Claire PEA Sensitivity Analysis to Economic Inputs
The PEA provides an after-tax NPV5 of $554M, an IRR of 41% and a payback period of 2.5 years with the Base Case scenario; an after-tax NPV of $610M, an IRR of 53% and a payback period of 1.5 years from production with the Hybrid Case and; an after-tax NPV of $639M, an IRR of 84% and a payback period of 1.1 years from production with the Toll Milling Case both at a gold price of US$2,400/oz (Table 5).
|
NPV5 to Gold Price Sensitivities |
|||
|
Gold Price (US$) |
Base Case |
Hybrid Case |
Toll Milling Case |
|
$1,440 (-40%) |
$70M |
$72M |
$96M |
|
$1,920 (-20%) |
$318M |
$346M |
$375M |
|
$2,400 (Study Price) |
$554M |
$610M |
$639M |
|
$2,880 (+20%) |
$787M |
$867M |
$897M |
|
$3,360 (+40%) |
$1,020M |
$1,124M |
$1,154M |
Table 8: Eau Claire PEA Sensitivity Analysis

Graphic 4: Eau Claire PEA Base Case Sensitivities.
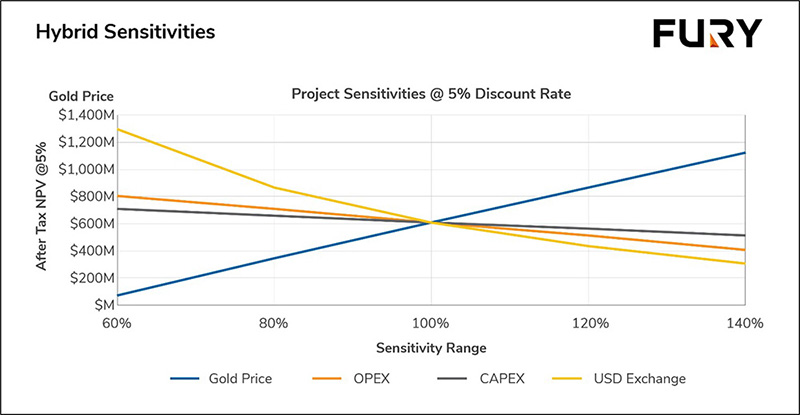
Graphic 5: Eau Claire Hybrid Case Sensitivities.
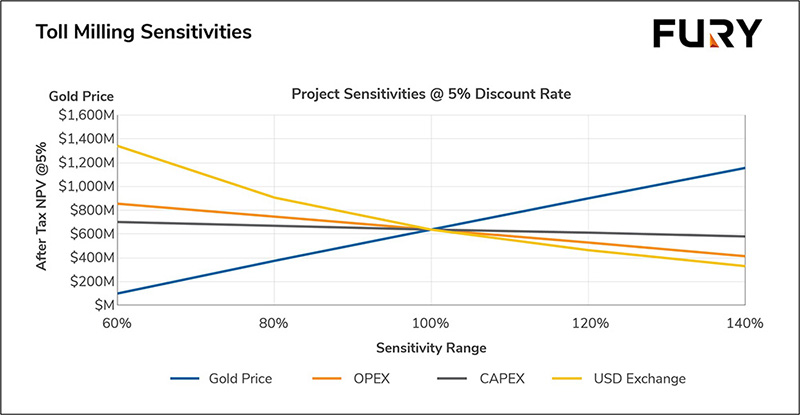
Graphic 6: Eau Claire PEA Toll Milling Case Sensitivities.
Qualified Person (“QP”) Recommendations from PEA
The work program recommended by the QP in the PEA is largely focused on the Eau Clare deposit consisting of continued resource expansion drilling the Eau Claire as the PEA demonstrates that future development of the resource is potentially economically viable. A large proportion of the mineable portion of the Eau Claire deposit is in the Measured and Indicated resource category which can be utilized in future studies. The Eau Claire and Percival deposits contain within-pit and underground Measured, Indicated and Inferred Mineral Resources that are associated with well-defined mineralized trends and models. The deposits are open along strike and at depth. Fury’s intentions are to continue exploration on the Property in 2026 as funding permits.
Drilling to improve continuity between current resource blocks outside of the PEA mineable portion of the deposit; limited conversion drilling to upgrade inferred portions of the Eau Claire resource to the indicated resource category; advancing metallurgical, engineering and geotechnical studies; advancing environmental baseline studies and; furthering Indigenous and Community Relations. Additionally, the Company will continue to review and explore the broader Eau Claire Project land package focusing on refining known gold occurrences within the Percival – Serendipity trend, 14 km to the east of Eau Claire, and attempting to define new prospects in areas with favorable geological and structural settings.
Fury has gained a better understanding of the combination of pathfinder elements and structural controls on the gold mineralization at Percival. The broad low-grade gold mineralization occurs along a well-defined east–west trending structural splay of the Cannard Deformation Zone. Certain elemental associations, most notably Arsenic, Bismuth, and Tungsten, are proving to be important pathfinders for gold mineralization. Higher-grade gold within the broader corridor is controlled by secondary shearing and is identified by the high degree of silicification. With this knowledge, the Company has refined their targeting along the Percival to Serendipity Trend identifying priority targets for 2026. These identified targets lie within the same stratigraphic package as Percival Main and Serendipity and have undergone varying degrees of deformation. The proximity of the main Cannard and Hashimoto Deformation Zones varies from one target to the other and may have a significant impact on gold mineralization. Fury believes the varying degrees of deformation are an important regional control on both gold mineralization and the potential preservation of a sizeable, mineralized body.
The follow-on program recommended by the PEA QP is anticipated to include the collection of 15,000 infill till and biogeochemical samples and 45,000 m of diamond drilling. Drilling would be allocated with approximately 30,000 m at the Eau Claire deposit to expand the overall resource as well as upgrade and expanding the mineable portion of the resource; approximately 7,500 m at the Percival resource to further expand and convert the currently defined resource and; 5,000 m to 10,000 m focused on testing regional targets within the Percival – Serendipity trend. Subsequent to the completion of additional drilling on the Property, updated MREs are planned which will form the basis of an updated engineering study in the form of an updated Preliminary Feasibility Study.
The budget for the recommendations provided is designed to collect the data required to complete a prefeasibility study and is estimated at CAD$ 24.2 M (see table below) The proposed budget involves a major upgrade drilling program, water supply studies, geotechnical/hydrogeological studies, tailing’s optimization studies, continued environmental and community liaison, mineral processing (metallurgy), power studies, mine access study and an engineering study.
Estimated Budget for Eau Claire Resource Expansion Drilling
|
Item |
Details |
Cost (C$) |
|
Labour |
Staff Wages, Technical and Support Contractors |
1,900,000 |
|
Assaying |
Sampling and Analytical |
1,800,800 |
|
Drilling |
Diamond Drilling (45,000m at $195/m) |
8,775,000 |
|
Till Sampling |
Detailed sampling program |
1,750,000 |
|
Land Management |
Consultants. Assessment Filing, Claim maintenance |
750,000 |
|
Environmental |
Desktop Gap analysis |
35,000 |
|
Phase 1 Baseline studies |
500,000 |
|
|
Engineering Studies (hydrogeology, geotechnical, tailings, road studies) |
Gap Analysis and Phase 1 work |
750,000 |
|
Metallurgical Studies |
Gap Analysis and Phase 1 work |
450,000 |
|
Community Relations |
Community Tours, Outreach |
175,000 |
|
Information Technology |
Remote site communications and IT |
35,000 |
|
Safety |
Equipment, Training and Supplies |
90,000 |
|
Expediting |
Expediting |
200,000 |
|
Camp Costs |
Equipment, Maintenance, Food, Supplies |
1,450,000 |
|
Freight and Transportation |
Freight, Travel, Helicopter |
450,000 |
|
Fuel |
1,500,000 |
|
|
General and Administration |
250,000 |
|
|
Update MRE and PFS |
1,200,000 |
|
|
Sub-total |
22,060,800 |
|
|
Contingency (10%) |
2,161,000 |
|
|
Total |
24,221,800 |
Table 9: Budget for Eau Claire Resource Expansion Drilling
Post-PEA Eau Claire Exploration
In October 2025 the Company commenced an initial 10,000m drill campaign based on the recommendations of the PEA. The drilling is focused on resource growth and enhancing the mine plan through improved continuity of resource blocks outside of the PEA mine plan. The program was later increased to 13,000m. Initial results form the drilling campaign were released on March 17, 2026 and include an intercept of 11.74 g/t gold over 6.63m from infill drilling. Overall the results to date demonstrate good continuity of the Eau Claire resource as well as potential to grow the overall contained gold ounces.
A phase 2 program focused on improving the confidence level on inferred portions of the resource and extending indicated portions of the resource started directly after the completion of the Phase 1 program. The phase 2 program will run through the summer of 2026 and comprise 20,000 – 25,000m of drilling.
Eau Claire Regional Exploration- Serendipity Prospect
The Serendipity Prospect is situated 16 kilometres (km) northeast of the Eau Claire Deposit and 6.5 km north northeast of the Percival Deposit along the Hashimoto Deformation Zone which is related to the Cannard Deformation Zone, one of the primary controls on gold mineralization within the region. Drilling during 2024 tested geochemical anomalies associated with prospective folded stratigraphy across approximately 2 km of strike length. In total 3,871 metres (m) were drilled in 10 holes across five distinct targets at Serendipity. Drill hole 24SD-009 targeted a biogeochemical anomaly overlying the easterly extension of the structure controlling the mineralization at Serendipity and intercepted 12.16 g/t gold over 3.0 m. Drill hole 25SD-002 targeted a biogeochemical anomaly at the hinge of an interpreted fold within volcanic stratigraphy and intercepted 5.27 g/t gold over 1.0 m. The two noted intercepts above are separated by over 2 kilometres indicating the potential for a large mineralizing system at Serendipity.
Broad low-grade gold mineralization occurs along well-defined structural splays sub-parallel to the regional Cannard and Hashimoto Deformation Zones. Certain elemental associations, most notably Arsenic, Bismuth, and Tungsten, are proving to be important pathfinders for the gold mineralization. Higher-grade gold within the broader corridor is controlled by secondary shearing and is identified by the high degree of silicification.
In 2024, the Company completed approximately 3,871 m of Diamond Drilling at the project targeting biogeochemical anomalies within the Percival – Serendipity trend 14km to the east of Eau Claire. The 2024 drill program resulted in the discovery of high-grade gold mineralization at Serendipity with two intercepts: 3m of 12.16 g/t gold and 1m of 5.27 g/t gold separated by over 2 km of prospective stratigraphy. The 2024 drilling cost $1,800.
Committee Bay Project
2023 Technical Report
The following disclosure relating to the Committee Bay Project is based on information derived from the NI 43-101 compliant technical report entitled “Technical Report on the Committee Bay Project, Nunavut Territory, Canada” dated September 11, 2023, prepared by Bryan Atkinson, P.Geo. as Senior Vice President Exploration of Fury Gold Mines and Andrew Turner, P.Geol., principal at APEX Geoscience Ltd., (the “Committee Bay Report”). Reference should be made to the full text of the Committee Bay Report, which is available electronically under the Company’s profile page on SEDAR+ at www.sedarplus.ca, as the Committee Bay Report contains additional assumptions, qualifications, references, third-party reliance and procedures which are not fully described herein. The Committee Bay Report is the only current NI 43-101 compliant technical report with respect to the Committee Bay Project and supersedes all previous technical reports.
Description and Location
The Committee Bay Project is located in the eastern part of the Kitikmeot Region of Nunavut, approximately 430 km northwest of the town of Rankin Inlet, Nunavut. The Project is accessible by air, either from Rankin Inlet or Baker Lake, Nunavut. Rankin Inlet and Baker Lake are serviced seasonally by barge and ship. The hamlets of Rankin Inlet, Baker Lake, Naujaat, Gjoa Haven, Taloyoak, and Kugaaruk are accessible by scheduled commercial flights.
The Committee Bay Project consists of 57 Crown Leases and 154 mineral claims in six non-contiguous blocks totaling approximately 254,933.10 ha. all of which are in good standing as of December 31, 2025
The figure below presents property location and claims comprising the Committee Bay project:

Graphic 7: Committee Bay Project Location and Claims
Access, Climate, Local Resources, Infrastructure and Physiography
The Committee Bay Project is accessed via fixed wing charter primarily through a 914 m, graded, esker airstrip at Hayes Camp, a permitted, seasonally prepared 1,580 m winter ice airstrip, which is constructed on the adjacent Sandspit Lake, or a 320m tundra airstrip at the Bullion Camp.
The Committee Bay Project is located in the Wager Bay Plateau Ecoregion of the Northern Arctic Ecozone (Marshall and Schutt, 1999). This ecoregion is classified as having a low arctic ecoclimate. Summers are short and cold, with mean daily temperatures above freezing only in July and August. Snow cover usually lasts from September to June, but it can fall during any month. Most of the lakes are icebound until approximately mid-July. Precipitation is moderate throughout the year, but drifting of snow in the winter can result in considerable localized accumulations, particularly on the sides of hills. Fog is often a problem near the coast and at higher elevations particularly during the late spring to early summer and the fall months.
There is no permanent infrastructure at the Committee Bay Project. The Company maintains four camps to support seasonal exploration campaigns in various portions of the Committee Bay Project, namely the Hayes Camp (100 person capacity), the Bullion Camp (20 to 40 person capacity), Crater Camp (40 person capacity) and the Ingot Camp (10 person capacity). A drill water system is maintained at the Three Bluffs site.
Geology, Mineralization and Deposit Types
The Committee Bay Project area, situated in the Churchill Structural Province, is underlain by Archean and Proterozoic rocks and extensively covered by Quaternary glacial drift. It comprises three distinct Archean sub-domains (Prince Albert Group, Northern Migmatite, and Walker Lake Intrusive Complex).
The Committee Bay Greenstone Belt (the “CBGB”), which hosts the gold occurrences discussed in the Committee Bay Report, is composed of Prince Albert Group rocks. These are bounded by the wide, northeast-striking Slave-Chantrey mylonite belt to the northwest and by the Amer and Wager Bay shear zones to the south. Two major fault systems, the northeast-striking Kellet fault and the northwest-striking Hayes River fault, intersect the central portion of the CBGB and cut the Prince Albert Group rocks. Gold occurrences in the CBGB appear to be spatially related to the major shear systems and their sub-structures indicating the potential for the re-mobilization of mineral-bearing fluids along these structures.
The regional strike of rock units in the West Laughland Lake area is generally north but shows a degree of variability. Units, generally vertically dipping in much of the CBGB, have a more moderate to shallow dip at Four Hills. Rocks generally strike northeast from Four Hills east to the Committee Bay Project. In the Hayes River area, the east-striking Walker Lake shear zone is the dominant structure. Dips in the Hayes River area are generally sub-vertical and there is evidence of flexural shear and silicification along lithological contacts between iron formation and talc-actinolite schist (meta-komatiite). Rocks of the Curtis River area, approximately 120 km northeast of the Hayes River area, strike northeast and dip sub-vertically.
The iron formations that host the Three Bluffs, Antler, Hayes, and Ledge gold occurrences have unique lithological associations with their contact rocks and do not appear to be stratigraphically equivalent.
Three low, rounded, rusty outcrops, called West, Central, and East, comprise the Three Bluffs gold occurrence. Gold mineralization is hosted in gossanous, predominantly oxide, silicate, and sulphide facies iron formations. Iron formation thicknesses range from 25 m to 30 m at the West Bluff to 55 m at the Central Bluff. The Three Bluffs iron formation maintains a thickness of 10 m for a minimum strike length of 1.8 km and is at least 55 m thick for 700 m. The iron formations are poorly banded to massive with locally shared, quartz-veined intervals of up to 3 m near lithological contacts. Chlorite and epidote alteration indicates either lower amphibolite grade metamorphism (epidote-amphibolite facies) or the result of retrograde greenschist facies metamorphism associated with gold deposition. Local mineralization, composed of disseminated pyrite and pyrrhotite, can occupy up to 50% of the rock volume.
History
Key historical events for the project are include: (i) in 1961 and 1967, mapping was done in the area by the Geological Survey of Canada (“GSC”); (ii) in 1970, King Resources Company conducted reconnaissance geological mapping and sampling in the Laughland Lake and Ellice Hills areas, with follow-up work including geophysics and detailed mapping, trenching, and sampling; (iii) in 1970, 1974, and 1976 Cominco Ltd. Carried out reconnaissance and detailed geological mapping, ground geophysics, and sampling in the Hayes River area; (iv) in 1971, the Aquitaine Company conducted airborne electromagnetic (‘EM”) and magnetometer surveys; (v) from 1972 to 1977, detailed re-mapping of the area was done by the GSC; (vi) in 1979, Urangesellschaft Canada Ltd. Carried out reconnaissance airborne radiometric surveys and prospecting for uranium in the Laughland Lake area; (vii) in 1986, Wollex carried out geological mapping and rock sampling in the West Laughland Lake area; (viii) in 1992, GSC conducted geological re-assessment of the mineral potential of the Prince Albert Group; (ix) in 1994, channel sampling carried out over the Three Bluffs area but the results were lost; (x) in 1996, Terraquest Ltd. Conducted a high-resolution airborne magnetometer survey; (xi) from 1997 to 1998, P.H. Thompson Geological Consulting Ltd. Conducted regional geological mapping in the Three Bluffs area; (xii) from 1999 to 2002: GSC conducted a multi-disciplinary study of the Committee Bay Greenstone Belt (“CBGB”); (xiii) from 1992 to 2012, North Country Gold and its predecessors Carried out prospecting, rock sampling, gridding, airborne and ground geophysics, geophysics, geological mapping, and reverse circulation and diamond drilling on several of the gold targets including Three Bluffs, Three Bluffs West, West Plains, Anuri, Inuk, Antler, and Hayes.
Older historical drilling (pre-2015) on the Project amounts to 68,269.98 metres drilled in 426 drill holes. Of the historical drilling, 351 drill holes comprising 58,575.56 m were completed at Three Bluffs and are the basis for the Three Bluffs Mineral Resource described below.
Committee Bay Sampling, Analyses and Data Verification
Committee Bay RAB Drilling QA/QC Disclosure
Intercepts were calculated using a minimum of a 0.25 g/t Au cut off at beginning and end of the intercept and allowing for no more than four consecutive samples (six metres) of less than 0.25 g/t Au.
Analytical samples were taken using 1/8 of each 5ft (1.52m) interval material (chips) and sent to ALS Global (“ALS”) Lab in Yellowknife, NWT and Vancouver, BC for preparation and then to ALS Lab in Vancouver, BC for analysis. All samples are assayed using 30g nominal weight fire assay with atomic absorption finish (Au-AA25) and multi-element four acid digest ICP-AES/ICP-MS method (ME-MS61). Quality Assurance/Quality Control (“QA/QC”) programs using internal standard samples, field and lab duplicates and blanks indicate good accuracy and precision in a large majority of standards assayed.
Committee Bay Diamond Drilling QA/QC Disclosure
Intercepts were calculated using a minimum of a 0.25 g/t Au cut off at beginning and end of the intercept and allowing for no more than six consecutive metres of less than 0.25 g/t Au.
Analytical samples were taken by sawing NQ diameter core into equal halves on site and sending one of the halves to ALS Lab in Yellowknife, NWT for preparation and then to ALS Lab in Vancouver, BC for analysis. All samples are assayed using 50g nominal weight fire assay with atomic absorption finish (Au-AA26) and multi-element four acid digest ICP-AES/ICP-MS method (ME-MS61). QA/QC programs using internal standard samples, field and lab duplicates and blanks indicate good accuracy. Due to the nuggety nature of mineralization encountered, the Company will be running additional analysis on duplicate samples to better understand the analytical precision.
True widths of mineralization are unknown based on current geometric understanding of the mineralized intervals.
Committee Bay Grabs QA/QC Disclosure:
Approximately 1 to 2kg of material was collected for analysis and sent to ALS Lab in Vancouver, BC for preparation and analysis. All samples are assayed using 50g nominal weight fire assay with atomic absorption finish (Au-AA26) and multi-element four acid digest ICP-AES/ICP-MS method (ME-MS61). QA/QC programs for 2018 rock grab samples using internal standard samples, lab duplicates, standards and blanks indicate good accuracy and precision in a large majority of standards assayed. Grab samples are selective in nature and cannot be considered as representative of the underlying mineralization.
Core arrives in camp at the end of each drill shift where geological technicians check and correct any downhole distance discrepancies. Technicians record core recovery, fracture density and orientation, magnetic susceptibility, and overall rock quality designation. Geological logging follows, comprising measurement and descriptions of geological units and the collection of semi- quantitative data such as the number of visible gold occurrences, volume percent sulphide minerals, volume percent of alteration minerals, volume percent vein quartz, etc. Sample intervals are then designated by the logging geologist focusing on sulphide bearing and/or silicified Intervals that are well bracketed by apparently unmineralized rock. Protocols limit sampling intervals between 0.75 m and 1 m in length with a minimum length of 0.3 m and a maximum length of 1.5 m so long as geological boundaries were honoured.
Drill core is digitally photographed and core samples are marked for sawing. Sampling intervals, geological boundaries, and a “saw line” are marked by the logging geologist and the core is sawed in half longitudinally by technicians. One half of the core is placed in a sample bag with a uniquely numbered tag and secured with plastic cable ties. Each batch of 20 field samples contain a blank and one of four commercial certified reference materials. The remaining half core is returned to the core box for reference. The majority of the reference core remains on-site except for chosen intervals which are taken to Edmonton, Alberta for display purposes. Individual sample bags are placed inside a larger bag which is closed with a security seal for shipment to the laboratory.
Assaying procedures are generally similar to those used in 2003, with some minor modifications. The standard aliquot size was increased to 2AT (58.32 g) and the samples were all analyzed using FA with a gravimetric finish. Selected samples, containing visible gold or which assayed greater than 20 g/t Au, are re-analyzed using metallic screen fire assay that include twin 2AT gravimetric assays of the fine fraction. A pulp from each sample is sent for standard 30 element ICP analysis using a three-acid digestion.
All the RAB and diamond drill core samples are analyzed at the ALS laboratory in Vancouver, BC, by fire assay of a 50 g sample followed by a gravimetric finish according to ALS lab code Au-GRA22 and by a multi-element inductively couple plasma atomic emission spectrometry or mass spectrometry (“ICP-AES/ICP-MS”) package following a four acid digestion of a one gram sample according to ALS lab code ME-MS61. Sample intervals with visible gold in core were assayed using a Screen Fire Assay method on a one kg sample according to ALS lab code Au-SCR24 where the entire sample is screened to 100 μm and firs assays are performed on a 50 g sample of <100 μm material and on the entire >100 μm material. The fire assay is calculated as a weighted average of the two fire assays.
In the Company’s view, the sample collection, preparation, analysis, transport, and security procedures at the Committee Bay Project are adequate for use in the estimation of mineral resources.
Mineral Processing and Metallurgical Testing
2003 Metallurgical Testing
Dawson Metallurgical Laboratories, Inc. of Salt Lake City, Utah, was commissioned in 2003 to conduct metallurgical tests on Three Bluffs mineralized material. Twelve drill core samples, eight high-grade and four low-grade, totaling approximately 20 kg were used. The mineralogical study reported the principal sulphide minerals as pyrrhotite with minor pyrite. No reference was made to any deleterious elements in the samples.
The test indicated that 92% gold recovery could be achieved with cyanidation but the presence of pyrrhotite would result in high cyanide consumption. RPA notes that these preliminary tests suggest gold at Three Bluffs can be recovered using conventional methods.
2008 Metallurgical Testing
Mineral processing test work comprising exploratory gravity concentration, cyanide leaching, and froth flotation studies was undertaken by Process Research Associates Ltd. (“PRA”) under the guidance of RPA. The sample used was a 110 kg composite of drill core samples from the 2007 exploration program with an average estimated grade of 4.3 g/t Au and 7.5% S.
Additional gravity recovery test work on Three Bluffs mineralization was performed by Knelson Research Technology Centre. An 18 kg sample, taken from a composite of coarse rejects sample material from 2007 drill core samples, was subjected to multi-pass testing utilizing a bench-scale enhanced gravity concentrator. The tests were designed to examine recovery trends for gold and gold-bearing sulphides.
Based on the composite sample tested it was expected that Three Bluffs mineralization could be processed by various standard beneficiation steps to recover approximately 93% of the gold. The limited metallurgical test work conducted to date suggests that the gold can be recovered by conventional means, a combination of gravity and flotation followed by cyanide leaching of the concentrate. The metallurgical test results indicated that a combination of gravity and flotation followed by cyanide leaching of the concentrate is likely the most suitable processing option.
2009 Metallurgical Testing
Follow-up work at PRA was then undertaken in April 2009 to look specifically at a flowsheet consisting of gravity recovery followed by cyanidation. These results were reported by PRA on May 6, 2009.
At a primary grind size P80 of 74 μm, gold was effectively extracted by gravity and flotation, with 96% of the gold recovered. In a single Locked-Cycle test, a gravity circuit recovery of 60.5% gold in 0.22% of mass, followed by a cleaner flotation recovery of 35.3% gold in 17.7% of the mass, was obtained. Thus, an overall gold recovery of 95.8% in 17.9% of the mass was shown to be possible. Flotation recovery without gravity scalping was also reasonably successful.
Flotation concentrate was subjected to cyanide leach test work. A total of eight concentrate leach tests were performed. A single whole ore cyanide leach test obtained 79.2% gold extraction after 48 hours and 94.6% after 72 hours.
Several issues were identified during metallurgical testing of samples, the largest issue lies with cyanide consumption. Cyanide consumption has been found to be extremely high at up to 0.2 kg/h, while leaching kinetics remain low. Another issue that has been identified is that gold bearing sulphides are not amenable to enhanced gravity separation, therefore batch concentration and not continuous gravity concentration should be utilized.
Based on the samples tested to date, Three Bluffs ore is generally considered to be relatively free-milling. Gravity concentration has been effective in recovering up to 60% of the gold. Much of the remaining gold can be effectively recovered by either flotation or cyanide leaching to produce an overall metallurgical recovery above 90%. RPA recommends further optimization and variability work on a greater variety of samples from the Three Bluffs property if further economic studies are conducted.
There has been no mineralogical processing and metallurgical testing since 2009.
2023 Committee Bay Mineral Resource Estimate
The mineral resources at the Committee Bay Project are estimated to be approximately 2.07 million tonnes of indicated mineral resources grading 7.85 g/t Au, containing 524,000 ounces of gold, and 2.93 million tonnes of inferred mineral resources grading 7.64 g/t Au, containing 720,000 ounces of gold as of September 11, 2023. Drilling at Three Bluffs subsequent to the Mineral Resource Estimation has been outside of the resource envelope focused on defining large extensions. Due to spacing, this drilling has no effect on the current Mineral Resource Estimate and the 2017 block model remains appropriate for the 2023 mineral resource calculation in the opinion of Mr. Turner. Mr. Turner acknowledges that some other parties may be using somewhat higher long-term gold price assumptions than were used for this estimate. A bulk density of 3.15 t/m3 was applied for estimation of tonnage. This value was derived from a total of 6,426 density determinations carried out on drill core from a variety of locations in the deposit.
The estimate was carried out using a block model method constrained by wireframe grade shell models, with Inverse Distance Cubed (“ID3”) weighting. Two sets of wireframes and block models were employed: one contemplated open pit mining and the other, underground mining. The block model grade interpolations were checked by (i) an inspection of the interpolated block grades in plan and section views and comparison to the composite grades, and (ii) through a statistical comparison of global block and composite mean grades. Inspection of the block grades in plan and section indicates that the grade estimation honours the drill hole grades reasonably well.
The reported mineral resources at calculated cut-off grades of 3.0 g/t Au for open pit mining and 4.0 g/t Au for underground mining based on the following assumptions:
|
● |
Gold Sale Price: US$1,200/oz; |
|
● |
Process Recovery 93%; |
|
● |
Open Pit Mining Cost C$10.00/t; |
|
● |
Underground Mining Cost C$70.00/t; |
|
● |
Process + G&A Costs C$75.00/t; and |
|
● |
Exchange Rate 1.25 US$/C$. |
To fulfill the resource status criteria requirements of “reasonable prospects for eventual economic extraction”, a pit shell analysis was run on the 0.5 g/t Au model to determine how much of the deposit could potentially be extracted using open pit methods. The analysis was done using Whittle software with very preliminary assumptions for pit slopes, metallurgical recovery, prices, and costs.
For this mineral resource the preliminary pit shell that was optimized in 2013 using a different gold price and cost assumptions (listed below) than those used to calculate the updated cut-off grade. Mr. Turner considers this approach reasonable given that the pit shell used to report open pit resources is conceptual and the relative difference between the underground and open-pit resource cut-off grades is negligible.
The following cost assumptions were used:
|
● |
Gold Sale Price: US$1,500/oz; |
|
● |
Overall Pit Slope Angles: 50°; |
|
● |
Process Recovery 93%; |
|
● |
Mining Cost US$10.00/t; and |
|
● |
Process + G&A Costs US$60.00/t |
Blocks from the open pit model captured within this shell were considered eligible for reporting as open pit resources. The same pit shell was applied to the underground model, except that blocks from this model were included in the resource only if they were outside of the shell.
|
Class |
Type |
Cut-off |
Tonnes |
Gold Grade |
Contained Gold |
|
Indicated |
Open Pit |
3.0 |
1,760 |
7.72 |
437,000 |
|
Indicated |
Underground |
4.0 |
310 |
8.57 |
86,000 |
|
Total |
2,070 |
7.85 |
524,000 |
||
|
Inferred |
Open Pit |
3.0 |
590 |
7.57 |
144,000 |
|
Inferred |
Underground |
4.0 |
2,340 |
7.65 |
576,000 |
|
Total |
2,930 |
7.64 |
720,000 |
Table 10: 2023 Committee Bay Mineral Resources
Notes
|
1. |
Mineral Resources are not Mineral Reserves as they do not have demonstrated economic viability, although, as per CIM requirements, the Mineral Resources reported above have been determined to have demonstrated reasonable prospects for eventual economic extraction. |
|
2. |
The Mineral Resources were estimated in accordance with the Canadian Institute of Mining, Metallurgy and Petroleum (CIM), CIM Standards on Mineral Resources and Reserves, Definitions (2014) and Best Practices Guidelines (2019) prepared by the CIM Standing Committee on Reserve Definitions and adopted by the CIM Council. |
|
3. |
The Mineral Resources Committee Bay Gold Project was initially reported in Ross (2017) – QP David A. Ross, M.Sc., P.Geo, effective date of May 31, 2017. |
|
4. |
The resources reported above are reviewed in detail within this Report and are accepted as current by the Qualified Person, Mr. Andrew J. Turner, B.Sc., P.Geol., of APEX Geoscience Ltd |
|
5. |
The Cutoff grades were determined using average block grade values within the estimation domains and an Au price of US$1,200/oz, and Process Recovery of 93%, Open Pit mining costs of C$10.00/t, Underground mining costs of C$70.00/t, Process and G&A costs of approximately C$75/t and an exchange rate of 1.25 US$/C$. |
|
6. |
A bulk density values value of 3.15 t/m3 was assigned based on available SG measurements. |
|
7. |
Differences may occur in totals due to rounding. |
Exploration Program Recommendations
The following summarizes the work programs recommended by the authors of the 2023 Technical Report for the Committee Bay Project. The Phase 1 program is anticipated to include collection of 15,000 infill detailed till samples and 7,500 m of Diamond drilling along the shear zone sub-parallel to the Three Bluffs deposit. The Phase 1 program is estimated to cost approximately $5 million Details of the recommended Phase I program can be found below.
A Phase 2 exploration program will be drill intensive. An additional 10,000 – 15,000m of diamond drilling should be completed at the Three Bluffs deposit to explore the down dip potential of the limb mineralization as well as tying in the newly identified shear zone hosted mineralization with the ultimate goal of updating the Mineral Resource Estimate. An additional 10,000m of drilling should be allocated to regional targets defined from the Phase 1 program. The Phase 2 program is estimated to cost between $15 and $20 million. Details of the recommended Phase 2 program can be found below.
|
Phase 1 |
||
|
Type |
Details |
Cost Estimate (C$) |
|
Labour |
Staff Wages, Technical and Support Contractors |
350,000 |
|
Assaying |
Sampling and Analytical |
150,000 |
|
Drilling |
Three Bluffs Diamond Drilling (7,500 meters at $220/m) |
1,650,000 |
|
Till Sampling |
Detailed sampling program |
120,000 |
|
Land Management |
Consultants. Assessment Filing, Lease Payments |
250,000 |
|
Community Relations |
Community Tours, Outreach |
30,000 |
|
Information Technology |
Remote site communications and IT |
35,000 |
|
Safety |
Equipment, Training and Supplies |
15,000 |
|
Expediting |
Expediting (Rankin Inlet, Baker Lake, Churchill) |
150,000 |
|
Camp Costs |
Equipment, Maintenance, Food, Supplies |
250,000 |
|
Freight and Transportation |
Freight, Travel, Helicopter, Fixed Wing |
450,000 |
|
Fuel |
1,000,000 |
|
|
General and Administration |
100,000 |
|
|
Sub-total |
4,550,000 |
|
|
Contingency (10%) |
455,000 |
|
|
Total |
5,005,000 |
|
|
Phase 2 |
||
|
Type |
Details |
Cost Estimate (C$) |
|
Labour |
Staff Wages, Technical and Support Contractors |
1,750,000 |
|
Drilling |
20,000 – 25,000 m Diamond Drilling at Three Bluffs and regional |
6,500,000 |
|
Assaying |
Sampling and Analytical |
750,000 |
|
Community Relations |
Community Tours, Outreach |
50,000 |
|
Information Technology |
Remote site communications and IT |
150,000 |
|
Safety |
Equipment, Training and Supplies |
75,000 |
|
Expediting |
Expediting (Rankin Inlet, Baker Lake, Churchill) |
550,000 |
|
Camp Costs |
Equipment, Maintenance, Food, Supplies |
1,250,000 |
|
Freight and Transportation |
Freight, Travel, Helicopter, Fixed Wing |
1,950,000 |
|
Fuel |
2,750,000 |
|
|
General and Administration |
400,000 |
|
|
Sub-total |
16,175,000 |
|
|
Contingency (10%) |
1,617,500 |
|
|
Total |
17,792,500 |
|
Table 11: CommitteeBay Future Drilling Budget
2015 through 2021 Committee Bay Exploration by Fury
Since acquiring the Project, Fury Gold has completed a total of 47,194.47 m of RAB drilling in 271 drill holes as well as 14,006.28 m of diamond drilling as part of the Phase 1 recommendations detailed above. In addition to the drilling extensive regional and infill till geochemical campaigns, ground and airborne geophysical surveying as well as aerial drone surveying have been undertaken. The Company has incurred approximately $60M in expenditures exploring the Project. The Company views that the results from this exploration further support conclusions drawn in the Committee Bay Report and do not represent a material change to the Committee Bay Project. The Company intends to continue its exploration in accordance with the Phase 2 recommendations with the continued testing of regional drill targets and expansion drilling at the Three Bluffs deposit.
The Company did not undertake an exploration program at Committee Bay in 2022 in order to focus available resources on the exploration program in Quebec.
During 2018, the Company drilled approximately 10,000 m across several targets in the vicinity of the Three Bluffs deposit but away from known mineralization. Summarized results from this program are highlighted as follows:
|
● |
Aiviq - 16 core and 7 RAB holes - The majority of the core drill holes intersected 20 - 40 meter widths of intense quartz veining and sulphidized banded iron formations. Results from the Aiviq core drill program include highlights of 13.5 m of 1.54 g/t gold (including 6 m of 3.3 g/t gold) 4.5 m of 2.93/t Au, and 1.5 m of 8.95/t Au; |
|
● |
Kalulik - 8 RAB holes - The 2018 drill program at Kalulik identified two separate gold-bearing hydrothermal systems, 4 km apart, that intersected broad zones of low-grade mineralization over 10 - 20 meter widths within sulphidized banded iron formations and associated quartz veining. These results include 21.34 m at 0.4 g/t gold and 16.76 m at 0.45 g/t gold; and, |
|
● |
Aarluk - 7 RAB holes - At the Aarluk prospect the best intercept was 3.05 m of 3.39 g/t gold, which was encountered in a weakly sulphidized banded iron formation. |
During 2019, the Company followed up on the results from its 2018 program by completing the following:
|
● |
Machine Learning - A total of twelve new targets were generated through unbiased processing of existing exploration data. Two of the targets overlapped with the Company’s geologist derived targets adjacent to the Aiviq and Kalulik discoveries; |
|
● |
Drill Program - A 2,700m diamond drill program at the Committee Bay Project targeted a combination of both machine learning and traditional geologist generated targets and drilled a new gold-bearing system along the regional fault zone that hosts the Aiviq and Kalulik systems. These results include 30 m of 0.67 g/t gold, including 1.5m of 5.03 g/t gold; and |
|
● |
IP Survey - A 27 line - kilometer induced polarization survey was conducted to identify both chargeability and conductivity targets along the Aiviq-Shamrock corridor. |
The Company completed 2,587m of diamond drilling during a six-week field program in the third quarter of 2021. The drilling was focused on expanding the defined high-grade mineralization at the Raven prospect and testing the potential mineralization below the current resource at the Three Bluffs deposit.
Raven Prospect
The Raven prospect is located in the southwest third of the Committee Bay Gold Belt, approximately 50 km west of the Three Bluffs deposit. The prospect is situated along an 8km long shear zone where defined gold mineralization is strongly associated with arsenopyrite within sheared and altered gabbros as well as within quartz veins marking the contact between the gabbro and metasediments over a known strike length of approximately 1.2km. There have been 207 rock samples historically taken over the defined area of mineralization, with 30 samples returning values greater than 5 g/t gold with a peak value of 143 g/t gold. Importantly, only 1.2km of the 8km shear zone has been systematically explored to date.
The prospect has a total of nine historical drill holes totaling 1,670m with intercepts including 5.49m of 12.6 g/t gold, 2.84m of 31.1 g/t gold, and 5.38m of 2.99 g/t gold over a drilled strike length of 400m. Historical drilling at the prospect has defined a high-grade body of mineralization approximately 250m in length, with a 30-degree plunge to the east that is open along strike and down dip. Highlights include drill intercepts of 9.18 g/t gold (Au) over 1.5 metres (m) and 7.30 g/t Au over 1.0m in drill hole 21RV-012 and 0.88 g/t Au over 8.00m in drill hole 21RV-011 as well as rock grab results of up to 32.90 g/t Au from a newly identified gold mineralized outcrop 150m to the south of the Raven structure that was drilled in this program.
The reported intercepts have extended mineralization 160m down dip and 70m along strike from historical drilling at Raven. These results paired with the identification of a previously untested gold mineralized structure clearly indicate the significance of the Raven structure and shear zones in general, as exploration targets along the belt. Additional till sampling was completed at the Raven prospect to explore the entire length of the 8km shear zone to define new targets. The sampling has identified high-grade gold mineralization 150m south of the main Raven showing along an undrilled structure at the edge of an 8km long regional shear zone. Seven rock grab samples from outcrop returned results above 10 g/t Au with a peak of 32.9 g/t Au. Gold and arsenic in till now define a coherent 1,400m by 500m anomaly at Raven.
Three Bluffs Deposit
The Three Bluffs deposit contains a high-grade resource defined by 525,000oz at 7.85 g/t gold in the indicated category and 720,000oz at 7.64 g/t gold in the inferred category. The deposit is characterized by gold mineralization hosted within a folded, silicified, and sulphidized banded iron formation. The anticline that defines the deposit has a strike length of approximately 4km and has been drilled from 150m to 650m vertical depth and is open down dip. High-grade mineralization at the deposit is associated with high conductivity responses due to the intense sulphidation of the banded iron formation as evidenced in the hinge zone of the anticline.
Fury Gold's primary target for 2021 at the Three Bluffs deposit was a conductive body that measures 600m by 200m at a vertical depth of between 300m and 500m. The target is down dip from high grade mineralization within the limbs of the anticline and is offsetting the following intersections: 5m of 40.6 g/t gold, 5.3m of 29.03 g/t gold, 11m of 16.23 g/t gold, 5m of 15.2 g/t gold, 2m of 21.81 g/t gold, and 2m of 19.38 g/t gold. The Company completed a single drill hole that intersected 10.0m of 13.93 g/t Au, 3.0m of 18.67 g/t Au and 1.0m of 23.2 g/t Au. These intercepts are associated with a deformation zone within a meta-sediment unit that is underexplored at Three Bluffs.
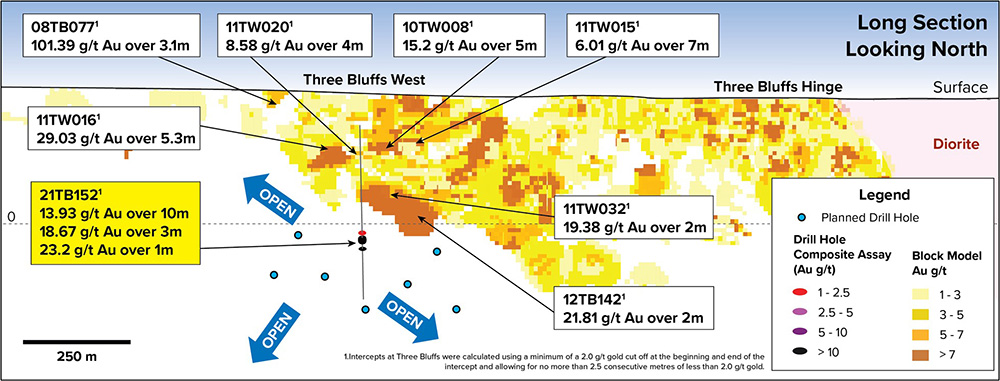
Graphic 8: Three Bluffs Drilling - Long Section
2022 and 2023 Committee Bay Project Exploration Program
The Company did not undertake an exploration program in 2022 and 2023 in order to focus all resources on the Quebec programs. However all claims were and are maintained in good standing.
2024 Committee Bay Project Exploration Program
The 2024 exploration program prioritized follow-up and infill sampling of highly anomalous regional gold-in-till samples with unidentified sources. The exploration model focused on regional shear zones proximal to favourable lithologies such as iron formation and ultramafic lithologies.
Three drill targets have now been determined:
|
1. |
Three Bluffs Shear, where drilling in 2021 intercepted 13.93 g/t Au over 10 metres (m) (see news release dated December 1, 2021); |
|
2. |
Raven Shear where 7 rock samples have averaged 16.12 g/t gold; and |
|
3. |
Burro West where a 300 by 300 m discrete >90th percentile gold in till anomaly has been defined with a peak value of 50 ppb gold. |
The program resulted in the collection of 546 infill till samples from two detailed grids, Burro West and Aarluk East, and 69 rock samples from 5 targets.
The 2024 mapping and rock sampling focused on shear zones proximal to and sub-parallel to favourable lithologies for gold mineralization within the Committee Bay Greenstone Belt with samples being collected at Three Bluffs, Raven, Burro, Aarluk East and Aarluk West.
The mapping and rock sampling at Three Bluffs was able to confirm the continuity of the interpreted shear zone that is sub-parallel to the Three Bluffs iron formation to the east of the reported 2021 intercept of 13.93 g/t gold over 10 m from drill hole 21TB152 (see news release dated December 1st, 2021). The reported 2021 intercept was a 120 m step out from the defined high-grade Three Bluffs gold deposit which on its own demonstrates the potential to meaningfully expand the known resource. The mapped continuation of this sub-parallel shear zone to the east trends into an area where there is no historic drilling providing an excellent near deposit drill target.
At Raven rock sampling and mapping has identified a mineralized sub parallel shear zone to the south of the main Raven showing where the average grade from seven rock samples collected is 16.12 g/t gold. The extensions along strike of the Raven south shear zone are obscured by glacial till deposits however, the average grade from outcrop sampling and prevalence of visible gold observed in the limited outcrop are encouraging and warrant drilling.
Infill till sampling at the Burro West target has identified a robust multi point +90th percentile approximately 300 x 300 m gold in till anomaly. The Burro West anomaly is spatially associated with a break in the regional magnetics data which is interpreted as a sheared contact between mafic volcanics and ultramafic lithologies. Additionally, the highest gold value returned from all the 2024 infill till samples is located at the SW corner of the Burro West grid and remains open.
The Aarluk East grid returned several intriguing moderate isolated gold in till anomalies associated with interpreted regional structures that require additional mapping work to potentially advance to the drill ready stage.
2025 Committee Bay Project Exploration Program
The 2025 exploration program included six diamond drill holes totaling approximately 2,778 meters. Four of these holes, covering 2,041 meters, targeted the expansion of the Three Bluffs Shear Zone and incepted gold mineralization over 315 meters of strike, with mineralized widths up to 19.5 meters. Notably, one interval included 5.73 grams per tonne gold over 3.0 meters within a broader 19.5-meter zone averaging 1.18 g/t gold The other two holes, totalling 737 meters, focused on the southern contact of the Raven Shear Zone, an 8-kilometer-long structure with historical drill intercepts of up to 12.60 g/t gold over 5.49 meters and 31.1 g/t gold across 2.8 meters, with gold mineralization mapped over 1.4 km. One of these, Hole 25RV015, a 330-meter step-out, intersected 4.59 g/t gold over 1.5 meters.
Three Bluffs resource estimations were completed by APEX Geoscience Ltd. (“APEX”) (see the Technical Report on the Committee Bay Project, Nunavut Territory, Canada, dated September 11, 2023, and filed under Fury’s SEDAR+ profile). It supersedes all previous Committee Bay technical reports.
The Company expects to incur approximately $160,000 in annual mineral claims holding costs in 2026, in order to keep the property in good standing. The same amount was paid during the year ended December 31, 2025, in respect of these mineral claims.
Éléonore South Property, Québec, Canada
2024 Technical Report
The following disclosure relating to the Éléonore South project is based on information derived from the technical report on the Éléonore South Project entitled “Technical Report on the Éléonore South Project, Quebec, Canada” prepared by Mrs. Valerie Doyon, the Company’s Senior Project Geologist with an effective date of March 31, 2024 (the “Éléonore South Technical Report”) Reference should be made to the full text of the Éléonore South Technical Report, which is available electronically on the SEDAR+ website at www.sedarplus.ca under our SEDAR profile, filed on March 31, 2025, as the Éléonore South Project contains additional assumptions, qualifications, references, reliance and procedures which are not fully described herein. Mrs. Doyon is a technically “qualified person” as defined by NI 43-101. All information of a scientific or technical nature contained below and provided after the date of the Éléonore South Report has been reviewed and approved by Mrs. Valerie Doyon. The Éléonore South Project was only determined to be a material property in 2025.
Location and Size
The 100% indirectly owned Éléonore South Project is an exploration stage project comprised of 282 claims, totaling 14,760 hectares (ha). Located in 1:50,000 scale NTS map sheets 33B12 and 33C09, approximately 200 km east of the Cree community of Wemindji, 330 km northwest of the town of Chibougamau and 800 km north of Montreal. The property is accessible, year-round, by either the James Bay Highway or Route du Nord and is located 100 km north of Nemaska, serviced by commercial flights twice per week. The centre of the property is located at approximately 75.98 degrees longitude west and 52.58 degrees latitude north.
The Éléonore South project is located north of the 52nd parallel (52ºN) and as such is subject to the provisions of the James Bay and Northern Quebec Agreement (1975), and the Paix des Braves Agreement (2002). The Project falls within the Eeyou Istchee Territory and straddles the boundary between the Cree Nations of Wemindji and Eastmain, including trap lines held by Angus Mayappo and Roderick Mayappo (tallyman).
The Éléonore South project is located on Category III lands, as established under the James Bay and Northern Quebec Agreement. Category III lands are administered by the province of Quebec, and they do not have any substantial restrictions on mineral exploration. A notice of work must be forwarded to the Wemindji and Eastmain Communities and the tallyman prior to initiating exploration activities. The Project straddles the traditional territories of the Cree Nations of Wemindji and Eastmain (Figure 1) and lies on traplines VC-29, VC-35 and VC-36.
The figure below presents property location and claims comprising the Éléonore South Project:
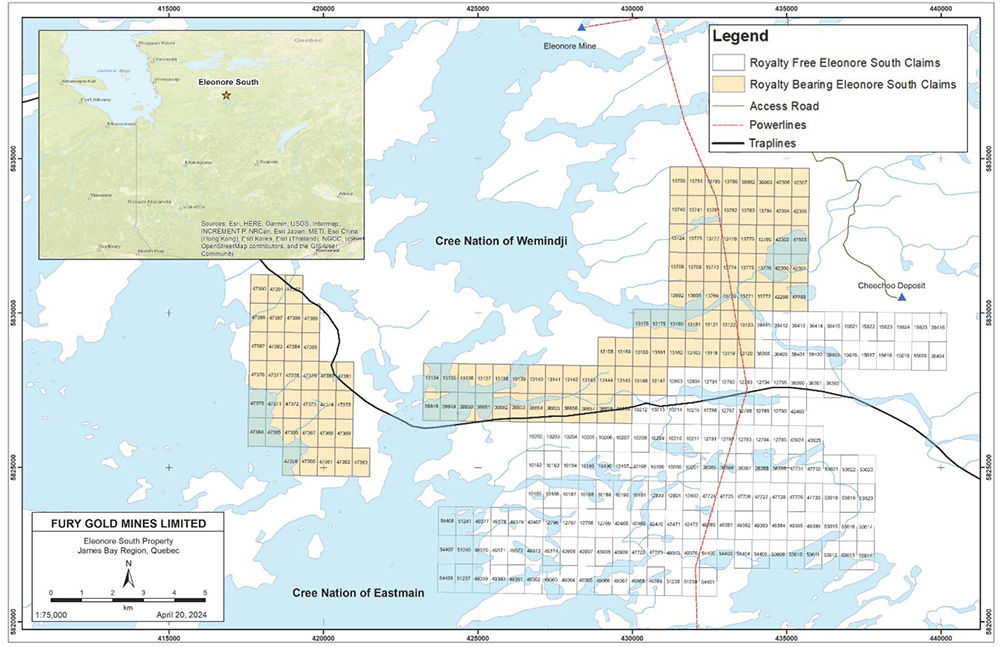
Graphic 9: Éléonore South Project Location and Claims
The Éléonore South property is strategically located in an area of prolific gold mineralization within the Eeyou Istchee James Bay gold camp and is locally defined by Newmont’s Éléonore mine and Sirios Resources’ Cheechoo deposit. The property has been explored over the last 12 years by the joint venture focused on the extension of the Cheechoo deposit mineralization within the portion of the Cheechoo Tonalite on the joint venture ground. Approximately 27,000 m of drilling in 172 drill holes, covering only a small proportion of the property at the Moni and JT prospects has been completed. Notable drill intercepts include 53.25 m of 4.22 g/t gold (Au); 6.0 m of 49.50 g/t Au including 1.0 m of 294 g/t Au and 23.8 m of 3.08 g/t Au including 1.5 m of 27.80 g/t Au.
In December 2020, Fury Gold announced the recognition of a large-scale gold in till anomaly on the Éléonore South property through a review of historical datasets. This target had not been drill tested. In September 2021 the ESJV initiated a field program designed to refine the broad geochemical anomaly into discrete targets for further follow up and eventual drill testing. Additionally, a regional survey was completed on the southern third of the property where no historical systematic sampling had been completed.
During the third quarter of 2022 an orientation biogeochemical sampling survey was completed over a buried fold hinge target interpreted to be hosted within the same sedimentary rock package as Newmont's Éléonore mine. A total of 641 biogeochemical samples were collected. In addition to the biogeochemical orientation survey the Company completed a rock sampling program within the nine discrete gold in soil anomalies identified from the 2021 field work. The nine discrete gold in till anomalies are centered on an east-west structural corridor that separates intrusives to the south and sediments to the north. The importance of this new structural framework is that the newly defined gold in till anomalies are located along deep-rooted structures clearly visible in the geophysical data. Based on the elemental associations observed of gold with arsenic, bismuth and tungsten, in both the historical and infill sampling the most likely style of mineralization to be encountered in the nine targets will be the Cheechoo style observed at the JT and Moni showings.
Access, Climate, Local Resources, Infrastructure and Physiography
The Éléonore South project is located in the Eeyou Istchee James Bay Territory of Northern Quebec, approximately 200 km east of the Cree community of Wemindji, 330 km northwest of the town of Chibougamau and 800 km north of Montreal (NTS Map sheet 33B12 and 33C09). The Project is 15 km southeast of Newmont Corporation’s Éléonore Mine (Figure 1). The Éléonore South project s accessible, year-round, by either the James Bay Highway or Route du Nord and is located 100 km north of Nemaska, serviced by commercial flights twice per week.
The Éléonore South project is accessible, year-round through a combination of the Billy Diamond (James Bay) Highway, the Route du Nord and Hydro-Quebec’s Sarcelle road. Sirios Resources has constructed a resource access road which leads to the Cheechoo Deposit within the Cheechoo Tonalite along the central east portion of the Property. Éléonore South is located 100 km north of Nemaska, serviced by commercial flights twice per week.
Fury, through its Eastmain subsidiary, maintains a 20-person camp to support exploration activities at the Éléonore South project. The hydroelectric power line that feeds Newmont’s Éléonore Mine transects the Éléonore South property (Figure 1). Newmont’s Éléonore mine complex, including a private airport are located 15 km to the northwest. Necessities such as skilled labour and specialized equipment are sourced from Val-d’Or or Chibougamau. Many services are now available through numerous Cree owned businesses and partnerships in Wemindji, Eastmain and Nemaska.
The Éléonore South project is located within the Canadian Shield and is characterized by many lakes, swamps, rivers, and low-lying terrain. The Property is bordered to the west by the Opinaca Reservoir. The Gipouloux River flows westward through the northern portion of the Property. The Éléonore South project is located in the boreal forest where forest fires are common. Vegetation is typical of taiga, including areas dominated by sparse black spruce, birch, and poplar forests, in addition to large areas of peat bog devoid of trees.
Overburden is typically 3 to 4 m thick, with the exception of isolated areas where overburden thickness can reach 20 m. Numerous glacial eskers often reaching tens of km in length can be seen of satellite images. Rock outcrops are sparse due to the abundance of quaternary deposits and swamps. The topography of the area is subdued and characterized dominantly by lowlands, with few hills that attain elevations up to 300 m above sea level.
Geology, Mineralization and Deposit Types
The Éléonore South property is in the northeastern part of the Archean Superior Province (4.3-2.6 Ga; Percival et al., 2012), in a region comprising both the La Grande and Opinaca Subprovinces. Both subprovinces were largely constructed and metamorphosed during a series of micro-continent collisions formerly known as the “Kenoran Orogeny” (ca. 2,720-2,660 Ma; Card, 1990; Percival et al., 2012). The property is entirely enclosed in the southwestern part of the La Grande Subprovince known as the Eastmain River domain at proximity of the boundary with the Opinaca Subprovince. This proximity with the Opinaca boundary is considered highly prospective for various types of gold mineralization along both north and south portions of the contact exemplified by the Éléonore and Eastmain mines, and several exploration projects such as Corvet Est, Poste Lemoyne and La Grande Sud.
The Éléonore South property is characterized by the widespread presence of metasedimentary rocks and felsic intrusions. The northern part of the main block consists almost exclusively of the LGSP Low Formation (which has in the past been attributed to the OPSP). The Low Formation comprises essentially variably recrystallized tubiditic biotite meta-wacke along with minor aluminous porphyroblasts bearing meta-pelite bands, conglomerates and iron formations. Its deposition is poorly constrained due to a complex history resulting in apparently conflicting dates. The Ell Lake diorite (2,706±2 Ma, Fontaine et al., 2017) intrudes the sediments, setting a local minimum age for consolidation, while sedimentation is locally thought to have kept going well after 2,700 Ma (Bandyayera et al., 2010; Ravenelle, 2013). However, some parts were deposited as early as shortly after 2,714 Ma. (Bandyayera et al., 2010) The sediments were therefore likely deposited in a tectonically active basin with magma intruding barely consolidated sedimentary rocks, while some parts were still sedimenting. Proximity and similarity in composition and chronology suggest that the Low Formation could represent a more proximal lower grade extension of the Laguiche basin (OPSP).
Two distinct styles of mineralization have been identified to date; structurally controlled quartz veins hosted within sedimentary rocks similar to the high-grade mineralization observed at the Éléonore Mine; and intrusion-related disseminated gold mineralization similar to that seen at the low-grade bulk tonnage Cheechoo deposit with higher grade potential as seen at the JT and Moni Prospects on the project.
Property History
Regional exploration in the James Bay region of Québec began in the 1970s in anticipation of flooding related to the James Bay hydroelectric development. Early work by the Société de Développement de la Baie James included regional geological mapping, lake sediment surveys, and airborne geophysical surveys to evaluate mineral potential. Additional geological compilations and reconnaissance mapping programs were conducted by the Québec government through the Ministère des Ressources naturelles et de la Faune between the 1970s and early 2000s, establishing the regional geological framework of the area.
In 2003, Azimut Exploration Inc. acquired the Opinaca C property through map designation, consisting of 99 claims. Following the discovery of the nearby Roberto gold deposit in 2004 by Virginia Gold Mines, located approximately 15 km north of the project, Azimut expanded its land position to 166 claims.
In 2005, Azimut entered into an option agreement with Eastmain Resources Inc. whereby Eastmain could earn a 50% interest in the property through exploration expenditures and staged payments. Initial exploration programs included airborne VTEM electromagnetic and magnetic surveys, regional soil geochemical sampling, prospecting, and geological mapping. These programs identified significant gold–arsenic soil anomalies and alteration assemblages comparable to those associated with the Roberto deposit.
In 2006, Azimut, Eastmain, and Goldcorp entered into a three-party joint venture agreement and consolidated their respective claims to form the Éléonore South property, comprising 282 claims. Eastmain was appointed operator of the project. Extensive exploration programs were completed during 2006, including grid cutting, regional soil sampling, trenching, prospecting, and airborne geophysical surveys. Several kilometre-scale gold–arsenic anomalies were identified, and trenching confirmed the presence of gold mineralization at several locations including the JT and WB prospects.
Between 2007 and 2010, exploration activities focused on geophysical surveys, trenching, and diamond drilling. Induced polarization surveys identified conductive structures interpreted as major shear zones. Initial drilling programs intersected multiple zones of anomalous gold mineralization at the JT and WB prospects, including intervals exceeding 1 g/t Au and locally higher-grade values. These results confirmed the presence of structurally controlled gold mineralization associated with metasedimentary host rocks.
Exploration activities continued intermittently between 2012 and 2016 and included airborne LiDAR surveys and prospecting programs designed to refine structural interpretations and evaluate geochemical anomalies. In 2016, Azimut identified the Moni Prospect east of the JT showing during a prospecting program that returned high-grade gold values in pegmatite and tonalite units. Subsequent drilling campaigns completed in 2016 and 2017 confirmed widespread gold mineralization within the Moni area and along the extension of the nearby Cheechoo deposit.
In 2018, additional trenching, till sampling, and diamond drilling programs were conducted to further evaluate the Moni Prospect, the Cheechoo southwest extension, and other geophysical and geochemical targets across the property. Drilling returned numerous gold-bearing intervals, including locally high-grade intersections.
To date, exploration programs have included airborne and ground geophysics, soil and till geochemical surveys, geological mapping, trenching, and extensive diamond drilling. A total of approximately 37,816 m of drilling in 164 drill holes has been completed on the property. Drilling has defined two principal mineralized trends along the Moni–JT corridor, including the Moni zone (approximately 2,000 m by 750 m) and the JT zone (approximately 1,200 m by 500 m). Mineralization is interpreted to represent an intrusion-related gold system comparable to the nearby Cheechoo deposit and is characterized by broad zones of lower-grade mineralization hosting locally higher-grade quartz vein stockworks.
Royalties
116 of the claims of the Éléonore South project are subject to an escalating Net Smelter Royalty (NSR) held by Osisko Royalties (Osisko Royalty). The Osisko Royalty is tied to overall production from these claims as well as from the Éléonore Mine property claims held by Newmont Corporation. The royalty amounts to 2% on the first 3 Moz of gold production and tops out at 3.5% after 8 Moz Au production. The royalty increases by 10% for gold prices above US$550/oz Au – again topping out at 3.5%. The remaining 166 claims are free of any royalty.
Sampling, Analyses and Data Verification
Method of analysis varied since the beginning of the project. QC protocols were established in 2008 and carried through with minor refinements.
Quality Control (QC) samples were introduced into the sample stream at a rate of 4% for both blank samples and CRM samples. Fury increases this rate to 5% and add field duplicates in the form of quarter sawn core samples introduced into the sample stream at a rate of 1 in 50 samples.
Core recovery is generally very good to excellent, allowing for representative samples to be taken and accurate analyses to be performed. Half-core samples, 0.5 m to 1.5 m long, were taken. The core was sampled along the entire length of each hole. Samples intervals were recorded with red grease pencil on the drill core during logging. Each sample was assigned a laboratory sample number for analytical purposes.
The sample is split along the cutting line and starting and stopping at the marked red arrows on the core. Place one half of the core in the bag and place the other half back in the core box with the cut face upwards. He/she is to place the sample end pieces (the core marked with red arrows) cut face side up, with the arrows pointing in the appropriate direction.
Samples with native gold were identified. This was to make sure the core cutting blade was cleaned before and after each of these mineralized samples by cutting through a concrete block.
Split core samples were placed in fiber rice bags in batches and labelled for shipment to ALS laboratories (ISO/IEC 17025:2017 and ISO 9001:2015 accredited facility) for preparation and analysis. These sacks were sealed with cable ties and fiber tape and shipped by commercial transport companies directly to the lab. A control file, the laboratory sample dispatch form, includes the sample-bag numbers in each shipment. The laboratory sample dispatch form accompanies the sample shipment and is used to control and monitor the shipment. The lab sends a confirmation email with detail of samples received upon delivery.
In the opinion of The Author, the logging, sampling, assaying, and chain of custody protocols practiced through the history of the Project meet or exceed industry standards. The drill programs have been configured and carried out in a manner that is appropriate for the geometry of the known mineralization. Drill holes are oriented perpendicular to strike and aimed to intersect the zones at an angle generally greater than 45°. As such, the samples should be representative of the mineralization as it is presently known.
The Author has reviewed the QC reports and files, as well as the laboratory procedures undertaken and conclude that the QC program for the Project is sufficient to support the current level of exploration. QC sample failures were dealt with on a case-by-case basis and were documented with commentary in the Dispatch Returns table within the database.
The Author has been involved in all exploration programs on the Project since 2020 and was last on-site August 2024.
Comprehensive data verification was performed by Fury Gold Mines. These included checks against original data sources, standard database checks such as from/to errors and basic visual checks for discrepancies with respect to topography and drillhole deviations.
The Author has been personally involved in the integration and merging of the historical drill data into the current database. This work included relogging of historical holes to provide consistency of logging codes across all generations of drilling, as well as spot checks of drill core versus drill logs to verify the geologic model. During this process sample intervals were verified. Lastly, the assay database was compared to original assay certificates. No errors were found within the geologic or assay databases.
Mineral Processing and Metallurgical Testing
There has been no metallurgical testing completed on the Éléonore South project.
Mineral Resource Estimates
There are no Mineral Resource Estimates for the Éléonore South Project.
2024 Éléonore South Exploration Program
Biochemical Sampling
A biogeochemical sampling survey designed to target an interpreted fold nose within the Low Formation sediments in an area where conventional soil or till sampling was not possible due to the ground conditions was completed in the summer of 2024. The targeted area exhibited similar geological, geophysical, and structural characteristics to those present at the nearby Éléonore Mine. Six priority drill targets across over 3 km of prospective folded sedimentary stratigraphy have been identified. These six targets encompass multi point gold anomalies above the 90th percentile of the data and correlate with moderate pathfinder elemental anomalies, most notably arsenic which is associated with gold mineralization at the Éléonore Mine.
Drilling
In winter 2024, Fury carried out a drilling campaign to focus on Moni Trend structural corridors and following up on previous drill intercepts of 53.25 m of 4.22 g/t Au; 6.2 m of 14.7 g/t Au and 23.8 m of 3.08 g/t Au (figure 6). In total, 2,331 m of were drilled in 7 holes. A total of 1,704 core samples were sent to the lab to be tested for gold. The drilling campaign work area was 2,500 m east-west by 800 m north-south. Most holes were drilled at 320 degrees azimuth and one at 140 degrees and one through north. All holes dip at -50 degrees.
The holes intersected broad gold zone with local gold peak value. The hole 24ES-161 intersected 0.44 g/t gold over 137.5 m (Table 13) including 9.7 g/t over 1.5 and 8.33 g/t gold over 8.33 g/t (Table 14). The hole 24ES-162 intersected 0.5 g/t gold over 115.5 m. The 2024 Fury drilling campaign show the continuity at depth of the mineralized zone in the Cheechoo Tonalite.
The Éléonore South project is an early-stage exploration project with limited previous drilling and sampling completed. The drilling completed to date has confirmed the presence of a Reduced Intrusion Related Gold System (RIRGS) within the southern portion of the Cheechoo Tonalite. Additionally, surface work completed by Fury has identified several gold in soil anomalies and biogeochemical anomalies which all require additional follow up work.
Éléonore South Future Exploration
Future exploration efforts should focus on the high-grade gold potential of the Cheechoo tonalite while also continuing to advance the identified gold in soil and biogeochemical anomalies to the drill ready stage. The recommended Phase 1 work program consists of a 5,000 – 6,000 m drilling program targeting the robust Eleonore style gold targets identified through the biogeochemical sampling program. The Phase 1 program is estimated to cost approximately $3.1 million, shown in the table below.
The Phase 2 exploration program will be drill intensive. An additional 10,000 – 20,000 m of diamond and reverse circulation drilling should be completed to follow up on the results from the phase 1 program as well as within the Cheechoo Tonalite to determine if sufficient continuity of gold mineralization is present to prepare a maiden mineral resource estimate. The Phase 2 program is estimated to cost between $7.5 and $10 million, as shown below.
|
Phase 1 |
||
|
Type |
Details |
Cost Estimate (C$) |
|
Labour |
Staff Wages, Technical and Support Contractors |
500,000 |
|
Assaying |
Sampling and Analytical |
400,000 |
|
Drilling |
Diamond Drilling (5,000m at $150/m) |
750,000 |
|
Land Management |
Consultants. Assessment Filing, Claim maintenance |
5,000 |
|
Community Relations |
Community Tours, Outreach |
10,000 |
|
Information Technology |
Remote site communications and IT |
5,000 |
|
Safety |
Equipment, Training and Supplies |
5,000 |
|
Expediting |
Expediting |
7,500 |
|
Camp Costs |
Equipment, Maintenance, Food, Supplies |
200,000 |
|
Freight and Transportation |
Freight, Travel, Helicopter |
600,000 |
|
Fuel |
250,000 |
|
|
General and Administration |
100,000 |
|
|
Sub-total |
2,873,500 |
|
|
Contingency (10%) |
287,350 |
|
|
Total |
3,121,250 |
|
|
Phase 2 |
||
|
Type |
Details |
Cost Estimate (C$) |
|
Labour |
Staff Wages, Technical and Support Contractors |
1,250,000 |
|
Drilling |
Diamond Drilling (10,000 - 20,000m) |
2,000,000 |
|
Assaying |
Sampling and Analytical |
1,000,000 |
|
Community Relations |
Community Tours, Outreach |
25,000 |
|
Information Technology |
Remote site communications and IT |
10,000 |
|
Safety |
Equipment, Training and Supplies |
125,000 |
|
Expediting |
Expediting |
150,000 |
|
Camp Costs |
Equipment, Maintenance, Food, Supplies |
550,000 |
|
Freight and Transportation |
Fright, Travel, Helicopter |
1,500,000 |
|
Fuel |
600,000 |
|
|
General and Administration |
250,000 |
|
|
Sub-total |
7,460,000 |
|
|
Contingency (10%) |
746,500 |
|
|
Total |
8,206,000 |
|
Table 12: Éléonore South Future Exploration Budget
The Company expects to incur approximately $35,000 annually in project maintenance costs, including certain mineral claims payments, in order to keep the properties in good standing in 2025.
2024 Éléonore South Project Exploration
The Spring 2024 drilling program resulted in 2,331.4 metres (m) completed in seven diamond drill holes testing 2.3 kilometres (km) of strike along the JT – Moni Trend. The drilling targeted 100 to 125 m downdip extensions from historical drilling. All seven drill holes intercepted anomalous gold mineralization, including 137.5 m of 0.44 g/t gold and 18.7 m of 0.97 g/t from drill hole 24ES-161, 115.5 m of 0.50 g/t gold from drill hole 24ES-162 and, 28.0 m of 0.47 g/t gold from drill hole 24ES-160.
During the summer of 2024 the Company carried out a limited prospecting program targeting multiple lepidolite and spodumene bearing pegmatite outcrops within the western claim block at the Éléonore South project. The outcrop sampling program targeted the historical Fliszar showing lepidolite bearing pegmatite as well as new rock exposures over an area of approximately 1000 x 500 metres (m) resulting in the collection of 34 samples. Seven samples returned high-grade values above 1.75% lithium oxide (Li2O) with a peak value of 4.67% Li2O.
The Company finalized drill targeting after completing a surficial geochemical survey at the Éléonore South project. Six priority drill targets across over 3 kilometres (km) of prospective folded sedimentary stratigraphy have been identified. These six targets encompass multi point gold anomalies above the 90th percentile of the data and correlate with moderate pathfinder elemental anomalies, most notably arsenic, which is associated with gold mineralization at the Éléonore Mine.
On February 3, 2025, the Company announced the commencement of a diamond drilling program on the greenfield exploration Éléonore South gold project located in the Eeyou Istchee Territory in the James Bay region of Northern Quebec. Drilling targeted robust multi-faceted geological, geophysical, and geochemical gold anomalies within the same sedimentary rock package that hosts the Éléonore Mine. The fully funded first phase drilling campaign comprised approximately 4,000 – 6,000 metres (m) targeting an interpreted fold nose within the Low Formation sediments. Within the prospective folded stratigraphy were six undrilled priority targets spanning over 3 kilometres (km) of strike length that had been identified through a combination of biogeochemical sampling and interpretation of magnetics and electromagnetics survey data. The first phase of drilling was focused within a northwest-southeast structural corridor where a strong correlation between anomalous gold, stratigraphy, and structure had been identified. The drill targets occurred in a structurally complex setting with little to no outcrop exposure and the targeting model evolved with each hole drilled. The Company planned to complete approximately 15 of the 77 permitted drill holes as part of the first phase of drilling and guided additional drilling based on the results and observations from this phase.
On June 16, 2025, the Company announced the results of the Spring 2025 diamond drilling program. The first phase of drilling targeted axial planar structures within the core of a fold within the prospective Low Formation sediments. The program comprised 12 diamond drill holes totaling approximately 4,930 m of drilling within a 2x3 km target area. Four of the twelve drill holes intercepted low-grade gold mineralization across widths of up to 5 m with up to five zones in a single drill hole (25ES-170). The low-grade gold mineralization intercepted lies within an east-west, steeply southerly dipping structural corridor with quartz veining and associated strong, broad zones of carbonate + silica + tourmaline +/- diopside alteration. The structural corridor is interpreted to be an axial planar feature related to broad regional scale folding within the favourable Low Formation sedimentary package. Gold is associated with bismuth and tellurium within altered bedded wackes and argillites of the Low Formation.
The first phase of drilling did not intercept arsenopyrite, which is a primary indicator of gold mineralization at the Éléonore Mine. Moderate arsenic anomalism was used in the targeting of the initial drilling in order to filter out the high background arsenic in the regional sedimentary package. Future drilling will target moderate to high arsenic anomalism with associated gold anomalism within the identified structural corridor in order to filter out the right concentration of arsenic associated with mineralization and not primary arsenic associated with lithology.
In addition to the Éléonore style biogeochemical targets, several gold in-till anomalies remain undrilled throughout the project. These gold in-till anomalies have similar geological and geochemical characteristics to the Cheechoo style of mineralization.
The Company expects to incur approximately $35 annually in project maintenance costs, including certain mineral claims payments, in order to keep the properties in good standing in 2025. No additional work is planned for 2025. The Company is reviewing targets and priorities for 2026.
Sakami Property, Québec, Canada
2025 Technical Report
Disclosure herein is substantially derived from a Sakami Project Technical Report entitled Initial Mineral Resource Estimate for the Sakami Project, Eeyou Istchee Territory, James Bay Region of Quebec, Canada” which is dated January 21, 2026, has an effective date of November 11, 2025 authored by Olivier Vadnai-Leblanc, P. Geo., Geologist with SGS Geological Services.
Property Description, Location
The Sakami Project was acquired in 2025 and is located in the Eeyou Istchee James Bay Territory of Northern Quebec, approximately 130 km southeast of the closest town of Radisson and 600 km north of Matagami. It is located in the James Bay gold mining camp where the Éléonore gold mine is operated by Dhilmar. The Property consists of several peninsulas and islands in the centre of the Sakami Reservoir.
The approximate centre of the Sakami Project is located at Universal Transverse Mercator (UTM) coordinates 5,895,800 m N and 375,800 m E (NAD 83, Zone 18N). The approximate UTM coordinates for the centre of the currently defined Sakami deposit are 5,894,000 m N and 374,500 m E. It is located within National Topographic System (NTS) 1:50,000 scale map-areas; 33F02, 33F03, and 33F07. The Sakami Project consists of a block of 281 contiguous map-designated claims covering 14,250 ha, (100% owned by Fury Gold Mines Limited
The claims are in good standing as of the effective date of this AIF. The technical report lists all the claims along with the relevant tenure information, including their designation number, registration and expiry dates, area, assessment work credits and work requirements for renewal. The boundaries of the claims have not been legally surveyed. The mineral rights exclude surface rights, which belong to the Quebec government.
Geology and Mineralization
The Sakami Project straddles the contact between the La Grande and Opinaca subprovinces (Figure 7-1). In 1998 and 1999, several gold showings were discovered by Matamec on the western shore of Sakami Reservoir (Lamarche and Lavallée, 1998; Beauregard and Gaudreault, 1999) within the contact zone between the volcanic rocks of the Yasinski Group (La Grande Subprovince) and the sedimentary rocks of the Laguiche Group (Opinaca Subprovince).
Location of the Project with Regional Geology
Local Geology

Graphic 10: Sakami Local Geology
Several mineralized areas hosting variable gold grades are known to exist throughout the Sakami Project and have been the focus of exploration work.
La Pointe Deposit and La Pointe Extension
Exploration work carried out to date on the La Pointe deposit and the recent discovery of the La Pointe Extension have provided a better understanding of the metallogenic context and improved the geological and structural interpretation of the auriferous showings.
At the Sakami project, two principal distinct gold zones are identified. These are denoted as Lapointe and Lapointe Extension. The current MRE is only focusing solely on Lapointe extension. The Lapointe area also contains gold, but the mineralized zones extend under the reservoir. Geotechnical studies and permits are required to develop this area of the Sakami project. On Figure 7-3, the two areas are shown with the limit of the pit on the Sakami Lapointe Extension as determined by the current MRE.
Couture (2001) identified three main rock types at the La Pointe Deposit:
|
● |
metamorphosed sedimentary rock (biotite paragneiss); |
|
● |
amphibolitized mafic volcanic rock; and |
|
● |
granodiorite. |
These rock units are interlayered and intruded by an alkali granite pegmatite (carrying tourmaline) and other felsic dikes (or strongly altered and silicified paragneiss) (Fleury 2016). There is also a band of pyrite-bearing quartz arenites that are interpreted to be part of the Apple Formation.
Methodology
Fury has implemented QA/QC procedures to ensure best practices in sampling and analysis of the core samples. Drill collars are located with a handheld GPS. Front sights and back sights are identified with pickets and oriented with a compass prior to installation of the drill on the setup. The sights are used to assist the field staff to align the drill.
Core logging is carried out by Fury staff. The software used to manage drillhole data is MX Deposit combined more recently with Leapfrog. The drill core is logged and then split, with one-half sent for assay and the other retained in the core box as a witness sample. The samples intervals are selected by lithology, alteration zones and zones of sulphide enrichment. All the mineralized paragneiss is sampled. Core is sampled from 1.0 m to 1.5 m lengths. RQD is included in the drill logs and recovery is very good. Core boxes are photographed, and the pictures are catalogued in Fulcrum application. Drill core is stored in wooden core boxes arranged in covered core towers on site at the camp located adjacent to the La Pointe Deposit. The samples are delivered, in secure tagged bags, directly to the ALS Minerals laboratory (ALS) in Val D’Or, Quebec for analysis. The samples are weighed and identified prior to sample preparation. All samples were analyzed by fire assay with AA finish on a 30g sample (0.005-10 ppm Au), with a gravimetric finish for assays over 10 ppm Au.
Drilling and Exploration
Drilling performed by previous owner QPM during 2018, 2019, 2019, 2020, 2021, 2022, and 2023 and is summarized in Section 6 (History) of the Technical Report.
A total of seven diamond drill holes totaling 3,686.4 m were completed at the Sakami Project by Fury during the 2025 campaign. Six holes targeted the down plunge and along strike extensions of previously identified gold mineralization across 650 m of strike length at the La Pointe Extension target. Historical drilling has intercepted gold mineralization across widths of up to 75 m and to a depth of up to 500 m below surface. All 2025 drill holes completed at La Pointe Extension intercepted zones of intense silicification with sulphide mineralization containing broad zones of gold mineralization in two sub-parallel zones with higher grade cores. Other than the drilling, the only exploration work made by Fury in 2025 was a regional geochemical soil sampling program.
During the 2025 field campaign a soil grid was completed 10 km to the west of La Pointe extension along a regional fault splay off of the main La Grande – Opinaca suture zone. The soil grid resulted in the collection of 237 samples identifying six structurally controlled gold anomalies for potential follow-up work (Figure 9-1). The gold in soil anomalies occur within a regional scale fold nose associated with mafic volcanic rocks and iron formation. Further field work is being contemplated to potentially advance the soil anomalies to a drill ready stage.
Mineral Resource Estimate MRE)
The Sakami Project Technical Report QP is of the opinion that the 2025 MRE should be classified as Inferred mineral resources based on geological and grade continuity, data density, search ellipse criteria, drill hole spacing and interpolation parameters. The requirement for reasonable prospect of eventual economic extraction has been met by (i) having a minimum width for the modelling of the mineralization zones and a cut-off grade, (ii) using reasonable inputs, for the potential surface mining method scenarios; and (iii) applying constraints consisting of an optimized surface pit shell.
The QPs consider the 2025 MRE to be reliable and based on quality data and geological knowledge. The estimate follows CIM Definition Standards and Best Practices Guidelines.
|
Category |
Tonnes |
Au g/t |
Contained Au (oz) |
|
Inferred |
23,887,000 |
1.07 |
825,000 |
Table 13: 2025 Sakami Inferred Resource Estimate
Note(s)to Sakami Resource Estimate:
|
1. |
The effective date of the Sakami project Mineral Resource Estimates (“MREs”) is November 11, 2025. |
|
2. |
The Mineral Resource Estimates were estimated by Olivier Vadnais-Leblanc, P.Geo. of SGS Geological Services and is an independent Qualified Person as defined by NI 43-101. |
|
3. |
The classification of the current Mineral Resource Estimates into Inferred mineral resources is consistent with current 2014 CIM Definition Standards – For Mineral Resources and Mineral Reserves. |
|
4. |
All figures are rounded to reflect the relative accuracy of the estimate and numbers may not add due to rounding. |
|
5. |
The mineral resources are presented undiluted and in situ, constrained by continuous 3D wireframe models, and are considered to have reasonable prospects for eventual economic extraction. |
|
6. |
Mineral resources which are not mineral reserves do not have demonstrated economic viability. An Inferred Mineral Resource has a lower level of confidence than that applying to an Indicated Mineral Resource and must not be converted to a Mineral Reserve. It is reasonably expected that most Inferred Mineral Resources could be upgraded to Indicated Mineral Resources with continued exploration. |
|
7. |
The Project mineral resource estimates (Sakami Extension) are based on a validated database which includes data from 54 surface diamond drill holes totaling 18,233.72 m. The Project resource database totals 13,147 drill hole assay intervals representing 17455.62 m of data. |
|
8. |
The MRE for the Sakami deposit is based on 44 three-dimensional (“3D”) resource models. |
|
9. |
Grades for Au were estimated for each mineralization domain using 1.5 metre capped composites assigned to that domain. To generate grade within the blocks, the inverse distance square (ID2) interpolation method was used for all domains of the Sakami deposit. An average density value of 2.76 g/cm3 was assigned to each domain. |
|
10. |
Based on the location, surface exposure, size, shape, general true thickness, and orientation, it is envisioned that parts of the Sakami deposit may be mined using open-pit mining methods. In-pit mineral resources are reported at a base case cut-off grade of 0.4 g/t Au. The in-pit resource grade blocks are quantified above the base case cut-off grade, above the constraining pit shell, below topography and within the constraining mineralized domains (the constraining volumes). |
|
11. |
The pit optimization and base-case cut-off grade consider a gold price of $2,600/oz and considers a gold recovery of 92%. The pit optimization and base case cut-off grade also considers a mining cost of US$2.80/t mined, pit slope of 55⁰ degrees, and processing, treatment, refining, G&A and transportation cost of USD$19.00/t of mineralized material. |
|
12. |
The results from the pit optimization, using the pseudoflow optimization method in Whittle.20.22, are used solely for the purpose of testing the “reasonable prospects for economic extraction” by an open pit and do not represent an attempt to estimate mineral reserves. There are no mineral reserves on the Property. The results are used as a guide to assist in the preparation of a Mineral Resource statement and to select an appropriate resource reporting cut-off grade. A Whittle pit shell at a revenue factor of 1.00 was selected as the ultimate pit shell for the purposes of this mineral resource estimate. |
|
13. |
The estimate of Mineral Resources may be materially affected by environmental, permitting, legal, title, taxation, socio-political, marketing, or other relevant issues. |
RISK FACTORS
An investment in securities of Fury Gold involves significant risks, which should be carefully considered by prospective investors before purchasing such securities. Management of Fury Gold considers the following risks to be most significant for potential investors in Fury Gold, but such risks do not necessarily comprise all those associated with an investment in Fury Gold. Additional risks and uncertainties not currently known to management of Fury Gold may also have an adverse effect on Fury Gold’s business. If any of these risks actually occur, Fury Gold’s business, financial condition, capital resources, results of operations and/or future operations could be materially adversely affected.
In addition to the other information set forth elsewhere in this AIF, the following risk factors should be carefully considered when assessing risks related to Fury Gold’s business.
Exploration Activities May Not Be Successful
Exploration for, and development of, mineral properties is speculative and involves significant financial risks, which even a combination of careful evaluation, experience and knowledge may not eliminate. While the discovery of an ore body may result in substantial rewards, few properties that are explored are ultimately developed into producing mines. Major expenditures may be required to establish reserves by drilling, to complete a feasibility study and to construct mining and processing facilities at a site for extracting gold or other metals from ore. Fury Gold cannot ensure that its future exploration programs will result in profitable commercial mining operations.
Few properties that are explored are ultimately developed into producing mines. Unusual or unexpected formations, formation pressures, fires, power outages, labour disruptions, flooding, explosions, cave-ins, landslides and the inability to obtain adequate machinery, equipment and/or labour are some of the risks involved in mineral exploration activities. The Company has relied on and may continue to rely on consultants and others for mineral exploration expertise.
The Company has implemented safety and environmental measures designed to comply with or exceed government regulations and ensure safe, reliable and efficient operations in all phases of its operations. The Company maintains liability and property insurance, where reasonably available, in such amounts as it considers prudent. The Company may become subject to liability for hazards against which it cannot insure or which it may elect not to insure against because of high premium costs or other reasons.
Also, substantial expenses may be incurred on exploration projects that are subsequently abandoned due to poor exploration results or the inability to define reserves that can be mined economically. Development projects have no operating history upon which to base estimates of future cash flow. Estimates of proven and probable mineral reserves and cash operating costs are, to a large extent, based upon detailed geological and engineering analysis. There have been no feasibility studies conducted in order to derive estimates of capital and operating costs including, among others, anticipated tonnage and grades of ore to be mined and processed, the configuration of the ore body, ground and mining conditions, expected recovery rates of the gold or copper from the ore, and anticipated environmental and regulatory compliance costs.
Substantial expenditures are required to establish mineral resources and mineral reserves through drilling and development and for mining and processing facilities and infrastructure. No assurances can be given that mineral will be discovered in sufficient quantities to justify commercial operations or that funds required for development can be obtained on a timely basis. There is also no assurance that even if commercial quantities of ore are discovered that the properties will be brought into commercial production or that the funds required to exploit any mineral reserves and resources discovered by the Company will be obtained on a timely basis or at all. Economic feasibility of a project is based on several other factors including anticipated metallurgical recoveries, environmental considerations and permitting, future metal prices and timely completion of any development plan. Most of the above factors are beyond the control of the Company. There can be no assurance that the Company’s mineral exploration activities will be successful. In the event that such commercial viability is never attained, the Company may seek to transfer its property interests or otherwise realize value or may even be required to abandon its business and fail as a “going concern”.
Moreover, advancing any of the Company’s exploration properties into a revenue generating property, will require the construction and operation of mines, processing plants and related infrastructure, the development of which includes various risks associated with establishing new mining operations, including:
|
● |
the ability to obtain acceptance and support from the local communities affected given many communities are opposed to mining operations of any kind; |
|
● |
the timing and costs, which can be considerable, of the construction of mining and processing facilities; |
|
● |
the availability and cost of skilled labour, mining equipment and principal supplies needed for operations; |
|
● |
the availability and cost of appropriate smelting and refining arrangements; |
|
● |
the need to maintain necessary environmental and other governmental approvals and permits; |
|
● |
the availability of funds to finance construction and development activities; |
|
● |
potential opposition from non-governmental organizations, environmental groups, local groups or other stakeholders which may delay or prevent development activities; and |
|
● |
potential increases in construction and operating costs due to changes in the cost of labour, fuel, power, materials and supplies. |
It is possible that actual costs and economic returns of future mining operations may differ materially from Fury Gold’s best estimates. It is not unusual for new mining operations to experience unexpected problems during the start-up phase and to require more capital than anticipated. These additional costs could have an adverse impact on Fury Gold’s future cash flows, earnings, results of operations and financial condition.
Commodity Price Fluctuations and Cycles
Resource exploration is significantly linked to the outlook for commodities. When the price of commodities being explored for declines, investor interest subsides, and capital markets become more difficult. The price of commodities varies on a daily basis and there is no reliable way to predict future prices.
Gold prices specifically are historically subject to wide fluctuation and are influenced by a number of factors including not only supply and demand for industrial uses, but for speculation purposes, all of which factors are beyond the control or influence of the Company. Some factors that affect the price of gold include industrial and jewelry demand; central bank lending or purchase or sales of gold bullion; forward or short sales of gold by producers and speculators; future level of gold productions; and rapid short-term changes in supply and demand due to speculative or hedging activities by producers, individuals or funds. Gold prices are also affected by macroeconomic factors including: confidence in the global monetary system; expectations of the future rate of inflation; the availability and attractiveness of alternative investment vehicles; the general level of interest rates; the strength of, and confidence in the U.S. dollar, the currency in which the price of gold is generally quoted, and other major currencies; global and regional political or economic events; and costs of production of other gold producing companies.
Additional Funding Requirements and Shareholder Equity Dilution
Fury Gold’s business is in the exploration stage and the Company does not carry on mining activities. As such, it will require additional financing to continue its operations. Fury Gold’s ability to secure additional financing and fund ongoing exploration will be affected by many factors, including the strength of the economy and other general economic factors. Global financial conditions continue to be subject to volatility arising from international geopolitical developments and global economic phenomenon, as well as general financial market turbulence. Access to public financing and credit can be negatively impacted by the effect of these events on Canadian and global credit markets. These instances of volatility and market turmoil could adversely impact Fury Gold’s operations and the trading price of the Common Shares. There can be no assurance that Fury Gold will be able to obtain adequate financing in the future, or that the terms of such financing will be favourable for further exploration and development of its projects. Failure to obtain such additional financing could result in delay or indefinite postponement of further exploration, drilling and/or development. Further, revenues, financings and profits, if any, will depend upon various factors, including the success, if any, of exploration programs undertaken and general market conditions for natural resources.
In order to finance future operations, Fury Gold may raise funds through the issuance of additional Common Shares or the issuance of debt instruments or other securities convertible into Common Shares. Fury Gold cannot predict the size of future issuances of Common Shares or the issuance of debt instruments or other securities convertible into Common Shares or the dilutive effect, if any, that future issuances and sales of Fury Gold’s securities will have on the market price of the Common Shares.
Negative Cash Flow
Fury Gold experiences negative cash flow from operations and anticipates incurring negative cash flow from operations for 2025 and beyond as a result of the fact that it does not have revenues from mining or any other activities. In addition, as a result of Fury Gold’s business plans for the development of its mineral projects, Fury Gold expects cash flow from operations to continue to be negative until Fury Gold is able to establish the economic viability and the development of one of its mineral projects, of which there is no assurance. Accordingly, Fury Gold’s cash flow from operations will be negative for the foreseeable future as a result of expenses to be incurred s in connection with advancement of exploration on its mineral projects.
Indirect Economic Interest in the Homestake Ridge Project
As a result of the completion of the sale of the Homestake Ridge Project to Dolly Varden in February 2022, the Company continued to own an indirect minority economic interest in the Homestake Ridge Project through its ownership of a significant interest in Dolly Varden’s common shares. Additionally, the Company had the right to nominate one director to the Dolly Varden Board, based on the Company’s ownership position of Dolly Varden, and the right to nominate a representative to the technical committee. The value of the Company’s ownership in Dolly Varden has varied as the price of the common shares of Dolly Varden fluctuate on the TSX Venture Exchange and this value has been more or less than the accounting value ascribed to these shares (which may create non-cash charges and credits when Dolly Varden finances). The Company had pre-emptive rights under the Investor Rights Agreement to retain is ownership position in Dolly Varden (on a percentage ownership basis). Accordingly, the Company’s interest in Dolly Varden has ultimately been diluted as the Company never participated in any equity offerings. On March 23, 2026, Dolly Varden received regulatory approval for its previously announced merger of equals with Contango, and the transaction closed on March 26, 2026. As a result, the Company’s 11,263,648 Dolly Varden common shares were converted into 1,860,755 Contango common shares, representing approximately 5.8% of Contango’s outstanding shares. Concurrently, the Investor Rights Agreement was terminated. Tim Clark, Fury’s CEO also serves as a director of Contango with permission of the Fury Board.
Price Volatility of Publicly Traded Securities
In recent years, the securities markets in the United States and Canada have experienced a high level of price and volume volatility, and the market prices of securities of many mining companies have experienced wide fluctuations in price which have not necessarily been related to the operating performance, underlying asset values or prospects of such companies. There can be no assurance that continuing fluctuations in price will not occur. These factors are ultimately beyond the control of Fury Gold and could have a material adverse effect on the Company’s financial condition and results of operations. Securities class action litigation often has been brought against companies following periods of volatility in the market price of their securities. The Company may in the future be the target of similar litigation. Securities litigation could result in substantial costs and damages and divert management's attention and resources.
Mineral Resource Estimates
There is no certainty that any of the mineral resources on the Eau Claire Project, the Committee Bay Project, or any other project with mineral resources will be advanced into mineral reserves. Until a deposit is actually mined and processed, the quantity of mineral resources and grades must be considered as estimates only, and are expressions of judgment based on knowledge, mining experience, analysis of drilling results and industry best practices. Valid estimates made at any given time may vary significantly when new information becomes available. While Fury Gold believes that the Company’s estimates of mineral resources are well established and reflect management’s best estimates, by their nature mineral resource estimates are imprecise and depend, to a certain extent, upon statistical inferences and geological interpretations, which may ultimately prove inaccurate.
The mineral resource estimates included herein have been determined and valued based on assumed future prices, cut-off grades and operating costs. Furthermore, fluctuations in gold and base or other precious metals prices, results of drilling, metallurgical testing and production and the evaluation of studies, reports and plans subsequent to the date of any estimate may require revisions to such estimates. Any material reductions in estimates of mineral resources could have a material adverse effect on the Company’s results of operations and financial condition.
To date, the Company has not established mineral reserves on any of its mineral properties.
Inflation
Consumer price inflation, although lower than 2023, has stayed above 2% in 2024 and if it continues it will mean much higher costs for Fury Gold’s expenditure programs. Fury Gold’s program cost estimates could rapidly become out-of-date. If this happens, the Company will need to either raise additional funds causing equity dilution or reduce its expenditures and potentially reducing progress. Increases in inflation usually result in central bank interest rate hikes which can trigger negative capital market conditions making financing difficult. While inflation increases have often led to higher precious metals prices, there can be no assurance of that, and the Company’s operations and its share price could well be adversely affected by increased inflation.
Property Commitments
Fury Gold’s mineral properties and/or interests may be subject to various land payments, royalties and/or work commitments. Failure by Fury Gold to meet its payment obligations or otherwise fulfill its commitments under these agreements could result in the loss of related property interests.
Environmental Regulatory, Health & Safety Risks
Fury Gold’s operations are subject to environmental regulations promulgated by government agencies from time to time. Environmental legislation and regulation provide for restrictions and prohibitions on spills, releases or emissions of various substances produced in association with certain exploration industry operations, such as from tailings disposal areas, which would result in environmental pollution. A breach of such legislation may result in the imposition of fines and penalties. In addition, certain types of operations require the submission and approval of environmental impact assessments. Environmental legislation is evolving in a manner which means stricter standards, and enforcement, fines and penalties for non-compliance are more stringent. Future legislation and regulations could cause additional expenses, capital expenditures, restrictions, liabilities and delays in exploration of any of Fury Gold’s properties, the extent of which cannot be predicted. Environmental assessments of proposed projects carry a heightened degree of responsibility for companies and directors, officers and employees. The cost of compliance with changes in governmental regulations has the potential to reduce the profitability of operations.
Although Fury Gold believes its operations are in compliance in all material respects with all relevant permits, licenses and regulations involving worker health and safety as well as the environment, there can be no assurance regarding continued compliance or ability of the Company to meet stricter environmental regulation, which may also require the expenditure of significant additional financial and managerial resources.
Moreover, mining companies are often targets of actions by non-governmental organizations and environmental groups in the jurisdictions in which they operate. Such organizations and groups may take actions in the future to disrupt Fury Gold’s operations. They may also apply pressure to local, regional and national government officials to take action which may be adverse to Fury Gold’s operations. Such actions could have an adverse effect on Fury Gold’s ability to advance is projects and, as a result on its operations and financial performance.
Relationships with Local Communities and Indigenous Organizations
Negative relationships with Indigenous and local communities could result in opposition to the Company’s projects. Such opposition could result in material delays in attaining key operating permits or make certain projects inaccessible to the Company’s personnel. Fury Gold respects and engages meaningfully with Indigenous and local communities at all of its operations. Fury Gold is committed to working constructively with local communities, government agencies and Indigenous groups to ensure that exploration work is conducted in a culturally and environmentally sensitive manner.
Fury Gold believes its operations can provide valuable benefits to surrounding communities, in terms of direct employment, training and skills development and other benefits associated with ongoing community support. In addition, Fury Gold seeks to maintain its partnerships and relationships with local communities, including Indigenous peoples, and stakeholders in a variety of ways, including in-kind contributions, volunteer time, sponsorships and donations. Notwithstanding the Company’s ongoing efforts, local communities and stakeholders could become dissatisfied with its activities or the level of benefits provided, which could result in civil unrest, protests, direct action or campaigns against it. Any such occurrence could materially and adversely affect the Company’s business, financial condition or results of operations.
Environmental Protection
All phases of the Company’s operations are subject to treaty provision and federal, provincial and local environmental laws and regulations. These provisions, laws and regulations address, among other things, the maintenance of air and water quality standards, land reclamation, the generation, transportation, storage and disposal of solid and hazardous waste, and the protection of natural resources and endangered species. Fury Gold has expanded significant financial and managerial resources to comply with environmental protection laws, regulations and permitting requirements in each jurisdiction where it operates. Fury Gold’s exploration and drilling projects operate under various operating and environmental permits, licenses and approvals that contain conditions that must be met. Failure to obtain such permits, licenses and approvals and/or meet any conditions set forth therein could have a material adverse effect on Fury Gold’s financial conditions or results of operations. Environmental hazards may exist on the Company’s properties which are unknown to the Company at present and were caused by previous or existing owners or operators of the properties, for which the Company could be held liable.
Although Fury Gold believes its operations are in compliance, in all material respects, with all relevant permits, licenses and regulations involving worker health and safety as well as the environment, there can be no assurance regarding continued compliance or ability of Fury Gold to meet potentially stricter environmental regulation, which may also require the expenditure of significant additional financial and managerial resources.
Fury Gold cannot be certain that all environmental permits, licenses and approvals which it may require for its future operations will be obtainable on reasonable terms or that such laws and regulations would not have an adverse effect on any mining project that it might undertake. To the extent such permits, licenses and approvals are required and are not obtained, Fury Gold may be delayed or prohibited from proceeding with planned exploration or development of its projects, which would adversely affect Fury Gold’s business, prospects and operations.
Failure to comply with applicable laws, regulations and permitting requirements may result in enforcement actions including orders issued by governmental, regulatory or judicial authorities causing operations to cease or be curtailed, and may include corrective measures requiring capital expenditures, installation of additional equipment or remedial actions. Parties engaged in mining operations may be required to compensate those suffering loss or damage by reason of the mining activities and may have civil or criminal fines or penalties imposed upon them for violation of applicable laws or regulations. Amendments to current provisions, laws and regulations and permits governing operations and activities of mining companies, or more stringent implementation thereof, could have a material adverse impact on Fury Gold and cause increases in capital expenditures or exploration costs, reduction in levels of exploration or abandonment or delays in the development of mining properties.
Moreover, mining companies are often targets of actions by non-governmental organizations and environmental groups in the jurisdictions in which they operate. Such organizations and groups may take actions in the future to disrupt Fury Gold’s operations. They may also apply pressure to local, regional and national government officials to take actions which may be adverse to Fury Gold’s operations. Such actions could have an adverse effect on Fury Gold’ ability to advance its projects and, as a result, on its financial position and results.
Climate Change
Fury Gold recognizes climate change as an international and community concern. The effects of climate change or extreme weather events may cause prolonged disruption to the delivery of essential commodities which could negatively affect operational efficiency. Furthermore, increased regulation of greenhouse gas emissions (including in the form of carbon taxes or other charges) may adversely affect the Company’s operations and that related legislation is becoming more stringent.
As a junior explorer Fury does not have operations which contribute significant green house gases relative to the operations of a producing mining company. Fury Gold is focused on operating in a manner that minimizes environmental impacts of its activities; however, environmental impacts from exploration and drilling activities are inevitable. The physical risks of climate change that may impact the Company’s operations are highly uncertain and may be particular to the unique geographic circumstances associated with each of its operations. Such physical risks include, but are not limited to, extreme weather events, wildfires, resource shortages, changes in rainfall and storm patterns and intensities, water shortages, changing sea levels and changing temperatures. There may also be supply chain implications in getting supplies to the Company’s operations, including transportation issues. Fury Gold makes efforts to mitigate climate risks by ensuring that extreme weather conditions are included in its emergency response plans. However, there is no assurance that the response will be effective, and the physical risks of climate change will not have an adverse effect on the Company’s operations and profitability.
Fury Gold is focused on operating in a manner that minimizes environmental impacts of its activities; however, environmental impacts from exploration and drilling activities are inevitable. The physical risks of climate change
Changes in Government Mining, Permitting, Environmental Regulation
In addition to climate change, other changes in government regulations or the application thereof and the presence of unknown environmental hazards on any of Fury Gold’s mineral properties may result in significant unanticipated compliance and reclamation costs. Government regulations and treaty provisions relating to mineral rights tenure, permission to disturb areas and the right to operate can adversely affect Fury Gold.
Fury Gold may not be able to obtain all necessary licenses and permits that may be required to carry out exploration on any of its projects. Obtaining the necessary governmental permits is a complex, time-consuming and costly process. The duration and success of efforts to obtain permits are contingent upon many variables not within our control. Obtaining environmental permits may increase costs and cause delays depending on the nature of the activity to be permitted and the interpretation of applicable requirements implemented by the permitting authority. There can be no assurance that all necessary approvals and permits will be obtained and, if obtained, that the costs involved will not exceed those that we previously estimated. It is possible that the costs and delays associated with the compliance of such standards and regulations could become such that we would not proceed with the development or operation.
Competitive Conditions
Fury Gold’s activities are directed towards exploration, evaluation and development of mineral deposits. The mineral exploration industry is competitive, and Fury Gold will be required to compete for the acquisition of mineral permits, claims, leases and other mineral interests for operations, exploration and development projects. As a result of this competition, Fury Gold may not be able to acquire or retain prospective development projects, technical experts that can find, develop and mine such mineral properties and interests, workers to operate its mineral properties, and capital to finance exploration, development and future operations. The Company competes with other mining companies, some of which have greater financial resources and technical facilities, for the acquisition of mineral property interests, the recruitment and retention of qualified employees; and for investment capital with which to fund its projects. If Fury Gold is unable to successfully compete in its industry it could have a material adverse effect on the Company’s results of operations and financial condition.
Local Community Uncertainties
Fury Gold’s operations at the Committee Bay Project are located in Nunavut, and, as such, its operations are exposed to various levels of political, economic and other risks and uncertainties inherent in operating in such jurisdictions. Risks and uncertainties of operating in Nunavut may vary from time to time, but are not limited to a limited local workforce, poor infrastructure, a complex regulatory regime and harsh weather. Moreover, Fury Gold’s operations at the Eau Claire Project are located within the Eeyou Istchee James Bay region, which is subject to a modern treaty with the Cree Nation. The treaty identifies land use categories across the region and communities of interest within the Cree Nations which will be consulted with during development of mineral projects in the Eau Claire Project area.
Acquisitions May Not Be Successfully Integrated
Fury Gold undertakes evaluations from time to time of opportunities to acquire additional mining assets and businesses. Any such acquisitions may be significant in size, may change the scale of the Company’s business, may require additional capital, and/or may expose the Company to new geographic, political, operating, financial and geological risks.
Fury Gold’s success in its acquisition activities depends on its ability to identify suitable acquisition candidates, acquire them on acceptable terms, and integrate their operations successfully. Any acquisitions would be accompanied by risks such as: (i) a significant decline in the relevant metal price after Fury Gold commits to complete an acquisition on certain terms; (ii) the quality of the mineral deposit acquired proving to be lower than expected; the difficulty of assimilating the operations and personnel of any acquired companies; (iii) the potential disruption of Fury Gold’s ongoing business; (iv) the inability of management to realize anticipated synergies and maximize the financial and strategic position of Fury Gold; (v) the failure to maintain uniform standards, controls, procedures and policies; (vi) the impairment of relationships with employees, customers and contractors as a result of any integration of new management personnel; and (vii) the potential unknown liabilities associated with acquired assets and businesses.
Changes in the Market Price of Common Shares
The Common Shares are listed on the TSX and the NYSE American. The price of Common Shares is likely to be significantly affected by short-term changes in the gold price or in its financial condition or results of operations as reflected in its quarterly earnings reports. Other factors unrelated to Fury Gold’s performance that may have an effect on the price of Common Shares and may adversely affect an investor’s ability to liquidate an investment and consequently an investor’s interest in acquiring a significant stake in Fury Gold include: a reduction in analyst coverage by investment banks with research capabilities, a drop in trading volume and general market interest in Fury Gold’s securities, a failure to meet the reporting and other obligations under relevant securities laws or imposed by applicable stock exchanges could result in a delisting of the Common Shares and a substantial decline in the price of the Common Shares that persists for a significant period of time.
Properties May Be Subject to Defects in Title
Fury Gold has investigated its rights to explore and exploit its projects and, to the best of its knowledge, its rights are in good standing. However, no assurance can be given that such rights will not be revoked, or significantly altered, to Fury Gold’s detriment. There can also be no assurance that Fury Gold’s rights will not be challenged or impugned by third parties.
Some of Fury Gold’s mineral claims may overlap with other mineral claims owned by third parties which may be considered senior in title to the Fury Gold mineral claims. The junior claim is only invalid in the areas where it overlaps a senior claim. Fury Gold has not determined which, if any, of the Fury Gold mineral claims is junior to a mineral claim held by a third party. Although Fury Gold is not aware of any existing title uncertainties with respect to any of its projects, there is no assurance that such uncertainties will not result in future losses or additional expenditures, which could have an adverse impact on Fury Gold’s future cash flows, earnings, results of operations and financial condition.
Reliance on Contractors and Experts
In various aspects of its operations, Fury Gold relies on the services, expertise and recommendations of its service providers and their employees and contractors, whom often are engaged at significant expense to the Company. For example, the decision as to whether a property contains a commercial mineral deposit and should be brought into production depends in large part upon the results of exploration programs and/or feasibility studies, and the recommendations of duly qualified third-party engineers and/or geologists. In addition, while Fury Gold emphasizes the importance of conducting operations in a safe and sustainable manner, it cannot exert absolute control over the actions of these third parties when providing services to Fury Gold or otherwise operating on Fury Gold’s properties. Any material error, omission, act of negligence or act resulting in environmental pollution, accidents or spills, industrial and transportation accidents, work stoppages or other actions could adversely affect the Company’s operations and financial condition.
Qualified and Experienced Employees, Management, and Board Members
Fury Gold’s future success is based on successfully attracting, training and developing employees at all levels of the company from Site Staff to Executive Management. This is especially true for professional geologists with the required skillset being available in the geographic areas that we operate in. The markets for highly skilled workers, as well as talented professionals and leaders in the mining and exploration industry are extremely competitive. The inability to meet our needs for skilled workers and talented professionals and leaders, whether through recruitment or internal training and development activities, could impact our ability to effectively implement our strategy. In addition to this, retaining qualified board members with diversified experience also brings valuable oversight and knowledge to the business.
Legal and Litigation Risks
All industries, including the exploration industry, are subject to legal claims, with and without merit. Defense and settlement costs of legal claims can be substantial, even with respect to claims that have no merit. Due to the inherent uncertainty of the litigation process, the resolution of any particular legal proceeding to which Fury Gold may become subject could have a material adverse effect on Fury Gold’s business, prospects, financial condition, and operating results. Defense and settlement of costs of legal claims can be substantial.
Risks Relating to Statutory and Regulatory Compliance
Fury Gold’s current and future operations, from exploration through development activities and commercial production, if any, are and will be governed by applicable laws, regulations and treaty obligations governing mineral claims acquisition, prospecting, development, mining, production, exports, taxes, labour standards, occupational health, waste disposal, toxic substances, land use, environmental protection, mine safety and other matters. Companies engaged in exploration activities and in the development and operation of mines and related facilities, generally experience increased costs and delays in production and other schedules as a result of the need to comply with applicable laws, regulations, treaty obligations and permits. Fury Gold has received all necessary permits for the exploration work it is presently conducting; however, there can be no assurance that all permits which Fury Gold may require for future exploration, construction of mining facilities and conduct of mining operations, if any, will be obtainable on reasonable terms or on a timely basis or at all, or that such laws and regulations would not have an adverse effect on any project which Fury Gold may undertake.
Failure to comply with applicable laws, regulations, treaty obligations and permits may result in enforcement actions thereunder, including the forfeiture of claims, orders issued by regulatory or judicial authorities requiring operations to cease or be curtailed, and may include corrective measures requiring capital expenditures, installation of additional equipment or costly remedial actions. Fury Gold may be required to compensate those suffering loss or damage by reason of its mineral exploration activities and may have civil or criminal fines or penalties imposed for violations of such laws, regulations, treaty obligations and permits. Fury Gold is not currently covered by any form of environmental liability insurance. See “– Under-insured or Uninsurable Insurance Risk”, below.
Existing and possible future laws, regulations and permits governing operations and activities of exploration companies, or more stringent implementation thereof, could have a material adverse impact on Fury Gold and cause increases in capital expenditures or require abandonment or delays in exploration.
Under-insured or Uninsurable Insurance Risks
Fury Gold is subject to a number of operational risks and may not be adequately insured for certain risks, including: accidents or spills, industrial and transportation accidents, which may involve hazardous materials, labour disputes, catastrophic accidents, fires, blockades or other acts of social activism, changes in the regulatory environment, impact of non-compliance with laws and regulations, natural phenomena such as inclement weather conditions, floods, earthquakes, ground movements, cave-ins, and encountering unusual or unexpected geological conditions and technological failure of exploration methods.
Limited Business History and No History of Earnings
Fury Gold has no history of operating earnings. The likelihood of success of Fury Gold must be considered in light of the problems, expenses, difficulties, complications and delays frequently encountered in connection with the establishment of its business. Fury Gold has limited financial resources and there is no assurance that additional funding will be available to it for further operations or to fulfill its obligations under applicable agreements. There is no assurance that Fury Gold will ultimately generate revenues, operate profitably, or provide a return on investment, or that it will successfully implement its plans.
Claims by Investors Outside of Canada
Fury Gold is incorporated under the laws of British Columbia. All of Fury Gold’s directors and officers, with the exception of Mr. Tim Clark, CEO of the Company and Phil Baker, independent Director, who are US residents, and all of the experts named herein, are residents of Canada or otherwise reside outside of the United States, and all or a substantial portion of their assets, and a substantial portion of Fury Gold’s assets, are located outside of the United States. As a result, it may be difficult for investors in the United States or outside of Canada to bring an action against directors, officers or experts who are not resident in the United States. It may also be difficult for an investor to enforce a judgment obtained in a United States court or a court of another jurisdiction of residence predicated upon the civil liability provisions of United States federal securities laws or other laws of the United States or any state thereof or the equivalent laws of other jurisdictions outside of Canada against those persons or Fury Gold.
No-Dividends Policy
No dividends on the Common Shares have been paid by Fury Gold to date. Payment of any future dividends, if any, will be at the discretion of the Board after taking into account many factors, including Fury Gold’s operating results, financial conditions, development and growth, and current and anticipated cash needs.
Disclosure and Internal Controls
Internal controls over financial reporting are procedures designed to provide reasonable assurance that transactions are properly authorized, assets are safeguarded against unauthorized or improper use, and transactions are properly recorded and reported. Disclosure controls and procedures are designed to ensure that information required to be disclosed by a company in reports filed with securities regulatory agencies is recorded, processed, summarized and reported on a timely basis and is accumulated and communicated to Fury Gold’s management, including its Chief Executive Officer and Chief Financial Officer, as appropriate, to allow timely decisions regarding required disclosure. A control system, no matter how well designed and operated, can provide only reasonable, not absolute, assurance with respect to the reliability of reporting, including financial reporting and financial statement preparation.
The Company documented and tested its internal controls over financial reporting during its most recent fiscal year in order to satisfy the requirements of Section 404 of the Sarbanes-Oxley Act (“SOX”). SOX requires an annual assessment by management and an independent assessment by the Company’s independent auditors of the effectiveness of the Company’s internal controls over financial reporting. As the Company is presently a “non-accelerated filer”, the Company’s independent auditors are not required to attest to the effectiveness of the Company’s internal control over financial reporting. While the Company’s management has assessed and made a statement to the effectiveness of the Company’s internal controls over financial reporting as at December 31, 2025, and the Company will be required to detail changes to our internal controls on a quarterly basis, the Company cannot provide assurance that the independent registered public accounting firm’s review process in assessing the effectiveness of our internal controls over financial reporting, if obtained, would not find one or more material weaknesses or significant deficiencies in the Company’s internal control over financial reporting.
The Company may fail to achieve and maintain the adequacy of its internal controls over financial reporting as such standards are modified, supplemented, or amended from time to time, and the Company may not be able to ensure that it can conclude on an ongoing basis that its internal controls over financial reporting are effective. The Company’s failure to maintain effective internal controls over financial reporting could result in the loss of investor confidence in the reliability of its financial statements, which in turn could harm the Company’s business and negatively impact the trading price of its common shares. In addition, any failure to implement required new or improved controls, or difficulties encountered in their implementation, could harm the Company’s operating results or cause it to fail to meet its reporting obligations. There can be no assurance that the Company will be able to remediate material weaknesses, if any, identified in future periods, or maintain all the controls necessary for continued compliance, and there can be no assurance that the Company will be able to retain sufficient skilled finance and accounting personnel, especially in light of the increased demand for such personnel among publicly traded companies. Future acquisitions of companies, if any, may provide the Company with challenges in implementing the required processes, procedures and controls in its acquired operations. Acquired companies may not have disclosure controls and procedures or internal control over financial reporting that are as thorough or effective as those required by the securities laws currently applicable to the Company.
No evaluation can provide complete assurance that the Company’s internal control over financial reporting will detect or uncover all failures of persons within the Company to disclose material information otherwise required to be reported. The effectiveness of the Company’s controls and procedures could also be limited by simple errors or faulty judgment. The challenges involved in implementing appropriate internal controls over financial reporting will likely increase with the Company’s plans for ongoing development of its business and this will require that the Company continues to improve its internal controls over financial reporting. Although the Company intends to devote substantial time and incur costs, as necessary, to ensure ongoing compliance, the Company cannot be certain that it will be successful in complying with SOX.
Cybersecurity Risks
Information systems and other technologies, including those related to the Company’s financial and operational management, and its technical and environmental date, are an integral part of the Company’s business activities. Network and information systems related events, such as computer hacking, cyber-attacks, computer viruses, works or other destructive or disruptive software, process breakdowns, denial of service attaches, or other malicious activities or any combination of the foregoing, or power outages, natural disasters, terrorist attacks or other similar events could result in damage to the Company’s property, equipment and date. These events also could result in significant expenditures to repair or replace damaged property or information systems and/or to protect them from similar events in the future. Furthermore, any security breaches such as misappropriation, misuse, leakage, falsification, accidental release or loss of information contained in the Company’s information technology seems including personal and other data that could damage is reputation and require the Company to expend significant capital and other resources to remedy any such security breach. Insurance held by the Company may mitigate losses; however, in any such events or security breaches may not be sufficient to cover any consequent losses or otherwise adequately compensate the Company for disruptions to its business that may result and the occurrence of any such events or security breaches could have a material adverse effect on the Company’s operations and financial results. There can be no assurances that these events and/or security breaches will not occur in the future or not have an adverse effect on the Company’s operations and financial results.
Social Media Risks
As a result of social media and other web-based applications, companies today are at much greater risk of losing control over how they are perceived. Damage to Fury Gold’s reputation can be the result of the actual or perceived occurrence of any number of events, and could include any negative publicity, whether true or not. Although the Company places a great emphasis on protecting its image and reputation, it does not ultimately have direct control over how it is perceived by others. Reputation loss may lead to increased challenges in developing and maintaining community relations, decreased investor confidence and act as an impediment to the Company’s overall ability to advance its projects, thereby having a material adverse impact on the Company’s business, financial condition or results of operations.
Liabilities relating to Past Issuances of Flow-Through Shares
The Company has issued Flow-Through (or FT) Shares which are Canadian tax-incentivized common shares for initial purchasers of treasury common shares for which the rules require that the Company expend the FT Share issuance proceeds on exploration in Canada. FT Shares are sold pursuant to the requirements of Canadian tax legislation, which incentivize investors to purchase these shares by allowing a deduction from income for their purchase price (aside from the tax aspects, FT Shares are in all respects ordinary common shares). Although the Company believes it will be able to incur the necessary amount of exploration expenditures as required by the Flow-Through Share subscription agreements, there is a risk that expenditures incurred by the Company may not be expended within the time limits, or that they will qualify as “Canadian exploration expenditures” (“CEE”), as such term is defined in the Income Tax Act (Canada) (the “Tax Act”), or that any such resource expenses incurred will be reduced by other events including failure to comply with the provisions of the Flow-Through Share subscription agreements or of applicable income tax legislation.
If the Company does not renounce to Flow-Through Share subscribers CEE within 2025, or if there is a reduction in such amount renounced pursuant to the provisions of the Tax Act, the Company may need to indemnify such subscribers, on the terms included in the Flow-Through Share subscription agreements, for an amount equal to the amount of any tax payable or that may become payable under the Tax Act. There were $0.9 million remaining expenditures as of December 31, 2025, which are to be used by December 31, 2025, in connection with the requirement to incur CEE in 2025.
On June 13, 2024, the Company issued 5,320,000 FT Shares of the Company for gross proceeds of $5 million. The Company is required to deploy the remaining $0.9 million of CEE on or before December 31, 2025 in respect of this financing and the balance in 2025 and failure to do so will result in financial penalties.
DESCRIPTION OF CAPITAL STRUCTURE
The Company’s authorized share capital consists of an unlimited number of Common Shares and an unlimited number of preferred shares in the capital of the Company (none of which has been allotted or issued). As of the date of this AIF, 190,123,861 Common Shares are issued and outstanding. In addition, as at the date of this AIF, there were 6,427,274 Common Shares issuable upon the exercise of outstanding share purchase options (“Options”), at a weighted average exercise price of $0.93 and 1,631,395 Common Shares issuable upon the vesting of outstanding restricted share units (“RSUs”), over the next 25 months. Additionally, 1,010,000 Common Shares are issuable upon a) the vesting of outstanding deferred share units (“DSUs”), with vesting dates over the next 25 months, and b) the cessation of employment or directorship with Fury. In addition, there are 13,029,434 common share purchase warrants outstanding (“Warrants”), with exercise prices ranging from $0.80 to $1.35 and expiry dates from May 31, 2027 to May 27, 2028.
Attributes of Common Shares
Each Common Share entitles the holder to: (i) one vote at all meetings of shareholders (except meetings at which only holders of a specified class of shares are entitled to vote); (ii) receive, subject to the holders of another class of shares, any dividend declared by the Board; and (iii) receive, subject to the rights of the holders of another class of shares, the remaining property of Fury Gold on the liquidation, dissolution or winding up of Fury Gold, whether voluntary or involuntary, or for the purposes of a reorganization or otherwise or upon any distribution of capital, on a pro-rata basis. No pre-emptive, redemption, sinking fund or conversion rights are attached to the Common Shares.
Authorized Preferred Shares- Nil issued
Preferred Shares are authorized to be issued from time to time in one or more series, and the Board may fix from time to time before such issue the number of Preferred Shares, the designation, rights and privileges attached thereto including any voting rights, dividend rights, redemption, purchase or conversion rights, sinking fund or other provisions. Preferred Shares generally rank in priority over Common Shares and any other shares ranking by their terms junior to the Preferred Shares as to dividends and return of capital upon, liquidation, dissolution or winding up of the Company or any other return of capital or distribution of the assets of the Company.
MARKET FOR SECURITIES
Trading Price and Volume on TSX
The following table sets out the high and low sale prices and the aggregate volume of trading of the Common Shares on the TSX and the NYSE American on a monthly basis for the most recently completed fiscal year ended December 31, 2025.
Trading Price and Volume of Common Shares on the TSX
|
Date |
High (CAD$) |
Low (CAD$) |
Volume |
|
December 2025 |
0.99 |
0.79 |
4,389,390 |
|
November 2025 |
0.86 |
0.70 |
3,556,196 |
|
October 2025 |
1.23 |
0.80 |
7,475,448 |
|
September 2025 |
1.00 |
0.72 |
4,536,748 |
|
August 2025 |
0.74 |
0.65 |
1,277,899 |
|
July 2025 |
0.81 |
0.67 |
958,970 |
|
June 2025 |
0.75 |
0.55 |
1,840,569 |
|
May 2025 |
0.59 |
0.49 |
1,809,192 |
|
April 2025 |
0.57 |
0.49 |
967,445 |
|
March 2025 |
0.59 |
0.51 |
942,125 |
|
February 2025 |
0.61 |
0.51 |
1,416,348 |
|
January 2025 |
0.61 |
0.51 |
717,874 |
Table 14: 2025 TSX Trading Summary
Trading Price and Volume of Common Shares on the NYSE American
|
Date |
High (US$) |
Low (US$) |
Volume |
|
December 2025 |
0.72 |
0.57 |
12,994,600 |
|
November 2025 |
0.63 |
0.50 |
9,975,100 |
|
October 2025 |
0.89 |
0.57 |
29,191,800 |
|
September 2025 |
0.73 |
0.51 |
16,791,800 |
|
August 2025 |
0.55 |
0.46 |
4,545,500 |
|
July 2025 |
0.59 |
0.50 |
4,780,100 |
|
June 2025 |
0.56 |
0.41 |
6,891,400 |
|
May 2025 |
0.42 |
0.36 |
3,818,600 |
|
April 2025 |
0.42 |
0.35 |
3,237,000 |
|
March 2025 |
0.42 |
0.36 |
2,774,500 |
|
February 2025 |
0.42 |
0.25 |
3,321,100 |
|
January 2025 |
0.42 |
0.39 |
2,658,400 |
Table 15: 2025 NYSE American Trading Summary
Prior Sales-2025 Issuances of Common Shares or Equivalents
During its financial year ended December 31, 2025, and up until the date of this AIF, Fury Gold issued the following securities that were not listed or quoted on either the TSX or the NYSE American:
|
Date of Issuance |
Number and Type of Securities Issued |
Issue/Exercise Price (C$) |
Reason for Issuance |
|
January 9, 2025(1) |
1,142,500 RSU’s |
N/A |
Long-Term RSU Grant |
|
January 9, 2025(2) |
590,000 DSU’s |
N/A |
Long-Term DSU Grant |
|
January 9, 2025 |
80,000 Options |
0.60 |
Option Grant |
|
April 28, 2025 |
596,808 Warrants |
1.35 |
QPM Acquisition |
|
May 27, 2025 |
6,728,000 Warrants |
0.80 |
Private Placement Financing |
|
June 18, 2025 |
60,000 Options |
0.72 |
Option Grant |
|
October 10, 2025 |
4,957,500 Warrants |
1.20 |
Private Placement Financing |
|
November 1, 2025 |
747,126 Warrants |
1.20 |
Private Placement Financing |
|
January 9, 2026 |
110,000 Options |
0.83 |
Option Grant |
|
January 9, 2026 |
885,000 RSUs |
N/A |
Long-Term RSU Grant |
|
January 9, 2026 |
430,000 DSUs |
N/A |
Long-Term DSU Grant |
|
January 23, 2026 |
100,000 DSUs |
N/A |
Long-Term DSU Grant |
Table 16: 2025 Issuances of Treasury Shares or Equivalents
Notes:
|
(1) |
Common Shares were issued during the year upon vesting. |
|
(2) |
Unvested DSUs were cancelled due to resignation. |
DIRECTORS AND EXECUTIVE OFFICERS
Name, Principal Occupation and Province or State of Residence
The following table sets out the names, province or state and country of residence, positions with or offices held with Fury Gold, and principal occupation for the past five years of each of Fury Gold’s directors and executive officers, as well as the period during which each has been a director of Fury Gold. The following table also identifies the members of each committee of the Board. The information contained in the table is current as of the date of this AIF.
The term of office of each director of Fury Gold expires at the annual general meeting of shareholders each year.
Directors and Executive Officers
|
Name, Position and Province and Country of Residence |
Principal Occupation During the Past Five Years |
Director Since |
||
|
FORRESTER (TIM) A. CLARK CEO & Director Massachusetts, United States |
Executive Director of Fury Gold; Director of Dolly Varden Silver Corporation. Mr. Clark has 25 years of global capital markets experience with numerous US, European and Canadian banks, including Barclays Capital, National Bank Financial, Merrill Lynch, Deutsche Bank and most recently BMO Capital Markets, where he held the role of Managing Director, Institutional Equity Sales. |
March 16, 2021 |
||
|
BRIAN CHRISTIE (1)(2)(3) Independent Chair Ontario, Canada |
Financial Executive Chair of Fury Gold; Director of Wallbridge Mining Company Limited; Past Director of Forum Energy Metals Corp; Strategic Advisor for Agnico Eagle Mining Limited (“Agnico Eagle”); Past Director of Denver Gold Group; VP, Investor Relations at Agnico Eagle |
February 22, 2023 |
||
|
STEVE COOK(1) (4) Independent Director British Columbia, Canada |
Semi-retired Lawyer and Businessman Director of Fury Gold; Past Director of Torq Resources Inc. (until Feb 29, 2025); Past Director of Tier One Silver Inc. (until Aug 7, 2024); Past Director of Coppernico Metals (until April 9, 2024), former tax partner at law firm of Thorsteinssons LLP; Principal at SM Cook Legal Services Law Corporation; Past Director of Cayden Resources Inc; Past Director of Skeena Resources Ltd.; Past Director of SnipGold Corp; Past Director of LaSalle Exploration Corp. |
October 28, 2013 |
||
|
MICHAEL HOFFMAN (1)(2)(3)(4) Independent Director Ontario, Canada |
Retired Mining Engineer/Mining Executive Director of Fury Gold; Director of 1911 Gold; Director and Chair of NiCAN Ltd; Director of Excellon Mining; Director of Volta Metals Inc.; Past Director of Eastmain; Past Director of Trevali Mining Corporation; Past Director of Silver X Mining; Past Director of Velocity Minerals; Past Director of LiCAN Ltd. (private). |
October 9, 2020 |
||
|
ALISON SAGA WILLIAMS (2)(4) Independent Director Ontario, Canada |
Lawyer Director of Fury Gold; Director of NiCAN Ltd Adjunct Professor at Osgoode Hall Law School; Former Elected Official for the Curve Lake First Nation. Principal of AS Williams Consulting firm, where the balance of Ms. Williams professional activities are spent working for Indigenous communities in government and resource development companies in the capacity of negotiations and governance, and as a strategic advisor. |
October 5, 2020 |
||
|
PHILLIPS BAKER, Jr. Independent Director Texas, United States |
Director of Fury Gold; Director of Dateline Resources Ltd.; Former Chief Executive Officer and director of Hecla Mining Company (“Hecla”) from 2003 until his retirement in 2024. Past Chair of the United States’ National Mining Association from 2017 to 2020. |
January 26, 2026 |
| Name, Position and Province and Country of Residence | Principal Occupation During the Past Five Years | Director Since | ||
|
ISABELLE CADIEUX (3)(5) Independent Director Quebec, Canada |
Geologist Director of Fury Gold until March 24, 2025; Past Managing Director, Investment, SIDEX. Past Director of Ordre des géologues du Québec (OGQ; Past Director of the Canadian Council of Professional Geoscientists; Past member of the Executive Committee of the UQAT-UQAM Chair in Mining Entrepreneurship. |
September 5, 2023 to March 24, 2025 |
||
|
PHIL VAN STADEN Chief Financial Officer Ontario, Canada |
Chartered Professional Accountant Chief Financial Officer of Fury Gold; Past Controller of Fury Gold; |
CFO since 2023 |
||
|
BRYAN ATKINSON, P.Geo(7) SVP, Exploration Alberta, Canada |
Geologist Senior Vice President, Exploration of Fury Gold; Past Exploration Manager of Universal Mineral Services; Past Senior Geologist of APEX Geoscience Ltd. |
SVP since 2022 |
||
|
Mario Courchesne, P Eng. VP Project Development St Basile-le-Grand, Que |
Mr. Courchesne brings 42 years of diverse experience in engineering, process mine development, feasibility studies, due diligence, construction, operations. He was most recently a self-employed consultant. |
VP project Development since March, 2026 |
Table 17: Directors and Officers Summary Information
Notes:
|
(1) |
Member of the Audit Committee. |
|
(2) |
Member of the Nominating, Compensation and Governance Committee. Effective June 26, 2025, Michael Hoffman was appointed to the Committee, replacing Jeffrey Mason |
|
(3) |
Member of the Technical, Safety and Risk Management Committee. |
|
(4) |
Member of the Indigenous and Community Relations Committee. |
|
(5) |
Isabelle Cadieux resigned from the Board effective March 25, 2025. |
|
(6) |
Phillips Baker was appointed to the Board effective January 23, 2026. |
|
(7) |
Mr Atkinson has given notice of his resignation as Sr Vice President Exploration to be effective on or about April 30, 2026. He will be pursuing other opportunities but is expected to be retained by Fury under a consulting arrangement to assist in transition and thereafter on an as-needed basis. |
Management Security Holdings
As at the date of this AIF, Fury Gold’s directors and executive officers as a group, beneficially owned, directly and indirectly, or exercised control or direction over, a total of 3,410,516 Common Shares, being approximately 1.84% of Fury Gold’s issued and outstanding Common Shares.
No Management History of Cease Trade Orders, Bankruptcies etc.
As at the date of this AIF or within the last 10 years before the date of this AIF, no director or executive officer of Fury Gold was a director, chief executive officer or chief financial officer of any company (including Fury Gold), that:
|
(a) |
was subject to a cease trade or similar order or an order denying the relevant company access to any exemptions under securities legislation, that was in effect for a period of more than 30 consecutive days; or |
|
(b) |
was subject to a cease trade or similar order or an order denying the relevant company access to any exemptions under securities legislation, that was in effect for a period of more than 30 consecutive days, that was issued after the director, chief executive officer or chief financial officer ceased to be a director, chief executive officer or chief financial officer, and which resulted from an event that occurred while that person was acting in the capacity as director, chief executive officer or chief financial officer. |
Other than as described below, no director or executive officer of Fury Gold, or a shareholder holding a sufficient number of securities of Fury Gold to affect materially the control of Fury Gold,
|
(a) |
is, at the date of this AIF, or has been within the 10 years before the date of this AIF, a director or executive officer of any company (including Fury Gold) that, while that person was acting in that capacity, or within a year of that person ceasing to act in that capacity, became bankrupt, made a proposal under any legislation relating to bankruptcy or insolvency or was subject to or instituted any proceedings, arrangement or compromise with creditors or had a receiver, receiver manager or trustee appointed to hold its assets; |
|
(b) |
has, within the 10 years before the date of this AIF, become bankrupt, made a proposal under any legislation relating to bankruptcy or insolvency, or become subject to or instituted any proceedings, arrangement or compromise with creditors, or had a receiver, receiver manager or trustee appointed to hold the assets of the director, executive officer or shareholder; or |
|
(c) |
has been subject to: |
|
i. |
any penalties or sanctions imposed by a court relating to securities legislation or by a securities regulatory authority or has entered into a settlement agreement with a securities regulatory authority; or |
|
ii. |
any other penalties or sanctions imposed by a court or a regulatory body that would likely be considered important to a reasonable securityholder in making an investment decision. |
Potential Conflicts of Interest
No directors or officers have any known conflicts of interest in connection with Fury Gold. Several directors serve on the boards of other publicly traded junior mining companies, which can lead to potential conflicts of interest in connection with the entitlement to mineral project opportunities which may come to their attention. In response to this risk, the Company and its shared services provider, Universal Mineral Services Ltd. haves established policies to avoid these situations and to comply with legal requirements of their fiduciary obligations and the requirements of the applicable corporate laws (Business Corporations Act (British Columbia)) should such potential conflict of interest situations arise.
Audit Committee
Audit Committee Charter
The primary responsibility of the Audit Committee of the Company (the “Audit Committee”) is that of oversight of the financial reporting process on behalf of the Board. This includes oversight responsibility for financial reporting and continuous disclosure, oversight of external audit activities, oversight of financial risk and financial management control, and oversight responsibility for compliance with tax and securities laws and regulations as well as whistle blowing procedures. The Audit Committee is also responsible for the other matters as set out in this charter and/or such other matters as may be directed by the Board from time to time. The Audit Committee should exercise continuous oversight of developments in these areas.
Composition of the Audit Committee
The current members of the Audit Committee are Steve Cook (Chairperson), Brian Christie and Michael Hoffman, each of whom are considered financially literate and all are independent as such terms are defined under National Instrument 52-110 – Audit Committees of the Canadian Securities Administrators
Relevant Education and Experience of Audit Committee Members
Set out below is a brief description of the education and experience of each Audit Committee member that is relevant to the performance of his responsibilities as an Audit Committee member.
Steve Cook is a retired tax partner at the law firm of Thorsteinssons LLP, Vancouver, BC. Mr. Cook received his B.Comm. and LL.B. degrees from the University of BC and was called to the BC Bar in 1982 and the Ontario Bar in 1992. Mr. Cook is a specialist in corporate and international tax planning, representation, and civil and criminal tax litigation.
Brian Christie was VP Investor Relations at Agnico Eagle Mines from December 2012 until his retirement in June 2022. Before joining Agnico, he worked for over 17 years in the investment industry, primarily as a precious and base metals mining analyst with Desjardins Securities, National Bank Financial, Canaccord Capital and HSBC Securities. Prior to this, Mr. Christie spent 13 years in the mining industry as a geologist for a variety of mining companies, including Homestake, Billiton, Falconbridge Copper and Newmont Mining.
Michael Hoffman is an experienced mining executive with over 40 years of practice including engineering, mine operations, corporate development, projects and construction. Mr. Hoffman also has direct northern Canadian mining experience including operations and projects.
Each member of the Audit Committee has:
|
● |
an understanding of the accounting principles used by the Company to prepare its financial statements, and the ability to assess the general application of those principles in connection with estimates, accruals and reserves; |
|
● |
experience preparing, auditing, auditing, analyzing or evaluating financial statements that present a breadth and level of complexity of accounting issues that are generally comparable to the breadth and complexity of issues that can reasonably be expected to be raised by the Company’s financial statements, or experience actively supervising individuals engaged in such activities; and |
|
● |
an understanding of internal controls and procedures for financial reporting. |
Pre-Approval Policies and Procedures
The Audit Committee has adopted specific policies and procedures for the engagement of non-audit services to be provided to the Company or any subsidiaries by the Company’s external auditor. The Chair of the Audit Committee has the authority to pre-approve in between regularly scheduled Audit Committee meetings any non-audit service of less than $50,000, however such approval will be presented to the Audit Committee at the next scheduled meeting for formal approval.
External Auditor Service Fees
The following table discloses the aggregate fees billed for each of the last two fiscal years for professional services rendered by the Company’s auditor for various services.
|
Nature of Services |
December 31, 2025 |
December 31, 2024 |
|
Audit Fees(1) |
$510,845 |
$523,364 |
|
Audit-Related Fees(2) |
Nil |
Nil |
|
Tax Fees |
Nil |
Nil |
|
All Other Fees |
Nil |
Nil |
|
Total |
$510,845 |
$523,364 |
Table 18: 2024/25 External Auditor Fees
Notes:
|
(1) |
“Audit Fees” include fees necessary to perform the annual audit and quarterly reviews of the Company’s consolidated financial statements. Audit Fees also include audit or other attest services required by legislation or regulation, such as comfort letters, consents, reviews of securities filings and statutory audits. In 2024 and 2025, the Audit Fees included fees incurred in connection with certain securities filings. |
|
(2) |
“Audit-Related Fees” include services that are traditionally performed by the auditor. These audit-related services include employee benefit audits, due diligence assistance, accounting consultations on proposed transactions, internal control reviews and audit or attest services not required by legislation or regulation. |
Other Board Committees
The Board currently has three other standing committees in addition to the Audit Committee, namely the Nominating, Compensation and Governance Committee, the Indigenous and Community Relations Committee, and the Technical, Health, Safety and Environment Committee. Each standing committee of the Board operates according to its mandate, which is approved by the Board and sets out the committee’s duties and responsibilities. Copies of the standing committee mandates are available at www.furygoldmines.com/about-us/governance/.
No Legal Proceedings
To the best knowledge of Fury Gold’s management, there are no material legal proceedings involving Fury Gold or its properties as of the date of this AIF and Fury Gold knows of no such proceedings currently contemplated.
No penalties or sanctions have been imposed against Fury Gold by a court relating to securities legislation or by a securities regulatory authority during Fury Gold’s financial year, no penalties or sanctions have been imposed by a court or regulatory body against Fury Gold that would likely be considered important to a reasonable investor in making an investment decision and no settlement agreements have been entered into by Fury Gold before a court relating to securities legislation or with a securities regulatory authority during the financial year.
INTEREST OF MANAGEMENT AND OTHERS IN MATERIAL TRANSACTIONS
To the knowledge of the directors and executive officers of Fury Gold, there were no material interests, direct or indirect, of directors or executive officers of Fury Gold, any shareholder of Fury Gold who beneficially owns, directly or indirectly, or exercised control or direction over Common Shares carrying more than 10% of the voting rights attached to all outstanding Common Shares, or any known associate or affiliate of such persons, in any transaction during the three most recently completed financial year of Fury Gold or during the current financial year that has materially affected or is reasonably expected to materially affect Fury Gold.
SHARED SERVICES PROVIDER
Pursuant to a 2021 Agreement amongst Fury, Universal Mineral Services Ltd. (“UMS”), a private British Columbia company and three other public companies, the Company shares geological and administrative services with three other junior explorers some of which now or in the past three years have had one or more common directors. These three are Torq Resources Inc, Coppernico Metals Inc. and Tier One Silver Inc. Fury and each of these other junior resource companies own a 25% share interest in UMS. Under the shared services arrangements UMS provides part-time personnel to assist with administrative and technical matters. All transactions with UMS are in the normal course of operations, and the shared costs are considered by management to be priced at equal to or better than would be the fair market rates for the shared services. All amounts owing to or from UMS are unsecured, non-interest bearing, and have no specific terms of settlement, unless otherwise noted.
| (in thousands) |
2025 |
2024 |
2023 |
|
Exploration and evaluation costs |
$344 |
$233 |
$ 872 |
|
General and administration |
$232 |
$307 |
$714 |
|
Total transactions for the year |
$576 |
$ 540 |
$ 1,586 |
Table 19: 2023-2025 Shared Service Provider Costs
The outstanding balance owing at December 31, 2025 was $57 (December 31, 2024 – $90, December 31, 2023 – $103), which is included in accounts payable. As part of the UMS arrangement, the Company is contractually obligated to pay certain rental expenses in respect of a ten-year office lease entered into by UMS on July 1, 2021. As at December 31, 2025, the Company expects to incur approximately $77in respect of its share of future rental expense of UMS.
The Company issues share options to certain UMS employees, including key management personnel of the Company. The Company recognized a share-based compensation recovery of $11 for the year ended December 31, 2025, in respect of share options issued to UMS employees (December 31, 2024 - $3 share-based compensation recovery, December 31, 2023 - $317 expense), which is included within employee benefits and exploration and evaluation costs.
TRANSFER AGENT AND REGISTRAR
Fury Gold’s registrar and transfer agent for the Common Shares is Odyssey Trust Company at its principal offices located at the Stock Exchange Tower, 1230 – 300 5th Avenue SW, Calgary, AB, T2P 3C4, Canada (888) 290-1175.
AUDITOR
The auditor of the Company since 2015 has been Deloitte LLP, Chartered Professional Accountants, of 410 W Georgia St, Vancouver, BC, V6B 0S7. Deloitte LLP is independent with respect to the Company within the meaning of the U.S. Securities Act of 1933, as amended, and the applicable rules and regulations thereunder adopted by the SEC and the Public Company Accounting Oversight Board (United States) and within the meaning of the rules of professional conduct of the Chartered Professional Accountants of British Columbia.
On January 20, 2026 management notified Deloitte LLP that it intends to recommend to shareholders the appointment of PricewaterhouseCoopers LLP to be elected successor auditors at the next annual shareholders meeting which is expected in June 2026. In the notice to Deloitte LLP, management confirmed that Deloitte LLP has not expressed any modified audit opinions on the consolidated financial statements of the Company for the two most recently completed financial years preceding the date of this notice, being the years ended December 31, 2024 and December 31, 2023 and further confirmed the opinion of the Company, there have been no “reportable events” in connection with Deloitte LLP’s audit work. In its response to the Company Deloitte LLP confirmed these statements. Both the Company’s notice letter and the Deloitte LLP response are publicly filed at www.sedarplus.ca on January 20, 2026.
PricewaterhouseCoopers LLP (“PwC”) of 18 York Street, Suite 2500, Toronto, Ontario, M5J 0B2 has advised the Company that they are independent with respect to the Company within the meaning of the Chartered Professional Accountants of British Columbia CPA Code of Professional Conduct and in accordance with the independence rules of the SEC and the Public Company Accounting Oversight Board.
MATERIAL CONTRACTS
The Company is not subject to any contracts on which its business can be considered substantially dependent.
INTERESTS OF EXPERTS
Certain of the scientific and technical information relating to the Company’s mineral projects has been derived from the four Technical Reports prepared by the experts named below and has been included in reliance on such person’s expertise. These Technical Reports are identified as follows:
|
1. |
2025 Eau Claire PEA-“Preliminary Economic Assessment of the Eau Claire Project, Eeyou Istchee James Bay Region of Quebec, Canada” prepared by Maxime Dupéré, P.Geo, Sarah Dean, P.Geo., William van Breugel, P. Eng., Henri Gouin, P. Eng., Johnny Canosa, P. Eng., and Joseph Keane, P.E. of SGS Geological Services with an effective date of August 25, 2025 (this Technical Report incorporates the 2024 Mineral Resource Estimate prepared by Mr Dupéré, a co-author). |
|
2. |
2025 Sakami-Sakami MRE “Initial Mineral Resource Estimate for the Sakami Project, Eeyou Istchee Territory, James Bay Region of Quebec, Canada” which is dated January 21, 2026, has an effective date of November 11, 2025 authored by Olivier Vadnai-Leblanc, P. Geo., Geologist with SGS Geological Services |
|
3. |
2024 Éléonore South Geological Report “Technical Report on the Éléonore South Project, Quebec, Canada” prepared by Mrs. Valerie Doyon, the Company’s Senior Project Geologist with an effective date of March 31, 2024”. |
|
4. |
2023 Committee Bay “Technical Report on the Committee Bay Project, Nunavut Territory, Canada” dated September 11, 2023, prepared by Bryan Atkinson, P.Geo. as Senior Vice President Exploration of Fury Gold Mines and Andrew Turner, P.Geol., principal at APEX Geoscience Ltd.”. |
Copies of the Technical Reports can be accessed online on SEDAR+ at www.sedarplus.ca and on EDGAR at www.sec.gov.
Bryan Atkinson, P.Geo Senior Vice President Exploration has reviewed the technical information this AIF relating t the Committee Bay Project and Ms. Valerie Doyon, P.Geo., as Senior Project Geologist reviewed and approved the information related to the Quebec projects herein namely Eau Claire Project, Éléonore South and Sakami.
This AIF forms the base disclosure for the Company’s US filing the multi-jurisdiction disclosure system Form 40F which requires written consents of experts named therein. Accordingly, the following persons referenced above have provided or will provide such consents: Maxime Dupéré, P.Geo, Sarah Dean, P.Geo., William van Breugel, P. Eng., Henri Gouin, P. Eng., Johnny Canosa, P. Eng., and Joseph Keane, P.E; Olivier Vadnai-Leblanc, P. Geo; Bryan Atkinson, P.Geo; Andre w Turner, P.Geol, and Valerie Doyon.
Each of the aforementioned firms or persons held less than one percent of any class of the Company’s securities or of any of the Company’s associates or affiliates when they prepared the Technical Reports referred to above or following the preparation of such Technical Reports. None of the aforementioned firms or persons received any direct or indirect interest in any of the Securities or property or of any of the Company’s associates or affiliates in connection with the preparation of such Technical Reports and the recipient of management incentive stock options in the Company commensurate with his role.
None of the aforementioned firms or persons, nor any directors, officers or employees of such firms, are currently expected to be elected, appointed or employed as a director, officer or employee of the Company or of any of its associates or affiliates, other than Bryan Atkinson, P.Geo, Senior Vice President Exploration of the Company and Valerie Doyon, Senior Project Geologist of the Company, who was at the time of reviewing and approving the applicable information and remain as of the date of this AIF a director, officer or employee of the Company or one of its subsidiaries.
ADDITIONAL INFORMATION
Additional information relating to Fury Gold, including directors’ and officers’ remuneration and indebtedness, principal holders of Fury Gold’s securities, and securities authorized for issuance under equity compensation plans, is contained in annual financial statements, management’s discussion and analysis, proxy circulars and interim financial statements of the Company, available under the Company’s profile on SEDAR+ at www.sedarplus.ca. A copy of the Company’s audit Committee charter is available at www.furygoldmines.com/about-us/governance/.
Exhibit 99.2
(An exploration company)
CONSOLIDATED
FINANCIAL STATEMENTS
FOR THE YEAR ENDED DECEMBER 31, 2025

|
Deloitte LLP 410 W. Georgia Street Suite 2000 Vancouver BC V6B 0S7 Canada
Tel: 604-669-4466 Fax: 604-685-0395 www.deloitte.ca |
Report of Independent Registered Public Accounting Firm
To the Shareholders and the Board of Directors of
Fury Gold Mines Limited
Opinion on the Financial Statements
We have audited the accompanying consolidated statements of financial position of Fury Gold Mines Limited and subsidiaries (the "Company") as at December 31, 2025 and 2024, the related consolidated statements of loss and comprehensive loss, equity, and cash flows, for each of the two years in the period ended December 31, 2025, and the related notes (collectively referred to as the "financial statements"). In our opinion, the financial statements present fairly, in all material respects, the financial position of the Company as at December 31, 2025 and 2024, and its financial performance and its cash flows for each of the two years in the period ended December 31, 2025, in accordance with IFRS Accounting Standards as issued by the International Accounting Standards Board.
We have also audited, in accordance with the standards of the Public Company Accounting Oversight Board (United States) (PCAOB), the Company's internal control over financial reporting as of
December 31, 2025, based on criteria established in Internal Control - Integrated Framework (2013) issued by the Committee of Sponsoring Organizations of the Treadway Commission and our report dated March 31, 2026, expressed an unqualified opinion on the Company's internal control over financial reporting.
Basis for Opinion
These financial statements are the responsibility of the Company's management. Our responsibility is to express an opinion on the Company's financial statements based on our audits. We are a public accounting firm registered with the PCAOB and are required to be independent with respect to the Company in accordance with the U.S. federal securities laws and the applicable rules and regulations of the Securities and Exchange Commission and the PCAOB.
We conducted our audits in accordance with the standards of the PCAOB. Those standards require that we plan and perform the audit to obtain reasonable assurance about whether the financial statements are free of material misstatement, whether due to error or fraud. Our audits included performing procedures to assess the risks of material misstatement of the financial statements, whether due to error or fraud, and performing procedures that respond to those risks. Such procedures included examining, on a test basis, evidence regarding the amounts and disclosures in the financial statements. Our audits also included evaluating the accounting principles used and significant estimates made by management, as well as evaluating the overall presentation of the financial statements. We believe that our audits provide a reasonable basis for our opinion.
Critical Audit Matter
The critical audit matter communicated below is a matter arising from the current-period audit of the financial statements that was communicated or required to be communicated to the audit committee and that (1) relates to accounts or disclosures that are material to the financial statements and (2) involved our especially challenging, subjective, or complex judgments. The communication of critical audit matters does not alter in any way our opinion on the financial statements, taken as a whole, and we are not, by communicating the critical audit matter below, providing separate opinions on the critical audit matter or on the accounts or disclosures to which it relates.
Accounting for Equity Method Investment in Dolly Varden Silver Corporation (“Dolly Varden”) – Refer to Notes 1 and 3 i) to the financial statements
Critical Audit Matter Description
The Company has a 12.26% interest in Dolly Varden where the remaining 87.74% interest is held by third-party investors. The Company has accounted for its interest in Dolly Varden under the equity method of accounting as it exercises significant influence, but not control. The Company’s investment in an associate was initially recognized at cost and subsequently increased or decreased to recognize the Company's share of earnings and losses of the associate, after any adjustments necessary to give effect to uniform accounting policies, and for impairment losses.
We identified the accounting for equity method investment as a critical audit matter because of its significance to the Company’s financial statements. This required an increased extent of audit effort, including the need to involve the auditor of Dolly Varden.
How the Critical Audit Matter Was Addressed in the Audit
Our audit procedures related to the equity method investment in Dolly Varden included the following, among others:
| ● |
Evaluated the effectiveness of management’s controls related to the accounting for the Company’s investment in Dolly Varden, which includes management’s receipt and review of Dolly Varden financial information; |
| ● |
Evaluated work performed at the underlying equity method investment through oversight of the auditor of Dolly Varden by obtaining and assessing information from the auditor to understand work performed, significant findings or issues identified, actions taken to address them, and conclusions reached; |
| ● |
Agreed the underlying information of the equity method investment to the audited financial statements of the Company; |
| ● |
Performed procedures to evaluate subsequent events related to the equity method investment and to assess their impact, if any, on the financial information, up to the date of our report of independent registered public accounting firm on the Company’s financial statements; and |
| ● |
Performed procedures to evaluate management’s determination of the Company’s dilution gain and share of net loss of the associate. |
/s/ Deloitte LLP
Chartered Professional Accountants
March 31, 2026
Vancouver, Canada
We have served as the Company's auditor since 2015.
|
|
Deloitte LLP 410 W. Georgia Street Suite 2000 Vancouver BC V6B 0S7 Canada
Tel: 604-669-4466 Fax: 604-685-0395 www.deloitte.ca |
Report of Independent Registered Public Accounting Firm
To the Shareholders and the Board of Directors of
Fury Gold Mines Limited
Opinion on Internal Control over Financial Reporting
We have audited the internal control over financial reporting of Fury Gold Mines Limited and subsidiaries (the “Company") as of December 31, 2025, based on criteria established in Internal Control - Integrated Framework (2013) issued by the Committee of Sponsoring Organizations of the Treadway Commission (COSO). In our opinion, the Company maintained, in all material respects, effective internal control over financial reporting as of December 31, 2025, based on criteria established in Internal Control - Integrated Framework (2013) issued by COSO.
We have also audited, in accordance with the standards of the Public Company Accounting Oversight Board (United States) (PCAOB), the consolidated financial statements as at and for the year ended December 31, 2025, of the Company and our report dated March 31, 2026 , expressed an unqualified opinion on those financial statements.
Basis for Opinion
The Company's management is responsible for maintaining effective internal control over financial reporting and for its assessment of the effectiveness of internal control over financial reporting, included in the accompanying Management's Report on Internal Control over Financial Reporting. Our responsibility is to express an opinion on the Company’s internal control over financial reporting based on our audit. We are a public accounting firm registered with the PCAOB and are required to be independent with respect to the Company in accordance with the U.S. federal securities laws and the applicable rules and regulations of the Securities and Exchange Commission and the PCAOB.
We conducted our audit in accordance with the standards of the PCAOB. Those standards require that we plan and perform the audit to obtain reasonable assurance about whether effective internal control over financial reporting was maintained in all material respects. Our audit included obtaining an understanding of internal control over financial reporting, assessing the risk that a material weakness exists, testing and evaluating the design and operating effectiveness of internal control based on the assessed risk, and performing such other procedures as we considered necessary in the circumstances. We believe that our audit provides a reasonable basis for our opinion.
Definition and Limitations of Internal Control over Financial Reporting
A company’s internal control over financial reporting is a process designed to provide reasonable assurance regarding the reliability of financial reporting and the preparation of financial statements for external purposes in accordance with generally accepted accounting principles. A company’s internal control over financial reporting includes those policies and procedures that (1) pertain to the maintenance of records that, in reasonable detail, accurately and fairly reflect the transactions and dispositions of the assets of the company; (2) provide reasonable assurance that transactions are recorded as necessary to permit preparation of financial statements in accordance with generally accepted accounting principles, and that receipts and expenditures of the company are being made only in accordance with authorizations of management and directors of the company; and (3) provide reasonable assurance regarding prevention or timely detection of unauthorized acquisition, use, or disposition of the company’s assets that could have a material effect on the financial statements.
Because of its inherent limitations, internal control over financial reporting may not prevent or detect misstatements. Also, projections of any evaluation of effectiveness to future periods are subject to the risk that controls may become inadequate because of changes in conditions, or that the degree of compliance with the policies or procedures may deteriorate.
/s/ Deloitte LLP
Chartered Professional Accountants
March 31, 2026
Vancouver, Canada
| Fury Gold Mines Limited |
||||||||||||
| Consolidated Statements of Financial Position |
||||||||||||
| (Expressed in thousands of Canadian dollars) |
||||||||||||
| At December 31 |
At December 31 |
|||||||||||
| Note |
2025 |
2024 |
||||||||||
| Assets |
||||||||||||
| Current assets: |
||||||||||||
| Cash |
7 | $ | 21,197 | $ | 4,912 | |||||||
| Marketable securities |
8 | 7,783 | 2,358 | |||||||||
| Other investment |
2,031 | 2,063 | ||||||||||
| Trade amounts receivable |
395 | 54 | ||||||||||
| Prepaid expenses and deposits |
591 | 522 | ||||||||||
| 31,997 | 9,909 | |||||||||||
| Non-current assets: |
||||||||||||
| Restricted cash |
7 | 144 | 144 | |||||||||
| Prepaid expenses and deposits |
- | 77 | ||||||||||
| Property and equipment |
9 | 297 | 326 | |||||||||
| Mineral property interests |
6,10,16 | 49,918 | 45,200 | |||||||||
| Investments in associates |
11 | 25,963 | 29,456 | |||||||||
| 76,322 | 75,203 | |||||||||||
| Total assets |
$ | 108,319 | $ | 85,112 | ||||||||
| Liabilities and Equity |
||||||||||||
| Current liabilities: |
||||||||||||
| Accounts payable and accrued liabilities |
$ | 2,023 | $ | 855 | ||||||||
| Deferred government grant |
12 | 22 | - | |||||||||
| Lease liability |
- | 65 | ||||||||||
| Flow-through share premium liability |
13 | 790 | 944 | |||||||||
| 2,835 | 1,864 | |||||||||||
| Non-current liabilities: |
||||||||||||
| Provision for site reclamation and closure |
14 | 4,473 | 5,045 | |||||||||
| Total liabilities |
$ | 7,308 | $ | 6,909 | ||||||||
| Equity: |
||||||||||||
| Share capital |
18 | $ | 339,782 | $ | 312,723 | |||||||
| Share option and warrant reserve |
19 | 24,911 | 22,684 | |||||||||
| Accumulated other comprehensive loss |
(31 | ) | (12 | ) | ||||||||
| Deficit |
(263,651 | ) | (257,192 | ) | ||||||||
| Total equity |
$ | 101,011 | $ | 78,203 | ||||||||
| Total liabilities and equity |
$ | 108,319 | $ | 85,112 | ||||||||
Commitments (notes 11, 23); Subsequent events (note 26)
Approved on behalf of the Board of Directors:
| “Forrester A. Clark” |
“Steve Cook” |
|
| Chief Executive Officer |
Director |
The accompanying notes form an integral part of these consolidated financial statements.
| Fury Gold Mines Limited |
||||||||||||
| Consolidated Statements of Loss and Comprehensive Loss |
||||||||||||
| (Expressed in thousands of Canadian dollars, except per share amounts) |
||||||||||||
| Years ended December 31 |
||||||||||||
|
|
Note | 2025 |
2024 |
|||||||||
| Operating expenses: |
||||||||||||
| Exploration and evaluation |
15 | $ | 12,853 | $ | 5,512 | |||||||
| Fees, salaries and other employee benefits |
2,369 | 2,202 | ||||||||||
| Insurance |
472 | 522 | ||||||||||
| Legal and professional |
1,158 | 789 | ||||||||||
| Marketing and investor relations |
798 | 677 | ||||||||||
| Office and administration |
302 | 461 | ||||||||||
| Regulatory and compliance |
304 | 214 | ||||||||||
| 18,256 | 10,377 | |||||||||||
| Other (income) expenses, net: |
||||||||||||
| Accretion on provision for site reclamation and closure |
14 | 147 | 146 | |||||||||
| Amortization of flow-through share premium |
13 | (1,403 | ) | (1,621 | ) | |||||||
| Foreign exchange loss |
5 | 13 | ||||||||||
| Impairment expense |
16 | - | 100,873 | |||||||||
| Interest expense |
2 | 33 | ||||||||||
| Interest income |
(257 | ) | (300 | ) | ||||||||
| Net loss from associates |
11 | 4,433 | 3,858 | |||||||||
| Net gain on investments in associates |
11 | (7,479 | ) | (4,109 | ) | |||||||
| Net loss on other investments |
32 | - | ||||||||||
| Net gain on marketable securities |
8 | (5,845 | ) | (373 | ) | |||||||
| Net gain on disposal of mineral properties |
10 | (1,100 | ) | - | ||||||||
| Other income |
17 | (168 | ) | (566 | ) | |||||||
| (11,633 | ) | 97,954 | ||||||||||
| Loss before taxes |
6,623 | 108,331 | ||||||||||
| Tax recovery |
25 | (164 | ) | (193 | ) | |||||||
| Net loss for the year |
6,459 | 108,138 | ||||||||||
| Other comprehensive loss, net of tax |
||||||||||||
| Unrealized currency loss on translation of foreign operations |
19 | 3 | ||||||||||
| Total comprehensive loss for the year |
$ | 6,478 | $ | 108,141 | ||||||||
| Loss per share: |
||||||||||||
| Basic and diluted loss per share |
22 | $ | 0.04 | $ | 0.73 | |||||||
The accompanying notes form an integral part of these consolidated financial statements.
| Fury Gold Mines Limited |
||||||||||||||||||||||||
| Consolidated Statements of Equity |
||||||||||||||||||||||||
| (Expressed in thousands of Canadian dollars, except share amounts) |
||||||||||||||||||||||||
| Number of common shares |
Share capital |
Share option and warrant reserve |
Accumulated other comprehensive loss |
Deficit |
Total |
|||||||||||||||||||
| Balance at December 31, 2023 |
145,744,795 | $ | 310,277 | $ | 21,660 | $ | (9 | ) | $ | (149,054 | ) | $ | 182,874 | |||||||||||
| Total comprehensive loss for the year |
- | - | - | (3 | ) | (108,138 | ) | (108,141 | ) | |||||||||||||||
| Shares issued pursuant to offering, net of share issue costs and flow-through premium liability (note 18) |
5,320,000 | 2,446 | - | - | - | 2,446 | ||||||||||||||||||
| Share-based compensation (note 19) |
491,478 | - | 1,024 | - | - | 1,024 | ||||||||||||||||||
| Balance at December 31, 2024 |
151,556,273 | $ | 312,723 | $ | 22,684 | $ | (12 | ) | $ | (257,192 | ) | $ | 78,203 | |||||||||||
| Total comprehensive loss for the year |
- | - | - | (19 | ) | (6,459 | ) | (6,478 | ) | |||||||||||||||
| Shares and warrants exchanged in QPM Acquisition (note 6) |
8,394,045 | 4,503 | 30 | - | - | 4,533 | ||||||||||||||||||
| Shares and warrants issued pursuant to private placement, net of share issue costs (note 18,19) |
8,662,253 | 4,669 | 1,031 | - | - | 5,700 | ||||||||||||||||||
| Shares issued pursuant to offering, net of share issue costs and flow-through premium liability (note 13,18) |
19,917,701 | 16,919 | 1,296 | - | - | 18,215 | ||||||||||||||||||
| Share options exercised (note 19) |
231,000 | 190 | (64 | ) | - | - | 126 | |||||||||||||||||
| Restrictive share units granted |
- | 778 | (778 | ) | - | - | - | |||||||||||||||||
| Share-based compensation (note 19) |
382,027 | - | 712 | - | - | 712 | ||||||||||||||||||
| Balance at December 31, 2025 |
189,143,299 | $ | 339,782 | $ | 24,911 | $ | (31 | ) | $ | (263,651 | ) | $ | 101,011 | |||||||||||
The accompanying notes form an integral part of these consolidated financial statements.
| Fury Gold Mines Limited |
||||||||||||
| Consolidated Statements of Cash Flows |
||||||||||||
| (Expressed in thousands of Canadian dollars) |
||||||||||||
| Years ended December 31 |
||||||||||||
| Note |
2025 |
2024 |
||||||||||
| Operating activities: |
||||||||||||
| Loss for the year |
$ | (6,459 | ) | $ | (108,138 | ) | ||||||
| Adjusted for: |
||||||||||||
| Interest income |
(257 | ) | (300 | ) | ||||||||
| Net gain on disposal of mineral properties | 10 | (1,100 | ) | - | ||||||||
| Items not involving cash: |
||||||||||||
| Accretion of provision for site reclamation and closure |
14 | 147 | 146 | |||||||||
| Amortization of flow-through share premium |
13 | (1,403 | ) | (1,621 | ) | |||||||
| Depreciation |
9 | 204 | 297 | |||||||||
| Impairment expense |
16 | - | 100,873 | |||||||||
| Interest expense |
2 | 25 | ||||||||||
| Net loss from associates |
11 | 4,433 | 3,858 | |||||||||
| Net gain on investments in associates |
11 | (7,479 | ) | (4,109 | ) | |||||||
| Net loss on other investments |
32 | - | ||||||||||
| Net gain on marketable securities |
8 | (5,845 | ) | (373 | ) | |||||||
| Share-based compensation |
19 | 712 | 859 | |||||||||
| Changes in non-cash working capital |
21 | 353 | 410 | |||||||||
| Cash used in operating activities |
(16,660 | ) | (8,073 | ) | ||||||||
| Investing activities: |
||||||||||||
| Acquisition of mineral interests, inclusive of transaction fees |
6 | (402 | ) | (3,030 | ) | |||||||
| Disposition of mineral properties | 10 | 850 | - | |||||||||
| Interest income |
257 | 300 | ||||||||||
| Proceeds from disposition of investment in associate, net of transaction costs |
11 | 6,539 | 7,042 | |||||||||
| Proceeds from disposition of marketable securities, net of transaction costs |
8 | 670 | 481 | |||||||||
| Marketable securities additions |
8,10 | - | (1,300 | ) | ||||||||
| Other investments additions |
- | (2,063 | ) | |||||||||
| Property and equipment additions |
9 | (175 | ) | (35 | ) | |||||||
| Cash provided by investing activities |
7,739 | 1,395 | ||||||||||
| Financing activities: |
||||||||||||
| Lease payments |
(62 | ) | (191 | ) | ||||||||
| Proceeds from financing, net of share issue costs |
18 | 5,700 | - | |||||||||
| Proceeds from issuance of flow-through shares, net of issuance costs |
18 | 19,461 | 4,468 | |||||||||
| Proceeds from exercise of options |
19 | 126 | - | |||||||||
| Cash provided by financing activities |
25,225 | 4,277 | ||||||||||
| Effect of foreign exchange on cash |
(19 | ) | - | |||||||||
| Increase (decrease) in cash |
16,285 | (2,401 | ) | |||||||||
| Cash, beginning of period |
4,912 | 7,313 | ||||||||||
| Cash, end of period |
$ | 21,197 | $ | 4,912 | ||||||||
Supplemental cash flow information (note 21)
The accompanying notes form an integral part of these consolidated financial statements.
| Note 1: |
Nature of operations |
Fury Gold Mines Limited (the “Company” or “Fury Gold”) was incorporated on June 9, 2008, under the Business Corporations Act (British Columbia) and is listed on the Toronto Stock Exchange and the NYSE-American, with its common shares trading under the symbol FURY. The Company’s registered and records office is at 1500-1055 West Georgia Street Vancouver, BC, V6E 4N7 and the mailing address is 401 Bay Street, 16th Floor, Toronto, Ontario, M5H 2Y4.
The Company’s principal business activity is the acquisition and exploration of resource projects in Canada. At December 31, 2025, the Company had four principal projects: Committee Bay in Nunavut, Eau Claire, Sakami, and Éléonore South in Quebec. Additionally, the Company held a 12.26% common share interest in Dolly Varden Silver Corporation (“Dolly Varden”) which owns the Kitsault project in British Columbia, and a 25% interest in Universal Mineral Services Limited (“UMS”), a private shared-services provider.
| Note 2: |
Basis of presentation |
These consolidated financial statements have been prepared in accordance with IFRS® Accounting Standards as issued by the International Accounting Standards Board (“IASB”), effective for the year ended December 31, 2025. IFRS Accounting Standards as issued by the IASB comprises IFRSs, International Accounting Standards (“IASs”), and interpretations issued by the IFRS Interpretations Committee (“IFRICs”), and the former Standing Interpretations Committee (“SICs”).
These consolidated financial statements were approved and authorized for issuance by the Board of Directors of the Company on March 31, 2026.
| Note 3: |
Material accounting policy information |
|
a) |
Basis of measurement |
These consolidated financial statements have been prepared on a historical cost basis, except for those assets and liabilities that are measured at revalued amounts or fair values at the end of each reporting period.
|
b) |
Currency of presentation |
The Company’s presentation currency is the Canadian (“CAD”) dollar. All amounts, with the exception of per share amounts, are expressed in thousands of Canadian dollars, unless otherwise stated. References to US$ are to United States (“US”) dollars.
|
c) |
Basis of preparation and consolidation |
These consolidated financial statements include the accounts of the Company and its subsidiaries. Subsidiaries are entities controlled by the Company. Control exists when the Company has power over an investee, when the Company is exposed, or has rights, to variable returns from the investee, and when the Company has the ability to affect those returns through its power over the investee. Subsidiaries are included in the consolidated financial results of the Company from the effective date of acquisition up to the effective date of disposition or loss of control. All intercompany balances and transactions have been eliminated.
The subsidiaries (with a beneficial interest of 100%) of the Company as at December 31, 2025, were as follows:
| Subsidiary |
Place of incorporation |
Functional currency |
| Eastmain Mines Inc. (“Eastmain Mines”) (a) |
Canada |
CAD |
| Eastmain Resources Inc. (“Eastmain”) |
ON, Canada |
CAD |
| Fury Gold USA Limited (“Fury Gold USA”) (b) |
Delaware, U.S.A. |
USD |
| North Country Gold Corp. (“North Country”) |
BC, Canada |
CAD |
| Quebec Precious Metals Corporation (“QPM”) (a) (c) |
Canada |
CAD |
(a) The entity is incorporated federally in Canada.
(b) Fury Gold USA provided certain administrative services with respect to employee benefits for US resident personnel.
(c) QPM’s results are included from April 28, 2025, which was the acquisition date. See note 6 for details.
Investments in associates
These consolidated financial statements also include the following investments in associates:
| Associates |
Ownership interest |
Location |
Classification and accounting method |
|||
| Dolly Varden |
12.26 | % | BC, Canada |
Associate; equity method |
||
| UMS |
25.00 | % | BC, Canada |
Associate; equity method |
||
|
d) |
Segmented information |
The Company’s operating segments are reviewed by the CEO, who is the chief operating decision maker (“CODM”) to make decisions about resources to be allocated to the segments and to assess their performance. The Company operates two reportable segments, a focus on the acquisition, exploration, and development of mineral resource properties within Quebec and Nunavut. The information contained in note 15 is the information used by the CODM to assess where to deploy resources and capital.
|
e) |
Foreign currency translation |
The financial statements of the Company and each of its subsidiaries are prepared in its functional currency determined on the basis of the currency of the primary economic environment in which such entities operate.
Transactions in currencies other than the functional currency are recorded at the rates of exchange prevailing at the transaction dates. At each reporting date, monetary items denominated in foreign currencies are translated into the entity’s functional currency at the then prevailing rates and non-monetary items measured at historical cost are translated into the entity’s functional currency at rates in effect at the date the transaction took place.
Exchange differences arising on the settlement of monetary items or on translating monetary items at rates different from those at which they were translated on initial recognition during the period or in previous financial statements are included in the consolidated statements of (earnings) loss and comprehensive (income) loss for the period in which they arise.
|
f) |
Property and equipment |
Property and equipment are stated at cost less accumulated amortization and impairment losses. Amortization is calculated using the straight-line method over the estimated useful lives as follows:
| ● |
Computer equipment3 years |
| ● |
Machinery and equipment5-10 years |
| ● |
Right-of-use (“ROU”) assets the lease term, unless the transfer of the asset ownership is reasonably certain at the end of the lease term, whereupon depreciation is over the useful life. |
|
g) |
Mineral property interests and exploration expenditures |
Title to mineral properties involves certain inherent risks due to the difficulties of determining the validity of certain claims as well as the potential for problems arising from the frequently ambiguous conveyancing historical characteristic of many properties. The Company has investigated title to all of its mineral properties and, to the best of its knowledge, title to all of its properties is in good standing.
The Company accounts for mineral property interests in accordance with IFRS 6 – Exploration for and evaluation of mineral properties (“IFRS 6”).
Costs directly related to acquiring the legal right to explore a mineral property including acquisition of licenses, mineral rights, and similar acquisition costs are recognized and capitalized as mineral property interests. Acquisition costs incurred in obtaining the legal right to explore a mineral property are deferred until the legal right is granted and thereon reclassified to mineral property interests. Transaction costs incurred in acquiring an asset are deferred until the transaction is completed and then included in the purchase price of the asset acquired.
Once the legal right to explore a property has been acquired, costs directly related to exploration and evaluation activities including, but not limited to, researching and analyzing existing exploration data, conducting geological studies, exploration drilling and sampling, and payments made to contractors and consultants in connection with the exploration and evaluation of the property, are expensed in the period in which they are incurred as exploration and evaluation costs on the consolidated statements of (earnings) loss and comprehensive (income) loss.
Costs not directly attributable to exploration and evaluation activities, including general administrative overhead costs, are expensed as administrative costs in the period in which they occur.
As the Company currently has no operational income, any incidental revenues earned in connection with exploration activities are applied as a reduction to exploration and evaluation costs.
When a project is deemed to no longer have commercially viable prospects to the Company, all capitalized acquisition costs in respect of that project are deemed to be impaired. As a result, those costs, in excess of the estimated recoverable amount, are expensed to the consolidated statements of (earnings) loss and comprehensive (income) loss.
The Company considers each group of claims in close proximity to one another as individual cash-generating units (“CGU”). The Company assesses mineral property interests as a CGU for impairment when facts and circumstances suggest that the carrying amount of the asset may exceed its recoverable amount. The recoverable amount is the higher of the asset’s fair value less costs to sell and its value in use and can be determined by factors including comparable public company resources, precedent transactions and valuing the Company’s projects using a reasonable per ounce valuation.
Once the technical feasibility and commercial viability of extracting the mineral resources have been determined, the property is considered to be a mine under development at which point the assets and further related costs no longer fall under the guidance of IFRS 6.
|
h) |
Joint arrangement |
The Company conducts a portion of its business through a joint arrangement where the parties are bound by contractual arrangements establishing joint control with decisions about the relevant activities that significantly affect the returns of the investee requiring unanimous consent. A joint arrangement is classified as either a joint operation or a joint venture, subject to the terms that govern each investor's rights and obligations in the arrangement.
In a joint operation, the investor has rights and obligations to the separate assets and liabilities of the investee, therefore the Company recognizes its share of the assets, liabilities, revenue, and expenses of the joint arrangement.
|
i) |
Investments in associates |
The Company conducts a portion of its business through equity interests in associates. An associate is an entity over which the Company has significant influence and is neither a subsidiary nor a joint venture. The Company has significant influence when it has the power to participate in the financial and operating policy decisions of the associate but does not have control or joint control over those policy decisions.
The Company accounts for its investments in associates using the equity method. Under the equity method, the Company’s investment in an associate is initially recognized at cost and subsequently increased or decreased to recognize the Company's share of earnings and losses of the associate, after any adjustments necessary to give effect to uniform accounting policies, and for impairment losses after the initial recognition date. The Company’s share of an associate’s losses that are in excess of its investment in the associate are recognized only to the extent that the Company has incurred legal or constructive obligations or made payments on behalf of the associate. The Company's share of earnings and losses of its associate are recognized in net (earnings)/loss during the period.
|
j) |
Impairment of non-financial assets |
At each reporting date, the Company reviews the carrying amounts of its non-financial assets to determine whether there are any indicators of impairment. If any such indicator exists, the recoverable amount of the asset is estimated in order to determine the extent of the impairment, if any.
Where the asset does not generate cash inflows that are independent from other assets, the Company estimates the recoverable amount of the CGU to which the asset belongs. Any intangible asset with an indefinite useful life is tested for impairment annually and whenever there is an indication that the asset may be impaired. An asset’s recoverable amount is the higher of fair value less costs of disposal and value in use. In assessing value in use, the estimated future cash flows are discounted to their present value using a pre-tax discount rate that reflects current market assessments of the time value of money and the risks specific to the asset for which estimates of future cash flows have not been adjusted.
If the recoverable amount of an asset or CGU is estimated to be less than its carrying amount, the carrying amount is reduced to the recoverable amount and an impairment loss is recognized immediately in the consolidated statements of (earnings) loss and comprehensive (income) loss. Where an impairment subsequently reverses, the carrying amount is increased to the revised estimate of recoverable amount but only to the extent that this does not exceed the carrying value that would have been determined if no impairment had previously been recognized. A reversal of impairment is recognized in the consolidated statements of (earnings) loss and comprehensive (income) loss.
|
k) |
Government grants |
Government grants are recognized when there is reasonable assurance that the Company will comply with the conditions attached to them and that the grants will be received. Grants related to income are recognized in profit or loss on a systematic basis over the periods in which the related expenses are incurred.
|
l) |
Leases |
The Company assesses if a contract is or contains a lease at inception of the contract. Control is considered to exist if the contract conveys the right to control the use of an identified asset during the term of the lease. When a lease is identified, a right-of-use asset and a corresponding lease liability are recognized, except for short-term leases (defined as leases with a lease term of 12 months or less) and leases of low value assets. For these leases, the Company recognizes the lease payments as an expense in profit or loss on a straight-line basis.
Right-of-use assets, which are included in property and equipment, are recognized at cost, which is comprised of the initial amount of the lease liability adjusted for any lease payments made at or before the commencement date, plus any initial direct costs and decommissioning and restoration costs, less any lease incentives received. Right-of-use assets are depreciated over the shorter of the asset's useful life and the lease term on a straight-line basis, except where ownership is expected to be transferred at the end of the lease, whereby the asset is depreciated over its useful life.
The lease liability is initially measured at the present value of the lease payments that are not paid at the commencement date discounted by using the rate implicit in the lease or the Company’s incremental borrowing rate, if the rate implicit in the lease cannot be determined. Lease payments included in the measurement of the lease liability are:
| ● |
fixed payments (including in-substance fixed payments), less any lease incentives receivable; |
| ● |
variable payments that depend on an index or rate; |
| ● |
amount expected to be payable by the lessee under residual value guarantees; |
| ● |
exercise price of purchase options, if the lessee is reasonably certain to exercise the options; and |
| ● |
penalties for terminations, unless the Company is reasonably certain the options will not be exercised. |
|
m) |
Provisions |
Provisions are recorded when a present legal or constructive obligation exists as a result of past events where it is probable that an outflow of resources embodying economic benefit will be required to settle the obligation, and a reliable estimate of the amount of the obligation can be made.
|
n) |
Provision for site reclamation and closure |
An obligation to incur rehabilitation and site restoration costs arises when an environmental disturbance is caused by the exploration, development, or on-going production of a mineral property interest. Such costs arising from the decommissioning of plant and other site preparation work, discounted to their net present value, are provided for and capitalized at the start of each project as soon as the obligation to incur such costs arises, as well when changes in estimates occur year over year. These costs are charged to the consolidated statements of (earnings) loss and comprehensive (income) loss over the life of the operation through amortization and the unwinding of the discount in the provision.
|
o) |
Flow-through common shares |
Canadian income tax legislation permits companies to issue flow-through instruments whereby the income tax deductions generated by eligible expenditures of the Company, defined in the Income Tax Act (Canada) as qualified Canadian exploration expenses (“CEE”), are claimed by the investors rather than by the Company. Shares issued on a flow-through basis are typically sold at a premium above the market share price which relates to the tax benefits that will flow through to the investors. The Company often issues flow-through shares as part of its equity financing transactions in order to fund its Canadian exploration activities. The Company estimates the portion of the proceeds attributable to the premium as being the excess of the flow-through share price over the market share price of the common shares without the flow-through feature at the time of issuance. The premium is recorded as a liability which represents the Company’s obligation to spend the flow-through funds on eligible expenditures and is amortized through the consolidated statements of (earnings) loss and comprehensive (income) loss as the eligible expenditures are incurred.
|
p) |
Loss per share |
Basic loss per share is calculated by dividing the net loss available to common shareholders by the weighted average number of shares outstanding during the reporting period. The diluted loss per share is calculated by dividing the net loss available to common shareholders by the weighted average number of shares outstanding on a diluted basis. The weighted average number of shares outstanding on a diluted basis takes into account the additional shares for the assumed exercise of share options and warrants, if dilutive. The number of additional shares is calculated by assuming that outstanding share options were exercised and that the proceeds from such exercises were used to acquire common shares at the average market price during the reporting period.
|
q) |
Share-based compensation |
Options
From time to time, the Company grants share options to employees and non-employees. An individual is classified as an employee, versus a non-employee, when the individual is an employee for legal or tax purposes (direct employee) or provides services similar to those performed by a direct employee.
The fair value of share options, measured using the Black-Scholes option pricing model at the date of grant, is charged to the consolidated statements of (earnings) loss and comprehensive (income) loss over the vesting period. Performance vesting conditions and forfeitures are taken into account by adjusting the number of equity instruments expected to vest at each reporting date so that, ultimately, the cumulative amount recognized over the vesting period is based on the number of options that eventually vest.
(Expressed in thousands of Canadian dollars, except where no Where the terms and conditions of options are modified before they vest, any change in the fair value of the options, measured immediately before and after the modification, is also charged to the consolidated statements of (earnings) loss and comprehensive (income) loss over the remaining vesting period.
Equity instruments granted to non-employees are recorded in the consolidated statements of (earnings) loss and comprehensive (income) loss at the fair value of the goods or services received, unless they are related to the issuance of shares. Costs related to the issuance of shares are recorded as a reduction of share capital.
When the value of goods or services received in exchange for a share-based payment cannot be reliably estimated, the fair value is measured by use of a valuation model. The expected life used in the model is adjusted, based on management’s best estimate, for the effects of non-transferability, exercise restrictions, and behavioral considerations.
All equity-settled share-based payments are recorded in the share option and warrant reserve until exercised. Upon exercise, shares are issued from treasury and the amount previously recorded in share option and warrant reserve is reclassified to share capital along with any consideration paid.
Deferred, Performance and Restricted Share Units (“DSU”, “PSU” and “RSU”)
Under the Company’s Long-term incentive (“LTI”) plan, the board can issue DSU’s, PSU’s or RSU’s to eligible members of management and or the board. The fair value of these shares will be determined at the time that they are granted and will be charged to the consolidated statements of loss and comprehensive loss at the time all vesting criteria have been met.
DSU’s, PSU’s or RSU’s issued under the Company’s LTI plan vest on or before the third anniversary of the grant or as otherwise provided and may be settled in the form of the Company's common shares or, at the option of the Company, the cash equivalent based on the market price of the common shares as of the vesting date.
The Company has historically settled RSUs in common shares. The Company has no present obligation to settle these in cash.
|
r) |
Income taxes |
Income tax reported in the consolidated statements of loss and comprehensive loss for the period presented comprises current and deferred income tax. Income tax is recognized in the consolidated statements of loss and comprehensive loss except to the extent that it relates to items recognized directly in equity, in which case it is recognized in equity.
Current income tax for each taxable entity in the Company is based on the local taxable income at the local statutory tax rate enacted or, substantively enacted, at the reporting date and includes any adjustments to tax payable or recoverable with regards to previous periods.
Deferred income tax is determined using the liability method, providing for temporary differences between the carrying amounts of assets and liabilities for financial reporting purposes and the amounts used for taxation purposes. The amount of deferred income tax provided is based on the expected manner of realization or settlement of the carrying amount of assets and liabilities, using the expected future tax rates enacted or substantively enacted at the reporting date.
A deferred income tax asset is recognized only to the extent that it is probable that future taxable profits will be available against which the asset can be utilized. Deferred tax assets are reduced to the extent that it is no longer probable that the related tax benefit will be realized.
Deferred income tax assets and liabilities are offset only when there is a legally enforceable right to set off current tax assets against current tax liabilities, when they relate to income taxes levied by the same taxation authority and the Company intends to settle its tax assets and liabilities on a net basis.
|
s) |
Financial instruments |
The Company recognizes financial assets and liabilities on its consolidated statements of financial position when it becomes a party to the contract creating the asset or liability.
On initial recognition, all financial assets and liabilities are recorded by the Company at fair value, net of attributable transaction costs, except for financial assets and liabilities classified as fair value through profit or loss for which transaction costs are expensed in the period in which they are incurred.
| i) |
Amortized cost |
Financial assets that meet the following conditions are measured subsequently at amortized cost:
| ● |
the financial asset is held within a business model whose objective is to hold financial assets in order to collect contractual cash flows; and |
| ● |
the contractual terms of the financial asset give rise on specified dates to cash flows that are solely payments of principal and interest on the principal amount outstanding. |
The amortized cost of a financial asset is the amount at which the financial asset is measured at initial recognition minus the principal repayments, plus the cumulative amortization using the effective interest method of any difference between that initial amount and the maturity amount, adjusted for any loss allowance. Interest income is recognized using the effective interest method.
| ii) |
Fair value through other comprehensive income (”FVTOCI") |
Financial assets that meet the following conditions are measured at FVTOCI:
| ● |
the financial asset is held within a business model whose objective is achieved by both collecting contractual cash flows and selling financial assets; and |
| ● |
the contractual terms of the financial asset give rise on specified dates to cash flows that are solely payments of principal and interest on the principal amount outstanding. |
The Company does not have any financial assets classified as FVTOCI at December 31, 2025 and 2024.
| iii) |
Financial assets measured subsequently at fair value through profit or loss (“FVTPL”) |
By default, all other financial assets are measured subsequently at FVTPL.
The Company, at initial recognition, may also irrevocably designate a financial asset as measured at FVTPL if doing so eliminates or significantly reduces a measurement or recognition inconsistency that would otherwise arise from measuring assets or liabilities or recognizing the gains and losses on them on different bases. Financial assets measured at FVTPL are measured at fair value at the end of each reporting period, with any fair value gains or losses recognized in profit or loss to the extent they are not part of a designated hedging relationship. Fair value is determined in the manner described in note 23.
| iv) |
Financial liabilities and equity |
Debt and equity instruments are classified as either financial liabilities or as equity in accordance with the substance of the contractual arrangements, and the definitions of a financial liability and an equity instrument.
An equity instrument is any contract that evidences a residual interest in the assets of the Company after deducting all its liabilities. Equity instruments issued by the Company are recognized at the proceeds received, net of direct issue costs. Repurchase of the Company’s own equity instruments is recognized and deducted directly in equity. No gain or loss is recognized in profit or loss on the purchase, sale, issue, or cancellation of the Company’s own equity instruments.
Financial liabilities that are not contingent consideration of an acquirer in a business combination, held for trading, or designated as at FVTPL, are measured at amortized cost using the effective interest method.
| v) |
Impairment |
The Company recognizes a loss allowance for expected credit losses on its financial assets. The amount of expected credit losses is updated at each reporting period to reflect changes in credit risk since initial recognition of the respective financial instruments.
|
t) |
Other comprehensive loss |
Other comprehensive loss is the change in net assets arising from transactions and other events and circumstances from non-owner sources. Comprehensive loss comprises net loss and other comprehensive loss. Foreign currency translation differences arising on translation of subsidiaries with a different functional currency are also included in other comprehensive loss.
| Note 4: |
Changes in accounting standards |
New and not yet effective accounting standards
On May 30, 2024, the IASB issued “Amendments to the Classification and Measurement of Financial Instruments (Amendments to IFRS 9 and IFRS 7)” to address matters identified during the post-implementation review of the classification and measurement requirements in IFRS 9 Financial Instruments and related requirements in IFRS 7 Financial Instruments: Disclosures. The amendments are effective for reporting periods beginning on or after January 1, 2026. Early application is permitted. The Company is currently evaluating the impact of the new standard on its financial statements.
On April 9, 2024, the IASB issued a new standard, called IFRS 18 Presentation and Disclosure in Financial Statements, which applies to an annual reporting period beginning on or after January 1, 2027, with earlier application permitted. IFRS 18 includes requirements for all entities applying IFRS Accounting Standards as issued by the IASB for the presentation and disclosure of information in financial statements. The Company is currently evaluating the impact of the new standard on its financial statements.
| Note 5: |
Critical accounting estimates and judgments |
The preparation of financial statements in conformity with IFRS Accounting Standards as issued by the IASB requires management to select accounting policies and make estimates and judgments that may have a significant impact on the consolidated financial statements. Estimates are continuously evaluated and are based on management’s experience and expectations of future events that are believed to be reasonable under the circumstances. Actual outcomes may differ from these estimates.
Critical accounting judgments exercised in applying accounting policies, apart from those involving estimates, which have the most significant effect on the amounts recognized in these consolidated financial statements are as follows:
| a) |
Functional currency |
The functional currency for each of the Company’s subsidiaries is the currency of the primary economic environment in which the entity operates. Determination of functional currency may involve certain judgments to determine the primary economic environment and the Company reconsiders the functional currency of its entities if there is a change in events and conditions that determined the primary economic environment.
| b) |
Economic recoverability and probability of future economic benefits of mineral property interests |
Management has determined that the acquisition of mineral properties and related costs incurred, which have been recognized on the consolidated statements of financial position, are economically recoverable. Management uses several criteria in its assessments of economic recoverability and probability of future economic benefit including geological data, scoping studies, accessible facilities, and existing and future permits.
| c) |
Indications of impairment of assets |
Assessments of impairment indicators are performed at the CGU level and judgment is involved in assessing whether there is any indication that an asset or a CGU may be impaired. The assessment of the impairment indicators involves the application of a number of significant judgments and estimates to certain variables, including metal price trends, exploration plans for properties, and the results of exploration and evaluation to date.
| d) |
Income taxes |
The provision for income taxes and composition of income tax assets and liabilities requires management’s judgment. The application of income tax legislation also requires judgment in order to interpret legislation and to apply those findings to the Company’s transactions.
| e) |
Determination of control of subsidiaries and joint arrangements |
Judgment is required to determine when the Company has control of subsidiaries or joint control of joint arrangements. This requires an assessment of the relevant activities of the investee, being those activities that significantly affect the investee’s returns (including operating and capital expenditure decision-making, financing of the investee, and the appointment, remuneration, and termination of key management personnel) and when the decisions in relation to those activities are under the control of the Company or require unanimous consent from the investors.
| f) |
Investments in associates |
The Company conducts a portion of its business through equity interests in associates. An associate is an entity over which the Company has significant influence and is neither a subsidiary nor a joint venture. The Company has significant influence when it has the power to participate in the financial and operating policy decisions of the associate but does not have control or joint control over those policy decisions.
| g) |
Financial instruments |
Financial instruments are assessed upon initial recognition to determine whether they meet the definition of a financial asset, financial liability, or equity instrument depending on the substance of the contractual arrangement. Judgement is required in making this determination as the substance of a transaction may differ from its legal form. Once a determination is made, IFRS Accounting Standards as issued by the IASB require that financial instruments be measured at fair value on initial recognition. For financial instruments that do not have quoted market prices or observable inputs, judgements are made in determining what are appropriate inputs and assumptions to use in calculating the fair value.
Key sources of estimation uncertainty that have significant risk of causing a material adjustment to the carrying amount of assets and liabilities are as follows:
| h) |
Reclamation obligations |
Management assesses its reclamation obligations annually and when circumstances suggest that a material change to the obligations have occurred. Significant estimates and assumptions are made in determining the provision for site reclamation and closure because there are numerous factors that will affect the ultimate liability that becomes payable. These factors include estimates of the extent, the timing, and the cost of reclamation activities, regulatory change, cost increases, and changes in discount rates. Those uncertainties may result in actual expenditures differing from the amounts currently provided. The provision at the reporting date represents management’s best estimate of the present value of the future reclamation costs required. Changes to estimated future costs are recognized in the consolidated statements of financial position by adjusting the reclamation asset and liability.
| i) |
Share-based compensation |
The Company determines the fair value of equity-settled share-based payments using the fair value of the equity instruments at the grant date. For options granted, the Company uses the Black‐Scholes option pricing model. This option pricing model requires the development of market-based subjective inputs, including the risk-free interest rate, expected price volatility, and expected life of the option. Changes in these inputs and the underlying assumption used to develop them can materially affect the fair value estimate.
| j) |
Deferred tax assets and liabilities |
Management judgment and estimates are required in assessing whether deferred tax assets and deferred tax liabilities are recognized in the consolidated statements of financial position. Judgments are made as to whether future taxable profits will be available in order to recognize deferred tax assets. Assumptions about the generation of future taxable profits depend on management’s estimates of future cash flows. These depend on estimates of future production and sales volumes, commodity prices, reserves, operating costs, and other capital management transactions. These judgments and assumptions are subject to risk and uncertainty, and changes in circumstances may alter expectations which may impact the amount of deferred tax assets and deferred tax liabilities recognized on the consolidated statements of financial position and the benefit of other tax losses and temporary differences not yet recognized.
| Note 6: |
Acquisition of Quebec Precious Metals Corporation |
On April 28, 2025, the Company acquired all of the issued and outstanding common shares of Quebec Precious Metals Corporation (the “QPM Shares”). Former shareholders of QPM received 0.0741 of a common share of the Company for each QPM Share held (the “Exchange Ratio”). As a result, the Company issued an aggregate 8,394,045 Fury Gold shares at a fair value of C$0.54 per share, for an aggregate fair value of $4,533 (the “QPM Acquisition”).
Share options and share purchase warrants of QPM that were outstanding as at the time of completion were exchanged for Fury Shares on substantially the same terms and conditions, with the number of Fury Gold shares issuable on exercise and the exercise price adjusted in accordance with the Exchange Ratio (note 19). The fair value of these replacement awards is not included in purchase price consideration in accordance with IFRS 2 Share-based Payment (note 19).
On April 22, 2025, the Company entered into a contingent capital contribution agreement with QPM for a contribution amount of $750. Upon completion of the QPM Acquisition, the contingent capital contribution formed part of the consideration. Additionally, the Company incurred transaction costs of $199 comprised of due diligence costs, legal and listing fees. Transaction costs are allocated as part of the consideration according to the Company’s accounting policy.
The Company concluded that the QPM Acquisition did not constitute a business combination and accounted for it as an asset acquisition. A summary of the Company's consideration paid, assets acquired, and liabilities assumed from QPM as at acquisition date is as follows:
| Purchase price |
||||
| Cash consideration |
$ | 750 | ||
| Fair value of common shares issued |
4,533 | |||
| Transaction costs |
199 | |||
| Total |
$ | 5,482 | ||
| Net assets acquired |
||||
| Cash |
$ | 547 | ||
| Other receivables and assets |
164 | |||
| Mineral property interests |
5,436 | |||
| Accounts payable and other liabilities |
(600 | ) | ||
| Deferred government grant |
(65 | ) | ||
| Total |
$ | 5,482 |
QPM holds a land package covering approximately 70,900 hectares in the Eeyou Istchee James Bay territory, Quebec, near Dhilmar’s Éléonore gold mine. QPM’s focus has been on advancing its Sakami gold project and its newly discovered, drill-ready Ninaaskuwin lithium showing on the Elmer East project. In addition, QPM holds a 68% interest in the Kipawa rare earths project located near Temiscaming, Quebec.
| Note 7: |
Cash and restricted cash |
Cash and restricted cash held by the Company were as follows:
| At December 31 |
||||||||
| 2025 |
2024 |
|||||||
| Cash |
$ | 21,197 | $ | 4,912 | ||||
| Restricted cash |
144 | 144 | ||||||
| $ | 21,341 | $ | 5,056 | |||||
Restricted cash includes an amount of $75 ( December 31, 2024 – $75) in connection with an irrevocable standby letter of credit in favor of Kitikmeot Inuit Association in connection with the Company’s Committee Bay project. The balance are mainly GIC’s held with financial institutions as security for the Company credit cards. Restricted cash is classified as a non-current asset and is not available for use within one year of the date of the consolidated statements of financial position.
| Note 8: |
Marketable securities |
The marketable securities held by the Company were as follows:
| Total |
||||
| Balance at December 31, 2023 |
$ | 1,166 | ||
| Additions |
1,300 | |||
| Sale of marketable securities |
(481 | ) | ||
| Realized loss on disposition |
(60 | ) | ||
| Unrealized net gain |
433 | |||
| Balance at December 31, 2024 |
$ | 2,358 | ||
| Additions |
250 | |||
| Sale of marketable securities |
(670 | ) | ||
| Realized gain on disposition |
58 | |||
| Unrealized net gain |
5,787 | |||
| Balance at December 31, 2025 |
$ | 7,783 | ||
| Note 9: |
Property and equipment |
Property and equipment are recorded at cost, and at December 31, 2025 and 2024, were comprised as follows:
| Machinery and equipment |
Office lease |
Other |
Total |
|||||||||||||
| Cost |
||||||||||||||||
| At December 31, 2023 |
$ | 2,272 | $ | 531 | $ | 11 | $ | 2,814 | ||||||||
| Additions |
35 | - | - | 35 | ||||||||||||
| At December 31, 2024 |
$ | 2,307 | $ | 531 | $ | 11 | $ | 2,849 | ||||||||
| Additions |
175 | - | - | 175 | ||||||||||||
| Disposal |
- | (531 | ) | (11 | ) | (542 | ) | |||||||||
| At December 31, 2025 |
$ | 2,482 | $ | - | $ | - | $ | 2,482 | ||||||||
| Accumulated depreciation |
||||||||||||||||
| At December 31, 2023 |
$ | (1,798 | ) | $ | (417 | ) | $ | (11 | ) | $ | (2,226 | ) | ||||
| Depreciation |
(207 | ) | (90 | ) | - | (297 | ) | |||||||||
| At December 31, 2024 |
$ | (2,005 | ) | $ | (507 | ) | $ | (11 | ) | $ | (2,523 | ) | ||||
| Depreciation |
(180 | ) | (24 | ) | - | (204 | ) | |||||||||
| Disposal |
- | 531 | 11 | 542 | ||||||||||||
| At December 31, 2025 |
$ | (2,185 | ) | $ | - | $ | - | $ | (2,185 | ) | ||||||
| Net book value |
||||||||||||||||
| At December 31, 2024 |
$ | 302 | $ | 24 | $ | - | $ | 326 | ||||||||
| At December 31, 2025 |
$ | 297 | $ | - | $ | - | $ | 297 | ||||||||
| Note 10: |
Mineral property interests |
The Company’s principal resource properties are located in Canada.
| a) |
Quebec |
The Company maintains interests in 10 properties within the James Bay region of Quebec. The three largest projects are:
Eau Claire
The Company owns a 100% interest in the Eau Claire project located immediately north of the Eastmain reservoir, approximately 10 kilometres (km) northeast of Hydro Quebec’s EM-1 hydroelectric power facility, 80 km north of the town of Nemaska, 320 km northeast of the town of Matagami, and 800 km north of Montreal, Quebec. The property consists of map-designated claims totaling approximately 23,000 hectares.
Sakami
The 100% owned Sakami project covers approximately 14,250 hectares (ha) or 142.5 square kilometres (km), located 30km to the east of the paved Billy Diamond Highway. The Project straddles the prospective structural corridor marking the contact between the Opinaca and La Grande Geological sub-provinces, where gold mineralization has been identified over a distance of more than 23km. Gold mineralization is located at the base of a sulphide-rich horizon within a zone of intense pervasive silicification located along a regional shear zone, marking the contact between the two geological sub-provinces.
Éléonore South
The Éléonore South project consists of two separate blocks of map-designated claims, comprising a total of 282 claims covering approximately 147 km2 of the Opinaca area of James Bay, Quebec. The Éléonore West block consists of 34 mineral claims covering approximately 18 km2, while the Éléonore South block contains 248 claims extending over an area of approximately 130 km2. The project was a joint operation, and the project ownership was based on participation in the funding of annual exploration programs.
On February 29, 2024, the Company and Newmont, through their respective subsidiaries, entered into a new agreement whereby the Company acquired the remaining 49.978% held by Newmont, to hold 100% control of the interests, consolidating these properties into the Company’s portfolio.
| b) |
Nunavut |
Committee Bay
The Company, through its wholly owned subsidiary North Country, owns a 100% interest in the Committee Bay project located in Nunavut, Canada. The Committee Bay project includes approximately 250,000 hectares situated along the Committee Bay Greenstone Belt located within the Western Churchill province of Nunavut. The Committee Bay project is subject to a 1% Net Smelter Royalty (“NSR”) on gold production, with certain portions subject to an additional 1.5% NSR. The 1.5% NSR is payable on only 7,596 hectares and can be purchased by the Company within two years of commencement of commercial production for $2,000 for each one-third (0.5%) of the 1.5% NSR.
A summary of the carrying amounts is as follows:
| Quebec |
Nunavut |
Total |
||||||||||
| Balance at December 31, 2023 |
$ | 122,978 | $ | 19,661 | $ | 142,639 | ||||||
| Additions(a) |
3,030 | - | 3,030 | |||||||||
| Change in estimate of provision for site reclamation and closure |
(23 | ) | 427 | 404 | ||||||||
| Impairment (note 16) |
(88,885 | ) | (11,988 | ) | (100,873 | ) | ||||||
| Balance at December 31, 2024 |
$ | 37,100 | $ | 8,100 | $ | 45,200 | ||||||
| Additions (note 6) |
5,436 | - | 5,436 | |||||||||
| Change in estimate of provision for site reclamation and closure |
(597 | ) | (121 | ) | (718 | ) | ||||||
| Balance at December 31, 2025 |
$ | 41,939 | $ | 7,979 | $ | 49,918 | ||||||
(a) On February 29, 2024, the Company, and its joint operation partner Newmont, through their respective subsidiaries, closed a transaction whereby the Company acquired 100% control of the joint operation interests, the Éléonore South project, consolidating these properties into the Company’s portfolio at which time the joint venture operation was dissolved. The 49.978% that Newmont held was acquired by the Company for $3,000 while incurring $30 in transaction costs. As part of the same transaction, the Company also acquired a 10.9% interest in Sirios Resources Inc.
During October 2025, the Company received the first milestone payment from Benz Mining Corp (“Benz”) to acquire the remaining 25% interest (for a total 100% undivided interest) of the Eastmain Mine and Ruby Hill Properties. The payment of $1,100 consisted of $850 cash and Benz Common Shares with a market value at the time of $250.
| Note 11: |
Investments in associates |
| (a) |
Acquisition of investments in associates |
| (i) |
On February 25, 2022, the Company completed the sale of Homestake Resources Corporation to Dolly Varden for cash proceeds of $5,000 and 76,504,590 common shares of Dolly Varden. The Company’s resulting interest in Dolly Varden represented approximately 35.3% of the issued and outstanding common shares of Dolly Varden on February 25, 2022, which has been accounted for using the equity method. The Company recognized a gain of $48,390, net of transaction costs of $589, on the date of disposition. On October 13, 2022, the Company completed the sale of 17,000,000 common shares of Dolly Varden for total gross proceeds of $6,800. During the year ended December 31, 2024, the Company sold an aggregate 8,450,000 shares of Dolly Varden for net proceeds of $7,042. The Company’s investment was also diluted through financing rounds by Dolly Varden in which the Company did not participate. As a result, the Company had a gain on investments of $4,109 consisting of a realized gain on disposal of $2,026 and a gain on dilution of $2,083 for the year ended December 31, 2024. On April 2, 2025, Dolly Varden announced a four for one Common Share Consolidation which took effect on April 7, 2025. The impact of this was that the Company’s 51,054,590 Common Shares was consolidated into 12,763,648 Common Shares. On May 8, 2025, the Company completed the sale of 1,000,000 common shares of Dolly Varden for total gross proceeds of $3,700. On September 17, 2025, the Company completed the sale of 500,000 common shares of Dolly Varden for total gross proceeds of $2,914. During the year ended December 31, 2025, there has been a dilution gain on investments of $4,249 ( December 31, 2024 – $2,083), as well as a realized gain of $3,230 ( December 31, 2024 – $2,137). |
| (ii) |
On April 1, 2022, the Company purchased a 25% share interest in UMS, a private shared-services provider, for nominal consideration. The Company funded, in addition to its nominal investment in UMS, a cash deposit of $150 which is held by UMS for the purposes of general working capital, and which will be returned to the Company upon termination of the UMS Canada arrangement, net of any residual unfulfilled obligations. UMS is the private company through which its shareholders, including Fury Gold, share geological, financial, and transactional advisory services as well as administrative services on a full, cost recovery basis. |
| (b) |
Summarized financial information of the Company’s investments in associates: |
The carrying amounts of the Company’s investments in associates were as follows:
| Dolly Varden |
UMS |
Total |
||||||||||
| Carrying amount at December 31, 2023 |
$ | 36,126 | $ | 122 | $ | 36,248 | ||||||
| Company’s share of net loss of associates |
(3,837 | ) | (21 | ) | (3,858 | ) | ||||||
| Disposition |
(5,017 | ) | - | (5,017 | ) | |||||||
| Dilution gain |
2,083 | - | 2,083 | |||||||||
| Carrying amount at December 31, 2024 |
$ | 29,355 | $ | 101 | $ | 29,456 | ||||||
| Company’s share of net loss of associates |
(4,420 | ) | (13 | ) | (4,433 | ) | ||||||
| Disposition |
(3,310 | ) | - | (3,310 | ) | |||||||
| Dilution gain |
4,250 | - | 4,250 | |||||||||
| Carrying amount at December 31, 2025 |
$ | 25,875 | $ | 88 | $ | 25,963 | ||||||
The quoted fair market value of the Company’s equity interest in Dolly Varden at December 31, 2025 was $67,582 ( December 31, 2024 - $49,012) based on the closing share price on the TSX Venture Exchange on that date. Subsequent to year end, Dolly Varden was party to a merger of equals, further described under subsequent events (note 26).
For the year ended December 31, 2025, the Company’s equity share of net loss (income) of the Company’s associates on a 100% basis were as follows:
| Dolly Varden |
UMS |
Total |
||||||||||
| Cost recoveries |
$ | - | $ | (2,699 | ) | $ | (2,699 | ) | ||||
| Exploration and evaluation |
25,198 | 918 | 26,116 | |||||||||
| Marketing |
2,166 | - | 2,166 | |||||||||
| Share-based compensation |
2,182 | - | 2,182 | |||||||||
| Administrative and other |
2,192 | 1,833 | 4,025 | |||||||||
| Net loss of associate, 100% |
31,738 | 52 | 31,790 | |||||||||
| Average equity interest for the period |
13.93 | % | 25 | % | ||||||||
| Company’s share of net loss of associates |
$ | 4,420 | $ | 13 | $ | 4,433 | ||||||
For the year ended December 31, 2024, the Company’s equity share of net loss of the Company’s associates on a 100% basis were as follows:
| Dolly Varden |
UMS |
Total |
||||||||||
| Cost recoveries |
$ | - | $ | (3,508 | ) | $ | (3,508 | ) | ||||
| Exploration and evaluation |
17,875 | 1,208 | 19,083 | |||||||||
| Marketing |
1,781 | 131 | 1,912 | |||||||||
| Share-based compensation |
2,601 | - | 2,601 | |||||||||
| Administrative and other |
(1,608 | ) | 2,255 | 647 | ||||||||
| Net loss of associate, 100% |
20,649 | 86 | 20,735 | |||||||||
| Average equity interest for the period |
18.58 | % | 25 | % | ||||||||
| Company’s share of net loss of associates |
$ | 3,837 | $ | 21 | $ | 3,858 | ||||||
The Company’s equity share of net assets of associates at December 31, 2025, is as follows:
| Dolly Varden |
UMS |
|||||||
| Current assets |
$ | 62,718 | $ | 875 | ||||
| Non-current assets |
156,713 | 1,796 | ||||||
| Current liabilities |
(11,011 | ) | (1,256 | ) | ||||
| Non-current liabilities |
- | (1,067 | ) | |||||
| Net assets, 100% |
208,420 | 348 | ||||||
| Company’s equity share of net assets of associate |
$ | 25,875 | $ | 88 | ||||
| (c) |
Services rendered and balances with UMS |
| Years ended December 31 |
||||||||
| 2025 |
2024 |
|||||||
| Exploration and evaluation costs |
$ | 344 | $ | 233 | ||||
| General and administration |
232 | 307 | ||||||
| Total transactions for the year |
$ | 576 | $ | 540 | ||||
The outstanding balance owing at December 31, 2025, was $57 ( December 31, 2024 – $90) which is included in accounts payable and accrued liabilities.
As part of the UMS arrangement, the Company is contractually obliged to pay certain rental expenses in respect of a ten-year office lease entered into by UMS on July 1, 2021. As at December 31, 2025, the Company expects to incur approximately $77 in respect of its share of future rental expense of UMS.
The Company issues share options to certain UMS employees, including key management personnel of the Company (note 19). The Company recognized a share-based compensation expense of $11 for the year ended December 31, 2025, in respect of share options issued to UMS employees ( December 31, 2024 - $3 recovery) which is included within employee benefits and exploration and evaluation costs.
| Note 12: |
Deferred government grant |
On April 28, 2025, as part of the QPM acquisition (note 6), the Company inherited a grant entitlement from the Government of Quebec’s Minister of Natural Resources and Forestry (the “Minister”) for expenditures to be made by the Company for geometallurgical studies on the Elmer East property (the “Program”). The Program will fund up to 50% of the qualifying exploration expenses incurred by the Company up to a maximum grant of $268. On May 30, 2025, the Company received a progress payment for fiscal year 2025-2026 of $83. As at December 31, 2025, the Company has unspent funding of $22 relating to the progress payment, which will require the Company to incur $44 in qualifying expenses under the Program before March 31, 2026. The Company is obligated to reimburse the Minister, upon expiry of the Program, for any unapplied grant funding plus interest thereon.
On May 30, 2025, the Company, through its subsidiary, North Country Gold, was approved by the Government of Nunavut’s Minister of the Department of Community Services a contribution of up to $250 from its Discover, Invest, Grow Program in support of the Company’s exploration activities in the Three Bluffs Gold deposit and the Raven Gold Prospect. Expenses eligible must be incurred between May 30, 2025 to March 31, 2026. The Company received initial payment of $125 in August 2025. The remaining balance is payable upon approval of the expenditure report which must be submitted by March 31, 2026. The Company is obligated to return the initial payment if the Company is unable to prove sufficient spending on approved expenditures equalling to or exceeding the advance provided. As at December 31, 2025, the Company incurred $125 in eligible expenditures and, as a result, fully recognized the initial grant amount received.
| Note 13: |
Flow-through share premium liability |
Flow-through shares are issued at a premium, calculated as the difference between the price of a flow-through share and the price of a common share at that date. Tax deductions generated by eligible expenditures are passed through to the shareholders of the flow-through shares once the eligible expenditures are incurred and renounced.
On October 14, 2025, the Company completed two offerings (note 18) and raised $18,000 through the issuance of (i) 9,915,000 flow-through units and (ii) 6,003,000 common shares designated as flow-through shares. The flow-through proceeds will be used for the Company’s mineral exploration activities. The Company is committed to incur the full exploration expenditures of $18,000 before December 31, 2026.
On June 19, 2025, the Company completed an offering (note 18) and raised $3,080 through the issuance of 3,999,701 common shares designated as flow-through shares. The flow-through proceeds will be used for the Company’s mineral exploration activities. The Company is committed to incur the full exploration expenditures of $3,080 before December 31, 2026.
On June 13, 2024, the Company completed an offering (note 18) and raised $5,001 through the issuance of 5,320,000 common shares designated as flow-through shares. The flow-through proceeds will be used for mineral exploration in Quebec. The exploration expenditures of $5,001 was fully incurred as of April 30, 2025.
The flow-through share funding and expenditures along with the corresponding impact on the flow-through share premium liability were as follows:
| Flow-through funding (expenditures) |
Flow-through premium liability |
|||||||
| Balance at December 31, 2023 |
$ | 1,223 | $ | 544 | ||||
| Flow-through eligible expenditures |
(1,223 | ) | (544 | ) | ||||
| Flow-through funds raised |
5,001 | 2,022 | ||||||
| Flow-through eligible expenditures |
(2,666 | ) | (1,078 | ) | ||||
| Balance at December 31, 2024 |
$ | 2,335 | $ | 944 | ||||
| Flow-through eligible expenditures |
(2,335 | ) | (944 | ) | ||||
| Flow-through funds raised |
21,080 | 1,246 | ||||||
| Flow-through eligible expenditures |
(4,259 | ) | (456 | ) | ||||
| Balance at December 31, 2025 |
$ | 16,821 | $ | 790 | ||||
| Note 14: |
Provision for site reclamation and closure |
The Company recognizes a provision for site reclamation and closure, which reflects the present value of the estimated amount of cash flows required to satisfy the asset retirement obligation in respect of the Committee Bay and Quebec properties. The components of this obligation are the removal of equipment currently being used at the site as well as costs associated with the reclamation of the camp housing and work sites on the property. The estimate of future asset retirement obligations is subject to change based on amendments to applicable laws, management’s intentions, and mining lease renewals.
The key assumptions used to calculate the present value of the future estimated cash flows of the Company’s projects are as follows:
| ■ |
Undiscounted cash flow obligation for site reclamation of $6,226 ( December 31, 2024 – $7,013); |
| ■ |
Expected timing of future cash flows which is between the years 2026 and 2040; |
| ■ |
Annual inflation rates of 2.29% and 2.91% ( December 31, 2024 – 2.29% and 2.83%); and |
| ■ |
Risk-free interest rates of 3.85% and 3.11% ( December 31, 2024 – 3.33% and 3.23%). |
The present value of the liability for the site reclamation and closure provision for the Company’s projects was as follows:
| Quebec |
Nunavut |
Total |
||||||||||
| Balance at December 31, 2023 |
$ | 1,569 | $ | 2,926 | $ | 4,495 | ||||||
| Accretion |
50 | 96 | 146 | |||||||||
| Change in estimate |
(23 | ) | 427 | 404 | ||||||||
| Balance at December 31, 2024 |
$ | 1,596 | $ | 3,449 | $ | 5,045 | ||||||
| Addition |
216 | - | 216 | |||||||||
| Accretion |
41 | 106 | 147 | |||||||||
| Change in estimate |
(814 | ) | (121 | ) | (935 | ) | ||||||
| Balance at December 31, 2025 |
$ | 1,039 | $ | 3,434 | $ | 4,473 | ||||||
| Note 15: |
Segmented information - Exploration and evaluation costs |
For the year ended December 31, 2025, the Company’s exploration and evaluation costs were as follows:
| Quebec |
Nunavut |
Total |
||||||||||
| Assaying |
$ | 1,166 | $ | 233 | $ | 1,399 | ||||||
| Exploration drilling |
1,995 | 570 | 2,565 | |||||||||
| Camp cost, equipment and field supplies |
1,170 | 334 | 1,504 | |||||||||
| Geological consulting services |
477 | 245 | 722 | |||||||||
| Permitting, environmental and community costs |
216 | 191 | 407 | |||||||||
| Expediting and mobilization |
7 | 128 | 135 | |||||||||
| Salaries and wages |
1,580 | 504 | 2,084 | |||||||||
| Fuel and consumables |
665 | 905 | 1,570 | |||||||||
| Aircraft and travel |
1,256 | 1,067 | 2,323 | |||||||||
| Share-based compensation |
113 | 31 | 144 | |||||||||
| Total for the year ended December 31, 2025 |
$ | 8,645 | $ | 4,208 | $ | 12,853 | ||||||
For the years ended December 31, 2024, the Company’s exploration and evaluation costs were as follows:
| Quebec |
Nunavut |
Total |
||||||||||
| Assaying |
$ | 874 | $ | 100 | $ | 974 | ||||||
| Exploration drilling |
843 | - | 843 | |||||||||
| Camp cost, equipment and field supplies |
651 | 203 | 854 | |||||||||
| Geological consulting services |
7 | 51 | 58 | |||||||||
| Permitting, environmental and community costs |
122 | 172 | 294 | |||||||||
| Expediting and mobilization |
- | 22 | 22 | |||||||||
| Salaries and wages |
1,403 | 70 | 1,473 | |||||||||
| Fuel and consumables |
182 | 10 | 192 | |||||||||
| Aircraft and travel |
456 | 208 | 664 | |||||||||
| Share-based compensation |
128 | 10 | 138 | |||||||||
| Total for year ended December 31, 2024 |
$ | 4,666 | $ | 846 | $ | 5,512 | ||||||
| Note 16: |
Impairment |
A summary of the Company’s impairment expenses is as follows:
| Years ended December 31 |
||||||||
| 2025 |
2024 |
|||||||
| Impairment on mineral properties interests |
$ | - | $ | 100,873 | ||||
| Total transactions for the year |
$ | - | $ | 100,873 | ||||
As required under IFRS Accounting Standards as issued by the IASB, we regularly assess whether impairment indicators are present and perform impairment testing as required.
In accordance with the Company’s accounting policies and processes, each asset or CGU is evaluated annually, to determine whether there are any indications of impairment or impairment reversal. If any such indications of impairment exist, a formal estimate of the recoverable amount is performed. Given the Company’s persistent lower market capitalization compared to its mineral properties carrying value, the Company engaged a third-party valuation specialist, in consultation with management, to assess the recoverability of the carrying value of the Company’s properties. The Company assessed the recoverable value of the CGUs based on its fair value less cost of disposal (“FVLCD”).
The Company utilized a market approach, which takes into account valuations of similar public companies and comparable transactions, to determine a recoverable amount. The recoverable amount was calculated using in situ multiples identified through independent research. This analysis along with specific attributes of the Eau Claire and Committee Bay Project was used as the basis of determining a reasonable per ounce valuation for these to projects. The Éléonore South Project which did not have a Mineral Resource Estimate at the time, was valued through a primary market approach, based on its recent acquisition by the Company. The CGUs were categorised within the Level 3 of the fair value hierarchy, using a combination of inputs other than quoted prices which were observable and unobservable to determine the fair value of the assets.
Based on the Company’s assessment with respect to possible indicators of impairment, the Company concluded that as at December 31, 2024, impairment indicators exist and based on the impairment analysis performed, an impairment on its Quebec projects of $88,885 and Committee Bay project of $11,988 totaling $100,873 was recorded. Estimating the in-situ multiples requires a significant management judgement due to the high degree of estimation uncertainty. Changes in the inputs used to determine the recoverable amount will result in a change to the valuation of the mineral properties and impairment expense. A 15% change in the in-situ values used, would give rise to a 13% change in the mineral properties values.
The result of the impairment better aligned the carrying value of these properties to the Company’s market capitalization value as per the guidance of IFRS 6.20(d) as at December 31, 2024. There were no indicators of impairment or impairment reversal as at December 31, 2025.
| Note 17: |
Other income |
| Years ended December 31 |
||||||||
| 2025 |
2024 |
|||||||
| Government grant income (note 12) |
$ | 168 | $ | - | ||||
| Excess fuel resold |
- | 566 | ||||||
| Total transactions for the year |
$ | 168 | $ | 566 | ||||
| Note 18: |
Share capital |
| (a) |
Authorized |
Unlimited common shares without par value.
Unlimited preferred shares – nil issued and outstanding.
| (b) |
Share issuances |
During the year ended December 31, 2025:
| i. |
The Company issued 8,394,045 common shares as part of the QPM acquisition with a fair market value of $4,533. Transaction costs incurred in respect of the acquisition were $199 (note 6). |
| ii. |
The Company closed a non-brokered private equity placement for gross proceeds of $4,306, consisting of 6,728,000 units at C$0.64 per unit. Each unit consisted of one common share of Fury Gold and one common share purchase warrant exercisable to purchase one Fury Gold common share at C$0.80 for a period of three years. Share issuance costs incurred in respect of the private placement were $123. |
| iii. |
156,000 shares were issued as a result of share options being exercised with a weighted average exercise price of C$0.55 for gross proceeds of $85. The amount of $43 attributed to these share options was transferred from the equity reserves and recorded against share capital. |
| iv. |
75,000 shares were issued as a result of share options being exercised with a weighted average exercise price of C$0.55 for gross proceeds of $41. The amount of $21 attributed to these share options was transferred from the equity reserves and recorded against share capital. |
| v. |
During June 2025, the Company issued 3,999,701 flow-through shares for gross proceeds of $3,080 ( “June 2025 Offering”). Share issuance costs related to the June 2025 Offering totaled $223, which included $183 in commissions and $40 in other issuance costs. A reconciliation of the impact of the June 2025 Offering on share capital is as follows: |
| Number of common shares |
Impact on share capital |
|||||||
| Flow-through shares issued at C$0.77 per share |
3,999,701 | $ | 3,080 | |||||
| Cash share issue costs |
- | (223 | ) | |||||
| Proceeds net of share issue costs |
3,999,701 | 2,857 | ||||||
| Less: flow-through share premium liability (note 13) |
- | (400 | ) | |||||
| Total allocated to share capital |
3,999,701 | $ | 2,457 | |||||
| vi. |
In connection with the June 2025 Offering, a certain shareholder of the Company exercised its existing participation rights and acquired 440,000 Fury Gold common shares at a price of C$0.67 per share for gross proceeds of $295. |
| vii. |
During Oct 2025, the Company issued (i) 9,915,000 flow-through units at a price of C$1.21 per unit and (ii) 6,003,000 flow-through at a price of C$1.00 per share, for total aggregate gross proceeds of $18,000 ( “Oct 2025 Offering”). Each unit consists of one common share of Fury Gold and one-half common share purchase warrant, two of which is exercisable to purchase one additional common share at C$1.20 per warrant share for a period of two years. Share issuance costs related to the Oct 2025 Offering totaled $1,396, which included $1,198 in commissions and $198 in other issuance costs. A reconciliation of the impact of the Oct 2025 Offering on share capital is as follows: |
| Number of common shares |
Impact on share capital |
|||||||
| Flow-through shares issued at C$1.21 and C$1.00 per share |
15,918,000 | $ | 18,000 | |||||
| Cash share issue costs |
- | (1,396 | ) | |||||
| Proceeds net of share issue costs |
15,918,000 | 16,604 | ||||||
| Less: fair value of warrants issued |
- | (1,296 | ) | |||||
| Less: flow-through share premium liability (note 13) |
- | (846 | ) | |||||
| Total allocated to share capital |
15,918,000 | $ | 14,462 | |||||
| viii. |
The Company closed a non-brokered private equity placement for gross proceeds of $1,300, consisting of 1,494,253 units at C$0.87 per unit. Each unit consists of one common share of Fury Gold and one-half common share purchase warrant, two of which is exercisable to purchase one additional common share at C$1.20 per warrant share for a period of two years. Share issuance costs incurred in respect of the private placement were $78. |
During the year ended December 31, 2024:
During June 2024, the Company issued 5,320,000 flow-through shares for gross proceeds of $5,001 ( “June 2024 Offering”). Share issuance costs related to the June 2024 Offering totaled $533, which included $300 in commissions and $233 in other issuance costs. A reconciliation of the impact of the June 2024 Offering on share capital is as follows:
| Number of common shares |
Impact on share capital |
|||||||
| Flow-through shares issued at C$0.94 per share |
5,320,000 | $ | 5,001 | |||||
| Cash share issue costs |
- | (533 | ) | |||||
| Proceeds net of share issue costs |
5,320,000 | 4,468 | ||||||
| Less: flow-through share premium liability (note 13) |
- | (2,022 | ) | |||||
| Total allocated to share capital |
5,320,000 | $ | 2,446 | |||||
| Note 19: |
Share-based compensation and warrant reserve |
| (a) |
Share-based compensation expense |
The Company uses the fair value method of accounting for all share-based payments to directors, officers, employees, and other service providers. During the year ended December 31, 2025 and 2024, the Company recognized share-based compensation expense as follows:
| Years ended December 31 |
||||||||
| 2025 |
2024 |
|||||||
| Recognized in net loss and included in: |
||||||||
| Exploration and evaluation costs |
$ | 143 | $ | 138 | ||||
| Fees, salaries and other employee benefits |
569 | 721 | ||||||
| Total share-based compensation expense |
$ | 712 | $ | 859 | ||||
During the year ended December 31, 2025, the Company granted 140,000 share options, ( December 31, 2024 – 245,000), to certain employees and consultants who provide defined on-going services to the Company, representative of employee service. In addition, during the year ended December 31, 2025, QPM options were converted to 282,470 share options of the Company.
The weighted average fair value per option of these share options was calculated as C$0.37 ( December 31, 2024 – C$0.31) using the Black-Scholes option valuation model at the grant date with the following weighted average assumptions:
| Years ended December 31 |
||||||||
| 2025 |
2024 |
|||||||
| Risk-free interest rate |
2.99 | % | 3.45 | % | ||||
| Expected dividend yield |
Nil |
Nil |
||||||
| Share price volatility |
71 | % | 70 | % | ||||
| Expected life in years |
5.0 | 5.0 | ||||||
The risk-free interest rate assumption is based on the Government of Canada benchmark bond yields and treasury bills with a remaining term that approximates the expected life of the share-based options. The expected volatility assumption is based on the historical and implied volatility of the Company’s common shares. The expected forfeiture rate and the expected life in years are based on historical trends.
In connection with the QPM Acquisition, all outstanding and vested share options of QPM were exchanged for replacement share options of the Company, in amount and at exercise prices adjusted in accordance with the Exchange Ratio. As a result, 282,470 share options with a nominal fair value were granted and vested immediately.
The number of share options issued and outstanding and the weighted average exercise price were as follows:
| Number of share options |
Weighted average exercise price (C$/option) |
|||||||
| Outstanding, December 31, 2023 |
9,951,602 | $ | 1.23 | |||||
| Granted |
245,000 | 0.56 | ||||||
| Expired |
(472,937 | ) | 1.92 | |||||
| Forfeited |
(1,502,487 | ) | 1.40 | |||||
| Outstanding, December 31, 2024 |
8,221,178 | $ | 1.14 | |||||
| Granted | 140,000 | 0.65 | ||||||
| Granted as part of QPM acquisition |
282,470 | 1.92 | ||||||
| Exercised |
(231,000 | ) | 0.55 | |||||
| Expired |
(1,838,144 | ) | 2.00 | |||||
| Forfeited |
(235,000 | ) | 1.12 | |||||
| Outstanding, December 31, 2025 |
6,339,504 | $ | 0.94 | |||||
As at December 31, 2025, the number of share options outstanding was as follows:
| Options outstanding |
Options exercisable |
|||||||||||||||||||||||
| Exercise price ($/option) |
Number of shares |
Weighted average exercise price (C$/option) |
Weighted average remaining life (years) |
Number of shares |
Weighted average exercise price (C$/option) |
Weighted average remaining life (years) |
||||||||||||||||||
| C$0.53 – C$1.00 |
3,689,500 | 0.83 | 1.78 | 3,629,500 | 0.83 | 1.74 | ||||||||||||||||||
| C$1.00 – C$1.85 |
2,616,659 | 1.06 | 1.14 | 2,616,659 | 1.06 | 1.14 | ||||||||||||||||||
| C$2.05 – C$3.91 |
33,345 | 3.37 | 0.49 | 33,345 | 3.37 | 0.49 | ||||||||||||||||||
| 6,339,504 | 0.94 | 1.51 | 6,279,504 | 0.94 | 1.48 | |||||||||||||||||||
| (b) |
Long-term incentive plan |
In addition to options, the Company also granted RSU’s to officers and employees.
On June 29, 2023, the Company adopted a Long-Term Incentive Plan (“LTI Plan”) which strives to accelerate and encourage additional share ownership by its employees, officers and directors. The LTI plan provides for the awarding of share options, performance share units, restricted share units and deferred share units. The LTI Plan limits the number of shares reserved for issuance under the LTI Plan, together with all other security-based compensation arrangements of the Company, to a maximum of 10% of the Common Shares issued and outstanding.
On January 9, 2025, the Company issued 590,000 DSU’s to directors and 1,142,500 RSU’s to officers and employees. The DSU’s and RSU’s were issued in accordance with the Company’s LTI plan, with a grant-date fair value of C$0.55 per unit, one third vesting annually on anniversary.
On January 31, 2024, the Company issued 273,542 RSU’s to an officer. The RSU’s were issued in accordance with the Company’s LTI plan, which vested on the same day and paid out as fully paid shares.
On January 9, 2024, the Company issued 1,318,623 RSU’s to directors, officers, and employees. The RSU’s were issued in accordance with the Company’s LTI plan, one third vesting annually on the anniversary and paid out as fully paid shares. The Company also approved 235,080 RSU’s to directors, which were fully vested and paid out as fully paid shares in 2024.
The number of RSU’s and DSU’s issued and outstanding and the weighted average grant date fair value were as follows:
| Number of RSU’s |
Number of DSU’s |
Weighted Average grant date fair value ($/ share) |
||||||||||
| Outstanding, December 31, 2023 |
- | - | $ | - | ||||||||
| Granted |
1,827,245 | - | 0.57 | |||||||||
| Settled |
(491,478 | ) | - | 0.59 | ||||||||
| Forfeited |
(189,687 | ) | - | 0.57 | ||||||||
| Outstanding, December 31, 2024 |
1,146,080 | - | $ | 0.57 | ||||||||
| Granted |
1,142,500 | 590,000 | 0.55 | |||||||||
| Settled |
(382,027 | ) | - | 0.53 | ||||||||
| Forfeited |
(179,597 | ) | (110,000 | ) | 0.56 | |||||||
| Outstanding, December 31, 2025 |
1,726,956 | 480,000 | $ | 0.56 | ||||||||
| (c) |
Share purchase warrants |
In connection with the QPM Acquisition (note 6), all warrants of QPM became exercisable to acquire common shares of the Company, in amounts and at exercise prices adjusted in accordance with the Exchange Ratio. As a result, 596,808 warrants, each exercisable into one Fury Gold share, were granted at an exercise price of C$1.35 per share. The total fair value of the warrants issued was $30, calculated using the Black-Scholes valuation model with the following inputs: (i) expected life – 2.12 years; (ii) expected volatility – 57%; (iii) expected dividend yield – 0%; (iv) risk-free interest rate – 2.56%; (v) share price – C$0.54.
In connection with a non-brokered private equity placement (note 18), the Company issued 6,728,000 warrants exercisable into one common share of the Company at a price of C$0.80 for a period of three years. The warrants were classified as equity instruments under IAS 32 and measured at a fair value of $949, calculated using the Black-Scholes valuation model with the following inputs: (i) expected life – 3 years; (ii) expected volatility – 58%; (iii) expected dividend yield – 0%; (iv) risk-free interest rate – 2.7%; (v) share price – C$0.51.
In connection with a non-brokered private equity placement (note 18), the Company issued 747,127 warrants exercisable into one common share of the Company at a price of C$1.20 for a period of two years. The warrants were classified as equity instruments under IAS 32 and measured at a fair value of $125, calculated using the Black-Scholes valuation model with the following inputs: (i) expected life – 2 years; (ii) expected volatility – 63%; (iii) expected dividend yield – 0%; (iv) risk-free interest rate – 2.5%; (v) share price – C$0.77.
The number of share purchase warrants outstanding at December 31, 2025 was as follows:
| Warrants outstanding |
Weighted average exercise price (C$/share) |
|||||||
| Outstanding, December 31, 2023 |
7,461,450 | $ | 1.20 | |||||
| Expired |
(7,461,450 | ) | 1.20 | |||||
| Outstanding, December 31, 2024 |
- | - | ||||||
| Issued |
13,029,435 | 1.00 | ||||||
| Outstanding, December 31, 2025 |
13,029,435 | $ | 1.00 | |||||
The following table reflects the share purchase warrants issued and outstanding as at December 31, 2025:
| Expiry date |
Warrants outstanding |
Exercise price (C$/share) |
||||||
| May 31, 2027 |
274,170 | $ | 1.35 | |||||
| June 21, 2027 |
322,638 | 1.35 | ||||||
| October 14, 2027 |
4,957,500 | 1.20 | ||||||
| November 12, 2027 |
747,127 | 1.20 | ||||||
| May 26, 2028 |
6,728,000 | 0.80 | ||||||
| Total |
13,029,435 | $ | 1.00 | |||||
| Note 20: |
Key management personnel |
Key management personnel include Fury Gold’s board of directors and certain executive officers of the Company, including the CEO, Chief Financial Officer (“CFO”) and Senior Vice President, Exploration.
The remuneration of the Company’s key management personnel was as follows:
| Years ended December 31 |
||||||||
| 2025 |
2024 |
|||||||
| Short-term benefits provided to executives (a) |
$ | 1,453 | $ | 1,306 | ||||
| Directors’ fees paid to non-executive directors |
251 | 161 | ||||||
| Share-based payments |
594 | 724 | ||||||
| Total |
$ | 2,298 | $ | 2,191 | ||||
(a) Short-term employee benefits include salaries, bonuses payable within twelve months of the date of the consolidated statements of financial position, and other annual employee benefits.
| Note 21: |
Supplemental cash flow information |
The impact of changes in non-cash working capital was as follows:
| Years ended December 31 |
||||||||
| 2025 |
2024 |
|||||||
| Accounts receivable |
$ | (180 | ) | $ | 321 | |||
| Prepaid expenses and deposits |
8 | 104 | ||||||
| Accounts payable and accrued liabilities |
568 | (15 | ) | |||||
| Deferred government grant |
(43 | ) | - | |||||
| Changes in non-cash working capital |
$ | 353 | $ | 410 | ||||
Operating activities include the following cash received:
| Years ended December 31 |
||||||||
| 2025 |
2024 |
|||||||
| Income taxes refunded |
$ | (182 | ) | $ | (193 | ) | ||
| Income taxes paid |
18 | - | ||||||
| Income tax expense (recovery) |
$ | (164 | ) | $ | (193 | ) | ||
| Note 22: |
Loss per share |
For the years ended December 31, 2025 and 2024, the weighted average number of shares outstanding and loss per share were as follows:
| Years ended December 31 |
||||||||
| 2025 |
2024 |
|||||||
| Net loss |
$ | 6,459 | $ | 108,138 | ||||
| Weighted average basic number of shares outstanding |
167,732,678 | 149,019,020 | ||||||
| Basic loss per share |
$ | 0.04 | $ | 0.73 | ||||
| Weighted average diluted number of shares outstanding |
167,732,678 | 149,019,020 | ||||||
| Diluted loss per share |
$ | 0.04 | $ | 0.73 | ||||
All of the outstanding share options and share purchase warrants at December 31, 2025 were anti-dilutive for the period then ended as the Company was in a loss position.
| Note 23: |
Financial instruments |
The Company’s financial instruments as at December 31, 2025, consisted of cash, marketable securities, accounts receivable, other investments, deposits, and accounts payable and accrued liabilities. The fair values of these financial instruments approximate their carrying values, unless otherwise noted.
| (a) |
Financial assets and liabilities by categories |
| At December 31, 2025 |
At December 31, 2024 |
|||||||||||||||||||||||
| Amortized Cost |
FVTPL |
Total |
Amortized Cost |
FVTPL |
Total |
|||||||||||||||||||
| Cash |
$ | 21,197 | $ | - | $ | 21,197 | $ | 4,912 | $ | - | $ | 4,912 | ||||||||||||
| Marketable securities |
- | 7,783 | 7,783 | - | 2,358 | 2,358 | ||||||||||||||||||
| Other investments |
- | 2,031 | 2,031 | - | 2,063 | 2,063 | ||||||||||||||||||
| Deposits |
66 | 66 | 191 | - | 191 | |||||||||||||||||||
| Accounts receivable |
395 | 395 | 54 | - | 54 | |||||||||||||||||||
| Total financial assets |
$ | 21,658 | $ | 9,814 | $ | 31,472 | $ | 5,157 | $ | 4,421 | $ | 9,578 | ||||||||||||
| Accounts payable and accrued liabilities |
(2,023 | ) | - | (2,023 | ) | 855 | - | 855 | ||||||||||||||||
| Deferred government grant |
(22 | ) | (22 | ) | - | - | - | |||||||||||||||||
| Total financial liabilities |
$ | (2,045 | ) | $ | - | $ | (2,045 | ) | $ | 855 | $ | - | $ | 855 | ||||||||||
| (b) |
Financial assets and liabilities measured at fair value |
The categories of the fair value hierarchy that reflect the significance of inputs used in making fair value measurements are as follows:
Level 1 – fair values based on unadjusted quoted prices in active markets for identical assets or liabilities;
Level 2 – fair values based on inputs that are observable for the asset or liability, either directly or indirectly; and
Level 3 – fair values based on inputs for the asset or liability that are not based on observable market data.
The Company’s policy to determine when a transfer occurs between levels is to assess the impact at the date of the event or the change in circumstances that could result in a transfer. No transfers occurred between the levels during the year.
As at December 31, 2025, the Company’s financial instruments measured at fair value on a recurring basis were the Company’s marketable securities which were classified as Level 1, and other investments which were classified as Level 3. There were no financial assets or financial liabilities measured and recognized in the consolidated statements of financial position at fair value that would be categorized as level 2 in the fair value hierarchy.
| Level 1 |
Level 2 |
Level 3 |
Total |
|||||||||||||
| Marketable securities |
7,783 | - | - | 7,783 | ||||||||||||
| Other investments |
- | - | 2,031 | 2,031 | ||||||||||||
| Total |
7,783 | - | 2,031 | 9,814 | ||||||||||||
The Company’s level 3 unquoted equity was valued using the adjusted market multiple method. Key input included market-based proxy valuation from comparable listed peers, adjusted for differences in growth stages of 0.4, revenue maturity of 0.5, and market conditions of 0.75. Currency translation as at reporting date was also included in the calculation. Changes in these adjustments would affect the resulting fair value of the instrument. As an example, a 10% increase in revenue maturity would increase fair value by $406. Fair value measurement and changes in fair value from period to period are reviewed for reasonability by management each reporting period.
The reconciliation of the Company’s level 3 financial instrument is as follows:
| Total |
||||
| Balance at December 31, 2023 |
$ | - | ||
| Additions |
2,063 | |||
| Balance at December 31, 2024 |
$ | 2,063 | ||
| Revaluation recognized in net loss for the year |
(32 | ) | ||
| Balance at December 31, 2025 |
$ | 2,031 | ||
| (c) |
Financial instruments and related risks |
The Company’s financial instruments are exposed to liquidity risk, credit risk and market risks, which include currency risk, interest rate risk and price risk. As at December 31, 2025, the primary risks were as follows:
Liquidity risk
Liquidity risk is the risk that the Company will encounter difficulty in meeting obligations associated with financial liabilities. The Company proactively manages its capital resources and has in place a budgeting and cash management process to help determine the funds required to ensure the Company has the appropriate liquidity to meet its current exploration plans and achieve its growth objectives. The Company ensures that there is sufficient liquidity available to meet its short-term business requirements, taking into account its anticipated cash outflows from exploration activities, and its holdings of cash and marketable securities. The Company monitors and adjusts, when required, these exploration programs as well as corporate administrative costs to ensure that adequate levels of working capital are maintained.
As at December 31, 2025, the Company had unrestricted cash of $21,197 ( December 31, 2024 – $4,912), working capital surplus of $29,162 ( December 31, 2024 – $8,045), which the Company defines as current assets less current liabilities, and an accumulated deficit of $263,651 ( December 31, 2024 – $257,192). During the year ended December 31, 2025, Fury Gold incurred a comprehensive loss of $6,478 ( December 31, 2024 – $108,141). The Company expects to incur future operating losses in relation to exploration activities. With no source of operating cash flow, there is no assurance that sufficient funding will be available to conduct further exploration of its mineral properties.
The Company’s contractual obligations are as follows:
| Within 1 year |
2 to 3 years |
Over 3 years |
At December 31, 2025 |
At December 31, 2024 |
||||||||||||||||
| Accounts payable and accrued liabilities |
$ | 2,023 | $ | - | $ | - | $ | 2,023 | $ | 855 | ||||||||||
| Deferred government grant |
22 | - | - | 22 | - | |||||||||||||||
| Flow-through expenditure requirements |
790 | - | - | 790 | 944 | |||||||||||||||
| Undiscounted lease payments |
- | - | - | - | 65 | |||||||||||||||
| Total |
$ | 2,835 | $ | - | $ | - | $ | 2,835 | $ | 1,864 | ||||||||||
The Company also makes certain payments arising on mineral claims and leases on an annual or bi-annual basis to ensure all the Company’s properties remain in good standing. Cash payments of $341 were made during the year ended December 31, 2025, in respect of these mineral claims ( December 31, 2024 - $212), with $49 recognized in prepaid expenses as at December 31, 2025 ( December 31, 2024 – $27).
Credit risk
The Company’s cash and accounts receivables are exposed to credit risk, which is the risk that the counterparties to the Company’s financial instruments will cause a loss to the Company by failing to pay their obligations. The amount of credit risk to which the Company is exposed is considered insignificant as the Company’s cash is held with highly rated financial institutions in interest-bearing accounts and the accounts receivable primarily consist of sales tax receivables.
Market risk
This is the risk that the fair value or future cash flows of a financial instrument will fluctuate because of changes in market prices. The significant market risks to which the Company is exposed are as follows:
| i. |
Currency risk |
The Company is exposed to currency risk by having balances and transactions in currencies that are different from the relevant functional currency (the Canadian dollar). The Company’s foreign currency exposure related to its financial assets and liabilities held in US dollars was as follows:
| At December 31, 2025 |
At December 31, 2024 |
|||||||
| Financial assets |
||||||||
| US$ bank accounts |
$ | 19 | $ | 1 | ||||
| Financial liabilities |
||||||||
| Accounts payable |
(244 | ) | - | |||||
| $ | (225 | ) | $ | 1 | ||||
A 10% increase or decrease in the US dollar to Canadian dollar exchange rate would not have a material impact on the Company’s net loss.
| ii. |
Price risk |
The Company holds certain investments in marketable securities (note 8) which are measured at fair value, being the closing share price of each equity security at the date of the consolidated statements of financial position. The Company is exposed to changes in share prices which would result in gains and losses being recognized in the loss for the year. A 10% increase or decrease in the Company’s marketable securities share prices would not have a material impact on the Company’s net loss.
| Note 24: |
Management of capital |
The Company’s objectives when managing capital are to safeguard the Company’s ability to continue as a going concern in order to pursue exploration of resource properties and to maintain a flexible capital structure which optimizes the costs of capital at an acceptable risk.
The Company manages the capital structure and makes adjustments to it in light of changes in economic conditions and the risk characteristics of the underlying assets. To maintain or adjust the capital structure, the Company may issue new shares or debt, acquire or dispose of assets, or adjust the amount of cash and investments.
In order to maximize ongoing exploration efforts, the Company does not pay out dividends, does not have any long-term debt, and is not subject to any externally imposed capital requirements. The capital of the Company was determined as follows:
| Years ended December 31 |
||||||||
| 2025 |
2024 |
|||||||
| Equity |
$ | 101,011 | $ | 78,203 | ||||
| Less: cash |
(21,197 | ) | (4,912 | ) | ||||
| $ | 79,814 | $ | 73,291 | |||||
The Company expects its capital resources to support its current forecasted project expenditures at the Eau Claire project and the Committee Bay project and other corporate activities. While the Company has been successful at raising capital in the past, there can be no assurance that the Company will have sufficient financing to meet its future capital requirements or that additional financing will be available on terms acceptable to the Company in the future.
| Note 25: |
Income taxes |
The reconciliation of the income tax recovery computed at statutory rates to the reported income tax recovery is:
| Years ended December 31 |
||||||||
| 2025 |
2024 |
|||||||
| (Earnings) Loss before income taxes |
$ | 6,623 | $ | 108,331 | ||||
| Canadian federal and provincial income tax rates |
27 | % | 27 | % | ||||
| Expected income tax expense (recovery) |
(1,788 | ) | (29,250 | ) | ||||
| Increase (decrease) in income tax recovery resulting from: |
||||||||
| Acquisition of Quebec Precious Metals |
(13,452 | ) | - | |||||
| Impairment |
- | 23,555 | ||||||
| Share-based compensation |
192 | 197 | ||||||
| Share issuance costs |
(490 | ) | (144 | ) | ||||
| Adjustment to tax estimates |
192 | (45 | ) | |||||
| Amortization of flow-through share premium |
(379 | ) | (439 | ) | ||||
| Flow-through expenditures renunciation |
1,724 | 1,033 | ||||||
| Difference in future and foreign tax rates |
38 | 466 | ||||||
| Sale of investments |
(97 | ) | (119 | ) | ||||
| Other |
(887 | ) | 7 | |||||
| Increase (decrease) in unrecognized tax asset |
14,782 | 4,546 | ||||||
| Income tax expense (recovery) |
$ | (164 | ) | $ | (193 | ) | ||
Significant components of deferred tax asset and liabilities are:
| December 31 2024 |
Net loss |
December 31 2025 |
||||||||||
| Deferred income tax assets |
||||||||||||
| Non-capital losses carried forward |
$ | 15,182 | $ | 6,156 | $ | 21,338 | ||||||
| Capital losses carried forward |
49 | (42 | ) | 7 | ||||||||
| Share issuance costs and CEC |
290 | 306 | 596 | |||||||||
| Investments |
60 | 19 | 79 | |||||||||
| Investments in associates |
1,488 | (168 | ) | 1,320 | ||||||||
| Site reclamation obligations |
1,354 | (151 | ) | 1,203 | ||||||||
| Property and equipment |
531 | 70 | 601 | |||||||||
| Mineral property interests |
8,234 | 9,336 | 17,570 | |||||||||
| Capital lease obligation |
18 | (18 | ) | - | ||||||||
| Other |
- | 11 | 11 | |||||||||
| 27,206 | 15,518 | 42,724 | ||||||||||
| Deferred income tax liabilities |
||||||||||||
| Property and equipment |
3 | (3 | ) | - | ||||||||
| Mineral property interests |
(282 | ) | 54 | (228 | ) | |||||||
| Investments |
- | (787 | ) | (787 | ) | |||||||
| Net deferred tax assets |
26,927 | 14,782 | 41,709 | |||||||||
| Unrecognized deferred tax assets |
(26,927 | ) | (14,782 | ) | (41,709 | ) | ||||||
| Net deferred tax balance |
$ | - | $ | - | $ | - | ||||||
| December 31 2023 |
Net loss |
December 31 2024 |
||||||||||
| Deferred income tax assets |
||||||||||||
| Non-capital losses carried forward |
$ | 14,192 | $ | 990 | $ | 15,182 | ||||||
| Capital losses carried forward |
55 | (6 | ) | 49 | ||||||||
| Share issuance costs and CEC |
356 | (66 | ) | 290 | ||||||||
| Investments |
98 | (38 | ) | 60 | ||||||||
| Investments in associates |
1,472 | 16 | 1,488 | |||||||||
| Site reclamation obligations |
1,206 | 148 | 1,354 | |||||||||
| Property and equipment |
479 | 52 | 531 | |||||||||
| Mineral property interests |
5,003 | 3,231 | 8,234 | |||||||||
| Capital lease obligation |
61 | (43 | ) | 18 | ||||||||
| $ | 22,922 | 4,284 | 27,206 | |||||||||
| Deferred income tax liabilities |
||||||||||||
| Property and equipment |
(24 | ) | 27 | 3 | ||||||||
| Mineral property interests |
(517 | ) | 235 | (282 | ) | |||||||
| Net deferred tax assets |
22,381 | 4,546 | 26,927 | |||||||||
| Unrecognized deferred tax assets |
(22,381 | ) | (4,546 | ) | (26,927 | ) | ||||||
| Net deferred tax balance |
$ | - | $ | - | $ | - | ||||||
The Company has accumulated non-capital tax losses of approximately $80,650 ( December 31, 2024 – $57,721) in Canada, which may be carried forward to reduce taxable income of future years. The non-capital tax losses will, if unused, expire between 2026 and 2045. The Company has not recognized any deferred tax assets at December 31, 2025, in respect of these non-capital losses due to the uncertainty that future operations will generate sufficient taxable income to utilize these non-capital losses.
The Company has $nil accumulated tax capital losses ( December 31, 2024 – $67) in Canada which may be carried forward indefinitely and used to reduce capital gains in future years.
| Note 26: |
Subsequent events |
On January 9, 2026, the Company issued 430,000 DSU’s to directors and 885,000 RSU’s to officers, and employees. The DSU’s and RSU’s were issued in accordance with the Company’s LTI plan (note 19), one third vesting annually on anniversary. The Company also approved 110,000 stock options, vesting over 18 months with an exercise price of C$0.84 per option, to certain UMS employees.
On January 26, 2026, the Company announced the appointment of Mr. Phillips S. Baker Jr. to its Board of Directors as an independent director. The Company also issued 100,000 DSU’s to Mr. Baker on his appointment.
On March 17, 2026, an earlier announced merger of equals between Dolly Varden and Contango ORE Inc (“Contango”) was approved at a shareholders meeting. Dolly Varden received regulatory approval on March 23, 2026 while the merger closed on March 26, 2026. As a result, the Company’s shareholding in Dolly Varden was converted into shares of Contango at a rate of 0.1652 Contango shares for each Dolly Varden share while converting from an investment in associate to marketable securities. The fair value of the Contango shares was $43.3M as at March 23, 2026. The carrying value of the Dolly Varden investment in associate was $25,875 as at December 31, 2025. The Company's shareholding in Contango represents roughly 5.8% ownership and does not constitute significant influence.
Exhibit 99.3
(An exploration company)
MANAGEMENT’S DISCUSSION AND ANALYSIS
FOR THE YEAR ENDED DECEMBER 31, 2025
MANAGEMENT’S DISCUSSION AND ANALYSIS
OF FINANCIAL CONDITION AND RESULTS OF OPERATIONS
FOR THE YEAR ENDED DECEMBER 31, 2025
This Management’s Discussion and Analysis (the “MD&A”) for Fury Gold Mines Limited (“Fury Gold” or the “Company”) should be read in conjunction with the consolidated financial statements of the Company and related notes thereto for the year ended December 31, 2025. The consolidated financial statements have been prepared in accordance with the IFRS® Accounting Standards as issued by the International Accounting Standards Board (“IASB”) and interpretations issued by the IFRS Interpretations Committee (“IFRIC”). All dollar amounts presented are expressed in thousands of Canadian dollars unless otherwise stated. Amounts presented in this MD&A may be rounded. The effective date of this MD&A is March 31, 2026.
| SECTION 1: FORWARD-LOOKING STATEMENTS AND RISK FACTORS | 2 |
| SECTION 2: BUSINESS OVERVIEW | 5 |
| SECTION 3: 2025 HIGHLIGHTS AND SUBSEQUENT EVENTS | 5 |
| SECTION 4: PROJECTS OVERVIEW | 10 |
| SECTION 5: REVIEW OF ANNUAL FINANCIAL INFORMATION | 17 |
| SECTION 6: REVIEW OF QUARTERLY FINANCIAL INFORMATION | 19 |
| SECTION 7: FINANCIAL POSITION, LIQUIDITY, AND CAPITAL RESOURCES | 20 |
| SECTION 8: FINANCIAL RISK SUMMARY | 26 |
| SECTION 9: RELATED PARTY TRANSACTIONS AND BALANCES | 26 |
| SECTION 10: CRITICAL ACCOUNTING ESTIMATES AND JUDGMENTS | 27 |
| SECTION 11: APPLICATION OF NEW AND REVISED ACCOUNTING STANDARDS | 29 |
| SECTION 12: CONTROLS AND PROCEDURES | 29 |
|
Fury Gold Mines Limited Results of Operations for the Year Ended December 31, 2025 (Amounts expressed in thousands of Canadian dollars, unless otherwise noted) |
Section 1: Forward-looking statements and risk factors
1.1 Forward-looking statements
Certain statements made in this MD&A contain forward-looking information within the meaning of applicable Canadian and United States securities laws (“forward-looking statements”). These forward-looking statements are presented for the purpose of assisting the Company’s securityholders and prospective investors in understanding management’s views regarding those future outcomes and may not be appropriate for other purposes. When used in this MD&A, the words “may”, “would”, “could”, “will”, “intend”, “plan”, “anticipate”, “believe”, “seek”, “propose”, “estimate”, “expect”, and similar expressions, as they relate to the Company, are intended to identify forward-looking statements. Specific forward-looking statements in this MD&A include, but are not limited to: the Company’s exploration plans and objectives and the timing and costs of these plans; future capital expenditures and requirements, and sources and timing of additional financing; the timing, costs and success of the Company’s exploration activities, estimates of the Company’s mineral resources; the realization of mineral resource estimates; any objectives, expectations, intentions, plans, results, levels of activity, goals or achievements; capital expenditures; the Company’s plans for its marketable securities in Dolly Varden Silver Corporation and Sirios Resources Inc. and the realization of carrying values of these and any other securities held for resale. Additional factors include liabilities related to unused tax benefits or flow-through obligations; statements relating to the business, operations or prospects of the Company; and other events or conditions that may occur in the future.
The forward-looking statements contained in this MD&A represent the Company’s views only as of the date hereof and may change. Many assumptions are subject to risks and uncertainties, and so may prove to be incorrect, including the Company’s budget, including expected costs and the assumptions regarding market conditions and other factors upon which the Company has based its expenditure expectations; the Company’s ability to complete its planned exploration activities with its available working capital; the Company’s ability to raise additional capital to proceed with its exploration plans; the Company’s ability to obtain or renew the licences and permits necessary for exploration; the Company’s ability to obtain all necessary regulatory approvals, permits and licences for its planned exploration activities under governmental and other applicable regulatory regimes including the legally, mandated consultation process with affected First Nations; the Company’s ability to complete and successfully integrate acquisitions; the effects of climate change, extreme weather events, tariffs, water scarcity, and seismic events, and the effectiveness of strategies to deal with these issues; the Company’s expectations regarding the demand for, and supply and price of, precious metals; the Company’s ability to recruit and retain qualified personnel; the Company’s resource estimates, and the assumptions upon which they are based; the Company’s ability to comply with current and future environmental, safety and other regulatory requirements.
The foregoing is not an exhaustive list of the risks and other factors that may affect any of the Company’s forward-looking statements. Readers should refer to the risks discussed herein and in the Company’s Annual Information Form (the “Annual Information Form”) for the year ended December 31, 2025, subsequent disclosure filings with the Canadian Securities Administrators, the Company’s registration statement on Form 40-F for the year ended December 31, 2025 filed (or to be filed shortly hereafter) with the United States Securities and Exchange Commission (the “SEC”), and subsequent disclosure filings with the SEC, available on SEDAR+ at www.sedarplus.com and with the SEC at www.sec.gov, as applicable.
The Company does not undertake to update any forward-looking statements, except to the extent required by applicable securities laws in future disclosure filings.
Readers are cautioned not to place heavy reliance on forward looking statements.
Cautionary Note to United States Investors concerning Estimates of Measured, Indicated, and Inferred Resource Estimates:
The mineral project technical information in this document has been prepared in accordance with NI 43-101, and the information contained herein may not be comparable to similar information disclosed by similar exploration companies reporting under S-K 1300. United States investors are cautioned that NI 43-101 and S-K 1300 differ in certain material respects as described above, and that the technical disclosure herein may not meet all requirements applicable to SEC-reporting companies.
|
Fury Gold Mines Limited Results of Operations for the Year Ended December 31, 2025 (Amounts expressed in thousands of Canadian dollars, unless otherwise noted) |
There is no assurance any mineral resources that the Company may report resources with sequentially lower confidence levels referred to as “measured mineral resources”, “indicated mineral resources” and “inferred mineral resources” under NI 43- 101 would be the same had the Company prepared the resource estimates under the standards adopted under the Regulation S-K 1300. United States investors are also cautioned that while the SEC will now recognize “measured mineral resources”, “indicated mineral resources” and “inferred mineral resources”, investors should not assume that any part or all of the mineralization in these categories will ever be converted into the next higher category of mineral resources or ultimately into mineral reserves. Mineralization described using these terms has a greater amount of uncertainty as to their existence and feasibility than mineralization that has been characterized as reserves.
The Company currently has no mineral resources which qualify as mineral reserves which requires that the estimated resources be demonstrated to be economic in at least a pre-feasibility level (± 30% estimates tolerance) study. Accordingly, investors are cautioned not to assume that any “measured mineral resources”, “indicated mineral resources” or “inferred mineral resources” that the Company reports are or will be economically or legally mineable. In Canada, “inferred mineral resources” are subject to an expectation that there must be a reasonable probability of upgrading a majority of an inferred resource into a measured or indicated category, inferred resources have a greater amount of uncertainty as to their existence and as to whether they can be mined legally or economically. United States investors are also cautioned not to assume that all or any part of the “inferred mineral resources” exist. Under Canadian securities laws, estimates of “inferred mineral resources” cannot form the basis of feasibility or other economic studies, except in limited circumstances where permitted under NI 43-101.
Accordingly, information contained in this MD&A describing the Company’s mineral deposits may not be comparable to similar information made public by domestic U.S. companies which are subject to the reporting and disclosure requirements under the United States federal securities laws and the rules and regulations thereunder.
Change in U.S. Securities Reporting Obligations
Previously, the Company filed its annual report with the U.S. Securities and Exchange Commission (the "SEC") on Form 20-F as a foreign private issuer. Effective December 31, 2025, the Company determined that it satisfies the eligibility requirements to register its securities and file its annual report under the Multijurisdictional Disclosure System ("MJDS") established jointly by the SEC and the Canadian Securities Administrators ("CSA").
Accordingly, for fiscal 2025 the Company has transitioned from filing its annual report on Form 20-F to filing on Form 40-F under the MJDS. Commencing with the annual report for the fiscal year ended December 31, 2025 the Company will file its annual report with the SEC on Form 40-F. This form permits eligible Canadian issuers to satisfy their SEC reporting obligations primarily by filing disclosure documents prepared in accordance with Canadian securities laws and filed on the System for Electronic Document Analysis and Retrieval ("SEDAR+").
To qualify for the MJDS and file on Form 40-F, the Company must, among other things, be incorporated or organized under the laws of Canada or a Canadian province or territory, be a "reporting issuer," or the equivalent, in at least one Canadian province for a minimum period of 12 months prior to filing, have an aggregate market value of its public float of at least US $75 million (as measured by the applicable threshold under General Instruction B(1) of Form 40-F); and not be an "ineligible issuer" as defined under SEC rules. The Company meets each of these criteria as of the date of this filing.
Under the MJDS, the Company's annual disclosure will continue to be prepared in accordance with applicable Canadian securities laws and will be filed on SEDAR+ in Canada. That disclosure will be included into the Company's Form 40-F filed with the SEC, and will therefore be available to U.S. investors through the SEC's Electronic Data Gathering, Analysis and Retrieval system ("EDGAR").The transition from Form 20-F to Form 40-F is not expected to result in any material change to the nature or scope of the Company's public disclosure obligations except that for the fiscal years for which the Company filed using form 20-F, it was required to provide disclosure on its mineral properties under US Regulation S-K 1300 and will now provide technical disclosure compliant with Canadian NI 43-101 and the Canadian Institute of Mining and Metallurgy (CIM) Standards (see above disclosure for differences in these two standards). The Company remains subject to the continuous and timely disclosure requirements of applicable Canadian securities laws, as well as the reporting obligations arising from the registration of its securities under the Securities Exchange Act of 1934, as amended (the "Exchange Act").
|
Fury Gold Mines Limited Results of Operations for the Year Ended December 31, 2025 (Amounts expressed in thousands of Canadian dollars, unless otherwise noted) |
Exchange Act Registration and Ongoing Obligations
The Company's common shares are registered under Section 12(g) of the Exchange Act. The Company will continue to comply with all applicable obligations arising under the Exchange Act, including the filing of annual reports on Form 40-F, the filing of Reports on Form 6-K to furnish material information to the SEC on an ongoing basis; and compliance with the applicable provisions of the Sarbanes-Oxley Act of 2002 and the rules and regulations promulgated thereunder, to the extent applicable to MJDS filers.
1.2 Qualified persons and technical disclosures
Bryan Atkinson. P.Geol., Senior Vice President, Exploration, and Valerie Doyon, P.Geo., Senior Project Geologist of the Company are each a “qualified person” or “QP” under and for the purposes of NI 43-101 with respect to the technical disclosures in this MD&A in respect to the Committee Bay and the Quebec projects respectively.
|
Fury Gold Mines Limited Results of Operations for the Year Ended December 31, 2025 (Amounts expressed in thousands of Canadian dollars, unless otherwise noted) |
Section 2: Business Overview
Fury Gold is a Canadian-focused gold exploration company whose four material projects are strategically positioned in two prolific mining regions: the Eeyou Istchee James Bay Region of Quebec and the Kitikmeot Region in Nunavut. As a result of its April 28, 2025 acquisition of Quebec Precious Minerals Corp, the Company now has a portfolio of additional mineral projects (described below). The Company’s vision is to deliver shareholder value by growing our multi-million-ounce gold portfolio and other mineral projects through additional significant discoveries in Canada.
The Company was incorporated on June 9, 2008, under the Business Corporations Act (British Columbia) has operated continuously as a mineral exploration company since then, and is listed on the Toronto Stock Exchange and the NYSE-American, with its common shares trading under the symbol FURY. The Company’s registered and records office is located in care of its Canadian attorneys at 1055 West Georgia Street, Suite 1500, Vancouver, British Columbia, V6E 4N7, and its mailing address is 401 Bay Street, 16th Floor, Toronto, Ontario, M5H 2Y4.
On December 31, 2025, the Company had four material mineral projects: Committee Bay in Nunavut, and Eau Claire, Sakami and Éléonore South in Quebec. The Eleanore South project is now owned 100% after the Company acquired a 49.978% interest which was previously held by Newmont Corporation (“Newmont”), in February 2024. As of December 31, 2025, the Company held a 12.26% common share interest in Dolly Varden Silver Corporation (“Dolly Varden”), which owns the Kitsault Valley project in British Columbia. The Company’s equity interest in Dolly Varden is accounted for as an investment in an associated company, meaning the investment is carried at cost less a share of Dolly Varden’s losses (or plus its income, if any) as well as any implied gains or losses from equity dilution. Accordingly, the carrying value of the Dolly Varden shares on the financial statements is unlikely to reflect the market value of these securities at any given time. The Dolly Varden investment would be required to be written down if the market value of these shares is determined to be persistently lower than its carrying value. On March 26, 2026 Dolly Varden closed a merger of equals transaction with Contango ORE Inc (“Contango“) and the Company’s holdings were converted into 1,860,755 Contango shares at this date.
The Company is a junior resource exploration issuer and as such is an expenditure-based business and does not have material revenues. The CEO, who is the chief operating decision maker (“CODM”), reviews the operating segments of the Company, and has determined that there are two reportable segments (Quebec and Nunavut). The Company focus on the acquisition, exploration, and development of mineral resource properties within Quebec and Nunavut. Its business success must be measured primarily by the success of its exploration programs in establishing that the Company’s mineral properties contain potential commercial deposits of precious metals.
Section 3: 2025 Highlights and subsequent events
3.1 Operational highlights
| ■ | On March 17, 2026, the Company announced initial results from its Phase 1 13,000-metre exploration drill program at Eau Claire. The key highlight was infill drill hole 26EC-099, which targeted an inferred portion of the Eau Claire resource and intercepted 11.74 g/t gold over 6.63m approximately 40m down plunge from previous drilling. The company also announced the Phase 2 program which is anticipated to comprise of an additional 15,000 – 25,000m of drilling and is expected to continue through the spring and summer of 2026. | |
|
■ |
On December 8, 2025, the Company announced an initial inferred mineral resource estimate for the La Pointe Extension target on the Sakami gold project, located in the Eeyou Istchee Territory of the James Bay region in Northern Quebec. The initial inferred mineral resource comprised 23.9 million tonnes grading 1.07 g/t gold for 825,000 gold ounces. The entirety of the inferred mineral resource is contained within a conceptual open pit with a maximum depth of 400m. The La Pointe inferred resource remains open in all directions with immediate opportunities for expansion to the NE and SW as well as below the shallow portion of the conceptual open pit where drilling is limited to 175m below surface. |
In addition to the inferred mineral resource at La Pointe Extension, the Company released a Mineral Exploration Target for the La Pointe prospect which ranges between 8.1 and 14.7 million tonnes grading from 1.11 to 1.57 g/t gold.
|
■ |
On November 24, 2025, the Company announced final results from its inaugural drill campaign at the Sakami gold project located in the Eeyou Istchee Territory of the James Bay region of Northern Quebec. The 2025 diamond drill program resulted in the completion of 3,685m in seven holes of which six drill holes totalling 2,965m targeted extensions and gaps at the La Pointe Extension prospect and one hole (720m) targeted an induced Polarization chargeability anomaly at the Juliette prospect. Drill hole 25SK-005, the southwestern most drill hole completed by the Company, intercepted 26.0m of 0.71 g/t gold including 6.5m of 1.76g/t gold. The intercept in drill hole 25SK-005 is 185m to the SW of drill hole 25SK-003, which intercepted 59m of 1.59 g/t gold. Drill hole 25SK-007 intercepted 22.2m of 0.83g/t gold including 2.9m of 1.71g/t gold and 1m of 8.62g/t gold in a shallow gap between two pods of mineralization. |
|
Fury Gold Mines Limited Results of Operations for the Year Ended December 31, 2025 (Amounts expressed in thousands of Canadian dollars, unless otherwise noted) |
In addition to the drilling results the Company also announced the results of the regional 2025 soil sampling program which was completed along a regional fault splay some 10km to the west of La Pointe Extension. The soil grid resulted in the collection of 237 samples identifying six structurally controlled gold anomalies for potential follow up.
|
■ |
On November 10, 2025, the Company announced the results from the 2025 exploration drilling program at the Committee Bay project, located in the eastern Kitikmeot region of Nunavut, Canada. The 2025 drilling program comprised six (6) diamond drill holes totaling approximately 2,778 metres (m). Four of the drill holes (2,041m), targeting expansion of the Three Bluffs Shear Zone intercepted gold mineralization across 315m of strike with mineralized widths of up to 19.5m, including 5.73 grams per tonne (g/t) gold across 3.0m within a broader interval of 1.18 g/t gold over 19.5m (Hole 25TB155), which ended in the mineralized zone. The remaining two drill holes, which totaled 737m, tested the southern contact of the 8 kilometre (km) long Raven Shear Zone, which historically returned drill intercepts of up to 12.60 g/t gold over 5.49m and 31.1 g/t gold across 2.8m with outcropping gold mineralization defined over 1.4 km. Hole 25RV015, which was a 330m step-out from previous drilling intercepted 4.59 g/t gold over 1.5m. |
|
■ |
On October 21, 2025, the Company announced that it had commenced a 10,000m drilling program at Eau Claire and provided an update on the Kipawa Rare Earths Project. The 10,000m drilling program was based on recommendation from the Eau Claire Preliminary Economic Assessment (PEA) focusing on resource growth and enhancing the mine plan. At Kipawa, the Company is currently reviewing the project and engaging with local stakeholders. |
|
■ |
On October 17, 2025, the Company announced that it had filed a Technical Report in compliance with NI 43-101 in support of the September 2, 2025 PEA results news release. |
|
■ |
On September 4, 2025, the Company announced the results from two additional drill holes at the Sakami gold project. Drill hole 25SK-002 was drilled 140 m below drill hole 25SK-001, where drill hole 25SK-003 was drilled 200 m below previous shallow drilling and 100 m to the west of the previously announced drill hole 25SK-001. Highlights from the additional two drill holes include 49.5 m of 0.6 g/t gold and 22.7 m at 1.47 g/t gold from drill hole 25SK-002, as well as 59 m of 1.59 g/t gold and 9.1 m of 0.92 g/t gold from drill hole 25SK-003. The reported intercepts leave the mineralization at La Pointe Extension open at depth and along strike to the west. Results from the remaining four drill holes are pending. |
|
■ |
On September 2, 2025, the Company announced the results of a PEA for the Eau Claire gold deposit. The PEA represents an initial conceptual evaluation of the economic potential of Eau Claire’s mineral resources and was prepared in accordance with National Instrument 43-101 (“NI 43-101”) by SGS Geological Services. Three scenarios, all based on the same mine plan, were evaluated, each returning an after-tax net present value at a 5% discount rate (“NPV5”) and after-tax internal rate of return (“IRR”) at a gold price of US$2,400 per ounce (“oz”): |
|
o |
Full standalone operation with all processing on site (the “Base Case”) |
|
■ |
After-tax NPV5 of $554 million (M) and after-tax IRR of 41% |
|
o |
Hybrid case starting with two years of toll milling, followed by full standalone crushing, milling, and processing on site (the “Hybrid Case”): |
|
■ |
After-tax NPV5 of $610M and after-tax IRR of 53% |
|
o |
Full toll milling scenario, processing mineralized material off-site at a third-party facility (the “Toll Milling Case”): |
|
■ |
After-tax NPV5 of $639M and after-tax IRR of 84% |
|
Fury Gold Mines Limited Results of Operations for the Year Ended December 31, 2025 (Amounts expressed in thousands of Canadian dollars, unless otherwise noted) |
|
■ |
On August 12, 2025, the Company announced the initial results from the inaugural drill campaign at the Sakami gold project. Drill hole 25SK-001, the first of six holes drilled to date, was designed to test the down plunge extension of gold mineralization intercepted in historical drilling and intercepted five distinct zones of gold mineralization across a 140-metre drilled length; 4.7 m of 2.72 g/t gold; 0.5 m of 10.2 g/t gold; 1.5 m of 5.17 g/t gold and; 11.8 m of 1.28 g/t gold and; 41.5 m of 1.23 g/t gold. Within the two broader intercepts of 11.8 m and 41.5 m, hosted within intense pervasive silicification, there is a high-grade core that includes intercepts of up to 7 m of 3.15 g/t gold. |
|
■ |
On July 22, 2025, the Company announced preliminary metallurgical test results from its Ninaaskumuwin lithium discovery at Elmer East, revealing that the spodumene‑rich pegmatite is highly amenable to conventional lithium extraction, with heavy‑liquid separation yielding 62.2% lithium recovery and a concentrate grading 5.59% Li₂O. The samples contain up to 42% spodumene, with no impurity minerals detected, suggesting the potential to produce battery‑grade lithium carbonate or hydroxide. Combined with earlier drilling results—including 32.35 metres of 1.16% Li₂O—the findings indicate a fertile, highly fractionated LCT pegmatite that warrants further exploration and development. |
|
■ |
On July 14, 2025, the Company commenced its 2025 exploration programs at Committee Bay, which comprised of 7 – 10 diamond drill holes totaling approximately 5,000 metres. The drilling had three primary goals: |
|
o |
Expansion of the Three Bluffs Shear Zone; |
|
o |
Testing regional shear zones along the Southern contact of the 8km long Raven shear zone; |
|
o |
Testing regional shear zones at Burro West. |
|
■ |
On July 9, 2025, the Company reported strong maiden drill results from the Ninaaskumuwin lithium discovery at its Elmer East project in Quebec, highlighted by a key intercept of 32.35 metres grading 1.16% Li₂O in hole EE24‑003 and an additional 22.48 metres of 1.19% Li₂O in hole EE24‑002. The drilling confirmed a thick, spodumene‑bearing pegmatite with individual sample grades reaching up to 3.70% Li₂O, vertical continuity of mineralization down to 150 metres, and open potential both along strike and at depth. Surface samples had previously returned values up to 3.92% Li₂O, and the discovery benefits from excellent nearby infrastructure and proximity to Rio Tinto’s Galaxy Lithium project. |
|
■ |
On June 16, 2025, the Company announced that it had finalized drill targeting for the Sakami Gold Project. The first phase of drilling commenced in late June and comprised approximately 3,000 – 5,000 metres with three priorities: |
|
o |
Discovery along a 23km long gold bearing structural corridor at the Juliette target; |
|
o |
Confirm historical mineralized intercepts at the La Pointe and La Pointe Extension targets; |
|
o |
Step out drilling along strike and down plunge of a high-grade corridor identified at La Pointe Extension. |
|
■ |
On February 3, 2025, the Company announced the commencement of a diamond drilling program on the greenfield exploration Éléonore South gold project located in the Eeyou Istchee Territory in the James Bay region of Northern Quebec. Drilling targeted robust multi-faceted geological, geophysical, and geochemical gold anomalies within the same sedimentary rock package that hosts the Éléonore Mine. The fully funded first phase drilling campaign comprised approximately 4,000 – 6,000 metres (m) targeting an interpreted fold nose within the Low Formation sediments. Within the prospective folded stratigraphy are six undrilled priority targets spanning over 3 kilometres (km) of strike length that had been identified through a combination of biogeochemical sampling and interpretation of magnetics and electromagnetics survey data. The first phase of drilling focused within a northwest-southeast structural corridor where a strong correlation between anomalous gold, stratigraphy, and structure had been identified. The drill targets occur in a structurally complex setting with little to no outcrop exposure and the targeting model evolved with each hole drilled. The Company planned to complete approximately 15 of the 77 permitted drill holes as part of the first phase of drilling and additional drilling was based on the results and observations from this phase. |
|
Fury Gold Mines Limited Results of Operations for the Year Ended December 31, 2025 (Amounts expressed in thousands of Canadian dollars, unless otherwise noted) |
3.2 Corporate highlights and subsequent events
| ■ | On January 26, 2026, the Company announced the appointment of Mr. Phillips S. Baker Jr. to its Board of Directors as an independent director. | |
|
■ |
On November 12, 2025 the Company closed a private placement of 1,494,253 units of the Company (the “Units”) at a price of $0.87 per Unit for gross proceeds of $1.3 million. The Units are comprised of one share, and one-half of one common share purchase warrant (each whole warrant, a “Warrant”). Each Warrant will entitle the holder to purchase one common share (a “Warrant Share”) at a price of $1.20 per Warrant Share for a period of 24 months from the date of the closing. |
|
■ |
On October 27, 2025 Benz Mining Corp (“Benz”) exercised their option to acquire the remaining 25% of the Eastmain Gold and Ruby Hill project from the Company. The additional 25% of the Eastmain Mine property was acquired by settling a cash payment of $750 and issuing common shares of Benz to the value of $250, while the acquisition of the remaining 25% of Ruby Hill was settled by a $100 cash payment. |
|
■ |
On October 14, 2025, the Company closed a brokered private placement financing which it initially announced on September 22, 2025. The financing employed a tax advantaged structure by which the securities were initially sold to investors who received the tax advantages available for “flow-through shares” under the Canadian Income Tax Act and who then donated the securities to registered charity in Canada. The so-called “charity” structure allows the shares to be sold at a premium to market. A total of 9,915,000 flow-through units were sold to (the “Charity FT Units”) at a price per Charity FT Unit of C$1.21; and 6,003,000 flow-through shares (the “FT Shares”) at a price per FT Share of C$1.00, for total aggregate gross proceeds of $18 million. The Charity FT Units are comprised of one “flow-through” share (each, a “Charity FT Share”), and one-half of one common share purchase warrant (each whole warrant, a “Warrant”). Each Warrant will entitle the holder to purchase one non-flow through common share (a “Warrant Share”) at a price of $1.20 per Warrant Share for a period of 24 months from the date of the closing. |
|
■ |
On September 17, 2025, the Company sold 500,000 of its holdings of common shares of Dolly Varden for net proceeds of $2,914. |
|
■ |
On June 27, 2025, the Company announced the voting results from its Annual General Meeting (“Meeting”) of Shareholders held on June 26, 2025. The Company confirmed that each director nominee listed in the Company’s management information circular dated May 12, 2025, in connection with the Meeting were re-elected as directors of the Company and that Deloitte LLP was re-appointed as the Company’s auditor. In February 2026 the Company filed a notice that PriceWaterhouseCoopers LLP would be nominated for fiscal 2026 at the June 2026 shareholders meeting. |
|
■ |
On June 20, 2025, the Company closed $3.08 Million financing (the “June 2025 Offering”) previously announced on June 5, 2025. The Company issued 3,999,701 common shares of the Company that qualify as “flow-through shares” as defined under subsection 66(15) of the Income Tax Act (Canada) at a price of C$0.77 per FT Share FT Shares are identical to all common shares except that they are tax advantaged securities in Canada that , generally speaking, allow the initial investor to deduct the cost thereof against taxable income in Canada provided the proceeds of issuance are spent exploring Canadian mineral projects. In connection with the June 2025 Offering, Agnico Eagle Mines Limited (“Agnico Eagle”) exercised its existing participation right and acquired 440,000 common shares of the Company at a price of C$0.67 per Share for gross proceeds of $295 (“AEM June Private Placement”). The Common Shares acquired in AEM June Private Placement do not qualify as “flow-through shares”. The proceeds from AEM June Private Placement will be used to advance the Company’s Committee Bay exploration program. |
|
■ |
On May 27, 2025, the Company entered into a subscription agreement with Agnico Eagle pursuant to which Agnico Eagle has acquired, on a non-brokered private placement basis, 6,728,000 units in the capital of the Company (“Units”) at C$0.64 per Unit for gross proceeds of $4,306 (the “AEM Private Placement”). Each Unit consists of one common share of Fury and one common share purchase warrant. Each common share purchase warrant is exercisable to purchase one Share at C$0.80 for a 36-month period from the date of issuance on May 26, 2025, subject to accelerated expiry after 24 months if the market price of the Shares closes above C$0.80 for twenty consecutive trading days. This investment increases Agnico Eagle’s basic ownership to 6.3% of Fury’s issued shares and its defined “ownership interest” to 9.9% calculated on a “partially diluted” basis. $3.9 Million of this investment is allocated for exploration under the Company’s 2025 exploration program at the Committee Bay project and the remainder is available for other projects and general corporate purposes. Agnico Eagle was also granted certain rights (provided that it maintains certain ownership thresholds), including (i) the right to nominate one person to the board of directors of the Company, and (ii) the right to participate in certain equity offerings and top-up its holdings in relation to dilutive issuances in order to maintain or acquire up to the greater of Agnico Eagle’s then-current ownership interest and an ownership interest of 9.9%. |
|
Fury Gold Mines Limited Results of Operations for the Year Ended December 31, 2025 (Amounts expressed in thousands of Canadian dollars, unless otherwise noted) |
|
■ |
On May 8, 2025, the Company sold 1,000,000 common shares of its holdings of Dolly Varden for net proceeds of $3,625. |
|
■ |
On April 28, 2025, the Company completed the acquisition of Quebec Precious Metals Corporation (“QPM”) originally announced on February 26, 2025. Fury acquired all of the issued and outstanding common shares of QPM by issuing an aggregate of 8,394,045 Fury shares on close, valued at $4.53 Million. The Company thereby acquired three prospective projects (one precious metal, one critical mineral and one rare earths) which are not individually material to Fury at this time. The QPM acquisition is not a significant acquisition in accordance with National Instrument 51-102 and therefore, no business acquisition report will be filed. |
|
■ |
On March 26, 2025, the Company announced that director Isabelle Cadieux had resigned from the Fury Board of directors to pursue other opportunities. |
|
Fury Gold Mines Limited Results of Operations for the Year Ended December 31, 2025 (Amounts expressed in thousands of Canadian dollars, unless otherwise noted) |
Section 4: Projects overview

Locations of the Company’s four material mineral projects and the non-material Kipawa rare earths project.
4.1 Indigenous community relations and environmental
The pursuit of environmentally sound and socially responsible mineral development guides all of Fury Gold’s activities as the Company understands the broad societal benefits that responsible mining can bring, as well as the risks that must be managed through the implementation of sustainable development practices. The Company strives to maintain the highest standards of environmental protection and aboriginal and local community engagement at all its projects.
The Company considers sustainability to include the pursuit of four mutually reinforcing pillars: environmental and cultural heritage protection; social and community development; economic growth and opportunity; and cultural intelligence development for all employees. The Company assesses the environmental, social, and financial benefits and risks of all business decisions and believes this commitment to sustainability generates value and benefits for local communities and shareholders.
The Company’s approach to Indigenous and stakeholder engagement provides opportunities and benefits through:
|
■ |
the provision of jobs and training programs |
|
■ |
contracting opportunities |
|
■ |
capacity funding for Indigenous engagement |
|
■ |
sponsorship of community events |
|
■ |
supporting professional development opportunities, building cultural and community intelligence capacity. |
The Company places a priority on creating mutually beneficial, long-term relationships with the communities in which it operates. Engagement goals include providing First Nation governments, communities, and residents with corporate and project-related information, including details of work programs, collaborative opportunities, and other activities being undertaken in the field.
|
Fury Gold Mines Limited Results of Operations for the Year Ended December 31, 2025 (Amounts expressed in thousands of Canadian dollars, unless otherwise noted) |
4.2 Quebec
Fury Gold holds 100% interests in the Eau Claire project as well as interests in ten other properties covering approximately 157,000 hectares predominantly within the Eeyou Istchee James Bay region of Quebec. This now includes a 100% interest in the Éléonore South Project. Through the acquisition of Quebec Precious Metals Corporation on April 28, 2025, the company acquired 100% interests in three projects: Sakami, Elmer East and Cheechoo – Eleonore Trend, and a 68% interest in the Heavy Rare Earth Elements (HREE) Kipawa project (the remaining 32% is held by Investissement Quebec).
4.2.1 Eau Claire
The Eau Claire project is located immediately north of the Paix Des Braves reservoir, 10km northeast of Hydro Quebec’s EM-1 hydroelectric power facility, 80km north of the town of Nemaska, approximately 320km northeast of the town of Matagami, and 800km north of Montreal. This property consists of map-designated claims totaling approximately 23,000 hectares. These claims are held 100% by Fury Gold and are in good standing. Permits are obtained on a campaign basis for all surface exploration, particularly trenching and drilling, undertaken on the property.
The Eau Claire project is underlain by typical Archean greenstone assemblages of the Eastmain Greenstone Belt, which are composed of volcanic rocks of basaltic to rhyolitic composition and related clastic and chemical sedimentary rocks. These rocks have been intruded by an assemblage of mafic to felsic sills, stocks, and dykes. Metamorphism ranges from upper greenschist to amphibolite facies in the greenstone assemblages, while higher-grade facies, up to granulite level, typically characterize the Opinaca sub-province. Archean-aged deformation affects all rocks on the property. Near the Eau Claire deposit, the volcano-sedimentary assemblage has been folded, forming a closed antiform plunging gently to the west. Regional rock foliation and lithology are generally east-west in strike with moderate to sub-vertical southerly dips in the vicinity of the Eau Claire gold deposit.
On September 2, 2025, the Company announced the results of a Preliminary Economic Assessment (“PEA”) for the Eau Claire Gold Deposit which was conducted by the independent engineering firm SGS Geological Services. The PEA contemplates a primary underground mining operation complemented by 2 small open pits. Production from the underground (“UG”) mine will start in year minus 1 with a small bulk sample, with full UG operations continuing through to year 11. In total, the underground would produce 702koz gold at an average diluted head grade of 5.22 g/t gold from 4.40Mt of material. The conventional open pits (“OP”) would operate for 8 years, recovering a total of 132koz gold at an average diluted grade of 2.50 g/t gold from 1.73Mt of material.
Percival to Serendipity trend:
The Serendipity Prospect is situated 16 km northeast of the Eau Claire Deposit and 6.5 km north northeast of the Percival Deposit along the Hashimoto Deformation Zone, which is related to the Cannard Deformation Zone, one of the primary controls on gold mineralization within the region. The 2024 drilling tested five robust distinct geochemical targets up to 150x background values proximal to the regional scale Hashimoto Deformation Zone within prospective folded stratigraphy across approximately 2 km of strike length. Limited historical drilling near Serendipity intercepted 7.9 m of 1.23 g/t gold; 12.1 m of 1.38 g/t gold and 1.5 m of 4.27 g/t gold.
Fury’s technical team has demonstrated the effectiveness of drilling biogeochemical anomalies in covered terrain within our project areas and continues to build a better understanding of the combination of pathfinder elements and structural controls on the gold mineralization along the Percival to Serendipity trend. Broad low-grade gold mineralization occurs along well-defined structural splays sub-parallel to the regional Cannard and Hashimoto Deformation Zones. Certain elemental associations, most notably Arsenic, Bismuth, and Tungsten, are proving to be important pathfinders for gold mineralization. Higher-grade gold within the broader corridor is controlled by secondary shearing and is identified by the high degree of silicification and alteration. The proximity of the main Cannard and Hashimoto Deformation Zones varies from one target to the other and Fury believes the varying degrees of deformation are an important control on both gold mineralization and the potential preservation of a sizeable, mineralized body.
The Company expects to incur approximately $12 annually in project maintenance costs, including certain mineral claims payments, in order to keep the properties in good standing in 2026.
|
Fury Gold Mines Limited Results of Operations for the Year Ended December 31, 2025 (Amounts expressed in thousands of Canadian dollars, unless otherwise noted) |
4.2.2 Éléonore South
The 100% owned Éléonore South property is strategically located in an area of prolific gold mineralization within the Eeyou Istchee James Bay gold camp and is locally defined by Newmont’s Éléonore mine and Sirios Resources’ Cheechoo deposit. Exploration over the past 13 years has largely been focused on the extension of the Cheechoo deposit mineralization within the portion of the Cheechoo Tonalite on the Property. Approximately 27,000m of drilling in 172 drill holes, covering only a small proportion of the property at the Moni and JT prospects has been completed. Notable drill intercepts include 53.25m of 4.22 g/t gold (Au); 6.0m of 49.50 g/t Au including 1.0m of 294 g/t Au and 23.8m of 3.08 g/t Au including 1.5m of 27.80 g/t Au.
The Company expects to incur approximately $35 annually in project maintenance costs, including certain mineral claims payments, in order to keep the properties in good standing in 2025. No additional work is planned for 2026. The Company is reviewing targets and priorities for 2026.
4.2.3 Sakami
The winter road accessible Sakami project covers approximately 14,250 hectares (ha), 30 km to the east of the paved Billy Diamond Highway. The Project straddles the prospective structural corridor marking the contact between the Opinaca and La Grande Geological subprovinces, where gold mineralization has been identified across over 23 km. Gold mineralization is located at the base of a sulphide rich horizon located along and proximal to regional-scale shearing, marking the contact between the two geological subprovinces.
The results from the 3,000 – 5,000m Phase 1 program announced on June 16, 2025 was announced through news releases dated August 12, September 4 and November 24, 2025 as described in section 3.1. The results include:
|
- |
Drill hole 25SK-001 intercepted five distinct zones of gold mineralization across a 140-metre (m) drilled length; 4.7 m of 2.72 g/t gold; 0.5 m of 10.2 g/t gold; 1.5 m of 5.17 g/t gold; 11.8 m of 1.28 g/t gold and; 41.5 m of 1.23 g/t gold; |
|
|
- |
Drill hole 25SK-002 intercepted 49.5 m of 0.6 g/t gold and 22.7 m at 1.47 g/t gold; |
|
|
- |
Drill hole 25SK-003 intercepted 59 m of 1.59 g/t gold and 9.1 m of 0.92 g/t gold; |
|
|
- |
Drill hole 25SK-007 intercepted 22.2m of 0.83g/t gold including 2.9m of 1.71g/t gold and 1m of 8.62g/t gold in a shallow gap between two pods of mineralization. |
|
Fury Gold Mines Limited Results of Operations for the Year Ended December 31, 2025 (Amounts expressed in thousands of Canadian dollars, unless otherwise noted) |
On December 8, 2025, the Company announced an initial inferred mineral resource estimate for the La Pointe Extension target on the Sakami gold project, located in the Eeyou Istchee Terittory of the James Bay region in Northern Quebec. The initial inferred mineral resource comprised 23.9 million tonnes grading 1.07 g/t gold for 825,000 gold ounces. The entirety of the inferred mineral resource is contained within a conceptual open pit with a maximum depth of 400m. The La Pointe inferred resource remains open in all directions with immediate opportunities for expansion to the NE and SW as well as below the shallow portion of the conceptual open pit where drilling is limited to 175m below surface.

|
Fury Gold Mines Limited Results of Operations for the Year Ended December 31, 2025 (Amounts expressed in thousands of Canadian dollars, unless otherwise noted) |

Figure 1: Long Section view looking NW of the La Pointe Extension initial open pit contained mineral resource estimate
In addition to the inferred mineral resource at La Pointe Extension, the Company released a Mineral Exploration Target for the La Pointe prospect which ranges between 8.1 and 14.7 million tonnes grading from 1.11 to 1.57 g/t gold.
|
Fury Gold Mines Limited Results of Operations for the Year Ended December 31, 2025 (Amounts expressed in thousands of Canadian dollars, unless otherwise noted) |

Gold mineralization has been intercepted across widths of up to 75 m and to a depth of up to 500 m. The identified gold mineralization at both La Pointe and La Pointe Extension remains open to depth and along strike. Further south along the same gold-bearing structure lies an intriguing undrilled coincident gold in soil geochemical anomalies and Induce Polarization (IP) geophysical chargeability anomaly with similar signature to the La Pointe and La Pointe Extension targets.
The Company expects to incur approximately $22 annually in project maintenance costs, including certain mineral claims payments, in order to keep the properties in good standing in 2026.
La Pointe Extension Resource Estimate technical report
The La Pointe Extension resource estimation was completed in a technical report authored by Olivier Vadnai-Leblanc, P. Geo., Geologist with SGS Geological Services (“Initial Mineral Resource Estimate for the Sakami Project, Eeyou Istchee Territory, James Bay Region of Quebec, Canada” which is dated January 21, 2026, has an effective date of November 11, 2025, and is filed on SEDAR+).
4.2.4 Elmer East
The Elmer East property covers approximately 45,735 ha and is easily accessible from the paved Billy Diamond highway. The project is located approximately 60 km north of the “km 381” rest stop where accommodations, fuel catering and power are available. The property is host to an undrilled 4.2 km long east–west oriented gold and base metal bearing structural trends known as the Lloyd showing where grab samples have returned results of up to 68.10 g/t gold, 7.99% Zinc and 7,660 ppm Copper.
|
Fury Gold Mines Limited Results of Operations for the Year Ended December 31, 2025 (Amounts expressed in thousands of Canadian dollars, unless otherwise noted) |
Spodumene bearing pegmatites have been identified throughout the QPM land package with a recently completed drilling campaign at the Ninaaskumuwin project where +20 m spodumene bearing pegmatites with vertical continuity of up to 150 m were intercepted in drilling late 2024.
On July 9, 2025, the Company announced the results of the 2024 diamond drilling campaign targeting spodumene bearing pegmatites at Elmer East. The program comprised 825 m of diamond drilling in 5 drill holes. The drilling targeted a spodumene-bearing pegmatite outcrop, which returned surface samples of up to 3.92% Li2O. Highlights from the drill campaign include 32.35 m of 1.16% Li2O from EE24-003 and 22.48 m of 1.19% Li2O from EE24-002. Drilling confirmed the vertical continuity of lithium mineralization from surface down to 150 m. The lithium mineralized spodumene-bearing pegmatite intercepted remains open at depth and along strike. This new lithium discovery sits approximately 50 km north of Rio Tinto plc’s Galaxy Lithium project, acquired in March 2025 as part of the broader acquisition of Arcadium Lithium plc for US$ 6.7 billion.
On July 22, 2025, the Company announced the results from metallurgical test work completed on the lithium mineralized pegmatite intercepted in the 2024 drill campaign. The objective of the metallurgical test work was to characterize the mineralogy and metallurgical properties of the spodumene-bearing pegmatite intercepted in drilling. Results from the preliminary test work indicate that the Ninaaskumuwin lithium mineralization is amenable to conventional lithium extraction techniques with Heavy Liquid Separation resulting in recovery of 62.2% Lithium and a concentrate grade of 5.59% Li2O from a single composite sample. Results from the test work indicate:
|
■ |
Samples analysed contain up to 42% spodumene; |
|
■ |
Spodumene is the sole lithium-bearing mineral identified; |
|
■ |
The pegmatite intercepted is free of impurities indicating that lithium concentrates suitable for lithium carbonate and lithium hydroxide battery grade products could possibly be produced; |
|
■ |
The Ninaaskumuwin pegmatite is a highly fractionated and fertile Lithium Cesium and Tantalum (LCT) pegmatite; |
|
■ |
Grades of the 85 samples analysed range from 0.02% to 3.71% Li2O and 0.36% to 6.30 % Fe2O3; and |
|
■ |
Recoveries of 62.2% Li and concentrate grade of 5.59% Li2O received from a single composite. |
The Company expects to incur approximately $64 annually in project maintenance costs, including certain mineral claims payments, in order to keep the properties in good standing in 2025. No work is currently planned for 2025.
4.2.5 Kipawa
The Heavy Rare Earth Elements (HREE) Kipawa project (68% owned through the Company’s subsidiary and 32% owned by Investissement Québec), 50 km east of Temiscaming in southwestern Quebec, is host to a historical 2013 Proven and Probable reserves of 19.8 million tonnes grading 0.411% total rare earth oxides (TREO). The road accessible project covers an area of 4,300 hectares with good access to local infrastructure.
The historical resource and reserve estimates discussed above have not been sufficiently reviewed by the Company to be deemed a current mineral resource or mineral reserve. Fury does not treat this historical resource and reserve estimate as current. There are no current mineral reserve or mineral resource estimates for the Kipawa Project.
The Company expects to incur approximately $3 annually in project maintenance costs, including certain mineral claims payments, in order to keep the properties in good standing in 2026. The Company is currently reviewing the project and engaging with local stakeholders.
4.3 Nunavut
Committee Bay Project
The Committee Bay project comprises approximately 238,000 hectares situated along the Committee Bay Greenstone Belt located 180km northeast of the Meadowbank mine operated by Agnico Eagle Mines Limited. The Committee Bay belt comprises one of a number of Archean-aged greenstone belts occurring within the larger Western Churchill province of northeastern Canada. The Committee Bay project is held 100% by the Company, subject to a 1% Net Smelter Return (“NSR”), and an additional 1.5% NSR payable on only 7,596 hectares which may be purchased within two years of the commencement of commercial production for $2,000 for each one-third (0.5%) of the NSR.
|
Fury Gold Mines Limited Results of Operations for the Year Ended December 31, 2025 (Amounts expressed in thousands of Canadian dollars, unless otherwise noted) |
On June 3, 2025, the Company announced the 2025 exploration plans for the Committee Bay project. The 2025 Committee Bay exploration program commenced in early July 2025 and will comprise 7 – 10 diamond drill holes totaling approximately 5,000 metres.
The 2025 drilling had three primary goals;
|
■ |
Expansion of the Three Bluffs Shear Zone target first identified in 2021 where drill hole 21TB152 intercepted three discrete zones of high-grade gold mineralization over a 30 m drill width, including 10.0 m of 13.93 g/t gold, 3.0 m of 18.67 g/t gold and 1.0 m of 23.2 g/t gold in a 120 m step-out from the defined mineral resource (see news release dated December 1, 2021); |
|
■ |
Testing regional shear zones along the southern contact of the 8 km-long Raven shear zone where samples of up to 32.90 g/t gold have been returned from an undrilled outcrop (see news release dated February 16, 2022); |
|
■ |
Testing regional shear zones at Burro West where a 300 by 300 m gold in till anomaly was identified in 2024. |
On July 14, 2025, the Company announced that the 2025 diamond drilling campaign had commenced at the Committee Bay project.
On November 10, 2025, the Company announced the results from the 2025 exploration drilling program at the Committee Bay project, located in the eastern Kitikmeot region of Nunavut, Canada. The 2025 drilling program comprised six (6) diamond drill holes totaling approximately 2,778 metres (m). Four of the drill holes (2,041m), targeting expansion of the Three Bluffs Shear Zone intercepted gold mineralization across 315m of strike with mineralized widths of up to 19.5m, including 5.73 grams per tonne (g/t) gold across 3.0m within a broader interval of 1.18 g/t gold over 19.5m (Hole 25TB155), which ended in the mineralized zone. The remaining two drill holes, which totaled 737m, tested the southern contact of the 8 kilometre (km) long Raven Shear Zone, which historically returned drill intercepts of up to 12.60 g/t gold over 5.49m and 31.1 g/t gold across 2.8m with outcropping gold mineralization defined over 1.4 km. Hole 25RV015, which was a 330m step-out from previous drilling intercepted 4.59 g/t gold over 1.5m.
The Company expects to incur approximately $160 in annual mineral claims expenditures in 2026, in order to keep the property in good standing. Payments totalling $157 were made during the year ended December 31, 2025, in respect of these mineral claims.
Committee Bay resource estimate and technical report
Three Bluffs resource estimations were completed by APEX Geoscience Ltd. (“APEX”) (see the Technical Report on the Committee Bay Project, Nunavut Territory, Canada, dated September 11, 2023, and filed under Fury’s SEDAR+ profile). It supersedes all previous Committee Bay technical reports.
Section 5: Review of annual financial information
|
Years ended December 31
|
||||||||
|
2025 |
2024 |
|||||||
|
Net loss |
6,459 | 108,138 | ||||||
|
Total comprehensive loss |
6,478 | 108,141 | ||||||
|
Basic and diluted loss per share |
$ | 0.04 | $ | 0.73 | ||||
|
Total assets |
108,319 | 85,112 | ||||||
|
Fury Gold Mines Limited Results of Operations for the Year Ended December 31, 2025 (Amounts expressed in thousands of Canadian dollars, unless otherwise noted) |
5.1 Year ended December 31, 2025, as compared to the year ended December 31, 2024
During the year ended December 31, 2025, the Company reported a total net loss of $6,459 and loss per share of C$0.04 compared to a total net loss of $108,138 and loss per share of C$0.73 for the year ended December 31, 2024 due to impairment expenses of $100,873 recognized effective December 31, 2024.
The significant decrease in net loss was primarily due to impairment expenses of $100,873 assessed on the Company’s mineral properties interests in 2024 which was recognized primarily due to the long-term discrepancy between the Company’s implied stock market capitalization versus the much higher carrying value of these written-down projects. Additionally, other significant changes were as follows:
Operating expenses:
|
■ |
Exploration and evaluation costs increased from $5,512 for the year ended December 31, 2024, to $12,853 for the year ended December 31, 2025. The increase resulted from robust exploration programs throughout 2025, including at Sakami, Eau Claire, and Committee Bay, whereas in 2024, after the initial Elenore South drill program in March wrapped up; the program at Eau Claire only started during the last part of June and concluded mid-August; |
|
■ |
Fees, salaries, and other employment benefits increased to $2,369 for the year ended December 31, 2025, compared to $2,202 for the year ended December 31, 2024. The higher costs were a result of annual salary adjustments; |
|
■ |
Legal and professional fees increased to $1,158 for the year ended December 31, 2025, compared to $789 for the year ended December 31, 2024. The higher costs in the current year are primarily a result of professional fees related to the valuation of mineral property interests, additional audit fees and additional internal control over financial reporting work as part of the current year’s integrated audit; |
|
■ |
Marketing and investor relations increased to $798 for the year ended December 31, 2025, compared to $677 for the year ended December 31, 2024. The increase was driven by ramped up marketing and investor relations activities in accordance with the increase in gold price during the year; and |
|
■ |
Office and administration decreased to $302 for the year ended December 31, 2025, compared to $461 for the year ended December 31, 2024. |
Other expenses (income), net:
|
■ |
$100,873 impairment expense for the year ended December 31, 2024, arose from the assessment of the Company’s mineral property interests, whereas there was no similar transaction in the year ended December 31, 2025; |
|
■ |
Gain on investments of $7,479 for the year ended December 31, 2025, compared to $4,109 for the year ended December 31, 2024, was a result of the Company’s disposition of Dolly Varden shares in the current year, combined with higher dilution gain consistent with the increased equity financing transactions completed by Dolly Varden as compared to the previous year; |
|
■ |
Net gain from marketable securities of $5,845 for the year ended December 31, 2025, compared to $373 for the year ended December 31, 2024 was due to an increase in fair value of securities held in 2025 compared to the fair value of securities held in 2024; |
|
■ |
Net gain on disposal of mineral properties of $1,100 for the year ended December 31, 2025 compared to $nil for the year ended December 31, 2024 was a result of Benz Mining Corp. acquiring the remaining 25% interest (for a total 100% undivided interest) of the Eastmain Mine and Ruby Hill Properties during Q4 2025; and |
|
■ |
Other income of $168 for the year ended December 31, 2025 was from expenses eligible for government grant that were recognized in the year; whereas other income of $566 for the year ended December 31, 2024 was from fuel resale. |
|
Fury Gold Mines Limited Results of Operations for the Year Ended December 31, 2025 (Amounts expressed in thousands of Canadian dollars, unless otherwise noted) |
Section 6: Review of quarterly financial information
|
Three months ended: |
Interest income |
Net (earnings) loss(1) |
Comprehensive (earnings) loss(1) |
(Earnings) loss per share (C$/share) |
||||||||||||
|
December 31, 2025 |
$ | 125 | $ | (3,227 | ) | $ | (3,214 | ) | $ | (0.02 | ) | |||||
|
September 30, 2025 |
53 | 4,699 | 4,701 | 0.03 | ||||||||||||
|
June 30, 2025 |
35 | 1,996 | 1,998 | 0.01 | ||||||||||||
|
March 31, 2025 |
44 | 2,991 | 2,993 | 0.02 | ||||||||||||
|
December 31, 2024 |
60 | 101,256 | 101,257 | 0.68 | ||||||||||||
|
September 30, 2024 |
75 | 2,673 | 2,673 | 0.02 | ||||||||||||
|
June 30, 2024 |
82 | 3,496 | 3,497 | 0.02 | ||||||||||||
|
March 31, 2024 |
82 | 714 | 715 | 0.01 | ||||||||||||
|
December 31, 2023 |
119 | 4,609 | 4,612 | 0.03 | ||||||||||||
|
September 30, 2023 |
162 | 6,650 | 6,649 | 0.05 | ||||||||||||
|
June 30, 2023 |
188 | 3,293 | 3,296 | 0.02 | ||||||||||||
|
March 31, 2023 |
121 | 2,661 | 2,662 | 0.02 | ||||||||||||
(1) Certain periods have been restated within this document to correct a misstatement which was identified in the fourth quarter of 2024. See section 6.2 below for details
6.1 Three months ended December 31, 2025, compared to three months ended December 31, 2024
During the three months ended December 31, 2025, the Company reported net income of $3,227 and earnings per share of C$0.02 compared to a net loss of $101,257 and loss per share of C$0.68 for the three months ended December 31, 2024. The significant drivers of the change in total net loss were as follows:
Operating expenses:
|
■ |
Exploration and evaluation costs increased to $3,363 for the three months ended December 31, 2025, compared to $718 for the three months ended December 31, 2024. The higher exploration expense in the last quarter of 2025 was a result of the drilling program at Eau Claire, whereas 2024 drill programs finished in mid-August; |
|
■ |
Legal and professional fees increased to $262 for the three months ended December 31, 2025 compared to $188 for the three months ended December 31, 2024. The higher costs in 2025 were primarily due to professional fees associated with internal control over financial reporting services during the quarter compared to the prior year; and |
|
■ |
Office and administration decreased to $85 for the three months ended December 31, 2025, compared to $181 for the three months ended December 31, 2024 |
Other (income) expenses, net:
|
■ |
$100,873 impairment expense for the three months ended December 31, 2024 arose from the fair value assessment of the Company’s mineral property interests, compared to $nil for the three months ended December 31, 2025; |
|
■ |
Net gain on marketable securities of $5,145 for the three months ended December 31, 2025 compared to $182 for the three months ended December 31, 2024 was a result of a significant increase in securities prices in the quarter compared to the same comparable quarter; and |
|
■ |
Net gain on disposal of mineral properties of $1,100 for the three months ended December 31, 2025 compared to $nil for the three months ended December 31, 2024 was a result of Benz Mining Corp. acquiring the remaining 25% interest (for a total 100% undivided interest) of the Eastmain Mine and Ruby Hill Properties during Q4 2025. |
|
Fury Gold Mines Limited Results of Operations for the Year Ended December 31, 2025 (Amounts expressed in thousands of Canadian dollars, unless otherwise noted) |
Section 7: Financial position, liquidity, and capital resources
|
As at and for the year ended: |
December 31 2025 |
December 31 2024 |
||||||
|
Cash |
$ | 21,197 | $ | 4,912 | ||||
|
Restricted cash |
144 | 144 | ||||||
|
Marketable securities |
7,783 | 2,358 | ||||||
|
Other investment (1) |
2,031 | 2,063 | ||||||
|
Other assets |
1,283 | 979 | ||||||
|
Mineral property interests |
49,918 | 45,200 | ||||||
|
Investments in associates |
25,963 | 29,456 | ||||||
|
Current liabilities |
2,835 | 1,864 | ||||||
|
Non-current liabilities |
4,473 | 5,045 | ||||||
|
Working capital surplus (2) |
29,162 | 8,045 | ||||||
|
Accumulated deficit |
263,651 | 257,192 | ||||||
|
Cash used in operating activities |
(16,660 | ) | (8,073 | ) | ||||
|
Cash provided by investing activities |
7,739 | 1,395 | ||||||
|
Cash provided by financing activities |
25,225 | 4,277 | ||||||
(1) Investment in unlisted shares of Alsym Energy Inc.
(2) Defined as total current assets less total current liabilities
7.1 Cash flows
Operating activities:
|
■ |
During the year ended December 31, 2025, the Company used cash of $16,660 in operating activities compared to $8,073 during the year ended December 31, 2024. The cash outflow was lower in 2024 due to overall lower operating expenditure compared to 2025, together with a higher net outflow of non-cash working capital compared to 2024. |
Investing activities:
|
■ |
During the year ended December 31, 2025, the Company generated cash from investing activities of $7,739, representing net receipt of $6,539 from selling Dolly Varden shares, $850 from disposition of mineral properties and net receipts of $670 for selling marketable securities, offset by mineral property interest additions of $402 and equipment addition of $175. During the year ended December 31, 2024, the Company generated cash from investing activities of $1,395, representing proceeds from the sale of some Dolly Varden shares, partially offset by the acquisition of mineral interests, marketable securities, and other investments. |
Financing activities:
|
■ |
For the year ended December 31, 2025, cash provided by financing activities of $25,225 represented primarily by the net proceeds received from private placements that raised net $5,700 and flow-through financings which raised net $19,461. For the year ended December 31, 2024, cash provided by financing activities of $4,277 primarily represented the net proceeds received in respect of a flow through common share offering which was completed in June 2024. |
7.2 Contractual commitments
In the normal course of business, the Company enters into contracts that give rise to commitments for future minimum payments. The following table summarizes the remaining contractual maturities of the Company’s financial liabilities and commitments as at December 31, 2025, shown in contractual undiscounted cashflows:
|
Fury Gold Mines Limited Results of Operations for the Year Ended December 31, 2025 (Amounts expressed in thousands of Canadian dollars, unless otherwise noted) |
|
Within 1 year |
2 to 3 years |
Over 3 years |
At December 31 2025 |
At December 31 2024 |
||||||||||||||||
|
Accounts payable and accrued liabilities |
$ | 2,023 | $ | - | $ | - | $ | 2,023 | $ | 855 | ||||||||||
|
Deferred government grant |
22 | - | - | 22 | - | |||||||||||||||
|
Flow-through expenditure requirements |
790 | - | - | 790 | 944 | |||||||||||||||
|
Undiscounted lease payments |
- | - | - | - | 65 | |||||||||||||||
|
Total |
$ | 2,835 | $ | - | $ | - | $ | 2,835 | $ | 1,864 | ||||||||||
The Company also makes certain payments arising on mineral claims and leases on an annual or bi-annual basis to ensure all the Company’s properties remain in good standing. The Company estimates that $501 of payments arising on mineral claims and leases will be payable during the year ended December 31, 2026.
In addition, the Company is committed to certain office rental expense in respect of shared head office premises as noted in section 9.
7.3 Summary of mineral property interests
A summary of the carrying amounts of the Company’s mineral property interests is as follows:
|
Quebec |
Nunavut |
Total |
||||||||||
|
Balance at December 31, 2023 |
$ | 122,978 | $ | 19,661 | $ | 142,639 | ||||||
|
Additions |
3,030 | - | 3,030 | |||||||||
|
Change in estimate of provision for site reclamation and closure |
(23 | ) | 427 | 404 | ||||||||
|
Impairment |
(88,885 | ) | (11,988 | ) | (100,873 | ) | ||||||
|
Balance at December 31, 2024 |
$ | 37,100 | $ | 8,100 | $ | 45,200 | ||||||
|
Additions |
5,436 | - | 5,436 | |||||||||
|
Change in estimate of provision for site reclamation and closure |
(597 | ) | (121 | ) | (718 | ) | ||||||
|
Balance at December 31, 2025 |
$ | 41,939 | $ | 7,979 | $ | 49,918 | ||||||
On February 29, 2024, the Company, and its former joint operations partner Newmont, through their respective subsidiaries, closed a transaction whereby the Company acquired 100% control of the joint operation interests, the Éléonore South project, consolidating these properties into the Company’s portfolio at which time the joint venture operation was dissolved. The 49.978% that Newmont held was acquired by the Company for $3,000 while incurring $30 in transaction costs. As part of the same transaction, the Company also acquired a 10.9% interest in Sirios Resources Inc. for $1,300 which is held as marketable securities.
The Company’s market capitalization had been persistently below the carrying value of its mineral properties over the last few years, and, accordingly, the Company engaged a third-party valuation specialist to conduct a review to determine a more reflective carrying value of these mineral property interests. The resulting report recommended an impairment charge to better reflect their values. Accordingly, the Company recorded an impairment charge of $100,873 for the year ended December 31, 2024.
On April 28, 2025, the Company acquired all of the issued and outstanding common shares of Quebec Precious Metals Corporation. The QPM Acquisition was accounted for as an asset acquisition, with its mineral property interests valued at $5,436.
During October 2025, the Company received the first milestone payment from Benz to acquire the remaining 25% interest (for a total 100% undivided interest) of the Eastmain Mine and Ruby Hill Properties. The payment of $1,100 consisted of $850 cash and Benz Common Shares with a market value at the time of $250.
|
Fury Gold Mines Limited Results of Operations for the Year Ended December 31, 2025 (Amounts expressed in thousands of Canadian dollars, unless otherwise noted) |
7.4 Capital resources
The Company seeks to proactively manage its capital resources and makes adjustments in light of changes in the economic environment and the risk characteristics of the Company’s assets. To effectively manage its capital requirements, the Company has in place a budgeting and cash management process to help determine the funds required to ensure the Company has the appropriate liquidity to meet its current project plans and achieve its growth objectives. The Company ensures that there is sufficient liquidity available to meet its short-term business requirements, including contractual commitments, taking into account its anticipated cash outflows from exploration activities and its holdings of cash and marketable securities. The Company monitors and adjusts, when required, these exploration programs as well as corporate administrative costs to ensure that adequate levels of working capital are maintained.
As at the date of this MD&A, the Company expects its existing working capital and other capital resources to support certain planned activities for the next 12 months at the Eau Claire and Committee Bay projects and short-term contractual commitments. The Company’s ability to undertake further project expansionary plans is dependent upon the Company’s ability to obtain adequate financing in the future. While the Company has been successful at raising capital in the past, there can be no assurance that the Company will have sufficient financing to meet its future capital requirements or that additional financing will be available on terms acceptable to the Company in the future.
During the year ended December 31, 2025, the Company issued 8,394,045 common shares as part of the QPM acquisition with a fair market value of $4,533. Share issuance costs incurred in respect of the acquisition were $199.
The Company closed a non-brokered private equity placement for gross proceeds of $4,306, consisting of 6,728,000 units at C$0.64 per unit. Each unit consisted of one common share of Fury Gold and one common share purchase warrant exercisable to purchase one Fury Gold common share at C$0.80 for a period of three years. Share issuance costs incurred in respect of the private placement were $123.
The same investor exercised its existing participation right in the June 2025 Offering and acquired additional 440,000 common shares of the Company at a price of C$0.67 per share for gross proceeds of $295. The funds raise from this investor will be used to advance the Company’s Committee Bay exploration program.
In October 2025, the Company issued (i) 9,915,000 flow-through units at a price of C$1.21 per unit and (ii) 6,003,000 flow-through at a price of C$1.00 per share, for total aggregate gross proceeds of $18,000 (“Oct 2025 Offering”). Each unit consists of one common share of Fury Gold and one-half common share purchase warrant, two of which is exercisable to purchase one additional common share at C$1.20 per warrant share for a period of two years. Share issuance costs related to the Oct 2025 Offering totaled $1,396, which included $1,198 in commissions and $198 in other issuance costs.
The Company closed a non-brokered private equity placement for gross proceeds of $1,300, consisting of 1,494,253 units at C$0.87 per unit. Each unit consists of one common share of Fury Gold and one-half common share purchase warrant, two of which is exercisable to purchase one additional common share at C$1.20 per warrant share for a period of two years. Share issuance costs incurred in respect of the private placement were $78.
October 2025 financing
In October 2025, the Company issued a total of 15,918,000 flow-through shares for total gross proceeds of $18,000. Share issue costs related to the October 2025 Offering totaled $1,396, which included $1,198 in commissions and $198 in other issuance costs.
Reconciliation of use of fund of October 2025 funding
Fury’s stated use of proceeds for the October 2025 Offering was to pursue exploration opportunities at both its Quebec and Nunavut projects. The funds raised and the application of these funds and working capital is summarized below.
|
Q4 2025 |
||||
|
Exploration and evaluation |
(1,180 | ) | ||
|
G&A expenditures |
- | |||
|
Total |
(1,180 | ) | ||
|
Amount raised |
16,604 | |||
|
Remaining to be spent on Quebec and Nunavut projects |
15,424 | |||
|
Fury Gold Mines Limited Results of Operations for the Year Ended December 31, 2025 (Amounts expressed in thousands of Canadian dollars, unless otherwise noted) |
June 2025 financing
In June 2025, the Company issued 3,999,701 flow-through shares for gross proceeds of $3,080. Share issue costs related to the June 2025 Offering totaled $223, which included $183 in commissions and $40 in other issuance costs.
Reconciliation of use of fund of 2025 funding
Fury’s stated use of proceeds for the June 2025 Offering was to pursue exploration opportunities at both its Quebec and Nunavut projects. The funds raised and the application of these funds and working capital is summarized below.
|
Q2 2025 |
Q3 2025 |
Q4 2025 |
||||||||||
|
Exploration and evaluation |
- | (1,818 | ) | (1,039 | ) | |||||||
|
G&A expenditures |
- | - | - | |||||||||
|
Total |
- | (1,818 | ) | (1,039 | ) | |||||||
|
Amount raised |
2,857 | - | - | |||||||||
|
Remaining to be spent on Quebec and Nunavut projects |
2,857 | 1,039 | - | |||||||||
June 2024 financing
In June 2024 the Company issued 5,320,000 flow-through shares for gross proceeds of $5,001 (“June 2024 Offering”). Share issue costs related to the June 2024 Offering totaled $533, which included $300 in commissions and $233 in other issuance costs. The proceeds of the June 2024 Offering will be used for the Company’s exploration program in Quebec.
Reconciliation of use of fund of 2024 funding
Fury’s stated use of proceeds for the June 2024 Offering was for (i) exploration at Eau Claire, (ii) Geochemical sampling and exploration at Éléonore South. The funds raised and the application of these funds and working capital is summarized below.
|
Q2 2024 |
Q3 2024 |
Q4 2024 |
Q1 2025 |
|||||||||||||
|
Quebec explorations |
(456 | ) | (1,773 | ) | (626 | ) | (1,710 | ) | ||||||||
|
G&A expenditures |
- | - | - | - | ||||||||||||
|
Total |
(456 | ) | (1,773 | ) | (626 | ) | (1,710 | ) | ||||||||
|
Amount raised |
4,565 | - | - | - | ||||||||||||
|
Remaining to be spent on Quebec projects |
4,109 | 2,336 | 1,710 | - | ||||||||||||
The Company use of fund from the 2024 financing is summarized below:
|
Financing |
Intended Use of Funds ($,000) |
Actual Use of Proceeds |
Variance and Impact on Business Objectives and Milestones |
|
June 2024 Financing: ● Issuance of 5,320,000 “flow-through” Common Shares for net proceeds of $4,565 |
● $2,500 for exploration on Eau Claire Project ● $2,000 to $2,500 for exploration at Éléonore South |
Work commenced at Eau Claire at the end of Q2 2024 while drilling at Elenore South commenced in February 2025 |
N/A |
|
Fury Gold Mines Limited Results of Operations for the Year Ended December 31, 2025 (Amounts expressed in thousands of Canadian dollars, unless otherwise noted) |
Exercise of share options and warrants
During the year ended December 31, 2025, 156,000 shares were issued as a result of share options being exercised with a weighted average exercise price of $0.55 for gross proceeds of $85. An amount of $42 attributed to these share options was transferred from the equity reserves and recorded against share capital. There was no exercise of share purchase warrants.
As at December 31, 2025, the share options outstanding were as follows:
|
Share options outstanding |
Share options exercisable | |||||||||||||||||||||||
|
Exercise price ($/option) |
Number of shares |
Weighted average exercise price ($/option) |
Weighted average remaining life (years) |
Number of shares |
Weighted average exercise price ($/option) |
Weighted average remaining life (years) |
||||||||||||||||||
|
C$0.53 – C$1.00 |
3,689,500 | 0.83 | 1.78 | 3,629,500 | 0.83 | 1.74 | ||||||||||||||||||
|
C$1.00 – C$1.85 |
2,616,659 | 1.06 | 1.14 | 2,616,659 | 1.06 | 1.14 | ||||||||||||||||||
|
C$2.05 – C$3.91 |
33,345 | 3.37 | 0.49 | 33,345 | 3.37 | 0.49 | ||||||||||||||||||
| 6,339,504 | 0.94 | 1.51 | 6,279,504 | 0.94 | 1.48 | |||||||||||||||||||
The number of share purchase warrants outstanding at December 31, 2025 was as follows:
|
Warrants outstanding |
Weighted average exercise price (C$/share) |
|||||||
|
Outstanding, December 31, 2023 |
7,461,450 | $ | 1.20 | |||||
|
Expired |
(7,461,450 | ) | 1.20 | |||||
|
Outstanding, December 31, 2024 |
- | - | ||||||
|
Issued |
13,029,435 | 1.00 | ||||||
|
Outstanding, December 31, 2025 |
13,029,435 | $ | 1.00 | |||||
On January 9, 2025, the Company issued 590,000 DSU’s to directors and 1,142,500 RSU’s to officers, and employees. The DSU’s and RSU’s were issued in accordance with the Company’s LTI plan, with a grant-date fair value of $0.55 per unit, one third vesting annually on the anniversary and to be paid out as fully paid shares.
During the year ended December 31, 2025, the Company granted 140,000 share options, (December 31, 2024 – 245,000), to certain employees and consultants who provide defined on-going services to the Company, representative of employee service. In addition, during the year ended December 31, 2025, QPM options were converted to 282,470 share options of the Company.
The Company does not utilize off-balance sheet arrangements. Earn-in arrangements are not viewed as off-balance sheet arrangements, and there are no other commitments held by the Company at the balance sheet date.
As at March 31, 2026, there were 6,427,274 and 13,029,435 share options and warrants outstanding, respectively, with a weighted average exercise price of $0.94 and $1.00, respectively.
|
Fury Gold Mines Limited Results of Operations for the Year Ended December 31, 2025 (Amounts expressed in thousands of Canadian dollars, unless otherwise noted) |
7.5 Capital structure
Authorized: Unlimited common shares without par value. Unlimited preferred shares – nil issued and outstanding.
Number of common shares issued and outstanding as at December 31, 2025: 189,143,299
Number of common shares issued and outstanding as at March 31, 2026: 190,123,861
7.6 Planned Exploration Activities
The Company is funded for its planned 2026 exploration programs, which include infill drilling at Eau Claire as well as a summer drill program at Committee Bay.
As at December 31, 2025, the Company had positive working capital of approximately $29 million, which the Company defines as total current assets less total current liabilities including a cash balance of $21 million (which excludes $0.1 million of restricted cash). As of the date of this MD&A, the Company's working capital is estimated to have declined by approximately $5 million since December 31, 2025, to pay for general corporate costs. The Company does not include its shares in Dolly Varden in working capital because it accounts for these shares as an affiliated entity. The Dolly Varden shares are eligible for sale and there is a reasonably liquid market for them. Subsequent to year end, an earlier announced merger of equals between Dolly Varden and Contango was approved at a shareholders meeting and regulatory approval was received on March 23, 2026 while the merger closed on March 26, 2026. The Company’s shareholding in Dolly Varden was converted into shares of Contango at a rate of 0.1652 Contango shares for each Dolly Varden share while converting from an investment in associate to marketable securities. The Company is no longer subject to any restrictions in its ability to sell these converted shares nor is it entitled to representation on the board as the Investor Rights Agreement of February 25, 2022 terminated on completion the merger of Dolly Varden and Contango. Tim Clark, Fury’s CEO also serves as a director of Contango with permission of the Fury Board.
7.7 Impairment of Mineral Properties
As required under IFRS Accounting Standards as issued by the IASB, we regularly assess whether impairment indicators are present and perform impairment testing as required.
In accordance with the Company’s accounting policies and processes, each asset or CGU is evaluated annually, to determine whether there are any indications of impairment or impairment reversal. If any such indications of impairment exist, a formal estimate of the recoverable amount is performed. Given the Company’s persistent lower market capitalization compared to its mineral properties carrying value, the Company engaged a third-party valuation specialist, in consultation with management, to assess the recoverability of the carrying value of the Company’s properties. The Company assessed the recoverable value of the CGUs based on its fair value less cost of disposal (“FVLCD”).
The Company utilized a market approach, which takes into account valuations of similar public companies and comparable transactions, to determine a recoverable amount. The recoverable amount was calculated using in situ multiples identified through independent research. This analysis along with specific attributes of the Eau Claire and Committee Bay Project was used as the basis of determining a reasonable per ounce valuation for these to projects. The Éléonore South Project which did not have a Mineral Resource Estimate at the time, was valued through a primary market approach, based on its recent acquisition by the Company. The CGUs were categorised within the Level 3 of the fair value hierarchy, using a combination of inputs other than quoted prices which were observable and unobservable to determine the fair value of the assets.
Based on the Company’s assessment with respect to possible indicators of impairment, the Company concluded that as at December 31, 2024 impairment indicators exist and based on the impairment analysis performed, an impairment on its Eau Claire project of $88,885 and Committee Bay project of $11,988 totaling $100,873 was recorded. Estimating the in-situ multiples requires a significant management judgment due to the high degree of estimation uncertainty. Changes in the inputs used to determine the recoverable amount will result in a change to the valuation of the mineral properties and impairment expense. A 15% change in the in-situ values used, would give rise to a 13% change in the mineral properties values.
|
Fury Gold Mines Limited Results of Operations for the Year Ended December 31, 2025 (Amounts expressed in thousands of Canadian dollars, unless otherwise noted) |
The result of the impairment aligned the carrying value of these properties to the Company’s market capitalization value as at December 31, 2024, as per the guidance of IFRS 6.20(d). There was no indicator of impairment as at December 31, 2025.
Section 8: Financial risk summary
As at December 31, 2025, the Company’s financial instruments consist of cash, marketable securities, other investments, accounts receivable, deposits, accounts payable and accrued liabilities, and deferred government grants. The fair values of these financial instruments, other than the marketable securities and other investments, approximate their carrying values due to their short term to maturity. The Company’s marketable securities, representing investments held in publicly traded entities, were classified as level 1 of the fair value hierarchy and measured at fair value using their quoted market price at period end. The Company’s other investments, representing investments held in private entities, were classified as level 3 of the fair value hierarchy and measured at fair value based on unobservable inputs.
The Company’s financial instruments are exposed to certain financial risks, primarily liquidity risk, credit risk and market risk, including price risk. Details of the primary financial risks that the Company is exposed to are available in the notes to the Company’s consolidated financial statements for the year ended December 31, 2025.
Section 9: Related party transactions and balances
9.1 UMS
The Company did not have any related party transactions as contemplated by securities policies dealing with protection of minority shareholders. The Company’s shared services provider arrangements are considered related party transactions for financial disclosure purposes. The Company owns 25% of the common shares of Universal Mineral Services Ltd (“UMS “) a shared services provider, with the other 75% owned by three other mineral exploration companies. UMS is a private company through which its four junior resource shareholders, including Fury Gold, share geological, financial, and transactional advisory services as well as administrative services on a full, cost recovery basis. This allows the Company to maintain a more efficient and cost-effective corporate overhead structure by hiring fewer full-time employees and engaging outside professional advisory firms less frequently. The agreement has an indefinite term and can be terminated for any participant upon providing 180 days’ notice.
All transactions with UMS have occurred in the normal course of operations, and all amounts owing to or from UMS are unsecured, non-interest bearing, and have no specific terms of settlement, unless otherwise noted.
|
Years ended December 31 |
||||||||
|
2025 |
2024 |
|||||||
|
Exploration and evaluation costs |
$ | 344 | $ | 233 | ||||
|
General and administration |
232 | 307 | ||||||
|
Total transactions for the period |
$ | 576 | $ | 540 | ||||
The outstanding balance owing at December 31, 2025, was $57 (December 31, 2024 – $90) which is included in accounts payable and accrued liabilities.
As part of the UMS arrangement, the Company is contractually obliged to pay certain rental expenses in respect of a ten-year office lease entered into by UMS on July 1, 2021. As at December 31, 2025, the Company expects to incur approximately $77 in respect of its share of future rental expense of UMS.
The Company issues share options to certain UMS employees, including key management personnel of the Company. The Company recognized a share-based compensation expense of $11 for the year ended December 31, 2025, in respect of share options issued to UMS employees (December 31, 2024 - $3 recovery) which is included within employee benefits and exploration and evaluation costs.
9.2 Key management personnel
Key management personnel include Fury Gold’s board of directors and certain executive officers of the Company, including the Chief Executive Officer and Chief Financial Officer.
|
Fury Gold Mines Limited Results of Operations for the Year Ended December 31, 2025 (Amounts expressed in thousands of Canadian dollars, unless otherwise noted) |
The remuneration of the Company’s key management personnel was as follows:
|
Years ended December 31 |
||||||||
|
2025 |
2024 |
|||||||
|
Short-term benefits provided to executives (a) |
$ | 1,453 | $ | 1,306 | ||||
|
Directors’ fees paid to non-executive directors |
251 | 161 | ||||||
|
Share-based payments |
594 | 724 | ||||||
|
Total |
$ | 2,298 | $ | 2,191 | ||||
(a) Short-term employee benefits include salaries, bonuses payable within twelve months of the date of the consolidated statement of financial position, and other annual employee benefits.
Section 10: Critical accounting estimates and judgments
The preparation of financial statements in conformity with IFRS Accounting Standards as issued by the IASB requires management to select accounting policies and make estimates and judgments that may have a significant impact on the consolidated financial statements. Estimates are continuously evaluated and are based on management’s experience and expectations of future events that are believed to be reasonable under the circumstances. Actual outcomes may differ from these estimates.
Critical accounting judgments exercised in applying accounting policies, apart from those involving estimates, which have the most significant effect on the amounts recognized in these consolidated financial statements are as follows:
Critical accounting judgments exercised in applying accounting policies, apart from those involving estimates, which have the most significant effect on the amounts recognized in these consolidated financial statements are as follows:
|
(a) |
Functional currency |
The functional currency for each of the Company’s subsidiaries is the currency of the primary economic environment in which the entity operates. Determination of functional currency may involve certain judgments to determine the primary economic environment and the Company reconsiders the functional currency of its entities if there is a change in events and conditions that determined the primary economic environment.
|
(b) |
Economic recoverability and probability of future economic benefits of mineral property interests |
Management has determined that the acquisition of mineral properties and related costs incurred, which have been recognized on the consolidated statements of financial position, are economically recoverable. Management uses several criteria in its assessments of economic recoverability and probability of future economic benefit including geological data, scoping studies, accessible facilities, and existing and future permits.
|
(c) |
Indications of impairment of assets |
Assessments of impairment indicators are performed at the Cash Generating Unit (“CGU”) level and judgment is involved in assessing whether there is any indication that an asset or a CGU may be impaired. The assessment of the impairment indicators involves the application of a number of significant judgments and estimates to certain variables, including metal price trends, exploration plans for properties, and the results of exploration and evaluation to date.
|
(d) |
Income taxes |
The provision for income taxes and composition of income tax assets and liabilities requires management’s judgment. The application of income tax legislation also requires judgment in order to interpret legislation and to apply those findings to the Company’s transactions.
|
Fury Gold Mines Limited Results of Operations for the Year Ended December 31, 2025 (Amounts expressed in thousands of Canadian dollars, unless otherwise noted) |
|
(e) |
Determination of control of subsidiaries and joint arrangements |
Judgment is required to determine when the Company has control of subsidiaries or joint control of joint arrangements. This requires an assessment of the relevant activities of the investee, being those activities that significantly affect the investee’s returns (including operating and capital expenditure decision-making, financing of the investee, and the appointment, remuneration, and termination of key management personnel) and when the decisions in relation to those activities are under the control of the Company or require unanimous consent from the investors.
|
(f) |
Investments in associates |
The Company conducts a portion of its business through equity interests in associates. An associate is an entity over which the Company has significant influence and is neither a subsidiary nor a joint venture. The Company has significant influence when it has the power to participate in the financial and operating policy decisions of the associate but does not have control or joint control over those policy decisions.
|
(g) |
Financial instruments |
Financial instruments are assessed upon initial recognition to determine whether they meet the definition of a financial asset, financial liability, or equity instrument depending on the substance of the contractual arrangement. Judgment is required in making this determination as the substance of a transaction may differ from its legal form. Once a determination is made, IFRS Accounting Standards as issued by the IASB requires that financial instruments be measured at fair value on initial recognition. For financial instruments that do not have quoted market prices or observable inputs, judgments are made in determining what are appropriate inputs and assumptions to use in calculating the fair value.
Key sources of estimation uncertainty that have significant risk of causing a material adjustment to the carrying amount of assets and liabilities are as follows:
|
(h) |
Reclamation obligations |
Management assesses its reclamation obligations annually and when circumstances suggest that a material change to the obligations have occurred. Significant estimates and assumptions are made in determining the provision for site reclamation and closure because there are numerous factors that will affect the ultimate liability that becomes payable. These factors include estimates of the extent, the timing, and the cost of reclamation activities, regulatory change, cost increases, and changes in discount rates. Those uncertainties may result in actual expenditures differing from the amounts currently provided. The provision at the reporting date represents management’s best estimate of the present value of the future reclamation costs required. Changes to estimated future costs are recognized in the consolidated statements of financial position by adjusting the reclamation asset and liability.
|
(i) |
Share-based compensation |
The Company determines the fair value of equity-settled share-based payments using the fair value of the equity instruments at the grant date. For options granted, the Company uses the Black‐Scholes option pricing model. This option pricing model requires the development of market-based subjective inputs, including the risk-free interest rate, expected price volatility, and expected life of the option. Changes in these inputs and the underlying assumption used to develop them can materially affect the fair value estimate.
|
(j) |
Deferred tax assets and liabilities |
Management judgment and estimates are required in assessing whether deferred tax assets and deferred tax liabilities are recognized in the consolidated statements of financial position. Judgments are made as to whether future taxable profits will be available in order to recognize deferred tax assets. Assumptions about the generation of future taxable profits depend on management’s estimates of future cash flows. These depend on estimates of future production and sales volumes, commodity prices, reserves, operating costs, and other capital management transactions. These judgments and assumptions are subject to risk and uncertainty, and changes in circumstances may alter expectations which may impact the amount of deferred tax assets and deferred tax liabilities recognized on the consolidated statements of financial position and the benefit of other tax losses and temporary differences not yet recognized.
|
Fury Gold Mines Limited Results of Operations for the Year Ended December 31, 2025 (Amounts expressed in thousands of Canadian dollars, unless otherwise noted) |
Section 11: Application of new and revised accounting standards
New and amended standards not yet effective
Certain pronouncements have been issued by the IASB that are mandatory for accounting periods beginning after December 31, 2025. The Company has not early adopted any of these pronouncements, and the impact of some on the financial statements are still being evaluated.
On May 30, 2024, the IASB issued “Amendments to the Classification and Measurement of Financial Instruments (Amendments to IFRS 9 and IFRS 7)” to address matters identified during the post-implementation review of the classification and measurement requirements in IFRS 9 Financial Instruments and related requirements in IFRS 7 Financial Instruments: Disclosures. The amendments are effective for reporting periods beginning on or after January 1, 2026. Early application is permitted. The Company is currently evaluating the impact of the new standard on its financial statements.
On April 9, 2024, the IASB issued a new standard, called IFRS 18 Presentation and Disclosure in Financial Statements, which applies to an annual reporting period beginning on or after January 1, 2027, with earlier application permitted. IFRS 18 includes requirements for all entities applying IFRS Accounting Standards as issued by the IASB for the presentation and disclosure of information in financial statements. The Company is currently evaluating the impact of the new standard on its financial statements.
Section 12: Controls and procedures
Disclosure controls and procedures
Disclosure controls and procedures (“DC&P”) are designed to provide reasonable assurance that information required to be disclosed in reports filed with, or submitted to, securities regulatory authorities is recorded, processed, summarized and reported within the time periods specified under Canadian and U.S. securities laws. As of December 31, 2025, an evaluation was carried out under the supervision of, and with the participation of, the Company's management, including the CEO and CFO, of the effectiveness of the Company's DC&P, as defined in the applicable Canadian and U.S. securities laws. Based on that evaluation, the CEO and CFO concluded that such DC&P are effective as of December 31, 2025. No changes have occurred in the Company’s DC&P during year ended December 31, 2025, that have materially affected, or are reasonably likely to materially affect, the Company’s disclosure controls and procedures.
Internal control over financial reporting
Internal control over financial reporting (“ICFR”) includes those policies and procedures that:
|
■ |
pertain to the maintenance of records that in reasonable detail accurately and fairly reflect the transactions and dispositions of the assets of the Company; and |
|
■ |
provide reasonable assurance that transactions are recorded as necessary to permit preparation of consolidated financial statements in accordance with IFRS Accounting Standards as issued by the IASB, and that receipts and expenditures of the Company are being made only in accordance with authorizations of management and directors of the Company; and |
|
■ |
provide reasonable assurance regarding prevention or timely detection of unauthorized acquisition, use, or disposition of the Company assets, or incurring liabilities or other obligations that could have a material effect on the consolidated financial statements. |
It is management’s responsibility to establish and maintain adequate ICFR to provide reasonable assurance regarding the reliability of financial reporting and the preparation of consolidated financial statements for external purposes in accordance with IFRS Accounting Standards as issued by the IASB.
|
Fury Gold Mines Limited Results of Operations for the Year Ended December 31, 2025 (Amounts expressed in thousands of Canadian dollars, unless otherwise noted) |
The Company's management, including the Company’s CEO and CFO, assessed the effectiveness of the Corporation's ICFR as of December 31, 2025, based on the criteria set forth in Internal Control - Integrated Framework (2013) issued by the Committee of Sponsoring Organizations of the Treadway Commission. Based on this assessment, management concluded that, as of December 31, 2025, the Company's ICFR was effective. No changes have occurred in the Company’s ICFR during the year ended December 31, 2025, that have materially affected, or are reasonably likely to materially affect, the Company’s internal control over financial reporting.
Additional disclosures pertaining to the Company’s management information circulars, material change reports, press releases, and other information are available on SEDAR+ at www.sedarplus.com.
On behalf of the Board of Directors,
“Forrester A. Clark”
Forrester A. Clark
Chief Executive Officer
March 31, 2026
|
Fury Gold Mines Limited Results of Operations for the Year Ended December 31, 2025 (Amounts expressed in thousands of Canadian dollars, unless otherwise noted) |
Exhibit 99.4
CERTIFICATION REQUIRED BY RULE 13a-14(a) UNDER THE SECURITIES EXCHANGE ACT OF 1934
I Forrester Clark, of Fury Gold Mines Ltd. Certify that:
|
1. |
I have reviewed this annual report on Form 40-F of Fury Gold Mines Ltd. (the “Issuer”); |
|
2. |
Based on my knowledge, this report does not contain any untrue statement of a material fact or omit to state a material fact necessary to make the statements made, in light of the circumstances under which such statements were made, not misleading with respect to the period covered by this report; |
|
3. |
Based on my knowledge, the financial statements, and other financial information included in this report, fairly present in all material respects the financial condition, results of operations and cash flows of the Issuer as of, and for, the periods presented in this report; |
|
4. |
The Issuer’s other certifying officer and I are responsible for establishing and maintaining disclosure controls and procedures (as defined in Exchange Act Rules 13a-15(e) and 15d-15(e)) and internal control over financial reporting (as defined in Exchange Act Rules 13a-15(f) and 15d-15(f)) for the Issuer and have: |
|
(a) |
Designed such disclosure controls and procedures, or caused such disclosure controls and procedures to be designed under our supervision, to ensure that material information relating to the Issuer, including its consolidated subsidiaries, is made known to us by others within those entities, particularly during the period in which this report is being prepared; |
|
(b) |
Designed such internal control over financial reporting, or caused such internal control over financial reporting to be designed under our supervision, to provide reasonable assurance regarding the reliability of financial reporting and the preparation of financial statements for external purposes in accordance with generally accepted accounting principles; |
|
(c) |
Evaluated the effectiveness of the Issuer’s disclosure controls and procedures and presented in this report our conclusions about the effectiveness of the disclosure controls and procedures, as of the end of the period covered by this report based on such evaluation; and |
|
(d) |
Disclosed in this report any change in the Issuer’s internal control over financial reporting that occurred during the period covered by the annual report that has materially affected, or is reasonably likely to materially affect, the Issuer’s internal control over financial reporting. |
|
5. |
The Issuer’s other certifying officer and I have disclosed, based on our most recent evaluation of internal control over financial reporting, to the Issuer’s auditor and the audit committee of the Issuer’s board of directors (or persons performing the equivalent functions): |
|
(a) |
All significant deficiencies and material weaknesses in the design or operation of internal control over financial reporting which are reasonably likely to adversely affect the Issuer’s ability to record, process, summarize and report financial information; and |
|
(b) |
Any fraud, whether or not material, that involves management or other employees who have a significant role in the Issuer’s internal control over financial reporting. |
Date: March 31, 2026

Forrester A. Clark
Chief Executive Officer
Exhibit 99.5
CERTIFICATION REQUIRED BY RULE 13a-14(a) UNDER THE SECURITIES EXCHANGE ACT OF 1934
I Phil van Staden, of Fury Gold Mines Ltd. Certify that:
|
1. |
I have reviewed this annual report on Form 40-F of Fury Gold Mines Ltd. (the “Issuer”); |
|
2. |
Based on my knowledge, this report does not contain any untrue statement of a material fact or omit to state a material fact necessary to make the statements made, in light of the circumstances under which such statements were made, not misleading with respect to the period covered by this report; |
|
3. |
Based on my knowledge, the financial statements, and other financial information included in this report, fairly present in all material respects the financial condition, results of operations and cash flows of the Issuer as of, and for, the periods presented in this report; |
|
4. |
The Issuer’s other certifying officer and I are responsible for establishing and maintaining disclosure controls and procedures (as defined in Exchange Act Rules 13a-15(e) and 15d-15(e)) and internal control over financial reporting (as defined in Exchange Act Rules 13a-15(f) and 15d-15(f)) for the Issuer and have: |
|
(a) |
Designed such disclosure controls and procedures, or caused such disclosure controls and procedures to be designed under our supervision, to ensure that material information relating to the Issuer, including its consolidated subsidiaries, is made known to us by others within those entities, particularly during the period in which this report is being prepared; |
|
(b) |
Designed such internal control over financial reporting, or caused such internal control over financial reporting to be designed under our supervision, to provide reasonable assurance regarding the reliability of financial reporting and the preparation of financial statements for external purposes in accordance with generally accepted accounting principles; |
|
(c) |
Evaluated the effectiveness of the Issuer’s disclosure controls and procedures and presented in this report our conclusions about the effectiveness of the disclosure controls and procedures, as of the end of the period covered by this report based on such evaluation; and |
|
(d) |
Disclosed in this report any change in the Issuer’s internal control over financial reporting that occurred during the period covered by the annual report that has materially affected, or is reasonably likely to materially affect, the Issuer’s internal control over financial reporting. |
|
5. |
The Issuer’s other certifying officer and I have disclosed, based on our most recent evaluation of internal control over financial reporting, to the Issuer’s auditor and the audit committee of the Issuer’s board of directors (or persons performing the equivalent functions): |
|
(a) |
All significant deficiencies and material weaknesses in the design or operation of internal control over financial reporting which are reasonably likely to adversely affect the Issuer’s ability to record, process, summarize and report financial information; and |
|
(b) |
Any fraud, whether or not material, that involves management or other employees who have a significant role in the Issuer’s internal control over financial reporting. |
Date: March 31, 2026

Phil van Staden
Chief Financial Officer
Exhibit 99.6
CERTIFICATION PURSUANT TO 18 U.S.C. §1350,
AS ADOPTED PURSUANT TO
SECTION 906 OF THE SARBANES-OXLEY ACT OF 2002
In connection with the Annual Report of Fury Gold Mines Ltd. (the “Company”) on Form 40-F for the period ended December 31, 2025 as filed with the Securities and Exchange Commission on the date hereof (the “Report”), I, Forrester Clark, Chief Executive Officer of the Company, certify, pursuant to 18 U.S.C. §1350, as adopted pursuant to Section 906 of the Sarbanes-Oxley Act of 2002, that:
|
1. |
The Report fully complies with the requirements of Section 13(a) or 15(d) of the Securities Exchange Act of 1934, as amended; and |
|
2. |
The information contained in this Report fairly presents, in all material respects, the financial condition and results of operations of the Company. |
Date: March 31, 2026
Forrester A. Clark
Chief Executive Officer
A signed original of this written statement required by Section 906 has been provided to Fury Gold Mines Ltd. and will be retained by Fury Gold Mines Ltd. and furnished to the Securities and Exchange Commission or its staff upon request.
Exhibit 99.7
CERTIFICATION PURSUANT TO 18 U.S.C. §1350,
AS ADOPTED PURSUANT TO
SECTION 906 OF THE SARBANES-OXLEY ACT OF 2002
In connection with the Annual Report of Fury Gold Mines Ltd. (the “Company”) on Form 40-F for the period ended December 31, 2025 as filed with the Securities and Exchange Commission on the date hereof (the “Report”), I, Phil van Staden, Chief Financial Officer of the Company, certify, pursuant to 18 U.S.C. §1350, as adopted pursuant to Section 906 of the Sarbanes-Oxley Act of 2002, that:
|
1. |
The Report fully complies with the requirements of Section 13(a) or 15(d) of the Securities Exchange Act of 1934, as amended; and |
|
2. |
The information contained in this Report fairly presents, in all material respects, the financial condition and results of operations of the Company. |
Date: March 31, 2026
Phil van Staden
Chief Financial Officer
A signed original of this written statement required by Section 906 has been provided to Fury Gold Mines Ltd. and will be retained by Fury Gold Mines Ltd. and furnished to the Securities and Exchange Commission or its staff upon request.
Exhibit 99.8
CONSENT OF INDEPENDENT REGISTERED PUBLIC ACCOUNTING FIRM
We consent to the use of our reports dated March 31, 2026 relating to the financial statements of Fury Gold Mines Limited (the “Company”) and the effectiveness of the Company’s internal control over financial reporting appearing in this Annual Report on Form 40-F for the year ended December 31, 2025.
/s/ Deloitte LLP
Chartered Professional Accountants
March 31, 2026
Vancouver, Canada
Exhibit 99.9
CONSENT OF EXPERT
|
To: |
United States Securities and Exchange Commission |
|
Re: |
Fury of Gold Mines Limited (the “Company”) |
This consent is provided in connection with the Company’s annual report on Form 40-F for the year ended December 31, 2025 to be filed by the Company with the United States Securities and Exchange Commission (the “SEC”) and any amendments thereto (the “Annual Report”). The Annual Report incorporates by reference, among other things, the Company’s Annual Information Form for the year ended December 31, 2025 (the “AIF”), and the Company’s Management Discussion and Analysis for the year ended December 31, 2025 (the “MD&A”).
The undersigned hereby consents to references to the undersigned’s name and involvement in connection with the following technical report (the “Technical Report”) referred to in the Annual Report and the documents incorporated by reference therein:
“Preliminary Economic Assessment of the Eau Claire Project, Eeyou Istchee James Bay Region of Quebec, Canada” prepared by Maxime Dupéré, P.Geo, Sarah Dean, P.Geo., William van Breugel, P. Eng., Henri Gouin, P. Eng., Johnny Canosa, P. Eng., and Joseph Keane, P.E. of SGS Geological Services with an effective date of August 25, 2025.
and to references to the Technical Reports, or portions thereof, in the Annual Report, the AIF, and the MD&A and to the inclusion and incorporation by reference of the information derived from the Technical Report in the Annual Report, the AIF, and the MD&A.
Dated the 31 day of March, 2026
/S/ Maxime Dupéré
Maxime Dupéré, P. Geo
Exhibit 99.10
CONSENT OF EXPERT
|
To: |
United States Securities and Exchange Commission |
|
Re: |
Fury of Gold Mines Limited (the “Company”) |
This consent is provided in connection with the Company’s annual report on Form 40-F for the year ended December 31, 2025 to be filed by the Company with the United States Securities and Exchange Commission (the “SEC”) and any amendments thereto (the “Annual Report”). The Annual Report incorporates by reference, among other things, the Company’s Annual Information Form for the year ended December 31, 2025 (the “AIF”), and the Company’s Management Discussion and Analysis for the year ended December 31, 2025 (the “MD&A”).
The undersigned hereby consents to references to the undersigned’s name and involvement in connection with the following technical report (the “Technical Report”) referred to in the Annual Report and the documents incorporated by reference therein:
“Preliminary Economic Assessment of the Eau Claire Project, Eeyou Istchee James Bay Region of Quebec, Canada” prepared by Maxime Dupéré, P.Geo, Sarah Dean, P.Geo., William van Breugel, P. Eng., Henri Gouin, P. Eng., Johnny Canosa, P. Eng., and Joseph Keane, P.E. of SGS Geological Services with an effective date of August 25, 2025.
and to references to the Technical Reports, or portions thereof, in the Annual Report, the AIF, and the MD&A and to the inclusion and incorporation by reference of the information derived from the Technical Report in the Annual Report, the AIF, and the MD&A.
Dated the 31 day of March, 2026
/S/ Sarah Dean
Sarah Dean, P.Geo
Exhibit 99.11
CONSENT OF EXPERT
|
To: |
United States Securities and Exchange Commission |
|
Re: |
Fury of Gold Mines Limited (the “Company”) |
This consent is provided in connection with the Company’s annual report on Form 40-F for the year ended December 31, 2025 to be filed by the Company with the United States Securities and Exchange Commission (the “SEC”) and any amendments thereto (the “Annual Report”). The Annual Report incorporates by reference, among other things, the Company’s Annual Information Form for the year ended December 31, 2025 (the “AIF”), and the Company’s Management Discussion and Analysis for the year ended December 31, 2025 (the “MD&A”).
The undersigned hereby consents to references to the undersigned’s name and involvement in connection with the following technical report (the “Technical Report”) referred to in the Annual Report and the documents incorporated by reference therein:
“Preliminary Economic Assessment of the Eau Claire Project, Eeyou Istchee James Bay Region of Quebec, Canada” prepared by Maxime Dupéré, P.Geo, Sarah Dean, P.Geo., William van Breugel, P. Eng., Henri Gouin, P. Eng., Johnny Canosa, P. Eng., and Joseph Keane, P.E. of SGS Geological Services with an effective date of August 25, 2025.
and to references to the Technical Reports, or portions thereof, in the Annual Report, the AIF, and the MD&A and to the inclusion and incorporation by reference of the information derived from the Technical Report in the Annual Report, the AIF, and the MD&A.
Dated the 31 day of March, 2026
/S/ William van Breugel
William van Breugel, P. Eng.
Exhibit 99.12
CONSENT OF EXPERT
|
To: |
United States Securities and Exchange Commission |
|
Re: |
Fury of Gold Mines Limited (the “Company”) |
This consent is provided in connection with the Company’s annual report on Form 40-F for the year ended December 31, 2025 to be filed by the Company with the United States Securities and Exchange Commission (the “SEC”) and any amendments thereto (the “Annual Report”). The Annual Report incorporates by reference, among other things, the Company’s Annual Information Form for the year ended December 31, 2025 (the “AIF”), and the Company’s Management Discussion and Analysis for the year ended December 31, 2025 (the “MD&A”).
The undersigned hereby consents to references to the undersigned’s name and involvement in connection with the following technical report (the “Technical Report”) referred to in the Annual Report and the documents incorporated by reference therein:
“Preliminary Economic Assessment of the Eau Claire Project, Eeyou Istchee James Bay Region of Quebec, Canada” prepared by Maxime Dupéré, P.Geo, Sarah Dean, P.Geo., William van Breugel, P. Eng., Henri Gouin, P. Eng., Johnny Canosa, P. Eng., and Joseph Keane, P.E. of SGS Geological Services with an effective date of August 25, 2025.
and to references to the Technical Reports, or portions thereof, in the Annual Report, the AIF, and the MD&A and to the inclusion and incorporation by reference of the information derived from the Technical Report in the Annual Report, the AIF, and the MD&A.
Dated the 31 day of March, 2026
/S/ Johnny Canosa
Johnny Canosa, P. Eng.
Exhibit 99.13
CONSENT OF EXPERT
|
To: |
United States Securities and Exchange Commission |
|
Re: |
Fury of Gold Mines Limited (the “Company”) |
This consent is provided in connection with the Company’s annual report on Form 40-F for the year ended December 31, 2025 to be filed by the Company with the United States Securities and Exchange Commission (the “SEC”) and any amendments thereto (the “Annual Report”). The Annual Report incorporates by reference, among other things, the Company’s Annual Information Form for the year ended December 31, 2025 (the “AIF”), and the Company’s Management Discussion and Analysis for the year ended December 31, 2025 (the “MD&A”).
The undersigned hereby consents to references to the undersigned’s name and involvement in connection with the following technical report (the “Technical Report”) referred to in the Annual Report and the documents incorporated by reference therein:
“Preliminary Economic Assessment of the Eau Claire Project, Eeyou Istchee James Bay Region of Quebec, Canada” prepared by Maxime Dupéré, P.Geo, Sarah Dean, P.Geo., William van Breugel, P. Eng., Henri Gouin, P. Eng., Johnny Canosa, P. Eng., and Joseph Keane, P.E. of SGS Geological Services with an effective date of August 25, 2025.
and to references to the Technical Reports, or portions thereof, in the Annual Report, the AIF, and the MD&A and to the inclusion and incorporation by reference of the information derived from the Technical Report in the Annual Report, the AIF, and the MD&A.
Dated the 31 day of March, 2026
/S/ Henri Gouin
Henri Gouin, P. Eng.
Exhibit 99.14
CONSENT OF EXPERT
|
To: |
United States Securities and Exchange Commission |
|
Re: |
Fury of Gold Mines Limited (the “Company”) |
This consent is provided in connection with the Company’s annual report on Form 40-F for the year ended December 31, 2025 to be filed by the Company with the United States Securities and Exchange Commission (the “SEC”) and any amendments thereto (the “Annual Report”). The Annual Report incorporates by reference, among other things, the Company’s Annual Information Form for the year ended December 31, 2025 (the “AIF”), and the Company’s Management Discussion and Analysis for the year ended December 31, 2025 (the “MD&A”).
The undersigned hereby consents to references to the undersigned’s name and involvement in connection with the following technical report (the “Technical Report”) referred to in the Annual Report and the documents incorporated by reference therein:
“Preliminary Economic Assessment of the Eau Claire Project, Eeyou Istchee James Bay Region of Quebec, Canada” prepared by Maxime Dupéré, P.Geo, Sarah Dean, P.Geo., William van Breugel, P. Eng., Henri Gouin, P. Eng., Johnny Canosa, P. Eng., and Joseph Keane, P.E. of SGS Geological Services with an effective date of August 25, 2025.
and to references to the Technical Reports, or portions thereof, in the Annual Report, the AIF, and the MD&A and to the inclusion and incorporation by reference of the information derived from the Technical Report in the Annual Report, the AIF, and the MD&A.
Dated the 31 day of March, 2026
/S/ Joseph Keane
Joseph Keane, P.E.
Exhibit 99.15
CONSENT OF EXPERT
|
To: |
United States Securities and Exchange Commission |
|
Re: |
Fury of Gold Mines Limited (the “Company”) |
This consent is provided in connection with the Company’s annual report on Form 40-F for the year ended December 31, 2025 to be filed by the Company with the United States Securities and Exchange Commission (the “SEC”) and any amendments thereto (the “Annual Report”). The Annual Report incorporates by reference, among other things, the Company’s Annual Information Form for the year ended December 31, 2025 (the “AIF”), and the Company’s Management Discussion and Analysis for the year ended December 31, 2025 (the “MD&A”).
The undersigned hereby consents to references to the undersigned’s name and involvement in connection with the following technical report (the “Technical Report”) referred to in the Annual Report and the documents incorporated by reference therein:
Technical Report on the Committee Bay Project, Nunavut Territory, Canada, dated September 11, 2023.
and to references to the Technical Reports, or portions thereof, in the Annual Report, the AIF, and the MD&A and to the inclusion and incorporation by reference of the information derived from the Technical Report in the Annual Report, the AIF, and the MD&A.
Dated the 31 day of March, 2026
/S/ Bryan Atkinson
Bryan Atkinson, P. Geol.
Exhibit 99.16
CONSENT OF EXPERT
|
To: |
United States Securities and Exchange Commission |
|
Re: |
Fury of Gold Mines Limited (the “Company”) |
This consent is provided in connection with the Company’s annual report on Form 40-F for the year ended December 31, 2025 to be filed by the Company with the United States Securities and Exchange Commission (the “SEC”) and any amendments thereto (the “Annual Report”). The Annual Report incorporates by reference, among other things, the Company’s Annual Information Form for the year ended December 31, 2025 (the “AIF”), and the Company’s Management Discussion and Analysis for the year ended December 31, 2025 (the “MD&A”).
The undersigned hereby consents to references to the undersigned’s name and involvement in connection with the following technical report (the “Technical Report”) referred to in the Annual Report and the documents incorporated by reference therein:
Technical Report on the Committee Bay Project, Nunavut Territory, Canada, dated September 11, 2023.
and to references to the Technical Reports, or portions thereof, in the Annual Report, the AIF, and the MD&A and to the inclusion and incorporation by reference of the information derived from the Technical Report in the Annual Report, the AIF, and the MD&A.
Dated the 31 day of March, 2026
/S/ Andrew Turner
Andrew Turner, P. Geol., of APEX Geoscience Ltd.,
Exhibit 99.17
CONSENT OF EXPERT
|
To: |
United States Securities and Exchange Commission |
|
Re: |
Fury of Gold Mines Limited (the “Company”) |
This consent is provided in connection with the Company’s annual report on Form 40-F for the year ended December 31, 2025 to be filed by the Company with the United States Securities and Exchange Commission (the “SEC”) and any amendments thereto (the “Annual Report”). The Annual Report incorporates by reference, among other things, the Company’s Annual Information Form for the year ended December 31, 2025 (the “AIF”), and the Company’s Management Discussion and Analysis for the year ended December 31, 2025 (the “MD&A”).
The undersigned hereby consents to references to the undersigned’s name and involvement in connection with the following technical report (the “Technical Report”) referred to in the Annual Report and the documents incorporated by reference therein:
Technical Report on the Éléonore South Project, Quebec, Canada” with an effective date of March 31, 2025.
and to references to the Technical Reports, or portions thereof, in the Annual Report, the AIF, and the MD&A and to the inclusion and incorporation by reference of the information derived from the Technical Report in the Annual Report, the AIF, and the MD&A.
Dated the 31 day of March, 2026
/S/ Valerie Doyon
Mrs. Valerie Doyon, P. Geo
Exhibit 99.18
CONSENT OF EXPERT
|
To: |
United States Securities and Exchange Commission |
|
Re: |
Fury of Gold Mines Limited (the “Company”) |
This consent is provided in connection with the Company’s annual report on Form 40-F for the year ended December 31, 2025 to be filed by the Company with the United States Securities and Exchange Commission (the “SEC”) and any amendments thereto (the “Annual Report”). The Annual Report incorporates by reference, among other things, the Company’s Annual Information Form for the year ended December 31, 2025 (the “AIF”), and the Company’s Management Discussion and Analysis for the year ended December 31, 2025 (the “MD&A”).
The undersigned hereby consents to references to the undersigned’s name and involvement in connection with the following technical report (the “Technical Report”) referred to in the Annual Report and the documents incorporated by reference therein:
“Technical Report On The Initial Mineral Resource Estimate for the Sakami Project, Eeyou Istchee Territory, James Bay Region, Quebec, Canada. Report Date: January 21, 2026 Effective Date: November 11, 2025
and to references to the Technical Reports, or portions thereof, in the Annual Report, the AIF, and the MD&A and to the inclusion and incorporation by reference of the information derived from the Technical Report in the Annual Report, the AIF, and the MD&A.
Dated the 31 day of March, 2026
/S/ Olivier Vadnais-Leblanc
Olivier Vadnais-Leblanc, P.Geo.
SGS Canada Inc. – d/b/a Geological Services