UNITED
STATES
SECURITIES AND EXCHANGE COMMISSION
Washington, D.C. 20549
FORM 6-K
REPORT
OF FOREIGN PRIVATE ISSUER
PURSUANT TO RULE 13a-16 OR 15d-16
UNDER THE SECURITIES EXCHANGE ACT OF 1934
For the month of November 2025
Commission File No. 001-38145
Fury Gold Mines Limited
(Translation of registrant's name into English)
401
Bay Street, 16th Floor, Toronto, Ontario, Canada, M5H 2Y4
(Address of principal executive office)
Indicate by check mark whether the registrant files or will file annual reports under cover of Form 20-F or Form 40-F
Form 20-F ☒ Form 40-F ☐
SUBMITTED HEREWITH
| Exhibits | |
| 99.1 | Condensed Interim Consolidated Financial Statements |
| 99.2 | Management’s Discussion And Analysis |
| 99.3 | CEO certification of interim filings |
| 99.4 | CFO certification of interim filings |
SIGNATURE
Pursuant to the requirements of the Securities Exchange Act of 1934, the registrant has duly caused this report to be signed on its behalf by the undersigned, thereunto duly authorized.
Dated: November 13, 2025
Fury Gold Mines Limited
/s/ Phil van Staden
Phil van Staden
Chief Financial Officer
Exhibit 99.1
(An exploration company)
CONDENSED INTERIM
CONSOLIDATED FINANCIAL STATEMENTS
(Unaudited)
FOR THE THREE AND NINE MONTHS ENDED SEPTEMBER 30, 2025
Fury Gold Mines Limited
Condensed Interim Consolidated Statements of Financial Position
(Expressed in thousands of Canadian dollars - Unaudited)
| At September 30 | At December 31 | |||||||||
| Note | 2025 | 2024 | ||||||||
| Assets | ||||||||||
| Current assets: | ||||||||||
| Cash | $ | 6,127 | $ | 4,912 | ||||||
| Marketable securities | 5 | 2,356 | 2,358 | |||||||
| Other investment | 2,063 | 2,063 | ||||||||
| Accounts receivable | 314 | 54 | ||||||||
| Prepaid expenses and deposits | 640 | 522 | ||||||||
| 11,500 | 9,909 | |||||||||
| Non-current assets: | ||||||||||
| Restricted cash | 144 | 144 | ||||||||
| Prepaid expenses and deposits | 73 | 77 | ||||||||
| Property and equipment | 222 | 326 | ||||||||
| Mineral property interests | 4,6 | 50,176 | 45,200 | |||||||
| Investments in associates | 7 | 24,514 | 29,456 | |||||||
| 75,129 | 75,203 | |||||||||
| Total assets | $ | 86,629 | $ | 85,112 | ||||||
| Liabilities and Equity | ||||||||||
| Current liabilities: | ||||||||||
| Accounts payable and accrued liabilities | $ | 1,042 | $ | 855 | ||||||
| Deferred government grant | 8 | 47 | - | |||||||
| Lease liability | - | 65 | ||||||||
| Flow-through share premium liability | 9 | 206 | 944 | |||||||
| 1,295 | 1,864 | |||||||||
| Non-current liabilities: | ||||||||||
| Provision for site reclamation and closure | 4,696 | 5,045 | ||||||||
| Total liabilities | $ | 5,991 | $ | 6,909 | ||||||
| Equity: | ||||||||||
| Share capital | 12 | $ | 324,223 | $ | 312,723 | |||||
| Share option and warrant reserve | 13 | 23,312 | 22,684 | |||||||
| Accumulated other comprehensive loss | (18 | ) | (12 | ) | ||||||
| Deficit | (266,879 | ) | (257,192 | ) | ||||||
| Total equity | $ | 80,638 | $ | 78,203 | ||||||
| Total liabilities and equity | $ | 86,629 | $ | 85,112 | ||||||
Commitments (notes 7, 17); Subsequent events (note 18)
Approved on behalf of the Board of Directors:
| “Forrester A. Clark” | “Steve Cook” | ||
| Chief Executive Officer | Director |
The accompanying notes form an integral part of these condensed interim consolidated financial statements.
| Fury Gold Mines Limited |
|
Fury Gold Mines Limited
Condensed Interim Consolidated Statements of Loss and Comprehensive Loss
(Expressed in thousands of Canadian dollars, except per share amounts - Unaudited)
| Three months ended September 30 |
Nine months ended September 30 |
|||||||||||||||||
| Note | 2025 | 2024 (Note 3) |
2025 | 2024 (Note 3) |
||||||||||||||
| Operating expenses: | ||||||||||||||||||
| Exploration and evaluation | 10 | $ | 4,295 | $ | 2,318 | $ | 9,489 | $ | 4,794 | |||||||||
| Fees, salaries and other employee benefits | 485 | 412 | 1,547 | 1,517 | ||||||||||||||
| Insurance | 114 | 124 | 372 | 420 | ||||||||||||||
| Legal and professional | 310 | 138 | 896 | 602 | ||||||||||||||
| Marketing and investor relations | 198 | 138 | 615 | 464 | ||||||||||||||
| Office and administration | 51 | 98 | 219 | 280 | ||||||||||||||
| Regulatory and compliance | 71 | 36 | 262 | 170 | ||||||||||||||
| 5,524 | 3,264 | 13,400 | 8,247 | |||||||||||||||
| Other (income) expenses, net: | ||||||||||||||||||
| Accretion on provision for site reclamation and closure | 36 | 39 | 111 | 111 | ||||||||||||||
| Amortization of flow-through share premium | 9 | (194 | ) | (678 | ) | (1,142 | ) | (1,407 | ) | |||||||||
| Foreign exchange loss | 3 | 2 | 4 | 11 | ||||||||||||||
| Interest expense | - | 6 | 2 | 24 | ||||||||||||||
| Interest income | (53 | ) | (75 | ) | (132 | ) | (240 | ) | ||||||||||
| Net loss from associates | 7 | 1,847 | 1,668 | 3,634 | 3,624 | |||||||||||||
| Net gain on investments | 7 | (1,854 | ) | (1,780 | ) | (5,232 | ) | (2,538 | ) | |||||||||
| Net (gain) loss on marketable securities | 5 | (320 | ) | 421 | (668 | ) | (191 | ) | ||||||||||
| Other income | 11 | (126 | ) | - | (144 | ) | (566 | ) | ||||||||||
| (661 | ) | (397 | ) | (3,567 | ) | (1,172 | ) | |||||||||||
| Loss before taxes | 4,863 | 2,867 | 9,833 | 7,075 | ||||||||||||||
| Tax recovery | (164 | ) | (194 | ) | (146 | ) | (194 | ) | ||||||||||
| Net loss for the period | 4,699 | 2,673 | 9,687 | 6,881 | ||||||||||||||
| Other comprehensive loss, net of tax | ||||||||||||||||||
| Unrealized currency loss on translation of foreign operations |
2 | - | 6 | 2 | ||||||||||||||
| Total comprehensive loss for the period | $ | 4,701 | $ | 2,673 | $ | 9,693 | $ | 6,883 | ||||||||||
| Loss per share: | ||||||||||||||||||
| Basic and diluted loss per share | 16 | $ | 0.03 | $ | 0.02 | $ | 0.06 | $ | 0.05 | |||||||||
The accompanying notes form an integral part of these condensed interim consolidated financial statements.
| Fury Gold Mines Limited |
|
Fury Gold Mines Limited
Condensed Interim Consolidated Statements of Equity
(Expressed in thousands of Canadian dollars, except share amounts - Unaudited)
| Number of common shares |
Share capital |
Share option and warrant reserve |
Accumulated other comprehensive loss |
Deficit | Total | |||||||||||||||||||
| Balance at December 31, 2023 | 145,744,795 | $ | 310,277 | $ | 21,660 | $ | (9 | ) | $ | (149,054 | ) | $ | 182,874 | |||||||||||
| Total comprehensive loss (note 3) | - | - | - | (2 | ) | (6,881 | ) | (6,883 | ) | |||||||||||||||
| Shares issued pursuant to offering, net of share issue costs and flow-through premium liability (note 9) | 5,320,000 | 2,537 | - | - | - | 2,537 | ||||||||||||||||||
| Share-based compensation (note 13) | 441,278 | - | 995 | - | - | 995 | ||||||||||||||||||
| Balance at September 30, 2024 | 151,506,073 | $ | 312,814 | $ | 22,655 | $ | (11 | ) | $ | (155,935 | ) | $ | 179,523 | |||||||||||
| Balance at December 31, 2024 | 151,556,273 | $ | 312,723 | $ | 22,684 | $ | (12 | ) | $ | (257,192 | ) | $ | 78,203 | |||||||||||
| Total comprehensive loss | - | - | - | (6 | ) | (9,687 | ) | (9,693 | ) | |||||||||||||||
| Shares and warrants exchanged in QPM Acquisition (note 4) | 8,394,045 | 4,503 | 30 | - | - | 4,533 | ||||||||||||||||||
| Shares and warrants issued pursuant to private placement, net of share issue costs (note 13) | 7,168,000 | 3,571 | 906 | - | - | 4,477 | ||||||||||||||||||
| Shares issued pursuant to offering, net of share issue costs and flow-through premium liability (note 9) | 3,999,701 | 2,457 | - | - | - | 2,457 | ||||||||||||||||||
| Share options exercised (note 13) | 231,000 | 190 | (64 | ) | - | - | 126 | |||||||||||||||||
| Share-based compensation (note 13) | 382,027 | 779 | (244 | ) | - | - | 535 | |||||||||||||||||
| Balance at September 30, 2025 | 171,731,046 | $ | 324,223 | $ | 23,312 | $ | (18 | ) | $ | (266,879 | ) | $ | 80,638 | |||||||||||
The accompanying notes form an integral part of these condensed interim consolidated financial statements.
| Fury Gold Mines Limited |
|
Fury Gold Mines Limited
Condensed Interim Consolidated Statements of Cash Flows
(Expressed in thousands of Canadian dollars - Unaudited)
| Three months ended September 30 |
Nine months ended September 30 |
|||||||||||||||||
| Note | 2025 | 2024 (Note 3) |
2025 | 2024 (Note 3) |
||||||||||||||
| Operating activities: | ||||||||||||||||||
| Loss for the year | $ | (4,699 | ) | $ | (2,673 | ) | $ | (9,687 | ) | $ | (6,881 | ) | ||||||
| Adjusted for: | ||||||||||||||||||
| Interest income | (53 | ) | (75 | ) | (132 | ) | (240 | ) | ||||||||||
| Government grant received | 8 | - | - | 83 | - | |||||||||||||
| Items not involving cash: | ||||||||||||||||||
| Accretion of provision for site reclamation and closure | 36 | 39 | 111 | 111 | ||||||||||||||
| Amortization of flow-through share premium | 9 | (194 | ) | (678 | ) | (1,142 | ) | (1,407 | ) | |||||||||
| Depreciation | 43 | 69 | 151 | 227 | ||||||||||||||
| Interest expense | - | 6 | 2 | 24 | ||||||||||||||
| Net loss from associates | 7 | 1,847 | 1,668 | 3,634 | 3,624 | |||||||||||||
| Net gain on investments | 7 | (1,854 | ) | (1,780 | ) | (5,232 | ) | (2,538 | ) | |||||||||
| Net (gain) loss on marketable securities | 5 | (320 | ) | 421 | (668 | ) | (191 | ) | ||||||||||
| Share-based compensation | 13 | 164 | 179 | 535 | 831 | |||||||||||||
| Changes in non-cash working capital | 15 | (473 | ) | (524 | ) | (222 | ) | (67 | ) | |||||||||
| Cash used in operating activities | (5,503 | ) | (3,348 | ) | (12,567 | ) | (6,507 | ) | ||||||||||
| Investing activities: | ||||||||||||||||||
| Acquisition of mineral interests, inclusive of transaction fees | 4 | - | - | (904 | ) | (3,030 | ) | |||||||||||
| Interest income | 53 | 75 | 132 | 240 | ||||||||||||||
| Proceeds from disposition of investment in associate, net of transaction costs |
7 | 2,914 | - | 6,539 | 3,820 | |||||||||||||
| Proceeds from disposition of marketable securities, net of transaction costs |
5 | 57 | 237 | 670 | 481 | |||||||||||||
| Marketable securities additions | 5 | - | - | - | (1,300 | ) | ||||||||||||
| Other investments additions | - | (2,063 | ) | - | (2,063 | ) | ||||||||||||
| Property and equipment additions | - | (35 | ) | (47 | ) | (35 | ) | |||||||||||
| Cash provided by (used in) investing activities | 3,024 | (1,786 | ) | 6,390 | (1,887 | ) | ||||||||||||
| Financing activities: | ||||||||||||||||||
| Lease payments | - | (48 | ) | (62 | ) | (142 | ) | |||||||||||
| Proceeds from financing, net of share issue costs | 12 | - | - | 4,477 | - | |||||||||||||
| Proceeds from issuance of flow-through shares, net of issuance costs |
12 | - | (4 | ) | 2,857 | 4,560 | ||||||||||||
| Proceeds from exercise of options | 13 | 41 | - | 126 | - | |||||||||||||
| Cash provided by financing activities | 41 | (52 | ) | 7,398 | 4,418 | |||||||||||||
| Effect of foreign exchange on cash | (2 | ) | - | (6 | ) | (2 | ) | |||||||||||
| Increase (decrease) in cash | (2,440 | ) | (5,186 | ) | 1,215 | (3,977 | ) | |||||||||||
| Cash, beginning of period | 8,567 | 8,522 | 4,912 | 7,313 | ||||||||||||||
| Cash, end of period | $ | 6,127 | $ | 3,336 | $ | 6,127 | $ | 3,336 | ||||||||||
Supplemental cash flow information (note 15)
The accompanying notes form an integral part of these condensed interim consolidated financial statements.
| Fury Gold Mines Limited |
|
Note 1: Nature of operations
Fury Gold Mines Limited (the “Company” or “Fury Gold”) was incorporated on June 9, 2008, under the Business Corporations Act (British Columbia) and is listed on the Toronto Stock Exchange and the NYSE-American, with its common shares trading under the symbol FURY. The Company’s registered and records office is at 1500-1055 West Georgia Street Vancouver, BC, V6E 4N7 and the mailing address is 401 Bay Street, 16th Floor, Toronto, Ontario, M5H 2Y4.
The Company’s principal business activity is the acquisition and exploration of resource projects in Canada. At September 30, 2025, the Company had three principal projects: Committee Bay in Nunavut, and Eau Claire and Éléonore South in Quebec, which the Company now owns 100% after acquiring the 49.978% interest previously held by Newmont Corporation (“Newmont”) in February 2024. Additionally, at September 30, 2025, the Company holds a 12.92% common share interest in Dolly Varden Silver Corporation (“Dolly Varden”) which owns the Kitsault project in British Columbia, and a 25% interest in Universal Mineral Services Limited (“UMS”), a private shared-services provider (note 7).
Note 2: Basis of presentation
Statement of compliance
These unaudited condensed interim consolidated financial statements (the “interim financial statements”) have been prepared in accordance with IAS 34 Interim Financial Reporting as issued by the International Accounting Standards Board (“IASB”). Certain disclosures included in the Company’s annual consolidated financial statements (the “consolidated financial statements”) prepared in accordance with IFRS® Accounting Standards as issued by the IASB have been condensed or omitted herein. Accordingly, these unaudited interim financial statements should be read in conjunction with the Company’s audited consolidated financial statements for the year ended December 31, 2024. These interim financial statements were approved and authorized for issuance by the Board of Directors of the Company on November 13, 2025.
Basis of preparation and consolidation
These interim financial statements include the accounts of the Company and its subsidiaries. Subsidiaries are entities controlled by the Company. Control exists when the Company has power over an investee, when the Company is exposed, or has rights, to variable returns from the investee, and when the Company has the ability to affect those returns through its power over the investee. Subsidiaries are included in the consolidated financial results of the Company from the effective date of acquisition up to the effective date of disposition or loss of control. The Company’s interim results are not necessarily indicative of its results for a full year.
The subsidiaries (with a beneficial interest of 100%) of the Company as at September 30, 2025, were as follows:
| Subsidiary | Place of incorporation |
Functional currency |
| Eastmain Mines Inc. (“Eastmain Mines”) (a) | Canada | CAD |
| Eastmain Resources Inc. (“Eastmain”) | ON, Canada | CAD |
| Fury Gold USA Limited (“Fury Gold USA”) (b) | Delaware, U.S.A. | USD |
| North Country Gold Corp. (“North Country”) | BC, Canada | CAD |
| Quebec Precious Metals Corporation (“QPM”) (a) (c) | Canada | CAD |
(a) The entity is incorporated federally in Canada.
(b) Fury Gold USA provided certain administrative services with respect to employee benefits for US resident personnel.
(c) QPM’s results are included from April 28, 2025, which was the acquisition date. See note 4 for details.
| Fury Gold Mines Limited |
|
| Notes to the Q3 2025 Condensed Interim Consolidated Financial Statements | |
(Expressed in thousands of Canadian dollars, except where noted - Unaudited) |
Investments in associates
These interim financial statements also include the following investments in associates:
| Associates | Ownership interest | Location | Classification and accounting method |
| Dolly Varden | 12.92% | BC, Canada | Associate; equity method |
| UMS | 25.00% | BC, Canada | Associate; equity method |
These interim financial statements have been prepared on a historical cost basis except for certain financial instruments that have been measured at fair value (note 17). All amounts are expressed in thousands of Canadian dollars unless otherwise noted. Reference to US$ are to United States dollars. All intercompany balances and transactions have been eliminated.
Segmented information
The Company’s operating segments are reviewed by the CEO, who is the chief operating decision maker (“CODM”) to make decisions about resources to be allocated to the segments and to assess their performance. The Company operates two reportable operating segments, a focus on the acquisition, exploration, and development of mineral resource properties within Quebec and Nunavut, as well as an administrative and corporate segment. The information contained in note 10 is the information used by the CODM to assess where to deploy resources and capital.
Critical accounting estimates, judgments, and policies
The preparation of financial statements in accordance with IFRS Accounting Standards as issued by the IASB requires management to select accounting policies and make estimates and judgments that may have a significant impact on consolidated financial statements. Estimates are continuously evaluated and are based on management’s experience and expectations of future events that are believed to be reasonable under the circumstances. Actual outcomes may differ from these estimates.
In preparing the Company’s interim financial statements for the three and nine months ended September 30, 2025, the Company applied the material accounting policy information and critical accounting estimates and judgments disclosed in notes 3 and 5, respectively, of its consolidated financial statements for the year ended December 31, 2024.
Application of new and revised accounting standards
On August 14, 2023, the IASB issued “Lack of Exchangeability (Amendments to IAS 21)” with amendments to clarify the accounting when there is a lack of exchangeability. The amendments to IAS 21 are effective for annual periods beginning on or after January 1, 2025, with earlier application permitted. The adoption of the new standard did not have an impact on the financial statements of the Company.
New and not yet effective accounting standards
On May 30, 2024, the IASB issued “Amendments to the Classification and Measurement of Financial Instruments (Amendments to IFRS 9 and IFRS 7)” to address matters identified during the post-implementation review of the classification and measurement requirements in IFRS 9 Financial Instruments and related requirements in IFRS 7 Financial Instruments: Disclosures. The amendments are effective for reporting periods beginning on or after January 1, 2026. Early application is permitted. The Company is currently evaluating the impact of the new standard on its financial statements.
On April 9, 2024, the IASB issued a new standard, called IFRS 18 Presentation and Disclosure in Financial Statements, which applies to an annual reporting period beginning on or after January 1, 2027, with earlier application permitted. IFRS 18 includes requirements for all entities applying IFRS Accounting Standards as issued by the IASB for the presentation and disclosure of information in financial statements. The Company is currently evaluating the impact of the new standard on its financial statements.
| Fury Gold Mines Limited |
|
| Notes to the Q3 2025 Condensed Interim Consolidated Financial Statements | |
(Expressed in thousands of Canadian dollars, except where noted - Unaudited) |
Note 3: Revision of prior period financial statements
In preparing the consolidated financial statements for the year ended December 31, 2024, the Company identified errors in its previously issued unaudited condensed interim consolidated financial statements for the periods ended March 31, 2024 and September 30, 2024. The errors resulted in a misstatement of gain/loss on investments and investments in associates relating to the Company’s investment in Dolly Varden, specifically an understatement of dilution gains on the consolidated statement of (earnings) loss and comprehensive (income) loss, as well as an understatement of investment in associate on the statement of financial position. The impact of the revisions to the periods presented in this report are as follows:
| As reported | Adjustment | Revised | ||||||||||
| Revised Statement of Financial Position as of March 31, 2024 | ||||||||||||
| Investment in associates | 32,638 | 220 | 32,858 | |||||||||
| Total assets | 188,023 | 220 | 188,243 | |||||||||
| Deficit | (149,988 | ) | 220 | 149,768 | ||||||||
| Total equity | 182,356 | 220 | 182,576 | |||||||||
| Revised Consolidated Statement of Loss and Comprehensive Loss for the three months ended March 31, 2024 | ||||||||||||
| Gain on investments | (537 | ) | (220 | ) | (757 | ) | ||||||
| Net loss | 934 | (220 | ) | 714 | ||||||||
| Total comprehensive loss | 935 | (220 | ) | 715 | ||||||||
| Revised Consolidated Statement of Loss and Comprehensive Loss for the six months ended June 30, 2024 | ||||||||||||
| Gain on investments | (537 | ) | (220 | ) | (757 | ) | ||||||
| Net loss | 4,428 | (220 | ) | 4,208 | ||||||||
| Total comprehensive loss | 4,430 | (220 | ) | 4,210 | ||||||||
| Revised Statement of Financial Position as of September 30, 2024 |
||||||||||||
| Investment in associates | 29,341 | 2,000 | 31,341 | |||||||||
| Total assets | 184,099 | 2,000 | 186,099 | |||||||||
| Deficit | (157,932 | ) | 2,000 | (155,932 | ) | |||||||
| Total equity | 177,526 | 2,000 | 179,526 | |||||||||
| Revised Consolidated Statement of Loss and Comprehensive Loss for the three months ended September 30, 2024 | ||||||||||||
| Gain on investments | - | (1,780 | ) | (1,780 | ) | |||||||
| Net loss | 4,453 | (1,780 | ) | 2,673 | ||||||||
| Total comprehensive loss | 4,453 | (1,780 | ) | 2,673 | ||||||||
| Revised Consolidated Statement of Loss and Comprehensive Loss for the nine months ended September 30, 2024 | ||||||||||||
| Gain on investments | (538 | ) | (2,000 | ) | (2,538 | ) | ||||||
| Net loss | 8,881 | (2,000 | ) | 6,881 | ||||||||
| Total comprehensive loss | 8,883 | (2,000 | ) | 6,883 | ||||||||
| Fury Gold Mines Limited |
|
| Notes to the Q3 2025 Condensed Interim Consolidated Financial Statements | |
(Expressed in thousands of Canadian dollars, except where noted - Unaudited) |
Note 4: Acquisition of Quebec Precious Metals Corporation
On April 28, 2025, the Company acquired all of the issued and outstanding common shares of Quebec Precious Metals Corporation (the “QPM Shares”). Former shareholders of QPM received 0.0741 of a common share of the Company for each QPM Share held (the “Exchange Ratio”). As a result, the Company issued an aggregate 8,394,045 Fury Gold shares at a fair value of C$0.54 per share, for an aggregate fair value of $4,533 (the “QPM Acquisition”).
Share options and share purchase warrants of QPM that were outstanding as at the time of completion were exchanged for Fury Shares on substantially the same terms and conditions, with the number of Fury Gold shares issuable on exercise and the exercise price adjusted in accordance with the Exchange Ratio (note 13). The fair value of these replacement awards is not included in purchase price consideration in accordance with IFRS 2 Share-based Payment (note 13).
On April 22, 2025, the Company entered into a contingent capital contribution agreement with QPM for a contribution amount of $750. Upon completion of the QPM Acquisition, the contingent capital contribution formed part of the consideration. Additionally, the Company incurred transaction costs of $199 comprised of due diligence costs, legal and listing fees. Transaction costs are allocated as part of the consideration according to the Company’s accounting policy.
The Company concluded that the QPM Acquisition did not constitute a business combination and accounted for it as an asset acquisition. A summary of the Company's consideration paid, assets acquired, and liabilities assumed from QPM as at acquisition date is as follows:
| Purchase price | ||||
| Cash consideration | $ | 750 | ||
| Fair value of common shares issued | 4,533 | |||
| Transaction costs | 199 | |||
| Total | $ | 5,482 | ||
| Net assets acquired | ||||
| Cash | $ | 547 | ||
| Other receivables and assets | 164 | |||
| Mineral property interests | 5,436 | |||
| Accounts payable and other liabilities | (600 | ) | ||
| Deferred government grant | (65 | ) | ||
| Total | $ | 5,482 | ||
QPM holds a land package covering approximately 70,900 hectares in the Eeyou Istchee James Bay territory, Quebec, near Newmont Corporation’s Éléonore gold mine. QPM’s focus has been on advancing its Sakami gold project and its newly discovered, drill-ready Ninaaskuwin lithium showing on the Elmer East project. In addition, QPM holds a 68% interest in the Kipawa rare earths project located near Temiscaming, Quebec.
Note 5: Marketable securities
The marketable securities held by the Company were as follows:
| Total | ||||
| Balance at December 31, 2023 | $ | 1,166 | ||
| Additions | 1,300 | |||
| Sale of marketable securities | (481 | ) | ||
| Realized loss on disposition | (60 | ) | ||
| Unrealized net gain | 433 | |||
| Balance at December 31, 2024 | $ | 2,358 | ||
| Sale of marketable securities | (670 | ) | ||
| Realized gain on disposition | 58 | |||
| Unrealized net gain | 610 | |||
| Balance at September 30, 2025 | $ | 2,356 | ||
| Fury Gold Mines Limited |
|
| Notes to the Q3 2025 Condensed Interim Consolidated Financial Statements | |
(Expressed in thousands of Canadian dollars, except where noted - Unaudited) |
Note 6: Mineral property interests
The Company’s principal resource properties are located in Canada. A summary of the carrying amounts is as follows:
| Quebec | Nunavut | Total | ||||||||||
| Balance at December 31, 2023 | $ | 122,978 | $ | 19,661 | $ | 142,639 | ||||||
| Additions(a) | 3,030 | - | 3,030 | |||||||||
| Change in estimate of provision for site reclamation and closure | (23 | ) | 427 | 404 | ||||||||
| Impairment(b) | (88,885 | ) | (11,988 | ) | (100,873 | ) | ||||||
| Balance at December 31, 2024 | $ | 37,100 | $ | 8,100 | $ | 45,200 | ||||||
| Additions (note 4) | 5,436 | - | 5,436 | |||||||||
| Change in estimate of provision for site reclamation and closure | (546 | ) | 86 | (460 | ) | |||||||
| Balance at September 30, 2025 | $ | 41,990 | $ | 8,186 | $ | 50,176 | ||||||
(a) On February 29, 2024, the Company, and its joint operation partner Newmont, through their respective subsidiaries, closed a transaction whereby the Company acquired 100% control of the joint operation interests, the Éléonore South project, consolidating these properties into the Company’s portfolio at which time the joint venture operation was dissolved. The 49.978% that Newmont held was acquired by the Company for $3,000 while incurring $30 in transaction costs. As part of the same transaction, the Company also acquired a 10.9% interest in Sirios, as disclosed in note 5.
(b) The Company’s market capitalization has historically been below the carrying value of its mineral properties over the last few years, and, for this reason, the Company engaged a third-party valuation specialist to conduct a review to determine a more reflective carrying value. As a result, the report recommended an impairment charge to these properties, to better align with the market capitalization value as at December 31, 2024.
Note 7: Investments in associates
| (a) | Acquisition of investments in associates |
| (i) | On February 25, 2022, the Company completed the sale of Homestake Resources Corporation to Dolly Varden for cash proceeds of $5,000 and 76,504,590 common shares of Dolly Varden. The Company’s resulting interest in Dolly Varden represented approximately 35.3% of the issued and outstanding common shares of Dolly Varden on February 25, 2022, which has been accounted for using the equity method. The Company recognized a gain of $48,390, net of transaction costs of $589, on the date of disposition. On October 13, 2022, the Company completed the sale of 17,000,000 common shares of Dolly Varden for total gross proceeds of $6,800. During the year ended December 31, 2024, the Company sold an aggregate 8,450,000 shares of Dolly Varden for net proceeds of $7,042. The Company’s investment was also diluted through financing rounds by Dolly Varden in which the Company did not participate. As a result, the Company had a gain on investments of $4,109 consisting of a realized gain on disposal of $2,026 and a gain on dilution of $2,083 for the year ended December 31, 2024. On April 2, 2025, Dolly Varden announced a four for one Common Share Consolidation which took effect on April 7, 2025. The impact of this was that the Company’s 51,054,590 Common Shares was consolidated into 12,763,648 Common Shares. On May 8, 2025, the Company completed the sale of 1,000,000 common shares of Dolly Varden for total gross proceeds of $3,625. On September 17, 2025, the Company completed the sale of 500,000 common shares of Dolly Varden for total gross proceeds of $2,914. During the three and nine months ended September 30, 2025, there has been a dilution gain on investments of $34 and $2,002 respectively (three and nine months ended September 30, 2024 – $1,780 and $2,000, respectively), as well as a realized gain of $1,820 and $3,230 respectively (three and nine months ended September 30, 2024 – $nil and $538, respectively). |
| Fury Gold Mines Limited |
|
| Notes to the Q3 2025 Condensed Interim Consolidated Financial Statements | |
(Expressed in thousands of Canadian dollars, except where noted - Unaudited) |
| (ii) | On April 1, 2022, the Company purchased a 25% share interest in UMS, a private shared-services provider, for nominal consideration. The Company funded, in addition to its nominal investment in UMS, a cash deposit of $150 which is held by UMS for the purposes of general working capital, and which will be returned to the Company upon termination of the UMS Canada arrangement, net of any residual unfulfilled obligations. UMS is the private company through which its shareholders, including Fury Gold, share geological, financial, and transactional advisory services as well as administrative services on a full, cost recovery basis. |
| (b) | Summarized financial information of the Company’s investments in associates: |
The carrying amounts of the Company’s investments in associates were as follows:
| Dolly Varden | UMS | Total | ||||||||||
| Carrying amount at December 31, 2023 | $ | 36,126 | $ | 122 | $ | 36,248 | ||||||
| Company’s share of net loss of associates | (3,837 | ) | (21 | ) | (3,858 | ) | ||||||
| Disposition | (5,017 | ) | - | (5,017 | ) | |||||||
| Dilution gain | 2,083 | - | 2,083 | |||||||||
| Carrying amount at December 31, 2024 | $ | 29,355 | $ | 101 | $ | 29,456 | ||||||
| Company’s share of net loss of associates | (3,632 | ) | (2 | ) | (3,634 | ) | ||||||
| Disposition | (3,310 | ) | - | (3,310 | ) | |||||||
| Dilution gain | 2,002 | - | 2,002 | |||||||||
| Carrying amount at September 30, 2025 | $ | 24,415 | $ | 99 | $ | 24,514 | ||||||
The quoted fair market value of the Company’s equity interest in Dolly Varden at September 30, 2025 was $78,733 (September 30, 2024 - $58,920) based on the closing share price on the TSX Venture Exchange on that date.
For the three months ended September 30, 2025, the Company’s equity share of net loss (income) of the Company’s associates on a 100% basis were as follows:
| Three months ended September 30, 2025 | Dolly Varden | UMS | Total | |||||||||
| Cost recoveries | $ | - | $ | (869 | ) | $ | (869 | ) | ||||
| Exploration and evaluation | 15,163 | 418 | 15,581 | |||||||||
| Marketing | 361 | - | 361 | |||||||||
| Share-based compensation | 529 | - | 529 | |||||||||
| Administrative and other | (2,288 | ) | 447 | (1,841 | ) | |||||||
| Net loss (income) of associate, 100% | 13,765 | (4 | ) | 13,761 | ||||||||
| Average equity interest for the period | 13.43 | % | 25 | % | ||||||||
| Company’s share of net loss (income) of associates | $ | 1,848 | $ | (1 | ) | $ | 1,847 | |||||
| Fury Gold Mines Limited |
|
| Notes to the Q3 2025 Condensed Interim Consolidated Financial Statements | |
(Expressed in thousands of Canadian dollars, except where noted - Unaudited) |
For the three months ended September 30, 2024, the Company’s equity share of net loss of the Company’s associates on a 100% basis were as follows:
| Three months ended September 30, 2024 | Dolly Varden | UMS | Total | |||||||||
| Cost recoveries | $ | - | $ | (1,016 | ) | $ | (1,016 | ) | ||||
| Exploration and evaluation | 9,269 | 481 | 9,750 | |||||||||
| Marketing | 561 | 20 | 581 | |||||||||
| Share-based compensation | 555 | - | 555 | |||||||||
| Administrative and other | (1,399 | ) | 557 | (842 | ) | |||||||
| Net loss of associate, 100% | 8,986 | 42 | 9,028 | |||||||||
| Average equity interest for the period | 18.44 | % | 25 | % | ||||||||
| Company’s share of net loss of associates | $ | 1,657 | $ | 11 | $ | 1,668 | ||||||
For the nine months ended September 30, 2025, the Company’s equity share of net loss of the Company’s associates on a 100% basis were as follows:
| Nine months ended September 30, 2025 | Dolly Varden | UMS | Total | |||||||||
| Cost recoveries | $ | - | $ | (2,119 | ) | $ | (2,119 | ) | ||||
| Exploration and evaluation | 23,416 | 757 | 24,173 | |||||||||
| Marketing | 1,414 | - | 1,414 | |||||||||
| Share-based compensation | 1,662 | - | 1,662 | |||||||||
| Administrative and other | (1,097 | ) | 1,371 | 274 | ||||||||
| Net loss of associate, 100% | 25,395 | 9 | 25,404 | |||||||||
| Average equity interest for the period | 14.30 | % | 25 | % | ||||||||
| Company’s share of net loss of associates | $ | 3,632 | $ | 2 | $ | 3,634 | ||||||
For the nine months ended September 30, 2024, the Company’s equity share of net loss of the Company’s associates on a 100% basis were as follows:
| Nine months ended September 30, 2024 | Dolly Varden | UMS | Total | |||||||||
| Cost recoveries | $ | - | $ | (2,797 | ) | $ | (2,797 | ) | ||||
| Exploration and evaluation | 16,502 | 1,014 | 17,516 | |||||||||
| Marketing | 1,245 | 131 | 1,376 | |||||||||
| Share-based compensation | 2,049 | - | 2,049 | |||||||||
| Administrative and other | (660 | ) | 1,780 | 1,120 | ||||||||
| Net loss of associate, 100% | 19,136 | 128 | 19,264 | |||||||||
| Average equity interest for the period | 18.91 | % | 25 | % | ||||||||
| Company’s share of net loss of associates | $ | 3,618 | $ | 32 | $ | 3,650 | ||||||
The Company’s equity share of net assets of associates at September 30, 2025, is as follows:
| Dolly Varden | UMS | |||||||
| Current assets | $ | 37,075 | $ | 838 | ||||
| Non-current assets | 152,630 | 1,859 | ||||||
| Current liabilities | (7,864 | ) | (1,196 | ) | ||||
| Non-current liabilities | - | (1,109 | ) | |||||
| Net assets, 100% | 181,841 | 392 | ||||||
| Company’s equity share of net assets of associate | $ | 24,415 | $ | 99 | ||||
| Fury Gold Mines Limited |
|
| Notes to the Q3 2025 Condensed Interim Consolidated Financial Statements | |
(Expressed in thousands of Canadian dollars, except where noted - Unaudited) |
| (c) | Services rendered and balances with UMS |
| Three months ended September 30 |
Nine months ended September 30 |
|||||||||||||||
| 2025 | 2024 | 2025 | 2024 | |||||||||||||
| Exploration and evaluation costs | $ | 187 | $ | 50 | $ | 260 | $ | 160 | ||||||||
| General and administration | 48 | 52 | 180 | 244 | ||||||||||||
| Total transactions for the period | $ | 235 | $ | 102 | $ | 440 | $ | 404 | ||||||||
The outstanding balance owing at September 30, 2025, was $42 (December 31, 2024 – $90) which is included in accounts payable and accrued liabilities.
As part of the UMS arrangement, the Company is contractually obliged to pay certain rental expenses in respect of a ten-year office lease entered into by UMS on July 1, 2021. As at September 30, 2025, the Company expects to incur approximately $81 in respect of its share of future rental expense of UMS.
The Company issues share options to certain UMS employees, including key management personnel of the Company (note 13). The Company recognized a share-based compensation expense of $2 and $9 for the three and nine months ended September 30, 2025, in respect of share options issued to UMS employees (September 30, 2024 - $1 expense and $3 recovery) which is included within employee benefits and exploration and evaluation costs.
Note 8: Deferred government grant
On April 28, 2025, as part of the QPM acquisition (note 4), the Company inherited a grant entitlement from the Government of Quebec’s Minister of Natural Resources and Forestry (the “Minister”) for expenditures to be made by the Company for geometallurgical studies on the Elmer East property (the “Program”). The Program will fund up to 50% of the qualifying exploration expenses incurred by the Company up to a maximum grant of $268. On May 30, 2025, the Company received a progress payment for fiscal year 2025-2026 of $83. As at September 30, 2025, the Company has unspent funding of $47 relating to the progress payment, which will require the Company to incur $94 in qualifying expenses under the Program before March 31, 2026. The Company is obligated to reimburse the Minister, upon expiry of the Program, for any unapplied grant funding plus interest thereon.
On May 30, 2025, the Company, through its subsidiary, North Country Gold, was approved by the Government of Nunavut’s Minister of the Department of Community Services a contribution of up to $250 from its Discover, Invest, Grow Program in support of the Company’s exploration activities in the Three Bluffs Gold deposit and the Raven Gold Prospect. Expenses eligible must be incurred between May 30, 2025 to March 31, 2026. The Company received initial payment of $125 in August 2025. The remaining balance is payable upon approval of the expenditure report which must be submitted by March 31, 2026. The Company is obligated to return the initial payment if the Company is unable to prove sufficient spending on approved expenditures equalling to or exceeding the advance provided. As at September 30, 2025, the Company incurred $125 in eligible expenditures and, as a result, fully recognized the initial grant amount received.
Note 9: Flow-through share premium liability
Flow-through shares are issued at a premium, calculated as the difference between the price of a flow-through share and the price of a common share at that date. Tax deductions generated by eligible expenditures are passed through to the shareholders of the flow-through shares once the eligible expenditures are incurred and renounced.
On June 19, 2025, the Company completed an offering (note 12) and raised $3,080 through the issuance of 3,999,701 common shares designated as flow-through shares. The flow-through proceeds will be used for the Company’s mineral exploration activities. The Company is committed to incur the full exploration expenditures of $3,080 before December 31, 2026.
| Fury Gold Mines Limited |
|
| Notes to the Q3 2025 Condensed Interim Consolidated Financial Statements | |
(Expressed in thousands of Canadian dollars, except where noted - Unaudited) |
On June 13, 2024, the Company completed an offering (note 12) and raised $5,001 through the issuance of 5,320,000 common shares designated as flow-through shares. The flow-through proceeds will be used for mineral exploration in Quebec. The exploration expenditures of $5,001 was fully incurred as of April 30, 2025.
The flow-through share funding and expenditures along with the corresponding impact on the flow-through share premium liability were as follows:
| Flow-through funding (expenditures) |
Flow-through premium liability |
|||||||
| Balance at December 31, 2023 | $ | 1,223 | $ | 544 | ||||
| Flow-through eligible expenditures | (1,223 | ) | (544 | ) | ||||
| Flow-through funds raised | 5,001 | 2,022 | ||||||
| Flow-through eligible expenditures | (2,666 | ) | (1,078 | ) | ||||
| Balance at December 31, 2024 | $ | 2,335 | $ | 944 | ||||
| Flow-through eligible expenditures | (2,335 | ) | (944 | ) | ||||
| Flow-through funds raised | 3,080 | 400 | ||||||
| Flow-through eligible expenditures | (1,497 | ) | (194 | ) | ||||
| Balance at September 30, 2025 | $ | 1,583 | $ | 206 | ||||
Note 10: Segmented information - Exploration and evaluation costs
For the three months ended September 30, 2025, the Company’s exploration and evaluation costs were as follows:
| Quebec | Nunavut | Total | ||||||||||
| Assaying | $ | 392 | $ | 157 | $ | 549 | ||||||
| Exploration drilling | 330 | 490 | 820 | |||||||||
| Camp cost, equipment and field supplies | 294 | 176 | 470 | |||||||||
| Geological consulting services | 1 | 205 | 206 | |||||||||
| Permitting, environmental and community costs | 32 | 55 | 87 | |||||||||
| Expediting and mobilization | 4 | 52 | 56 | |||||||||
| Salaries and wages | 349 | 431 | 780 | |||||||||
| Fuel and consumables | 74 | 18 | 92 | |||||||||
| Aircraft and travel | 343 | 872 | 1,215 | |||||||||
| Share-based compensation | 5 | 15 | 20 | |||||||||
| Total for the three months ended September 30, 2025 | $ | 1,824 | $ | 2,471 | $ | 4,295 | ||||||
For the three months ended September 30, 2024, the Company’s exploration and evaluation costs were as follows:
| Quebec | Nunavut | Total | ||||||||||
| Assaying | $ | 449 | $ | 61 | $ | 510 | ||||||
| Exploration drilling | 376 | - | 376 | |||||||||
| Camp cost, equipment and field supplies | 181 | 60 | 241 | |||||||||
| Geological consulting services | - | 40 | 40 | |||||||||
| Permitting, environmental and community costs | 38 | 79 | 117 | |||||||||
| Expediting and mobilization | - | 23 | 23 | |||||||||
| Salaries and wages | 341 | 51 | 392 | |||||||||
| Fuel and consumables | 73 | 10 | 83 | |||||||||
| Aircraft and travel | 315 | 205 | 520 | |||||||||
| Share-based compensation | 7 | 9 | 16 | |||||||||
| Total for the three months ended September 30, 2024 | $ | 1,780 | $ | 538 | $ | 2,318 | ||||||
| Fury Gold Mines Limited |
|
| Notes to the Q3 2025 Condensed Interim Consolidated Financial Statements | |
(Expressed in thousands of Canadian dollars, except where noted - Unaudited) |
For the nine months ended September 30, 2025, the Company’s exploration and evaluation costs were as follows:
| Quebec | Nunavut | Total | ||||||||||
| Assaying | $ | 854 | $ | 179 | $ | 1,033 | ||||||
| Exploration drilling | 1,049 | 570 | 1,619 | |||||||||
| Camp cost, equipment and field supplies | 667 | 291 | 958 | |||||||||
| Geological consulting services | 41 | 213 | 254 | |||||||||
| Permitting, environmental and community costs | 189 | 157 | 346 | |||||||||
| Expediting and mobilization | 6 | 117 | 123 | |||||||||
| Salaries and wages | 1,017 | 473 | 1,490 | |||||||||
| Fuel and consumables | 461 | 898 | 1,359 | |||||||||
| Aircraft and travel | 1,152 | 1,047 | 2,199 | |||||||||
| Share-based compensation | 82 | 26 | 108 | |||||||||
| Total for the nine months ended September 30, 2025 | $ | 5,518 | $ | 3,971 | $ | 9,489 | ||||||
For the nine months ended September 30, 2024, the Company’s exploration and evaluation costs were as follows:
| Quebec | Nunavut | Total | ||||||||||
| Assaying | $ | 749 | $ | 80 | $ | 829 | ||||||
| Exploration drilling | 843 | - | 843 | |||||||||
| Camp cost, equipment and field supplies | 607 | 156 | 763 | |||||||||
| Geological consulting services | 7 | 48 | 55 | |||||||||
| Permitting, environmental and community costs | 75 | 165 | 240 | |||||||||
| Expediting and mobilization | - | 23 | 23 | |||||||||
| Salaries and wages | 1,000 | 57 | 1,057 | |||||||||
| Fuel and consumables | 182 | 10 | 192 | |||||||||
| Aircraft and travel | 450 | 205 | 655 | |||||||||
| Share-based compensation | 127 | 10 | 137 | |||||||||
| Total for the nine months ended September 30, 2024 | $ | 4,040 | $ | 754 | $ | 4,794 | ||||||
Note 11: Other income
| Three months ended September 30 |
Nine months ended September 30 |
|||||||||||||||
| 2025 | 2024 | 2025 | 2024 | |||||||||||||
| Government grant income (note 8) | 126 | - | 144 | - | ||||||||||||
| Excess fuel resold | - | - | - | 566 | ||||||||||||
| Total transactions for the period | $ | 126 | $ | - | $ | 144 | $ | 566 | ||||||||
| Fury Gold Mines Limited |
|
| Notes to the Q3 2025 Condensed Interim Consolidated Financial Statements | |
(Expressed in thousands of Canadian dollars, except where noted - Unaudited) |
Note 12: Share capital
| (a) | Authorized |
Unlimited common shares without par value.
Unlimited preferred shares – nil issued and outstanding.
| (b) | Share issuances |
During the nine months ended September 30, 2025:
| i. | The Company issued 8,394,045 common shares as part of the QPM acquisition with a fair market value of $4,533 (note 4). Transaction costs incurred in respect of the acquisition were $199. |
| ii. | The Company closed a non-brokered private equity placement for gross proceeds of $4,306, consisting of 6,728,000 units at C$0.64 per unit. Each unit consisted of one common share of Fury Gold and one common share purchase warrant exercisable to purchase one Fury Gold common share at C$0.80 for a period of three years. Share issuance costs incurred in respect of the private placement were $123. |
| iii. | 156,000 shares were issued as a result of share options being exercised with a weighted average exercise price of C$0.55 for gross proceeds of $85. The amount of $43 attributed to these share options was transferred from the equity reserves and recorded against share capital. |
| iv. | 75,000 shares were issued as a result of share options being exercised with a weighted average exercise price of C$0.55 for gross proceeds of $41. The amount of $21 attributed to these share options was transferred from the equity reserves and recorded against share capital. |
| v. | During June 2025, the Company issued 3,999,701 flow-through shares for gross proceeds of $3,080 (“June 2025 Offering”). Share issuance costs related to the June 2025 Offering totaled $223, which included $183 in commissions and $40 in other issuance costs. A reconciliation of the impact of the June 2025 Offering on share capital is as follows: |
| Number of common shares |
Impact on share capital |
|||||||
| Flow-through shares issued at $0.77 per share | 3,999,701 | $ | 3,080 | |||||
| Cash share issue costs | - | (223 | ) | |||||
| Proceeds net of share issue costs | 3,999,701 | 2,857 | ||||||
| Less: flow-through share premium liability (note 9) | - | (400 | ) | |||||
| Total allocated to share capital | 3,999,701 | $ | 2,457 | |||||
| vi. | In connection with the June 2025 Offering, a certain shareholder of the Company exercised its existing participation rights and acquired 440,000 Fury Gold common shares at a price of C$0.67 per share for a gross proceed of $295. |
During the year ended December 31, 2024:
During June 2024, the Company issued 5,320,000 flow-through shares for gross proceeds of $5,001 (“June 2024 Offering”). Share issuance costs related to the June 2024 Offering totaled $533, which included $300 in commissions and $233 in other issuance costs. A reconciliation of the impact of the June 2024 Offering on share capital is as follows:
| Number of common shares |
Impact on share capital |
|||||||
| Flow-through shares issued at $0.94 per share | 5,320,000 | $ | 5,001 | |||||
| Cash share issue costs | - | (533 | ) | |||||
| Proceeds net of share issue costs | 5,320,000 | 4,468 | ||||||
| Less: flow-through share premium liability (note 9) | - | (2,022 | ) | |||||
| Total allocated to share capital | 5,320,000 | $ | 2,446 | |||||
| Fury Gold Mines Limited |
|
| Notes to the Q3 2025 Condensed Interim Consolidated Financial Statements | |
(Expressed in thousands of Canadian dollars, except where noted - Unaudited) |
Note 13: Share-based compensation and warrant reserve
| (a) | Share-based compensation expense |
The Company uses the fair value method of accounting for all share-based payments to directors, officers, employees, and other service providers. During the three and nine months ended September 30, 2025 and 2024, the Company recognized share-based compensation expense as follows:
| Three months ended September 30 |
Nine months ended September 30 |
|||||||||||||||
| 2025 | 2024 | 2025 | 2024 | |||||||||||||
| Recognized in net loss and included in: | ||||||||||||||||
| Exploration and evaluation costs | $ | 20 | $ | 16 | $ | 108 | $ | 137 | ||||||||
| Fees, salaries and other employee benefits | 144 | 163 | 427 | 694 | ||||||||||||
| Total share-based compensation expense | $ | 164 | $ | 179 | $ | 535 | $ | 831 | ||||||||
During the three and nine months ended September 30, 2025, the Company granted nil and 140,000 share options, respectively, (three and nine months ended September 30, 2024 – nil and 245,000, respectively), to certain employees and consultants who provide defined on-going services to the Company, representative of employee service.
The weighted average fair value per option of these share options for the three and nine months ended September 30, 2025 was calculated as nil and C$0.38, respectively (three and nine months ended September 30, 2024 – nil and C$0.31, respectively), using the Black-Scholes option valuation model at the grant date with the following weighted average assumptions:
| Three months ended September 30 |
Nine months ended September 30 |
|||||||||||||||
| 2025 | 2024 | 2025 | 2024 | |||||||||||||
| Risk-free interest rate | - | - | 2.99 | % | 3.45 | % | ||||||||||
| Expected dividend yield | - | - | Nil | Nil | ||||||||||||
| Share price volatility | - | - | 71 | % | 70 | % | ||||||||||
| Expected life in years | - | - | 5.0 | 5.0 | ||||||||||||
The risk-free interest rate assumption is based on the Government of Canada benchmark bond yields and treasury bills with a remaining term that approximates the expected life of the share-based options. The expected volatility assumption is based on the historical and implied volatility of the Company’s common shares. The expected forfeiture rate and the expected life in years are based on historical trends.
In connection with the QPM Acquisition, all outstanding and vested share options of QPM were exchanged for replacement share options of the Company, in amount and at exercise prices adjusted in accordance with the Exchange Ratio. As a result, 282,470 share options with a nominal fair value were granted and vested immediately.
| Fury Gold Mines Limited |
|
| Notes to the Q3 2025 Condensed Interim Consolidated Financial Statements | |
(Expressed in thousands of Canadian dollars, except where noted - Unaudited) |
The number of share options issued and outstanding and the weighted average exercise price were as follows:
|
Number of share options |
Weighted average exercise price (C$/option) |
|||||||
| Outstanding, December 31, 2023 | 9,951,602 | $ | 1.23 | |||||
| Granted | 245,000 | 0.56 | ||||||
| Expired | (472,937 | ) | 1.92 | |||||
| Forfeited | (1,502,487 | ) | 1.40 | |||||
| Outstanding, December 31, 2024 | 8,221,178 | $ | 1.14 | |||||
| Granted | 422,470 | 1.50 | ||||||
| Exercised | (231,000 | ) | 0.55 | |||||
| Expired | (253,144 | ) | 1.73 | |||||
| Forfeited | (50,000 | ) | 0.91 | |||||
| Outstanding, September 30, 2025 | 8,109,504 | $ | 1.17 | |||||
As at September 30, 2025, the number of share options outstanding was as follows:
| Options outstanding | Options exercisable | |||||||||||||||||||||||
| Exercise price ($/option) |
Number of shares |
Weighted average exercise price (C$/option) |
Weighted average remaining life (years) |
Number of shares |
Weighted average exercise price (C$/option) |
Weighted average remaining life (years) |
||||||||||||||||||
| C$0.53 – C$1.00 | 3,749,500 | 0.83 | 2.03 | 3,659,500 | 0.84 | 1.98 | ||||||||||||||||||
| C$1.00 – C$1.85 | 2,806,659 | 1.09 | 1.35 | 2,806,659 | 1.09 | 1.35 | ||||||||||||||||||
| C$2.05 – C$3.91 | 1,553,345 | 2.08 | 0.07 | 1,553,345 | 2.08 | 0.07 | ||||||||||||||||||
| 8,109,504 | 1.17 | 1.42 | 8,019,504 | 1.17 | 1.39 | |||||||||||||||||||
| (b) | Long-term incentive plan |
In addition to options, the Company also granted RSU’s to officers and employees.
On June 29, 2023, the Company adopted a Long-Term Incentive Plan (“LTI Plan”) which strives to accelerate and encourage additional share ownership by its employees, officers and directors. The LTI plan provides for the awarding of share options, performance share units, restricted share units and deferred share units. The LTI Plan limits the number of shares reserved for issuance under the LTI Plan, together with all other security-based compensation arrangements of the Company, to a maximum of 10% of the Common Shares issued and outstanding.
On January 9, 2025, the Company issued 590,000 DSU’s to directors and 1,142,500 RSU’s to officers and employees. The DSU’s and RSU’s were issued in accordance with the Company’s LTI plan, with a grant-date fair value of $0.55 per unit, one third vesting annually on anniversary.
On January 31, 2024, the Company issued 273,542 RSU’s to an officer. The RSU’s were issued in accordance with the Company’s LTI plan, which vested on the same day and paid out as fully paid shares.
On January 9, 2024, the Company issued 1,318,623 RSU’s to directors, officers, and employees. The RSU’s were issued in accordance with the Company’s LTI plan, one third vesting annually on the anniversary and paid out as fully paid shares. The Company also approved 235,080 RSU’s to directors, which were fully vested and paid out as fully paid shares in 2024.
| Fury Gold Mines Limited |
|
| Notes to the Q3 2025 Condensed Interim Consolidated Financial Statements | |
(Expressed in thousands of Canadian dollars, except where noted - Unaudited) |
The number of RSU’s and DSU’s issued and outstanding and the weighted average grant date fair value were as follows:
| Number of RSU’s and DSU’s |
Weighted Average grant date fair value ($/ share) |
|||||||
| Outstanding, December 31, 2023 | - | $ | - | |||||
| Granted | 1,827,245 | 0.57 | ||||||
| Settled | (491,478 | ) | 0.59 | |||||
| Forfeited | (189,687 | ) | 0.57 | |||||
| Outstanding, December 31, 2024 | 1,146,080 | $ | 0.57 | |||||
| Granted | 1,732,500 | 0.55 | ||||||
| Settled | (382,027 | ) | 0.53 | |||||
| Forfeited | (289,597 | ) | 0.56 | |||||
| Outstanding, September 30, 2025 | 2,206,956 | $ | 0.56 | |||||
| (c) | Share purchase warrants |
In connection with the QPM Acquisition (note 4), all warrants of QPM became exercisable to acquire common shares of the Company, in amounts and at exercise prices adjusted in accordance with the Exchange Ratio. As a result, 596,808 warrants, each exercisable into one Fury Gold share, were granted at an exercise price of C$1.35 per share. The total fair value of the warrants issued was $30, calculated using a the Black-Scholes valuation model with the following inputs: (i) expected life – 2.12 years; (ii) expected volatility – 57%; (iii) expected dividend yield – 0%; (iv) risk-free interest rate – 2.56%; (v) share price – C$0.54.
In connection with a non-brokered private equity placement (note 13), the Company issued 6,728,000 warrants exercisable into one common share of the Company at a price of C$0.80 for a period of three years. The warrants were classified as equity instruments under IAS 32 and measured at a fair value of $949, calculated using a the Black-Scholes valuation model with the following inputs: (i) expected life – 3 years; (ii) expected volatility – 58%; (iii) expected dividend yield – 0%; (iv) risk-free interest rate – 2.7%; (v) share price – C$0.51.
The number of share purchase warrants outstanding at September 30, 2025 was as follows:
| Warrants outstanding |
Weighted average exercise price (C$/share) |
|||||||
| Outstanding, December 31, 2023 | 7,461,450 | $ | 1.20 | |||||
| Expired | (7,461,450 | ) | 1.20 | |||||
| Outstanding, December 31, 2024 | - | - | ||||||
| Issued | 7,324,808 | 0.84 | ||||||
| Outstanding, September 30, 2025 | 7,324,808 | $ | 0.84 | |||||
The following table reflects the share purchase warrants issued and outstanding as at September 30, 2025:
| Expiry date | Warrants outstanding |
Exercise price (C$/share) |
||||||
| May 31, 2027 | 274,170 | $ | 1.35 | |||||
| June 21, 2027 | 322,638 | 1.35 | ||||||
| May 26, 2028 | 6,728,000 | 0.80 | ||||||
| Total | 7,324,808 | $ | 0.84 | |||||
| Fury Gold Mines Limited |
|
| Notes to the Q3 2025 Condensed Interim Consolidated Financial Statements | |
(Expressed in thousands of Canadian dollars, except where noted - Unaudited) |
Note 14: Key management personnel
Key management personnel include Fury Gold’s board of directors and certain executive officers of the Company, including the CEO, Chief Financial Officer (“CFO”) and Senior Vice President, Exploration.
The remuneration of the Company’s key management personnel was as follows:
| Three months ended September 30 |
Nine months ended September 30 |
|||||||||||||||
| 2025 | 2024 | 2025 | 2024 | |||||||||||||
| Short-term benefits provided to executives (a) | $ | 260 | $ | 209 | $ | 787 | $ | 642 | ||||||||
| Directors’ fees paid to non-executive directors | 60 | 39 | 191 | 123 | ||||||||||||
| Share-based payments | 151 | 160 | 443 | 704 | ||||||||||||
| Total | $ | 471 | $ | 408 | $ | 1,421 | $ | 1,469 | ||||||||
(a) Short-term employee benefits include salaries, bonuses payable within twelve months of the date of the consolidated statements of financial position, and other annual employee benefits.
Note 15: Supplemental cash flow information
The impact of changes in non-cash working capital was as follows:
| Three months ended September 30 |
Nine months ended September 30 |
|||||||||||||||
| 2025 | 2024 | 2025 | 2024 | |||||||||||||
| Accounts receivable | $ | (94 | ) | $ | (60 | ) | $ | (260 | ) | $ | 137 | |||||
| Prepaid expenses and deposits | (121 | ) | (179 | ) | (114 | ) | 47 | |||||||||
| Accounts payable and accrued liabilities | (257 | ) | (285 | ) | 189 | (251 | ) | |||||||||
| Deferred government grant | (1 | ) | - | (37 | ) | - | ||||||||||
| Changes in non-cash working capital | $ | (473 | ) | $ | (524 | ) | $ | (222 | ) | $ | (67 | ) | ||||
Note 16: Loss per share
For the three and nine months ended September 30, 2025, and 2024, the weighted average number of shares outstanding and loss per share were as follows:
| Three months ended September 30 |
Nine months ended September 30 |
|||||||||||||||
| 2025 | 2024 | 2025 | 2024 | |||||||||||||
| Net loss | $ | 4,699 | $ | 2,673 | $ | 9,687 | $ | 6,881 | ||||||||
| Weighted average basic number of shares outstanding | 166,338,451 | 151,470,606 | 161,569,043 | 148,178,821 | ||||||||||||
| Basic loss per share | $ | 0.03 | $ | 0.02 | $ | 0.06 | $ | 0.05 | ||||||||
| Weighted average diluted number of shares outstanding | 166,338,451 | 151,470,606 | 161,569,043 | 148,178,821 | ||||||||||||
| Diluted loss per share | $ | 0.03 | $ | 0.02 | $ | 0.06 | $ | 0.05 | ||||||||
All of the outstanding share options and share purchase warrants at September 30, 2025 were anti-dilutive for the period then ended as the Company was in a loss position.
| Fury Gold Mines Limited |
|
| Notes to the Q3 2025 Condensed Interim Consolidated Financial Statements | |
(Expressed in thousands of Canadian dollars, except where noted - Unaudited) |
Note 17: Financial instruments
The Company’s financial instruments as at September 30, 2025, consisted of cash, marketable securities, accounts receivable, other investments, deposits, and accounts payable and accrued liabilities. The fair values of these financial instruments approximate their carrying values, unless otherwise noted.
| (a) | Financial assets and liabilities by categories |
| At September 30, 2025 | At December 31, 2024 | |||||||||||||||||||||||
| Amortized Cost |
FVTPL | Total | Amortized Cost |
FVTPL | Total | |||||||||||||||||||
| Cash | $ | 6,127 | $ | - | $ | 6,127 | $ | 4,912 | $ | - | $ | 4,912 | ||||||||||||
| Marketable securities | - | 2,356 | 2,356 | - | 2,358 | 2,358 | ||||||||||||||||||
| Other investments | - | 2,063 | 2,063 | - | 2,063 | 2,063 | ||||||||||||||||||
| Deposits | 36 | 36 | 191 | - | 191 | |||||||||||||||||||
| Accounts receivable | 314 | 314 | 54 | - | 54 | |||||||||||||||||||
| Total financial assets | $ | 6,477 | $ | 4,419 | $ | 10,896 | $ | 5,157 | $ | 4,421 | $ | 9,578 | ||||||||||||
| Accounts payable and accrued liabilities | (1,042 | ) | - | (1,042 | ) | 855 | - | 855 | ||||||||||||||||
| Deferred government grant | (47 | ) | (47 | ) | - | - | - | |||||||||||||||||
| Total financial liabilities | $ | (1,089 | ) | $ | - | $ | (1,089 | ) | $ | 855 | $ | - | $ | 855 | ||||||||||
| (b) | Financial assets and liabilities measured at fair value |
The categories of the fair value hierarchy that reflect the significance of inputs used in making fair value measurements are as follows:
Level 1 – fair values based on unadjusted quoted prices in active markets for identical assets or liabilities;
Level 2 – fair values based on inputs that are observable for the asset or liability, either directly or indirectly; and
Level 3 – fair values based on inputs for the asset or liability that are not based on observable market data.
The Company’s policy to determine when a transfer occurs between levels is to assess the impact at the date of the event or the change in circumstances that could result in a transfer. No transfers occurred between the levels during the year.
As at September 30, 2025, the Company’s financial instruments measured at fair value on a recurring basis were the Company’s marketable securities which were classified as Level 1, and other investments which were classified as Level 3. There were no financial assets or financial liabilities measured and recognized in the condensed interim consolidated statements of financial position at fair value that would be categorized as level 2 in the fair value hierarchy.
| (c) | Financial instruments and related risks |
The Company’s financial instruments are exposed to liquidity risk, credit risk and market risks, which include currency risk, interest rate risk and price risk. As at September 30, 2025, the primary risks were as follows:
Liquidity risk
Liquidity risk is the risk that the Company will encounter difficulty in meeting obligations associated with financial liabilities. The Company proactively manages its capital resources and has in place a budgeting and cash management process to help determine the funds required to ensure the Company has the appropriate liquidity to meet its current exploration plans and achieve its growth objectives. The Company ensures that there is sufficient liquidity available to meet its short-term business requirements, taking into account its anticipated cash outflows from exploration activities, and its holdings of cash and marketable securities. The Company monitors and adjusts, when required, these exploration programs as well as corporate administrative costs to ensure that adequate levels of working capital are maintained.
| Fury Gold Mines Limited |
|
| Notes to the Q3 2025 Condensed Interim Consolidated Financial Statements | |
(Expressed in thousands of Canadian dollars, except where noted - Unaudited) |
As at September 30, 2025, the Company had unrestricted cash of $6,127 (December 31, 2024 – $4,912), working capital surplus of $10,205 (December 31, 2024 – $8,045), which the Company defines as current assets less current liabilities, and an accumulated deficit of $266,879 (December 31, 2024 – $257,192). During the three and nine months ended September 30, 2025, Fury Gold incurred a comprehensive loss of $4,701 and $9,693, respectively, (three and nine months ended September 30, 2024 – $2,673 and $6,883, respectively). The Company expects to incur future operating losses in relation to exploration activities. With no source of operating cash flow, there is no assurance that sufficient funding will be available to conduct further exploration of its mineral properties.
The Company’s contractual obligations are as follows:
| Within 1 year |
2 to 3 years |
Over 3 years |
At September 30, 2025 |
At December 31, 2024 |
||||||||||||||||
| Accounts payable and accrued liabilities | $ | 1,042 | $ | - | $ | - | $ | 1,042 | $ | 855 | ||||||||||
| Deferred government grant | 47 | - | - | 47 | - | |||||||||||||||
| Quebec flow-through expenditure requirements | 206 | - | - | 206 | 944 | |||||||||||||||
| Undiscounted lease payments | - | - | - | - | 65 | |||||||||||||||
| Total | $ | 1,295 | $ | - | $ | - | $ | 1,295 | $ | 1,864 | ||||||||||
The Company also makes certain payments arising on mineral claims and leases on an annual or bi-annual basis to ensure all the Company’s properties remain in good standing. The Company estimates that $477 of payments arising on mineral claims and leases will be payable during the year ended December 31, 2025.
Credit risk
The Company’s cash and accounts receivables are exposed to credit risk, which is the risk that the counterparties to the Company’s financial instruments will cause a loss to the Company by failing to pay their obligations. The amount of credit risk to which the Company is exposed is considered insignificant as the Company’s cash is held with highly rated financial institutions in interest-bearing accounts and the accounts receivable primarily consist of sales tax receivables.
Market risk
This is the risk that the fair value or future cash flows of a financial instrument will fluctuate because of changes in market prices. The significant market risks to which the Company is exposed are as follows:
| i. | Currency risk |
The Company is exposed to currency risk by having balances and transactions in currencies that are different from the relevant functional currency (the Canadian dollar). The Company’s foreign currency exposure related to its financial assets and liabilities held in US dollars was as follows:
| At September 30, 2025 |
At December 31, 2024 |
|||||||
| Financial assets | ||||||||
| US$ bank accounts | $ | 12 | $ | 1 | ||||
| Financial liabilities | ||||||||
| Accounts payable | - | - | ||||||
| $ | 12 | $ | 1 | |||||
| Fury Gold Mines Limited |
|
| Notes to the Q3 2025 Condensed Interim Consolidated Financial Statements | |
(Expressed in thousands of Canadian dollars, except where noted - Unaudited) |
A 10% increase or decrease in the US dollar to Canadian dollar exchange rate would not have a material impact on the Company’s net loss.
| ii. | Price risk |
The Company holds certain investments in marketable securities (note 5) which are measured at fair value, being the closing share price of each equity security at the date of the consolidated statements of financial position. The Company is exposed to changes in share prices which would result in gains and losses being recognized in the loss for the year. A 10% increase or decrease in the Company’s marketable securities share prices would not have a material impact on the Company’s net loss.
Note 18: Subsequent events
| - | On November 12, 2025 the Company closed a private placement of 1,494,253 units of the Company (the “Units”) at a price of $0.87 per Unit for gross proceeds of $1.3 million. The Units are comprised of one share, and one-half of one common share purchase warrant (each whole warrant, a “Warrant”). Each Warrant will entitle the holder to purchase one common share (a “Warrant Share”) at a price of $1.20 per Warrant Share for a period of 24 months from the date of the closing. |
| - | On October 14, 2025, the Company closed its previously announced brokered private placement of 9,915,000 flow-through units sold to charity purchasers (the “Charity FT Units”) at a price per Charity FT Unit of C$1.21; and 6,003,000 flow-through shares (the “FT Shares”) at a price per FT Share of C$1.00, for total aggregate gross proceeds of $18 million. The Charity FT Units are comprised of one “flow-through” share (each, a “Charity FT Share”), and one-half of one common share purchase warrant. Each Warrant will entitle the holder to purchase one non-flow through common share at a price of $1.20 per Warrant Share for a period of 24 months from the date of the closing. |
| - | On October 27, 2025 Benz Mining Corp (“Benz”) exercised their option to acquire the remaining 25% of the Eastmain Gold and Ruby Hill project from the Company. The additional 25% of the Eastmain Mine property was acquired by settling a cash payment of $750 and issuing common shares of Benz to the value of $250, while the acquisition of the remaining 25% of Ruby Hill was settled by a $100 cash payment. |
| Fury Gold Mines Limited | 23 |
| Notes
to the Q3 2025 Condensed Interim Consolidated Financial Statements (Expressed in thousands of Canadian dollars, except where noted - Unaudited) |
Exhibit 99.2

(An exploration company)
MANAGEMENT’S DISCUSSION AND ANALYSIS
FOR THE THREE AND NINE MONTHS ENDED SEPTEMBER 30, 2025
MANAGEMENT’S DISCUSSION AND ANALYSIS
OF FINANCIAL CONDITION AND RESULTS OF OPERATIONS
FOR THE THREE AND NINE MONTHS ENDED SEPTEMBER 30, 2025
This Management’s Discussion and Analysis (the “MD&A”) for Fury Gold Mines Limited (“Fury Gold” or the “Company”) should be read in conjunction with the condensed interim consolidated financial statements of the Company and related notes thereto for the three and nine months ended September 30, 2025. The condensed interim consolidated financial statements have been prepared in accordance with International Accounting Standard 34 – Interim Financial Reporting (“IAS 34”) of the IFRS® Accounting Standards as issued by the International Accounting Standards Board (“IASB”) and interpretations issued by the IFRS Interpretations Committee (“IFRIC”). All dollar amounts presented are expressed in thousands of Canadian dollars unless otherwise stated. Amounts presented in this MD&A may be rounded. The effective date of this MD&A is November 13, 2025.
| Fury Gold Mines Limited Results of Operations for the Three and Nine Months Ended September 30, 2025 (Amounts expressed in thousands of Canadian dollars, unless otherwise noted) |
|
Section 1: Forward-looking statements and risk factors
1.1 Forward-looking statements
Certain statements made in this MD&A contain forward-looking information within the meaning of applicable Canadian and United States securities laws (“forward-looking statements”). These forward-looking statements are presented for the purpose of assisting the Company’s securityholders and prospective investors in understanding management’s views regarding those future outcomes and may not be appropriate for other purposes. When used in this MD&A, the words “may”, “would”, “could”, “will”, “intend”, “plan”, “anticipate”, “believe”, “seek”, “propose”, “estimate”, “expect”, and similar expressions, as they relate to the Company, are intended to identify forward-looking statements. Specific forward-looking statements in this MD&A include, but are not limited to: the Company’s exploration plans and objectives and the timing and costs of these plans; future capital expenditures and requirements, and sources and timing of additional financing; the timing, costs and success of the Company’s exploration activities, estimates of the Company’s mineral resources; the realization of mineral resource estimates; any objectives, expectations, intentions, plans, results, levels of activity, goals or achievements; capital expenditures; the Company’s plans for its marketable securities in Dolly Varden Silver Corporation and Sirios Resources Inc. and the realization of carrying values of these and any other securities held for resale. Additional factors include liabilities related to unused tax benefits or flow-through obligations; statements relating to the business, operations or prospects of the Company; and other events or conditions that may occur in the future.
The forward-looking statements contained in this MD&A represent the Company’s views only as of the date such statements were made and may change. Many assumptions are subject to risks and uncertainties, and so may prove to be incorrect, including the Company’s budget, including expected costs and the assumptions regarding market conditions and other factors upon which the Company has based its expenditure expectations; the Company’s ability to complete its planned exploration activities with its available working capital; the Company’s ability to raise additional capital to proceed with its exploration plans; the Company’s ability to obtain or renew the licences and permits necessary for exploration; the Company’s ability to obtain all necessary regulatory approvals, permits and licences for its planned exploration activities under governmental and other applicable regulatory regimes including the legally, mandated consultation process with affected First Nations; the Company’s ability to complete and successfully integrate acquisitions; the effects of climate change, extreme weather events, tariffs, water scarcity, and seismic events, and the effectiveness of strategies to deal with these issues; the Company’s expectations regarding the demand for, and supply and price of, precious metals; the Company’s ability to recruit and retain qualified personnel; the Company’s resource estimates, and the assumptions upon which they are based; the Company’s ability to comply with current and future environmental, safety and other regulatory requirements.
The foregoing is not an exhaustive list of the risks and other factors that may affect any of the Company’s forward-looking statements. Readers should refer to the risks discussed herein and in the Company’s Annual Information Form (the “Annual Information Form”) for the year ended December 31, 2024, subsequent disclosure filings with the Canadian Securities Administrators, the Company’s annual report on Form 20-F for the year ended December 31, 2024 filed with the United States Securities and Exchange Commission (the “SEC”) (the “2024 Form 20-F Annual Report”), and subsequent disclosure filings with the SEC, available on SEDAR+ at www.sedarplus.com and with the SEC at www.sec.gov, as applicable.
The Company does not undertake to update any forward-looking statements, except to the extent required by applicable securities laws.
Readers are cautioned not to place heavy reliance on forward looking statements.
Cautionary Note to United States Investors concerning Estimates of Measured, Indicated, and Inferred Resource Estimates:
This MD&A uses the terms “mineral resource”, “measured mineral resource”, “indicated mineral resource” and “inferred mineral resource”, which are Canadian mining terms as defined in, and required to be disclosed in accordance with, National Instrument 43-101 – Standards of Disclosure for Mineral Projects (“NI 43-101”), which references the guidelines set out in the Canadian Institute of Mining, Metallurgy and Petroleum (the “CIM”) – CIM Definition Standards on mineral resources and mineral reserves (“CIM Definition Standards”), adopted by the CIM Council, as amended. Mining disclosure under U.S. securities law was previously required to comply with SEC Industry Guide 7 (“SEC Industry Guide 7”) under the United States Securities Exchange Act of 1934, as amended. The SEC has adopted rules to replace SEC Industry Guide 7 with new mining disclosure rules under sub-part 1300 of Regulation S-K of the U.S. Securities Act (“Regulation S-K 1300”) which became mandatory for U.S. reporting companies beginning with the first fiscal year commencing on or after January 1, 2021. Under Regulation S-K 1300, the SEC now recognizes estimates of “Measured Mineral Resources”, “Indicated Mineral Resources” and “Inferred Mineral Resources”. In addition, the SEC has amended its definitions of “Proven Mineral Reserves” and “Probable Mineral Reserves” to be substantially similar to international standards. Readers are cautioned that despite efforts to harmonize U.S. mining disclosure rules with NI 43-101 and other international requirements, there are differences between the terms and definitions used in Regulation S-K 1300 and mining terms defined by CIM and used in NI 43 101, and there is no assurance that any mineral reserves or mineral resources that an owner or operator may report as “proven mineral reserves”, “probable mineral reserves”, “measured mineral resources”, “indicated mineral resources” and “inferred mineral resources” under NI 43-101 would be the same had the owner or operator prepared the reserve or resource estimates under the standards of Regulation S-K 1300.
| Fury Gold Mines Limited Results of Operations for the Three and Nine Months Ended September 30, 2025 (Amounts expressed in thousands of Canadian dollars, unless otherwise noted) |
|
As a “foreign private issuer” under United States securities laws, the Company was previously (until year-ended December 31, 2023) eligible to file its annual report on Form 40-F with the SEC pursuant to the multi-jurisdictional disclosure system. Consequently, the Company was not required to provide disclosure on its mineral properties under US Regulation S-K 1300 but rather provided disclosure under Canadian NI 43-101 and the Canadian Institute of Mining and Metallurgy (CIM) Standards. The Company has lost its eligibility to file its annual report on Form 40-F using Canadian standards due to the market capitalization of its non-affiliate public share float having a market value less than US$75 million from and after the year ended December 31, 2023. Consequently, unless and until the Company’s market capitalization of its non-affiliate public share float has a market value greater than US$75 million as of a fiscal year end commencing December 31, 2025, any Form 20-F Annual Reports filed by the Company with the SEC will include disclosure on the Company’s material properties in accordance with the requirements of Regulation S-K 1300 which as noted above may materially differ from the requirements of NI 43-101 and the CIM Definition Standards.
There is no assurance any mineral resources that the Company may report as “measured mineral resources”, “indicated mineral resources” and “inferred mineral resources” under NI 43- 101 would be the same had the Company prepared the resource estimates under the standards adopted under the Regulation S-K 1300. United States investors are also cautioned that while the SEC will now recognize “measured mineral resources”, “indicated mineral resources” and “inferred mineral resources”, investors should not assume that any part or all of the mineralization in these categories will ever be converted into a higher category of mineral resources or into mineral reserves. Mineralization described using these terms has a greater amount of uncertainty as to their existence and feasibility than mineralization that has been characterized as reserves.
The Company has no mineral reserves which require that the estimated resources be demonstrated to be economic in at least a pre-feasibility study. Accordingly, investors are cautioned not to assume that any “measured mineral resources”, “indicated mineral resources” or “inferred mineral resources” that the Company reports are or will be economically or legally mineable. Although in Canada, “inferred mineral resources” are subject to an expectation that there must be a reasonable probability of upgrading a majority of an inferred resource into a measured or indicated category, inferred resources have a greater amount of uncertainty as to their existence and as to whether they can be mined legally or economically. Therefore, United States investors are also cautioned not to assume that all or any part of the “inferred mineral resources” exist. In accordance with Canadian securities laws, estimates of “inferred mineral resources” cannot form the basis of feasibility or other economic studies, except in limited circumstances where permitted under NI 43-101.
Accordingly, information contained in this MD&A describing the Company’s mineral deposits may not be comparable to similar information made public by U.S. companies subject to the reporting and disclosure requirements under the United States federal securities laws and the rules and regulations thereunder.
See the heading “Resource Category (Classification) Definitions” in the 2024 Form 20-F Annual Report for a more detailed description of certain of the mining terms used in this MD&A.
1.2 Qualified persons and technical disclosures
Bryan Atkinson. P.Geol., Senior Vice President, Exploration, and Valerie Doyon, P.Geo., Senior Project Geologist of the Company are each a “qualified person” or “QP” under and for the purposes of NI 43-101 with respect to the technical disclosures in this MD&A in respect to the Committee Bay and the Quebec projects respectively.
| Fury Gold Mines Limited Results of Operations for the Three and Nine Months Ended September 30, 2025 (Amounts expressed in thousands of Canadian dollars, unless otherwise noted) |
|
Section 2: Business Overview
Fury Gold is a Canadian-focused gold exploration company strategically positioned in two prolific mining regions: the Eeyou Istchee James Bay Region of Quebec and the Kitikmeot Region in Nunavut. As a result of its recent April 28, 2025 acquisition of Quebec Precious Minerals Corp, the Company now has a portfolio of additional precious, critical and rare earth mineral projects (described below) which are not yet considered to be material. The Company’s vision is to deliver shareholder value by growing our multi-million-ounce gold portfolio and other mineral projects through additional significant discoveries in Canada.
The Company was incorporated on June 9, 2008, under the Business Corporations Act (British Columbia) and is listed on the Toronto Stock Exchange and the NYSE-American, with its common shares trading under the symbol FURY. The Company’s registered and records office is located at 1055 West Georgia Street, Suite 1500, Vancouver, British Columbia, V6E 4N7, and its mailing address is 401 Bay Street, 16th Floor, Toronto, Ontario, M5H 2Y4.
At September 30, 2025, the Company had three material mineral projects (none of which include projects recently acquired in the Quebec Precious Minerals Corp acquisition): Committee Bay in Nunavut, and Eau Claire and Éléonore South in Quebec, which the Company now owned 100% after acquiring the 49.978% interest previously held by Newmont Corporation (“Newmont”) in February 2024. Additionally, at September 30, 2025, the Company held a 12.92% common share interest in Dolly Varden Silver Corporation (“Dolly Varden”), which owns the Kitsault project in British Columbia. The Company’s equity interest in Dolly Varden is accounted for as an investment in associate meaning the investment is carried at cost less a share of Dolly Varden’s losses (or plus its income, if any) as well as any implied gains or losses from equity dilution discussed below. Accordingly, the carrying value of the Dolly Varden shares on the financial statements may not reflect the market value of these securities. Conversely, Dolly Varden investment would be written down if the market value of these shares is determined to be persistently lower than its carrying value.
The Company is a junior resource exploration issuer and as such is an expenditure based business and does not have material revenues. The CEO, who is the chief operating decision maker (“CODM”), reviews the operating segments of the Company, and has determined that there are two reportable segments. The Company focus on the acquisition, exploration, and development of mineral resource properties within Quebec and Nunavut, as well as having an administrative and corporate segment. Its business success must be measured primarily by the success of its exploration programs in establishing that the Company’s mineral properties contain potential commercial deposits of precious metals.
Section 3: Q3 Highlights and subsequent events
3.1 Operational highlights
| • | On November 10, 2025 announced the results from the 2025 exploration drilling program at the Committee Bay project, located in the eastern Kitikmeot region of Nunavut, Canada. The 2025 drilling program comprised six (6) diamond drill holes totaling approximately 2,778 metres (m). Four of the drill holes (2,041m), targeting expansion of the Three Bluffs Shear Zone intercepted gold mineralization across 315m of strike with mineralized widths of up to 19.5m, including 5.73 grams per tonne (g/t) gold across 3.0m within a broader interval of 1.18 g/t gold over 19.5m (Hole 25TB155), which ended in the mineralized zone. The remaining two drill holes, which totaled 737m, tested the southern contact of the 8 kilometre (km) long Raven Shear Zone, which historically returned drill intercepts of up to 12.60 g/t gold over 5.49m and 31.1 g/t gold across 2.8m with outcropping gold mineralization defined over 1.4 km. Hole 25RV015, which was a 330m step-out from previous drilling intercepted 4.59 g/t gold over 1.5m. |
| • | On October 21, 2025, the Company announced that it had commenced a 10,000m drilling program at Eau Claire and provided an update on the Kipawa Rare Earths Project. The 10,000m drilling program was based on recommendation from the Eau Claire Preliminary Economic Assessment (PEA) focusing on resource growth and enhancing the mine plan. At Kipawa, the Company has focussed on re-initiating dialogue with First Nations and local communities through the establishment of a new committee comprised of First Nations, local communities and Fury representatives. The Company looks forward to working collaboratively with the committee and the Quebec government to establish next steps to put Kipawa back on a positive pathway for the benefit of all. |
| Fury Gold Mines Limited Results of Operations for the Three and Nine Months Ended September 30, 2025 (Amounts expressed in thousands of Canadian dollars, unless otherwise noted) |
|
| • | On October 17, 2025, the Company announced that it had filed a Technical Report in support of the September 2, 2025 PEA results news release. |
| • | On September 4, 2025, the Company announced the results from two additional drill holes at the Sakami gold project. Drill hole 25SK-002 was drilled 140 m below drill hole 25SK-001, where drill hole 25SK-003 was drilled 200 m below previous shallow drilling and 100 m to the west of the previously announced drill hole 25SK-001. Highlights from the additional two drill holes include 49.5 m of 0.6 g/t gold and 22.7 m at 1.47 g/t gold from drill hole 25SK-002, as well as 59 m of 1.59 g/t gold and 9.1 m of 0.92 g/t gold from drill hole 25SK-003. The reported intercepts leave the mineralization at La Pointe Extension open at depth and along strike to the west. Results from the remaining four drill holes are pending. |
| • | On September 2, 2025, the Company announced the results of a PEA for the Eau Claire gold deposit. The PEA represents an initial conceptual evaluation of the economic potential of Eau Claire’s mineral resources and was prepared in accordance with National Instrument 43-101 (“NI 43-101”) by SGS Geological Services. Three scenarios, all based on the same mine plan, were evaluated, each returning an after-tax net present value at a 5% discount rate (“NPV5”) and after-tax internal rate of return (“IRR”) at a gold price of US$2,400 per ounce (“oz”): |
| o | Full standalone operation with all processing on site (the “Base Case”) |
| • | After-tax NPV5 of $554 million (M) and after-tax IRR of 41% |
| o | Hybrid case starting with two years of toll milling, followed by full standalone crushing, milling, and processing on site (the “Hybrid Case”): |
| • | After-tax NPV5 of $610M and after-tax IRR of 53% |
| o | Full toll milling scenario, processing mineralized material off-site at a third-party facility (the “Toll Milling Case”): |
| • | After-tax NPV5 of $639M and after-tax IRR of 84% |
| • | On August 12, 2025, the Company announced the initial results from the inaugural drill campaign at the Sakami gold project. Drill hole 25SK-001, the first of six holes drilled to date, was designed to test the down plunge extension of gold mineralization intercepted in historical drilling and intercepted five distinct zones of gold mineralization across a 140-metre drilled length; 4.7 m of 2.72 g/t gold; 0.5 m of 10.2 g/t gold; 1.5 m of 5.17 g/t gold and; 11.8 m of 1.28 g/t gold and; 41.5 m of 1.23 g/t gold. Within the two broader intercepts of 11.8 m and 41.5 m, hosted within intense pervasive silicification, there is a high-grade core that includes intercepts of up to 7 m of 3.15 g/t gold. |
3.2 Corporate highlights
| • | On November 12, 2025 the Company closed a private placement of 1,494,253 units of the Company (the “Units”) at a price of $0.87 per Unit for gross proceeds of $1.3 million. The Units are comprised of one share, and one-half of one common share purchase warrant (each whole warrant, a “Warrant”). Each Warrant will entitle the holder to purchase one common share (a “Warrant Share”) at a price of $1.20 per Warrant Share for a period of 24 months from the date of the closing. |
| • | On October 27, 2025 Benz Mining Corp (“Benz”) exercised their option to acquire the remaining 25% of the Eastmain Gold and Ruby Hill project from the Company. The additional 25% of the Eastmain Mine property was acquired by settling a cash payment of $750 and issuing common shares of Benz to the value of $250, while the acquisition of the remaining 25% of Ruby Hill was settled by a $100 cash payment. |
| • | On October 14, 2025, the Company closed a brokered private placement which it initially announced on September 22, 2025. There was 9,915,000 flow-through units sold to charity purchasers (the “Charity FT Units”) at a price per Charity FT Unit of C$1.21; and 6,003,000 flow-through shares (the “FT Shares”) at a price per FT Share of C$1.00, for total aggregate gross proceeds of $18 million. The Charity FT Units are comprised of one “flow-through” share (each, a “Charity FT Share”), and one-half of one common share purchase warrant (each whole warrant, a “Warrant”). Each Warrant will entitle the holder to purchase one non-flow through common share (a “Warrant Share”) at a price of $1.20 per Warrant Share for a period of 24 months from the date of the closing. |
| • | On September 17, 2025, the Company sold 500,000 common shares of Dolly Varden for net proceeds of $2,914. |
| Fury Gold Mines Limited Results of Operations for the Three and Nine Months Ended September 30, 2025 (Amounts expressed in thousands of Canadian dollars, unless otherwise noted) |
|
Section 4: Projects overview
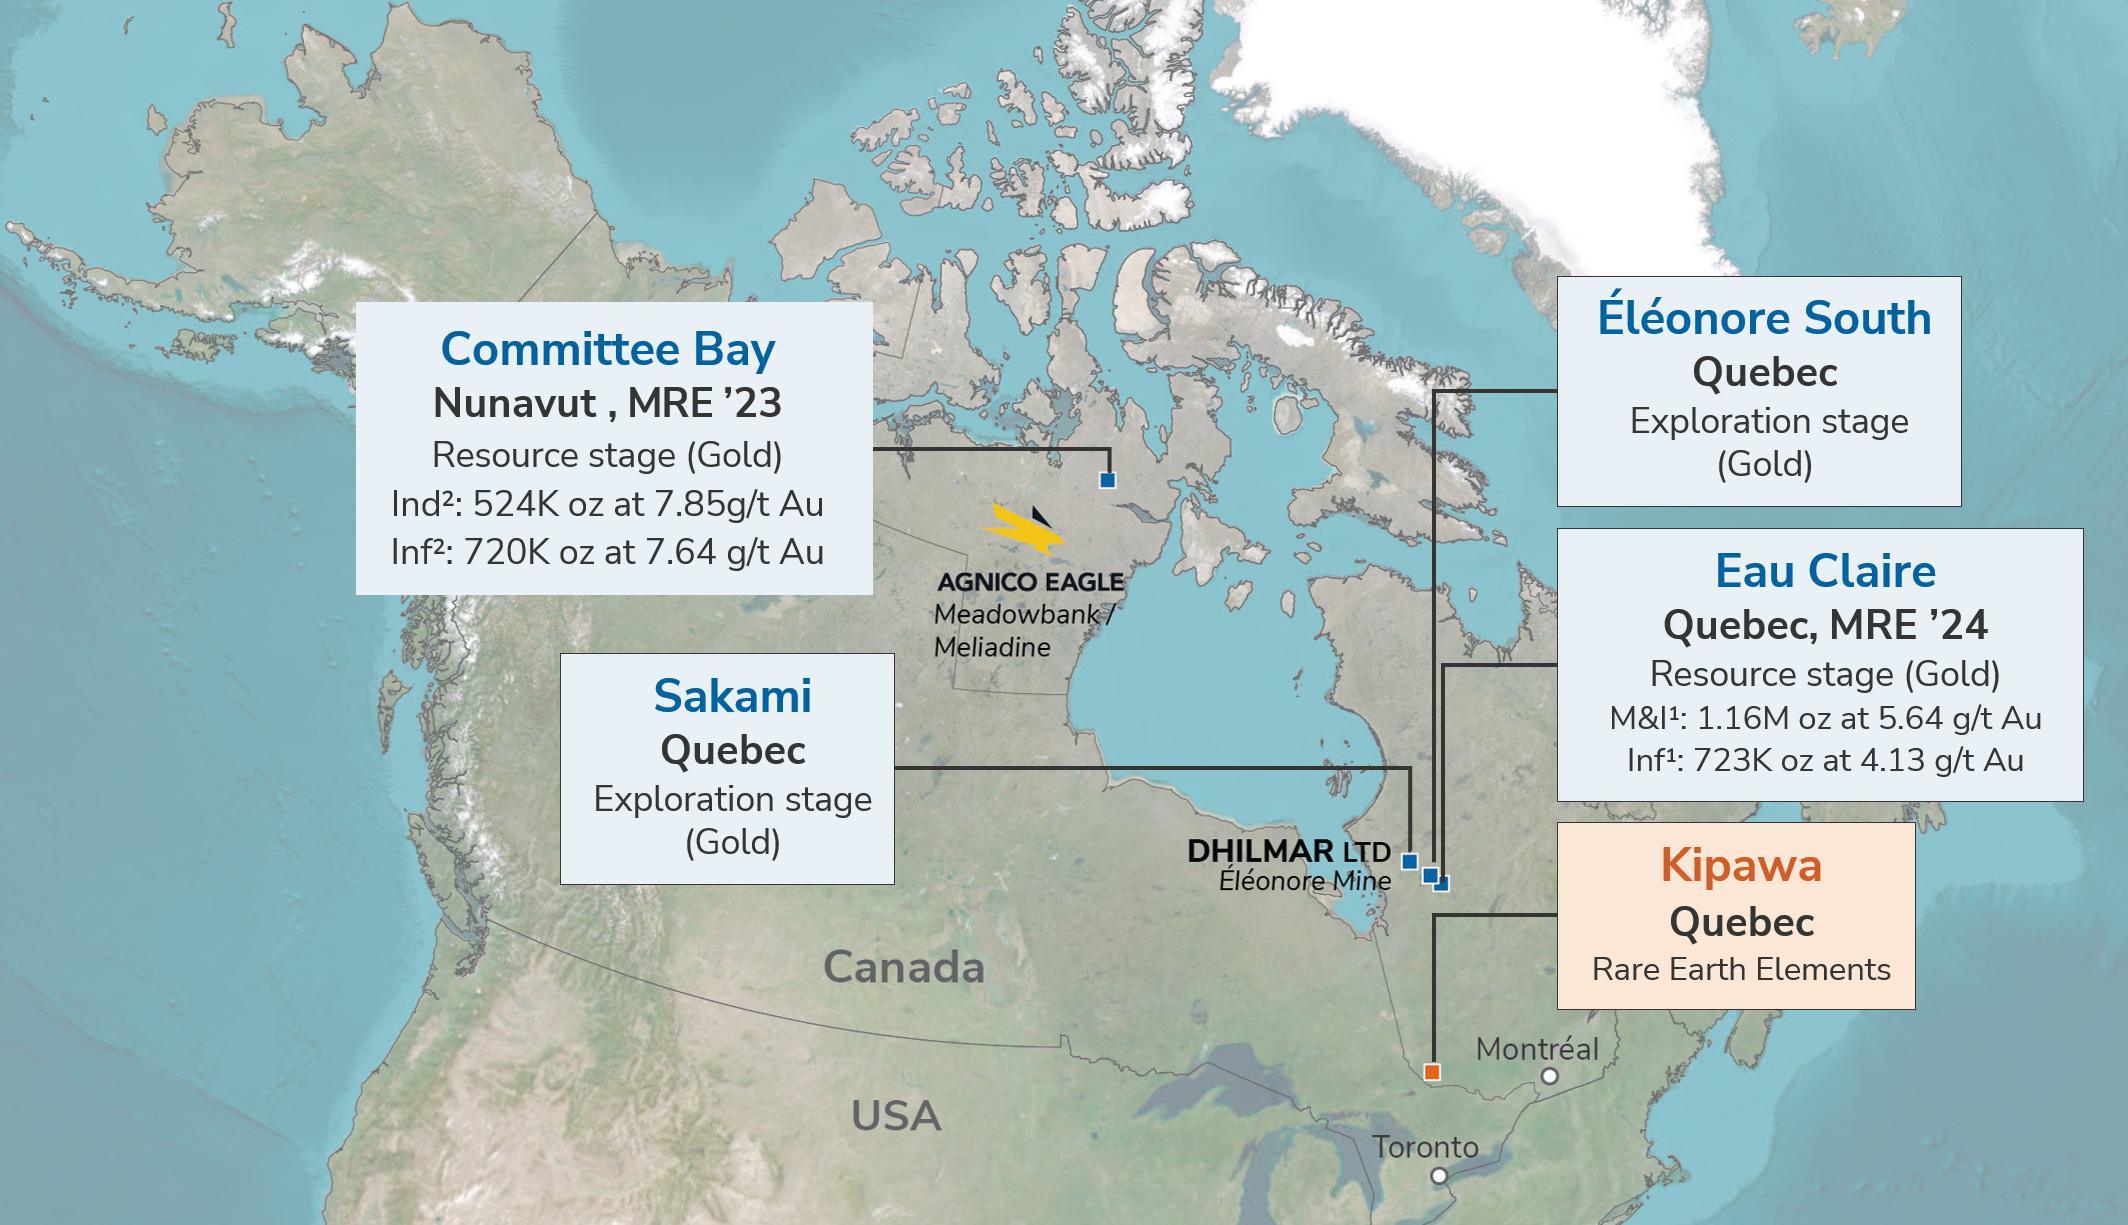
4.1 Indigenous community relations and environmental
The pursuit of environmentally sound and socially responsible mineral development guides all of Fury Gold’s activities as the Company understands the broad societal benefits that responsible mining can bring, as well as the risks that must be managed through the implementation of sustainable development practices. The Company strives to maintain the highest standards of environmental protection and community engagement at all its projects.
The Company considers sustainability to include the pursuit of four mutually reinforcing pillars: environmental and cultural heritage protection; social and community development; economic growth and opportunity; and cultural intelligence development for all employees. The Company assesses the environmental, social, and financial benefits and risks of all business decisions and believes this commitment to sustainability generates value and benefits for local communities and shareholders.
The Company’s approach to Indigenous and stakeholder engagement provides opportunities and benefits through:
| • | the provision of jobs and training programs |
| • | contracting opportunities |
| • | capacity funding for Indigenous engagement |
| • | sponsorship of community events |
| • | supporting professional development opportunities, building cultural and community intelligence capacity. |
The Company places a priority on creating mutually beneficial, long-term relationships with the communities in which it operates. Engagement goals include providing First Nation governments, communities, and residents with corporate and project-related information, including details of work programs, collaborative opportunities, and other activities being undertaken in the field.
4.2 Quebec
Fury Gold holds 100% interests in the Eau Claire project as well as interests in ten other properties covering approximately 157,000 hectares predominantly within the Eeyou Istchee James Bay region of Quebec. This now includes a 100% interest in the Éléonore South Project. Through the acquisition of Quebec Precious Metals Corporation on April 28, 2025, the company added 100% interest in three projects: Sakami, Elmer East and Cheechoo – Eleonore Trend, and a 68% interest in the Heavy Rare Earth Elements (HREE) Kipawa project (the remaining 32% is held by Investissement Quebec). The Eastmain Mine project along with the Ruby Hill East and Ruby Hill West projects are under option to Benz Mining Corp. (“Benz Mining”) whereby Benz Mining has earned a 75% interest in those properties, by completing certain option payments and exploration expenditures, with a further option to increase Benz Mining’s holding to 100% in the Eastmain Mine property upon receipt of a final milestone payment. Benz Mining currently acts as operator and is current with regards to all option payment and expenditure obligations. As noted in the Section 3.2 and after quarter end, Benz Mining made the final payments necessary to acquire the remaining 25% of both the Eastmain Mine and Ruby Hill projects.
| Fury Gold Mines Limited Results of Operations for the Three and Nine Months Ended September 30, 2025 (Amounts expressed in thousands of Canadian dollars, unless otherwise noted) |
|
4.2.1 Eau Claire
The Eau Claire project is located immediately north of the Paix Des Braves reservoir, 10km northeast of Hydro Quebec’s EM-1 hydroelectric power facility, 80km north of the town of Nemaska, approximately 320km northeast of the town of Matagami, and 800km north of Montreal. This property consists of map-designated claims totaling approximately 23,000 hectares. These claims are held 100% by Fury Gold and are in good standing. Permits are obtained on a campaign basis for all surface exploration, particularly trenching and drilling, undertaken on the property.
The Eau Claire project is underlain by typical Archean greenstone assemblages of the Eastmain Greenstone Belt, which are composed of volcanic rocks of basaltic to rhyolitic composition and related clastic and chemical sedimentary rocks. These rocks have been intruded by an assemblage of mafic to felsic sills, stocks, and dykes. Metamorphism ranges from upper greenschist to amphibolite facies in the greenstone assemblages, while higher-grade facies, up to granulite level, typically characterize the Opinaca sub-province. Archean-aged deformation affects all rocks on the property. Near the Eau Claire deposit, the volcano-sedimentary assemblage has been folded, forming a closed antiform plunging gently to the west. Regional rock foliation and lithology are generally east-west in strike with moderate to sub-vertical southerly dips in the vicinity of the Eau Claire gold deposit.
On September 2, 2025, the Company announced the results of a Preliminary Economic Assessment (“PEA”) for the Eau Claire Gold Deposit which was conducted by the independent engineering firm of SGS. The PEA contemplates a primary underground mining operation complemented by 2 small open pits. Production from the underground (“UG”) mine will start in year minus 1 with a small bulk sample, with full UG operations continuing through to year 11. In total, the underground would produce 702koz gold at an average diluted head grade of 5.22 g/t gold from 4.40Mt of material. The conventional open pits (“OP”) would operate for 8 years, recovering a total of 132koz gold at an average diluted grade of 2.50 g/t gold from 1.73Mt of material.
Table 1: Eau Claire PEA Key Economic Assumptions and Results
| Production | ||||
| PEA Life of Mine (LOM) | Years | 11 | ||
| LOM Production Resource Tonnes | Tonnes | 6.1M | ||
| LOM diluted head grade | g/t Au | 4.46 | ||
| Average Diluted Grade (OP) | g/t Au | 2.5 | ||
| Average Diluted Grade (UG) | g/t Au | 5.22 | ||
| Average Gold Recovery | % | 95 | ||
| Contained Gold | oz | 878,281 | ||
| Recovered Gold | oz | 834,367 | ||
| Average Annual production | oz | 75,852 | ||
| OP LOM Strip Ratio | 7.73 | |||
| Fury Gold Mines Limited Results of Operations for the Three and Nine Months Ended September 30, 2025 (Amounts expressed in thousands of Canadian dollars, unless otherwise noted) |
|
| Capital Costs | ||||
| Base Case | Hybrid | Toll Milling | ||
| Initial Capital Cost Expense (“CapEx”) (incl UG development) | C$ | $217M | $216M | $117M |
| Sustaining Capital | C$ | $66M | $66M | $66M |
| Contingency included in Capital | C$ | $36M | $36M | $10M |
| Total Capital | C$ | $283M | $282M | $184M |
| Total Operating Costs | C$ | $1,019M | $1,036M | $1,153M |
| Cash Costs (LOM) | USD/oz | $892 | $906 | 1,009 |
| AISC (LOM)1 | USD/oz | $1,140 | $1,153 | $1,170 |
| Financial Summary | ||||
| Assumed long-term Gold Price | USD | $2,400 | ||
| Exchange Rate | USD/C$ | 0.73 | ||
| After-Tax Net Present Value NPV(5%) | C$ | $554M | $610M | $639M |
| After-Tax Internal rate of return (IRR) | % | 41 | 53 | 84 |
| After-Tax Payback | Years | 2.5 | 1.5 | 1.15 |
| 1. | AISC is calculated as the sum of treatment and refining charges, onsite operating costs, sustaining capital costs, and closure costs, divided by the quantity of ounces produced. |

Figure 1: Long Section and Cross Section views of the proposed Eau Claire OP and UG mine plan.
| Fury Gold Mines Limited Results of Operations for the Three and Nine Months Ended September 30, 2025 (Amounts expressed in thousands of Canadian dollars, unless otherwise noted) |
|
The PEA is subject to a number of assumptions and risks, including, among others, that all required permits and other rights will be obtained in a timely manner, that development of the Eau Claire deposit will have the support of the First Nations, stakeholders, and government, and that geotechnical, hydrogeological, and metallurgical assumptions will be confirmed. The Company cannot determine at this time whether any toll milling arrangements will be reached with any facility within a reasonable distance from the project. The Toll milling assumptions used in the PEA includes provision for on-site crushing, an on-site sample tower, one-way 205 km road haulage, and toll milling costs with life of mine costs ranging between $61.89/tonne and $58.21/tonne for the Hybrid and Toll Milling Cases, respectively.
Eau Claire Mineral Resource Estimate
The PEA is based on the current Mineral Resource Estimate for Eau Claire with an effective date of May 10, 2024, and is reported using a gold price of US$1,900/oz (Table 2), see Eau Claire NI 43-101 report titled “Mineral Resource Estimate Update for the Eau Claire Project, Eeyou Istchee James Bay Region of Quebec, Canada” dated June 25, 2024 filed under Fury’s profile on SEDAR+.
Table 2: Mineral Resource Estimate for the Eau Claire Deposit
| Category | Tonnes | Au g/t | Contained Au (oz) | |
| Open Pit (base case cut-off grade of 0.5 g/t Au) |
Measured | 1,157k | 5.19 | 193k |
| Indicated | 1,291k | 4.19 | 174k | |
| Measured & Indicated | 2,448k | 4.66 | 367k | |
| Inferred | 69k | 4.39 | 10k | |
| Underground (base case cut-off grade of 2.5 g/t Au) |
Measured | 455k | 6.9 | 101k |
| Indicated | 3,490k | 6.17 | 692k | |
| Measured & Indicated | 3,945k | 6.25 | 793k | |
| Inferred | 2,566k | 6.08 | 502k | |
| Combined Open Pit and Underground | Measured | 1,612k | 5.67 | 294k |
| Indicated | 4,781k | 5.64 | 866k | |
| Measured & Indicated | 6,393k | 5.65 | 1,160k | |
| Inferred | 2,635k | 6.04 | 512k |
| (1) | The effective date of the Eau Claire project Mineral Resource Estimates (“MREs”), including the Eau Claire and Percival deposit estimates, is May 10, 2024. |
| (2) | The Mineral Resource Estimates were estimated by Maxime Dupéré, B.Sc., géo. of SGS Geological Services and is an independent Qualified Person as defined by NI 43-101. |
| (3) | The classification of the current Mineral Resource Estimates into Measured, Indicated and Inferred mineral resources is consistent with current 2014 CIM Definition Standards - For Mineral Resources and Mineral Reserves. |
| (4) | All figures are rounded to reflect the relative accuracy of the estimate and numbers may not add due to rounding. |
| (5) | The mineral resources are presented undiluted and in situ, constrained by continuous 3D wireframe models, and are considered to have reasonable prospects for eventual economic extraction. |
| (6) | Mineral resources which are not mineral reserves do not have demonstrated economic viability. An Inferred Mineral Resource has a lower level of confidence than that applying to an Indicated Mineral Resource and must not be converted to a Mineral Reserve. It is reasonably expected that most Inferred Mineral Resources could be upgraded to Indicated Mineral Resources with continued exploration. |
| Fury Gold Mines Limited Results of Operations for the Three and Nine Months Ended September 30, 2025 (Amounts expressed in thousands of Canadian dollars, unless otherwise noted) |
|
| (7) | The Project mineral resource estimates are based on a validated database which includes data from 1202 surface diamond drill holes totalling 406,431 m, and 426 surface channels (Eau Claire deposit) for 1,345 m. The resource database totals 273,402 drill hole assay intervals representing 267,721 m of data and 2,254 channel assays for 1,316 m. |
| (8) | The MRE for the Eau Claire deposit is based on 280 three-dimensional (“3D”) resource models representing the 450, 850 and hinge zones. The MRE for the Percival deposit is based on 29 3D resource models representing high grade and lower grade halo zones. |
| (9) | Grades for Au were estimated for each mineralization domain using 1.0 metre capped composites assigned to that domain. To generate grade within the blocks, the inverse distance cubed (ID3) interpolation method was used for all domains of the Eau Claire deposit and ID2 for Percival deposit. An average density value was assigned to each domain. |
| (10) | Based on the location, surface exposure, size, shape, general true thickness, and orientation, it is envisioned that parts of the Eau Claire and Percival deposits may be mined using open-pit mining methods. In-pit mineral resources are reported at a base case cut-off grade of 0.5 g/t Au. The in-pit resource grade blocks are quantified above the base case cut-off grade, above the constraining pit shell, below topography and within the constraining mineralized domains (the constraining volumes). |
| (11) | The pit optimization and base-case cut-off grade consider a gold price of $1,900/oz and considers a gold recovery of 95%. The pit optimization and base case cut-off grade also considers a mining cost of US$2.80/t mined, pit slope of 55⁰ degrees, and processing, treatment, refining, G&A and transportation cost of USD$19.00/t of mineralized material. |
| (12) | The results from the pit optimization, using the pseudoflow optimization method in Whittle 4.7.4, are used solely for the purpose of testing the “reasonable prospects for economic extraction” by an open pit and do not represent an attempt to estimate mineral reserves. There are no mineral reserves on the Property. The results are used as a guide to assist in the preparation of a Mineral Resource statement and to select an appropriate resource reporting cut-off grade. A Whittle pit shell at a revenue factor of 0.52 was selected as the ultimate pit shell for the purposes of this mineral resource estimate. |
| (13) | Based on the size, shape, general true thickness, and orientation, it is envisioned that parts of the Eau Claire and Percival deposits may be mined using underground mining methods. Underground mineral resources are reported at a base case cut-off grade of 2.5 g/t Au. The mineral resource grade blocks were quantified above the base case cut-off grade, below surface/pit surface and within the constraining mineralized wireframes (considered mineable shapes). Based on the size, shape, general thickness, and orientation of the mineralized structures, it is envisioned that the deposits may be mined using a combination of underground mining methods including sub-level stoping (SLS) and/or cut and fill (CAF) mining. |
| (14) | The underground base case cut-off grade of 2.5 g/t Au considers a mining cost of US$65.00/t mined, and processing, treatment, refining, G&A and transportation cost of USD$19.00/t of mineralized material. |
| (15) | The estimate of Mineral Resources may be materially affected by environmental, permitting, legal, title, taxation, socio-political, marketing, or other relevant issues. |
Table 3: Potentially Mineable Portion of the Resource
| Category | Tonnes | Diluted Au g/t | Contained Ounces Au (oz) | |
| Underground | Measured Resource | 549k | 4.83 | 85k |
| Indicated Resource | 2,711k | 5.11 | 446k | |
| Measured & Indicated | 3,260k | 5.06 | 531k | |
| Inferred Resource | 1,143k | 5.68 | 209k | |
| In-pit | Measured Resource | 1,292k | 2.55 | 106k |
| Indicated Resource | 423k | 2.40 | 33k | |
| Measured & Indicated | 1,715k | 2.51 | 139k | |
| Inferred Resource | 12k | 1.59 | 597 |
| Fury Gold Mines Limited Results of Operations for the Three and Nine Months Ended September 30, 2025 (Amounts expressed in thousands of Canadian dollars, unless otherwise noted) |
|
Capital and Operating Cost Estimates
The initial capital is estimated to range between $117M and $217M with an additional $66M in sustaining capital (Table 4). The PEA is based on contract mining. Operating costs were developed from unit costs for projects of a similar scale in Canada (Table 5).
Table 4: Capital and Operating Cost Summary
| Input | Base Case | Hybrid | Toll Milling |
| Initial Capital | |||
| Pre-Production Engineering & Design | $9M | $9M | $2M |
| Process Plant | $86M | $86M | |
| Tailings | $5M | $5M | |
| Site Facilities | $16M | $17M | $17M |
| Power Line from Quebec Hydro 18 km | $13M | $13M | $13M |
| Surface Support Equipment | $2.3M | $2.3M | $2.3M |
| OP Mining | $549k | $549k | $549k |
| UG Non-Development Capital | $6.4M | $6M | $6M |
| UG Development Capital | $66M | $66M | $66M |
| Non-Mining Development Contingency | $10M | $10M | $10M |
| Pre-Production G&A | $3M | ||
| Initial Capital Sub-total | $217M | $216M | $117M |
| Sustaining Capital | |||
| OP Mining | $155k | $155k | $155k |
| UG Non-Development Capital | $240k | $245k | $245k |
| UG Development Capital | $61M | $61M | $61M |
| Site Closure | $5M | $5M | $5M |
| Sustaining Capital Sub-total | $66M | $66M | $66M |
| Total Capital Costs | $283M | $282M | $184M |
| Operating Costs | |||
| OP Direct Mining Costs | $86M | $86M | $86M |
| UG Direct Mining Costs | $504M | $504M | $504M |
| Indirect Mining Costs | $70M | $70M | $70M |
| Process Costs | $212M | $224M | $360M |
| Site G&A | $148M | $153M | $133M |
| Total Operating Costs | $1,019M | $1,036M | $1,153M |
| OP Cost per Resource Tonne | $49.64 | $49.64 | $49.64 |
| UG Cost per Resource Tonne | $114.50 | $114.50 | $114.50 |
| LOM Process Cost per Resource Tonne | $34.64 | $36.56 | $58.80 |
| LOM G&A per Resource Tonne | $24.10 | $24.93 | $21.77 |
| AISC USD/oz1 | $1,140 | $1,153 | $1,170 |
| 1. | AISC is calculated as the sum of treatment and refining charges, onsite operating costs, sustaining capital costs, and closure costs, divided by the quantity of ounces sold. |
| 2. | Values may not add due to rounding. |
| Fury Gold Mines Limited Results of Operations for the Three and Nine Months Ended September 30, 2025 (Amounts expressed in thousands of Canadian dollars, unless otherwise noted) |
|
Economic Sensitivities
The PEA provides an after-tax NPV5 of $554M, an IRR of 41% and a payback period of 2.5 years with the Base Case scenario; an after-tax NPV of $610M, an IRR of 53% and a payback period of 1.5 years from production with the Hybrid Case and; an after-tax NPV of $639M, an IRR of 84% and a payback period of 1.1 years from production with the Toll Milling Case both at a gold price of US$2,400/oz (Table 5).
Table 5: Sensitivity Analysis
| NPV5 to Gold Price Sensitivities | |||
| Gold Price (US$) | Base Case | Hybrid Case | Toll Milling Case |
| $1,440 (-40%) | $70M | $72M | $96M |
| $1,920 (-20%) | $318M | $346M | $375M |
| $2,400 (Study Price) | $554M | $610M | $639M |
| $2,880 (+20%) | $787M | $867M | $897M |
| $3,360 (+40%) | $1,020M | $1,124M | $1,154M |
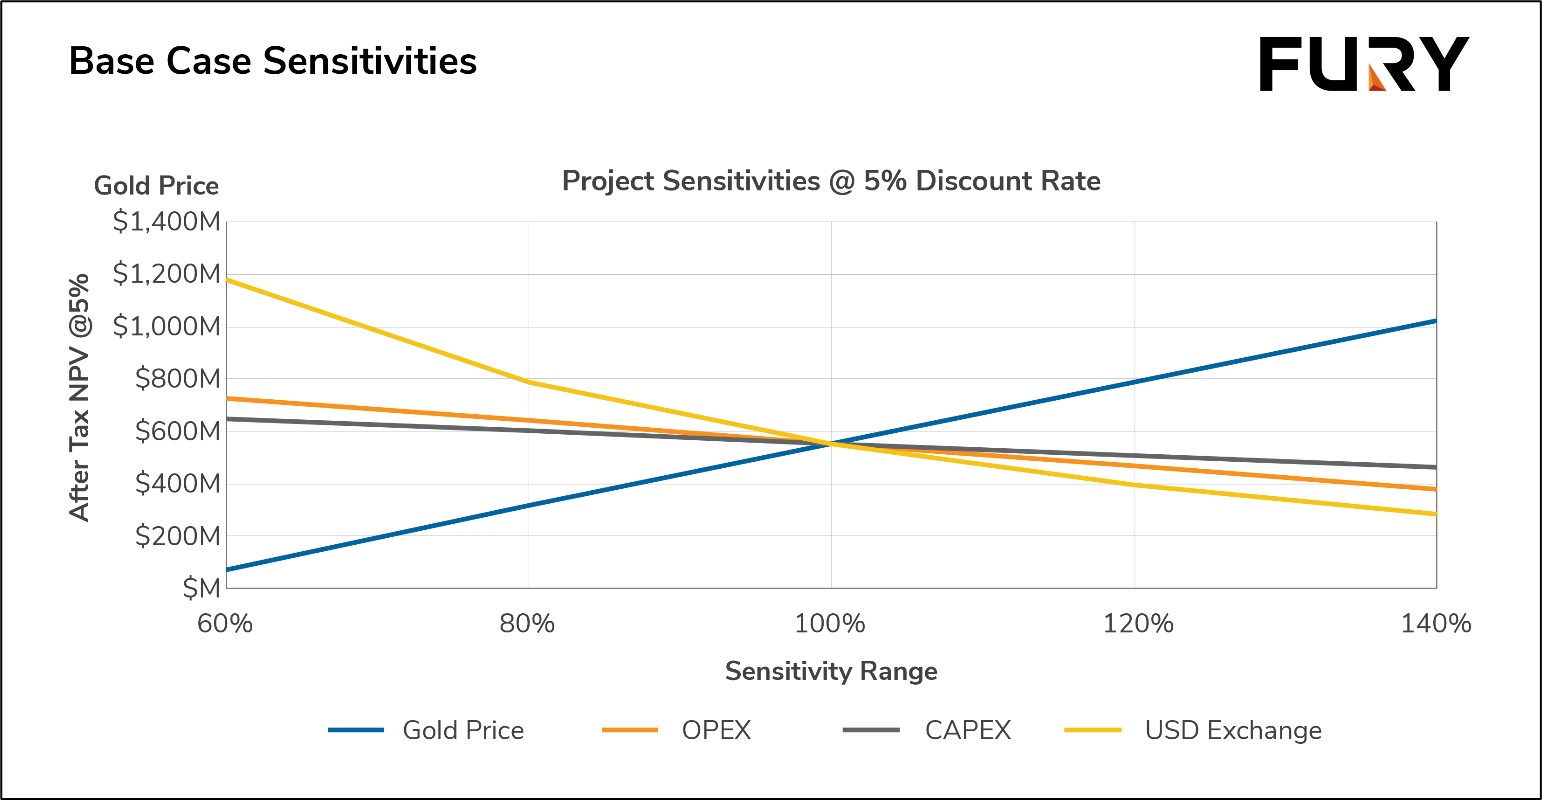
Figure 2: Base Case Sensitivities.
| Fury Gold Mines Limited Results of Operations for the Three and Nine Months Ended September 30, 2025 (Amounts expressed in thousands of Canadian dollars, unless otherwise noted) |
|
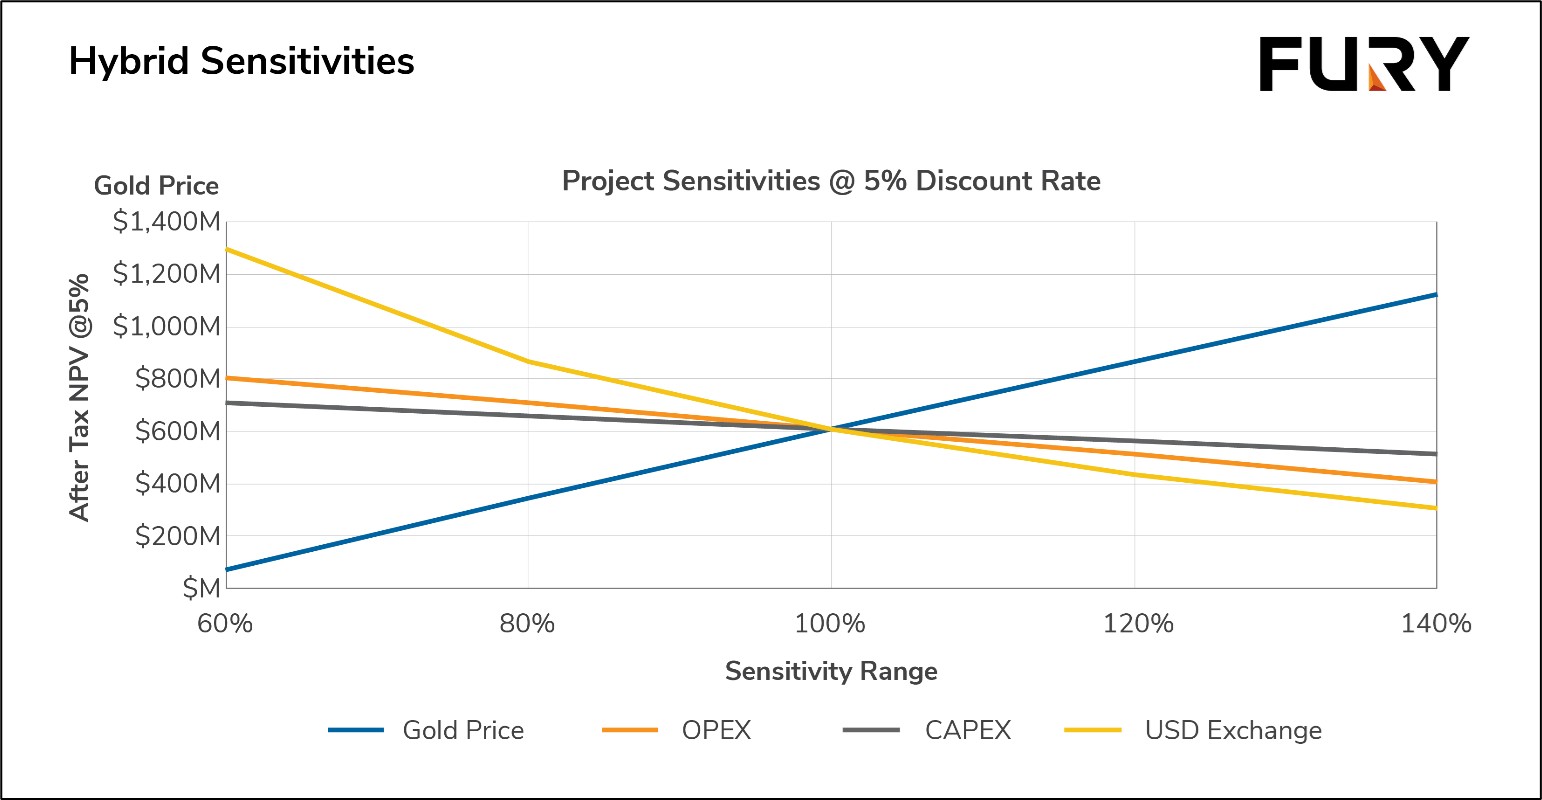
Figure 3: Hybrid Case Sensitivities.
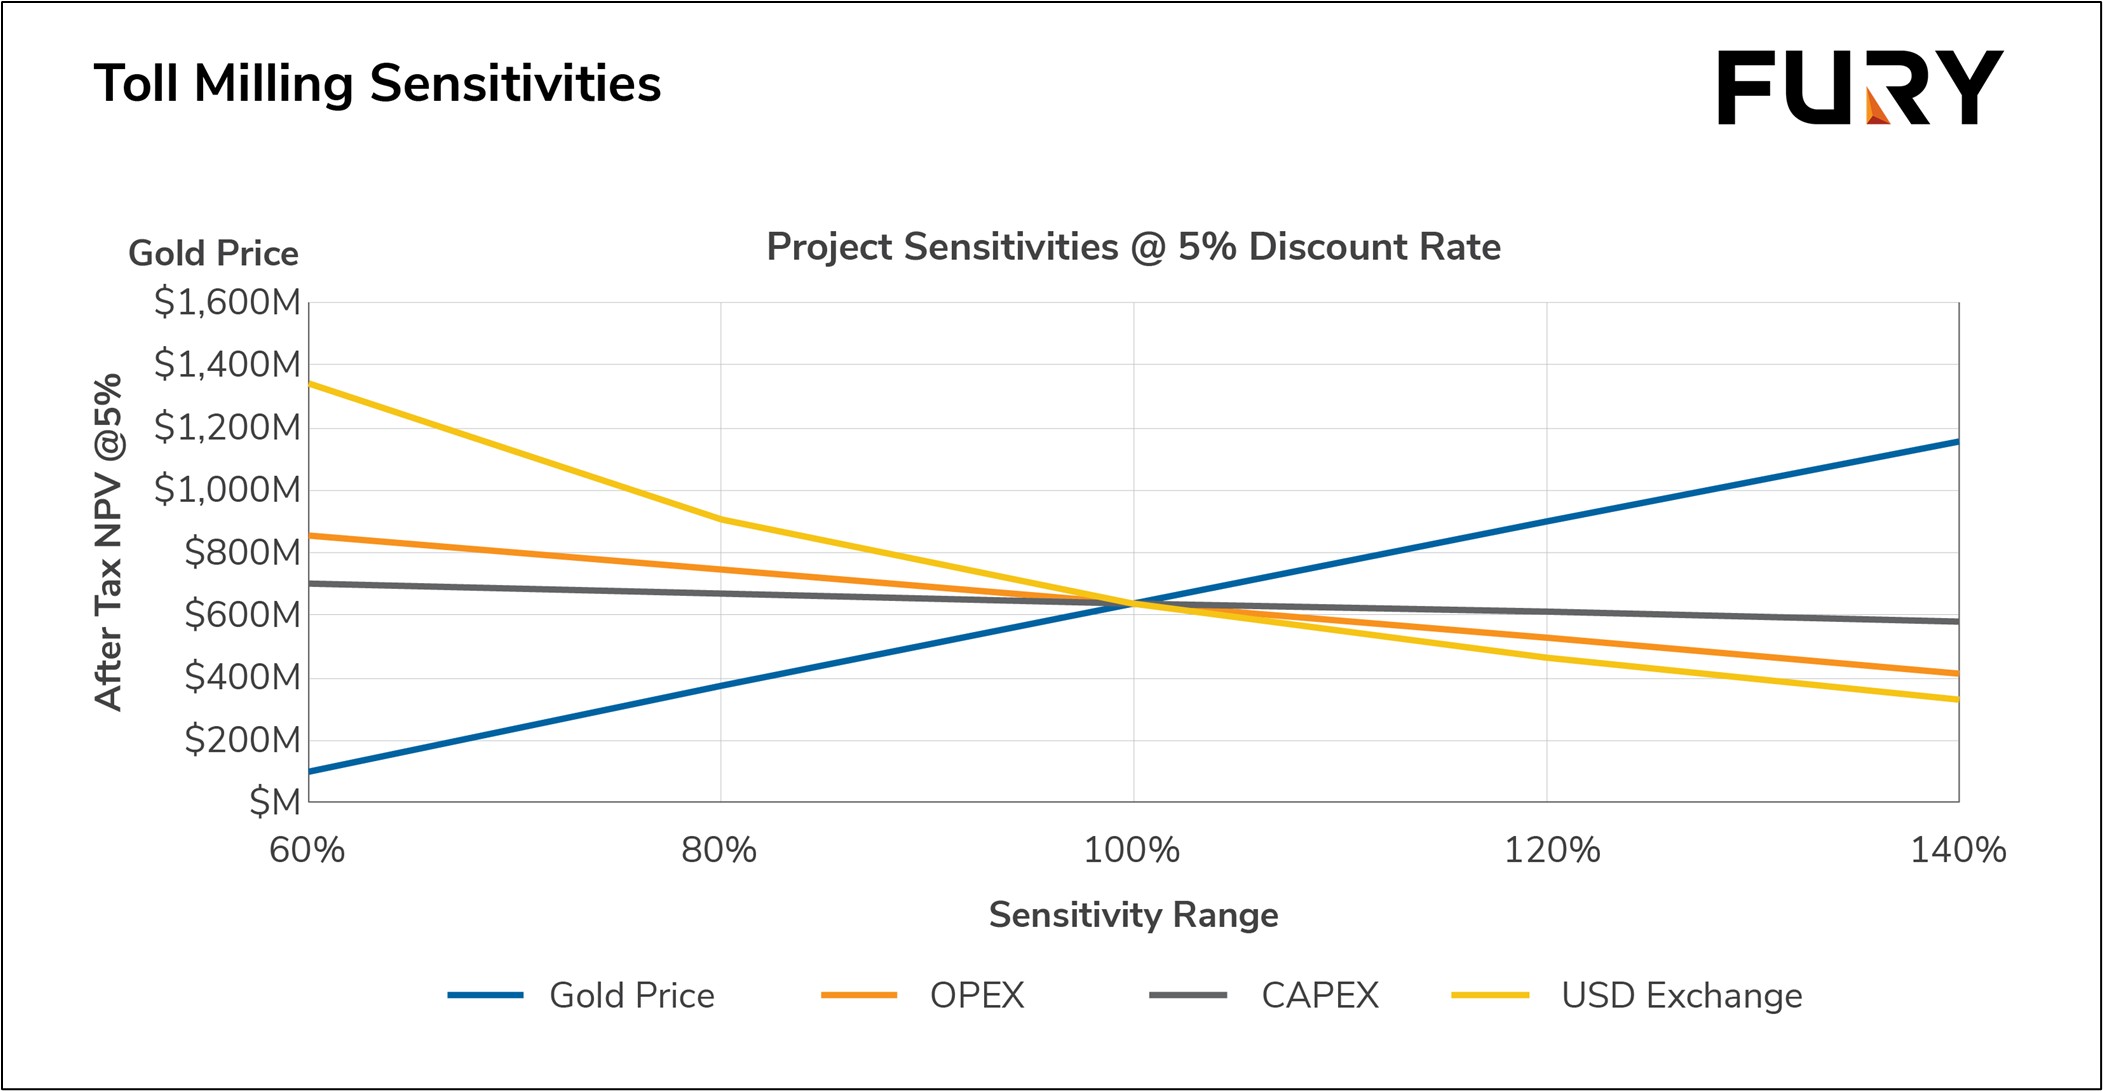
Figure 4: Toll Milling Case Sensitivities.
In 2024, the Company completed approximately 3,871 m of Diamond Drilling at the project targeting biogeochemical anomalies within the Percival – Serendipity trend 14km to the east of Eau Claire. The 2024 drill program resulted in the discovery of high-grade gold mineralization at Serendipity with two intercepts: 3m of 12.16 g/t gold and 1m of 5.27 g/t gold separated by over 2 km of prospective stratigraphy. The 2024 drilling cost $1,800.
| Fury Gold Mines Limited Results of Operations for the Three and Nine Months Ended September 30, 2025 (Amounts expressed in thousands of Canadian dollars, unless otherwise noted) |
|
Percival to Serendipity trend:
The Serendipity Prospect is situated 16 km northeast of the Eau Claire Deposit and 6.5 km north northeast of the Percival Deposit along the Hashimoto Deformation Zone, which is related to the Cannard Deformation Zone, one of the primary controls on gold mineralization within the region. The planned 2024 drilling tested five robust distinct geochemical targets up to 150x background values proximal to the regional scale Hashimoto Deformation Zone within prospective folded stratigraphy across approximately 2 km of strike length. Limited historical drilling near Serendipity intercepted 7.9 m of 1.23 g/t gold; 12.1 m of 1.38 g/t gold and 1.5 m of 4.27 g/t gold.
Fury’s technical team has demonstrated the effectiveness of drilling biogeochemical anomalies in covered terrain within our project areas and continues to build a better understanding of the combination of pathfinder elements and structural controls on the gold mineralization along the Percival to Serendipity trend. Broad low-grade gold mineralization occurs along well-defined structural splays sub-parallel to the regional Cannard and Hashimoto Deformation Zones. Certain elemental associations, most notably Arsenic, Bismuth, and Tungsten, are proving to be important pathfinders for gold mineralization. Higher-grade gold within the broader corridor is controlled by secondary shearing and is identified by the high degree of silicification and alteration. The proximity of the main Cannard and Hashimoto Deformation Zones varies from one target to the other and Fury believes the varying degrees of deformation are an important control on both gold mineralization and the potential preservation of a sizeable, mineralized body.
The Company expects to incur approximately $35 annually in project maintenance costs, including certain mineral claims payments, in order to keep the properties in good standing in 2025. The Company is currently finalizing exploration plans for the Eau Claire project for the fall of 2025.
Eau Claire Preliminary Economic Assessment technical report
The Eau Claire PEA was published in a technical report titled “Technical Report – Preliminary Economic Assessment of the Eau Claire Project, Eeyou Istchee James Bay Region of Quebec, Canada” (“2025 Eau Claire Technical Report” or the “Report”), with an effective date of August 25, 2025. The report was authored by:
William van Breugel, P. Eng. of SGS Geological Services, an independent Qualified Person as defined by NI 43-101, having responsibility for the project economics including capital expenditures, operating expenditures, financials and sensitivities.
Johnny Canosa, P. Eng. of SGS Geological Services, an independent Qualified Person as defined by NI 43-101, having responsibility for the mining methods, infrastructure, and environment, permitting & social or community impact. Johnny Canosa, P. Eng., conducted a site visit to the Eau Claire Property on November 14-15, 2024.
Henri Gouin, P. Eng. of SGS Geological Services, an independent Qualified Person as defined by NI 43-101, having responsibility for the underground mining planning and schedule.
Joseph Keane, P. E. of SGS Geological Services, an independent Qualified Person as defined by NI 43-101, Processing and Metallurgy.
Maxime Dupéré, P. Geo. of SGS Geological Services, an independent Qualified person as defined by NI 43-101, having responsibility for summary (2024 mineral resource estimate; and adjacent properties), introduction, data verification, mineral resource estimates, adjacent properties, interpretation and conclusion (2024 mineral resource estimate; and risk and opportunities) and recommendations.
Sarah Dean, P. Geo. of SGS Geological Services, an independent Qualified Person as defined by NI 43-101, having responsibility for summary (property description, location access and physiography; history of exploration, drilling; and geology and mineralization), property description and location, accessibility climate, local resources, infrastructure and physiography, history, geological setting and mineralization, deposit types, exploration, drilling, and interpretation and conclusions (property description).
| Fury Gold Mines Limited Results of Operations for the Three and Nine Months Ended September 30, 2025 (Amounts expressed in thousands of Canadian dollars, unless otherwise noted) |
|
Eau Claire Mineral Resource Estimate technical report
The Eau Claire resource estimation was completed in a technical report authored by Maxime Dupere, Geologist, Ben Eggers, Geologist, and Sarah Dean, Geologist, all with SGS Geological Services (“Mineral Resource Estimate Update for the Eau Claire Project, Eeyou Istchee James Bay Region of Quebec, Canada” which is dated June 25, 2024, has an effective date of May 10, 2024, and is filed on SEDAR+).
4.2.2 Éléonore South
On March 1, 2024, Fury Gold completed the purchase of Newmont Corporation’s 49.978% interest in the Éléonore South project for $3,000 consolidating Fury’s interest in the project to 100%.
The Éléonore South property is strategically located in an area of prolific gold mineralization within the Eeyou Istchee James Bay gold camp and is locally defined by Newmont’s Éléonore mine and Sirios Resources’ Cheechoo deposit. Exploration over the past 13 years has largely been focused on the extension of the Cheechoo deposit mineralization within the portion of the Cheechoo Tonalite on the Property. Approximately 27,000m of drilling in 172 drill holes, covering only a small proportion of the property at the Moni and JT prospects has been completed. Notable drill intercepts include 53.25m of 4.22 g/t gold (Au); 6.0m of 49.50 g/t Au including 1.0m of 294 g/t Au and 23.8m of 3.08 g/t Au including 1.5m of 27.80 g/t Au.
On March 5, 2024, the Company announced that it has identified a robust biogeochemical gold anomaly within the same sedimentary rock package that hosts Newmont’s Éléonore Mine at the Éléonore South project. The orientation level biogeochemical sampling survey was designed to target an interpreted fold nose within the Low Formation sediments in an area where conventional soil or till sampling was not possible due to the ground conditions. The targeted area exhibited similar geological, geophysical, and structural characteristics to those present at the nearby Éléonore Mine. The identified anomaly is up to 200x the background value in gold and outlines the folded sedimentary package.
On March 20, 2024, Fury announced its intention to commence diamond core drilling operations at the Éléonore South gold project. The diamond drilling program commenced in late March and will comprise approximately 2,000 metres (m) focussed on the Moni showing trend where previous drilling intercepted up to; 53.25 m of 4.22 g/t gold (Au); 6.0 m of 49.50 g/t Au including 1.0 m of 294 g/t Au and 23.8 m of 3.08 g/t Au including 1.5 m of 27.80 g/t Au, several of which remain open.
On June 4, 2024, Fury announced the results from its Spring 2024 diamond core drilling program at the Éléonore South gold project. The Spring 2024 diamond drilling program comprised 2,331.4 m completed in seven diamond drill holes testing 2.3 km of strike along the JT – Moni Trend. The drilling targeted 100 to 125 m downdip extensions from historical drilling. All seven drill holes intercepted anomalous gold mineralization including 137.5 m of 0.44 g/t gold and 18.7 m of 0.97 g/t from drill hole 24ES-161, 115.5 m of 0.50 g/t gold from drill hole 24ES-162 and, 28.0 m of 0.47 g/t gold from drill hole 24ES-160. The limited drilling completed confirms that the gold mineralization hosted within the Cheechoo tonalite remains open.
On October 7, 2024, the Company announced the discovery of high-grade lithium outcrop on the western claim block of its 100% owned Éléonore South project in the Eeyou Istchee Territory in the James Bay region of Quebec. The outcrop sampling program targeted the historical Fliszar showing lepidolite bearing pegmatite as well as new rock exposures over an area of approximately 1000 x 500 metres resulting in the collection of 34 samples. Seven samples returned high-grade values above 1.75% lithium oxide (Li2O) with a peak value of 4.67% Li2O. The Company’s focus remains on the gold prospectivity of the Éléonore South project; however, the announced lithium results provide additional exploration targets as the overall project is advanced.
On November 12, 2024, the Company announced the finalization of drill targeting at the Éléonore South gold project in the Eeyou Istchee Territory in the James Bay Region of Quebec. Drilling will target robust geochemical gold anomalies within the same sedimentary rock package that hosts Newmont’s Éléonore Mine. The completed biogeochemical sampling survey covered an interpreted fold nose within the Low Formation sediments where an orientation level study identified a large-scale gold anomaly in a similar geological, geophysical, and structural setting to that of the nearby Éléonore Mine. Six priority drill targets across over 3 kilometres (km) of prospective folded sedimentary stratigraphy have been identified. These six targets encompass multi point gold anomalies above the 90th percentile of the data and correlate with moderate pathfinder elemental anomalies, most notably arsenic which is associated with gold mineralization at the Éléonore Mine. The Company has mobilized crews during February 2025 for an initial fully funded 3,000 – 5,000 metre diamond drilling programs.
| Fury Gold Mines Limited Results of Operations for the Three and Nine Months Ended September 30, 2025 (Amounts expressed in thousands of Canadian dollars, unless otherwise noted) |
|
On February 3, 2025, the Company announced the commencement of a diamond drilling program on the greenfield exploration Éléonore South gold project located in the Eeyou Istchee Territory in the James Bay region of Northern Quebec. Drilling will target a combination of geological, geophysical, and geochemical gold anomalies within the same sedimentary rock package that hosts the Éléonore Mine. The fully funded first phase drilling campaign will comprise approximately 4,000 – 6,000 metres targeting an interpreted fold nose within the Low Formation sediments. Within the prospective folded stratigraphy are six undrilled priority targets spanning over 3 km of strike length that have been identified through a combination of biogeochemical sampling and interpretation of magnetics and electromagnetics survey data. The first phase of drilling will be focused within a northwest-southeast structural corridor where a strong correlation between anomalous gold, stratigraphy, and structure has been identified. The drill targets occur in a structurally complex setting with little to no outcrop exposure and the targeting model will evolve with each hole drilled. The Company plans to complete approximately 15 of the 77 permitted drill holes as part of the first phase of drilling and will guide additional drilling based on the results and observations from this phase.
On June 16, 2025, the Company announced the results of the Spring 2025 diamond drilling program. The first phase of drilling targeted axial planar structures within the core of a fold within the prospective Low Formation sediments. The program comprised 12 diamond drill holes totaling approximately 4,930 m of drilling within a 2x3 km target area. Four of the twelve drill holes intercepted low-grade gold mineralization across widths of up to 5 m with up to five zones in a single drill hole (25ES-170). The low-grade gold mineralization intercepted lies within an east-west, steeply southerly dipping structural corridor with quartz veining and associated strong, broad zones of carbonate + silica + tourmaline +/- diopside alteration. The structural corridor is interpreted to be an axial planar feature related to broad regional scale folding within the favourable Low Formation sedimentary package. Gold is associated with bismuth and tellurium within altered bedded wackes and argillites of the Low Formation.
The first phase of drilling did not intercept arsenopyrite, which is a primary indicator of gold mineralization at the Éléonore Mine. Moderate arsenic anomalism was used in the targeting of the initial drilling in order to filter out the high background arsenic in the regional sedimentary package. Future drilling will target moderate to high arsenic anomalism with associated gold anomalism within the identified structural corridor in order to filter out the right concentration of arsenic associated with mineralization and not primary arsenic associated with lithology.
In addition to the Éléonore style biogeochemical targets, several gold in-till anomalies remain undrilled throughout the project. These gold in-till anomalies have similar geological and geochemical characteristics to the Cheechoo style of mineralization.
The Company expects to incur approximately $35 annually in project maintenance costs, including certain mineral claims payments, in order to keep the properties in good standing in 2025. No additional work is planned for 2025. The Company is reviewing targets and priorities for 2026.
4.2.3 Sakami
The winter road accessible Sakami project covers approximately 14,250 hectares (ha), 30 km to the east of the paved Billy Diamond Highway. The Project straddles the prospective structural corridor marking the contact between the Opinaca and La Grande Geological subprovinces, where gold mineralization has been identified across over 23 km. Gold mineralization is located at the base of a sulphide rich horizon located along and proximal to regional-scale shearing, marking the contact between the two geological subprovinces.
On June 16, 2025, the Company announced the finalization of drill targets at Sakami. The first phase drilling campaign commenced in late June 2025 and will be comprise of approximately 3,000 – 5,000 metres, with three priorities;
| • | Discovery along a 23-km long gold-bearing structural corridor at the Juliette target; |
| • | Confirm historical mineralized intercepts at the La Pointe and La Pointe Extension targets; |
| • | Step out drilling along strike and down plunge of a high-grade corridor identified at La Pointe Extension. |
| Fury Gold Mines Limited Results of Operations for the Three and Nine Months Ended September 30, 2025 (Amounts expressed in thousands of Canadian dollars, unless otherwise noted) |
|
Historical drilling at Sakami has intercepted gold mineralization across widths of up to 75 m and to a depth of up to 500 m below surface with intercepts of 7.79 g/t gold (Au) over 3.0 m from drill hole PT21-182; 8.70 g/t Au over 7.0 m from drill hole PT21-187; 4.28 g/t Au over 4.5 m from drill hole PT17-102 and 3.89 g/t Au over 14.90 m from drill hole PT18-116.
On August 12, 2025, the Company announced the results from the first drill hole of the 2025 campaign at Sakami. Drill hole 25SK-001 was designed to test the down plunge extension of gold mineralization intercepted in historical drilling. The drill hole intercepted five distinct zones of gold mineralization across a 140-metre (m) drilled length; 4.7 m of 2.72 g/t gold; 0.5 m of 10.2 g/t gold; 1.5 m of 5.17 g/t gold; 11.8 m of 1.28 g/t gold and; 41.5 m of 1.23 g/t gold.
On September 4, 2025 the Company announced the results from two additional drill holes at the Sakami gold project. Drill hole 25SK-002 was drilled 140 m below drill hole 25SK-001, where drill hole 25SK-003 was drilled 200 m below previous shallow drilling and 100 m to the west of the previously announced drill hole 25SK-001. Highlights from the additional two drill holes include 49.5 m of 0.6 g/t gold and 22.7 m at 1.47 g/t gold from drill hole 25SK-002, as well as 59 m of 1.59 g/t gold and 9.1 m of 0.92 g/t gold from drill hole 25SK-003. The reported intercepts leave the mineralization at La Pointe Extension open at depth and along strike to the west. Results from the remaining four drill holes are pending.
Drilling to date on the Property by the Company has confirmed:
| • | Gold mineralization remains open to the west with reported intercept from 25SK-003, 59 m of 1.59 g/t gold, the eighth highest overall intercept (grade x width) of all time at Sakami. |
| • | Mineralization is structurally controlled, consistent, and identifiable by a large zone of intense silicification. |
| • | The high-grade gold core persists to depth and remains open. |
Gold mineralization has been intercepted across widths of up to 75 m and to a depth of up to 500 m. The identified gold mineralization at both La Pointe and La Pointe Extension remains open to depth and along strike. Further south along the same gold-bearing structure lies an intriguing undrilled coincident gold in soil geochemical anomalies and Induce Polarization (IP) geophysical chargeability anomaly with similar signature to the La Pointe and La Pointe Extension targets.
The 2025 Diamond Drilling campaign is anticipated to cost $1,700.
The Company expects to incur approximately $22 annually in project maintenance costs, including certain mineral claims payments, in order to keep the properties in good standing in 2025.
4.2.4 Elmer East
The Elmer East property covers approximately 45,735 ha and is easily accessible from the paved Billy Diamond highway. The project is located approximately 60 km north of the “km 381” rest stop where accommodations, fuel catering and power are available. The property is host to an undrilled 4.2 km long east–west oriented gold and base metal bearing structural trends known as the Lloyd showing where grab samples have returned results of up to 68.10 g/t gold, 7.99% Zinc and 7,660 ppm Copper.
Spodumene bearing pegmatites have been identified throughout the QPM land package with a recently completed drilling campaign at the Ninaaskumuwin project where +20 m spodumene bearing pegmatites with vertical continuity of up to 150 m were intercepted in drilling late 2024.
On July 9, 2025, the Company announced the results of the 2024 diamond drilling campaign targeting spodumene bearing pegmatites at Elmer East. The program comprised 825 m of diamond drilling in 5 drill holes. The drilling targeted a spodumene-bearing pegmatite outcrop, which returned surface samples of up to 3.92% Li2O. Highlights from the drill campaign include 32.35 m of 1.16% Li2O from EE24-003 and 22.48 m of 1.19% Li2O from EE24-002. Drilling confirmed the vertical continuity of lithium mineralization from surface down to 150 m. The lithium mineralized spodumene-bearing pegmatite intercepted remains open at depth and along strike. This new lithium discovery sits approximately 50 km north of Rio Tinto plc’s Galaxy Lithium project, acquired in March 2025 as part of the broader acquisition of Arcadium Lithium plc for US$ 6.7 billion.
| Fury Gold Mines Limited Results of Operations for the Three and Nine Months Ended September 30, 2025 (Amounts expressed in thousands of Canadian dollars, unless otherwise noted) |
|
On July 22, 2025, the Company announced the results from metallurgical test work completed on the lithium mineralized pegmatite intercepted in the 2024 drill campaign. The objective of the metallurgical test work was to characterize the mineralogy and metallurgical properties of the spodumene-bearing pegmatite intercepted in drilling. Results from the preliminary test work indicate that the Ninaaskumuwin lithium mineralization is amenable to conventional lithium extraction techniques with Heavy Liquid Separation resulting in recovery of 62.2% Lithium and a concentrate grade of 5.59% Li2O from a single composite sample. Results from the test work indicate:
| • | Samples analysed contain up to 42% spodumene; |
| • | Spodumene is the sole lithium-bearing mineral identified; |
| • | The pegmatite intercepted is free of impurities indicating that lithium concentrates suitable for lithium carbonate and lithium hydroxide battery grade products could possibly be produced; |
| • | The Ninaaskumuwin pegmatite is a highly fractionated and fertile Lithium Cesium and Tantalum (LCT) pegmatite; |
| • | Grades of the 85 samples analysed range from 0.02% to 3.71% Li2O and 0.36% to 6.30 % Fe2O3; and |
| • | Recoveries of 62.2% Li and concentrate grade of 5.59% Li2O received from a single composite. |
The Company expects to incur approximately $64 annually in project maintenance costs, including certain mineral claims payments, in order to keep the properties in good standing in 2025. No work is currently planned for 2025.
4.2.5 Kipawa
The Heavy Rare Earth Elements (HREE) Kipawa project (68% owned through the Company’s subsidiary and 32% owned by Investissement Québec), 50 km east of Temiscaming in southwestern Quebec, is host to a historical 2013 Proven and Probable reserves of 19.8 million tonnes grading 0.411% total rare earth oxides (TREO). The road accessible project covers an area of 4,300 hectares with good access to local infrastructure.
The above noted reserves estimation with an effective date of September 4, 2013 was completed for Matamec Exploration Inc. by Roche Ltd, Genivar, Golder Associates and SGS Canada Geostat (Feasibility Study for the Kipawa Project, Temiscamingue Area, Quebec, Canada - Saucier et. al., 2013). The 2013 estimate was based on 293 drill holes totaling 24,571m of drilling and 13 trenches totalling 631m. The 2013 historical resource and reserve estimate used a block model method constrained by wireframe grade-shell models, with ordinary kriging (OK) weighting. Block sizes of 10x5x5m were estimated. Measured and Indicated resources required drill grid spacing of 25m and 50m respectively with mineralized material 30 m outside of the drill grids being categorized as Inferred. Using a bulk density of 2.89t/m3 and a 0.2% TREO cut-off the 2013 historical resource estimate totalled 10.4Mt at 0.46% TREO in the Measured category, 13.4Mt at 0.36% TREO in the Indicated category and 3.3Mt at 0.31% TREO in the inferred category. Mineral Reserves were estimated using a bulk density of 2.89 t/m3 and a cut-off value of $48.96/ tonne with 5% dilution and a mining recovery of 95.2% resulted in a historical reserve estimate of 10.2Mt at 0.44% TREO in the Proven category and 9.5Mt at 0.38% TREO in the Probable category
The historical resource and reserve estimates discussed above have not been sufficiently reviewed by the Company to be deemed a current mineral resource or mineral reserve. Fury does not treat this historical resource and reserve estimate as current. There are no current mineral reserve or mineral resource estimates for the Kipawa Project.
The Company expects to incur approximately $3 annually in project maintenance costs, including certain mineral claims payments, in order to keep the properties in good standing in 2025. The Company are currently reviewing the project and engaging with local stakeholders.
4.3 Nunavut
Committee Bay and Gibson MacQuoid Projects
The Committee Bay project comprises approximately 250,000 hectares situated along the Committee Bay Greenstone Belt located 180km northeast of the Meadowbank mine operated by Agnico Eagle Mines Limited. The Committee Bay belt comprises one of a number of Archean-aged greenstone belts occurring within the larger Western Churchill province of northeastern Canada. The Committee Bay project is held 100% by the Company, subject to a 1% Net Smelter Return (“NSR”), and an additional 1.5% NSR payable on only 7,596 hectares which may be purchased within two years of the commencement of commercial production for $2,000 for each one-third (0.5%) of the NSR.
| Fury Gold Mines Limited Results of Operations for the Three and Nine Months Ended September 30, 2025 (Amounts expressed in thousands of Canadian dollars, unless otherwise noted) |
|
On October 24, 2024, the Company announced the results from the summer exploration program at its 100% Committee Bay project in the Kitikmeot Region of Nunavut. The 2024 exploration program defined three drill ready shear zone hosted targets advanced through a combination of till sampling, rock sampling and geological mapping:
| • | Three Bluffs Shear, where drilling in 2021 intercepted 13.93 g/t Au over 10 metres; |
| • | Raven Shear where 7 rock samples have averaged 16.12 g/t gold; and |
| • | Burro West where a 300 by 300 m discrete >90th percentile gold in till anomaly has been defined with a peak value of 50 ppb gold. |
On June 3, 2025, the Company announced the 2025 exploration plans for the Committee Bay project. The 2025 Committee Bay exploration program commenced in early July 2025 and will comprise 7 – 10 diamond drill holes totaling approximately 5,000 metres.
The 2025 drilling will have three primary goals;
| • | Expansion of the Three Bluffs Shear Zone target first identified in 2021 where drill hole 21TB152 intercepted three discrete zones of high-grade gold mineralization over a 30 m drill width, including 10.0 m of 13.93 g/t gold, 3.0 m of 18.67 g/t gold and 1.0 m of 23.2 g/t gold in a 120 m step-out from the defined mineral resource (see news release dated December 1, 2021); |
| • | Testing regional shear zones along the southern contact of the 8 km-long Raven shear zone where samples of up to 32.90 g/t gold have been returned from an undrilled outcrop (see news release dated February 16, 2022); |
| • | Testing regional shear zones at Burro West where a 300 by 300 m gold in till anomaly was identified in 2024. |
On July 14, 2025, the Company announced that the 2025 diamond drilling campaign had commenced at the Committee Bay project. The 2025 program is anticipated to cost $4,200. Results from the program are expected in the last quarter of 2025.
The Company expects to incur approximately $160 in annual mineral claims expenditures in 2025, in order to keep the property in good standing. Payments totalling $157 were made during the year ended December 31, 2024, in respect of these mineral claims.
Committee Bay resource estimate and technical report
Three Bluffs resource estimations were completed by APEX Geoscience Ltd. (“APEX”) (see the Technical Report on the Committee Bay Project, Nunavut Territory, Canada, dated September 11, 2023, and filed under Fury’s SEDAR+ profile). It supersedes prior all previous Committee Bay technical reports.
Section 5: Review of quarterly financial information
| Three months ended: | Interest income | Net Loss(1) | Comprehensive loss(1) | Loss per share (C$/share) | ||||||||||||
| September 30, 2025 | $ | 53 | $ | 4,699 | $ | 4,701 | $ | 0.03 | ||||||||
| June 30, 2025 | 35 | 1,996 | 1,998 | 0.01 | ||||||||||||
| March 31, 2025 | 44 | 2,991 | 2,993 | 0.02 | ||||||||||||
| December 31, 2024 | 60 | 101,256 | 101,257 | 0.68 | ||||||||||||
| September 30, 2024 | 75 | 2,673 | 2,673 | 0.02 | ||||||||||||
| June 30, 2024 | 82 | 3,496 | 3,497 | 0.02 | ||||||||||||
| March 31, 2024 | 82 | 714 | 715 | 0.01 | ||||||||||||
| December 31, 2023 | 119 | 4,609 | 4,612 | 0.03 | ||||||||||||
(1) Certain periods have been restated within this document to correct a misstatement which was identified in the fourth quarter of 2024. See section 5.2 below for details
| Fury Gold Mines Limited Results of Operations for the Three and Nine Months Ended September 30, 2025 (Amounts expressed in thousands of Canadian dollars, unless otherwise noted) |
|
5.1 Three months ended September 30, 2025, compared to three months ended September 30, 2024
During the three months ended September 30, 2025, the Company reported net loss of $4,699 and loss per share of C$0.03 compared to a net loss of $2,673 and loss per share of C$0.02 for the three months ended September 30, 2024. The significant drivers of the change in total net loss were as follows:
Operating expenses:
| • | Exploration and evaluation costs increased to $4,295 for the three months ended September 30, 2025 compared to $2,318 for the three months ended September 30, 2024. The higher exploration expense in the third quarter of 2025 was a result of the robust summer drilling programs at both Sakami and Committee Bay; whereas 2024 drill program was shorter and finished in mid-August. |
| • | Fees, salaries and other employee benefits increased to $485 for the three months ended September 30, 2025 compared to $412 for the three months ended September 30, 2024. The higher costs were a result of annual salary adjustment as well as higher share-based compensation costs for the quarter; and |
| • | Legal and professional fees increased to $310 for the three months ended September 30, 2025 compared to $138 for the three months ended September 30, 2024. The higher costs in 2025 were primarily due to professional fees associated with the review of the corporate acquisitions and internal control over financial reporting services during the quarter compared to the prior year. |
Other (income) expenses, net:
| • | Amortization of flow-through share premium decreased to $194 for the three months ended September 30, 2025 compared to $678 for the three months ended September 30, 2024 was a result of the extinguishment of the flow-through liability in April 2025, and the June 2025 financing only started amortizing in Q3; |
| • | Net loss from associates of $1,847 primarily comprising the Company’s share of net losses of Dolly Varden, compared to $1,668 for the three months ended September 30, 2024; and |
| • | Net gain on marketable securities of $320 for the three months ended September 30, 2025 compared to net loss of $421 for the three months ended September 30, 2024 was a result of the increase in securities prices in the quarter compared to the decrease in the same comparable quarter. |
5.2 Nine months ended September 30, 2025, compared to nine months ended September 30, 2024
During the nine months ended September 30, 2025, the Company reported net loss of $9,687 and loss per share of C$0.06 compared to a net loss of $6,881 and loss per share of $0.05 for the nine months ended September 30, 2024. The significant drivers of the change in total net loss were as follows:
Operating expenses:
| • | Exploration and evaluation costs increased to $9,489 for the nine months ended September 30, 2025 compared to $4,794 for the nine months ended September 30, 2024. The increase resulted from the 4,000 – 6,000 metres diamond drilling program at the Éléonore South property in the first quarter of 2025 and the program at Sakami which started in June, as well as the program in Committee Bay that started in July, whereas in 2024, work in the first quarter were limited to reviewing drill results and working on a resource update, with field days at the last part of June and concluded mid-August; |
| • | Legal and professional fees increased to $896 for the nine months ended September 30, 2025 compared to $602 for the nine months ended September 30, 2024. The higher costs in the current year are primarily a result of due diligence work performed for various financings, professional fees related to the valuation of mineral property interests, additional audit fees and additional internal control framework review work; and |
| Fury Gold Mines Limited Results of Operations for the Three and Nine Months Ended September 30, 2025 (Amounts expressed in thousands of Canadian dollars, unless otherwise noted) |
|
| • | Marketing and investor relations costs increased to $615 for the nine months ended September 30, 2025 compared to $464 for the nine months ended September 30, 2024. The increase in costs was due to more strategic consultation services and marketing campaigns undertaken in 2025 compared to 2024. |
Other income, net:
| • | A net gain on disposal of investment of $3,230 and deemed dilution gain of $2,002 for the nine months ended September 30, 2025 compared to a net gain on disposal of investment of $538 and deemed dilution gain of $2,000 for the nine months ended September 30, 2024; |
| • | Net gain on marketable securities of $668 for the nine months ended September 30, 2025 compared to $191 for the nine months ended September 30, 2024 was primarily due to in 2025, there was a significant upturn in market value of certain securities within the lithium exploration space of which the Company had significant holdings; and |
| ▪ | Other income of $144 for the nine months ended September 30, 2025 was from expenses eligible for government grant that were recognized in the period; whereas other income of $566 for the nine months ended September 30, 2024 was from fuel resale. |
5.3 Revision of prior period unaudited interim financial statements
In preparing the consolidated financial statements for the year ended December 31, 2024, the Company identified an error in its previously issued unaudited consolidated quarterly financial statements for the periods ended March 31, 2024 and September 30, 2024. The carrying value of our investment in associates may also change as a result of effective increase or decrease in the investor’s ownership interest, with gains or losses arising as a result being recognized in profit or loss. In certain circumstances, our interest in the associates can change without us directly purchasing or selling shares, for example in the events of share issuances in which we do not participate. The error resulted in a misstatement of gain/loss on investments and investments in associates relating to the Company’s investment in Dolly Varden, specifically an understatement of dilution gain on the consolidated statement of (earnings) loss and comprehensive (income) loss, as well as an understatement of our investment in associate balance on the statement of financial position. The error had no cash impact on our financial statements. The impact of the revisions to the periods presented in this report are as follows:
| As reported | Adjustment | Revised | ||||||||||
| Revised Statement of Financial Position as of March 31, 2024 | ||||||||||||
| Investment in associates | 32,638 | 220 | 32,858 | |||||||||
| Total assets | 188,023 | 220 | 188,243 | |||||||||
| Deficit | (149,988 | ) | 220 | 149,768 | ||||||||
| Total equity | 182,356 | 220 | 182,576 | |||||||||
| Revised Consolidated Statement of Loss and Comprehensive Loss for the three months ended March 31, 2024 | ||||||||||||
| Gain on investments | (537 | ) | (220 | ) | (757 | ) | ||||||
| Net loss | 934 | (220 | ) | 714 | ||||||||
| Total comprehensive loss | 935 | (220 | ) | 715 | ||||||||
| Fury Gold Mines Limited Results of Operations for the Three and Nine Months Ended September 30, 2025 (Amounts expressed in thousands of Canadian dollars, unless otherwise noted) |
|
| Revised Consolidated Statement of Loss and Comprehensive Loss for the six months ended June 30, 2024 | ||||||||||||
| Gain on investments | (537 | ) | (220 | ) | (757 | ) | ||||||
| Net loss | 4,428 | (220 | ) | 4,208 | ||||||||
| Total comprehensive loss | 4,430 | (220 | ) | 4,210 | ||||||||
| Revised Statement of Financial Position as of September 30, 2024 |
||||||||||||
| Investment in associates | 29,341 | 2,000 | 31,341 | |||||||||
| Total assets | 184,099 | 2,000 | 186,099 | |||||||||
| Deficit | (157,932 | ) | 2,000 | (155,932 | ) | |||||||
| Total equity | 177,526 | 2,000 | 179,526 | |||||||||
| Revised Consolidated Statement of Loss and Comprehensive Loss for the three months ended September 30, 2024 | ||||||||||||
| Gain on investments | — | (1,780 | ) | (1,780 | ) | |||||||
| Net loss | 4,453 | (1,780 | ) | 2,673 | ||||||||
| Total comprehensive loss | 4,453 | (1,780 | ) | 2,673 | ||||||||
| Revised Consolidated Statement of Loss and Comprehensive Loss for the nine months ended September 30, 2024 | ||||||||||||
| Gain on investments | (538 | ) | (2,000 | ) | (2,538 | ) | ||||||
| Net loss | 8,881 | (2,000 | ) | 6,881 | ||||||||
| Total comprehensive loss | 8,883 | (2,000 | ) | 6,883 |
Section 6: Financial position, liquidity, and capital resources
| At September 30 2025 |
At December 31 2024 |
|||||||
| Cash | $ | 6,127 | $ | 4,912 | ||||
| Restricted cash | 144 | 144 | ||||||
| Marketable securities | 2,356 | 2,358 | ||||||
| Other investment (1) | 2,063 | 2,063 | ||||||
| Other assets | 1,249 | 979 | ||||||
| Mineral property interests | 50,176 | 45,200 | ||||||
| Investments in associates | 24,514 | 29,456 | ||||||
| Current liabilities | 1,295 | 1,864 | ||||||
| Non-current liabilities | 4,696 | 5,045 | ||||||
| Working capital surplus (2) | 10,205 | 8,045 | ||||||
| Accumulated deficit | 266,879 | 257,192 | ||||||
(1) Investment in unlisted shares of Alsym Energy Inc.
(2) Defined as total current assets less total current liabilities
| Fury Gold Mines Limited Results of Operations for the Three and Nine Months Ended September 30, 2025 (Amounts expressed in thousands of Canadian dollars, unless otherwise noted) |
|
| Three months ended September 30 | Nine months ended September 30 | |||||||||||||||
| Cash flows from continuing operations: | 2025 | 2024 | 2025 | 2024 | ||||||||||||
| Cash (used in) operating activities | (5,503 | ) | (3,348 | ) | (12,567 | ) | (6,507 | ) | ||||||||
| Cash (used in) provided by investing activities | 3,024 | (1,786 | ) | 6,390 | (1,887 | ) | ||||||||||
| Cash (used in) provided by financing activities | 41 | (52 | ) | 7,398 | 4,418 | |||||||||||
6.1 Cash flows
Operating activities:
| • | During the three months ended September 30, 2025, the Company used cash of $5,503 in operating activities compared to $3,348 in 2024. The higher cash outflow for the current period was consistent with higher exploration activities compared to the previous period. |
| • | During the nine months ended September 30, 2025, the Company used cash of $12,567 in operating activities compared to $6,507 during the nine months ended September 30, 2024. The cash outflow was lower in 2024 due to overall lower operating expenditure compared to 2025, together with a higher net outflow of non-cash working capital compared to 2024. |
Investing activities:
| • | During the three months ended September 30, 2025, the Company generated cash from investing activities of $3,024, representing mostly proceeds from disposition of investment and marketable securities. During the three months ended September 30, 2024, the Company used cash from investing activities of $1,786 representing mostly the investment made in Alsym Energy Inc. |
| • | During the nine months ended September 30, 2025, the Company generated cash from investing activities of $6,390, representing net receipt of $6,539 from selling Dolly Varden shares and net receipts of $670 for selling marketable securities, offset by mineral property interest additions of $904 and equipment addition of $47. During the nine months ended September 30, 2024, the Company used cash from investing activities of $1,887, representing mainly the acquisition of other investments, setting off by proceeds from the sale of some Dolly Varden shares. |
Financing activities:
| • | For the three months ended September 30, 2025, cash provided by financing activities of $41 was from the proceeds from exercise of share options. For the three months ended September 30, 2024, cash used in financing activities of $52 was primarily for lease payments. |
| • | For the nine months ended September 30, 2025, cash provided by financing activities of $7,398 represented the net proceeds received from a private placement that raised net $4,477 and a flow-through financing which raised net $2,857. For the nine months ended September 30, 2024, cash provided by financing activities of $4,418 primarily represented the net proceeds received in respect of a flow through common share offering which was completed in June 2024. |
6.2 Contractual commitments
In the normal course of business, the Company enters into contracts that give rise to commitments for future minimum payments. The following table summarizes the remaining contractual maturities of the Company’s financial liabilities and commitments as at September 30, 2025, shown in contractual undiscounted cashflows:
| Within 1 year | 2 to 3 years |
Over 3 years |
At September 30 2025 |
At December 31 2024 |
||||||||||||||||
| Accounts payable and accrued liabilities | $ | 1,042 | $ | — | $ | — | $ | 1,042 | $ | 855 | ||||||||||
| Deferred government grant | 47 | — | — | 47 | — | |||||||||||||||
| Quebec flow-through expenditure requirements | 206 | — | — | 206 | 944 | |||||||||||||||
| Undiscounted lease payments | — | — | — | — | 65 | |||||||||||||||
| Total | $ | 1,295 | $ | — | $ | — | $ | 1,295 | $ | 1,864 | ||||||||||
| Fury Gold Mines Limited Results of Operations for the Three and Nine Months Ended September 30, 2025 (Amounts expressed in thousands of Canadian dollars, unless otherwise noted) |
|
The Company also makes certain payments arising on mineral claims and leases on an annual or bi-annual basis to ensure all the Company’s properties remain in good standing. The Company estimates that $477 of payments arising on mineral claims and leases will be payable during the year ended December 31, 2025.
In addition, the Company is committed to certain office rental expense in respect of shared head office premises as noted in section 8.
6.3 Summary of mineral property interests
A summary of the carrying amounts of the Company’s mineral property interests is as follows:
| Quebec | Nunavut | Total | ||||||||||
| Balance at December 31, 2023 | $ | 122,978 | $ | 19,661 | $ | 142,639 | ||||||
| Additions | 3,030 | — | 3,030 | |||||||||
| Change in estimate of provision for site reclamation and closure | (23 | ) | 427 | 404 | ||||||||
| Impairment | (88,885 | ) | (11,988 | ) | (100,873 | ) | ||||||
| Balance at December 31, 2024 | $ | 37,100 | $ | 8,100 | $ | 45,200 | ||||||
| Additions | 5,436 | — | 5,436 | |||||||||
| Change in estimate of provision for site reclamation and closure | (546 | ) | 86 | (460 | ) | |||||||
| Balance at September 30, 2025 | $ | 41,990 | $ | 8,186 | $ | 50,176 | ||||||
On February 29, 2024, the Company, and its former joint operations partner Newmont, through their respective subsidiaries, closed a transaction whereby the Company acquired 100% control of the joint operation interests, the Éléonore South project, consolidating these properties into the Company’s portfolio at which time the joint venture operation was dissolved. The 49.978% that Newmont held was acquired by the Company for $3,000 while incurring $30 in transaction costs. As part of the same transaction, the Company also acquired a 10.9% interest in Sirios for $1,300 which is held as marketable securities.
The Company’s market capitalization had been persistently below the carrying value of its mineral properties over the last few years, and, accordingly, the Company engaged a third-party valuation specialist to conduct a review to determine a more reflective carrying value of these mineral property interests. The resulting report recommended an impairment charge to better reflect their values. Accordingly, the Company recorded an impairment charge of $100,873 for the year ended December 31, 2024.
6.4 Capital resources
The Company seeks to proactively manage its capital resources and makes adjustments in light of changes in the economic environment and the risk characteristics of the Company’s assets. To effectively manage its capital requirements, the Company has in place a budgeting and cash management process to help determine the funds required to ensure the Company has the appropriate liquidity to meet its current project plans and achieve its growth objectives. The Company ensures that there is sufficient liquidity available to meet its short-term business requirements, including contractual commitments, taking into account its anticipated cash outflows from exploration activities and its holdings of cash and marketable securities. The Company monitors and adjusts, when required, these exploration programs as well as corporate administrative costs to ensure that adequate levels of working capital are maintained.
As at the date of this MD&A, the Company expects its existing capital resources to support certain planned activities for the next 12 months at the Eau Claire and Éléonore South projects and short-term contractual commitments. The Company’s ability to undertake further project expansionary plans is dependent upon the Company’s ability to obtain adequate financing in the future. While the Company has been successful at raising capital in the past, there can be no assurance that the Company will have sufficient financing to meet its future capital requirements or that additional financing will be available on terms acceptable to the Company in the future.
| Fury Gold Mines Limited Results of Operations for the Three and Nine Months Ended September 30, 2025 (Amounts expressed in thousands of Canadian dollars, unless otherwise noted) |
|
During the nine months ended September 30, 2025, the Company issued 8,394,045 common shares as part of the QPM acquisition with a fair market value of $4,533. Share issuance costs incurred in respect of the acquisition were $199.
The Company closed a non-brokered private equity placement for gross proceeds of $4,306, consisting of 6,728,000 units at C$0.64 per unit. Each unit consisted of one common share of Fury Gold and one common share purchase warrant exercisable to purchase one Fury Gold common share at C$0.80 for a period of three years. Share issuance costs incurred in respect of the private placement were $123.
As part of the June 2025 Offering, the same investor exercised its existing participation right and acquired 440,000 common shares of the Company at a price of C$0.67 per share for gross proceeds of $295. The funds raise from this investor will be used to advance the Company’s Committee Bay exploration program.
June 2025 financing
In June 2025 the Company issued 3,999,701 flow-through shares for gross proceeds of $3,080. Share issue costs related to the June 2025 Offering totaled $223, which included $183 in commissions and $40 in other issuance costs. The proceeds of the June 2025 Offering will be used for the Company’s exploration program in Nunavut and Quebec.
Reconciliation of use of fund of 2025 funding
Fury’s stated use of proceeds for the June 2025 Offering were to pursue exploration opportunities at both its Quebec and Nunavut projects. The funds raised and the application of these funds and working capital is summarized below.
| Q2 2025 | Q3 2025 | |||||||
| Exploration and evaluation | — | (1,818 | ) | |||||
| G&A expenditures | — | — | ||||||
| Total | — | — | ||||||
| Amount raised | 2,857 | — | ||||||
| Remaining to be spent | 2,857 | 1,039 | ||||||
June 2024 financing
In June 2024 the Company issued 5,320,000 flow-through shares for gross proceeds of $5,001 (“June 2024 Offering”). Share issue costs related to the June 2024 Offering totaled $533, which included $300 in commissions and $233 in other issuance costs. The proceeds of the June 2024 Offering will be used for the Company’s exploration program in Quebec.
Reconciliation of use of fund of 2024 funding
Fury’s stated use of proceeds for the June 2024 Offering were for (i) exploration at Eau Claire, (ii) Geochemical sampling and exploration at Éléonore South. The funds raised and the application of these funds and working capital is summarized below.
| Q2 2024 | Q3 2024 | Q4 2024 | Q1 2025 | |||||||||||||
| Quebec explorations | (456 | ) | (1,773 | ) | (626 | ) | (1,710 | ) | ||||||||
| G&A expenditures | — | — | — | — | ||||||||||||
| Total | (456 | ) | (1,773 | ) | (626 | ) | (1,710 | ) | ||||||||
| Amount raised | 4,565 | — | — | — | ||||||||||||
| Remaining to be spent | 4,109 | 2,336 | 1,710 | — | ||||||||||||
| Fury Gold Mines Limited Results of Operations for the Three and Nine Months Ended September 30, 2025 (Amounts expressed in thousands of Canadian dollars, unless otherwise noted) |
|
The Company use of fund from the 2024 financing is summarized below:
| Financing | Intended Use of Funds ($,000) | Actual Use of Proceeds | Variance and Impact on Business Objectives and Milestones |
|
June 2024 Financing:
• Issuance of 5,320,000 “flow-through” Common Shares for net proceeds of $4,565
|
• $2,500 for exploration on Eau Claire Project • $2,000 to $2,500 for exploration at Éléonore South |
Work commenced at Eau Claire at the end of Q2 2024 while drilling at Elenore South commenced in February 2025 | No variance. Planned exploration programs were completed. |
Exercise of share options and warrants
During the nine months ended September 30, 2025, 156,000 shares were issued as a result of share options being exercised with a weighted average exercise price of $0.55 for gross proceeds of $85. An amount of $42 attributed to these share options was transferred from the equity reserves and recorded against share capital. There was no exercise of share purchase warrants.
As at September 30, 2025, the share options outstanding were as follows:
| Share options outstanding | Share options exercisable | |||||||||||||||||||||||
| Exercise price ($/option) |
Number of shares | Weighted average exercise price ($/option) | Weighted average remaining life (years) | Number of shares | Weighted average exercise price ($/option) | Weighted average remaining life (years) | ||||||||||||||||||
| C$0.53 – C$1.00 | 3,749,500 | 0.83 | 2.03 | 3,659,500 | 0.84 | 1.98 | ||||||||||||||||||
| C$1.00 – C$1.85 | 2,806,659 | 1.09 | 1.35 | 2,806,659 | 1.09 | 1.35 | ||||||||||||||||||
| C$2.05 – C$3.91 | 1,553,345 | 2.08 | 0.07 | 1,553,345 | 2.08 | 0.07 | ||||||||||||||||||
| 8,109,504 | 1.17 | 1.42 | 8,019,504 | 1.17 | 1.39 | |||||||||||||||||||
The number of share purchase warrants outstanding at September 30, 2025 was as follows:
| Warrants outstanding |
Weighted average exercise price (C$/share) |
|||||||
| Outstanding, December 31, 2023 | 7,461,450 | $ | 1.20 | |||||
| Expired | (7,461,450 | ) | 1.20 | |||||
| Outstanding, December 31, 2024 | — | — | ||||||
| Issued | 7,324,808 | 0.84 | ||||||
| Outstanding, September 30, 2025 | 7,324,808 | $ | 0.84 | |||||
On January 9, 2025, the Company issued 590,000 DSU’s to directors and 1,142,500 RSU’s to officers, and employees. The DSU’s and RSU’s were issued in accordance with the Company’s LTI plan, with a grant-date fair value of $0.55 per unit, one third vesting annually on the anniversary and to be paid out as fully paid shares.
| Fury Gold Mines Limited Results of Operations for the Three and Nine Months Ended September 30, 2025 (Amounts expressed in thousands of Canadian dollars, unless otherwise noted) |
|
During the three and nine months ended September 30, 2025, the Company granted nil and 140,000 share options, respectively, (three and nine months ended September 30, 2024 – nil and 245,000, respectively), to certain UMS employees and consultants who provide defined on-going services to the Company, representative of employee service, as well as converted 282,470 options from QPM options during the nine months ended September 30, 2025.
The Company does not utilize off-balance sheet arrangements. Earn-in arrangements are not viewed as off-balance sheet arrangements, and there are no other commitments held by the Company at the balance sheet date.
As at November 13, 2025, there were 6,589,504 and 7,324,808 share options and warrants outstanding, respectively, with a weighted average exercise price of $0.97 and $0.84, respectively.
6.5 Capital structure
Authorized: Unlimited common shares without par value. Unlimited preferred shares – nil issued and outstanding.
Number of common shares issued and outstanding as at September 30, 2025: 171,731,046
Number of common shares issued and outstanding as at November 13, 2025: 189,143,299
Section 7: Financial risk summary
As at September 30, 2025, the Company’s financial instruments consist of cash, marketable securities, other investments, accounts receivable, deposits, accounts payable and accrued liabilities, and deferred government grants. The fair values of these financial instruments, other than the marketable securities and other investments, approximate their carrying values due to their short term to maturity. The Company’s marketable securities, representing investments held in publicly traded entities, were classified as level 1 of the fair value hierarchy and measured at fair value using their quoted market price at period end. The Company’s other investments, representing investments held in private entities, were classified as level 3 of the fair value hierarchy and measured at fair value based on unobservable inputs.
The Company’s financial instruments are exposed to certain financial risks, primarily liquidity risk, credit risk and market risk, including price risk. Details of the primary financial risks that the Company is exposed to are available in the notes to the Company’s condensed interim consolidated financial statements for the three and nine months ended September 30, 2025.
Section 8: Related party transactions and balances
8.1 UMS
The Company did not have any related party transactions as contemplated by securities policies dealing with protection of minority shareholders. The Company’s shared services provider arrangements are considered related party transactions for financial disclosure purposes. The Company owns 25% of the common shares of Universal Mineral Services Ltd (“UMS “) a shared services provider, with the other 75% owned by three other mineral exploration companies. UMS is a private company through which its four junior resource shareholders, including Fury Gold, share geological, financial, and transactional advisory services as well as administrative services on a full, cost recovery basis. This allows the Company to maintain a more efficient and cost-effective corporate overhead structure by hiring fewer full-time employees and engaging outside professional advisory firms less frequently. The agreement has an indefinite term and can be terminated for any participant upon providing 180 days’ notice.
| Fury Gold Mines Limited Results of Operations for the Three and Nine Months Ended September 30, 2025 (Amounts expressed in thousands of Canadian dollars, unless otherwise noted) |
|
All transactions with UMS have occurred in the normal course of operations, and all amounts owing to or from UMS are unsecured, non-interest bearing, and have no specific terms of settlement, unless otherwise noted.
| Three months ended September 30 | Nine months ended September 30 | |||||||||||||||
| 2025 | 2024 | 2025 | 2024 | |||||||||||||
| Exploration and evaluation costs | $ | 187 | $ | 50 | $ | 260 | $ | 160 | ||||||||
| General and administration | 48 | 52 | 180 | 244 | ||||||||||||
| Total transactions for the period | $ | 235 | $ | 102 | $ | 440 | $ | 404 | ||||||||
The outstanding balance owing at September 30, 2025, was $32 (December 31, 2024 – $90) which is included in accounts payable and accrued liabilities.
As part of the UMS arrangement, the Company is contractually obliged to pay certain rental expenses in respect of a ten-year office lease entered into by UMS on July 1, 2021. As at September 30, 2025, the Company expects to incur approximately $81 in respect of its share of future rental expense of UMS.
The Company issues share options to certain UMS employees, including key management personnel of the Company. The Company recognized a share-based compensation expense of $2 and $9 for the three and nine months ended September 30, 2025, in respect of share options issued to UMS employees (September 30, 2024 - $1 expense and $3 recovery) which is included within employee benefits and exploration and evaluation costs.
8.2 Key management personnel
Key management personnel include Fury Gold’s board of directors and certain executive officers of the Company, including the Chief Executive Officer and Chief Financial Officer.
The remuneration of the Company’s key management personnel was as follows:
| Three months ended September 30 | Nine months ended September 30 | |||||||||||||||
| 2025 | 2024 | 2025 | 2024 | |||||||||||||
| Short-term benefits provided to executives (a) | $ | 260 | $ | 209 | $ | 787 | $ | 642 | ||||||||
| Directors’ fees paid to non-executive directors | 60 | 39 | 191 | 123 | ||||||||||||
| Share-based payments | 151 | 160 | 443 | 704 | ||||||||||||
| Total | $ | 471 | $ | 408 | $ | 1,421 | $ | 1,469 | ||||||||
(a) Short-term employee benefits include salaries, bonuses payable within twelve months of the date of the consolidated statement of financial position, and other annual employee benefits.
Section 9: Critical accounting estimates and judgements
The preparation of financial statements in conformity with IFRS Accounting Standards as issued by the IASB requires management to select accounting policies and make estimates and judgments that may have a significant impact on the consolidated financial statements. Estimates are continuously evaluated and are based on management’s experience and expectations of future events that are believed to be reasonable under the circumstances. Actual outcomes may differ from these estimates.
In preparing the Company’s condensed interim consolidated financial statements for the three and nine months ended September 30, 2025, the Company applied the material accounting policy information and critical accounting estimates and judgements disclosed in notes 3 and 5 of its consolidated financial statements for the year ended December 31, 2024.
New accounting policy adopted in Q2 2025
During the second quarter of 2025, the Company received two government grants. As this is the first time the Company has received such assistance, a new accounting policy has been adopted. Government grants are recognized when there is reasonable assurance that the Company will comply with the conditions attached to them and that the grants will be received. Grants related to income are recognized in profit or loss on a systematic basis over the periods in which the related expenses are incurred.
| Fury Gold Mines Limited Results of Operations for the Three and Nine Months Ended September 30, 2025 (Amounts expressed in thousands of Canadian dollars, unless otherwise noted) |
|
Application of new and revised accounting standards
On August 14, 2023, the IASB issued “Lack of Exchangeability (Amendments to IAS 21)” with amendments to clarify the accounting when there is a lack of exchangeability. The amendments to IAS 21 are effective for annual periods beginning on or after January 1, 2025, with earlier application permitted. The adoption of the new standard did not have an impact on the financial statements of the Company.
New and amended standards not yet effective
Certain pronouncements have been issued by the IASB that are mandatory for accounting periods beginning after December 31, 2025. The Company has not early adopted any of these pronouncements, and they are not expected to have a significant impact in the foreseeable future on the Company's consolidated financial statements once adopted.
On May 30, 2024, the IASB issued “Amendments to the Classification and Measurement of Financial Instruments (Amendments to IFRS 9 and IFRS 7)” to address matters identified during the post-implementation review of the classification and measurement requirements in IFRS 9 Financial Instruments and related requirements in IFRS 7 Financial Instruments: Disclosures. The amendments are effective for reporting periods beginning on or after January 1, 2026. Early application is permitted. The Company is currently evaluating the impact of the new standard on its financial statements.
On April 9, 2024, the IASB issued a new standard, called IFRS 18 Presentation and Disclosure in Financial Statements, which applies to an annual reporting period beginning on or after January 1, 2027, with earlier application permitted. IFRS 18 includes requirements for all entities applying IFRS Accounting Standards as issued by the IASB for the presentation and disclosure of information in financial statements. The Company is currently evaluating the impact of the new standard on its financial statements.
Section 10: Controls and procedures
Internal control over financial reporting
Internal control over financial reporting (“ICFR”) includes those policies and procedures that:
| • | pertain to the maintenance of records that in reasonable detail accurately and fairly reflect the transactions and dispositions of the assets of the Company; |
| • | provide reasonable assurance that transactions are recorded as necessary to permit preparation of consolidated financial statements in accordance with IFRS Accounting Standards as issued by the IASB, and that receipts and expenditures of the Company are being made only in accordance with authorizations of management and directors of the Company; and |
| • | provide reasonable assurance regarding prevention or timely detection of unauthorized acquisition, use, or disposition of the Company assets, or incurring liabilities or other obligations that could have a material effect on the consolidated financial statements. |
It is management’s responsibility to establish and maintain adequate ICFR to provide reasonable assurance regarding the reliability of financial reporting and the preparation of consolidated financial statements for external purposes in accordance with IFRS Accounting Standards as issued by the IASB.
Management evaluated the design and operating effectiveness of the Company’s internal control over financial reporting based on the criteria established in the Internal Control - Integrated Framework (2013) issued by the Committee of Sponsoring Organizations of the Treadway Commission. Based on that evaluation, the CEO and CFO concluded that such ICFR were not effective at the reasonable assurance level as of December 31, 2024. During the second quarter of 2025 we successfully completed the testing necessary to conclude that the remedial controls are operating effectively, and the material weakness has been remediated.
Disclosure controls and procedures
Disclosure controls and procedures (“DC&P”) are designed to provide reasonable assurance that information required to be disclosed in reports filed with, or submitted to, securities regulatory authorities is recorded, processed, summarized and reported within the time periods specified under Canadian and U.S. securities laws. As of December 31, 2024, an evaluation was carried out under the supervision of, and with the participation of, the Company's management, including the CEO and CFO, of the effectiveness of the Company's DC&P, as defined in the applicable Canadian and U.S. securities laws. Based on that evaluation, the CEO and CFO concluded that such DC&P were not effective at the reasonable assurance level as of December 31, 2024, due to the material weakness in our internal control over financial reporting as described below. During the second quarter of 2025 we successfully completed the testing necessary to conclude that the remedial controls are operating effectively, and the material weakness has been remediated.
| Fury Gold Mines Limited Results of Operations for the Three and Nine Months Ended September 30, 2025 (Amounts expressed in thousands of Canadian dollars, unless otherwise noted) |
|
Material Weakness in Internal Control Over Financial Reporting
A material weakness is a deficiency, or combination of deficiencies, in internal control over financial reporting, such that there is a reasonable possibility that a material misstatement of the annual or interim financial statements will not be prevented or detected on a timely basis.
In the fourth quarter of 2024, management determined that there was a material weakness in the Company’s ICFR and DC&P related to the review of complex accounting transactions outside of the normal course of the Company’s operations. Specifically, we did not design and maintain controls to timely analyze and report dilution gains or losses resulting from changes in ownership in associates accounted for using the equity method.
This control deficiency resulted in a misstatement of gain on investments and investments in associates relating to the Company’s investment in Dolly Varden, specifically an understatement of dilution gains on the consolidated statement of (earnings) loss and comprehensive (income) loss, as well as an understatement of the investment in associate balance in the statement of financial position, which management corrected via revision as noted in section 5.3.
Changes in Internal Control over Financial Reporting
Other than the changes discussed above, there were no changes in the Company’s ICFR (as defined in Rules 13a-15(f) and 15d-15(f) under the Exchange Act) during the nine months ended September 30, 2025, that have materially affected, or are reasonably likely to materially affect, our internal control over financial reporting.
Additional disclosures pertaining to the Company’s management information circulars, material change reports, press releases, and other information are available on SEDAR+ at www.sedarplus.com.
On behalf of the Board of Directors,
“Forrester A. Clark”
Forrester A. Clark
Chief Executive Officer
November 13, 2025
|
Fury Gold Mines Limited Results of Operations for the Three and Nine Months Ended September 30, 2025 (Amounts expressed in thousands of Canadian dollars, unless otherwise noted) |
30 |
Exhibit 99.3
Form 52-109F2
Certification of Interim Filings
Full Certificate
I, Forrester A. Clark, Chief Executive Officer of Fury Gold Mines Limited., certify the following:
| 1. | Review: I have reviewed the interim financial report and interim MD&A (together, the “interim filings”) of Fury Gold Mines Limited (the “issuer”) for the interim period ended September 30, 2025. |
| 2. | No misrepresentations: Based on my knowledge, having exercised reasonable diligence, the interim filings do not contain any untrue statement of a material fact or omit to state a material fact required to be stated or that is necessary to make a statement not misleading in light of the circumstances under which it was made, with respect to the period covered by the interim filings. |
| 3. | Fair presentation: Based on my knowledge, having exercised reasonable diligence, the interim financial report together with the other financial information included in the interim filings fairly present in all material respects the financial condition, financial performance and cash flows of the issuer, as of the date of and for the periods presented in the interim filings. |
| 4. | Responsibility: The issuer’s other certifying officer(s) and I are responsible for establishing and maintaining disclosure controls and procedures (DC&P) and internal control over financial reporting (ICFR), as those terms are defined in National Instrument 52-109 Certification of Disclosure in Issuers’ Annual and Interim Filings, for the issuer. |
| 5. | Design: Subject to the limitations, if any, described in paragraphs 5.2 and 5.3, the issuer’s other certifying officer(s) and I have, as at the end of the period covered by the interim filings |
| (a) | designed DC&P, or caused it to be designed under our supervision, to provide reasonable assurance that |
| (i) | material information relating to the issuer is made known to us by others, particularly during the period in which the interim filings are being prepared; and |
| (ii) | information required to be disclosed by the issuer in its annual filings, interim filings or other reports filed or submitted by it under securities legislation is recorded, processed, summarized and reported within the time periods specified in securities legislation; and |
| (b) | designed ICFR, or caused it to be designed under our supervision, to provide reasonable assurance regarding the reliability of financial reporting and the preparation of financial statements for external purposes in accordance with the issuer’s GAAP. |
| 5.1 | Control framework: The control framework the issuer’s other certifying officer(s) and I used to design the issuer’s ICFR is based on Internal Control – Integrated Framework (2013) published by the Committee of Sponsoring Organizations of the Treadway Commission. |
| 5.2 | ICFR – material weakness relating to design: NA |
| 5.3 | Limitation on scope of design: NA |
| 6. | Reporting changes in ICFR: The issuer has disclosed in its interim MD&A any change in the issuer’s ICFR that occurred during the period beginning on July 1, 2025 and ended on September 30, 2025 that has materially affected, or is reasonably likely to materially affect, the issuer’s ICFR. |
Date: November 13, 2025
Signed “Forrester A. Clark”
_______________________
Forrester A. Clark
Chief Executive Officer
Exhibit 99.4
Form 52-109F2
Certification of Interim Filings
Full Certificate
I, Phil van Staden, Chief Financial Officer of Fury Gold Mines Limited, certify the following:
| 1. | Review: I have reviewed the interim financial report and interim MD&A (together, the “interim filings”) of Fury Gold Mines Limited (the “issuer”) for the interim period ended September 30, 2025. |
| 2. | No misrepresentations: Based on my knowledge, having exercised reasonable diligence, the interim filings do not contain any untrue statement of a material fact or omit to state a material fact required to be stated or that is necessary to make a statement not misleading in light of the circumstances under which it was made, with respect to the period covered by the interim filings. |
| 3. | Fair presentation: Based on my knowledge, having exercised reasonable diligence, the interim financial report together with the other financial information included in the interim filings fairly present in all material respects the financial condition, financial performance and cash flows of the issuer, as of the date of and for the periods presented in the interim filings. |
| 4. | Responsibility: The issuer’s other certifying officer(s) and I are responsible for establishing and maintaining disclosure controls and procedures (DC&P) and internal control over financial reporting (ICFR), as those terms are defined in National Instrument 52-109 Certification of Disclosure in Issuers’ Annual and Interim Filings, for the issuer. |
| 5. | Design: Subject to the limitations, if any, described in paragraphs 5.2 and 5.3, the issuer’s other certifying officer(s) and I have, as at the end of the period covered by the interim filings |
| (a) | designed DC&P, or caused it to be designed under our supervision, to provide reasonable assurance that |
| (i) | material information relating to the issuer is made known to us by others, particularly during the period in which the interim filings are being prepared; and |
| (ii) | information required to be disclosed by the issuer in its annual filings, interim filings or other reports filed or submitted by it under securities legislation is recorded, processed, summarized and reported within the time periods specified in securities legislation; and |
| (b) | designed ICFR, or caused it to be designed under our supervision, to provide reasonable assurance regarding the reliability of financial reporting and the preparation of financial statements for external purposes in accordance with the issuer’s GAAP. |
| 5.1 | Control framework: The control framework the issuer’s other certifying officer(s) and I used to design the issuer’s ICFR is based on Internal Control – Integrated Framework (2013) published by the Committee of Sponsoring Organizations of the Treadway Commission. |
| 5.2 | ICFR – material weakness relating to design: NA |
| 5.3 | Limitation on scope of design: NA |
| 6. | Reporting changes in ICFR: The issuer has disclosed in its interim MD&A any change in the issuer’s ICFR that occurred during the period beginning on July 1, 2025 and ended on September 30, 2025 that has materially affected, or is reasonably likely to materially affect, the issuer’s ICFR. |
Date: November 13, 2025
Signed “Phil van Staden”
_______________________
Phil van Staden
Chief Financial Officer