UNITED STATES
SECURITIES AND EXCHANGE COMMISSION
Washington, D.C. 20549
FORM 6-K
REPORT OF FOREIGN PRIVATE ISSUER PURSUANT TO RULE 13a-16 OR 15d-16 UNDER THE SECURITIES EXCHANGE ACT OF 1934
For the month of November 2025
Commission File Number: 001-35165
BRAINSWAY LTD.
(Translation of registrant's name into English)
16 Hartum Street RAD Tower, 14th Floor
Har HaHotzvim
Jerusalem, 9777516, Israel
(+972-2) 582-4030
(Address and telephone number of Registrant’s principal executive office)
Indicate by check mark whether the registrant files or will file annual reports under cover of Form 20-F or Form 40-F.
Form 20-F [ X ] Form 40-F [ ]
This Form 6-K is incorporated by reference into the Company's Registration Statement on Form S-8 filed with the Securities and Exchange Commission on April 22, 2019 (Registration No. 333- 230979) and the Company's Registration Statements on Form F-3 filed with the Securities and Exchange Commission on July 22, 2024 (Registration No. 333-280934) and on April 22, 2025 (Registration No. 333-286672).
EXHIBIT INDEX
| Exhibit | Title | |
| 99.1 | Investor Deck |
SIGNATURES
Pursuant to the requirements of the Securities Exchange Act of 1934, the registrant has duly caused this report to be signed on its behalf by the undersigned, thereunto duly authorized.
| BRAINSWAY LTD. | ||
| (Registrant) | ||
| Date: November 12, 2025 | /s/ Hadar Levy | |
| Hadar Levy | ||
| Chief Executive Officer | ||
Exhibit 99.1


Advanced Noninvasive Neurostimulation Treatments for Mental Health Disorders Investor Deck November 2025 Nasdaq/TASE: BWAY Investor Deck | November 2025 Safe Harbor and Non - GAAP/IFRS Financial Measures 2 Investor Deck | November 2025 This presentation does not constitute a n offer o r invitation to sell o r issue, o r any solicitation of a n offer to subscribe for o r acquire, any securities of th e Company, nor to participate i n any investment . This presentation shall not constitute advertising o r b e construed as commercial o r promotional i n nature . No representation o r warranty is made as to the accuracy o r completeness o f this presentation . You must make your own investigation and assessment of the matters contained herein . I n particular, n o responsibility is assumed as to th e achievement o r reasonableness of any forecasts, estimates, o r statements as to prospects contained o r referred to i n this presentation . This presentation contains information that includes or is based on forward - looking statements within the meaning of the federal securities laws . Such statements are not guarantees of future performance . They reflect current expectations and ar e subject to risks and uncertainties that could cause actual results to differ materially from those expressed o r implied . Factors include, bu t ar e not limited to : continued business impact from COVID - 19 ; adverse economic conditions ; changes i n demand and pricing ; manufacturing difficulties o r delays ; legislative and regulatory actions ; changes in reimbursement ; third - party payor decisions ; product liability claims ; U . S . healthcare reform ; financial market conditions ; competitive dynamics ; failure to achieve sufficient market adoption ; regulatory actions o r delays ; and our ability to realize expected operational and manufacturing efficiencies . Additional information about these and other risks is contained i n our filings with the U . S . Securities and Exchange Commission . If one o r more o f these factors materialize, o r i f underlying assumptions prove incorrect, actual results may differ materially . This presentation also includes market and industry data from government and private publications and internal estimates and projections based o n a number of assumptions . W e undertake n o obligation to update any forward - looking statement as a result of new information, futureevents, o r otherwise . Certain non - GAAP/IFRS financial measures are included in this presentation . These measures are presented to complement the financial information prepared in accordance with IFRS because management believes they are useful to investors . For example, Adjusted EBITDA, a non - IFRS measure, is widely used by investors and securities analysts to evaluate a company’s operating performance without regard to one - time items (such as restructuring and litigation expenses) that can vary substantially from company to company . Management also uses Adjusted EBITDA with IFRS measures for planning purposes, including preparation of annual operating budgets, as a measure of operating performance . These non - GAAP/IFRS measures should be considered only as supplementsto, andnot superiorto, financial measures prepared in accordancewith IFRS . Othercompanies may calculate similarly titled non - GAAP/IFRS measures differently than the Company .


BrainsWay: Global Leader in Transcranial Magnetic Stimulation (TMS) September 16, 2025: FDA Clearance for Accelerated Deep TMS Protocol for MDD Established reimbursement 2013 - Major Depressive Disorder (MDD) 2018 - Obsessive - Compulsive Disorder (OCD) 2020 - Smoking Addiction 2021 - Anxious Depression Installed base of >1,600 systems > 7M individual treatment 4 FDA - cleared indications 3 Investor Deck | November 2025 Q3 2025 Highlights Strong Growth & Profitability • Revenue: $13.5 M (+29% YoY) • Gross Margin: 75% • Adjusted EBITDA *: $2.0 M (+81%) • Net Profit: $1.6 M (+137%) • Cash: ~$71 M as of Sept 30, 2025 Momentum Across the Business • Remaining Performance Obligations: $65 M (up 37% YoY) • Shipments: 90 Deep TMS systems (+43%), installed base >1,600 • ~70% of new engagements as multi - year leases • FDA Clearance: Accelerated protocol for Major Depressive Disorder (MDD) • NIH Grant: $2.5 M for Stanford/PAVIR study on Deep TMS for Alcohol Use Disorder • Strategic Investments: 4 minority stakes “We’re driving record adoption and sustained profitability, building long - term value through clinical innovation, strategic investments, and durable recurring revenue.” * Adjusted EBITDA is a non - IFRS measure. See slide 33 for operating income results, the closest IFRS measure, and the reconciliation table in the Company’s earnings release.
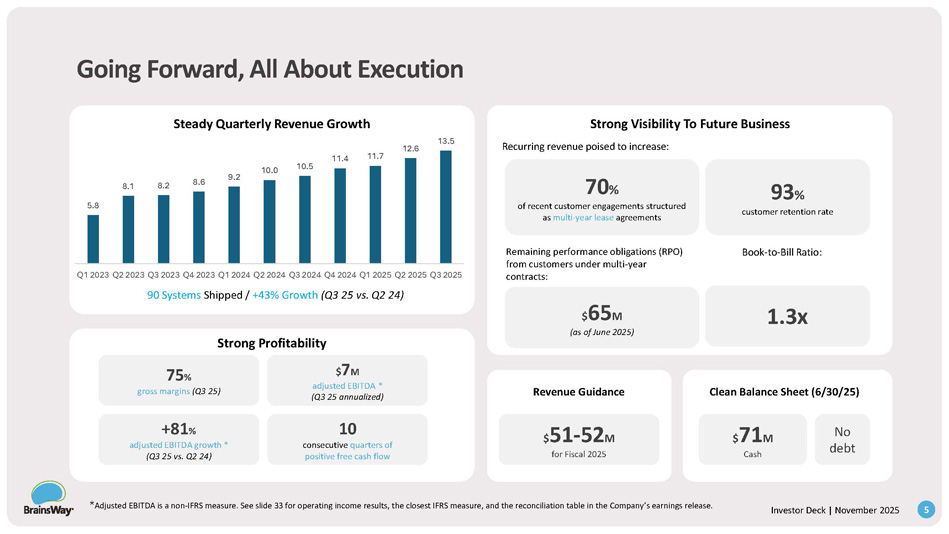
4 Investor Deck | November 2025 Going Forward, All About Execution Steady Quarterly Revenue Growth 90 Systems Shipped / +43% Growth (Q3 25 vs. Q2 24) Strong Profitability Revenue Guidance Clean Balance Sheet (6/30/25) 75 % gross margins (Q3 25) $ 7 M adjusted EBITDA * (Q3 25 annualized) +81 % adjusted EBITDA growth * (Q3 25 vs. Q2 24) 10 consecutive quarters of positive free cash flow 70 % of recent customer engagements structured as multi - year lease agreements 93 % customer retention rate Strong Visibility To Future Business Recurring revenue poised to increase: Remaining performance obligations (RPO) from customers under multi - year contracts: $ 65 M (as of June 2025) $ 51 - 52 M for Fiscal 2025 Book - to - Bill Ratio: 1.3x $ 71 M Cash No debt 5.8 * Adjusted EBITDA is a non - IFRS measure. See slide 33 for operating income results, the closest IFRS measure, and the reconciliation table in the Company’s earnings release. 5 Investor Deck | November 2025 8.1 8.2 8.6 9.2 10.0 10.5 11.4 11.7 12.6 13.5 Q1 2023 Q2 2023 Q3 2023 Q4 2023 Q1 2024 Q2 2024 Q3 2024 Q4 2024 Q1 2025 Q2 2025 Q3 2025 The ARR Model 4.6 5.5 5.6 6 6.1 6.7 6.8 7.4 7.2 8.1 8.8 2 2.3 2.7 3 3 3.3 3.7 4 4.3 4.5 4.7 - 2.9 - 0.6 0.3 0.8 0.7 1.2 1.1 1.4 1.3 1.5 2.0 Q1 - 2023 Q2 - 2023 Q3 - 2023 Q4 - 2023 Q1 - 2024 Q2 - 2024 Q3 - 2024 Q4 - 2024 Q1 - 2025 Q2 - 2025 Q3 - 2025 Sale Lease Adj.

EBITDA * ——— — Business Model - Leasing 12.6 11.4 10.5 10 9.1 9.0 8.3 7.8 6.6 $13M Recurring $17.4M Recurring * Adjusted EBITDA is a non - IFRS measure. See slide 33 for operating income results, the closest IFRS measure, and the reconciliation table in the Company’s earnings release.

6 Investor Deck | November 2025 +34 % YoY growth Recurring revenue growth (+34 % YoY ) Exceeds Non - Recurring Revenue growth (+23 % YoY ) 11.5 13.5 Focused on ARR and Operating Leverage Recurring Revenue Growth Exceeds Non - Recurring Revenue Growth % Growth 2025 (est.) $18.4 2024 $14.0 2023 $10.0 $ Millions Recurring Revenue +31% +25% $33.7 $27.0 $21.7 Non - Recurring Revenue Revenue Mix Shift Towards ARR - $10 $90 $80 $70 $60 $50 $40 $30 $20 $10 $0 2023 2024 2025 2026 Booking Revenue Opex EBITDA Strong Operating Leverage * Adjusted EBITDA is a non - IFRS measure. See slide 33 for operating income results, the closest IFRS measure, and the reconciliation table in the Company’s earnings release. 7 Investor Deck | November 2025 Recent revenue growth: >25% Targeted future operating expense growth: <15% 2023 Actual vs. 2025 Guidance: Revenue increased by $25M Operating expenses increased by only <$8M Future ($ in Millions)

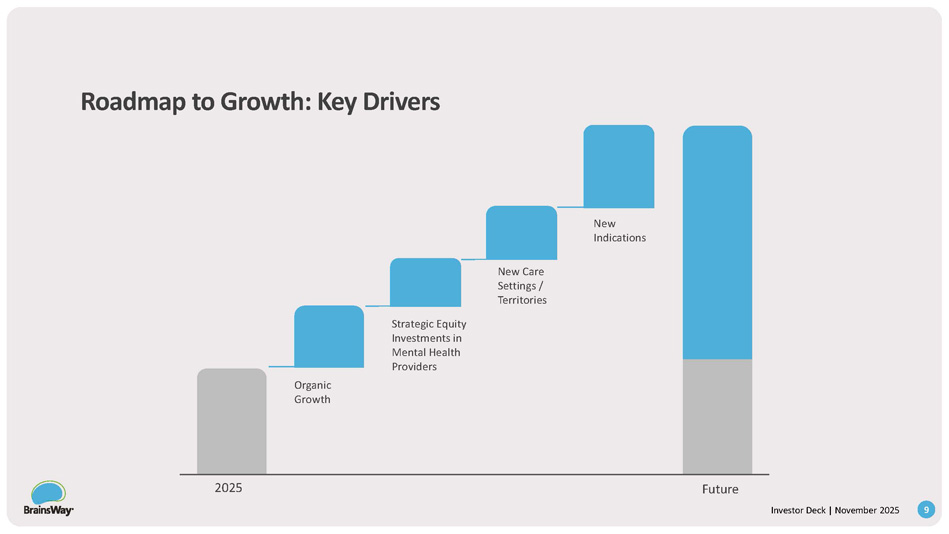
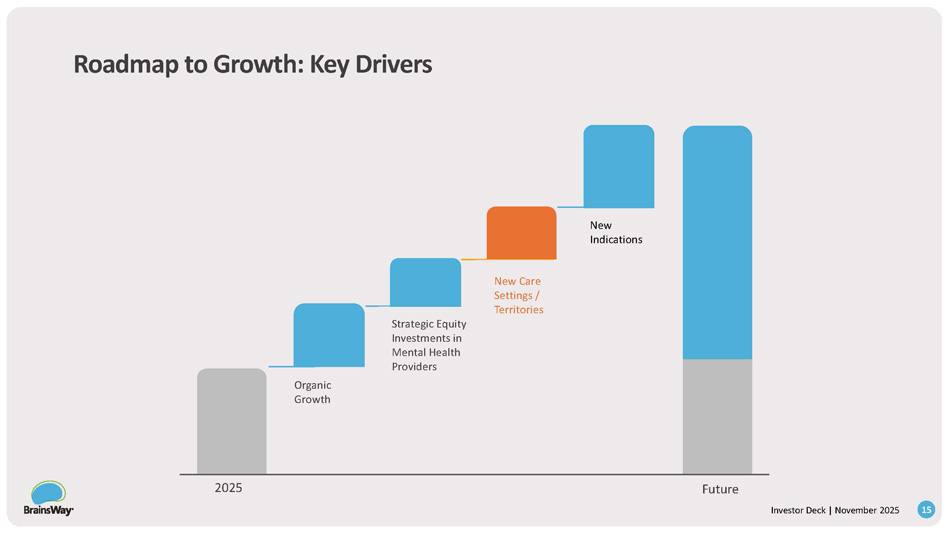
We transformed to a winning business model ——— — Business Model - Leasing From: One time sale To: A high - margin ARR model 8 Investor Deck | November 2025 Roadmap to Growth: Key Drivers New Indications New Care Settings / Territories Strategic Equity Investments in Mental Health Providers Organic Growth 2025 Future 9 Investor Deck | November 2025

Provides 4 - 5 years contracts Built for today’s market: solves high - rate CapEx hesitation and staffing constraints Removes barriers, boosts adoption Reduces upfront capital commitment for physicians Clinics pay only when they treat: faster adoption & utilization ~$250 – 300K ~$900K – $1.0M/yr Psychiatrist salaries potential growth Fix Lease Model & Pay Per Use Driving $65M RPO – U.S. Only 10 Investor Deck | November 2025 Roadmap to Growth: Key Drivers New Indications New Care Settings / Territories Strategic Equity Investments in Mental Health Providers Organic Growth 2025 Future 11 Investor Deck | November 2025


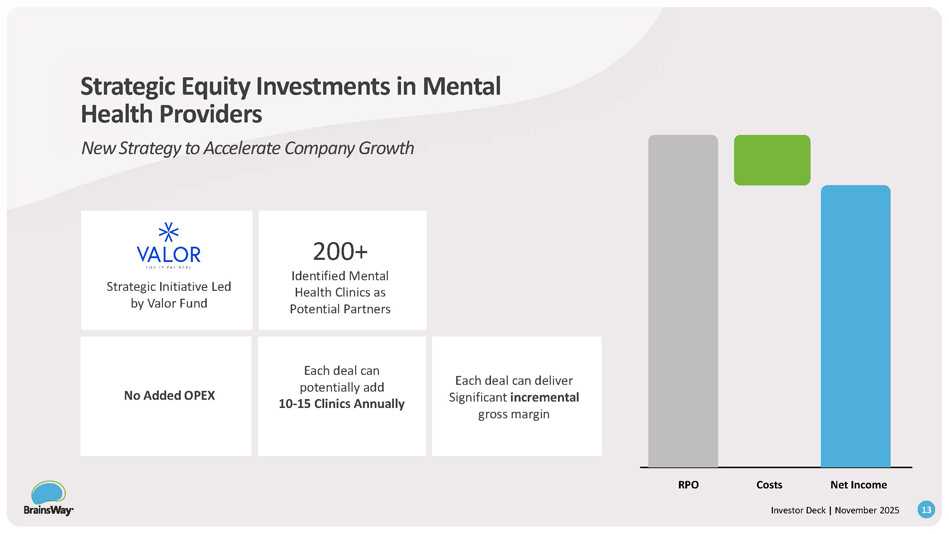
Strategic Partnership With Valor Equity Partners 12 Investor Deck | November 2025 Valor, a leading $20B equity firm behind market leaders, is now BrainsWay’s largest investor and an active partner in our scale strategy RPO Costs Net Income 200+ Identified Mental Health Clinics as Potential Partners Strategic Initiative Led by Valor Fund Each deal can deliver Significant incremental gross margin Each deal can potentially add 10 - 15 Clinics Annually No Added OPEX Strategic Equity Investments in Mental Health Providers New Strategy to Accelerate Company Growth 13 Investor Deck | November 2025
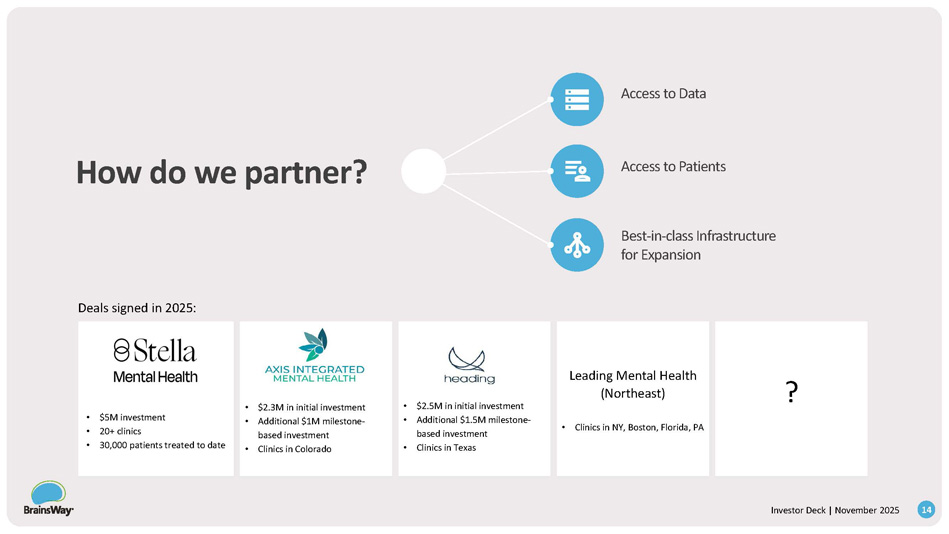
• $5M investment • 20+ clinics • 30,000 patients treated to date • $2.3M in initial investment • Additional $1M milestone - based investment • Clinics in Colorado • $2.5M in initial investment • Additional $1.5M milestone - based investment • Clinics in Texas Leading Mental Health (Northeast) • Clinics in NY, Boston, Florida, PA ? How do we partner? Deals signed in 2025 : 14 Investor Deck | November 2025 Access to Data Access to Patients Best - in - class Infrastructure for Expansion Roadmap to Growth: Key Drivers New Indications New Care Settings / Territories Strategic Equity Investments in Mental Health Providers Organic Growth 2025 Future 15 Investor Deck | November 2025

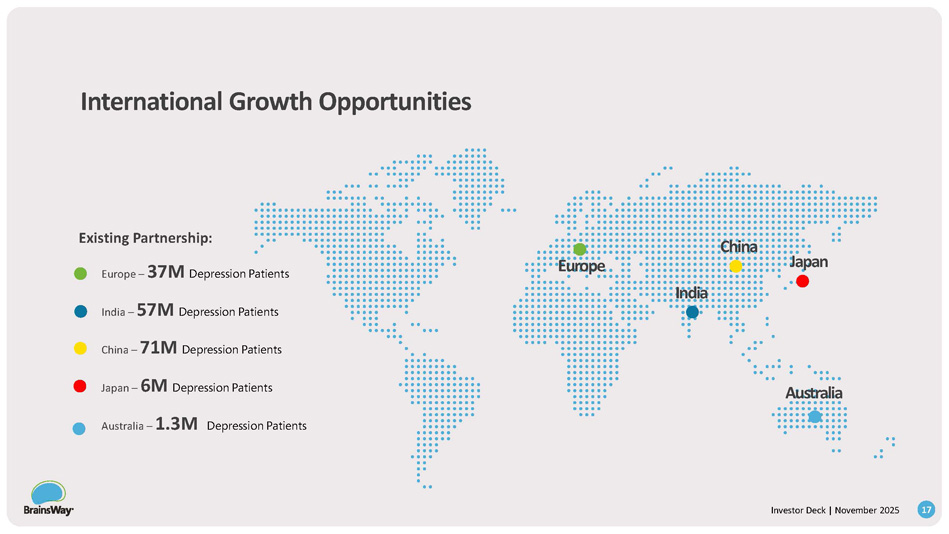
03 02 01 Explore extending deep TMS treatments with At - home* therapy - start in clinic, continue at home 04 Bigger reach: taps ~50% telemedicine activity, clinic - prescribed home device grows TAM without extra marketing and feeds in - clinic use. Patients can go directly to their primary care physician (PCP) Structured deal: $5M convertible debt; milestone tranches; call option to acquire Clean P&L: no consolidation, no added OPEX Extending to Home - Use Neuromodulation August 21, 2025: Announced Structured M&A Option *Neurolief’s at - home therapy is not yet FDA - cleared I I nv v es s t t or r Dec c k k | | S N e o p v tembe r r 2025 16 Europe – 37M Depression Patients India – 57M Depression Patients China – 71M Depression Patients Japan – 6M Depression Patients Australia – 1.3M Depression Patients Existing Partnership: Europ e India China Australia Japan International Growth Opportunities 17 Investor Deck | November 2025
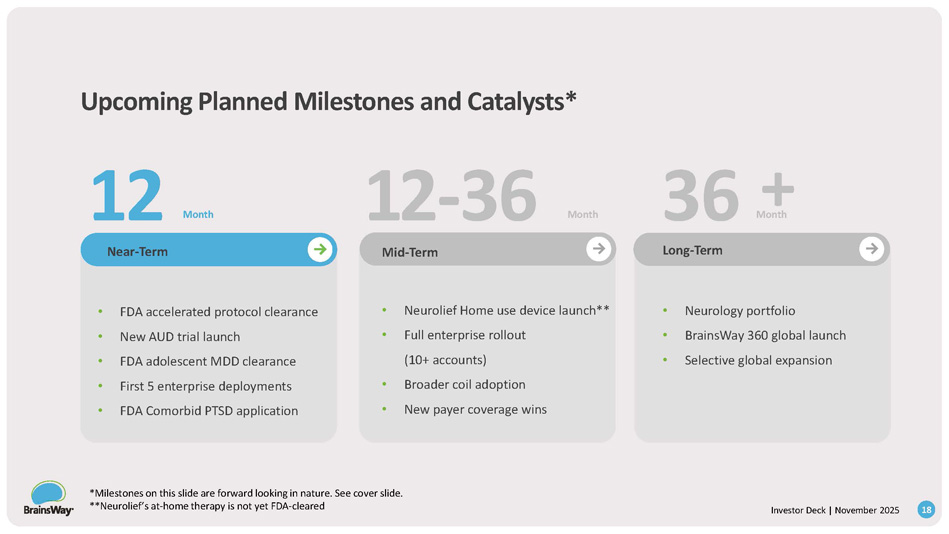
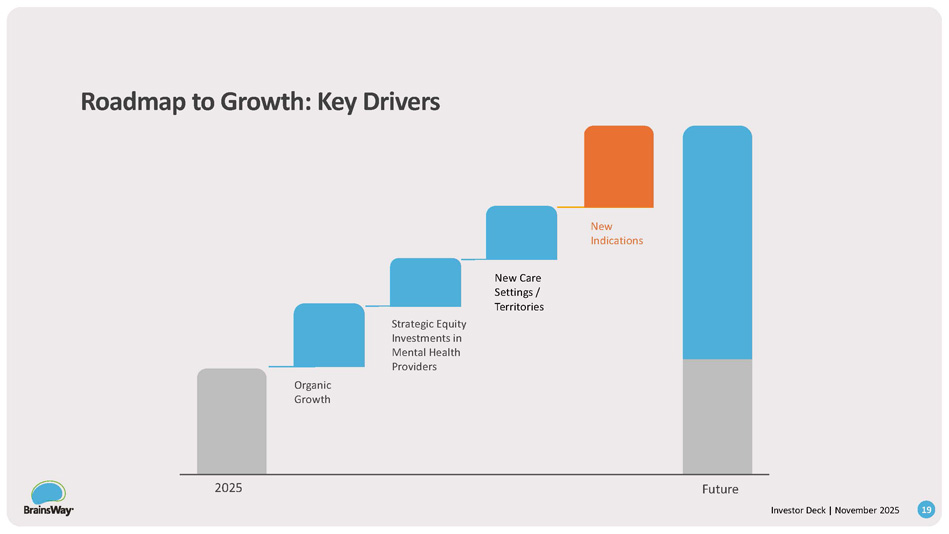
Investor Deck | November 2025 Upcoming Planned Milestones and Catalysts* • Neurolief Home use device launch** • Full enterprise rollout (10+ accounts) • Broader coil adoption • New payer coverage wins Long - Term • Neurology portfolio • BrainsWay 360 global launch • Selective global expansion Near - Term Mid - Term • FDA accelerated protocol clearance • New AUD trial launch • FDA adolescent MDD clearance • First 5 enterprise deployments • FDA Comorbid PTSD application Month 12 12 - 36 36 Month M + o n th 18 *Milestones on this slide are forward looking in nature. See cover slide. **Neurolief’s at - home therapy is not yet FDA - cleared Roadmap to Growth: Key Drivers New Indications New Care Settings / Territories Strategic Equity Investments in Mental Health Providers Organic Growth 2025 Future 19 Investor Deck | November 2025
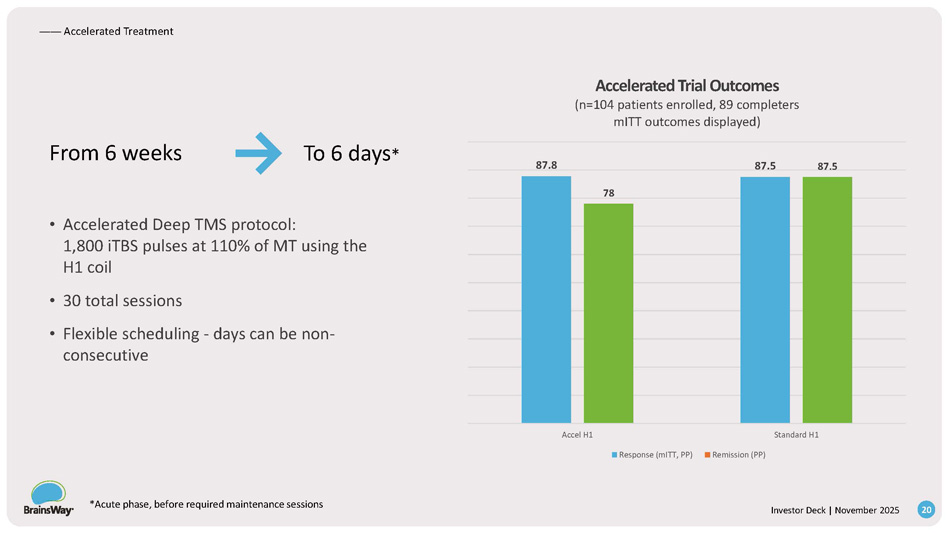
From 6 weeks To 6 days * • Accelerated Deep TMS protocol: 1,800 iTBS pulses at 110% of MT using the H1 coil • 30 total sessions • Flexible scheduling - days can be non - consecutive 78 87.8 87.5 87.5 Accel H1 Standard H1 Accelerated Trial Outcomes (n=104 patients enrolled, 89 completers mITT outcomes displayed) Response (mITT, PP) Remission (PP) —— Accelerated Treatment *Acute phase, before required maintenance sessions 20 Investor Deck | November 2025 — — Indications Smoking Addiction 28.3 M U.S Adult Smokers $ 2B /year nearly spent by smokers on Quitting 85 % of them don't succeed With Brainsway: ~ 67 % of 6 - week completers remained non - smokers for +3 months ~ 1 o u t of 3 patients quit for 4 weeks 1 st and Only TMS Addiction Clearance 21 Investor Deck | November 2025

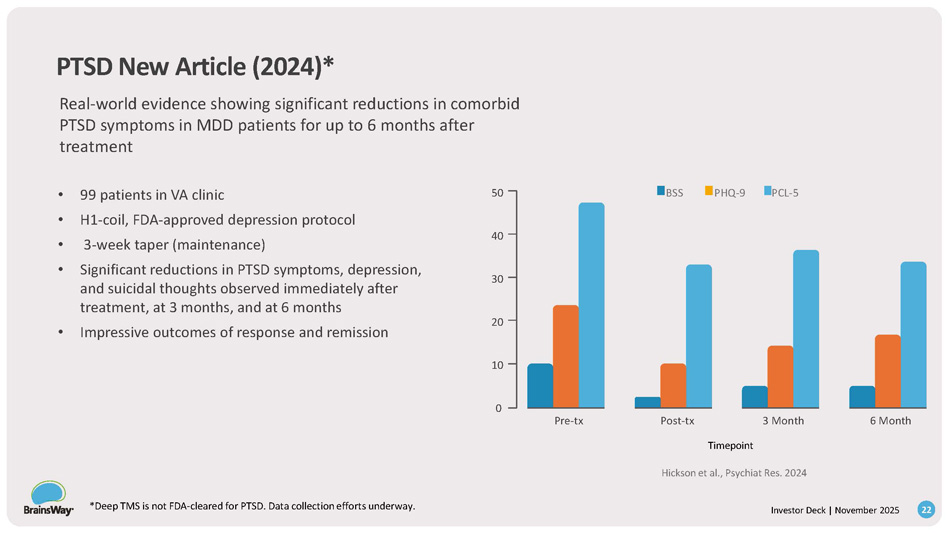
Pre - tx Post - tx 3 Month 6 Month 20 10 0 40 30 50 BSS *Deep TMS is not FDA - cleared for PTSD. Data collection efforts underway. 22 Investor Deck | November 2025 PHQ - 9 PCL - 5 PTSD New Article (2024)* Real - world evidence showing significant reductions in comorbid PTSD symptoms in MDD patients for up to 6 months after treatment • 99 patients in VA clinic • H1 - coil, FDA - approved depression protocol • 3 - week taper (maintenance) • Significant reductions in PTSD symptoms, depression, and suicidal thoughts observed immediately after treatment, at 3 months, and at 6 months • Impressive outcomes of response and remission Timepoint Hickson et al., Psychiat Res.

2024 Investor Deck | November 2025 Upside Potential: Deep TMS 360 Research* Overview • Potential Novel solution being explored for shorter treatment , better efficacy , and possible new indications • Enables activation of greater numbers of neurons in the brain than currently available forms of TMS May be uniquely suited for older adults with neurodegenerative conditions and reduced neuroplasticity Today’s TMS: Single coil • Neurons aligned parallel to coil’s electrical field are more likely to be stimulated • As a result, only a fraction of neurons in the targeted brain region are actually impacted • Deep TMS 360 : Rotational Field system has 2 perpendicular orthogonal TMS coils • 2 coils are operated with short time lag (milliseconds) in order to induce a circularly rotating electrical field • Results in uniform stimulation of neurons oriented across a wide range of directions 23 Deep TMS 360 Clinical Plans • Launched study on post - stroke rehabilitation in 1H 2024 • Launching alcohol use disorder trial in Q3 2025 • Plans to initiate feasibility studies on various neurology indications (dementia, Parkinsons, Alzheimer's) in [2H 2025] *Deep TMS 360 is being investigated for clinical trial research and is not commercially available. This slide is forward - looking only.

Expanding TAM in a Massive Market Major Depressive Disorder (MDD) & Anxious Depression, OCD, Smoking Addiction Alcohol Use Disorder (AUD) Alzheimer Post - Stroke Future Pipeline Indications U.S Patient population FDA cleared indications 49 M 29 M 8 M 24 Investor Deck | November 2025 Note: Other than MDD/Anxious Depression, OCD, and Smoking Addiction, the above indications are currently investigational, not available in the U.S, and not cleared by the FDA.
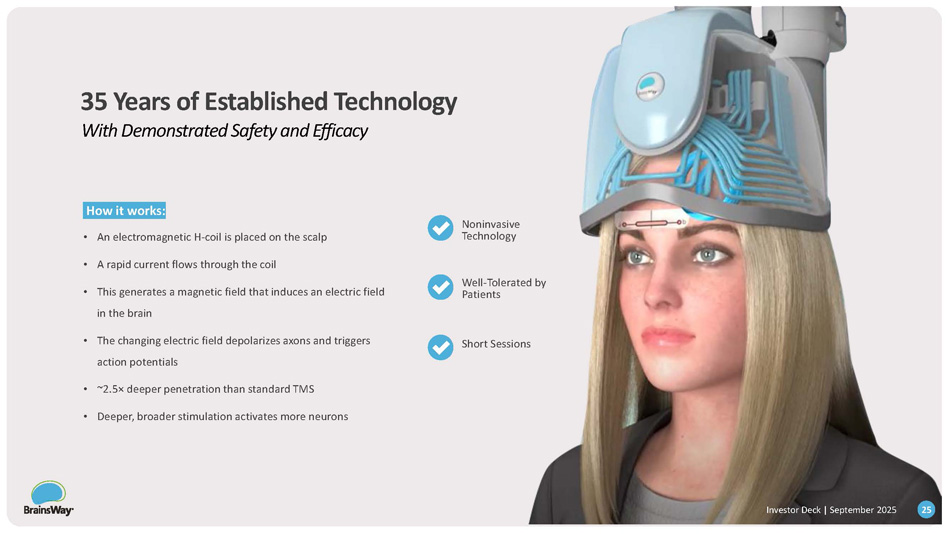
How it works: • An electromagnetic H - coil is placed on the scalp • A rapid current flows through the coil • This generates a magnetic field that induces an electric field in the brain • The changing electric field depolarizes axons and triggers action potentials • ~2.5 п deeper penetration than standard TMS • Deeper, broader stimulation activates more neurons Noninvasive Technology Well - Tolerated by Patients Short Sessions 35 Years of Established Technology With Demonstrated Safety and Efficacy Investor Deck | November 2025 Investor Deck | September 2025 25 Investor Deck | November 2025 All competitors in the commercial depression space use variations of the traditional “figure - 8” TMS coil design Technological distinctions do not necessarily correlate with clinical outcomes BrainsWay Deep TMS Traditional TMS 1.8 to 2.0 cm 9,10 Extensive - 17 cm 10 More Reliable Targeting Deep and Broad RCT Data in Multiple Indications 0.7cm to 1.0 cm 9 Limited - 3 cm 10 Prone to Targeting Errors Superficial and Focal RCT Data Limited to Depression Features Depth Brain Volume Stimulated Therapy Delivery Structures Treated Technology Platform BrainsWay Deep TMS vs. Traditional TMS Clear, compelling technological advantage 26

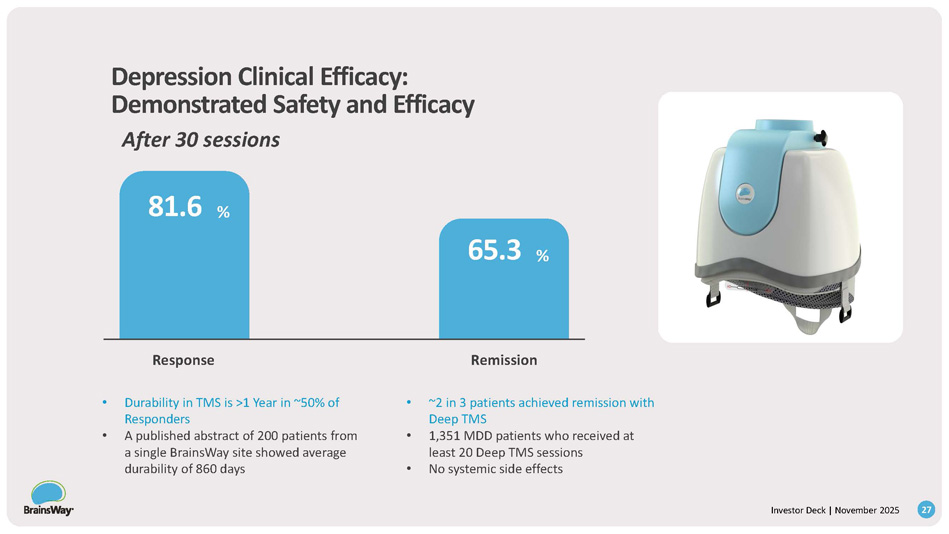
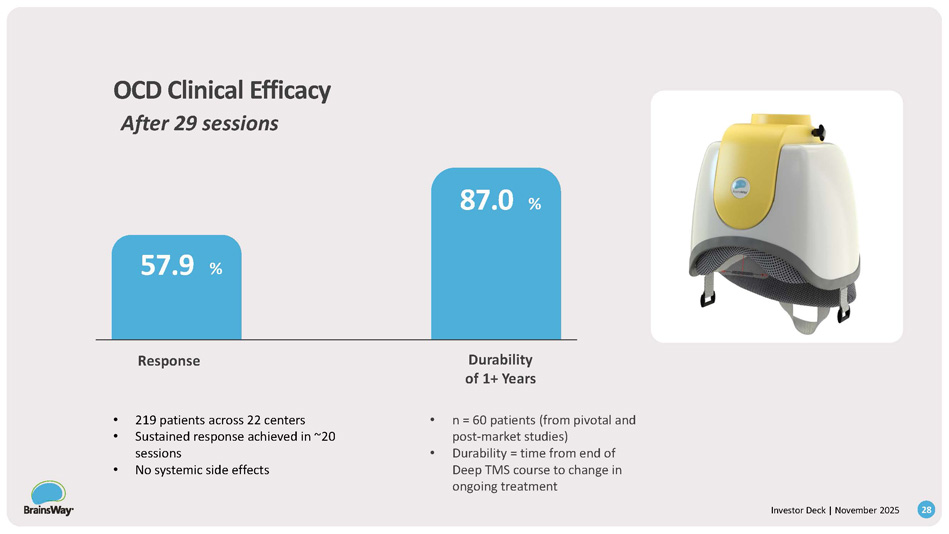
Depression Clinical Efficacy: Demonstrated Safety and Efficacy After 30 sessions 81.6 % Remission 65.3 % Response • Durability in TMS is >1 Year in ~50% of Responders • A published abstract of 200 patients from a single BrainsWay site showed average durability of 860 days • ~2 in 3 patients achieved remission with Deep TMS • 1,351 MDD patients who received at least 20 Deep TMS sessions • No systemic side effects 27 Investor Deck | November 2025 OCD Clinical Efficacy After 29 sessions 57.9 % Durability of 1+ Years 87.0 % Response • 219 patients across 22 centers • Sustained response achieved in ~20 sessions • No systemic side effects • n = 60 patients (from pivotal and post - market studies) • Durability = time from end of Deep TMS course to change in ongoing treatment 28 Investor Deck | November 2025
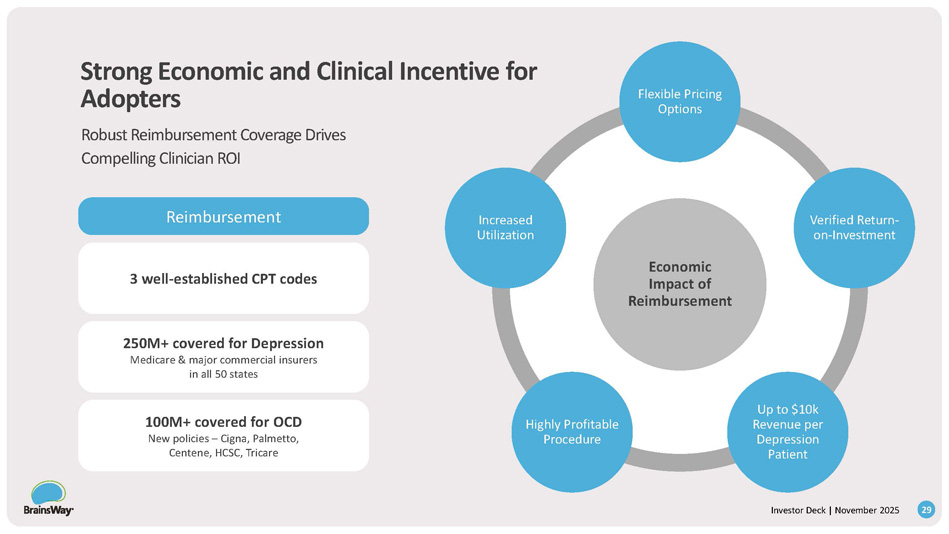
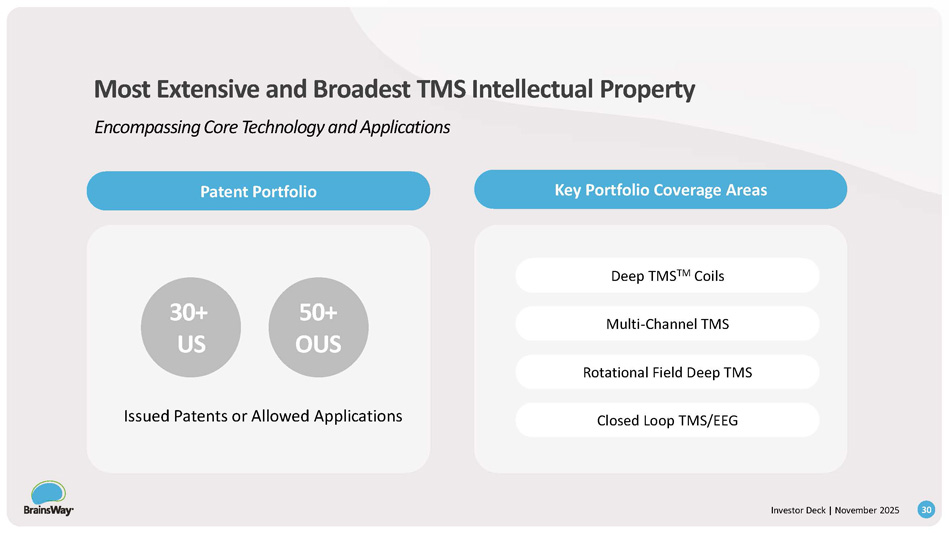
Economic Impact of Reimbursement 29 Investor Deck | November 2025 Flexible Pricing Options Verified Return - on - Investment Up to $10k Revenue per Depression Patient Highly Profitable Procedure Increased Utilization 3 well - established CPT codes Reimbursement 250M+ covered for Depression Medicare & major commercial insurers in all 50 states 100M+ covered for OCD New policies – Cigna, Palmetto, Centene, HCSC, Tricare Strong Economic and Clinical Incentive for Adopters Robust Reimbursement Coverage Drives Compelling Clinician ROI 30+ US 50+ OUS Deep TMS TM Coils Multi - Channel TMS Rotational Field Deep TMS Closed Loop TMS/EEG Issued Patents or Allowed Applications Most Extensive and Broadest TMS Intellectual Property Encompassing Core Technology and Applications Key Portfolio Coverage Areas Patent Portfolio 30 Investor Deck | November 2025
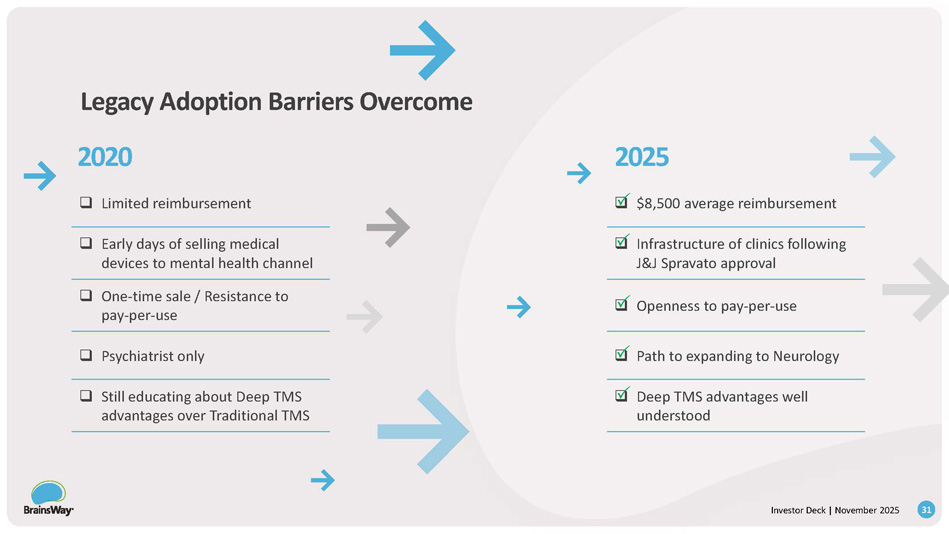
2020 2025 Legacy Adoption Barriers Overcome □ $8,500 average reimbursement □ Limited reimbursement □ Infrastructure of clinics following J&J Spravato approval □ Early days of selling medical devices to mental health channel □ Openness to pay - per - use □ One - time sale / Resistance to pay - per - use □ Path to expanding to Neurology □ Psychiatrist only □ Deep TMS advantages well understood □ Still educating about Deep TMS advantages over Traditional TMS 31 Investor Deck | November 2025 Investor Deck | November 2025 Strong Financial Momentum.
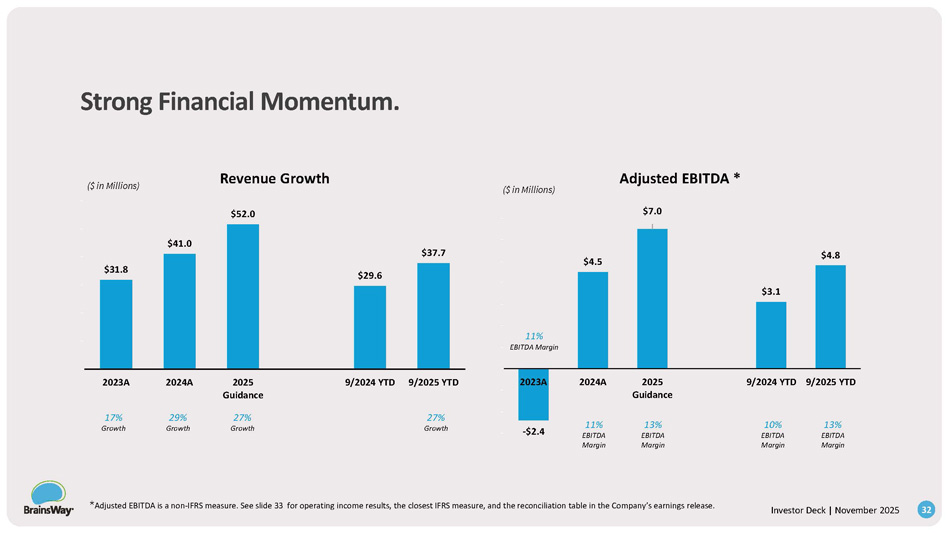
$31.8 $41.0 $52.0 $29.6 $37.7 $0. 00 $10 .00 $20 .00 $30 .00 $40 .00 $50 .00 $60 .00 2023A 2024A 2025 Guidance 9/2024 YTD 9/2025 YTD Revenue Growth - $2.4 $4.5 $7.0 $3.1 $4.8 - $3.00 - $2.00 - $1.00 $0. 00 $1. 00 $2. 00 $3. 00 $4. 00 $5. 00 $6. 00 $7. 00 2023A 2024A 2025 Guidance 9/2024 YTD 9/2025 YTD Adjusted EBITDA * ($ in Millions) ($ in Millions) 27% Growth 27% Growth 29% Growth 17% Growth 13% EBITDA Margin 10% EBITDA Margin 13% EBITDA Margin 11% EBITDA Margin 11% EBITDA Margin 32 * Adjusted EBITDA is a non - IFRS measure. See slide 33 for operating income results, the closest IFRS measure, and the reconciliation table in the Company’s earnings release.
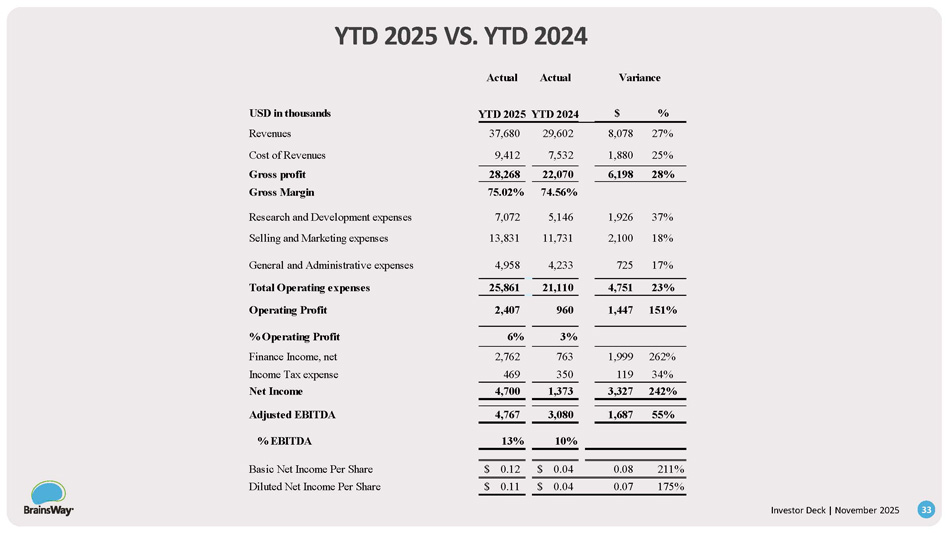
YTD 2025 VS.
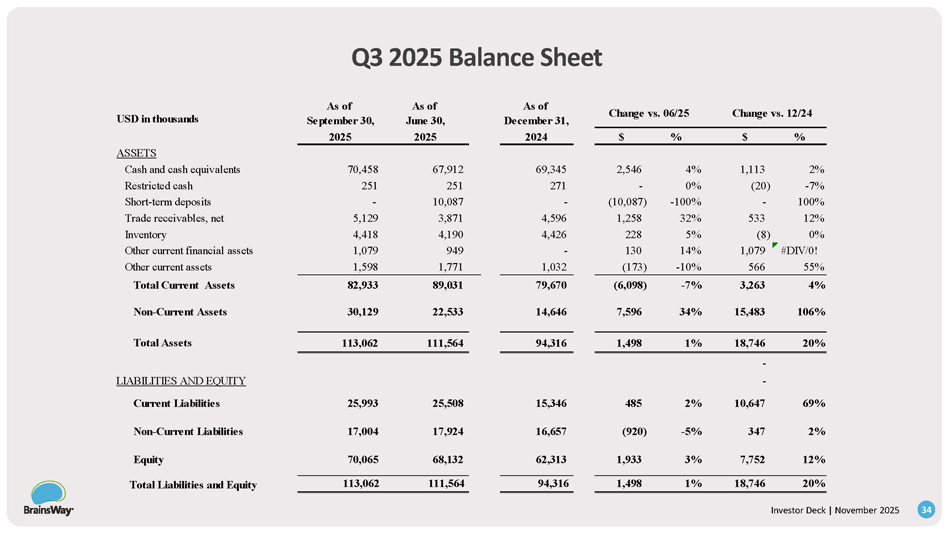
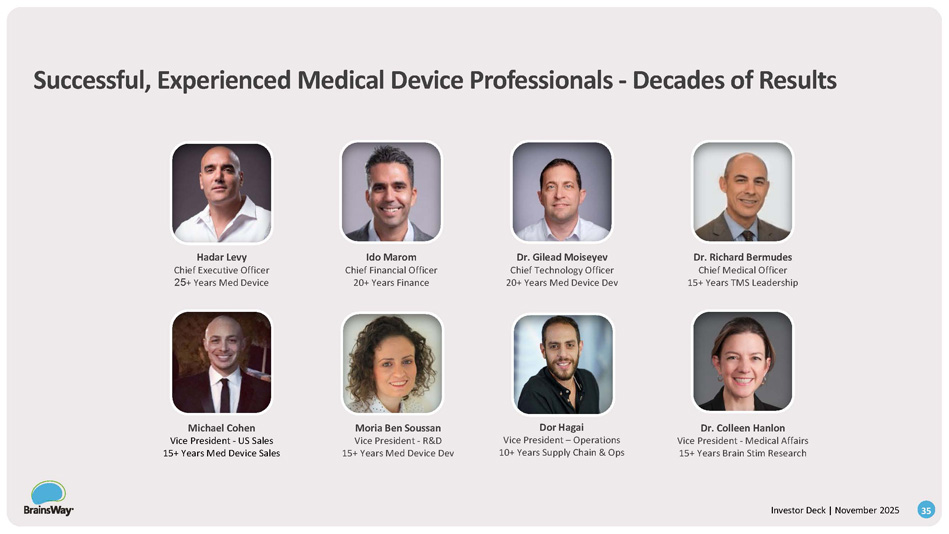
YTD 2024 Variance Actual Actual % $ YTD 2024 YTD 2025 USD in thousands 27% 8,078 29,602 37,680 Revenues 25% 1,880 7,532 9,412 Cost of Revenues 28% 6,198 22,070 28,268 Gross profit 74.56% 75.02% Gross Margin 37% 1,926 5,146 7,072 Research and Development expenses 18% 2,100 11,731 13,831 Selling and Marketing expenses 17% 725 4,233 4,958 General and Administrative expenses 23% 4,751 21,110 25,861 Total Operating expenses 151% 1,447 960 2,407 Operating Profit 3% 6% % Operating Profit 262% 1,999 763 2,762 Finance Income, net 34% 119 350 469 Income Tax expense 242% 3,327 1,373 4,700 Net Income 55% 1,687 3,080 4,767 Adjusted EBITDA 10% 13% % EBITDA 211% 0.08 $ 0.04 $ 0.12 Basic Net Income Per Share 175% 0.07 $ 0.04 $ 0.11 Diluted Net Income Per Share Investor Deck | November 2025 33 Q3 2025 Balance Sheet Change vs. 06/25 Change vs. 12/24 As of December 31, As of June 30, As of September 30, USD in thousands % $ % $ 2024 2025 2025 ASSETS 2% 1,113 4% 2,546 69,345 67,912 70,458 Cash and cash equivalents - 7% (20) 0% - 271 251 251 Restricted cash 100% - - 100% (10,087) - 10,087 - Short - term deposits 12% 533 32% 1,258 4,596 3,871 5,129 Trade receivables, net 0% (8) 5% 228 4,426 4,190 4,418 Inventory #DIV/0! 1,079 14% 130 - 949 1,079 Other current financial assets 55% 566 - 10% (173) 1,032 1,771 1,598 Other current assets 4% 3,263 - 7% (6,098) 79,670 89,031 82,933 Total Current Assets 106% 15,483 34% 7,596 14,646 22,533 30,129 Non - Current Assets 20% 18,746 1% 1,498 94,316 111,564 113,062 Total Assets - - LIABILITIES AND EQUITY 69% 10,647 2% 485 15,346 25,508 25,993 Current Liabilities 2% 347 - 5% (920) 16,657 17,924 17,004 Non - Current Liabilities 12% 7,752 3% 1,933 62,313 68,132 70,065 Equity 20% 18,746 1% 1,498 94,316 111,564 113,062 Total Liabilities and Equity Investor Deck | November 2025 34 Moria Ben Soussan Vice President - R&D 15+ Years Med Device Dev Hadar Levy Chief Executive Officer 25 + Years Med Device Michael Cohen Vice President - US Sales 15+ Years Med Device Sales Dr. Colleen Hanlon Vice President - Medical Affairs 15+ Years Brain Stim Research Dr. Richard Bermudes Chief Medical Officer 15+ Years TMS Leadership Dr. Gilead Moiseyev Chief Technology Officer 20+ Years Med Device Dev Dor Hagai Vice President – Operations 10+ Years Supply Chain & Ops Ido Marom Chief Financial Officer 20+ Years Finance Successful, Experienced Medical Device Professionals - Decades of Results Investor Deck | November 2025 35
Summary Highlights Investor Deck | November 2025 36 Category Leader – Only Deep TMS platform with 4 FDA cleared indications Expanding TAM – New indications, Neurolief at - home entry, international scale Recurring Revenue Model – ~70% new deals are multi - year rentals High Visibility - $65M Remaining Performance Obligations (RPO) Strong Profitability – 10 straight quarters of positive free cash flow Backed to Scale – $71M cash; strategic partner Valor supports continued expansion References Investor Deck | November 2025 37 1.

BrainsWay Data on File 2. The National Institute of Mental Health: nimh.nih.gov 3. Kessler RC, et al. Comorbidity of DSM - III - R major depressive disorder in the general population: results from the US National Comorbidity Survey Br J Psychiatry Suppl. 1996 4. Trivedi MH et al. STAR*D Study Team (2006), Evaluation of outcomes with citalopram for depression using measurement - based care in STAR*D: implications for clinical practice. Am J Psychiatry. 2006 Jan; 163(1):28 - 40. 5. Greist JH. The comparative effectiveness of treatments for obsessive - compulsive disorder. Bull Menninger Clin. 1998;62(4, suppl 1A):A65 – A81 6. Marks I. Behavior therapy for obsessive - compulsive disorder: a decade of progress. Can J Psychiatry. 1997;42:1021 – 1027 7. Ballenger JC. Current treatments of the anxiety disorders in adults. Biol Psychiatry. 1999;46: 1579 – 1594 8. Lawson McLean A. Publication trends in transcranial magnetic stimulation: a 30 - year panorama. Brain Stimul. 2019 May - Jun;12(3): 619 - 627 9. BrainsWay Data on File; Depth, measured in phantom head, is from cortical surface toward brain center for which E - field >=100V/m for calibrated stimulator output. If measuring from scalp surface, an additional 1.5 cm should be added; See also, Guadagnin, V., et. al., 2016. Deep Transcranial Magnetic Stimulation: Modeling of Different Coil Configurations. 63, 1543 – 1550. 10. Fiocchi, S., et. al., 2016. Modelling of the Electric Field Distribution in Deep Transcranial Magnetic Stimulation. 2016 11. Company estimates, references 3.4M adult MDD patients with insurance coverage and assumes 33 sessions per patient with an average session price of $70; Oppenheimer Research Report, 08/24/2020 12. Tendler, A, et al. Deep TMS H1 Coil treatment for depression: Results from a large post marketing data analysis. Psychiatry Research. Vol 324, June 2023, 115179 13. Senova S, et al. Durability of antidepressant response to repetitive transcranial magnetic stimulation: Systematic review and meta - analysis. Brain Stimulation 12 (2019) 119e128 14. Gersner R, et al. What is the durability of Deep TMS for Major Depressive Disorder. Brain Stimulation 13 (2020) 1842 - 1862 15. Roth Y, et al. Real - world efficacy of deep TMS for obsessive - compulsive disorder: Post - marketing data collected from twenty - two clinical sites. J Psychiatr Res. 2020 Nov 4;S0022 3956(20)31065 - 7 16. Harmelech T et al. Long - term outcomes of a course of deep TMS for treatment - resistant OCD. Brain Stimulation 15 (2022) 226e228 17 .https://www.cdc.gov/tobacco/data_statistics/fact_sheets/cessation/smoking - cessation - fast - facts/index.html. Data as of 2018 for U.S. adults. 18. EY Parthenon Analysis 2018 https://www.smokefreeworld.org/sites/default/files/ey - p_smoking_cessation_landscape_analysis_key_findings.pdf 19. Zangen A et al. Repetitive transcranial magnetic stimulation for smoking cessation: a pivotal multicenter double - blind randomized controlled trial. World Psychiatry. 2021 Oct;20(3):397 - 404 20. https://worldpopulationreview.com/country - rankings/depression - rates - by - country