UNITED STATES OF AMERICA
SECURITIES AND EXCHANGE COMMISSION
Washington, D.C. 20549
FORM 8-K
CURRENT REPORT
PURSUANT TO SECTION 13 OR 15(d) OF THE SECURITIES EXCHANGE ACT OF 1934
Date of Report (Date of earliest event reported): November 7, 2025
CHEMUNG FINANCIAL CORPORATION
(Exact name of registrant as specified in its charter)
| New York | 001-35741 | 16-1237038 | ||
| (State or other jurisdiction of incorporation) | (Commission File Number) | (IRS Employer Identification No.) |
One Chemung Canal Plaza, Elmira, NY 14901
(Address of principal executive offices) (Zip Code)
(607) 737-3711
(Registrant’s telephone number, including area code)
Securities registered pursuant to Section 12(b) of the Exchange Act:
| Title of each class | Trading symbol | Name of exchange on which registered | ||
| Common stock, par value $0.01 per share | CHMG | The Nasdaq Stock Market LLC |
Check the appropriate box below if the Form 8-K filing is intended to simultaneously satisfy the filing obligation of the registrant under any of the following provisions (see General Instruction A.2 below):
☐ Written communications pursuant to Rule 425 under the Securities Act (17 CFR 230.425)
☐ Soliciting material pursuant to Rule 14a-12 under the Exchange Act (17 CFR 240.14a-12)
☐ Pre-commencement communications pursuant to Rule 14d-2(b) under the Exchange Act (17 CFR 240.14d-2(b))
☐ Pre-commencement communications pursuant to Rule 13e-4(c) under the Exchange Act (17 CFR 240.13e-4(c))
Indicate by check mark whether the registrant is an emerging growth company as defined in Rule 405 of the Securities Act of 1933 (§230.405 of this chapter) or Rule 12b-2 of the Securities Exchange Act of 1934 (§240.12b-2 of this chapter). Emerging growth company ☐
If an emerging growth company, indicate by check mark if the registrant has elected not to use the extended transition period for complying with any new or revised financial accounting standards provided pursuant to Section 13(a) of the Exchange Act. ☐
| ITEM 7.01 | Regulation FD Disclosure |
The management of Chemung Financial Corporation (the “Corporation”) intends to participate in meetings with institutional investors and other interested parties during the fourth quarter of 2025 to discuss the Corporation’s strategies, recent performance, and trends. Anders M. Tomson, Chief Executive Officer, and Dale M. McKim III, Chief Financial Officer and Treasurer, are expected to present at such meetings.
The investor presentation prepared by the Corporation for use in these meetings is available on the Corporation’s website at www.chemungcanal.com under Investor Relations and “Investor Presentation.” Investors should note that the Corporation announces material information in Securities and Exchange Commission (the “SEC”) filings and press releases. Based on guidance from the SEC, the Corporation may also use the Investor Relations section of its corporate website, www.chemungcanal.com, to communicate with investors about the Corporation. It is possible that the information posted there could be deemed to be material information. The information on the Corporation’s website is not incorporated by reference into this Current Report on Form 8-K.
This investor presentation is furnished pursuant to Item 7.01 of Form 8-K and shall not be deemed to be “filed” for the purposes of Section 18 of the Securities Exchange Act of 1934 (the “Exchange Act”), as amended, or otherwise subject to the liabilities of that section, nor shall it be deemed incorporated by reference in any filing under the Securities Act of 1933, as amended, or the Exchange Act, whether made before or after the date of this report, except as shall be expressly set forth by specific reference in such filing.
The investor presentation is furnished as Exhibit 99.1 to this report.
| ITEM 9.01 | Financial Statements and Exhibits |
| (d) | Exhibits |
| Exhibit No. |
| 99.1 | Third Quarter 2025 Investor Presentation |
| 104 | Cover Page Interactive Data File (embedded within the Inline XBRL document) |
SIGNATURES
Pursuant to the requirements of the Securities Exchange Act of 1934, the registrant has duly caused this report to be signed on its behalf by the undersigned, hereunto duly authorized.
CHEMUNG FINANCIAL CORPORATION
| November 7, 2025 | By: | /s/ Dale M. McKim, III |
| Dale M. McKim, III | ||
| Chief Financial Officer and Treasurer | ||
Exhibit 99.1

With You Today Anders Tomson President & Chief Executive Officer Dale McKim Executive Vice President & Chief Financial Officer 2 Chemung Financial Corporation Safe Harbor Statement 3 Chemung Financial Corporation Forward - looking Statements: This report contains forward - looking statements within the meaning of Section 27A of the Securities Act.

The Corporation intends its forward - looking statements to be covered by the safe harbor provisions for forward - looking statements in these sections. All statements regarding the Corporation’s expected financial position and operating results, the Corporation’s business strategy, the Corporation’s financial plans, forecasted demographic and economic trends relating to the Corporation’s industry and similar matters are forward - looking statements. These statements can sometimes be identified by the Corporation’s use of forward - looking words such as “may,” “will,” “anticipate,” “estimate,” “expect,” or “intend.” The Corporation's actual results could be materially different from expectations because of various factors, including changes in economic conditions or interest rates, credit risk, inflation, tariffs, cybersecurity risks, difficulties in managing the Corporation’s growth, recent bank failures, changes in FDIC assessments, public health issues, geopolitical conflicts, competition, changes in law or the regulatory environment, and changes in general business and economic trends. Information concerning these and other factors, including Risk Factors, can be found in the Corporation’s periodic filings with the SEC, including the discussion under the heading “Item 1A. Risk Factors” in the Corporation’s 2024 Annual Report on Form 10 - K. These filings are available publicly on the SEC’s web site at http://www.sec.gov , on the Corporation's web site at http://www.chemungcanal.com or upon request from the Corporate Secretary at (607) 737 - 3746. Except as otherwise required by law, the Corporation undertakes no obligation to publicly update or revise its forward - looking statements, whether as a result of new information, future events, or otherwise.

Key Takeaways Continued strength and momentum in underlying businesses High customer engagement across all business lines and geographies. Stable deposit base and ample liquidity Majority of deposits sourced from stable, legacy markets. Strategic balance sheet restructuring driving enhanced earnings Support growth strategies and improve funding profile. Valuable wealth management business High touch relationships with affluent borrowers provides dependable non - interest income stream. Solid and stable credit quality Consistently low non - performing assets and charge - offs. Contiguous geographic expansion Expansion of the franchise in higher growth markets of Albany and Buffalo. 4 Chemung Financial Corporation About Us Elmira, NY 5
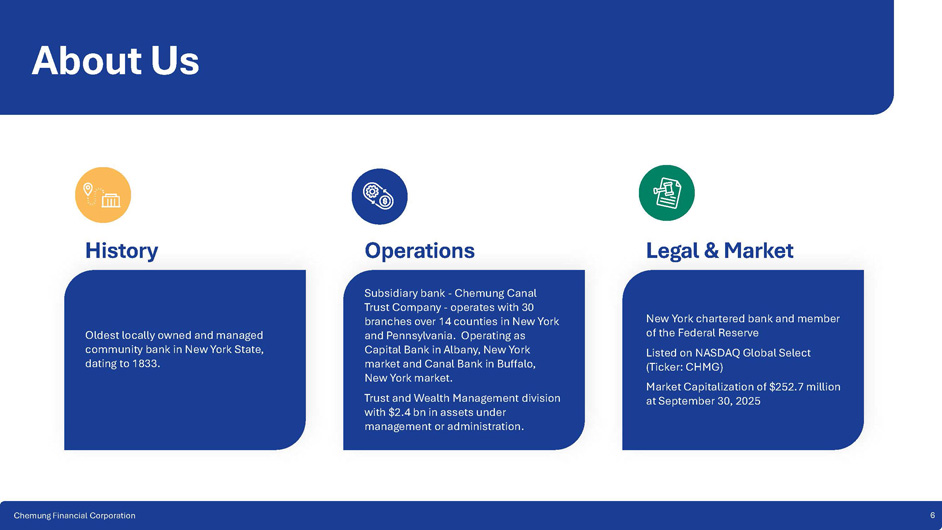
Chemung Financial Corporation Oldest locally owned and managed community bank in New York State, dating to 1833 . New York chartered bank and member of the Federal Reserve Listed on NASDAQ Global Select (Ticker: CHMG) Market Capitalization of $252.7 million at September 30, 2025 About Us History Operations Subsidiary bank - Chemung Canal Trust Company - operates with 30 branches over 14 counties in New York and Pennsylvania. Operating as Capital Bank in Albany, New York market and Canal Bank in Buffalo, New York market. Trust and Wealth Management division with $2.4 bn in assets under management or administration. Legal & Market 6 Chemung Financial Corporation Revenue Growth ▪ Drive loan growth in Albany and Buffalo with legacy market deposits and proceeds from balance sheet restructuring.

▪ Well positioned to opportunistically acquire when operational model and pricing is right. Seeking wealth management, whole bank or branch opportunities. ▪ Fee and pricing discipline. Operating Efficiencies ▪ Continual evaluation of branch distribution model. ▪ Optimization of vendor contracts. ▪ Rationalization of headcount and outsourcing opportunities. ▪ Robotic Process Automation and Artificial Intelligence. Customer Experience and Brand ▪ Growth of Canal Bank brand in Western New York. ▪ Introduction of unified digital experience. ▪ Relationship focus. Colleagues and Community ▪ Believe and behave like a community bank. ▪ Recognized community partner within our markets. ▪ Incentive compensation plans to maintain competitiveness and drive the strategy.
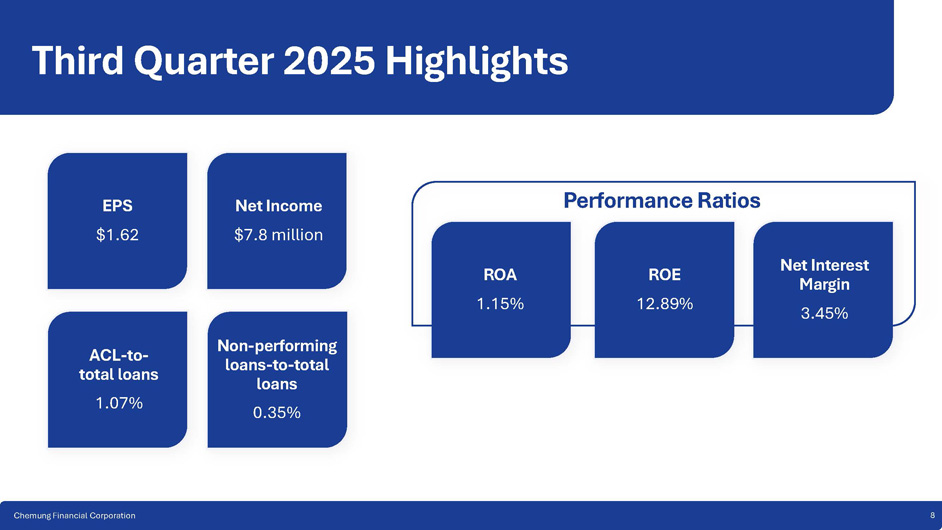

Core Strategies 7 Third Quarter 2025 Highlights EPS $1.62 Net Income $7.8 million ROA 1.15% ROE 12.89% Net Interest Margin 3.45% ACL - to - total loans 1.07% Non - performing loans - to - total loans 0.35% Performance Ratios 8 Chemung Financial Corporation Third Quarter 2025 Highlights 9 Chemung Financial Corporation ▪ Announced $0.02 per share dividend increase for third quarter 2025, representing a 6.3% increase over the prior quarter ▪ Net interest margin expanded 40 bp compared to the prior quarter, from 3 . 05 % to 3 . 45 % ▪ Average yield on interest - earning assets increased 32 bp to 5 . 15 % ▪ Cost of funds decreased 9 bp to 1 .
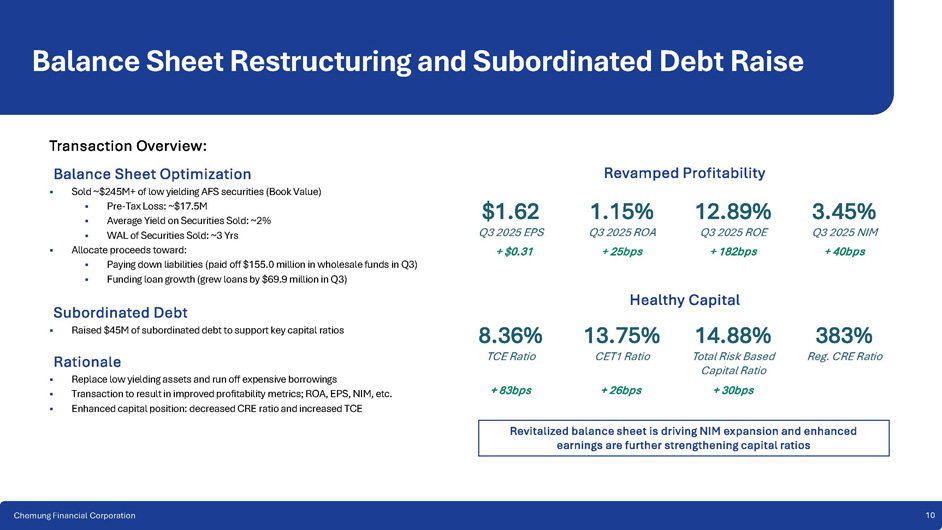
85 % ▪ YTD loan growth was 8.4% annualized, including commercial loan growth of 13.6% annualized ▪ Paid off $155.0 million in wholesale funding early in the quarter Balance Sheet Restructuring and Subordinated Debt Raise 10 Chemung Financial Corporation Transaction Overview: Balance Sheet Optimization ▪ Sold ~$245M+ of low yielding AFS securities (Book Value) ▪ Pre - Tax Loss: ~$17.5M ▪ Average Yield on Securities Sold: ~2% ▪ WAL of Securities Sold: ~3 Yrs ▪ Allocate proceeds toward: ▪ Paying down liabilities (paid off $155.0 million in wholesale funds in Q3) ▪ Funding loan growth (grew loans by $69.9 million in Q3) Subordinated Debt ▪ Raised $45M of subordinated debt to support key capital ratios Rationale ▪ Replace low yielding assets and run off expensive borrowings ▪ Transaction to result in improved profitability metrics; ROA, EPS, NIM, etc. ▪ Enhanced capital position: decreased CRE ratio and increased TCE Revamped Profitability Healthy Capital 383% 14.88% 13.75% 8.36% Reg.
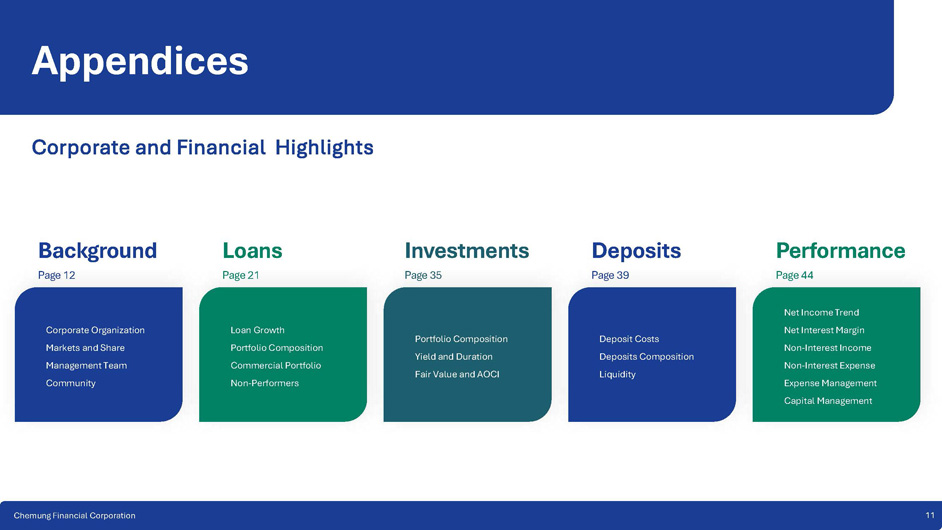
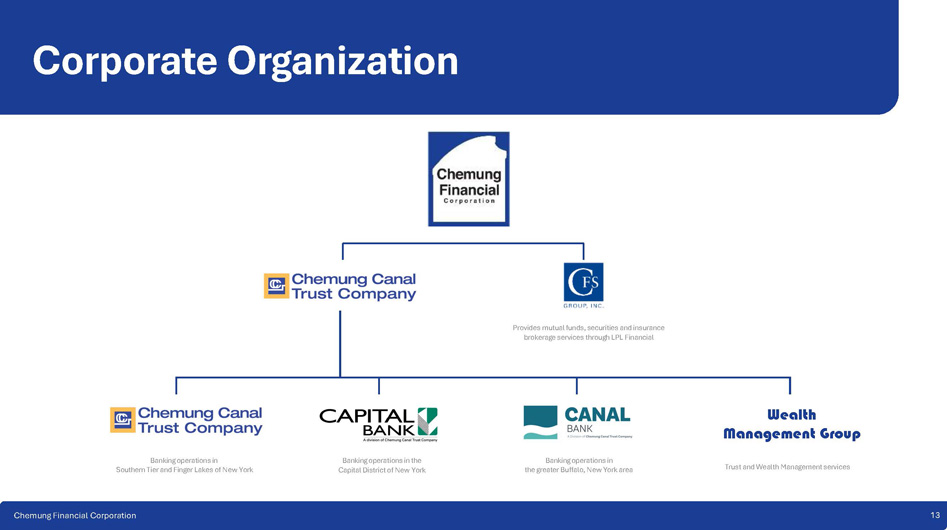
CRE Ratio Total Risk Based CET1 Ratio TCE Ratio Capital Ratio + 30bps + 26bps + 83bps $1.62 Q3 2025 EPS + $0.31 1.15% Q3 2025 ROA + 25bps 3.45% Q3 2025 NIM + 40bps Revitalized balance sheet is driving NIM expansion and enhanced earnings are further strengthening capital ratios 12.89% Q3 2025 ROE + 182bps Appendices Corporate and Financial Highlights Background Page 12 Corporate Organization Markets and Share Management Team Community Loans Page 21 Loan Growth Portfolio Composition Commercial Portfolio Non - Performers Investments Page 35 Portfolio Composition Yield and Duration Fair Value and AOCI Deposits Page 39 Deposit Costs Deposits Composition Liquidity Performance Page 44 11 Chemung Financial Corporation Net Income Trend Net Interest Margin Non - Interest Income Non - Interest Expense Expense Management Capital Management Corporate Organization Trust and Wealth Management services Provides mutual funds, securities and insurance brokerage services through LPL Financial Banking operations in Southern Tier and Finger Lakes of New York Wealth Management Group Banking operations in the Capital District of New York Banking operations in the greater Buffalo, New York area Chemung Financial Corporation 13
Background 12

Markets Legacy Markets Long, deep relationships since 1833 provide stable funding and earnings engine. Steady and even economy, powered by large corporations (Corning, Inc.), higher education (Cornell University, SUNY Binghamton) and tourism. Growth Opportunity New York’s Capital and Western New York regions offer larger population centers undergoing economic renaissances. Large bank consolidation providing market disruption opportunities. Chemung Financial Corporation 14 Legacy Markets Dominant market share of deposits Growth Markets Small share of much larger markets; a lot of room to grow.
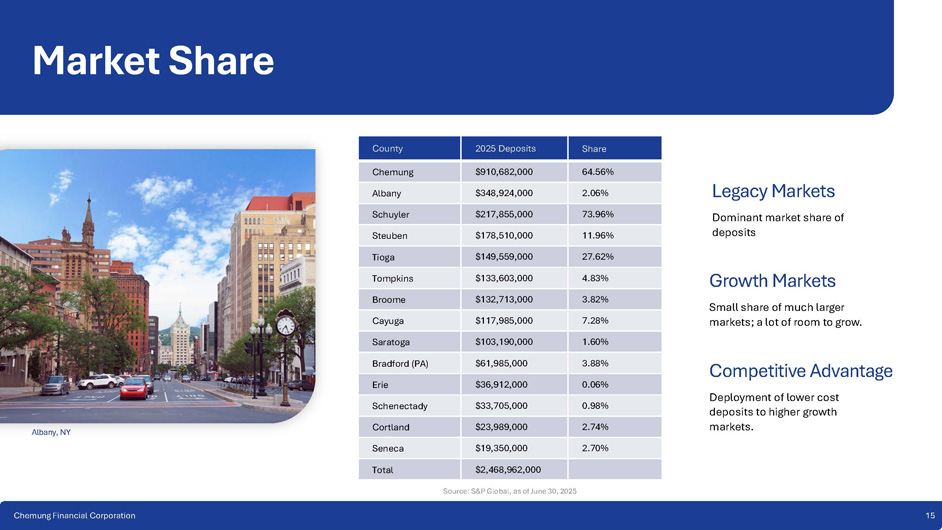
Competitive Advantage Deployment of lower cost deposits to higher growth markets .
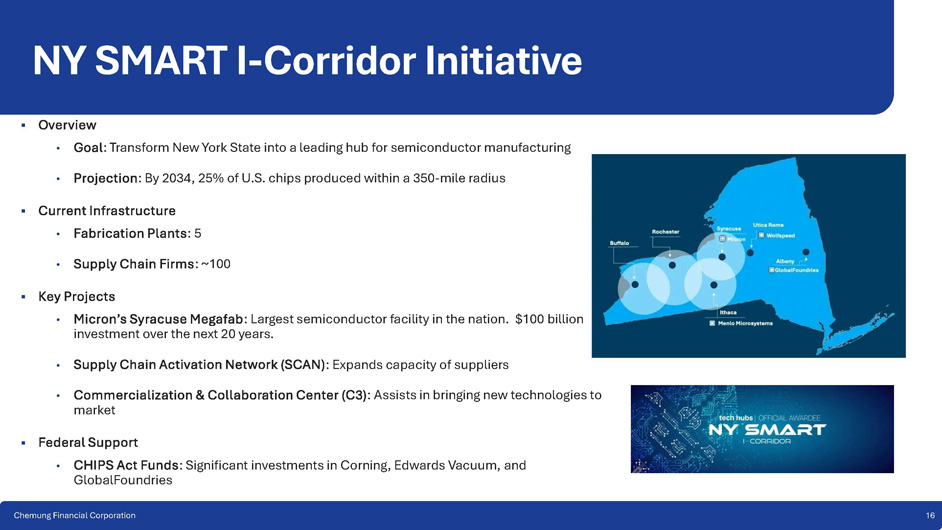
Share 2025 Deposits County 64.56% $910,682,000 Chemung 2.06% $348,924,000 Albany 73.96% $217,855,000 Schuyler 11.96% $178,510,000 Steuben 27.62% $149,559,000 Tioga 4.83% $133,603,000 Tompkins 3.82% $132,713,000 Broome 7.28% $117,985,000 Cayuga 1.60% $103,190,000 Saratoga 3.88% $61,985,000 Bradford (PA) 0.06% $36,912,000 Erie 0.98% $33,705,000 Schenectady 2.74% $23,989,000 Cortland 2.70% $19,350,000 Seneca $2,468,962,000 Total Market Share Albany, NY Chemung Financial Corporation 15 Source: S&P Global, as of June 30, 2025 NY SMART I - Corridor Initiative ▪ Overview • Goal : Transform New York State into a leading hub for semiconductor manufacturing • Projection : By 2034, 25% of U.S. chips produced within a 350 - mile radius ▪ Current Infrastructure • Fabrication Plants : 5 • Supply Chain Firms : ~100 ▪ Key Projects • Micron’s Syracuse Megafab : Largest semiconductor facility in the nation. $100 billion investment over the next 20 years.
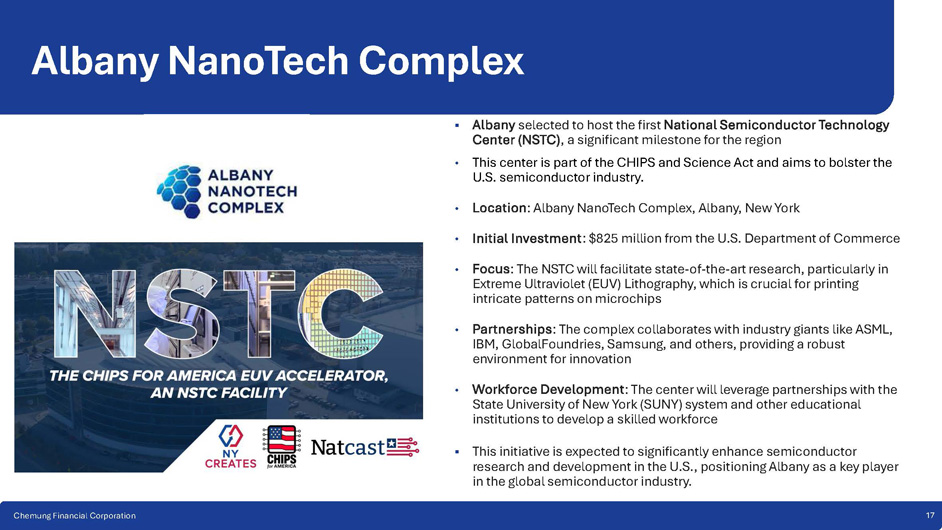
• Supply Chain Activation Network (SCAN) : Expands capacity of suppliers • Commercialization & Collaboration Center (C3) : Assists in bringing new technologies to market ▪ Federal Support • CHIPS Act Funds : Significant investments in Corning, Edwards Vacuum, and GlobalFoundries Chemung Financial Corporation 16 Albany NanoTech Complex ▪ Albany selected to host the first National Semiconductor Technology Center (NSTC) , a significant milestone for the region • This center is part of the CHIPS and Science Act and aims to bolster the U.S. semiconductor industry. • Location : Albany NanoTech Complex, Albany, New York • Initial Investment : $825 million from the U.S. Department of Commerce • Focus : The NSTC will facilitate state - of - the - art research, particularly in Extreme Ultraviolet (EUV) Lithography, which is crucial for printing intricate patterns on microchips • Partnerships : The complex collaborates with industry giants like ASML, IBM, GlobalFoundries, Samsung, and others, providing a robust environment for innovation • Workforce Development : The center will leverage partnerships with the State University of New York (SUNY) system and other educational institutions to develop a skilled workforce ▪ This initiative is expected to significantly enhance semiconductor research and development in the U.S., positioning Albany as a key player in the global semiconductor industry. Chemung Financial Corporation 17 Empire AI Consortium – SUNY Buffalo Overview: • Launched in April 2024 by Governor Kathy Hochul.
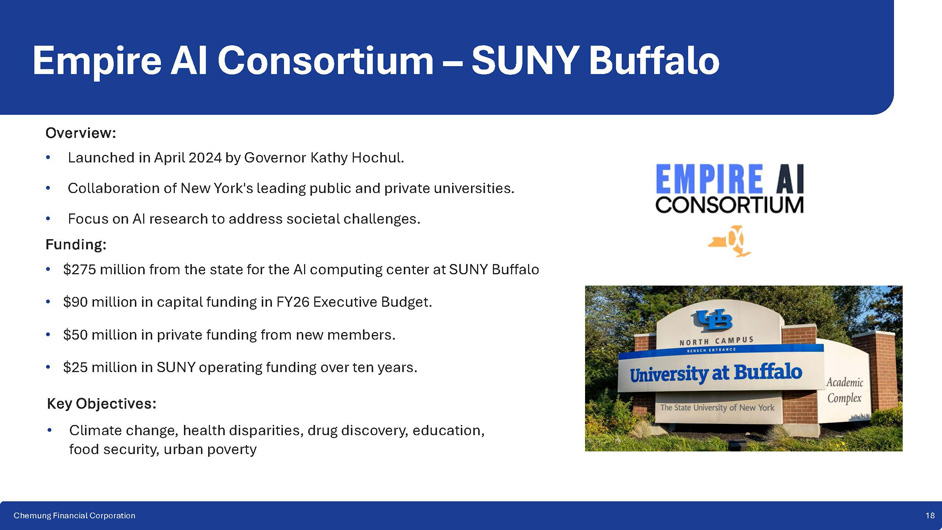
• Collaboration of New York's leading public and private universities. • Focus on AI research to address societal challenges. Funding: • $275 million from the state for the AI computing center at SUNY Buffalo • $90 million in capital funding in FY26 Executive Budget. • $50 million in private funding from new members. • $25 million in SUNY operating funding over ten years.
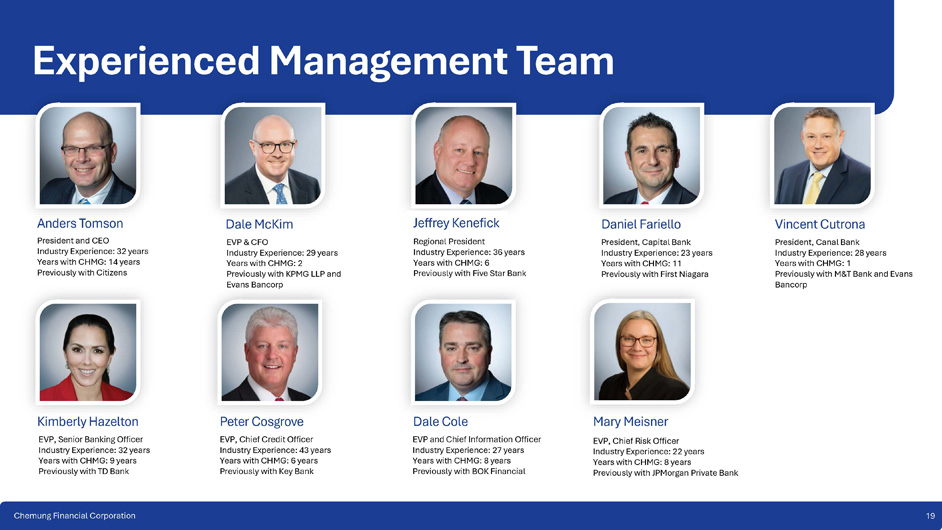
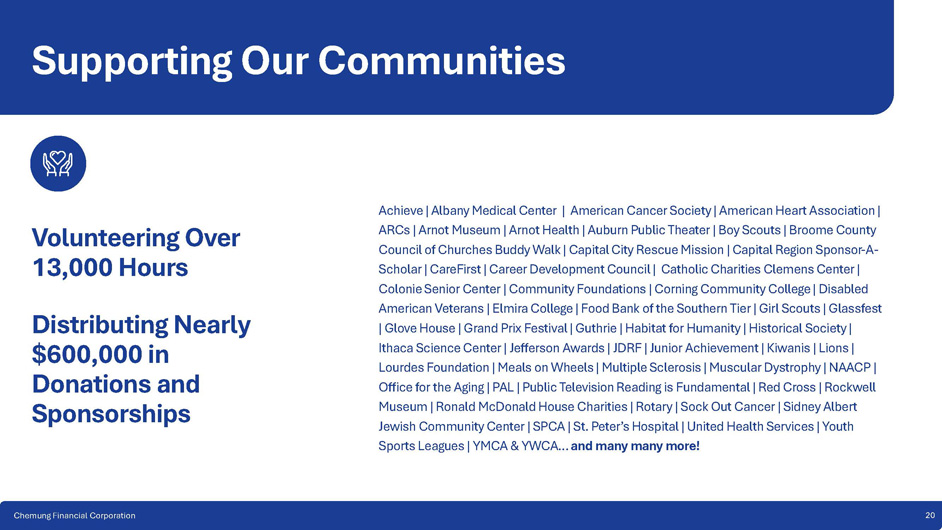
Key Objectives: • Climate change, health disparities, drug discovery, education, food security, urban poverty Chemung Financial Corporation 18 Kimberly Hazelton EVP, Senior Banking Officer Industry Experience: 32 years Years with CHMG: 9 years Previously with TD Bank Anders Tomson President and CEO Industry Experience: 32 years Years with CHMG: 14 years Previously with Citizens Experienced Management Team 1 Dale McKim EVP & CFO Industry Experience: 29 years Years with CHMG: 2 Previously with KPMG LLP and Evans Bancorp Regional President Industry Experience: 36 years Years with CHMG: 6 Previously with Five Star Bank Jeffrey Kenefick Daniel Fariello President, Capital Bank Industry Experience: 23 years Years with CHMG: 11 Previously with First Niagara Peter Cosgrove EVP, Chief Credit Officer Industry Experience: 43 years Years with CHMG: 6 years Previously with Key Bank Dale Cole EVP and Chief Information Officer Industry Experience: 27 years Years with CHMG: 8 years Previously with BOK Financial Vincent Cutrona President, Canal Bank Industry Experience: 28 years Years with CHMG: 1 Previously with M&T Bank and Evans Bancorp Mary Meisner EVP, Chief Risk Officer Industry Experience: 22 years Years with CHMG: 8 years Previously with JPMorgan Private Bank Chemung Financial Corporation 19 Supporting Our Communities Volunteering Over 13,000 Hours Distributing Nearly $600,000 in Donations and Sponsorships Achieve | Albany Medical Center | American Cancer Society | American Heart Association | ARCs | Arnot Museum | Arnot Health | Auburn Public Theater | Boy Scouts | Broome County Council of Churches Buddy Walk | Capital City Rescue Mission | Capital Region Sponsor - A - Scholar | CareFirst | Career Development Council | Catholic Charities Clemens Center | Colonie Senior Center | Community Foundations | Corning Community College | Disabled American Veterans | Elmira College | Food Bank of the Southern Tier | Girl Scouts | Glassfest | Glove House | Grand Prix Festival | Guthrie | Habitat for Humanity | Historical Society | Ithaca Science Center | Jefferson Awards | JDRF | Junior Achievement | Kiwanis | Lions | Lourdes Foundation | Meals on Wheels | Multiple Sclerosis | Muscular Dystrophy | NAACP | Office for the Aging | PAL | Public Television Reading is Fundamental | Red Cross | Rockwell Museum | Ronald McDonald House Charities | Rotary | Sock Out Cancer | Sidney Albert Jewish Community Center | SPCA | St. Peter’s Hospital | United Health Services | Youth Sports Leagues | YMCA & YWCA… and many many more! Chemung Financial Corporation 20
Loans 21

5.0% 4.9% 4.9% 5.1% 5.3% 6.5% 8.6% 10.7% 11.0% 7.8% 12.6% 13.3% 17.1% 14.1% 15.6% 61.9% 58.8% 56.9% 2.8% 54.5% 52.9% 14.0% 14.4% 13.4% 13.8% 14.1% 0% 10% 20% 30% 40% 50% 60% 70% 80% 90% 100% Loans by Type (%) Other Cons. Indirect Cons. Res. Mort. PPP Comm. Mort. Comm. & Ind. Summary of Loan Growth 22 Chemung Financial Corporation ▪ Total Loans: $2.202 billion at September 30, 2025 ▪ Originated $302.0MM in Commercial Loans to date in 2025 ▪ Originated $20.8MM in Indirect Loans to date in 2025 ▪ Originated $48.7MM in Home Equity Loans to date in 2025 ▪ Opened full - service Canal Bank branch in Williamsville, NY in Q 4 2024 - $ 196 .
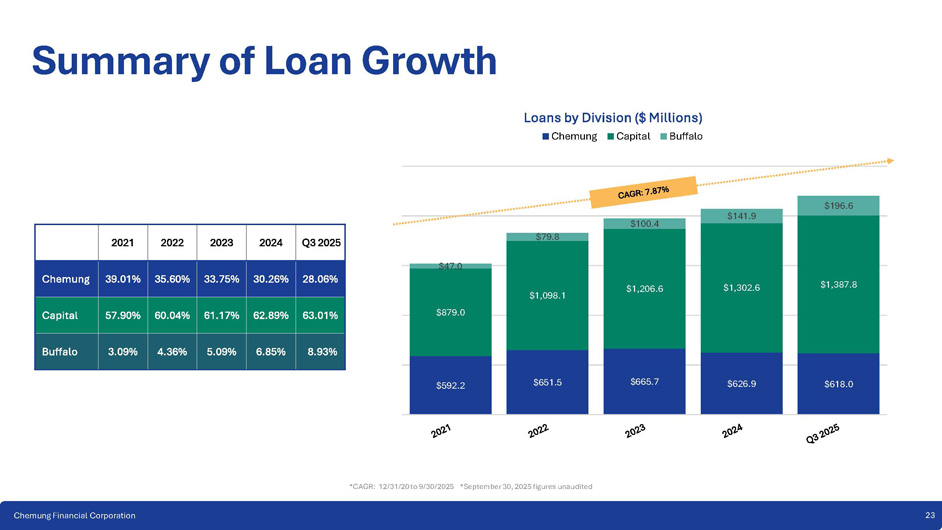
6 MM in loans as of September 30 , 2025 *September 30, 2025 figures unaudited $592.2 $651.5 $665.7 $626.9 $618.0 $879.0 $1,098.1 $1,206.6 $1,302.6 $1,387.8 $47.0 $79.8 $100.4 $141.9 $196.6 Loans by Division ($ Millions) Chemung Capital Buffalo Summary of Loan Growth Q3 2025 2024 2023 2022 2021 28.06% 30.26% 33.75% 35.60% 39.01% Chemung 63.01% 62.89% 61.17% 60.04% 57.90% Capital 8.93% 6.85% 5.09% 4.36% 3.09% Buffalo 23 Chemung Financial Corporation *CAGR: 12/31/20 to 9/30/2025 *September 30, 2025 figures unaudited 14.04% 7.72% 54.13% 12.61% 11.50% Portfolio Concentrations to Total Loans September 30, 2025 Commercial & Ind.

CRE Owner Occupied CRE Non - Owner Occupied Residential Mort. Consumer *September 30, 2025 figures unaudited 24 Chemung Financial Corporation Loan Composition ▪ June capital raise meaningfully reduced CRE non - owner occupied (NOO) ratios to provide opportunities for further growth.
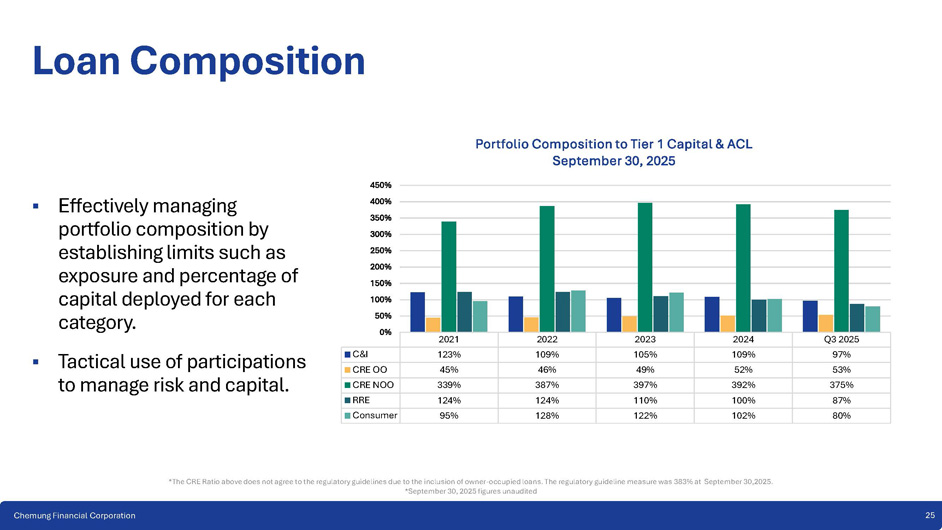
2021 2022 2023 2024 Q3 2025 97% 109% 105% 109% 123% C&I 53% 52% 49% 46% 45% CRE OO 375% 392% 397% 387% 339% CRE NOO 87% 100% 110% 124% 124% RRE 80% 102% 122% 128% 95% Consumer 350% 300% 250% 200% 150% 100% 50% 0% *September 30, 2025 figures unaudited 25 Chemung Financial Corporation 450% 400% Portfolio Composition to Tier 1 Capital & ACL September 30, 2025 Loan Composition ▪ Effectively managing portfolio composition by establishing limits such as exposure and percentage of capital deployed for each category. ▪ Tactical use of participations to manage risk and capital. *The CRE Ratio above does not agree to the regulatory guidelines due to the inclusion of owner - occupied loans. The regulatory guideline measure was 383% at September 30,2025.
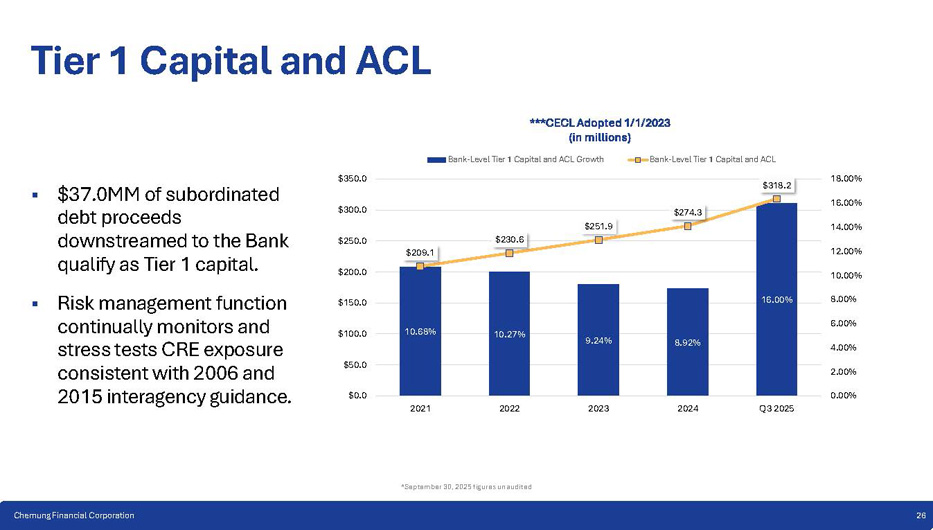
10.68% 10.27% 9.24% 8.92% 16.00% $209.1 $230.6 $251.9 $274.3 $318.2 0.00% 2.00% 4.00% 6.00% 8.00% 10.00% 12.00% 14.00% 16.00% 18.00% $0.0 $50.0 $100.0 $150.0 $200.0 $250.0 $300.0 $350.0 2021 2022 2023 2024 Q3 2025 ***CECL Adopted 1/1/2023 (in millions) Bank - Level Tier 1 Capital and ACL Growth Bank - Level Tier 1 Capital and ACL *September 30, 2025 figures unaudited 26 Chemung Financial Corporation Tier 1 Capital and ACL ▪ $37.0MM of subordinated debt proceeds downstreamed to the Bank qualify as Tier 1 capital. ▪ Risk management function continually monitors and stress tests CRE exposure consistent with 2006 and 2015 interagency guidance.

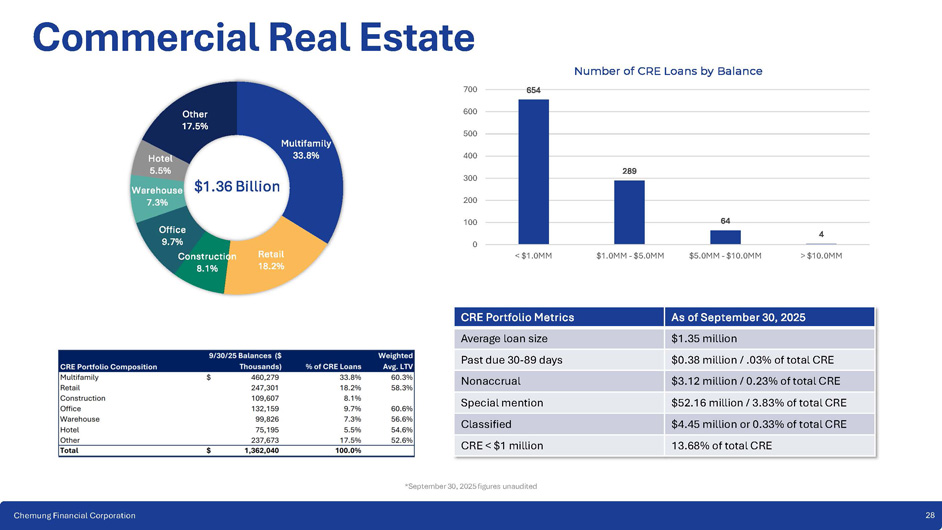
NAICS Code / Descriptions Balances ($ Thousands) Real Estate, Rental & Leasing 1,146,188 $ Percentage 68.58% 2.91% 48,561 Manufacturing 4.87% 81,401 Health Care & Social Assistance 1.66% 27,826 Wholesale Trade 3.67% 61,293 Construction 6.19% 103,431 Accommodation & Food Services 54,343 148,218 3.25% 8.87% Arts, Entertainment & Recreation Other Total 1,671,261 $ 100.00% $ Loan Types Non - Owner Occupied Commercial & Industrial Multi - Family Owner Occupied 657,146 309,221 425,373 169,914 39.32% 18.50% 25.45% 10.17% 68.58% 2.91% 8.87% 3.25% 6.19% 3.67% 1.66% 4.87% NAICS Descriptions Real Estate, Rental & Leasing Manufacturing Health Care & Social Assistance Wholesale Trade Construction Accommodation & Food Services Arts, Entertainment & Recreation Other Commercial Loan Portfolio – September 30, 2025 39.32% 10.17% 25.45% 6.56% 109,607 Construction Construction 100.00% $ 1,671,261 Total 18.50% 6.56% Loan Types Non - Owner Occupied Commercial & Industrial Multi - Family Owner Occupied *September 30, 2025 figures unaudited 27 Chemung Financial Corporation 654 289 64 4 0 100 200 300 400 500 600 700 < $1.0MM $1.0MM - $5.0MM $5.0MM - $10.0MM > $10.0MM Number of CRE Loans by Balance Multifamily 33.8% Retail 18.2% Office 9.7% Construction 8.1% Hotel 5.5% Warehouse 7.3% Other 17.5% $1.36 Billion Commercial Real Estate As of September 30, 2025 CRE Portfolio Metrics $1.35 million Average loan size $0.38 million / .03% of total CRE Past due 30 - 89 days $3.12 million / 0.23% of total CRE Nonaccrual $52.16 million / 3.83% of total CRE Special mention $4.45 million or 0.33% of total CRE Classified 13.68% of total CRE CRE < $1 million *September 30, 2025 figures unaudited 28 Chemung Financial Corporation

Powered by Bing © GeoNames, Microsoft, TomTom Series1 % of CRE Loans 9/30/25 Balances ($ Thousands) Region 61.8% $ 841,640 Capital Region 16.6% 226,048 Southern Tier & Finger Lakes 16.5% 224,642 Western New York 5.1% 69,710 Other 100.0% $ 1,362,040 Total Commercial Real Estate $61.2 Million in CRE Loan Balances outside of New York State ▪ Focused on loans in existing markets. ▪ Continued strong CRE growth across footprint. ▪ Additional capital provides raw materials for growth.
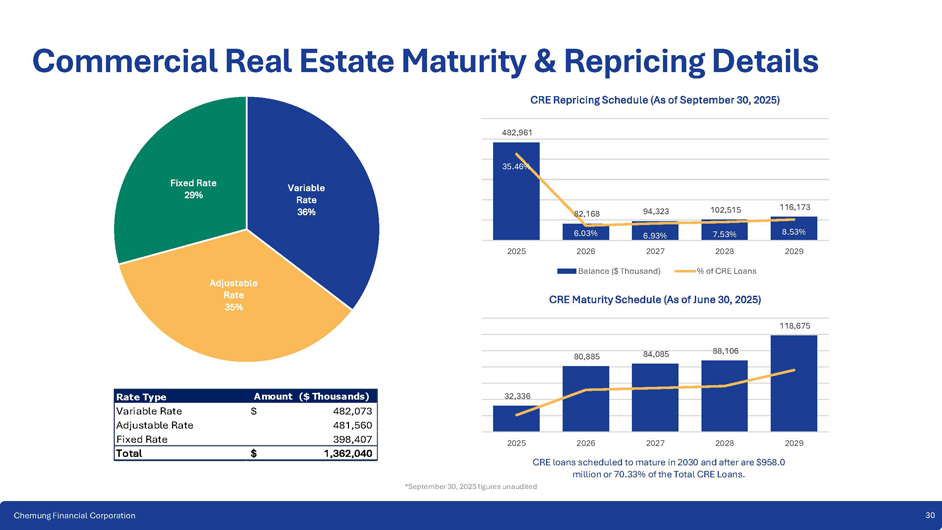
CRE Loan Balances by Collateral County CRE Loan Balance 150,000,000.00 75,000,000.00 - *September 30, 2025 figures unaudited 29 Chemung Financial Corporation CRE Repricing Schedule (As of September 30, 2025) 482,961 82,168 94,323 102,515 116,173 35.46% 8.53% 7.53% 6.93% 6.03% 2029 2028 2027 2026 2025 Balance ($ Thousand) % of CRE Loans CRE Maturity Schedule (As of June 30, 2025) Variable Rate 36% Adjustable Rate 35% Fixed Rate 29% ($ Thousands) Amount Rate Type 482,073 $ Variable Rate 481,560 Adjustable Rate 398,407 Fixed Rate 1,362,040 $ Total Commercial Real Estate Maturity & Repricing Details 2026 2027 2028 2029 CRE loans scheduled to mature in 2030 and after are $958.0 million or 70.33% of the Total CRE Loans.
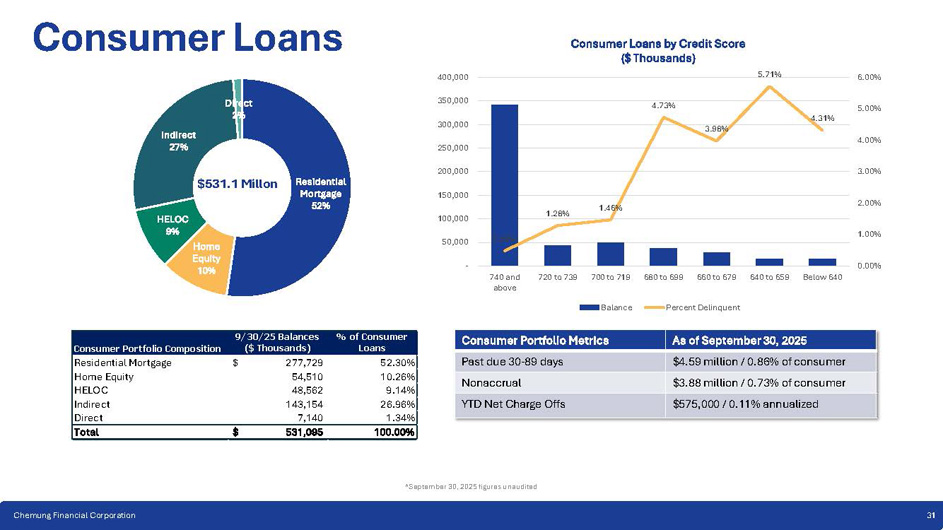
32,336 *September 30, 2025 figures unaudited 30 Chemung Financial Corporation 80,885 84,085 88,106 118,675 2025 % of Consumer Loans 9/30/25 Balances ($ Thousands) Consumer Portfolio Composition 52.30% $ 277,729 Residential Mortgage 10.26% 54,510 Home Equity 9.14% 48,562 HELOC 26.96% 143,154 Indirect 1.34% 7,140 Direct 100.00% $ 531,095 Total 0.48% 1.28% 1.46% 4.73% 3.98% Consumer Loans by Credit Score ($ Thousands) 5.71% 4.31% 0.00% 1.00% 2.00% 3.00% 4.00% 5.00% 6.00% - 50,000 100,000 150,000 200,000 250,000 300,000 350,000 400,000 740 and above 720 to 739 700 to 719 680 to 699 660 to 679 640 to 659 Below 640 Balance Percent Delinquent $531.1 Millon Residential Mortgage 52% Home Equity 10 % HELOC 9% Direct 2% Indirect 27% Consumer Loans As of September 30, 2025 Consumer Portfolio Metrics $4.59 million / 0.86% of consumer Past due 30 - 89 days $3.88 million / 0.73% of consumer Nonaccrual $575,000 / 0.11% annualized YTD Net Charge Offs *September 30, 2025 figures unaudited 31 Chemung Financial Corporation Fixed Rate Loans by Maturity Date 2035 & Greater 2034 2033 2032 2031 2030 2029 2028 2027 2025 & 2026 35,631,487 3,547,741 4,323,655 7,901,845 22,954,421 34,227,806 44,083,256 34,063,057 12,438,477 3,050,583 Consumer 171,128,177 7,816,773 3,231,520 6,655,537 7,660,833 6,061,694 3,195,192 2,359,786 1,457,386 11,338,791 Residential 17,260,750 3,399,539 21,687,507 57,480,167 37,726,996 57,488,900 53,371,312 63,421,538 39,654,034 56,590,067 Commercial 4.47% 4.58% 5.38% 4.22% 5.63% 6.37% 6.36% 4.91% 4.84% 5.81% WA Rate 5.81% 4.84% 4.91% 6.36% 6.37% 5.63% 4.22% 5.38% 4.58% 4.47% 0.00% 1.00% 2.00% 3.00% 4.00% 5.00% 6.00% 7.00% - 50,000 100,000 150,000 200,000 250,000 As of September 30, 2025 ($ Thousands) Commercial Residential Consumer WA Rate *September 30, 2025 figures unaudited 32 Chemung Financial Corporation


0.30% 0.35% 0.00% 0.10% 0.20% 0.30% 0.40% 0.50% 0.60% Non - Performing Loans and Assets (% of Total) Non - performing assets to total assets Non - performing loans to total loans *September 30, 2025 figures unaudited. 33 Chemung Financial Corporation Trends in Non - Performing Assets $7,762 $7,972 $5,000 $7,500 $10,000 $12,500 $15,000 Non - Performing Loans and Assets ($ Thousands) Non Performing Loans Non Performing Assets *September 30, 2025 figures unaudited.


Investments 35
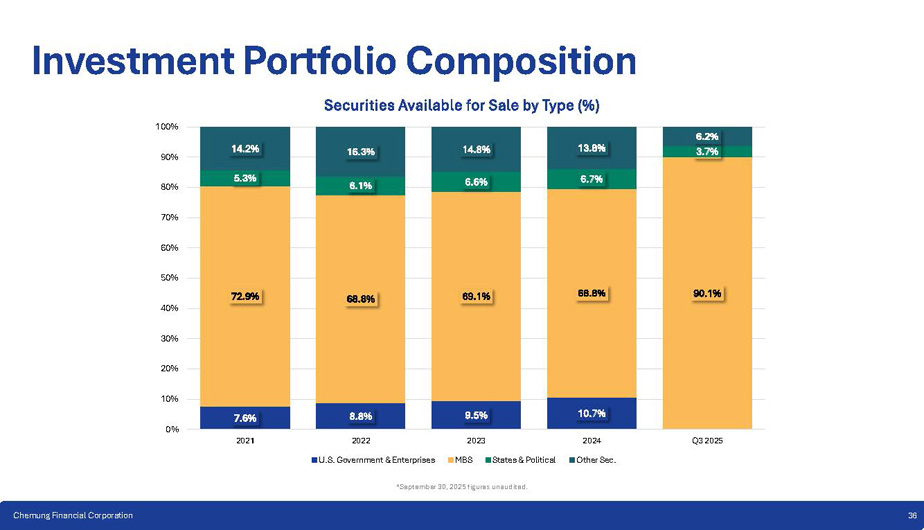
34 Chemung Financial Corporation Trends in Non - Performing Assets 7.6% 8.8% 9.5% 10.7% 72.9% 68.8% 69.1% 68.8% 90.1% 5.3% 6.1% 6.6% 6.7% 3.7% 14.2% 16.3% 14.8% 13.8% 6.2% 0% 40% 30% 20% 10% 70% 60% 50% 80% 90% 100% 2021 2022 U.S. Government & Enterprises 2023 MBS 2024 Other Sec. Q3 2025 Securities Available for Sale by Type (%) States & Political Investment Portfolio Composition *September 30, 2025 figures unaudited. 36 Chemung Financial Corporation 2.34% 5.1 3.0 3.5 4.0 4.5 5.0 5.5 6.0 6.5 7.0 1.50% 1.70% 1.90% 2.10% 2.30% 2.50% 2021 2022 2023 2024 Q3 2025 Investment Portfolio Yield Duration - Years *September 30, 2025 figures unaudited.

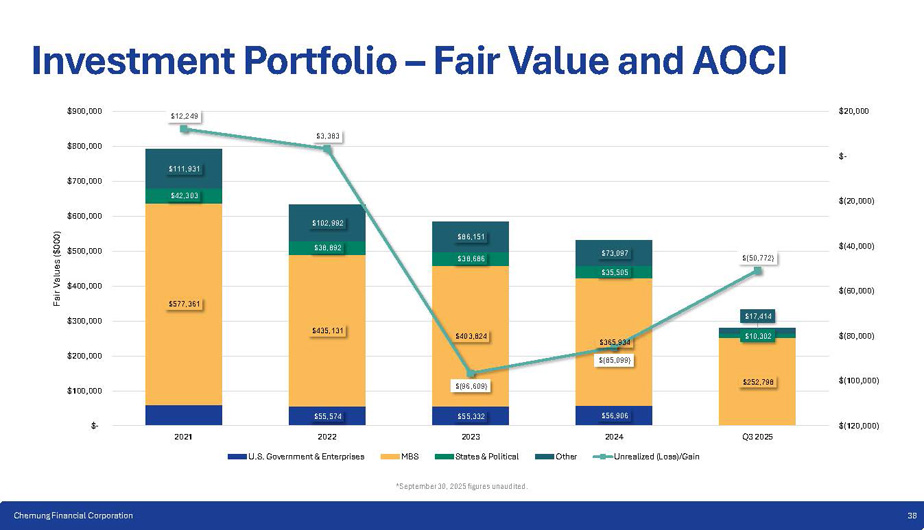
37 Chemung Financial Corporation Investment Portfolio - Yield & Duration ▪ Utilizing proceeds from securities sales to reduce wholesale funding and support future loan growth ▪ Approximately $2 million a month in projected cash flows ▪ Principal cash flows representing 35% to 40% of the portfolio to be received in the next five years $55,574 $55,332 $56,906 $577,361 $435,131 $403,824 $365,934 $252,798 $42,303 $38,892 $38,686 $35,505 $10,302 $111,931 $102,992 $86,151 $73,097 $17,414 $12,249 $3,383 $(96,609) $(85,099) $(50,772) $(120,000) $(100,000) $(80,000) $(60,000) $(40,000) $(20,000) $ - $20,000 $ - $100,000 $200,000 $300,000 $400,000 $500,000 $600,000 $700,000 $800,000 $900,000 2021 2022 U.S. Government & Enterprises 2023 States & Political Q3 2025 Fair Values ($000) MBS Other 2024 Unrealized (Loss)/Gain *September 30, 2025 figures unaudited.

Deposits 39
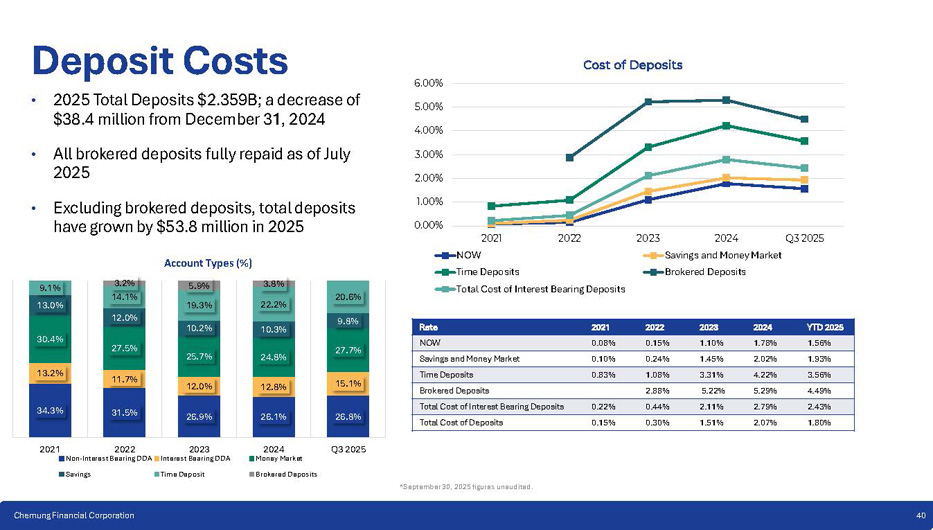
38 Chemung Financial Corporation Investment Portfolio – Fair Value and AOCI 34.3% 31.5% 26.8% 13.2% 11.7% 15.1% 30.4% 27.5% 27.7% 13.0% 12.0% 10.3% 10.2% 24.8% 25.7% 12.8% 12.0% 26.1% 26.9% 9.8% 9.1% 14.1% 19.3% 22.2% 20.6% 3.2% 5.9% 3.8% 2021 2022 Non - Interest Bearing DDA Savings 2023 Interest Bearing DDA Time Deposit 2024 Money Market Brokered Deposits Q3 2025 Account Types (%) 0.00% 1.00% 2.00% 3.00% 4.00% 5.00% 6.00% 2021 2022 2023 2024 Savings and Money Market Brokered Deposits Q3 2025 Cost of Deposits NOW Time Deposits Total Cost of Interest Bearing Deposits *September 30, 2025 figures unaudited. 40 Chemung Financial Corporation YTD 2025 2024 2023 2022 2021 Rate 1.56% 1.78% 1.10% 0.15% 0.08% NOW 1.93% 2.02% 1.45% 0.24% 0.10% Savings and Money Market 3.56% 4.22% 3.31% 1.08% 0.83% Time Deposits 4.49% 5.29% 5.22% 2.88% Brokered Deposits 2.43% 2.79% 2.11% 0.44% 0.22% Total Cost of Interest Bearing Deposits 1.80% 2.07% 1.51% 0.30% 0.15% Total Cost of Deposits Deposit Costs • 2025 Total Deposits $2.359B; a decrease of $38.4 million from December 31, 2024 • All brokered deposits fully repaid as of July 2025 • Excluding brokered deposits, total deposits have grown by $53.8 million in 2025 52.8% 51.2% 50.2% 50.4% 43.8% 45.0% 44.1% 42.0% 44.9% 45.2% 24.1% 26.9% 28.4% 29.4% 34.0% 34.1% 30.1% 28.2% 29.0% 30.8% 9.1% 9.1% 9.1% 8.7% 6.6% 7.5% 6.8% 6.3% 6.1% 8.7% 5.9% 3.8% 14.0% 12.8% 12.3% 11.5% 15.6% 13.4% 15.9% 17.6% 16.2% 15.3% Deposits by Customer (%) Consumer Commerical Public Brokered ICS / CDARS *September 30, 2025 figures unaudited.


41 Chemung Financial Corporation Deposit Composition $1,738.0 $1,815.5 $1,899.8 $1,892.2 $1,930.2 $415.6 $435.2 $381.0 $399.4 $381.4 $73.5 $142.8 $92.2 $1.8 $3.0 $5.8 $13.1 $46.9 33.6% 30.1% 27.0% 27.2% 31.4% 0.0% 10.0% 20.0% 30.0% 40.0% 50.0% 60.0% 70.0% 80.0% 90.0% 100.0% $ - $500 $1,000 $1,500 $2,000 $2,500 $3,000 2021 2023 Q3 2025 Deposits by Division ($ Millions) CCTC 2022 Capital Bank Brokered Western New York 2024 Uninsured Deposits Deposit Composition 42 Chemung Financial Corporation *CAGR 12/31/2020 to 9/30/2025, excluding brokered deposits *September 30, 2025 figures unaudited.
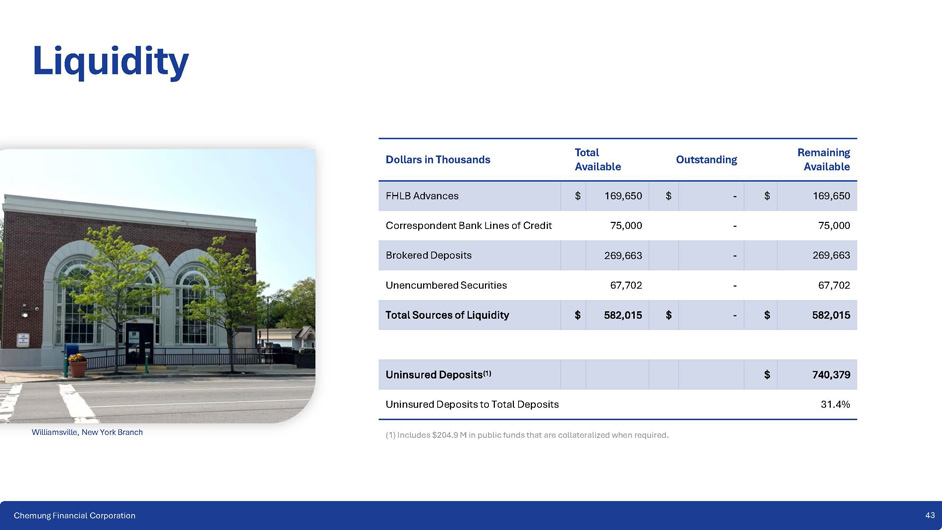
Liquidity Williamsville, New York Branch $ - $ 169,650 $ 169,650 FHLB Advances - 75,000 75,000 Correspondent Bank Lines of Credit - 269,663 269,663 Brokered Deposits - 67,702 67,702 Unencumbered Securities $ - $ 582,015 $ 582,015 Total Sources of Liquidity $ 740,379 Uninsured Deposits (1) 31.4% Uninsured Deposits to Total Deposits (1) Includes $204.9 M in public funds that are collateralized when required.
Performance 44
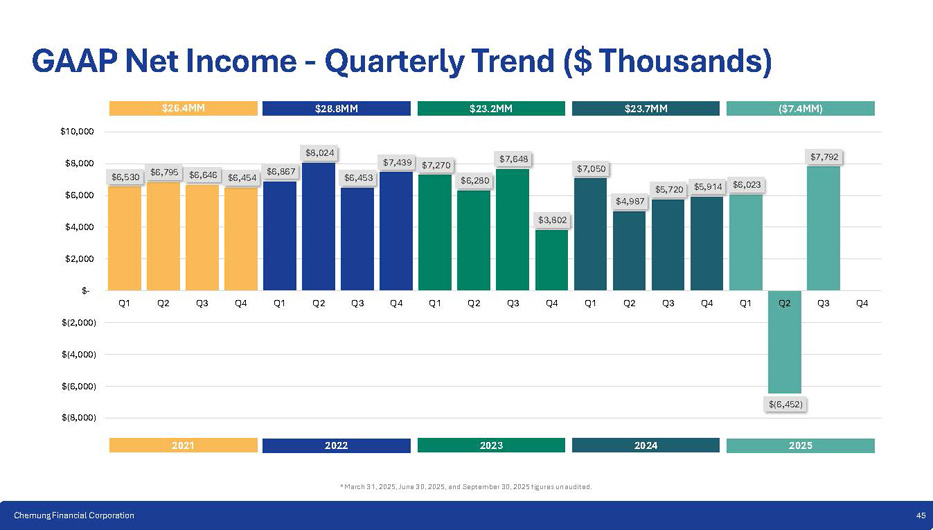
Dollars in Thousands 43 Chemung Financial Corporation Total Available Outstanding Remaining Available $6,530 $6,795 $6,646 $6,454 $6,867 $8,024 $6,453 $7,439 $7,270 $6,280 $7,648 $3,802 $7,050 $4,987 $5,720 $5,914 $6,023 $(6,452) $7,792 $(8,000) $(2,000) $(4,000) $(6,000) $2,000 $ - $4,000 $6,000 $8,000 $10,000 Q1 Q2 Q3 Q4 Q1 Q2 Q3 Q4 Q1 Q2 Q3 Q4 Q1 Q2 Q3 Q4 Q1 Q2 Q3 Q4 GAAP Net Income - Quarterly Trend ($ Thousands) $26.4MM $28.8MM $23.2MM $23.7MM ($7.4MM) 2021 2022 *March 31, 2025, June 30, 2025, and September 30, 2025 figures unaudited.
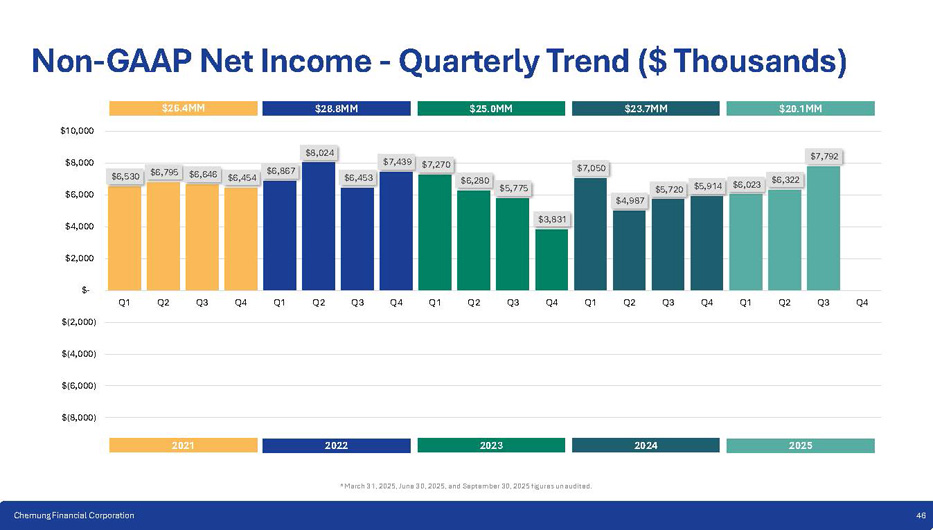
45 Chemung Financial Corporation 2023 2024 2025 $6,530 $6,795 $6,646 $6,454 $6,867 $8,024 $6,453 $7,439 $7,270 $6,280 $5,775 $3,831 $7,050 $4,987 $5,720 $5,914 $6,023 $6,322 $7,792 $(2,000) $(4,000) $(6,000) $(8,000) $2,000 $ - $4,000 $6,000 $8,000 $10,000 Q1 Q2 Q3 Q4 Q1 Q2 Q3 Q4 Q1 Q2 Q3 Q4 Q1 Q2 Q3 Q4 Q1 Q2 Q3 Q4 Non - GAAP Net Income - Quarterly Trend ($ Thousands) $26.4MM $28.8MM $25.0MM $23.7MM $20.1MM 2021 2022 *March 31, 2025, June 30, 2025, and September 30, 2025 figures unaudited.

46 Chemung Financial Corporation 2023 2024 2025 2021 2022 2023 2024 2025 Q1 2.86% 2.87% 3.14% 2.73% 2.96% Q2 2.76% 2.97% 2.87% 2.66% 3.05% Q3 2.88% 3.08% 2.73% 2.72% 3.45% Q4 2.85% 3.26% 2.69% 2.92% 0.00% 0.50% 1.00% 1.50% 2.00% 2.50% 3.00% 3.50% 4.00% Fully Taxable Equivalent Net Interest Margin (%) Q1 Q2 Q3 Q4 *March 31, 2025, June 30, 2025, and September 30, 2025 figures unaudited. 47 Chemung Financial Corporation Net Interest Margin ▪ 36.4% of the loan portfolio reprices or matures within the next 90 days ▪ 45.2% of the commercial loan portfolio reprices or matures within the next 90 days ▪ 73.7% of the commercial loan portfolio reprices or matures within the next 5 years ▪ 75.5% of the commercial loan portfolio is variable or adjustable 2.84% 3.05% 2.85% 2.76% 3.15% *September 30, 2025 figures unaudited.
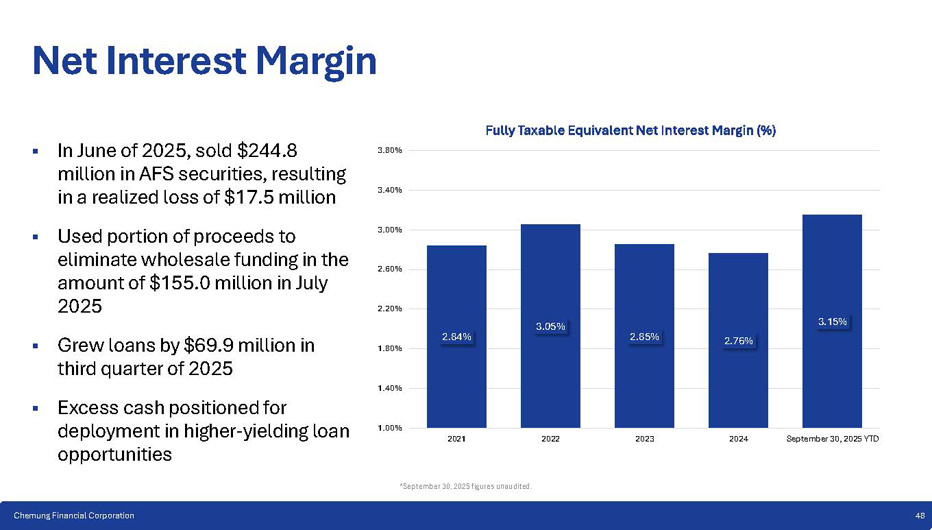
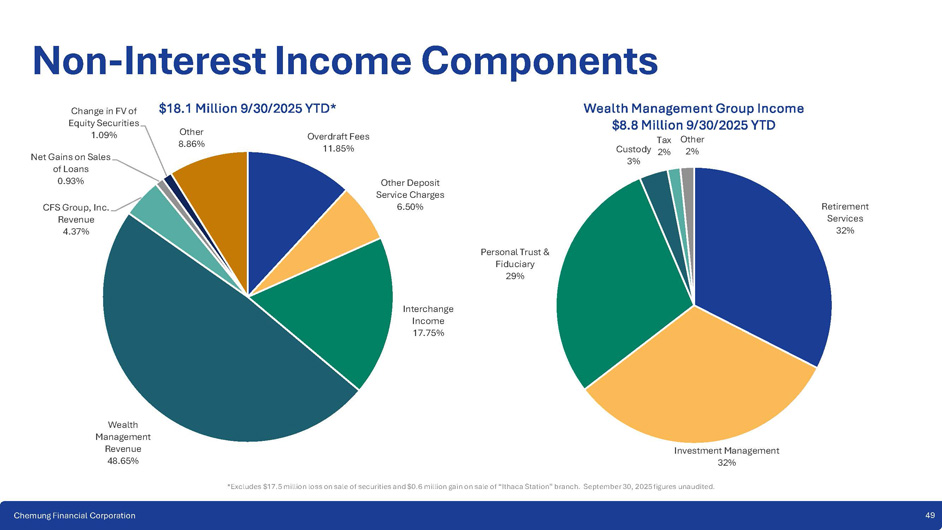
48 Chemung Financial Corporation 1.00% 1.40% 1.80% 2.20% 2.60% 3.00% 3.40% 3.80% 2021 2022 2023 2024 September 30, 2025 YTD Fully Taxable Equivalent Net Interest Margin (%) Net Interest Margin ▪ In June of 2025, sold $244.8 million in AFS securities, resulting in a realized loss of $17.5 million ▪ Used portion of proceeds to eliminate wholesale funding in the amount of $155.0 million in July 2025 ▪ Grew loans by $69.9 million in third quarter of 2025 ▪ Excess cash positioned for deployment in higher - yielding loan opportunities Overdraft Fees 11.85% Other Deposit Service Charges 6.50% Personal Trust & Fiduciary 29% Interchange Income 17.75% Wealth Management Revenue 48.65% CFS Group, Inc. Revenue 4.37% Change in FV of Equity Securities 1.09% Net Gains on Sales of Loans 0.93% 8.86% $18.1 Million 9/30/2025 YTD* Other Non - Interest Income Components Retirement Services 32% *Excludes $17.5 million loss on sale of securities and $0.6 million gain on sale of “Ithaca Station” branch. September 30, 2025 figures unaudited. 49 Chemung Financial Corporation Investment Management 32% Tax Other Custody 2% 2% 3% Wealth Management Group Income $8.8 Million 9/30/2025 YTD
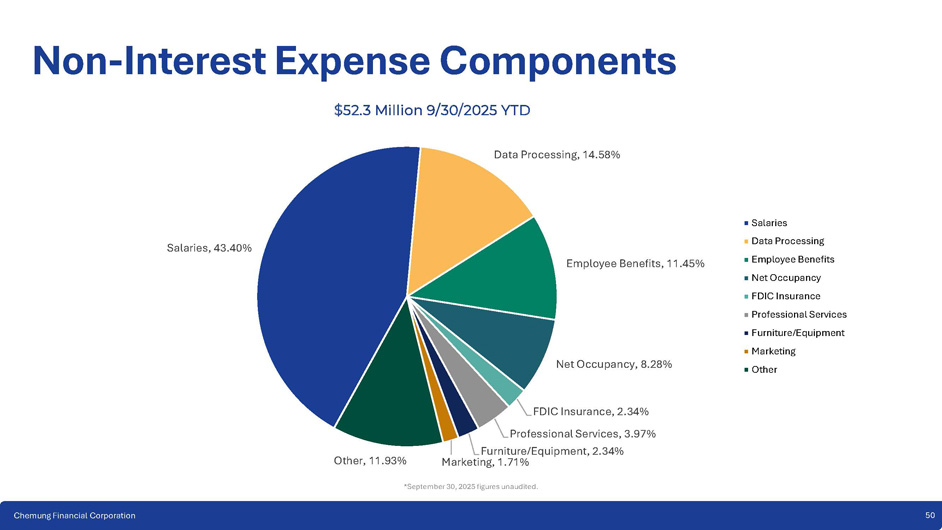
Salaries, 43.40% Employee Benefits, 11.45% Net Occupancy, 8.28% FDIC Insurance, 2.34% Professional Services, 3.97% Furniture/Equipment, 2.34% Marketing, 1.71% Other, 11.93% $52.3 Million 9/30/2025 YTD Data Processing, 14.58% Salaries Data Processing Employee Benefits Net Occupancy FDIC Insurance Professional Services Furniture/Equipment Marketing Other Non - Interest Expense Components *September 30, 2025 figures unaudited. 50 Chemung Financial Corporation 67.95 65.71 61.71 61.71 66.20 68.89 64.08 *September 30, 2025 figures unaudited.
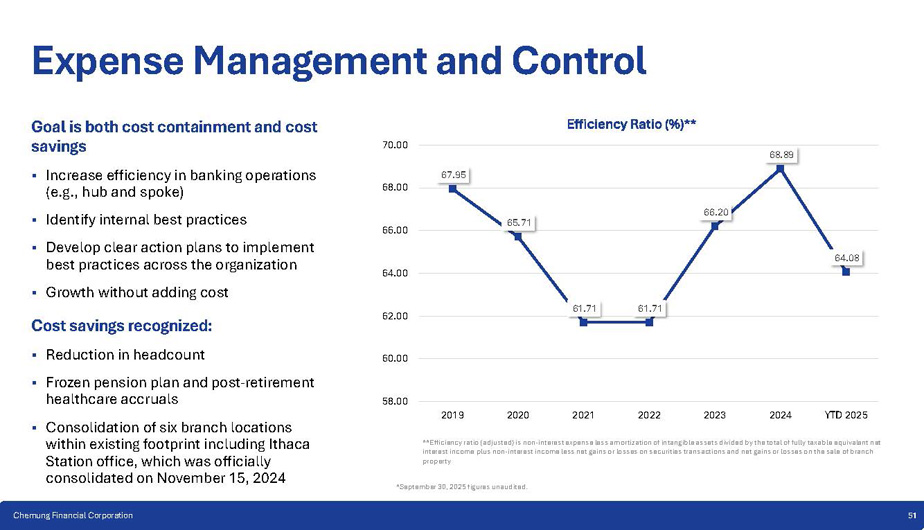
51 Chemung Financial Corporation 58.00 60.00 62.00 64.00 66.00 68.00 70.00 2019 2020 2021 2022 2023 2024 YTD 2025 **Efficiency ratio (adjusted) is non - interest expense less amortization of intangible assets divided by the total of fully taxable equivalent net interest income plus non - interest income less net gains or losses on securities transactions and net gains or losses on the sale of branch property Efficiency Ratio (%)** Expense Management and Control Goal is both cost containment and cost savings ▪ Increase efficiency in banking operations (e.g., hub and spoke) ▪ Identify internal best practices ▪ Develop clear action plans to implement best practices across the organization ▪ Growth without adding cost Cost savings recognized: ▪ Reduction in headcount ▪ Frozen pension plan and post - retirement healthcare accruals ▪ Consolidation of six branch locations within existing footprint including Ithaca Station office, which was officially consolidated on November 15, 2024 8.06% 8.23% 8.62% 9.18% 9.66% 12.96% 12.08% 12.30% 12.26% 14.21% 12.57% 11.54% 13.26% 13.35% 15.44% 7.91% 5.51% 6.45% 7.02% 8.36% 4% 6% 8% 10% 12% 14% 16% 18% Chemung Financial Corporation - Capital Ratios (%) Tier 1 Leverage Tier 1 Capital / CET1 Total Capital TCE Ratio *September 30, 2025 figures unaudited.
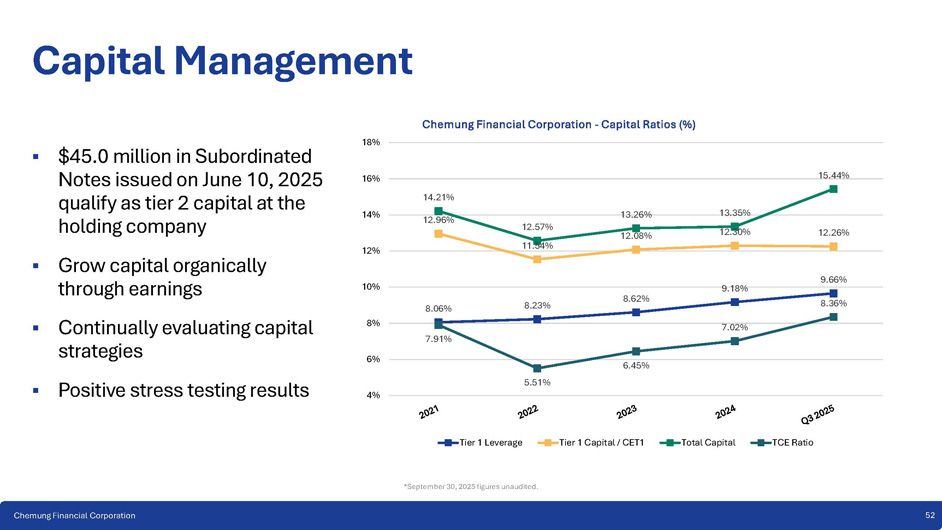
52 Chemung Financial Corporation Capital Management ▪ $45.0 million in Subordinated Notes issued on June 10, 2025 qualify as tier 2 capital at the holding company ▪ Grow capital organically through earnings ▪ Continually evaluating capital strategies ▪ Positive stress testing results Q3 2025 2024 2023 2022 2021 $1.53 $4.96 $5.28 $6.13 $5.64 EPS $0.98 $1.24 $1.24 $1.24 $1.19 Dividends / Share $50.98 $45.13 $41.07 $35.32 $45.09 Book Value / Share $46.44 $40.55 $36.48 $30.69 $40.44 Tangible Book Value / Share $ - *September 30, 2025 figures unaudited.
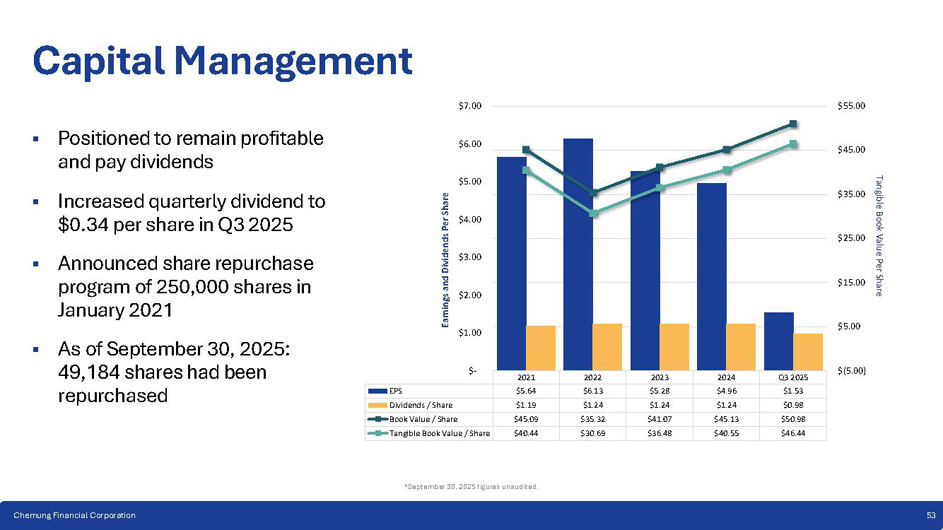
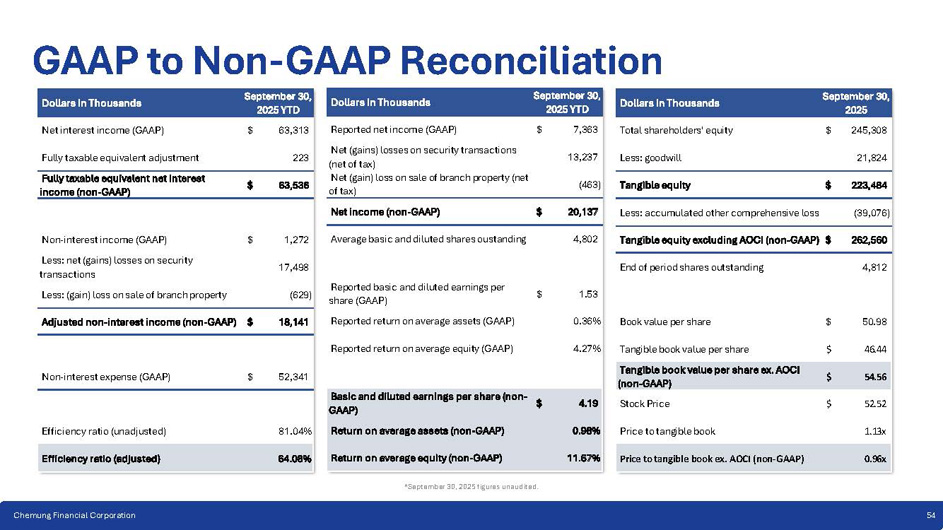
53 Chemung Financial Corporation $1.00 $2.00 $3.00 $4.00 $5.00 $6.00 $7.00 $(5.00) $5.00 $15.00 $25.00 $35.00 $45.00 $55.00 Earnings and Dividends Per Share Tangible Book Value Per Share Capital Management ▪ Positioned to remain profitable and pay dividends ▪ Increased quarterly dividend to $0.34 per share in Q3 2025 ▪ Announced share repurchase program of 250 , 000 shares in January 2021 ▪ As of September 30, 2025: 49,184 shares had been repurchased GAAP to Non - GAAP Reconciliation Dollars in Thousands September 30, 2025 YTD Net interest income (GAAP) $ 63,313 Fully taxable equivalent adjustment 223 Fully taxable equivalent net interest $ 63,536 income (non - GAAP) Non - interest income (GAAP) $ 1,272 Less: net (gains) losses on security 17,498 transactions Less: (gain) loss on sale of branch property (629) Adjusted non - interest income (non - GAAP) $ 18,141 Non - interest expense (GAAP) $ 52,341 Efficiency ratio (unadjusted) 81.04% Efficiency ratio (adjusted) 64.08% Dollars in Thousands September 30, 2025 YTD Reported net income (GAAP) $ 7,363 Net (gains) losses on security transactions 13,237 (net of tax) Net (gain) loss on sale of branch property (net (463) of tax) Net income (non - GAAP) $ 20,137 Average basic and diluted shares oustanding 4,802 Reported basic and diluted earnings per $ 1.53 share (GAAP) Reported return on average assets (GAAP) 0.36% Reported return on average equity (GAAP) 4.27% Basic and diluted earnings per share (non - $ 4.19 GAAP) Return on average assets (non - GAAP) 0.98% Return on average equity (non - GAAP) 11.67% Dollars in Thousands September 30, 2025 Total shareholders' equity $ 245,308 Less: goodwill 21,824 Tangible equity $ 223,484 Less: accumulated other comprehensive loss (39,076) Tangible equity excluding AOCI (non - GAAP) $ 262,560 End of period shares outstanding 4,812 Book value per share $ 50.98 Tangible book value per share $ 46.44 Tangible book value per share ex. AOCI (non - GAAP) $ 54.56 Stock Price $ 52.52 Price to tangible book 1.13x Price to tangible book ex. AOCI (non - GAAP) 0.96x *September 30, 2025 figures unaudited.

54 Chemung Financial Corporation 4.8 million Shares Outstanding $252.7M Market Capitalization $0.98 YTD Dividend Per Share 2.46% Dividend Yield (TTM) 13,567 Average Daily Volume^ $50.98 Book Value Per Share $46.44 Tangible Book Value Per Share $52.52 Stock Price 9.67x Price to Earnings (TTM)* 1.13x Price to Tangible Book 0.98% Return on Average Assets* 11.67% Return on Average Equity* 55 Chemung Financial Corporation CHMG Stock At a Glance 5 As of September 30, 2025 (unaudited). *Based on non - GAAP net income. ^YTD, September 30,2025 (unaudited).
One Chemung Canal Plaza Elmira, New York 14901 Anders Tomson 607 737 - 3756 atomson@chemungcanal.com Get In Touch Chemung Financial Corporation is a $2.7 billion financial services holding company headquartered in Elmira, New York and operates 30 retail offices through its principal subsidiary, Chemung Canal Trust Company, a full - service community bank with trust powers. Established in 1833, Chemung Canal Trust Company is the oldest locally - owned and managed community bank in New York State. Chemung Financial Corporation is also the parent of CFS Group, Inc., a financial services subsidiary offering non - traditional services including mutual funds, annuities, brokerage services, tax preparation services and insurance. Dale McKim 607 737 - 3714 dmckim@chemungcanal.com 56 Chemung Financial Corporation