UNITED STATES
SECURITIES AND EXCHANGE COMMISSION
Washington, D.C. 20549
FORM 6-K
REPORT OF FOREIGN PRIVATE ISSUER PURSUANT TO RULE 13a-16 OR 15d-16 UNDER THE SECURITIES EXCHANGE ACT OF 1934
For the month of October 2025
Commission File Number: 001-14642
ING Groep N.V.
(Translation of registrant's name into English)
Bijlmerdreef 106
1102 CT Amsterdam
The Netherlands
(Address of principal executive office)
Indicate by check mark whether the registrant files or will file annual reports under cover of Form 20-F or Form 40-F.
Form 20-F [ X ] Form 40-F [ ]
On October 30, 2025, the Registrant issued a press release, a copy of which is attached hereto as Exhibit 99.1 and is incorporated herein by reference.
(c) Exhibit 99.1. Press release dated October 30, 2025
SIGNATURES
Pursuant to the requirements of the Securities Exchange Act of 1934, the registrant has duly caused this report to be signed on its behalf by the undersigned, thereunto duly authorized.
| ING Groep N.V. | ||
| (Registrant) | ||
| Date: October 30, 2025 | /s/ Raymond Vermeulen | |
| Raymond Vermeulen | ||
| Head of Media Relations & Issue Management | ||
Exhibit 99.1
ING posts 3Q2025 net result of €1,787 million, with strong growth in fee income and customer lending Profit before tax increases quarter - on - quarter to €2,560 million; CET1 ratio rises to 13.4% • Continued growth in Retail Banking with increases in mobile primary customer base, lending portfolio and fee income; resilient commercial net interest income • Strong performance of Wholesale Banking, with increased loan underwriting activity and higher lending volumes driving robust fee income, complemented by continued disciplined capital management • Operating expenses remain under control; risk costs remain below our through - the - cycle average, reflecting the high quality of our assets • We announce a €1.6 billion distribution CEO statement “ING has had a strong third quarter of 2025 as we continued to execute our strategy to accelerate growth, increase our impact and deliver customer value, and we are on track to reach our financial targets for 2027," said Steven van Rijswijk, CEO of ING. "While macroeconomic and geopolitical uncertainty remains prevalent, a growing number of customers continue to place their trust in us. Customer lending has increased and fee income has grown at a strong pace. Commercial net interest income has increased quarter - on - quarter, supported by higher business volume. “In Retail Banking, we have gained almost 200,000 mobile primary customers during a seasonally slower quarter, and 1.1 million, or 8%, year - on - year, which is in line with our growth target of 1 million mobile primary customers per year. Growth has been particularly strong in Germany, Spain, Italy and Romania. Retail lending has grown by €8.6 billion, mainly in mortgages. In Business Banking, lending volumes were stable, with increases in the Netherlands and Poland offset by a decline in Belgium. Retail fee income has risen 14% year - on - year, mainly from investment products as more customers started investing with us. Following significant inflows in previous quarters, deposits have decreased, reflecting seasonal impacts and the conclusion of successful campaigns in Germany and Belgium, with part of these funds moving into investment products. “In Wholesale Banking, corporate loan demand has picked up, driving lending growth to €5.7 billion and a 19% growth in fee income year - on - year. Financial Markets income has also improved, and Trade Finance Services and Working Capital Solutions continued to perform well too. Deposits have grown strongly by €7 billion, reflecting growth in volumes in Payments & Cash Management, Financial Markets and in our cash pooling business. “During the quarter we published our Climate Update, which details our ongoing efforts to help accelerate the transition to a low - carbon economy. In the first nine months of 2025, amid more volatile market circumstances, we increased our sustainable volume mobilised by 29% year - on - year to €110 billion, as we continued to support our clients in their sustainable transitions. “Expenses have increased year - on - year, mainly attributable to wage inflation and investments in business growth, as well as to initiatives to further enhance the digital customer experience and the scalability of our systems. Compared with the second quarter, expenses decreased, partly attributable to lower restructuring costs in Wholesale Banking. Risk costs remained below our through - the - cycle average. The four - quarter rolling average return on equity was 12.6%. “We have adjusted our CET1 capital ratio target to ~13% to cater for higher (expected) capital requirements. Operating at the right level of capital is in the best interest of all our stakeholders, including our customers and the economies where we do business. After completing the share buyback programme announced in May 2025, we today announce a distribution of €1.6 billion. “We are pleased with another set of strong results that show continued growth in our business.
We appreciate the ongoing trust our customers and clients place in us, as well as the continued commitment demonstrated by our employees.” Press release ING Corporate Communications Amsterdam, 30 October 2025 Investor enquiries E: investor.relations@ing.com Press enquiries T: +31 (0)20 576 5000 E: media.relations@ing.com Analyst call 30 October 2025 at 9:00 am CET +31 20 708 5074 (NL) +44 330 551 0202 (UK) (Registration required via invitation) Live audio webcast at www.ing.com Net core lending growth €14.2 bln in 3Q2025 Net core deposits growth € - 0.2 bln in 3Q2025 Profit before tax €2,560 mln - 4% vs 3Q2024 Fee income €1,165 mln +15% vs 3Q2024 CET1 ratio 13.4% +0.1% vs 2Q2025 Return on equity (4 - qtr rolling avg) 12.6% - 0.1% vs 2Q2025 Superior value for customers NPS score Retail Banking: Ranked #1 in 5 of 10 retail markets Mobile primary customers 1) : +197,000 in 3Q2025 Sustainability Volume mobilised 2) : €110.3 bln in 9M2025 vs €85.3 bln in 9M2024 ING Press Release 3Q2025 2 Sustainability deals supported by ING: 633 in 9M2025 vs 565 in 9M2024 Business Highlights We continue to support clients in their sustainability transitions, with the volume of sustainable finance mobilised reaching €110 billion, up 29% compared to the first nine months of last year. In September, we published our Climate Update 2025, which details our ongoing efforts to help accelerate the transition to a low - carbon economy. We provided an update on the actions we’re taking to achieve our ambitious targets to help clients drive down their greenhouse gas emissions, expand our sustainable finance initiatives and seek new ways to help people stay a step ahead on climate change. We finance the homes of a significant number of people, which enables us to support our customers in their sustainability journeys via our mortgage portfolio. In Belgium, customers can pause principal repayments for up to 12 months while making sustainability upgrades to their homes. We also offer retrofit discounts for customers who work with our renovation partners to make their homes more sustainable. We now have retrofitting and sustainable mortgage propositions in seven markets. We finance the energy transition by supporting renewable energy projects. ING in Germany supported NeXtWind in the largest financing of its kind for an independent wind energy provider in Germany. In Spain, we helped Sonnedix expand its solar portfolio to 2.4GW across six European countries and secure €1.3 billion in funding. Society is transitioning to a low - carbon economy. So are our clients, and so is ING. We finance a lot of sustainable activities, but we still finance more that’s not sustainable. See how we’re progressing at ing.com/climate. We have grown our mobile primary customer base by over 1.1 million, or 8%, since the third quarter of 2024, in line with our growth target of 1 million mobile primary customers a year. The increase primarily came from Germany, Spain, Italy and Romania. We have also maintained the number one NPS score in 5 out of 10 retail markets by continuing to deliver superior value to our customers. We are actively integrating generative AI capabilities throughout our organisation. We have launched the GenAI chatbot in six markets, enabling faster support for our customers. In consumer finance, we use AI to assess applicants and process loan applications automatically. In KYC, we use AI to detect unusual transaction patterns with the help of advanced analytics. AI improves customer protection and compliance while streamlining monitoring processes across multiple countries. In Business Banking, we have continued to expand our business, including a broadening of our product suite and the roll - out of improved digital processes for onboarding clients across our markets. We continue to attract more investment customers and have over €268 billion in assets under management and e - brokerage. To further leverage our scale and consolidate our investment capabilities, ING has launched a Global Investment Centre. Plan Ahead, our digital wealth management tool, is now active in the Netherlands, Belgium and Spain. The tool helps our Private Banking clients to actively manage their wealth planning in real time via the ING app and MyING. We also continuously innovate to make banking personal, easy, relevant and instant for our customers. ING customers in Germany can now use Wero, a pan - European alternative to international payment systems, to send and receive money instantly and free of charge via the ING app. Furthermore, ING is part of an initiative that is planning to issue a euro - denominated stablecoin. The stablecoin will offer near - instant, low - cost transactions and 24/7 access to efficient cross - border payments. In addition, ING was ranked number one in Europe in the Euromoney Cash Management Survey 2025 for corporates.
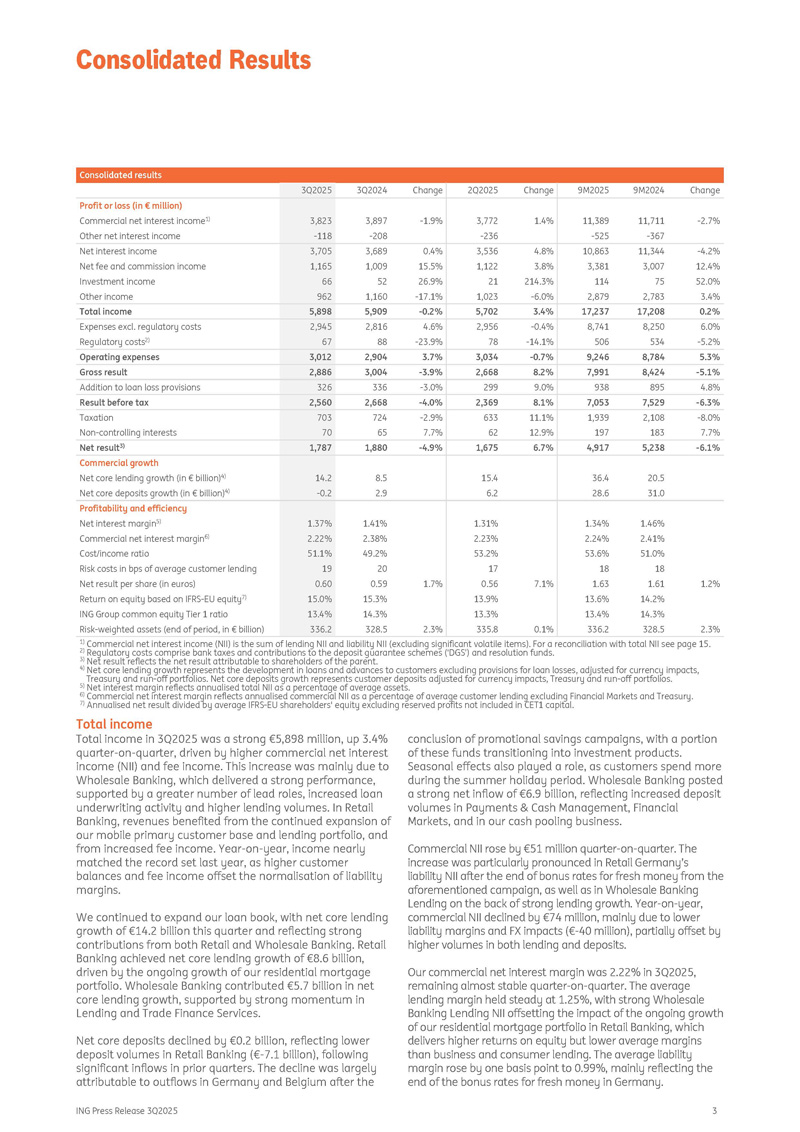
1) Includes private individuals only 2) See our Annual Report for definition ING Press Release 3Q2025 3 Consolidated results Change 9M2024 9M2025 Change 2Q2025 Change 3Q2024 3Q2025 - 2.7% 11,711 - 367 11,389 - 525 1.4% 3,772 - 236 - 1.9% 3,897 - 208 3,823 - 118 Profit or loss (in € million) Commercial net interest income 1) Other net interest income - 4.2% 11,344 10,863 4.8% 3,536 0.4% 3,689 3,705 Net interest income 12.4% 3,007 3,381 3.8% 1,122 15.5% 1,009 1,165 Net fee and commission income 52.0% 75 114 214.3% 21 26.9% 52 66 Investment income 3.4% 2,783 2,879 - 6.0% 1,023 - 17.1% 1,160 962 Other income 0.2% 17,208 17,237 3.4% 5,702 - 0.2% 5,909 5,898 Total income 6.0% 8,250 8,741 - 0.4% 2,956 4.6% 2,816 2,945 Expenses excl. regulatory costs - 5.2% 534 506 - 14.1% 78 - 23.9% 88 67 Regulatory costs 2) 5.3% 8,784 9,246 - 0.7% 3,034 3.7% 2,904 3,012 Operating expenses - 5.1% 8,424 7,991 8.2% 2,668 - 3.9% 3,004 2,886 Gross result 4.8% 895 938 9.0% 299 - 3.0% 336 326 Addition to loan loss provisions - 6.3% 7,529 7,053 8.1% 2,369 - 4.0% 2,668 2,560 Result before tax - 8.0% 2,108 1,939 11.1% 633 - 2.9% 724 703 Taxation 7.7% 183 197 12.9% 62 7.7% 65 70 Non - controlling interests - 6.1% 5,238 4,917 6.7% 1,675 - 4.9% 1,880 1,787 Net result 3) Commercial growth 20.5 36.4 15.4 8.5 14.2 Net core lending growth (in € billion) 4) 31.0 28.6 6.2 2.9 - 0.2 Net core deposits growth (in € billion) 4) Profitability and efficiency 1.46% 1.34% 1.31% 1.41% 1.37% Net interest margin 5) 2.41% 2.24% 2.23% 2.38% 2.22% Commercial net interest margin 6) 51.0% 53.6% 53.2% 49.2% 51.1% Cost/income ratio 18 18 17 20 19 Risk costs in bps of average customer lending 1.2% 1.61 1.63 7.1% 0.56 1.7% 0.59 0.60 Net result per share (in euros) 14.2% 13.6% 13.9% 15.3% 15.0% Return on equity based on IFRS - EU equity 7) 14.3% 13.4% 13.3% 14.3% 13.4% ING Group common equity Tier 1 ratio 2.3% 328.5 336.2 0.1% 335.8 2.3% 328.5 336.2 Risk - weighted assets (end of period, in € billion) 1) Commercial net interest income (NII) is the sum of lending NII and liability NII (excluding significant volatile items). For a reconciliation with total NII see page 15. 2) Regulatory costs comprise bank taxes and contributions to the deposit guarantee schemes (‘DGS’) and resolution funds. 3) Net result reflects the net result attributable to shareholders of the parent. 4) Net core lending growth represents the development in loans and advances to customers excluding provisions for loan losses, adjusted for currency impacts, Treasury and run - off portfolios. Net core deposits growth represents customer deposits adjusted for currency impacts, Treasury and run - off portfolios. 5) Net interest margin reflects annualised total NII as a percentage of average assets. 6) Commercial net interest margin reflects annualised commercial NII as a percentage of average customer lending excluding Financial Markets and Treasury. 7) Annualised net result divided by average IFRS - EU shareholders' equity excluding reserved profits not included in CET1 capital. Total income Total income in 3Q2025 was a strong €5,898 million, up 3.4% quarter - on - quarter, driven by higher commercial net interest income (NII) and fee income. This increase was mainly due to Wholesale Banking, which delivered a strong performance, supported by a greater number of lead roles, increased loan underwriting activity and higher lending volumes. In Retail Banking, revenues benefited from the continued expansion of our mobile primary customer base and lending portfolio, and from increased fee income. Year - on - year, income nearly matched the record set last year, as higher customer balances and fee income offset the normalisation of liability margins. We continued to expand our loan book, with net core lending growth of €14.2 billion this quarter and reflecting strong contributions from both Retail and Wholesale Banking. Retail Banking achieved net core lending growth of €8.6 billion, driven by the ongoing growth of our residential mortgage portfolio. Wholesale Banking contributed €5.7 billion in net core lending growth, supported by strong momentum in Lending and Trade Finance Services. Net core deposits declined by €0.2 billion, reflecting lower deposit volumes in Retail Banking (€ - 7.1 billion), following significant inflows in prior quarters. The decline was largely attributable to outflows in Germany and Belgium after the conclusion of promotional savings campaigns, with a portion of these funds transitioning into investment products. Seasonal effects also played a role, as customers spend more during the summer holiday period. Wholesale Banking posted a strong net inflow of €6.9 billion, reflecting increased deposit volumes in Payments & Cash Management, Financial Markets, and in our cash pooling business. Commercial NII rose by €51 million quarter - on - quarter. The increase was particularly pronounced in Retail Germany’s liability NII after the end of bonus rates for fresh money from the aforementioned campaign, as well as in Wholesale Banking Lending on the back of strong lending growth. Year - on - year, commercial NII declined by €74 million, mainly due to lower liability margins and FX impacts (€ - 40 million), partially offset by higher volumes in both lending and deposits. Our commercial net interest margin was 2.22% in 3Q2025, remaining almost stable quarter - on - quarter. The average lending margin held steady at 1.25%, with strong Wholesale Banking Lending NII offsetting the impact of the ongoing growth of our residential mortgage portfolio in Retail Banking, which delivers higher returns on equity but lower average margins than business and consumer lending. The average liability margin rose by one basis point to 0.99%, mainly reflecting the end of the bonus rates for fresh money in Germany. Consolidated Results Other NII increased both year - on - year and sequentially, almost entirely due to a reduced impact from accounting asymmetry in Financial Markets, with a corresponding offset in other income.
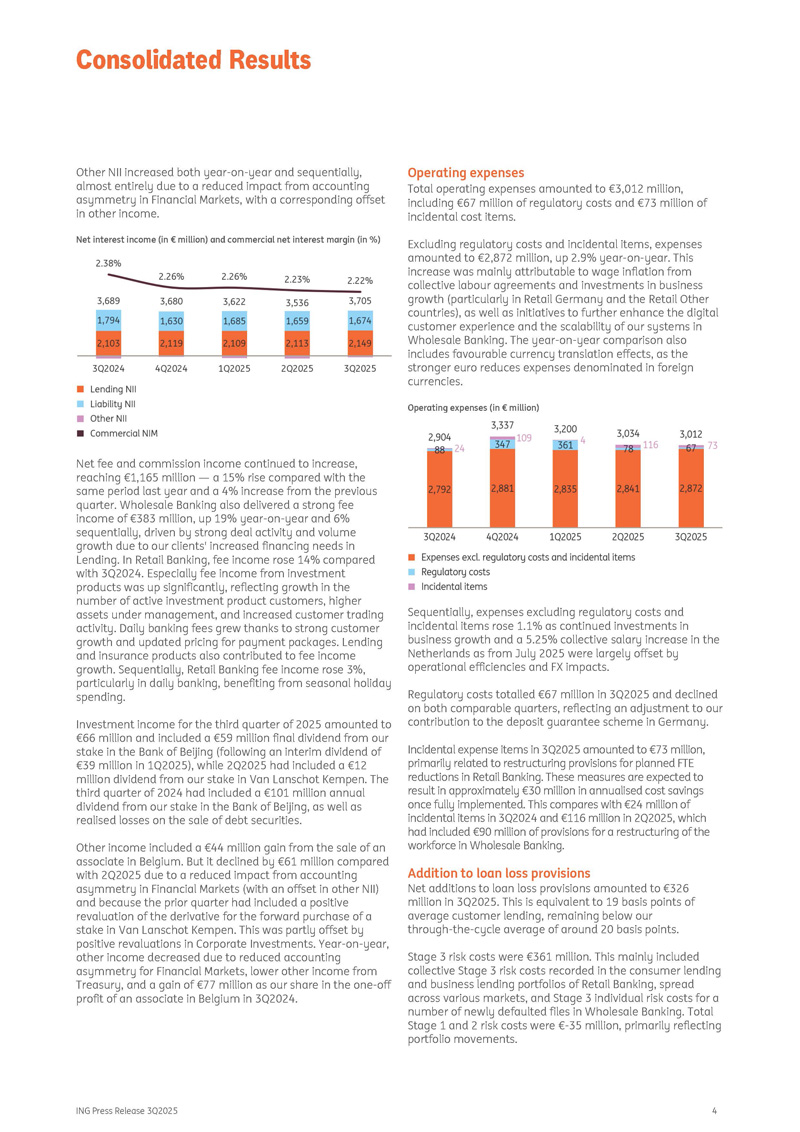
Net interest income (in € million) and commercial net interest margin (in %) Net fee and commission income continued to increase, reaching €1,165 million — a 15% rise compared with the same period last year and a 4% increase from the previous quarter. Wholesale Banking also delivered a strong fee income of €383 million, up 19% year - on - year and 6% sequentially, driven by strong deal activity and volume growth due to our clients' increased financing needs in Lending. In Retail Banking, fee income rose 14% compared with 3Q2024. Especially fee income from investment products was up significantly, reflecting growth in the number of active investment product customers, higher assets under management, and increased customer trading activity. Daily banking fees grew thanks to strong customer growth and updated pricing for payment packages. Lending and insurance products also contributed to fee income growth. Sequentially, Retail Banking fee income rose 3%, particularly in daily banking, benefiting from seasonal holiday spending. Investment income for the third quarter of 2025 amounted to €66 million and included a €59 million final dividend from our stake in the Bank of Beijing (following an interim dividend of €39 million in 1Q2025), while 2Q2025 had included a €12 million dividend from our stake in Van Lanschot Kempen. The third quarter of 2024 had included a €101 million annual dividend from our stake in the Bank of Beijing, as well as realised losses on the sale of debt securities. Other income included a €44 million gain from the sale of an associate in Belgium. But it declined by €61 million compared with 2Q2025 due to a reduced impact from accounting asymmetry in Financial Markets (with an offset in other NII) and because the prior quarter had included a positive revaluation of the derivative for the forward purchase of a stake in Van Lanschot Kempen. This was partly offset by positive revaluations in Corporate Investments. Year - on - year, other income decreased due to reduced accounting asymmetry for Financial Markets, lower other income from Treasury, and a gain of €77 million as our share in the one - off profit of an associate in Belgium in 3Q2024. Operating expenses Total operating expenses amounted to €3,012 million, including €67 million of regulatory costs and €73 million of incidental cost items. Excluding regulatory costs and incidental items, expenses amounted to €2,872 million, up 2.9% year - on - year. This increase was mainly attributable to wage inflation from collective labour agreements and investments in business growth (particularly in Retail Germany and the Retail Other countries), as well as initiatives to further enhance the digital customer experience and the scalability of our systems in Wholesale Banking. The year - on - year comparison also includes favourable currency translation effects, as the stronger euro reduces expenses denominated in foreign currencies. Operating expenses (in € million) Sequentially, expenses excluding regulatory costs and incidental items rose 1.1% as continued investments in business growth and a 5.25% collective salary increase in the Netherlands as from July 2025 were largely offset by operational efficiencies and FX impacts. ING Press Release 3Q2025 4 Regulatory costs totalled €67 million in 3Q2025 and declined on both comparable quarters, reflecting an adjustment to our contribution to the deposit guarantee scheme in Germany. Incidental expense items in 3Q2025 amounted to €73 million, primarily related to restructuring provisions for planned FTE reductions in Retail Banking. These measures are expected to result in approximately €30 million in annualised cost savings once fully implemented. This compares with €24 million of incidental items in 3Q2024 and €116 million in 2Q2025, which had included €90 million of provisions for a restructuring of the workforce in Wholesale Banking. Addition to loan loss provisions Net additions to loan loss provisions amounted to €326 million in 3Q2025. This is equivalent to 19 basis points of average customer lending, remaining below our through - the - cycle average of around 20 basis points. Stage 3 risk costs were €361 million. This mainly included collective Stage 3 risk costs recorded in the consumer lending and business lending portfolios of Retail Banking, spread across various markets, and Stage 3 individual risk costs for a number of newly defaulted files in Wholesale Banking. Total Stage 1 and 2 risk costs were € - 35 million, primarily reflecting portfolio movements.
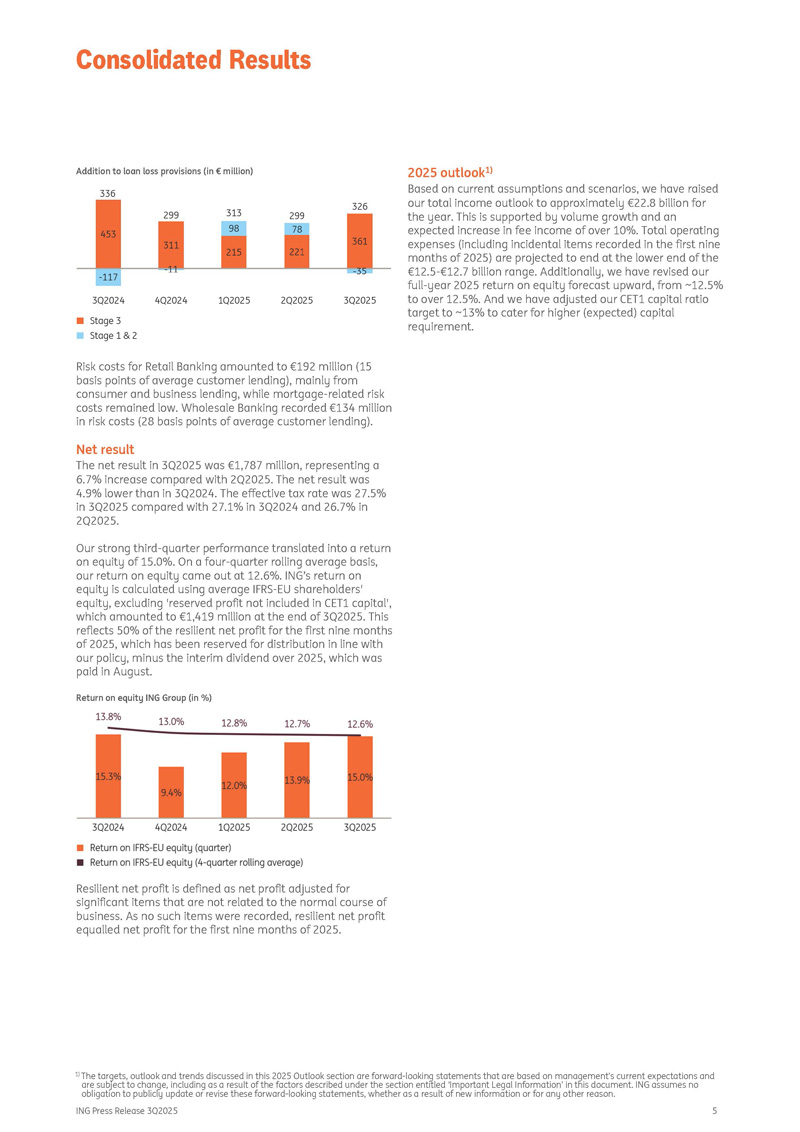
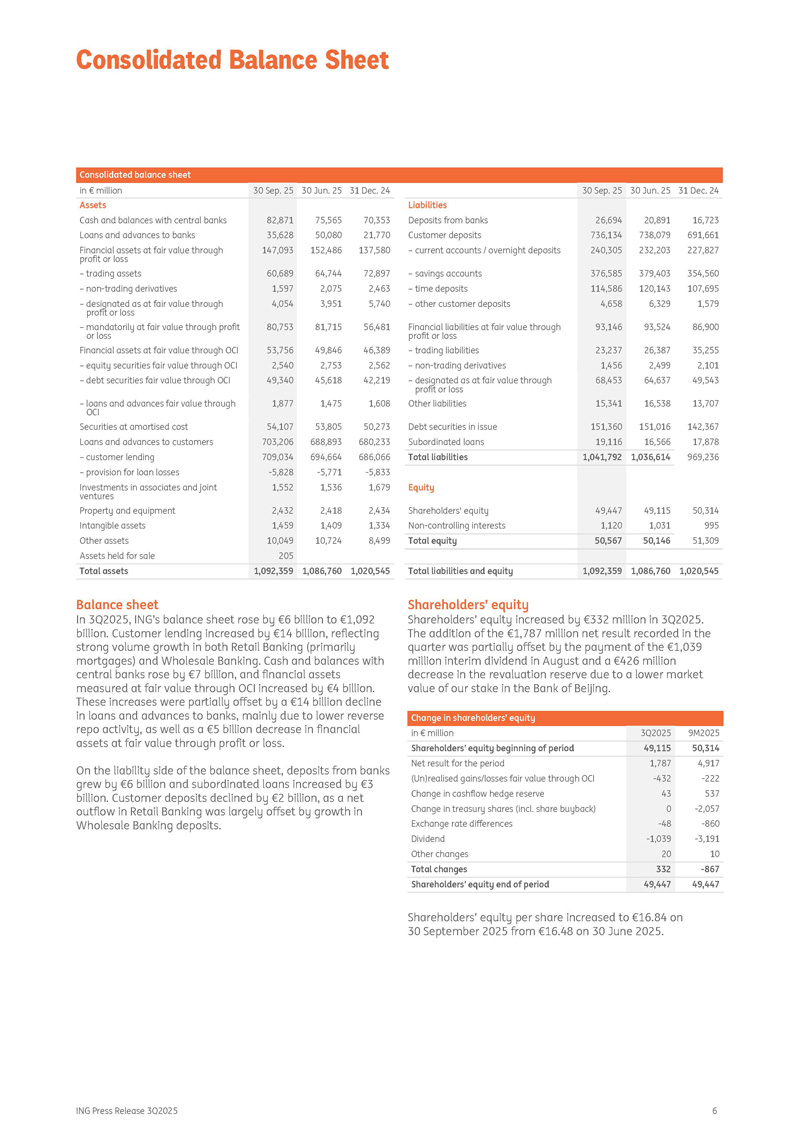
Consolidated Results Addition to loan loss provisions (in € million) Risk costs for Retail Banking amounted to €192 million (15 basis points of average customer lending), mainly from consumer and business lending, while mortgage - related risk costs remained low. Wholesale Banking recorded €134 million in risk costs (28 basis points of average customer lending). Net result The net result in 3Q2025 was €1,787 million, representing a 6.7% increase compared with 2Q2025. The net result was 4.9% lower than in 3Q2024. The effective tax rate was 27.5% in 3Q2025 compared with 27.1% in 3Q2024 and 26.7% in 2Q2025. Our strong third - quarter performance translated into a return on equity of 15.0%. On a four - quarter rolling average basis, our return on equity came out at 12.6%. ING’s return on equity is calculated using average IFRS - EU shareholders' equity, excluding 'reserved profit not included in CET1 capital', which amounted to €1,419 million at the end of 3Q2025. This reflects 50% of the resilient net profit for the first nine months of 2025, which has been reserved for distribution in line with our policy, minus the interim dividend over 2025, which was paid in August. Return on equity ING Group (in %) Resilient net profit is defined as net profit adjusted for significant items that are not related to the normal course of business. As no such items were recorded, resilient net profit equalled net profit for the first nine months of 2025. ING Press Release 3Q2025 5 2025 outlook 1) Based on current assumptions and scenarios, we have raised our total income outlook to approximately €22.8 billion for the year. This is supported by volume growth and an expected increase in fee income of over 10%. Total operating expenses (including incidental items recorded in the first nine months of 2025) are projected to end at the lower end of the €12.5 - €12.7 billion range. Additionally, we have revised our full - year 2025 return on equity forecast upward, from ~12.5% to over 12.5%. And we have adjusted our CET1 capital ratio target to ~13% to cater for higher (expected) capital requirement. Consolidated Results 1) The targets, outlook and trends discussed in this 2025 Outlook section are forward - looking statements that are based on management’s current expectations and are subject to change, including as a result of the factors described under the section entitled ‘Important Legal Information’ in this document. ING assumes no obligation to publicly update or revise these forward - looking statements, whether as a result of new information or for any other reason.
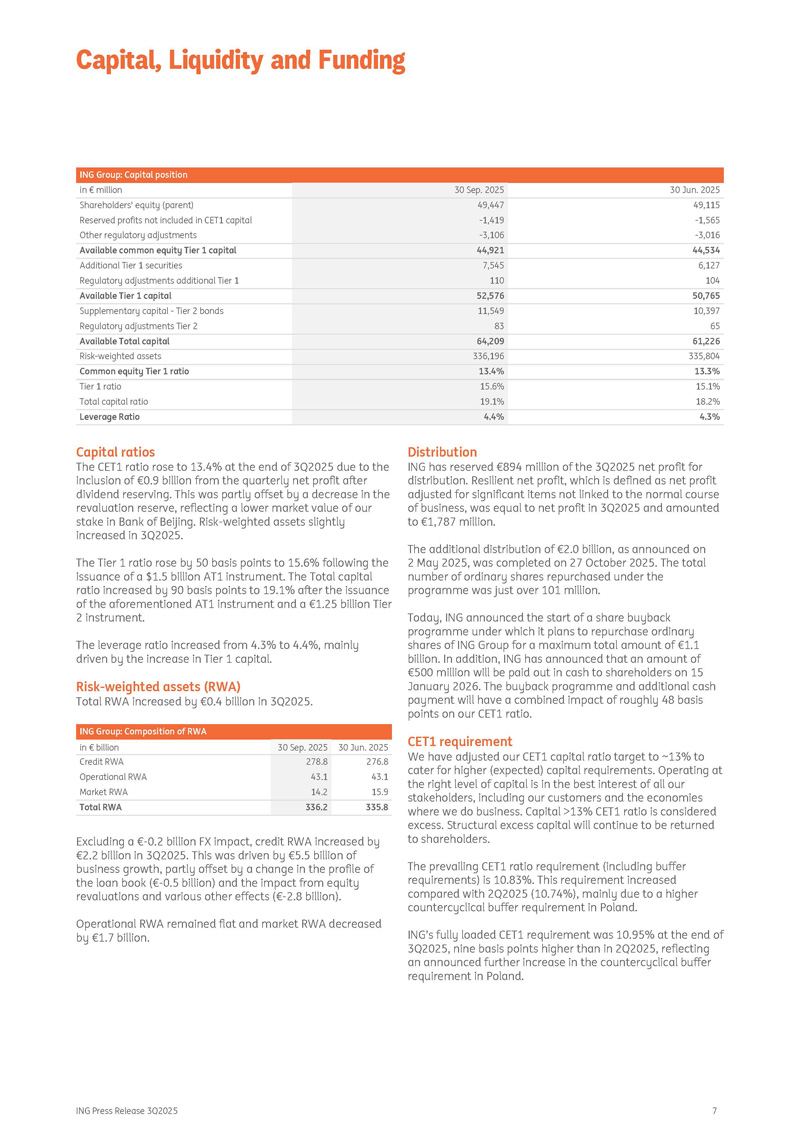
ING Press Release 3Q2025 6 Consolidated balance sheet 31 Dec. 24 30 Jun. 25 30 Sep. 25 30 Jun. 25 31 Dec. 24 30 Sep. 25 in € million Liabilities Deposits from banks Customer deposits – current accounts / overnight deposits – savings accounts – time deposits – other customer deposits Financial liabilities at fair value through profit or loss – trading liabilities – non - trading derivatives – designated as at fair value through profit or loss Other liabilities Debt securities in issue Subordinated loans 75,565 70,353 50,080 21,770 152,486 137,580 64,744 72,897 2,075 2,463 3,951 5,740 81,715 56,481 49,846 46,389 2,753 2,562 45,618 42,219 1,475 1,608 53,805 50,273 688,893 680,233 694,664 686,066 - 5,771 - 5,833 1,536 1,679 2,418 2,434 1,409 1,334 10,724 8,499 82,871 35,628 147,093 60,689 1,597 4,054 80,753 53,756 2,540 49,340 1,877 54,107 703,206 709,034 - 5,828 1,552 2,432 1,459 10,049 205 Assets 16,723 20,891 26,694 Cash and balances with central banks 691,661 738,079 736,134 Loans and advances to banks 227,827 232,203 240,305 Financial assets at fair value through profit or loss 354,560 379,403 376,585 – trading assets 107,695 120,143 114,586 – non - trading derivatives 1,579 6,329 4,658 – designated as at fair value through profit or loss 86,900 93,524 93,146 – mandatorily at fair value through profit or loss 35,255 26,387 23,237 Financial assets at fair value through OCI 2,101 2,499 1,456 – equity securities fair value through OCI 49,543 64,637 68,453 – debt securities fair value through OCI 13,707 16,538 15,341 – loans and advances fair value through OCI 142,367 151,016 151,360 Securities at amortised cost 17,878 16,566 19,116 Loans and advances to customers 969,236 1,036,614 1,041,792 Total liabilities – customer lending Equity – provision for loan losses Investments in associates and joint ventures 50,314 49,115 49,447 Shareholders' equity Property and equipment 995 1,031 1,120 Non - controlling interests Intangible assets 51,309 50,146 50,567 Total equity Other assets Assets held for sale 1,020,545 1,086,760 1,092,359 Total liabilities and equity 1,086,760 1,020,545 1,092,359 Total assets Balance sheet In 3Q2025, ING’s balance sheet rose by €6 billion to €1,092 billion. Customer lending increased by €14 billion, reflecting strong volume growth in both Retail Banking (primarily mortgages) and Wholesale Banking. Cash and balances with central banks rose by €7 billion, and financial assets measured at fair value through OCI increased by €4 billion. These increases were partially offset by a €14 billion decline in loans and advances to banks, mainly due to lower reverse repo activity, as well as a €5 billion decrease in financial assets at fair value through profit or loss. On the liability side of the balance sheet, deposits from banks grew by €6 billion and subordinated loans increased by €3 billion. Customer deposits declined by €2 billion, as a net outflow in Retail Banking was largely offset by growth in Wholesale Banking deposits. Shareholders’ equity Shareholders’ equity increased by €332 million in 3Q2025. The addition of the €1,787 million net result recorded in the quarter was partially offset by the payment of the €1,039 million interim dividend in August and a €426 million decrease in the revaluation reserve due to a lower market value of our stake in the Bank of Beijing. Change in shareholders’ equity 9M2025 3Q2025 in € million 50,314 49,115 Shareholders' equity beginning of period 4,917 1,787 Net result for the period - 222 - 432 (Un)realised gains/losses fair value through OCI 537 43 Change in cashflow hedge reserve - 2,057 0 Change in treasury shares (incl. share buyback) - 860 - 48 Exchange rate differences - 3,191 - 1,039 Dividend 10 20 Other changes - 867 332 Total changes 49,447 49,447 Shareholders' equity end of period Shareholders’ equity per share increased to €16.84 on 30 September 2025 from €16.48 on 30 June 2025.
Consolidated Balance Sheet ING Press Release 3Q2025 7 ING Group: Capital position 30 Jun. 2025 30 Sep. 2025 in € million 49,115 49,447 Shareholders' equity (parent) - 1,565 - 1,419 Reserved profits not included in CET1 capital - 3,016 - 3,106 Other regulatory adjustments 44,534 44,921 Available common equity Tier 1 capital 6,127 7,545 Additional Tier 1 securities 104 110 Regulatory adjustments additional Tier 1 50,765 52,576 Available Tier 1 capital 10,397 11,549 Supplementary capital - Tier 2 bonds 65 83 Regulatory adjustments Tier 2 61,226 64,209 Available Total capital 335,804 336,196 Risk - weighted assets 13.3% 13.4% Common equity Tier 1 ratio 15.1% 15.6% Tier 1 ratio 18.2% 19.1% Total capital ratio 4.3% 4.4% Leverage Ratio Capital ratios The CET1 ratio rose to 13.4% at the end of 3Q2025 due to the inclusion of €0.9 billion from the quarterly net profit after dividend reserving. This was partly offset by a decrease in the revaluation reserve, reflecting a lower market value of our stake in Bank of Beijing. Risk - weighted assets slightly increased in 3Q2025. The Tier 1 ratio rose by 50 basis points to 15.6% following the issuance of a $1.5 billion AT1 instrument. The Total capital ratio increased by 90 basis points to 19.1% after the issuance of the aforementioned AT1 instrument and a €1.25 billion Tier 2 instrument. The leverage ratio increased from 4.3% to 4.4%, mainly driven by the increase in Tier 1 capital. Risk - weighted assets (RWA) Total RWA increased by €0.4 billion in 3Q2025. ING Group: Composition of RWA 30 Jun. 2025 30 Sep. 2025 in € billion 276.8 278.8 Credit RWA 43.1 43.1 Operational RWA 15.9 14.2 Market RWA 335.8 336.2 Total RWA Excluding a € - 0.2 billion FX impact, credit RWA increased by €2.2 billion in 3Q2025. This was driven by €5.5 billion of business growth, partly offset by a change in the profile of the loan book (€ - 0.5 billion) and the impact from equity revaluations and various other effects (€ - 2.8 billion). Operational RWA remained flat and market RWA decreased by €1.7 billion. Distribution ING has reserved €894 million of the 3Q2025 net profit for distribution. Resilient net profit, which is defined as net profit adjusted for significant items not linked to the normal course of business, was equal to net profit in 3Q2025 and amounted to €1,787 million. The additional distribution of €2.0 billion, as announced on 2 May 2025, was completed on 27 October 2025. The total number of ordinary shares repurchased under the programme was just over 101 million. Today, ING announced the start of a share buyback programme under which it plans to repurchase ordinary shares of ING Group for a maximum total amount of €1.1 billion. In addition, ING has announced that an amount of €500 million will be paid out in cash to shareholders on 15 January 2026. The buyback programme and additional cash payment will have a combined impact of roughly 48 basis points on our CET1 ratio. CET1 requirement We have adjusted our CET1 capital ratio target to ~13% to cater for higher (expected) capital requirements. Operating at the right level of capital is in the best interest of all our stakeholders, including our customers and the economies where we do business. Capital >13% CET1 ratio is considered excess. Structural excess capital will continue to be returned to shareholders. The prevailing CET1 ratio requirement (including buffer requirements) is 10.83%. This requirement increased compared with 2Q2025 (10.74%), mainly due to a higher countercyclical buffer requirement in Poland. ING’s fully loaded CET1 requirement was 10.95% at the end of 3Q2025, nine basis points higher than in 2Q2025, reflecting an announced further increase in the countercyclical buffer requirement in Poland. Capital, Liquidity and Funding ING Press Release 3Q2025 8 MREL and TLAC requirements Minimum Required Eligible Liabilities (MREL) and Total Loss Absorbing Capacity (TLAC) requirements apply to ING Group at the consolidated level of the resolution group.
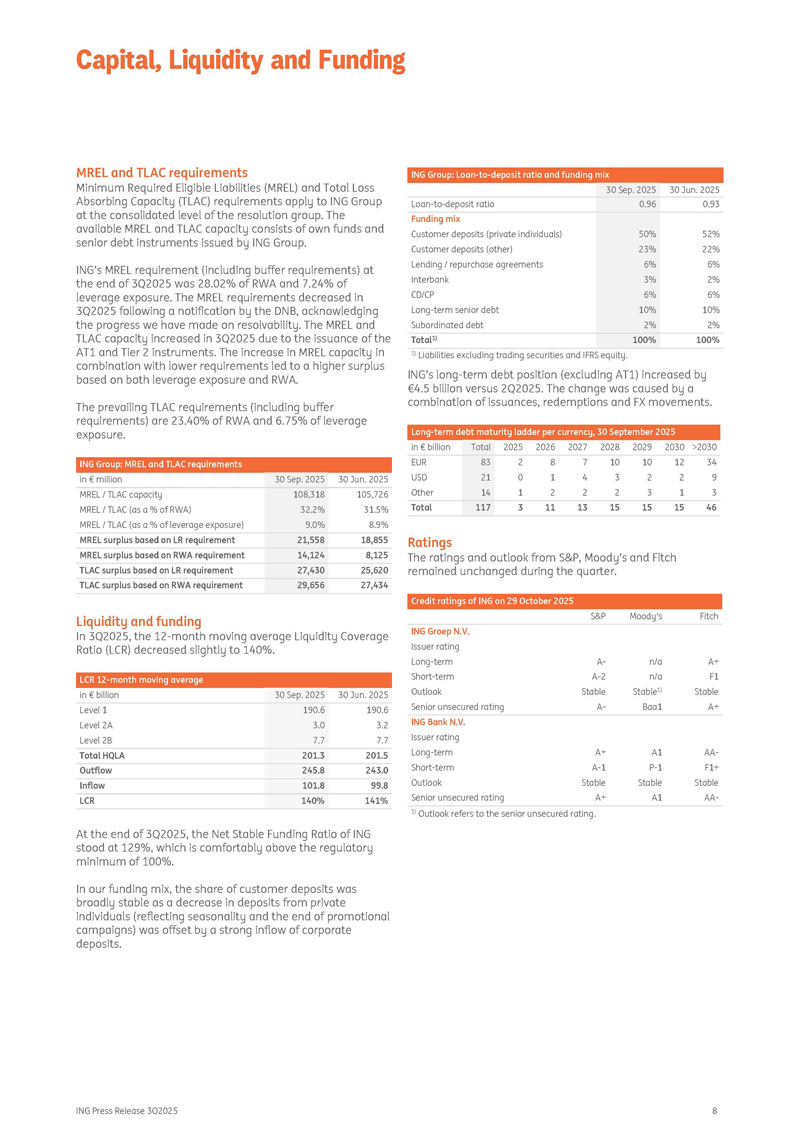
The available MREL and TLAC capacity consists of own funds and senior debt instruments issued by ING Group. ING’s MREL requirement (including buffer requirements) at the end of 3Q2025 was 28.02% of RWA and 7.24% of leverage exposure. The MREL requirements decreased in 3Q2025 following a notification by the DNB, acknowledging the progress we have made on resolvability. The MREL and TLAC capacity increased in 3Q2025 due to the issuance of the AT1 and Tier 2 instruments. The increase in MREL capacity in combination with lower requirements led to a higher surplus based on both leverage exposure and RWA. The prevailing TLAC requirements (including buffer requirements) are 23.40% of RWA and 6.75% of leverage exposure. ING Group: MREL and TLAC requirements 30 Jun. 2025 30 Sep. 2025 in € million 105,726 108,318 MREL / TLAC capacity 31.5% 32.2% MREL / TLAC (as a % of RWA) 8.9% 9.0% MREL / TLAC (as a % of leverage exposure) 18,855 21,558 MREL surplus based on LR requirement 8,125 14,124 MREL surplus based on RWA requirement 25,620 27,430 TLAC surplus based on LR requirement 27,434 29,656 TLAC surplus based on RWA requirement Liquidity and funding In 3Q2025, the 12 - month moving average Liquidity Coverage Ratio (LCR) decreased slightly to 140%. LCR 12 - month moving average 30 Jun. 2025 30 Sep. 2025 in € billion 190.6 190.6 Level 1 3.2 3.0 Level 2A 7.7 7.7 Level 2B 201.5 201.3 Total HQLA 243.0 245.8 Outflow 99.8 101.8 Inflow 141% 140% LCR ING Group: Loan - to - deposit ratio and funding mix 30 Jun. 2025 30 Sep. 2025 0.93 0.96 Loan - to - deposit ratio Funding mix 52% 50% Customer deposits (private individuals) 22% 23% Customer deposits (other) 6% 6% Lending / repurchase agreements 2% 3% Interbank 6% 6% CD/CP 10% 10% Long - term senior debt 2% 2% Subordinated debt 100% 100% Total 1) 1) Liabilities excluding trading securities and IFRS equity. ING’s long - term debt position (excluding AT1) increased by €4.5 billion versus 2Q2025. The change was caused by a combination of issuances, redemptions and FX movements. Long - term debt maturity ladder per currency, 30 September 2025 >2030 2030 2029 2028 2027 2026 2025 Total in € billion 34 12 10 10 7 8 2 83 EUR 9 2 2 3 4 1 0 21 USD 3 1 3 2 2 2 1 14 Other 46 15 15 15 13 11 3 117 Total Ratings The ratings and outlook from S&P, Moody’s and Fitch remained unchanged during the quarter. Credit ratings of ING on 29 October 2025 Fitch Moody's S&P ING Groep N.V. Issuer rating A+ n/a A - Long - term F1 n/a A - 2 Short - term Stable Stable 1) Stable Outlook A+ Baa1 A - Senior unsecured rating ING Bank N.V. Issuer rating AA - A1 A+ Long - term F1+ P - 1 A - 1 Short - term Stable Stable Stable Outlook AA - A1 A+ Senior unsecured rating 1) Outlook refers to the senior unsecured rating. At the end of 3 Q 2025 , the Net Stable Funding Ratio of ING stood at 129 % , which is comfortably above the regulatory minimum of 100 % . In our funding mix, the share of customer deposits was broadly stable as a decrease in deposits from private individuals (reflecting seasonality and the end of promotional campaigns) was offset by a strong inflow of corporate deposits. Capital, Liquidity and Funding ING Group: Total credit outstandings 1) Stage 3 ratio Stage 3 Stage 2 ratio Stage 2 Credit outstandings 30 Sep.
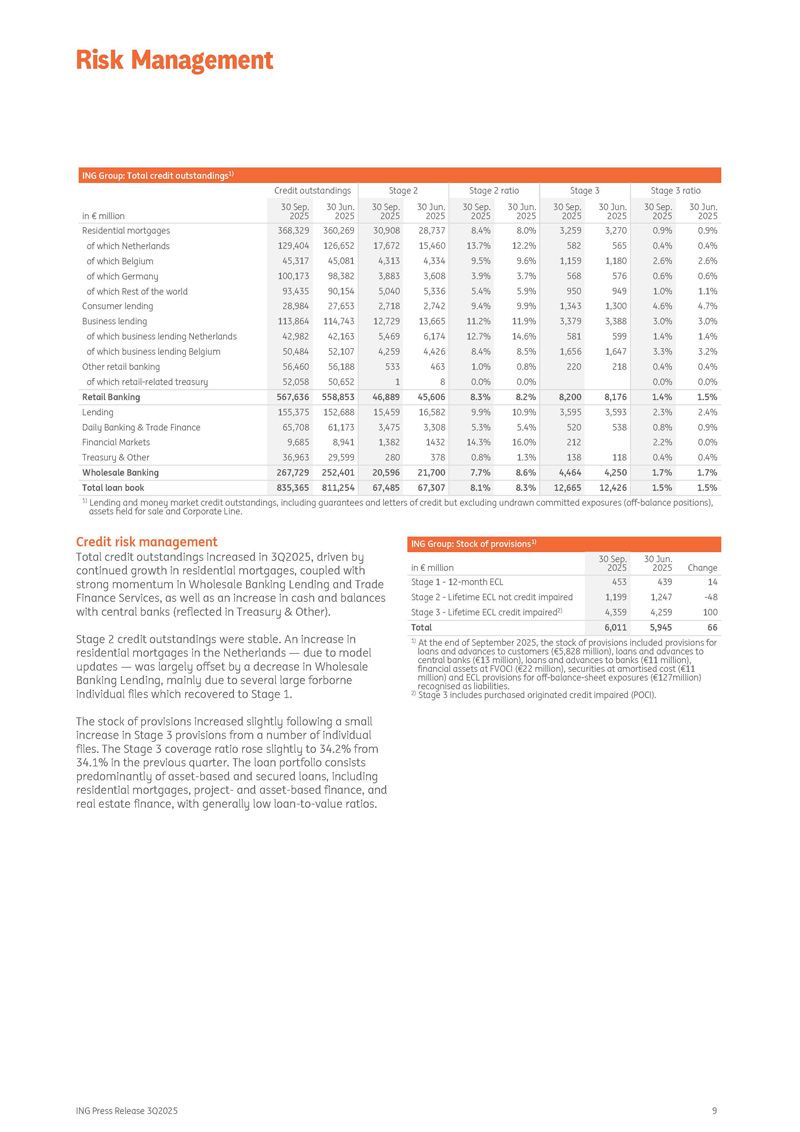
30 Jun. 2025 2025 in € million 30 Jun. 2025 30 Sep. 2025 30 Jun. 2025 30 Sep. 2025 30 Jun. 2025 30 Sep. 2025 30 Jun. 2025 30 Sep. 2025 0.9% 0.9% 3,270 3,259 8.0% 8.4% 28,737 30,908 360,269 368,329 Residential mortgages 0.4% 0.4% 565 582 12.2% 13.7% 15,460 17,672 126,652 129,404 of which Netherlands 2.6% 2.6% 1,180 1,159 9.6% 9.5% 4,334 4,313 45,081 45,317 of which Belgium 0.6% 0.6% 576 568 3.7% 3.9% 3,608 3,883 98,382 100,173 of which Germany 1.1% 1.0% 949 950 5.9% 5.4% 5,336 5,040 90,154 93,435 of which Rest of the world 4.7% 4.6% 1,300 1,343 9.9% 9.4% 2,742 2,718 27,653 28,984 Consumer lending 3.0% 3.0% 3,388 3,379 11.9% 11.2% 13,665 12,729 114,743 113,864 Business lending 1.4% 1.4% 599 581 14.6% 12.7% 6,174 5,469 42,163 42,982 of which business lending Netherlands 3.2% 3.3% 1,647 1,656 8.5% 8.4% 4,426 4,259 52,107 50,484 of which business lending Belgium 0.4% 0.4% 218 220 0.8% 1.0% 463 533 56,188 56,460 Other retail banking 0.0% 0.0% 0.0% 0.0% 8 1 50,652 52,058 of which retail - related treasury 1.5% 1.4% 8,176 8,200 8.2% 8.3% 45,606 46,889 558,853 567,636 Retail Banking 2.4% 2.3% 3,593 3,595 10.9% 9.9% 16,582 15,459 152,688 155,375 Lending 0.9% 0.8% 538 520 5.4% 5.3% 3,308 3,475 61,173 65,708 Daily Banking & Trade Finance 0.0% 2.2% 212 16.0% 14.3% 1432 1,382 8,941 9,685 Financial Markets 0.4% 0.4% 118 138 1.3% 0.8% 378 280 29,599 36,963 Treasury & Other 1.7% 1.7% 4,250 4,464 8.6% 7.7% 21,700 20,596 252,401 267,729 Wholesale Banking 1.5% 1.5% 12,426 12,665 8.3% 8.1% 67,307 67,485 811,254 835,365 Total loan book ING Press Release 3Q2025 9 1) Lending and money market credit outstandings, including guarantees and letters of credit but excluding undrawn committed exposures (off - balance positions), assets held for sale and Corporate Line. Credit risk management Total credit outstandings increased in 3Q2025, driven by continued growth in residential mortgages, coupled with strong momentum in Wholesale Banking Lending and Trade Finance Services, as well as an increase in cash and balances with central banks (reflected in Treasury & Other). Stage 2 credit outstandings were stable. An increase in residential mortgages in the Netherlands — due to model updates — was largely offset by a decrease in Wholesale Banking Lending, mainly due to several large forborne individual files which recovered to Stage 1. The stock of provisions increased slightly following a small increase in Stage 3 provisions from a number of individual files. The Stage 3 coverage ratio rose slightly to 34.2% from 34.1% in the previous quarter. The loan portfolio consists predominantly of asset - based and secured loans, including residential mortgages, project - and asset - based finance, and real estate finance, with generally low loan - to - value ratios. ING Group: Stock of provisions 1) Change 30 Jun. 2025 30 Sep. 2025 in € million 14 439 453 Stage 1 - 12 - month ECL - 48 1,247 1,199 Stage 2 - Lifetime ECL not credit impaired 100 4,259 4,359 Stage 3 - Lifetime ECL credit impaired 2) 66 5,945 6,011 Total 1) At the end of September 2025, the stock of provisions included provisions for loans and advances to customers (€5,828 million), loans and advances to central banks (€13 million), loans and advances to banks (€11 million), financial assets at FVOCI (€22 million), securities at amortised cost (€11 million) and ECL provisions for off - balance - sheet exposures (€127million) recognised as liabilities. 2) Stage 3 includes purchased originated credit impaired (POCI).
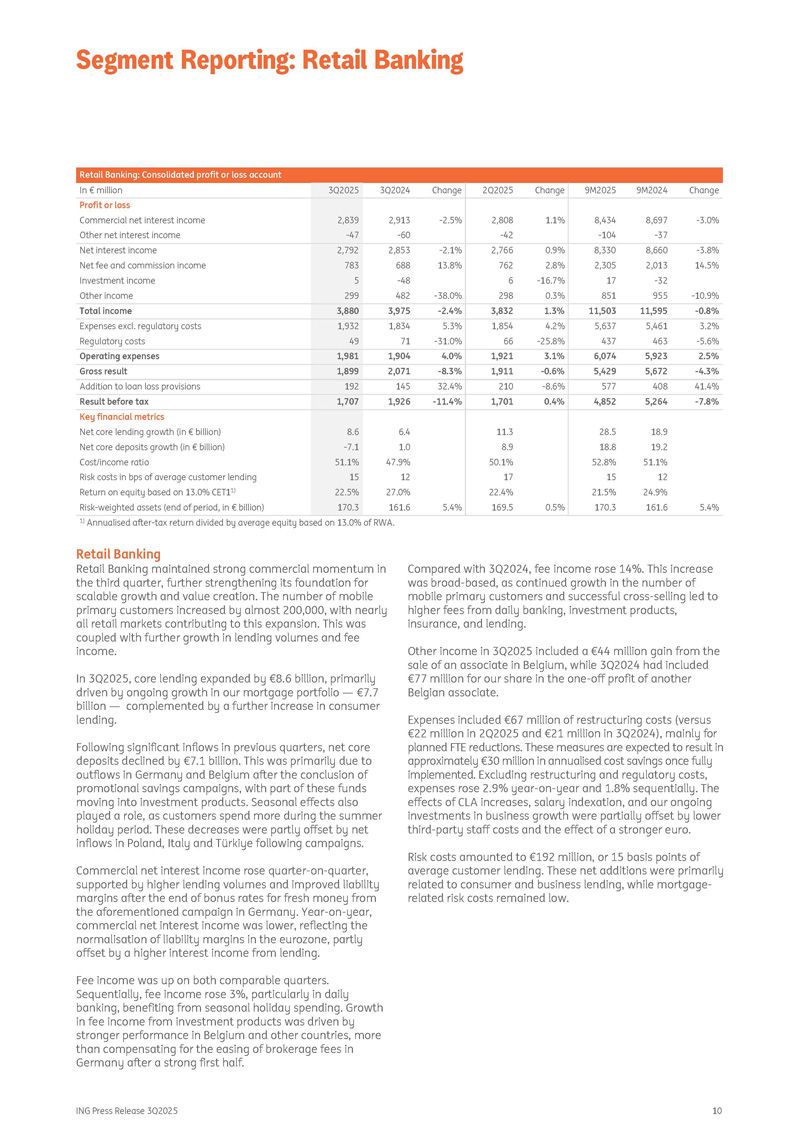
Risk Management ING Press Release 3Q2025 10 Retail Banking: Consolidated profit or loss account Change 9M2024 9M2025 Change 2Q2025 Change 3Q2024 3Q2025 In € million - 3.0% 8,697 - 37 8,434 - 104 1.1% 2,808 - 42 - 2.5% 2,913 - 60 2,839 - 47 Profit or loss Commercial net interest income Other net interest income - 3.8% 8,660 8,330 0.9% 2,766 - 2.1% 2,853 2,792 Net interest income 14.5% 2,013 2,305 2.8% 762 13.8% 688 783 Net fee and commission income - 32 17 - 16.7% 6 - 48 5 Investment income - 10.9% 955 851 0.3% 298 - 38.0% 482 299 Other income - 0.8% 11,595 11,503 1.3% 3,832 - 2.4% 3,975 3,880 Total income 3.2% 5,461 5,637 4.2% 1,854 5.3% 1,834 1,932 Expenses excl. regulatory costs - 5.6% 463 437 - 25.8% 66 - 31.0% 71 49 Regulatory costs 2.5% 5,923 6,074 3.1% 1,921 4.0% 1,904 1,981 Operating expenses - 4.3% 5,672 5,429 - 0.6% 1,911 - 8.3% 2,071 1,899 Gross result 41.4% 408 577 - 8.6% 210 32.4% 145 192 Addition to loan loss provisions - 7.8% 5,264 4,852 0.4% 1,701 - 11.4% 1,926 1,707 Result before tax Key financial metrics 18.9 28.5 11.3 6.4 8.6 Net core lending growth (in € billion) 19.2 18.8 8.9 1.0 - 7.1 Net core deposits growth (in € billion) 51.1% 52.8% 50.1% 47.9% 51.1% Cost/income ratio 12 15 17 12 15 Risk costs in bps of average customer lending 24.9% 21.5% 22.4% 27.0% 22.5% Return on equity based on 13.0% CET1 1) 5.4% 161.6 170.3 0.5% 169.5 5.4% 161.6 170.3 Risk - weighted assets (end of period, in € billion) 1) Annualised after - tax return divided by average equity based on 13.0% of RWA. Retail Banking Retail Banking maintained strong commercial momentum in the third quarter, further strengthening its foundation for scalable growth and value creation. The number of mobile primary customers increased by almost 200,000, with nearly all retail markets contributing to this expansion. This was coupled with further growth in lending volumes and fee income. In 3 Q 2025 , core lending expanded by € 8 . 6 billion, primarily driven by ongoing growth in our mortgage portfolio — € 7 . 7 billion — complemented by a further increase in consumer lending . Following significant inflows in previous quarters, net core deposits declined by €7.1 billion. This was primarily due to outflows in Germany and Belgium after the conclusion of promotional savings campaigns, with part of these funds moving into investment products. Seasonal effects also played a role, as customers spend more during the summer holiday period. These decreases were partly offset by net inflows in Poland, Italy and Türkiye following campaigns. Commercial net interest income rose quarter - on - quarter, supported by higher lending volumes and improved liability margins after the end of bonus rates for fresh money from the aforementioned campaign in Germany. Year - on - year, commercial net interest income was lower, reflecting the normalisation of liability margins in the eurozone, partly offset by a higher interest income from lending. Fee income was up on both comparable quarters. Sequentially, fee income rose 3%, particularly in daily banking, benefiting from seasonal holiday spending. Growth in fee income from investment products was driven by stronger performance in Belgium and other countries, more than compensating for the easing of brokerage fees in Germany after a strong first half. Compared with 3Q2024, fee income rose 14%. This increase was broad - based, as continued growth in the number of mobile primary customers and successful cross - selling led to higher fees from daily banking, investment products, insurance, and lending. Other income in 3Q2025 included a €44 million gain from the sale of an associate in Belgium, while 3Q2024 had included €77 million for our share in the one - off profit of another Belgian associate. Expenses included €67 million of restructuring costs (versus €22 million in 2Q2025 and €21 million in 3Q2024), mainly for planned FTE reductions. These measures are expected to result in approximately €30 million in annualised cost savings once fully implemented. Excluding restructuring and regulatory costs, expenses rose 2.9% year - on - year and 1.8% sequentially. The effects of CLA increases, salary indexation, and our ongoing investments in business growth were partially offset by lower third - party staff costs and the effect of a stronger euro. Risk costs amounted to €192 million, or 15 basis points of average customer lending. These net additions were primarily related to consumer and business lending, while mortgage - related risk costs remained low.
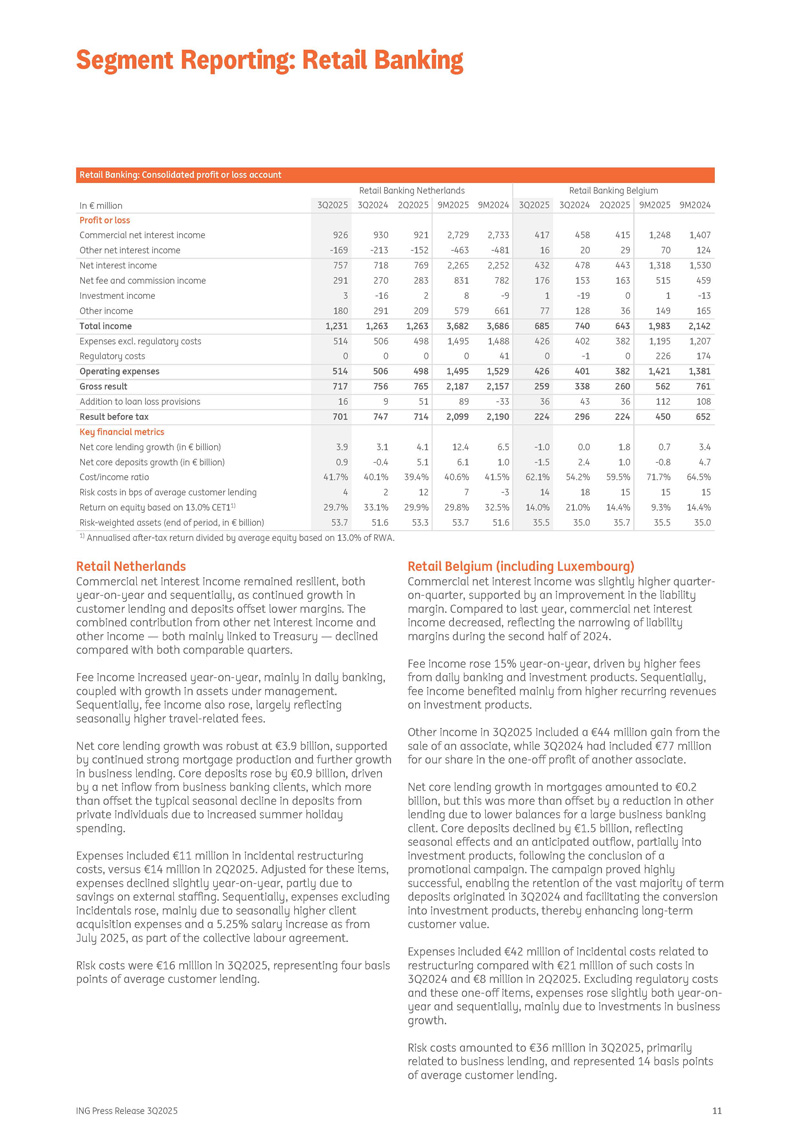
Segment Reporting: Retail Banking Retail Banking: Consolidated profit or loss account Retail Banking Belgium Retail Banking Netherlands 9M2024 9M2025 2Q2025 3Q2024 3Q2025 9M2024 9M2025 2Q2025 3Q2024 3Q2025 In € million Profit or loss 1,407 1,248 415 458 417 2,733 2,729 921 930 926 Commercial net interest income 124 70 29 20 16 - 481 - 463 - 152 - 213 - 169 Other net interest income 1,530 1,318 443 478 432 2,252 2,265 769 718 757 Net interest income 459 515 163 153 176 782 831 283 270 291 Net fee and commission income - 13 1 0 - 19 1 - 9 8 2 - 16 3 Investment income 165 149 36 128 77 661 579 209 291 180 Other income 2,142 1,983 643 740 685 3,686 3,682 1,263 1,263 1,231 Total income 1,207 1,195 382 402 426 1,488 1,495 498 506 514 Expenses excl. regulatory costs 174 226 0 - 1 0 41 0 0 0 0 Regulatory costs 1,381 1,421 382 401 426 1,529 1,495 498 506 514 Operating expenses 761 562 260 338 259 2,157 2,187 765 756 717 Gross result 108 112 36 43 36 - 33 89 51 9 16 Addition to loan loss provisions 652 450 224 296 224 2,190 2,099 714 747 701 Result before tax Key financial metrics 3.4 0.7 1.8 0.0 - 1.0 6.5 12.4 4.1 3.1 3.9 Net core lending growth (in € billion) 4.7 - 0.8 1.0 2.4 - 1.5 1.0 6.1 5.1 - 0.4 0.9 Net core deposits growth (in € billion) 64.5% 71.7% 59.5% 54.2% 62.1% 41.5% 40.6% 39.4% 40.1% 41.7% Cost/income ratio 15 15 15 18 14 - 3 7 12 2 4 Risk costs in bps of average customer lending 14.4% 9.3% 14.4% 21.0% 14.0% 32.5% 29.8% 29.9% 33.1% 29.7% Return on equity based on 13.0% CET1 1) 35.0 35.5 35.7 35.0 35.5 51.6 53.7 53.3 51.6 53.7 Risk - weighted assets (end of period, in € billion) ING Press Release 3Q2025 11 1) Annualised after - tax return divided by average equity based on 13.0% of RWA. Retail Netherlands Commercial net interest income remained resilient, both year - on - year and sequentially, as continued growth in customer lending and deposits offset lower margins. The combined contribution from other net interest income and other income — both mainly linked to Treasury — declined compared with both comparable quarters. Fee income increased year - on - year, mainly in daily banking, coupled with growth in assets under management. Sequentially, fee income also rose, largely reflecting seasonally higher travel - related fees. Net core lending growth was robust at €3.9 billion, supported by continued strong mortgage production and further growth in business lending. Core deposits rose by €0.9 billion, driven by a net inflow from business banking clients, which more than offset the typical seasonal decline in deposits from private individuals due to increased summer holiday spending. Expenses included €11 million in incidental restructuring costs, versus €14 million in 2Q2025. Adjusted for these items, expenses declined slightly year - on - year, partly due to savings on external staffing. Sequentially, expenses excluding incidentals rose, mainly due to seasonally higher client acquisition expenses and a 5.25% salary increase as from July 2025, as part of the collective labour agreement. Risk costs were €16 million in 3Q2025, representing four basis points of average customer lending. Retail Belgium (including Luxembourg) Commercial net interest income was slightly higher quarter - on - quarter, supported by an improvement in the liability margin. Compared to last year, commercial net interest income decreased, reflecting the narrowing of liability margins during the second half of 2024. Fee income rose 15% year - on - year, driven by higher fees from daily banking and investment products. Sequentially, fee income benefited mainly from higher recurring revenues on investment products. Other income in 3Q2025 included a €44 million gain from the sale of an associate, while 3Q2024 had included €77 million for our share in the one - off profit of another associate. Net core lending growth in mortgages amounted to €0.2 billion, but this was more than offset by a reduction in other lending due to lower balances for a large business banking client. Core deposits declined by €1.5 billion, reflecting seasonal effects and an anticipated outflow, partially into investment products, following the conclusion of a promotional campaign. The campaign proved highly successful, enabling the retention of the vast majority of term deposits originated in 3Q2024 and facilitating the conversion into investment products, thereby enhancing long - term customer value. Expenses included €42 million of incidental costs related to restructuring compared with €21 million of such costs in 3Q2024 and €8 million in 2Q2025. Excluding regulatory costs and these one - off items, expenses rose slightly both year - on - year and sequentially, mainly due to investments in business growth. Risk costs amounted to €36 million in 3Q2025, primarily related to business lending, and represented 14 basis points of average customer lending.
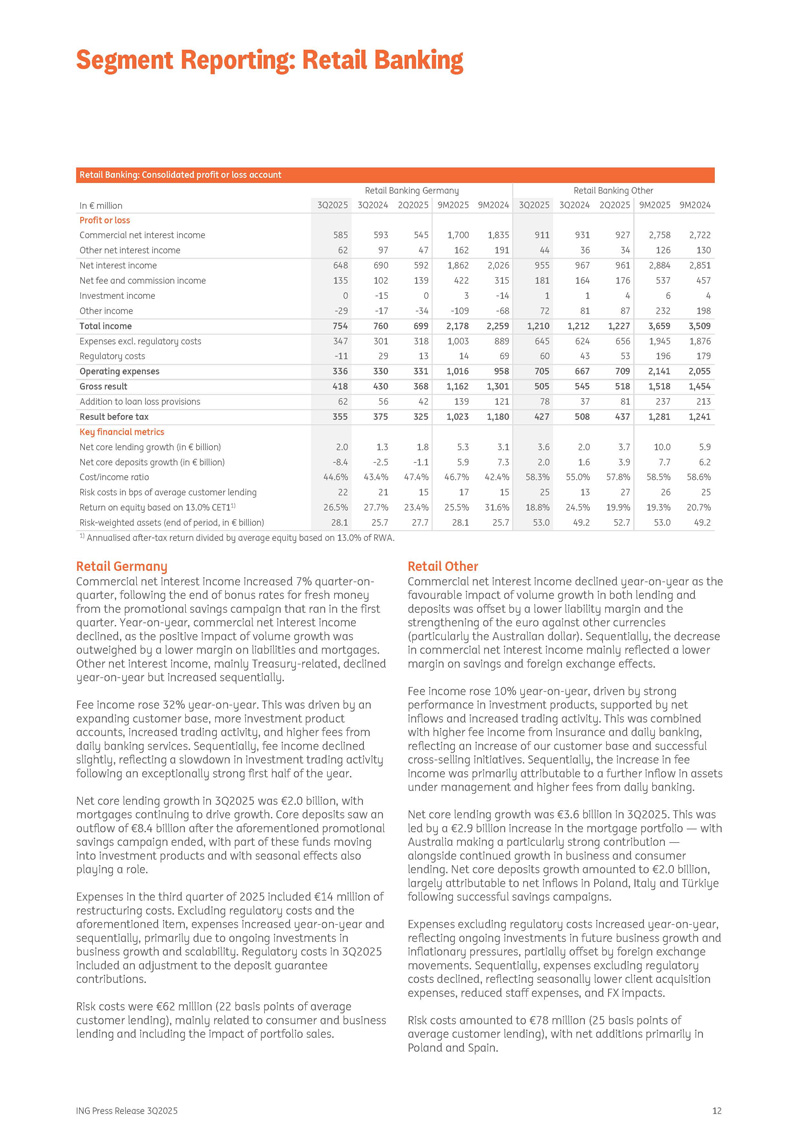
Segment Reporting: Retail Banking Retail Banking: Consolidated profit or loss account Retail Banking Other Retail Banking Germany 9M2024 9M2025 2Q2025 3Q2024 3Q2025 9M2024 9M2025 2Q2025 3Q2024 3Q2025 In € million Profit or loss 2,722 2,758 927 931 911 1,835 1,700 545 593 585 Commercial net interest income 130 126 34 36 44 191 162 47 97 62 Other net interest income 2,851 2,884 961 967 955 2,026 1,862 592 690 648 Net interest income 457 537 176 164 181 315 422 139 102 135 Net fee and commission income 4 6 4 1 1 - 14 3 0 - 15 0 Investment income 198 232 87 81 72 - 68 - 109 - 34 - 17 - 29 Other income 3,509 3,659 1,227 1,212 1,210 2,259 2,178 699 760 754 Total income 1,876 1,945 656 624 645 889 1,003 318 301 347 Expenses excl. regulatory costs 179 196 53 43 60 69 14 13 29 - 11 Regulatory costs 2,055 2,141 709 667 705 958 1,016 331 330 336 Operating expenses 1,454 1,518 518 545 505 1,301 1,162 368 430 418 Gross result 213 237 81 37 78 121 139 42 56 62 Addition to loan loss provisions 1,241 1,281 437 508 427 1,180 1,023 325 375 355 Result before tax Key financial metrics 5.9 10.0 3.7 2.0 3.6 3.1 5.3 1.8 1.3 2.0 Net core lending growth (in € billion) 6.2 7.7 3.9 1.6 2.0 7.3 5.9 - 1.1 - 2.5 - 8.4 Net core deposits growth (in € billion) 58.6% 58.5% 57.8% 55.0% 58.3% 42.4% 46.7% 47.4% 43.4% 44.6% Cost/income ratio 25 26 27 13 25 15 17 15 21 22 Risk costs in bps of average customer lending 20.7% 19.3% 19.9% 24.5% 18.8% 31.6% 25.5% 23.4% 27.7% 26.5% Return on equity based on 13.0% CET1 1) 49.2 53.0 52.7 49.2 53.0 25.7 28.1 27.7 25.7 28.1 Risk - weighted assets (end of period, in € billion) ING Press Release 3Q2025 12 1) Annualised after - tax return divided by average equity based on 13.0% of RWA. Retail Germany Commercial net interest income increased 7% quarter - on - quarter, following the end of bonus rates for fresh money from the promotional savings campaign that ran in the first quarter. Year - on - year, commercial net interest income declined, as the positive impact of volume growth was outweighed by a lower margin on liabilities and mortgages. Other net interest income, mainly Treasury - related, declined year - on - year but increased sequentially. Fee income rose 32% year - on - year. This was driven by an expanding customer base, more investment product accounts, increased trading activity, and higher fees from daily banking services. Sequentially, fee income declined slightly, reflecting a slowdown in investment trading activity following an exceptionally strong first half of the year. Net core lending growth in 3Q2025 was €2.0 billion, with mortgages continuing to drive growth. Core deposits saw an outflow of €8.4 billion after the aforementioned promotional savings campaign ended, with part of these funds moving into investment products and with seasonal effects also playing a role. Expenses in the third quarter of 2025 included €14 million of restructuring costs. Excluding regulatory costs and the aforementioned item, expenses increased year - on - year and sequentially, primarily due to ongoing investments in business growth and scalability. Regulatory costs in 3Q2025 included an adjustment to the deposit guarantee contributions. Risk costs were €62 million (22 basis points of average customer lending), mainly related to consumer and business lending and including the impact of portfolio sales. Retail Other Commercial net interest income declined year - on - year as the favourable impact of volume growth in both lending and deposits was offset by a lower liability margin and the strengthening of the euro against other currencies (particularly the Australian dollar). Sequentially, the decrease in commercial net interest income mainly reflected a lower margin on savings and foreign exchange effects. Fee income rose 10% year - on - year, driven by strong performance in investment products, supported by net inflows and increased trading activity. This was combined with higher fee income from insurance and daily banking, reflecting an increase of our customer base and successful cross - selling initiatives. Sequentially, the increase in fee income was primarily attributable to a further inflow in assets under management and higher fees from daily banking. Net core lending growth was €3.6 billion in 3Q2025. This was led by a €2.9 billion increase in the mortgage portfolio — with Australia making a particularly strong contribution — alongside continued growth in business and consumer lending. Net core deposits growth amounted to €2.0 billion, largely attributable to net inflows in Poland, Italy and Türkiye following successful savings campaigns. Expenses excluding regulatory costs increased year - on - year, reflecting ongoing investments in future business growth and inflationary pressures, partially offset by foreign exchange movements. Sequentially, expenses excluding regulatory costs declined, reflecting seasonally lower client acquisition expenses, reduced staff expenses, and FX impacts. Risk costs amounted to €78 million (25 basis points of average customer lending), with net additions primarily in Poland and Spain.
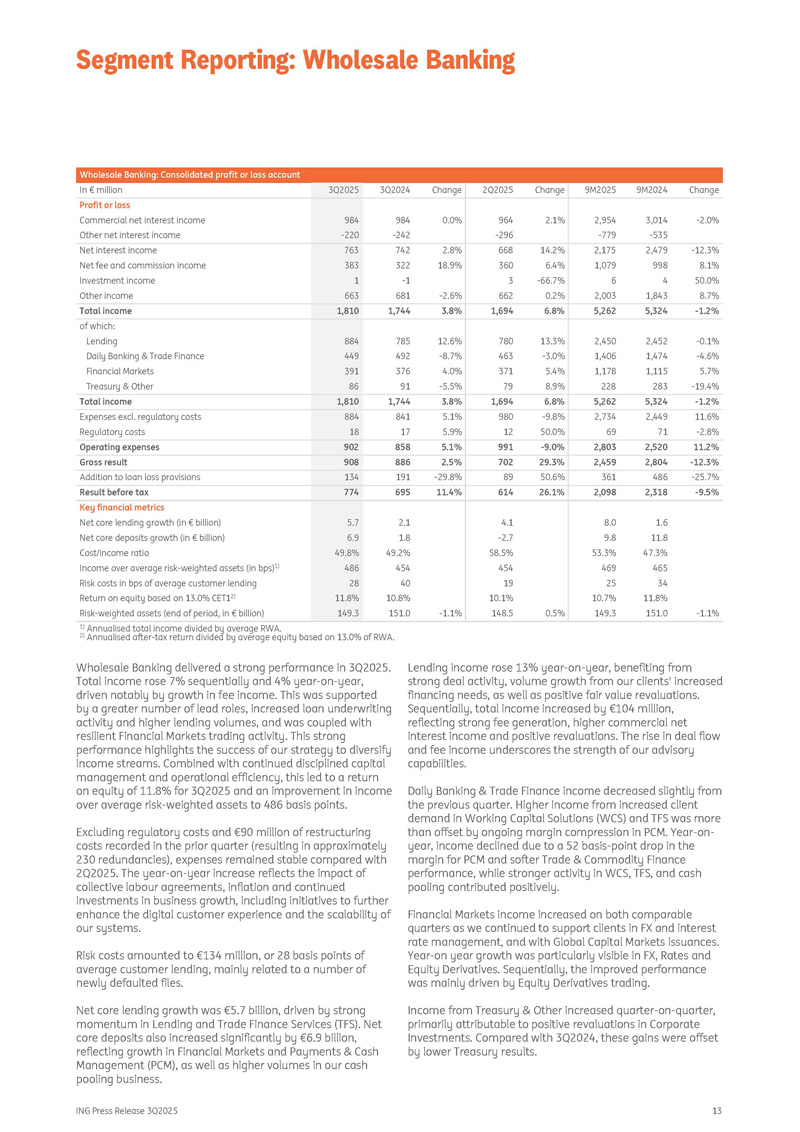
Segment Reporting: Retail Banking ING Press Release 3Q2025 13 Wholesale Banking: Consolidated profit or loss account Change 9M2024 9M2025 Change 2Q2025 Change 3Q2024 3Q2025 In € million - 2.0% 3,014 - 535 2,954 - 779 2.1% 964 - 296 0.0% 984 - 242 984 - 220 Profit or loss Commercial net interest income Other net interest income - 12.3% 2,479 2,175 14.2% 668 2.8% 742 763 Net interest income 8.1% 998 1,079 6.4% 360 18.9% 322 383 Net fee and commission income 50.0% 4 6 - 66.7% 3 - 1 1 Investment income 8.7% 1,843 2,003 0.2% 662 - 2.6% 681 663 Other income - 1.2% 5,324 5,262 6.8% 1,694 3.8% 1,744 1,810 Total income of which: - 0.1% 2,452 2,450 13.3% 780 12.6% 785 884 Lending - 4.6% 1,474 1,406 - 3.0% 463 - 8.7% 492 449 Daily Banking & Trade Finance 5.7% 1,115 1,178 5.4% 371 4.0% 376 391 Financial Markets - 19.4% 283 228 8.9% 79 - 5.5% 91 86 Treasury & Other - 1.2% 5,324 5,262 6.8% 1,694 3.8% 1,744 1,810 Total income 11.6% 2,449 2,734 - 9.8% 980 5.1% 841 884 Expenses excl. regulatory costs - 2.8% 71 69 50.0% 12 5.9% 17 18 Regulatory costs 11.2% 2,520 2,803 - 9.0% 991 5.1% 858 902 Operating expenses - 12.3% 2,804 2,459 29.3% 702 2.5% 886 908 Gross result - 25.7% 486 361 50.6% 89 - 29.8% 191 134 Addition to loan loss provisions - 9.5% 2,318 2,098 26.1% 614 11.4% 695 774 Result before tax Key financial metrics 1.6 8.0 4.1 2.1 5.7 Net core lending growth (in € billion) 11.8 9.8 - 2.7 1.8 6.9 Net core deposits growth (in € billion) 47.3% 53.3% 58.5% 49.2% 49.8% Cost/income ratio 465 469 454 454 486 Income over average risk - weighted assets (in bps) 1) 34 25 19 40 28 Risk costs in bps of average customer lending 11.8% 10.7% 10.1% 10.8% 11.8% Return on equity based on 13.0% CET1 2) - 1.1% 151.0 149.3 0.5% 148.5 - 1.1% 151.0 149.3 Risk - weighted assets (end of period, in € billion) 1) Annualised total income divided by average RWA. 2) Annualised after - tax return divided by average equity based on 13.0% of RWA. Wholesale Banking delivered a strong performance in 3Q2025. Total income rose 7% sequentially and 4% year - on - year, driven notably by growth in fee income. This was supported by a greater number of lead roles, increased loan underwriting activity and higher lending volumes, and was coupled with resilient Financial Markets trading activity. This strong performance highlights the success of our strategy to diversify income streams. Combined with continued disciplined capital management and operational efficiency, this led to a return on equity of 11.8% for 3Q2025 and an improvement in income over average risk - weighted assets to 486 basis points. Excluding regulatory costs and €90 million of restructuring costs recorded in the prior quarter (resulting in approximately 230 redundancies), expenses remained stable compared with 2Q2025. The year - on - year increase reflects the impact of collective labour agreements, inflation and continued investments in business growth, including initiatives to further enhance the digital customer experience and the scalability of our systems. Risk costs amounted to € 134 million, or 28 basis points of average customer lending, mainly related to a number of newly defaulted files . Net core lending growth was €5.7 billion, driven by strong momentum in Lending and Trade Finance Services (TFS). Net core deposits also increased significantly by €6.9 billion, reflecting growth in Financial Markets and Payments & Cash Management (PCM), as well as higher volumes in our cash pooling business. Lending income rose 13% year - on - year, benefiting from strong deal activity, volume growth from our clients' increased financing needs, as well as positive fair value revaluations. Sequentially, total income increased by €104 million, reflecting strong fee generation, higher commercial net interest income and positive revaluations. The rise in deal flow and fee income underscores the strength of our advisory capabilities. Daily Banking & Trade Finance income decreased slightly from the previous quarter. Higher income from increased client demand in Working Capital Solutions (WCS) and TFS was more than offset by ongoing margin compression in PCM. Year - on - year, income declined due to a 52 basis - point drop in the margin for PCM and softer Trade & Commodity Finance performance, while stronger activity in WCS, TFS, and cash pooling contributed positively. Financial Markets income increased on both comparable quarters as we continued to support clients in FX and interest rate management, and with Global Capital Markets issuances. Year - on year growth was particularly visible in FX, Rates and Equity Derivatives. Sequentially, the improved performance was mainly driven by Equity Derivatives trading. Income from Treasury & Other increased quarter - on - quarter, primarily attributable to positive revaluations in Corporate Investments. Compared with 3Q2024, these gains were offset by lower Treasury results.
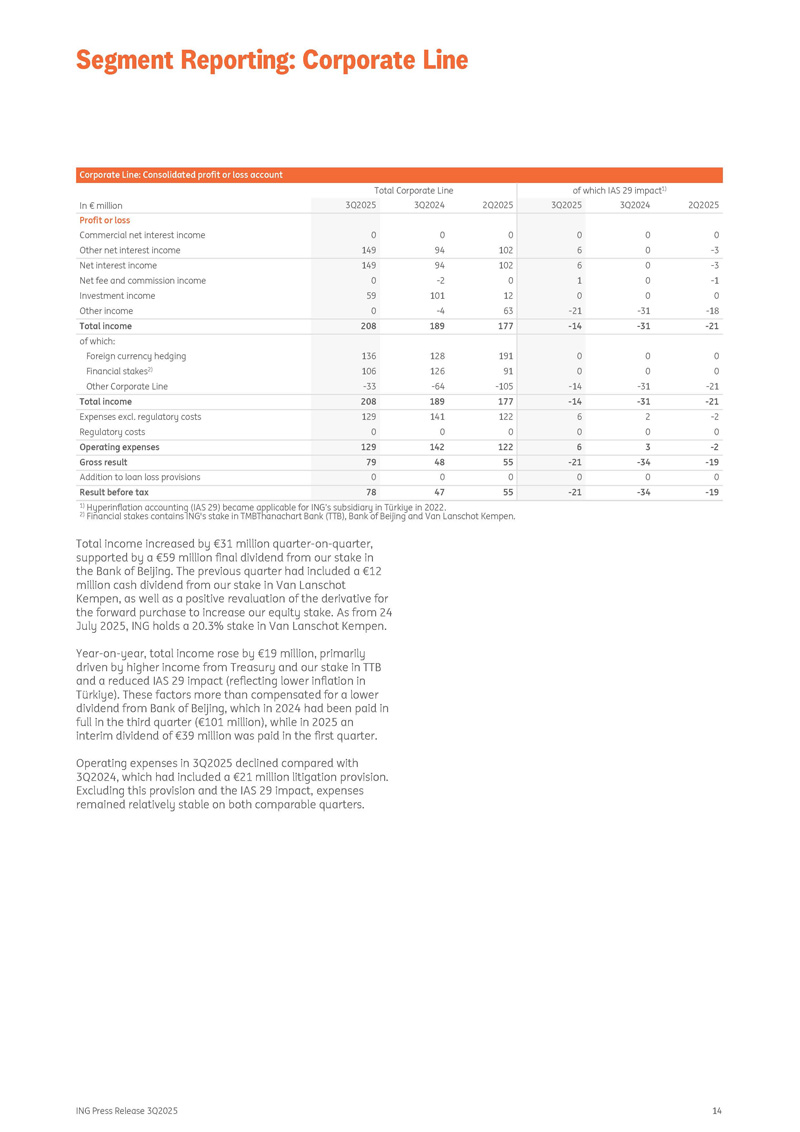
Segment Reporting: Wholesale Banking ING Press Release 3Q2025 14 Corporate Line: Consolidated profit or loss account of which IAS 29 impact 1) Total Corporate Line 2Q2025 3Q2024 3Q2025 2Q2025 3Q2024 3Q2025 In € million Profit or loss 0 0 0 0 0 0 Commercial net interest income - 3 0 6 102 94 149 Other net interest income - 3 0 6 102 94 149 Net interest income - 1 0 1 0 - 2 0 Net fee and commission income 0 0 0 12 101 59 Investment income - 18 - 31 - 21 63 - 4 0 Other income - 21 - 31 - 14 177 189 208 Total income of which: 0 0 0 191 128 136 Foreign currency hedging 0 0 0 91 126 106 Financial stakes 2) - 21 - 31 - 14 - 105 - 64 - 33 Other Corporate Line - 21 - 31 - 14 177 189 208 Total income - 2 2 6 122 141 129 Expenses excl. regulatory costs 0 0 0 0 0 0 Regulatory costs - 2 3 6 122 142 129 Operating expenses - 19 - 34 - 21 55 48 79 Gross result 0 0 0 0 0 0 Addition to loan loss provisions - 19 - 34 - 21 55 47 78 Result before tax 1) Hyperinflation accounting (IAS 29) became applicable for ING’s subsidiary in Türkiye in 2022. 2) Financial stakes contains ING's stake in TMBThanachart Bank (TTB), Bank of Beijing and Van Lanschot Kempen. Total income increased by €31 million quarter - on - quarter, supported by a €59 million final dividend from our stake in the Bank of Beijing. The previous quarter had included a €12 million cash dividend from our stake in Van Lanschot Kempen, as well as a positive revaluation of the derivative for the forward purchase to increase our equity stake. As from 24 July 2025, ING holds a 20.3% stake in Van Lanschot Kempen. Year - on - year, total income rose by €19 million, primarily driven by higher income from Treasury and our stake in TTB and a reduced IAS 29 impact (reflecting lower inflation in Türkiye). These factors more than compensated for a lower dividend from Bank of Beijing, which in 2024 had been paid in full in the third quarter (€101 million), while in 2025 an interim dividend of €39 million was paid in the first quarter. Operating expenses in 3Q2025 declined compared with 3Q2024, which had included a €21 million litigation provision. Excluding this provision and the IAS 29 impact, expenses remained relatively stable on both comparable quarters. Segment Reporting: Corporate Line ING Press Release 3Q2025 15 commercial net interest income and net core lending and deposits growth.
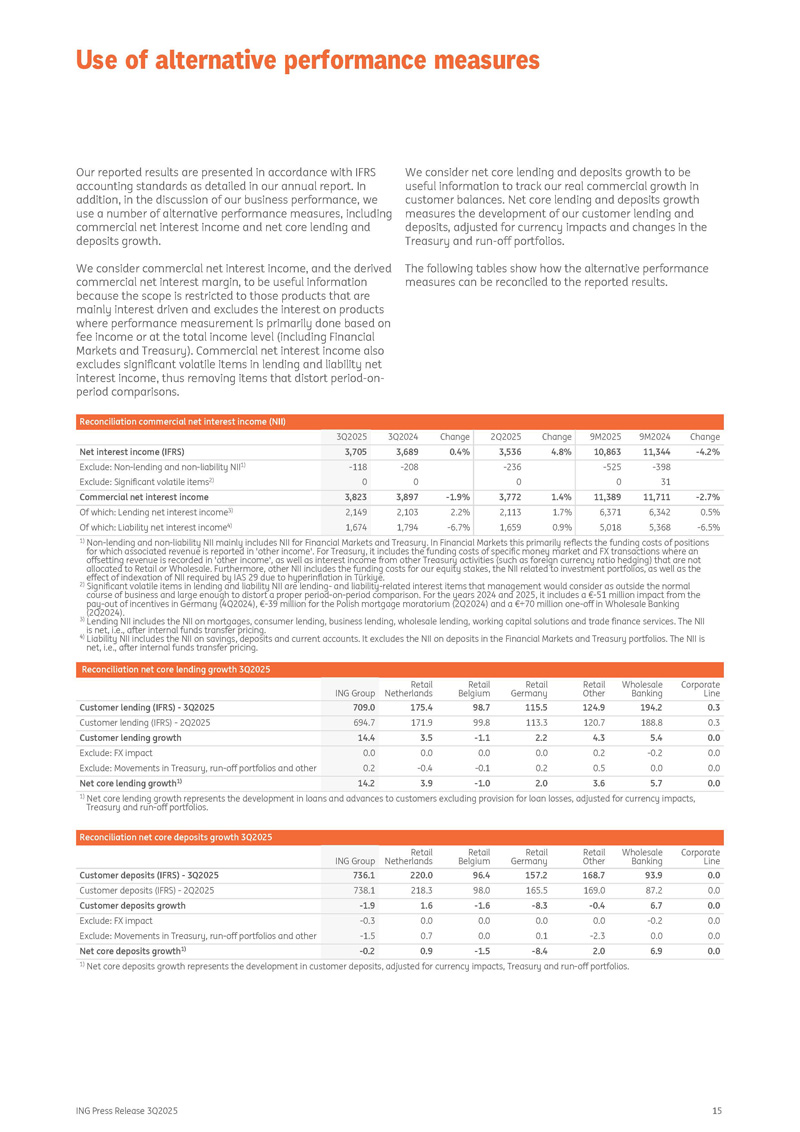
Our reported results are presented in accordance with IFRS We consider net core lending and deposits growth to be accounting standards as detailed in our annual report. In useful information to track our real commercial growth in addition, in the discussion of our business performance, we customer balances. Net core lending and deposits growth use a number of alternative performance measures, including measures the development of our customer lending and commercial net interest margin, to be useful information because the scope is restricted to those products that are mainly interest driven and excludes the interest on products where performance measurement is primarily done based on fee income or at the total income level (including Financial Markets and Treasury). Commercial net interest income also excludes significant volatile items in lending and liability net interest income, thus removing items that distort period - on - period comparisons. We consider commercial net interest income, and the derived The following tables show how the alternative performance deposits, adjusted for currency impacts and changes in the Treasury and run - off portfolios. measures can be reconciled to the reported results. Reconciliation commercial net interest income (NII) Change 9M2024 9M2025 Change 2Q2025 Change 3Q2024 3Q2025 - 4.2% 11,344 10,863 4.8% 3,536 0.4% 3,689 3,705 Net interest income (IFRS) - 398 - 525 - 236 - 208 - 118 Exclude: Non - lending and non - liability NII 1) 31 0 0 0 0 Exclude: Significant volatile items 2) - 2.7% 11,711 11,389 1.4% 3,772 - 1.9% 3,897 3,823 Commercial net interest income 0.5% 6,342 6,371 1.7% 2,113 2.2% 2,103 2,149 Of which: Lending net interest income 3) - 6.5% 5,368 5,018 0.9% 1,659 - 6.7% 1,794 1,674 Of which: Liability net interest income 4) 1) Non - lending and non - liability NII mainly includes NII for Financial Markets and Treasury. In Financial Markets this primarily reflects the funding costs of positions for which associated revenue is reported in 'other income'. For Treasury, it includes the funding costs of specific money market and FX transactions where an offsetting revenue is recorded in 'other income', as well as interest income from other Treasury activities (such as foreign currency ratio hedging) that are not allocated to Retail or Wholesale. Furthermore, other NII includes the funding costs for our equity stakes, the NII related to investment portfolios, as well as the effect of indexation of NII required by IAS 29 due to hyperinflation in Türkiye. 2) Significant volatile items in lending and liability NII are lending - and liability - related interest items that management would consider as outside the normal course of business and large enough to distort a proper period - on - period comparison. For the years 2024 and 2025, it includes a € - 51 million impact from the pay - out of incentives in Germany (4Q2024), € - 39 million for the Polish mortgage moratorium (2Q2024) and a €+70 million one - off in Wholesale Banking (2Q2024). 3) Lending NII includes the NII on mortgages, consumer lending, business lending, wholesale lending, working capital solutions and trade finance services. The NII is net, i.e., after internal funds transfer pricing. 4) Liability NII includes the NII on savings, deposits and current accounts. It excludes the NII on deposits in the Financial Markets and Treasury portfolios. The NII is net, i.e., after internal funds transfer pricing. Reconciliation net core lending growth 3Q2025 Corporate Line Wholesale Banking Retail Other Retail Germany Retail Belgium Retail Netherlands ING Group 0.3 194.2 124.9 115.5 98.7 175.4 709.0 Customer lending (IFRS) - 3Q2025 0.3 188.8 120.7 113.3 99.8 171.9 694.7 Customer lending (IFRS) - 2Q2025 0.0 5.4 4.3 2.2 - 1.1 3.5 14.4 Customer lending growth 0.0 - 0.2 0.2 0.0 0.0 0.0 0.0 Exclude: FX impact 0.0 0.0 0.5 0.2 - 0.1 - 0.4 0.2 Exclude: Movements in Treasury, run - off portfolios and other 0.0 5.7 3.6 2.0 - 1.0 3.9 14.2 Net core lending growth 1) 1) Net core lending growth represents the development in loans and advances to customers excluding provision for loan losses, adjusted for currency impacts, Treasury and run - off portfolios. Reconciliation net core deposits growth 3Q2025 Corporate Line Wholesale Banking Retail Other Retail Germany Retail Belgium Retail Netherlands ING Group 0.0 93.9 168.7 157.2 96.4 220.0 736.1 Customer deposits (IFRS) - 3Q2025 0.0 87.2 169.0 165.5 98.0 218.3 738.1 Customer deposits (IFRS) - 2Q2025 0.0 6.7 - 0.4 - 8.3 - 1.6 1.6 - 1.9 Customer deposits growth 0.0 - 0.2 0.0 0.0 0.0 0.0 - 0.3 Exclude: FX impact 0.0 0.0 - 2.3 0.1 0.0 0.7 - 1.5 Exclude: Movements in Treasury, run - off portfolios and other 0.0 6.9 2.0 - 8.4 - 1.5 0.9 - 0.2 Net core deposits growth 1) 1) Net core deposits growth represents the development in customer deposits, adjusted for currency impacts, Treasury and run - off portfolios.
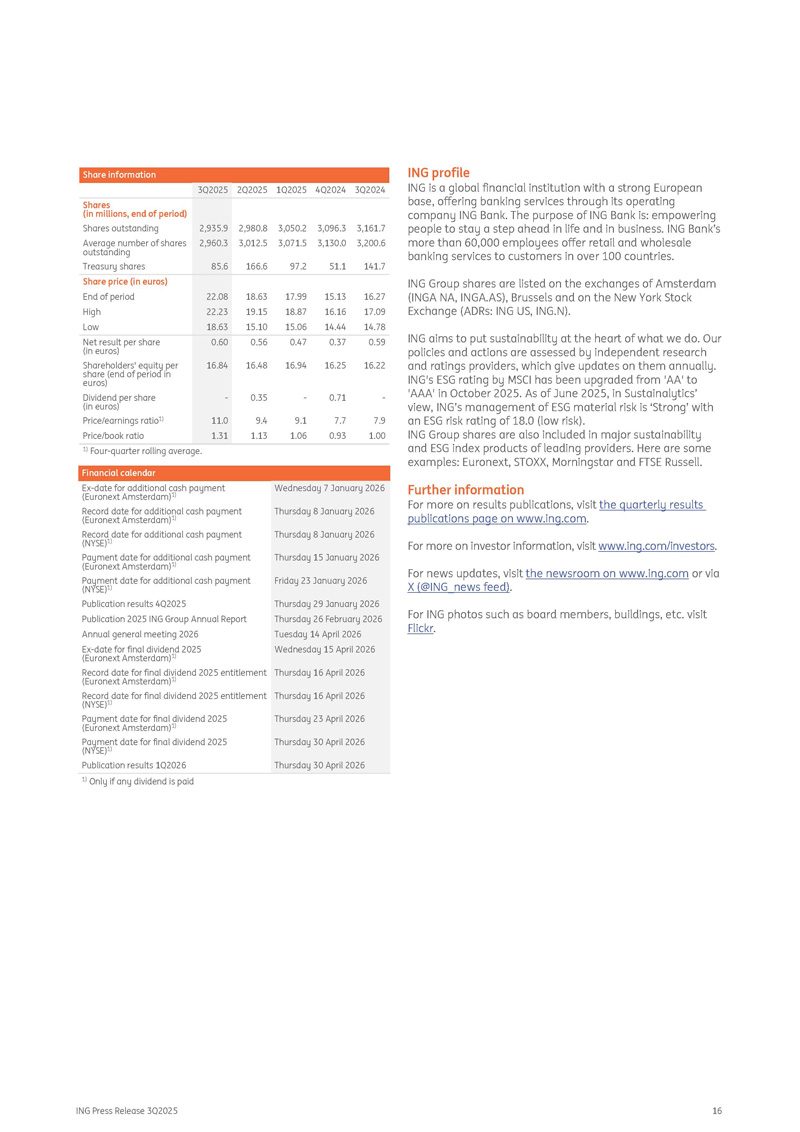
Use of alternative performance measures Share information 3Q2024 4Q2024 1Q2025 2Q2025 3Q2025 3,161.7 3,200.6 141.7 3,096.3 3,130.0 51.1 3,050.2 3,071.5 97.2 2,980.8 3,012.5 166.6 2,935.9 2,960.3 85.6 Shares (in millions, end of period) Shares outstanding Average number of shares outstanding Treasury shares Share price (in euros) 16.27 15.13 17.99 18.63 22.08 End of period 17.09 16.16 18.87 19.15 22.23 High 14.78 14.44 15.06 15.10 18.63 Low 0.59 0.37 0.47 0.56 0.60 Net result per share (in euros) 16.22 16.25 16.94 16.48 16.84 Shareholders' equity per share (end of period in euros) - 0.71 - 0.35 - Dividend per share (in euros) 7.9 7.7 9.1 9.4 11.0 Price/earnings ratio 1) 1.00 0.93 1.06 1.13 1.31 Price/book ratio 1) Four - quarter rolling average. Financial calendar Ex - date for additional cash payment (Euronext Amsterdam) 1) Record date for additional cash payment (Euronext Amsterdam) 1) Record date for additional cash payment (NYSE) 1) Payment date for additional cash payment (Euronext Amsterdam) 1) Payment date for additional cash payment (NYSE) 1) Publication results 4Q2025 Publication 2025 ING Group Annual Report Annual general meeting 2026 Ex - date for final dividend 2025 (Euronext Amsterdam) 1) Record date for final dividend 2025 entitlement (Euronext Amsterdam) 1) Record date for final dividend 2025 entitlement (NYSE) 1) Payment date for final dividend 2025 (Euronext Amsterdam) 1) Payment date for final dividend 2025 (NYSE) 1) Publication results 1Q2026 Wednesday 7 January 2026 Thursday 8 January 2026 Thursday 8 January 2026 Thursday 15 January 2026 Friday 23 January 2026 Thursday 29 January 2026 Thursday 26 February 2026 Tuesday 14 April 2026 Wednesday 15 April 2026 Thursday 16 April 2026 Thursday 16 April 2026 Thursday 23 April 2026 Thursday 30 April 2026 Thursday 30 April 2026 1) Only if any dividend is paid ING profile ING is a global financial institution with a strong European base, offering banking services through its operating company ING Bank. The purpose of ING Bank is: empowering people to stay a step ahead in life and in business. ING Bank’s more than 60,000 employees offer retail and wholesale banking services to customers in over 100 countries. ING Group shares are listed on the exchanges of Amsterdam (INGA NA, INGA.AS), Brussels and on the New York Stock Exchange (ADRs: ING US, ING.N). ING aims to put sustainability at the heart of what we do. Our policies and actions are assessed by independent research and ratings providers, which give updates on them annually. ING's ESG rating by MSCI has been upgraded from 'AA' to 'AAA' in October 2025. As of June 2025, in Sustainalytics’ view, ING’s management of ESG material risk is ‘Strong’ with an ESG risk rating of 18.0 (low risk). ING Group shares are also included in major sustainability and ESG index products of leading providers. Here are some examples: Euronext, STOXX, Morningstar and FTSE Russell. Further information For more on results publications, visit the quarterly results publications page on www.ing.com . For more on investor information, visit www.ing.com/investors . ING Press Release 3Q2025 16 For news updates, visit the newsroom on www.ing.com or via X (@ING_news feed) . For ING photos such as board members, buildings, etc. visit Flickr .
ING Press Release 3Q2025 17 Important legal information Elements of this press release contain or may contain information about ING Groep N.V. and/ or ING Bank N.V. within the meaning of Article 7(1) to (4) of EU Regulation No 596/2014 (‘Market Abuse Regulation’). ING Group’s annual accounts are prepared in accordance with International Financial Reporting Standards as adopted by the European Union (‘IFRS - EU’). In preparing the financial information in this document, except as described otherwise, the same accounting principles are applied as in the 2024 ING Group consolidated annual accounts. All figures in this document are unaudited. Small differences are possible in the tables due to rounding. Certain of the statements contained herein are not historical facts, including, without limitation, certain statements made of future expectations and other forward - looking statements that are based on management’s current views and assumptions and involve known and unknown risks and uncertainties that could cause actual results, performance or events to differ materially from those expressed or implied in such statements. Actual results, performance or events may differ materially from those in such statements due to a number of factors, including, without limitation: (1) changes in general economic conditions and customer behaviour, in particular economic conditions in ING’s core markets, including changes affecting currency exchange rates and the regional and global economic impact of the invasion of Russia into Ukraine and related international response measures (2) changes affecting interest rate levels (3) any default of a major market participant and related market disruption (4) changes in performance of financial markets, including in Europe and developing markets (5) fiscal uncertainty in Europe and the United States (6) discontinuation of or changes in ‘benchmark’ indices (7) inflation and deflation in our principal markets (8) changes in conditions in the credit and capital markets generally, including changes in borrower and counterparty creditworthiness (9) failures of banks falling under the scope of state compensation schemes (10) non - compliance with or changes in laws and regulations, including those concerning financial services, financial economic crimes and tax laws, and the interpretation and application thereof (11) geopolitical risks, political instabilities and policies and actions of governmental and regulatory authorities, including in connection with the invasion of Russia into Ukraine and the related international response measures (12) legal and regulatory risks in certain countries with less developed legal and regulatory frameworks (13) prudential supervision and regulations, including in relation to stress tests and regulatory restrictions on dividends and distributions (also among members of the group) (14) ING’s ability to meet minimum capital and other prudential regulatory requirements (15) changes in regulation of US commodities and derivatives businesses of ING and its customers (16) application of bank recovery and resolution regimes, including write down and conversion powers in relation to our securities (17) outcome of current and future litigation, enforcement proceedings, investigations or other regulatory actions, including claims by customers or stakeholders who feel misled or treated unfairly, and other conduct issues (18) changes in tax laws and regulations and risks of non - compliance or investigation in connection with tax laws, including FATCA (19) operational and IT risks, such as system disruptions or failures, breaches of security, cyber - attacks, human error, changes in operational practices or inadequate controls including in respect of third parties with which we do business and including any risks as a result of incomplete, inaccurate, or otherwise flawed outputs from the algorithms and data sets utilized in artificial intelligence (20) risks and challenges related to cybercrime including the effects of cyberattacks and changes in legislation and regulation related to cybersecurity and data privacy, including such risks and challenges as a consequence of the use of emerging technologies, such as advanced forms of artificial intelligence and quantum computing (21) changes in general competitive factors, including ability to increase or maintain market share (22) inability to protect our intellectual property and infringement claims by third parties (23) inability of counterparties to meet financial obligations or ability to enforce rights against such counterparties (24) changes in credit ratings (25) business, operational, regulatory, reputation, transition and other risks and challenges in connection with climate change, diversity, equity and inclusion and other ESG - related matters, including data gathering and reporting and also including managing the conflicting laws and requirements of governments, regulators and authorities with respect to these topics (26) inability to attract and retain key personnel (27) future liabilities under defined benefit retirement plans (28) failure to manage business risks, including in connection with use of models, use of derivatives, or maintaining appropriate policies and guidelines (29) changes in capital and credit markets, including interbank funding, as well as customer deposits, which provide the liquidity and capital required to fund our operations, and (30) the other risks and uncertainties detailed in the most recent annual report of ING Groep N.V. (including the Risk Factors contained therein) and ING’s more recent disclosures, including press releases, which are available on www.ING.com. This document may contain ESG - related material that has been prepared by ING on the basis of publicly available information, internally developed data and other third - party sources believed to be reliable. ING has not sought to independently verify information obtained from public and third - party sources and makes no representations or warranties as to accuracy, completeness, reasonableness or reliability of such information. This document may also discuss one or more specific transactions and/or contain general statements about ING’s ESG approach. The approach and criteria referred to in this document are intended to be applied in accordance with applicable law. Due to the fact that there may be different or even conflicting laws, the approach, criteria or the application thereof, could be different. Materiality, as used in the context of ESG, is distinct from, and should not be confused with, such term as defined in the Market Abuse Regulation or as defined for Securities and Exchange Commission (‘SEC’) reporting purposes. Any issues identified as material for purposes of ESG in this document are therefore not necessarily material as defined in the Market Abuse Regulation or for SEC reporting purposes. In addition, there is currently no single, globally recognized set of accepted definitions in assessing whether activities are “green” or “sustainable.” Without limiting any of the statements contained herein, we make no representation or warranty as to whether any of our securities constitutes a green or sustainable security or conforms to present or future investor expectations or objectives for green or sustainable investing. For information on characteristics of a security, use of proceeds, a description of applicable project(s) and/or any other relevant information, please reference the offering documents for such security. This document may contain inactive textual addresses to internet websites operated by us and third parties. Reference to such websites is made for information purposes only, and information found at such websites is not incorporated by reference into this document. ING does not make any representation or warranty with respect to the accuracy or completeness of, or take any responsibility for, any information found at any websites operated by third parties. ING specifically disclaims any liability with respect to any information found at websites operated by third parties. ING cannot guarantee that websites operated by third parties remain available following the publication of this document, or that any information found at such websites will not change following the filing of this document. Many of those factors are beyond ING’s control. Any forward - looking statements made by or on behalf of ING speak only as of the date they are made, and ING assumes no obligation to publicly update or revise any forward - looking statements, whether as a result of new information or for any other reason. This document does not constitute an offer to sell, or a solicitation of an offer to purchase, any securities in the United States or any other jurisdiction.