UNITED STATES
SECURITIES AND EXCHANGE COMMISSION
Washington, D.C. 20549
FORM 8-K
CURRENT REPORT
Pursuant to Section 13 or 15(d)
of the Securities Exchange Act of 1934
Date of Report (Date of earliest event reported): June 22, 2025
Beta Bionics, Inc.
(Exact name of registrant as specified in its charter)
| Delaware | 001-42491 | 47-5386878 | ||
| (State or other jurisdiction of incorporation) | (Commission File Number) | (IRS Employer Identification No.) |
11 Hughes
Irvine, California 92618
(Address of principal executive offices)
Registrant’s telephone number, including area code: (949) 427-7785
N/A
(Former name or former address, if changed since last report.)
Check the appropriate box below if the Form 8-K filing is intended to simultaneously satisfy the filing obligation of the registrant under any of the following provisions:
☐ Written communications pursuant to Rule 425 under the Securities Act (17 CFR 230.425)
☐ Soliciting material pursuant to Rule 14a-12 under the Exchange Act (17 CFR 240.14a-12)
☐ Pre-commencement communications pursuant to Rule 14d-2(b) under the Exchange Act (17 CFR 240.14d-2(b))
☐ Pre-commencement communications pursuant to Rule 13e-4(c) under the Exchange Act (17 CFR 240.13e-4(c))
Securities registered pursuant to Section 12(b) of the Act:
| Title of each class | Trading symbol(s) |
Name of each exchange on which registered |
||
| Common Stock, $0.0001 par value per share | BBNX | Nasdaq Global Market |
Indicate by check mark whether the registrant is an emerging growth company as defined in Rule 405 of the Securities Act of 1933 (§230.405 of this chapter) or Rule 12b-2 of the Securities Exchange Act of 1934 (§240.12b-2 of this chapter).
Emerging growth company ☒
If an emerging growth company, indicate by check mark if the registrant has elected not to use the extended transition period for complying with any new or revised financial accounting standards provided pursuant to Section 13(a) of the Exchange Act. ☐
Item 7.01 Regulation FD Disclosure
On June 22, 2025, Beta Bionics, Inc. (the “Company”) hosted its first Investor and Analyst Event in conjunction with the 85th Scientific Sessions of the American Diabetes Association (“ADA”). A copy of the presentation to be used by the Company during the event (the “Presentation”) is attached hereto as Exhibit 99.1 and incorporated by reference herein. A copy of the Presentation will also be available on the Company’s website in the “Investors – Events & Presentations” section at https://investors.betabionics.com. Information contained in, or that can be accessed through, the Company's website is not incorporated by reference into this report.
The information contained under this Item 7.01, including Exhibit 99.1 attached hereto, shall not be deemed “filed” for purposes of Section 18 of the Securities Exchange Act of 1934, as amended (the “Exchange Act”), or otherwise subject to the liability of that section, nor shall it be deemed incorporated by reference in any filing under the Securities Act of 1933, as amended, or under the Exchange Act, regardless of any general incorporation language in any such filing, unless the Company expressly sets forth in such filing that such information is to be considered “filed” or incorporated by reference therein.
Item 8.01 Other Events
On June 22, 2025, the Company announced updated “Real-world” iLet Bionic Pancreas (“iLet”) data sourced from iLet users who uploaded continuous glucose monitor (“CGM”) readings to the Beta Bionics cloud over the first two years after the iLet’s commercial launch (May 19, 2023 to May 18, 2025). 16,439 iLet users uploaded at least three-weeks’ worth of iLet data. Of those 16,439 iLet users, 14,952 had a pre-iLet baseline HbA1c value available (as provided to us by the medical providers).
Figure 1 shows the change from baseline HbA1c to glucose management indicator (“GMI”) – a population-based estimate of HbA1c based on mean CGM glucose that is widely accepted as an indicator in the diabetes industry – on the iLet for the group of 14,952 iLet users. Data from these users showed an overall improvement from an average baseline HbA1c of 8.9% to an average GMI of 7.3% on the iLet. Users saw a meaningful change from baseline HbA1c to follow-up GMI on iLet regardless of their baseline HbA1c. Additionally, over 84% of these users met the ADA’s hypoglycemia goals of less than 4% time below 70 mg/dL and less than 1% time below 54 mg/dL.
Figure 1. All iLet Users: Change from Baseline HbA1c to Follow-Up GMI While On the iLet
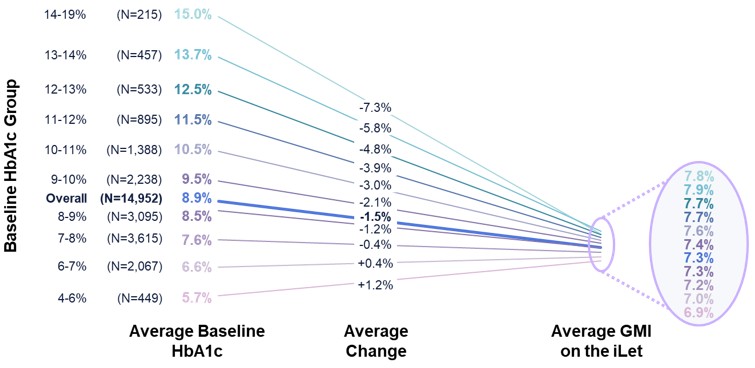
Figure 2 shows the HbA1c of adults with Type 1 Diabetes (“T1D”) in the United States based on the real-world data included in Pettus et al., Diabetes Care 2019;42:2220–2227 (“Pettus study”). The Pettus study included data from 31,430 adults, sourced from the Optum Humedica database between July 2014 and June 2016. Figure 2 also shows the baseline HbA1c of 10,333 iLet users who are adults and have T1D (as provided to us by the medical providers). The 10,333 iLet users included in Figure 2 who are adults and have T1D are a subgroup of the aforementioned 14,952 iLet users.
Figure 2. HbA1c of Adults with T1D in the U.S. Versus Baseline HbA1c of iLet Adult Users with T1D
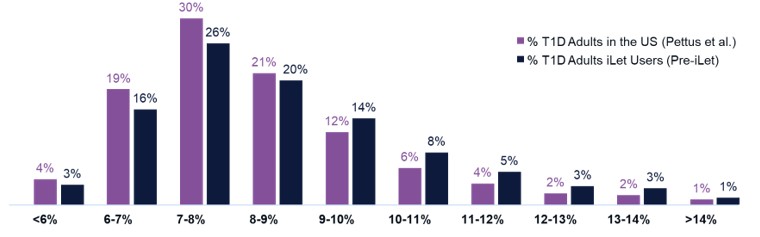
Figure 3 shows the HbA1c of adults with T1D in the United States based on the Pettus study. Figure 3 also shows the follow-up GMI on iLet of the same 10,333 iLet users who are adults and have T1D as described above.
Figure 3. HbA1c of Adults with T1D in the U.S. Versus Follow-Up GMI of iLet Adult Users with T1D
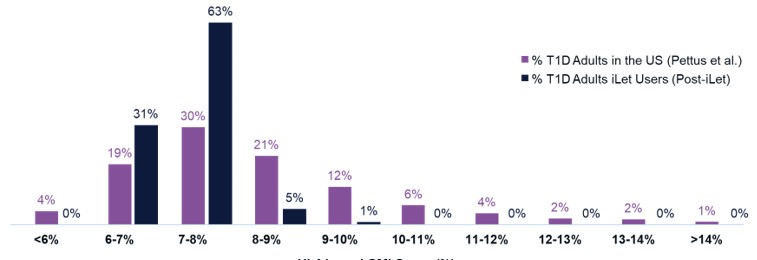
Figure 4 shows the change from baseline HbA1c to GMI on the iLet for iLet users whose previous therapy before starting iLet was multiple daily injections (“MDI”) (as provided to us by the medical providers). Of the aforementioned 14,952 iLet users, 8,802 iLet users were identified as using MDI as their most recent therapy prior to starting iLet. Data from these previous MDI users showed an overall improvement from an average baseline HbA1c of 9.2% to an average GMI of 7.3% on the iLet. Users saw a meaningful change from baseline HbA1c to follow-up GMI on iLet regardless of their baseline HbA1c. Additionally, over 85% of users met the ADA’s aforementioned hypoglycemia goals.
Figure 4. iLet Users Coming from MDI: Change from Baseline HbA1c to Follow-Up GMI While On the iLet
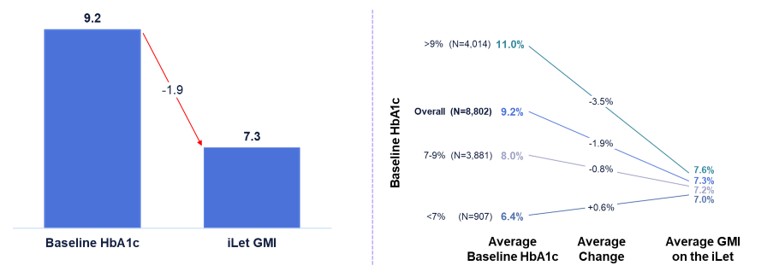
Figure 5 shows the change from baseline HbA1c to GMI on the iLet for iLet users whose previous therapy before starting iLet was a competitive hybrid-closed loop (“HCL”) system (as provided to us directly by users). Competitive HCL systems include Tandem’s t:slim X2 and Mobi, Insulet’s Omnipod 5, and Medtronic’s MiniMed 670G, 720G, 750G, 760G, 770G, and 780G. Of the aforementioned 14,952 iLet users, 2,910 iLet users were identified as using a competitive HCL system as their most recent therapy prior to starting iLet. Data from these previous competitive HCL system users showed an overall improvement from an average baseline HbA1c of 8.1% to an average GMI of 7.3% on the iLet. Users saw a meaningful change from baseline HbA1c to follow-up GMI on iLet regardless of their baseline HbA1c. Additionally, over 83% of users met the ADA’s aforementioned hypoglycemia goals.
Figure 5. iLet Users Coming from Competitive HCL Systems: Change from Baseline HbA1c to Follow-Up GMI While On the iLet
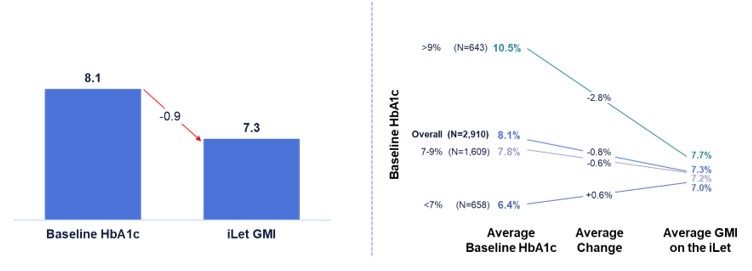
Figure 6 shows the change from baseline HbA1c to GMI on the iLet for iLet users who are treated in endocrinology practices and primary care practices (as determined by Symphony Health Solutions’ database and the Centers for Medicare & Medicaid Services’ National Plan and Provider Enumeration System). Of the aforementioned 14,952 iLet users, 13,566 iLet users were identified as being treated in endocrinology practices, and 1,036 iLet users were identified as being treated in primary care practices. Data from iLet users treated in endocrinology practices and users treated in primary care practices showed a similar overall improvement from an average baseline HbA1c of 8.9% to an average GMI of 7.3% on the iLet. Users saw a similar improvement from baseline HbA1c to follow-up GMI on iLet regardless of their provider practice type. Additionally, over 84% of users met the ADA’s aforementioned hypoglycemia goals regardless of their provider practice type.
Figure 6. iLet Users Treated by Type of Provider Practice (Endocrinology or Primary Care)
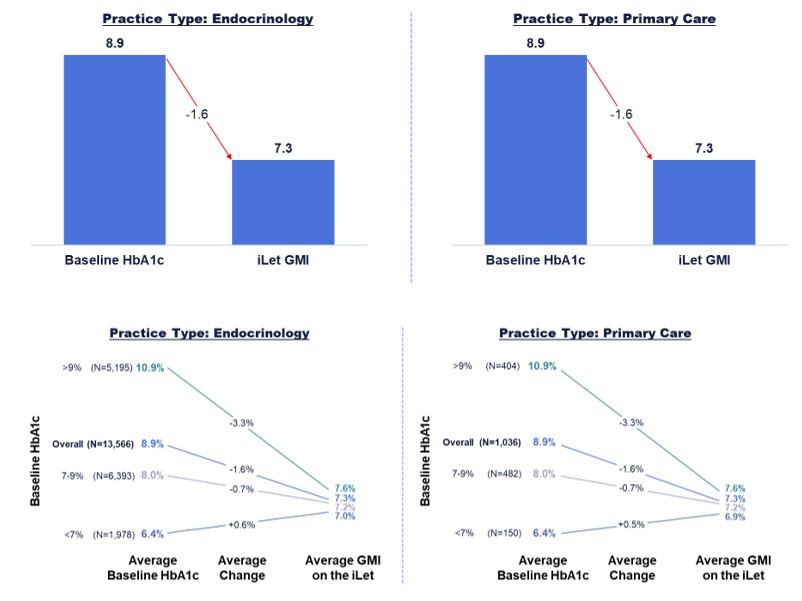
Figure 7 shows the change from baseline HbA1c to GMI on the iLet for iLet users who use the pump in a “fully-closed loop” manner, defined as iLet users who announced less than one meal per day, on average, over the 21-day period from April 28, 2025 to May 18, 2025 (as determined by meal announcements inputted into the iLet App). Of the aforementioned 14,952 iLet users, 2,416 iLet users were identified as using the pump in a “fully-closed loop” manner. On average, “fully-closed loop” iLet users announced approximately one meal every three days. Data from “fully-closed loop” iLet users showed an overall improvement from an average baseline HbA1c of 9.4% to an average GMI of 7.5% on the iLet during the 21-day period. Users saw a meaningful change from baseline HbA1c to follow-up GMI on iLet regardless of their baseline HbA1c, and approximately 83% of users met the ADA’s aforementioned hypoglycemia goals. Additionally, those users showed an average time in range (defined as blood glucose levels between 70 and 180 mg/dL as determined by CGM readings) of approximately 62%. Lastly, 530 iLet users were identified as not having announced a single meal in the aforementioned 21-day period, and those users showed an overall improvement from an average baseline HbA1c of 9.4% to an average GMI of 7.4% on the iLet during the 21-day period. Additionally, approximately 86% of those users met the ADA’s aforementioned hypoglycemia goals.
Figure 7. “Fully-Closed” Loop iLet Users: Change from Baseline HbA1c to Follow-Up GMI
While On the iLet
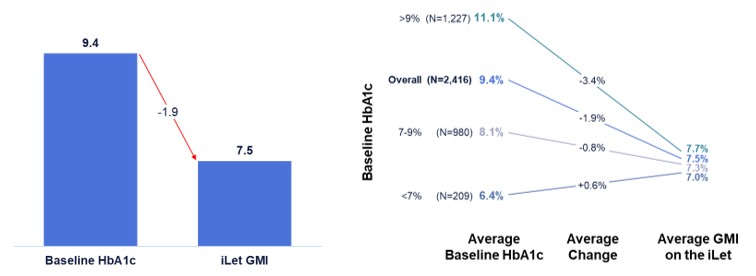
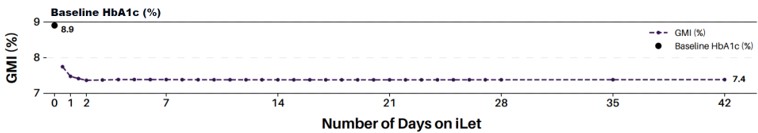
Figure 8 shows the change from baseline HbA1c to follow-up GMI on the iLet relative to the duration of iLet use from initialization to day 42. These data are sourced from all iLet users who uploaded CGM readings to the Beta Bionics cloud over the first two years after the iLet’s commercial launch (May 19, 2023 to May 18, 2025). 90% of these users had a baseline HbA1c available, but all users were included in the analysis regardless of whether or not they had a baseline HbA1c available. In total, 30,077 iLet sessions were uploaded. A session reflects each initial use of an iLet or after a factory reset. Most iLets had only one session. iLet sessions showed an overall improvement from an average baseline HbA1c of 8.9% to an average GMI of 7.4% on the iLet after 42 days. On average, the iLet sessions took two days to reach a near steady-state GMI of 7.4%, suggesting that the adaptive algorithm “warms-up” just two days after initiation.
Figure 8. Change from Baseline HbA1c to Follow-Up GMI On the iLet Relative to the Duration of iLet Use
Cautionary Statement Regarding Forward Looking Statements
This Current Report on Form 8-K contains forward-looking statements within the meaning of the Private Securities Litigation Reform Act of 1995. Statements in this Current Report on Form 8-K that are not statements of historical fact are forward-looking statements. Such forward-looking statements include, without limitation, statements regarding the potential benefits of the iLet, including the overall improvement reflected in the data between average baseline HbA1c and an average GMI on the iLet. These forward-looking statements are based on the beliefs of the management of the Company as well as assumptions made by and information currently available to the Company. Such statements reflect the current views of the Company with respect to future events and are subject to known and unknown risks and uncertainties, including business, regulatory, economic and competitive risks and uncertainties about the Company, including, without limitation, risks inherent in developing product candidates, future results from the Company’s ongoing and future studies and clinical trials, the Company’s ability to obtain adequate financing to fund its product development and other expenses, risks that real-world data or future results may not be consistent with interim, initial or preliminary results or results from prior preclinical studies or clinical trials, trends in the industry, the Company’s relationships with its existing and future collaboration partners, the legal and regulatory framework for the industry, future expenditures and the potential impacts of global macroeconomic conditions. In light of these risks and uncertainties, the events or circumstances referred to in the forward-looking statements may not occur. The actual results may vary from the anticipated results and the variations may be material. Other factors that may cause the Company’s actual results to differ from current expectations are discussed in the Company’s filings with the Securities and Exchange Commission, including the section titled “Risk Factors” in the Company’s Quarterly Report on Form 10-Q for the quarter ended March 31, 2025. You are cautioned not to place undue reliance on these forward-looking statements, which speak only as of the date this Current Report on Form 8-K is given. Except as required by law, the Company undertakes no obligation to publicly update any forward-looking statements, whether as a result of new information, future events or otherwise.
Item 9.01 Financial Statements and Exhibits.
(d) Exhibits.
| Exhibit No. | Description |
| 99.1 | Investor and Analyst Event Presentation |
| 104 | Cover Page Interactive Data File (embedded within the Inline XBRL document) |
SIGNATURES
Pursuant to the requirements of the Securities Exchange Act of 1934, the registrant has duly caused this report to be signed on its behalf by the undersigned hereunto duly authorized.
| Beta Bionics, Inc. | ||
| By: | /s/ Sean Saint | |
| Sean Saint | ||
| President and Chief Executive Officer | ||
Dated: June 23, 2025
Exhibit 99.1

ADA Investor & Analyst Event June 2025

Disclaimer 2 This presentation contains forward - looking statements within the meaning of the Private Securities Litigation Reform Act of 1995. Statements in this presentation that are not statements of historical fact are forward - looking statements. Such forward - looking statements include, without limitation, statements regarding: expectations of Beta Bionics, Inc. (the “Company”) regarding the potential benefits, effectiveness, and safety of the iLet and other product candidates; our expectations with regard to the design, results and timing of our research and development efforts, clinical trials and real world use or experience, including the timing and availability of data from such trials and real world use; our regulatory development plans for the iLet and other product candidates; the markets and market opportunities for the iLet and other product candidates, and if approved; the timing, likelihood or success of our business strategy, including commercialization and our multi - channel reimbursement strategy. In some cases, you can identify forward - looking statements by terms such as “expect,” “should,” “plan,” “anticipate,” “could,” “intend,” “target,” “project,” “believe,” “estimates,” “potential” or “continue” or the negative of these terms or other similar expressions. These forward - looking statements are based on the beliefs of the management of the Company as well as assumptions made by and information currently available to the Company. These statements involve substantial known and unknown risks, uncertainties and other factors that may cause our actual results, timing of results, levels of activity, performance, or achievements to be materially different from the information expressed or implied by these forward - looking statements. Other factors that may cause the Company’s actual results to differ from current expectations are discussed in the Company’s filings with the Securities and Exchange Commission (the “SEC”), including the section titled “Risk Factors” in the Company’s Form 10 - Q for the quarter ended March 31, 2025, filed with the SEC on May 6, 2025. You are cautioned not to place undue reliance on these forward - looking statements, which speak only as of the date this presentation is given. Except as required by law, the Company undertakes no obligation to publicly update any forward - looking statements, whether as a result of new information, future events or otherwise. We operate in a very competitive and rapidly changing environment, and new risks emerge from time to time. It is not possible for our management to predict all risks, nor can we assess the impact of all factors on our business or the extent to which any factor, or combination of factors, may cause actual results to differ materially and adversely from those anticipated or implied in the forward - looking statements. We may not actually achieve the plans, intentions, or expectations disclosed in our forward - looking statements, and you should not place undue reliance on our forward - looking statements. Actual results or events could differ materially from the plans, intentions and expectations disclosed in the forward - looking statements we make. The forward - looking statements in this presentation represent our views as of the date of this presentation. We anticipate that subsequent events and developments will cause our views to change. However, while we may elect to update these forward - looking statements at some point in the future, we have no current intention of doing so except to the extent required by applicable law. Except as required by law, neither we nor any other person assumes responsibility for the accuracy and completeness of the forward - looking statements in this presentation and the accompanying oral commentary. You should, therefore, not rely on these forward - looking statements as representing our views as of any date subsequent to the date of this presentation. This presentation contains trademarks, service marks, trade names and copyrights of the Company and other companies which are the property of their respective owners. This presentation discusses certain product candidates that have not yet received marketing authorization or clearance by the U.S. Food and Drug Administration. No representation is made as to the safety, effectiveness or likelihood of marketing authorization or clearance of these product candidates.

Event Agenda 1 2 5 4 3 3 Commercial Updates Q&A Adaptive - Closed Loop Algorithm Overview iLet Real - World Evidence Patch Pump Demonstration Presenters • Stephen Feider, Chief Financial Officer • Mark Hopman, Chief Commercial Officer • All Presenters • Sean Saint, Chief Executive Officer • Sean Saint, Chief Executive Officer • Dr.

Steven Russell, Chief Medical Officer • Sean Saint, Chief Executive Officer • Mike Mensinger, Chief Product Officer Event Agenda 1 2 5 4 3 4 Commercial Updates Q&A Adaptive - Closed Loop Algorithm Overview iLet Real - World Evidence Patch Pump Demonstration Presenters • Stephen Feider, Chief Financial Officer • Mark Hopman, Chief Commercial Officer • All Presenters • Sean Saint, Chief Executive Officer • Sean Saint, Chief Executive Officer • Dr. Steven Russell, Chief Medical Officer • Sean Saint, Chief Executive Officer • Mike Mensinger, Chief Product Officer Bionic Portal for Healthcare Providers Filter Patients by Prior Therapy Overall Patient Cohort Outcomes Patient Subgroup Outcomes Patient - Specific Outcomes Note: 5 The data shown is an illustrative example.
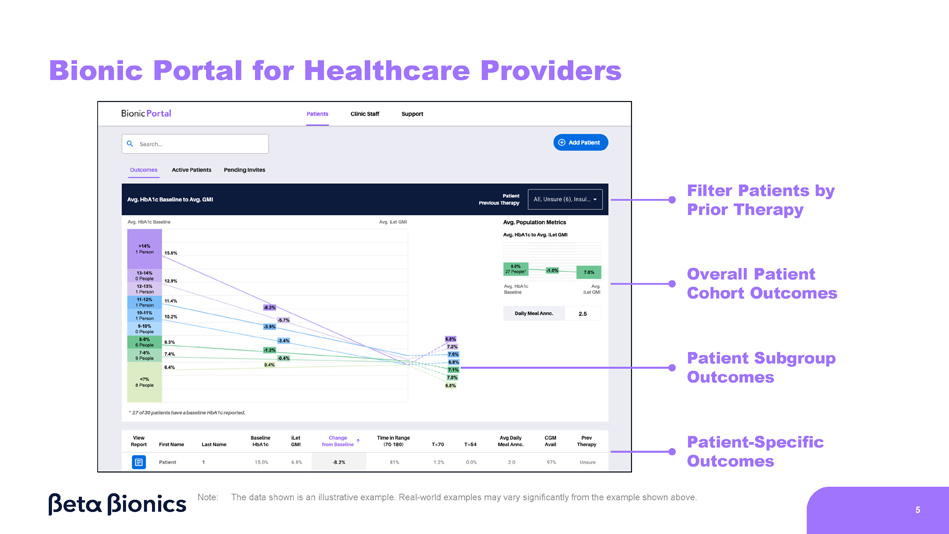
Real - world examples may vary significantly from the example shown above.

Pharmacy Channel Strategy Streamlined insurance approval Users Less administrative burden Lower out - of - pocket costs No 4 - year pump commitment Beta Bionics Faster Access to New Users Pay - as - you - go economics Higher Customer Lifetime Value Pharmacy New Patient Starts Providers Payers PBM Agreement Health Plan Adoption 1 2 Time & Logistics 3 x Shifting risk to manufacturer Note: 6 Pharmacy Benefit Manager (PBM).

Event Agenda 1 2 5 4 3 7 Commercial Updates Q&A Adaptive - Closed Loop Algorithm Overview iLet Real - World Evidence Patch Pump Demonstration Presenters • Stephen Feider, Chief Financial Officer • Mark Hopman, Chief Commercial Officer • All Presenters • Sean Saint, Chief Executive Officer • Sean Saint, Chief Executive Officer • Dr. Steven Russell, Chief Medical Officer • Sean Saint, Chief Executive Officer • Mike Mensinger, Chief Product Officer Automated Insulin Delivery Continuum: Users 1.

iLet does not require carb counting, but users must be carb aware Users Engagement Required No Engagement Required Carb Counting Manual Correction Boluses Temporary Basal Rate Adjustments Fixed Mealtime Dosing Meal Announcements 1 Extended Boluses Pre - Programmed Carb Counts Hybrid - Closed Loop 8 Fully - Closed Loop HCPs Manually Adjust Settings Quarterly Automated Insulin Delivery Continuum: HCPs Static Adaptive Basal Rate, Calculate Initial Settings Per Guidelines Manually Adjust Non - Basal Settings Quarterly Manually Adjust Settings Quarterly Basal Rate Learning Algorithm Pump Setup Wizard Per Guidelines No Settings Corrections & Meals Learning Algorithms Note: Healthcare Provider (HCP).
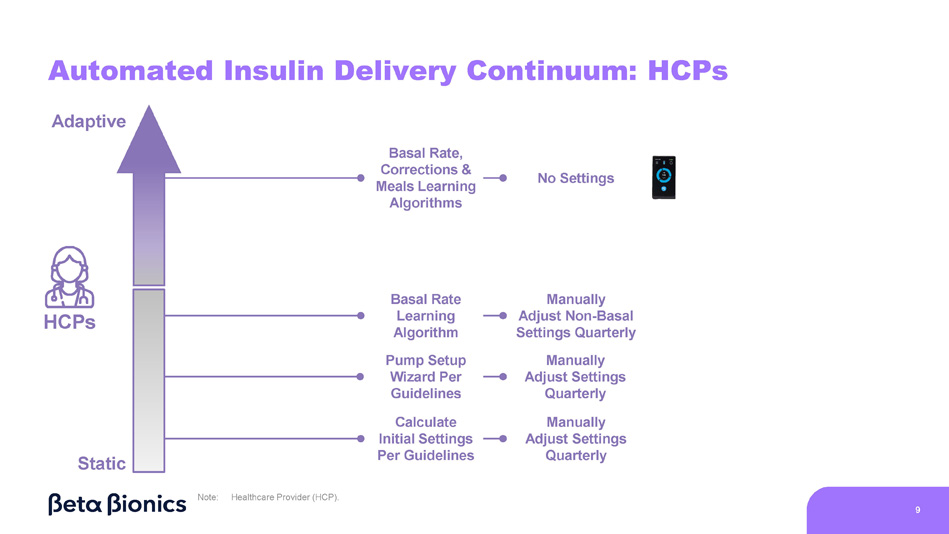
9
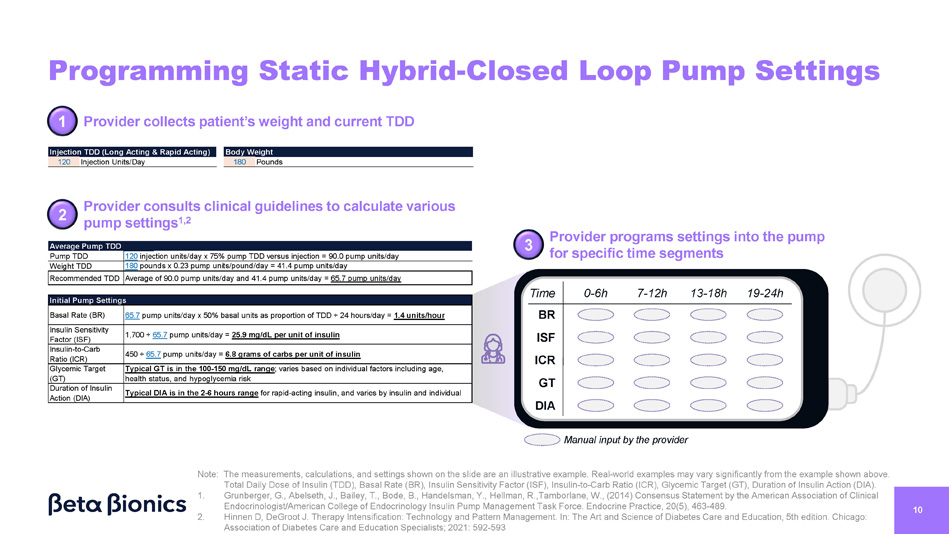
Average Pump TDD 120 injection units/day x 75% pump TDD versus injection = 90.0 pump units/day Pump TDD 180 pounds x 0.23 pump units/pound/day = 41.4 pump units/day Weight TDD Average of 90.0 pump units/day and 41.4 pump units/day = 65.7 pump units/day Recommended TDD Initial Pump Settings 65.7 pump units/day x 50% basal units as proportion of TDD · 24 hours/day = 1.4 units/hour Basal Rate (BR) 1,700 · 65.7 pump units/day = 25.9 mg/dL per unit of insulin Insulin Sensitivity Factor (ISF) 450 · 65.7 pump units/day = 6.8 grams of carbs per unit of insulin Insulin - to - Carb Ratio (ICR) Typical GT is in the 100 - 150 mg/dL range ; varies based on individual factors including age, health status, and hypoglycemia risk Glycemic Target (GT) Typical DIA is in the 2 - 6 hours range for rapid - acting insulin, and varies by insulin and individual Duration of Insulin Action (DIA) Provider programs settings into the pump for specific time segments 10 Programming Static Hybrid - Closed Loop Pump Settings Endocrinologist/American College of Endocrinology Insulin Pump Management Task Force. Endocrine Practice, 20(5), 463 - 489. 2. Hinnen D, DeGroot J. Therapy Intensification: Technology and Pattern Management. In: The Art and Science of Diabetes Care and Education, 5th edition. Chicago: Association of Diabetes Care and Education Specialists; 2021: 592 - 593 Provider consults clinical guidelines to calculate various pump settings 1,2 1 Provider collects patient’s weight and current TDD 120 180 Injection TDD (Long Acting & Rapid Acting) Injection Units/Day Body Weight Pounds 3 2 Time BR ISF ICR GT DIA Manual input by the provider Note: The measurements, calculations, and settings shown on the slide are an illustrative example. Real - world examples may vary significantly from the example shown above. Total Daily Dose of Insulin (TDD), Basal Rate (BR), Insulin Sensitivity Factor (ISF), Insulin - to - Carb Ratio (ICR), Glycemic Target (GT), Duration of Insulin Action (DIA). 1. Grunberger, G., Abelseth, J., Bailey, T., Bode, B., Handelsman, Y., Hellman, R.,Tamborlane, W., (2014) Consensus Statement by the American Association of Clinical 0 - 6h 19 - 24h 7 - 12h 13 - 18h 11 How Pump Settings Translate to Insulin Delivery BR ISF ICR GT DIA Time 0 - 6h 19 - 24h 7 - 12h 13 - 18h Basal Dose Every 5 mins.
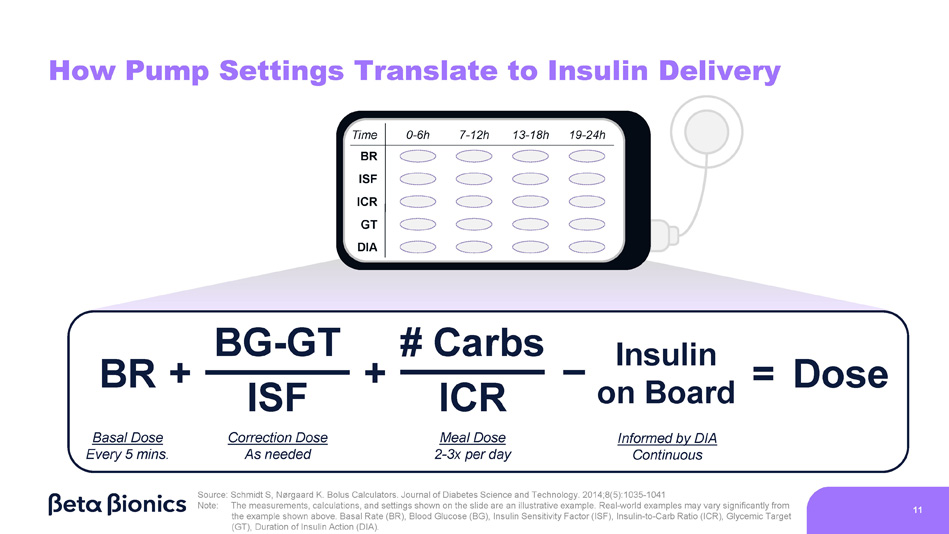
ISF Correction Dose As needed ICR Meal Dose 2 - 3x per day BG - GT # Carbs BR + + Insulin on Board Informed by DIA Continuous = Dose Source: Schmidt S, Nørgaard K. Bolus Calculators. Journal of Diabetes Science and Technology. 2014;8(5):1035 - 1041 Note: The measurements, calculations, and settings shown on the slide are an illustrative example . Real - world examples may vary significantly from the example shown above . Basal Rate (BR), Blood Glucose (BG), Insulin Sensitivity Factor (ISF), Insulin - to - Carb Ratio (ICR), Glycemic Target (GT), Duration of Insulin Action (DIA) .
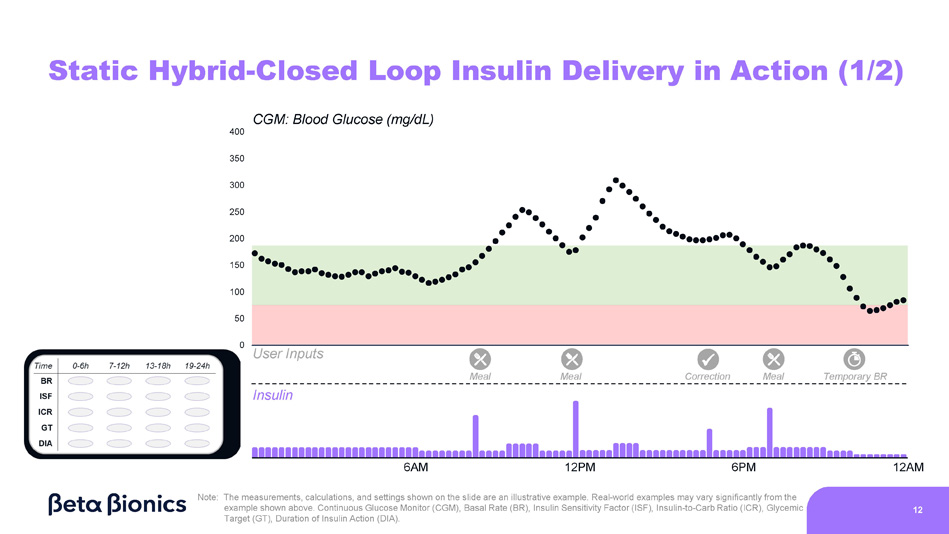
0 CGM: Blood Glucose (mg/dL) 400 350 300 250 200 150 100 50 Static Hybrid - Closed Loop Insulin Delivery in Action (1/2) Insulin User Inputs x Meal Correction Temporary BR Meal Meal 6AM 12PM 6PM 12AM Note: The measurements, calculations, and settings shown on the slide are an illustrative example. Real - world examples may vary significantly from the example shown above. Continuous Glucose Monitor (CGM), Basal Rate (BR), Insulin Sensitivity Factor (ISF), Insulin - to - Carb Ratio (ICR), Glycemic Target (GT), Duration of Insulin Action (DIA). 12 0 Static Hybrid - Closed Loop Insulin Delivery in Action (2/2) Insulin User Inputs x CGM: Blood Glucose (mg/dL) 400 350 300 250 200 150 100 50 Meal Meal Correction Meal 6AM 12PM 6PM 12AM Note: The measurements, calculations, and settings shown on the slide are an illustrative example.
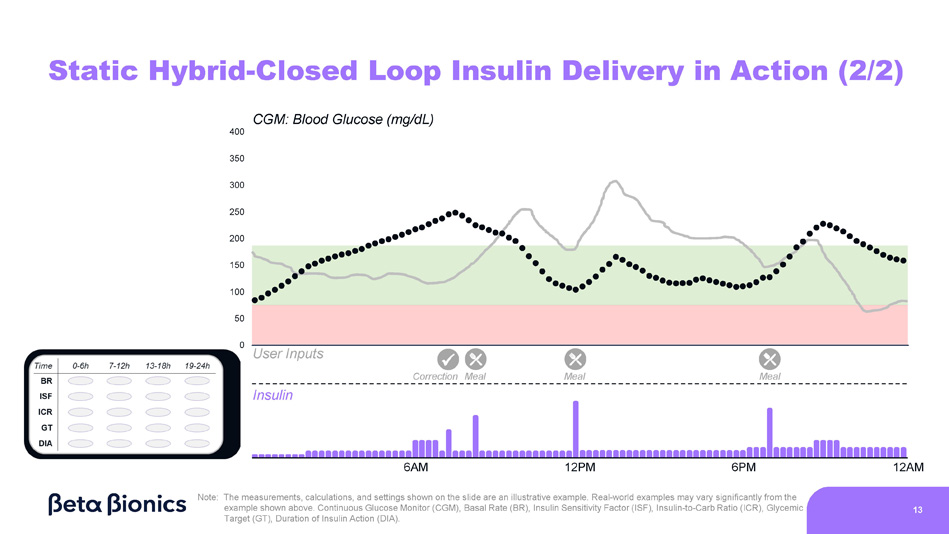
Real - world examples may vary significantly from the example shown above. Continuous Glucose Monitor (CGM), Basal Rate (BR), Insulin Sensitivity Factor (ISF), Insulin - to - Carb Ratio (ICR), Glycemic Target (GT), Duration of Insulin Action (DIA). 13 0 Interpreting Glycemic Charts to Adjust Pump Settings… Insulin CGM: Blood Glucose (mg/dL) 400 350 300 250 200 150 100 50 User Inputs …is a difficult and time - consuming process for healthcare providers 6AM 12PM 6PM 12AM Note: The measurements, calculations, and settings shown on the slide are an illustrative example.
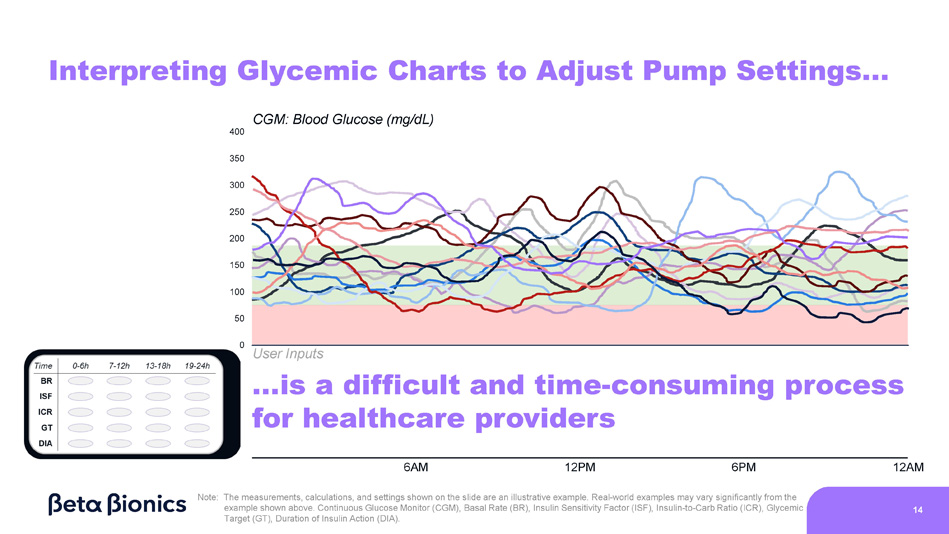
Real - world examples may vary significantly from the example shown above. Continuous Glucose Monitor (CGM), Basal Rate (BR), Insulin Sensitivity Factor (ISF), Insulin - to - Carb Ratio (ICR), Glycemic Target (GT), Duration of Insulin Action (DIA). 14 X X No more settings No more spaghetti charts Note: The measurements, calculations, and settings shown on the slide are an illustrative example.
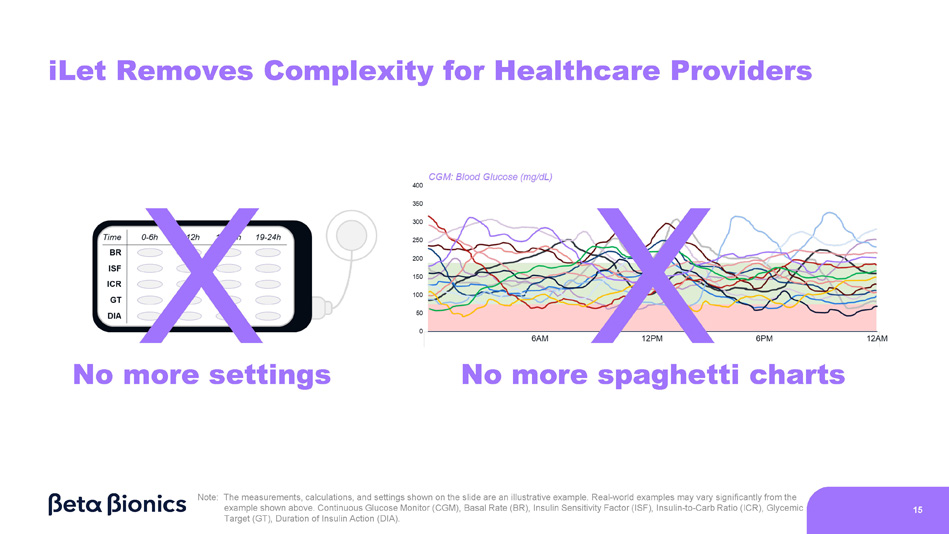
Real - world examples may vary significantly from the example shown above. Continuous Glucose Monitor (CGM), Basal Rate (BR), Insulin Sensitivity Factor (ISF), Insulin - to - Carb Ratio (ICR), Glycemic Target (GT), Duration of Insulin Action (DIA). 15 iLet Removes Complexity for Healthcare Providers 16 Adaptive Algorithm Learns and Adjusts Automatically
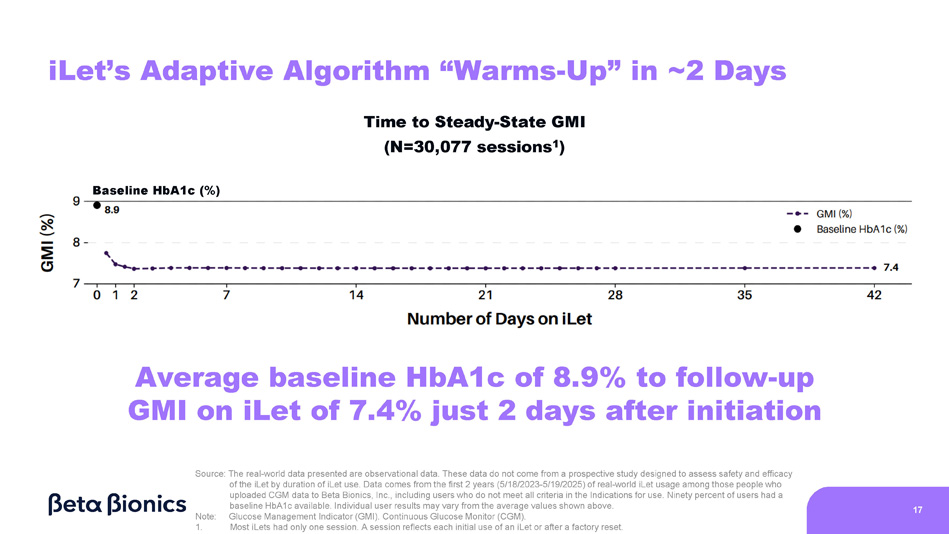
17 iLet’s Adaptive Algorithm “Warms - Up” in ~2 Days Time to Steady - State GMI (N=30,077 sessions 1 ) Source: The real - world data presented are observational data. These data do not come from a prospective study designed to assess safety and efficacy of the iLet by duration of iLet use. Data comes from the first 2 years (5/18/2023 - 5/19/2025) of real - world iLet usage among those people who uploaded CGM data to Beta Bionics, Inc., including users who do not meet all criteria in the Indications for use. Ninety percent of users had a baseline HbA1c available. Individual user results may vary from the average values shown above. Note: Glucose Management Indicator (GMI). Continuous Glucose Monitor (CGM). 1. Most iLets had only one session. A session reflects each initial use of an iLet or after a factory reset. Average baseline HbA1c of 8.9% to follow - up GMI on iLet of 7.4% just 2 days after initiation Baseline HbA1c (%)
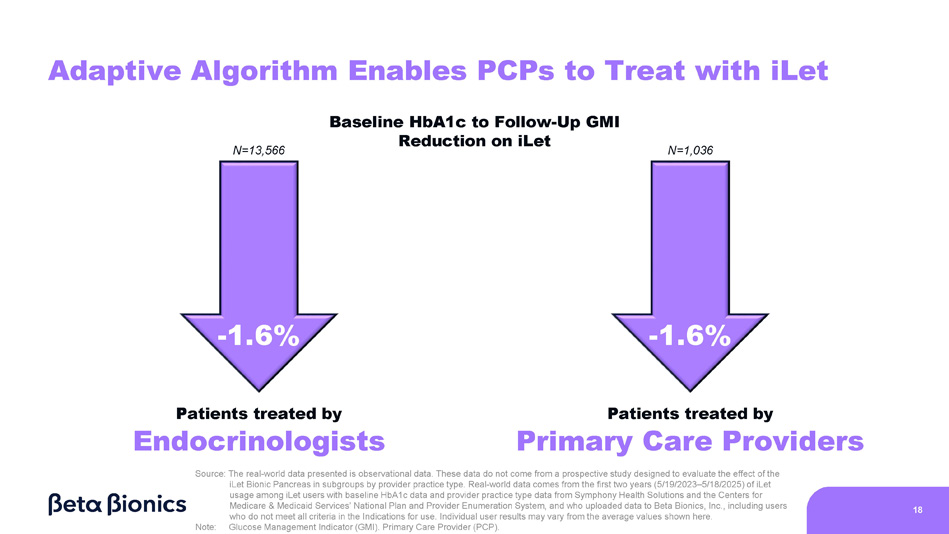
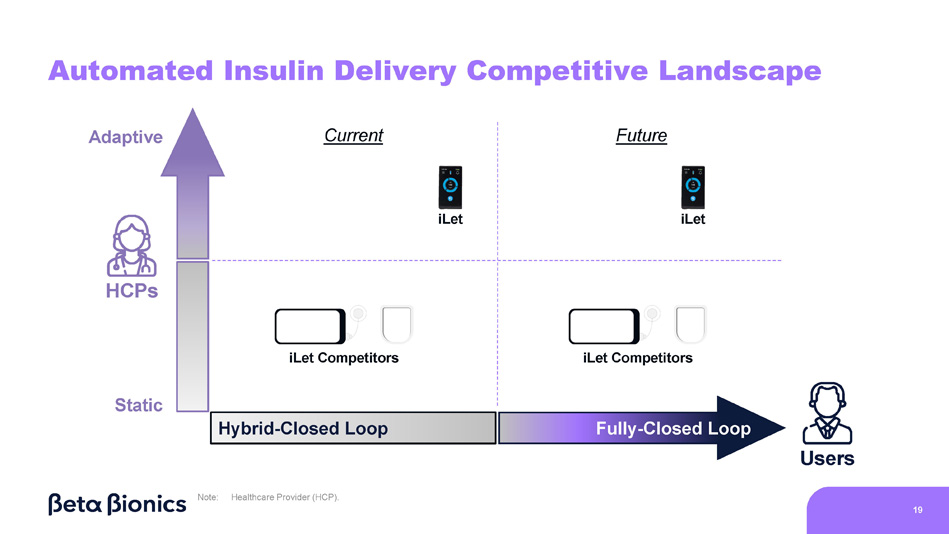
18 Adaptive Algorithm Enables PCPs to Treat with iLet - 1.6% Patients treated by Endocrinologists - 1.6% Patients treated by Primary Care Providers Source: The real - world data presented is observational data. These data do not come from a prospective study designed to evaluate the effect of the iLet Bionic Pancreas in subgroups by provider practice type. Real - world data comes from the first two years (5/19/2023 – 5/18/2025) of iLet usage among iLet users with baseline HbA1c data and provider practice type data from Symphony Health Solutions and the Centers for Medicare & Medicaid Services’ National Plan and Provider Enumeration System, and who uploaded data to Beta Bionics, Inc., including users who do not meet all criteria in the Indications for use. Individual user results may vary from the average values shown here. Note: Glucose Management Indicator (GMI). Primary Care Provider (PCP). N=13,566 N=1,036 Baseline HbA1c to Follow - Up GMI Reduction on iLet Automated Insulin Delivery Competitive Landscape Users Hybrid - Closed Loop Fully - Closed Loop Static Adaptive HCPs iLet Competitors iLet Competitors iLet iLet 19 Current Future Note: Healthcare Provider (HCP).
Event Agenda 1 2 5 4 3 20 Commercial Updates Q&A Adaptive - Closed Loop Algorithm Overview iLet Real - World Evidence Patch Pump Demonstration Presenters • Stephen Feider, Chief Financial Officer • Mark Hopman, Chief Commercial Officer • All Presenters • Sean Saint, Chief Executive Officer • Sean Saint, Chief Executive Officer • Dr.
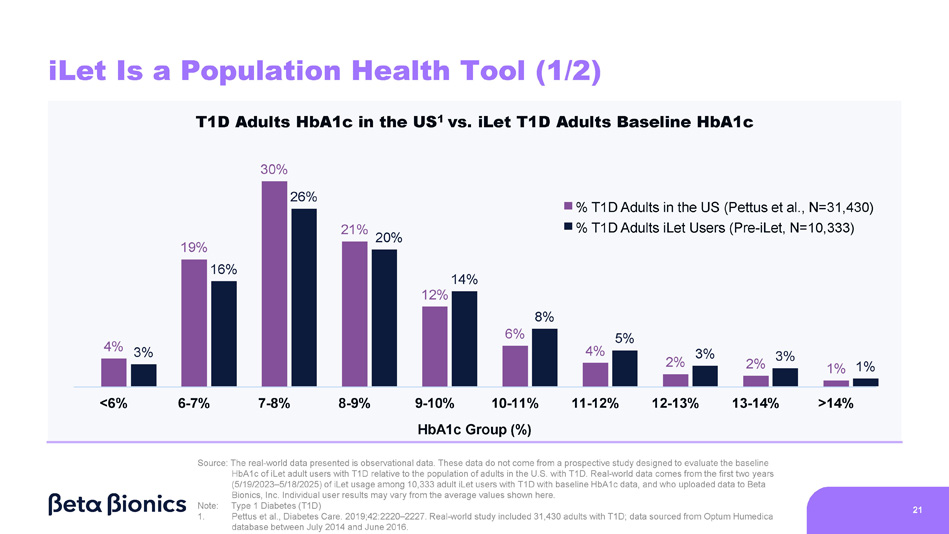
Steven Russell, Chief Medical Officer • Sean Saint, Chief Executive Officer • Mike Mensinger, Chief Product Officer 4% 19% 12% 6% 4% 2% 2% 1% <6% 6 - 7% 7 - 8% 8 - 9% 11 - 12% 12 - 13% 13 - 14% >14% 3% 16% 26% 21% 20% 14% 8% 5% 3% 3% 1% T1D Adults HbA1c in the US 1 vs. iLet T1D Adults Baseline HbA1c 30% 9 - 10% 10 - 11% HbA1c Group (%) iLet Is a Population Health Tool (1/2) 21 % T1D Adults in the US (Pettus et al., N=31,430) % T1D Adults iLet Users (Pre - iLet, N=10,333) Source: The real - world data presented is observational data. These data do not come from a prospective study designed to evaluate the baseline HbA1c of iLet adult users with T1D relative to the population of adults in the U.S. with T1D. Real - world data comes from the first two years (5/19/2023 – 5/18/2025) of iLet usage among 10,333 adult iLet users with T1D with baseline HbA1c data, and who uploaded data to Beta Bionics, Inc. Individual user results may vary from the average values shown here. Note: Type 1 Diabetes (T1D) 1. Pettus et al., Diabetes Care. 2019;42:2220 – 2227. Real - world study included 31,430 adults with T1D; data sourced from Optum Humedica database between July 2014 and June 2016.
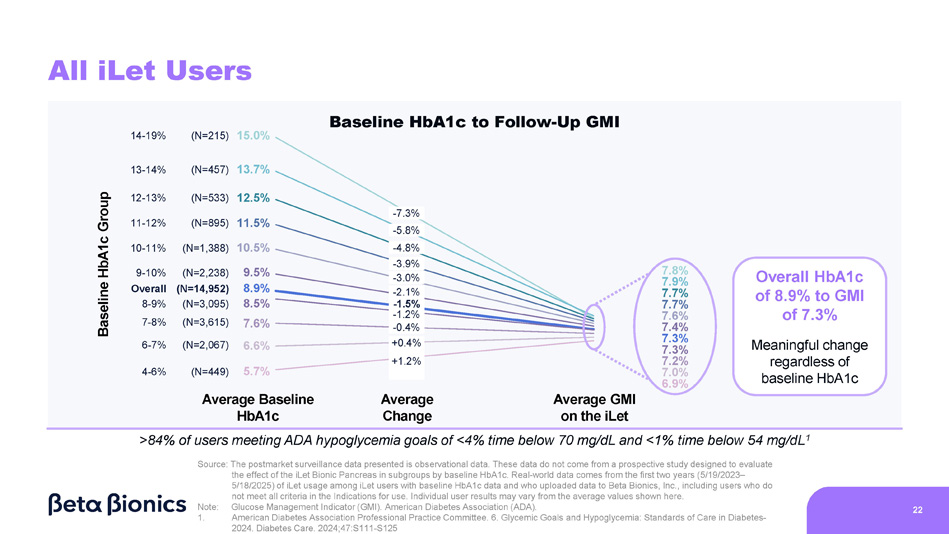
All iLet Users 22 Baseline HbA1c Group Average Baseline HbA1c Average Change Average GMI on the iLet 15.0% (N=215) 14 - 19% 13.7% (N=457) 13 - 14% 12.5% (N=533) 12 - 13% 11.5% (N=895) 11 - 12% 10.5% (N=1,388) 10 - 11% 9.5% (N=2,238) 9 - 10% 8.9% (N=14,952) Overall 8.5% (N=3,095) 8 - 9% 7.6% (N=3,615) 7 - 8% 6.6% (N=2,067) 6 - 7% 5.7% (N=449) 4 - 6% Overall HbA1c of 8.9% to GMI of 7.3% Meaningful change regardless of baseline HbA1c Note: Glucose Management Indicator (GMI). American Diabetes Association (ADA). 1. American Diabetes Association Professional Practice Committee. 6. Glycemic Goals and Hypoglycemia: Standards of Care in Diabetes - 2024. Diabetes Care. 2024;47:S111 - S125 >84% of users meeting ADA hypoglycemia goals of <4% time below 70 mg/dL and <1% time below 54 mg/dL 1 Source: The postmarket surveillance data presented is observational data. These data do not come from a prospective study designed to evaluate the effect of the iLet Bionic Pancreas in subgroups by baseline HbA1c. Real - world data comes from the first two years (5/19/2023 – 5/18/2025) of iLet usage among iLet users with baseline HbA1c data and who uploaded data to Beta Bionics, Inc., including users who do not meet all criteria in the Indications for use. Individual user results may vary from the average values shown here.
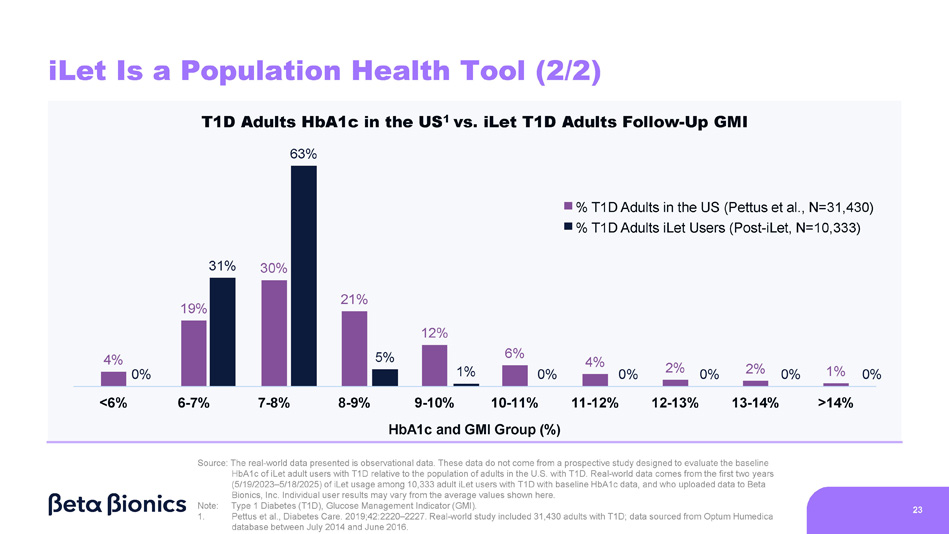
- 7.3% - 5.8% - 4.8% - 3.9% - 3.0% - 2.1% - 1.5% - 1.2% - 0.4% +0.4% +1.2% Baseline HbA1c to Follow - Up GMI 7.8% 7.9% 7.7% 7.7% 7.6% 7.4% 7.3% 7.3% 7.2% 7.0% 6.9% 31% 5% 1% 0% 0% 0% 0% 0% 4% 0% 19% 30% 21% 12% 6% 4% 2% 2% 1% <6% 6 - 7% 7 - 8% 8 - 9% 11 - 12% 12 - 13% 13 - 14% >14% 9 - 10% 10 - 11% HbA1c and GMI Group (%) iLet Is a Population Health Tool (2/2) 23 T1D Adults HbA1c in the US 1 vs. iLet T1D Adults Follow - Up GMI 63% % T1D Adults in the US (Pettus et al., N=31,430) % T1D Adults iLet Users (Post - iLet, N=10,333) Source: The real - world data presented is observational data. These data do not come from a prospective study designed to evaluate the baseline HbA1c of iLet adult users with T1D relative to the population of adults in the U.S. with T1D. Real - world data comes from the first two years (5/19/2023 – 5/18/2025) of iLet usage among 10,333 adult iLet users with T1D with baseline HbA1c data, and who uploaded data to Beta Bionics, Inc. Individual user results may vary from the average values shown here. Note: Type 1 Diabetes (T1D), Glucose Management Indicator (GMI). 1. Pettus et al., Diabetes Care. 2019;42:2220 – 2227. Real - world study included 31,430 adults with T1D; data sourced from Optum Humedica database between July 2014 and June 2016.

24 Meaningful change regardless of baseline HbA1c, with >85% of users meeting ADA hypoglycemia goals on iLet Source: The real - world data presented is observational data. These data do not come from a prospective study designed to evaluate the effect of the iLet Bionic Pancreas’ safety and efficacy versus multiple daily injections or competitive hybrid - closed loop systems. Real - world data comes from the first two years (5/19/2023 – 5/18/2025) of iLet usage among iLet users with baseline HbA1c data and pre - iLet therapy data of MDI, and who uploaded data to Beta Bionics, Inc., including users who do not meet all criteria in the Indications for use. Individual user results may vary from the average values shown here. Note: Glucose Management Indicator (GMI). Multiple Daily Injections (MDI). American Diabetes Association (ADA). iLet Users Coming from MDI 9.2 7.3 Baseline HbA1c iLet GMI - 1.9 Baseline HbA1c to Follow - Up GMI Baseline HbA1c Average Baseline HbA1c Average Change Average GMI on the iLet 8.0% 9.2% >9% (N=4,014) 11.0% 7 - 9% (N=3,881) Overall (N=8,802) <7% (N=907) 6.4% 7.6% 7.3% 7.2% 7.0% - 3.5% - 1.9% - 0.8% +0.6% N=8,802 6.4% 8.1% 7.8% >9% (N=643) 10.5% Overall (N=2,910) 7 - 9% (N=1,609) <7% (N=658) - 2.8% - 0.8% - 0.6% +0.6% 8.1 7.3 Baseline HbA1c iLet GMI 25 iLet Users Coming from Competitive HCL Systems 1 7.7% 7.3% 7.2% 7.0% Baseline HbA1c to Follow - Up GMI Note: Glucose Management Indicator (GMI).
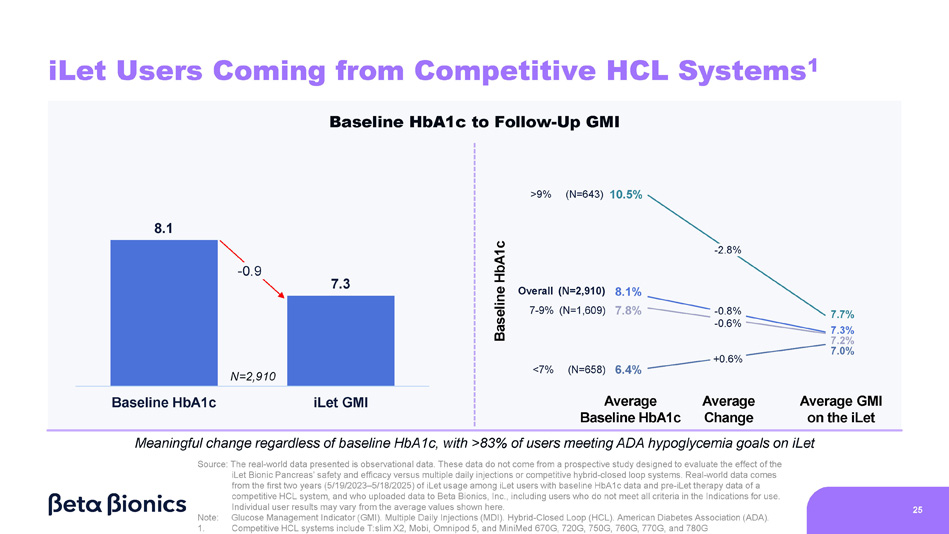
Multiple Daily Injections (MDI). Hybrid - Closed Loop (HCL). American Diabetes Association (ADA). 1. Competitive HCL systems include T:slim X2, Mobi, Omnipod 5, and MiniMed 670G, 720G, 750G, 760G, 770G, and 780G Meaningful change regardless of baseline HbA1c, with >83% of users meeting ADA hypoglycemia goals on iLet Source: The real - world data presented is observational data. These data do not come from a prospective study designed to evaluate the effect of the iLet Bionic Pancreas’ safety and efficacy versus multiple daily injections or competitive hybrid - closed loop systems. Real - world data comes from the first two years (5/19/2023 – 5/18/2025) of iLet usage among iLet users with baseline HbA1c data and pre - iLet therapy data of a competitive HCL system, and who uploaded data to Beta Bionics, Inc., including users who do not meet all criteria in the Indications for use. Individual user results may vary from the average values shown here.

- 0.9 Baseline HbA1c Average Baseline HbA1c Average Change Average GMI on the iLet N=2,910 7.3 - 1.6 iLet Users Treated by Type of Provider Practice (1/2) Baseline HbA1c to Follow - Up GMI Practice Type: Primary Care 8.9 Practice Type: Endocrinology 8.9 7.3 - 1.6 N=13,566 N=1,036 Baseline HbA1c iLet GMI Baseline HbA1c iLet GMI Similar improvement in GMI with >84% of users meeting ADA hypoglycemia goals, regardless of provider practice type Source: The real - world data presented is observational data. These data do not come from a prospective study designed to evaluate the effect of the iLet Bionic Pancreas in subgroups by provider practice type. Real - world data comes from the first two years (5/19/2023 – 5/18/2025) of iLet usage among iLet users with baseline HbA1c data and provider practice type data from Symphony Health Solutions and the Centers for Medicare & Medicaid Services’ National Plan and Provider Enumeration System, and who uploaded data to Beta Bionics, Inc., including users who do not meet all criteria in the Indications for use. Individual user results may vary from the average values shown here. 26 Note: Glucose Management Indicator (GMI). Primary Care Provider (PCP). American Diabetes Association (ADA).
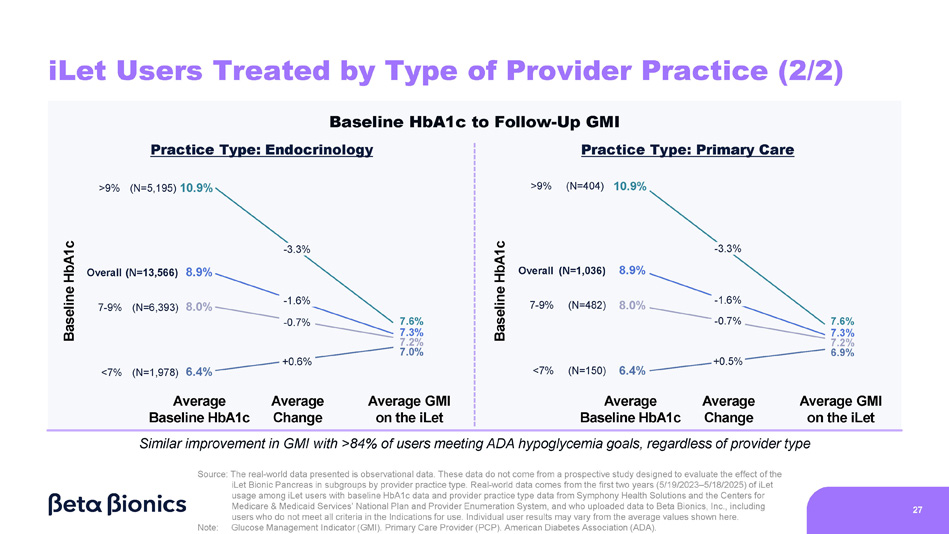
iLet Users Treated by Type of Provider Practice (2/2) Baseline HbA1c 7.6% 7.3% 7.2% 7.0% - 3.3% - 1.6% - 0.7% +0.6% Average Change Average GMI on the iLet Average Baseline HbA1c <7% (N=1,978) 6.4% >9% (N=5,195) 10.9% 7 - 9% (N=6,393) 8.0% Overall (N=13,566) 8.9% Average Baseline HbA1c Average Change Average GMI on the iLet 7.6% 7.3% 7.2% 6.9% 10.9% 8.0% 8.9% >9% (N=404) 7 - 9% (N=482) Overall (N=1,036) <7% (N=150) 6.4% - 3.3% - 1.6% - 0.7% +0.5% Baseline HbA1c Baseline HbA1c to Follow - Up GMI Practice Type: Endocrinology Practice Type: Primary Care Similar improvement in GMI with >84% of users meeting ADA hypoglycemia goals, regardless of provider type Source: The real - world data presented is observational data. These data do not come from a prospective study designed to evaluate the effect of the iLet Bionic Pancreas in subgroups by provider practice type. Real - world data comes from the first two years (5/19/2023 – 5/18/2025) of iLet usage among iLet users with baseline HbA1c data and provider practice type data from Symphony Health Solutions and the Centers for Medicare & Medicaid Services’ National Plan and Provider Enumeration System, and who uploaded data to Beta Bionics, Inc., including users who do not meet all criteria in the Indications for use. Individual user results may vary from the average values shown here. 27 Note: Glucose Management Indicator (GMI). Primary Care Provider (PCP). American Diabetes Association (ADA).
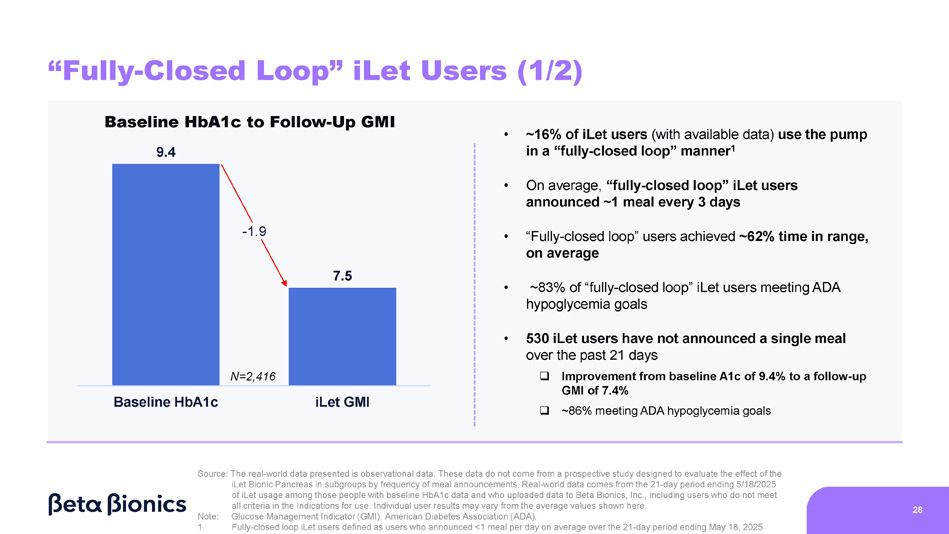
7.5 Baseline HbA1c iLet GMI - 1.9 Baseline HbA1c to Follow - Up GMI 9.4 “Fully - Closed Loop” iLet Users (1/2) • ~16% of iLet users (with available data) use the pump in a “fully - closed loop” manner 1 • On average, “fully - closed loop” iLet users announced ~1 meal every 3 days • “Fully - closed loop” users achieved ~62% time in range, on average • ~83% of “fully - closed loop” iLet users meeting ADA hypoglycemia goals • 530 iLet users have not announced a single meal over the past 21 days □ Improvement from baseline A1c of 9.4% to a follow - up GMI of 7.4% □ ~86% meeting ADA hypoglycemia goals Source: The real - world data presented is observational data. These data do not come from a prospective study designed to evaluate the effect of the iLet Bionic Pancreas in subgroups by frequency of meal announcements. Real - world data comes from the 21 - day period ending 5/18/2025 of iLet usage among those people with baseline HbA1c data and who uploaded data to Beta Bionics, Inc., including users who do not meet all criteria in the Indications for use. Individual user results may vary from the average values shown here. 28 Note: 1. Glucose Management Indicator (GMI). American Diabetes Association (ADA). Fully - closed loop iLet users defined as users who announced <1 meal per day on average over the 21 - day period ending May 18, 2025 N=2,416 “Fully - Closed Loop” iLet Users (2/2) Baseline HbA1c to Follow - Up GMI • ~16% of iLet users (with available data) use the pump in a “fully - closed loop” manner 1 Source: The real - world data presented is observational data.
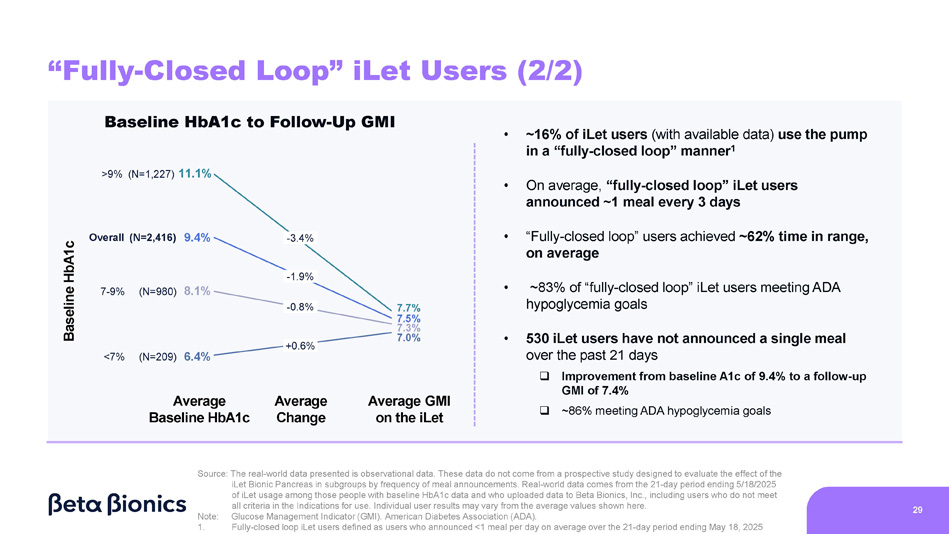
These data do not come from a prospective study designed to evaluate the effect of the iLet Bionic Pancreas in subgroups by frequency of meal announcements. Real - world data comes from the 21 - day period ending 5/18/2025 of iLet usage among those people with baseline HbA1c data and who uploaded data to Beta Bionics, Inc., including users who do not meet all criteria in the Indications for use. Individual user results may vary from the average values shown here. 29 Note: 1. Glucose Management Indicator (GMI). American Diabetes Association (ADA). Fully - closed loop iLet users defined as users who announced <1 meal per day on average over the 21 - day period ending May 18, 2025 • On average, “fully - closed loop” iLet users announced ~1 meal every 3 days • “Fully - closed loop” users achieved ~62% time in range, on average • ~83% of “fully - closed loop” iLet users meeting ADA hypoglycemia goals • 530 iLet users have not announced a single meal over the past 21 days □ Improvement from baseline A1c of 9.4% to a follow - up GMI of 7.4% □ ~86% meeting ADA hypoglycemia goals >9% (N=1,227) 11.1% 7 - 9% (N=980) 8.1% Overall (N=2,416) 9.4% <7% (N=209) 6.4% 7.7% 7.5% 7.3% 7.0% - 3.4% - 1.9% - 0.8% +0.6% Baseline HbA1c Average Baseline HbA1c Average Change Average GMI on the iLet Event Agenda 1 2 5 4 3 30 Commercial Updates Q&A Adaptive - Closed Loop Algorithm Overview iLet Real - World Evidence Patch Pump Demonstration Presenters • Stephen Feider, Chief Financial Officer • Mark Hopman, Chief Commercial Officer • All Presenters • Sean Saint, Chief Executive Officer • Sean Saint, Chief Executive Officer • Dr. Steven Russell, Chief Medical Officer • Sean Saint, Chief Executive Officer • Mike Mensinger, Chief Product Officer
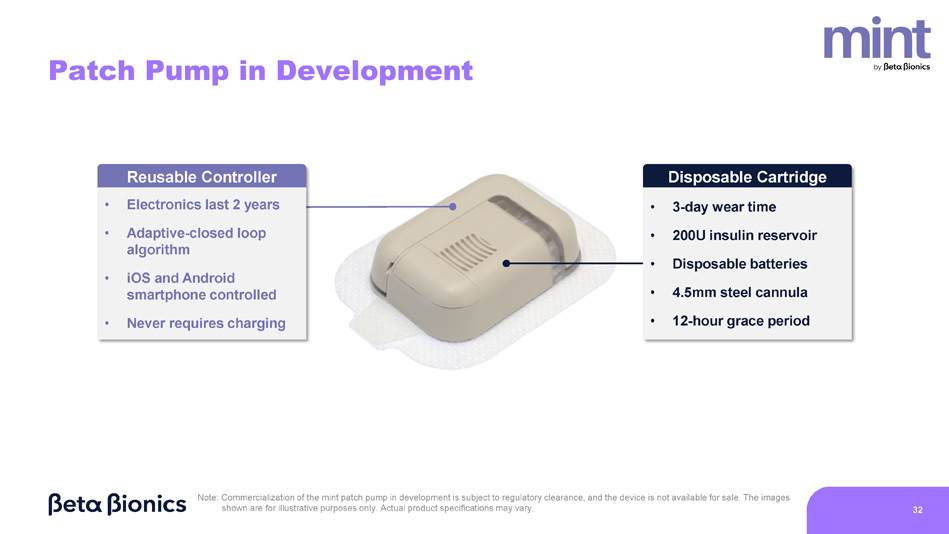
Note: Commercialization of the mint patch pump in development is subject to regulatory clearance, and the device is not available for sale. The images shown are for illustrative purposes only. Actual product specifications may vary. 31 Patch Pump in Development Reusable Controller • Electronics last 2 years • Adaptive - closed loop algorithm • iOS and Android smartphone controlled • Never requires charging Disposable Cartridge • 3 - day wear time • 200U insulin reservoir • Disposable batteries • 4.5mm steel cannula • 12 - hour grace period Note: Commercialization of the mint patch pump in development is subject to regulatory clearance, and the device is not available for sale. The images shown are for illustrative purposes only. Actual product specifications may vary. 32 33 Adaptive - Closed Loop Algorithm Seamless Patch Change Process Pharmacy Channel Access Robust Digital Ecosystem Same or better outcomes with substantially less work for the user and provider 1,2 No phone or charging required; 4.5mm steel cannula minimizes insertion discomfort Streamlined insurance approval; minimal out - of - pocket costs Compatible with Dexcom G7 and Abbott Libre 3 Plus; iLet App and Bionic Circle for iOS and Android Expected User Experience Advantages Note: Commercialization of the mint patch pump in development is subject to regulatory approval, and the device is not available for sale.
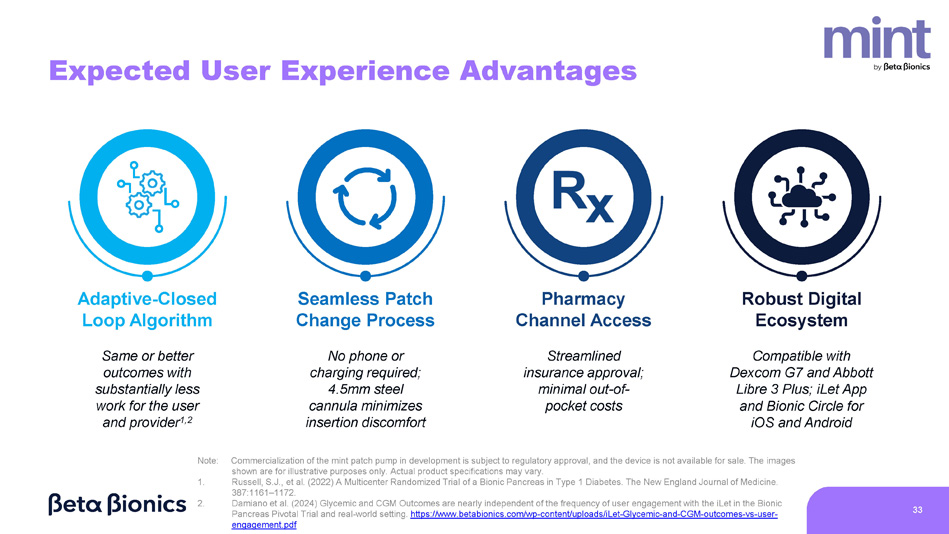
The images shown are for illustrative purposes only. Actual product specifications may vary. Russell, S.J., et al. (2022) A Multicenter Randomized Trial of a Bionic Pancreas in Type 1 Diabetes. The New England Journal of Medicine. 387:1161 – 1172. Damiano et al. (2024) Glycemic and CGM Outcomes are nearly independent of the frequency of user engagement with the iLet in the Bionic Pancreas Pivotal Trial and real - world setting. https://www.betabionics.com/wp - content/uploads/iLet - Glycemic - and - CGM - outcomes - vs - user - engagement.pdf 1. 2.
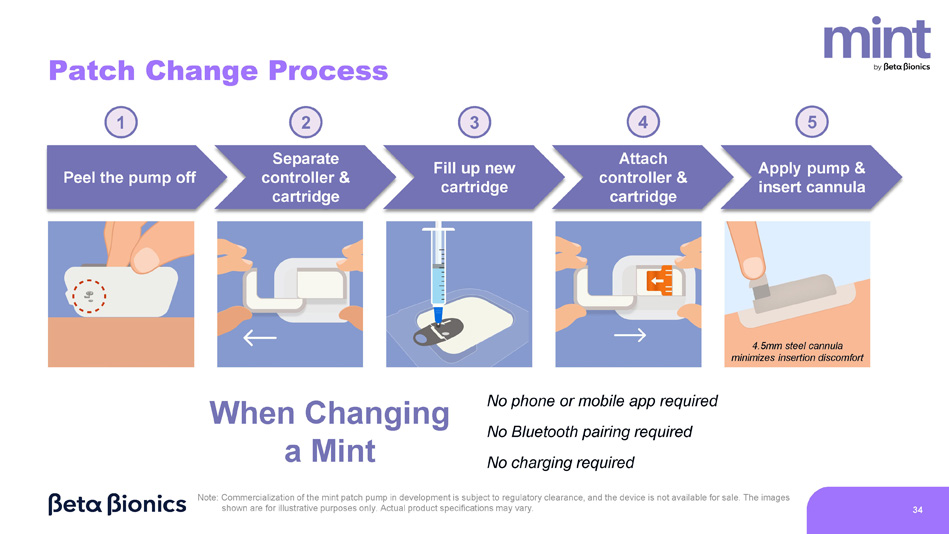
Patch Change Process Separate controller & cartridge 1 2 Fill up new cartridge 3 Attach controller & cartridge 4 Peel the pump off Apply pump & insert cannula 5 Note: Commercialization of the mint patch pump in development is subject to regulatory clearance, and the device is not available for sale. The images shown are for illustrative purposes only. Actual product specifications may vary. 34 4.5mm steel cannula minimizes insertion discomfort No phone or mobile app required No Bluetooth pairing required No charging required When Changing a Mint Meal Announcement Process Select relative carb amount 1 2 Swipe to deliver bolus 3 Select meal type Note: Commercialization of the mint patch pump in development is subject to regulatory clearance, and the device is not available for sale.
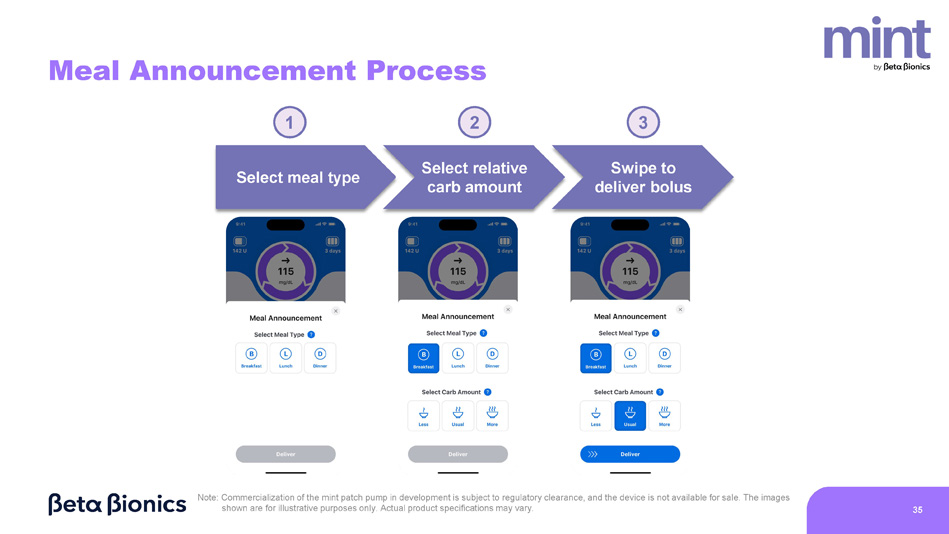
The images shown are for illustrative purposes only. Actual product specifications may vary. 35
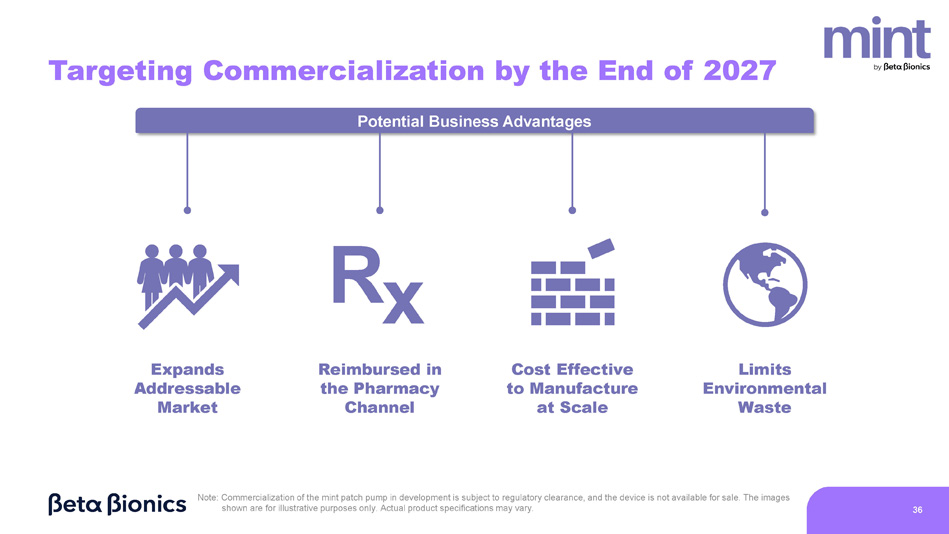
Potential Business Advantages Targeting Commercialization by the End of 2027 Expands Addressable Market R x Reimbursed in the Pharmacy Channel Cost Effective to Manufacture at Scale Limits Environmental Waste Note: Commercialization of the mint patch pump in development is subject to regulatory clearance, and the device is not available for sale. The images shown are for illustrative purposes only. Actual product specifications may vary. 36

Q&A