UNITED STATES
SECURITIES AND EXCHANGE COMMISSION
Washington, D.C. 20549
_________________
FORM 8-K
_________________
CURRENT REPORT
Pursuant to Section 13 or 15(d)
of the Securities Exchange Act of 1934
Date of Report (Date of earliest event reported): March 5, 2025
_______________________________
BROADWIND, INC.
(Exact name of registrant as specified in its charter)
_______________________________
| Delaware | 001-34278 | 88-0409160 |
| (State or Other Jurisdiction of Incorporation) | (Commission File Number) | (I.R.S. Employer Identification No.) |
3240 South Central Avenue
Cicero, Illinois 60804
(Address of Principal Executive Offices) (Zip Code)
(708) 780-4800
(Registrant's telephone number, including area code)
Not Applicable
(Former name or former address, if changed since last report)
_______________________________
Check the appropriate box below if the Form 8-K filing is intended to simultaneously satisfy the filing obligation of the registrant under any of the following provisions:
| ☐ | Written communications pursuant to Rule 425 under the Securities Act (17 CFR 230.425) |
| ☐ | Soliciting material pursuant to Rule 14a-12 under the Exchange Act (17 CFR 240.14a-12) |
| ☐ | Pre-commencement communications pursuant to Rule 14d-2(b) under the Exchange Act (17 CFR 240.14d-2(b)) |
| ☐ | Pre-commencement communications pursuant to Rule 13e-4(c) under the Exchange Act (17 CFR 240.13e-4(c)) |
Securities registered pursuant to Section 12(b) of the Act:
| Title of each class | Trading Symbol(s) | Name of each exchange on which registered |
| Common Stock, $0.001 par value | BWEN | The NASDAQ Capital Market |
Indicate by check mark whether the registrant is an emerging growth company as defined in Rule 405 of the Securities Act of 1933 (§230.405 of this chapter) or Rule 12b-2 of the Securities Exchange Act of 1934 (§240.12b-2 of this chapter).
Emerging growth company ☐
If an emerging growth company, indicate by check mark if the registrant has elected not to use the extended transition period for complying with any new or revised financial accounting standards provided pursuant to Section 13(a) of the Exchange Act. ☐
On March 5, 2025, Broadwind, Inc. (the “Company”) issued a press release announcing its financial results as of and for the year ended December 31, 2024. The press release is incorporated herein by reference and is attached hereto as Exhibit 99.1.
The information contained in, or incorporated into, this Item 2.02 of this Current Report on Form 8-K (this “Report”), including Exhibit 99.1, is furnished under Item 2.02 of Form 8-K and shall not be deemed “filed” for the purposes of Section 18 of the Securities Exchange Act of 1934, as amended (the “Exchange Act”) or otherwise subject to the liabilities of that section, and shall not be deemed to be incorporated by reference into the filings of the Company under the Securities Act of 1933, as amended (the “Securities Act”) or the Exchange Act regardless of any general incorporation language in such filings.
Please refer to Exhibit 99.1 for a discussion of certain forward-looking statements included therein and the risks and uncertainties related thereto.
An Investor Presentation dated March 5, 2025, is incorporated herein by reference and attached hereto as Exhibit 99.2.
The information contained in, or incorporated into, this Item 7.01 of this Report, including Exhibit 99.2 attached hereto, is furnished under Item 7.01 of Form 8-K and shall not be deemed “filed” for the purposes of Section 18 of the Exchange Act or otherwise subject to the liabilities of that section, and shall not be deemed to be incorporated by reference into the filings of the Company under the Securities Act or the Exchange Act regardless of any general incorporation language in such filings.
This Report shall not be deemed an admission as to the materiality of any information in this Report that is being disclosed pursuant to Regulation FD.
Please refer to Exhibit 99.2 for a discussion of certain forward-looking statements included therein and the risks and uncertainties related thereto.
(d) Exhibits
| EXHIBIT NUMBER | DESCRIPTION | |||
| 99.1 | Press Release dated March 5, 2025 | |||
| 99.1 | Investor Presentation dated March 5, 2025 | |||
| 104 | Cover Page Interactive Data File (embedded within the Inline XBRL document) |
SIGNATURE
Pursuant to the requirements of the Securities Exchange Act of 1934, the registrant has duly caused this report to be signed on its behalf by the undersigned hereunto duly authorized.
| BROADWIND, INC. | ||
| Date: March 5, 2025 | By: | /s/ Eric B. Blashford |
| Eric B. Blashford | ||
| President and Chief Executive Officer (Principal Executive Officer) |
||
EXHIBIT 99.1
Broadwind Announces Fourth Quarter and Full-Year 2024 Results
CICERO, Ill., March 05, 2025 (GLOBE NEWSWIRE) -- Broadwind (Nasdaq: BWEN, or the “Company”), a diversified precision manufacturer of specialized components and solutions serving global markets, today announced results for the fourth quarter and full-year 2024.
FOURTH QUARTER 2024 RESULTS
FULL-YEAR 2024 RESULTS
Broadwind reported a net loss of ($0.9) million, or ($0.04) per share in the fourth quarter 2024, compared to net income of $1.1 million, or $0.05 per share, in the fourth quarter 2023. The Company reported adjusted EBITDA, a non-GAAP measure, of $2.1 million in the fourth quarter compared to $4.4 million in the prior year period. For a reconciliation of GAAP to non-GAAP metrics, please see the appendix of this release.
Fourth quarter results were impacted by lower customer demand across each reporting segment, when compared to the prior year period, particularly within the Company’s wind and oil/gas end-markets. Total wind-related revenue within our heavy fabrication segment decreased 27% compared to the prior year period, as weakness in the domestic onshore wind activity persisted into the fourth quarter.
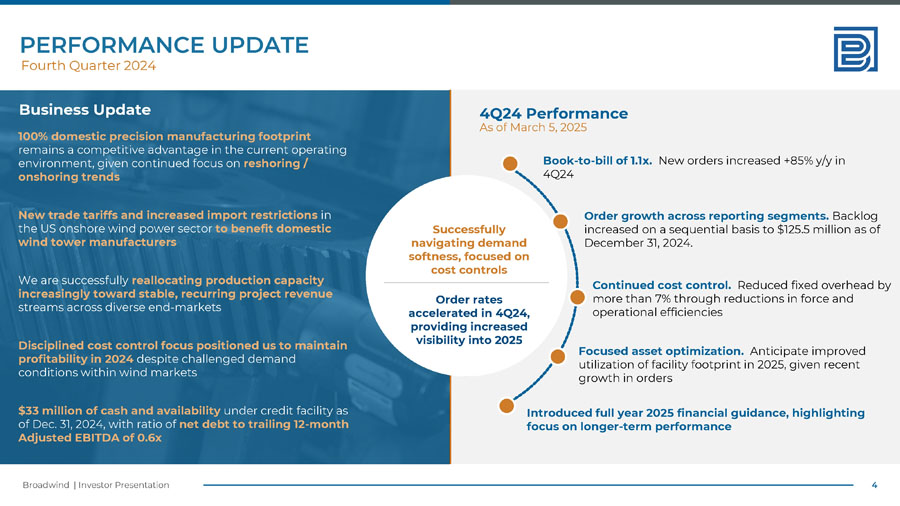
Total orders increased 85% in the fourth quarter, when compared to the prior year period, benefiting from increased customer demand across all reporting segments and most of the Company’s vertical markets. Within the Industrial Solutions segment, orders and backlog reached record levels during the fourth quarter driven by demand for natural gas turbines. Consolidated backlog increased on a sequential basis to $125.5 million as of December 31, 2024.
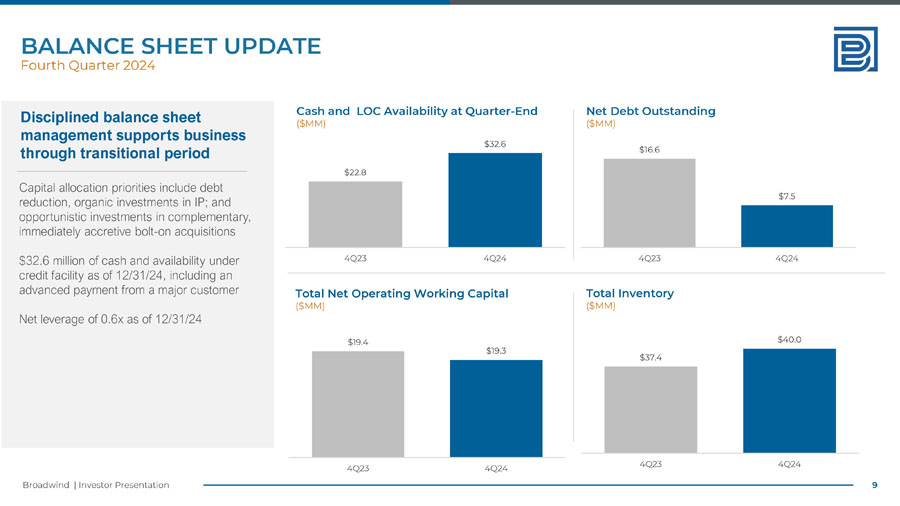
As of December 31, 2024, Broadwind had total cash on hand and availability under its credit facility of $33 million. The Company’s ratio of net debt to trailing twelve month non-GAAP adjusted EBITDA was 0.6x at the end of the fourth quarter 2024.
MANAGEMENT COMMENTARY
“While customer project activity remained below prior year levels during the fourth quarter, primarily due to lower activity within our wind and oil/gas markets, new orders increased to the highest level in nearly two years, resulting in a book-to-bill of 1.1x in the period,” stated Eric Blashford, President and CEO of Broadwind. “We expect that a combination of increased order intake and recent cost-saving measures will enhance our operating leverage over the coming year, consistent with our strategic focus on profitable growth.”
“Total orders increased 85% in the fourth quarter versus the prior year period, supported by demand growth across nearly every customer end-market,” continued Blashford. “Orders within our industrial end-markets increased by more than 300% in the fourth quarter, while wind orders doubled as compared to the prior year period. While we expect our oil/gas markets to remain soft in the near-term, we anticipate ratable improvements in order activity across our diverse end-markets as we move through 2025.”
“Within our Heavy Fabrications segment, we received our first substantial order for large fabrications serving the hydroelectric market during the fourth quarter. Within our Gearing segment, we’ve continued to gain traction with new customers within the aeroderivative turbine and medical technology markets where our precision machining expertise is in high demand,” continued Blashford. “Natural gas turbine demand remained very strong in the fourth quarter, which continued to benefit our Industrial Solutions segment, which generated record orders and backlog in the period.”
“We remain highly focused on asset optimization, particularly with respect to utilization rates across our manufacturing system,” continued Blashford. “Recent order growth is expected to support a meaningful uplift in plant utilization in 2025, well above the levels experienced this past year. As order rates continue to recover, and backlog conversion accelerates, we intend to realize improved fixed-cost absorption across the Company during 2025.”
“On a full-year basis, we successfully advanced our strategic priorities during a period of softer demand, culminating in another year of profitability,” continued Blashford. “Our 100% U.S. manufacturing footprint, highly skilled domestic workforce, and depth of experience producing large-scale, technical fabrications remain highly valued competitive advantages, particularly in a policy environment that is expected to favor domestic manufacturers. Looking ahead, we remain focused on further expanding our commercial focus across high-value, growing end-markets, further improving our operational efficiency and asset utilization, while selectively deploying capital toward high-return intellectual property and manufacturing capabilities valued by our customers.”
“At the end of the fourth quarter, we had $33 million of available cash and liquidity to support our operations, which includes an advanced payment negotiated with a major customer late in the year,” noted Blashford. “As of December 31, 2024, our net leverage was 0.6x, well within our target range of at or below 2.0x.”
“Today, we introduced financial guidance for the full year 2025,” concluded Blashford. “While new U.S. onshore wind development is expected to remain muted over the coming year, we’re encouraged by the pace of order growth within our core, non-wind markets, which positions us for improved optimization of our manufacturing base over the coming year. Amidst a policy environment that favors domestic manufacturers, we believe that our business is well-positioned ahead of a cyclical demand recovery.”
SEGMENT RESULTS
Heavy Fabrications Segment
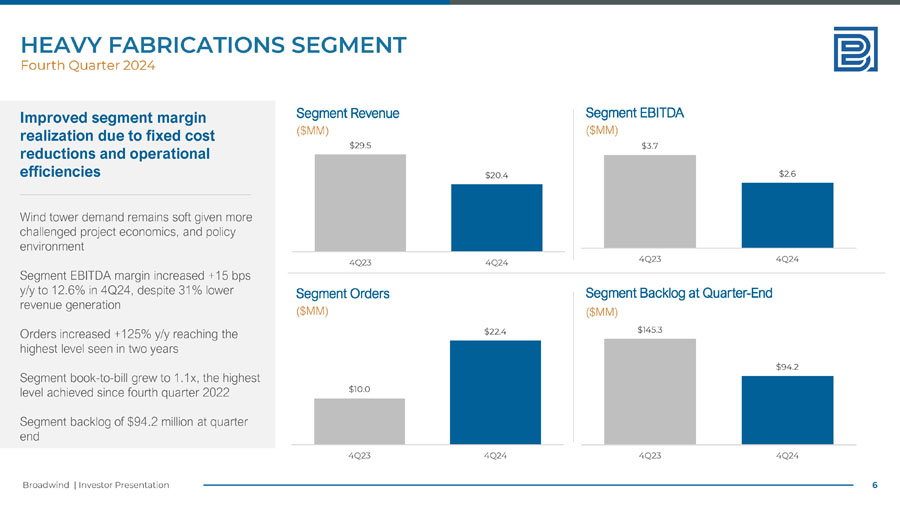
Broadwind provides large, complex and precision fabrications, and proprietary industrial processing equipment, to customers in a broad range of industrial markets. Key products include wind towers, compressed natural gas pressure reducing systems and industrial fabrications, including mining and material handling components and other frames/structures.
Heavy Fabrications segment sales declined by 30.8% to $20.4 million in the fourth quarter 2024, as compared to the prior year period, primarily driven by a 27% decline in wind-related revenue. The segment reported operating income of $1.3 million in the fourth quarter, as compared to operating income of $2.6 million in the prior year period. Segment non-GAAP adjusted EBITDA was $2.6 million in the fourth quarter, as compared to $3.7 million in the prior year period.
Gearing Segment
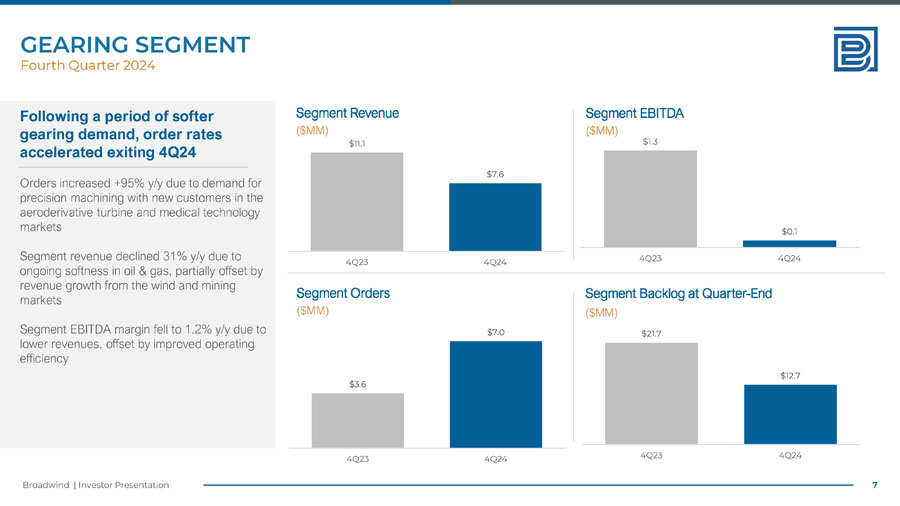
Broadwind provides custom gearboxes, loose gearing, precision machined components and heat treat services to a broad set of customers in diverse markets, including oil & gas production, surface and underground mining, wind energy, steel, material handling and other infrastructure markets.
Gearing segment sales declined by 31.0% to $7.6 million in the fourth quarter 2024, as compared to the prior year period, primarily driven by softness in demand from our oil & gas markets. The segment reported an operating loss of ($0.6) million in the fourth quarter, compared to operating income of $0.7 million in the prior year period. Segment non-GAAP adjusted EBITDA was $0.1 million in the fourth quarter, as compared to $1.3 million in the prior year period.
Industrial Solutions Segment
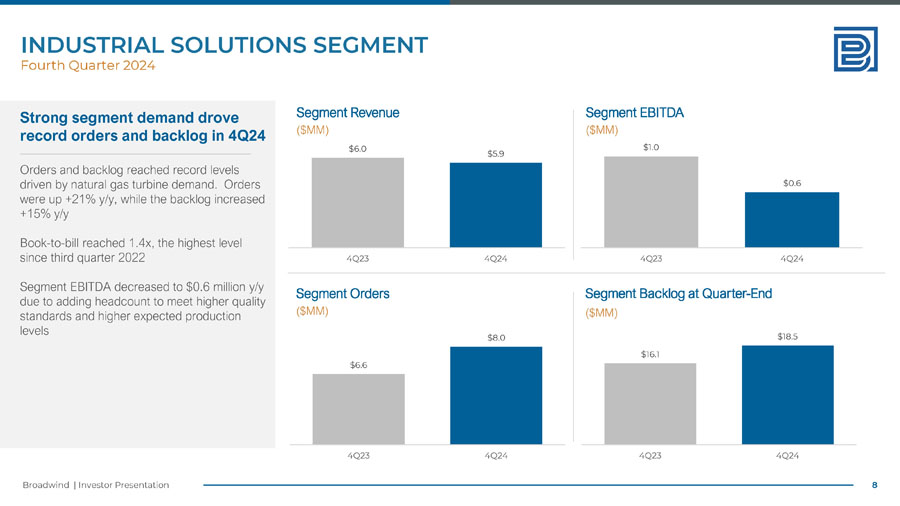
Broadwind provides supply chain solutions, light fabrication, inventory management, kitting and assembly services, primarily serving the combined cycle natural gas turbine market as well as other clean technology markets.
Industrial Solutions segment sales declined by 2.8% to $5.9 million in the fourth quarter 2024, as compared to the prior year period, primarily driven by lower demand for aftermarket units. The segment reported operating income of $0.4 million in the fourth quarter compared to operating income of $0.8 million in the prior year period. Segment non-GAAP adjusted EBITDA was $0.6 million in the fourth quarter, as compared to $1.0 million in the prior year period.
FINANCIAL GUIDANCE
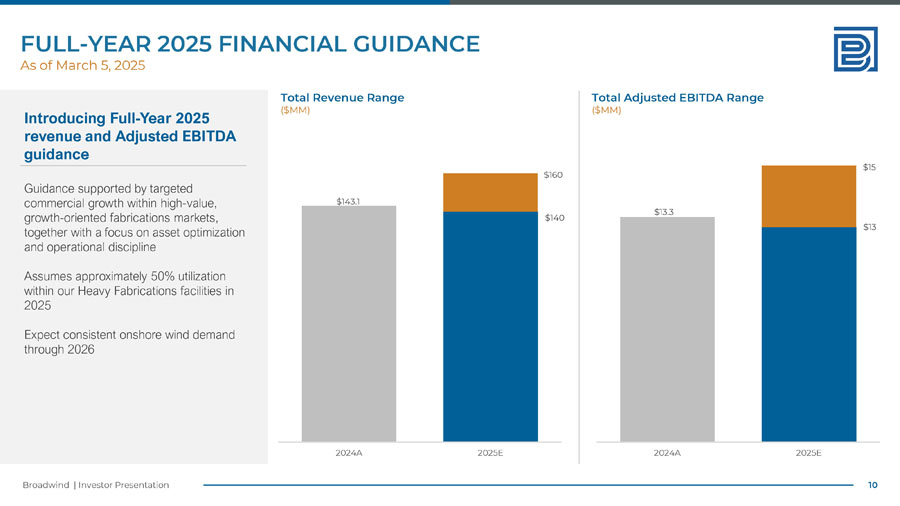
Today, Broadwind introduced financial guidance for the full year 2025. The following financial guidance reflects the Company’s current expectations and beliefs. All guidance is current as of the time provided and is subject to change.
| Full Year 2025 | |||
| $ in Millions | Low | Mid | High |
| Total Revenue | $140 | $150 | $160 |
| Adjusted EBITDA | $13 | $14 | $15 |
FOURTH QUARTER AND FULL-YEAR 2024 RESULTS CONFERENCE CALL
Broadwind will host a conference call today, March 5, 2025, at 11:00 a.m. ET to review the Company’s financial results, discuss recent events and conduct a question-and-answer session.
A webcast of the conference call and accompanying presentation materials will be available in the Investor Relations section of the Company’s corporate website at https://investors.bwen.com/investors. To listen to a live broadcast, go to the site at least 15 minutes prior to the scheduled start time in order to register, download, and install any necessary audio software.
To participate in the live teleconference:
Live Teleconference: 877-407-9716
To listen to a replay of the teleconference, which will be available through Wednesday, March 12, 2025:
Teleconference Replay: 844-512-2921
Conference ID: 13751146
ABOUT BROADWIND
Broadwind (Nasdaq: BWEN) is a precision manufacturer of structures, equipment and components for clean tech and other specialized applications. With facilities throughout the U.S., our talented team is committed to helping customers maximize performance of their investments—quicker, easier and smarter. Find out more at www.bwen.com
NON-GAAP FINANCIAL MEASURES
The Company provides non-GAAP adjusted EBITDA (earnings before interest, income taxes, depreciation, amortization, share-based compensation and other stock payments, restructuring costs, impairment charges, proxy contest-related expenses and other non-cash gains and losses) as supplemental information regarding the Company’s business performance. The Company’s management uses this supplemental information when it internally evaluates its performance, reviews financial trends and makes operating and strategic decisions. The Company believes that this non-GAAP financial measure is useful to investors because it provides investors with a better understanding of the Company’s past financial performance and future results, which allows investors to evaluate the Company’s performance using the same methodology and information as used by the Company’s management. The Company's definition of adjusted EBITDA may be different from similar non-GAAP financial measures used by other companies and/or analysts.
FORWARD-LOOKING STATEMENTS
This release contains “forward-looking statements”—that is, statements related to future, not past, events— as defined in Section 21E of the Securities Exchange Act of 1934, as amended, (the “Exchange Act”), that reflect our current expectations regarding our future growth, results of operations, financial condition, cash flows, performance, business prospects and opportunities, as well as assumptions made by, and information currently available to, our management. We have tried to identify forward looking statements by using words such as “anticipate,” “believe,” “expect,” “intend,” “will,” “should,” “may,” “plan” and similar expressions, but these words are not the exclusive means of identifying forward looking statements. Forward-looking statements include any statement that does not directly relate to a current or historical fact. Our forward-looking statements may include or relate to our beliefs, expectations, plans and/or assumptions with respect to the following: (i) our expectations and beliefs with respect to our financial guidance as set forth in this release; (ii) the impact of global health concerns on the economies and financial markets and the demand for our products; (iii) state, local and federal regulatory frameworks affecting the industries in which we compete, including the wind energy industry, and the related extension, continuation or renewal of federal tax incentives and grants, including the advanced manufacturing tax credits, and state renewable portfolio standards as well as new or continuing tariffs on steel or other products imported into the United States; (iv) our customer relationships and our substantial dependency on a few significant customers and our efforts to diversify our customer base and sector focus and leverage relationships across business units; (v) our ability to operate our business efficiently, comply with our debt obligations, manage capital expenditures and costs effectively, and generate cash flow; (vi) the economic and operational stability of our significant customers and suppliers, including their respective supply chains, and the ability to source alternative suppliers as necessary; (vii) our ability to continue to grow our business organically and through acquisitions; (viii) the production, sales, collections, customer deposits and revenues generated by new customer orders and our ability to realize the resulting cash flows; (ix) information technology failures, network disruptions, cybersecurity attacks or breaches in data security; (x) the sufficiency of our liquidity and alternate sources of funding, if necessary; (xi) our ability to realize revenue from customer orders and backlog (including our ability to finalize the terms of the remaining obligations under a supply agreement with a leading global wind turbine manufacturer); (xii) the economy and the potential impact it may have on our business, including our customers; (xiii) the state of the wind energy market and other energy and industrial markets generally, including the availability of tax credits, and the impact of competition and economic volatility in those markets; (xiv) the effects of market disruptions and regular market volatility, including fluctuations in the price of oil, gas and other commodities; (xv) competition from new or existing industry participants including, in particular, increased competition from foreign tower manufacturers; (xvi) the effects of the change of administrations in the U.S. federal government; (xvii) our ability to successfully integrate and operate acquired companies and to identify, negotiate and execute future acquisitions; (xviii) the potential loss of tax benefits if we experience an “ownership change” under Section 382 of the Internal Revenue Code of 1986, as amended; (xix) the effects of proxy contests and actions of activist stockholders; (xx) the limited trading market for our securities and the volatility of market price for our securities; (xxi) our outstanding indebtedness and its impact on our business activities (including our ability to incur additional debt in the future); and (xxii) the impact of future sales of our common stock or securities convertible into our common stock on our stock price. These statements are based on information currently available to us and are subject to various risks, uncertainties and other factors that could cause our actual growth, results of operations, financial condition, cash flows, performance, business prospects and opportunities to differ materially from those expressed in, or implied by, these statements including, but not limited to, those set forth under the caption “Risk Factors” in Part I, Item 1A of our most recently filed Form 10-K. We are under no duty to update any of these statements. You should not consider any list of such factors to be an exhaustive statement of all of the risks, uncertainties or other factors that could cause our current beliefs, expectations, plans and/or assumptions to change. Accordingly, forward-looking statements should not be relied upon as a predictor of actual results.
IR CONTACT
Noel Ryan, IRC
BWEN@val-adv.com
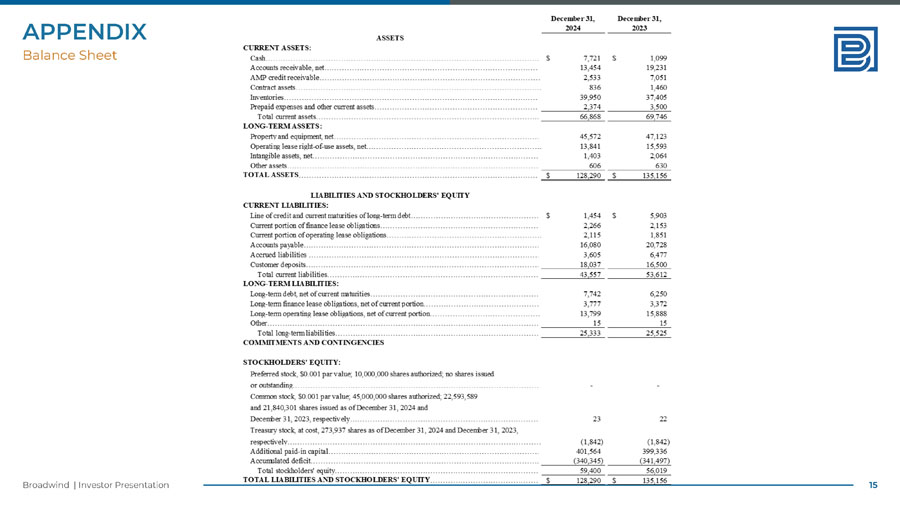
| BROADWIND, INC. AND SUBSIDIARIES CONSOLIDATED BALANCE SHEETS (IN THOUSANDS, EXCEPT SHARE DATA) | |||||||||||
| December 31, | December 31, | ||||||||||
| 2024 | 2023 | ||||||||||
| ASSETS | |||||||||||
| CURRENT ASSETS: | |||||||||||
| Cash | $ | 7,721 | $ | 1,099 | |||||||
| Accounts receivable, net | 13,454 | 19,231 | |||||||||
| AMP credit receivable | 2,533 | 7,051 | |||||||||
| Contract assets | 836 | 1,460 | |||||||||
| Inventories | 39,950 | 37,405 | |||||||||
| Prepaid expenses and other current assets | 2,374 | 3,500 | |||||||||
| Total current assets | 66,868 | 69,746 | |||||||||
| LONG-TERM ASSETS: | |||||||||||
| Property and equipment, net | 45,572 | 47,123 | |||||||||
| Operating lease right-of-use assets, net | 13,841 | 15,593 | |||||||||
| Intangible assets, net | 1,403 | 2,064 | |||||||||
| Other assets | 606 | 630 | |||||||||
| TOTAL ASSETS | $ | 128,290 | $ | 135,156 | |||||||
| LIABILITIES AND STOCKHOLDERS' EQUITY | |||||||||||
| CURRENT LIABILITIES: | |||||||||||
| Line of credit and current maturities of long-term debt | $ | 1,454 | $ | 5,903 | |||||||
| Current portion of finance lease obligations | 2,266 | 2,153 | |||||||||
| Current portion of operating lease obligations | 2,115 | 1,851 | |||||||||
| Accounts payable | 16,080 | 20,728 | |||||||||
| Accrued liabilities | 3,605 | 6,477 | |||||||||
| Customer deposits | 18,037 | 16,500 | |||||||||
| Total current liabilities | 43,557 | 53,612 | |||||||||
| LONG-TERM LIABILITIES | |||||||||||
| Long-term debt, net of current maturities | 7,742 | 6,250 | |||||||||
| Long-term finance lease obligations, net of current portion | 3,777 | 3,372 | |||||||||
| Long-term operating lease obligations, net of current portion | 13,799 | 15,888 | |||||||||
| Other | 15 | 15 | |||||||||
| Total long-term liabilities | 25,333 | 25,525 | |||||||||
| COMMITMENTS AND CONTINGENCIES | |||||||||||
| STOCKHOLDERS' EQUITY: | |||||||||||
| Preferred stock, $0.001 par value; 10,000,000 shares authorized; no shares issued | |||||||||||
| or outstanding | - | - | |||||||||
| Common stock, $0.001 par value; 45,000,000 shares authorized; 22,593,589 | |||||||||||
| and 21,840,301 shares issued as of December 31, 2024 and | |||||||||||
| December 31, 2023, respectively | 23 | 22 | |||||||||
| Treasury stock, at cost, 273,937 shares as of December 31, 2024 and December 31, 2023, | |||||||||||
| respectively | (1,842 | ) | (1,842 | ) | |||||||
| Additional paid-in capital |
401,564 | 399,336 | |||||||||
| Accumulated deficit | (340,345 | ) | (341,497 | ) | |||||||
| Total stockholders' equity | 59,400 | 56,019 | |||||||||
| TOTAL LIABILITIES AND STOCKHOLDERS' EQUITY | $ | 128,290 | $ | 135,156 | |||||||
| BROADWIND, INC. AND SUBSIDIARIES CONSOLIDATED STATEMENTS OF OPERATIONS (IN THOUSANDS, EXCEPT PER SHARE DATA) (UNAUDITED) | ||||||||||||||||
| Three Months Ended December 31, | Twelve Months Ended December 31, | |||||||||||||||
| 2024 | 2023 | 2024 | 2023 | |||||||||||||
| Revenues | $ | 33,565 | $ | 46,598 | $ | 143,136 | $ | 203,477 | ||||||||
| Cost of sales | 29,776 | 39,566 | 121,947 | 170,969 | ||||||||||||
| Gross profit | 3,789 | 7,032 | 21,189 | 32,508 | ||||||||||||
| OPERATING EXPENSES: | ||||||||||||||||
| Selling, general and administrative | 3,912 | 4,592 | 16,303 | 20,705 | ||||||||||||
| Intangible amortization | 165 | 166 | 661 | 664 | ||||||||||||
| Total operating expenses | 4,077 | 4,758 | 16,964 | 21,369 | ||||||||||||
| Operating (loss) income | (288 | ) | 2,274 | 4,225 | 11,139 | |||||||||||
| OTHER (EXPENSE) INCOME, net: | ||||||||||||||||
| Interest expense, net | (762 | ) | (1,030 | ) | (3,078 | ) | (3,201 | ) | ||||||||
| Other, net | 77 | (11 | ) | 79 | (48 | ) | ||||||||||
| Total other expense, net | (685 | ) | (1,041 | ) | (2,999 | ) | (3,249 | ) | ||||||||
| Net (loss) income before provision for income taxes | (973 | ) | 1,233 | 1,226 | 7,890 | |||||||||||
| (Benefit) provision for income taxes | (59 | ) | 162 | 74 | 241 | |||||||||||
| NET (LOSS) INCOME | $ | (914 | ) | $ | 1,071 | $ | 1,152 | $ | 7,649 | |||||||
| NET (LOSS) INCOME PER COMMON SHARE - BASIC: | ||||||||||||||||
| Net (loss) income | $ | (0.04 | ) | $ | 0.05 | $ | 0.05 | $ | 0.36 | |||||||
| WEIGHTED AVERAGE COMMON SHARES OUTSTANDING - BASIC | 22,172 | 21,449 | 21,896 | 21,189 | ||||||||||||
| NET (LOSS) INCOME PER COMMON SHARE - DILUTED: | ||||||||||||||||
| Net (loss) income | $ | (0.04 | ) | $ | 0.05 | $ | 0.05 | $ | 0.36 | |||||||
| WEIGHTED AVERAGE COMMON SHARES OUTSTANDING - DILUTED | 22,224 | 21,633 | 21,975 | 21,491 | ||||||||||||
| BROADWIND, INC. AND SUBSIDIARIES CONSOLIDATED STATEMENTS OF CASH FLOWS (IN THOUSANDS) (UNAUDITED) | ||||||||||
| Twelve Months Ended December 31, | ||||||||||
| 2024 | 2023 | |||||||||
| CASH FLOWS FROM OPERATING ACTIVITIES: | ||||||||||
| Net income | $ | 1,152 | $ | 7,649 | ||||||
| Adjustments to reconcile net cash provided by (used in) operating activities: | ||||||||||
| Depreciation and amortization expense | 6,684 | 6,383 | ||||||||
| Deferred income taxes | - | (10 | ) | |||||||
| Share-based compensation | 1,160 | 877 | ||||||||
| Allowance for credit losses | (5 | ) | 82 | |||||||
| Common stock issued under defined contribution 401(k) plan | 1,199 | 1,336 | ||||||||
| (Gain) loss on disposal of assets | (114 | ) | 42 | |||||||
| Changes in operating assets and liabilities: | ||||||||||
| Accounts receivable | 5,782 | (2,295 | ) | |||||||
| AMP credit receivable | 4,518 | (7,051 | ) | |||||||
| Contract assets | 624 | 495 | ||||||||
| Inventories | (2,545 | ) | 6,857 | |||||||
| Prepaid expenses and other current assets | 1,126 | (210 | ) | |||||||
| Accounts payable | (4,392 | ) | (6,008 | ) | ||||||
| Accrued liabilities | (2,872 | ) | 2,782 | |||||||
| Customer deposits | 1,537 | (18,050 | ) | |||||||
| Other non-current assets and liabilities | (48 | ) | 175 | |||||||
| Net cash provided by (used in) operating activities | 13,806 | (6,946 | ) | |||||||
| CASH FLOWS FROM INVESTING ACTIVITIES: | ||||||||||
| Purchases of property and equipment | (3,618 | ) | (6,405 | ) | ||||||
| Proceeds from disposals of property and equipment | 159 | 21 | ||||||||
| Net cash used in investing activities | (3,459 | ) | (6,384 | ) | ||||||
| CASH FLOWS FROM FINANCING ACTIVITIES: | ||||||||||
| (Payments on) proceeds from line of credit, net | (4,637 | ) | 4,705 | |||||||
| Payments for deferred financing costs | (20 | ) | (48 | ) | ||||||
| Proceeds from long-term debt | 4,107 | 1,056 | ||||||||
| Payments on long-term debt | (1,399 | ) | (1,872 | ) | ||||||
| Payments on finance leases | (1,646 | ) | (1,409 | ) | ||||||
| Shares withheld for taxes in connection with issuance of restricted stock | (130 | ) | (735 | ) | ||||||
| Net cash (used in) provided by financing activities | (3,725 | ) | 1,697 | |||||||
| NET INCREASE (DECREASE) IN CASH | 6,622 | (11,633 | ) | |||||||
| CASH beginning of the period | 1,099 | 12,732 | ||||||||
| CASH end of the period | $ | 7,721 | $ | 1,099 | ||||||
| Supplemental cash flow information: | ||||||||||
| Interest paid | $ | 1,555 | $ | 2,073 | ||||||
| Income taxes paid | $ | 192 | $ | 17 | ||||||
| Non-cash investing and financing activities: | ||||||||||
| Equipment additions via finance lease | $ | 1,376 | $ | 719 | ||||||
| Non-cash purchases of property and equipment | $ | 257 | $ | 482 | ||||||
| Settlement of incentive compensation liability with stock | $ | - | $ | 619 | ||||||
| BROADWIND, INC. AND SUBSIDIARIES SELECTED SEGMENT FINANCIAL INFORMATION (IN THOUSANDS) (UNAUDITED) | |||||||||||||||||
| Three Months Ended | Twelve Months Ended | ||||||||||||||||
| December 31, | December 31, | ||||||||||||||||
| 2024 | 2023 | 2024 | 2023 | ||||||||||||||
| ORDERS: | |||||||||||||||||
| Heavy Fabrications | $ | 22,428 | $ | 9,985 | $ | 53,934 | $ | 50,594 | |||||||||
| Gearing | 7,016 | 3,603 | 26,562 | 24,814 | |||||||||||||
| Industrial Solutions | 8,026 | 6,619 | 27,317 | 25,652 | |||||||||||||
| Total orders | $ | 37,470 | $ | 20,207 | $ | 107,813 | $ | 101,060 | |||||||||
| REVENUES: | |||||||||||||||||
| Heavy Fabrications | $ | 20,429 | $ | 29,503 | $ | 82,657 | $ | 133,368 | |||||||||
| Gearing | 7,630 | 11,061 | 35,588 | 45,408 | |||||||||||||
| Industrial Solutions | 5,863 | 6,035 | 26,056 | 25,159 | |||||||||||||
| Corporate and Other | (357 | ) | (1 | ) | (1,165 | ) | (458 | ) | |||||||||
| Total revenues | $ | 33,565 | $ | 46,598 | $ | 143,136 | $ | 203,477 | |||||||||
| OPERATING INCOME/(LOSS): |
|||||||||||||||||
| Heavy Fabrications | $ | 1,296 | $ | 2,554 | $ | 7,128 | $ | 15,006 | |||||||||
| Gearing | (567 | ) | 654 | (138 | ) | 1,846 | |||||||||||
| Industrial Solutions | 413 | 848 | 3,265 | 3,160 | |||||||||||||
| Corporate and Other | (1,430 | ) | (1,782 | ) | (6,030 | ) | (8,873 | ) | |||||||||
| Total operating income (loss) | $ | (288 | ) | $ | 2,274 | $ | 4,225 | $ | 11,139 | ||||||||
| BROADWIND, INC. AND SUBSIDIARIES RECONCILIATION OF NON-GAAP FINANCIAL MEASURES (IN THOUSANDS) (UNAUDITED) | |||||||||||||||||
| Consolidated | Three Months Ended December 31, | Twelve Months Ended December 31, | |||||||||||||||
| 2024 | 2023 | 2024 | 2023 | ||||||||||||||
| Net (Loss) Income | $ | (914 | ) | $ | 1,072 | $ | 1,152 | $ | 7,649 | ||||||||
| Interest Expense | 762 | 1,031 | 3,078 | 3,201 | |||||||||||||
| Income Tax (Benefit) Provision | (59 | ) | 162 | 74 | 241 | ||||||||||||
| Depreciation and Amortization | 1,698 | 1,611 | 6,684 | 6,383 | |||||||||||||
| Share-based Compensation and Other Stock Payments | 662 | 559 | 2,347 | 2,220 | |||||||||||||
| Proxy Contest-Related Expenses | - | 1 | (10 | ) | 1,780 | ||||||||||||
| Adjusted EBITDA (Non-GAAP) | $ | 2,149 | $ | 4,436 | $ | 13,325 | $ | 21,474 | |||||||||
| Heavy Fabrications Segment | Three Months Ended December 31, | Twelve Months Ended December 31, | |||||||||||||||
| 2024 | 2023 | 2024 | 2023 | ||||||||||||||
| Net Income | $ | 167 | $ | 1,696 | $ | 6,755 | $ | 13,862 | |||||||||
| Interest Expense | 218 | 149 | 1,071 | 649 | |||||||||||||
| Income Tax (Benefit) Provision | 991 | 711 | (617 | ) | 493 | ||||||||||||
| Depreciation | 1,006 | 907 | 3,938 | 3,518 | |||||||||||||
| Share-based Compensation and Other Stock Payments | 202 | 224 | 791 | 936 | |||||||||||||
| Adjusted EBITDA (Non-GAAP) | $ | 2,584 | $ | 3,687 | $ | 11,938 | $ | 19,458 | |||||||||
| Gearing Segment | Three Months Ended December 31, | Twelve Months Ended December 31, | |||||||||||||||
| 2024 | 2023 | 2024 | 2023 | ||||||||||||||
| Net (Loss) Income | $ | (651 | ) | $ | 585 | $ | (405 | ) | $ | 1,553 | |||||||
| Interest Expense | 75 | 59 | 237 | 262 | |||||||||||||
| Income Tax Provision | 9 | 9 | 30 | 32 | |||||||||||||
| Depreciation and Amortization | 556 | 555 | 2,183 | 2,270 | |||||||||||||
| Share-based Compensation and Other Stock Payments | 104 | 107 | 441 | 453 | |||||||||||||
| Adjusted EBITDA (Non-GAAP) | $ | 93 | $ | 1,315 | $ | 2,486 | $ | 4,570 | |||||||||
| Industrial Solutions Segment | Three Months Ended December 31, | Twelve Months Ended December 31, | |||||||||||||||
| 2024 | 2023 | 2024 | 2023 | ||||||||||||||
| Net Income | $ | 332 | $ | 625 | $ | 2,673 | $ | 2,504 | |||||||||
| Interest Expense | 92 | 151 | 517 | 512 | |||||||||||||
| Income Tax (Benefit) Provision | (13 | ) | 62 | 70 | 96 | ||||||||||||
| Depreciation and Amortization | 113 | 99 | 427 | 380 | |||||||||||||
| Share-based Compensation and Other Stock Payments | 75 | 48 | 258 | 196 | |||||||||||||
| Adjusted EBITDA (Non-GAAP) | $ | 599 | $ | 985 | $ | 3,945 | $ | 3,688 | |||||||||
| Corporate and Other | Three Months Ended December 31, | Twelve Months Ended December 31, | |||||||||||||||
| 2024 | 2023 | 2024 | 2023 | ||||||||||||||
| Net Loss | $ | (762 | ) | $ | (1,834 | ) | $ | (7,871 | ) | $ | (10,270 | ) | |||||
| Interest Expense | 377 | 672 | 1,253 | 1,778 | |||||||||||||
| Income Tax (Benefit) Provision | (1,046 | ) | (620 | ) | 591 | (380 | ) | ||||||||||
| Depreciation and Amortization | 23 | 50 | 136 | 215 | |||||||||||||
| Share-based Compensation and Other Stock Payments | 281 | 180 | 857 | 635 | |||||||||||||
| Proxy Contest-Related Expenses | - | 1 | (10 | ) | 1,780 | ||||||||||||
| Adjusted EBITDA (Non-GAAP) | $ | (1,127 | ) | $ | (1,551 | ) | $ | (5,044 | ) | $ | (6,242 | ) | |||||
EXHIBIT 99.2