UNITED STATES
SECURITIES AND EXCHANGE COMMISSION
Washington, D.C. 20549
FORM 6-K
Report of Foreign Private Issuer Pursuant
to Rule 13a-16 or 15d-16
under the Securities Exchange Act of 1934
For the month of May 2024
Commission File Number 001-11444
| MAGNA INTERNATIONAL INC. |
| (Exact Name of Registrant as specified in its Charter) |
| 337 Magna Drive, Aurora, Ontario, Canada L4G 7K1 |
| (Address of principal executive office) |
Indicate by check mark whether the registrant files or will file annual reports under cover Form 20-F or Form 40-F.
Form 20-F ☐ Form 40-F ☒ Pursuant to the requirements of the Securities Exchange Act of 1934, the registrant has duly caused this report to be signed on its behalf by the undersigned, thereunto duly authorized.
SIGNATURES
| MAGNA INTERNATIONAL INC. | |||
| (Registrant) | |||
| Date: May 3, 2024 | |||
| By: | /s/ “Bassem Shakeel” | ||
| Bassem A. Shakeel, | |||
| Vice-President, Associate General Counsel and Corporate Secretary |
|||
EXHIBITS
| Exhibit 99.1 | Q1 2024 Financial Review | |
| Exhibit 99.2 | Q1 2024 Results Call Presentation slides (May 3, 2024) | |
| Exhibit 99.3 | Q1 2024 Results Call Transcript (May 3, 2024) |
Exhibit 99.1
| FINANCIAL REVIEW OF MAGNA INTERNATIONAL INC. | |||||||||||||||||||
| (United States dollars in millions, except per share figures) (Unaudited) Prepared in accordance with U.S. GAAP |
|||||||||||||||||||
| 2022 | 2023 | 2024 | |||||||||||||||||
| Note | 1st Q | 2nd Q | 3rd Q | 4th Q | TOTAL | 1st Q | 2nd Q | 3rd Q | 4th Q | TOTAL | 1st Q | ||||||||
| VEHICLE VOLUME STATISTICS (in millions) | |||||||||||||||||||
| North America | 3.615 | 3.551 | 3.600 | 3.514 | 14.280 | 3.884 | 4.080 | 3.930 | 3.743 | 15.637 | 3.963 | ||||||||
| Europe | 3.997 | 4.020 | 3.597 | 4.188 | 15.802 | 4.581 | 4.598 | 3.825 | 4.357 | 17.361 | 4.497 | ||||||||
| China | 6.361 | 5.489 | 7.235 | 7.264 | 26.349 | 5.936 | 6.797 | 7.657 | 8.940 | 29.330 | 6.601 | ||||||||
| Other | 6.375 | 6.140 | 6.704 | 6.858 | 26.077 | 6.968 | 6.715 | 6.998 | 7.189 | 27.870 | 6.832 | ||||||||
| Global | 20.348 | 19.200 | 21.136 | 21.824 | 82.508 | 21.369 | 22.190 | 22.410 | 24.229 | 90.198 | 21.893 | ||||||||
| Magna Steyr vehicle assembly volumes | 0.026 | 0.032 | 0.026 | 0.028 | 0.112 | 0.034 | 0.027 | 0.023 | 0.021 | 0.105 | 0.022 | ||||||||
| AVERAGE FOREIGN EXCHANGE RATES | |||||||||||||||||||
| 1 Canadian dollar equals U.S. dollars | 0.790 | 0.783 | 0.765 | 0.737 | 0.769 | 0.740 | 0.745 | 0.746 | 0.735 | 0.742 | 0.741 | ||||||||
| 1 euro equals U.S. dollars | 1.123 | 1.064 | 1.006 | 1.019 | 1.053 | 1.073 | 1.089 | 1.088 | 1.076 | 1.082 | 1.085 | ||||||||
| 1 Chinese renminbi equals U.S. dollars | 0.158 | 0.151 | 0.146 | 0.140 | 0.149 | 0.146 | 0.143 | 0.138 | 0.138 | 0.141 | 0.139 | ||||||||
| CONSOLIDATED STATEMENTS OF INCOME (LOSS) | |||||||||||||||||||
| Sales: | |||||||||||||||||||
| Body Exteriors & Structures | 4,077 | 3,947 | 3,976 | 4,004 | 16,004 | 4,439 | 4,540 | 4,354 | 4,178 | 17,511 | 4,429 | ||||||||
| Power & Vision | 3,046 | 2,888 | 2,911 | 3,016 | 11,861 | 3,323 | 3,462 | 3,745 | 3,775 | 14,305 | 3,842 | ||||||||
| Seating Systems | 1,376 | 1,253 | 1,295 | 1,345 | 5,269 | 1,486 | 1,603 | 1,529 | 1,429 | 6,047 | 1,455 | ||||||||
| Complete Vehicles | 1,275 | 1,403 | 1,213 | 1,330 | 5,221 | 1,626 | 1,526 | 1,185 | 1,201 | 5,538 | 1,383 | ||||||||
| Corporate & Other | (132) | (129) | (127) | (127) | (515) | (201) | (149) | (125) | (129) | (604) | (139) | ||||||||
| Sales | 9,642 | 9,362 | 9,268 | 9,568 | 37,840 | 10,673 | 10,982 | 10,688 | 10,454 | 42,797 | 10,970 | ||||||||
| Costs and expenses: | |||||||||||||||||||
| Cost of goods sold | 8,400 | 8,259 | 8,126 | 8,403 | 33,188 | 9,416 | 9,544 | 9,264 | 8,961 | 37,185 | 9,642 | ||||||||
| Selling, general and administrative | 386 | 410 | 387 | 477 | 1,660 | 488 | 505 | 491 | 566 | 2,050 | 516 | ||||||||
| Equity income | (20) | (25) | (27) | (17) | (89) | (33) | (36) | (40) | (3) | (112) | (34) | ||||||||
| Adjusted EBITDA | 876 | 718 | 782 | 705 | 3,081 | 802 | 969 | 973 | 930 | 3,674 | 846 | ||||||||
| Depreciation | 357 | 348 | 330 | 338 | 1,373 | 353 | 353 | 358 | 372 | 1,436 | 377 | ||||||||
| Adjusted EBIT | 519 | 370 | 452 | 367 | 1,708 | 449 | 616 | 615 | 558 | 2,238 | 469 | ||||||||
| Amortization of acquired intangible assets | 12 | 12 | 11 | 11 | 46 | 12 | 13 | 32 | 31 | 88 | 28 | ||||||||
| Other expense (income), net | 1 | 61 | 426 | 23 | 193 | 703 | 142 | 86 | (4) | 164 | 388 | 356 | |||||||
| Interest expense, net | 26 | 20 | 18 | 17 | 81 | 20 | 34 | 49 | 53 | 156 | 51 | ||||||||
| Income (loss) from operations before income taxes | 420 | (88) | 400 | 146 | 878 | 275 | 483 | 538 | 310 | 1,606 | 34 | ||||||||
| Income tax expense | 41 | 57 | 104 | 35 | 237 | 58 | 129 | 121 | 12 | 320 | 8 | ||||||||
| Net income (loss) | 379 | (145) | 296 | 111 | 641 | 217 | 354 | 417 | 298 | 1,286 | 26 | ||||||||
| Income attributable to non-controlling interests | (15) | (11) | (7) | (16) | (49) | (8) | (15) | (23) | (27) | (73) | (17) | ||||||||
| Net income (loss) attributable to Magna International Inc. | 364 | (156) | 289 | 95 | 592 | 209 | 339 | 394 | 271 | 1,213 | 9 | ||||||||
| Diluted earnings (loss) per common share | $ 1.22 | $ (0.54) | $ 1.00 | $ 0.33 | $ 2.03 | $ 0.73 | $ 1.18 | $ 1.37 | $ 0.94 | $ 4.23 | $ 0.03 | ||||||||
| Weighted average number of Common Shares outstanding | |||||||||||||||||||
| during the period (in millions): | 298.1 | 291.1 | 288.5 | 286.3 | 291.2 | 286.6 | 286.3 | 286.8 | 286.6 | 286.6 | 287.1 | ||||||||
| NON-GAAP MEASURES | |||||||||||||||||||
| Adjusted EBITDA | 876 | 718 | 782 | 705 | 3,081 | 802 | 969 | 973 | 930 | 3,674 | 846 | ||||||||
| Adjusted EBIT | 2 | 519 | 370 | 452 | 367 | 1,708 | 449 | 616 | 615 | 558 | 2,238 | 469 | |||||||
| Adjusted net income attributable to Magna International Inc. | 393 | 253 | 317 | 270 | 1,233 | 329 | 441 | 419 | 383 | 1,572 | 311 | ||||||||
| Adjusted Diluted earnings per common share | $ 1.32 | $ 0.87 | $ 1.10 | $ 0.94 | $ 4.24 | $ 1.15 | $ 1.54 | $ 1.46 | $ 1.33 | $ 5.49 | $ 1.08 | ||||||||
| PROFITABILITY RATIOS | |||||||||||||||||||
| Selling, general and administrative /Sales | 4.0% | 4.4% | 4.2% | 5.0% | 4.4% | 4.6% | 4.6% | 4.6% | 5.4% | 4.8% | 4.7% | ||||||||
| Adjusted EBIT /Sales | 5.4% | 4.0% | 4.9% | 3.8% | 4.5% | 4.2% | 5.6% | 5.8% | 5.3% | 5.2% | 4.3% | ||||||||
| Operating income /Sales | 4.4% | -0.9% | 4.3% | 1.5% | 2.3% | 2.6% | 4.4% | 5.0% | 3.0% | 3.8% | 0.3% | ||||||||
| Effective tax rate | |||||||||||||||||||
| Reported | 9.8% | -64.8% | 26.0% | 24.0% | 27.0% | 21.1% | 26.7% | 22.5% | 3.9% | 19.9% | 23.5% | ||||||||
| Excluding Other expense (income) and amortization, net of taxes | 17.2% | 24.6% | 25.3% | 18.3% | 21.2% | 21.4% | 21.6% | 21.9% | 18.8% | 21.0% | 21.5% | ||||||||
| Page |
| FINANCIAL REVIEW OF MAGNA INTERNATIONAL INC. | |||||||||||||||||||
| CONSOLIDATED BALANCE SHEETS | |||||||||||||||||||
| (United States dollars in millions) (Unaudited) | |||||||||||||||||||
| 2022 | 2023 | 2024 | |||||||||||||||||
| 1st Q | 2nd Q | 3rd Q | 4th Q | 1st Q | 2nd Q | 3rd Q | 4th Q | 1st Q | |||||||||||
| FUNDS EMPLOYED | |||||||||||||||||||
| Current assets: | |||||||||||||||||||
| Accounts receivable | 7,006 | 6,764 | 7,082 | 6,791 | 7,959 | 8,556 | 8,477 | 7,881 | 8,379 | ||||||||||
| Inventories | 4,258 | 4,064 | 4,108 | 4,180 | 4,421 | 4,664 | 4,751 | 4,606 | 4,511 | ||||||||||
| Prepaid expenses and other | 310 | 262 | 269 | 320 | 367 | 455 | 387 | 352 | 399 | ||||||||||
| 11,574 | 11,090 | 11,459 | 11,291 | 12,747 | 13,675 | 13,615 | 12,839 | 13,289 | |||||||||||
| Current liabilities: | |||||||||||||||||||
| Accounts payable | 6,845 | 6,443 | 6,624 | 6,999 | 7,731 | 7,984 | 7,911 | 7,842 | 7,855 | ||||||||||
| Accrued salaries and wages | 879 | 766 | 810 | 850 | 822 | 858 | 900 | 912 | 883 | ||||||||||
| Other accrued liabilities | 2,123 | 2,096 | 1,986 | 2,118 | 2,526 | 2,637 | 2,537 | 2,626 | 2,728 | ||||||||||
| Income taxes payable (receivable) | 190 | 136 | 97 | 93 | 9 | (14) | 33 | 125 | 132 | ||||||||||
| 10,037 | 9,441 | 9,517 | 10,060 | 11,088 | 11,465 | 11,381 | 11,505 | 11,598 | |||||||||||
| Working capital | 1,537 | 1,649 | 1,942 | 1,231 | 1,659 | 2,210 | 2,234 | 1,334 | 1,691 | ||||||||||
| Investments | 1,487 | 1,375 | 1,323 | 1,429 | 1,390 | 1,287 | 1,311 | 1,273 | 1,195 | ||||||||||
| Fixed assets, net | 8,090 | 7,723 | 7,470 | 8,173 | 8,304 | 8,646 | 8,778 | 9,618 | 9,545 | ||||||||||
| Goodwill, other assets and intangible assets | 3,544 | 3,353 | 3,280 | 3,576 | 3,640 | 4,733 | 4,726 | 4,962 | 4,646 | ||||||||||
| Operating lease right-of-use assets | 1,667 | 1,587 | 1,545 | 1,595 | 1,638 | 1,667 | 1,696 | 1,744 | 1,733 | ||||||||||
| Funds employed | 16,325 | 15,687 | 15,560 | 16,004 | 16,631 | 18,543 | 18,745 | 18,931 | 18,810 | ||||||||||
| FINANCING | |||||||||||||||||||
| Straight debt: | |||||||||||||||||||
| Cash and cash equivalents | (1,996) | (1,664) | (1,102) | (1,234) | (2,429) | (1,281) | (1,022) | (1,198) | (1,517) | ||||||||||
| Short-term borrowings | - | - | - | 8 | 4 | 150 | 2 | 511 | 838 | ||||||||||
| Long-term debt due within one year | 127 | 105 | 95 | 654 | 668 | 1,426 | 1,398 | 819 | 824 | ||||||||||
| Long-term debt | 3,501 | 3,408 | 3,325 | 2,847 | 4,500 | 4,159 | 4,135 | 4,175 | 4,549 | ||||||||||
| Current portion of operating lease liabilities | 276 | 270 | 266 | 276 | 285 | 303 | 384 | 399 | 306 | ||||||||||
| Operating lease liabilities | 1,369 | 1,294 | 1,254 | 1,288 | 1,318 | 1,345 | 1,289 | 1,319 | 1,407 | ||||||||||
| 3,277 | 3,413 | 3,838 | 3,839 | 4,346 | 6,102 | 6,186 | 6,025 | 6,407 | |||||||||||
| Long-term employee benefit liabilities | 686 | 651 | 617 | 548 | 563 | 579 | 564 | 591 | 584 | ||||||||||
| Other long-term liabilities | 374 | 390 | 397 | 461 | 451 | 448 | 453 | 475 | 471 | ||||||||||
| Deferred tax liabilities, net | (51) | (111) | (138) | (179) | (218) | (242) | (210) | (437) | (576) | ||||||||||
| 1,009 | 930 | 876 | 830 | 796 | 785 | 807 | 629 | 479 | |||||||||||
| Shareholders' equity | 12,039 | 11,344 | 10,846 | 11,335 | 11,489 | 11,656 | 11,752 | 12,277 | 11,924 | ||||||||||
| 16,325 | 15,687 | 15,560 | 16,004 | 16,631 | 18,543 | 18,745 | 18,931 | 18,810 | |||||||||||
| ASSET UTILIZATION RATIOS | |||||||||||||||||||
| Days in accounts receivable | 65.4 | 65.0 | 68.8 | 63.9 | 67.1 | 70.1 | 71.4 | 67.8 | 68.7 | ||||||||||
| Days in accounts payable | 73.3 | 70.2 | 73.4 | 75.0 | 73.9 | 75.3 | 76.9 | 78.8 | 73.3 | ||||||||||
| Inventory turnover - cost of goods sold | 7.9 | 8.1 | 7.9 | 8.0 | 8.5 | 8.2 | 7.8 | 7.8 | 8.5 | ||||||||||
| Working capital turnover | 25.1 | 22.7 | 19.1 | 31.1 | 25.7 | 19.9 | 19.1 | 31.3 | 25.9 | ||||||||||
| Total asset turnover | 2.4 | 2.4 | 2.4 | 2.4 | 2.6 | 2.4 | 2.3 | 2.2 | 2.3 | ||||||||||
| CAPITAL STRUCTURE | |||||||||||||||||||
| Straight debt | 20.1% | 21.8% | 24.7% | 24.0% | 26.1% | 32.9% | 33.0% | 31.8% | 34.1% | ||||||||||
| Long-term employee benefit liabilities, other long-term | |||||||||||||||||||
| liabilities & deferred tax liabilities, net | 6.2% | 5.9% | 5.6% | 5.2% | 4.8% | 4.2% | 4.3% | 3.3% | 2.5% | ||||||||||
| Shareholders' equity | 73.7% | 72.3% | 69.7% | 70.8% | 69.1% | 62.9% | 62.7% | 64.9% | 63.4% | ||||||||||
| 100.0% | 100.0% | 100.0% | 100.0% | 100.0% | 100.0% | 100.0% | 100.0% | 100.0% | |||||||||||
| Debt to total capitalization | 30.5% | 30.9% | 31.3% | 30.9% | 37.1% | 38.8% | 38.0% | 37.0% | 39.9% | ||||||||||
| ANNUALIZED RETURNS | |||||||||||||||||||
| Adjusted Return on equity (Adjusted Net income attributable | |||||||||||||||||||
| to Magna International Inc. / Average shareholders' equity) | 13.6% | 8.7% | 11.4% | 9.7% | 11.5% | 15.2% | 14.3% | 12.8% | 10.3% | ||||||||||
| Adjusted Return on Invested Capital (Adjusted Annualized after-tax | |||||||||||||||||||
| operating profits / Invested capital) | 10.6% | 7.0% | 8.6% | 7.6% | 8.7% | 11.0% | 10.3% | 9.6% | 7.8% | ||||||||||
| Page |
| FINANCIAL REVIEW OF MAGNA INTERNATIONAL INC. | |||||||||||||||||||
| CONSOLIDATED STATEMENTS OF CASH FLOWS | |||||||||||||||||||
| (United States dollars in millions) (Unaudited) | |||||||||||||||||||
| 2022 | 2023 | 2024 | |||||||||||||||||
| Cash provided from (used for): | Note | 1st Q | 2nd Q | 3rd Q | 4th Q | TOTAL | 1st Q | 2nd Q | 3rd Q | 4th Q | TOTAL | 1st Q | |||||||
| Operating activities | |||||||||||||||||||
| Net income (loss) | 379 | (145) | 296 | 111 | 641 | 217 | 354 | 417 | 298 | 1,286 | 26 | ||||||||
| Items not involving current cash flows | 370 | 705 | 295 | 406 | 1,776 | 351 | 525 | 404 | 362 | 1,642 | 565 | ||||||||
| 749 | 560 | 591 | 517 | 2,417 | 568 | 879 | 821 | 660 | 2,928 | 591 | |||||||||
| Changes in operating assets and liabilities | (569) | (139) | (353) | 739 | (322) | (341) | (332) | (24) | 918 | 221 | (330) | ||||||||
| Cash provided from operating activities | 180 | 421 | 238 | 1,256 | 2,095 | 227 | 547 | 797 | 1,578 | 3,149 | 261 | ||||||||
| Investment activities | |||||||||||||||||||
| Fixed asset additions | (238) | (329) | (364) | (750) | (1,681) | (424) | (502) | (630) | (944) | (2,500) | (493) | ||||||||
| Increase in investments, other assets and intangible assets | (64) | (80) | (125) | (186) | (455) | (101) | (96) | (176) | (189) | (562) | (125) | ||||||||
| Net cash inflow (outflow) from disposal of facilities | 1(c), 1(e) | 6 | - | - | - | 6 | (25) | - | (23) | - | (48) | 4 | |||||||
| Increase in public and private equity investments | (2) | (2) | (25) | - | (29) | - | (3) | (7) | (1) | (11) | (23) | ||||||||
| Proceeds from disposition | 23 | 40 | 41 | 20 | 124 | 19 | 44 | 32 | 27 | 122 | 87 | ||||||||
| Business combinations | - | - | - | (3) | (3) | - | (1,475) | - | (29) | (1,504) | (30) | ||||||||
| Cash used for investment activities | (275) | (371) | (473) | (919) | (2,038) | (531) | (2,032) | (804) | (1,136) | (4,503) | (580) | ||||||||
| Financing activities | |||||||||||||||||||
| Net issues (repayments) of debt | (328) | (31) | (10) | (22) | (391) | 1,636 | 544 | (135) | (119) | 1,926 | 757 | ||||||||
| Common Shares issued on exercise of stock options | 4 | - | 1 | 3 | 8 | 6 | - | 8 | 6 | 20 | 30 | ||||||||
| Repurchase of Common Shares | (383) | (212) | (180) | (5) | (780) | (9) | (2) | - | (2) | (13) | (3) | ||||||||
| Tax withholdings on vesting of equity awards | (14) | (1) | - | - | (15) | (9) | (1) | - | (1) | (11) | (4) | ||||||||
| Contributions to subsidiaries by non-controlling interests | - | 5 | - | - | 5 | - | - | - | 11 | 11 | - | ||||||||
| Dividends paid to non-controlling interests | - | (12) | (10) | (24) | (46) | (7) | (24) | (18) | (25) | (74) | - | ||||||||
| Dividends paid | (133) | (130) | (125) | (126) | (514) | (132) | (129) | (128) | (133) | (522) | (134) | ||||||||
| Cash provided from (used for) financing activities | (854) | (381) | (324) | (174) | (1,733) | 1,485 | 388 | (273) | (263) | 1,337 | 646 | ||||||||
| Effect of exchange rate changes on cash and cash equivalents | (3) | (1) | (3) | (31) | (38) | 14 | (51) | 21 | (3) | (19) | (8) | ||||||||
| Net increase (decrease) in cash and cash equivalents, during the period | (952) | (332) | (562) | 132 | (1,714) | 1,195 | (1,148) | (259) | 176 | (36) | 319 | ||||||||
| Cash and cash equivalents, beginning of period | 2,948 | 1,996 | 1,664 | 1,102 | 2,948 | 1,234 | 2,429 | 1,281 | 1,022 | 1,234 | 1,198 | ||||||||
| Cash and cash equivalents, end of period | 1,996 | 1,664 | 1,102 | 1,234 | 1,234 | 2,429 | 1,281 | 1,022 | 1,198 | 1,198 | 1,517 | ||||||||
| Page |
| FINANCIAL REVIEW OF MAGNA INTERNATIONAL INC. | |||||||||||||||||||
| (United States dollars in millions, except per share figures) (Unaudited) | |||||||||||||||||||
| This Analyst should be read in conjunction with the audited consolidated financial statements for the year ended December 31, 2023. | |||||||||||||||||||
| Note 1: | OTHER EXPENSE (INCOME), NET | ||||||||||||||||||
| Other expense (income), net consists of: | |||||||||||||||||||
| 2022 | 2023 | 2024 | |||||||||||||||||
| 1st Q | 2nd Q | 3rd Q | 4th Q | TOTAL | 1st Q | 2nd Q | 3rd Q | 4th Q | TOTAL | 1st Q | |||||||||
| Impairments and restructuring related to Fisker Inc. [“Fisker”] | [a] | - | - | - | - | - | - | - | - | - | - | 316 | |||||||
| Restructuring | [b] | - | - | - | 22 | 22 | 118 | (35) | (1) | 66 | 148 | 38 | |||||||
| Investment revaluations, (gains) losses on sales, and impairments | [c] | 61 | 50 | 9 | 101 | 221 | 24 | 98 | (19) | 98 | 201 | 2 | |||||||
| Impairments and loss on sale of operations in Russia | [d] | - | 376 | - | - | 376 | - | - | 16 | - | 16 | - | |||||||
| Veoneer AS transaction costs | [e] | - | - | - | - | - | - | 23 | - | - | 23 | - | |||||||
| Loss on sale of business | [f] | - | - | - | 58 | 58 | - | - | - | - | - | - | |||||||
| Impairments | [g] | - | - | 14 | 12 | 26 | - | - | - | - | - | - | |||||||
| 61 | 426 | 23 | 193 | 703 | 142 | 86 | (4) | 164 | 388 | 356 | |||||||||
| [a] | Impairments and restructuring related to Fisker Inc. [“Fisker”] | ||||||||||||||||||
| Impairment of Fisker related assets: | |||||||||||||||||||
| During the first quarter of 2024, the Company recorded a $261 million impairment charge on its Fisker related assets as a result of the expected lack of future cashflows and the substantial doubt about Fisker’s ability to continue as a going concern. The assets impaired include production receivables, inventory, fixed assets and other capitalized expenditures. | |||||||||||||||||||
| Impairment of Fisker warrants: | |||||||||||||||||||
| Fisker issued approximately 19.5 million penny warrants to the Company to purchase common stock in connection with our agreements with Fisker for platform sharing, engineering and manufacturing of the Fisker Ocean SUV. These warrants vested during 2021 and 2022 based on specified milestones and have been marked to market each quarter. During the first quarter of 2024, Magna recorded a $33 million impairment charge on these warrants reducing the value of the warrants to nil. |
|||||||||||||||||||
| Restructuring: | |||||||||||||||||||
| In the first quarter of 2024, the Company recorded restructuring charges of $22 million in its Complete Vehicles segment in connection with its Fisker related assembly operations. | |||||||||||||||||||
| [b] | Restructuring | ||||||||||||||||||
| Reversal of restructuring charges: | |||||||||||||||||||
| During the second quarter of 2023, the Company’s Power & Vision segment reversed $39 million of charges due to a change in the restructuring plans related to a plant closure. | |||||||||||||||||||
| Sale of buildings as a result of restructuring activities: | |||||||||||||||||||
| During the second and third quarter of 2023, the Company’s Power & Vision segment recorded a $10 million and $8 million gain on the sale of a building as a result of restructuring activities, respectively. | |||||||||||||||||||
| Other Restructuring: | 2022 | 2023 | 2024 | ||||||||||||||||
| 1st Q | 2nd Q | 3rd Q | 4th Q | TOTAL | 1st Q | 2nd Q | 3rd Q | 4th Q | TOTAL | 1st Q | |||||||||
| Complete Vehicles | - | - | - | - | - | - | - | - | - | - | 26 | ||||||||
| Body Exteriors & Structures | - | - | - | - | - | 13 | 9 | - | 9 | 31 | 12 | ||||||||
| Power & Vision | - | - | - | 22 | 22 | 105 | 5 | 7 | 57 | 174 | - | ||||||||
| - | - | - | 22 | 22 | 118 | 14 | 7 | 66 | 205 | 38 | |||||||||
| [c] | Investment revaluations, (gains) losses on sales, and impairments | ||||||||||||||||||
| The Company revalues its public and private equity investments and certain public company warrants every quarter. The gains and losses related to this revaluation, as well as gain and losses on disposition, are primarily recorded in Corporate. In the second quarter of 2023, the Company recorded a non-cash impairment charge of $85 million on a private equity investment and related long-term receivables within Other assets in its Corporate segment. In the fourth quarter of 2023, the Company also recorded a non-cash impairment charge of $5 million on a private equity investment in its Power & Vision segment. | |||||||||||||||||||
| [d] | Impairments and loss on sale of operations in Russia | ||||||||||||||||||
| As a result of the expected lack of future cashflows and the continuing uncertainties connected with the Russian economy, during the second quarter of 2022, the Company recorded a $376 million impairment charge related to its investment in Russia. This included net asset impairments of $173 million and a $203 million reserve against the related foreign currency translation losses that were included in accumulated other comprehensive loss. The net asset impairments consisted of $163 million and $10 million in our Body Exteriors & Structures and our Seating Systems segments, respectively. During the third quarter of 2023, the Company completed the sale of all of its investments in Russia resulting in a loss of $16 million including a net cash outflow of $23 million. |
|||||||||||||||||||
| [e] | Veoneer AS transaction costs | ||||||||||||||||||
| During 2023, the Company incurred $23 million of transaction costs related to the acquisition of the Veoneer Active Safety Business. | |||||||||||||||||||
| [f] | Loss on sale of business | ||||||||||||||||||
| During the fourth quarter of 2022, the Company entered into an agreement to sell a European Power & Vision operation. Under the terms of the arrangement, the Company was contractually obligated to provide the buyer with up to $42 million of funding, resulting in a loss of $58 million. During the first quarter of 2023, the Company completed the sale of this operation which resulted in a net cash outflow of $25 million. | |||||||||||||||||||
| [g] | Impairments | 2022 | 2023 | 2024 | |||||||||||||||
| 1st Q | 2nd Q | 3rd Q | 4th Q | TOTAL | 1st Q | 2nd Q | 3rd Q | 4th Q | TOTAL | 1st Q | |||||||||
| Body Exteriors & Structures | - | - | 10 | 12 | 22 | - | - | - | - | - | - | ||||||||
| Power & Vision | - | - | 4 | - | 4 | - | - | - | - | - | - | ||||||||
| - | - | 14 | 12 | 26 | - | - | - | - | - | - | |||||||||
| Page |
| Note 2: | NON-GAAP MEASURES | ||||||||||||||||||
| The Company presents Adjusted EBIT (Earnings before interest, taxes, Other expense (income),net and amortization of acquired intangible assets); Adjusted Net Income (Net Income before Other expense (income),net, net of tax excluding significant income tax valuation allowance adjustments, and amortization of acquired intangible assets); Adjusted Diluted Earnings per Share; Adjusted EBIT as a percentage of sales; Adjusted Return on Invested Capital and Adjusted Return on Equity. The Company presents these financial figures because such measures are widely used by analysts and investors in evaluating the operating performance of the Company. However, such measures do not have any standardized meaning under U.S. generally accepted accounting principles and may not be comparable to the calculation of similar measures by other companies. Adjusted EBIT, Adjusted Net Income and Adjusted diluted earnings per share presented in the tables below, including for the prior period, have been updated to reflect the revised calculation. | |||||||||||||||||||
| The following table reconciles Income (loss) from operations before income taxes to Adjusted EBIT: | |||||||||||||||||||
| 2022 | 2023 | 2024 | |||||||||||||||||
| 1st Q | 2nd Q | 3rd Q | 4th Q | TOTAL | 1st Q | 2nd Q | 3rd Q | 4th Q | TOTAL | 1st Q | |||||||||
| Income (loss) from operations before income taxes | 420 | (88) | 400 | 146 | 878 | 275 | 483 | 538 | 310 | 1,606 | 34 | ||||||||
| Exclude: | |||||||||||||||||||
| Amortization of acquired intangible assets | 12 | 12 | 11 | 11 | 46 | 12 | 13 | 32 | 31 | 88 | 28 | ||||||||
| Other expense (income), net | 61 | 426 | 23 | 193 | 703 | 142 | 86 | (4) | 164 | 388 | 356 | ||||||||
| Interest expense | 26 | 20 | 18 | 17 | 81 | 20 | 34 | 49 | 53 | 156 | 51 | ||||||||
| Adjusted EBIT | 519 | 370 | 452 | 367 | 1,708 | 449 | 616 | 615 | 558 | 2,238 | 469 | ||||||||
| The following table show the calculation of Adjusted Return on Invested Capital: | |||||||||||||||||||
| 2022 | 2023 | 2024 | |||||||||||||||||
| 1st Q | 2nd Q | 3rd Q | 4th Q | 1st Q | 2nd Q | 3rd Q | 4th Q | 1st Q | |||||||||||
| Net income (loss) | 379 | (145) | 296 | 111 | 217 | 354 | 417 | 298 | 26 | ||||||||||
| Add (deduct): | |||||||||||||||||||
| Interest expense | 26 | 20 | 18 | 17 | 20 | 34 | 49 | 53 | 51 | ||||||||||
| Amortization of acquired intangible assets | 12 | 12 | 11 | 11 | 12 | 13 | 32 | 31 | 28 | ||||||||||
| Other expense (income), net | 61 | 426 | 23 | 193 | 142 | 86 | (4) | 164 | 356 | ||||||||||
| Tax effect on Interest expense, net, Amortization of acquired | |||||||||||||||||||
| intangible assets and Other expense, net | (19) | (34) | (11) | (32) | (38) | (4) | (14) | (46) | (93) | ||||||||||
| Adjustments to Deferred Tax Valuation Allowances | (29) | - | - | - | - | - | - | (47) | - | ||||||||||
| Adjusted After-tax operating profits | 430 | 279 | 337 | 300 | 353 | 483 | 480 | 453 | 368 | ||||||||||
| Total Assets | 28,822 | 27,283 | 26,667 | 27,789 | 30,654 | 31,837 | 31,675 | 32,255 | 32,678 | ||||||||||
| Excluding: | |||||||||||||||||||
| Cash and cash equivalents | (1,996) | (1,664) | (1,102) | (1,234) | (2,429) | (1,281) | (1,022) | (1,198) | (1,517) | ||||||||||
| Deferred tax assets | (464) | (491) | (488) | (491) | (506) | (535) | (527) | (621) | (753) | ||||||||||
| Less Current Liabilities | (10,440) | (9,816) | (9,878) | (10,998) | (12,045) | (13,358) | (13,165) | (13,234) | (13,566) | ||||||||||
| Excluding: | |||||||||||||||||||
| Short-term borrowing | - | - | - | 8 | 4 | 150 | 2 | 511 | 838 | ||||||||||
| Long-term debt due within one year | 127 | 105 | 95 | 654 | 668 | 1,426 | 1,398 | 819 | 824 | ||||||||||
| Current portion of operating lease liabilities | 276 | 270 | 266 | 276 | 285 | 303 | 384 | 399 | 306 | ||||||||||
| Invested Capital | 16,325 | 15,687 | 15,560 | 16,004 | 16,631 | 18,542 | 18,745 | 18,931 | 18,810 | ||||||||||
| Adjusted After-tax operating profits | 430 | 279 | 337 | 300 | 353 | 483 | 480 | 453 | 368 | ||||||||||
| Average Invested Capital | 16,185 | 16,006 | 15,624 | 15,782 | 16,318 | 17,587 | 18,644 | 18,838 | 18,871 | ||||||||||
| Adjusted Return on Invested Capital | 10.6% | 7.0% | 8.6% | 7.6% | 8.7% | 11.0% | 10.3% | 9.6% | 7.8% | ||||||||||
| Page |
| Note 2: | NON-GAAP MEASURES (Continued) | ||||||||||||||||||
| The following table show the calculation of Adjusted Return on Equity: | |||||||||||||||||||
| 2022 | 2023 | 2024 | |||||||||||||||||
| 1st Q | 2nd Q | 3rd Q | 4th Q | 1st Q | 2nd Q | 3rd Q | 4th Q | 1st Q | |||||||||||
| Net income (loss) attributable to Magna International Inc. | 364 | (156) | 289 | 95 | 209 | 339 | 394 | 271 | 9 | ||||||||||
| Add (deduct): | |||||||||||||||||||
| Amortization of acquired intangible assets | 12 | 12 | 11 | 11 | 12 | 13 | 32 | 31 | 28 | ||||||||||
| Other expense (income), net | 61 | 426 | 23 | 193 | 142 | 86 | (4) | 164 | 356 | ||||||||||
| Tax effect on Amortization of acquired intangible assets | |||||||||||||||||||
| and Other expense, net | (15) | (29) | (6) | (29) | (34) | 3 | (3) | (36) | (82) | ||||||||||
| Adjustments to Deferred Tax Valuation Allowances | (29) | - | - | - | - | - | - | (47) | - | ||||||||||
| Adjusted Net income (loss) attributable to Magna International Inc. | 393 | 253 | 317 | 270 | 329 | 441 | 419 | 383 | 311 | ||||||||||
| Average Shareholder's Equity | 11,599 | 11,692 | 11,095 | 11,091 | 11,412 | 11,573 | 11,704 | 12,015 | 12,101 | ||||||||||
| Adjusted Return on Equity | 13.6% | 8.7% | 11.4% | 9.7% | 11.5% | 15.2% | 14.3% | 12.8% | 10.3% | ||||||||||
| The following table reconciles Net income (loss) attributable to Magna International Inc. to Adjusted net income attributable to Magna International Inc.: | |||||||||||||||||||
| 2022 | 2023 | 2024 | |||||||||||||||||
| 1st Q | 2nd Q | 3rd Q | 4th Q | TOTAL | 1st Q | 2nd Q | 3rd Q | 4th Q | TOTAL | 1st Q | |||||||||
| Net income (loss) attributable to Magna International Inc. | 364 | (156) | 289 | 95 | 592 | 209 | 339 | 394 | 271 | 1,213 | 9 | ||||||||
| Exclude: | |||||||||||||||||||
| Amortization of acquired intangible assets | 10 | 10 | 9 | 9 | 38 | 10 | 11 | 25 | 25 | 71 | 22 | ||||||||
| Impairments and restructuring related to Fisker Inc. [“Fisker”] | - | - | - | - | - | - | - | - | - | - | 247 | ||||||||
| Investment revaluations, (gains) losses on sales, and impairments | 48 | 38 | 7 | 75 | 168 | 18 | 95 | (14) | 74 | 173 | 1 | ||||||||
| Restructuring | - | - | - | 22 | 22 | 92 | (26) | (2) | 60 | 124 | 32 | ||||||||
| Impairments and loss on sale of operations in Russia | - | 361 | - | - | 361 | - | - | 16 | - | 16 | - | ||||||||
| Veoneer AS transaction costs | - | - | - | - | - | - | 22 | - | - | 22 | - | ||||||||
| Impairments | - | - | 12 | 12 | 24 | - | - | - | - | - | - | ||||||||
| Net losses on the sale of business | - | - | - | 57 | 57 | - | - | - | - | - | - | ||||||||
| Adjustments to Deferred Tax Valuation Allowance | [i] | (29) | - | - | - | (29) | - | - | - | (47) | (47) | - | |||||||
| - | |||||||||||||||||||
| Adjusted net income attributable to Magna International Inc. | 393 | 253 | 317 | 270 | 1,233 | 329 | 441 | 419 | 383 | 1,572 | 311 | ||||||||
| The following table reconciles diluted earnings (loss) per common share to Adjusted diluted earnings per common share: | |||||||||||||||||||
| 2022 | 2023 | 2024 | |||||||||||||||||
| 1st Q | 2nd Q | 3rd Q | 4th Q | TOTAL | 1st Q | 2nd Q | 3rd Q | 4th Q | TOTAL | 1st Q | |||||||||
| Diluted earnings (loss) per common share | $ 1.22 | $ (0.54) | $ 1.00 | $ 0.33 | $ 2.03 | $ 0.73 | $ 1.18 | $ 1.37 | $ 0.95 | $ 4.23 | $ 0.03 | ||||||||
| Exclude: | |||||||||||||||||||
| Amortization of acquired intangible assets | 0.04 | 0.03 | 0.03 | 0.03 | 0.13 | 0.04 | 0.04 | 0.09 | 0.09 | 0.25 | 0.08 | ||||||||
| Impairments and restructuring related to Fisker Inc. [“Fisker”] | - | - | - | - | - | - | - | - | - | - | 0.86 | ||||||||
| Investment revaluations, (gains) losses on sales, and impairments | 0.16 | 0.13 | 0.03 | 0.26 | 0.58 | 0.07 | 0.33 | (0.06) | 0.25 | 0.60 | - | ||||||||
| Restructuring | - | - | - | 0.08 | 0.08 | 0.31 | (0.09) | - | 0.20 | 0.43 | 0.11 | ||||||||
| Impairments and loss on sale of operations in Russia | - | 1.24 | - | - | 1.24 | - | - | 0.06 | - | 0.06 | - | ||||||||
| Veoneer AS transaction costs | - | - | - | - | - | - | 0.08 | - | - | 0.08 | - | ||||||||
| Impairments | - | - | 0.04 | 0.04 | 0.08 | - | - | - | - | - | - | ||||||||
| Net losses on the sale of business | - | - | - | 0.20 | 0.20 | - | - | - | - | - | - | ||||||||
| Adjustments to Deferred Tax Valuation Allowance | [i] | (0.10) | - | - | - | (0.10) | - | - | - | (0.16) | (0.16) | - | |||||||
| Adjusted diluted earnings per common share | $ 1.32 | $ 0.87 | $ 1.10 | $ 0.94 | $ 4.24 | $ 1.15 | $ 1.54 | $ 1.46 | $ 1.33 | $ 5.49 | $ 1.08 | ||||||||
| [i] Adjustments to Deferred Tax Valuation Allowance | |||||||||||||||||||
| The Company records quarterly adjustments to the valuation allowance against its deferred tax assets in continents like North America, Europe, Asia, and South America. The net effect of these adjustments is a reduction to income expense. | |||||||||||||||||||
| Page |
| Note 3: | SEGMENTED INFORMATION | ||||||||||||||||||
| 2022 | 2023 | 2024 | |||||||||||||||||
| 1st Q | 2nd Q | 3rd Q | 4th Q | TOTAL | 1st Q | 2nd Q | 3rd Q | 4th Q | TOTAL | 1st Q | |||||||||
| Body Exteriors & Structures | |||||||||||||||||||
| Sales | 4,077 | 3,947 | 3,976 | 4,004 | 16,004 | 4,439 | 4,540 | 4,354 | 4,178 | 17,511 | 4,429 | ||||||||
| Adjusted EBIT | 231 | 194 | 227 | 200 | 852 | 272 | 394 | 358 | 280 | 1,304 | 298 | ||||||||
| Adjusted EBIT as a percentage of sales | 5.7% | 4.9% | 5.7% | 5.0% | 5.3% | 6.1% | 8.7% | 8.2% | 6.7% | 7.4% | 6.7% | ||||||||
| Power & Vision | |||||||||||||||||||
| Sales | 3,046 | 2,888 | 2,911 | 3,016 | 11,861 | 3,323 | 3,462 | 3,745 | 3,775 | 14,305 | 3,842 | ||||||||
| Adjusted EBIT | 163 | 99 | 124 | 116 | 502 | 92 | 124 | 221 | 231 | 668 | 98 | ||||||||
| Adjusted EBIT as a percentage of sales | 5.4% | 3.4% | 4.3% | 3.8% | 4.2% | 2.8% | 3.6% | 5.9% | 6.1% | 4.7% | 2.6% | ||||||||
| Seating Systems | |||||||||||||||||||
| Sales | 1,376 | 1,253 | 1,295 | 1,345 | 5,269 | 1,486 | 1,603 | 1,529 | 1,429 | 6,047 | 1,455 | ||||||||
| Adjusted EBIT | 50 | 3 | 37 | 14 | 104 | 37 | 67 | 70 | 44 | 218 | 52 | ||||||||
| Adjusted EBIT as a percentage of sales | 3.6% | 0.2% | 2.9% | 1.0% | 2.0% | 2.5% | 4.2% | 4.6% | 3.1% | 3.6% | 3.6% | ||||||||
| Complete Vehicles | |||||||||||||||||||
| Sales | 1,275 | 1,403 | 1,213 | 1,330 | 5,221 | 1,626 | 1,526 | 1,185 | 1,201 | 5,538 | 1,383 | ||||||||
| Adjusted EBIT | 50 | 63 | 65 | 57 | 235 | 52 | 34 | (5) | 43 | 124 | 27 | ||||||||
| Adjusted EBIT as a percentage of sales | 3.9% | 4.5% | 5.4% | 4.3% | 4.5% | 3.2% | 2.2% | -0.4% | 3.6% | 2.2% | 2.0% | ||||||||
| Corporate and other | |||||||||||||||||||
| Intercompany eliminations | (132) | (129) | (127) | (127) | (515) | (201) | (149) | (125) | (129) | (604) | (139) | ||||||||
| Adjusted EBIT | 25 | 11 | (1) | (20) | 15 | (4) | (3) | (29) | (40) | (76) | (6) | ||||||||
| Total | |||||||||||||||||||
| Sales | 9,642 | 9,362 | 9,268 | 9,568 | 37,840 | 10,673 | 10,982 | 10,688 | 10,454 | 42,797 | 10,970 | ||||||||
| Adjusted EBIT | 519 | 370 | 452 | 367 | 1,708 | 449 | 616 | 615 | 558 | 2,238 | 469 | ||||||||
| Adjusted EBIT as a percentage of sales | 5.4% | 4.0% | 4.9% | 3.8% | 4.5% | 4.2% | 5.6% | 5.8% | 5.3% | 5.2% | 4.3% | ||||||||
Page 7 of 7
Exhibit 99.2

First Quarter 2024 May 3, 2024 Q1 2024 Results 1
Louis Tonelli Vice President, Investor Relations Q1 2024 Results 2
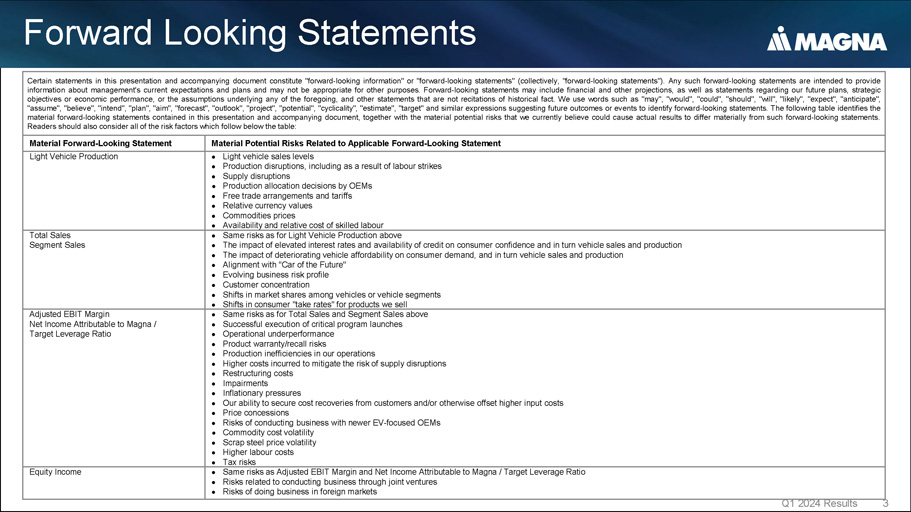
Forward Looking Statements Q1 2024 Results 3 Certain statements in this presentation and accompanying document constitute "forward - looking information" or "forward - looking statements" (collectively, "forward - looking statements") . Any such forward - looking statements are intended to provide information about management's current expectations and plans and may not be appropriate for other purposes . Forward - looking statements may include financial and other projections, as well as statements regarding our future plans, strategic objectives or economic performance, or the assumptions underlying any of the foregoing, and other statements that are not recitations of historical fact . We use words such as "may", "would", "could", "should", "will", "likely", "expect", "anticipate", "assume", "believe", "intend", "plan", "aim", "forecast", "outlook", "project", "potential", "cyclicality", "estimate", "target" and similar expressions suggesting future outcomes or events to identify forward - looking statements . The following table identifies the material forward - looking statements contained in this presentation and accompanying document, together with the material potential risks that we currently believe could cause actual results to differ materially from such forward - looking statements .
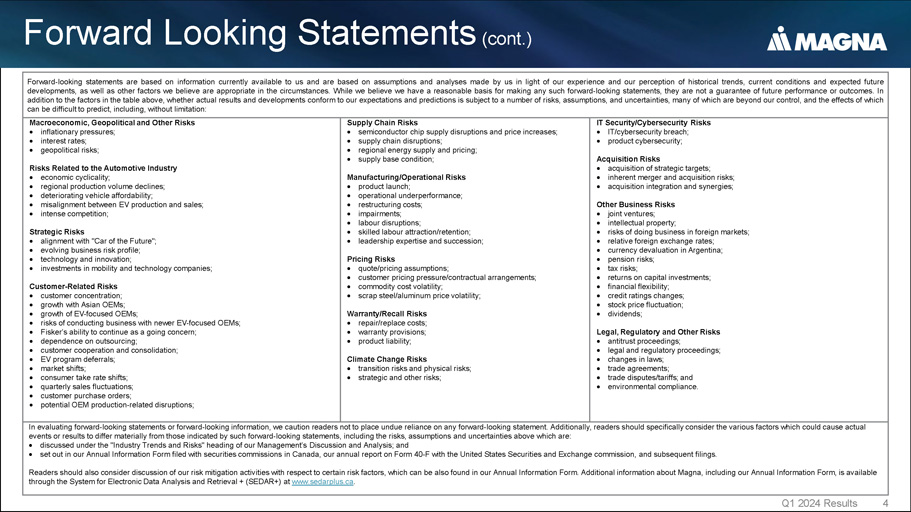
Readers should also consider all of the risk factors which follow below the table : Material Potential Risks Related to Applicable Forward - Looking Statement Material Forward - Looking Statement Light vehicle sales levels Production disruptions, including as a result of labour strikes Supply disruptions Production allocation decisions by OEMs Free trade arrangements and tariffs Relative currency values Commodities prices Availability and relative cost of skilled labour Light Vehicle Production Same risks as for Light Vehicle Production above The impact of elevated interest rates and availability of credit on consumer confidence and in turn vehicle sales and production The impact of deteriorating vehicle affordability on consumer demand, and in turn vehicle sales and production Alignment with "Car of the Future" Evolving business risk profile Customer concentration Shifts in market shares among vehicles or vehicle segments Shifts in consumer "take rates" for products we sell Total Sales Segment Sales Same risks as for Total Sales and Segment Sales above Successful execution of critical program launches Operational underperformance Product warranty/recall risks Production inefficiencies in our operations Higher costs incurred to mitigate the risk of supply disruptions Restructuring costs Impairments Inflationary pressures Our ability to secure cost recoveries from customers and/or otherwise offset higher input costs Price concessions Risks of conducting business with newer EV - focused OEMs Commodity cost volatility Scrap steel price volatility Higher labour costs Tax risks Adjusted EBIT Margin Net Income Attributable to Magna / Target Leverage Ratio Same risks as Adjusted EBIT Margin and Net Income Attributable to Magna / Target Leverage Ratio Risks related to conducting business through joint ventures Risks of doing business in foreign markets Equity Income Forward Looking Statements (cont.) Q1 2024 Results 4 Forward - looking statements are based on information currently available to us and are based on assumptions and analyses made by us in light of our experience and our perception of historical trends, current conditions and expected future developments, as well as other factors we believe are appropriate in the circumstances . While we believe we have a reasonable basis for making any such forward - looking statements, they are not a guarantee of future performance or outcomes . In addition to the factors in the table above, whether actual results and developments conform to our expectations and predictions is subject to a number of risks, assumptions, and uncertainties, many of which are beyond our control, and the effects of which can be difficult to predict, including, without limitation : IT Security/Cybersecurity Risks IT/cybersecurity breach; product cybersecurity; Acquisition Risks acquisition of strategic targets; inherent merger and acquisition risks; acquisition integration and synergies; Other Business Risks joint ventures; intellectual property; risks of doing business in foreign markets; relative foreign exchange rates; currency devaluation in Argentina; pension risks; tax risks; returns on capital investments; financial flexibility; credit ratings changes; stock price fluctuation; dividends; Legal, Regulatory and Other Risks antitrust proceedings; legal and regulatory proceedings; changes in laws; trade agreements; trade disputes/tariffs; and environmental compliance. Supply Chain Risks semiconductor chip supply disruptions and price increases; supply chain disruptions; regional energy supply and pricing; supply base condition; Manufacturing/Operational Risks product launch; operational underperformance; restructuring costs; impairments; labour disruptions; skilled labour attraction/retention; leadership expertise and succession; Pricing Risks quote/pricing assumptions; customer pricing pressure/contractual arrangements; commodity cost volatility; scrap steel/aluminum price volatility; Warranty/Recall Risks repair/replace costs; warranty provisions; product liability; Climate Change Risks transition risks and physical risks; strategic and other risks; Macroeconomic, Geopolitical and Other Risks inflationary pressures; interest rates; geopolitical risks; Risks Related to the Automotive Industry economic cyclicality; regional production volume declines; deteriorating vehicle affordability; misalignment between EV production and sales; intense competition; Strategic Risks alignment with "Car of the Future"; evolving business risk profile; technology and innovation; investments in mobility and technology companies; Customer - Related Risks customer concentration; growth with Asian OEMs; growth of EV - focused OEMs; risks of conducting business with newer EV - focused OEMs; Fisker’s ability to continue as a going concern; dependence on outsourcing; customer cooperation and consolidation; EV program deferrals; market shifts; consumer take rate shifts; quarterly sales fluctuations; customer purchase orders; potential OEM production - related disruptions; In evaluating forward - looking statements or forward - looking information, we caution readers not to place undue reliance on any forward - looking statement. Additionally, readers should specifically consider the various factors which could cause actual events or results to differ materially from those indicated by such forward - looking statements, including the risks, assumptions and uncertainties above which are: discussed under the "Industry Trends and Risks" heading of our Management’s Discussion and Analysis; and set out in our Annual Information Form filed with securities commissions in Canada, our annual report on Form 40 - F with the United States Securities and Exchange commission, and subsequent filings. Readers should also consider discussion of our risk mitigation activities with respect to certain risk factors, which can be also found in our Annual Information Form. Additional information about Magna, including our Annual Information Form, is available through the System for Electronic Data Analysis and Retrieval + (SEDAR+) at www.sedarplus.ca .
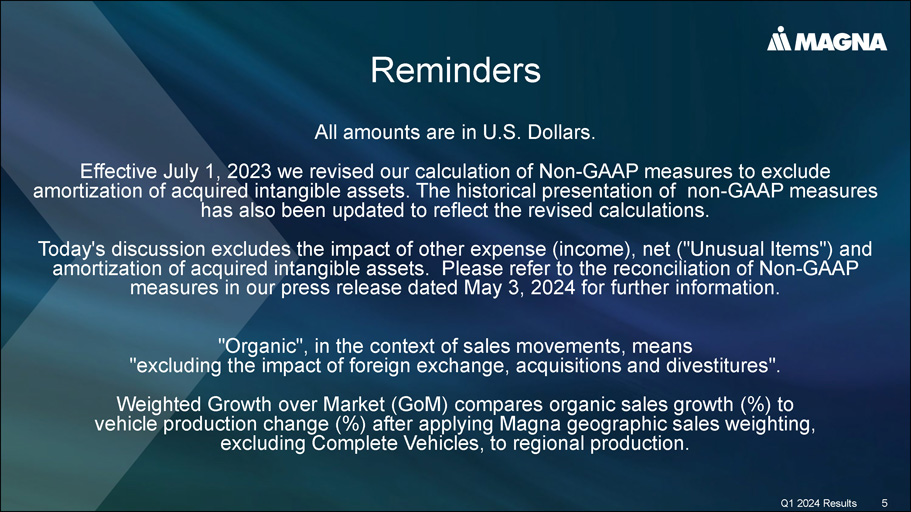
Reminders Q1 2024 Results 5 All amounts are in U.S. Dollars. Effective July 1, 2023 we revised our calculation of Non - GAAP measures to exclude amortization of acquired intangible assets. The historical presentation of non - GAAP measures has also been updated to reflect the revised calculations. Today's discussion excludes the impact of other expense (income), net ("Unusual Items") and amortization of acquired intangible assets. Please refer to the reconciliation of Non - GAAP measures in our press release dated May 3, 2024 for further information. "Organic", in the context of sales movements, means "excluding the impact of foreign exchange, acquisitions and divestitures". Weighted Growth over Market (GoM) compares organic sales growth (%) to vehicle production change (%) after applying Magna geographic sales weighting, excluding Complete Vehicles, to regional production.

Swamy Kotagiri Chief Executive Officer Q1 2024 Results 6
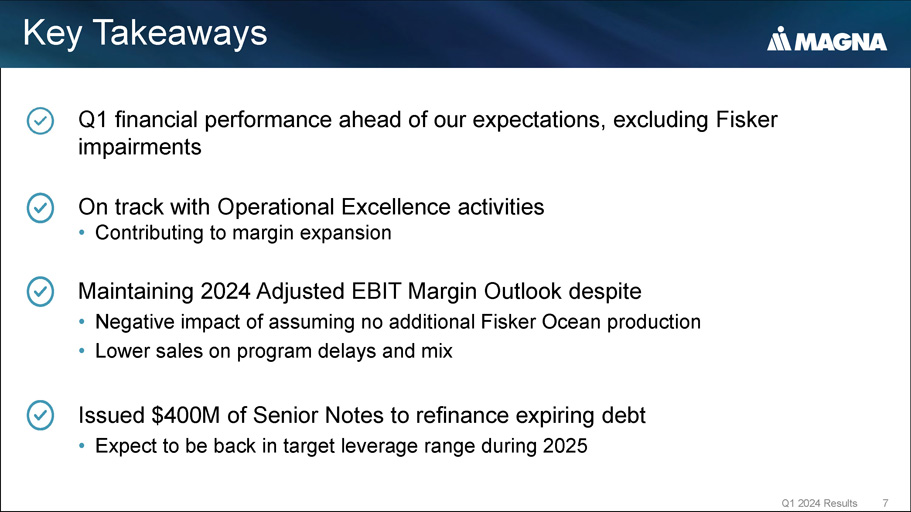
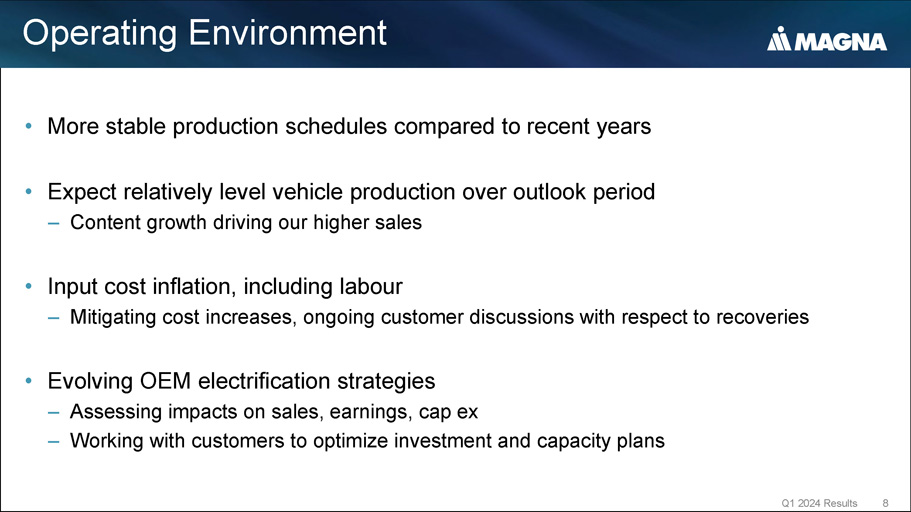
Q1 financial performance ahead of our expectations, excluding Fisker impairments On track with Operational Excellence activities • Contributing to margin expansion Maintaining 2024 Adjusted EBIT Margin Outlook despite • Negative impact of assuming no additional Fisker Ocean production • Lower sales on program delays and mix Issued $400M of Senior Notes to refinance expiring debt • Expect to be back in target leverage range during 2025 Key Takeaways Q1 2024 Results 7 • More stable production schedules compared to recent years • Expect relatively level vehicle production over outlook period – Content growth driving our higher sales • Input cost inflation, including labour – Mitigating cost increases, ongoing customer discussions with respect to recoveries • Evolving OEM electrification strategies – Assessing impacts on sales, earnings, cap ex – Working with customers to optimize investment and capacity plans Q1 2024 Results 8 Operating Environment
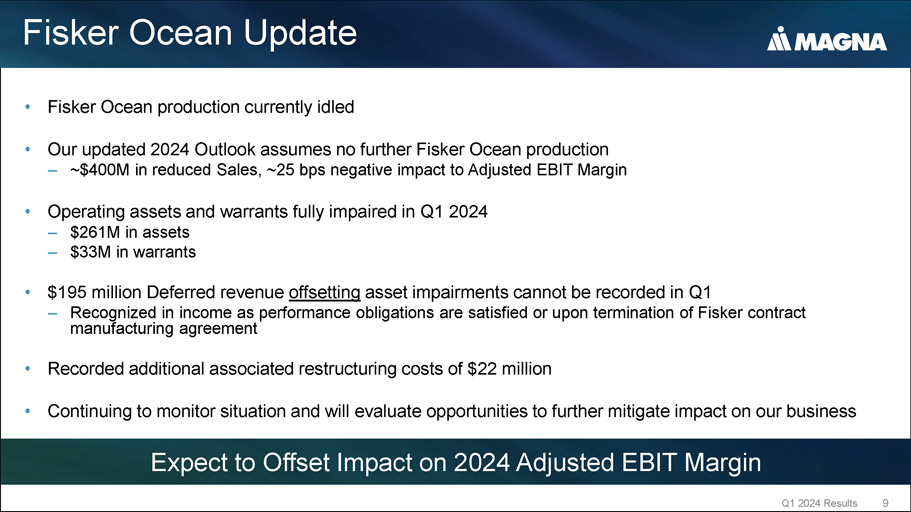
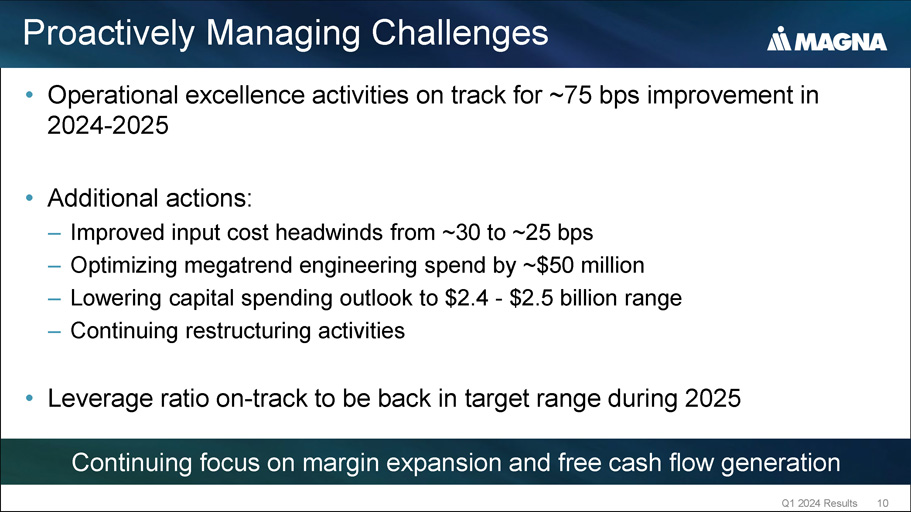
Fisker Ocean Update Q1 2024 Results 9 • Fisker Ocean production currently idled • Our updated 2024 Outlook assumes no further Fisker Ocean production – ~$400M in reduced Sales, ~25 bps negative impact to Adjusted EBIT Margin • Operating assets and warrants fully impaired in Q1 2024 – $261M in assets – $33M in warrants • $195 million Deferred revenue offsetting asset impairments cannot be recorded in Q1 – Recognized in income as performance obligations are satisfied or upon termination of Fisker contract manufacturing agreement • Recorded additional associated restructuring costs of $22 million • Continuing to monitor situation and will evaluate opportunities to further mitigate impact on our business Expect to Offset Impact on 2024 Adjusted EBIT Margin Proactively Managing Challenges Q1 2024 Results 10 • Operational excellence activities on track for ~75 bps improvement in 2024 - 2025 • Additional actions: – Improved input cost headwinds from ~30 to ~25 bps – Optimizing megatrend engineering spend by ~$50 million – Lowering capital spending outlook to $2.4 - $2.5 billion range – Continuing restructuring activities • Leverage ratio on - track to be back in target range during 2025 Continuing focus on margin expansion and free cash flow generation
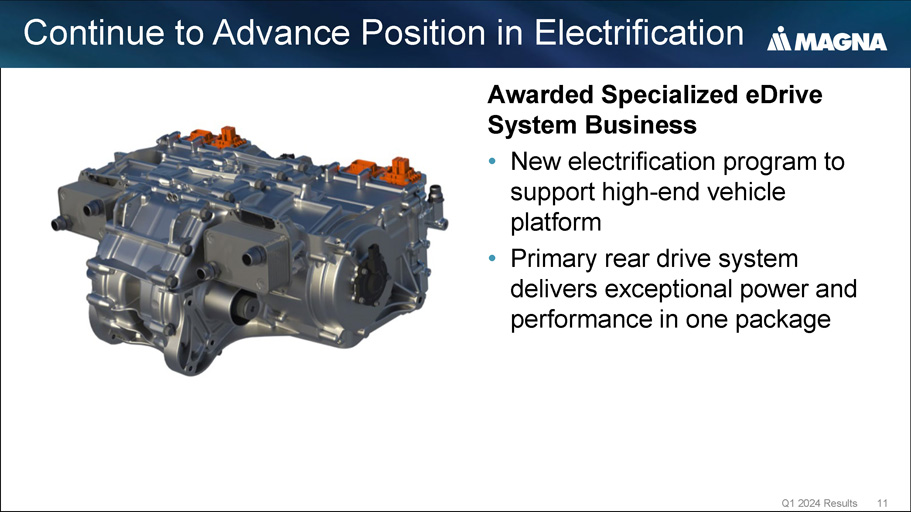
Awarded Specialized eDrive System Business • New electrification program to support high - end vehicle platform • Primary rear drive system delivers exceptional power and performance in one package Continue to Advance Position in Electrification Q1 2024 Results 11 Industry and Customer Recognition • 100+ Customer Awards annually • Launch and Quality Performance • Five GM 2023 Supplier of the Year Awards, across four product areas Magna Wins 2024 Automotive News Pace Award, Receives PACEpilot Recognitions Q1 2024 Results 12 Magna Earns Five 2023 Supplier of the Year Award from GM
Pat McCann Executive Vice President & Chief Financial Officer Q1 2024 Results 13
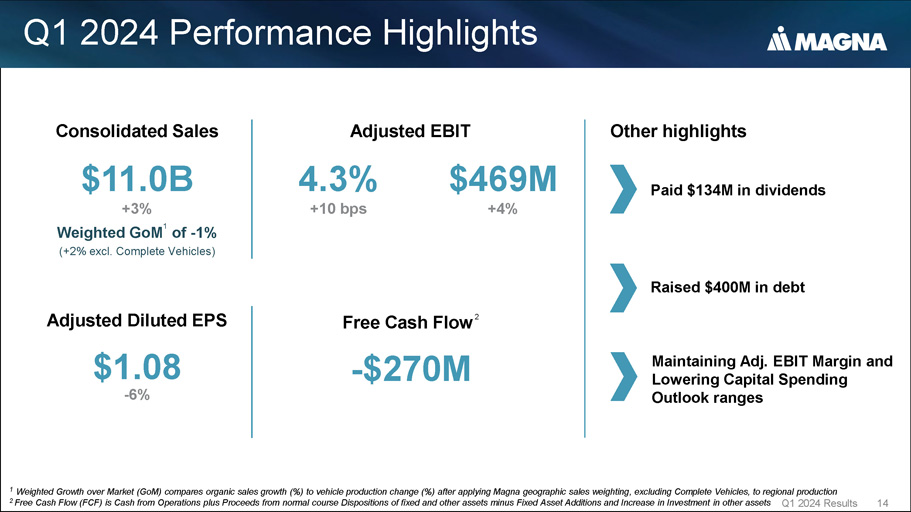
Q1 2024 Performance Highlights Q1 2024 Results 14 Consolidated Sales $11.0B +3% Weighted GoM 1 of - 1% (+2% excl. Complete Vehicles) Adjusted Diluted EPS $1.08 - 6% Free Cash Flow 2 - $270M 1 Weighted Growth over Market (GoM) compares organic sales growth (%) to vehicle production change (%) after applying Magna geographic sales weighting, excluding Complete Vehicles, to regional production 2 Free Cash Flow (FCF) is Cash from Operations plus Proceeds from normal course Dispositions of fixed and other assets minus Fixed Asset Additions and Increase in Investment in other assets Adjusted EBIT 4.3% +10 bps $469M +4% Other highlights Paid $134M in dividends Raised $400M in debt Maintaining Adj. EBIT Margin and Lowering Capital Spending Outlook ranges Q1 2024 Financial Results Q1 2024 Results 15 Weighted GoM 1 - 1% (+2% excl.
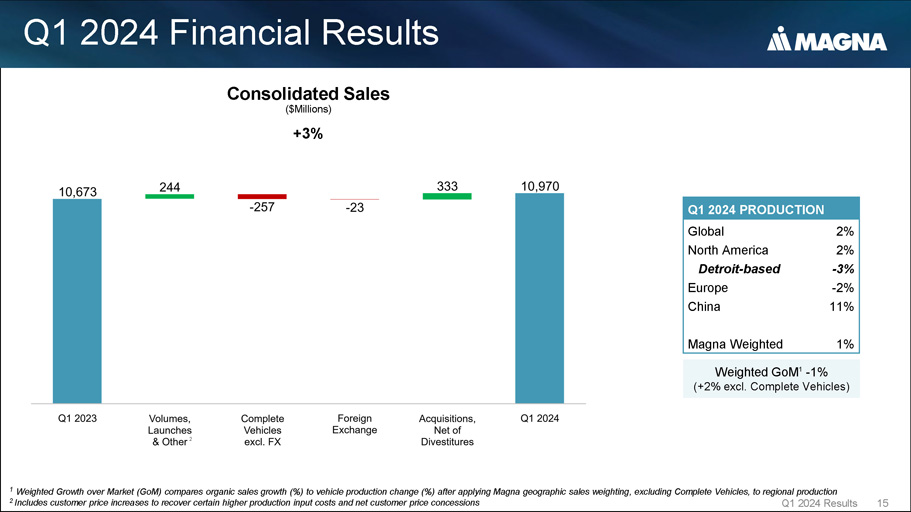
Complete Vehicles) Consolidated Sales ($Millions) +3% 2 Q1 2024 PRODUCTION 2% Global 2% North America - 3% Detroit - based - 2% Europe 11% China 1% Magna Weighted 1 Weighted Growth over Market (GoM) compares organic sales growth (%) to vehicle production change (%) after applying Magna geographic sales weighting, excluding Complete Vehicles, to regional production 2 Includes customer price increases to recover certain higher production input costs and net customer price concessions Q1 2024 Financial Results • Operational – Operational excellence activities • Non - recurring – Lower warranty – Gain on sale of equity - method investment • Higher net input costs (inflation) – Higher labour • Volumes & Other – Acquisitions, net of divestitures ( - ) – Lower earnings on lower assembly sales ( - ) – Earnings on higher component & system sales (+) – Net transactional foreign exchange gains (+) $469 Q1 2024 Results 16 $449 Adjusted EBIT & Margin ($Millions)

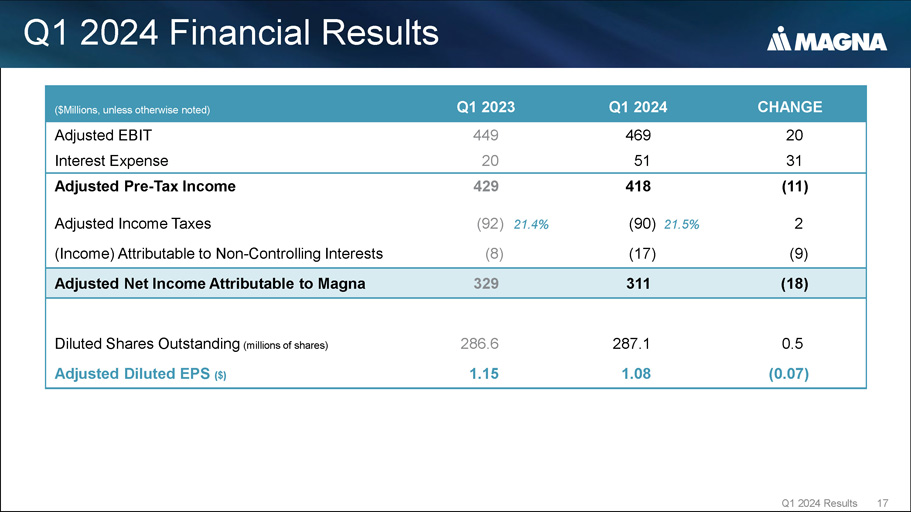
Q1 2024 Financial Results Q1 2024 Results 17 CHANGE Q1 2024 Q1 2023 ($Millions, unless otherwise noted) 20 469 449 Adjusted EBIT 31 51 20 Interest Expense (11) 418 429 Adjusted Pre - Tax Income 2 (90) 21.5% (92) 21.4% Adjusted Income Taxes (9) (17) (8) (Income) Attributable to Non - Controlling Interests (18) 311 329 Adjusted Net Income Attributable to Magna 0.5 287.1 286.6 Diluted Shares Outstanding (millions of shares) (0.07) 1.08 1.15 Adjusted Diluted EPS ($)
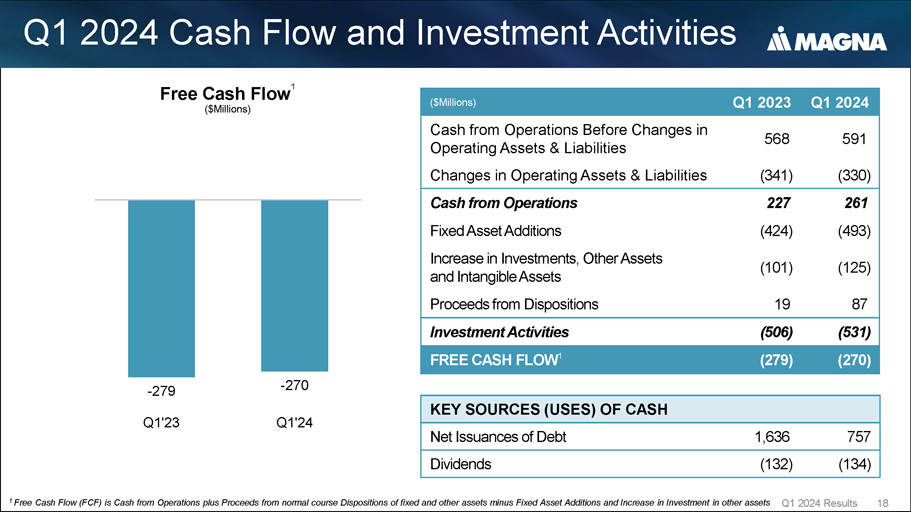
Q1 2024 Cash Flow and Investment Activities Free Cash Flow 1 ($Millions) KEY SOURCES (USES) OF CASH 757 1,636 Net Issuances of Debt (134) (132) Dividends Q1 2024 Q1 2023 ($Millions) 591 568 Cash from Operations Before Changes in Operating Assets & Liabilities (330) (341) Changes in Operating Assets & Liabilities 261 227 Cash from Operations (493) (424) Fixed Asset Additions (125) (101) Increase in Investments, Other Assets and Intangible Assets 87 19 Proceeds from Dispositions (531) (506) Investment Activities (270) (279) FREE CASH FLOW 1 - 279 1 Free Cash Flow (FCF) is Cash from Operations plus Proceeds from normal course Dispositions of fixed and other assets minus Fixed Asset Additions and Increase in Investment in other assets Q1 2024 Results 18 - 270 Q1'23 Q1'24 Continued Financial Strength ($Millions) LEVERAGE RATIO (LTM, 31MAR24) 8,049 Adjusted Debt 4,067 Adjusted EBITDA 1.98 Adjusted Debt / Adjusted EBITDA Adjusted Debt / Adjusted EBITDA (excl.
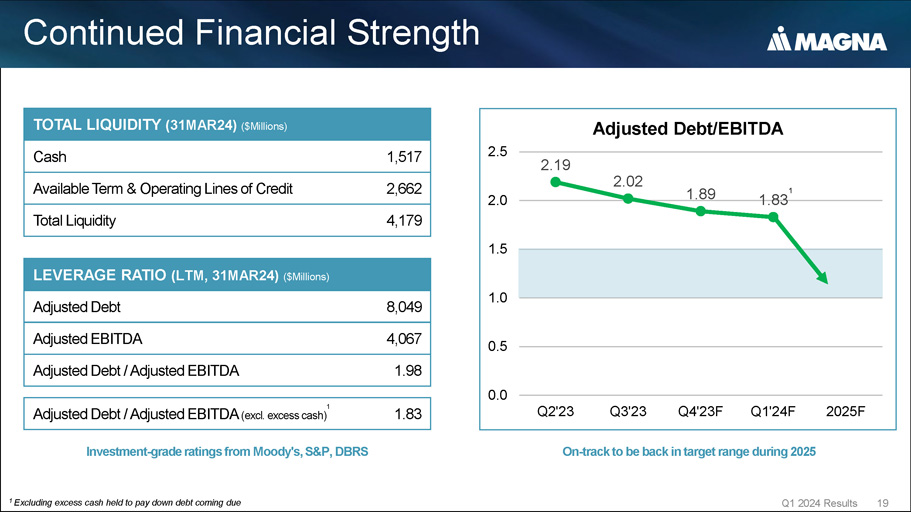
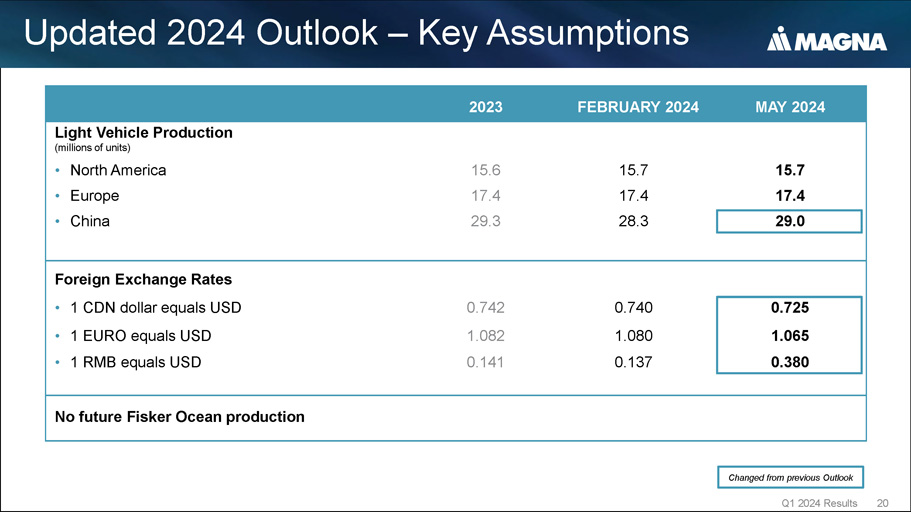
excess cash) 1 1.83 TOTAL LIQUIDITY (31MAR24) ($Millions) Cash 1,517 Available Term & Operating Lines of Credit 2,662 Total Liquidity 4,179 Investment - grade ratings from Moody's, S&P, DBRS 2.02 1.89 1.5 1.0 0.5 0.0 2.0 2.5 2.19 2025F Adjusted Debt/EBITDA Q2'23 Q3'23 Q4'23F Q1'24F On - track to be back in target range during 2025 1 Excluding excess cash held to pay down debt coming due Q1 2024 Results 19 1 1.83 Updated 2024 Outlook – Key Assumptions Q1 2024 Results 20 MAY 2024 FEBRUARY 2024 2023 Light Vehicle Production (millions of units) 15.7 15.7 15.6 • North America 17.4 17.4 17.4 • Europe 29.0 28.3 29.3 • China Foreign Exchange Rates 0.725 0.740 0.742 • 1 CDN dollar equals USD 1.065 1.080 1.082 • 1 EURO equals USD 0.380 0.137 0.141 • 1 RMB equals USD No future Fisker Ocean production Changed from previous Outlook

Updated 2024 Outlook Q1 2024 Results 21 MAY 2024 FEBRUARY 2024 2023 ($Billions, unless otherwise noted) 42.6 - 44.2 43.8 - 45.4 42.8 Total Sales 5.4% - 6.0% 5.4% - 6.0% 5.2% Adjusted EBIT Margin % 1 120M - 150M 120M - 150M 112M Equity Income ~230M ~230M 156M Interest Expense ~22% ~21% 21.0% Income Tax Rate 2 1.5 - 1.7 1.6 - 1.8 1.572 Adjusted Net Income Attributable to Magna 3 2.4 - 2.5 ~2.5 2.500 Capital Spending 0.6 - 0.8 0.6 - 0.8 0.209 Free Cash Flow 4 Maintaining EBIT Margin and Lowering Capital Spending Outlook 1 Adjusted EBIT Margin is the ratio of Adjusted EBIT to Total Sales 2 Income Tax Rate has been calculated using Adjusted EBIT and is based on current tax legislation 3 Adjusted Net Income Attributable to Magna represents Net Income excluding Other expense (income), net 4 Free Cash Flow (FCF) is Cash from Operations plus Proceeds from normal course Dispositions of fixed and other assets minus Fixed Asset Additions and Increase in Investment in other assets Changed from previous Outlook Updated 2024 Consolidated Sales Outlook Q1 2024 Results 22 ($Billions) 1 Includes Active Safety volume declines, program delays and customer in - sourcing, partially offset by higher sales in other areas.
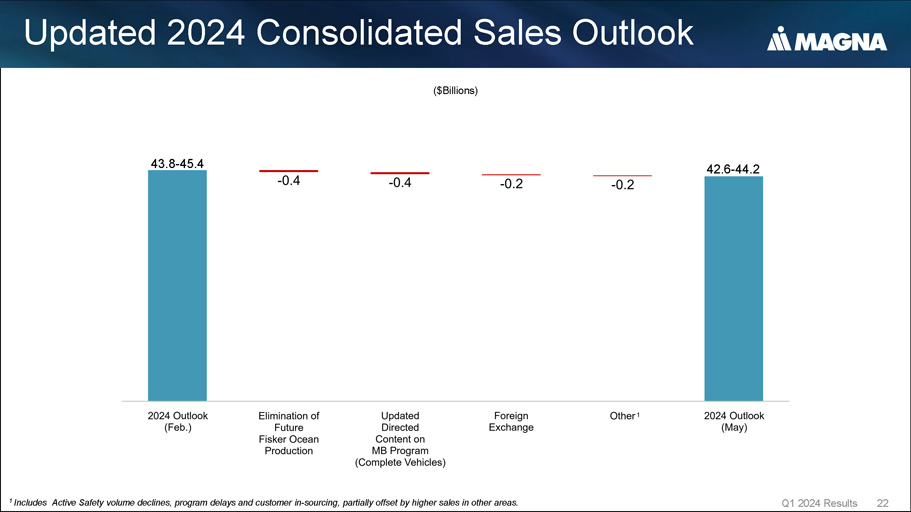
1 43.8 - 45.4 42.6 - 44.2
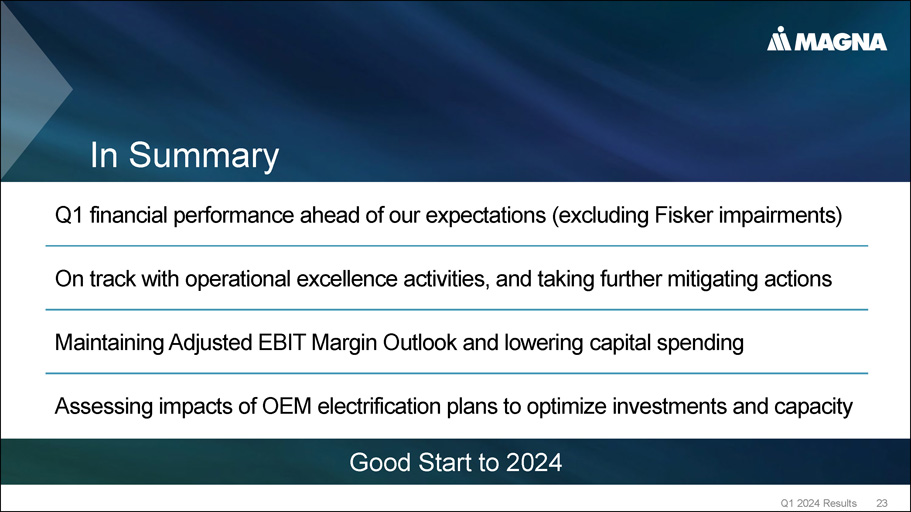
In Summary Q1 financial performance ahead of our expectations (excluding Fisker impairments) On track with operational excellence activities, and taking further mitigating actions Maintaining Adjusted EBIT Margin Outlook and lowering capital spending Assessing impacts of OEM electrification plans to optimize investments and capacity Good Start to 2024 Q1 2024 Results 23 Appendix – Q1 2024 Results Q1 2024 Results 26
Q1 2024 Results 25


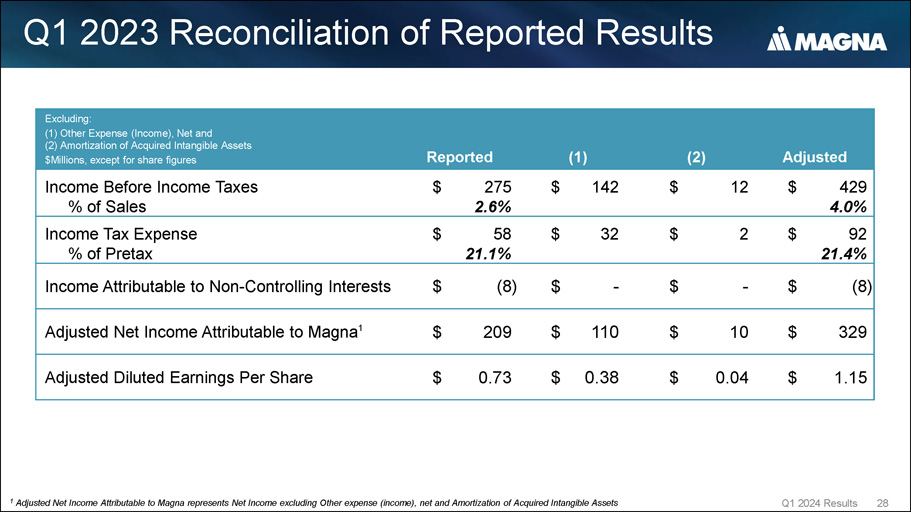
Q1 2024 Reconciliation of Reported Results 1 Adjusted Net Income Attributable to Magna represents Net Income excluding Other expense (income), net and Amortization of Acquired Intangible Assets Q1 2024 Results 27 Adjusted (2) (1) Reported Excluding: (1) Other Expense (Income), Net and (2) Amortization of Acquired Intangible Assets $Millions, except for share figures $ 418 3.8% $ 28 $ 356 $ 34 0.3% Income Before Income Taxes % of Sales $ 90 21.5% $ 6 $ 76 $ 8 23.5% Income Tax Expense % of Pretax $ (17) $ - $ - $ (17) Income Attributable to Non - Controlling Interests $ 311 $ 22 $ 280 $ 9 Adjusted Net Income Attributable to Magna 1 $ 1.08 $ 0.08 $ 0.97 $ 0.03 Adjusted Diluted Earnings Per Share Q1 2023 Reconciliation of Reported Results 1 Adjusted Net Income Attributable to Magna represents Net Income excluding Other expense (income), net and Amortization of Acquired Intangible Assets Q1 2024 Results 28 Adjusted (2) (1) Reported Excluding: (1) Other Expense (Income), Net and (2) Amortization of Acquired Intangible Assets $Millions, except for share figures $ 429 4.0% $ 12 $ 142 $ 275 2.6% Income Before Income Taxes % of Sales $ 92 21.4% $ 2 $ 32 $ 58 21.1% Income Tax Expense % of Pretax $ (8) $ - $ - $ (8) Income Attributable to Non - Controlling Interests $ 329 $ 10 $ 110 $ 209 Adjusted Net Income Attributable to Magna 1 $ 1.15 $ 0.04 $ 0.38 $ 0.73 Adjusted Diluted Earnings Per Share
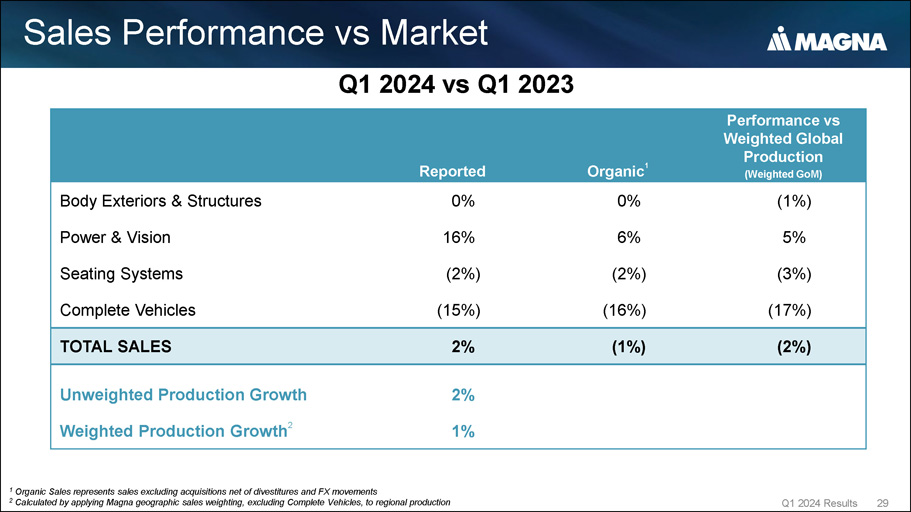
Sales Performance vs Market Q1 2024 Results 29 Performance vs Weighted Global Production (Weighted GoM) Organic 1 Reported (1%) 0% 0% Body Exteriors & Structures 5% 6% 16% Power & Vision (3%) (2%) (2%) Seating Systems (17%) (16%) (15%) Complete Vehicles (2%) (1%) 2% TOTAL SALES 2% 1% Unweighted Production Growth Weighted Production Growth 2 1 Organic Sales represents sales excluding acquisitions net of divestitures and FX movements 2 Calculated by applying Magna geographic sales weighting, excluding Complete Vehicles, to regional production Q1 2024 vs Q1 2023 Segment Impact on Adjusted EBIT % of Sales Q1 2024 Results 30 Adjusted EBIT as a Percentage of Sales Adjusted EBIT Sales ($Millions) 4.2% $ 449 $ 10,673 1 st Quarter of 2023 Increase (Decrease) Related to: 0.2% $ 26 $ (10) Body Exteriors & Structures (0.1%) $ 6 $ 519 Power & Vision 0.1% $ 15 $ (31) Seating Systems (0.1%) $ (25) $ (243) Complete Vehicles 0.0% $ (2) $ 62 Corporate and Other 4.3% $ 469 $ 10,970 1 st Quarter of 2024 Q1 2024 vs Q1 2023

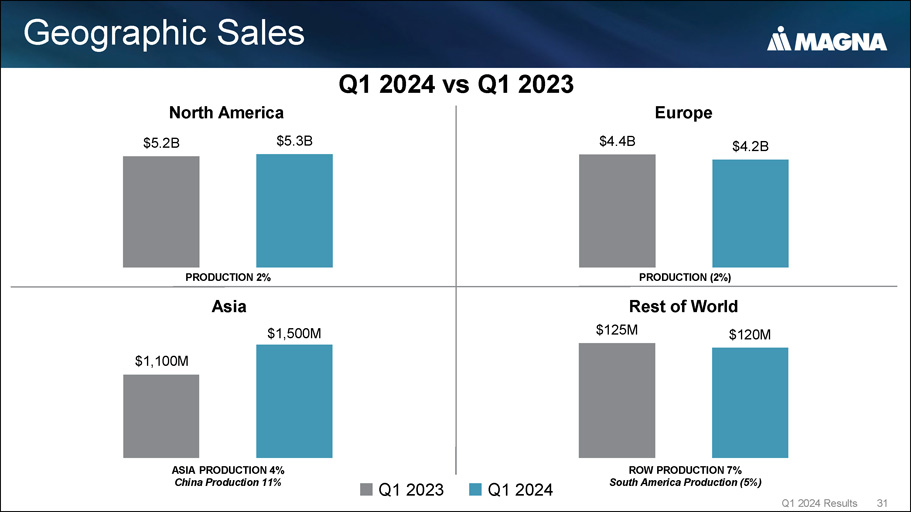
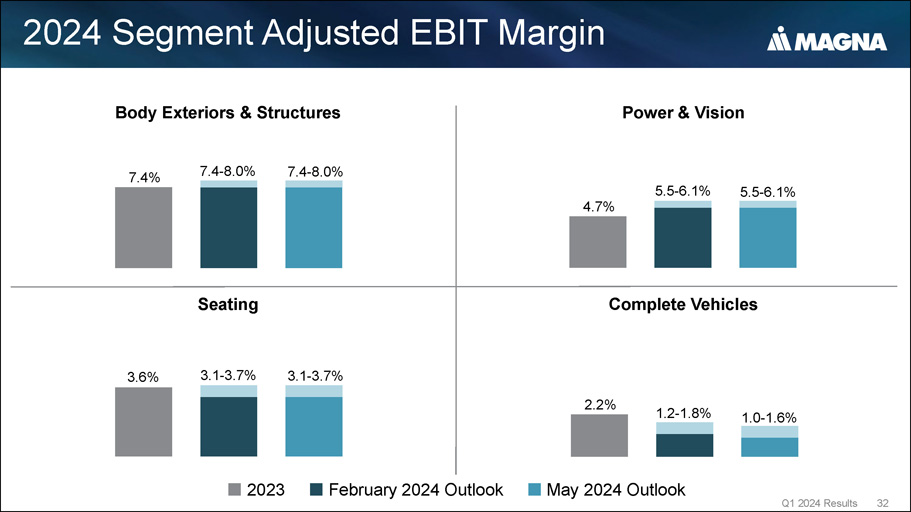
Geographic Sales Q1 2023 Q1 2024 Asia ASIA PRODUCTION 4% China Production 11% $5.2B $5.3B $4.4B $4.2B $1,100M $1,500M $125M Q1 2024 Results 31 $120M North America PRODUCTION 2% Europe PRODUCTION (2%) ROW PRODUCTION 7% South America Production (5%) Rest of World Q1 2024 vs Q1 2023 2024 Segment Adjusted EBIT Margin Body Exteriors & Structures 2023 February 2024 Outlook May 2024 Outlook 7.4% 7.4 - 8.0% 7.4 - 8.0% 3.6% 3.1 - 3.7% 3.1 - 3.7% 4.7% 5.5 - 6.1% 5.5 - 6.1% 2.2% Q1 2024 Results 32 1.2 - 1.8% 1.0 - 1.6% Seating Power & Vision Complete Vehicles
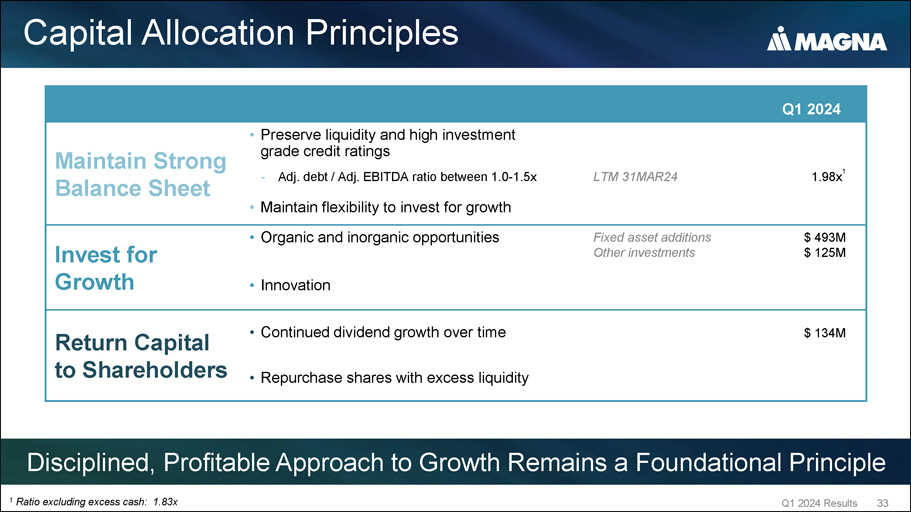
Capital Allocation Principles Q1 2024 Results 33 Disciplined, Profitable Approach to Growth Remains a Foundational Principle Q1 2024 1.98x 1 LTM 31MAR24 • Preserve liquidity and high investment Maintain Strong grade credit ratings Balance Sheet - Adj. debt / Adj. EBITDA ratio between 1.0 - 1.5x • Maintain flexibility to invest for growth $ 493M $ 125M Fixed asset additions Other investments • Organic and inorganic opportunities Invest for Growth • Innovation $ 134M Return Capital • Continued dividend growth over time to Shareholders • Repurchase shares with excess liquidity 1 Ratio excluding excess cash: 1.83x Leverage Ratio Q1 2024 Q1 2024 Results 34 ($Millions) $ 3,718 LTM EBITDA 349 Credit Rating Agency Adjustments $ 4,067 Adjusted EBITDA $ 7,924 Debt per Balance Sheet 125 Credit Rating Agency Adjustments $ 8,049 Adjusted Debt 1.98x Adjusted Debt / Adjusted EBITDA Ratio (Q1 2024) Adjusted Debt / Adjusted EBITDA Ratio (Q1 2024) – excluding excess cash 1.83x
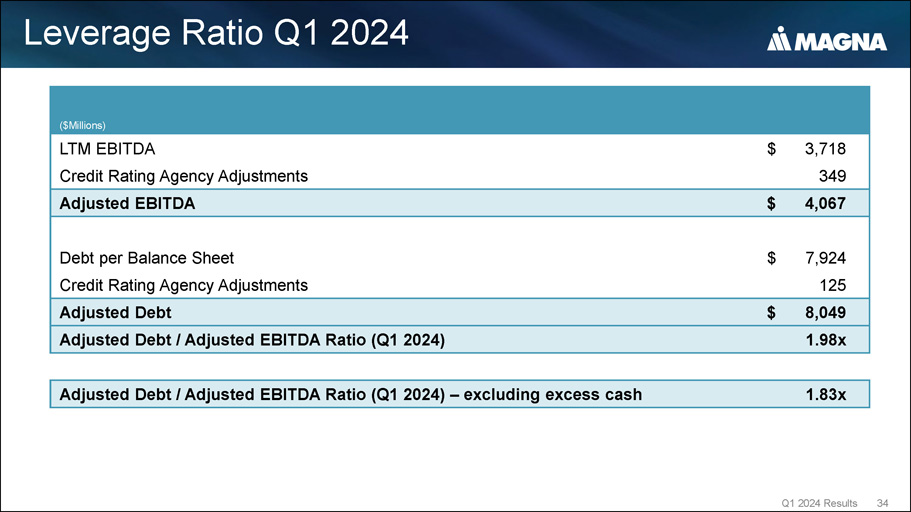
Exhibit 99.3

REFINITIV STREETEVENTS EDITED TRANSCRIPT MG.TO - Q1 2024 Magna International Inc Earnings Call EVENT DATE/TIME: MAY 03, 2024 / 12:00PM GMT REFINITIV STREETEVENTS | www.refinitiv.com | Contact Us ©2024 Refinitiv. All rights reserved. Republication or redistribution of Refinitiv content, including by framing or similar means, is prohibited without the prior written consent of Refinitiv. 'Refinitiv' and the Refinitiv logo are registered trademarks of Refinitiv and its affiliated companies.
MAY 03, 2024 / 12:00PM, MG.TO - Q1 2024 Magna International Inc Earnings Call CORPORATE PARTICIPANTS Louis Tonelli Magna International Inc. - VP of IR Patrick W. D. McCann Magna International Inc. - Executive VP & CFO Seetarama Swamy Kotagiri Magna International Inc. - CEO & Director CONFERENCE CALL PARTICIPANTS Colin M. Langan Wells Fargo Securities, LLC, Research Division - Senior Equity Analyst Dan Meir Levy Barclays Bank PLC, Research Division - Senior Analyst Itay Michaeli Citigroup Inc., Research Division - Director & Global Head of Autos Sector John Joseph Murphy BofA Securities, Research Division - MD and Lead United States Auto Analyst Joseph Robert Spak UBS Investment Bank, Research Division - Analyst Krista Friesen CIBC Capital Markets, Research Division - Director of Equity Research Mark Trevor Delaney Goldman Sachs Group, Inc., Research Division - Equity Analyst Michael W. Glen Raymond James Ltd., Research Division - MD & Equity Research Analyst Tamy Chen BMO Capital Markets Equity Research - Cannabis Analyst PRESENTATION Operator Thank you for standing by, and welcome to the Magna International First Quarter 2021 Results . (Operator Instructions) Finally, a reminder that this conference is being recorded . I would now like to turn the conference over to Louis Tonelli, Vice President of Investor Relations . Please go ahead . Louis Tonelli - Magna International Inc. - VP of IR Thank you, operator . Hello, everyone, and welcome to our conference call covering our first quarter 2024 . Joining me today are Swamy Kotagiri and Pat McCann . Yesterday, our Board of Directors met and approved our financial results for the first quarter of 2024 . We issued a press release this morning outlining our results . You'll find the press release, today's conference call webcast, the slide presentation to go along with the call and our updated quarterly financial review all in the Investor Relations section of our website at magna . com . Before we get started, just as a reminder, the discussion today may contain forward - looking information or forward - looking statements within the meaning of applicable securities legislation . Such statements involve certain risks, assumptions and uncertainties, which may cause the company's actual or future results and performance to be materially different from those expressed or implied in these statements . Please refer to today's press release for a complete description of our safe harbor disclaimer . Please also refer to our reminder slide included in our presentation that relates to our commentary today . With that, I'll pass it over to Swamy . 2 REFINITIV STREETEVENTS | www.refinitiv.com | Contact Us ©2024 Refinitiv. All rights reserved. Republication or redistribution of Refinitiv content, including by framing or similar means, is prohibited without the prior written consent of Refinitiv. 'Refinitiv' and the Refinitiv logo are registered trademarks of Refinitiv and its affiliated companies.
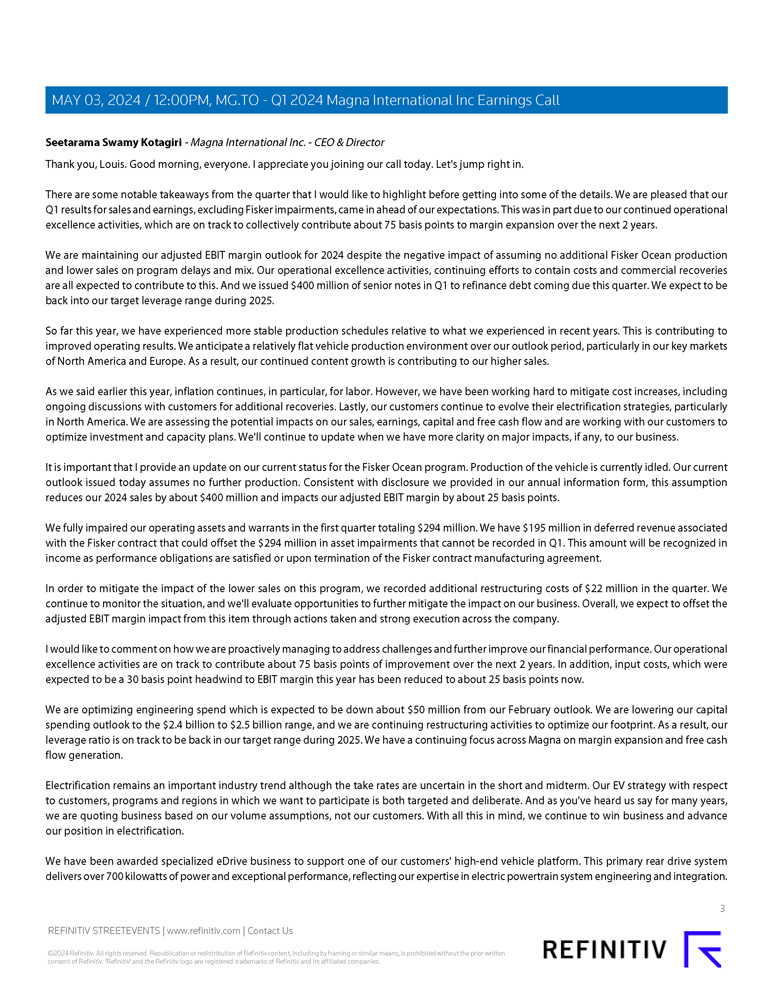
Seetarama Swamy Kotagiri - Magna International Inc . - CEO & Director Thank you, Louis . Good morning, everyone . I appreciate you joining our call today . Let's jump right in . There are some notable takeaways from the quarter that I would like to highlight before getting into some of the details . We are pleased that our Q 1 results for sales and earnings, excluding Fisker impairments, came in ahead of our expectations . This was in part due to our continued operational excellence activities, which are on track to collectively contribute about 75 basis points to margin expansion over the next 2 years . We are maintaining our adjusted EBIT margin outlook for 2024 despite the negative impact of assuming no additional Fisker Ocean production and lower sales on program delays and mix . Our operational excellence activities, continuing efforts to contain costs and commercial recoveries are all expected to contribute to this . And we issued $ 400 million of senior notes in Q 1 to refinance debt coming due this quarter . We expect to be back into our target leverage range during 2025 . So far this year, we have experienced more stable production schedules relative to what we experienced in recent years . This is contributing to improved operating results . We anticipate a relatively flat vehicle production environment over our outlook period, particularly in our key markets of North America and Europe . As a result, our continued content growth is contributing to our higher sales . As we said earlier this year, inflation continues, in particular, for labor . However, we have been working hard to mitigate cost increases, including ongoing discussions with customers for additional recoveries . Lastly, our customers continue to evolve their electrification strategies, particularly in North America . We are assessing the potential impacts on our sales, earnings, capital and free cash flow and are working with our customers to optimize investment and capacity plans . We'll continue to update when we have more clarity on major impacts, if any, to our business . It is important that I provide an update on our current status for the Fisker Ocean program . Production of the vehicle is currently idled . Our current outlook issued today assumes no further production . Consistent with disclosure we provided in our annual information form, this assumption reduces our 2024 sales by about $ 400 million and impacts our adjusted EBIT margin by about 25 basis points . We fully impaired our operating assets and warrants in the first quarter totaling $ 294 million . We have $ 195 million in deferred revenue associated with the Fisker contract that could offset the $ 294 million in asset impairments that cannot be recorded in Q 1 . This amount will be recognized in income as performance obligations are satisfied or upon termination of the Fisker contract manufacturing agreement . In order to mitigate the impact of the lower sales on this program, we recorded additional restructuring costs of $ 22 million in the quarter . We continue to monitor the situation, and we'll evaluate opportunities to further mitigate the impact on our business . Overall, we expect to offset the adjusted EBIT margin impact from this item through actions taken and strong execution across the company . I would like to comment on ho w we are proactively managing to address challenges and further improve our financial performance . Our operational excellence activities are on track to contribute about 75 basis points of improvement over the next 2 years . In addition, input costs, which were expected to be a 30 basis point headwind to EBIT margin this year has been reduced to about 25 basis points now . We are optimizing engineering spend which is expected to be down about $ 50 million from our February outlook . We are lowering our capital spending outlook to the $ 2 . 4 billion to $ 2 . 5 billion range, and we are continuing restructuring activities to optimize our footprint . As a result, our leverage ratio is on track to be back in our target range during 2025 . We have a continuing focus across Magna on margin expansion and free cash flow generation . Electrification remains an important industry trend although the take rates are uncertain in the short and midterm . Our EV strategy with respect to customers, programs and regions in which we want to participate is both targeted and deliberate . And as you've heard us say for many years, we are quoting business based on our volume assumptions, not our customers . With all this in mind, we continue to win business and advance our position in electrification . We have been awarded specialized eDrive business to support one of our customers' high - end vehicle platform . This primary rear drive system delivers over 700 kilowatts of power and exceptional performance, reflecting our expertise in electric powertrain system engineering and integration . MAY 03, 2024 / 12:00PM, MG.TO - Q1 2024 Magna International Inc Earnings Call 3 REFINITIV STREETEVENTS | www.refinitiv.com | Contact Us ©2024 Refinitiv. All rights reserved. Republication or redistribution of Refinitiv content, including by framing or similar means, is prohibited without the prior written consent of Refinitiv. 'Refinitiv' and the Refinitiv logo are registered trademarks of Refinitiv and its affiliated companies.
Lastly, before I pass the call over to Pat, I want to highlight recognitions received by Magna, which I am very proud of . Magna was named at 2024 Automotive News PACE Award winner, 1 of only 13 winners for our integrated driver and occupant monitoring system . We also received PACEpilot recognitions in seating for our EcoSphere 100 % Melt - Recyclable Foam and Trim and in exteriors for our Modular & Scalable Active Grill Shutter Assembly . Magna was the only company to receive both a PACE award and multiple recognitions for PACEpilot Innovation to Watch . And reflected in our ongoing commitment to operational excellence is the recognition we received from our customers . Typically, Magna receives more than 100 launch and quality awards from various global automakers around the world each year . Most recently, General Motors recognized Magna with 5 awards across 4 product areas . This brings our total to 30 GM Supplier of the Year awards over the last 5 years . With that, I'll pass the call over to Pat . Patrick W . D . McCann - Magna International Inc . - Executive VP & CFO Thanks, Swamy, and good morning, everyone . As Swamy indicated, we delivered solid first quarter earnings ahead of our expectations, excluding the Fisker impairments . Recall that we indicated on our February call that we expected our 2024 earnings to be lowest in the first quarter of the year . Now comparing the first quarter of 2024 to the first quarter of 2023 . Consolidated sales were $ 11 billion, up 3 % compared to a 2 % increase in global light vehicle production . Adjusted EBIT was $ 469 million and adjusted EBIT margin was up 10 basis points to 4 . 3 % . Adjusted EPS came in at $ 1 . 08 , down 6 % year - over - year primarily due to interest costs but ahead of our expectations . And free cash flow used in the quarter was $ 270 million compared to $ 279 million in the first quarter of 2023 . During the quarter, we paid dividends of $ 134 million . We also raised $ 400 million to repay debt coming due later this quarter . More importantly, with respect to our outlook, as Swamy noted, we are maintaining our adjusted EBIT margin range and lowering our capital spending range . Let me take you through some of the details . North American light vehicle production was up 2 % and China was up 11 % , while production in Europe declined 2 % , netting to a 2 % increase in global production . Breaking down North American production further, while overall production increased 2 % , production by our Detroit - based customers declined 3 % in the quarter . Our consolidated sales were $ 11 billion, up 3 % over the first quarter of 2023 . On an organic basis, our sales increased 1 % year - over - year for a minus 1 % growth over market in the first quarter, but plus 2 % growth over market, excluding complete vehicles . Once again, negative production mix in North America unfavorably impacted our year - over - year sales growth in the quarter . Our sales increase was primarily due to the launch of new programs, higher overall global vehicle production, the acquisition of Veoneer Active Safety and increases to recover certain higher input costs . These were largely offset by lower complete vehicle assembly volumes, the impact of foreign currency translation and normal course customer price givebacks . Adjusted EBIT was $ 469 million, and adjusted EBIT margin was 4 . 3 % compared to 4 . 2 % in Q 1 2023 . The higher EBIT percent in the quarter reflects approximately 40 basis points of operational items, the most significant of which relates to our operational activities, including improved results at underperforming operations, 30 basis points of nonrecurring items the most significant of which are lower warranty and a gain on the sale of a noncore equity method investment . These items were partially offset by higher net input costs, in particular for labor, which approximated 20 basis points and volume and other items, which collectively impacted us by about 40 basis points . These include acquisitions, which came in at lower margins than the corporate average, lower earnings on lower assembly sales, including as a result of the end of production of the BMW 5 Series, net of higher earnings on higher component and system sales as well as transactional foreign exchange gains . Interest expense increased, reflecting net debt raised last year as well as higher market rates on the new debt . Our adjusted effective income tax rate came in at 21 . 5 % , essentially in line with Q 1 of last year . Net income was $ 311 million compared to $ 329 million in Q 1 2023 , mainly reflecting higher adjusted EBIT, offset by higher interest expense and minority interest . Adjusted diluted EPS was $ 1 . 08 compared to $ 1 . 15 last year . MAY 03, 2024 / 12:00PM, MG.TO - Q1 2024 Magna International Inc Earnings Call 4 REFINITIV STREETEVENTS | www.refinitiv.com | Contact Us ©2024 Refinitiv. All rights reserved. Republication or redistribution of Refinitiv content, including by framing or similar means, is prohibited without the prior written consent of Refinitiv. 'Refinitiv' and the Refinitiv logo are registered trademarks of Refinitiv and its affiliated companies.
Turning to a review of our cash flows and investment activities . In the first quarter of 2024 , we generated $ 591 million in cash from operations before changes in working capital and invested $ 330 million in working capital . Investment activities in the quarter included $ 493 million for fixed assets and a $ 125 million increase in investments, other assets and intangibles . Overall, we used free cash flow of $ 270 million in Q 1 . We continue to return capital to shareholders . We paid $ 134 million in dividends in Q 1 . Our balance sheet continues to be strong with investment - grade ratings from the major credit rating agencies . At the end of Q 1 , we had over $ 4 billion in liquidity, including about $ 1 . 5 billion in cash . Currently, our adjusted debt to adjusted EBITDA ratio is up 1 . 83 , excluding excess cash held to pay down debt coming due this quarter . We anticipate a reduction of our leverage ratio, and we are on track to be within our targeted range during 2025 . Next, I will cover our updated outlook, which incorporates slightly higher - than - expected vehicle production in China, while our assumptions for production in North America and Europe are unchanged from our previous outlook . We also assume exchange rates in our outlook will approximate recent rates . We now expect a lower euro and Canadian dollar for 2024 and a slightly higher RMB all relative to our previous outlook . And as Swamy mentioned earlier, we are assuming no more production of the Fisker Ocean . We are reducing our expected sales range . Despite this, we are maintaining our EBIT margin outlook, reflecting our operational excellence efforts to contain cost and obtain commercial recoveries . We have increased our expected tax rate for 2024 from 21 % to 22 % , largely reflecting a change in the mix of earnings towards higher tax jurisdictions . As a result of reducing the range of our sales and the higher expected tax rate, we are reducing our range for net income . We now expect capital spending to be in the $ 2 . 4 billion to $ 2 . 5 billion range compared to approximately $ 2 . 5 billion in our February outlook . This mainly reflects revised program spending . And our interest expense, equity income and free cash flow expectations are all unchanged from our last outlook . Let me walk you through the change in our sales outlook from February to now . As we mentioned earlier, we have assumed no future production for the Fisker Ocean . Consistent with our previous communications of the 2024 impact, this reduced sales by about $ 400 million . We have received updated information on the amount of directed content on the new Mercedes G - Class assembly programs, which has reduced sales by about $ 400 million . Recall from our February outlook that we expected no dollar impact related to the sales change . Our updated FX rates resulted in about $ 200 million of lower sales and the remainder, including reduced active safety sales, partially offset by other amounts netted to about $ 200 million in lower sales in our outlook . In summary, we had solid financial performance in the first quarter, ahead of what we had expected, excluding the Fisker impairments . We are on track with our operational excellence activities and are taking further actions to mitigate impacts from lower expected sales . As a result, we are maintaining our adjusted EBIT margin outlook for 2024 . We're also lowering our capital spending expectations for the year . And we are assessing the impacts of OEM electrification plans on our business in order to optimize investments and capacity plans . All in all, a solid start to 2024 . Thanks for your attention, and we are more than happy to answer your questions . Operator? QUESTIONS AND ANSWERS Operator (Operator Instructions) And your first question comes from the line of John Murphy from Bank of America . John Joseph Murphy - BofA Securities, Research Division - MD and Lead United States Auto Analyst Just A couple of quick ones . First, on Power & Vision, the margins dropped pretty dramatically sequentially . I guess they're flat to slightly down year - over - year . And I think we've kind of gotten comfortable as we're exiting last year traveling maybe in the 5 % to 6 % range and maybe some upside over time . Was there anything specific or unique that happened in the quarter there? And how should we think about those margins as we MAY 03, 2024 / 12:00PM, MG.TO - Q1 2024 Magna International Inc Earnings Call 5 REFINITIV STREETEVENTS | www.refinitiv.com | Contact Us ©2024 Refinitiv. All rights reserved. Republication or redistribution of Refinitiv content, including by framing or similar means, is prohibited without the prior written consent of Refinitiv. 'Refinitiv' and the Refinitiv logo are registered trademarks of Refinitiv and its affiliated companies.
progress through the year and maybe even beyond? Because I think it was 2 . 6 % . It's far lower than we were at least modeling . Maybe we got something wrong . Seetarama Swamy Kotagiri - Magna International Inc. - CEO & Director John, this is Swamy . From the P&V sector perspective, there are a couple of things to note . First of all, fundamentally and basically, everything good . No surprises there other than what we talked in terms of volumes a little bit here and there . There is one specific program, which starts cadence in the second quarter and towards the second half of the year, which starts kicking in . The engineering spend decreased cadence starts also from the second quarter moving forward . Some recoveries on tooling and insulating recoveries as the programs launch also comes in the later part of the year . All said, just to give a little bit more color the way you asked and maybe helps modeling, as you look at the numbers today that we are showing for P&V is about 2 . 5 % . It's going to be definitely more than double as we see, and we are expecting in the second quarter and going forward . So that's the step change that we have planned, and we see going from this quarter into second quarter and onwards . John Joseph Murphy - BofA Securities, Research Division - MD and Lead United States Auto Analyst That's very helpful . And then just another question around the battery structures business . Obviously, there's pushing down and to the right and a lot of EV ramp launches and volumes . I'm just curious if you could talk about sort of the state of that business and if there's been any significant change in your expectations, potentially maybe even a slowdown in the capital deployed for that to be more measured with what might actually be happening in the market . Seetarama Swamy Kotagiri - Magna International Inc. - CEO & Director Yes . That's a very good question, John . I think as we've always said, wherever possible, we have always looked at phasing in capital . That was one . Second thing, looking at volumes that are our own set of assumptions rather than just take what is given . The third thing we mentioned last time is, in some cases, customer partially or fully funding capital . As you know, tooling is a normal course of business . But in specific programs on some of these products and programs, we have been asking and successful in some cases to get the customer to fund the capital partially or fully . All of those things help us mitigate . But on top of that, as we said, we are looking at just the overall -- whether it's investment in capital or on the engineering spend, we continue to look at it, and that's the reason for the guide on saying that the 2 . 5 % is more in the range of 2 . 4 % to 2 . 5 % . And as you know, there is a lot of volatility in volumes and how they're looking . So as we get a little bit more clarity, we'll continue to scrub the capital number even further . The engineering guide, we are able to say that we are reducing $ 50 million now, and we see that path, and we continue to scrub that even further . John Joseph Murphy - BofA Securities, Research Division - MD and Lead United States Auto Analyst Okay . That's very helpful . Just one other follow - up . On the $ 195 million of deferred revenue that you're carrying that should flow through at some point in the future, Pat, is there cost that will come in with that deferred revenue? And how should we think about that potential benefit over time? And is that kind of it now that you've kind of taken these charges for the Fisker Ocean? MAY 03, 2024 / 12:00PM, MG.TO - Q1 2024 Magna International Inc Earnings Call 6 REFINITIV STREETEVENTS | www.refinitiv.com | Contact Us ©2024 Refinitiv. All rights reserved. Republication or redistribution of Refinitiv content, including by framing or similar means, is prohibited without the prior written consent of Refinitiv. 'Refinitiv' and the Refinitiv logo are registered trademarks of Refinitiv and its affiliated companies.
Patrick W. D. McCann - Magna International Inc. - Executive VP & CFO Yes, that's correct, John . So effectively, we've written off 100 % of our Fisker assets . So what's left is the deferred revenue and depending on how the future plays out, that deferred revenue will come through income with no cost associated . John Joseph Murphy - BofA Securities, Research Division - MD and Lead United States Auto Analyst Is there an expectation as to -- will that be like over a couple of quarters? Or will that hit in one quarter? I'm just curious how that will roll because that's obviously -- it could be pretty meaningful to EBIT . Patrick W. D. McCann - Magna International Inc. - Executive VP & CFO It really depends on Fisker themselves, John, and how they move their business forward . It's really too early to tell . That's why under the accounting rules, we're not able to take it until we have clarity from Fisker themselves . Operator Your next question comes from the line of Tamy Chen from BMO Capital Markets . Tamy Chen - BMO Capital Markets Equity Research - Cannabis Analyst Just wanted to go back on the Power & Vision . So it sounds like this quarter, just some timing of those items . I'm just thinking going forward, Swamy, I know you said in Q 2 should be at least double, probably more than Q 1 . But should we think of them going forward will be kind of at that level? Or the timing of things like recoveries from launches could still cause some quarter - to - quarter volatility on the margin for Power & Vision? Seetarama Swamy Kotagiri - Magna International Inc. - CEO & Director I think you summarized it, the significant step change happens from Q 1 to Q 2 . And we expect improvement from there, but if the volumes change or there is launch deferment from the customers and so on, that's an extraneous event, right? And that could create some . But as we see in our plan today, it's a more smoother cadence from second quarter with improvements into the third and fourth . Patrick W. D. McCann - Magna International Inc. - Executive VP & CFO Yes . And keep in mind, our outlook for Power & Vision for the year is unchanged, right, 5 . 5 % to 6 . 1 % . So you do the math, it implies that pretty good second half as well as a good second quarter . Tamy Chen - BMO Capital Markets Equity Research - Cannabis Analyst Yes . Got it . Okay . And I just wanted to go back to the holding an EBIT margin, even though you've got some of those other puts like Fisker coming out . I wanted to go back on that . So are you saying versus your loss side, you found additional operating efficiencies? Or is it the customer recoveries are coming in more than you had anticipated the last time you were talking about guidance? MAY 03, 2024 / 12:00PM, MG.TO - Q1 2024 Magna International Inc Earnings Call 7 REFINITIV STREETEVENTS | www.refinitiv.com | Contact Us ©2024 Refinitiv. All rights reserved. Republication or redistribution of Refinitiv content, including by framing or similar means, is prohibited without the prior written consent of Refinitiv. 'Refinitiv' and the Refinitiv logo are registered trademarks of Refinitiv and its affiliated companies.
Patrick W. D. McCann - Magna International Inc. - Executive VP & CFO I think it's a combination of all of them, Tamy . When you look at a couple of the pieces, so you're correct . So we did -- when you go through the Fisker, the 25 % decrementals on the margin holds the offsets when you go through a bunch of them . We have Swamy mentioned, we're focusing on engineering, and that number is coming down in the range of about $ 50 million . That's part of it . We do have a benefit on inflationary headwinds net . We're seeing some relief on the energy costs in Europe . It was a hotter summer . And we're also seeing some benefit on the semiconductors . So that's about a 10 basis point benefit . And then when you have some of the other puts and takes, we have -- Swamy also mentioned in the P&V and part of driving that margin to the back half of the year, some of the commercial benefits we've negotiated as the PL reflected, and that benefit is going to flow through in the back part of the year as the programs launch . And then the last piece, which is a little bit unusual was the G - Wagen pricing at Steyr . We talked at about a 10 basis point impact in February . The bill of materials that we see from Mercedes continues to change, and our sales reduction with no EBIT impact is about $ 350 million . So that benefit on a basis point is 5 . And then just more broadly, our focus on CIs and improvements at underperformance is -- it's always been intense, but I would say it's even more intense with all the changes that we're seeing in the industry right now . Tamy Chen - BMO Capital Markets Equity Research - Cannabis Analyst Okay . And how should we think about, with respect to CapEx, do you think there's a possibility to further lower it? Or it's difficult just given there's some -- there's commitment aspects that you can't change, and this provision is kind of what we can expect for most of the year going forward? Seetarama Swamy Kotagiri - Magna International Inc. - CEO & Director So what you see, Tamy, lowering or bringing the range from a 2 . 5 % , approximately to 2 . 4 % to 2 . 5 % is based on the information that we have . And we continue the efforts . There's like you said, some capital that's already in place . And if there is a change in volumes, it becomes a commercial discussion . It doesn't mean we stop . But on the other hand, on unlaunched programs, with the change in volumes, there would be opportunity, obviously, to bring down capital . Operator Your next question comes from the line of Mark Delaney from Goldman Sachs . Mark Trevor Delaney - Goldman Sachs Group, Inc., Research Division - Equity Analyst Yes . I guess, first, I'd like to better understand what you're seeing in terms of customer production schedules regionally . I saw you left North America and Europe unchanged . You took up China but some of the other Tier 1 s have talked about recent volatility in Europe . We've heard some of the European OEMs about some more difficult 1 Q results . So would love to better understand what you may be seeing regionally, especially in Europe . Seetarama Swamy Kotagiri - Magna International Inc. - CEO & Director Mark, I think as you saw, there's not a significant change in our set of assumptions in volumes that I've talked about . We see a change in the mix maybe from one side from -- to the other . But the overall units, we don't see a significant change . I mean, one program to the other, there is a little bit ups and downs, but we don't see anything significantly different than what we are projecting . MAY 03, 2024 / 12:00PM, MG.TO - Q1 2024 Magna International Inc Earnings Call 8 REFINITIV STREETEVENTS | www.refinitiv.com | Contact Us ©2024 Refinitiv. All rights reserved. Republication or redistribution of Refinitiv content, including by framing or similar means, is prohibited without the prior written consent of Refinitiv. 'Refinitiv' and the Refinitiv logo are registered trademarks of Refinitiv and its affiliated companies.
Mark Trevor Delaney - Goldman Sachs Group, Inc., Research Division - Equity Analyst Okay . And another question for you, Swamy . I'm trying to better understand how Magna wants to support and sell the new market entrants in the future . Over the last couple of years, there was a lot of focus on maybe selling them for an Apple car . Of course, you had your experience with Fisker . But now we've also seen in China, right, we've got Xiaomi and Huawei . So what lessons has Magna learned with the Fisker business? And just better understand how Magna may try to partner and support those types of new market entrants, wherever they may be globally going forward, be it China, U . S . , Europe, et cetera . Seetarama Swamy Kotagiri - Magna International Inc. - CEO & Director As we sit and look back, right, even in the past, the process of how we look at the business and we take is the same . We look at the viability of the product, the financial strength at that point when we are looking at the customer and just the overall acceptance possibly to the best we can in terms of the product . It's no different than that . We look at all of those things and assess the risk factors . We still believe, as we look at Steyr and complete vehicle assembly with maybe just not the new entrants, I would rather say it's -- as the market consolidation happens, as the transition from ICE to EV happens in a long process . Some of the OEMs are looking at niche vehicles . Some of the regions are looking to enter into new regions . All of this play into putting the pieces of the puzzle together . That's how we look at it . It's no different than how we go about with every program . And we kind of look at some of the terms and conditions, which are very important . I think we talked in some cases, if it's an offshoot, do we have the guarantees from the parent company and what are the payment terms like all upfront payment of capital, number of days for payment and so on . It has been in place . I think it's -- we kind of give a more focused look on some of these companies that might be new . Operator Your next question comes from the line of Itay Michaeli from Citi . Itay Michaeli - Citigroup Inc., Research Division - Director & Global Head of Autos Sector Just on the first question, kind of going back to margins for the rest of the year . I was hoping you can give a little bit more color how you expect total company margin cadence the rest of the year? And maybe just as a point of clarification, is the deferred revenue assumed to be released in this year in the guidance? Patrick W. D. McCann - Magna International Inc. - Executive VP & CFO It's Pat . I'll cover the deferred revenue 1 first or guidance does not include any impact of deferred revenue . So the way it's being reflected is it's on the balance sheet at December of 2024 . On the cadence of margins, I think the cadence is, I would say, fairly similar to last year . When you think about what's happening in the industry, Swamy's gone through the P&V segment . But when you go by segment, I would say when you look at our BES segment, it's going to follow the similar pattern to what we have seen last year . We're seeing it's fairly consistent first half to second half . We have some improvements, but that's being driven primarily by recoveries of inflation . They tend to be clustered more in the back half of the year and then also some of the CI activities just as programs launch and get that benefit . When you look at the P&V segment, I think Swamy covered it in detail, but it's -- again, it's the inflation . They tend to come in the back part of the year, and that explains part of the delta from Q 4 of 2023 into Q 1 of 2024 . And then as Louis said, you can see the benefit as we come up into the back part of the year . MAY 03, 2024 / 12:00PM, MG.TO - Q1 2024 Magna International Inc Earnings Call 9 REFINITIV STREETEVENTS | www.refinitiv.com | Contact Us ©2024 Refinitiv. All rights reserved. Republication or redistribution of Refinitiv content, including by framing or similar means, is prohibited without the prior written consent of Refinitiv. 'Refinitiv' and the Refinitiv logo are registered trademarks of Refinitiv and its affiliated companies.
The other part of it is we -- as Swamy said, we do have some commercial pricing that kicks in, in the back part of the year . And then we talked about the $ 50 million engineering spend reduction . That's primarily coming through the P&V segment . Again, it sequentially gets better quarter - by - quarter and then again, the operational benefits as programs launch . So you see that benefit coming through in the back half of the year . Seating is pretty consistent . And I think on the complete vehicles, it's a Fisker issue that we've discussed . Seetarama Swamy Kotagiri - Magna International Inc. - CEO & Director And Pat, I think just to add a little bit more color like we did in P&V . If you look from a Q 1 to Q 2 , typically, we don't talk quarter - by - quarter . But just to give you a little bit color we see north of 5 % going into Q 2 and sequential going forward . Itay Michaeli - Citigroup Inc., Research Division - Director & Global Head of Autos Sector That's very helpful . And just a second question, and apologies if I missed it earlier, but can you talk a bit more about the active safety volume declines assumed in the guidance now? And any changes of your thinking for active safety over the next couple of years? Seetarama Swamy Kotagiri - Magna International Inc. - CEO & Director Yes . If you just look at the overall going into ' 26 and ' 27 , I would say it's not a material change . The volume change or the revenue change that we talked about in the short term in ' 24 , ' 25 is really related to program ramp trajectory being a little bit slower significantly, that is one . And some of the deferred launches, I would say, is the second aspect . And the third one is the in - sourcing of programs more specifically related to China . And as we look at that, we are obviously looking at the offset in terms of engineering and other spending in that, specifically in ADAS, but generally in P&V to keep our focus on getting to the megatrend profitability going forward . Operator Your next question comes from the line of Joseph Spak from UBS Securities . Joseph Robert Spak - UBS Investment Bank, Research Division - Analyst I guess to start, Swamy, you talked about some restructuring . We've seen a number of other suppliers also begin to really restructure, particularly more in Europe as the volumes there makes it seem like they're going to be potentially structurally lower . So I was wondering if you could just spend a couple of minutes talking a little bit more about how you feel about your footprint maybe very specifically in Europe also and how you're going to evaluate going forward restructuring opportunities . Seetarama Swamy Kotagiri - Magna International Inc. - CEO & Director Yes . I think it's a good question . With what's happening in the industry, for us, it's, I would say, normal course of business, right? Some of the reductions or optimization as you look at -- we are not really focused on just overall headcount reduction . I think the way I look at it is what is the cost structure of the business to be able to hit the margins that we're talking about . Part of that obviously means flexing direct labor in various locations, and we have been doing that over the last 6 months . So it's not a one - step change discussion for us . More specifically, if you are looking at a program like Fisker that we talked about, that type of restructuring is a little bit different . We have talked about certain divisions being restructured over the last year or so, and that is a normal course, and we are continuing to look at that . This is all part of the operational excellence activities that we generally look at, right, which is headcount reduction of overheads, SG&A . MAY 03, 2024 / 12:00PM, MG.TO - Q1 2024 Magna International Inc Earnings Call 10 REFINITIV STREETEVENTS | www.refinitiv.com | Contact Us ©2024 Refinitiv. All rights reserved. Republication or redistribution of Refinitiv content, including by framing or similar means, is prohibited without the prior written consent of Refinitiv. 'Refinitiv' and the Refinitiv logo are registered trademarks of Refinitiv and its affiliated companies.
Looking at more focus on continuous improvements, looking at recoveries, commercial discipline . All of this is how we are able to say we are offsetting the inflation headwinds by the 10 basis points that we talked about . We are talking about the capital discipline, that's how we are able to reduce the capital . We are looking at every engineering program and its relevance now and going forward, that's a reduction on the engineering spend . So I think it's all encompassing . I wouldn't say it's just focused on headcount . So again, this is all efforts towards margin expansion, and that's one of the reasons why we are able to keep the margin outlook for ' 24 , and we feel comfortable looking forward into ' 25 and ' 26 . Joseph Robert Spak - UBS Investment Bank, Research Division - Analyst Okay . And maybe just as a second question . Last quarter, you talked about an EV win in the Southern U . S . I was wondering if you could sort of provide an updated view from your perspective, given that there's obviously been a lot of noise in the market around that potential program . Seetarama Swamy Kotagiri - Magna International Inc. - CEO & Director Yes . Difficult to comment without the customers talking, right? We don't comment specifically on the programs . But as we get to a little bit more clarity, we'll start seeing what it means to CapEx and revenue going forward, we'll keep you posted . Joseph Robert Spak - UBS Investment Bank, Research Division - Analyst Have you changed any of your internal plans yet? Seetarama Swamy Kotagiri - Magna International Inc. - CEO & Director Not at this point to comment. Patrick W. D. McCann - Magna International Inc. - Executive VP & CFO I think certainly, Joe, just for perspective, we do an annual planning once per year on a 3 - year forward basis, and we're updating ' 24 . So I think it's a little premature to say we've updated weather out to ' 25 , ' 26 . We'll kick that off through the summer . Operator Your next question comes from the line of Dan Levy from Barclays. Dan Meir Levy - Barclays Bank PLC, Research Division - Senior Analyst I wanted to start first with a question on complete vehicles . Can you just give us a sense on the go - forward strategy across -- assuming the Fisker Ocean is no longer going to be in production and you no w have spare capacity, what is the process to get that capacity allocated to other automakers? What's the cost? What's the confidence that other automakers will take up that capacity and the timing around that? MAY 03, 2024 / 12:00PM, MG.TO - Q1 2024 Magna International Inc Earnings Call 11 REFINITIV STREETEVENTS | www.refinitiv.com | Contact Us ©2024 Refinitiv. All rights reserved. Republication or redistribution of Refinitiv content, including by framing or similar means, is prohibited without the prior written consent of Refinitiv. 'Refinitiv' and the Refinitiv logo are registered trademarks of Refinitiv and its affiliated companies.
Seetarama Swamy Kotagiri - Magna International Inc. - CEO & Director I think as we look at the current status, we are still looking at in 2024 producing roughly about 70 , 000 units or so . One of the key things that we have always talked about is the flexibility in the process to be able to and handle multiple volumes in the same line, whether it's ICE or EV or different types of vehicle segments . So that gives the, call it the speed to be able to change over and address as we get opportunities . But I think as you rightly said, one, we've got to first be clear from an obligations perspective of what capacity needs to be kept versus when it's released and how we can use it . All of that comes into the equation . There is multiple conversations on different customers, I would say, mature customers or new ideas . And we continue to look at that . So we've clearly indicated there is a, call it, a lull in the 2026 time frame . And this business is typically lumpy . So it's not very unnatural to have a low point and then get back to what we need to get to . That's what we are going through, but there's a lot of conversations on that topic to see how we can address the existing capacity . And like the total capacity is in the range of [ 1 50 , 1 60 ], roughly, right? And we are [ 70 ] there with a lot of conversations ongoing . Dan Meir Levy - Barclays Bank PLC, Research Division - Senior Analyst Is drop being looked at by other automakers as an opportunity to fill some of the EV value where maybe they have a bit more of an uncertain outlook, so it's more of a stop gap for them rather than dedicating their own capacity to it? Seetarama Swamy Kotagiri - Magna International Inc. - CEO & Director Yes . Like I said, a lot of conversations with different customers not just in terms of EV, but EV or ICE, sometimes it's volume leveling, sometimes it's varying discussion . So it's a combination of the two, it's not specific to EV . It's more open, again, going back to the ability that we have, the flexibility to do different models of the same line and be able to do that quickly . There is a whole bunch of conversations on that topic, yes . Dan Meir Levy - Barclays Bank PLC, Research Division - Senior Analyst Okay . Great . And then as a follow - up, wondering if you could just talk to, within the revenue base, the ICE versus EV split . I believe in the past, you made a comment that something like 20 % of your revenue is on EV programs of some sort . What is the trajectory of that? Are you seeing any softening in that -- are there offsets from better ICE? And then maybe you could just provide a quick comment on your DCT, which presumably benefiting from a better hybrid outlook? Seetarama Swamy Kotagiri - Magna International Inc. - CEO & Director Yes, I think there is 2 parts of the question . Generally, I would say, in the short term, if we look at ' 24 , obviously, different regions have different EV penetrations . And overall, as Magna, if you look at it, we would be aligned with the overall EV market to the global market in 2024 . And as we go out into the future years, we are more indexed in North America, as you know, 50 % of our sales is in North America roughly . So we might have a higher index of EV in North America . But if you look globally, I think further out is difficult to say as volumes are changing and we -- and as Pat said, as we go through the planning process, we'll come back and be able to give you a little bit more clarity on that . That's one part of it . So pretty aligned in the short term as we look out in the mid and long term, a little bit more index in North America, under indexed in China and Europe . But if you look at the DCT, I think the question you asked, there are certain programs where we have both sides of the equation . That means we are on the same platform supplying the ICE version, DCT or the hybrid DCT or the eDrive . MAY 03, 2024 / 12:00PM, MG.TO - Q1 2024 Magna International Inc Earnings Call 12 REFINITIV STREETEVENTS | www.refinitiv.com | Contact Us ©2024 Refinitiv. All rights reserved. Republication or redistribution of Refinitiv content, including by framing or similar means, is prohibited without the prior written consent of Refinitiv. 'Refinitiv' and the Refinitiv logo are registered trademarks of Refinitiv and its affiliated companies.
So if there is ups and downs on this, it will be neutral to us . It's a good thing . But it doesn't apply to all programs, obviously . So we do see, if the ICE continues, to have the volumes and have an uptick, we will see that in our DCT programs that we have . Operator Your next question is from the line of Krista Friesen from CIBC . Krista Friesen - CIBC Capital Markets, Research Division - Director of Equity Research I was wondering if you could just give us a little bit more detail on what the conversations are like with some of your customers who are maybe adjusting their EV strategies and if you're able to get any recoveries at all or if that's kind of out of the question and if that impacts how you structure kind of your contracts going forward . Seetarama Swamy Kotagiri - Magna International Inc. - CEO & Director Yes . For sure, the discussions are on . And in cases -- in some cases, we actually had the commercial recoveries already . Like I said at the beginning of my comments, in some cases, the OEMs are actually coming in with the capital upfront, which reduces the risk . In some cases, where we had a certain set of assumptions on volumes, and we had the capital invested, we had recoveries and those discussions continue going forward . We are also looking, as I said before, how we look at these programs, whether it's volume banding, whether it's in our front payments or at least have the framework to have a discussion given . All this said, more importantly, also, we have our own view of looking at what we think the volumes could be on the project, although we have to meet the customer requirements in the run rates and be ready to give that volumes, that's where -- how we think in terms of flexibility and modularity and all of that stuff . So it's managing that . So that's where a lot of this, call it, process knowledge and continuous improvement as well as the operational excellence planning comes into play . Patrick W. D. McCann - Magna International Inc. - Executive VP & CFO Sorry, I'll just add to that, Swamy . I think Krista, if you think about -- when we think about EVs, we have strategy depending on product group . So if you start thinking about higher capital type programs, whether it's a battery tray or a frame, we're making decisions now for the next 3 years . We're making decisions on Gen 2 , Gen 3 , and that's the history we've had on these capital - intensive products or highly - engineered products . So I think it's -- there's a lot of noise in the media right now about EVs, particularly in North America . But we're looking much longer than the next 3 - year time horizon, and we're making decisions based on our view of where the industry is going to be long term . And as Swamy said, EVs are coming, and it's a matter of picking the right platforms and the right customers . Operator Your next question comes from the line of Colin Langan from Wells Fargo . Colin M. Langan - Wells Fargo Securities, LLC, Research Division - Senior Equity Analyst I just wanted to follow up, make sure I fully capture all the changes in guidance . So on the sales side, at the midpoint, guidance has cut $ 1 . 2 billion . So that split $ 400 million for Fisker, $ 350 million is the G - Wagen which is just pass - through with no margin and then there's 450 - ish from launch delays . And then the EBIT cut at the midpoint was like $ 135 million, so about 100 - ish from the Fisker impact . Maybe if you have contributions on that $ 450 million of lost sales, that's maybe 20 % contribution, maybe $ 190 million, $ 90 million - ish maybe? And then the offsets to that are going to be about MAY 03, 2024 / 12:00PM, MG.TO - Q1 2024 Magna International Inc Earnings Call 13 REFINITIV STREETEVENTS | www.refinitiv.com | Contact Us ©2024 Refinitiv. All rights reserved. Republication or redistribution of Refinitiv content, including by framing or similar means, is prohibited without the prior written consent of Refinitiv. 'Refinitiv' and the Refinitiv logo are registered trademarks of Refinitiv and its affiliated companies.
$ 50 million in lower engineering and then the input cost, which I guess is 10 basis points or maybe $ 40 million - ish . Are those the main puts and takes that we should be thinking about? Patrick W. D. McCann - Magna International Inc. - Executive VP & CFO Let's just deal with the sales first, Colin it, if that's okay . So Fisker 400 - ish is correct, the G - Wagen, just pure flow - through is the $ 350 million you mentioned . The one on that number that I didn't hear was foreign exchange headwind of about $ 200 million, which should have a corporate average type margin, most likely . And so that adds those number -- those 3 numbers add up to the $ 950 million of the $ 1 . 2 billion . So your balance is $ 350 million - ish of delta -- $ 250 million, sorry . And that's a combination of volumes launches, offset in part by some of the delays we're seeing in the ADAS space, but at net - net . And then on the EBIT walk side, I think we talked so the G - Wagen, Fisker, we talked about the 25 basis point headwind . We have the pickup then on G - Wagen is about 5 basis points . We then talk about the benefit of about 10 basis points on the inflationary pieces . Engineering spend is the 50 Swamy had mentioned . And then we have some commercial pricing pickups in the back half that are going to flow through, which is in the range of about 20 basis points . So those are the big drivers . And then obviously, the offset is just the lower sales of the $ 250 million net . Colin M. Langan - Wells Fargo Securities, LLC, Research Division - Senior Equity Analyst Got it . That's very helpful to put it all together . Okay . And then just going back to the prior question about the EV programs because there was a very large paragraph in the release on those programs . Do you not have minimum contract commitments in your -- in some of these programs where if you don't hit certain volumes, you actually would be qualified to get some recovery . I don't know how common that is or if it's just hard to actually enforce those kinds of clauses ... Seetarama Swamy Kotagiri - Magna International Inc. - CEO & Director So Colin, it normally, we don't have minimum volume guarantees or volume guarantees, right? These are all discussions, like I said, in figuring out as we look at specific programs . But as normal course in the industry, we have a volume set and we work through that . There is risk and opportunity, but no guarantees . There is some in terms of like Pat talked about, like big (inaudible) investment, which is a discussion with the customer and more specific to those programs rather than a general rule . And some changes going forward -- sorry, some changes going forward as we look at these big programs and having conversations, but those are more exceptions than a rule . Operator Your next question comes from the line of Michael Glen from Raymond James . Michael W. Glen - Raymond James Ltd., Research Division - MD & Equity Research Analyst Swamy, first, can you give an update on the Veoneer acquisition, how it's tracking, how sales are tracking and your outlook for the programs there? Are they coming in as expected, the volumes? MAY 03, 2024 / 12:00PM, MG.TO - Q1 2024 Magna International Inc Earnings Call 14 REFINITIV STREETEVENTS | www.refinitiv.com | Contact Us ©2024 Refinitiv. All rights reserved. Republication or redistribution of Refinitiv content, including by framing or similar means, is prohibited without the prior written consent of Refinitiv. 'Refinitiv' and the Refinitiv logo are registered trademarks of Refinitiv and its affiliated companies.
Seetarama Swamy Kotagiri - Magna International Inc. - CEO & Director Yes . Michael, I think we talked about Veoneer . I think as we go forward, it's I would say, an integrated business into our own electronics business, so we see that as one . But understand your question . We talked about the $ 70 million plus in synergies on a run rate basis by end of 2025 . I can confirm that we are on track for it . It could be that . As we look at your question about the sales, we talked about the lower sales this year, but that's not specific to Veoneer . It is overall with program in - sourcing and some delays and some ramp - up trajectory being different . Going into ' 26 , we still feel comfortable with the overall projections . There is no material difference to what we've been talking about . So overall, pretty comfortable with how we are looking at it . Like I said, obviously, the sales drop that we see right now for various reasons, we are continuing to monitor and see what we can do in terms of investments and engineering spend and so on and so forth . Michael W. Glen - Raymond James Ltd., Research Division - MD & Equity Research Analyst Okay . And just to come back on the -- I think you're referring to -- you're referring to $ 50 million of reduced engineering . So is that specific to the megatrend spending amounts that we think about? Is that applied to the $ 1 . 2 billion of megatrend spending? Seetarama Swamy Kotagiri - Magna International Inc. - CEO & Director That's correct, Michael. And I would say it's largely to the megatrend areas, right? Significant, I would say. So yes, it is applied to the $1.2 billion. Michael W. Glen - Raymond James Ltd., Research Division - MD & Equity Research Analyst Okay . And then just on the balance of the megatrend spending, are you making an active assessment of that total amount? Should -- is there a potential that we think about further downward revisions on the megatrend spending in subsequent quarters? Seetarama Swamy Kotagiri - Magna International Inc. - CEO & Director Yes . It will be a little up and down, as you see . To answer your question, clearly, yes, we're constantly looking at it . We have been able to quantify the $ 50 million, but we won't stop there . We'll continue to look at it . The reason I'm saying it goes up and down a little is we have to look at the application that's being done on the programs that we have and continue to have and protect the future . Like Pat said, we are looking at this not for this year and next year, what does it mean for the long term of Magna that we have to keep an eye on for sure . But we are continuing to look at everything that's in place and how we can optimize it . So that's going to be a key focus area for us . Operator And that concludes our Q&A session. I would like to turn the conference back over to Swamy for closing remarks. Seetarama Swamy Kotagiri - Magna International Inc. - CEO & Director So thanks, everyone, for listening in today . As I said, we remain highly focused on flawless launches of new business, cost containment across the company and obtaining commercial recoveries, all of which should contribute to our roadmap of margin expansion and free cash flow generation . Thanks for listening, and have a great day. MAY 03, 2024 / 12:00PM, MG.TO - Q1 2024 Magna International Inc Earnings Call 15 REFINITIV STREETEVENTS | www.refinitiv.com | Contact Us ©2024 Refinitiv. All rights reserved. Republication or redistribution of Refinitiv content, including by framing or similar means, is prohibited without the prior written consent of Refinitiv. 'Refinitiv' and the Refinitiv logo are registered trademarks of Refinitiv and its affiliated companies.
Operator This concludes today's conference call. Enjoy the rest of your day. You may now disconnect. DISCLAIMER Refinitiv reserves the right to make changes to documents, content, or other information on this web site without obligation to notify any person of such changes . In the conference calls upon which Event Transcripts are based, companies may make projections or other forward - looking statements regarding a variety of items . Such forward - looking statements are based upon current expectations and involve risks and uncertainties . Actual results may differ materially from those stated in any forward - looking statement based on a number of important factors and risks, which are more specifically identified in the companies' most recent SEC filings . Although the companies may indicate and believe that the assumptions underlying the forward - looking statements are reasonable, any of the assumptions could prove inaccurate or incorrect and, therefore, there can be no assurance that the results contemplated in the forward - looking statements will be realized . THE INFORMATION CONTAINED IN EVENT TRANSCRIPTS IS A TEXTUAL REPRESENTATION OF THE APPLICABLE COMPANY'S CONFERENCE CALL AND WHILE EFFORTS ARE MADE TO PROVIDE AN ACCURATE TRANSCRIPTION, THERE MAY BE MATERIAL ERRORS, OMISSIONS, OR INACCURACIES IN THE REPORTING OF THE SUBSTANCE OF THE CONFERENCE CALLS . IN NO WAY DOES REFINITIV OR THE APPLICABLE COMPANY ASSUME ANY RESPONSIBILITY FOR ANY INVESTMENT OR OTHER DECISIONS MADE BASED UPON THE INFORMATION PROVIDED ON THIS WEB SITE OR IN ANY EVENT TRANSCRIPT . USERS ARE ADVISED TO REVIEW THE APPLICABLE COMPANY'S CONFERENCE CALL ITSELF AND THE APPLICABLE COMPANY'S SEC FILINGS BEFORE MAKING ANY INVESTMENT OR OTHER DECISIONS . © 2024 , Refinitiv . All Rights Reserved . MAY 03, 2024 / 12:00PM, MG.TO - Q1 2024 Magna International Inc Earnings Call 16 REFINITIV STREETEVENTS | www.refinitiv.com | Contact Us ©2024 Refinitiv. All rights reserved. Republication or redistribution of Refinitiv content, including by framing or similar means, is prohibited without the prior written consent of Refinitiv. 'Refinitiv' and the Refinitiv logo are registered trademarks of Refinitiv and its affiliated companies.