UNITED STATES
SECURITIES AND EXCHANGE COMMISSION
Washington, D.C. 20549
FORM 6-K
REPORT OF FOREIGN PRIVATE ISSUER PURSUANT TO RULE 13a-16 OR 15d-16 UNDER THE SECURITIES EXCHANGE ACT OF 1934
For the month of May 2024
Commission File Number: 001-14642
ING Groep N.V.
(Translation of registrant's name into English)
Bijlmerdreef 106
1102 CT Amsterdam
The Netherlands
(Address of principal executive office)
Indicate by check mark whether the registrant files or will file annual reports under cover of Form 20-F or Form 40-F.
Form 20-F [ X ] Form 40-F [ ]
On May 2, 2024, the Registrant issued a press release, a copy of which is attached hereto as Exhibit 99.1 and is incorporated herein by reference.
(c) Exhibit 99.1. Press release dated May 2, 2024
SIGNATURES
Pursuant to the requirements of the Securities Exchange Act of 1934, the registrant has duly caused this report to be signed on its behalf by the undersigned, thereunto duly authorized.
| ING Groep N.V. | ||
| (Registrant) | ||
| Date: May 2, 2024 | /s/ Raymond Vermeulen | |
| Raymond Vermeulen | ||
| Head of External Communications & Media Relations | ||
EXHIBIT 99.1
Press release ING Corporate Communications Amsterdam, 2 May 2024 ING posts 1Q2024 net result of €1,578 million, with strong commercial performance 1Q2024 profit before tax of €2,293 million; 4 - quarter rolling return on equity of 14.8% on higher CET1 ratio of 14.8% • Net interest income from lending and liabilities remains strong • Double - digit growth in fee income, with strong contributions from both Retail and Wholesale Banking • Increase of 99,000 primary customers, net core deposits growth of €13.5 billion and net core lending growth of €4.2 billion while keeping our focus on capital efficiency • €2.5 billion share buyback as we continue to align our capital to our target level CEO statement “We had a very strong start to 2024 with good financial and commercial results as we executed on our strategy,” said ING CEO Steven van Rijswijk. “Our total income has remained strong and was boosted this quarter by double - digit fee income growth, with contributions from both Retail Banking and Wholesale Banking. Net interest income from lending and liabilities continued to be resilient. Operating expenses have declined due to lower regulatory costs, and our own costs were under control, while risk costs were again below the through - the - cycle - average. We have delivered very good results despite ongoing challenges in the geopolitical landscape. “We have added 99,000 primary customers this quarter, comprising new and existing customers who have chosen to have a payment account and at least one other product with us. This indicates their trust in us and demonstrates how we’re deepening existing customer relationships. This was also seen in the growth across customer lending, led by mortgages as we have helped more people to buy homes, and in the growth in customer deposits, mainly in Germany and Poland. “Fee income rose 11% compared with the same period last year and 14% from last quarter. Growth in Retail was driven by higher fee income for both daily banking and investment products. We have benefited from more customers choosing ING for their banking products and from increased package fees, as well as from growth in assets under management and in the number of brokerage trades. Fee income was strong for Global Capital Markets and for Lending in Wholesale. For example, ING was an active bookrunner on several of the largest euro - denominated corporate bonds placed this year. “We offer customers a superior experience across all our segments. In Business Banking, for example, we have launched a feature in the Netherlands that enables mobile onboarding for new clients. In Poland, we integrated a product offer page into ING Business Mobile, making it easier for customers to see solutions that can support the growth of their companies. And in Romania, we have expanded our instant lending proposition by introducing an instant overdraft product in addition to term loans, giving customers a complete offering. In Wholesale Banking, the ING InsideBusiness portal now includes a portfolio insights tool that saves clients time by giving them real - time insights into their lending portfolio. The pilot was successful and it is now being expanded to more clients and countries. “We also continued to support clients in their sustainability transitions, with the volume of sustainable finance mobilised rising 13% from the first quarter of last year to €24.7 billion. We have led a €7 billion syndicated facility for Switzerland’s largest provider of renewable energy, as well as the financing of a wind farm and battery energy storage system in Australia. These deals support our aim to triple our renewable energy financing by 2025, contributing to the transition to a low - carbon world. “We are working to expand our sustainability offerings in Retail Banking, in line with our ambition to offer sustainable alternatives for our main Retail products in all markets by 2025. In Poland, we have introduced a mortgage - linked renovation loan. This means that customers buying a poor energy - efficient home can receive additional funds for energy renovations, benefiting from discounted rates. This is important because meeting net - zero climate goals in housing is dependent on energy renovations of existing homes. “We continue to align our capital to our target level . And we are announcing a share buyback programme of € 2 . 5 billion . Our results confirm that we are a well - capitalised bank with strong earnings power, enabling us to navigate our global operating landscape confidently . I am proud of how ING has continued to make the difference by improving our customers’ experience and by working hard to put sustainability at the heart of what we do . This is how we add value for all of our stakeholders .

” Investor enquiries E: investor.relations@ing.com Press enquiries T: +31 (0)20 576 5000 E: media.relations@ing.com Analyst call 2 May 2024 at 9:00 am CET +31 20 708 5074 (NL) +44 330 551 0202 (UK) (Registration required via invitation) Live audio webcast at www.ing.com Media call 2 May 2024 at 11:00 am CET +31 20 708 5073 (NL) +44 330 551 0200 (UK) (Quote ING Media Call 1Q2024 when prompted by the operator) Live audio webcast at www.ing.com Primary customers 1) 15.4 mln +99,000 vs 4Q2023 Mobile - only customers 62% of total active customers vs 62% in 4Q2023 Net result €1,578 mln - 1% vs 1Q2023 Fee income €998 mln +11% vs 1Q2023 CET1 ratio 14.8% +0.1% vs 4Q2023 Return on equity (4 - qtr rolling avg) 14.8% stable vs 4Q2023 Customer experience NPS score: Ranked #1 in 4 of 10 Retail markets Primary customers 1) : +99,000 in 1Q2024 Sustainability Volume mobilised 2) : €24.7 bln in 1Q2024 vs €21.9 bln in 1Q2023 ING Press Release 1Q2024 2 Sustainability deals supported by ING: 156 in 1Q2024 vs 98 in 1Q2023 Business Highlights In the first quarter, our primary customer base grew by 99,000 to 15.4 million, mainly thanks to Germany. We are the number - one recommended bank in four of our 10 Retail markets, and customers voted ING the ‘most popular bank in Germany’ in a survey by €uro magazine for the 18th time in a row. Safety is an important element of our customers’ experience and therefore an area that we continuously work to improve. For example, in Spain, we implemented awareness messages in the app’s payment process to help our customers avoid scammers, leading to a 90% decrease in customer losses there. In the Netherlands, we launched a feature in our banking app that allows customers to immediately check whether a caller who contacts them is actually an ING employee. And in Poland, we added a feature called SmartGuard to our online risk process that shortens the system’s reaction to suspicious and fraudulent transactions to mere milliseconds. To improve the customer experience in Wholesale Banking, the ING InsideBusiness portal now includes a portfolio insights tool that saves clients time by giving them real - time insights into their lending portfolio and creates a one - stop - shop in our portal. This is especially valuable for clients that more actively use their revolving credit and/or trade product facilities, where quick insight into availability is a vital piece of information for the speed of doing business. The pilot was with 17 clients covering 113 entities and it’s now being expanded to more clients and selected countries in Eastern Europe and Asia. 1) Includes private individuals only 2) See our Annual Report for definition As we strive to put sustainability at the heart of our business, we continue to support clients in their transition to a low - carbon economy. In the first quarter we achieved a volume of sustainable finance mobilised of €24.7 billion, an increase of 13% from the same period last year, and we closed 156 sustainability transactions, 59% more than the first quarter last year. One example is the financing of five battery gigafactories across France, Germany and Italy, built and owned by Automotive Cell Company. ING and three other banks acted as underwriter of this €4.4 billion transaction. We had support from our Sustainable Value Chains team. They worked across the energy, transportation, logistics & automotive, financial markets and structured export finance teams. These gigafactories will produce the batteries that will go into electric cars. Achieving progress on net - zero climate goals in housing depends largely on energy renovations of existing homes, but such renovations can be challenging for homeowners. Therefore, next to sustainable mortgages, we’re also working to help connect customers with services to undertake sustainable home renovations. For example, in Germany, we started a pilot in the first quarter where customers can receive advice and connect to partners specialised in sustainable solutions such as heat pumps, solar panels, installation services, and subsidy advice. We released publications on human rights and nature that transparently outline our progress. For nature, we aim to help clients contribute to halting and reversing nature loss and are working to develop an approach to measure and steer our portfolio, just like we do for carbon emissions. On human rights, we reassessed the most salient potential issues regarding our workforce and Wholesale Banking business and update on our efforts to identify these in our Retail activities. Society is transitioning to a low - carbon economy . So are our clients, and so is ING . We finance a lot of sustainable activities, but we still finance more that’s not . Follow our progress on ing . com/ climate .
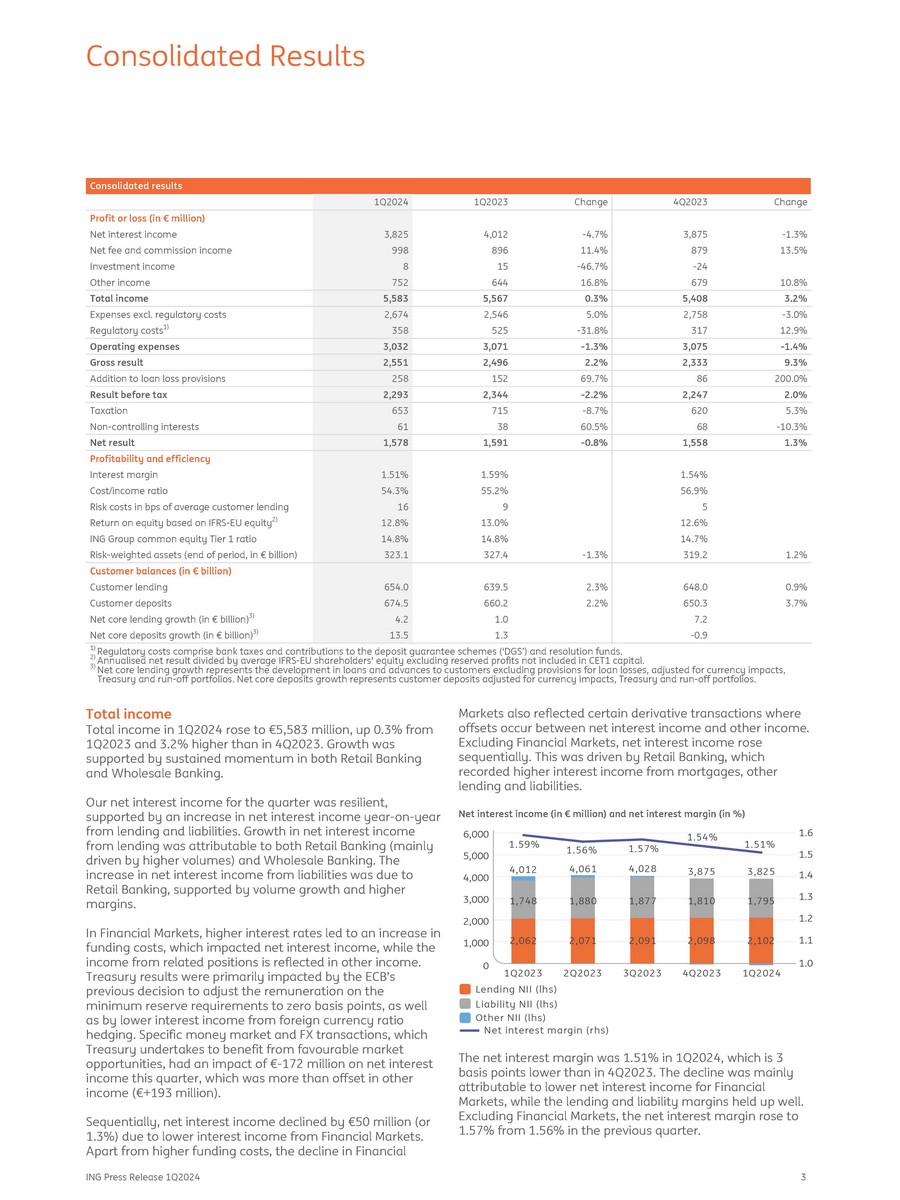
Consolidated results Change 4Q2023 Change 1Q2023 1Q2024 Profit or loss (in € million) - 1.3% 3,875 - 4.7% 4,012 3,825 Net interest income 13.5% 879 11.4% 896 998 Net fee and commission income - 24 - 46.7% 15 8 Investment income 10.8% 679 16.8% 644 752 Other income 3.2% 5,408 0.3% 5,567 5,583 Total income - 3.0% 2,758 5.0% 2,546 2,674 Expenses excl. regulatory costs 12.9% 317 - 31.8% 525 358 Regulatory costs 1) - 1.4% 3,075 - 1.3% 3,071 3,032 Operating expenses 9.3% 2,333 2.2% 2,496 2,551 Gross result 200.0% 86 69.7% 152 258 Addition to loan loss provisions 2.0% 2,247 - 2.2% 2,344 2,293 Result before tax 5.3% 620 - 8.7% 715 653 Taxation - 10.3% 68 60.5% 38 61 Non - controlling interests 1.3% 1,558 - 0.8% 1,591 1,578 Net result Profitability and efficiency 1.54% 1.59% 1.51% Interest margin 56.9% 55.2% 54.3% Cost/income ratio 5 9 16 Risk costs in bps of average customer lending 12.6% 13.0% 12.8% Return on equity based on IFRS - EU equity 2) 14.7% 14.8% 14.8% ING Group common equity Tier 1 ratio 1.2% 319.2 - 1.3% 327.4 323.1 Risk - weighted assets (end of period, in € billion) Customer balances (in € billion) 0.9% 648.0 2.3% 639.5 654.0 Customer lending 3.7% 650.3 2.2% 660.2 674.5 Customer deposits 7.2 1.0 4.2 Net core lending growth (in € billion) 3) - 0.9 1.3 13.5 Net core deposits growth (in € billion) 3) 1) Regulatory costs comprise bank taxes and contributions to the deposit guarantee schemes (‘DGS’) and resolution funds. 2) Annualised net result divided by average IFRS - EU shareholders' equity excluding reserved profits not included in CET1 capital. 3) Net core lending growth represents the development in loans and advances to customers excluding provisions for loan losses, adjusted for currency impacts, Treasury and run - off portfolios. Net core deposits growth represents customer deposits adjusted for currency impacts, Treasury and run - off portfolios. Total income Total income in 1Q2024 rose to €5,583 million, up 0.3% from 1Q2023 and 3.2% higher than in 4Q2023. Growth was supported by sustained momentum in both Retail Banking and Wholesale Banking. Our net interest income for the quarter was resilient, supported by an increase in net interest income year - on - year from lending and liabilities. Growth in net interest income from lending was attributable to both Retail Banking (mainly driven by higher volumes) and Wholesale Banking. The increase in net interest income from liabilities was due to Retail Banking, supported by volume growth and higher margins. In Financial Markets, higher interest rates led to an increase in funding costs, which impacted net interest income, while the income from related positions is reflected in other income. Treasury results were primarily impacted by the ECB’s previous decision to adjust the remuneration on the minimum reserve requirements to zero basis points, as well as by lower interest income from foreign currency ratio hedging. Specific money market and FX transactions, which Treasury undertakes to benefit from favourable market opportunities, had an impact of € - 172 million on net interest income this quarter, which was more than offset in other income (€+193 million). Sequentially, net interest income declined by €50 million (or 1.3%) due to lower interest income from Financial Markets. Apart from higher funding costs, the decline in Financial Markets also reflected certain derivative transactions where offsets occur between net interest income and other income. Excluding Financial Markets, net interest income rose sequentially. This was driven by Retail Banking, which recorded higher interest income from mortgages, other lending and liabilities. Net interest income (in € million) and net interest margin (in %) The net interest margin was 1.51% in 1Q2024, which is 3 basis points lower than in 4Q2023. The decline was mainly attributable to lower net interest income for Financial Markets, while the lending and liability margins held up well. Excluding Financial Markets, the net interest margin rose to 1.57% from 1.56% in the previous quarter. ING Press Release 1Q2024 3 Consolidated Results We recorded strong commercial growth in 1Q2024.
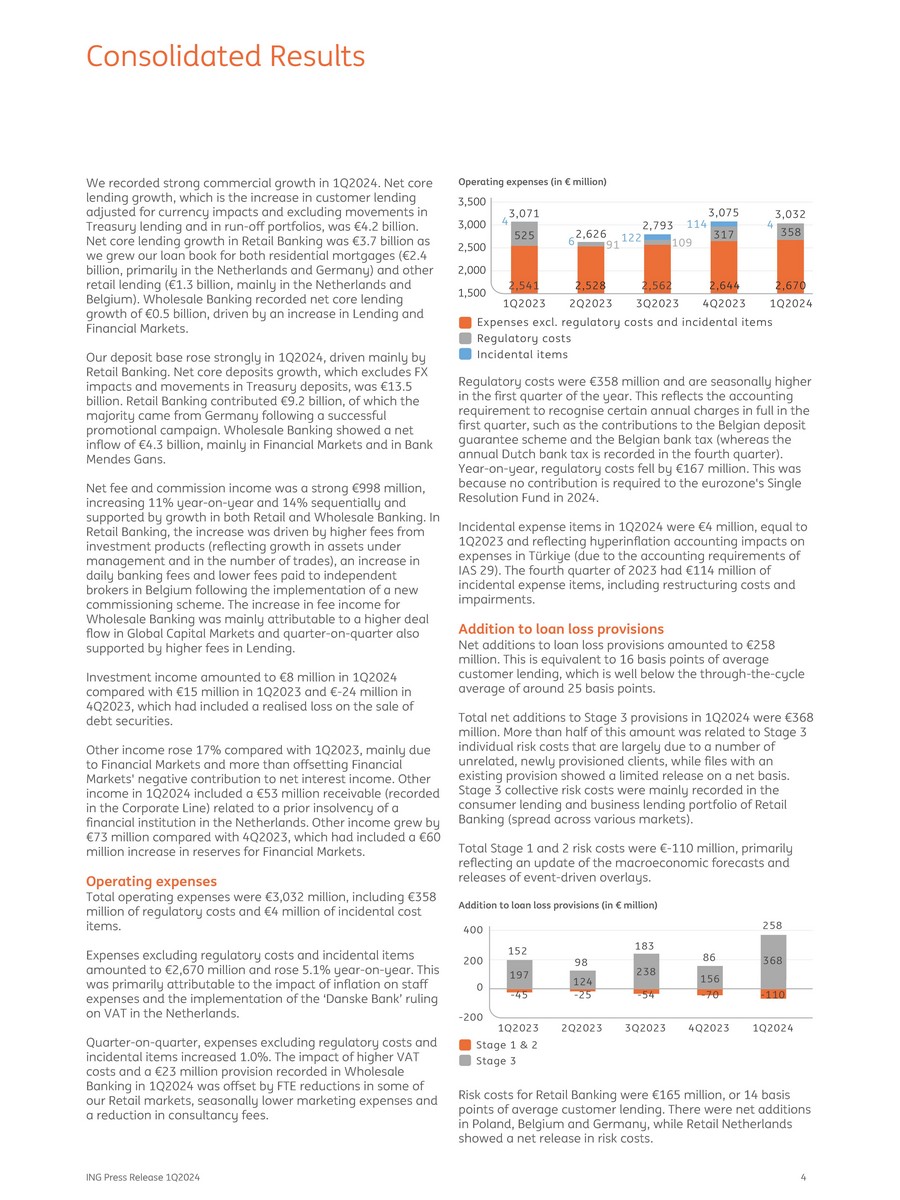
Net core lending growth, which is the increase in customer lending adjusted for currency impacts and excluding movements in Treasury lending and in run - off portfolios, was €4.2 billion. Net core lending growth in Retail Banking was €3.7 billion as we grew our loan book for both residential mortgages (€2.4 billion, primarily in the Netherlands and Germany) and other retail lending (€1.3 billion, mainly in the Netherlands and Belgium). Wholesale Banking recorded net core lending growth of €0.5 billion, driven by an increase in Lending and Financial Markets. Our deposit base rose strongly in 1Q2024, driven mainly by Retail Banking. Net core deposits growth, which excludes FX impacts and movements in Treasury deposits, was €13.5 billion. Retail Banking contributed €9.2 billion, of which the majority came from Germany following a successful promotional campaign. Wholesale Banking showed a net inflow of €4.3 billion, mainly in Financial Markets and in Bank Mendes Gans. Net fee and commission income was a strong €998 million, increasing 11% year - on - year and 14% sequentially and supported by growth in both Retail and Wholesale Banking. In Retail Banking, the increase was driven by higher fees from investment products (reflecting growth in assets under management and in the number of trades), an increase in daily banking fees and lower fees paid to independent brokers in Belgium following the implementation of a new commissioning scheme. The increase in fee income for Wholesale Banking was mainly attributable to a higher deal flow in Global Capital Markets and quarter - on - quarter also supported by higher fees in Lending. Investment income amounted to €8 million in 1Q2024 compared with €15 million in 1Q2023 and € - 24 million in 4Q2023, which had included a realised loss on the sale of debt securities. Other income rose 17% compared with 1Q2023, mainly due to Financial Markets and more than offsetting Financial Markets' negative contribution to net interest income. Other income in 1Q2024 included a €53 million receivable (recorded in the Corporate Line) related to a prior insolvency of a financial institution in the Netherlands. Other income grew by €73 million compared with 4Q2023, which had included a €60 million increase in reserves for Financial Markets. Operating expenses Total operating expenses were €3,032 million, including €358 million of regulatory costs and €4 million of incidental cost items. Expenses excluding regulatory costs and incidental items amounted to €2,670 million and rose 5.1% year - on - year. This was primarily attributable to the impact of inflation on staff expenses and the implementation of the ‘Danske Bank’ ruling on VAT in the Netherlands. Quarter - on - quarter, expenses excluding regulatory costs and incidental items increased 1.0%. The impact of higher VAT costs and a €23 million provision recorded in Wholesale Banking in 1Q2024 was offset by FTE reductions in some of our Retail markets, seasonally lower marketing expenses and a reduction in consultancy fees. Operating expenses (in € million) Regulatory costs were €358 million and are seasonally higher in the first quarter of the year. This reflects the accounting requirement to recognise certain annual charges in full in the first quarter, such as the contributions to the Belgian deposit guarantee scheme and the Belgian bank tax (whereas the annual Dutch bank tax is recorded in the fourth quarter). Year - on - year, regulatory costs fell by € 167 million . This was because no contribution is required to the eurozone's Single Resolution Fund in 2024 . Incidental expense items in 1Q2024 were €4 million, equal to 1Q2023 and reflecting hyperinflation accounting impacts on expenses in Türkiye (due to the accounting requirements of IAS 29). The fourth quarter of 2023 had €114 million of incidental expense items, including restructuring costs and impairments. Addition to loan loss provisions Net additions to loan loss provisions amounted to €258 million. This is equivalent to 16 basis points of average customer lending, which is well below the through - the - cycle average of around 25 basis points. Total net additions to Stage 3 provisions in 1Q2024 were €368 million. More than half of this amount was related to Stage 3 individual risk costs that are largely due to a number of unrelated, newly provisioned clients, while files with an existing provision showed a limited release on a net basis. Stage 3 collective risk costs were mainly recorded in the consumer lending and business lending portfolio of Retail Banking (spread across various markets). Total Stage 1 and 2 risk costs were € - 110 million, primarily reflecting an update of the macroeconomic forecasts and releases of event - driven overlays . Addition to loan loss provisions (in € million) Risk costs for Retail Banking were €165 million, or 14 basis points of average customer lending. There were net additions in Poland, Belgium and Germany, while Retail Netherlands showed a net release in risk costs. ING Press Release 1Q2024 4 Consolidated Results Wholesale Banking recorded €93 million of risk costs, or 20 basis points of average customer lending.

This included additions in Stage 3 for a number of unrelated files that were newly provisioned. These were partly offset by a net release in Stages 1 and 2, triggered by an update of the macroeconomic indicators and a reduction of overlays. Net result The net result in 1Q2024 was €1,578 million compared with €1,591 million in 1Q2023 and €1,558 million in the previous quarter. The effective tax rate in 1Q2024 was 28.5% compared with 30.5% in 1Q2023 and 27.6% in 4Q2023. Return on equity ING Group (in %) ING’s continued strong performance was reflected in a 12.8% return on average IFRS - EU equity in the first quarter. On a four - quarter rolling average basis, the return on average IFRS - EU equity remained high at 14.8%. ING’s return on equity is calculated using IFRS - EU shareholders' equity after excluding 'reserved profit not included in CET1 capital', which amounted to €3,319 million at the end of 1Q2024. This includes the final cash dividend over 2023 that will be paid out in May 2024 and 50% of the resilient net profit for 1Q2024, which has been reserved for distribution in line with our policy. Resilient net profit is defined as net profit adjusted for significant items that are not linked to the normal course of business. In line with this definition, and consistent with previous quarters, the impact of hyperinflation accounting has been excluded. Therefore, resilient net profit was €51 million higher than net profit in 1Q2024. 2024 Outlook 1) Based on current assumptions and scenarios, total income in 2024 to remain strong in a positive rate environment albeit somewhat lower than in 2023. Our aim is to increase fee income by 5 - 10%. Based on the current outlook, a total cost growth of around 3% (excluding incidental items) is foreseen. The CET1 ratio is expected to converge towards our ~12.5% target by 2025. Return on equity expected of >12%. ING Press Release 1Q2024 5 Consolidated Results 1) The targets, outlook and trends discussed in this 2024 Outlook section are forward - looking statements that are based on management’s current expectations and are subject to change, including as a result of the factors described under the section entitled ‘Important Legal Information’ in this document. ING assumes no obligation to publicly update or revise these forward - looking statements, whether as a result of new information or for any other reason.
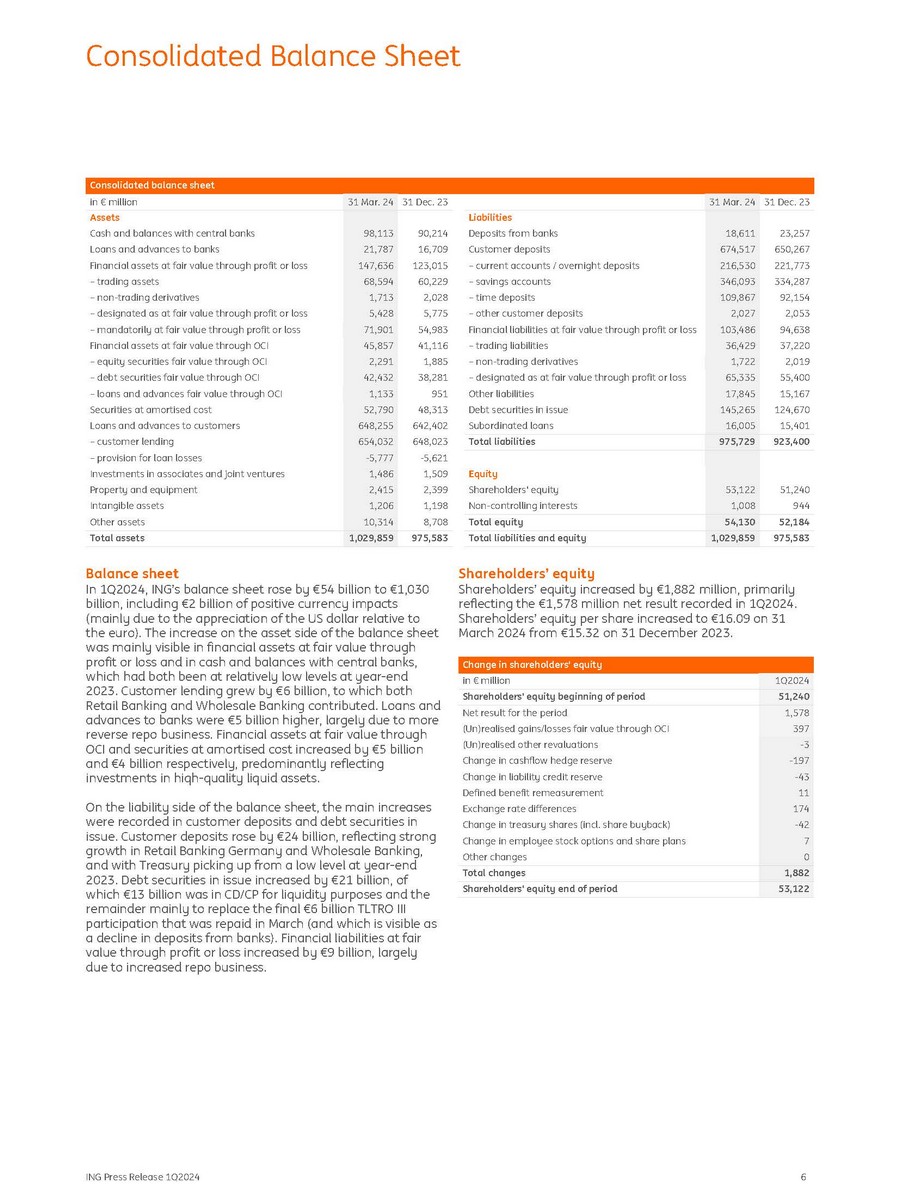
ING Press Release 1Q2024 6 Consolidated balance sheet 31 Dec. 23 31 Mar. 24 31 Dec. 23 31 Mar. 24 in € million Liabilities Assets 23,257 18,611 Deposits from banks 90,214 98,113 Cash and balances with central banks 650,267 674,517 Customer deposits 16,709 21,787 Loans and advances to banks 221,773 216,530 – current accounts / overnight deposits 123,015 147,636 Financial assets at fair value through profit or loss 334,287 346,093 – savings accounts 60,229 68,594 – trading assets 92,154 109,867 – time deposits 2,028 1,713 – non - trading derivatives 2,053 2,027 – other customer deposits 5,775 5,428 – designated as at fair value through profit or loss 94,638 103,486 Financial liabilities at fair value through profit or loss 54,983 71,901 – mandatorily at fair value through profit or loss 37,220 36,429 – trading liabilities 41,116 45,857 Financial assets at fair value through OCI 2,019 1,722 – non - trading derivatives 1,885 2,291 – equity securities fair value through OCI 55,400 65,335 – designated as at fair value through profit or loss 38,281 42,432 – debt securities fair value through OCI 15,167 17,845 Other liabilities 951 1,133 – loans and advances fair value through OCI 124,670 145,265 Debt securities in issue 48,313 52,790 Securities at amortised cost 15,401 16,005 Subordinated loans 642,402 648,255 Loans and advances to customers 923,400 975,729 Total liabilities 648,023 654,032 – customer lending - 5,621 - 5,777 – provision for loan losses Equity 1,509 1,486 Investments in associates and joint ventures 51,240 53,122 Shareholders' equity 2,399 2,415 Property and equipment 944 1,008 Non - controlling interests 1,198 1,206 Intangible assets 52,184 54,130 Total equity 8,708 10,314 Other assets 975,583 1,029,859 Total liabilities and equity 975,583 1,029,859 Total assets Balance sheet In 1Q2024, ING’s balance sheet rose by €54 billion to €1,030 billion, including €2 billion of positive currency impacts (mainly due to the appreciation of the US dollar relative to the euro). The increase on the asset side of the balance sheet was mainly visible in financial assets at fair value through profit or loss and in cash and balances with central banks, which had both been at relatively low levels at year - end 2023. Customer lending grew by €6 billion, to which both Retail Banking and Wholesale Banking contributed. Loans and advances to banks were €5 billion higher, largely due to more reverse repo business. Financial assets at fair value through OCI and securities at amortised cost increased by €5 billion and €4 billion respectively, predominantly reflecting investments in hiqh - quality liquid assets. On the liability side of the balance sheet, the main increases were recorded in customer deposits and debt securities in issue. Customer deposits rose by €24 billion, reflecting strong growth in Retail Banking Germany and Wholesale Banking, and with Treasury picking up from a low level at year - end 2023. Debt securities in issue increased by €21 billion, of which €13 billion was in CD/CP for liquidity purposes and the remainder mainly to replace the final €6 billion TLTRO III participation that was repaid in March (and which is visible as a decline in deposits from banks). Financial liabilities at fair value through profit or loss increased by €9 billion, largely due to increased repo business. Shareholders’ equity Shareholders’ equity increased by €1,882 million, primarily reflecting the €1,578 million net result recorded in 1Q2024. Shareholders’ equity per share increased to €16.09 on 31 March 2024 from €15.32 on 31 December 2023. Change in shareholders’ equity 1Q2024 in € million 51,240 Shareholders' equity beginning of period 1,578 Net result for the period 397 (Un)realised gains/losses fair value through OCI - 3 (Un)realised other revaluations - 197 Change in cashflow hedge reserve - 43 Change in liability credit reserve 11 Defined benefit remeasurement 174 Exchange rate differences - 42 Change in treasury shares (incl.
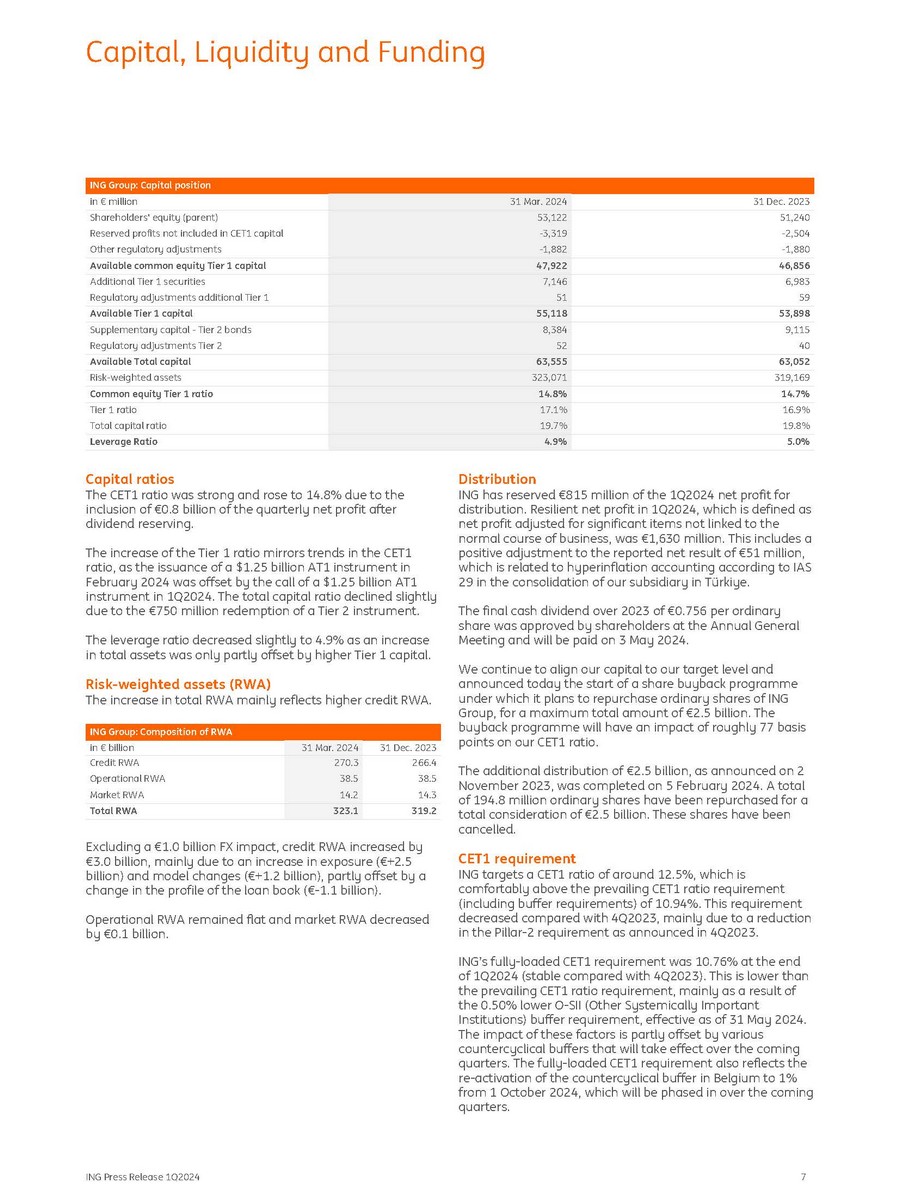
share buyback) 7 Change in employee stock options and share plans 0 Other changes 1,882 Total changes 53,122 Shareholders' equity end of period Consolidated Balance Sheet ING Group: Capital position 31 Dec. 2023 31 Mar. 2024 in € million 51,240 - 2,504 - 1,880 53,122 - 3,319 - 1,882 Shareholders' equity (parent) Reserved profits not included in CET1 capital Other regulatory adjustments 46,856 47,922 Available common equity Tier 1 capital 6,983 59 7,146 51 Additional Tier 1 securities Regulatory adjustments additional Tier 1 53,898 55,118 Available Tier 1 capital 9,115 8,384 Supplementary capital - Tier 2 bonds 40 52 Regulatory adjustments Tier 2 63,052 63,555 Available Total capital 319,169 323,071 Risk - weighted assets 14.7% 14.8% Common equity Tier 1 ratio 16.9% 17.1% Tier 1 ratio 19.8% 19.7% Total capital ratio 5.0% 4.9% Leverage Ratio Capital ratios The CET1 ratio was strong and rose to 14.8% due to the inclusion of €0.8 billion of the quarterly net profit after dividend reserving. The increase of the Tier 1 ratio mirrors trends in the CET1 ratio, as the issuance of a $1.25 billion AT1 instrument in February 2024 was offset by the call of a $1.25 billion AT1 instrument in 1Q2024. The total capital ratio declined slightly due to the €750 million redemption of a Tier 2 instrument. The leverage ratio decreased slightly to 4.9% as an increase in total assets was only partly offset by higher Tier 1 capital. Risk - weighted assets (RWA) The increase in total RWA mainly reflects higher credit RWA. ING Group: Composition of RWA ING Press Release 1Q2024 7 31 Dec. 2023 31 Mar. 2024 in € billion 266.4 270.3 Credit RWA 38.5 38.5 Operational RWA 14.3 14.2 Market RWA 319.2 323.1 Total RWA Excluding a €1.0 billion FX impact, credit RWA increased by €3.0 billion, mainly due to an increase in exposure (€+2.5 billion) and model changes (€+1.2 billion), partly offset by a change in the profile of the loan book (€ - 1.1 billion). Operational RWA remained flat and market RWA decreased by €0.1 billion. Distribution ING has reserved €815 million of the 1Q2024 net profit for distribution. Resilient net profit in 1Q2024, which is defined as net profit adjusted for significant items not linked to the normal course of business, was €1,630 million. This includes a positive adjustment to the reported net result of €51 million, which is related to hyperinflation accounting according to IAS 29 in the consolidation of our subsidiary in Türkiye. The final cash dividend over 2023 of €0.756 per ordinary share was approved by shareholders at the Annual General Meeting and will be paid on 3 May 2024. We continue to align our capital to our target level and announced today the start of a share buyback programme under which it plans to repurchase ordinary shares of ING Group, for a maximum total amount of €2.5 billion. The buyback programme will have an impact of roughly 77 basis points on our CET1 ratio. The additional distribution of €2.5 billion, as announced on 2 November 2023, was completed on 5 February 2024. A total of 194.8 million ordinary shares have been repurchased for a total consideration of €2.5 billion. These shares have been cancelled. CET1 requirement ING targets a CET1 ratio of around 12.5%, which is comfortably above the prevailing CET1 ratio requirement (including buffer requirements) of 10.94%. This requirement decreased compared with 4Q2023, mainly due to a reduction in the Pillar - 2 requirement as announced in 4Q2023. ING’s fully - loaded CET1 requirement was 10.76% at the end of 1Q2024 (stable compared with 4Q2023). This is lower than the prevailing CET1 ratio requirement, mainly as a result of the 0.50% lower O - SII (Other Systemically Important Institutions) buffer requirement, effective as of 31 May 2024. The impact of these factors is partly offset by various countercyclical buffers that will take effect over the coming quarters. The fully - loaded CET1 requirement also reflects the re - activation of the countercyclical buffer in Belgium to 1% from 1 October 2024, which will be phased in over the coming quarters. Capital, Liquidity and Funding MREL and TLAC requirements Minimum Required Eligible Liabilities (MREL) and Total Loss Absorbing Capacity (TLAC) requirements apply to ING Group at the consolidated level of the resolution group.
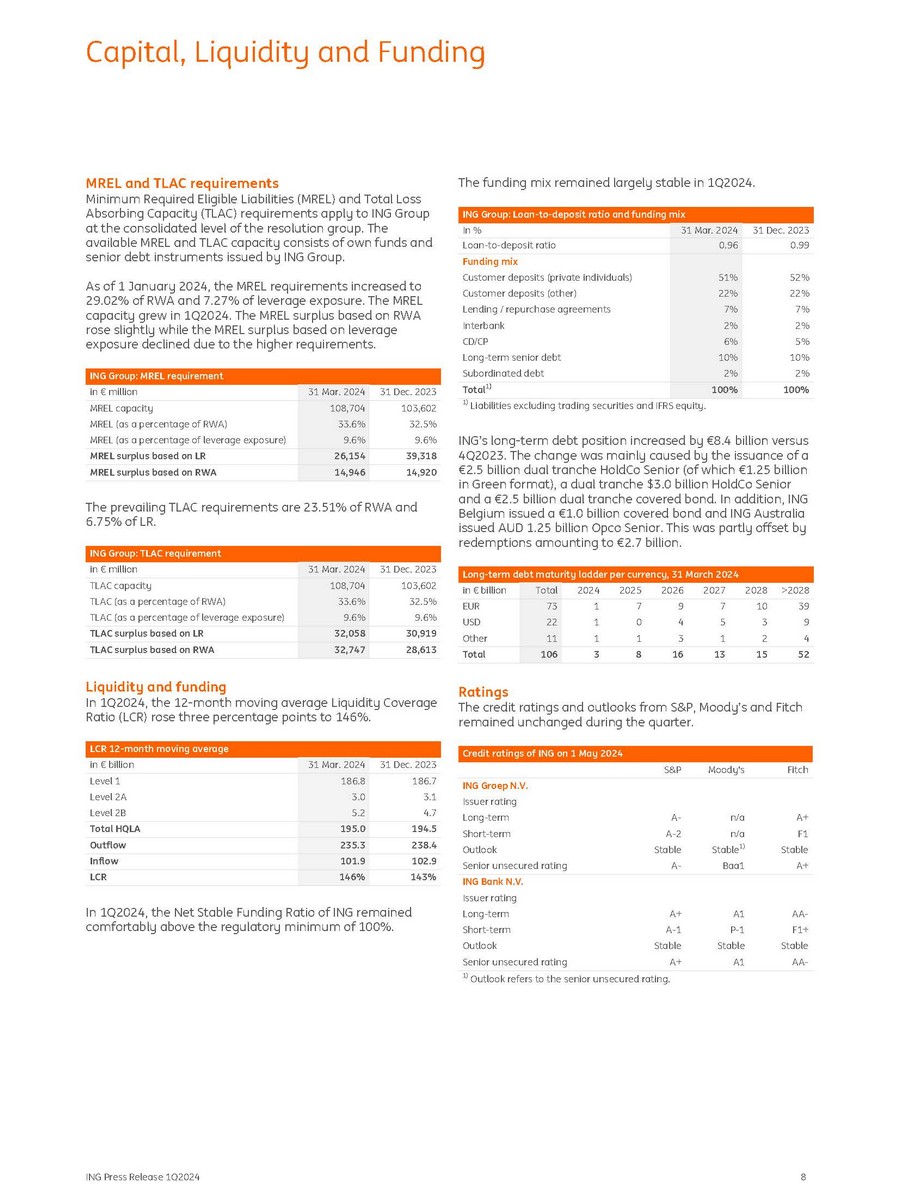
The available MREL and TLAC capacity consists of own funds and senior debt instruments issued by ING Group. As of 1 January 2024, the MREL requirements increased to 29.02% of RWA and 7.27% of leverage exposure. The MREL capacity grew in 1Q2024. The MREL surplus based on RWA rose slightly while the MREL surplus based on leverage exposure declined due to the higher requirements. ING Group: MREL requirement 31 Dec. 2023 31 Mar. 2024 in € million 103,602 108,704 MREL capacity 32.5% 33.6% MREL (as a percentage of RWA) 9.6% 9.6% MREL (as a percentage of leverage exposure) 39,318 26,154 MREL surplus based on LR 14,920 14,946 MREL surplus based on RWA The prevailing TLAC requirements are 23.51% of RWA and 6.75% of LR. ING Group: TLAC requirement 31 Dec. 2023 31 Mar. 2024 in € million 103,602 108,704 TLAC capacity 32.5% 33.6% TLAC (as a percentage of RWA) 9.6% 9.6% TLAC (as a percentage of leverage exposure) 30,919 32,058 TLAC surplus based on LR 28,613 32,747 TLAC surplus based on RWA Liquidity and funding In 1Q2024, the 12 - month moving average Liquidity Coverage Ratio (LCR) rose three percentage points to 146%. LCR 12 - month moving average 31 Dec. 2023 31 Mar. 2024 in € billion 186.7 186.8 Level 1 3.1 3.0 Level 2A 4.7 5.2 Level 2B 194.5 195.0 Total HQLA 238.4 235.3 Outflow 102.9 101.9 Inflow 143% 146% LCR In 1Q2024, the Net Stable Funding Ratio of ING remained comfortably above the regulatory minimum of 100%. The funding mix remained largely stable in 1Q2024. ING Group: Loan - to - deposit ratio and funding mix 31 Dec. 2023 31 Mar. 2024 In % 0.99 0.96 Loan - to - deposit ratio Funding mix 52% 51% Customer deposits (private individuals) 22% 22% Customer deposits (other) 7% 7% Lending / repurchase agreements 2% 2% Interbank 5% 6% CD/CP 10% 10% Long - term senior debt 2% 2% Subordinated debt 100% 100% Total 1) 1) Liabilities excluding trading securities and IFRS equity. ING’s long - term debt position increased by €8.4 billion versus 4Q2023. The change was mainly caused by the issuance of a €2.5 billion dual tranche HoldCo Senior (of which €1.25 billion in Green format), a dual tranche $3.0 billion HoldCo Senior and a €2.5 billion dual tranche covered bond. In addition, ING Belgium issued a €1.0 billion covered bond and ING Australia issued AUD 1.25 billion Opco Senior. This was partly offset by redemptions amounting to €2.7 billion. Long - term debt maturity ladder per currency, 31 March 2024 >2028 2028 2027 2026 2025 2024 Total in € billion 39 10 7 9 7 1 73 EUR 9 3 5 4 0 1 22 USD 4 2 1 3 1 1 11 Other 52 15 13 16 8 3 106 Total Ratings The credit ratings and outlooks from S&P, Moody’s and Fitch remained unchanged during the quarter. Credit ratings of ING on 1 May 2024 S&P Moody's Fitch ING Groep N.V. Issuer rating Long - term Short - term Outlook Senior unsecured rating A - A - 2 Stable A - n/a n/a Stable 1) Baa1 A+ F1 Stable A+ ING Bank N.V. Issuer rating Long - term Short - term Outlook Senior unsecured rating A+ A - 1 Stable A+ A1 P - 1 Stable A1 AA - F1+ Stable AA - 1) Outlook refers to the senior unsecured rating.
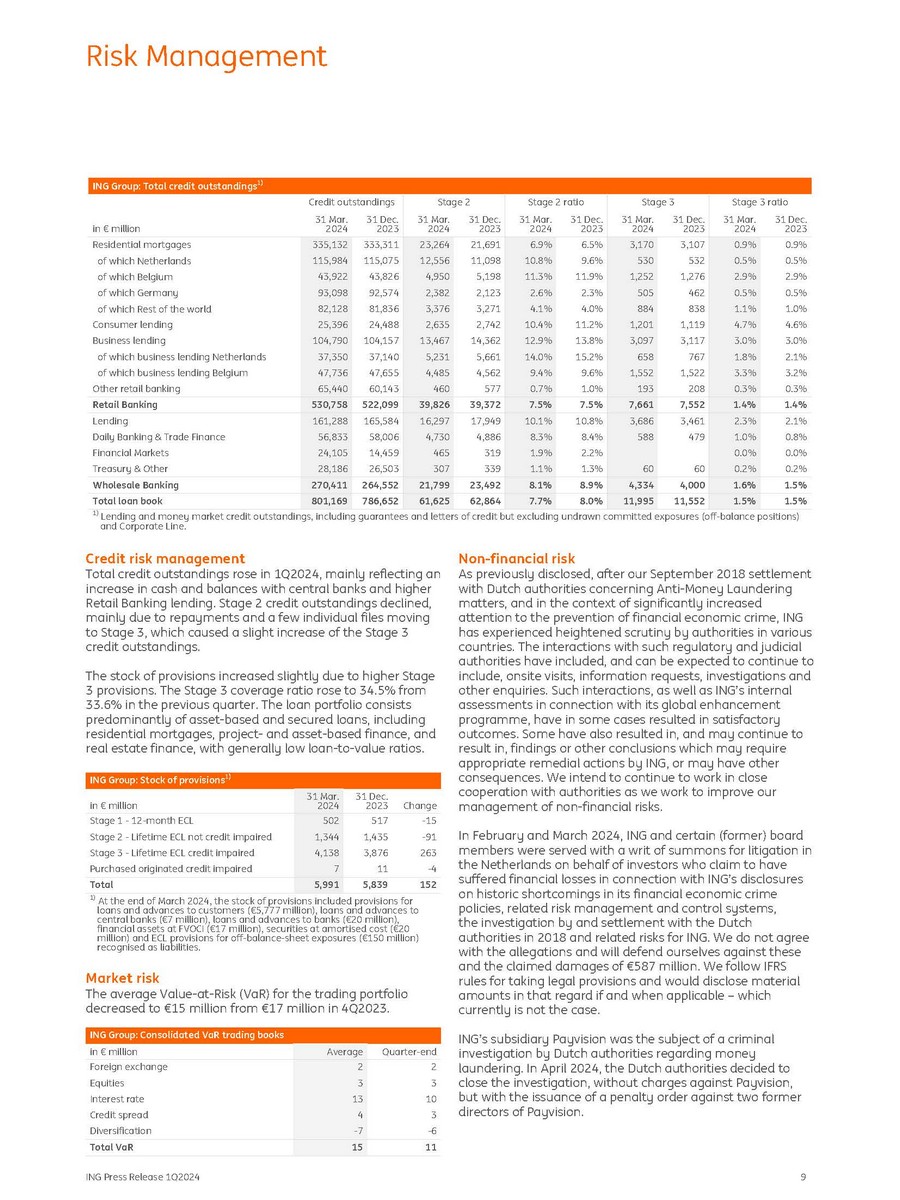
Capital, Liquidity and Funding ING Press Release 1Q2024 8 ING Press Release 1Q2024 9 ING Group: Total credit outstandings 1) Stage 3 ratio 31 Mar. 31 Dec. 2024 2023 Stage 3 31 Mar. 31 Dec. 2024 2023 Stage 2 ratio 31 Mar. 31 Dec. 2024 2023 Stage 2 31 Mar. 31 Dec. 2024 2023 Credit outstandings 31 Mar. 31 Dec. 2024 2023 in € million 0.9% 0.9% 3,107 3,170 6.5% 6.9% 21,691 23,264 333,311 335,132 Residential mortgages 0.5% 0.5% 532 530 9.6% 10.8% 11,098 12,556 115,075 115,984 of which Netherlands 2.9% 2.9% 1,276 1,252 11.9% 11.3% 5,198 4,950 43,826 43,922 of which Belgium 0.5% 0.5% 462 505 2.3% 2.6% 2,123 2,382 92,574 93,098 of which Germany 1.0% 1.1% 838 884 4.0% 4.1% 3,271 3,376 81,836 82,128 of which Rest of the world 4.6% 4.7% 1,119 1,201 11.2% 10.4% 2,742 2,635 24,488 25,396 Consumer lending 3.0% 3.0% 3,117 3,097 13.8% 12.9% 14,362 13,467 104,157 104,790 Business lending 2.1% 1.8% 767 658 15.2% 14.0% 5,661 5,231 37,140 37,350 of which business lending Netherlands 3.2% 3.3% 1,522 1,552 9.6% 9.4% 4,562 4,485 47,655 47,736 of which business lending Belgium 0.3% 0.3% 208 193 1.0% 0.7% 577 460 60,143 65,440 Other retail banking 1.4% 1.4% 7,552 7,661 7.5% 7.5% 39,372 39,826 522,099 530,758 Retail Banking 2.1% 0.8% 0.0% 0.2% 2.3% 1.0% 0.0% 0.2% 3,461 479 60 3,686 588 60 10.8% 8.4% 2.2% 1.3% 10.1% 8.3% 1.9% 1.1% 17,949 4,886 319 339 16,297 4,730 465 307 165,584 58,006 14,459 26,503 161,288 56,833 24,105 28,186 Lending Daily Banking & Trade Finance Financial Markets Treasury & Other 1.5% 1.6% 4,000 4,334 8.9% 8.1% 23,492 21,799 264,552 270,411 Wholesale Banking 1.5% 1.5% 11,552 11,995 8.0% 7.7% 62,864 61,625 786,652 801,169 Total loan book 1) Lending and money market credit outstandings, including guarantees and letters of credit but excluding undrawn committed exposures (off - balance positions) and Corporate Line. Credit risk management Total credit outstandings rose in 1Q2024, mainly reflecting an increase in cash and balances with central banks and higher Retail Banking lending. Stage 2 credit outstandings declined, mainly due to repayments and a few individual files moving to Stage 3, which caused a slight increase of the Stage 3 credit outstandings. The stock of provisions increased slightly due to higher Stage 3 provisions. The Stage 3 coverage ratio rose to 34.5% from 33.6% in the previous quarter. The loan portfolio consists predominantly of asset - based and secured loans, including residential mortgages, project - and asset - based finance, and real estate finance, with generally low loan - to - value ratios. ING Group: Stock of provisions 1) Change 31 Dec. 2023 31 Mar. 2024 in € million - 15 517 502 Stage 1 - 12 - month ECL - 91 1,435 1,344 Stage 2 - Lifetime ECL not credit impaired 263 3,876 4,138 Stage 3 - Lifetime ECL credit impaired - 4 11 7 Purchased originated credit impaired 152 5,839 5,991 Total 1) At the end of March 2024, the stock of provisions included provisions for loans and advances to customers (€5,777 million), loans and advances to central banks (€7 million), loans and advances to banks (€20 million), financial assets at FVOCI (€17 million), securities at amortised cost (€20 million) and ECL provisions for off - balance - sheet exposures (€150 million) recognised as liabilities. Market risk The average Value - at - Risk (VaR) for the trading portfolio decreased to €15 million from €17 million in 4Q2023. ING Group: Consolidated VaR trading books Quarter - end Average in € million 2 2 Foreign exchange 3 3 Equities 10 13 Interest rate 3 4 Credit spread - 6 - 7 Diversification 11 15 Total VaR Non - financial risk As previously disclosed, after our September 2018 settlement with Dutch authorities concerning Anti - Money Laundering matters, and in the context of significantly increased attention to the prevention of financial economic crime, ING has experienced heightened scrutiny by authorities in various countries. The interactions with such regulatory and judicial authorities have included, and can be expected to continue to include, onsite visits, information requests, investigations and other enquiries. Such interactions, as well as ING’s internal assessments in connection with its global enhancement programme, have in some cases resulted in satisfactory outcomes. Some have also resulted in, and may continue to result in, findings or other conclusions which may require appropriate remedial actions by ING, or may have other consequences. We intend to continue to work in close cooperation with authorities as we work to improve our management of non - financial risks. In February and March 2024, ING and certain (former) board members were served with a writ of summons for litigation in the Netherlands on behalf of investors who claim to have suffered financial losses in connection with ING’s disclosures on historic shortcomings in its financial economic crime policies, related risk management and control systems, the investigation by and settlement with the Dutch authorities in 2018 and related risks for ING. We do not agree with the allegations and will defend ourselves against these and the claimed damages of €587 million. We follow IFRS rules for taking legal provisions and would disclose material amounts in that regard if and when applicable – which currently is not the case. ING’s subsidiary Payvision was the subject of a criminal investigation by Dutch authorities regarding money laundering. In April 2024, the Dutch authorities decided to close the investigation, without charges against Payvision, but with the issuance of a penalty order against two former directors of Payvision.

Risk Management Retail Banking: Consolidated profit or loss account ING Press Release 1Q2024 10 Change 4Q2023 Change 1Q2023 1Q2024 In € million Profit or loss 4.9% 2,795 4.1% 2,817 2,933 Net interest income 10.2% 586 12.3% 575 646 Net fee and commission income - 19 - 58.3% 12 5 Investment income - 48.2% 332 - 44.2% 308 172 Other income 1.7% 3,693 1.2% 3,712 3,757 Total income - 4.7% 1,836 2.8% 1,703 1,750 Expenses excl. regulatory costs 55.1% 207 - 17.5% 389 321 Regulatory costs 1.4% 2,043 - 1.0% 2,092 2,072 Operating expenses 2.1% 1,650 4.0% 1,620 1,685 Gross result 91.9% 86 - 31.8% 242 165 Addition to loan loss provisions - 2.9% 1,565 10.2% 1,379 1,520 Result before tax Profitability and efficiency 3.8 2.2 3.7 Net core lending growth (in € billion) 2.5 1.7 9.2 Net core deposits growth (in € billion) 55.3% 56.4% 55.1% Cost/income ratio 8 21 14 Risk costs in bps of average customer lending 23.2% 19.2% 22.6% Return on equity based on 12.5% CET1 1) 1.3% 154.4 0.5% 155.6 156.4 Risk - weighted assets (end of period, in € billion) 1) Annualised after - tax return divided by average equity based on 12.5% of RWA. Retail Banking Retail Banking maintained strong commercial momentum in 1Q2024. The primary customer base increased by 99,000 customers, and both customer lending and customer deposits grew too. These factors contributed to the strong 1Q2024 financial results and a return on equity of 22.6%. Retail Banking’s result before tax increased 10% year - on - year, supported by higher income and lower operating expenses and risk costs. Quarter - on - quarter, the result before tax declined slightly as risk costs rose from the low level recorded in 4Q2023. Total income increased on both comparable quarters, driven by higher net interest income and double - digit growth in fee income. The increase in total income was only partly offset by lower other income for Treasury. Net interest income rose 4.1% year - on - year, mainly reflecting higher net interest income on liabilities following a rapid increase in the short - term interest rates in 2023. Sequentially, net interest income was up 4.9%. This was largely attributable to Treasury (with an offset in other income) and furthermore supported by higher average lending and deposit volumes. Fee income grew 12% compared with 1Q2023 and 10% sequentially. The increases were primarily driven by higher fee income for both daily banking and investment products. We benefited from the fact that more customers chose ING for their banking products coupled with increased package fees, as well as from growth in assets under management and in the number of brokerage trades. Net core lending growth, which excludes currency impacts, Treasury and the run - off in Westland Utrecht Bank, was €3.7 billion. The bulk of this growth was in residential mortgages, with an increase recorded across all of our markets. Net core deposits growth, excluding FX impacts and Treasury, was €9.2 billion and primarily driven by Germany and Poland. Expenses excluding regulatory costs increased 2.8% year - on - year, as the impact of inflation on staff expenses was partly offset by lower provisions for legal claims and restructuring. Sequentially, after adjusting for the €85 million of incidental item costs recorded in 4Q2023, expenses excluding regulatory costs were relatively stable. Regulatory costs are normally seasonally higher in the first quarter, but they declined year - on - year because no contribution is required to the eurozone's Single Resolution Fund in 2024. The cost/ income ratio improved to 55.1% in 1Q2024 compared with 56.4% in 1Q2023. Risk costs in 1Q2024 were 14 basis points of average customer lending, which is well below the through - the - cycle average and reflects our strong asset quality.

Segment Reporting: Retail Banking Retail Banking Market Leaders: Consolidated profit or loss account Banking Belgium Retail Retail Banking Netherlands 4Q2023 1Q2023 1Q2024 4Q2023 1Q2023 1Q2024 In € million Profit or loss 511 494 524 700 843 787 Net interest income 129 115 148 242 235 250 Net fee and commission income 1 1 2 1 3 3 Investment income 17 31 17 247 224 145 Other income 658 641 691 1,190 1,305 1,185 Total income 425 383 387 494 474 483 Expenses excl. regulatory costs 30 177 203 72 93 20 Regulatory costs 456 560 589 566 567 503 Operating expenses 202 81 101 624 738 682 Gross result 28 78 44 - 35 56 - 17 Addition to loan loss provisions 174 3 58 660 682 699 Result before tax Profitability and efficiency 1.1 1.4 0.4 0.7 0.2 1.7 Net core lending growth (in € billion) 0.1 0.7 0.5 0.4 - 2.6 - 3.5 Net core deposits growth (in € billion) 69.3% 87.4% 85.3% 47.5% 43.4% 42.5% Cost/income ratio 12 34 19 - 9 15 - 4 Risk costs in bps of average customer lending 13.2% - 2.1% 2.8% 30.7% 31.8% 32.6% Return on equity based on 12.5% CET1 1) 34.6 34.6 34.3 50.7 50.8 51.3 Risk - weighted assets (end of period, in € billion) ING Press Release 1Q2024 11 1) Annualised after - tax return divided by average equity based on 12.5% of RWA. Retail Netherlands Net interest income was resilient, but declined from its high level in 1Q2023 as a higher core savings rate led to lower net interest income from liabilities. In addition, Treasury - related interest income decreased, including the impact of the ECB’s adjustment of the remuneration on the minimum reserve requirement to zero basis points in September 2023. Sequentially, net interest income increased strongly, primarily driven by Treasury. This was partly due to a lower impact on net interest income of specific money market and FX transactions (with an offsetting effect in other income due to lower volumes). Fee income rose on both comparable quarters, driven by daily banking and investment products. Other income decreased both year - on - year and sequentially, almost entirely due to Treasury (that quarter - on - quarter was partly offset by higher net interest income for Treasury). Net core lending growth was €1.7 billion in 1Q2024, driven by continued growth in mortgages (€1.1 billion) and an increase in other lending. The net core deposits decline of €3.5 billion was mainly due to business banking clients withdrawing money for increased working capital requirements and tax payments. Expenses excluding regulatory costs increased from one year ago. These were mostly higher staff expenses due to a CLA impact and a small increase in internal FTEs, partly offset by lower expenses for external FTEs. Sequentially, expenses excluding regulatory costs declined, mainly due to lower marketing expenses. Regulatory costs dropped year - on - year as no contribution to the Single Resolution Fund is required in 2024. Sequentially, regulatory costs declined as 4Q2023 included the annual booking of the Dutch bank tax. Risk costs in 1Q2024 showed a net release for both business lending and mortgages. In business lending, this was largely driven by releases for individual files, while for mortgages it mainly reflected a release of event - based overlays. Retail Belgium (including Luxembourg) Net interest income increased year - on - year, driven by higher margins on liabilities. Sequentially, the increase in net interest income was mainly driven by Treasury, while net interest income from liabilities declined due to a shift from current accounts to deposits. Fee income rose strongly, both year - on - year and sequentially, supported by investment products and lower commissions paid to agents. Other income declined year - on - year due to Treasury and was stable compared with 4Q2023, which included an €11 million gain on the sale of a participation. Net core lending growth was €0.4 billion, driven by an increase in business lending. Net core deposits growth was €0.5 billion. Expenses excluding regulatory costs rose modestly year - on - year, as the impact of automatic salary indexation was largely offset by FTE reductions. Sequentially, expenses excluding regulatory costs declined due to lower marketing expenses and €30 million of incidental item costs that were recorded in 4Q2023. Regulatory costs in 1Q2024 included the contributions to the Belgian deposit guarantee scheme and the Belgian bank tax, which rose year - on - year, partly because 1Q2023 had included a partial reimbursement of the bank tax that was paid in 2016. Risk costs amounted to €44 million in 1Q2024 and included higher collective provisions on mortgages, as well as an increase in Stage 3 provisions for a small number of business lending clients.

Segment Reporting: Retail Banking Retail Banking Other Retail Banking Challengers & Growth Markets: Consolidated profit or loss account Retail Banking Germany 4Q2023 1Q2023 1Q2024 4Q2023 1Q2023 1Q2024 In € million Profit or loss 875 815 948 709 665 674 Net interest income 131 128 144 84 96 105 Net fee and commission income - 4 5 0 - 17 3 0 Investment income 75 65 56 - 7 - 12 - 46 Other income 1,077 1,013 1,149 769 753 733 Total income 608 562 589 309 283 292 Expenses excl. regulatory costs 79 80 79 26 40 20 Regulatory costs 687 642 667 335 323 312 Operating expenses 390 371 481 434 430 421 Gross result 68 75 99 25 33 40 Addition to loan loss provisions 322 296 383 409 397 382 Result before tax Profitability and efficiency 1.6 0.3 1.0 0.3 0.3 0.7 Net core lending growth (in € billion) 4.6 3.1 3.1 - 2.5 0.5 9.0 Net core deposits growth (in € billion) 63.8% 63.4% 58.1% 43.5% 42.9% 42.5% Cost/income ratio 25 28 36 10 13 15 Risk costs in bps of average customer lending 18.3% 15.2% 20.5% 30.2% 28.1% 33.5% Return on equity based on 12.5% CET1 1) 45.1 41.6 46.0 24.0 28.5 24.8 Risk - weighted assets (end of period, in € billion) ING Press Release 1Q2024 12 1) Annualised after - tax return divided by average equity based on 12.5% of RWA. Retail Germany Net interest income increased year - on - year, driven by higher lending volumes and improved margins on mortgages, as well as by an increase in Treasury - related income. Sequentially, net interest income decreased due to a rise in core savings rates and a decline in Treasury - related interest income. Fee income increased on both comparable quarters, fuelled by a higher number of brokerage trades in investment products. Investment and other income declined, reflecting lower Treasury - related income. Net core lending growth in 1Q2024 was €0.7 billion and largely driven by mortgages. Net core deposits growth was €9.0 billion following a successful promotional campaign to attract new savings and customers during 1Q2024. Expenses excluding regulatory costs increased year - on - year, predominantly due to higher staff expenses related to annual salary increases and investments in business growth. Regulatory costs declined compared with 1Q2023 as no contribution to the Single Resolution Fund is required this year. Sequentially, expenses excluding regulatory costs declined, because 4Q2023 had included €20 million of incidental items for restructuring costs and staff allowances. Adjusted for that, expenses rose slightly quarter - on - quarter due to higher marketing expenses. Risk costs were €40 million and primarily related to consumer lending and mortgages. Retail Other Year - on - year, net interest income was supported by higher margins on liabilities, most notably in Poland and Spain. Sequentially, net interest income increased due to higher volumes and margins. Fee income rose both year - on - year and sequentially. This was driven by higher fees from both investment products and daily banking, with the latter reflecting primary customer growth and the updated pricing of payment packages. Other income decreased versus both comparable quarters due to lower Treasury - related income. Net core lending growth amounted to €1.0 billion in 1Q2024, mainly due to higher lending volumes in Poland, Italy and Romania. Net core deposits growth was €3.1 billion and largely driven by net inflows in Poland and Spain. Expenses in 1Q2023 had included €27 million of legal provisions and 4Q2023 had €36 million of restructuring costs and impairments as well as an €8 million addition to a legal provision. Expenses – excluding regulatory costs and the aforementioned legal provisions and incidental items – rose on both comparable quarters, mainly due to the impact of inflation and business growth. Risk costs were €99 million with net additions recorded mainly in Poland and Spain.

Segment Reporting: Retail Banking Wholesale Banking: Consolidated profit or loss account ING Press Release 1Q2024 13 Change 4Q2023 Change 1Q2023 1Q2024 In € million Profit or loss 3.2% 805 3.0% 807 831 Lending - 6.9% 536 - 5.7% 529 499 Daily Banking & Trade Finance 94.4% 197 9.7% 349 383 Financial Markets - 38.6% 57 - 67.3% 107 35 Treasury & Other 9.7% 1,595 - 2.3% 1,791 1,749 Total income 0.6% 800 11.0% 725 805 Expenses excl. regulatory costs - 66.4% 110 - 72.8% 136 37 Regulatory costs - 7.6% 910 - 2.2% 860 841 Operating expenses 32.4% 685 - 2.6% 931 907 Gross result - 1 - 90 93 Addition to loan loss provisions 18.7% 686 - 20.3% 1,021 814 Result before tax Profitability and efficiency 3.5 - 1.2 0.5 Net core lending growth (in € billion) - 3.5 - 0.4 4.3 Net core deposits growth (in € billion) 57.1% 48.0% 48.1% Cost/income ratio 425 454 465 Income over average risk - weighted assets (in bps) 1) 0 - 19 20 Risk costs in bps of average customer lending 11.4% 15.2% 12.5% Return on equity based on 12.5% CET1 2) 0.3% 150.3 - 3.5% 156.2 150.7 Risk - weighted assets (end of period, in € billion) 1) Annualised total income divided by average RWA. 2) Annualised after - tax return divided by average equity based on 12.5% of RWA. Wholesale Banking had a strong start to 2024, recording a gross result of €907 million compared with €931 million a year ago. Our focus on income diversification is yielding positive results, as evidenced by higher income from Financial Markets and growth in fee income. Combined with disciplined capital management, this resulted in a 1Q2024 return on equity of 12.5% and a further increase in income over average risk - weighted assets. Expenses excluding regulatory costs rose, primarily due to the impact of inflation on staff expenses, investments in the business and a provision of €23 million. Regulatory costs sharply declined year - on - year because no contribution is required to the eurozone's Single Resolution Fund in 2024. Risk costs amounted to €93 million or 20 basis points of average customer lending. This includes additions for a number of unrelated files that were newly provisioned and that were partially offset by releases in collective provisions, whereas the 1Q2023 and 4Q2023 risk costs had been positively influenced by significant releases for our Russia - related portfolio. Net core lending growth was €0.5 billion, reflecting client demand in our Lending and Financial Markets portfolio. Net core deposits growth was €4.3 billion, mainly in Financial Markets and in Bank Mendes Gans. Lending income increased both year - on - year and sequentially by 3%. This was attributable to strong fee income from several sizeable deals in 1Q2024 and increased volumes, despite tighter credit conditions and a prolonged market - wide weakening in loan demand. Income from Daily Banking & Trade Finance declined year - on - year, mainly due to lower Payments & Cash Management (PCM) income, where reduced deposit balances were only partly offset by improved margins. Sequentially, income was impacted by the normalisation of interest margins in PCM, while 4Q2023 included strong results from Working Capital Solutions and a gain on an equity stake. Financial Markets income increased year - on - year, reflecting a robust quarter, especially for Global Capital Markets and Global Securities Finance, which benefited from strong client flows. This was partly offset by lower income from Rates and Money Markets, where stabilising policy rates resulted in lower client activity. Compared with 4Q2023, income increased significantly after a €60 million reserve increase and relatively low market activity in the last quarter of 2023. Income from Treasury & Other declined year - on - year, mainly due to a lower remuneration on the ECB minimum reserve requirement, while Treasury had benefited from the rapid increase in interest rates a year ago. This was coupled with lower results from Corporate Investments. Sequentially, income also declined, mainly due to lower Corporate Finance fees and lower results from Corporate Investments. Segment Reporting: Wholesale Banking Corporate Line: Consolidated profit or loss account 29 impact 1) IAS Corporate Line excl.

IAS 29 impact Line Corporate Total 4Q2023 1Q2023 1Q2024 4Q2023 1Q2023 1Q2024 4Q2023 1Q2023 1Q2024 In € million Profit or loss 8 1 3 109 134 47 117 136 50 Net interest income 2 0 0 - 4 - 3 - 2 - 2 - 3 - 2 Net fee and commission income 0 0 0 0 0 0 0 0 0 Investment income - 25 - 70 - 52 31 0 82 5 - 70 30 Other income - 16 - 69 - 49 136 132 126 120 63 78 Total income 12 4 4 110 114 115 122 118 119 Expenses excl. regulatory costs 0 0 0 0 0 0 0 0 0 Regulatory costs 12 4 4 110 114 115 122 118 119 Operating expenses - 28 - 73 - 53 26 18 11 - 2 - 55 - 42 Gross result 2 0 0 0 0 0 2 0 0 Addition to loan loss provisions - 30 - 73 - 53 26 18 11 - 4 - 55 - 42 Result before tax of which: 0 0 0 65 20 11 65 20 11 Income on capital surplus 0 0 0 106 143 130 106 143 130 Foreign currency ratio hedging 0 0 0 - 58 - 22 - 83 - 58 - 22 - 83 Other Group Treasury 0 0 0 114 141 58 114 141 58 Group Treasury 0 0 0 22 20 23 22 20 23 Asian stakes - 30 - 73 - 53 - 110 - 144 - 70 - 140 - 217 - 123 Other Corporate Line - 30 - 73 - 53 26 18 11 - 4 - 55 - 42 Result before tax 2 - 6 - 1 Taxation - 32 - 68 - 51 Net result ING Press Release 1Q2024 14 1) Hyperinflation accounting (IAS 29) has become applicable for ING’s subsidiary in Türkiye since 2Q2022 with retrospective application from 1 January 2022. Total income increased by €15 million year - on - year. The first quarter of 2024 included the recognition of a €53 million receivable related to a prior insolvency of a financial institution in the Netherlands, which has been recorded in other income. This item was largely offset by a decline in net interest income from Group Treasury, which was partly due to lower results from foreign currency ratio hedging. Compared with 4Q2023, total income decreased by €42 million. This was mainly due to lower income on capital surplus and a bigger IAS 29 impact (reflecting a higher level of inflation in Türkiye), partly compensated by the aforementioned €53 million receivable. Operating expenses remained relatively stable on both comparable quarters.
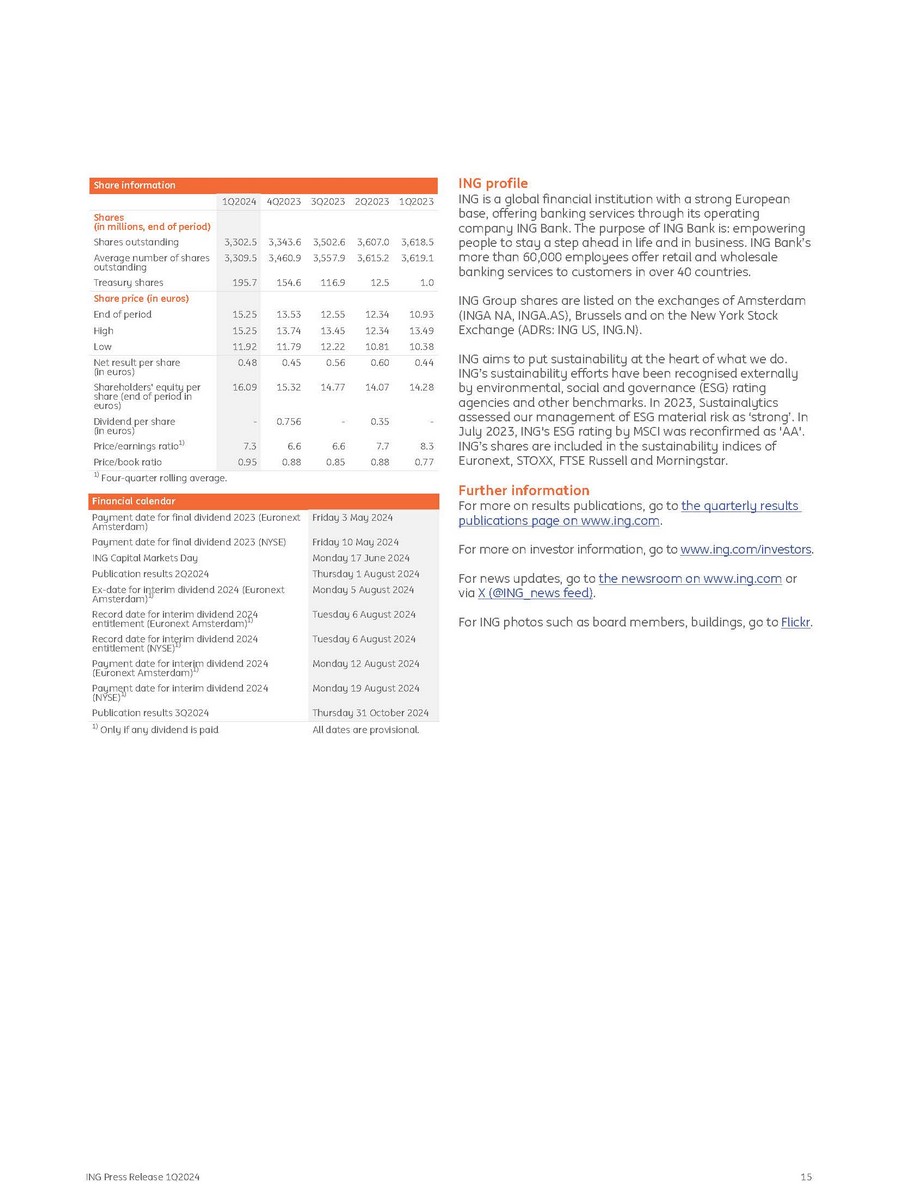
Segment Reporting: Corporate Line Share information 4Q2023 3Q2023 2Q2023 1Q2023 1Q2024 3,343.6 3,502.6 3,607.0 3,618.5 3,460.9 3,557.9 3,615.2 3,619.1 154.6 116.9 12.5 1.0 3,302.5 3,309.5 195.7 Shares (in millions, end of period) Shares outstanding Average number of shares outstanding Treasury shares 13.53 12.55 12.34 10.93 13.74 13.45 12.34 13.49 11.79 12.22 10.81 10.38 15.25 15.25 11.92 Share price (in euros) End of period High Low 0.45 0.56 0.60 0.44 15.32 14.77 14.07 14.28 0.756 - 0.35 - 6.6 6.6 7.7 8.3 0.88 0.85 0.88 0.77 0.48 16.09 - 7.3 0.95 Net result per share (in euros) Shareholders' equity per share (end of period in euros) Dividend per share (in euros) Price/earnings ratio 1) Price/book ratio 1) Four - quarter rolling average. Financial calendar Friday 3 May 2024 Payment date for final dividend 2023 (Euronext Amsterdam) Payment date for final dividend 2023 (NYSE) ING Capital Markets Day Publication results 2Q2024 Amsterdam) Ex - date for interim dividend 2024 (Euronext 1) Friday 10 May 2024 Monday 17 June 2024 Thursday 1 August 2024 Monday 5 August 2024 Record date for interim dividend 2024 entitlement (Euronext Amsterdam) 1) Tuesday 6 August 2024 Record date for interim dividend 2024 entitlement (NYSE) 1) Tuesday 6 August 2024 Payment date for interim dividend 2024 (Euronext Amsterdam) 1) Monday 12 August 2024 Payment date for interim dividend 2024 Monday 19 August 2024 (NYSE) 1) Publication results 3Q2024 Thursday 31 October 2024 1) Only if any dividend is paid All dates are provisional. ING profile ING is a global financial institution with a strong European base, offering banking services through its operating company ING Bank. The purpose of ING Bank is: empowering people to stay a step ahead in life and in business. ING Bank’s more than 60,000 employees offer retail and wholesale banking services to customers in over 40 countries. ING Group shares are listed on the exchanges of Amsterdam (INGA NA, INGA.AS), Brussels and on the New York Stock Exchange (ADRs: ING US, ING.N). ING aims to put sustainability at the heart of what we do. ING’s sustainability efforts have been recognised externally by environmental, social and governance (ESG) rating agencies and other benchmarks. In 2023, Sustainalytics assessed our management of ESG material risk as ‘strong’. In July 2023, ING's ESG rating by MSCI was reconfirmed as 'AA'. ING’s shares are included in the sustainability indices of Euronext, STOXX, FTSE Russell and Morningstar. ING Press Release 1Q2024 15 Further information For more on results publications, go to the quarterly results publications page on www.ing.com . For more on investor information, go to www.ing.com/investors . For news updates, go to the newsroom on www.ing.com or via X (@ING_news feed) . For ING photos such as board members, buildings, go to Flickr .

ING Press Release 1Q2024 16 Important legal information Elements of this press release contain or may contain information about ING Groep N.V. and/ or ING Bank N.V. within the meaning of Article 7(1) to (4) of EU Regulation No 596/2014 (‘Market Abuse Regulation’). ING Group’s annual accounts are prepared in accordance with International Financial Reporting Standards as adopted by the European Union (‘IFRS - EU’). In preparing the financial information in this document, except as described otherwise, the same accounting principles are applied as in the 2023 ING Group consolidated annual accounts. All figures in this document are unaudited. Small differences are possible in the tables due to rounding. Certain of the statements contained herein are not historical facts, including, without limitation, certain statements made of future expectations and other forward - looking statements that are based on management’s current views and assumptions and involve known and unknown risks and uncertainties that could cause actual results, performance or events to differ materially from those expressed or implied in such statements. Actual results, performance or events may differ materially from those in such statements due to a number of factors, including, without limitation: (1) changes in general economic conditions and customer behaviour, in particular economic conditions in ING’s core markets, including changes affecting currency exchange rates and the regional and global economic impact of the invasion of Russia into Ukraine and related international response measures (2) changes affecting interest rate levels (3) any default of a major market participant and related market disruption (4) changes in performance of financial markets, including in Europe and developing markets (5) fiscal uncertainty in Europe and the United States (6) discontinuation of or changes in ‘benchmark’ indices (7) inflation and deflation in our principal markets (8) changes in conditions in the credit and capital markets generally, including changes in borrower and counterparty creditworthiness (9) failures of banks falling under the scope of state compensation schemes (10) non - compliance with or changes in laws and regulations, including those concerning financial services, financial economic crimes and tax laws, and the interpretation and application thereof (11) geopolitical risks, political instabilities and policies and actions of governmental and regulatory authorities, including in connection with the invasion of Russia into Ukraine and the related international response measures (12) legal and regulatory risks in certain countries with less developed legal and regulatory frameworks (13) prudential supervision and regulations, including in relation to stress tests and regulatory restrictions on dividends and distributions (also among members of the group) (14) ING’s ability to meet minimum capital and other prudential regulatory requirements (15) changes in regulation of US commodities and derivatives businesses of ING and its customers (16) application of bank recovery and resolution regimes, including write down and conversion powers in relation to our securities (17) outcome of current and future litigation, enforcement proceedings, investigations or other regulatory actions, including claims by customers or stakeholders who feel misled or treated unfairly, and other conduct issues (18) changes in tax laws and regulations and risks of non - compliance or investigation in connection with tax laws, including FATCA (19) operational and IT risks, such as system disruptions or failures, breaches of security, cyber - attacks, human error, changes in operational practices or inadequate controls including in respect of third parties with which we do business and including any risks as a result of incomplete, inaccurate, or otherwise flawed outputs from the algorithms and data sets utilized in artificial intelligence (20) risks and challenges related to cybercrime including the effects of cyberattacks and changes in legislation and regulation related to cybersecurity and data privacy, including such risks and challenges as a consequence of the use of emerging technologies, such as advanced forms of artificial intelligence and quantum computing (21) changes in general competitive factors, including ability to increase or maintain market share (22) inability to protect our intellectual property and infringement claims by third parties (23) inability of counterparties to meet financial obligations or ability to enforce rights against such counterparties (24) changes in credit ratings (25) business, operational, regulatory, reputation, transition and other risks and challenges in connection with climate change and ESG - related matters, including data gathering and reporting (26) inability to attract and retain key personnel (27) future liabilities under defined benefit retirement plans (28) failure to manage business risks, including in connection with use of models, use of derivatives, or maintaining appropriate policies and guidelines (29) changes in capital and credit markets, including interbank funding, as well as customer deposits, which provide the liquidity and capital required to fund our operations, and (30) the other risks and uncertainties detailed in the most recent annual report of ING Groep N.V. (including the Risk Factors contained therein) and ING’s more recent disclosures, including press releases, which are available on www.ING.com. This document may contain ESG - related material that has been prepared by ING on the basis of publicly available information, internally developed data and other third - party sources believed to be reliable. ING has not sought to independently verify information obtained from public and third - party sources and makes no representations or warranties as to accuracy, completeness, reasonableness or reliability of such information. Materiality, as used in the context of ESG, is distinct from, and should not be confused with, such term as defined in the Market Abuse Regulation or as defined for Securities and Exchange Commission (‘SEC’) reporting purposes. Any issues identified as material for purposes of ESG in this document are therefore not necessarily material as defined in the Market Abuse Regulation or for SEC reporting purposes. In addition, there is currently no single, globally recognized set of accepted definitions in assessing whether activities are “green” or “sustainable.” Without limiting any of the statements contained herein, we make no representation or warranty as to whether any of our securities constitutes a green or sustainable security or conforms to present or future investor expectations or objectives for green or sustainable investing. For information on characteristics of a security, use of proceeds, a description of applicable project(s) and/or any other relevant information, please reference the offering documents for such security. This document may contain inactive textual addresses to internet websites operated by us and third parties. Reference to such websites is made for information purposes only, and information found at such websites is not incorporated by reference into this document. ING does not make any representation or warranty with respect to the accuracy or completeness of, or take any responsibility for, any information found at any websites operated by that websites operated by third parties remain available following the publication of this document, or that any information found at such websites will not change following the filing of this document. Many of those factors are beyond ING’s control. Any forward - looking statements made by or on behalf of ING speak only as of the date they are made, and ING assumes no obligation to publicly update or revise any forward - looking statements, whether as a result of new information or for any other reason. This document does not constitute an offer to sell, or a solicitation of an offer to purchase, any securities in the United States or any other jurisdiction.