UNITED STATES SECURITIES AND EXCHANGE COMMISSION
WASHINGTON, D.C. 20549
FORM 40-F
☐ Registration Statement Pursuant to Section 12 of the Securities Exchange Act of 1934
or
☒ Annual Report Pursuant to Section 13(a) or 15(d) of the Securities Exchange Act of 1934
For the fiscal year ended December 31, 2023
Commission file number 001-36898
Colliers International Group Inc.
(Exact name of Registrant as specified in its charter)
N/A
(Translation of Registrant’s name into English (if applicable))
Ontario, Canada
(Province or other jurisdiction of incorporation or organization)
6500
(Primary Standard Industrial Classification Code Number (if applicable))
N/A
(I.R.S. Employer Identification Number (if applicable))
1140 Bay Street, Suite 4000
Toronto, Ontario, Canada M5S 2B4
416-960-9500
(Address and telephone number of Registrant’s principal executive offices)
Mr. Santino Ferrante, Ferrante & Associates
126 Prospect Street, Cambridge, MA 02139
617-868-5000
(Name, address (including zip code) and telephone number (including area code) of agent for service in the United States)
Securities registered or to be registered pursuant to Section 12(b) of the Act:
| Title of each class |
Trading Symbol |
Name of each exchange on which registered |
| Subordinate Voting Shares |
CIGI |
NASDAQ Stock Market |
Securities registered or to be registered pursuant to Section 12(g) of the Act: None
Securities for which there is a reporting obligation pursuant to Section 15(d) of the Act: None
For annual reports, indicate by check mark the information filed with this Form:
| ☒ Annual information form | ☒ Audited annual financial statements |
Indicate the number of outstanding shares of each of the issuer’s classes of capital or common stock as of the close of the period covered by the annual report:
46,223,682 Subordinate Voting Shares and 1,325,694 Multiple Voting Shares as of December 31, 2023
Indicate by check mark whether the Registrant (1) has filed all reports required to be filed by Section 13 or 15(d) of the Exchange Act during the preceding 12 months (or for such shorter period that the Registrant was required to file such reports) and (2) has been subject to such filing requirements for the past 90 days.
☒ Yes ☐ No
Indicate by check mark whether the registrant has submitted electronically every Interactive Data File required to be submitted pursuant to Rule 405 of Regulation S-T (§232.405 of this chapter) during the preceding 12 months (or for such shorter period that the Registrant was required to submit such files).
☒ Yes ☐ No
Indicate by check mark whether the registrant is an emerging growth company as defined in Rule 12b-2 of the Exchange Act.
Emerging growth company ☐
If an emerging growth company that prepares its financial statements in accordance with U.S. GAAP, indicate by check mark if the registrant has elected not to use the extended transition period for complying with any new or revised financial accounting standards† provided pursuant to Section 13(a) of the Exchange Act. ☐
† The term “new or revised financial accounting standard” refers to any update issued by the Financial Accounting Standards Board to its Accounting Standards Codification after April 5, 2012.
Indicate by check mark whether the Registrant has filed a report on and attestation to its management’s assessment of the effectiveness of its internal control over financial reporting under Section 404(b) of the Sarbanes-Oxley Act (15 U.S.C. 7262(b)) by the registered public accounting firm that prepared or issued its audit report. ☒
If securities are registered pursuant to Section 12(b) of the Act, indicate by check mark whether the financial statements of the registrant included in the filing reflect the correction of an error to previously issued financial statements. ☐
Indicate by check mark whether any of those error corrections are restatements that required a recovery analysis of incentive-based compensation received by any of the registrant’s executive officers during the relevant recovery period pursuant to §240.10D-1(b). ☐
PRINCIPAL DOCUMENTS
The following documents have been filed as part of this Annual Report on Form 40-F:
A. Annual Information Form
For the Registrant’s Annual Information Form for the year ended December 31, 2023, see Exhibit 1 of this Annual Report on Form 40-F.
B. Audited Annual Financial Statements
For the Registrant’s audited consolidated financial statements as at December 31, 2023 and 2022 and for the years ended December 31, 2023 and 2022 and the related notes, Management's Report on Internal Control over Financial Reporting and the Report of Independent Registered Public Accounting Firm (PCAOB ID 271), see Exhibit 2 of this Annual Report on Form 40-F.
C. Management’s Discussion and Analysis
For the Registrant’s management’s discussion and analysis for the year ended December 31, 2023, see Exhibit 3 of this Annual Report on Form 40-F.
DISCLOSURE CONTROLS AND PROCEDURES
The Registrant’s Chief Executive Officer and Chief Financial Officer have evaluated the effectiveness of the Registrant’s disclosure controls and procedures (as defined in Rules 13a-15(e) and 15d-15(e) of the Securities Exchange Act of 1934, as amended (the “Exchange Act”)) as of the end of the period covered by this annual report (the “Evaluation Date”). Based on that evaluation, the Chief Executive Officer and Chief Financial Officer have concluded that, as of the Evaluation Date, the Registrant’s disclosure controls and procedures were effective to ensure that information required to be disclosed by the Registrant in reports that it files or submits under the Exchange Act is (i) recorded, processed, summarized and reported within the time periods specified in the rules and forms of the Securities and Exchange Commission (the “SEC”) and (ii) accumulated and communicated to the Registrant’s management, including its Chief Executive Officer and Chief Financial Officer, as appropriate, to allow timely decisions regarding required disclosure.
MANAGEMENT’S REPORT ON INTERNAL CONTROL OVER FINANCIAL REPORTING
Management is responsible for establishing and maintaining adequate internal control over financial reporting for the Registrant. Internal control over financial reporting is a process designed to provide reasonable assurance regarding the reliability of financial reporting and the preparation of financial statements for external purposes in accordance with generally accepted accounting principles.
Due to its inherent limitations, internal control over financial reporting may not prevent or detect misstatements. Also, projections of any evaluation of its effectiveness to future periods are subject to the risk that controls may become inadequate because of changes in conditions, or that the degree of compliance with the policies or procedures may deteriorate.
Management has excluded three entities acquired by the Company during the last fiscal period from its assessment of internal control over financial reporting as at December 31, 2023. The total assets and total revenues of the three majority-owned entities represent 0.7% and 0.9%, respectively of the related consolidated financial statement amounts as at and for the year ended December 31, 2023.
Management has assessed the effectiveness of the Registrant’s internal control over financial reporting as at December 31, 2023, based on the criteria set forth in Internal Control – Integrated Framework (2013) issued by the Committee of Sponsoring Organizations of the Treadway Commission. Based on this assessment, management has concluded that, as at December 31, 2023, the Registrant’s internal control over financial reporting was effective.
The effectiveness of the Registrant’s internal control over financial reporting as at December 31, 2023 has been audited by PricewaterhouseCoopers LLP, the Registrant’s independent registered public accounting firm, as stated in their report filed in Exhibit 2 of this Annual Report on Form 40-F.
CHANGES IN INTERNAL CONTROL OVER FINANCIAL REPORTING
During the year ended December 31, 2023, there were no changes in the Registrant’s internal control over financial reporting that have materially affected, or are reasonably likely to materially affect, the Registrant’s internal control over financial reporting.
NOTICES PURSUANT TO REGULATION BTR
There were no notices required by Rule 104 of Regulation BTR that the Registrant sent during the year ended December 31, 2023 concerning any equity security subject to a blackout period under Rule 101 of Regulation BTR.
AUDIT COMMITTEE FINANCIAL EXPERTS
The Registrant’s board of directors (the “Board of Directors”) has determined that it has one audit committee financial expert (as such term is defined in paragraph 8 of General Instruction B to Form 40-F) serving on its audit & risk committee (the “Audit Committee”). Mr. L. Frederick Sutherland has been determined by the Board of Directors to be an audit committee financial expert and is independent (as such term is defined by the corporate governance standards of the NASDAQ Stock Market (“NASDAQ”) applicable to the Registrant).
Mr. Sutherland was the Executive Vice President and Chief Financial Officer of Aramark Corporation, Philadelphia, PA, a leading global provider of food services, facilities management and uniform and career apparel, from 1997 to 2015. Prior to joining Aramark in 1980, Mr. Sutherland was Vice President, Corporate Banking, at Chase Manhattan Bank, New York, NY. Mr. Sutherland is a director of Consolidated Edison, Inc. and Sterling Check Corp. Mr. Sutherland is also a director and former Chair of the Board of WHYY, Philadelphia’s public broadcast affiliate and a trustee of Duke University, The National Constitution Center, Episcopal Community Services, an anti-poverty agency, and People's Light, a professional non-profit theater. Mr. Sutherland holds an MBA Degree in Finance from the Katz School of the University of Pittsburgh and a Bachelors in Physics and Mathematics from Duke University.
The SEC has indicated that the designation of Mr. Sutherland as an audit committee financial expert does not make him an “expert” for any purpose, impose on him any duties, obligations or liability that are greater than the duties, obligations or liability imposed on him as a member of the Audit Committee and the Board of Directors in absence of such designation, or affect the duties, obligations or liability of any other member of the Audit Committee or Board of Directors.
CODE OF ETHICS
The Registrant has adopted a Code of Ethics and Conduct that applies to all directors, officers and employees of the Registrant and its subsidiaries. A copy of the Code of Ethics and Conduct can be obtained, free of charge, on the Registrant’s website (www.colliers.com) or by contacting the Registrant at (416) 960-9500. Information contained or otherwise accessed through the Registrant’s website or any other website, other than those documents filed as exhibits hereto or otherwise specifically referred to herein, does not form part of this Annual Report on Form 40-F, and any reference to the Registrant’s website herein is as an inactive textual reference only.
PRINCIPAL ACCOUNTANT FEES AND SERVICES
The following table sets out the fees billed to the Registrant by PricewaterhouseCoopers LLP for professional services rendered in each of the years ended December 31, 2023 and 2022. During these years, PricewaterhouseCoopers LLP was the Registrant’s only external auditor.
| (in thousands of C$) |
Year ended December 31, 2023 |
Year ended December 31, 2022 |
||||||
| Audit fees (note 1) |
$ | 4,392 | $ | 3,922 | ||||
| Audit-related fees (note 2) |
308 | 333 | ||||||
| Tax fees (note 3) |
2,736 | 1,851 | ||||||
| All other fees (note 4) |
12 | 25 | ||||||
| $ | 7,448 | $ | 6,131 | |||||
Notes:
| 1. |
Refers to the aggregate fees billed and expected to be billed by the Registrant's external auditor for audit services relating to the audit of the Registrant and statutory audits required by subsidiaries. |
| 2. |
Refers to the aggregate fees billed for assurance and related services by the Company’s external auditor that are reasonably related to the performance of the audit or review of the Company’s financial statements and are not reported under (1) above, including professional services rendered by the Company’s external auditor for supplementary assurance assessments and engagements. |
| 3. |
Refers to the aggregate fees billed for professional services rendered by the Registrant's external auditor for tax compliance, tax advice and tax planning. The majority of tax fees in 2023 relate to a non-recurring project. |
| 4. |
Refers to fees for consulting and subscriptions to accounting and tax research tools. |
The Registrant’s Audit Committee pre-approves all audit services and permitted non-audit services provided to the Registrant by PricewaterhouseCoopers LLP. The Audit Committee has delegated to the Chair of the Audit Committee, who is independent, the authority to act on behalf of the Audit Committee with respect to the pre-approval of all audit and permitted non-audit services provided by its external auditors from time to time. Any approvals by the Chair are reported to the full Audit Committee at its next meeting. None of the services provided by the Company’s external auditors described in footnotes 2, 3 and 4 under “Principal Accountant Fees and Services” above were approved pursuant to a waiver of pre-approval provisions under SEC rules (paragraph (c)(7)(i)(C) of Rule 2-01 of Regulation S-X).
OFF-BALANCE SHEET ARRANGEMENTS
The Registrant does not have any off-balance sheet arrangements that have, or are reasonably likely to have, a current or future material effect on the Registrant’s financial performance or financial condition except as provided under the heading “Liquidity and Capital Resources” on page 7 of the Management’s Discussion and Analysis, which is filed as Exhibit 3 to this Annual Report on Form 40-F.
CONTRACTUAL OBLIGATIONS
The information provided in the table entitled “Contractual Obligations” under the section entitled “Liquidity and Capital Resources” on page 8 in the Management’s Discussion and Analysis, which is filed as Exhibit 3 to this Annual Report on Form 40-F.
IDENTIFICATION OF THE AUDIT COMMITTEE
The Registrant has a separately designated standing Audit Committee established in accordance with section 3(a)(58)(A) of the Exchange Act. The members of the Audit Committee are L. Frederick Sutherland (Chair), John (Jack) P. Curtin, Jr., Katherine M. Lee and Edward Waitzer.
CORPORATE GOVERNANCE
The Registrant is a “foreign private issuer” as defined in Rule 3b-4 under the Exchange Act and its Subordinate Voting Shares are listed on the Toronto Stock Exchange and the NASDAQ Global Select Market. NASDAQ Stock Market Rule 5615(a)(3) permits a foreign private issuer to follow its home country practices in lieu of certain requirements in the NASDAQ Listing Rules. A foreign private issuer that follows home country practices in lieu of certain corporate governance provisions of the NASDAQ Listing Rules must disclose each NASDAQ corporate governance requirement that it does not follow and include a brief statement of the home country practice the issuer follows in lieu of the NASDAQ corporate governance requirement(s), either on its website or in its annual filings with the SEC. A description of the significant ways in which the Registrant’s corporate governance practices differ from those followed by domestic companies pursuant to the applicable NASDAQ Listing Rules is disclosed on the Registrant’s website at https://corporate.colliers.com/en/Investor-Relations/Governance-Documents.
MINE SAFETY DISCLOSURE
Not applicable.
DISCLOSURE REGARDING FOREIGN JURISDICTIONS THAT PREVENT INSPECTIONS
Not applicable.
RECOVERY OF ERRONEOUSLY AWARDED COMPENSATION
Not applicable.
UNDERTAKING AND CONSENT TO SERVICE OF PROCESS
A. Undertaking
The Registrant undertakes to make available, in person or by telephone, representatives to respond to inquiries made by the staff of the SEC, and to furnish promptly, when requested to do so by the SEC staff, information relating to the securities registered pursuant to Form 40-F; the securities in relation to which the obligation to file an Annual Report on Form 40-F arises; or transactions in said securities.
B. Consent to Service of Process
The Registrant has previously filed with the SEC an Appointment of Agent for Service of Process and Undertaking on Form F-X.
Any change to the name or address of the agent for service of process of the Registrant shall be communicated promptly to the SEC by an amendment to the Form F-X referencing the file number of the Registrant.
SIGNATURES
Pursuant to the requirements of the Exchange Act, the Registrant certifies that it meets all of the requirements for filing on Form 40-F and has duly caused this annual report to be signed on its behalf by the undersigned, thereto duly authorized.
| Date: February 15, 2024 |
COLLIERS INTERNATIONAL GROUP INC. |
|
| By: |
/s/ Christian Mayer |
|
| Name: Christian Mayer |
||
| Title: Chief Financial Officer | ||
EXHIBIT INDEX
| Exhibit No. |
Document |
| Annual Information Form of the Registrant for the year ended December 31, 2023. |
|
| Management’s Discussion and Analysis of the Registrant for the year ended December 31, 2023. |
|
| 101 |
Interactive Data File. |
| 104 |
Cover Page Interactive Data File (formatted as Inline XBRL and contained in Exhibit 101) |
Exhibit 1
TABLE OF CONTENTS
This Annual Information Form contains, and incorporates by reference, “forward looking statements” which reflect the current expectations, estimates, forecasts and projections of management regarding our future growth, results of operations, performance and business prospects and opportunities. Wherever possible, words such as “may,” “would,” “could,” “will,” “anticipate,” “believe,” “plan,” “expect,” “intend,” “estimate,” “aim,” “endeavour” and similar expressions have been used to identify these forward-looking statements. These statements reflect management’s current beliefs with respect to future events and are based on information currently available to management. Forward-looking statements involve significant known and unknown risks, uncertainties and assumptions. Many factors could cause our actual results, performance or achievements to be materially different from any future results, performance or achievements that may be expressed or implied by such forward-looking statements, including, without limitation, those listed in the “Risk Factors” section of this Annual Information Form. Should one or more of these risks or uncertainties materialize, or should assumptions underlying the forward-looking statements prove incorrect, actual results, performance or achievements could vary materially from those expressed or implied by the forward-looking statements contained in this Annual Information Form. These factors should be considered carefully and readers should not place undue reliance on the forward-looking statements. Although the forward-looking statements contained, or incorporated by reference into, this Annual Information Form are based upon what management currently believes to be reasonable assumptions, we cannot assure readers that actual results, performance or achievements will be consistent with these forward-looking statements. These forward-looking statements are made as of the date of this Annual Information Form and we do not intend, and do not assume any obligation, to update or revise these forward-looking statements, except as otherwise required by law.
COLLIERS INTERNATIONAL GROUP INC.
ANNUAL INFORMATION FORM
February 15, 2024
All amounts referred to in this Annual Information Form (“AIF”) are in United States dollars unless otherwise indicated. All financial and statistical data in this AIF is presented as at December 31, 2023 unless otherwise indicated.
Colliers International Group Inc. (“we,” “us,” “our,” “Colliers,” or the “Company”) was formed under the Business Corporations Act (Ontario) by Articles of Arrangement dated June 1, 2015. The predecessor to the Company, FirstService Corporation (“Old FSV”), was formed by Articles of Incorporation dated February 25, 1988. Old FSV amalgamated with Coloma Resources Limited pursuant to Articles of Amalgamation dated July 31, 1988, and the amalgamated corporation continued as Old FSV.
By Articles of Amendment dated April 2, 1990, Old FSV: (i) consolidated each of its Class A Subordinate Voting Shares on a 30 to 1 basis and changed the designation of that class of shares to “Subordinate Voting Shares”, each such share carrying one vote; and (ii) consolidated each of its Class B shares on a 30 to 1 basis and changed the designation of that class of shares to “Multiple Voting Shares”, each such share carrying 20 votes.
By Certificate of Amendment dated June 27, 2007, the first series of Preference Shares of Old FSV were created and designated as 7% cumulative preference shares, series 1 (the “Preferred Shares”), with each Preferred Share having a stated value of US$25.00 and carrying a fixed cumulative annual dividend of US$1.75 payable quarterly. All outstanding Preferred Shares were eliminated on May 3, 2013 by way of a partial redemption for cash of $39.2 million immediately followed by a mandatory conversion of all then remaining Preferred Shares into Subordinate Voting Shares, which resulted in the issuance of 2.89 million new Subordinate Voting Shares.
On June 1, 2015, Old FSV completed a plan of arrangement (the “Spin-off”) which separated Old FSV into two independent publicly traded companies – Colliers, a global leader in diversified professional real estate services and new FirstService Corporation (“FirstService”), the North American leader in residential property management and related services. The Spin-off was designed to enhance long-term value for shareholders by creating two independent and sustainable companies, each with the ability to pursue and achieve greater success by employing independent value creation strategies best suited to its core businesses and customers. Under the Spin-off, Old FSV shareholders received one Colliers share and one FirstService share of the same class as each Old FSV share previously held, Old FSV amalgamated with a wholly-owned subsidiary and changed its name to Colliers and FirstService adopted the name “FirstService Corporation”.
On April 16, 2021, after receiving approval from 95% of disinterested shareholders, the Company completed the previously announced transaction to settle the Management Services Agreement, including the LTIA, between Colliers, Jay S. Hennick and Jayset Management CIG Inc., a corporation controlled by Mr. Hennick. This transaction also established a timeline for the orderly elimination of Colliers’ dual class voting structure by no later than September 1, 2028.
Our Subordinate Voting Shares are publicly traded on both the Toronto Stock Exchange (“TSX”) (symbol: CIGI) and the NASDAQ Stock Market (“NASDAQ”) (symbol: CIGI). Our head and registered office is located at 1140 Bay Street, Suite 4000, Toronto, Ontario, M5S 2B4. Our fiscal year-end is December 31.
Intercorporate Relationships
We have the following principal subsidiaries which have total assets or revenues which exceed 10% of our total consolidated assets or revenues as at and for the year ended December 31, 2023:
|
Name of Subsidiary |
Percentage of Voting Securities Owned |
Jurisdiction of Incorporation, Continuance, Formation or Organization |
|
Colliers International EMEA Holdings Ltd. |
100% |
England & Wales |
|
Colliers International Holdings (USA), Inc. |
100% |
Delaware |
|
Colliers International USA, LLC |
100% |
Delaware |
|
Colliers Investment Management Holdings, Inc. |
100% |
Delaware |
|
Colliers Macaulay Nicolls Inc. |
100% |
Ontario |
|
Colliers Macaulay Nicolls (Cyprus) Ltd. |
100% |
Cyprus |
|
Harrison Street Real Estate Capital, LLC |
75% |
Delaware |
|
Colliers International Holdings Limited |
100% |
British Virgin Islands |
|
CI Holdings (USA), LLC |
100% |
Delaware |
|
Colliers International WA, LLC |
100% |
Delaware |
|
Colliers Engineering & Design Inc. |
65% |
New Jersey |
The above table does not include all of the subsidiaries of Colliers.
General development of the business
Our origins date back to 1972 when Jay S. Hennick, the Chairman & CEO of the Company, started a Toronto commercial swimming pool and recreational facility management business, which became the foundation of Old FSV. In 1993, we completed our initial public offering on the TSX, raising C$20 million. In 1995, our shares were listed on NASDAQ. In 1997, a second stock offering was completed in Canada and the United States raising US$20 million. In December 2004, a stock dividend was declared effectively achieving a 2-for-1 stock split for all outstanding Subordinate Voting Shares and Multiple Voting Shares. In 2009, Old FSV issued $77 million of convertible unsecured subordinate debentures, which were subsequently converted into 2.7 million Subordinate Voting Shares in 2014. In 2020, the Company issued $230 million of Convertible Senior Subordinate Notes (“Convertible Notes”), which were subsequently converted or redeemed into 4.0 million Subordinate Voting Shares in 2023.
From 1994 to present, we completed numerous acquisitions and selected divestitures, developing, growing and focusing on the diversified professional services provided by us today.
In 2004, we established a commercial real estate services division under the “Colliers International” brand with the acquisition of Colliers Macaulay Nicolls Inc. (“CMN”). Since that time, we have strengthened this business across markets and acquired numerous businesses within existing and new markets, greatly expanding its geographic scope, services and talent. Today, Colliers is one of the world’s largest commercial real estate services providers offering a full range of commercial real estate services in the United States, Canada, Australia, the United Kingdom, Germany, New Zealand, China and several other countries in Asia, Europe and Latin America.
In 2015, we completed the Spin-off, creating two independent publicly traded companies: Colliers in commercial real estate services and FirstService in residential property management and related services.
In September 2016, we acquired ICADE Asset Management and ICADE Conseil (“ICADE”), an asset management and investor advisory services platform in France. The acquisition established the Company’s Investment Management service line, with €2 billion of assets under management (“AUM") in Europe.
In July 2018, we acquired 75% of the ownership interests in Harrison Street Real Estate Capital, LLC (“Harrison Street”), a real estate investment firm dedicated to demographic-based investing with approximately $15.6 billion in AUM as of June 30, 2018. The senior management team of Harrison Street holds the balance of the equity. Headquartered in Chicago, with offices in New York, San Francisco, Washington, D.C., Toronto, Tokyo and London. Harrison Street is a pioneer in demographic-based real estate investing.
In May 2020, we acquired a controlling interest in four subsidiaries of Dougherty Financial Group LLC – Dougherty Mortgage LLC, Dougherty & Company LLC, Dougherty Funding LLC and Dougherty Insurance Agency LLC (together “Dougherty”). Dougherty’s mortgage banking operations were rebranded as “Colliers Mortgage” which provides specialty debt financing through its relationships with US government agencies while all brokerage, investment banking, capital markets and public finance services are carried on through “Colliers Securities” which is licensed under the Securities and Exchange Commission and is a member of the Financial Industry Regulatory Authority (“FINRA”).
In July 2020, we acquired a controlling interest in Maser Consulting P.A. (“Maser”), a multi-disciplinary engineering design and consulting firm in the United States The operation was rebranded as “Colliers Engineering & Design” in 2021.
In April 2022, we completed the acquisition of controlling interests in Antirion SGR S.p.A. (“Antirion”), a real estate investment management firm in Italy, and its commercial real estate services affiliate (which collectively consists of Colliers International Italia S.p.A., Colliers Real Estate Services Italia S.R.L. and Colliers Real Estate Management Services S.R.L.). Subsequent to the acquisition, Antirion was subsequently rebranded as Colliers Global Investors.
In June 2022, we acquired a 75% controlling interest in Basalt Infrastructure Partners LLP (“Basalt”), a London-based transatlantic infrastructure investment management firm. The acquisition added highly differentiated investment products in the utility, transportation, energy/renewables and communications sectors to the Company’s Investment Management service line.
In July 2022, we completed the acquisition of a 65% controlling interest in Rockwood Capital, LLC (“Rockwood”), a US real estate investment management firm. Rockwood specializes in equity and credit investments across multifamily, office, mixed use, life science, hospitality, and retail asset classes in North America.
In August 2022, we acquired a controlling interest in PeakUrban Pty Limited (“PeakUrban”), a civil, infrastructure, water engineering, town planning and urban design company in Australia, thereby establishing a new engineering service line in the country. The business has rebranded as Colliers Engineering & Design and integrated into Colliers’ existing Australian operations.
In October 2022, we acquired a 75% controlling interest in Versus Capital (“Versus”), a US alternative real asset management firm with private wealth distribution capabilities.
In December 2022, we acquired a controlling interest in Pangea Property Partners (“Pangea”), a real estate advisory firm in Sweden and Norway. Together with our existing operations in Denmark and Finland, Colliers has established itself as a one of the leading Capital Markets firms in the Nordic region.
Narrative description of Colliers
History
CMN traces its roots back to 1898 when Macaulay Nicolls was founded in Vancouver, Canada as a property management and insurance agency. Colliers originated in 1976 in Australia through the merger of three commercial property services firms. In 1984, Colliers joined forces with Macaulay Nicolls to form CMN. Over the years, Colliers continued to grow globally as other market leading commercial real estate service providers joined the group. In 2004, Old FSV acquired a controlling interest in CMN. At the time of the acquisition by Old FSV, CMN was generating approximately $250 million in annual revenue.
With the financial and strategic support of Old FSV, CMN accelerated its growth by adding company-owned operations, expanding into complementary service areas and growing into other geographic regions. By 2010, Old FSV had unified all operations globally under the “Colliers International” brand name with one mission and standardized business practices delivered consistently throughout all operations. Over the past 19 years, Colliers has been one of the fastest growing major, global diversified professional services and investment management companies based on revenue growth. A summary of Colliers’ history and growth initiatives to date is as follows:
|
Year |
Event |
|
|
1898 |
Macaulay Nicolls founded in Vancouver, Canada |
|
|
1976 |
Colliers International Property Consultants incorporated in Australia |
|
|
1984 |
Colliers International launches global expansion into Canada and the US as CMN |
|
|
1986 |
Colliers International merges operations in Australia and Asia establishing operations in 20 markets in Asia Pacific |
|
|
1990 |
Colliers International expands into emerging markets including Central Europe and Latin America |
|
|
2004 |
Old FSV acquires a controlling interest in CMN with a long-term strategy to consolidate operations and create one global organization, under one brand with consistent business practices applied globally |
|
|
2006 |
Between 2006 and 2010, CMN begins to strengthen and grow its global platform by acquiring additional Colliers International branded operations. In total, 29 acquisitions are completed in 15 countries around the world |
|
|
2010 |
The US operations of Colliers combine with CMN and re-brand under as “Colliers International” in all markets Original network structure is disbanded and Colliers International, controlled by Old FSV, becomes one of the largest and most recognized brands in commercial real estate globally |
|
|
2012 |
Colliers acquires the Colliers International operations in the United Kingdom and Ireland and integrates them into its global platform |
|
|
2013 |
Colliers acquires the German Colliers International operations and integrates them into its global platform |
|
|
2014 |
Colliers International voted to the top five in Global Outsourcing 100 for the first time in its history Colliers expands to France and Belgium |
|
|
2015 |
Colliers International Group Inc. begins trading on the NASDAQ and TSX on June 2, 2015 |
|
|
2016 |
Colliers establishes its Investment Management service line with the acquisition of French firm ICADE |
|
Year |
Event |
|
|
2017 |
Colliers acquires two of largest remaining non-owned Colliers International branded operations in the United States. Colliers acquires the Colliers International operations in Denmark |
|
|
2018 |
Colliers acquires a controlling interest in Harrison Street, a real estate investment management firm dedicated to demographic-based investing |
|
|
2019 |
Colliers acquires a controlling interest in Synergy Property Development Services, a project management services firm in India |
|
|
2020 |
Colliers acquires a controlling interest in Dougherty and establishes a US debt finance and loan servicing platform Colliers acquires a controlling interest in Maser, a multi-discipline engineering design service firm in the US |
|
|
2021 |
Colliers releases first Global Impact Report, highlighting its commitment to embedding environmental, social and corporate governance (“ESG”) best practices across the organization Settlement of Long-Term Incentive Arrangement with the Company’s Chairman and CEO as approved by 95% of the Company’s disinterested shareholders. As part of the settlement, the Company established a timeline for the orderly elimination of Colliers’ dual class voting structure by no later than September 1, 2028 Colliers acquires Bergmann (“Bergmann”), an engineering & design services firm located in the US Northeast, Midwest and Mid-Atlantic regions |
|
|
2022 |
Colliers deploys $1 billion in acquisitions, particularly in Investment Management - Acquires KFW Engineers & Surveying (“KFW”), a Texas-based civil engineering, design and survey firm - Acquires controlling interest in Antirion, a real estate investment management firm in Italy, and Italy affiliate - Acquires controlling interest in Paragon, a building consultancy and project management firm in the UK - Acquires controlling interest in Basalt, a transatlantic infrastructure investment management firm with operations in Europe and North America - Acquires controlling interest in Rockwood, a US real estate investment management firm - Establishes Engineering & Design service line in Australia with the acquisition of PeakUrban - Acquires a controlling interest in Versus, a US alternative real asset management firm with private wealth distribution capabilities - Acquires controlling interest in Pangea, a real estate advisory firm in the Nordics Colliers discontinues its operations in Russia and terminates its affiliate in Belarus |
|
|
2023 |
Colliers bolsters its Engineering & Design and Project Management capabilities in Australia, New Zealand and the United States with three acquisitions |
Service offerings
Recurring Services (59% of revenues)
Recurring services are comprised of our Outsourcing & Advisory and Investment Management service lines. These services are high value-add professional services with most of the revenues contractual and recurring or repeat in nature.
Outsourcing & Advisory
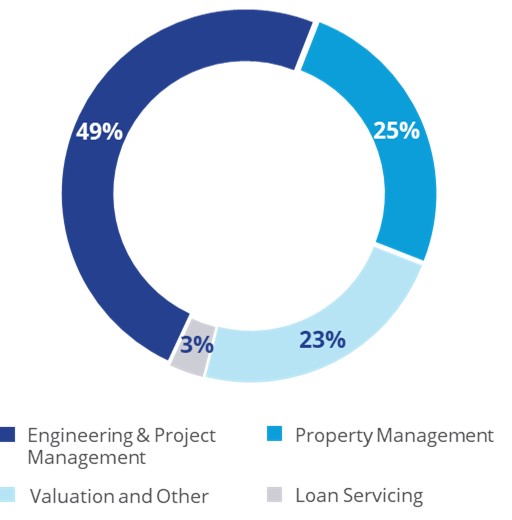
Our Outsourcing & Advisory Services operations include Engineering and Project Management, Property Management, Valuation and other services as well as Loan Servicing for commercial real estate clients. In addition, we also partner with large occupiers in managing their overall real estate portfolios and transactions, providing corporate and workplace solutions to reduce costs, improve execution across multiple markets and increase operational efficiency. Professional staff combines proprietary technology with high level strategic planning, portfolio management, lease administration and facilities and project management to deliver bespoke solutions to our clients. In general, Outsourcing & Advisory services revenues are derived from fees which are typically contractual, both fixed and fee for service, and contract terms are often multi-year providing recurring or repeat revenues. Outsourcing & Advisory Services has approximately 8,400 revenue producers globally.
2023 Outsourcing & Advisory Revenue
Our Outsourcing & Advisory Services include:
|
• |
Engineering & Project Management Services: We established our Engineering & Design service line with the acquisition of Maser in 2020 and further enhanced this service offering with several subsequent tuck-in acquisitions. Our vision is to lead the industry with proven expertise and innovative, sustainable solutions through exceptional work and client experience. We offer a full range of consulting and engineering design services for property & buildings, transportation and infrastructure, environmental, telecommunications, civil/site and utilities end-markets through a dedicated team of approximately 2,300 employees. Our professionals include licensed engineers, planners, surveyors, landscape architects and environmental scientists. Our client base is diversified with a balanced mix of both public and private sector clients in the United States and Australia focused on the middle market. Our client centered approach enables us to foster long-term relationships which translate to repeat work from our clients. As a result of our focus on service and client diversification, our business is resilient, allowing us the ability to respond to changing market conditions quickly and effectively. We intend to grow this service offering through acquisitions in other geographies around the world. |
| In addition to Engineering services, we provide Project Management services for a wide range of projects globally, focusing on the middle market. These services include bid document review, construction monitoring and delivery management, contract administration and integrated cost control, development management, facility and engineering functionality, milestone and performance monitoring, quality assurance, risk management and strategic project consulting. Our projects span across multiple industries, including infrastructure, education, healthcare, utilities, federal, state and municipal, as well as turnkey projects for occupiers and landlords. As of December 31, 2023, we had 2,500 employees in our Project Management service line. |
|
• |
Property Management Services: Property Management provides oversight and management of the daily operations of a single property or portfolio of properties and provides on-going strategic advice on ways in which clients can maximize the value of their properties. Services include building operations and maintenance, facilities management, lease administration, property accounting and financial reporting, contract management and construction management. We ensure that we implement the owner’s specific property value enhancement objectives through maximization of opportunities to help clients ensure excellent tenant relations while maximizing property level cash flows. |
|
• |
Valuation & Advisory Services: We provide clients with an opinion of a property’s value that complies with a client’s requirements and applicable professional standards and regulations to offer a nuanced understanding of the property and broader market trends. Our advisors leverage technology to offer clients both speed and accuracy while maintaining a dedicated project leader and senior management oversight to ensure quality and accountability. Services include valuation and appraisal review and management, portfolio or single asset valuation, arbitration and consulting, research, highest and best use studies, property tax reviews as well as appeals and litigation support. |
|
• |
Occupier Services: We work as an extension of a client’s team to provide deep expertise and a comprehensive set of portfolio management, transaction management, project management, workplace solutions, strategic consulting, property and asset management as well as other real estate services. Our Occupier Services clients are typically companies or public sector institutions with large, highly distributed real estate portfolios. We typically enter into long-term, contractual relationships with these clients to ensure that real estate strategies are developed to support their overall business needs. This service line offers clients a fully integrated suite of services under the leadership and accountability of an account leader or team who are responsible for overall performance around the world. Many of our contracts contain fees that are tied to performance against client objectives (such as cost and footprint reduction, cycle-time improvement, and customer satisfaction) instead of fees based solely on transaction commissions. Our Occupier Services teams have a unified value proposition which is to deliver customized, accountable, and innovative real estate solutions that result in the best service experience and alignment with our client’s core business strategy. We have developed technology through Colliers360 (which provides clients with user-friendly, fast and flexible dashboard and analytics technologies via a secure portal) which allows us to measure performance and help our clients make efficient, well-informed decisions regarding their real estate portfolio. Colliers360 also includes business intelligence that populates data from various independent and client related sources. In 2020, we added the Workplace Expert tool to Colliers360 suite of technology apps that recommends clients different office environments and potential configurations tailored specific to their business needs. We also provide lease administration, transaction, project management and facilities management systems. |
|
• |
Workplace Strategy: We provide a full suite of visioning, change management and strategic consulting services to occupiers to maximize the effectiveness of their workplace. These consulting services are designed to help clients turn their real estate into a competitive advantage to recruit and retain talent through the analysis and design of an optimal work environment. These services also include advice on various approaches to optimizing the “return to work” strategy of clients around the world. |
|
• |
Property Marketing: We provide turnkey property marketing solutions for both commercial and residential projects to generate demand and attract credit-worthy tenants and investors. We have made a significant investment in our property marketing strategies, increasing volumes of leads and reducing time-on-market. The majority of the leads we generate for our clients now come from online sources. By transforming the typical industry marketing mix, we can both reduce costs and decrease lease-up time. Our property marketing platform engages with both domestic and international buyers. |
|
• |
Loan Servicing: We service loans originated under contractual arrangements associated with our debt finance operations. Our services include managing the administrative aspects of the loan, including collection of monthly payments, maintenance of records and management of escrow funds among others. Our loan servicing portfolio was $13.1 billion as at December 31, 2023 and had an average remaining life of 16.5 years. |
Investment Management
Our Investment Management segment is a global alternative asset manager with long-standing, cycle tested expertise across high growth and defensive sectors within real assets. Our differentiated approach focuses on demographic, needs-based and essential real assets; middle-market infrastructure like communications, transport, energy, and utilities; real asset private credit; and premier core and opportunistic real estate strategies. We invest capital for the long-term through our differentiated strategies that have strong tailwinds, are resilient through cycles, and are designed to deliver top-tier risk-adjusted returns. We serve more than 900 clients across the globe, including institutional investors, sovereign wealth funds, public and corporate pension funds, endowments, insurance companies, foundations and family offices.
Since 2016, when we first established Investment Management operations in Europe, with the acquisition of ICADE, an asset management and investor advisory services platform in France, our platform has delivered superior growth, fueled by strong fundraising across all our products and investment vehicles.
During the same time, our AUM (please refer “Reconciliation of non-GAAP financial measures” section) has grown to $98 billion, more than 40x since 2016, fueled by strong acquisition activity and fundraising. In July 2018, Colliers acquired a 75% ownership interest in Harrison Street, a real estate investment firm dedicated to demographic-based investing, establishing itself as a leading player in the alternative private capital industry. Harrison Street is headquartered in Chicago, with offices in New York, San Francisco, Washington, D.C., Toronto, Tokyo and London, and has more than 250 employees. In 2022, Harrison Street was ranked 26th in the PERE Top 100 Private Real Estate Managers and also received five PERE Awards, including ‘Alternatives Investor of the Year’ globally. In 2023, Harrison Street was named as the “Best Place to Work in Money Management” by Pension & Investments for the ninth year. Members of the senior management team hold a 25% redeemable non-controlling equity interest in Harrison Street. As of December 31, 2023, Harrison Street had $57.4 billion in AUM.
In 2022, the Company made a concerted effort to significantly expands its investment management capabilities, acquiring majority ownership interests in new platforms across different product types, including infrastructure, alternatives, traditional real estate and credit in North America and Europe, specifically in long-duration, highly differentiated assets under management.
In April 2022, we completed the acquisition of controlling interests in Antirion, a real estate investment management firm in Italy, which was subsequently combined with our existing operations in the UK and France and rebranded as Colliers Global Investors. Members of the senior management team hold a 35% redeemable non-controlling equity interest in Antirion. Together with existing Investment Management operations in Europe, our AUM for Colliers Global Investors were $8.1 billion as of December 31, 2023.
In June 2022, we acquired a 75% controlling interest in Basalt, a London-based transatlantic infrastructure investment management firm. Established in 2011, Basalt employs approximately 40 professionals in the US and Europe. Members of the senior management team hold a 25% redeemable non-controlling equity interest in Basalt. As of December 31, 2023, Basalt had $10.9 billion in AUM.
In July 2022, we completed the acquisition of a 65% controlling interest in Rockwood, a US real estate investment management firm, specializing in equity and credit investments across traditional real estate in North America. As of December 31, 2023, Rockwood had $16.6 billion in AUM.
In October 2022, we acquired a 75% controlling interest in Versus, a US alternative real asset management firm with private wealth distribution capabilities. As of December 31, 2023, Versus had $5.3 billion in AUM.
In total, as of December 31, 2023, the Company had $98.2 billion of AUM, with 88% in perpetual or long-dated investment strategies. We deploy capital across four main investments strategies, namely, alternatives, infrastructure, traditional real estate and credit, with more than 70% deployed in highly defensive alternative and infrastructure asset classes. The Company’s fee-paying assets under management (“FPAUM”) (See “Reconciliation of non-GAAP financial measures”) were $50.8 billion as of December 31, 2023.
Long Duration, Highly Differentiated AUM
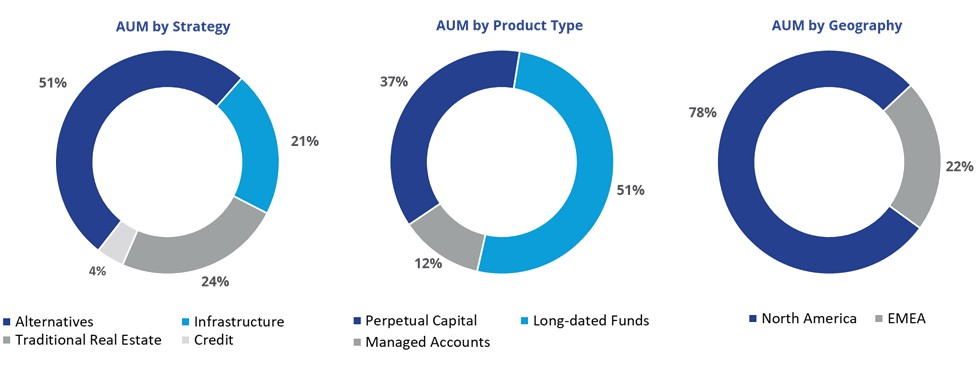
The Company’s investment products consist of (i) perpetual funds, (ii) long-dated funds and (iii) separately managed accounts. We generate contractual management fee revenue from each of the funds and separately managed accounts under our management and have an opportunity to generate carried interest revenues on long-dated funds under our management.
Perpetual (open-end) funds
In our perpetual funds, management fees are based on net asset value (“NAV”). NAV is calculated quarterly using data from third party valuation advisors to determine the current market value of the private real estate and real assets in the funds.
Investors in our perpetual funds may invest on a quarterly basis at the then-current NAV. Investors can also request to have their interests redeemed on a periodic basis, at the then-current NAV. There are typically restrictions around redemption requests, including lock-up periods and gating provisions that restrict the amount that can be redeemed in any quarterly period in order to preserve fund liquidity and to ensure the efficient operation of the fund for the benefit of all investors. We also have flexibility in the timing of funding redemptions given the underlying illiquid nature of the funds’ private real estate and real assets. In such instances, the funds may invoke a queue system with the redemption requests processed on a pro rata basis.
Long-dated (closed-end) funds
Our long-dated funds typically have a ten-year term with two one-year extensions, at the option of the manager. However, this can vary between different investment strategies and platforms.
We generate management fees based on committed capital or invested capital in these funds. Committed capital is used to calculate fees during the investment period, which typically comprises the first 3 years of a fund’s life. Management fees commence on the date of a fund’s “first close”, which is the date that the initial investors legally commit to invest in the fund. Additional investors may commit to invest in the fund during the investment period, however they are required to pay management fees from the “first close” date. This results in our recognition of “catch-up” management fees when such investors make commitments after the first close date. Once a fund is fully invested (i.e., after the end of the investment period), the management fee is calculated based on invested capital, which is typically 90-95% of the committed capital amount.
In addition to the contractual management fee, we are also entitled to earn performance fees (sometimes referred to as carried interest) on long-dated funds, provided that we meet or exceed certain contractually agreed preferred return targets. Carried interest revenue is recognized when it is highly probable that such return targets will be exceeded, typically when the fund is near the end of its life and the underlying fund assets have been sold or are in the process of being sold. Colliers is only entitled to receive carried interest on funds established on or after acquisition dates of its Investment Management platforms. Historical carried interest on funds established prior to acquisition dates is structured as a pass-through to the sellers with no impact on the Company’s earnings.
Management fee revenue is expected to be relatively stable and recurring due to: (i) historically consistent fund financial performance at or exceeding industry benchmarks, which we anticipate will continue in the future; (ii) the generally defensive nature of the sectors being invested in by the funds; and (iii) management fees for long-dated funds based on committed capital or invested capital rather than marked-to-market NAV, providing for revenue stability throughout the life of the funds regardless of the underlying market value of fund assets.
Separately managed accounts
The Company also has separately managed accounts (“SMAs”) where we agree to provide investment management services to individual institutional investors to fulfill their specific long-term investment objectives, investing directly in private real estate and real assets. SMAs are subject to contractual management agreements, with management fees earned based on NAV and/or in connection with the acquisition or disposition of assets.
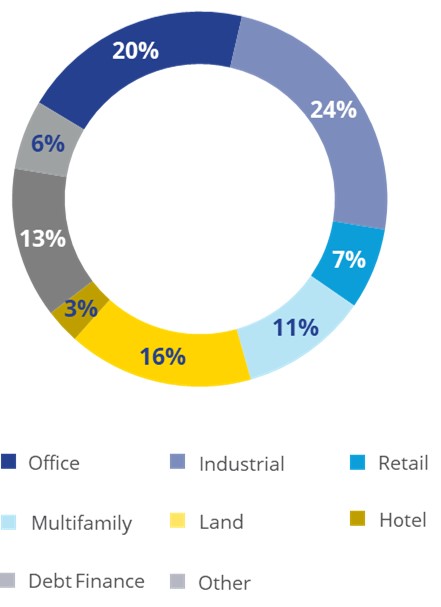
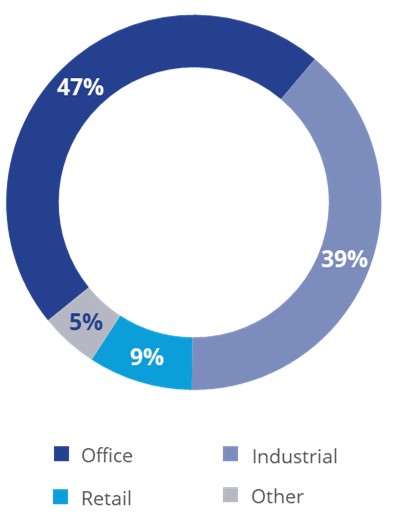
Capital Markets and Leasing (41% of revenues)
We provide transaction brokerage services in sales and leasing for commercial clients including corporations, financial institutions, pension funds, sovereign wealth funds, insurance companies, governments and individuals. Our 4,400 professional advisors work with all asset classes, including office, industrial, retail, multi-family, hospitality, health care and mixed-use properties. In 2023, we completed 46,000 sale and lease transactions for a total transaction value of $90 billion.
Capital Markets
Our Capital Markets services include property sales brokerage for commercial clients as well as debt finance services related to the origination and sale of multifamily and commercial mortgage loans. Our advisors assist buyers and sellers in connection with the acquisition or disposition of real estate and assist borrowers and lenders with the placement of debt capital on commercial real estate assets. Our advisors typically perform their services for commissions calculated based on the value of a transaction. We execute transactions across a diverse client base, including corporations, financial institutions, pension funds, sovereign wealth funds, insurance companies, governments and individuals.
2023 Capital Markets Revenues By Asset Class
We provide Capital Markets services in the following areas:
|
• |
Property Sales: Colliers’ sales advisors are professionals that work collaboratively to provide real estate expertise to our clients, acting in a consultancy capacity to help each client maximize investment returns, whether as a buyer, seller or borrower. Our advisors are organized into office, industrial, retail, multifamily, hospitality, healthcare, alternatives and special purpose teams in order to drive thought leadership for each major asset class. Many team members also represent subspecialties in areas such as Affordable Housing, Data Centers, Student Housing, Seniors Housing, Land, Self-Storage and Transit Oriented Development. These investment teams are further organized in subsets to meet the needs of both our institutional and private capital clients, recognizing that these client groupings have different needs. These investment teams understand the intricacies of single asset and portfolio executions and, with the assistance of our advisors, are globally connected with active market participants. Integrally supporting these investment teams are national and/or regional groups of debt & equity financing advisors that help both our institutional and private capital clients with senior and subordinated debt strategies and placements with a global network of capital providers. Many of our financing advisors have experience helping our clients with preferred and common equity strategies and placements, including partnership capitalizations and recapitalizations. Our financing professionals are in the market continuously with these capital sources, providing our clients with significant market intelligence and leverage when evaluating their financing needs. Our teams work closely with each service line, including property management, project management, leasing, and valuations in order to serve the broader business needs of each client. |
|
• |
Debt Finance Services: Through Colliers Mortgage, we provide specialty debt financing for multifamily housing, healthcare and senior housing real estate through US Government Sponsored Agencies. This includes origination, underwriting and asset management for Fannie Mae, the Federal Housing Administration / US Department of Housing and Urban Development (FHA/HUD) and the US Department of Agriculture (USDA). Loan origination and placement lead to Loan Servicing – see “Loan Servicing” above. Colliers Mortgage also provides commercial property loan placement to institutional investors as well as loan syndication. In markets outside the US, we provide loan placement services to owners of real estate. In 2023, the Company originated a total volume of $2.2 billion. |
|
• |
Mortgage Investment Banking: Colliers Securities provides brokerage, investment banking, capital markets services, public finance services and other real estate related activities in the US. |
Leasing
We provide Lease brokerage services to owners and occupiers of commercial real estate across all major asset classes. Our long-standing relationships with both large and medium-sized occupiers and owners ensure that our services are engaged on a repeat basis for lease renewals or negotiations.
2023 Leasing Revenues By Asset Class
We provide Leasing services as follows:
|
• |
Landlord Representation: Agency advisors work on behalf of property owners to search for and obtain tenants by strategically positioning and promoting the property through various campaigns and marketing channels. Our advisors look to secure the right tenants for clients’ properties, help owners avoid common pitfalls of the leasing process and otherwise support landlord ownership goals for their real estate assets. Agency advisors work closely with our Property Management professionals to secure tenants for properties we manage. |
|
• |
Tenant Representation: Our advisors work on behalf of tenants to lease the right space in the right location and secure the most favorable terms. Our advisors help to turn a lease, often the second-greatest expenditure for a business after payroll, from a cost center into a competitive advantage that can elevate a client’s brand, streamline their operations, attract leading talent and make a meaningful impact to their business. |
ESG Strategy
In 2021, the Company announced its ‘Elevate the Built Environment’ strategic framework designed to embed ESG best practices across the organization. In addition, Colliers committed to setting a science-based target through the Science-Based Targets initiative’s (SBTi) Business Ambition for 1.5°C program as well as achieving Net Zero for the Company’s own operations by 2030. The SBTi target was formally approved in June 2023. Goals for the remaining areas of the Company’s framework to address material topics across three core areas identified through strong stakeholder engagement are detailed below:
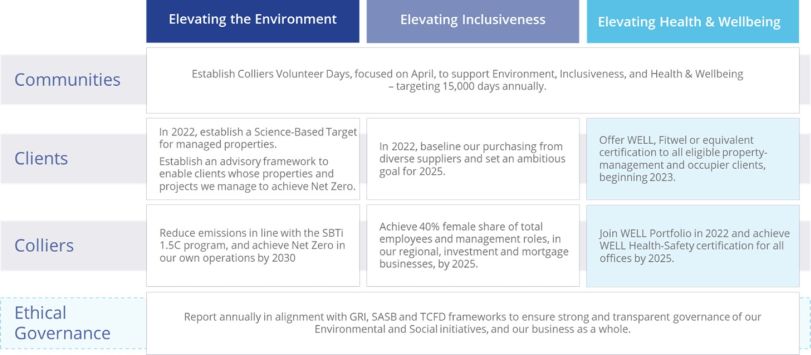
Governance structures and working groups have been established to execute on each of these objectives. The Company publishes an annual Global Impact Report outlining its commitments, performance, and progress. This report is released in June each year and can be found on the Company’s website.
In 2023, the Company signed the World Green Building Council’s (WGBC) Net Zero Carbon Buildings Commitment, which calls for emissions from buildings globally to be halved by 2030, and advocates for total decarbonization of buildings in operation no later than 2050.
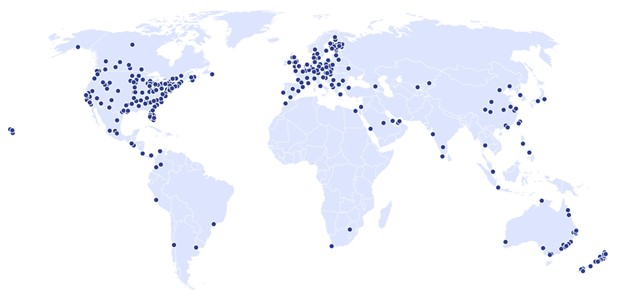
Geographic locations
We deliver services from 385 offices in 34 countries companywide (not including affiliates). Operationally, we have organized our business and report our results through four segments. For the year ended December 31, 2023:
1. Americas represented 58% of our global revenues (46% generated in the United States, 10% in Canada and 2% in Latin America);
2. EMEA represented 17% of our global revenues, comprising operations in 19 countries;
3. Asia Pacific represented 14% of our revenues, comprising operations in 10 countries; and
4. Investment Management represented 11% of our revenues, comprising operations in 4 countries.
Below is a map reflecting the geographic location of our company-owned and affiliate offices:
Operating segments
|
Revenues by operating segment |
Year ended December 31 |
||||||||
|
(in thousands of US$) |
2023 |
2022 |
2021 |
||||||
|
Americas |
$ | 2,510,002 | $ | 2,756,345 | $ | 2,489,217 | |||
| EMEA | 726,900 | 715,140 | 672,737 | ||||||
| Asia Pacific | 610,313 | 608,460 | 673,661 | ||||||
| Investment Management | 487,457 | 378,881 | 252,890 | ||||||
| Corporate | 469 | 661 | 624 | ||||||
| Total | $ | 4,335,141 | $ | 4,459,487 | $ | 4,089,129 | |||
|
Operating earnings by operating segment |
Year ended December 31 |
|||||||||||||||||||||||
|
(in thousands of US$ and as a % of revenues) |
2023 |
2022 |
2021 |
|||||||||||||||||||||
|
Americas |
$ | 174,613 | 7.0 | % | $ | 254,375 | 9.2 | % | $ | 233,788 | 9.4 | % | ||||||||||||
| EMEA | 5,483 | 0.8 | % | 9,891 | 1.4 | % | 59,606 | 8.9 | % | |||||||||||||||
| Asia Pacific | 62,709 | 10.3 | % | 72,256 | 11.9 | % | 82,023 | 12.2 | % | |||||||||||||||
| Investment Management | 103,139 | 21.2 | % | 37,055 | 9.8 | % | 63,659 | 25.2 | % | |||||||||||||||
| Corporate | (45,009 | ) | N/A | (41,081 | ) | N/A | (570,577 | ) | N/A | |||||||||||||||
| Total | $ | 300,935 | 6.9 | % | $ | 332,496 | 7.5 | % | $ | ( 131,501 | ) | (3.2 | )% | |||||||||||
|
Adjusted EBITDA1 by operating segment |
Year ended December 31 |
|||||||||||||||||||||||
|
(in thousands of US$ and as a % of revenues) |
2023 |
2022 |
2021 |
|||||||||||||||||||||
|
Americas |
$ | 270,902 | 10.8 | % | $ | 332,347 | 12.1 | % | $ | 296,133 | 11.9 | % | ||||||||||||
| EMEA | 38,373 | 5.3 | % | 68,501 | 9.6 | % | 82,505 | 12.3 | % | |||||||||||||||
| Asia Pacific | 79,238 | 13.0 | % | 85,092 | 14.0 | % | 95,238 | 14.1 | % | |||||||||||||||
| Investment Management | 213,925 | 43.9 | % | 145,955 | 38.5 | % | 95,122 | 37.6 | % | |||||||||||||||
| Corporate | (7,445 | ) | N/A | (1,370 | ) | N/A | (24,660 | ) | N/A | |||||||||||||||
| Total | $ | 594,993 | 13.7 | % | $ | 630,525 | 14.1 | % | $ | 544,338 | 13.3 | % | ||||||||||||
Seasonality
The Company historically generates peak revenues and earnings in the month of December followed by a low in January and February as a result of the seasonal timing of closings on Capital Markets transactions. Revenues and earnings during the balance of the year are relatively even. The Capital Markets operations comprised 16% of our 2023 annual consolidated revenues. Variations can also be caused by business acquisitions or dispositions which alter the consolidated service mix.
1 Adjusted EBITDA is a financial measure that is not calculated in accordance with GAAP. For a reconciliation of this and other non-GAAP financial measures, see “Reconciliation of non-GAAP financial measures” in this AIF.
Trademarks
Our trademarks are important for the advertising and brand awareness of our businesses. We take precautions to defend the value of our trademarks by maintaining legal registrations and by litigating against alleged infringements, if necessary.
In markets where Colliers does not operate company-owned operations, we operate through affiliates operating under the “Colliers International” and “Colliers” brands and trademarks. To ensure brand unity and service quality, all affiliates are subject to brand and performance guidelines that are monitored and enforced by Colliers. We currently have affiliates in 32 countries around the world who together generated approximately $480 million in revenue in 2023, which are excluded from the Company’s consolidated results. In 2023, our affiliates completed 13,000 sale and lease transactions for a total transaction value of $14 billion.
Employees
We currently have approximately 19,230 employees worldwide as follows:
|
Segment |
Professional staff |
Support & administrative staff |
Total employees |
|||||||||
|
Americas |
6,320 | 3,820 | 10,140 | |||||||||
|
EMEA |
2,590 | 1,230 | 3,820 | |||||||||
|
Asia Pacific |
3,870 | 880 | 4,750 | |||||||||
|
Investment Management |
330 | 190 | 520 | |||||||||
|
Total operations |
13,110 | 6,120 | 19,230 | |||||||||
Non-controlling interests
In many cases, operating management teams of our majority-owned subsidiaries own minority equity stakes in the businesses they operate day-to-day. This structure was designed to maintain control at Colliers while providing significant risks and rewards of equity ownership to management at the operating businesses. In almost all cases, we have the right to “call” management’s shares, usually payable at our option with any combination of Subordinate Voting Shares or cash. We may also be obligated to acquire certain of these non-controlling interests in the event of death, disability or cessation of employment or if the shares are “put” by the holder, subject to annual limitations on these puts imposed by the relevant shareholder agreements. These arrangements provide significant flexibility to us in connection with management succession planning and shareholder liquidity matters.
Our growth strategy
With our global scale, we are transforming our business model to further balance and diversify our business, and in turn, continuing to generate compelling returns for shareholders. Our growth strategy is underpinned by six key pillars: build scale, strategically acquire, expand client relationships, make culture count, amplify our brand, and innovate with technology. We augment internal growth with smart acquisitions that increase our market share, build on our growth engines, and expand services and expertise that matter to our clients around the world. High-value and high-margin, essential services with recurring revenue streams are our priority. Our focus on culture, winning with data-backed insights and deep expertise, and exceeding client expectations ensure our growth and brand are resilient.
Dividend policy
Following the completion of the Spin-off in 2015, our Board of Directors approved a dividend policy for the Company, which was a dividend of $0.08 per Subordinate Voting Share and Multiple Voting Share per annum, payable semi-annually. On May 31, 2016, the Board of Directors increased the semi-annual dividend from $0.04 to $0.05 per Subordinate Voting Share and Multiple Voting Share ($0.10 per annum). On December 7, 2021, the Board of Directors further increased the semi-annual dividend from $0.05 to $0.15 per Subordinate Voting Share and Multiple Voting Share ($0.30 per annum). These dividends are paid in cash after the end of the second and fourth quarters. All dividend payments are subject to the discretion of our Board of Directors. For the purposes of the Income Tax Act (Canada) and any similar provincial legislation, all dividends on the Subordinate Voting Shares and Multiple Voting Shares will be eligible dividends unless indicated otherwise.
The terms of the Subordinate Voting Share and Multiple Voting Share dividend policy remain, among other things, at the discretion of our Board of Directors. Future dividends on the Subordinate Voting Shares and Multiple Voting Shares, if any, will depend on the results of Colliers’ operations, cash requirements, financial condition, contractual restrictions, business opportunities, provisions of applicable law and other relevant factors. Under the terms of the Company’s debt agreements, the Company is not permitted to pay dividends, whether in cash or in specie, in the circumstances of an event of default thereunder occurring and continuing or an event of default occurring as a consequence thereof. See “Material contracts” below.
Dividend history
The aggregate cash dividends declared per Subordinate Voting Share and Multiple Voting Share in respect of the years ended December 31, 2023, 2022 and 2021 were $0.30, $0.30 and $0.20, respectively.
Share capital
The authorized capital of the Company consists of an unlimited number of preference shares (the “Preference Shares”), issuable in series, an unlimited number of Subordinate Voting Shares and an unlimited number of Multiple Voting Shares.
Colliers may purchase its Subordinate Voting Shares, from time to time, if it believes that the market price of its Subordinate Voting Shares is attractive and that the purchase would be an appropriate use of corporate funds and in the best interests of the Company. The Company did not repurchase any shares in 2023. As of February 15, 2024, there were 46,238,682 Subordinate Voting Shares and 1,325,694 Multiple Voting Shares issued and outstanding.
Subordinate Voting Shares and Multiple Voting Shares
The Subordinate Voting Shares and Multiple Voting Shares rank junior to the Preference Shares or series thereof ranking in priority with respect to the payment of dividends, return of capital and distribution of assets in the event of liquidation, dissolution or any distribution of the assets of Colliers for the purpose of winding-up its affairs. The holders of outstanding Subordinate Voting Shares and Multiple Voting Shares are entitled to receive dividends and other distributions on a share-for-share basis (or, in the discretion of the directors, in a greater amount per Subordinate Voting Share than per Multiple Voting Share) out of the assets legally available therefor at such times and in such amounts as our Board of Directors may determine, but without preference or distinction between the Multiple Voting Shares and the Subordinate Voting Shares. The Subordinate Voting Shares carry one vote per share and the Multiple Voting Shares carry 20 votes per share. The holders of Subordinate Voting Shares and the holders of Multiple Voting Shares are entitled to receive notice of any meeting of shareholders and to attend and vote thereat as a single class on all matters to be voted on by the shareholders, except at meetings where the holders of shares of one class or of a particular series of shares are entitled to vote separately.
The rights, privileges, conditions and restrictions attaching to the Subordinate Voting Shares and the Multiple Voting Shares may be respectively modified if the amendment is authorized by at least two-thirds of the votes cast at a meeting of the holders of Subordinate Voting Shares and the holders of Multiple Voting Shares duly held for that purpose. However, if the holders of Subordinate Voting Shares, as a class, or the holders of Multiple Voting Shares, as a class, are to be affected in a manner different from the other classes of shares, such amendment must, in addition, be authorized by at least two-thirds of the votes cast at a meeting of the holders of the class of shares which is affected differently.
Each outstanding Multiple Voting Share is convertible at any time, at the option of the holder and without further consideration, into one Subordinate Voting Share. The Subordinate Voting Shares are not convertible into any other class of shares, except in certain circumstances relating to a take-over bid, as described in the section entitled “Certain Rights of Holders of Subordinate Voting Shares” contained in the most recent Management Information Circular filed on Colliers’ SEDAR+ profile at www.sedarplus.ca. No subdivision, consolidation, reclassification or other change of the Multiple Voting Shares or the Subordinate Voting Shares may be made without, concurrently, having the Multiple Voting Shares or Subordinate Voting Shares, as the case may be, subdivided, consolidated, reclassified or other change made under the same conditions. The Subordinate Voting Shares and Multiple Voting Shares are not redeemable nor retractable but are able to be purchased for cancelation by Colliers in the open market, by private contract or otherwise. Upon the liquidation, dissolution or any distribution of the assets of Colliers for the purpose of winding-up its affairs, the holders of Subordinate Voting Shares and Multiple Voting Shares are entitled to participate equally, on a share-for-share basis, in the remaining property and assets of Colliers available for distribution to such holders.
In accordance with the terms and conditions of a trust agreement entered into by Jay Hennick and Henset Capital Inc. (the “Multiple Voting Shareholder”) on April 16, 2021 (the “New Trust Agreement”) (see “Material Contracts” below), the Multiple Voting Shares will convert into Subordinate Voting Shares on a one-for-one basis and for no additional consideration or premium upon the earliest to occur of: (a) the date that the sum of the number of Multiple Voting Shares and Subordinate Voting Shares held by Mr. Hennick and the Multiple Voting Shareholder, together with their associates and affiliates, is less than 4,000,000 (subject to adjustment and including ownership of securities convertible into Subordinate Voting Shares); (b) 24 months after the termination of the New MSA (as defined below) as a result of Mr. Hennick’s death, disability, voluntary resignation or the occurrence of certain other specific events set out in the New MSA; and (c) September 1, 2028. Additionally, the New Trust Agreement provides that Mr. Hennick and the Multiple Voting Shareholder will not sell any Multiple Voting Shares at a price greater than the market price of the Subordinate Voting Shares on the date of the agreement to sell such shares unless through the facilities of the NASDAQ or TSX, pursuant to a take-over bid, or similar transaction, where there is a concurrent offer made to, or acquisition from, the holders of all of the Subordinate Voting Shares on terms that are at least as favorable to the holders of Subordinate Voting Shares as those made to Mr. Hennick or the Multiple Voting Shareholder, pursuant to an issuer bid or pursuant to the granting of a permitted security interest.
Preference Shares
The Preference Shares are issuable, from time to time, in one or more series, as determined by our Board of Directors. Our Board of Directors will determine, before the issue of any series of Preference Shares, the designation, preferences, rights, restrictions, conditions, limitations, priorities as to payment of dividends and/or distribution on liquidation, dissolution or winding-up, or prohibitions attaching to such series. The Preference Shares, if issued, will rank prior to the Subordinate Voting Shares and Multiple Voting Shares with respect to the payment of dividends and in the distribution of assets in the event of liquidation, dissolution or winding-up of Colliers or any other distribution of assets of Colliers among its shareholders for the purpose of winding-up its affairs, and may also be given such other preferences over the Subordinate Voting Shares and Multiple Voting Shares as may be determined with respect to the respective series authorized and issued. Except as required by law, the Preference Shares will not carry voting rights.
Certain rights of holders of Subordinate Voting Shares
A summary of the rights attaching to the Subordinate Voting Shares in the event that a take-over bid is made for Multiple Voting Shares is set out in the section entitled “Certain Rights of Holders of Subordinate Voting Shares” contained in our most recent Management Information Circular, which is incorporated by reference herein and is available on SEDAR+ at www.sedarplus.ca. Reference should be made to our articles for the full text of these provisions.
Option Plan
Colliers has a stock option plan (the “Option Plan”) pursuant to which options to acquire Subordinate Voting Shares may be granted to directors, officers and full-time employees of Colliers or its subsidiaries (other than Mr. Hennick). A summary of the terms of the Option Plan is set out in the section entitled “Executive Compensation – Incentive Award Plans of Colliers – Stock Option Plan” contained in the 2024 Circular, which is incorporated by reference herein and will be available on SEDAR+ at www.sedarplus.ca. The maximum number of Subordinate Voting Shares subject to grants of options under the Option Plan is limited to 9,100,000, which reflects the cumulative number of options approved by shareholders since the Option Plan’s inception in 2004. Options exercisable for 3,227,250 Subordinate Voting Shares have been granted and are outstanding as at the date hereof; and options which were exercisable for 5,770,450 Subordinate Voting Shares have been exercised or expired as at the date hereof, leaving options yet to be granted which would be exercisable for 102,300 Subordinate Voting Shares.
Convertible Notes
On May 19, 2020, the Company issued $230 million aggregate principal of Convertible Notes at par value with a maturity date of June 1, 2025 bearing interest of 4.0% per annum, payable semi-annually in arrears on June 1 and December 1 of each year, beginning on December 1, 2020. The Convertible Notes were unsecured and subordinated to all of the Company’s existing and future secured indebtedness, and were treated as equity for financial leverage calculations under the Company’s Revolving Credit Facility (“Revolving Credit Facility”) and Senior Notes due 2028 and Senior Notes due 2031.
On April 4, 2023, the Company issued a notice of redemption to all holders of its Convertible Notes. The applicable redemption date was June 1, 2023 (the “Redemption Date”), and the Company, in accordance with the terms and conditions of the indenture governing the Convertible Notes, satisfied its obligations in connection with any redeemed Convertible Notes by agreeing to issue an amount of Subordinate Voting Shares per US$1,000 of redeemed principal amount that is calculated based on the average of daily volume-weighted average trading prices of the Shares for the thirty trading day period ending on May 24, 2023. Substantially all of the Convertible Notes were converted into Subordinate Voting Shares, prior to the Redemption Date at a conversion rate of 17.7607 shares per US$1,000 of principal amount, which is equivalent to a conversion price of approximately $56.30 per share. All remaining Convertible Notes were redeemed on June 1, 2023.
The outstanding Subordinate Voting Shares are listed for trading on the TSX and NASDAQ under the symbol “CIGI”. The Multiple Voting Shares are not listed and do not trade on any public market or quotation system.
The following table sets forth the reported high and low trading prices and the aggregate volume of trading of the Subordinate Voting Shares on NASDAQ (in United States dollars) and on the TSX (in Canadian dollars) for each month in 2023.
|
NASDAQ |
TSX |
||||||||||||||||||||||
|
Month |
High Price (US$) |
Low Price (US$) |
Volume Traded |
High Price (C$) |
Low Price (C$) |
Volume Traded |
|||||||||||||||||
|
January 2023 |
107.84 | 90.40 | 1,204,230 | 143.63 | 122.35 | 987,665 | |||||||||||||||||
|
February 2023 |
129.95 | 104.93 | 2,082,962 | 161.37 | 140.29 | 1,619,669 | |||||||||||||||||
|
March 2023 |
115.69 | 101.01 | 2,707,078 | 157.84 | 137.50 | 1,601,609 | |||||||||||||||||
|
April 2023 |
106.50 | 96.58 | 1,530,722 | 144.88 | 130.80 | 1,072,325 | |||||||||||||||||
|
May 2023 |
107.61 | 87.52 | 2,757,908 | 145.76 | 119.86 | 1,824,828 | |||||||||||||||||
|
June 2023 |
102.99 | 91.67 | 1,593,542 | 135.75 | 121.60 | 1,241,245 | |||||||||||||||||
|
July 2023 |
109.03 | 97.04 | 2,127,828 | 143.73 | 129.79 | 1,265,489 | |||||||||||||||||
|
August 2023 |
115.72 | 99.02 | 2,488,497 | 156.36 | 131.47 | 1,952,305 | |||||||||||||||||
|
September 2023 |
117.67 | 94.85 | 1,903,701 | 158.88 | 128.65 | 1,397,862 | |||||||||||||||||
|
October 2023 |
97.23 | 86.81 | 1,855,663 | 131.89 | 118.98 | 1,490,446 | |||||||||||||||||
|
November 2023 |
109.11 | 83.38 | 3,134,052 | 148.81 | 115.00 | 1,939,375 | |||||||||||||||||
|
December 2023 |
131.01 | 103.50 | 1,525,826 | 172.74 | 140.49 | 1,075,918 | |||||||||||||||||
Escrowed securities and securities subject to contractual restriction on transfer
To the knowledge of Colliers, as of the date hereof, no securities of any class of securities of Colliers are held in escrow or subject to contractual restrictions on transfer or are anticipated to be held in escrow or subject to contractual restrictions on transfer.
Transfer agents and registrars
The transfer agent and registrar for the Subordinate Voting Shares is TSX Trust Company, 100 Adelaide Street West, Suite 301, Toronto, Ontario, M5H 4H1. The transfer agent and registrar for the Multiple Voting Shares is the Company at 1140 Bay Street, Suite 4000, Toronto, Ontario, M5S 2B4.
Directors and executive officers
Directors
Our Board of Directors is currently comprised of ten members. The following information is provided with respect to the directors of the Company as at February 15, 2024:
|
Name and municipality of residence |
Age |
Present position and tenure |
Principal occupation during last five years |
|
Jay S. Hennick Ontario, Canada |
67 |
Chief Executive Officer & Director since May 30, 1988; Chairman since June 2015. |
Mr. Hennick is the global Chairman, CEO and controlling shareholder of Colliers International. Jay is also the Founder, Chairman and the largest individual shareholder of FirstService and was the former CEO from 1988 to 2015. He is also the Chairman of Hennick & Company, a private family investment firm. In 1998, Mr. Hennick was awarded Canada’s Entrepreneur of the Year, and in 2001 he was named Canada’s CEO of the Year by Canadian Business Magazine. In 2011, Jay received an Honorary Doctorate of Laws from York University and in 2014, an Honorary Doctorate from the University of Ottawa. In 2019, Mr. Hennick was appointed as a member of the Order of Canada and received the International Horatio Alger Award. Mr. Hennick also served as past Chairman of the Board of Directors of the Sinai Health System and Mount Sinai Hospital, in Toronto. Jay and his wife Barbara are also active philanthropists establishing the Hennick Family Foundation to support important causes in healthcare, education and the arts, the largest of which include: $50 million donation to the Royal Ontario Museum in support of their revitalization and new vision plans; $36 million donation to name Hennick Bridgepoint Hospital, the largest complex care and rehabilitation hospital in Canada; $10 million donation to the World Holocaust Remembrance Centre (Yad Vashem) in Jerusalem, Israel; and smaller but significant benefactions include those to Osgoode Hall Law School and the Schulich School of Business at York University and to the University of Ottawa.
|
|
Name and municipality of residence |
Age |
Present position and tenure |
Principal occupation during last five years |
|
John (Jack) P. Curtin, Jr.1 Ontario, Canada |
73 |
Lead Director since May 16, 2023; Director since February 10, 2015 |
Mr. Curtin is an Advisory Director in the Investment Banking Division of Goldman, Sachs & Co. in Toronto and New York. From July 2010 to December 2014, Mr. Curtin served as Chairman and Chief Executive of Goldman Sachs Canada Inc. From 2003 to July 2010, Mr. Curtin was Chairman of Goldman Sachs Canada Inc. From 1999 to 2003, Mr. Curtin was an Advisory Director of Goldman, Sachs & Co. in New York. From 1995 to 1999, Mr. Curtin was Chief Executive of Goldman Sachs Canada Inc. in Toronto. Prior to this assignment, Mr. Curtin was co-head of Global Money Markets and Chairman of Goldman Sachs Money Markets LP. Mr. Curtin moved to Money Markets in 1987 after serving as head of Fixed Income Syndicate/New Issues. Mr. Curtin joined the firm in 1976 in the Corporate Finance Department and was named partner in 1988 and managing director in 1996. Mr. Curtin is also a member of the Board of Directors of the Art Gallery of Ontario Foundation and the Royal Conservatory of Music. He previously served as a Director of the Canada/United States Fulbright Foundation. Mr. Curtin is a former governor of the Toronto Stock Exchange, a former director of Brookfield Asset Management, Cadillac Fairview Corporation, Maxxcom Corporation and the Investment Dealers Association of Canada. Mr. Curtin served as a trustee of Lakefield College School as well as Royal St. George’s College. Mr. Curtin received an MBA from Harvard in 1976 and his BA from Williams College in 1972.
|
|
Name and municipality of residence |
Age |
Present position and tenure |
Principal occupation during last five years |
|
Christopher Galvin3 Illinois, USA |
73 |
Director since September 23, 2018 |
Christopher Galvin is the Co‐Founder of Harrison Street Real Estate Capital LLC. Additional roles include serving as either Chairman or Board Member of Three Ocean Partners, Infleqtion and Uncommon X. Mr. Galvin’s current outside activities include: Trustee and member of the Executive Committee of Northwestern University’s Board of Trustees; Executive Committee and member of Dean’s Advisory Board of the Kellogg School of Management at Northwestern; American Enterprise Institute Board; Legion D’Honneur; Advisory Board of Tsinghua University School of Management and Economics (Beijing); the Advisory Committee on International Economic Policy of the US Department of State (ACIEP) and a member of the Center for Public Leadership at Harvard Kennedy School. Previously, Mr. Galvin has served in the following capacities: Chairman and CEO of Motorola Inc.; Chairman of NAVTEQ Inc.; Chairman of Cleversafe Inc.; Chairman of the US‐China Business Council; member of the Bechtel Corporation’s Board of Counselors; member of Business Council (US); director of the Rand Corporation; member of the US Department of Defense Manufacturing Board; member of the US Department of Defense Science Board; advisor to the City of Tianjin, China; advisor to the CEO of Hong Kong; Chair of the Rhodes Scholars selection committee for Illinois‐Michigan.
|
|
Name and municipality of residence |
Age |
Present position and tenure |
Principal occupation during last five years |
|
P. Jane Gavan2 |
64 |
Director since April 8, 2020 |
Ms. P. Jane Gavan is the President, Asset Management of Dream Unlimited Corporation and has more than 30 years of experience in the real estate industry, having held increasingly senior positions since joining Dream. In her capacity as President, Asset Management, Ms. Gavan serves as Chief Executive Officer of Dream Residential REIT which completed an IPO in May 2022. Previously, Ms. Gavan served as Chief Executive Officer of Dream Global Real Estate Investment Trust (Dream Global), a TSX listed real estate investment income trust (REIT) from its 2011 IPO until its acquisition in December 2019, and previously served as Chief Executive Officer of Dream Office REIT. Prior to joining Dream, Ms. Gavan served as legal counsel for numerous companies including Oxford Properties Corp. and Denison Mines Corp., and began her career in private law practice with Blake, Cassels & Graydon, LLP, specializing in real estate and corporate finance. Ms. Gavan earned an Honours Bachelor of Commerce degree from Carleton University and a Bachelor of Laws degree from Osgoode Hall, York University. Ms. Gavan has served on the board of directors of the Women’s College Hospital Foundation and is on the Patron’s Council for Community Living Toronto.
|
|
Name and municipality of residence |
Age |
Present position and tenure |
Principal occupation during last five years |
|
Stephen J. Harper3 Alberta, Canada |
64 |
Director since September 15, 2016 |
Mr. Harper was elected the twenty-second Prime Minister of Canada in 2006 and served in such role until 2015, making him the longest serving Conservative Prime Minister since Sir John A. Macdonald, Canada’s first Prime Minister. Mr. Harper is Chairman of Harper & Associates Consulting, which is affiliated with Dentons, a leading global law firm, and acts as a strategic consultant to clients around the world, providing advice on matters relating to market access, the management of global geopolitical and economic risk and the maximization of value in global markets. Mr. Harper is a founding partner and Chairman of Vision One Management, a fundamental value-oriented equity fund that applies a private equity investment approach to public markets. Mr. Harper also serves as the Chair of the International Democrat Union and international Friends of Israel Initiative. Mr. Harper has received a bachelor and master’s degree in economics from the University of Calgary, was awarded an honorary doctorate of philosophy from Tel Aviv University in 2014 and received an honorary degree from the Jerusalem College of Technology. In recognition of his government service, Mr. Harper has been awarded the Ukrainian Order of Liberty, the Woodrow Wilson Award for Public Service, the B'nai B’rith International Presidential Gold Medallion for Humanitarianism and was named as the World Statesman of the Year in 2012 by the Appeal of Conscience Foundation.
|
|
Katherine M. Lee1,2 Ontario, Canada |
60 |
Director since June 17, 2015 |
Ms. Lee is a seasoned executive in financial services and served as President & CEO of GE Capital Canada, a leading global provider of financial and fleet management solutions to mid-market companies operating in a broad range of economic sectors. Prior to this role, Ms. Lee served as CEO of GE Capital Real Estate in Canada from 2002 to 2010 building it to a full debt and equity operating company. Ms. Lee joined GE in 1994 where she held a number of positions including Director, Mergers & Acquisitions for GE Capital’s Pension Fund Advisory Services based in San Francisco, and Managing Director of GE Capital Real Estate Korea based in Seoul and Tokyo. Ms. Lee earned a Bachelor of Commerce from the University of Toronto. She is a Chartered Professional Accountant and Chartered Accountant. She is active in the community championing women’s networks and Asian-Pacific Forums. |
|
Name and municipality of residence |
Age |
Present position and tenure |
Principal occupation during last five years |
|
Poonam Puri3 |
51 |
Director since February 9, 2022 |
Ms. Puri is a tenured Professor of Law at Osgoode Hall Law School in Toronto, Ontario, and a corporate lawyer and Affiliated Scholar at Davies, Ward, Phillips & Vineberg, LLP, a leading Canadian law firm. Ms. Puri holds a Bachelor of Laws from the University of Toronto, a Master of Laws from Harvard University and has earned the Institute of Corporate Directors, Institute-Certified Director Designation (ICD.D). Ms. Puri has extensive experience as an expert in governance and as a director of organizations in the engineering, transportation, infrastructure and healthcare sectors, including as a past director of Arizona Mining, Cole Engineering and the Greater Toronto Airports Authority, and she previously served as the commission and director of the Ontario Securities Commission. Ms. Puri presently serves on the board of directors or trustees of the Canada Infrastructure Bank, Canadian Apartment Properties Real Estate Investment Trust, Augusta Gold and Holland Bloorview Kids Rehabilitation Hospital. Ms. Puri has been recognized as one of the top 25 most influential lawyers in Canada by Canadian Lawyer Magazine in 2017 and 2015 and is a former recipient of Canada’s Top 40 under 40 award and Canada’s Most Powerful Women: Top 100 Award. In 2021, Ms. Puri was awarded the Royal Society of Canada’s Yvan Allaire Medal for exemplary contributions to the governance of public and private institutions in Canada, in addition to the Law Society Medal and the David Walter Mundell Medal. In 2022, Ms. Puri was awarded the Peter Dey Governance Achievement Award by the Governance Professionals of Canada.
|
|
Benjamin F. Stein2 New York, USA |
38 |
Director since September 14, 2017 |
Mr. Stein is a co-founder of The Spruce House Partnership, a New York-based investment partnership. Spruce House was founded in 2005 and has investments in public companies globally and seeks to invest alongside management teams that are focused on growing the value of their companies over the long term. Mr. Stein received his Bachelor of Arts in International Relations from the University of Pennsylvania in 2008. Mr. Stein also serves on the board of The Africa Center, a New York-based institution focused on African business, culture and policy.
|
|
Name and municipality of residence |
Age |
Present position and tenure |
Principal occupation during last five years |
|
L. Frederick Sutherland1
Pennsylvania, USA |
72 |
Director since June 1, 2015 |
Mr. Sutherland was the Executive Vice President and Chief Financial Officer of Aramark Corporation, Philadelphia, PA, a leading global provider of food services, facilities management and uniform and career apparel, from 1997 to 2015. Prior to joining Aramark in 1980, Mr. Sutherland was Vice President, Corporate Banking, at Chase Manhattan Bank, New York, NY. Mr. Sutherland is a director of Consolidated Edison, Inc. and Sterling Check Corp. Mr. Sutherland is also a director and former Chair of the Board of WHYY, Philadelphia’s public broadcast affiliate and a trustee of Duke University, The National Constitution Center, Episcopal Community Services, an anti-poverty agency, and People's Light, a professional non-profit theater. Mr. Sutherland holds an MBA Degree in Finance from the Katz School of the University of Pittsburgh and a Bachelors in Physics and Mathematics from Duke University.
|
|
Edward Waitzer1,3 Ontario, Canada |
70 |
Director since May 16, 2023 |
Mr. Waitzer was a long-time partner of Stikeman Elliott LLP until his retirement in 2021, including serving as Chair of the firm from 1999 to 2006. Mr. Waitzer was also a professor and the Jarislowsky Dimma Mooney Chair in Corporate Governance at Osgoode Hall Law School and the Schulich School of Business at York University. Mr. Waitzer also has considerable regulatory and governance experience, having served as the Chairman of the Ontario Securities Commission from 1993 to 1996.
|
Notes:
|
1. |
Member of Audit & Risk Committee |
|
2. |
Member of Executive Compensation Committee |
|
3. |
Member of Nominating and Corporate Governance Committee |
Each director remains in office until the following annual shareholders’ meeting of the Company or until the election or appointment of their successor, unless they resign, their office becomes vacant or they become disqualified to act as a director. All directors stand for election or re-election annually.
Further background information regarding the directors of the Company will be set out in the 2024 Circular, the relevant sections of which are incorporated by reference herein and which will be available on SEDAR+ at www.sedarplus.ca.
Executive officers
The following information is provided with respect to the executive officers of the Company as at February 15, 2024:
|
Name and municipality of residence |
Age |
Present position and tenure |
Principal occupation during last five years |
|
Jay S. Hennick Ontario, Canada |
67 |
Chairman since June 1, 2015 and Chief Executive Officer since 1988
|
See description above under “Directors”. |
|
Christopher R. McLernon Ontario, Canada |
58 |
Chief Executive Officer, Real Estate Services since 2022 |
Mr. McLernon is the Chief Executive Officer, Real Estate Services | Global. He oversees Colliers’ Capital Markets, Leasing and Outsourcing & Advisory businesses globally, with emphasis on accelerating growth, enhancing global collaboration, and strengthening our unique culture and way of doing business. Previously the Chief Executive Officer for Europe, Middle East and Africa (EMEA), Mr. McLernon provided strategic direction for the region, ensuring a seamless service experience for clients across our complete range of services, and grew its revenues 20-fold. He oversaw more than 30 acquisitions including Colliers UK, Colliers Germany, Colliers Italy, Antirion, IREA, Sadoline & Albæk, Ovenia and The AOS Group from France. Earlier, he built and led Colliers’ Latin America business and was one of the top producers in Canada when he joined Colliers in 1987 as an office leasing advisor in Toronto.
|
|
Christian Mayer Ontario, Canada |
51 |
Chief Financial Officer since 2020 |
Mr. Mayer served as Senior Vice President Finance & Treasurer of Colliers from 2015 to January 2020. Prior to the Spin-off, Mr. Mayer served as Vice President, Finance for Old FSV. Mr. Mayer joined Old FSV in 1999. Mr. Mayer is a Chartered Professional Accountant and began his career with the accounting firms Grant Thornton and PwC, both in Toronto.
|
|
Name and municipality of residence |
Age |
Present position and tenure |
Principal occupation during last five years |
|
Elias Mulamoottil Ontario, Canada |
54 |
Co-Chief Investment Officer since 2021 |
Prior to the Spin-off, Mr. Mulamoottil served as Senior Vice President Strategy & Corporate Development for Old FSV since March 2011. Mr. Mulamoottil joined Old FSV in June 2007 as Vice President Strategy & Corporate Development. Prior to joining Old FSV, Mr. Mulamoottil was a partner at a Toronto based financial advisory and asset management firm, where he was responsible for the sourcing and executing of merger, acquisition, divestiture and financing transactions. Previously, Mr. Mulamoottil worked with one of Europe’s leading private equity firms, Terra Firma Capital Partners, in London, England executing and managing private equity investments. Mr. Mulamoottil is a Chartered Professional Accountant and began his career at the accounting firm Deloitte. Prior to being appointed as Co-Chief Investment Officer, Mr. Mulamoottil served as the Head, Strategic Investments of the Company.
|
|
Zachary Michaud Ontario, Canada |
41 |
Co-Chief Investment Officer since 2021 |
Mr. Michaud joined Colliers in 2015. Prior to joining Colliers, Mr. Michaud was a senior investment professional at one of Canada’s leading private equity firms specializing in credit investing, distressed debt, operational turnarounds and activist investing. Previously, Mr. Michaud was an investment banker in Los Angeles and worked on the trading floor at two large bank owned investment dealers. Prior to being appointed as Co-Chief Investment Officer, Mr. Michaud served as the Vice President, Strategic Investments of the Company.
|
|
Rebecca Finley Ontario, Canada |
48 |
Chief Brand and People Officer, since 2020 |
Ms. Finley is the Chief Brand & People Officer. In this role, Ms. Finley has responsibility for leading and providing global oversight for the Colliers marketing, brand, communication, and people strategies. She joined Colliers in 2018 as Senior Vice President, Brand & People. Ms. Finley has extensive leadership experience in branding, culture and business operations. Prior to Colliers, Ms. Finley served as Business Lead and Head of Technology, Telecommunications & Media at Facebook, led the Office of the CEO at Maple Leaf Foods, was a Management Consultant with the Boston Consulting Group, and worked as an Investment Banker with TD Securities. Ms. Finley holds an ICD.D from the Institute of Corporate Directors, an MBA from the Rotman School of Management and a Bachelor of Mathematics and Education from Queen’s University.
|
|
Name and municipality of residence |
Age |
Present position and tenure |
Principal occupation during last five years |
|
Robert D. Hemming British Columbia, Canada |
56 |
Senior Vice President and Chief Accounting Officer since 2008 |
Prior to the Spin-off, Mr. Hemming served as Chief Financial Officer-Global for Colliers where he was responsible for Collier’s financial accounting, reporting, analysis and compliance functions. Prior to joining Colliers in August 2006, Mr. Hemming was the Corporate Controller–Western Canada for Bell Canada. Mr. Hemming is a Chartered Professional Accountant and a Certified General Accountant and outside of real estate, has spent his career working in the mining, forestry and telecom industries.
|
|
Matthew Hawkins Ontario, Canada |
41 |
Vice President, Legal Counsel and Corporate Secretary since 2016 |
Mr. Hawkins joined Colliers in 2016. Prior to joining, Mr. Hawkins previously worked as the Vice President of Legal Affairs at a TSX-listed pharmaceuticals company, and previously worked in the corporate and securities group of a leading Canadian law firm.
|
Ownership
As of February 15, 2024, the directors and executive officers of the Company, as a group, owned, or controlled or directed, directly or indirectly, 5,806,099 Subordinate Voting Shares and 1,325,694 Multiple Voting Shares, which represent 12.6 % of the total Subordinate Voting Shares and 100.0% of the total Multiple Voting Shares, in each case, outstanding on such date. The directors and executive officers, as a group, controlled 44.4% of the total voting rights as of such date when all Multiple Voting Shares and Subordinate Voting Shares are considered. Mr. Hennick controls all of the Multiple Voting Shares.
Legal proceedings and regulatory actions
There are no legal proceedings to which Colliers is a party to, or in respect of which, any of the property of Colliers is the subject of, which is or was material to Colliers during 2023, and Colliers is not aware of any such legal proceedings that are contemplated. In the normal course of operations, Colliers is subject to routine immaterial claims and litigation incidental to its business. Litigation currently pending or threatened against Colliers includes disputes with former employees and commercial liability claims related to services provided by Colliers. Colliers believes resolution of such proceedings, combined with amounts set aside, will not have a material impact on the Company’s financial condition or the results of operations.
During 2023, there have not been any penalties or sanctions imposed against Colliers by a court relating to provincial and territorial securities legislation or by a securities regulatory authority, nor have there been any other penalties or sanctions imposed by a court or regulatory body against Colliers, and Colliers has not entered into any settlement agreements before a court relating to provincial and territorial securities legislation or with a securities regulatory authority.
The following chart provides a summary of the properties occupied by the Company and its subsidiaries as at December 31, 2023:
|
(square feet) |
Leased |
Owned |
Total |
|||||||||
|
Americas |
2,109,000 | - | 2,109,000 | |||||||||
|
EMEA |
416,000 | - | 416,000 | |||||||||
|
Asia Pacific |
499,000 | - | 499,000 | |||||||||
|
Investment Management |
137,000 | - | 137,000 | |||||||||
|
Corporate |
- | 20,000 | 20,000 | |||||||||
|
Total operations |
3,161,000 | 20,000 | 3,181,000 | |||||||||
Reconciliation of non-GAAP financial measures
In this AIF, we make reference to certain financial measures that are not calculated in accordance with GAAP.
Adjusted EBITDA is defined as net earnings, adjusted to exclude: (i) income tax; (ii) other expense (income); (iii) interest expense; (iv) loss on disposal of operations; (v) depreciation and amortization, including amortization of mortgage servicing rights (“MSRs”); (vi) gains attributable to MSRs; (vii) acquisition-related items (including contingent acquisition consideration fair value adjustments, contingent acquisition consideration-related compensation expense and transaction costs); (viii) restructuring costs and (ix) stock-based compensation expense. We use adjusted EBITDA to evaluate our own operating performance and our ability to service debt, and it is an integral part of our planning and reporting systems. Additionally, we use this measure in conjunction with discounted cash flow models to determine the Company’s overall enterprise valuation and to evaluate acquisition targets. We present adjusted EBITDA as a supplemental measure because we believe such measure is useful to investors as a reasonable indicator of operating performance because of the low capital intensity of the Company’s service operations. We believe this measure is a financial metric used by many investors to compare companies, especially in the services industry. This measure is not a recognized measure of financial performance under GAAP in the United States and should not be considered as a substitute for operating earnings, net earnings or cash flow from operating activities, as determined in accordance with GAAP. Our method of calculating adjusted EBITDA may differ from other issuers and accordingly, this measure may not be comparable to measures used by other issuers. A reconciliation of net earnings to adjusted EBITDA appears below.
|
Year ended |
||||||||
|
(in thousands of US$) |
December 31 |
|||||||
|
2023 |
2022 | |||||||
|
Net earnings |
$ | 144,691 | $ | 194,544 | ||||
|
Income tax |
68,086 | 95,010 | ||||||
|
Other income, including equity earnings from non-consolidated investments |
(5,919 | ) | (5,645 | ) | ||||
|
Interest expense, net |
94,077 | 48,587 | ||||||
|
Operating earnings |
300,935 | 332,496 | ||||||
|
Loss on disposal of operations |
2,282 | 26,834 | ||||||
|
Depreciation and amortization |
202,536 | 177,421 | ||||||
|
(Gains) losses attributable to MSRs |
(17,722 | ) | (17,385 | ) | ||||
|
Equity earnings from non-consolidated investments |
5,078 | 6,677 | ||||||
|
Acquisition-related items |
47,096 | 77,144 | ||||||
|
Restructuring costs |
27,701 | 5,485 | ||||||
|
Stock-based compensation expense |
27,087 | 21,853 | ||||||
|
Adjusted EBITDA |
$ | 594,993 | $ | 630,525 | ||||
Adjusted EPS is defined as diluted net earnings per share as calculated under the “if-converted” method, adjusted for the effect, after income tax, of: (i) the non-controlling interest redemption increment; (ii) loss on disposal of operations; (iii) amortization expense related to intangible assets recognized in connection with acquisitions and MSRs; (iv) gains attributable to MSRs; (v) acquisition-related items; (vi) restructuring costs and (vii) stock-based compensation expense. We believe this measure is useful to investors because it provides a supplemental way to understand the underlying operating performance of the Company and enhances the comparability of operating results from period to period. Adjusted EPS is not a recognized measure of financial performance under GAAP, and should not be considered as a substitute for diluted net earnings per share from continuing operations, as determined in accordance with GAAP. Our method of calculating this non-GAAP measure may differ from other issuers and, accordingly, this measure may not be comparable to measures used by other issuers. A reconciliation of net earnings to adjusted net earnings and of diluted net earnings per share to adjusted EPS appears below.
Similar to GAAP diluted EPS, Adjusted EPS is calculated using the “if-converted” method of calculating earnings per share in relation to the Convertible Notes, which were issued on May 19, 2020 and fully converted or redeemed by June 1, 2023. As such, the interest (net of tax) on the Convertible Notes is added to the numerator and the additional shares issuable on conversion of the Convertible Notes are added to the denominator of the earnings per share calculation to determine if an assumed conversion is more dilutive than no assumption of conversion. The “if-converted” method is used if the impact of the assumed conversion is dilutive. The “if-converted” method is dilutive for the adjusted EPS calculation for all periods where the Convertible Notes were outstanding.
|
Year ended |
||||||||
|
(in US$) |
December 31 |
|||||||
|
2023 |
2022 |
|||||||
|
Diluted net earnings (loss) per Subordinate Voting Share and Multiple Voting Share (1) |
$ | 1.38 | $ | 0.97 | ||||
|
Interest on Convertible Notes, net of tax |
0.04 | 0.14 | ||||||
|
Non-controlling interest redemption increment |
0.47 | 1.97 | ||||||
|
Loss on disposal of operations |
0.05 | 0.56 | ||||||
|
Amortization of intangible assets, net of tax |
1.92 | 1.63 | ||||||
|
Gains attributable to MSRs net of tax |
(0.21 | ) | (0.20 | ) | ||||
|
Acquisition-related items |
0.83 | 1.45 | ||||||
|
Restructuring costs, net of tax |
0.43 | 0.08 | ||||||
|
Stock-based compensation expense, net of tax |
0.44 | 0.39 | ||||||
|
Adjusted EPS |
$ | 5.35 | $ | 6.99 | ||||
|
(1) |
Amounts shown reflect the “if-converted” method’s dilutive impact on the adjusted EPS calculation |
We believe that the presentation of adjusted EBITDA and adjusted earnings per share, which are non-GAAP financial measures, provides important supplemental information to management and investors regarding financial and business trends relating to the Company’s financial condition and results of operations. We use these non-GAAP financial measures when evaluating operating performance because we believe that the inclusion or exclusion of the items described above, for which the amounts are non-cash or non-recurring in nature, provides a supplemental measure of our operating results that facilitates comparability of our operating performance from period to period, against our business model objectives, and against other companies in our industry. We have chosen to provide this information to investors so they can analyze our operating results in the same way that management does and use this information in their assessment of our core business and the valuation of the Company. Adjusted EBITDA and adjusted earnings per share are not calculated in accordance with GAAP, and should be considered supplemental to, and not as a substitute for, or superior to, financial measures calculated in accordance with GAAP. Non-GAAP financial measures have limitations in that they do not reflect all of the costs or benefits associated with the operations of our business as determined in accordance with GAAP. As a result, investors should not consider these measures in isolation or as a substitute for analysis of our results as reported under GAAP.
Adjusted EBITDA from recurring revenue percentage is computed on a trailing twelve-month basis and represents the proportion of adjusted EBITDA that is derived from Outsourcing & Advisory and Investment Management service lines. Both these service lines represent medium to long-term duration revenue streams that are either contractual or repeatable in nature. Adjusted EBITDA for this purpose is calculated in the same manner as for our debt agreement covenant calculation purposes, incorporating the expected full year impact of business acquisitions and dispositions.
Free cash flow is defined as net cash flow from operating activities plus contingent acquisition consideration paid, less purchases of fixed assets, plus cash collections on AR Facility deferred purchase price less distributions to non-controlling interests. We use free cash flow as a measure to evaluate and monitor operating performance as well as our ability to service debt, fund acquisitions and pay of dividends to shareholders. We present free cash flow as a supplemental measure because we believe this measure is a financial metric used by many investors to compare valuation and liquidity measures across companies, especially in the services industry. This measure is not a recognized measure of financial performance under GAAP in the United States, and should not be considered as a substitute for operating earnings, net earnings or cash flow from operating activities, as determined in accordance with GAAP. Our method of calculating free cash flow may differ from other issuers and accordingly, this measure may not be comparable to measures used by other issuers. A reconciliation of net cash flow from operating activities to free cash flow appears below.
|
Year ended |
||||||||
|
(in thousands of US$) |
December 31 |
|||||||
|
2023 |
2022 | |||||||
|
Net cash provided by operating activities |
$ | 165,661 | $ | 67,031 | ||||
|
Contingent acquisition consideration paid |
39,115 | 69,224 | ||||||
|
Purchase of fixed assets |
(84,524 | ) | (67,681 | ) | ||||
|
Cash collections on AR Facility deferred purchase price |
124,313 | 288,004 | ||||||
|
Distributions paid to non-controlling interests |
(77,400 | ) | (62,926 | ) | ||||
|
Free cash flow |
$ | 167,165 | $ | 293,652 | ||||
We use the term assets under management (“AUM”) as a measure of the scale of our Investment Management operations. AUM is defined as the gross market value of operating assets and the projected gross cost of development assets of the funds, partnerships and accounts to which we provide management and advisory services, including capital that such funds, partnerships and accounts have the right to call from investors pursuant to capital commitments. Our definition of AUM may differ from those used by other issuers and as such may not be directly comparable to similar measures used by other issuers.
We use the term fee paying assets under management (“FPAUM”) to represent only the AUM on which the Company is entitled to receive management fees. We believe this measure is useful in providing additional insight into the capital base upon which the Company earns management fees. Our definition of FPAUM may differ from those used by other issuers and as such may not be directly comparable to similar measures used by other issuers.
Readers should carefully consider the following risks, as well as the other information contained in this AIF and our management’s discussion and analysis for the year ended December 31, 2023. If any of the following risks actually occurs, our business could be materially harmed. The risks and uncertainties described below are not the only ones we face. Additional risks and uncertainties, including those of which we are currently unaware or we currently deem immaterial, may also adversely affect our business.
Risks relating to our business
Economic conditions, especially as they relate to interest rates, credit conditions and business spending
During periods of rising interest rates, economic, fiscal or political uncertainty, market volatility, disruption to global capital or credit markets our operations may be negatively affected. Tighter credit conditions impact commercial real estate transaction volumes, which may materially reduce demand for our Capital Markets services. Continued uncertainty in the market can also impact Leasing volumes, with occupiers opting either for smaller than optimal space or shorter lease terms. Moreover, lower business spending directly impacts our Outsourcing & Advisory revenues, with some services potentially being conducted in-house. These factors could also lead to payment delays or defaults from customers, which negatively impacts our operating revenues, profitability and cash flow.
Commercial real estate property values, vacancy rates and general conditions of financial liquidity for real estate transactions
Property values have a direct impact on the commissions earned on sales transactions. Vacancy rates affect market lease rates and the duration of lease commitments, which are the basis of leasing commissions earned. Both property values and vacancy rates influence the number of sales and leasing transactions that occur, which may materially impact our revenues, financial condition, results of operations and cash flows.
Economic deterioration impacting our ability to recover goodwill and other intangible assets
Expectations of future earnings drive the recoverability of goodwill and other intangible assets, which are tested, at least, on an annual basis. A future deterioration of operating performance may necessitate non-cash impairment charges.
As a result of the changes in the current economic environment, geopolitical uncertainty, inflation and rising interest rates, management has performed asset impairment testing across our reporting units. Management has concluded that no impairment loss is required to be recognized as of December 31, 2023. The testing considered a range of scenarios, but is subject to significant estimation uncertainty given the factors noted above. If there are future adverse developments, impairment losses may be required to be recognized.
Competition, economic conditions, and reputational risks may hamper our ability to fundraise in Investment Management
Our ability to raise capital is dependent on multiple factors, including fund performance, macroeconomic environment, and fundraising by our competitors. In certain cases, investors may decrease allocations to the asset classes we invest in, either to maintain portfolio allocations; to make a macro shift away from the asset class; or to invest in our competitors’ funds. Continued competition in the industry may also impact or ability to generate management fees and carried interest at historical levels.
Moreover, in our Investment Management operations, our reputation could be negatively impacted by various factors including poor performance; actual, potential or perceived conflicts of interest; misconduct by employees; rumors; or underperformance in our investments or strategies relative to benchmark, which may have significant impact on our fundraising initiatives.
Failure to meet threshold returns in our long-dated funds
There is no certainty that we will be able to meet contractually defined threshold returns, which are highly dependent on macroeconomic conditions and a fund’s ability to identify suitable investment opportunities. Failure to generate threshold returns could lead to lower, or the absence of, carried interest revenues, related profitability and also adversely impact our future fundraising efforts.
Seeding new funds require temporary investments which may impact liquidity
We periodically enter into arrangements to temporarily own assets on behalf of a new fund with the expectation that the assets will be subsequently transferred to the fund. However, in certain cases, we may be unable to transfer the assets to the fund and may be required to keep ownership of the assets for longer than expected. This could impact our available liquidity and potential to fund other internal or acquisition growth initiatives. A general lack of liquidity on our balance sheet could inhibit us from seeding new funds and thus limit growth in our Investment Management operations.
A decline in our ability to fundraise, or an increase in redemptions from our perpetual funds and separately managed accounts could adversely impact our Investment Management operations
The success of our Investment Management operations is dependent on our ability to fundraise. Failure to do so could severely constrain growth in our assets under management, and consequently profitability. Higher than expected redemption requests could also adversely impact management fees in our perpetual funds and separately managed accounts and may also create reputational risks which could impact subsequent fundraising efforts.
A decline in performance in our Investment Management operations
The revenue, net earnings and cash flow generated by our Investment Management operations may fluctuate, primarily due to the changes in management fees as a result of market movements from one period to another in our perpetual funds. In the event that any of the funds that we manage were to perform poorly, our revenue, net earnings and cash flow could be materially impacted. Investors and potential investors in our funds continually assess our performance, and our ability to raise capital for existing and future funds and maintaining our current fee structure will depend on our continued satisfactory performance.
Risks associated with Colliers Mortgage operations
Our Colliers Mortgage operations have certain key risk factors unique to the services provided, including:
|
● |
a change in or loss of our relationship with US government agencies could significantly impact our ability to originate mortgage loans; |
|
● |
defaults by borrowers on loans originated under the Fannie Mae Delegated Underwriting and Servicing Program could materially affect our profitability as we are subject to sharing up to one-third of incurred losses; |
|
● |
a decline in origination volumes or termination of our current servicing agreements could significantly impact profitability; and |
|
● |
termination or changes to our warehouse credit facilities could lead to unfavourable replacement terms and may significantly impact our ability to originate new loans. |
Rising inflation could materially impact our profitability
In our Outsourcing & Advisory and Investment Management operations, we provide contractual services to clients, typically for multi-year durations. The contracts typically include price escalation for inflation. However, should inflation rise more than anticipated, it could severely impact our ability to recover certain cost from our clients. Moreover, compensation represents our largest expense. Rising wage costs could impact not only our profitability but also our ability to recruit and retain talent.
A decline in our ability to generate cash from our businesses to fund future acquisitions and meet our debt obligations
We rely on our businesses to generate the necessary cash to service our financial obligations. As at December 31, 2023, we have $1.50 billion of debt outstanding ($1.32 billion net of cash) that will be required to be refinanced or repaid over the next eight years. To date, we have met all of our debt obligations. However, a decline in business performance may impact our ability to service outstanding debt, and/or raise capital at favourable terms.
The effects of changes in foreign exchange rates in relation to the US dollar on our Euro, Canadian dollar, Australian dollar and UK pound sterling denominated revenues and expenses
We generate approximately 46% of our revenues outside the United States. Consequently, our consolidated results are impacted by fluctuations in the relative strength of the US dollar against foreign currencies, including the Euro, Canadian dollar, Australian dollar and UK pound sterling.
Political events, including elections, referenda and government positions on international trade, among other things, could also impact foreign exchange rates in relation to the US dollar. In addition, we expect to acquire additional international operations in the future. As a consequence, foreign currency exchange rate fluctuations may be material in the future.
Competition in the markets served by the Company
We operate in highly competitive markets. Changes in the source and intensity of competition in the markets served by us impact the demand for our services and may result in additional pricing pressures. The relatively low capital cost of entry to certain of our businesses has led to strong competitive markets, including regional and local owner-operated companies. Regional and local competitors operating in a limited geographic area may have lower labour, benefits and overhead costs. The principal methods of competition in our businesses include name recognition, quality and speed of service, pricing, customer satisfaction and reputation. No assurance can be given that we will be able to compete successfully against current or future competitors and that the competitive pressures that we face will not result in reduced market share or negatively impact our financial performance.
A decline in our ability to attract, recruit and retain talent
Our ability to attract and recruit talent is an important determinant of revenue growth. While the Company makes significant efforts in attracting, recruiting and mobilizing talent, it is possible that we are unable to hire sufficiently skilled investment professional, engineers, property managers, and real estate sales/leasing advisors, which can impact our ability to sustain or increase our internal revenue growth.
Labour shortages or increases in wage and benefit costs
As a services company, our primary asset is the human capital that comprises our workforce to generate revenues. A shortage, or increase in wage and benefit costs, of this human capital could reduce our revenues and profitability.
Reliance on subcontractors
For certain of our services, we rely on external subcontractors for timely delivery and execution. Failure to manage subcontractor performance may result in higher costs and potential loss of clients.
The effects of changes in interest rates on our cost of borrowing
The Company uses its Revolving Credit Facility and Accounts Receivable Facility, which are at variable interest rates (except for RCF swapped to fixed), as primary sources of funding for its operations, acquisitions and other general proceeds. As a result, changes in base rates such as SOFR affect our interest expense as these base rates fluctuate.
A decline in our performance impacting our continued compliance with the financial covenants under our debt agreements, or our ability to negotiate a waiver of certain covenants with our lenders
A decline in our earnings performance may cause our financial leverage to increase, which results in a higher applicable margin on our Revolving Credit Facility, thereby increasing our interest costs. A decline in earnings performance may also cause us to be non-compliant with certain financial covenants, leading to a potential default on our debt obligations.
Unexpected increases in operating costs, such as insurance, workers’ compensation, and health care
As a services company, the costs of providing services to our customers can fluctuate. Certain operating costs, such as insurance, workers’ compensation and health care are based on market rates which we cannot control and, absent an offsetting price increase in our services, have a direct impact on our operating margins.
Changes in the frequency or severity of insurance incidents relative to our historical experience
Adverse changes in claims experience could increase our insurance costs and/or increase the risk of being unable to renew insurance coverage at our operations. In each of our operating segments, we effectively self-insure certain risks, with a layer of third-party insurance for catastrophic claims. An increase in the frequency or severity of claims in these areas could materially affect our financial position and results of operations. There can be no assurance that we will be able to obtain insurance coverage on favourable economic terms in the future.
A decline in the availability of suitable acquisition targets
Although the diversified professional services market remains highly fragmented, ongoing consolidation activity may limit our ability to find suitable acquisition targets. It is possible that irrational buyer behavior in the market could drive valuations higher than before, which can significantly impact our ability to close transactions on mutually favorable terms.
A decline in our ability to successfully integrate acquired operations
Failure to successfully integrate acquisitions into our existing operations can be disruptive to our business and may have a material adverse impact on our operating results. Challenges in integrating operations and information technology systems acquired from other companies may also limit our ability to achieve anticipated synergies. We may experience difficulties in the assimilation of different cultures and practices, integration of systems, including accounting systems, as well as in maintaining controls, including internal control over financial reporting required by applicable securities laws and related procedures and policies. It is possible that the integration process could result in a loss of key management personnel and clients, which can severely impact profitability. In addition, we may also expose ourselves to unforeseen liabilities which may have not been identified during the due diligence process.
Changes in laws, regulations and government policies at the federal, state/provincial or local level that may adversely impact our businesses
As a multinational company, changes in laws and regulation at the different jurisdictional levels can have a direct effect on our operations. It is difficult to predict the future impact of a change in legislative and regulatory requirements affecting our businesses. The laws and regulations applicable to our businesses will likely change in the future and affect our operations and financial performance. In addition, if we were to fail to comply with any applicable law or regulation, we could be subject to substantial fines or damages, be involved in litigation, suffer losses to our reputation and suffer the loss of licenses or penalties that may affect how our business is operated, which, in turn, would have a material adverse effect on our business, financial condition and results of operations.
Risks arising from any regulatory review and litigation
The commencement of any formal regulatory reviews or investigations could result in the diversion of significant management attention and resources and, if securities or other regulators determine that a violation of securities or other laws may have occurred, or has occurred, the Company or its officers and directors may receive notices regarding potential enforcement action or prosecution and could be subject to civil or criminal penalties or other remedies. For example, the Company or its officers could be required to pay substantial damages, fines or other penalties, the regulators could seek an injunction against the Company or seek to ban an officer or director of the Company from acting as such, any of which actions would have a material adverse effect on the Company.
Risks associated with intellectual property and other proprietary rights that are material to our business
Our ability to compete effectively depends in part on our rights to service marks, trademarks, trade names and other intellectual property rights we own or license (including “Colliers”). We have not sought to register every one of our marks in every country in which they are used. Furthermore, because of the differences in foreign trademark, patent and other intellectual property or proprietary rights laws, we may not receive the same protection in other countries as we would in Canada or the United States. If we are unable to protect our proprietary information and brand names, we could suffer a material adverse effect on our business, financial condition or results of operations. Litigation may be necessary to enforce our intellectual property rights and protect our proprietary information, or to defend against claims by third parties that our products or services infringe their intellectual property rights. Any litigation or claims brought by or against us could result in substantial costs and diversion of our resources. A successful claim of trademark, patent or other intellectual property infringement against us, or any other successful challenge to the use of our intellectual property, could subject us to damages or prevent us from providing certain services under our recognized brand names, which could have a material adverse effect on our business, financial condition or results of operations.
Reputational risk
The Company operates in multiple global jurisdictions and is subject to various local laws and regulations. We train employees to comply with anti-bribery and workplace violence and harassment laws along with clear company-wide guidelines, internal controls and policies in place to prohibit any non-compliant behaviours. However, despite our best efforts, it is possible that violations may occur, either through our own employees or through our external partners/subcontractors, which may expose the Company to potential litigation and lawsuits and significantly harm our reputation. Reputational losses may also arise from any negative publicity, failure to meet client expectations and negative market perception.
Disruptions or security failures in our information technology systems
Our information technology systems facilitate our ability to monitor, operate and control our operations. While we have disaster recovery plans in place, any disruption in these plans or the failure of our information technology systems to operate as expected could, depending on the magnitude of the problem, adversely affect our operating results by limiting, among other things, our capacity to monitor, operate and control our operations effectively. In addition, because our systems contain information about individuals and businesses, our failure to maintain the security of the data we hold, whether the result of our own error or the malfeasance or errors of others, could harm our reputation or give rise to legal liabilities relating to violations of privacy laws or otherwise, which may lead to lower revenues, increased costs and other material adverse effects on our results of operations.
Cybersecurity risks
Cybersecurity incidents, in the form of malware, computer viruses, cyber threats, malfeasance and other types of data breaches, continue to rise. With our employees relying heavily on our information systems, some managed by third parties, we make significant efforts to maintain the security of our information systems as well as to monitor for cybersecurity threats. However, there can be no assurance that we will be able to prevent all cybersecurity incidents, which could have a material adverse impact on our operations. This could be in the form of lost revenues, unauthorized access to client and employee data, damage to our reputation, significant corrective costs and as well as material legal liabilities.
Exposure to global tax laws
Given our global footprint, we are subject to income tax laws in various jurisdictions. While we continuously manage and provision for income tax, any changes in effective tax rates within local jurisdictions can have a material impact on our net earnings.
Political conditions or events, including escalation of hostilities, outbreak of war, elections, referenda, changes to international trade and immigration policies, terrorism, disruption of supply chains (particularly energy) and the impact thereof on our business
Political events, uncertainties and situations can have an effect on our Company because of our global operations. Events could occur that may hamper our ability to manage operations, repatriate cash and implement Colliers’ policies in certain regions, particularly in developing countries that have had a recent history of political and economic instability.
Risks relating to our shares
Volatility of market price of the Subordinate Voting Shares
The market price of the Subordinate Voting Shares may be volatile and subject to wide fluctuations in response to numerous factors, many of which are beyond our control, including the following:
|
• |
actual or anticipated fluctuations in our annual or quarterly results of operations; |
|
• |
changes in estimates of future results of operations by us or by equity research analysts; |
|
• |
changes in the economic performance or market valuations of other companies that investors deem comparable to us; |
|
• |
the addition or departure of our executive officers or other key personnel; |
|
• |
litigation or regulatory action against us; |
|
• |
issuances or expected issuances of additional Subordinate Voting Shares or other forms of our securities; |
|
• |
changes in applicable laws and regulations, including tax laws, or changes in the manner in which those laws are applied; |
|
• |
significant acquisitions or business combinations, strategic partnerships, joint ventures or capital commitments by or involving us or our competitors; and |
|
• |
news reports relating to the conditions in the economy in general and/or trends, concerns or competitive developments, regulatory changes and other related issues in our industry. |
The volatility may affect the ability of holders of Subordinate Voting Shares to sell the Subordinate Voting Shares at an advantageous price.
Financial markets have, at times, experienced significant price and volume fluctuations that have particularly affected the market prices of securities of companies and that have, in many cases, been unrelated to the operating performance, underlying asset values or prospects of such companies. Accordingly, the market price of the Subordinate Voting Shares may decline even if our operating results, underlying asset values or prospects have not changed. Additionally, these factors, as well as other related factors, may cause decreases in asset values that are deemed to be other than temporary, which may result in impairment losses. As well, certain institutional investors may base their investment decisions on consideration of our environmental, governance and social practices and performance against such institutions’ respective investment guidelines and criteria, and failure to meet such criteria may result in a limited or no investment in the Subordinate Voting Shares by those institutions, which could adversely affect the trading price of the Subordinate Voting Shares. There can be no assurance that fluctuations in price and volume will not occur. If such increased levels of volatility and market turmoil occur, our operations could be adversely impacted and the trading price of the Subordinate Voting Shares may be adversely affected.
The impact of our dual class share structure
As agreed in the New Trust Agreement, the Multiple Voting Shares shall convert on a one-for-one basis into Subordinate Voting Shares upon the occurrence of certain specified events and in any event by not later than September 1, 2028. However, the Multiple Voting Shares shall remain issued and outstanding until any such conversion event. Our Multiple Voting Shares have twenty votes per share and our Subordinate Voting Shares have one vote per share. As at February 15, 2024, Mr. Hennick beneficially owns and controls all of the Multiple Voting Shares, and holds approximately 43.6% of the voting power of all of our issued and outstanding Subordinate Voting Shares and Multiple Voting Shares and therefore has significant influence over our management and affairs and over all matters requiring shareholder approval, including the election of directors and significant corporate transactions. As a result, the holder of Multiple Voting Shares has the ability to influence many matters affecting us and actions may be taken that the holders of the Subordinate Voting Shares may not view as beneficial. The market price of the Subordinate Voting Shares could be adversely affected due to the significant influence and voting power of the holder of Multiple Voting Shares. Additionally, the significant voting interest of the holder of Multiple Voting Shares may discourage transactions involving a change of control, including transactions in which an investor, as a holder of the Subordinate Voting Shares, might otherwise receive a premium for the Subordinate Voting Shares over the then-current market price, or discourage competing proposals if a going private transaction is proposed by the holder of Multiple Voting Shares.
A decline in our performance impacting our ability to pay dividends on our shares
Although we intend to make cash dividends to shareholders in accordance with our existing dividend policy, these dividends are not assured. Future dividends on the Subordinate Voting Shares and Multiple Voting Shares will depend on our results of operations, financial condition, capital requirements, general business conditions and other factors that our board of directors may deem relevant. Additionally, under the Company’s debt agreements, the Company is not permitted to pay dividends, whether in cash or in specie, in the circumstances of an event of default thereunder occurring and continuing or an event of default occurring as a consequence thereof. The market value of the Subordinate Voting Shares and Multiple Voting Shares may deteriorate if we are unable to pay dividends pursuant to our existing dividend policy in the future.
Potential future dilution to the holders of the Subordinate Voting Shares
We are authorized to issue an unlimited number of Subordinate Voting Shares for consideration and terms and conditions as established by our board of directors, in many cases, without any requirement for explicit shareholder approval, and shareholders have no pre-emptive rights in connection with such further issuances. We may issue additional Subordinate Voting Shares in share offerings (including through the sale of securities convertible into or exchangeable for Subordinate Voting Shares) and pursuant to the exercise of options under our Option Plan. We cannot predict the size of future issuances of Subordinate Voting Shares or the effect that future issuances and sales of Subordinate Voting Shares will have on the market price of the Subordinate Voting Shares. Issuances of a substantial number of additional Subordinate Voting Shares, or the perception that such issuances could occur, may adversely affect prevailing market prices for the Subordinate Voting Shares. With any additional issuance of Subordinate Voting Shares, holders of Subordinate Voting Shares will suffer dilution and we may experience dilution in our earnings per share.
The existence of our right to issue blank cheque preference shares
The Company has the right to issue so-called “blank cheque” preference shares which may affect the voting and liquidation rights of holders of Subordinate Voting Shares and Multiple Voting Shares. The Company’s Board of Directors is authorized, without any further shareholder approval, to issue one or more additional series of preference shares in an unlimited number and to set the rights, privileges, restrictions and conditions attached thereto.
Risks related to our qualification as a foreign private issuer
We are a “foreign private issuer”, as such term is defined in Rule 405 under the United States Securities Act of 1933, as amended, and are permitted, under a multijurisdictional disclosure system adopted by the United States and Canada, to prepare our disclosure documents filed under the United States Securities Exchange Act of 1934, as amended (“US Exchange Act”), in accordance with Canadian disclosure requirements. Under the US Exchange Act, we are subject to reporting obligations that, in certain respects, are less detailed and less frequent than those of US domestic reporting companies. As a result, we do not file the same reports that a US domestic issuer would file with the Securities and Exchange Commission (“SEC”), although we are required to file or furnish to the SEC the continuous disclosure documents that we are required to file in Canada under Canadian securities laws. In addition, our officers, directors, and principal shareholders are exempt from the reporting and short swing profit liability provisions of Section 16 of the US Exchange Act. Therefore, our shareholders may not know on a timely basis when our officers, directors and principal shareholders purchase or sell shares, as the reporting deadlines under the corresponding Canadian insider reporting requirements are generally longer.
As a foreign private issuer, we are exempt from the rules and regulations under the US Exchange Act related to the furnishing and content of proxy statements. We are also exempt from Regulation FD, which prohibits issuers from making selective disclosures of material non-public information. While we will comply with the corresponding requirements relating to proxy statements and disclosure of material non-public information under Canadian securities laws, these requirements differ from those under the US Exchange Act and Regulation FD, and shareholders should not expect to receive the same information at the same time as such information is provided by US domestic companies.
In addition, as a foreign private issuer, we have the option to follow certain Canadian corporate governance practices, except to the extent that such laws would be contrary to US securities laws, and provided that we disclose the requirements we are not following and describe the Canadian practices we follow instead. We currently rely on this exemption with respect to requirements regarding the quorum for any meeting of our shareholders, the requirement to obtain shareholder approval prior to an issuance of securities in certain circumstances and certain responsibilities of the Executive Compensation Committee of our board of directors. We may in the future elect to follow home country practices in Canada with regard to other matters. As a result, our shareholders may not have the same protections afforded to shareholders of US domestic companies that are subject to all corporate governance requirements.
Risks relating to ESG
Risks related to global climate change
As global climate change policy continues to evolve and attract considerable public, scientific and regulatory attention, it could have both tangible and intangible impact on our operations, employees and clients. Moreover, we may be subject to litigation on certain properties, projects or assets that we manage that have a direct impact on the environment from governments, shareholders and environmental activists. A loss of management fee revenues as well as any litigation could materially impact our profitability, reputation as well as financial condition.
Changes in client preferences and requirements for low-carbon and climate-resilient properties
As climate policy continues to evolve and demand for low-carbon and climate-resilient properties increases, it may impact our operations with respect to deal sourcing as well as product availability. Should the company be unable to meet client needs, it may also lead to deterioration of relationship with the client and a loss of revenue.
Reputational risk should our efforts to mitigate climate change not keep pace with peers and societal expectations
We are making dedicated efforts towards reducing our carbon footprint, promoting social initiatives and implementing strong governance policies. However, there can be no assurance that we will be able to achieve all of our targets. In the unlikely event of the Company failing to meet its target or falling short of societal expectations, there could be a material adverse impact on our operations. This could be in the form of lost revenues, damage to our reputation, decreased attractiveness to investors, as well as significant operating costs.
Risks related to measurement and compliance
We need to invest in various technologies to accurately manage and comply with the environmental regulatory policies of the local and global jurisdictions. In addition, in certain cases, we may purchase carbon offsets or could be exposed to carbon tax on our owned operations. Compliance costs, in some regions, could also force us to discontinue managing certain properties or exit the business altogether. This could lead to a significant deterioration in profitability.
Physical and transition risks related to climate-related changes
Rapid changes in client preferences and requirements for low-carbon and climate-resilient properties, ahead of our ability to deliver related solutions, could lead to customer attrition and consequently lower revenues and profitability. Our operating costs could also increase marginally with increasing carbon pricing, should we fail to transition our operations to lower-carbon energy sources in time. Lastly, our invested assets in our Investment Management business and the properties we manage are susceptible to physical damages due to climate-related changes.
Interest of management and others in material transactions
Except as described below or elsewhere in this AIF, no director of Colliers, executive officer of Colliers, or person or company that beneficially owns, or controls or directs more than 10% of any class or series of voting securities of Colliers, or any associate or affiliate of any of the foregoing persons, has or has had any material interest in any transaction within the last three years, or during the current year, that has materially affected or is reasonably expected to materially affect Colliers or any of its subsidiaries.
On April 16, 2021, the Company completed a transaction with Mr. Hennick and certain related entities pursuant to which: (a) the LTIA that had been previously granted to Mr. Hennick was terminated, for effective consideration of $96.2 million and the issuance of 3,572,858 Subordinate Voting Shares (such consideration having been determined with reference to the formula set out in the previously issued LTIA); (b) Mr. Hennick and certain related entities entered into the New MSA with respect to the provision of Mr. Hennick’s services as Chief Executive Officer and/or Executive Chairman of the Company, as his option; and (c) the New Trust Agreement was entered into, resulting in a clear timeline for the orderly elimination of the Subordinate Voting Shares and the Company’s dual class share structure, without payment of any premium. Full details regarding this transaction are set out in the Management Information Circular of the Company dated March 9, 2021, which is available on SEDAR+ at www.sedarplus.ca.
The only contracts that can reasonably be regarded as material to us, other than contracts entered into in the ordinary course of business, are as follows:
(a) Revolving Credit Facility: On May 27, 2022, the Company extended its Revolving Credit Facility for a new five-year term maturing in May 2027 (previously April 2024) and increased its borrowing capacity to $1.5 billion from $1.0 billion. On April 28, 2023, the Company exercised its right to further increase the borrowing capacity under the Revolving Credit Facility by $250 million to $1.75 billion. The Revolving Credit Facility is sustainability-linked and includes pricing adjustments tied to achievements of performance targets over time aligned with Colliers’ Elevate the Built Environment framework. These targets include: 1) reducing greenhouse gas emissions consistent with the Science-Based Targets initiative (“SBTi”); 2) increasing female representation in management roles and 3) ensuring Colliers-occupied offices obtain the WELL Health-Safety certification. We met our annual sustainability targets for 2022, and as of July 27, 2023, we achieved a full five basis point reduction in the borrowing cost on our Revolving Credit Facility. The Revolving Credit Facility bears interest at 1.125% to 2.50% over floating reference rates, depending on certain leverage ratios, and requires that we pay a commitment fee of 0.11% to 0.35% of the unused portion of the Revolving Credit Facility, depending on certain leverage ratios. The credit agreement relating to the Revolving Credit Facility (together with all applicable amendments) is available on SEDAR+ at www.sedarplus.ca.
The Company uses certain financial instruments from time to time in order to hedge against increases in market interest rates and its impact on interest expense, as described in the Risks Factors section. In December 2018 (and amended in May 2022), the Company entered into interest rate swap agreements to convert floating reference rates on $100 million of US dollar borrowings under the Revolving Credit Facility into a fixed interest rate of 2.6026%. These swaps matured on April 30, 2023. In July and December 2022, the Company entered into similar interest rate swap agreements (the “2022 IRS”) to hedge an additional $150 million and $250 million of US dollar borrowings under the Revolving Credit Facility at fixed interest rates of 2.802% and 3.592%, respectively. In April and December 2023, the Company entered into another similar swap agreement (the “2023 IRS”) to hedge an additional $100 million and $100 million of US dollar borrowings under the Revolving Credit Facility at fixed interest rate of 3.7250% and 4.0000%, respectively. The 2022 IRS and 2023 IRS have a maturity of May 27, 2027.
(b) Senior Notes due 2028: We issued €210 million of senior unsecured notes (the “Senior Notes due 2028”) pursuant to a note purchase agreement dated May 17, 2018 (the “2028 Note Agreement”), with a ten-year term ending May 30, 2028 and a fixed interest rate of 2.23%, which Senior Notes were placed privately and rank equally with the Revolving Credit Facility in terms of seniority. The proceeds of this issuance were drawn on May 30, 2018, and we used the net proceeds to reduce outstanding borrowings under the Revolving Credit Facility and for general corporate purposes. We may prepay the Senior Notes due 2028 at any time in an amount not less than 5% of the aggregate principal amount of the notes then outstanding, subject to payment of an applicable make-whole amount and other amounts. The financial covenants contained in the 2028 Note Agreement require that we maintain a net debt to consolidated EBITDA ratio of not more than 3.5, an interest coverage ratio of greater than 2.0 and to ensure that our priority debt does not at any time exceed 7.5% of our consolidated total assets. To date, we have complied with the foregoing covenants. All outstanding amounts under the Senior Notes must be repaid by the earlier of May 30, 2028 and the occurrence of an event of default under the Note Agreement. We are prohibited under the Note Agreement from undertaking certain acquisitions and dispositions, and incurring certain indebtedness and encumbrances, without prior approval of the holders of the Senior Notes. Since entering into the 2028 Note Agreement, certain amendments and/or waivers have been entered into in order to address points similar to those addressed by way of amendments to the Revolving Credit Facility as noted above. The Note Agreement is available on SEDAR+ at www.sedarplus.ca.
(c) Senior Notes due 2031: On July 28, 2021 the Company entered into a note purchase agreement to issue US dollar and Euro fixed rate senior unsecured notes (the “Senior Notes due 2031”), consisting of US$150 million of 3.02% Notes due 2031 and €125 million of 1.52% Notes due 2031. The Senior Notes due 2031 were placed privately and rank equally with the Revolving Credit Facility and Senior Notes due 2028. The proceeds of the Senior Notes due 2031 were drawn on October 7, 2021. The Company used the proceeds for general corporate purposes and to repay all outstanding borrowings under its Revolving Credit Facility. We may prepay the Senior Notes at any time in an amount not less than 5% of the aggregate principal amount of the notes then outstanding, subject to payment of an applicable make-whole amount and other amounts. The financial covenants contained require that we maintain a net debt to consolidated EBITDA ratio of not more than 3.5, an interest coverage ratio of greater than 2.0 and to ensure that our priority debt does not at any time exceed 7.5% of our consolidated total assets.
(d) AR Facility: On April 12, 2019, the Company established a structured accounts receivable facility (the “AR Facility”) with committed availability of $125 million and an initial term of 364 days, unless extended or an earlier termination event occurs. On April 25, 2022, the Company renewed its AR Facility with two third-party financial institutions and expanded the committed availability to $150 million from $125 million, with a term of 364 days extending to April 24, 2023 and includes selected US and Canadian trade accounts receivable. On December 15, 2022, the Company extended the AR Facility with a maturity date of October 24, 2024 and increased the committed availability to $175 million from $150 million. On September 28, 2023, the Company further expanded the AR Facility to $200 million. Under the AR Facility, certain of the Company’s subsidiaries continuously sell trade accounts receivable and contract assets (the “Receivables”) to wholly owned special purpose entities at fair market value. The special purpose entities then sell 100% of the Receivables to a third-party financial institution. Although the special purpose entities are wholly owned subsidiaries of the Company, they are separate legal entities with their own separate creditors who will be entitled, upon their liquidation, to be satisfied out of their assets prior to any assets or value in such special purpose entities becoming available to their equity holders and their assets are not available to pay other creditors of the Company. The agreements relating to the AR Facility are available on SEDAR+ at www.sedarplus.ca.
(e) Agreements Relating to Settlement of Long Term Incentive Arrangement with CEO: On April 16, 2021, after receiving approval from 95% of disinterested shareholders, the Company completed the previously announced transaction (the “Transaction”) to settle previously issued LTIA granted to an entity related to Mr. Hennick. The Transaction also established a timeline for the orderly elimination of Colliers’ dual class voting structure by no later than September 1, 2028. As described under “Interest of management and others in material transactions” above, the transaction resulted in the payment of $96.2 million to certain entities related to Mr. Hennick, along with the issuance of 3,572,858 Subordinate Voting Shares. Additionally, the Company entered into a new management services agreement (the “New MSA”) with Mr. Hennick and an entity related thereto with respect to the continued provision of Mr. Hennick’s services as Chief Executive Officer and/or Executive Chairman of the Company, at his option. The particulars of the New MSA are set out in the section entitled “Executive Compensation – Management Contract” contained in the 2023 Circular, which section is incorporated herein by reference. The definitive documentation relating to this transaction, including a new trust agreement relating to the Multiple Voting Shares, registration rights agreement and transaction agreement are available on SEDAR+ at www.sedarplus.ca.
Cease trade orders, bankruptcies, penalties or sanctions
To the best of the knowledge of the Company:
(1) none of the directors or executive officers of the Company is, as at the date of this AIF, or was within 10 years before the date of this AIF, a director, chief executive officer or chief financial officer of any company (including the Company) that: (i) was subject to a cease trade or similar order or an order that denied the relevant company access to any exemption under securities legislation, in each case, that was in effect for a period of more than 30 consecutive days (collectively, an “Order”) that was issued while the director or executive officer was acting in the capacity as director, chief executive officer or chief financial officer; or (ii) was subject to an Order that was issued after the director or executive officer ceased to be a director, chief executive officer or chief financial officer and which resulted from an event that occurred while that person was acting in the capacity as director, chief executive officer or chief financial officer; and
(2) none of the directors or executive officers of the Company, or a shareholder holding a sufficient number of securities of the Company to affect materially the control the Company: (a) is, as at the date of this AIF, or has been, within 10 years before the date of this AIF, a director or executive officer of any company (including the Company) that, while that person was acting in that capacity, or within a year of that person ceasing to act in that capacity, became bankrupt, made a proposal under any legislation relating to bankruptcy or insolvency or was subject to or instituted any proceedings, arrangement or compromise with creditors or had a receiver, receiver manager or trustee appointed to hold its assets; or (b) has, within the 10 years before the date of this AIF, become bankrupt, made a proposal under any legislation relating to bankruptcy or insolvency, or become subject to or instituted any proceedings, arrangement or compromise with creditors, or had a receiver, receiver manager or trustee appointed to hold the assets of the director, executive officer or shareholder,
except for Benjamin Stein, who served as a director of GTT Communications, Inc. (“GTT”) from May 2019 until December 2021. GTT commenced Chapter 11 bankruptcy proceedings in the United States in October 2021 which were subsequently completed in December 2022.
Certain directors and officers of the Company are engaged in and will continue to engage in activities outside the Company, and as a result, certain directors and officers of the Company may become subject to conflicts of interest. The Business Corporations Act (Ontario) provides that in the event that a director or officer has an interest in a contract or proposed contract or agreement, the director or officer shall disclose his or her interest in such contract or agreement and, in the case of directors, shall refrain from voting on any matter in respect of such contract or agreement unless otherwise provided under the Business Corporations Act (Ontario). To the extent that conflicts of interest arise, such conflicts will be resolved in accordance with the provisions of the Business Corporations Act (Ontario).
As at the date hereof, the Company is not aware of any existing or potential material conflicts of interest between the Company and a director or officer of the Company.
Independent registered public accounting firm
The Company’s independent registered public accounting firm is PricewaterhouseCoopers LLP, Chartered Professional Accountants, who has issued a Report of Independent Registered Public Accounting Firm dated February 15, 2024 on the Company’s consolidated financial statements as of December 31, 2023 and 2022 and for each of the years in the two-year period ended December 31, 2023 and on the effectiveness of the Company’s internal control over financial reporting as at December 31, 2023. PricewaterhouseCoopers LLP has advised that they are independent with respect to the Company within the meaning of the Chartered Professional Accountants of Ontario CPA Code of Professional Conduct and the rules and regulations of the SEC and the Public Company Accounting Oversight Board (“PCAOB”).
The Audit & Risk Committee (the “ARC”) is comprised of four members who are each “independent” and “financially literate” as required by Multilateral Instrument 52-110 Audit Committees (the “Audit Committee Rule”). The ARC has the resources and the authority to discharge its responsibilities, including the authority to engage, at the expense of Colliers, outside consultants, independent legal counsel and other advisors as it determines necessary to carry out its duties, without seeking approval our Board of Directors or management. The ARC also has the authority to conduct any investigation necessary and appropriate to fulfilling its responsibilities and has direct access and authority to communicate directly with the external auditors, legal counsel and officers and employees of Colliers. The ARC meets six times annually, or more frequently as circumstances dictate.
The ARC reviews the annual and interim financial statements intended for circulation among shareholders and reports upon these to the Board prior to their approval by our Board of Directors. The ARC is also responsible for reviewing the integrity of Colliers’ financial reporting process, both internal and external, and any major issues as to the adequacy of the internal controls and any special audit procedures adopted in light of any material control deficiencies. The ARC communicates directly with Colliers’ external auditors in order to discuss audit and related matters whenever appropriate. In addition, our Board of Directors may refer to the ARC such matters and questions relating to the financial position and operations of Colliers and its subsidiaries. All reports made to Colliers’ ethics hotline are reviewed by the Chair of the ARC and then by the entire ARC at its next meeting. Our Board of Directors has adopted an ARC mandate, a copy of which is annexed as Exhibit “A” to this AIF.
The education and related experience of each of the members of the ARC that is relevant to the performance by such members of their responsibilities on such committee is described below.
L. Frederick Sutherland (Chair) – Mr. Sutherland was the Executive Vice President and Chief Financial Officer of Aramark Corporation, Philadelphia, PA, a leading global provider of food services, facilities management and uniform and career apparel, from 1997 to 2015. Prior to joining Aramark in 1980, Mr. Sutherland was Vice President, Corporate Banking, at Chase Manhattan Bank, New York, NY. Mr. Sutherland is a director of Consolidated Edison, Inc. and Sterling Check Corp. Mr. Sutherland is also a director and former Chair of the Board of WHYY, Philadelphia’s public broadcast affiliate and a trustee of Duke University, The National Constitution Center, Episcopal Community Services, an anti-poverty agency, and People's Light, a professional non-profit theater. Mr. Sutherland holds an MBA Degree in Finance from the Katz School of the University of Pittsburgh and a Bachelors in Physics and Mathematics from Duke University.
John (Jack) P. Curtin, Jr. – Mr. Curtin is an Advisory Director in the Investment Banking Division of Goldman, Sachs & Co. in Toronto and New York. From July 2010 to December 2014, Mr. Curtin served as Chairman and Chief Executive of Goldman Sachs Canada Inc. From 2003 to July 2010, Mr. Curtin was Chairman of Goldman Sachs Canada Inc. From 1999 to 2003, Mr. Curtin was an Advisory Director of Goldman, Sachs & Co. in New York. From 1995 to 1999, Mr. Curtin was Chief Executive of Goldman Sachs Canada Inc. in Toronto. Prior to this assignment, Mr. Curtin was co-head of Global Money Markets and Chairman of Goldman Sachs Money Markets LP. Mr. Curtin moved to Money Markets in 1987 after serving as head of Fixed Income Syndicate/New Issues. Mr. Curtin joined the firm in 1976 in the Corporate Finance Department and was named partner in 1988 and managing director in 1996. Mr. Curtin is also a member of the Board of Directors of the Art Gallery of Ontario Foundation and the Royal Conservatory of Music. He previously served as a Director of the Canada/United States Fulbright Foundation. Mr. Curtin is a former governor of the Toronto Stock Exchange, a former director of Brookfield Asset Management, Cadillac Fairview Corporation, Maxxcom Corporation and the Investment Dealers Association of Canada. Mr. Curtin served as a trustee of Lakefield College School as well as Royal St. George’s College. Mr. Curtin received an MBA from Harvard in 1976 and his BA from Williams College in 1972.
Katherine M. Lee – Ms. Lee is a seasoned executive in financial services and served as President & CEO of GE Capital Canada, a leading global provider of financial and fleet management solutions to mid-market companies operating in a broad range of economic sectors. Prior to this role, Ms. Lee served as CEO of GE Capital Real Estate in Canada from 2002 to 2010 building it to a full debt and equity operating company. Ms. Lee joined GE in 1994 where she held a number of positions including Director, Mergers & Acquisitions for GE Capital’s Pension Fund Advisory Services based in San Francisco, and Managing Director of GE Capital Real Estate Korea based in Seoul and Tokyo. Ms. Lee earned a Bachelor of Commerce from the University of Toronto. She is a Chartered Professional Accountant and Chartered Accountant. She is active in the community championing women’s networks and Asian-Pacific Forums.
Edward Waitzer - Mr. Waitzer was a long-time partner of Stikeman Elliott LLP until his retirement in 2021, including serving as Chair of the firm from 1999 to 2006. Mr. Waitzer was also a professor and the Jarislowsky Dimma Mooney Chair in Corporate Governance at Osgoode Hall Law School and the Schulich School of Business at York University. Mr. Waitzer also has considerable regulatory and governance experience, having served as the Chairman of the Ontario Securities Commission from 1993 to 1996.
The Audit Committee Rule requires the Company to disclose whether its ARC has adopted specific policies and procedures for the engagement of non-audit services and to prepare a summary of these policies and procedures. The mandate of the ARC provides that it is such committee’s responsibility to: (a) approve the appointment and, when circumstances warrant, discharge of the external auditor and monitor its qualifications, performance and independence; (b) approve and oversee the disclosure of all audit services provided by the external auditor to the Company or any of its subsidiaries, determining which non-audit services the external auditor are prohibited from providing and, exceptionally, pre-approve and oversee the disclosure of permitted non-audit services to be performed by the external auditor, in accordance with applicable laws and regulations; and (c) approve the basis and amount of the external auditor’s fees and other significant compensation. The ARC has adopted a pre-approval policy pursuant to which the Company may not engage the Company’s external auditor to carry out certain non-audit services that are deemed inconsistent with the independence of auditors under US and Canadian applicable laws. The ARC must pre-approve all audit services as well as permitted non-audit services. The ARC has delegated to the Chair of the Audit Committee, who is independent, the authority to act on behalf of the ARC with respect to the pre-approval of all audit and permitted non-audit services provided by its external auditors from time to time. Any approvals by the Chair are reported to the full ARC at its next meeting.
In addition to performing the integrated audit of the Company’s annual consolidated financial statements and effectiveness of internal control over financial reporting, PricewaterhouseCoopers LLP provided other permitted services to the Company and they billed the Company the following fees for each of the Company’s two most recently completed years:
|
(in thousands of C$) |
Year ended December 31, 2023 |
Year ended December 31, 2022 |
|||||
|
Audit fees (note 1) |
$ | 4,392 | $ | 3,922 | |||
|
Audit-related fees (note 2) |
308 | 333 | |||||
|
Tax fees (note 3) |
2,736 | 1,851 | |||||
|
All other fees (note 4) |
12 | 25 | |||||
| $ | 7,448 | $ | 6,131 | ||||
Notes:
|
1. |
Refers to the aggregate fees billed and expected to be billed by the Company’s external auditor for audit services relating to the audit of the Company and statutory audits required by subsidiaries. |
|
2. |
Refers to the aggregate fees billed for assurance and related services by the Company’s external auditor that are reasonably related to the performance of the audit or review of the Company’s financial statements and are not reported under (1) above, including professional services rendered by the Company’s external auditor for supplementary assurance assessments and engagements. |
|
3. |
Refers to the aggregate fees billed for professional services rendered by the Company’s external auditor for tax compliance, tax advice and tax planning. The majority of the tax fees in 2023 relate to a non-recurring project. |
|
4. |
Refers to fees for consulting and subscriptions to accounting and tax research tools. |
Additional information, including the directors’ and officers’ remuneration and indebtedness, principal holders of the Company’s securities and options to purchase securities, where applicable, is contained in the 2023 Circular.
Copies of publicly filed documents of the Company, including those incorporated herein by reference, can be found on SEDAR+ at www.sedarplus.ca and also on EDGAR at www.sec.gov. Additional financial information is provided in the Company’s consolidated financial statements and management’s discussion and analysis for the year ended December 31, 2023.
AUDIT & RISK COMMITTEE MANDATE
Purpose
The Audit & Risk Committee (the "Committee") is appointed by and shall assist the Board of Directors (the "Board") of Colliers International Group Inc. (the "Company") in fulfilling its oversight responsibilities in the following principal areas: (i) accounting policies and practices, (ii) the financial reporting process, (iii) financial statements provided by the Company to the public, (iv) risk identification, management and processes, including systems of internal accounting and financial controls, internal systems reviews and remediation, and information technology and cyber-security risks and controls, (v) reviewing the Company's insurance policies and consideration of the extent of any uninsured exposure and the adequacy of coverage, (vi) appointing, overseeing and evaluating the work and independence of the external auditors and overseeing and evaluating the work of the Company's internal audit personnel (including by way of regular interaction and review at all Committee meetings and periodic meetings with the Company’s Director of Internal Audit at in camera sessions), (vii) compliance with applicable legal and regulatory requirements (including the Sarbanes-Oxley Act of 2002 and all applicable laws relating to environmental, social and governance matters), (viii) review of contractual arrangements involving related parties, conflicts of interest or material risks (other than employment related contracts), and (ix) overseeing and evaluating compliance with the Company's Code of Ethics and Conduct, Ethics Hotline Policy and other Company policies involving ethics and/or conflicts of interest. In addition to the responsibilities specifically enumerated in this Mandate, the Board may refer to the Committee such matters and questions relating to the financial position and operations of the Company and its subsidiaries as the Board may from time to time see fit.
Membership
The Committee shall consist of at least three directors appointed annually by the Board and shall be selected based upon the following, in accordance with applicable laws, rules and regulations:
Independence. Each member shall be independent in accordance with applicable legal and regulatory requirements, including, without limitation, the independence requirements set forth in Rule 10A-3(b)(1) under the Securities Exchange Act of 1934, as amended (the “Act”) (subject to the exemptions provided in Rule 10A-3(c) under the Act) and National Instrument 52-110 – Audit Committees of the Canadian Securities Administrators, and shall have no direct or indirect material relationship with the Company which could, in the view of the Board, reasonably interfere with the exercise of a member’s independent judgment.
Financially Literate. Each member shall be financially literate or must become financially literate within a reasonable period of time after his or her appointment to the Committee. For these purposes, an individual is financially literate if he or she has the ability to read and understand a set of financial statements that present a breadth and level of complexity of accounting issues that are generally comparable to the breadth and complexity of the issues that can reasonably be expected to be raised by the Company’s financial statements.
Commitment. In addition to being a member of the Committee, if a member is also on the audit committee or board of directors of other public companies or organizations, the Board shall determine that such simultaneous service does not impair the ability of such member to serve effectively on the Committee.
Chair and Secretary
The Chair of the Committee shall be selected by the Board. If the Chair is not present, the members of the Committee may designate a Chair for the meeting by majority vote of the members present. The Secretary of the Company shall be the Secretary of the Committee, provided that if the Secretary is not present, the Chair of the meeting may appoint a secretary for the meeting with the consent of the other Committee members who are present.
Meetings
The times and locations of meetings of the Committee and the calling of and procedures at such meetings, shall be determined from time to time by the Chair of the Committee, in consultation with management when necessary, provided that there shall be a minimum of four meetings per year. The Committee shall have sufficient notice in order to prepare for each meeting. Notice of each meeting shall also be given to the external auditors of the Company, and meetings shall be convened whenever requested by the external auditors or any member of the Committee in accordance with applicable law.
Meeting Agendas
Agendas for meetings of the Committee shall be developed by the Chair of the Committee in consultation with management and the corporate secretary, and shall be circulated to the Committee members prior to any meetings.
Resources and Authority
The Committee shall have the resources and the authority to discharge its responsibilities, including the authority to engage, at the expense of the Company, outside consultants, independent legal counsel and other advisors as it determines necessary to carry out its duties, without seeking approval of the Board or management. The Committee shall determine the appropriate funding required to compensate any advisor employed by the Committee and to pay ordinary administrative expenses of the Committee that are necessary or appropriate in carrying out its duties.
The Committee shall have the authority to conduct any investigation necessary and appropriate to fulfilling its responsibilities, and has direct access and authority to communicate directly with the external auditors, legal counsel and officers and employees of the Company (including, for the avoidance of doubt, internal audit personnel of the Company).
The members of the Committee have the right, for the purpose of performing their duties, to inspect the books and records of the Company and to discuss such accounts and records and any matters relating to the financial position, risk management and internal controls of the Company with the officers and external auditors of the Company.
Responsibilities
The Company's management is responsible for preparing the Company's financial statements while the external auditors are responsible for auditing those financial statements. The Committee is responsible for overseeing the conduct of those activities by the Company's management and external auditors, and overseeing the activities of any internal audit personnel and initiatives. The Company's external auditors are accountable to the Committee as representatives of the Company's shareholders.
It is recognized that members of the Committee are not full-time employees of the Company and do not represent themselves to be accountants or auditors by profession or experts in the fields of accounting or auditing or the preparation of financial statements. It is not the duty or responsibility of the Committee or its members to conduct "field work" or other types of auditing or accounting reviews or procedures. Each member of the Committee shall be entitled to rely on (i) the integrity of those persons and organizations within and outside the Company from whom it receives information, and (ii) the accuracy of the financial and other information provided to the Committee by such persons or organizations absent actual knowledge to the contrary.
The specific responsibilities of the Committee are as follows:
|
● |
In consultation with the external auditors and management, review the integrity of the Company's financial reporting process, both internal and external, and any major issues as to the adequacy of the internal controls and any special audit procedures adopted in light of any material control deficiencies; |
|
● |
Review all material transactions and contracts entered into by the Company with any insider or related party of the Company, other than director, officer or employee compensation which is approved by the Company's Compensation Committee; |
|
● |
Review with management and the external auditors the Company's annual audited consolidated financial statements and discuss with the external auditors all matters required to be discussed by generally accepted auditing standards (GAAS) in Canada and the United States. This would include reviewing an annual audit & risk committee report prepared by the external auditors describing: (i) all critical accounting policies used by the Company, (ii) any material alternative accounting treatments within generally accepted accounting principles (GAAP) that have been discussed with management of the Company, including the ramifications of the use of such alternative treatments and disclosures, and (iii) any other material written communications between the external auditors and management; |
|
● |
Following completion of the annual audit, review with management and the external auditors any significant issues, concerns or difficulties encountered and resolve any disagreements between management and the external auditors regarding financial reporting; |
|
● |
Review and approve the interim quarterly financial statements and press releases, and review and recommend to the Board for approval the annual financial statements and press releases, in each case prior to the release of earnings information, including any non-GAAP measures and earnings guidance; |
|
● |
Review and be satisfied that adequate procedures are in place for the review of the public disclosure of financial information by the Company extracted or derived from the Company's financial statements, and periodically assess the adequacy of those procedures; |
|
● |
and Meet separately with management and with the external auditors, including at the time of the annual audit plan review with management and the external auditors. |
External Auditors
The Committee shall:
|
● |
Require the external auditor to report directly to it and is responsible for the appointment, nomination, compensation, retention, termination and oversight of the work of the external auditors engaged for the purpose of issuing an auditor's report or performing other audit, review or attest services for the Company, and in such regard recommend to the Board the external auditors to be nominated for approval by the shareholders; |
|
● |
Pre-approve all audit engagements and the provision by the external auditors of all non-audit services, including fees and terms for all audit and non-audit engagements, and in such regard the Committee may establish the types of non-audit services the external auditors shall be prohibited from providing and shall establish the types of audit, audit related and non-audit services for which the Committee will retain the external auditors. The Committee may delegate the responsibility to pre-approve non-audit services to one of its members and any such delegated pre-approvals shall be presented to the Committee at its next scheduled meeting; |
|
● |
Review and approve the Company's policies for the hiring of partners and employees and former partners and employees of the external auditing firm; |
|
● |
Consider, assess and report to the Board with regard to the independence and performance of the external auditors; |
|
● |
Request and review annually a report by the external auditors regarding the auditing firm's internal quality-control procedures, any material issues raised by the most recent internal quality-control review of the auditing firm, or by any inquiry or investigation by governmental or professional authorities, within the past five years; |
|
● |
and Request and review annually a formal written statement by the external auditor delineating all relationships between the external auditor and the Company, actively engaging in a dialogue with the external auditor with respect to any disclosed relationships or services that may impact the objectivity and independence of the auditor and for taking, or recommending that the full Board take, appropriate action to oversee the independence of the external auditor. |
Internal Controls and Risk Management
The Committee shall:
|
● |
Oversee management's design, implementation and evaluation of the Company's internal controls over financial reporting, including compliance with the requirements of the Sarbanes-Oxley Act of 2002; |
|
● |
Receive and review reports from management and the external auditors with regard to the reliability and effective operation of the Company's accounting systems and internal controls; Discuss with management the Company's approach to risk assessment and management, controls over fraud and assessment of the need for internal auditing (including assessing and managing the risks related to personal and sensitive data that is collected, transmitted or stored by the Company and the control environment in place to protect the privacy of such data); |
|
● |
Communicate directly with internal audit personnel as the Committee determines appropriate with respect to any matters relating to internal controls over financial reporting and oversee the review thereof by internal audit personnel; |
|
● |
Establish policies and procedures for the confidential, anonymous submission of any concerns regarding questionable accounting or other acts and for the receipt, retention and treatment of complaints received regarding accounting, internal accounting controls or auditing matters; |
|
● |
Review of the principal risks of the Company's business and operations, and any other circumstances and events that could have a significant impact on the Company's assets and stakeholders; |
|
● |
Discuss with management potential risks to the Company's business and operations, their likelihood and magnitude and the interrelationships and potential compounding effects of such risks; |
|
● |
Assess the steps management has taken to minimize such risks in light of the Company's risk tolerance; |
|
● |
Assess the Company's risk tolerance, the overall process for identifying the Company's principal business and operational risks and the implementation of appropriate measures to manage and disclose such risks; |
|
● |
Review the controls and security governing the Company's information technology systems, including information technology infrastructure (e.g., disaster recovery) and business controls (e.g., data integrity, authorized access and process compliance); |
|
● |
Review with senior management annually, the Company's insurance policies and considering the extent of any uninsured exposure and the adequacy of coverage; |
|
● |
and Review disclosure respecting the oversight of management of the Company's principal business and operational risks. |
Legal and Regulatory Requirements
Receive and review timely analysis by management of significant issues relating to public disclosure and reporting, including, prior to finalization, the Management's Discussion & Analysis and Annual Information Form; Prepare the report of the Committee required to be included with the Company's periodic filings; and Assist the Board in the oversight of compliance with legal and regulatory matters.
Additional Responsibilities
Report regularly to the Board, including on matters such as the quality and integrity of the Company's financial statements, compliance with legal and regulatory requirements, the results of any internal audit initiatives and the status of the internal audit function and personnel of the Company, including evaluation of internal controls over financial reporting for purposes of compliance with the Sarbanes-Oxley Act of 2002, and the performance and independence of the external auditors; and Review and reassess annually the adequacy of the Committee's Mandate and prepare and review with the Board an annual performance evaluation of the Committee.
Exhibit 2
COLLIERS INTERNATIONAL GROUP INC.
MANAGEMENT’S REPORT
MANAGEMENT’S RESPONSIBILITY FOR FINANCIAL STATEMENTS
The accompanying consolidated financial statements and management discussion and analysis (“MD&A”) of Colliers International Group Inc. (“Colliers” or the “Company”) and all information in this annual report are the responsibility of management and have been approved by the Board of Directors.
The consolidated financial statements have been prepared by management in accordance with accounting principles generally accepted in the United States of America using the best estimates and judgments of management, where appropriate. The most significant of these accounting principles are set out in Note 2 to the consolidated financial statements. Management has prepared the financial information presented elsewhere in this annual report and has ensured that it is consistent with the consolidated financial statements.
The MD&A has been prepared in accordance with National Instrument 51-102 of the Canadian Securities Administrators, taking into consideration other relevant guidance, including Regulation S-K of the US Securities and Exchange Commission.
The Board of Directors of the Company has an Audit & Risk Committee consisting of four independent directors. The Audit & Risk Committee meets regularly to review with management and the independent auditors any significant accounting, internal control, auditing and financial reporting matters.
These consolidated financial statements have been audited by PricewaterhouseCoopers LLP, which have been appointed as the independent registered public accounting firm of the Company by the shareholders. Their report outlines the scope of their examination. As auditors, PricewaterhouseCoopers LLP have full and independent access to the Audit & Risk Committee to discuss their findings.
MANAGEMENT’S REPORT ON INTERNAL CONTROL OVER FINANCIAL REPORTING
Management is responsible for establishing and maintaining adequate internal control over financial reporting for the Company. Internal control over financial reporting is a process designed to provide reasonable assurance regarding the reliability of financial reporting and the preparation of financial statements for external purposes in accordance with generally accepted accounting principles.
Due to its inherent limitations, internal control over financial reporting may not prevent or detect misstatements. Also, projections of any evaluation of its effectiveness to future periods are subject to the risk that controls may become inadequate because of changes in conditions, or that the degree of compliance with the policies or procedures may deteriorate.
Management has excluded three entities acquired by the Company during the last fiscal period from its assessment of internal control over financial reporting as at December 31, 2023. The total assets and total revenues of the three majority-owned entities represent 0.7% and 0.9%, respectively of the related consolidated financial statement amounts as at and for the year ended December 31, 2023.
Management has assessed the effectiveness of the Company’s internal control over financial reporting as at December 31, 2023, based on the criteria set forth in Internal Control – Integrated Framework (2013) issued by the Committee of Sponsoring Organizations of the Treadway Commission. Based on this assessment, management has concluded that, as at December 31, 2023, the Company’s internal control over financial reporting was effective.
The effectiveness of the Company's internal control over financial reporting as at December 31, 2023, has been audited by PricewaterhouseCoopers LLP, the Company’s independent registered public accounting firm as stated in their report which appears herein.
| /s/ Jay S. Hennick Chairman and Chief Executive Officer |
/s/ Christian Mayer Chief Financial Officer |
| February 15, 2024 |
REPORT OF INDEPENDENT REGISTERED PUBLIC ACCOUNTING FIRM
To the Shareholders and Board of Directors of Colliers International Group Inc.
Opinions on the Financial Statements and Internal Control over Financial Reporting
We have audited the accompanying consolidated balance sheets of Colliers International Group Inc. and its subsidiaries (together, the Company) as of December 31, 2023 and 2022, and the related consolidated statements of earnings and comprehensive earnings, of shareholders’ equity and of cash flows for the years then ended, including the related notes (collectively referred to as the consolidated financial statements). We also have audited the Company’s internal control over financial reporting as of December 31, 2023, based on criteria established in Internal Control – Integrated Framework (2013) issued by the Committee of Sponsoring Organizations of the Treadway Commission (COSO).
In our opinion, the consolidated financial statements referred to above present fairly, in all material respects, the financial position of the Company as of December 31, 2023 and 2022, and the results of its operations and its cash flows for the years then ended in conformity with accounting principles generally accepted in the United States of America. Also in our opinion, the Company maintained, in all material respects, effective internal control over financial reporting as of December 31, 2023, based on criteria established in Internal Control – Integrated Framework (2013) issued by the COSO.
Basis for Opinions
The Company’s management is responsible for these consolidated financial statements, for maintaining effective internal control over financial reporting, and for its assessment of the effectiveness of internal control over financial reporting, included in the accompanying Management’s Report on Internal Control over Financial Reporting. Our responsibility is to express opinions on the Company’s consolidated financial statements and on the Company’s internal control over financial reporting based on our audits. We are a public accounting firm registered with the Public Company Accounting Oversight Board (United States) (PCAOB) and are required to be independent with respect to the Company in accordance with the U.S. federal securities laws and the applicable rules and regulations of the Securities and Exchange Commission and the PCAOB.
We conducted our audits in accordance with the standards of the PCAOB. Those standards require that we plan and perform the audits to obtain reasonable assurance about whether the consolidated financial statements are free of material misstatement, whether due to error or fraud, and whether effective internal control over financial reporting was maintained in all material respects.
Our audits of the consolidated financial statements included performing procedures to assess the risks of material misstatement of the consolidated financial statements, whether due to error or fraud, and performing procedures that respond to those risks. Such procedures included examining, on a test basis, evidence regarding the amounts and disclosures in the consolidated financial statements. Our audits also included evaluating the accounting principles used and significant estimates made by management, as well as evaluating the overall presentation of the consolidated financial statements. Our audit of internal control over financial reporting included obtaining an understanding of internal control over financial reporting, assessing the risk that a material weakness exists, and testing and evaluating the design and operating effectiveness of internal control based on the assessed risk. Our audits also included performing such other procedures as we considered necessary in the circumstances. We believe that our audits provide a reasonable basis for our opinions.
As described in Management’s Report on Internal Control over Financial Reporting, management has excluded three majority owned entities from its assessment of internal control over financial reporting as of December 31, 2023 because they were acquired by the Company in a purchase business combination during the year ended December 31, 2023. We have also excluded the three entities from our audit of internal control over financial reporting. These are majority owned subsidiaries whose total assets and total revenues excluded from management’s assessment and our audit of internal control over financial reporting represent 0.7% and 0.9%, respectively, of the related consolidated financial statement amounts as of and for the year ended December 31, 2023.
Definition and Limitations of Internal Control over Financial Reporting
A company’s internal control over financial reporting is a process designed to provide reasonable assurance regarding the reliability of financial reporting and the preparation of financial statements for external purposes in accordance with generally accepted accounting principles. A company’s internal control over financial reporting includes those policies and procedures that (i) pertain to the maintenance of records that, in reasonable detail, accurately and fairly reflect the transactions and dispositions of the assets of the company; (ii) provide reasonable assurance that transactions are recorded as necessary to permit preparation of financial statements in accordance with generally accepted accounting principles, and that receipts and expenditures of the company are being made only in accordance with authorizations of management and directors of the company; and (iii) provide reasonable assurance regarding prevention or timely detection of unauthorized acquisition, use, or disposition of the company’s assets that could have a material effect on the financial statements.
Because of its inherent limitations, internal control over financial reporting may not prevent or detect misstatements. Also, projections of any evaluation of effectiveness to future periods are subject to the risk that controls may become inadequate because of changes in conditions, or that the degree of compliance with the policies or procedures may deteriorate.
Critical Audit Matters
The critical audit matter communicated below is a matter arising from the current period audit of the consolidated financial statements that was communicated or required to be communicated to the audit committee and that (i) relates to accounts or disclosures that are material to the consolidated financial statements and (ii) involved our especially challenging, subjective, or complex judgments. The communication of critical audit matters does not alter in any way our opinion on the consolidated financial statements, taken as a whole, and we are not, by communicating the critical audit matter below, providing a separate opinion on the critical audit matter or on the accounts or disclosures to which it relates.
Revenue Recognition – Sales Brokerage and Leasing Services Revenue
As described in Notes 2 and 27 to the consolidated financial statements, the Company recognized revenue from real estate sales brokerage services, which makes up a significant portion of capital markets revenue of $702.5 million and leasing services revenue of $1,063.1 million for the year ended December 31, 2023. Revenue is recognized upon transfer of control of promised services to customers in an amount that reflects the consideration the Company expects to receive in exchange for those services. Management has determined that control of sales brokerage services rendered transfers to a customer when a sale and purchase agreement becomes unconditional and leasing services rendered transfers to a customer when a lease between the landlord and the tenant is executed. At these points in time, the customer has received substantially all of the benefit of the services provided by the Company. Sales brokerage and leasing service revenue contracts may include terms that result in variability to the transaction price and ultimate revenues earned beyond the underlying value of the transaction, which may include contingencies. Sales brokerage and leasing services revenue is constrained when it is probable that the Company may not be entitled to the total amount of the revenue under the contract, which is associated with the occurrence or non-occurrence of an event that is outside of the Company’s control, or where the facts and circumstances of the contract limit the Company’s ability to predict whether this event will occur. When sales brokerage and leasing services revenue is constrained, revenue is not recognized until the uncertainty has been resolved. Management estimates variable consideration and performs a constraint analysis for these contracts using historical information to estimate the amount the Company will ultimately be entitled to. Management used significant judgment to determine whether sales brokerage and leasing services revenue should be constrained and the timing of when such revenue should be recognized.
The principal considerations for our determination that performing procedures relating to sales brokerage and leasing services revenue recognition is a critical audit matter are (i) the significant judgment by management in determining whether sales brokerage and leasing services revenue should be constrained and the timing of when such revenue should be recognized, and (ii) high degree of auditor judgment, subjectivity and effort in performing procedures and evaluating management’s assessment of sales brokerage and leasing services revenue recognition.
Addressing the matter involved performing procedures and evaluating audit evidence in connection with forming our overall opinion on the consolidated financial statements. These procedures included testing the effectiveness of controls relating to the sales brokerage and leasing services revenue recognition process, including controls over management’s review and approval of revenue recognition based upon the supporting evidence available for each sales brokerage and leasing services revenue contract. These procedures also included, among others, evaluating the appropriateness of management’s assessment of sales brokerage and leasing services revenue recognition for a sample of sales brokerage and leasing services revenue transactions recognized, including evaluating the contractual terms identified in the underlying brokerage transaction agreements and considering other supporting evidence such as customer or third party correspondence and cash receipts.
/s/ PricewaterhouseCoopers LLP
Chartered Professional Accountants, Licensed Public Accountants
Toronto, Canada
February 15, 2024
We have served as the Company’s auditor since 1995.
Colliers International Group Inc.
Consolidated Statements of Earnings
(in thousands of US dollars, except per share amounts)
| Year ended December 31, |
2023 |
2022 |
||||||
| Revenues (note 27) |
$ | 4,335,141 | $ | 4,459,487 | ||||
| Cost of revenues (exclusive of depreciation and amortization shown below) |
2,596,823 | 2,749,485 | ||||||
| Selling, general and administrative expenses |
1,185,469 | 1,096,107 | ||||||
| Depreciation |
54,608 | 48,680 | ||||||
| Amortization of intangible assets |
147,928 | 128,741 | ||||||
| Acquisition-related items (note 7) |
47,096 | 77,144 | ||||||
| Loss on disposal of operations (note 5) |
2,282 | 26,834 | ||||||
| Operating earnings |
300,935 | 332,496 | ||||||
| Interest expense, net |
94,077 | 48,587 | ||||||
| Earnings from equity accounted investments |
(5,078 | ) | (6,677 | ) | ||||
| Other (income) expense |
(841 | ) | 1,032 | |||||
| Earnings before income tax |
212,777 | 289,554 | ||||||
| Income tax expense (note 22) |
68,086 | 95,010 | ||||||
| Net earnings |
144,691 | 194,544 | ||||||
| Non-controlling interest share of earnings |
56,560 | 53,919 | ||||||
| Non-controlling interest redemption increment (note 18) |
22,588 | 94,372 | ||||||
| Net earnings attributable to Company |
$ | 65,543 | $ | 46,253 | ||||
| Net earnings per common share (note 20) |
||||||||
| Basic |
$ | 1.43 | $ | 1.07 | ||||
| Diluted |
$ | 1.41 | $ | 1.05 | ||||
The accompanying notes are an integral part of these consolidated financial statements.
Colliers International Group Inc.
Consolidated Statements of Comprehensive Earnings
(in thousands of US dollars)
| Year ended December 31, |
2023 |
2022 |
||||||
| Net earnings |
$ | 144,691 | $ | 194,544 | ||||
| Other comprehensive earnings, net of tax: |
||||||||
| Change in foreign currency translation |
3,492 | (24,154 | ) | |||||
| Reclassification of accumulated foreign currency translation on disposal of operations (note 5) |
541 | 19,152 | ||||||
| Unrealized gain on interest rate swaps, net of tax |
(2,433 | ) | 6,955 | |||||
| Pension liability adjustments, net of tax |
(660 | ) | 1,292 | |||||
| Total other comprehensive earnings, net |
940 | 3,245 | ||||||
| Comprehensive earnings |
145,631 | 197,789 | ||||||
| Less: Comprehensive earnings attributable to non-controlling interests |
73,371 | 157,573 | ||||||
| Comprehensive earnings attributable to Company |
$ | 72,260 | $ | 40,216 | ||||
The accompanying notes are an integral part of these consolidated financial statements.
Colliers International Group Inc.
Consolidated Balance Sheets
(in thousands of US dollars)
| As at December 31, |
2023 |
2022 |
||||||
| Assets |
||||||||
| Current assets |
||||||||
| Cash and cash equivalents |
$ | 181,134 | $ | 173,661 | ||||
| Restricted cash |
37,941 | 25,381 | ||||||
| Accounts receivable, net of allowance of $36,382 (December 31, 2022 - $25,332) |
643,375 | 577,879 | ||||||
| Contract assets (note 27) |
83,389 | 91,924 | ||||||
| Warehouse receivables (note 24) |
177,104 | 29,623 | ||||||
| Income tax recoverable |
48,104 | 21,970 | ||||||
| Prepaid expenses and other current assets (note 8) |
258,725 | 247,635 | ||||||
| Warehouse fund assets (note 6) |
44,492 | 45,353 | ||||||
| 1,474,264 | 1,213,426 | |||||||
| Other receivables |
11,857 | 12,461 | ||||||
| Contract assets (note 27) |
19,691 | 15,755 | ||||||
| Other assets (note 8) |
157,197 | 138,510 | ||||||
| Warehouse fund assets (note 6) |
47,536 | - | ||||||
| Fixed assets (note 10) |
202,837 | 164,493 | ||||||
| Operating lease right-of-use assets (note 9) |
390,565 | 341,623 | ||||||
| Deferred tax assets, net (note 22) |
59,468 | 63,460 | ||||||
| Intangible assets (note 11) |
1,080,471 | 1,159,910 | ||||||
| Goodwill (note 12) |
2,038,240 | 1,988,539 | ||||||
| 4,007,862 | 3,884,751 | |||||||
| $ | 5,482,126 | $ | 5,098,177 | |||||
| Liabilities and shareholders' equity |
||||||||
| Current liabilities |
||||||||
| Accounts payable and accrued expenses |
$ | 535,769 | $ | 503,189 | ||||
| Accrued compensation |
569,166 | 625,565 | ||||||
| Income tax payable |
16,527 | 32,282 | ||||||
| Contract liabilities (note 27) |
45,293 | 25,616 | ||||||
| Long-term debt - current (note 13) |
1,796 | 1,360 | ||||||
| Contingent acquisition consideration - current (note 24) |
13,944 | 42,942 | ||||||
| Warehouse credit facilities (note 15) |
168,780 | 24,286 | ||||||
| Operating lease liabilities (note 9) |
89,938 | 84,989 | ||||||
| Liabilities related to warehouse fund assets (note 6) |
- | 1,353 | ||||||
| 1,441,213 | 1,341,582 | |||||||
| Long-term debt (note 13) |
1,500,843 | 1,437,739 | ||||||
| Contingent acquisition consideration (note 24) |
30,768 | 48,287 | ||||||
| Operating lease liabilities (note 9) |
375,454 | 322,496 | ||||||
| Other liabilities |
120,565 | 91,105 | ||||||
| Deferred tax liabilities, net (note 22) |
43,191 | 57,754 | ||||||
| Liabilities related to warehouse fund assets (note 6) |
47,536 | - | ||||||
| Convertible notes (note 14) |
- | 226,534 | ||||||
| 2,118,357 | 2,183,915 | |||||||
| Redeemable non-controlling interests (note 18) |
1,072,066 | 1,079,306 | ||||||
| Shareholders' equity |
||||||||
| Common shares (note 19) |
1,127,034 | 845,680 | ||||||
| Contributed surplus |
123,394 | 104,504 | ||||||
| Deficit |
(332,866 | ) | (384,199 | ) | ||||
| Accumulated other comprehensive loss |
(69,571 | ) | (76,288 | ) | ||||
| Total Company shareholders' equity |
847,991 | 489,697 | ||||||
| Non-controlling interests |
2,499 | 3,677 | ||||||
| Total shareholders' equity |
850,490 | 493,374 | ||||||
| $ | 5,482,126 | $ | 5,098,177 | |||||
| Commitments and contingencies (note 25) |
||||||||
The accompanying notes are an integral part of these consolidated financial statements.
On behalf of the Board of Directors,
| /s/ L. Frederick Sutherland Director |
/s/ Jay S. Hennick Director |
Colliers International Group Inc.
Consolidated Statements of Shareholders' Equity
(in thousands of US dollars, except share information)
| Common shares |
Accumulated |
|||||||||||||||||||||||||||
| Issued and |
other |
Non- |
Total |
|||||||||||||||||||||||||
| outstanding |
Contributed |
comprehensive |
controlling |
shareholders' |
||||||||||||||||||||||||
| shares |
Amount |
surplus |
Deficit |
loss |
interests |
equity |
||||||||||||||||||||||
| Balance, December 31, 2021 |
44,054,744 | $ | 852,167 | $ | 79,407 | $ | (279,724 | ) | $ | (70,251 | ) | $ | 3,670 | $ | 585,269 | |||||||||||||
| Net earnings |
- | - | - | 194,544 | - | - | 194,544 | |||||||||||||||||||||
| Pension liability adjustment, net of tax |
- | - | - | - | 1,292 | - | 1,292 | |||||||||||||||||||||
| Foreign currency translation loss |
- | - | - | - | (24,154 | ) | - | (24,154 | ) | |||||||||||||||||||
| Unrealized gain on interest rate swaps, net of tax |
- | - | - | - | 6,955 | - | 6,955 | |||||||||||||||||||||
| Other comprehensive earnings (loss) attributable to NCI |
- | - | - | - | (9,282 | ) | 90 | (9,192 | ) | |||||||||||||||||||
| NCI share of earnings |
- | - | - | (53,919 | ) | - | 2,834 | (51,085 | ) | |||||||||||||||||||
| NCI redemption increment |
- | - | - | (94,372 | ) | - | - | (94,372 | ) | |||||||||||||||||||
| Distributions to NCI |
- | - | - | - | - | (2,387 | ) | (2,387 | ) | |||||||||||||||||||
| Acquisitions of businesses, net |
- | - | - | - | - | 10 | 10 | |||||||||||||||||||||
| Reclass to net earnings on disposal of operations (note 5) |
- | - | (93 | ) | - | 19,152 | (540 | ) | 18,519 | |||||||||||||||||||
| Subsidiaries’ equity transactions |
- | - | 8,004 | - | - | - | 8,004 | |||||||||||||||||||||
| Subordinate Voting Shares: |
||||||||||||||||||||||||||||
| Stock option expense |
- | - | 21,853 | - | - | - | 21,853 | |||||||||||||||||||||
| Stock options exercised |
305,125 | 21,445 | (4,667 | ) | - | - | - | 16,778 | ||||||||||||||||||||
| Dividends |
- | - | - | (12,932 | ) | - | - | (12,932 | ) | |||||||||||||||||||
| Purchased for cancellation (note 20) |
(1,426,713 | ) | (27,932 | ) | - | (137,796 | ) | - | - | (165,728 | ) | |||||||||||||||||
| Balance, December 31, 2022 |
42,933,156 | $ | 845,680 | $ | 104,504 | $ | (384,199 | ) | $ | (76,288 | ) | $ | 3,677 | $ | 493,374 | |||||||||||||
| Net earnings |
- | - | - | 144,691 | - | - | 144,691 | |||||||||||||||||||||
| Pension liability adjustment, net of tax |
- | - | - | - | (660 | ) | - | (660 | ) | |||||||||||||||||||
| Foreign currency translation gain |
- | - | - | - | 3,492 | - | 3,492 | |||||||||||||||||||||
| Unrealized loss on interest rate swaps, net of tax |
- | - | - | - | (2,433 | ) | - | (2,433 | ) | |||||||||||||||||||
| Other comprehensive earnings attributable to NCI |
- | - | - | - | 5,777 | 349 | 6,126 | |||||||||||||||||||||
| NCI share of earnings |
- | - | - | (56,560 | ) | - | 2,939 | (53,621 | ) | |||||||||||||||||||
| NCI redemption increment |
- | - | - | (22,588 | ) | - | - | (22,588 | ) | |||||||||||||||||||
| Distributions to NCI |
- | - | - | - | - | (3,212 | ) | (3,212 | ) | |||||||||||||||||||
| Acquisition of businesses, net |
- | - | - | - | - | (44 | ) | (44 | ) | |||||||||||||||||||
| Reclass to net earnings on disposal of operations (note 5) |
- | - | 541 | (1,210 | ) | (669 | ) | |||||||||||||||||||||
| Subsidiaries’ equity transactions |
- | - | 3,998 | - | - | - | 3,998 | |||||||||||||||||||||
| Subordinate Voting Shares: |
||||||||||||||||||||||||||||
| Redemption of Convertible Notes (note 14) |
4,015,720 | 227,101 | - | - | - | - | 227,101 | |||||||||||||||||||||
| Stock option expense |
- | - | 27,087 | - | - | - | 27,087 | |||||||||||||||||||||
| Stock options exercised |
600,500 | 54,253 | (12,195 | ) | - | - | - | 42,058 | ||||||||||||||||||||
| Dividends |
- | - | - | (14,210 | ) | - | - | (14,210 | ) | |||||||||||||||||||
| Balance, December 31, 2023 |
47,549,376 | $ | 1,127,034 | $ | 123,394 | $ | (332,866 | ) | $ | (69,571 | ) | $ | 2,499 | $ | 850,490 | |||||||||||||
The accompanying notes are an integral part of these consolidated financial statements.
Colliers International Group Inc.
Consolidated Statements of Cash Flows
(in thousands of US dollars)
| Year ended December 31, |
2023 |
2022 |
||||||
| Cash provided by (used in) |
||||||||
| Operating activities |
||||||||
| Net earnings |
$ | 144,691 | $ | 194,544 | ||||
| Items not affecting cash: |
||||||||
| Depreciation and amortization |
202,536 | 177,421 | ||||||
| Loss on disposal of operations (note 5) |
2,282 | 26,834 | ||||||
| Gains attributable to mortgage servicing rights |
(17,722 | ) | (17,385 | ) | ||||
| Gains attributable to the fair value of mortgage premiums and origination fees |
(16,335 | ) | (16,582 | ) | ||||
| Deferred tax |
(9,924 | ) | (25,997 | ) | ||||
| Earnings from equity accounted investments |
(5,078 | ) | (6,677 | ) | ||||
| Stock option expense (note 21) |
27,087 | 21,853 | ||||||
| Amortization of advisor loans |
33,844 | 27,408 | ||||||
| Contingent consideration (note 7) |
32,948 | 53,869 | ||||||
| Other |
23,649 | 19,498 | ||||||
| Increase in accounts receivable, prepaid expenses and other assets |
(203,727 | ) | (469,062 | ) | ||||
| Increase in accounts payable, accrued expenses and other liabilities |
9,036 | 39,166 | ||||||
| Decrease in accrued compensation |
(70,395 | ) | (85,547 | ) | ||||
| Contingent acquisition consideration paid |
(39,115 | ) | (69,224 | ) | ||||
| Proceeds received on sale of mortgage loans |
1,138,535 | 1,137,730 | ||||||
| Principal funded on originated mortgage loans |
(1,262,361 | ) | (973,466 | ) | ||||
| Increase (decrease) in warehouse credit facilities |
144,493 | (138,625 | ) | |||||
| Sales to AR Facility, net (note 16) |
31,217 | 171,273 | ||||||
| Net cash provided by operating activities |
165,661 | 67,031 | ||||||
| Investing activities |
||||||||
| Acquisitions of businesses, net of cash acquired (note 4) |
(60,343 | ) | (1,007,297 | ) | ||||
| Purchases of fixed assets |
(84,524 | ) | (67,681 | ) | ||||
| Advisor loans issued |
(75,243 | ) | (55,610 | ) | ||||
| Purchases of warehouse fund assets |
(122,604 | ) | (161,042 | ) | ||||
| Proceeds from disposal of warehouse fund assets |
74,627 | 137,578 | ||||||
| Collections of AR facility deferred purchase price (note 16) |
124,313 | 288,004 | ||||||
| Other investing activities |
9,791 | (6,796 | ) | |||||
| Net cash used in investing activities |
(133,983 | ) | (872,844 | ) | ||||
| Financing activities |
||||||||
| Increase in long-term debt |
924,980 | 1,629,242 | ||||||
| Repayment of long-term debt |
(832,934 | ) | (700,201 | ) | ||||
| Purchases of non-controlling interests' subsidiary shares, net |
(32,661 | ) | (31,622 | ) | ||||
| Contingent acquisition consideration paid |
(17,415 | ) | (56,290 | ) | ||||
| Proceeds received on exercise of stock options |
42,058 | 16,779 | ||||||
| Dividends paid to common shareholders |
(13,517 | ) | (13,100 | ) | ||||
| Distributions paid to non-controlling interests |
(77,400 | ) | (62,926 | ) | ||||
| Repurchases of Subordinate Voting Shares |
- | (165,728 | ) | |||||
| Other financing activities |
(917 | ) | (3,237 | ) | ||||
| Net cash provided by (used in) financing activities |
(7,806 | ) | 612,917 | |||||
| Effect of exchange rate changes on cash, cash equivalents and restricted cash |
(3,839 | ) | (33,333 | ) | ||||
| Net change in cash, cash equivalents and restricted cash |
20,033 | (226,229 | ) | |||||
| Cash, cash equivalents and restricted cash, beginning of year |
199,042 | 425,271 | ||||||
| Cash, cash equivalents and restricted cash, end of year |
$ | 219,075 | $ | 199,042 | ||||
The accompanying notes are an integral part of these consolidated financial statements.
Colliers International Group Inc.
Notes to Consolidated Financial Statements
(in thousands of US dollars, except share and per share amounts)
1. Description of the business
Colliers International Group Inc. (“Colliers” or the “Company”) provides commercial real estate professional services and investment management to corporate and institutional clients in 34 countries around the world (66 countries including affiliates and franchisees). Colliers’ primary service lines are Outsourcing & Advisory, Investment Management (“IM”), Leasing and Capital Markets. Operationally, Colliers is organized into four distinct segments: Americas; Europe, Middle East and Africa (“EMEA”); Asia and Australasia (“Asia Pacific”) and Investment Management.
2. Summary of presentation
The preparation of consolidated financial statements in accordance with accounting principles generally accepted in the United States of America (“GAAP”) requires management to make estimates and assumptions that affect the reported amounts of assets and liabilities and disclosures of contingent assets and liabilities at the date of the financial statements, and the reported amounts of revenues and expenses during the reporting period. The most significant estimates are related to the judgments used to determine the timing and amount of revenue recognition, recoverability of goodwill and intangible assets, determination of fair values of assets acquired and liabilities assumed in business combinations, estimated fair value of contingent consideration related to acquisitions, determination of the fair value of capitalized mortgage servicing rights and derivative financial instruments, and current expected credit losses on financial assets including collectability of accounts receivable and allowance for loss sharing obligations. Actual results could be materially different from these estimates.
Significant accounting policies are summarized as follows:
Principles of consolidation
The accompanying consolidated financial statements include the accounts of the Company, its majority-owned subsidiaries and those variable interest entities where the Company is the primary beneficiary. Where the Company does not have a controlling interest but has the ability to exert significant influence, the equity method of accounting is used. Inter-company transactions and accounts are eliminated on consolidation.
When applying the principles of consolidation, the Company begins by determining whether an investee is a variable interest entity (“VIE”) or a voting interest entity (“VOE”). Assessing whether an entity is a VIE or a VOE involves judgment and analysis. Factors considered in this assessment include the entity’s legal organization, the entity’s capital structure and equity ownership, and any related party or de facto agent implications of the Company’s involvement with the entity.
VOEs are embodied by common and traditional corporate and certain partnership structures. For VOEs, the interest holder with control through majority ownership and majority voting rights consolidates the entity.
For VIEs, identification of the primary beneficiary determines the accounting treatment. In evaluating whether the Company is the primary beneficiary, it evaluates its direct and indirect economic interests in the entity. A reporting entity is determined to be the primary beneficiary if it holds a controlling financial interest in the VIE. Determining which reporting entity, if any, has a controlling financial interest in a VIE is primarily a qualitative approach focused on identifying which reporting entity has both (1) the power to direct the activities of a VIE that most significantly impact such entity’s economic performance and (2) the obligation to absorb losses or the right to receive benefits from such entity that could potentially be significant to such entity.
The primary beneficiary analysis is performed at the inception of the Company’s investment and upon the occurrence of a reconsideration event. When the Company determines it is the primary beneficiary of a VIE, it consolidates the VIE; when it is determined that the Company is not the primary beneficiary of the VIE, the investment in the VIE is accounted for at fair value or under the equity method, based upon an election made at the time of investment.
Cash and cash equivalents
Cash equivalents consist of short-term interest-bearing securities and money market mutual funds. These cash equivalents are readily convertible into cash and the interest-bearing securities have original maturities at the date of purchase of three months or less. The Company also maintains custodial escrow accounts, agency and fiduciary funds relating to its debt finance operations and as an agent for its property management operations. These amounts are not included in the accompanying consolidated balance sheets as they are not assets of the Company.
Restricted cash
Restricted cash consists primarily of cash amounts set aside to satisfy legal or contractual requirements arising in the normal course of business, primarily at Colliers Mortgage.
Receivables and allowance for credit losses
Accounts receivables are recorded when the Company has a right to payment within customary payment terms or it recognizes a contract asset if revenue is recognized prior to when payment is due. From the point of initial recognition, the carrying value of such receivables and contract assets, net of allowance for credit losses, represents their estimated net realizable value after deducting for potential credit losses. The Company’s expected loss allowance methodology uses historical collection experience, the current status of customers’ accounts receivable and considers both current and expected future economic and market conditions. Due to the short-term nature of such receivables, the estimate of accounts receivable that may be collected is based on the aging of the receivable balances and the financial condition of customers. Additionally, specific allowance amounts are established to record the appropriate provision for customers that have a higher probability of default. The allowances are then reviewed on a quarterly basis to ensure that they are appropriate. After all collection efforts have been exhausted by management, the outstanding balance considered not collectible is written off against the allowance.
In some cases, the Company may record a receivable or a contract asset which corresponds with payables which the Company is only obligated to pay upon collection of the receivable (“Reimbursable Receivables”). These Reimbursable Receivables correspond with commissions payable, payables to facilitate collection from the customer and make payments to subcontractors or relate to collection from tenants for payment to the landlord. These corresponding payables are typically satisfied on a pay-when-paid basis. In relation to Reimbursable Receivables, an allowance is only recorded to the extent that the Company has estimated credit losses.
Fixed assets
Fixed assets are carried at cost less accumulated depreciation. The costs of additions and improvements are capitalized, while maintenance and repairs are expensed as incurred. Fixed assets are reviewed for impairment whenever events or circumstances indicate that the carrying value of an asset group may not be recoverable. An impairment loss is recorded to the extent the carrying amount exceeds the estimated fair value of an asset group. Fixed assets are depreciated over their estimated useful lives as follows:
| Buildings | 20 to 40 years straight-line |
| Vehicles | 3 to 5 years straight-line |
| Furniture and equipment | 3 to 10 years straight-line |
| Computer equipment and software | 3 to 7 years straight-line |
| Leasehold improvements | 1 to 10 years straight-line (based upon term of the lease) |
Investments
Equity accounted investments
For equity investments where it does not control the investee, and where it is not the primary beneficiary of a VIE but can exert significant influence over the financial and operating policies of the investee the Company utilizes the equity method of accounting. The evaluation of whether the Company exerts control or significant influence over the financial and operation policies of the investees requires significant judgement based on the facts and circumstances surrounding each individual investment. Factors considered in these evaluations may include the type of investment, the legal structure of the investee, any influence the Company may have on the governing board of the investee.
The Company’s equity accounted investees that are investment companies record their underlying investments at fair value. Therefore, under the equity method of accounting, the Company’s share of the investee’s underlying net income predominantly represents fair value adjustments in the investments held by the equity method investees.
The Company’s share of the investee’s underlying net income or loss is based upon the most currently available information, which may precede the date of the consolidated statement of financial condition and is realized in other (income) expense. Distributions received reduce the Company’s carrying value of the investee.
Investments in debt and equity securities
The Company invests in debt and equity securities primarily in relation to its wholly owned captive insurance company and Colliers Securities, a broker-dealer licensed under the Securities and Exchange Commission and a member of the Financial Industry Regulatory Authority (“FINRA”). These investments are accounted for at fair value with changes recorded in net earnings (loss).
Financial instruments and derivatives
Certain loan commitments and forward sales commitments related to the Company’s warehouse receivables meet the definition of a derivative and are recorded at fair value in the consolidated balance sheets upon the execution of the commitment to originate a loan with a borrower and to sell the loan to an investor, with a corresponding amount recognized as revenue in the consolidated statements of earnings. The estimated fair value of loan commitments includes the value of loan origination fees and premiums on anticipated sale of the loan, net of related costs and broker fees, a loss sharing reserve, the fair value of the expected net cash flows associated with servicing of the loan, and the effects of interest rate movements. The estimated fair value of the forward sales commitments includes the effects of interest rate movements. Adjustments to the fair value related to loan commitments and forward sale commitments are included within Capital Markets revenue on the consolidated statements of earnings.
From time to time, the Company may use interest rate swaps to hedge a portion of its interest rate exposure on long-term debt. When hedge accounting is applied, the swaps are carried at fair value on the consolidated balance sheets, with gains or losses recognized in interest expense. The carrying value of the hedged item is adjusted for changes in fair value attributable to the hedged interest rate risk; the associated gain or loss is recognized currently in earnings and the unrealized gain or loss is recognized in other comprehensive income. If swaps are terminated and the underlying item is not or when hedge accounting is discontinued, the resulting gain or loss is deferred and recognized over the remaining life of the underlying item using the effective interest method. In addition, the Company may enter into short-term foreign exchange contracts to lower its cost of borrowing, to which hedge accounting is not applied.
Derivative financial instruments are recorded on the consolidated balance sheets as other assets or other liabilities and carried at fair value. See note 24 for additional information on derivative financial instruments.
Fair value
The Company uses the fair value measurement framework for financial assets and liabilities and for non-financial assets and liabilities that are recognized or disclosed at fair value on a non-recurring basis. The framework defines fair value, gives guidance for measurement and disclosure, and establishes a three-level hierarchy for observable and unobservable inputs used to measure fair value. An asset or liability’s classification within the hierarchy is determined based on the lowest level input that is significant to the fair value measurement. The three levels are as follows:
Level 1 – Quoted prices (unadjusted) in active markets for identical assets or liabilities
Level 2 – Observable market-based inputs other than quoted prices in active markets for identical assets or liabilities
Level 3 – Unobservable inputs for which there is little or no market data, which requires the Company to develop its own assumptions
Convertible notes
Convertible Notes are accounted for entirely as debt as no portion of the proceeds is required to be accounted for as attributable to the conversion feature. Interest on the Convertible Notes is recorded as interest expense. Financing fees are amortized over the life of the Convertible Notes as additional non-cash interest expense utilizing the effective interest method.
The earnings per share impact of the Convertible Notes is calculated using the “if-converted” method, if dilutive, where coupon interest expense, net of tax, is added to the numerator and the number of potentially issuable subordinate voting shares is added to the denominator. Convertible Notes were fully settled in June 2023 (see note 14).
Financing fees
Financing fees related to the Revolving Credit Facility are recorded as an asset and amortized to interest expense using the effective interest method. Financing fees related to the Senior Notes and Convertible Notes are recorded as a reduction of the debt amount and are amortized to interest expense using the effective interest method.
Financial guarantees and allowance for loss sharing obligations
For certain loans originated and sold under the Fannie Mae Delegated Underwriting and Servicing (“DUS”) Program the Company undertakes an obligation to partially guarantee performance of the loan typically up to one-third of any losses on loans originated.
When the Company commits to making a loan to a borrower, it recognizes an expense equal to the estimated fair value of this loss sharing obligation (the “Loss Reserve”), which reduces the gain on sale of the loan reported in Capital Markets revenue.
In accordance with ASC 326, the Company estimates the credit losses expected over the life of the credit exposure related to this loss sharing obligation and performs a quarterly analysis of the Loss Reserve. The Company evaluates the Loss Reserve on an individual loan basis and the evaluation models consider the specific details of the underlying property used as collateral, such as occupancy and financial performance. The models also analyze historical losses, current and expected economic conditions, and reasonable and supportable forecasts. Changes to the Loss Reserve are recognized in the consolidated statement of earnings. See note 25 for further information on the DUS Program and the loss-sharing obligation.
Warehouse receivables
The Company originates held for sale mortgage loans with commitments to sell to third party investors. These loans are referred to as warehouse receivables and are funded directly to borrowers by the warehouse credit facilities. The facilities are generally repaid within 45 days when the loans are transferred while the Company retains the servicing rights. The Company elects the fair value option for warehouse receivables.
Warehouse fund assets
From time to time, the Company’s Investment Management segment purchases investments for placement, or “seeding”, of assets into a fund which it manages. The purchased investments are recorded at fair value as warehouse fund assets and corresponding liabilities related to warehouse fund assets prior to the ultimate divestiture to the identified fund. These assets and associated liabilities may be purchased by the entity and held for sale to the fund or may be held in a structure that is consolidated by the Company as a VIE and which will be deconsolidated when its controlling financial interest is redeemed commensurate with a sale of interests to the ultimate investors in the fund. When assets are purchased by the Company and held for sale the warehouse fund assets are presented as current on the consolidated balance sheets as they are expected to be held for a period not to exceed twelve months.
The transactions are not intended as an alternative source of operating earnings and the arrangements are generally structured not to generate any gain or loss. See note 6 for additional details on warehouse fund assets.
Mortgage servicing rights (“MSRs”)
MSRs, or the rights to service mortgage loans for others, result from the sale or securitization of loans originated by the Company and are recognized as intangible assets on the consolidated balance sheets. The Company initially recognizes MSRs based on the fair value of these rights on the date the loans are sold. Subsequent to initial recognition, MSRs are amortized and carried at the lower of amortized cost or fair value. They are amortized in proportion to and over the estimated period that net servicing income is expected to be received based on projections and timing of estimated future net cash flows.
In connection with the origination and sale of mortgage loans for which the Company retains servicing rights, an asset or liability is recognized based upon the fair value of the MSR on the date that the loans are sold. Upon origination of a mortgage loan held for sale, the fair value of the retained MSR is included in the forecasted proceeds from the anticipated loan sale and results in a net gain (which is reflected in Capital Markets revenue).
MSRs do not actively trade in an open market with readily observable prices; therefore, fair value is determined based on certain assumptions and judgments. The valuation model incorporates assumptions including contractual servicing fee income, interest on escrow deposits, discount rates, the cost of servicing, prepayment rates, delinquencies, the estimated life of servicing cash flows and ancillary income and late fees. The assumptions used are subject to change based upon changes to estimates of future cash flows and interest rates, among other things. The key assumptions used during the years ended December 31, 2023 and December 31, 2022, in measuring fair value were as follows:
| As at December 31, |
||||||||
| 2023 |
2022 |
|||||||
| Discount rate |
11.7 | % | 11.5 | % | ||||
| Conditional prepayment rate |
3.1 | % | 3.1 | % | ||||
As at December 31, 2023, the estimated fair value of MSRs was $179,858 (2022 – $172,833). See note 11 for the current carrying value of the MSR assets. The MSRs are evaluated quarterly for impairment through a comparison of the carrying amount and fair value of the MSRs, and recognized with the establishment of a valuation allowance or an impairment if determined to be other than temporary. Other than write-offs due to prepayments of sold warehouse receivables where servicing rights have been retained, there have been no instances of impairment since acquiring Colliers Mortgage.
Goodwill and intangible assets
Goodwill represents the excess of purchase price over the fair value of assets acquired and liabilities assumed in a business combination and is not subject to amortization.
Intangible assets are recorded at fair value on the date they are acquired. Indefinite life intangible assets are not subject to amortization. Where lives are finite, they are amortized over their estimated useful lives as follows:
| Customer lists and relationships | straight-line over 4 to 20 years |
| Investment management contracts | straight-line over 5 to 15 years |
| Trademarks and trade names | straight-line over 2 to 10 years |
| Franchise rights | straight-line over 2 to 15 years |
| Management contracts and other | straight-line over life of contract ranging from 2 to 10 years |
| Backlog | as underlying backlog transactions are completed |
The Company reviews the carrying value of finite life intangible assets for impairment whenever events or changes in circumstances indicate that the carrying amount of an asset group may not be recoverable from the estimated future cash flows expected to result from their use and eventual disposition. If the sum of the undiscounted expected future cash flows is less than the carrying amount of the asset group, an impairment loss is recognized. Measurement of the impairment loss is based on the excess of the carrying amount of the asset group over the fair value calculated using discounted expected future cash flows.
Goodwill and indefinite life intangible assets are tested for impairment annually, on August 1, or more frequently if events or changes in circumstances indicate the asset might be impaired, in which case the carrying amount of the asset is written down to fair value.
Impairment of goodwill is tested at the reporting unit level. The Company has four distinct reporting units. Impairment is tested by first assessing qualitative factors to determine whether it is more likely than not that the fair value of a reporting unit is less than its carrying amount. Where it is determined to be more likely than not that its fair value is greater than its carrying amount, then no further testing is required. Where the qualitative analysis is not sufficient to support that the fair value exceeds the carrying amount then a quantitative goodwill impairment test is performed. The quantitative test compares the reporting unit’s carrying amount, including goodwill with the estimated fair value of the reporting unit. The fair values of the reporting units are estimated using a discounted cash flow approach. The fair value measurement is classified within Level 3 of the fair value hierarchy. If the carrying amount of the reporting unit exceeds its fair value, the difference is reported as an impairment loss. Certain assumptions are used to determine the fair value of the reporting units, the most sensitive of which are estimated future cash flows and the discount rate applied to future cash flows. Changes in these assumptions could result in a materially different fair value.
Impairment of indefinite life intangible assets is tested by comparing the carrying amount to the estimated fair value on an individual intangible asset basis.
Redeemable non-controlling interests
Redeemable non-controlling interests (“RNCI”) are recorded at the greater of (i) the redemption amount or (ii) the amount initially recorded as RNCI at the date of inception of the minority equity position. This amount is recorded in the “mezzanine” section of the balance sheet, outside of shareholders’ equity. Changes in the RNCI amount are recognized immediately as they occur.
Revenue
The Company generates revenue through its provision of commercial real estate services. These services consist of Leasing, Capital Markets, Outsourcing & Advisory and Investment Management services.
(a) Leasing
Leasing includes landlord and tenant representation services. Landlord representation provides real estate owners with services to strategically position properties and to secure appropriate tenants. Tenant representation focuses on assisting businesses to assess their occupancy requirements and evaluating and negotiating leases and lease renewals.
(b) Capital Markets
Capital Markets revenue is generated through sales brokerage and other capital markets transactions. These services include real estate sales, debt origination and placement, equity capital raising, market value opinions, acquisition advisory and transaction management. The Company’s debt finance operations relate to the origination and sale of multifamily and commercial mortgage loans.
(c) Outsourcing & Advisory
Outsourcing & Advisory services consist of project management, engineering and design, valuation services, property management as well as loan servicing. Project management services include design and construction management, move management and workplace solutions consulting. Engineering & design services consist of multidisciplinary planning, consulting and design engineering services to multiple end-markets. Project management and engineering & design engagements range from single project contracts with a duration of less than one year to multi-year contracts with multiple discrete projects. Property management provides real estate service solutions to real estate owners. In addition to providing on-site management and staffing, the Company provides support through centralized resources such as technical and environmental services, accounting, marketing and human resources. Consistent with industry standards, management contract terms typically range from one to three years, although most contracts are terminable at any time following a notice period, usually 30 to 120 days.
Valuation services consist of helping customers determine market values for various types of real estate properties. Such services may involve appraisals of single properties or portfolios of properties. These appraisals may be utilized for a variety of customer needs including acquisitions, dispositions, financing or for tax purposes.
Loan servicing fees consist of revenues earned in accordance with the contractual arrangements associated with the Company’s debt finance operations and represent fees earned for servicing loans originated by the Company. Loan servicing revenues are included in the Other revenue line (see note 27).
(d) Investment Management
Investment Management revenues include consideration for services in the form of asset management advisory and administration fees, transaction fees and incentive fees (carried interest). The performance obligation is to manage client’s invested capital for a specified period of time and is delivered over time.
Revenue recognition and unearned revenues
Revenue is recognized upon transfer of control of promised products or services to customers in an amount that reflects the consideration the Company expects to receive in exchange for those products or services. The Company enters into contracts that can include various combinations of services, which are capable of being distinct and accounted for as separate performance obligations. Revenue is recognized net of any taxes collected from customers, which are subsequently remitted to governmental authorities.
(a) Nature of services
The Company has determined that control of real estate sales brokerage services rendered transfer to a customer when a sale and purchase agreement becomes unconditional. Leasing services rendered transfer to a customer when a lease between the landlord and the tenant is executed. At these points in time the customer has received substantially all of the benefit of the services provided by the Company. The transaction price is typically associated with the underlying asset involved in the transaction, most commonly a percentage of the sales price or the aggregate rental payments over the term of the lease which are generally known when revenue is recognized.
Other Capital Market revenues are recorded when the Company’s performance obligation is satisfied. Although the performance obligation varies based upon the contractual terms of the transaction or service, the performance obligation is generally recognized at the point in time when a defined outcome is satisfied, including completion of financing or closing of a transaction. At this time, the Company has transferred control of the promised service and the customer obtains control.
Revenues from the Company’s debt finance operations, included in Capital Markets revenue, are excluded from the scope of ASC Topic 606, Revenue from Contracts with Customers (“ASC 606”). Revenue is recognized and a derivative asset is recorded upon the commitment to originate a loan with a borrower and corresponding sale to an investor. The derivative asset is recognized at fair value and includes the fair value of the contractual loan origination, related fees and sale premium, and the estimated fair value of the expected net cash flows associated with the servicing of the loan. Debt finance revenue also includes changes to the fair value of loan commitments, forward sale commitments and loans held for sale that occur during their respective holding periods. Upon sale of the loans, no gains or losses are recognized as such loans are recorded at fair value during the holding periods. MSRs and loss sharing obligations are recognized as assets and liabilities, respectively, upon the sale of the loans.
Outsourcing & Advisory services including those provided in relation to property management, project management and engineering & design transfer to the customer over time as the services are performed and revenue from providing these services is recognized in the accounting period in which the services are rendered. For fixed-price contracts, revenue is recognized based upon the actual labor hours spent relative to the total expected labor hours or the project costs incurred relative to the total project costs. For some projects certain obligations that are representative of the work completed may be used as an alternative to recognize revenue. The use of labor hours or overall project costs is dependent upon the input that best represents the progress of the work completed in relation to the specific contract. For cost-reimbursable and hourly-fee contracts, revenue is recognized in the amount to which the Company has a right to invoice.
For other advisory services, including valuation and appraisal review, the customer is unable to benefit from the services until the work is substantially complete, revenue is recognized upon delivery of materials to the customer because this faithfully represents when the service has been rendered. For most fixed fee consulting assignments, revenue is recognized based upon the actual service provided to the end of the reporting period as a proportion of the total services to be provided.
Loan servicing revenues are recognized over the contractual service period. Loan servicing fees related to retained MSRs are governed by ASC 820 and ASC 860 and excluded from the scope of ASC 606. Loan servicing fees earned from servicing contracts which the Company does not hold mortgage servicing rights are in scope of ASC 606.
Investment Management advisory fees are recognized as the services are performed over time and are primarily based on agreed-upon percentages of a calculated fee base which may include committed capital, assets under management, invested capital, gross asset value or net asset value depending upon the terms of the fund and/or the stage in a fund’s life. Revenue recognition for transactional performance obligations are recognized at a point in time when the performance obligation has been met. The Company receives investment management advisory incentive fees (carried interest) from certain investment funds. These incentive fees are dependent upon exceeding specified performance thresholds on a relative or absolute basis, depending on the product and structure of the business. Incentive fees are recognized when it is determined that significant reversal is considered no longer probable (such as upon the sale of a fund’s investment or when the amount of assets under management becomes known as of the end of the specified measurement period). Incentive fee-related compensation represents carried interest allocations awarded to employees which are tied to the funds’ performance. Incentive fee-related compensation expenses are recognized as services are being rendered by the employees and accrued when it is probable that payment will be made in accordance with the applicable governing agreements. Pursuant to the terms of Harrison Street Real Estate Capital, LLC (“Harrison Street”), Basalt Infrastructure Partners LLC (“Basalt”) and Rockwood Capital, LLC (“Rockwood”) acquisitions, incentive fees related to assets that were invested prior to the respective acquisition dates are allocated to certain stakeholders including employees and former owners; as such the full amount of these incentive fees is passed through and recognized as cost of revenues in the consolidated statement of earnings.
(b) Significant judgments
The Company’s contracts with customers may include promises to transfer multiple products and services. Determining whether products and services are considered distinct performance obligations that should be accounted for separately versus together may require significant judgment. Where a contract contains multiple performance obligations, judgment is used to assess whether they are distinct and accounted for separately or not distinct and are accounted for and recognized together.
Brokerage commission arrangements may include terms that result in variability to the transaction price and ultimate revenues earned beyond the underlying value of the transaction, these may include rebates and/or contingencies. The Company estimates variable consideration and performs a constraint analysis for these contracts on the basis of historical information to estimate the amount the Company will ultimately be entitled to. Revenue is constrained when it is probable that the Company may not be entitled to the total amount of the revenue as associated with the occurrence or non-occurrence of an event that is outside of the Company’s control or where the facts and circumstances of the arrangement limit the Company’s ability to predict whether this event will occur. When revenue is constrained, this revenue is not recognized until the uncertainty has been resolved.
Outsourcing & Advisory arrangements may include incentives tied to achieving certain performance targets. The Company estimates variable consideration or performs a constraint analysis for these contracts on the basis of circumstances specific to the project and historical information in order to estimate the amount the Company will ultimately be entitled to. Estimates of revenue, costs or extent of progress toward completion are revised if circumstances change. Any resulting increases or decreases in estimated revenues or costs are reflected in profit or loss in the period in which the circumstances that give rise to the revision become known by management.
In providing project management, engineering and design or property management services, the Company may engage subcontractors to provide on-site staffing or to provide specialized technical services, materials and/or installation services. These arrangements are assessed and require judgment to determine whether the Company is a principal or an agent of the customer. When the Company acts as a principal, because it is primarily responsible for the delivery of the completed project and controls the services provided by the subcontractors, these amounts are accounted for as revenue on a gross basis. However, when the Company acts as an agent, because it does not control the services prior to delivery to the customer, these costs are accounted for on a net basis.
In some cases, the Company may facilitate collection from the customer and payments to subcontractors or may facilitate collection from tenants for payment to the landlord. In these instances, balances are recorded as accounts receivable and accounts payable until settled.
Investment Management fee arrangements are unique to each contract and evaluated on an individual basis to determine the timing of revenue recognition as well as evaluation of incentive-fee related compensation expense and significant judgment is involved in making such determinations. At each reporting period, the Company considers various factors in estimating revenue to be recognized and incentive fee related-compensation expense to be accrued. Incentive fees have a broad range of possible amounts and the determination of these amounts is based upon the market value for managed assets which is highly susceptible to factors outside of the Company’s influence. As a result, incentive fee revenue is generally constrained until significant reversal is considered no longer probable.
Certain constrained Capital Markets and Leasing fees, Outsourcing & Advisory fees and Investment Management fees may arise from services that began in a prior reporting period. Consequently, a portion of the fees the Company recognizes in the current period may be partially related to the services performed in prior periods. In particular, substantially all investment management incentive fees recognized in the period were previously constrained.
Contract balances
Timing of revenue recognition may differ from the timing of invoicing to customers. The Company invoices the customer and records a receivable when it has a right to payment within customary payment terms or it recognizes a contract asset if revenue is recognized prior to when payment is due. Contract liabilities consist of payments received in advance of recognizing revenue. These liabilities consist primarily of payments received for outsourcing and advisory engagements where a component of the revenue may be paid by the customer prior to the benefits of the services transferring to the customer. As a practical expedient, the Company does not adjust the promised amount of consideration for the effect of a significant financing component when it is expected, at contract inception, that the period between transfer of the service and when the customer pays for that service will be one year or less. The Company does not typically include extended payment terms in its contracts with customers.
The Company generally does not incur upfront costs to obtain or fulfill contracts that are capitalizable to contract assets and if capitalizable they would be amortized to expense within one year or less of incurring the expense; consequently, the Company applies the practical expedient to recognize these incremental costs as an expense when incurred. Any costs to obtain or fulfill contracts that exceed one year are capitalized to contract assets and amortized over the term of the contract on a method consistent with the transfer of services to the customer and the contract’s revenue recognition.
Payment terms and conditions vary by contract type, although terms generally include a requirement of payment within 30 to 90 days. With the exceptions of sales brokerage and lease brokerage, the Company does not expect to have any contracts where the period between the transfer of services to the customer and the payment by the customer exceeds one year. With regard to sales brokerage and lease brokerage, arrangements may exist where the service is transferred but payment is not received for a period greater than one year. However, arrangements of this nature do not contain a significant financing component because the amount and timing varies on the basis of the occurrence or non-occurrence of an event that is outside the control of the Company or the customer. As a consequence, the Company does not adjust the transaction prices for the time value of money.
Contract liabilities represent advance payments associated with the Company’s performance obligations that have not yet been satisfied. The majority of the balances are expected to be recognized to revenue or disbursed on behalf of the client within a year.
Remaining performance obligations
Remaining performance obligations represent the aggregate transaction prices for contracts where the Company’s performance obligations have not yet been satisfied. The Company applies the practical expedient related to remaining performance obligations that are part of a contract that has an original expected duration of one year or less and the practical expedient related to variable consideration from remaining performance obligations.
Stock-based compensation
For equity classified awards, compensation cost is measured at the grant date based on the estimated fair value of the award adjusted for expected forfeitures. The related stock option compensation expense is allocated using the graded attribution method.
Long-term incentive plans
Under these plans, certain subsidiary employees are compensated if the earnings before interest, income tax and amortization of the subsidiary increases. In some instances, subsidiary employees may be compensated through participation in a stock-based plan associated with the value of a subsidiary’s shares. Awards under these plans have a term of up to ten years, a vesting period of five to ten years. All long-term incentive plans are settled in cash, with the exception of certain stock-based plans which are predominantly settled in cash, but which may have the option to settle in a subsidiary’s shares. As at December 31, 2023 all significant stock-based plans are to be settled in cash. If an award is subject to a vesting condition, then the graded attribution method is applied to the fair value or intrinsic value of the award. The related compensation expense is recorded in selling, general and administrative expenses and the liability is recorded in accrued compensation or other non-current liabilities.
The Company incurred compensation expense related to subsidiary stock-based plans of $2,656 during the year ended December 31, 2023 (2022 - $6,954). As at December 31, 2023, there was $24,026 of unrecognized compensation costs related to non-vested stock-based plans which is expected to be recognized over the next seven years. During the year-ended December 31, 2023, the fair value of options vested under stock-based plans was $6,671.
Foreign currency translation and transactions
Assets, liabilities and operations of foreign subsidiaries are recorded based on the functional currency of each entity. For certain foreign operations, the functional currency is the local currency, in which case the assets, liabilities and operations are translated at current exchange rates from the local currency to the reporting currency, the US dollar. The resulting unrealized gains or losses are reported as a component of accumulated other comprehensive earnings. Realized and unrealized foreign currency gains or losses related to any foreign dollar denominated monetary assets and liabilities are included in net earnings.
Income tax
Income tax has been provided using the asset and liability method whereby deferred tax assets and liabilities are recognized for the expected future income tax consequences of events that have been recognized in the consolidated financial statements or income tax returns. Deferred tax assets and liabilities are measured using enacted income tax rates expected to apply to taxable income in the years in which temporary differences are expected to reverse, be recovered or settled. The effect on deferred tax assets and liabilities of a change in income tax rates is recognized in earnings in the period in which the change occurs. A valuation allowance is recorded unless it is more likely than not that realization of a deferred tax asset will occur based on available evidence.
The Company recognizes uncertainty in tax positions taken or expected to be taken utilizing a two-step approach. The first step is to determine whether it is more likely than not that the tax position will be sustained upon examination by tax authorities on the basis technical merits of the position. The second step is to recognize the largest amount of tax benefit that is more than 50 percent likely to be realized upon ultimate settlement with the related tax authority.
The Company classifies interest and penalties associated with income tax positions in income tax expense.
Leases
The Company recognizes an operating lease right-of-use (“ROU”) asset and a lease liability on the consolidated balance sheet at the lease commencement date. Operating lease ROU assets represent the Company’s right to use an underlying asset for the lease term and lease liabilities represent the obligation to make lease payments arising from the lease. Operating lease ROU assets and liabilities are recognized at commencement date based on the present value of lease payments over the lease term adjusted for lease pre-payments and lease incentives. After the commencement date any modifications to the leasing arrangement are assessed and the ROU asset and lease liability are remeasured to recognize modifications to the lease term or fixed payments. As most of the Company’s leases do not provide an implicit rate, the incremental borrowing rate based on the information available at commencement date is used to determine the present value of lease payments. The Company uses the implicit rate when readily determinable. The lease terms may include options to extend or terminate the lease when it is reasonably certain that the Company will exercise that option. Operating leases ROU assets are amortized to selling, general and administrative expenses (“SG&A”) straight-line over the lease term.
Finance leases are included in fixed assets and long-term debt on the consolidated balance sheet. Finance lease assets are depreciated using the straight-line method from the commencement date to the earlier of the end of the useful life of the right-of-use asset or the end of lease term.
Variable lease payments and variable payments related to non-lease components are recorded to SG&A as incurred. Variable lease payments include amounts related to changes in payments associated with changes in an index or rate but which are not also associated with a remeasurement of the lease liability.
The Company has operating lease agreements with lease and non-lease components, and the Company has elected to apply the practical expedient to not separate lease and nonlease components and therefore the ROU assets and lease liabilities include payments related to services included in the lease agreement. Additionally, for certain leases the Company has elected to group leases that commence at the same time and where accounting does not materially differ from accounting for the leases individually as a portfolio of leases.
The Company has elected not to recognize ROU assets and lease liabilities for leases that have a term of twelve months or less. Similarly, the Company will be applying the practical expedient to not recognize assets or liabilities related to a business combination when the acquired lease has a remaining term of twelve months or less at the acquisition date. The payments associated with these leases are recorded to SG&A on a straight-line basis over the remaining lease term.
Business combinations
All business combinations are accounted for using the acquisition method of accounting. Transaction costs are expensed as incurred.
The fair value of the contingent consideration is classified as a financial liability and is recorded on the balance sheet at the acquisition date and is re-measured at fair value at the end of each period until the end of the contingency period, with fair value adjustments recognized in earnings. However, if the contingent consideration includes an element of compensation to the vendors (i.e. it is tied to continuing employment or it is not linked to the business valuation), then the portion of contingent consideration related to such element is treated as compensation expense over the expected employment period.
3. Impact of recently issued accounting standards
Recently adopted accounting guidance
Contract Assets and Contract Liabilities from Contracts with Customers – Business Combinations
In October 2021, the FASB issued ASU No. 2021-08, Accounting for Contract Assets and Contract Liabilities from Contracts with Customers (Subtopic 805-10: Business Combinations). The ASU requires that recognition and measurement principles of ASC 606 Revenue Recognition be applied for contract assets and contract liabilities acquired in a business combination. The guidance in ASC 805 listing exceptions to recognition principle was amended to include contract assets and contract liabilities. The Company adopted the guidance effective January 1, 2023. The adoption of the standard did not have a material impact on the Company’s consolidated financial statements.
Reference Rate Reform
The FASB has issued three ASUs related to reference rate reform. In March 2020, the FASB issued ASU No. 2020-04, Reference Rate Reform (Topic 848): Facilitation of the Effects of Reference Rate Reform on Financial Reporting and in January 2021 the FASB issued ASU No. 2021-01, Reference Rate Reform (Topic 848): Scope. With reference rates like the various tenors of the London Interbank Offered Rates (“LIBOR”) being discontinued between December 31, 2021 and June 30, 2023, a significant volume of contracts and other arrangements will be impacted by the transition required to alternative reference rates. The ASUs provides optional expedients and exceptions to reduce the costs and complexity of applying existing GAAP to contract modifications and hedge accounting if certain criteria are met. The standard is effective for a limited time for all entities through December 31, 2022. In December 2022, FASB issued ASU No. 2022-06 Reference Rate Reform (Topic 848): Deferral of the Sunset Date of Topic 848, with immediate effect, to defer the sunset date from December 31, 2022 to December 31, 2024, after which the entities will no longer be permitted to apply the relief in Topic 848. The Company has certain debt arrangements which may qualify for use of the practical expedients permitted under the guidance. The Company has evaluated and will continue to evaluate arrangements subject to rate reform and the options under the ASUs to facilitate an orderly transition to alternative reference rates and their potential impacts on its consolidated financial statements and disclosures.
Recently issued accounting guidance, not yet adopted
Improvements to Reportable Segment Disclosures
In November 2023, FASB issued ASU No. 2023-07 Improvements to Reportable Segment Disclosures. The amendments in this update improve financial reporting by requiring disclosure of incremental segment information on an interim and annual basis, primarily through enhanced disclosures about significant segment expenses. The amendments are effective for fiscal years beginning after December 15, 2023, and interim periods within fiscal years beginning after December 15, 2024. Early adoption is permitted with retrospective application to all prior periods presented in the financial statements. The Company is currently assessing the impacts of this ASU but expects it to only impact disclosures with no impact to its results of operations, cash flows or financial condition.
Improvements to Income Tax Disclosures
In December 2023, FASB issued ASU No. 2023-09 Improvements to Income Tax Disclosures. The amendments in this update encourage transparency in income tax disclosures by requiring consistent categories and greater disaggregation of information in the rate reconciliation and income taxes paid disclosures. The amendments are effective for annual periods beginning after December 15, 2024 with early adoption permitted and should be applied on a prospective basis, however, retrospective application is permitted. The Company is currently assessing the impacts of this ASU but expects it to only impact disclosures with no impact to its results of operations, cash flows or financial condition.
4. Acquisitions
2023 acquisitions:
During the year ended December 31, 2023, the Company acquired controlling interests in three businesses including two in Asia Pacific, Greenstone Group Ltd., a project management firm in New Zealand and Craig & Rhodes Pty Limited, an engineering and design firm in Australia, and one in the Americas HILGARTWILSON, LLC, an engineering and design firm in the United States.
The acquisition date fair value of consideration transferred and the purchase price allocations are summarized as follows:
| Aggregate |
||||
| Acquisitions |
||||
| Current assets, excluding cash |
$ | 15,372 | ||
| Non-current assets |
9,286 | |||
| Current liabilities |
6,653 | |||
| Long-term liabilities |
8,445 | |||
| $ | 9,560 | |||
| Cash consideration, net of cash acquired of $7,278 |
$ | 60,343 | ||
| Acquisition date fair value of contingent consideration |
3,962 | |||
| Total purchase consideration |
$ | 64,305 | ||
| Acquired intangible assets (note 11) |
||||
| Finite life |
$ | 44,567 | ||
| Goodwill (note 12) |
$ | 34,369 | ||
| Redeemable non-controlling interest (note 18) |
$ | 24,191 | ||
Certain balances included in the assets and liabilities reported as at December 31, 2023 were updated for changes to the estimated fair values in the preliminary purchase price allocation. The change primarily resulted from finalization of the opening balances of the acquired companies with an adjustment to certain asset and liability classifications. The change to the net assets acquired, intangible assets and goodwill were not material. The Company’s consolidated statements of earnings for previously reported periods was not materially impacted by these changes. During the year ended December 31, 2023, the Company made no significant adjustments to its purchase consideration for acquisitions completed in 2022.
2022 acquisitions:
The Company acquired controlling interests in twelve businesses operating in the Americas, EMEA, Asia Pacific, and Investment Management.
The acquisition date fair value of consideration transferred and purchase price allocation was as follows:
| Aggregate |
||||
| Acquisitions |
||||
| Current assets, excluding cash |
$ | 44,190 | ||
| Non-current assets |
49,817 | |||
| Current liabilities |
95,844 | |||
| Long-term liabilities |
82,920 | |||
| $ | (84,757 | ) | ||
| Cash consideration, net of cash acquired of $122,964 |
$ | 1,007,297 | ||
| Acquisition date fair value of contingent consideration |
57,600 | |||
| Total purchase consideration |
$ | 1,064,897 | ||
| Acquired intangible assets (note 11) |
||||
| Finite life |
$ | 714,775 | ||
| Goodwill (note 12) |
$ | 936,122 | ||
| Redeemable non-controlling interest (note 18) |
$ | 501,243 | ||
Acquired goodwill and intangible assets
The purchase price allocations of acquisitions resulted in the recognition of goodwill. The primary factors contributing to goodwill acquired in the years ended December 31, 2023 and December 31, 2022 are assembled workforces, synergies with existing operations and future growth prospects. Specifically, the synergies in the Company’s acquisitions primarily relate to diversifying the Company’s client base and service offerings, cross-sell opportunities, increasing market share, and geographic expansion. Future growth prospects in the acquired businesses are consistent with long-term growth trends in the commercial real estate services and asset management industries. For acquisitions completed during the year ended December 31, 2023, goodwill in the amount of $22,168 is deductible for income tax purposes (2022 - $483,159).
In determining the fair value of intangible assets acquired in business combinations, management makes estimates and assumptions which require significant judgment. In particular, the Company acquired $37,312 of Customer lists and relationships. Valuation of these intangible assets is based upon a discounted cash flow methodology where the most significant estimates relate to discount rates and forecasted revenues.
In all years presented, the fair values of non-controlling interests were determined using an income approach with reference to a discounted cash flow model using the same assumptions implied in determining the purchase consideration.
Contingent acquisition consideration
The Company typically structures its business acquisitions to include contingent consideration. Certain vendors, at the time of acquisition, are entitled to receive a contingent consideration payment if the acquired businesses achieve specified earnings levels during the one- to five-year periods following the dates of acquisition. The ultimate amount of payment is determined based on a formula, the key inputs to which are (i) a contractually agreed maximum payment; (ii) a contractually specified earnings level and (iii) the actual earnings for the contingency period. If the acquired business does not achieve the specified earnings level, the maximum payment is reduced for any shortfall, potentially to nil.
Unless it contains an element of compensation, contingent consideration is recorded at fair value each reporting period. The fair value recorded on the consolidated balance sheet as at December 31, 2023, was $44,712 ( December 31, 2022 - $91,229). See note 24 for discussion on the fair value of contingent consideration. Contingent consideration where the seller is required to remain employed to be entitled to payment is considered to have a compensatory element and is revalued at each reporting period and recognized on a straight-line basis over the term of the contingent consideration arrangement. The liability recorded on the balance sheet for the compensatory element of contingent consideration arrangements as at December 31, 2023, was $90,480 ( December 31, 2022 - $61,870). The estimated range of outcomes (undiscounted) for all contingent consideration arrangements, including those with an element of compensation is determined based on the likelihood of achieving specified earnings levels over the contingency period, and ranges from $347,079 to a maximum of $404,458. These contingencies will expire during the period extending to September 2028.
The consideration for the acquisitions during the year ended December 31, 2023, was financed from borrowings on the Revolving Credit Facility and cash on hand. During the year ended December 31, 2023, $56,530 was paid with reference to contingent consideration (2022 - $125,514).
Unaudited Supplemental proforma
The amounts of revenues and earnings contributed from the dates of acquisition and included in the Company’s consolidated results for the year ended December 31, 2023, and the supplemental pro forma revenues and earnings of the combined entity had the acquisition dates been January 1, 2022, are as follows:
| Revenues |
Net earnings |
|||||||
| Actual from acquired entities for 2023 |
$ | 41,029 | $ | 5,027 | ||||
| Supplemental pro forma for 2023 (unaudited) |
4,354,159 | 140,120 | ||||||
| Supplemental pro forma for 2022 (unaudited) |
4,715,661 | 217,556 | ||||||
Supplemental pro forma results were adjusted for non-recurring items.
5. Business disposals
In June 2023, the Company exited the majority of its operations in Peru. In relation to exiting these operations, $9,739 of assets and $6,788 of liabilities, which largely consisted of working capital, were derecognized from the Company’s consolidated balance sheets. The proceeds received from the disposals were de minimus and during the year ended December 31, 2023 the Company recognized a loss on disposal in the amount of $2,282.
In 2022, the Company discontinued its businesses in Russia, by way of a sale of its controlling interests to local management. The Company also sold four individually insignificant operations (EMEA – Morocco and Americas – Panama, Colombia and Costa Rica). The proceeds received from disposals were de minimus. During the year ended December 31, 2022, the Company recognized an aggregate loss on disposal of operations in the amount of $26,834.
6. Warehouse fund assets
During the year ended December 31, 2023, the Company acquired controlling interests in six portfolios of land, buildings and infrastructure located in Europe and the US. The Company sold four of its portfolios during the year to newly established funds, including the assets held at December 31, 2022, without gain or loss. The Company expects to sell the remaining three portfolios to newly established closed-end funds, without gain or loss, during 2024.
As is customary for closed-end funds, the Company typically holds an equity interest of between 1% and 2% in these funds. There was no significant impact on net earnings related to warehouse fund assets in the years ended December 31, 2023, or 2022.
The following table summarizes the warehouse fund assets:
| As at December 31, |
||||||||
| 2023 |
2022 |
|||||||
| Warehouse fund assets |
||||||||
| Warehouse fund assets |
$ | 44,492 | $ | 45,353 | ||||
| Warehouse fund assets - non-current |
$ | 47,536 | $ | - | ||||
| Total warehouse fund assets |
$ | 92,028 | $ | 45,353 | ||||
| Liabilities related to warehouse fund assets |
||||||||
| Liabilities related to warehouse fund assets |
$ | - | $ | 1,353 | ||||
| Liabilities related to warehouse fund assets - non-current |
$ | 47,536 | $ | - | ||||
| Total liabilities related to warehouse fund assets |
$ | 47,536 | $ | 1,353 | ||||
| Net warehouse fund assets |
$ | 44,492 | $ | 44,000 | ||||
7. Acquisition-related items
| Year ended December 31, |
||||||||
| 2023 |
2022 |
|||||||
| Transaction costs |
$ | 14,148 | $ | 23,275 | ||||
| Contingent consideration fair value adjustments (note 24) |
(17,698 | ) | 3,700 | |||||
| Contingent consideration compensation expense (note 4) |
50,646 | 50,169 | ||||||
| $ | 47,096 | $ | 77,144 | |||||
Contingent consideration compensation expense and contingent consideration fair value adjustments relate to acquisitions made in the current year as well as the preceding five years. $2,853 of the $50,646 of contingent consideration compensation expense recognized during the year ended December 31, 2023 was associated with 2023 acquisitions.
8. Prepaid expenses and other assets
| As at December 31, |
||||||||
| 2023 |
2022 |
|||||||
| Prepaid expenses |
$ | 73,592 | $ | 61,324 | ||||
| Advisor loans receivable |
35,893 | 23,958 | ||||||
| Investments in equity securities |
3,956 | 9,486 | ||||||
| Investments in debt securities |
19,565 | 18,364 | ||||||
| Deferred Purchase Price (notes 16 and 24) |
107,743 | 92,278 | ||||||
| Mortgage derivative asset (note 24) |
14,224 | 40,879 | ||||||
| Interest rate swap asset (note 24) |
- | 659 | ||||||
| Other |
3,752 | 687 | ||||||
| Prepaid and other assets (Current Assets) |
$ | 258,725 | $ | 247,635 | ||||
| As at December 31, |
||||||||
| 2023 |
2022 |
|||||||
| Advisor loans receivable |
$ | 94,508 | $ | 66,991 | ||||
| Equity accounted investments (note 17) |
33,851 | 28,175 | ||||||
| Investments in equity securities |
8,440 | 8,943 | ||||||
| Investments in debt securities |
5,934 | 15,449 | ||||||
| Financing fees, net of accumulated amortization of $9,865 (December 31, 2022 - $8,018) |
3,109 | 4,040 | ||||||
| Interest rate swap asset (note 24) |
4,275 | 6,940 | ||||||
| Other |
7,080 | 7,972 | ||||||
| Other assets (Non-Current Assets) |
$ | 157,197 | $ | 138,510 | ||||
Captive insurance investments
Investments in equity securities in the amount of $3,945 (2022 - $9,476) consist of investments recorded at fair value (see note 24). Investments in debt securities include held-to-maturity investments current $389 (2022 - $1,410) and non-current $5,934 (2022 - $15,449), both of which are recorded at amortized cost. The amortized cost (carrying value) of these investments approximated fair value. At December 31, 2023, all of these investments mature within 10 years. The Company’s wholly owned captive insurance company has letters of credit in relation to its reinsurance activities. The letters of credit are secured by $1,214 of the current investments.
Colliers Securities investments
Investments in equity and debt securities in the amount of $19,188 (2022 – $16,961) consist of investments recorded at fair value in relation to Colliers Securities (see note 24). All securities owned are pledged to a clearing firm on terms that permit it to sell or re-pledge the securities to others, subject to certain limitations.
Other investments in equity securities
Investments in equity securities non-current in the amount of $7,335 (2022 - $7,768) are recorded at fair value following the net asset value practical expedient or recorded at cost less impairment adjusted for observable prices. During the year ended December 31, 2023, the Company recognized a net gain of $101 related to these investments which was included in Other income in the Company’s consolidated statements of earnings.
9. Leases
The Company enters into premise leases and equipment leases as a lessee.
(a) Premise leases
The Company leases office space where the remaining lease term ranges from less than one year to fifteen years. Leases generally include an initial contract term, but some leases include an option to renew the lease for an additional period at the end of this initial term. These renewal periods range in length up to a period equivalent to the initial term of the lease. All the Company’s premise leases are classified as operating leases.
(a) Equipment leases
The Company leases certain equipment in its operations, including furniture and equipment, computer equipment and vehicles. Equipment leases may consist of operating leases or finance leases based upon the assessment of the facts at the commencement date of the lease. The remaining lease terms for equipment leases range from one year to five years. Certain leases may have the option to extend the leases for a short period or to purchase the asset at the end of the lease term.
The components of lease expense were as follows:
| Year ended December 31, |
||||||||
| 2023 |
2022 |
|||||||
| Operating lease cost |
$ | 107,323 | $ | 97,467 | ||||
| Finance lease cost |
||||||||
| Amortization of right-of-use assets |
1,169 | 1,034 | ||||||
| Interest on lease liabilities |
173 | 29 | ||||||
| Variable lease cost |
26,520 | 21,728 | ||||||
| Short term lease cost |
4,580 | 4,323 | ||||||
| Total lease expense |
$ | 139,765 | $ | 124,581 | ||||
| Sublease revenues |
(6,856 | ) | (6,904 | ) | ||||
| Total lease cost, net of sublease revenues |
$ | 132,909 | $ | 117,677 | ||||
Supplemental information related to leases was as follows:
| Year ended December 31, |
||||||||
| 2023 |
2022 |
|||||||
| Right-of-use assets obtained in exchange for new operating lease obligations |
$ | 134,442 | $ | 99,669 | ||||
| Right-of-use assets obtained in exchange for new finance lease obligations |
4,965 | 1,101 | ||||||
| Cash paid for amounts included in the measurement of lease liabilities: |
||||||||
| Operating cash flows from operating leases |
$ | (104,570 | ) | $ | (94,761 | ) | ||
| Operating cash flows from finance leases |
(173 | ) | (29 | ) | ||||
| Financing cash flows from finance leases |
(1,077 | ) | (1,391 | ) | ||||
Supplemental balance sheet information related to leases was as follows:
| As at December 31, |
||||||||
| 2023 |
2022 |
|||||||
| Operating leases |
||||||||
| Operating lease right-of-use assets |
$ | 390,565 | $ | 341,623 | ||||
| Operating lease liabilities - current |
$ | (89,938 | ) | $ | (84,989 | ) | ||
| Operating lease liabilities - non-current |
(375,454 | ) | (322,496 | ) | ||||
| Total operating lease liabilities |
$ | (465,392 | ) | $ | (407,485 | ) | ||
| Finance leases |
||||||||
| Fixed assets, cost |
$ | 8,244 | $ | 3,895 | ||||
| Accumulated depreciation |
(2,566 | ) | (2,511 | ) | ||||
| Fixed assets, net |
$ | 5,678 | $ | 1,384 | ||||
| Long-term debt - current |
$ | (1,415 | ) | $ | (755 | ) | ||
| Long-term debt - non-current |
(4,295 | ) | (725 | ) | ||||
| Total finance lease liabilities |
$ | (5,710 | ) | $ | (1,480 | ) | ||
Maturities of lease liabilities were as follows:
| 1 year |
2 years |
3 years |
4 years |
5 years |
Thereafter |
Total |
||||||||||||||||||||||
| Operating leases |
$ | 109,682 | $ | 92,538 | $ | 70,696 | $ | 57,788 | $ | 49,193 | $ | 159,990 | $ | 539,887 | ||||||||||||||
| Present value of operating lease liabilities |
465,392 | |||||||||||||||||||||||||||
| Difference between undiscounted cash flows and discounted cash flows |
$ | 74,495 | ||||||||||||||||||||||||||
| Finance leases |
$ | 1,991 | $ | 1,707 | $ | 1,366 | $ | 1,144 | $ | 737 | $ | - | $ | 6,945 | ||||||||||||||
| Present value of finance lease liabilities |
5,710 | |||||||||||||||||||||||||||
| Difference between undiscounted cash flows and discounted cash flows |
$ | 1,235 | ||||||||||||||||||||||||||
| As at December 31, |
||||
| 2023 |
||||
| Weighted average remaining lease term |
||||
| Operating leases (in years) |
7.0 | |||
| Finance leases (in years) |
4.0 | |||
| Weighted average discount rate |
||||
| Operating leases |
4.2 | % | ||
| Finance leases |
9.2 | % | ||
As of December 31, 2023, the Company has additional operating leases, primarily for premises, that have not yet commenced of $40,749. These operating leases will commence within the next year and have lease terms ranging from three to eleven years.
10. Fixed assets
| December 31, 2023 |
Accumulated |
|||||||||||
| Cost |
depreciation |
Net |
||||||||||
| Buildings |
$ | 2,564 | $ | 1,765 | $ | 799 | ||||||
| Vehicles |
19,147 | 9,714 | 9,433 | |||||||||
| Furniture and equipment |
107,708 | 68,744 | 38,964 | |||||||||
| Computer equipment and software |
220,136 | 157,514 | 62,622 | |||||||||
| Leasehold improvements |
182,331 | 91,312 | 91,019 | |||||||||
| $ | 531,886 | $ | 329,049 | $ | 202,837 | |||||||
| December 31, 2022 |
Accumulated |
|||||||||||
| Cost |
depreciation |
Net |
||||||||||
| Buildings |
$ | 2,553 | $ | 1,615 | $ | 938 | ||||||
| Vehicles |
14,338 | 7,413 | 6,925 | |||||||||
| Furniture and equipment |
93,827 | 58,908 | 34,919 | |||||||||
| Computer equipment and software |
185,260 | 136,582 | 48,678 | |||||||||
| Leasehold improvements |
149,401 | 76,368 | 73,033 | |||||||||
| $ | 445,379 | $ | 280,886 | $ | 164,493 | |||||||
| Fixed assets include ROU assets - Finance leases (see note 9). |
||||||||||||
11. Intangible assets
The following table summarizes the gross value, accumulated amortization and net carrying value of the Company’s indefinite life and finite life intangible assets:
| Gross |
||||||||||||
| carrying |
Accumulated |
|||||||||||
| December 31, 2023 |
amount |
amortization |
Net |
|||||||||
| Indefinite life intangible assets: |
||||||||||||
| Licenses |
$ | 29,200 | $ | - | $ | 29,200 | ||||||
| Trademarks and trade names |
23,408 | - | 23,408 | |||||||||
| $ | 52,608 | $ | - | $ | 52,608 | |||||||
| Finite life intangible assets: |
||||||||||||
| Customer lists and relationships |
$ | 707,355 | $ | 218,435 | $ | 488,920 | ||||||
| Investment management contracts |
591,826 | 181,653 | 410,173 | |||||||||
| Mortgage servicing rights ("MSRs") |
188,489 | 84,058 | 104,431 | |||||||||
| Trademarks and trade names |
27,563 | 7,486 | 20,077 | |||||||||
| Management contracts and other |
13,893 | 10,547 | 3,346 | |||||||||
| Backlog |
6,349 | 5,433 | 916 | |||||||||
| $ | 1,535,475 | $ | 507,612 | $ | 1,027,863 | |||||||
| $ | 1,588,083 | $ | 507,612 | $ | 1,080,471 | |||||||
| Gross |
||||||||||||
| carrying |
Accumulated |
|||||||||||
| December 31, 2022 |
amount |
amortization |
Net |
|||||||||
| Indefinite life intangible assets: |
||||||||||||
| Licenses |
$ | 29,200 | $ | - | $ | 29,200 | ||||||
| Trademarks and trade names |
23,285 | - | 23,285 | |||||||||
| $ | 52,485 | $ | - | $ | 52,485 | |||||||
| Finite life intangible assets: |
||||||||||||
| Customer lists and relationships |
$ | 695,007 | $ | 187,743 | $ | 507,264 | ||||||
| Investment management contracts |
589,885 | 126,904 | 462,981 | |||||||||
| Mortgage servicing rights ("MSRs") |
170,213 | 65,771 | 104,442 | |||||||||
| Trademarks and trade names |
27,702 | 4,389 | 23,313 | |||||||||
| Management contracts and other |
15,426 | 10,635 | 4,791 | |||||||||
| Backlog |
8,299 | 3,665 | 4,634 | |||||||||
| $ | 1,506,532 | $ | 399,107 | $ | 1,107,425 | |||||||
| $ | 1,559,017 | $ | 399,107 | $ | 1,159,910 | |||||||
The MSR assets are evaluated quarterly for impairment by stratifying the servicing portfolio according to predominant risk characteristics, primarily investor type and interest rate. An impairment is recorded if the carrying value of an individual stratum exceeds its estimated fair value. There was no impairment recorded for the twelve-month period ended December 31, 2023, or 2022.
The following table summarizes activity related to the Company’s mortgage servicing rights for the year ended December 31, 2023:
| 2023 |
2022 |
|||||||
| Balance, January 1 |
$ | 104,442 | $ | 106,423 | ||||
| Additions, following the sale of loan |
18,276 | 22,335 | ||||||
| Amortization |
(14,833 | ) | (14,943 | ) | ||||
| Prepayments and write-offs |
(3,454 | ) | (9,373 | ) | ||||
| Balance, December 31 |
$ | 104,431 | $ | 104,442 | ||||
During the year ended December 31, 2023, the Company acquired the following intangible assets:
| Estimated |
||||||||
| weighted |
||||||||
| average |
||||||||
| amortization |
||||||||
| Amount |
period (years) |
|||||||
| Finite life intangible assets: |
||||||||
| Customer lists and relationships |
$ | 38,061 | 9.9 | |||||
| Trademarks and trade names - finite life |
481 | 2.0 | ||||||
| Customer backlog |
6,670 | 0.7 | ||||||
| Other |
627 | 4.4 | ||||||
| $ | 45,839 | 8.4 | ||||||
The table above includes $1,272 related to assets acquired that do not constitute a business under GAAP.
The following is the estimated future expense for amortization of the finite life intangible assets for each of the next five years and thereafter:
| For the year ended December 31, |
MSRs |
Other Intangibles |
Total |
|||||||||
| 2024 |
$ | 12,540 | $ | 114,023 | $ | 126,563 | ||||||
| 2025 |
11,402 | 103,800 | 115,202 | |||||||||
| 2026 |
10,783 | 103,107 | 113,890 | |||||||||
| 2027 |
10,047 | 93,671 | 103,718 | |||||||||
| 2028 |
9,426 | 87,599 | 97,025 | |||||||||
| Thereafter |
50,233 | 421,232 | 471,465 | |||||||||
| $ | 104,431 | $ | 923,432 | $ | 1,027,863 | |||||||
12. Goodwill
| Asia |
||||||||||||||||||||
| Americas |
EMEA |
Pacific |
IM |
Consolidated |
||||||||||||||||
| December 31, 2021 |
$ | 359,945 | 259,764 | 92,018 | 379,321 | $ | 1,091,048 | |||||||||||||
| Goodwill acquired during the year |
35,221 | 135,061 | 30,829 | 735,011 | 936,122 | |||||||||||||||
| Goodwill disposed during the year |
- | (7,052 | ) | - | - | (7,052 | ) | |||||||||||||
| Other items |
- | 2,410 | - | (2,410 | ) | - | ||||||||||||||
| Foreign exchange |
(71 | ) | (21,118 | ) | (8,486 | ) | (1,904 | ) | (31,579 | ) | ||||||||||
| December 31, 2022 |
395,095 | 369,065 | 114,361 | 1,110,018 | 1,988,539 | |||||||||||||||
| Goodwill acquired during the year |
22,168 | - | 12,201 | - | 34,369 | |||||||||||||||
| Goodwill disposed during the year |
(629 | ) | - | - | - | (629 | ) | |||||||||||||
| Other items |
(144 | ) | (683 | ) | - | - | (827 | ) | ||||||||||||
| Foreign exchange |
643 | 14,234 | 400 | 1,511 | 16,788 | |||||||||||||||
| December 31, 2023 |
417,133 | 382,616 | 126,962 | 1,111,529 | 2,038,240 | |||||||||||||||
| Goodwill |
443,404 | 385,928 | 126,962 | 1,111,529 | 2,067,823 | |||||||||||||||
| Accumulated impairment loss |
(26,271 | ) | (3,312 | ) | - | - | (29,583 | ) | ||||||||||||
| $ | 417,133 | $ | 382,616 | $ | 126,962 | $ | 1,111,529 | $ | 2,038,240 | |||||||||||
A test for goodwill impairment is required to be completed annually, in the Company’s case as of August 1, or more frequently if events or changes in circumstances indicate the asset might be impaired. No goodwill impairments were recorded in 2023 or 2022. The accumulated impairment loss reflects a goodwill impairment incurred in 2009.
13. Long-term debt
| As at December 31, |
||||||||
| 2023 |
2022 |
|||||||
| Revolving Credit Facility |
$ | 977,110 | $ | 930,042 | ||||
| Senior Notes |
518,982 | 506,533 | ||||||
| Finance leases maturing at various dates through 2028 |
5,710 | 1,480 | ||||||
| Other long-term debt maturing at various dates through 2028 |
837 | 1,044 | ||||||
| 1,502,639 | 1,439,099 | |||||||
| Less: current portion |
1,796 | 1,360 | ||||||
| Long-term debt - non-current |
$ | 1,500,843 | $ | 1,437,739 | ||||
On May 27, 2022, the Company amended and extended the multi-currency, sustainability-linked senior unsecured revolving credit facility (the “Revolving Credit Facility”) of $1,500,000. On April 28, 2023, the Company increased the Revolving Credit Facility by $250,000 to $1,750,000 as per the terms of the agreement. The Revolving Credit Facility has a 5-year term ending May 27, 2027, and bears interest at an applicable margin of 1.125% to 2.5% over floating reference rates, depending on financial leverage ratios. The applicable margin may be adjusted, annually, plus or minus 0.05% subject to achieving certain sustainability metrics. The weighted average interest rate on borrowings under the Revolving Credit Facility was 6.6% (2022 – 4.1%). The Revolving Credit Facility had $759,358 of available undrawn credit as at December 31, 2023 ($557,594 as at December 31, 2022). As at December 31, 2023, letters of credit in the amount of $13,532 were outstanding against the Revolving Credit Facility ($12,365 as at December 31, 2022). The Revolving Credit Facility requires a commitment fee of 0.11% to 0.35% of the unused portion, depending on financial leverage ratios.
The Company has outstanding €210,000 of senior unsecured notes with a fixed interest rate of 2.23% (the “Senior Notes due 2028”), which are held by a group of institutional investors. The Senior Notes due 2028 have a 10-year term ending May 30, 2028.
The Company also has outstanding €125,000 and $150,000 of senior unsecured notes with fixed interest rates of 1.52% and 3.02%, respectively (the “Senior Notes due 2031”), which are held by a group of institutional investors. The Senior Notes due 2031 have a 10-year term ending October 7, 2031.
The Revolving Credit Facility, Senior Notes due 2028, and Senior Notes due 2031 rank equally in terms of seniority and have similar financial covenants, including leverage and interest coverage. The Company was in compliance with all covenants as of December 31, 2023. The Company is limited from undertaking certain mergers, acquisitions and dispositions without prior approval.
The estimated aggregate principal repayments on long-term debt required in each of the next five years and thereafter to meet the retirement provisions are as follows:
| For the year ended December 31, |
||||
| 2024 |
$ | 1,796 | ||
| 2025 |
1,605 | |||
| 2026 |
1,181 | |||
| 2027 |
978,073 | |||
| 2028 and thereafter |
519,984 | |||
| $ | 1,502,639 |
14. Convertible notes
On April 4, 2023, the Company issued a notice of redemption to all holders of its 4.0% Convertible Senior Subordinated Notes due 2025 (the “Convertible Notes”). During the period leading up to the redemption date of June 1, 2023, $230,000 of Convertible Notes were converted or redeemed resulting in the issuance of 4,015,720 Subordinate Voting Shares.
Upon conversion and redemption of the Convertible Notes, the unamortized financing cost of $2,899 was reclassified to equity.
15. Warehouse credit facilities
The following table summarizes the Company’s mortgage warehouse credit facilities:
| December 31, 2023 |
December 31, 2022 |
||||||||||||||||
| Current |
Maximum |
Carrying |
Maximum |
Carrying |
|||||||||||||
| Maturity |
Capacity |
Value |
Capacity |
Value |
|||||||||||||
| Facility A - SOFR plus 1.40% |
October 17, 2024 |
$ | 275,000 | $ | 168,780 | $ | 125,000 | $ | 1,924 | ||||||||
| Facility B - SOFR plus 1.45% |
On demand |
125,000 | - | 125,000 | 7,619 | ||||||||||||
| Facility C - SOFR plus 1.60% |
Terminated |
- | - | 150,000 | 14,743 | ||||||||||||
| $ | 400,000 | $ | 168,780 | $ | 400,000 | $ | 24,286 | ||||||||||
Colliers Mortgage LLC (“Colliers Mortgage”) has warehouse credit facilities which are used exclusively for the purpose of funding warehouse mortgages receivable. The warehouse credit facilities are recourse only to Colliers Mortgage, are revolving and are secured by any warehouse mortgages financed on the facilities.
On April 17, 2023, the Company terminated Facility C and amended Facility A to increase the borrowing capacity to $275,000 with the right to increase its borrowing capacity up to an additional $150,000. The amendment also modified the interest rate to SOFR plus 1.40% without any change in the maturity.
On October 19, 2023, the Company amended the financing agreement for Facility A to extend the maturity date to October 17, 2024.
16. AR Facility
In 2019, the Company entered into a structured accounts receivable facility (the “AR Facility”). Under the AR Facility, certain of the Company's subsidiaries continuously sell trade accounts receivable and contract assets (the “Receivables”) to wholly owned special purpose entities at fair market value. The special purpose entities in turn sell the Receivables to a third-party financial institution (the “Purchaser”).
On September 28, 2023, the Company expanded the committed availability of its AR Facility with two third-party financial institutions to $200,000, from $175,000, with the maturity date remaining unchanged at October 24, 2024. As of December 31, 2023, the Company’s draw under the AR Facility was $199,986.
All transactions under the AR Facility are accounted for as a true sale in accordance with ASC 860, Transfers and Servicing (“ASC 860”). Following the sale of the Receivables to the Purchaser, the Receivables are legally isolated from the Company and its wholly owned special purpose entities. The AR Facility is recorded as a sale of accounts receivable, and accordingly sold receivables are derecognized from the consolidated balance sheet. The Company continues to service, administer and collect the Receivables on behalf of the Purchaser, and recognizes a servicing liability in accordance with ASC 860. The Company has elected the amortization method for subsequent measurement of the servicing liability, which is assessed for changes in the obligation at each reporting date. As of December 31, 2023, the servicing liability was nil.
The proceeds from the sale of these Receivables comprises of cash and a deferred purchase price (“Deferred Purchase Price” or “DPP”). The DPP asset is realized following the collection of Receivables sold to the Purchaser; however, due to the revolving nature of the AR Facility, collections are reinvested by the Purchaser monthly in new Receivable purchases. For the year ended December 31, 2023, Receivables sold under the AR Facility were $1,621,501 and cash collections from customers on Receivables sold were $1,575,267. As of December 31, 2023, the outstanding principal on trade accounts receivable, net of allowance for credit losses, sold under the AR Facility was $194,199; and the outstanding principal on contract assets, current and non-current, sold under the AR Facility was $139,649. See note 24 for fair value information on the DPP.
For the year ended December 31, 2023, the Company recognized a gain related to Receivables sold of $129 (2022 - $78 loss) that was recorded in other expense in the consolidated statement of earnings. Based on the Company’s collection history, the fair value of the Receivables sold subsequent to the initial sale approximates carrying value.
The non-cash investing activities associated with the DPP for the year ended December 31, 2023, were $139,065 (2022 - $143,579).
17. Variable interest entities
The Company holds variable interests in certain Variable Interest Entities (“VIE”) in its Investment Management segment which are not consolidated as it was determined that the Company is not the primary beneficiary. The Company’s involvement with these entities is in the form of advisory fee arrangements and equity co-investments (typically 1%-2%). Equity co-investments are included in Other non-current assets on the consolidated balance sheets.
The following table provides the maximum exposure to loss related to these non-consolidated VIEs:
| As at December 31, |
||||||||
| 2023 |
2022 |
|||||||
| Equity accounted investments |
$ | 29,631 | $ | 22,361 | ||||
| Co-investment commitments |
42,395 | 18,588 | ||||||
| Maximum exposure to loss |
$ | 72,026 | $ | 40,949 | ||||
18. Redeemable non-controlling interests
The minority equity positions in the Company’s subsidiaries are referred to as redeemable non-controlling interests (“RNCI”). The RNCI are considered to be redeemable securities. Accordingly, the RNCI is recorded at the greater of (i) the redemption amount or (ii) the amount initially recorded as RNCI at the date of inception of the minority equity position. This amount is recorded in the “mezzanine” section of the balance sheet, outside of shareholders’ equity. Changes in the RNCI amount are recognized immediately as they occur. The following table provides a reconciliation of the beginning and ending RNCI amounts:
| 2023 |
2022 |
|||||||
| Balance, January 1 |
$ | 1,079,306 | $ | 536,903 | ||||
| RNCI share of earnings |
53,621 | 51,084 | ||||||
| RNCI redemption increment |
22,588 | 94,372 | ||||||
| Distributions paid to RNCI |
(74,268 | ) | (60,623 | ) | ||||
| Purchase of interests from RNCI |
(36,922 | ) | (43,061 | ) | ||||
| Sale of interests to RNCI |
3,550 | 1,994 | ||||||
| Disposal of operations (note 5) |
- | (2,361 | ) | |||||
| RNCI recognized on business acquisitions |
24,191 | 501,243 | ||||||
| Other |
- | (245 | ) | |||||
| Balance, December 31 |
$ | 1,072,066 | $ | 1,079,306 | ||||
The Company has shareholders’ agreements in place at each of its non-wholly owned subsidiaries. These agreements allow the Company to “call” the RNCI at a price determined with the use of a formula price, which is usually equal to a fixed multiple of average annual net earnings before income taxes, interest, depreciation, and amortization. The agreements also have redemption features which allow the owners of the RNCI to “put” their equity to the Company at the same price subject to certain limitations. The formula price is referred to as the redemption amount and may be paid in cash or in Subordinate Voting Shares. The redemption amount as of December 31, 2023, was $943,235 ( December 31, 2022 - $1,027,124). The redemption amount is lower than that recorded on the balance sheet as the formula price of certain RNCI are lower than the amount initially recorded at the inception of the minority equity position. If all put or call options were settled with Subordinate Voting Shares as at December 31, 2023, approximately 8,200,000 such shares would be issued.
Increases or decreases to the formula price of the underlying shares are recognized in the statement of earnings as the NCI redemption increment.
19. Capital stock
The authorized capital stock of the Company is as follows:
An unlimited number of Preferred Shares, issuable in series;
An unlimited number of Subordinate Voting Shares having one vote per share; and
An unlimited number of Multiple Voting Shares having 20 votes per share, convertible at any time into Subordinate Voting Shares at a rate of one Subordinate Voting Share for each Multiple Voting Share outstanding.
The following table provides a summary of total capital stock issued and outstanding:
| Subordinate Voting Shares |
Multiple Voting Shares |
Total Common Shares |
||||||||||||||||||||||
| Number |
Amount |
Number |
Amount |
Number |
Amount |
|||||||||||||||||||
| Balances as at: |
||||||||||||||||||||||||
| December 31, 2022 |
41,607,462 | 845,307 | 1,325,694 | 373 | 42,933,156 | 845,680 | ||||||||||||||||||
| December 31, 2023 |
46,223,682 | 1,126,661 | 1,325,694 | 373 | 47,549,376 | 1,127,034 | ||||||||||||||||||
During the year ended December 31, 2023, the Company declared dividends on its Common Shares of $0.30 per share (2022 - $0.30).
20. Net earnings per common share
The earnings per share calculation cannot be anti-dilutive.
Diluted EPS is calculated using the “if-converted” method of calculating earnings per share in relation to the Convertible Notes. The Convertible Notes were fully converted or redeemed by June 1, 2023 (see note 14). The “if-converted” method is used if the impact of the assumed conversion is dilutive. When dilutive, the interest charges (net of income tax) recorded in relation to the Convertible Notes prior to conversion or redemption is adjusted from the numerator and the additional shares issuable on conversion of the Convertible Notes for the portion of the period while they were outstanding are added to the denominator of the earnings per share calculation. The “if-converted” method was antidilutive for the year ended December 31, 2022.
The following table reconciles the basic and diluted common shares outstanding:
| Year ended December 31, |
||||||||
| (in thousands of US dollars, except share information) |
2023 |
2022 |
||||||
| Net earnings attributable to Company |
$ | 65,543 | $ | 46,253 | ||||
| After-tax interest on Convertible Notes |
(119 | ) | - | |||||
| Adjusted numerator under the "If-Converted" Method |
$ | 65,424 | $ | 46,253 | ||||
| Weighted average number of shares used in computing basic earnings per share |
45,679,676 | 43,409,265 | ||||||
| Assumed exercise of stock options acquired under the Treasury Stock Method |
307,987 | 509,138 | ||||||
| Conversion of Convertible Notes |
285,911 | - | ||||||
| Number of shares used in computing diluted earnings per share |
46,273,574 | 43,918,403 | ||||||
On July 17, 2023, the Company announced the approval by the Toronto Stock Exchange of its notice to implement a normal course issuer bid (the “2023/2024 NCIB”). The 2023/2024 NCIB allows the Company to purchase for cancellation, up to 4,000,000 Subordinate Voting Shares. The 2023/2024 NCIB commenced on July 20, 2023 and is set to expire on July 19, 2024.
21. Stock-based compensation
The Company has a stock option plan for certain officers, key full-time employees and directors of the Company and its subsidiaries. Options are granted at the market price for the underlying shares on the day immediately prior to the date of grant. Each option vests over a four-year term, expires five years from the date granted and allows for the purchase of one Subordinate Voting Share. All Subordinate Voting Shares issued are new shares. As at December 31, 2023, there were 102,300 options available for future grants.
Grants under the Company’s stock option plan are equity-classified awards.
Stock option activity for the years ended December 31, 2023, and 2022 was as follows:
| Weighted average |
||||||||||||||||
| Weighted |
remaining |
Aggregate |
||||||||||||||
| Number of |
average |
contractual life |
intrinsic |
|||||||||||||
| options |
exercise price |
(years) |
value |
|||||||||||||
| Shares issuable under options - December 31, 2021 |
2,550,875 | $ | 89.34 | |||||||||||||
| Granted |
837,500 | 95.69 | ||||||||||||||
| Exercised |
(305,125 | ) | 54.99 | |||||||||||||
| Forfeited |
(30,250 | ) | 110.73 | |||||||||||||
| Shares issuable under options - December 31, 2022 |
3,053,000 | $ | 94.30 | |||||||||||||
| Granted |
815,000 | 106.75 | ||||||||||||||
| Exercised |
(600,500 | ) | 70.04 | |||||||||||||
| Forfeited |
(25,250 | ) | 119.82 | |||||||||||||
| Shares issuable under options - December 31, 2023 |
3,242,250 | $ | 101.73 | 3.2 | $ | 87,846 | ||||||||||
| Options exercisable - December 31, 2023 |
1,378,039 | $ | 94.61 | 2.2 | $ | 47,249 | ||||||||||
The Company incurred stock-based compensation expense related to these awards of $27,087 during the year ended December 31, 2023 (2022 - $21,853). As at December 31, 2023, the range of option exercise prices was $47.41 to $150.24 per share.
The following table summarizes information about option exercises:
| Year ended December 31, |
||||||||
| 2023 |
2022 |
|||||||
| Number of options exercised |
600,500 | 305,125 | ||||||
| Aggregate fair value |
$ | 68,629 | $ | 41,528 | ||||
| Intrinsic value |
26,571 | 16,779 | ||||||
| Amount of cash received |
42,058 | 24,749 | ||||||
| Tax benefit recognized |
$ | 131 | $ | 754 | ||||
As at December 31, 2023, there was $49,299 of unrecognized compensation cost related to non-vested awards which is expected to be recognized over the next four years. During the year ended December 31, 2023, the fair value of options vested was $22,971 (2022 - $16,866).
The fair value of each option grant is estimated on the date of grant using the Black-Scholes option pricing model, utilizing the following weighted average assumptions:
| As at December 31, |
||||||||
| 2023 |
2022 |
|||||||
| Risk free rate |
4.9 | % | 4.2 | % | ||||
| Expected life in years |
4.75 | 4.75 | ||||||
| Expected volatility |
42.3 | % | 41.2 | % | ||||
| Dividend yield |
0.3 | % | 0.3 | % | ||||
| Weighted average fair value per option granted |
$ | 44.78 | $ | 38.22 | ||||
The risk-free interest rate is based on the implied yield of a zero-coupon US Treasury bond with a term equal to the option’s expected term. The expected life in years represents the estimated period of time until exercise and is based on historical experience. The expected volatility is based on the historical prices of the Company’s shares over a period that is equal to the option’s expected life.
22. Income tax
Income tax differs from the amounts that would be obtained by applying the combined statutory corporate income tax rate of Ontario, Canada to the respective year’s earnings before income tax. Differences result from the following items:
| Year ended December 31, |
||||||||
| 2023 |
2022 |
|||||||
| Income tax expense using a combined statutory rate of 26.5% (2022 - 26.5%) |
$ | 56,386 | $ | 76,732 | ||||
| Loss on disposal of operations |
361 | 7,110 | ||||||
| Permanent differences |
5,515 | 2,686 | ||||||
| Tax effect of flow through entities |
(12,264 | ) | (10,890 | ) | ||||
| Adjustments to tax liabilities for prior periods |
(407 | ) | (1,597 | ) | ||||
| Changes in liability for unrecognized tax benefits |
(1,980 | ) | 1,617 | |||||
| Stock-based compensation |
1,730 | 2,024 | ||||||
| Foreign, state, and provincial tax rate differential |
1,266 | 1,875 | ||||||
| Change in valuation allowance |
3,349 | 2,626 | ||||||
| Acquisition-related items |
8,864 | 10,106 | ||||||
| Withholding taxes and other |
5,266 | 2,721 | ||||||
| Income tax expense |
$ | 68,086 | $ | 95,010 | ||||
Earnings (loss) before income tax by jurisdiction comprise the following:
| Year ended December 31, |
||||||||
| 2023 |
2022 |
|||||||
| Canada |
$ | (33,907 | ) | $ | 10,112 | |||
| United States |
200,035 | 211,382 | ||||||
| Foreign |
46,649 | 68,060 | ||||||
| Total |
$ | 212,777 | $ | 289,554 | ||||
Income tax expense (recovery) comprises the following:
| Year ended December 31, |
||||||||
| 2023 |
2022 |
|||||||
| Current |
||||||||
| Canada |
$ | 3,125 | $ | 9,390 | ||||
| United States |
28,268 | 60,101 | ||||||
| Foreign |
46,617 | 51,517 | ||||||
| 78,010 | 121,008 | |||||||
| Deferred |
||||||||
| Canada |
(10,360 | ) | (3,006 | ) | ||||
| United States |
16,753 | (11,837 | ) | |||||
| Foreign |
(16,317 | ) | (11,155 | ) | ||||
| (9,924 | ) | (25,998 | ) | |||||
| Total |
$ | 68,086 | $ | 95,010 | ||||
The significant components of deferred tax assets and liabilities are as follows:
| As at December 31, |
||||||||
| 2023 |
2022 |
|||||||
| Loss carryforwards and other credits |
$ | 29,876 | $ | 21,960 | ||||
| Expenses not currently deductible |
67,950 | 56,385 | ||||||
| Revenue not currently taxable |
(1,108 | ) | (3,079 | ) | ||||
| Stock-based compensation |
9,490 | 3,573 | ||||||
| Investments |
(7,818 | ) | 16,269 | |||||
| Provision for doubtful accounts |
11,375 | 9,752 | ||||||
| Financing fees |
(71 | ) | (227 | ) | ||||
| Net unrealized foreign exchange losses |
443 | 764 | ||||||
| Depreciation and amortization |
(88,012 | ) | (96,044 | ) | ||||
| Operating leases |
14,698 | 13,496 | ||||||
| Less: valuation allowance |
(20,546 | ) | (17,145 | ) | ||||
| Net deferred tax (liabilities) assets |
$ | 16,277 | $ | 5,704 | ||||
As at December 31, 2023, the Company believes that it is more likely than not that its net deferred tax assets of $59,468 will be realized based upon future income, consideration of net operating loss (“NOL”) limitations, earnings trends, and tax planning strategies. The amount of deferred tax assets considered realizable, however, could be reduced in the near term if estimates of future income are reduced.
The Company has pre-tax NOL carryforward balances as follows:
| Pre-tax losses |
Pre-tax losses |
Pre-tax losses |
||||||||||||||||||||||
| carryforward |
not recognized |
recognized |
||||||||||||||||||||||
| 2023 |
2022 |
2023 |
2022 |
2023 |
2022 |
|||||||||||||||||||
| Canada |
$ | 19,400 | $ | 4,554 | $ | 169 | $ | 159 | $ | 19,231 | $ | 4,395 | ||||||||||||
| United States |
8,120 | 5,546 | 931 | 929 | 7,189 | 4,617 | ||||||||||||||||||
| Foreign |
90,164 | 69,884 | 59,734 | 50,120 | 30,430 | 19,764 | ||||||||||||||||||
The Company has pre-tax capital loss carryforwards as follows:
| Pre-tax losses |
Pre-tax losses |
Pre-tax losses |
||||||||||||||||||||||
| carryforward |
not recognized |
recognized |
||||||||||||||||||||||
| 2023 |
2022 |
2023 |
2022 |
2023 |
2022 |
|||||||||||||||||||
| Canada |
$ | 2,397 | $ | 1,482 | $ | 2,397 | $ | 1,482 | $ | - | $ | - | ||||||||||||
| Foreign |
6,089 | 6,071 | 6,089 | 6,071 | - | - | ||||||||||||||||||
These amounts above are available to reduce future, federal, state, and provincial income taxes in their respective jurisdictions. NOL carryforward balances attributable to Canada begin to expire in 2035. NOL carryforward balances attributable to the United States begin to expire in 2028. Foreign NOL carryforward balances begin to expire in 2024. The utilization of NOLs may be subject to certain limitations under federal, provincial, state or foreign tax laws.
Cumulative unremitted foreign earnings of US subsidiaries are nil (2022 - nil). Cumulative unremitted foreign earnings of international subsidiaries (other than the US) approximated $139,541 as at December 31, 2023 (2022 - $131,062). The Company has not provided a deferred tax liability on the unremitted foreign earnings as it is management’s intent to permanently reinvest such earnings outside of Canada. In addition, any repatriation of such earnings would not be subject to significant Canadian or foreign taxes.
A reconciliation of the beginning and ending amounts of the liability for unrecognized tax benefits is as follows:
| 2023 |
2022 | |||||||
| Balance, January 1 |
$ | 5,467 | $ | 4,048 | ||||
| Gross increases for tax positions of current period |
- | 1,178 | ||||||
| Gross increases for tax positions of prior periods |
310 | 438 | ||||||
| Reduction for settlements with taxing authorities |
(2,281 | ) | - | |||||
| Reduction for lapses in applicable statutes of limitations |
- | (44 | ) | |||||
| Foreign currency translation |
27 | (153 | ) | |||||
| Balance, December 31 |
$ | 3,523 | $ | 5,467 | ||||
Of the $3,523 (2022 - $5,467) in gross unrecognized tax benefits, $3,523 (2022 - $5,467) would affect the Company’s effective tax rate if recognized. For the year-ended December 31, 2023, additional interest and penalties of $310 related to uncertain tax positions was accrued (2022 - $132). The Company reversed $60 of accrued interest and penalties related to positions lapsed in applicable statute of limitations or positions settled with taxing authorities in 2023 (2022 - $22). As of December 31, 2023, the Company had accrued $854 (2022 - $604) for potential income tax related interest and penalties.
Within the next twelve months, the Company expects $1,131 of unrecognized tax benefits associated with uncertain tax positions to be reduced due to lapses in statutes of limitations.
The Company files tax returns in Canada and multiple foreign jurisdictions. The number of years with open tax audits varies depending on the tax jurisdiction. Generally, income tax returns filed with the Canada Revenue Agency and related provinces are open for four to seven years and income tax returns filed with the United States Internal Revenue Service and related states are open for three to five years. Tax returns for significant other jurisdictions in which the Company conducts business are generally open for four years.
The Company does not currently expect any other material impact on earnings to result from the resolution of matters related to open taxation years, other than noted above. Actual settlements may differ from the amounts accrued. The Company has, as part of its analysis, made its current estimates based on facts and circumstances known to date and cannot predict changes in facts and circumstances that may affect its current estimates.
23. Other supplemental information
| Year ended December 31, |
||||||||
| 2023 |
2022 |
|||||||
| Cash payments made during the year |
||||||||
| Income tax, net of refunds |
$ | 118,175 | $ | 138,274 | ||||
| Interest |
96,203 | 49,709 | ||||||
| Non-cash financing activities |
||||||||
| Dividends declared but not paid |
7,132 | 6,440 | ||||||
24. Financial instruments
Concentration of credit risk
The Company is subject to credit risk with respect to its cash and cash equivalents, accounts receivable, contract assets, other receivables and advisor loans receivable. Concentrations of credit risk with respect to cash and cash equivalents are limited by the use of multiple large and reputable banks. Concentrations of credit risk with respect to receivables are limited due to the large number of entities comprising the Company’s customer base and other counterparties, and their dispersion across different service lines in various countries.
Foreign currency risk
Foreign currency risk is related to the portion of the Company’s business transactions denominated in currencies other than US dollars. A significant portion of revenue is generated by the Company’s Canadian, Australian, UK and Euro currency operations. The Company’s head office expenses are incurred primarily in Canadian dollars which are hedged by Canadian dollar denominated revenue.
Fluctuations in foreign currencies impact the amount of total assets and liabilities that are reported for foreign subsidiaries upon the translation of these amounts into US dollars. In particular, the amount of cash, working capital, goodwill and intangibles held by these subsidiaries is subject to translation variance caused by changes in foreign currency exchange rates as of the end of each respective reporting period (the offset to which is recorded to accumulated other comprehensive income on the consolidated balance sheets).
Interest rate risk
The Company utilizes an interest rate risk management strategy that may use interest rate hedging contracts from time to time. The Company’s specific goals are to: (i) manage interest rate sensitivity by modifying the characteristics of its debt and (ii) lower the long-term cost of its borrowed funds.
Fair values of financial instruments
The following table provides the financial assets and liabilities carried at fair value measured on a recurring basis as of December 31, 2023:
| Level 1 |
Level 2 |
Level 3 |
||||||||||
| Assets |
||||||||||||
| Cash equivalents |
$ | 3,753 | $ | - | $ | - | ||||||
| Equity securities |
5,049 | 12 | - | |||||||||
| Debt securities |
- | 19,176 | - | |||||||||
| Mortgage derivative assets |
- | - | 14,224 | |||||||||
| Warehouse receivables |
- | 177,104 | - | |||||||||
| Interest rate swap assets |
- | 4,275 | - | |||||||||
| Deferred Purchase Price on AR Facility |
- | - | 107,743 | |||||||||
| Total assets |
$ | 8,802 | $ | 200,567 | $ | 121,967 | ||||||
| Liabilities |
||||||||||||
| Mortgage derivative liabilities |
$ | - | $ | - | $ | 10,547 | ||||||
| Interest rate swap liabilities |
- | 1,470 | - | |||||||||
| Contingent consideration liabilities |
- | - | 44,712 | |||||||||
| Total liabilities |
$ | - | $ | 1,470 | $ | 55,259 | ||||||
Other than the assets and liabilities acquired in relation to business combinations (see note 4), there were no significant non-recurring fair value measurements recorded during the twelve months ended December 31, 2023.
Cash equivalents
Cash equivalents include highly liquid investments with original maturities of less than three months. Actively traded cash equivalents where a quoted price is readily available are classified as Level 1 in the fair value hierarchy.
Debt and equity securities
The Company records debt and equity securities at fair value on the consolidated balance sheets. These financial instruments are valued based on observable market data that may include quoted market prices dealer quotes, market spreads, cash flows, the US Treasury yield curve, trading levels, market consensus prepayment speeds, credit information and the instruments’ terms and conditions and are classified as Level 2 of the fair value hierarchy.
Certain investments in equity securities where quoted prices are readily available are classified as Level 1 in the fair value hierarchy. The Company increases or decreases its investment each reporting period by the change in the fair value of the investment reported in net earnings on the consolidated statements of earnings.
Mortgage-related derivatives
Interest rate lock commitments and forward sale commitments are derivative instruments which use a discounted cash flow model and consider observable market data in determining their fair values, particularly changes in interest rates. In the case of interest rate lock commitments, the fair value measurement also considers the expected net cash flows associated with the servicing of the loans. The Company also considers the impact of unobservable inputs related to counterparty non-performance risk when measuring the fair value of these derivatives. Therefore, these mortgage-related derivatives are categorized as Level 3. The mortgage-related derivative assets and liabilities are included in Prepaid expenses and other current assets and Accounts payable and accrued expenses, respectively, on the consolidated balance sheets.
Given the credit quality of the Company’s counterparties, the short duration of interest rate lock commitments and forward sale commitments and the Company’s historical experience, management does not believe the risk of non-performance is significant. An increase in counterparty non-performance risk assumptions would result in a lower fair value measurement.
Changes in the fair value of the net mortgage derivative assets and liabilities comprises the following:
| 2023 |
||||
| Balance, January 1 |
$ | 6,949 | ||
| Settlements |
(31,919 | ) | ||
| Realized gains recorded in earnings |
24,970 | |||
| Unrealized gains recorded in earnings |
3,677 | |||
| Balance, December 31 |
$ | 3,677 | ||
Warehouse receivables
Warehouse receivables represent mortgage loans originated by the Company with commitments to sell to third party investors. Principal funded on mortgage loans plus gains attributable to the fair value of mortgage premiums and origination fees increase warehouse receivables and proceeds received from the sale of mortgage loans to third party investors reduce warehouse receivables. As at December 31, 2023, all warehouse facility liabilities are supported by mortgage warehouse receivables which are under commitment to be purchased by a qualifying investor. These assets are classified as Level 2 in the fair value hierarchy as a substantial majority of the inputs are readily observable.
AR Facility deferred purchase price (“DPP”)
The Company recorded a DPP under its AR Facility. The DPP represents the difference between the fair value of the Receivables sold and the cash purchase price and is recognized at fair value as part of the sale transaction. The DPP is remeasured each reporting period in order to account for activity during the period, including the seller’s interest in any newly transferred Receivables, collections on previously transferred Receivables attributable to the DPP and changes in estimates for credit losses. Changes in the DPP attributed to changes in estimates for credit losses are expected to be immaterial, as the underlying Receivables are short-term and of high credit quality. The DPP is valued using Level 3 inputs, primarily discounted cash flows, with the significant inputs being discount rates ranging from 2.5% to 5.0% depending upon the aging of the Receivables. See note 16 for information on the AR Facility.
Changes in the fair value of the DPP comprises the following:
| 2023 |
2022 |
|||||||
| Balance, January 1 |
$ | 92,278 | $ | 238,835 | ||||
| Additions to DPP |
139,065 | 143,579 | ||||||
| Collections on DPP |
(124,313 | ) | (288,004 | ) | ||||
| Fair value adjustment |
129 | (78 | ) | |||||
| Foreign exchange and other |
584 | (2,054 | ) | |||||
| Balance, December 31 |
$ | 107,743 | $ | 92,278 | ||||
Interest rate swaps
The Company has entered into interest rate swap agreements (“IRS”) to convert floating interest on US dollar denominated debt to fixed interest rates. The interest rate swaps are measured at fair value and are included in Other assets on the consolidated balance sheets. The table below summarizes the details of the interest rate swaps in place as at December 31, 2023.
| Effective |
Maturity |
Notional Amount |
Interest rates |
||||||||
| Date |
Date |
of US dollar debt |
Floating |
Fixed |
|||||||
| 2022 IRS A |
July 15, 2022 |
May 27, 2027 |
$ | 150,000 | SOFR |
2.8020 | % | ||||
| 2022 IRS B |
December 21, 2022 |
May 27, 2027 |
$ | 250,000 | SOFR |
3.5920 | % | ||||
| 2023 IRS A |
April 28, 2023 |
May 27, 2027 |
$ | 100,000 | SOFR |
3.7250 | % | ||||
| 2023 IRS B |
December 5, 2023 |
May 27, 2027 |
$ | 100,000 | SOFR |
4.0000 | % | ||||
2022 IRS A, 2022 IRS B, 2023 IRS A and 2023 IRS B (collectively the “Designated IRSs”) are being accounted for as cash flow hedges and are measured at fair value on the consolidated balance sheets. Gains or losses on the Designated IRSs, which are determined to be effective as hedges, are reported in accumulated other comprehensive income (“AOCI”).
In the year ended December 31, 2023, $825 of the AOCI, was included in interest expense on the consolidated statements of earnings (2022 - $2,510) associated with an IRS that was entered into in December 2018 and which was dedesignated as a hedging relationship on July 1, 2021. This IRS matured on April 30, 2023.
Contingent acquisition consideration
The inputs to the measurement of the fair value of contingent consideration related to acquisitions are Level 3 inputs. The fair value measurements were made using a discounted cash flow model; significant model inputs were expected future operating cash flows (determined with reference to each specific acquired business) and discount rates (which range from 3.5% to 10.3%, with a weighted average of 5.9%). The wide range of discount rates is attributable to the level of risk related to economic growth factors combined with the length of the contingent payment periods; and the dispersion was driven by unique characteristics of the businesses acquired and the respective terms for these contingent payments. A 2% increase in the weighted average discount rate would reduce the fair value of contingent consideration by $1,000. See note 4 for discussion on contingent acquisition consideration.
Changes in the fair value of the contingent consideration liability comprises the following:
| 2023 |
2022 |
|||||||
| Balance, January 1 |
$ | 91,229 | $ | 154,671 | ||||
| Amounts recognized on acquisitions |
3,962 | 57,600 | ||||||
| Fair value adjustments (note 7) |
(17,698 | ) | 3,700 | |||||
| Resolved and settled in cash |
(34,475 | ) | (123,629 | ) | ||||
| Other |
1,694 | (1,113 | ) | |||||
| Balance, December 31 |
$ | 44,712 | $ | 91,229 | ||||
| Less: current portion |
$ | 13,944 | $ | 42,942 | ||||
| Non-current portion |
$ | 30,768 | $ | 48,287 | ||||
The carrying amounts for cash, restricted cash, accounts receivable, accounts payable, advisor loans, other receivables and accrued liabilities approximate their estimated fair values due to the short-term nature of these instruments, unless otherwise indicated. The carrying value of the Company’s Revolving Credit Facility and other short-term borrowings approximate their estimated fair value due to their short-term nature and variable interest rate terms. These fair value measurements use a net present value approach; significant model inputs were expected future cash outflows and discount rates which are Level 3 inputs within the fair value hierarchy.
The carrying amount and the estimated fair value of Senior Notes and Convertible Notes are presented in the table below. Interest rate yield curves, interest rate indices and market prices (Level 2 inputs within the fair value hierarchy) are used in determining the fair value of the Senior Notes and Convertible Notes.
| December 31, 2023 |
December 31, 2022 |
|||||||||||||||
| Carrying |
Fair |
Carrying |
Fair |
|||||||||||||
| amount |
value |
amount |
value |
|||||||||||||
| Senior Notes |
$ | 518,982 | $ | 458,377 | $ | 506,533 | $ | 414,195 | ||||||||
| Convertible Notes |
- | - | 226,534 | 366,183 | ||||||||||||
25. Commitments and Contingencies
Purchase commitments
Minimum contractual purchase commitments for the years ended December 31 are as follows:
| Year ended December 31, |
||||
| 2024 |
$ | 31,984 | ||
| 2025 |
13,829 | |||
| 2026 |
9,106 | |||
| 2027 |
1,365 | |||
| 2028 |
1,576 | |||
| Thereafter |
9,147 | |||
| $ | 67,007 |
Claims and Litigation
In the normal course of operations, the Company is subject to routine claims and litigation incidental to its business. Litigation currently pending or threatened against the Company includes disputes with former employees and commercial liability claims related to services provided by the Company. The Company believes resolution of such proceedings, combined with amounts accrued, will not have a material impact on the Company’s financial condition or the results of operations.
Contingencies associated with US government sponsored enterprises
Colliers Mortgage is a lender in the Fannie Mae DUS Program. Commitments for the origination and subsequent sale and delivery of loans to Fannie Mae represent those mortgage loan transactions where the borrower has locked an interest rate and scheduled closing and the Company has entered into a mandatory delivery commitment to sell the loan to Fannie Mae. As discussed in note 24, the Company accounts for these commitments as derivatives recorded at fair value.
Colliers Mortgage is obligated to share in losses, if any, related to mortgages originated under the DUS Program. These obligations expose the Company to credit risk on mortgage loans for which the Company is providing underwriting, servicing, or other services under the DUS Program. Net losses on defaulted loans are shared with Fannie Mae based upon established loss-sharing ratios, and typically, the Company is subject to sharing up to one-third of incurred losses on loans originated under the DUS Program. As of December 31, 2023, the Company has funded and sold loans subject to such loss sharing obligations with an aggregate unpaid principal balance of approximately $4,991,000. As at December 31, 2023, the loss reserve was $12,837 ( December 31, 2022 - $14,470) and was included within Other liabilities on the consolidated balance sheets.
Pursuant to its licenses with Fannie Mae, Ginnie Mae and the Department of Housing and Urban Development, Colliers Mortgage is required to maintain certain standards for capital adequacy which include minimum net worth and liquidity requirements. If it is determined at any time that Colliers Mortgage fails to maintain appropriate capital adequacy, the licensor reserves the right to terminate the Company’s servicing authority for all or some of the portfolio. At December 31, 2023, Colliers Mortgage was in compliance with all such requirements.
26. Related party transactions
As at December 31, 2023, the Company had $2,778 of loans receivable from non-controlling shareholders (2022 - $3,615). The majority of the loans receivable represent amounts assumed in connection with acquisitions and amounts issued to non-controlling interests to finance the sale of non-controlling interests in subsidiaries to senior managers. The loans are of varying principal amounts and interest rates which range from nil to 7.55%. These loans are due on demand or mature on various dates up to 2032 but are open for repayment without penalty at any time.
27. Revenue
Disaggregated revenue
Colliers has disaggregated its revenue from contracts with customers by type of service and operating segment as presented in the following table.
OPERATING SEGMENT REVENUES
| Asia |
||||||||||||||||||||||||
| Americas |
EMEA |
Pacific |
IM |
Corporate |
Consolidated |
|||||||||||||||||||
| Year ended December 31, |
||||||||||||||||||||||||
| 2023 | ||||||||||||||||||||||||
| Leasing |
$ | 788,132 | $ | 140,111 | $ | 134,845 | $ | - | $ | - | $ | 1,063,088 | ||||||||||||
| Capital Markets |
481,226 | 101,494 | 119,752 | - | - | 702,472 | ||||||||||||||||||
| E&D and Project management |
644,303 | 245,429 | 112,673 | - | - | 1,002,405 | ||||||||||||||||||
| Property management |
323,437 | 82,950 | 121,353 | - | - | 527,740 | ||||||||||||||||||
| Valuation and advisory |
187,178 | 148,526 | 101,237 | - | - | 436,941 | ||||||||||||||||||
| IM - Advisory and other |
- | - | - | 480,674 | - | 480,674 | ||||||||||||||||||
| IM - Incentive Fees |
- | - | - | 6,783 | - | 6,783 | ||||||||||||||||||
| Other |
85,726 | 8,390 | 20,453 | - | 469 | 115,038 | ||||||||||||||||||
| Total Revenue |
$ | 2,510,002 | $ | 726,900 | $ | 610,313 | $ | 487,457 | $ | 469 | $ | 4,335,141 | ||||||||||||
| 2022 |
||||||||||||||||||||||||
| Leasing |
$ | 851,621 | $ | 147,473 | $ | 125,012 | $ | - | $ | - | $ | 1,124,106 | ||||||||||||
| Capital Markets |
760,486 | 161,454 | 162,232 | - | - | 1,084,172 | ||||||||||||||||||
| E&D and Project management |
518,214 | 191,378 | 81,073 | - | - | 790,665 | ||||||||||||||||||
| Property management |
297,573 | 70,148 | 131,507 | - | - | 499,228 | ||||||||||||||||||
| Valuation and advisory |
244,719 | 139,365 | 93,635 | - | - | 477,719 | ||||||||||||||||||
| IM - Advisory and other |
- | - | - | 348,604 | - | 348,604 | ||||||||||||||||||
| IM - Incentive Fees |
- | - | - | 30,277 | - | 30,277 | ||||||||||||||||||
| Other |
83,732 | 5,322 | 15,001 | - | 661 | 104,716 | ||||||||||||||||||
| Total Revenue |
$ | 2,756,345 | $ | 715,140 | $ | 608,460 | $ | 378,881 | $ | 661 | $ | 4,459,487 | ||||||||||||
Revenue associated with the Company’s debt finance and loan servicing operations are outside the scope of ASC 606, Revenue from Contracts with Customers (“ASC 606”). During the year ended December 31, 2023 - $42,304 of Capital Markets revenue (2022 - $48,244) and $44,549 of Other Revenue (2022 - $53,105) respectively, was excluded from the scope of ASC 606. Substantially all of these revenues were included within the Americas segment.
Contract balances
As at December 31, 2023, the Company had contract assets totaling $103,080 of which $83,389 was current ($107,679 as at December 31, 2022 - of which $91,924 was current). During the year ended December 31, 2023, substantially all of the current contract assets were moved to accounts receivable or sold under the AR Facility (see note 16).
As at December 31, 2023, the Company had contract liabilities (all current) totaling $45,293 ($25,616 as at December 31, 2022). Revenue recognized for the year ended December 31, 2023, totaled $23,446 (2022 - $28,165) that was included in the contract liability balance at the beginning of the year.
Certain constrained revenues may arise from services that began in a prior reporting period. Consequently, a portion of the revenues the Company recognizes in the current period may be partially related to the services performed in prior periods. Typically, less than 5% of Leasing and Capital Markets revenue recognized in a period had previously been constrained and substantially all investment management incentive fees recognized in the period were previously constrained.
28. Segmented information
Operating segments
Colliers has identified four reportable operating segments. Three segments are grouped geographically into Americas, Asia Pacific and EMEA. The IM segment operates in the Americas and EMEA. The groupings are based on the manner in which the segments are managed. Management assesses each segment’s performance based on operating earnings or operating earnings before depreciation and amortization. Corporate includes the costs of global administrative functions and the corporate head office.
Included in segment total assets at December 31, 2023 are investments in non-consolidated subsidiaries accounted for under the equity method: Americas $2,438 (2022 - $2,690), EMEA $1,665 (2022 - $1,483) and IM $29,748 (2022 - $24,002). The reportable segment information excludes intersegment transactions.
| Asia |
||||||||||||||||||||||||
| Americas |
EMEA |
Pacific |
IM |
Corporate |
Consolidated |
|||||||||||||||||||
| Year ended December 31, 2023 |
||||||||||||||||||||||||
| Revenues |
$ | 2,510,002 | $ | 726,900 | $ | 610,313 | $ | 487,457 | $ | 469 | $ | 4,335,141 | ||||||||||||
| Depreciation and amortization |
84,725 | 31,698 | 12,174 | 71,429 | 2,510 | 202,536 | ||||||||||||||||||
| Operating earnings (loss) |
174,613 | 5,483 | 62,709 | 103,139 | (45,009 | ) | 300,935 | |||||||||||||||||
| Equity earnings |
2,095 | 98 | - | 2,885 | - | 5,078 | ||||||||||||||||||
| Other income, net |
841 | |||||||||||||||||||||||
| Interest expense, net |
(94,077 | ) | ||||||||||||||||||||||
| Income tax expense |
(68,086 | ) | ||||||||||||||||||||||
| Net earnings |
$ | 144,691 | ||||||||||||||||||||||
| Total assets |
$ | 1,898,815 | $ | 879,919 | $ | 467,122 | $ | 2,062,956 | $ | 173,314 | $ | 5,482,126 | ||||||||||||
| Total additions to fixed assets, intangible assets and goodwill |
112,953 | 18,187 | 28,127 | 6,334 | 2,571 | 168,172 | ||||||||||||||||||
| Asia |
||||||||||||||||||||||||
| Americas |
EMEA |
Pacific |
IM |
Corporate |
Consolidated |
|||||||||||||||||||
| Year ended December 31, 2022 |
||||||||||||||||||||||||
| Revenues |
$ | 2,756,345 | $ | 715,140 | $ | 608,460 | $ | 378,881 | $ | 661 | $ | 4,459,487 | ||||||||||||
| Depreciation and amortization |
86,927 | 27,432 | 11,476 | 48,543 | 3,043 | 177,421 | ||||||||||||||||||
| Operating earnings (loss) |
254,375 | 9,891 | 72,256 | 37,055 | (41,081 | ) | 332,496 | |||||||||||||||||
| Equity earnings |
1,671 | 58 | - | 4,948 | - | 6,677 | ||||||||||||||||||
| Other income, net |
(1,032 | ) | ||||||||||||||||||||||
| Interest expense, net |
(48,587 | ) | ||||||||||||||||||||||
| Income tax expense |
(95,010 | ) | ||||||||||||||||||||||
| Net earnings |
$ | 194,544 | ||||||||||||||||||||||
| Total assets |
$ | 1,685,753 | $ | 857,974 | $ | 408,825 | $ | 2,101,208 | $ | 44,417 | $ | 5,098,177 | ||||||||||||
| Total additions to fixed assets, intangible assets and goodwill |
131,114 | 237,622 | 59,759 | 1,291,202 | 3,703 | 1,723,400 | ||||||||||||||||||
Geographic information
Revenues in each geographic region are reported by customer locations except for IM where revenues are reported by the location of the fund management.
GEOGRAPHIC INFORMATION
| 2023 |
2022 |
|||||||
| United States |
||||||||
| Revenues |
$ | 2,362,420 | $ | 2,542,270 | ||||
| Total long-lived assets |
2,293,362 | 2,270,468 | ||||||
| Canada |
||||||||
| Revenues |
$ | 432,176 | $ | 467,975 | ||||
| Total long-lived assets |
110,195 | 76,071 | ||||||
| Euro currency countries |
||||||||
| Revenues |
$ | 404,158 | $ | 411,834 | ||||
| Total long-lived assets |
368,198 | 367,749 | ||||||
| Australia |
||||||||
| Revenues |
$ | 284,471 | $ | 277,488 | ||||
| Total long-lived assets |
114,754 | 111,013 | ||||||
| United Kingdom |
||||||||
| Revenues |
$ | 266,487 | $ | 218,304 | ||||
| Total long-lived assets |
526,669 | 527,157 | ||||||
| China |
||||||||
| Revenues |
$ | 87,509 | $ | 96,222 | ||||
| Total long-lived assets |
8,073 | 7,410 | ||||||
| Other |
||||||||
| Revenues |
$ | 497,920 | $ | 445,394 | ||||
| Total long-lived assets |
290,862 | 294,697 | ||||||
| Consolidated |
||||||||
| Revenues |
$ | 4,335,141 | $ | 4,459,487 | ||||
| Total long-lived assets |
3,712,113 | 3,654,565 | ||||||
Exhibit 3
|

COLLIERS INTERNATIONAL GROUP INC.
Management’s Discussion & Analysis
Year ended | December 31, 2023
|
Page 2 of 16
COLLIERS INTERNATIONAL GROUP INC.
Management’s discussion and analysis
For the year ended December 31, 2023
(in US dollars)
February 15, 2024
The following management’s discussion and analysis (“MD&A”) should be read together with the audited consolidated financial statements and the accompanying notes of Colliers International Group Inc. (“we,” “us,” “our,” the “Company” or “Colliers”) for the year ended December 31, 2023 and the Company’s audited consolidated financial statements and MD&A for the year ended December 31, 2022. The consolidated financial statements have been prepared in accordance with generally accepted accounting principles in the United States (“GAAP”). All financial information herein is presented in United States dollars.
The Company has prepared this MD&A with reference to National Instrument 51-102 – Continuous Disclosure Obligations of the Canadian Securities Administrators (the “CSA”). Under the U.S./Canada Multijurisdictional Disclosure System, the Company is permitted to prepare this MD&A in accordance with the disclosure requirements of Canada, which requirements are different from those of the United States. This MD&A provides information for the year ended December 31, 2023 and up to and including February 15, 2024.
Additional information about the Company can be found on SEDAR+ at www.sedarplus.ca and on EDGAR at www.sec.gov.
This MD&A includes references to “internal revenue growth rate”, “adjusted EBITDA”, “local currency revenue and adjusted EBITDA growth rate”, “adjusted EPS”, “free cash flow” and “assets under management (“AUM”)”, which are financial measures that are not calculated in accordance with GAAP. For a reconciliation of these non-GAAP measures to the most directly comparable GAAP financial measures, see “Reconciliation of non-GAAP financial measures”.
Consolidated review
Our consolidated revenues for the year ended December 31, 2023 were $4.34 billion, a decrease of 3% versus the prior year (3% in local currency). The decline was attributable to lower market-driven activity in Capital Markets and, to a lesser extent, Leasing partly offset by robust growth in Investment Management and Outsourcing & Advisory. GAAP diluted net earnings per share were $1.41 as compared to $1.05 in the prior year. Adjusted earnings per share (see “Reconciliation of non-GAAP financial measures” below) were $5.35 relative to $6.99 in the prior year. The decrease was attributable to (i) lower revenues; (ii) higher interest expense from increased debt levels resulting from recent acquisition activity and higher floating interest rates as well as (iii) higher non-controlling interest share of earnings of acquired businesses. GAAP diluted net earnings per share and adjusted earnings per share for the year ended December 31, 2023 were favourably impacted approximately $0.02 and $0.02, respectively, by changes in foreign exchange rates.
In April 2023, the Company acquired Greenstone Group Ltd., a project management and property advisory firm in New Zealand. The business rebranded as “Colliers Project Leaders” and was integrated into our New Zealand operations.
In May 2023, the Company acquired Craig & Rhodes Pty Limited, a multi-discipline engineering, design and survey firm in Australia. The business rebranded as “Colliers Engineering & Design” and was integrated into our existing operations in Australia.
Also in May 2023, the Company also acquired HILGARTWILSON, LLC, an Arizona-based engineering, planning and survey firm. The business will rebrand as “Colliers Engineering & Design” and will integrate into our US Colliers Engineering & Design operations.
Page 3 of 16
|
(in thousands of US$) |
Three months ended December 31 |
Change in US$ |
Change in LC |
Twelve months ended December 31 |
Change in US$ |
Change in LC |
||||||||||||||||||||||||||
|
(LC = local currency) |
2023 |
2022 |
% | % |
2023 |
2022 |
% | % | ||||||||||||||||||||||||
|
Outsourcing & Advisory |
$ | 580,375 | $ | 519,084 | 12 | % | 10 | % | $ | 2,082,124 | $ | 1,872,328 | 11 | % | 11 | % | ||||||||||||||||
|
Investment Management (1) |
129,134 | 121,307 | 6 | % | 6 | % | 487,457 | 378,881 | 29 | % | 28 | % | ||||||||||||||||||||
|
Leasing |
318,236 | 335,724 | -5 | % | -6 | % | 1,063,088 | 1,124,106 | -5 | % | -5 | % | ||||||||||||||||||||
|
Capital Markets |
207,423 | 246,290 | -16 | % | -16 | % | 702,472 | 1,084,172 | -35 | % | -35 | % | ||||||||||||||||||||
|
Total revenues |
$ | 1,235,168 | $ | 1,222,405 | 1 | % | 0 | % | $ | 4,335,141 | $ | 4,459,487 | -3 | % | -3 | % | ||||||||||||||||
|
(1) Investment Management local currency revenues, excluding pass-through carried interest, were up 4% and 38% for the three and twelve months ended December 31, 2023, respectively. |
||||||||||||||||||||||||||||||||
Results of operations – year ended December 31, 2023
For the year ended December 31, 2023, revenues were $4.34 billion, down 3% compared to the prior year (3% in local currency). Internally generated revenues were down 8% on lower Capital Markets and, to a lesser extent, Leasing activity consistent with overall market conditions despite solid growth in Investment Management and Outsourcing & Advisory. Acquisitions contributed 5% to local currency revenue growth versus the prior year.
Operating earnings for the year ended December 31, 2023 were $300.9 million relative to $332.5 million in the prior year. The operating earnings margin was 6.9% versus 7.5% in the prior year. The decrease in margin was attributable to (i) service mix, which was impacted by a lower proportion of higher margin Capital Markets revenues; and (ii) an $11.4 million gain on termination of a lease in the Americas in the prior year. Adjusted EBITDA (see “Reconciliation of non-GAAP financial measures” below) was $595.0 million, down 6% versus $630.5 million in the prior year. The Adjusted EBITDA margin was 13.7% compared to 14.1% in the prior year.
Depreciation expense was $54.6 million relative to $48.7 million in the prior year, with the increase attributable to the impact of recent acquisitions and increased investments in office leaseholds.
Amortization expense was $147.9 million relative to $128.7 million in the prior year, with the increase attributable mainly to intangible assets recognized in connection with recent business acquisitions.
Net interest expense was $94.1 million compared to $48.6 million in the prior year driven by both increases in debt levels and rising market interest rates. The average interest rate on our debt during the year was 4.9%, versus 3.3% in the prior year.
Consolidated income tax expense for the year ended December 31, 2023 was $68.1 million, relative to $95.0 million in the prior year. The effective tax rate was 32.0% compared to 32.8% in the prior year.
Net earnings for the year ended December 31, 2023 were $144.7 million compared to $194.5 million in the prior year.
Revenues in the Americas region totalled $2.51 billion for the year compared to $2.76 billion in the prior year, down 9% (9% in local currency). The revenue decline was largely driven by market conditions in Capital Markets and, to a lesser extent, Leasing. The decline was partly offset by internal growth in Outsourcing & Advisory revenues, primarily Engineering, Project Management and Property Management, and the favourable impact of recent acquisitions. Adjusted EBITDA was $270.9 million, down 18% (18% in local currency) from $332.3 million in the prior year, impacted by (i) changes in service mix; and (ii) an $11.4 million gain on the termination of a lease which favourably impacted the prior year. GAAP operating earnings were $174.6 million, versus $254.4 million in 2022.
EMEA region revenues were $726.9 million for the full year compared to $715.1 million in the prior year, up 2% (down 1% in local currency). Local currency revenue mix shifted significantly, with Capital Markets and Leasing lower due to difficult macroeconomic conditions, almost fully offset by growth in Outsourcing & Advisory (including recent acquisitions). Foreign exchange tailwinds favourably impacted revenues by 3%. Adjusted EBITDA was $38.4 million, down 44% (50% in local currency) versus $68.5 million in the prior year on significantly lower higher-margin Capital Markets revenues. GAAP operating earnings were $5.5 million as compared to $9.9 million in 2022.
Page 4 of 16
Asia Pacific region generated revenues of $610.3 million for the year, which were flat (up 4% in local currency) compared to $608.5 million in the prior year. Both Leasing and Outsourcing & Advisory revenues (including recent acquisitions) were up, partly offset by a continued decline in Capital Markets activity consistent with the market conditions in the region. Foreign exchange headwinds impacted revenues by 4%. Adjusted EBITDA was $79.2 million, down 7% (4% in local currency) versus $85.1 million in the prior year. GAAP operating earnings were $62.7 million, versus $72.3 million in the prior year.
Investment Management revenues were $487.5 million compared to $378.9 million in the prior year, up 29% (28% in local currency). Pass-through revenue from historical carried interest was $6.8 million in the current year, versus $30.3 million in the prior year. Excluding the impact of pass-through revenue, revenues were up 38% (38% in local currency) and were positively impacted by (i) acquisitions and (ii) fundraising across all investment strategies which led to increased management fees. Adjusted EBITDA was $213.9 million, up 47% (46% in local currency), relative to $146.0 million in the prior year. GAAP operating earnings were $103.1 million, versus $37.1 million in 2022. AUM was $98.2 billion as of December 31, 2023 compared to $97.7 billion as of December 31, 2022.
Unallocated global corporate costs as reported in Adjusted EBITDA were $7.4 million in 2023, relative to $1.4 million in the prior year, with the difference primarily attributable to foreign exchange gains in the prior year. The corporate GAAP operating loss was $45.0 million, relative to $41.1 million in 2022.
|
Selected annual information - last five years |
||||||||||||||||||||
|
(in thousands of US$, except share and per share amounts) |
||||||||||||||||||||
|
Year ended December 31 |
||||||||||||||||||||
|
2023 |
2022 |
2021 |
2020 |
2019 |
||||||||||||||||
|
Operations |
||||||||||||||||||||
|
Revenues |
$ | 4,335,141 | $ | 4,459,487 | $ | 4,089,129 | $ | 2,786,857 | $ | 3,045,811 | ||||||||||
|
Operating earnings / (loss) |
300,935 | 332,496 | (131,501 | ) | 164,578 | 218,197 | ||||||||||||||
|
Net earnings / (loss) |
144,691 | 194,544 | (237,557 | ) | 94,489 | 137,585 | ||||||||||||||
|
Financial position |
||||||||||||||||||||
|
Total assets |
$ | 5,482,126 | $ | 5,098,177 | $ | 3,873,730 | $ | 3,292,167 | $ | 2,892,714 | ||||||||||
|
Long-term debt |
1,502,639 | 1,439,099 | 531,054 | 479,895 | 611,404 | |||||||||||||||
|
Convertible Notes |
- | 226,534 | 225,214 | 223,957 | - | |||||||||||||||
|
Redeemable non-controlling interests |
1,072,066 | 1,079,306 | 536,903 | 442,375 | 359,150 | |||||||||||||||
|
Shareholders' equity |
850,490 | 493,374 | 585,269 | 586,109 | 517,299 | |||||||||||||||
|
Common share data |
||||||||||||||||||||
|
Net earnings (loss) per common share: |
||||||||||||||||||||
|
Basic |
||||||||||||||||||||
| 1.43 | 1.07 | (9.09 | ) | 1.23 | 2.60 | |||||||||||||||
|
Diluted |
||||||||||||||||||||
| 1.41 | 1.05 | (9.09 | ) | 1.22 | 2.57 | |||||||||||||||
|
Weighted average common shares outstanding (thousands) |
||||||||||||||||||||
|
Basic |
45,680 | 43,409 | 42,920 | 39,986 | 39,550 | |||||||||||||||
|
Diluted |
46,274 | 43,918 | 42,920 | 40,179 | 39,981 | |||||||||||||||
|
Cash dividends per common share |
$ | 0.30 | $ | 0.30 | $ | 0.20 | $ | 0.10 | $ | 0.10 | ||||||||||
|
Other data* |
||||||||||||||||||||
|
Adjusted EBITDA |
$ | 594,993 | $ | 630,525 | $ | 544,338 | $ | 361,442 | $ | 359,476 | ||||||||||
|
Adjusted EPS |
5.35 | 6.99 | 6.18 | 4.18 | 4.67 | |||||||||||||||
|
*See “Reconciliation of non-GAAP financial measures” |
||||||||||||||||||||
Page 5 of 16
Results of operations – fourth quarter ended December 31, 2023
For the quarter ended December 31, 2023, revenues were $1.24 billion, up 1% (flat in local currency). The market-driven transaction slowdown in Capital Markets and, to a lesser extent, Leasing was offset by solid growth in Outsourcing & Advisory and Investment Management. Consolidated internal revenues measured in local currencies declined 2% versus the prior year quarter. GAAP operating earnings were $132.6 million as compared to $103.8 million in the prior year quarter. Adjusted EBITDA was $198.4 million relative to $202.7 million in the prior year quarter.
Summary of quarterly results
The following table sets forth our quarterly consolidated results of operations data. The information in the table below has been derived from interim consolidated financial statements that, in management’s opinion, have been prepared on a consistent basis and include all adjustments necessary for a fair presentation of information. The information below is not necessarily indicative of results for any future quarter.
|
Summary of quarterly results - years ended December 31, 2023, 2022 and 2021 |
||||||||||||||||
|
(in thousands of US$, except per share amounts) |
||||||||||||||||
|
Q1 |
Q2 |
Q3 |
Q4 |
|||||||||||||
|
Year ended December 31, 2023 |
||||||||||||||||
|
Revenues |
$ | 965,903 | $ | 1,078,038 | $ | 1,056,032 | $ | 1,235,168 | ||||||||
|
Operating earnings |
22,144 | 75,262 | 70,899 | 132,630 | ||||||||||||
|
Net earnings (loss) |
(907 | ) | 35,001 | 29,376 | 81,221 | |||||||||||
|
Basic net earnings (loss) per common share |
(0.47 | ) | (0.15 | ) | 0.53 | 1.42 | ||||||||||
|
Diluted net earnings (loss) per common share |
(0.47 | ) | (0.16 | ) | 0.53 | 1.42 | ||||||||||
|
Year ended December 31, 2022 |
||||||||||||||||
|
Revenues |
$ | 1,000,912 | $ | 1,127,846 | $ | 1,108,324 | $ | 1,222,405 | ||||||||
|
Operating earnings |
40,834 | 103,850 | 84,030 | 103,782 | ||||||||||||
|
Net earnings |
21,317 | 66,731 | 44,524 | 61,972 | ||||||||||||
|
Basic net earnings (loss) per common share |
(0.42 | ) | 0.70 | 0.28 | 0.52 | |||||||||||
|
Diluted net earnings (loss) per common share |
(0.42 | ) | 0.67 | 0.27 | 0.51 | |||||||||||
|
Year ended December 31, 2021 |
||||||||||||||||
|
Revenues |
$ | 774,914 | $ | 945,994 | $ | 1,022,756 | $ | 1,345,465 | ||||||||
|
Operating earnings (loss) 1 |
39,956 | (385,777 | ) | 75,966 | 138,354 | |||||||||||
|
Net earnings (loss) |
24,807 | (412,601 | ) | 50,496 | 99,741 | |||||||||||
|
Basic net earnings (loss) per common share |
0.11 | (10.53 | ) | 0.41 | 0.98 | |||||||||||
|
Diluted net earnings (loss) per common share |
0.11 | (10.53 | ) | 0.40 | 0.92 | |||||||||||
|
Other data 2 |
||||||||||||||||
|
Adjusted EBITDA - 2023 |
$ | 104,623 | $ | 147,080 | $ | 144,912 | $ | 198,378 | ||||||||
|
Adjusted EBITDA - 2022 |
121,461 | 161,313 | 145,065 | 202,686 | ||||||||||||
|
Adjusted EBITDA - 2021 |
92,129 | 136,558 | 123,641 | 192,010 | ||||||||||||
|
Adjusted EPS - 2023 |
0.86 | 1.31 | 1.19 | 2.00 | ||||||||||||
|
Adjusted EPS - 2022 |
1.44 | 1.84 | 1.41 | 2.31 | ||||||||||||
|
Adjusted EPS - 2021 |
1.04 | 1.58 | 1.27 | 2.25 | ||||||||||||
|
1 Operating loss for Q2 2021 reflects the settlement of the Long Term Incentive Arrangement with the Company's Chairman and Chief Executive Officer, which resulted in a charge of $471,928 |
||||||||||||||||
|
2 See "Reconciliation of non-GAAP financial measures" |
||||||||||||||||
Seasonality and quarterly fluctuations
The Company historically generates peak revenues and earnings in the month of December followed by a low in January and February as a result of the timing of closings on Capital Markets transactions. Revenues and earnings during the balance of the year are relatively even. Capital Markets operations comprised 16% of consolidated annual revenues for 2023. Variations can be caused by business acquisitions which alter the consolidated service mix.
Page 6 of 16
Outlook for 2024
For 2024, the Company expects Capital Markets and Leasing conditions to remain challenging in the first half of the year followed by year-over-year growth in the second half, with market sentiment improving and interest rates and credit conditions stabilizing. Outsourcing & Advisory revenue growth is expected to remain resilient. Investment Management revenues are expected to grow in line with fundraising, which is expected to improve relative to 2023.
The outlook for 2024 is as follows:
|
Measure |
Actual 2023 |
Outlook for 2024 |
|
Revenue growth |
-3% |
+5% to +10% |
|
Adjusted EBITDA growth |
-6% |
+5% to +15% |
|
Adjusted EPS growth |
-23% |
+10% to +20% |
The financial outlook is based on the Company’s best available information as of the date of this MD&A, and remains subject to change based on numerous macroeconomic, geopolitical, health, social and related factors. Continued interest rate volatility and/or lack of credit availability for commercial real estate transactions could materially impact the outlook.
Liquidity and capital resources
Net cash provided by operating activities for the year ended December 31, 2023 was $165.7 million, versus $67.0 million in the prior year. The increase in cash from operations was driven primarily by lower working capital usage as well as lower contingent acquisition consideration paid more than offsetting a reduction in net earnings. We believe that cash from operations and other existing resources, including our $1.75 billion multi-currency Revolving Credit Facility, will continue to be adequate to satisfy the ongoing working capital needs of the Company.
For the year ended December 31, 2023, capital expenditures were $84.5 million (December 31, 2022 - $67.7 million). Capital expenditures for the year ending December 31, 2024 are expected to be between $75-$80 million and expected to be funded by cash on hand.
Net indebtedness is considered a supplementary financial measure and as of December 31, 2023 was $1.32 billion, versus $1.27 billion as of December 31, 2022. Net indebtedness is calculated as the current and non-current portion of long-term debt (excluding the Convertible Notes and warehouse credit facilities, in accordance with our debt agreements) less cash and cash equivalents. As of December 31, 2023, the Company’s financial leverage ratio expressed in terms of net debt to pro forma Adjusted EBITDA, as defined in our debt agreements, was 2.2x (1.8x as of December 31, 2022), relative to a maximum of 3.5x permitted under our debt agreements. We were in compliance with the covenants contained in our debt agreements as of December 31, 2023 and, based on our outlook for 2024, we expect to remain in compliance with these covenants.
The Company’s Revolving Credit Facility matures in May 2027. The Revolving Credit Facility is sustainability-linked and includes pricing adjustments tied to achievements of performance targets over time aligned with Colliers’ Elevate the Built Environment framework available on corporate.colliers.com. These targets include: i) reducing greenhouse gas emissions consistent with the Science-Based Targets initiative (“SBTi”); ii) increasing female representation in management roles and iii) ensuring Colliers-occupied offices obtain the WELL Health-Safety certification. We met our annual sustainability targets for 2022, and as of July 27, 2023, we achieved the maximum five basis point reduction in the borrowing cost on our Revolving Credit Facility.
In April 2023 the Company increased its borrowing capacity under its Revolving Credit Facility by $250 million to $1.75 billion. As of December 31, 2023, the Company had $759.4 million of unused credit under the Revolving Credit Facility.
On April 4, 2023, the Company issued a notice of redemption to all holders of its Convertible Notes due 2025 (“Convertible Notes”). The applicable redemption date was June 1, 2023 (the “Redemption Date”), and the Company, in accordance with the terms and conditions of the indenture governing the Convertible Notes, satisfied its obligations in connection with any redeemed Convertible Notes by issuing an amount of Subordinate Voting Shares per US$1,000 of redeemed principal amount that is calculated based on the average of daily volume-weighted average trading prices of the Shares for the thirty trading day period ending on May 24, 2023. Substantially all of the Convertible Notes were converted into Subordinate Voting Shares, prior to the Redemption Date, at an average conversion rate of 17.7607 shares per US$1,000 of principal amount, which is equivalent to a conversion price of approximately $56.30 per share. All remaining Convertible Notes were redeemed on June 1, 2023.
Page 7 of 16
Colliers Mortgage utilizes warehouse credit facilities for the purpose of funding warehouse receivables. Warehouse receivables represent mortgage loans receivable, the majority of which are offset by borrowings under warehouse credit facilities which fund loans that financial institutions have committed to purchase. The warehouse credit facilities are excluded from the financial leverage calculations under our debt agreements.
On September 28, 2023, the Company expanded the committed availability of its account receivable facility (“AR Facility”) (which includes selected US and Canadian trade accounts receivable) with two third-party financial institutions to $200 million from $175 million, with the maturity date remaining unchanged at October 24, 2024. The AR Facility is recorded as a sale of accounts receivable, and accordingly sold receivables are derecognized from the consolidated balance sheet. The AR Facility results in a decrease to our borrowing costs. As of December 31, 2023, the Company’s AR Facility was fully drawn.
During 2022, the Company acquired certain real estate assets in the US in connection with the establishment of new Investment Management funds. The real estate assets, as well as corresponding liabilities, were transferred to the respective funds during the first quarter of 2023, without gain or loss. During the year, the Company acquired real estate and real assets located in Europe and the US, some of which were transferred to the respective funds during the year (see note 6 in our consolidated financial statements). The Company recorded the corresponding warehouse fund assets and liabilities related to warehouse fund assets on the consolidated balance sheet as of December 31, 2023. We expect to enter into similar transactions from time to time in the future to facilitate the formation of new Investment Management funds.
The Company pays semi-annual dividends in cash after the end of the second and fourth quarters to shareholders of record on the last business day of the quarter. The Company’s policy is to pay dividends on its common shares in the future, subject to the discretion of our Board of Directors. On December 5, 2023, the Company’s Board of Directors declared a semi-annual dividend of $0.15 per share to shareholders of record on December 29, 2023, paid on January 12, 2024. Total common share dividends paid by the Company during the year ended December 31, 2023 were $13.5 million.
During the year ended December 31, 2023, the Company invested cash in acquisitions as follows: $60.3 million in acquisitions, $35.2 million in purchases of redeemable non-controlling interest and $56.5 million in contingent consideration payments. All acquisitions during the year were funded from borrowings on the Revolving Credit Facility and cash on hand (See note 4 in our consolidated financial statements). The Company expects to fund any future acquisitions from borrowings on the Revolving Credit Facility and cash on hand.
As at December 31, 2023, in relation to acquisitions completed during the past three years, we have outstanding contingent consideration, assuming all contingencies are satisfied and payment is due in full, totalling $404.5 million (December 31, 2022 - $422.0 million). Unless it contains an element of compensation, contingent consideration is recorded at fair value each reporting period. The fair value recorded on the consolidated balance sheet as at December 31, 2023 was $44.7 million (December 31, 2022 - $91.2 million). Contingent consideration with a compensatory element is revalued at each reporting period and recognized on a straight-line basis over the term of the contingent consideration arrangement. The liability recorded on the consolidated balance sheet for the compensatory element of contingent consideration arrangements as at December 31, 2023 was $90.5 million (December 31, 2022 - $61.9 million). The contingent consideration is based on achieving specified earnings levels and is paid or payable after the end of the relevant contingency periods, which extend to September 2028. We estimate that approximately 86% of the contingent consideration outstanding as of December 31, 2023 will ultimately be paid.
Page 8 of 16
The following table summarizes our contractual obligations as at December 31, 2023:
|
Contractual obligations |
Payments due by period |
|||||||||||||||||||
|
(in thousands of US$) |
Less than |
After |
||||||||||||||||||
|
Total |
1 year |
1-3 years |
4-5 years |
5 years |
||||||||||||||||
|
Long-term debt |
$ | 1,496,929 | $ | 380 | $ | 310 | $ | 1,208,939 | $ | 287,300 | ||||||||||
|
Warehouse credit facilities |
168,780 | 168,780 | - | - | - | |||||||||||||||
|
Interest on long-term debt (1) |
74,459 | 11,870 | 23,670 | 20,587 | 18,332 | |||||||||||||||
|
Finance lease obligations |
5,710 | 1,415 | 2,476 | 1,819 | - | |||||||||||||||
|
Contingent acquisition consideration(2) |
44,712 | 13,944 | 30,650 | - | 118 | |||||||||||||||
|
Operating leases obligations |
581,103 | 112,506 | 172,072 | 115,919 | 180,606 | |||||||||||||||
|
Purchase commitments |
67,007 | 31,984 | 22,934 | 2,942 | 9,147 | |||||||||||||||
|
Co-investment Commitments |
42,395 | 42,395 | - | - | - | |||||||||||||||
|
Total contractual obligations |
$ | 2,481,095 | $ | 383,274 | $ | 252,112 | $ | 1,350,206 | $ | 495,503 | ||||||||||
|
(1) |
Figures do not include interest payments for borrowings under the Revolving Credit Facility. Assuming the Revolving Credit Facility is held until maturity, using current interest rate, we estimate that we will make $236.2 million of interest payments, $69.4 million of which will be made in the next 12 months. |
|
(2) |
Estimated fair value as at December 31, 2023. |
At December 31, 2023, we had commercial commitments totaling $13.5 million comprised of letters of credit outstanding due to expire within one year.
In order to effectively manage our corporate risk and support our global insurance program, we supplement our commercial insurance placements with the use of a wholly-owned captive insurance company to provide support for our professional liability, general liability and employment practices liability programs. The level of risk retained by our captive insurance company varies by coverage. Currently, the captive insures up to $0.75 million per claim with respect to professional liability, $2.0 million per claim with respect to general liability and $1.0 million per claim with respect to employment practices liability. All limits are inclusive of commercial market self-insured retentions. Liability insurance claims can be complex and take a number of years to resolve. Within our captive insurance company, we estimate the ultimate cost of these claims by way of specific claim accruals developed through periodic reviews of the circumstances of individual claims, validated annually by a third-party actuary. As of December 31, 2023, the captive insurance company has reserves for unpaid claim liabilities of $13.8 million.
Redeemable non-controlling interests
In most operations where managers or employees are also non-controlling owners, the Company is party to shareholders’ agreements. These agreements allow us to “call” the redeemable non-controlling interests (“RNCI”) at a value determined with the use of a formula price, which is in most cases equal to a multiple of trailing two-year average earnings, less debt. Non-controlling owners may also “put” their interest to the Company at the same price, with certain limitations including (i) the inability to “put” more than 25% to 50% of their holdings in any twelve-month period and (ii) the inability to “put” any holdings for at least one year after the date of our initial acquisition of the business or the date the non-controlling shareholder acquired their interest, as the case may be.
The total value of the RNCI (the “redemption amount”), as calculated in accordance with shareholders’ agreements, was $943.2 million as of December 31, 2023 (December 31, 2022 - $1.03 billion). The amount recorded on our balance sheet under the caption “redeemable non-controlling interests” is the greater of (i) the redemption amount (as above) or (ii) the amount initially recorded as RNCI at the date of inception of the minority equity position. As at December 31, 2023, the RNCI recorded on the balance sheet was $1.07 billion (December 31, 2022 - $1.08 billion). The purchase prices of the RNCI may be paid in cash or in Subordinate Voting Shares of Colliers. If all RNCI were redeemed in cash, the pro forma estimated accretion to diluted net earnings per share for the year ended December 31, 2023 would be $0.62, and the accretion to adjusted EPS would be $0.13.
Page 9 of 16
Critical accounting estimates
Critical accounting estimates are those that we deem to be most important to the portrayal of our financial condition and results of operations, and that require management’s most difficult, subjective or complex judgments due to the need to make estimates about the effects of matters that are inherently uncertain. We have identified eight critical accounting estimates, which are discussed below.
|
1. |
Revenue recognition. We earn revenues from Leasing and Capital Markets brokerage transaction commissions, advisory fees, debt finance fees, property management fees, project management fees, engineering and design fees, loan servicing fees and investment management fees (including carried interest). Some of the contractual terms related to the process of earning revenue from these sources, including potentially contingent events, can be complex and may require us to make judgments about the timing of when we should recognize revenue and whether revenue should be reported on a gross basis or net basis. Changes in judgments could result in a change in the period in which revenues are reported, or in the amounts of revenue and cost of revenue reported. |
|
2. |
Goodwill. Goodwill impairment testing involves assessing whether events have occurred that would indicate potential impairment and making estimates concerning the fair values of reporting units and then comparing the fair value to the carrying amount of each unit. The determination of what constitutes a reporting unit requires significant management judgment. We have four reporting units, consistent with our four operating segments. Goodwill is attributed to the reporting units at the time of acquisition. Estimates of fair value can be impacted by changes in the business environment, prolonged economic downturns or declines in the market value of the Company’s own shares and therefore require significant management judgment in their determination. When events have occurred that would suggest a potential decrease in fair value, the determination of fair value is calculated with reference to a discounted cash flow model which requires management to make certain estimates. The most sensitive estimates are estimated future cash flows and the discount rate applied to future cash flows. Changes in these assumptions could result in a materially different fair value. |
|
3. |
Business combinations. The determination of fair values of assets acquired and liabilities assumed in business combinations requires the use of estimates and management judgment, particularly in determining fair values of intangible assets acquired. For example, if different assumptions were used regarding the profitability and expected attrition rates of acquired customer relationships or forecasted committed capital and assets under management related to asset management contracts, different amounts of intangible assets and related amortization could be reported. |
|
4. |
Contingent acquisition consideration. Contingent consideration is required to be measured at fair value at the acquisition date and at each balance sheet date until the contingency expires or is settled. The fair value at the acquisition date is a component of the purchase price; subsequent changes in fair value are reflected in earnings. Most acquisitions made by us have a contingent consideration feature, which is usually based on the acquired entity’s profitability (measured in terms of adjusted EBITDA) during a one to five year period after the acquisition date. Significant estimates are required to measure the fair value of contingent consideration, including forecasting profits for the contingency period and the selection of an appropriate discount rate. |
|
5. |
Mortgage servicing rights (“MSRs”). MSRs, or the rights to service mortgage loans for others, result from the sale or securitization of loans originated by the Company and are recognized as intangible assets on the consolidated balance sheet. The Company initially recognizes MSRs based on the fair value of these rights on the date the loans are sold. Subsequent to initial recognition, MSRs are amortized and carried at the lower of amortized cost or fair value. They are amortized in proportion to and over the estimated period that net servicing income is expected to be received based on projections and timing of estimated future net cash flows. |
|
6. |
Allowance for credit loss reserves. Colliers Mortgage is obligated to share in losses, if any, related to mortgages originated under the Fannie Mae Delegated Underwriting and Servicing (“DUS”) Program. These obligations expose the Company to credit risk on mortgage loans for which the Company is providing underwriting, servicing, or other services under the DUS Program. Net losses on defaulted loans are shared with Fannie Mae based upon established loss-sharing ratios, and typically, the Company is subject to sharing up to one-third of incurred losses on loans originated under the DUS Program. As of December 31, 2023, the Company has funded and sold loans subject to such loss sharing obligations with an aggregate unpaid principal balance of approximately $5.0 billion. As at December 31, 2023, the loss reserve was $12.8 million (December 31, 2022 - $14.5 million) and was included within Other liabilities on the consolidated balance sheet. |
Page 10 of 16
Reconciliation of non-GAAP financial measures
In this MD&A, we make reference to certain financial measures that are not calculated in accordance with GAAP.
Adjusted EBITDA is defined as net earnings, adjusted to exclude: (i) income tax; (ii) other expense (income); (iii) interest expense; (iv) loss on disposal of operations; (v) depreciation and amortization, including amortization of mortgage servicing rights (“MSRs”); (vi) gains attributable to MSRs; (vii) acquisition-related items (including contingent acquisition consideration fair value adjustments, contingent acquisition consideration-related compensation expense and transaction costs); (viii) restructuring costs and (ix) stock-based compensation expense. We use Adjusted EBITDA to evaluate our own operating performance and our ability to service debt, as well as an integral part of our planning and reporting systems. Additionally, we use this measure in conjunction with discounted cash flow models to determine the Company’s overall enterprise valuation and to evaluate acquisition targets. We present Adjusted EBITDA as a supplemental measure because we believe such measure is useful to investors as a reasonable indicator of operating performance because of the low capital intensity of the Company’s service operations. We believe this measure is a financial metric used by many investors to compare companies, especially in the services industry. This measure is not a recognized measure of financial performance under GAAP in the United States, and should not be considered as a substitute for operating earnings, net earnings or cash flow from operating activities, as determined in accordance with GAAP. Our method of calculating adjusted EBITDA may differ from other issuers and accordingly, this measure may not be comparable to measures used by other issuers. A reconciliation of net earnings to adjusted EBITDA appears below.
|
Three months ended |
Twelve months ended |
|||||||||||||||
|
December 31 |
December 31 |
|||||||||||||||
|
(in thousands of US$) |
2023 |
2022 |
2023 |
2022 |
||||||||||||
|
Net earnings |
$ | 81,221 | $ | 61,972 | $ | 144,691 | $ | 194,544 | ||||||||
|
Income tax |
29,974 | 24,976 | 68,086 | 95,010 | ||||||||||||
|
Other income, including equity earnings from non-consolidated investments |
(912 | ) | (2,329 | ) | (5,919 | ) | (5,645 | ) | ||||||||
|
Interest expense, net |
22,347 | 19,163 | 94,077 | 48,587 | ||||||||||||
|
Operating earnings |
132,630 | 103,782 | 300,935 | 332,496 | ||||||||||||
|
Loss on disposal of operations |
- | (524 | ) | 2,282 | 26,834 | |||||||||||
|
Depreciation and amortization |
51,087 | 51,542 | 202,536 | 177,421 | ||||||||||||
|
(Gains) losses attributable to MSRs |
(5,436 | ) | 6,829 | (17,722 | ) | (17,385 | ) | |||||||||
|
Equity earnings from non-consolidated investments |
707 | 1,856 | 5,078 | 6,677 | ||||||||||||
|
Acquisition-related items |
(6,406 | ) | 26,406 | 47,096 | 77,144 | |||||||||||
|
Restructuring costs |
15,435 | 5,023 | 27,701 | 5,485 | ||||||||||||
|
Stock-based compensation expense |
10,361 | 7,772 | 27,087 | 21,853 | ||||||||||||
|
Adjusted EBITDA |
$ | 198,378 | $ | 202,686 | $ | 594,993 | $ | 630,525 | ||||||||
Adjusted EPS is defined as diluted net earnings per share as calculated under the “if-converted” method, adjusted for the effect, after income tax, of: (i) the non-controlling interest redemption increment; (ii) loss on disposal of operations; (iii) amortization expense related to intangible assets recognized in connection with acquisitions and MSRs; (iv) gains attributable to MSRs; (v) acquisition-related items; (vi) restructuring costs and (vii) stock-based compensation expense. We believe this measure is useful to investors because it provides a supplemental way to understand the underlying operating performance of the Company and enhances the comparability of operating results from period to period. Adjusted EPS is not a recognized measure of financial performance under GAAP, and should not be considered as a substitute for diluted net earnings per share from continuing operations, as determined in accordance with GAAP. Our method of calculating this non-GAAP measure may differ from other issuers and, accordingly, this measure may not be comparable to measures used by other issuers. A reconciliation of net earnings to adjusted net earnings and of diluted net earnings per share to adjusted EPS appears below.
Similar to GAAP diluted EPS, Adjusted EPS is calculated using the “if-converted” method of calculating earnings per share in relation to the Convertible Notes, which were issued on May 19, 2020 and fully converted or redeemed by June 1, 2023. As such, the interest (net of tax) on the Convertible Notes is added to the numerator and the additional shares issuable on conversion of the Convertible Notes are added to the denominator of the earnings per share calculation to determine if an assumed conversion is more dilutive than no assumption of conversion. The “if-converted” method is used if the impact of the assumed conversion is dilutive. The “if-converted” method is dilutive for the adjusted EPS calculation for all periods where the Convertible Notes were outstanding.
Page 11 of 16
|
Three months ended |
Twelve months ended |
|||||||||||||||
|
December 31 |
December 31 |
|||||||||||||||
|
(in thousands of US$) |
2023 |
2022 |
2023 |
2022 |
||||||||||||
|
Net earnings |
$ | 81,221 | $ | 61,972 | $ | 144,691 | $ | 194,544 | ||||||||
|
Non-controlling interest share of earnings |
(17,593 | ) | (16,222 | ) | (56,560 | ) | (53,919 | ) | ||||||||
|
Interest on Convertible Notes |
- | 2,300 | 2,861 | 9,200 | ||||||||||||
|
Loss on disposal of operations |
- | (524 | ) | 2,282 | 26,834 | |||||||||||
|
Amortization of intangible assets |
36,269 | 39,111 | 147,928 | 128,741 | ||||||||||||
|
(Gains) losses attributable to MSRs |
(5,436 | ) | 6,829 | (17,722 | ) | (17,385 | ) | |||||||||
|
Acquisition-related items |
(6,406 | ) | 26,406 | 47,096 | 77,144 | |||||||||||
|
Restructuring costs |
15,435 | 5,023 | 27,701 | 5,485 | ||||||||||||
|
Stock-based compensation expense |
10,361 | 7,772 | 27,087 | 21,853 | ||||||||||||
|
Income tax on adjustments |
(13,313 | ) | (19,835 | ) | (48,359 | ) | (42,486 | ) | ||||||||
|
Non-controlling interest on adjustments |
(5,534 | ) | (3,804 | ) | (22,667 | ) | (15,262 | ) | ||||||||
|
Adjusted net earnings |
$ | 95,004 | $ | 109,028 | $ | 254,338 | $ | 334,749 | ||||||||
|
Three months ended |
Twelve months ended |
|||||||||||||||
|
December 31 |
December 31 |
|||||||||||||||
|
(in US$) |
2023 |
2022 |
2023 |
2022 |
||||||||||||
|
Diluted net earnings per common share(1) |
$ | 1.42 | $ | 0.48 | $ | 1.38 | $ | 0.97 | ||||||||
|
Interest on Convertible Notes, net of tax |
- | 0.04 | 0.04 | 0.14 | ||||||||||||
|
Non-controlling interest redemption increment |
(0.08 | ) | 0.49 | 0.47 | 1.97 | |||||||||||
|
Loss on disposal of operations |
- | - | 0.05 | 0.56 | ||||||||||||
|
Amortization expense, net of tax |
0.47 | 0.50 | 1.92 | 1.63 | ||||||||||||
|
(Gains) losses attributable to MSRs, net of tax |
(0.07 | ) | 0.08 | (0.21 | ) | (0.20 | ) | |||||||||
|
Acquisition-related items |
(0.14 | ) | 0.51 | 0.83 | 1.45 | |||||||||||
|
Restructuring costs, net of tax |
0.24 | 0.08 | 0.43 | 0.08 | ||||||||||||
|
Stock-based compensation expense, net of tax |
0.16 | 0.13 | 0.44 | 0.39 | ||||||||||||
|
Adjusted EPS |
$ | 2.00 | $ | 2.31 | $ | 5.35 | $ | 6.99 | ||||||||
|
Diluted weighted average shares for Adjusted EPS (thousands) |
47,582 | 47,215 | 47,504 | 47,897 | ||||||||||||
|
(1) Amounts shown reflect the "if-converted" method's dilutive impact on the adjusted EPS calculation. |
||||||||||||||||
We believe that the presentation of adjusted EBITDA and adjusted earnings per share, which are non-GAAP financial measures, provides important supplemental information to management and investors regarding financial and business trends relating to the Company’s financial condition and results of operations. We use these non-GAAP financial measures when evaluating operating performance because we believe that the inclusion or exclusion of the items described above, for which the amounts are non-cash or non-recurring in nature, provides a supplemental measure of our operating results that facilitates comparability of our operating performance from period to period, against our business model objectives, and against other companies in our industry. We have chosen to provide this information to investors so they can analyze our operating results in the same way that management does and use this information in their assessment of our core business and the valuation of the Company. Adjusted EBITDA and adjusted earnings per share are not calculated in accordance with GAAP, and should be considered supplemental to, and not as a substitute for, or superior to, financial measures calculated in accordance with GAAP. Non-GAAP financial measures have limitations in that they do not reflect all of the costs or benefits associated with the operations of our business as determined in accordance with GAAP. As a result, investors should not consider these measures in isolation or as a substitute for analysis of our results as reported under GAAP.
Percentage revenue and AEBITDA variances presented on a local currency basis are calculated by translating the current period results of our non-US dollar denominated operations to US dollars using the foreign currency exchange rates from the periods against which the current period results are being compared. Percentage revenue variances presented on an internal growth basis are calculated assuming no impact from acquired entities in the current and prior periods. Revenue from acquired entities, including any foreign exchange impacts, are treated as acquisition growth until the respective anniversaries of the acquisitions. We believe that these revenue growth rate methodologies provide a framework for assessing the Company’s performance and operations excluding the effects of foreign currency exchange rate fluctuations and acquisitions. Since these revenue growth rate measures are not calculated under GAAP, they may not be comparable to similar measures used by other issuers.
Page 12 of 16
Adjusted EBITDA from recurring revenue percentage is computed on a trailing twelve-month basis and represents the proportion of adjusted EBITDA that is derived from Outsourcing & Advisory and Investment Management service lines. Both these service lines represent medium to long-term duration revenue streams that are either contractual or repeatable in nature. Adjusted EBITDA for this purpose is calculated in the same manner as for our debt agreement covenant calculation purposes, incorporating the expected full year impact of business acquisitions and dispositions.
Free cash flow is defined as net cash flow from operating activities plus contingent acquisition consideration paid, less purchases of fixed assets, plus cash collections on AR Facility deferred purchase price less distributions to non-controlling interests. We use free cash flow as a measure to evaluate and monitor operating performance as well as our ability to service debt, fund acquisitions and pay of dividends to shareholders. We present free cash flow as a supplemental measure because we believe this measure is a financial metric used by many investors to compare valuation and liquidity measures across companies, especially in the services industry. This measure is not a recognized measure of financial performance under GAAP in the United States, and should not be considered as a substitute for operating earnings, net earnings or cash flow from operating activities, as determined in accordance with GAAP. Our method of calculating free cash flow may differ from other issuers and accordingly, this measure may not be comparable to measures used by other issuers. A reconciliation of net cash flow from operating activities to free cash flow appears below.
|
Three months ended |
Twelve months ended |
|||||||||||||||
|
December 31 |
December 31 |
|||||||||||||||
|
(in thousands of US$) |
2023 |
2022 |
2023 |
2022 |
||||||||||||
|
Net cash provided by operating activities |
$ | 157,103 | $ | 238,501 | $ | 165,661 | $ | 67,031 | ||||||||
|
Contingent acquisition consideration paid |
469 | 285 | 39,115 | 69,224 | ||||||||||||
|
Purchase of fixed assets |
(24,113 | ) | (25,874 | ) | (84,524 | ) | (67,681 | ) | ||||||||
|
Cash collections on AR Facility deferred purchase price |
33,106 | (57,052 | ) | 124,313 | 288,004 | |||||||||||
|
Distributions paid to non-controlling interests |
(9,578 | ) | (8,193 | ) | (77,400 | ) | (62,926 | ) | ||||||||
|
Free cash flow |
$ | 156,987 | $ | 147,667 | $ | 167,165 | $ | 293,652 | ||||||||
We use the term assets under management (“AUM”) as a measure of the scale of our Investment Management operations. AUM is defined as the gross market value of operating assets and the projected gross cost of development assets of the funds, partnerships and accounts to which we provide management and advisory services, including capital that such funds, partnerships and accounts have the right to call from investors pursuant to capital commitments. Our definition of AUM may differ from those used by other issuers and as such may not be directly comparable to similar measures used by other issuers.
Recently adopted accounting guidance
Contract Assets and Contract Liabilities from Contracts with Customers – Business Combinations
In October 2021, the FASB issued ASU No. 2021-08, Accounting for Contract Assets and Contract Liabilities from Contracts with Customers (Subtopic 805-10: Business Combinations). The ASU requires that recognition and measurement principles of ASC 606 Revenue Recognition be applied for contract assets and contract liabilities acquired in a business combination. The guidance in ASC 805 listing exceptions to recognition principle was amended to include contract assets and contract liabilities. The Company adopted the guidance effective January 1, 2023. The adoption of the standard did not have a material impact on the Company’s consolidated financial statements.
Reference Rate Reform
The FASB has issued three ASUs related to reference rate reform. In March 2020, the FASB issued ASU No. 2020-04, Reference Rate Reform (Topic 848): Facilitation of the Effects of Reference Rate Reform on Financial Reporting and in January 2021 the FASB issued ASU No. 2021-01, Reference Rate Reform (Topic 848): Scope. With reference rates like the various tenors of the London Interbank Offered Rates (“LIBOR”) being discontinued between December 31, 2021 and June 30, 2023, a significant volume of contracts and other arrangements will be impacted by the transition required to alternative reference rates. The ASUs provides optional expedients and exceptions to reduce the costs and complexity of applying existing GAAP to contract modifications and hedge accounting if certain criteria are met. The standard is effective for a limited time for all entities through December 31, 2022. In December 2022, FASB issued ASU No. 2022-06 Reference Rate Reform (Topic 848): Deferral of the Sunset Date of Topic 848, with immediate effect, to defer the sunset date from December 31, 2022 to December 31, 2024, after which the entities will no longer be permitted to apply the relief in Topic 848. The Company has certain debt arrangements which may qualify for use of the practical expedients permitted under the guidance. The Company has evaluated and will continue to evaluate arrangements subject to rate reform and the options under the ASUs to facilitate an orderly transition to alternative reference rates and their potential impacts on its consolidated financial statements and disclosures.
Page 13 of 16
Recently issued accounting guidance, not yet adopted
Improvements to Reportable Segment Disclosures
In November 2023, FASB issued ASU No. 2023-07 Improvements to Reportable Segment Disclosures. The amendments in this update improve financial reporting by requiring disclosure of incremental segment information on an interim and annual basis, primarily through enhanced disclosures about significant segment expenses. The amendments are effective for fiscal years beginning after December 15, 2023, and interim periods within fiscal years beginning after December 15, 2024. Early adoption is permitted with retrospective application to all prior periods presented in the financial statements. The Company is currently assessing the impacts of this ASU but expects it to only impact disclosures with no impact to its results of operations, cash flows or financial condition.
Improvements to Income Tax Disclosures
In December 2023, FASB issued ASU No. 2023-09 Improvements to Income Tax Disclosures. The amendments in this update encourage transparency in income tax disclosures by requiring consistent categories and greater disaggregation of information in the rate reconciliation and income taxes paid disclosures. The amendments are effective for annual periods beginning after December 15, 2024 with early adoption permitted and should be applied on a prospective basis, however, retrospective application is permitted. The Company is currently assessing the impacts of this ASU but expects it to only impact disclosures with no impact to its results of operations, cash flows or financial condition.
Financial instruments
We use financial instruments as part of our strategy to manage the risk associated with interest rates and currency exchange rates. We do not use financial instruments for trading or speculative purposes. In December 2018 (amended in May 2022), the Company entered into interest rate swap agreements to convert the SOFR floating interest rate on $100.0 million of US dollar denominated debt into a fixed interest rate of 2.6026% plus the applicable margin. These swaps matured on April 30, 2023.
In July and December 2022, the Company entered into similar interest rate swap agreements (the “2022 IRS”) to hedge an additional $150.0 million and $250.0 million of US dollar borrowings under the Revolving Credit Facility at fixed interest rates of 2.8020% and 3.5920%, respectively. In April 2023 and December 2023, the Company entered into another similar swap agreement (the “2023 IRS”) to hedge an additional $100.0 million and $100.0 million of US dollar borrowings under the Revolving Credit Facility at a fixed interest rate of 3.7250% and 4.000%, respectively. The 2022 IRS and 2023 IRS have a maturity of May 27, 2027. The swaps are measured at fair value on the consolidated balance sheet. Gains or losses on the 2022 IRS and 2023 IRS, which are determined to be effective as hedges, are reported in other comprehensive income.
Financial instruments involve risks, such as the risk that counterparties may fail to honor their obligations under these arrangements. If we have financial instruments outstanding and such events occur, our results of operations and financial position may be adversely affected.
Transactions with related parties
As at December 31, 2023, the Company had $2.8 million of loans receivable from shareholders of subsidiaries (December 31, 2022 - $3.6 million). The majority of the loans receivable represent amounts to finance the sale of non-controlling interests in subsidiaries to senior managers. The loans are of varying principal amounts and interest rates which range from nil to 7.55%. These loans are due on demand or mature on various dates up to 2032 but are open for repayment without penalty at any time.
Page 14 of 16
Outstanding share data
The authorized capital of the Company consists of an unlimited number of preference shares, issuable in series, an unlimited number of Subordinate Voting Shares and an unlimited number of Multiple Voting Shares. The holders of Subordinate Voting Shares are entitled to one vote in respect of each Subordinate Voting Share held at all meetings of the shareholders of the Company. The holders of Multiple Voting Shares are entitled to twenty votes in respect of each Multiple Voting Share held at all meetings of the shareholders of the Company. Each Multiple Voting Share is convertible into one Subordinate Voting Share at any time at the election of the holders thereof.
As of the date hereof, the Company has outstanding 46,238,682 Subordinate Voting Shares and 1,325,694 Multiple Voting Shares. In addition, as at the date hereof 3,227,250 Subordinate Voting Shares are issuable upon exercise of options granted under the Company’s stock option plan.
On July 17, 2023, the Company announced a Normal Course Issuer Bid (“NCIB”) effective from July 20, 2023 to July 19, 2024. The Company may repurchase up to 4,000,000 Subordinate Voting Shares on the open market pursuant to the NCIB.
Canadian tax treatment of common share dividends
For the purposes of the enhanced dividend tax credit rules contained in the Income Tax Act (Canada) and any corresponding provincial and territorial tax legislation, all dividends (and deemed dividends) paid by us to Canadian residents on our Subordinate Voting Shares and Multiple Voting Shares are designated as “eligible dividends”. Unless stated otherwise, all dividends (and deemed dividends) paid by us hereafter are designated as “eligible dividends” for the purposes of such rules.
Disclosure controls and procedures
Disclosure controls and procedures are designed to provide reasonable assurance that information required to be disclosed in reports filed or submitted by us under U.S. and Canadian securities legislation is recorded, processed, summarized and reported within the time periods specified in those rules, and include controls and procedures designed to ensure that information required to be disclosed in reports filed or submitted by us under U.S. and Canadian securities legislation is accumulated and communicated to management, including the Chief Executive Officer and Chief Financial Officer, as appropriate, to permit timely decisions regarding required disclosure. The Chief Executive Officer and Chief Financial Officer have evaluated the effectiveness of the design and operation of our disclosure controls and procedures, as defined in the rules of the U.S. Securities and Exchange Commission and the Canadian Securities Administrators, as at December 31, 2023. Based on this evaluation, the Chief Executive Officer and Chief Financial Officer have concluded that our disclosure controls and procedures were effective as at December 31, 2023.
Changes in internal control over financial reporting
Our management is responsible for establishing and maintaining adequate internal control over financial reporting. Any system of internal control over financial reporting, no matter how well-designed, has inherent limitations. Therefore, even those systems determined to be effective can provide only reasonable assurance with respect to financial statement preparation and presentation. Management has used the Committee of Sponsoring Organizations of the Treadway Commission (COSO) 2013 framework to evaluate the effectiveness of our internal control over financial reporting. Based on this assessment, management has concluded that as at December 31, 2023, our internal control over financial reporting was effective.
During the year ended December 31, 2023, there were no changes in our internal control over financial reporting that have materially affected, or are reasonably likely to materially affect, the Company’s internal control over financial reporting.
Management has excluded three entities acquired by the Company during the last fiscal period from its assessment of internal control over financial reporting as at December 31, 2023. The total assets and total revenues of the three majority-owned entities represent 0.7% and 0.9%, respectively of the related consolidated financial statement amounts as at and for the year ended December 31, 2023.
Legal proceedings
There are no legal proceedings to which Colliers is a party to, or in respect of which, any of the property of Colliers is the subject of, which is or was material to Colliers during 2023, and Colliers is not aware of any such legal proceedings that are contemplated. In the normal course of operations, Colliers is subject to routine immaterial claims and litigation incidental to its business. Litigation currently pending or threatened against Colliers includes disputes with former employees and commercial liability claims related to services provided by Colliers. Colliers believes resolution of such proceedings, combined with amounts set aside, will not have a material impact on the Company’s financial condition or the results of operations.
Page 15 of 16
Forward-looking statements and risks
This MD&A contains forward-looking statements with respect to expected financial performance, strategy and business conditions. The words “believe,” “anticipate,” “estimate,” “plan,” “expect,” “intend,” “may,” “project,” “will,” “would,” and similar expressions are intended to identify forward-looking statements, although not all forward-looking statements contain these identifying words. These statements reflect management's current beliefs with respect to future events and are based on information currently available to management. Forward-looking statements involve significant known and unknown risk and uncertainties. Many factors could cause our actual results, performance or achievements to be materially different from any future results, performance or achievements that may be expressed or implied by such forward-looking statements. Factors which may cause such differences include, but are not limited to those set out below and those set out in detail in the “Risk Factors” section of the Company’s Annual Information Form:
|
● |
Economic conditions, especially as they relate to rising interest rates, commercial and consumer credit conditions and business spending, particularly in regions where our operations may be concentrated. |
|
● |
Rising inflation and its impact on compensation costs, hiring and retention of talent, and the Company’s ability to recover costs from our clients. |
|
● |
The continuing aftermath of the global COVID-19 pandemic and its related impact on economic conditions, and in particular its impact on client demand for our services, our ability to deliver services and ensure the health and productivity of our employees. |
|
● |
Commercial real estate and real asset values, vacancy rates and general conditions of financial liquidity for transactions. |
|
● |
The effect of significant movements in average capitalization rates across different property types. |
|
● |
A change in or loss of our relationship with US government agencies. |
|
● |
Defaults by borrowers on loans originated under the Fannie Mae DUS Program. |
|
● |
A reduction by clients in their reliance on outsourcing for their commercial real estate needs. |
|
● |
Competition in the markets served by the Company. |
|
● |
The impact of changes in the market value of assets under management on the performance of our Investment Management business. |
|
● |
A decline in our ability to fundraise in our Investment Management operations, or an increase in redemptions from our perpetual funds and separately managed accounts. |
|
● |
A decline in our ability to attract, recruit and retain talent. |
|
● |
A decline in our performance impacting our continued compliance with the financial covenants under our debt agreements, or our ability to negotiate a waiver of certain covenants with our lenders. |
|
● |
The effect of increases in interest rates on our cost of borrowing. |
|
● |
Unexpected increases in operating costs, such as insurance, workers’ compensation and health care. |
|
● |
Changes in the frequency or severity of insurance incidents relative to our historical experience. |
|
● |
The effects of changes in foreign exchange rates in relation to the US dollar on the Company’s Canadian dollar, Euro, Australian dollar and UK pound sterling denominated revenues and expenses. |
|
● |
A decline in our ability to identify and make acquisitions at reasonable prices and successfully integrate acquired operations. |
|
● |
Disruptions, cyber attacks or security failures in our information technology systems, and our ability to recover from such incidents. |
|
● |
The ability to comply with laws and regulations related to our global operations, including real estate and mortgage banking licensure, labour and employment laws and regulations, as well as the anti-corruption laws and trade sanctions. |
|
● |
Political conditions, including political instability, any outbreak or escalation of hostilities, elections, referenda, trade policy changes, immigration policy changes and terrorism and the impact thereof on our business. |
|
● |
Changes in climate and environment-related policies that directly impact our businesses. |
|
● |
Changes in government laws and policies at the federal, state/provincial or local level that directly impact our businesses. |
Page 16 of 16
We caution that the foregoing list is not exhaustive of all possible factors, as other factors could adversely affect our results, performance or achievements. The reader is cautioned against undue reliance on these forward-looking statements. Although we believe that the assumptions underlying our forward-looking statements are reasonable, any of the assumptions could prove inaccurate and, therefore, there can be no assurance that the results contemplated in such forward-looking statements will be realized. The inclusion of such forward-looking statements should not be regarded as a representation by the Company or any other person that the future events, plans or expectations contemplated by the Company will be achieved. We note that past performance in operations and share price are not necessarily predictive of future performance. We disclaim any intention and assume no obligation to update or revise any forward-looking statement even if new information becomes available, as a result of future events or for any other reason.
Additional information
Additional information about Colliers, including our Annual Information Form for the year ended December 31, 2023, is available on SEDAR+ at www.sedarplus.ca and on EDGAR at www.sec.gov. Further information about us can also be obtained at www.colliers.com.
EXHIBIT 23
CONSENT OF INDEPENDENT REGISTERED PUBLIC ACCOUNTING FIRM
We hereby consent to the incorporation by reference in this Annual Report on Form 40-F for the year ended December 31, 2023 of Colliers International Group Inc. of our report dated February 15, 2024, relating to the consolidated financial statements and the effectiveness of internal control over financial reporting, which appears in Exhibit 2 incorporated by reference in this Annual Report on Form 40-F.
We also consent to the reference to us under the heading, “Independent Registered Public Accounting Firm” in the Annual Information Form which is filed as Exhibit 1 to this Annual Report on Form 40-F.
/s/ PricewaterhouseCoopers LLP
Chartered Professional Accountants, Licensed Public Accountants
Toronto, Canada
February 15, 2024
EXHIBIT 31
CERTIFICATION
PURSUANT TO RULE 13a-14(a) OR 15d-14(a) OF THE SECURITIES EXCHANGE ACT OF 1934
I, Jay S. Hennick, certify that:
|
1. |
I have reviewed this annual report on Form 40-F of Colliers International Group Inc.; |
|
2. |
Based on my knowledge, this report does not contain any untrue statement of a material fact or omit to state a material fact necessary to make the statements made, in light of the circumstances under which such statements were made, not misleading with respect to the period covered by this report; |
|
3. |
Based on my knowledge, the financial statements, and other financial information included in this report, fairly present in all material respects the financial condition, results of operations and cash flows of the issuer as of, and for, the periods presented in this report; |
|
4. |
The issuer’s other certifying officer and I are responsible for establishing and maintaining disclosure controls and procedures (as defined in Exchange Act Rules 13a-15(e) and 15d-15(e)) and internal control over financial reporting (as defined in Exchange Act Rules 13a-15(f) and 15d-15(f)) for the issuer and have: |
|
(a) |
Designed such disclosure controls and procedures, or caused such disclosure controls and procedures to be designed under our supervision, to ensure that material information relating to the issuer, including its consolidated subsidiaries, is made known to us by others within those entities, particularly during the period in which this report is being prepared; |
|
(b) |
Designed such internal control over financial reporting, or caused such internal control over financial reporting to be designed under our supervision, to provide reasonable assurance regarding the reliability of financial reporting and the preparation of financial statements for external purposes in accordance with generally accepted accounting principles; |
|
(c) |
Evaluated the effectiveness of the issuer’s disclosure controls and procedures and presented in this report our conclusions about the effectiveness of the disclosure controls and procedures, as of the end of the period covered by this report based on such evaluation; and |
|
(d) |
Disclosed in this report any change in the issuer’s internal control over financial reporting that occurred during the period covered by the annual report that has materially affected, or is reasonably likely to materially affect, the issuer’s internal control over financial reporting; and |
|
5. |
The issuer’s other certifying officer and I have disclosed, based on our most recent evaluation of internal control over financial reporting, to the issuer’s auditors and the audit committee of the issuer’s board of directors (or persons performing the equivalent functions): |
|
(a) |
All significant deficiencies and material weaknesses in the design or operation of internal control over financial reporting which are reasonably likely to adversely affect the issuer’s ability to record, process, summarize and report financial information; and |
|
(b) |
Any fraud, whether or not material, that involves management or other employees who have a significant role in the issuer’s internal control over financial reporting. |
February 15, 2024
/s/ Jay S. Hennick
Jay S. Hennick
Chairman and Chief Executive Officer
CERTIFICATION
PURSUANT TO RULE 13a-14(a) OR 15d-14(a) OF THE SECURITIES EXCHANGE ACT OF 1934
I, Christian Mayer, certify that:
|
1. |
I have reviewed this annual report on Form 40-F of Colliers International Group Inc.; |
|
2. |
Based on my knowledge, this report does not contain any untrue statement of a material fact or omit to state a material fact necessary to make the statements made, in light of the circumstances under which such statements were made, not misleading with respect to the period covered by this report; |
|
3. |
Based on my knowledge, the financial statements, and other financial information included in this report, fairly present in all material respects the financial condition, results of operations and cash flows of the issuer as of, and for, the periods presented in this report; |
|
4. |
The issuer’s other certifying officer and I are responsible for establishing and maintaining disclosure controls and procedures (as defined in Exchange Act Rules 13a-15(e) and 15d-15(e)) and internal control over financial reporting (as defined in Exchange Act Rules 13a-15(f) and 15d-15(f)) for the issuer and have: |
|
(a) |
Designed such disclosure controls and procedures, or caused such disclosure controls and procedures to be designed under our supervision, to ensure that material information relating to the issuer, including its consolidated subsidiaries, is made known to us by others within those entities, particularly during the period in which this report is being prepared; |
|
(b) |
Designed such internal control over financial reporting, or caused such internal control over financial reporting to be designed under our supervision, to provide reasonable assurance regarding the reliability of financial reporting and the preparation of financial statements for external purposes in accordance with generally accepted accounting principles; |
|
(c) |
Evaluated the effectiveness of the issuer’s disclosure controls and procedures and presented in this report our conclusions about the effectiveness of the disclosure controls and procedures, as of the end of the period covered by this report based on such evaluation; and |
|
(d) |
Disclosed in this report any change in the issuer’s internal control over financial reporting that occurred during the period covered by the annual report that has materially affected, or is reasonably likely to materially affect, the issuer’s internal control over financial reporting; and |
|
5. |
The issuer’s other certifying officer and I have disclosed, based on our most recent evaluation of internal control over financial reporting, to the issuer’s auditors and the audit committee of the issuer’s board of directors (or persons performing the equivalent functions): |
|
(a) |
All significant deficiencies and material weaknesses in the design or operation of internal control over financial reporting which are reasonably likely to adversely affect the issuer’s ability to record, process, summarize and report financial information; and |
|
(b) |
Any fraud, whether or not material, that involves management or other employees who have a significant role in the issuer’s internal control over financial reporting. |
February 15, 2024
/s/ Christian Mayer
Christian Mayer
Chief Financial Officer
EXHIBIT 32
CERTIFICATION
PURSUANT TO 18 U.S.C. SECTION 1350, AS ADOPTED PURSUANT
TO SECTION 906 OF THE SARBANES-OXLEY ACT OF 2002
In connection with the annual report on Form 40-F of Colliers International Group Inc. (the “Company”) for the year ended December 31, 2023 (the “Report”) filed with the United States Securities and Exchange Commission on the date hereof, I, Jay S. Hennick, Chairman and Chief Executive Officer of the Company, certify, pursuant to 18 U.S.C. Section 1350, as enacted pursuant to section 906 of the Sarbanes‑Oxley Act of 2002, that, to the best of my knowledge:
|
1. |
The Report fully complies with the requirements of Section 13(a) or 15(d) of the Securities Exchange Act of 1934; and |
|
2. |
The information contained in the Report fairly presents, in all material respects, the financial condition and results of operations of the Company. |
Dated: February 15, 2024
/s/ Jay S. Hennick
Jay S. Hennick
Chairman and Chief Executive Officer
CERTIFICATION
PURSUANT TO 18 U.S.C. SECTION 1350, AS ADOPTED PURSUANT
TO SECTION 906 OF THE SARBANES-OXLEY ACT OF 2002
In connection with the annual report on Form 40-F of Colliers International Group Inc. (the “Company”) for the year ended December 31, 2023 (the “Report”) filed with the United States Securities and Exchange Commission on the date hereof, I, Christian Mayer, Chief Financial Officer of the Company, certify, pursuant to 18 U.S.C. Section 1350, as enacted pursuant to section 906 of the Sarbanes‑Oxley Act of 2002, that, to the best of my knowledge:
|
1. |
The Report fully complies with the requirements of Section 13(a) or 15(d) of the Securities Exchange Act of 1934; and |
|
2. |
The information contained in the Report fairly presents, in all material respects, the financial condition and results of operations of the Company. |
Dated: February 15, 2024
/s/ Christian Mayer
Christian Mayer
Chief Financial Officer
Exhibit 97
COLLIERS INTERNATIONAL GROUP INC.
CLAWBACK POLICY
Effective as of September 19, 2023
Scope
This Clawback Policy (this “Policy”) applies to any individual who is or was an Executive Officer (as defined below) of Colliers International Group Inc. (“Colliers”) at the relevant time. Should Colliers be required to prepare an Accounting Restatement (as defined below), Colliers will have the right to claw back Incentive-Based Compensation (as defined below) from its Executive Officers, on and subject to the terms provided for in this Policy.
Definitions
For the purposes of this Policy, the following terms will have the meanings set forth below:
|
“Accounting Restatement” |
means any accounting restatement of Colliers’ financial statements due to material noncompliance with any financial reporting requirement under United States federal securities laws, including any required accounting restatement to correct a material error in Colliers’ previously-issued financial statements, or to avoid a material misstatement if the error were corrected in the current period or left uncorrected in the current period. |
|
“Erroneously Awarded Compensation” |
means the amount of Incentive-Based Compensation received that exceeds the amount of Incentive-Based Compensation that otherwise would have been received had it been determined based on the restated amounts in connection with an Accounting Restatement and must be computed without regard to any taxes paid and otherwise in accordance with the U.S. Clawback Rules. |
|
“Exchange Act” |
means the United States Securities Exchange Act of 1934, as amended. |
|
“Executive Officer” |
Means: (a) any individual listed as, or holding the position designated as being, an executive officer in Colliers’ most recently filed annual information form; (b) any other person that would be considered an “executive officer” of Colliers within the meaning of the U.S. Clawback Rules; and (c) any individual identified and designated as being subject to this policy by Colliers or any subsidiary thereof. For clarity, in applying a Restatement Clawback, “Executive Officer” will include any person who served as an Executive Officer at any time during the performance period for the Incentive-Based Compensation subject to such Restatement Clawback. |
|
“Financial Reporting Measures” |
means measures that are determined and presented in accordance with the accounting principles used in preparing Colliers’ financial statements, and any measures that are derived wholly or in part from such measures, including stock price and total shareholder return. |
|
“Incentive-Based Compensation” |
means any compensation to any Executive Officer that is granted, earned, or vested based wholly or in part upon the attainment of a Financial Reporting Measure. |
|
“Restatement Clawback” |
means recovery and repayment of Erroneously Awarded Compensation from an Executive Officer when Colliers is required to prepare an Accounting Restatement. |
|
“Restatement Date” |
means the date on which Colliers is required to prepare an Accounting Restatement (such date as determined by the U.S. Clawback Rules). |
|
“U.S. Clawback Rules” |
means Section 10D of the Exchange Act, Rule 10D-1 issued thereunder, and the listing standards of the national securities exchange on which the Colliers’ securities are listed to implement Rule 10D-1 under the Exchange Act. |
Accounting Restatements
In the event Colliers is required to prepare an Accounting Restatement, the board of directors of Colliers (the “Board”) or, at the Board’s election, the Executive Compensation Committee of the Board will review all Incentive-Based Compensation received by Executive Officers during the three completed fiscal years immediately preceding the applicable Restatement Date (as well as during any transition period specified in the U.S. Clawback Rules), other than any such compensation that was received prior to such Executive Officer’s service as an Executive Officer or prior to the U.S. Clawback Rules becoming effective. Incentive-Based Compensation is deemed “received” in the fiscal period during which the Financial Reporting Measure specified in the Incentive-Based Compensation is attained, even if the payment or grant of Incentive-Based Compensation occurs after the end of that period. If the Board determines that an Executive Officer received any Erroneously Awarded Compensation in connection with such Accounting Restatement, the Board shall, reasonably promptly after the Restatement Date, seek recoupment from such Executive Officer of all such Erroneously Awarded Compensation, subject to the exceptions set forth below under “—Recoupment Exceptions”. The Board will determine, in its sole discretion, the method for recouping Erroneously Awarded Compensation hereunder.
Calculation of Erroneously Awarded Compensation
The amount of Erroneously Awarded Compensation shall be calculated in accordance with the U.S. Clawback Rules. For Incentive-Based Compensation based on Colliers’ stock price or total shareholder return, where the amount of Erroneously Awarded Compensation is not subject to mathematical recalculation directly from the information in an Accounting Restatement: (i) the amount of Erroneously Awarded Compensation must be based on a reasonable estimate of the effect of the Accounting Restatement on Colliers’ stock price or total shareholder return upon which the Incentive-Based Compensation was received; and (ii) Colliers must maintain documentation of the determination of that reasonable estimate and provide such documentation to the applicable U.S. stock exchange.
Clawback Policy – Last Updated: September 2023
Recoupment Exceptions
Colliers must recover any Erroneously Awarded Compensation unless the Executive Compensation Committee (or, in its absence, the majority of the independent directors serving on the Board) determines that any of the impracticality exceptions set forth in the U.S. Clawback Rules are available.
Recoupment of Erroneously Awarded Compensation due to an Accounting Restatement will be made on a “no fault” basis, without regard to whether any misconduct occurred or whether any Executive Officer is responsible for the noncompliance that resulted in the Accounting Restatement.
Further Reference to Applicable SEC and U.S. Stock Exchange Rules
This Policy shall be qualified in all respects by reference to the U.S. Clawback Rules. To the extent there is a conflict between this Policy and the U.S. Clawback Rules, or any interpretive question arises hereunder, the U.S. Clawback Rules shall control. Colliers shall comply with all disclosure obligations associated with the implementation and enforcement of this Policy under the U.S. Clawback Rules and any other applicable law.
Applicability
Each award agreement or other document setting forth the terms and conditions of any Incentive-Based Compensation granted or paid to an Executive Officer will include (or will be deemed to include) a provision incorporating this Policy or the requirements of this Policy. The remedies specified in this Policy shall not be exclusive and shall be in addition to every other right or remedy at law or in equity that may be available to Colliers.
Interpretation
The Board shall have full and final authority to make all determinations under this Policy including, without limitation, whether this Policy applies and if so, the amount of compensation to be repaid or forfeited by an Executive Officer. All determinations and decisions made by the Board pursuant to the provisions of this Policy shall be final, conclusive and binding on all parties.
This Policy supersedes and replaces any previous clawback or clawback-related policies.
Clawback Policy – Last Updated: September 2023