UNITED STATES OF AMERICA
SECURITIES AND EXCHANGE COMMISSION
Washington, D.C. 20549
FORM 8-K
CURRENT REPORT
PURSUANT TO SECTION 13 OR 15(d) OF THE SECURITIES EXCHANGE ACT OF 1934
Date of Report (Date of earliest event reported): November 16, 2023 (November 16, 2023)
CHEMUNG FINANCIAL CORPORATION
(Exact name of registrant as specified in its charter)
| New York | 001-35741 | 16-1237038 | ||
| (State or other jurisdiction of incorporation) | (Commission File Number) | (IRS Employer Identification No.) |
One Chemung Canal Plaza, Elmira, NY 14901
(Address of principal executive offices) (Zip Code)
(607) 737-3711
(Registrant’s telephone number, including area code)
Securities registered pursuant to Section 12(b) of the Exchange Act:
| Title of each class | Trading symbol | Name of exchange on which registered | ||
| Common stock, par value $0.01 per share | CHMG | Nasdaq Global Select Market |
Check the appropriate box below if the Form 8-K filing is intended to simultaneously satisfy the filing obligation of the registrant under any of the following provisions:
☐ Written communications pursuant to Rule 425 under the Securities Act (17 CFR 230.425)
☐ Soliciting material pursuant to Rule 14a-12 under the Exchange Act (17 CFR 240.14a-12)
☐ Pre-commencement communications pursuant to Rule 14d-2(b) under the Exchange Act (17 CFR 240.14d-2(b))
☐ Pre-commencement communications pursuant to Rule 13e-4(c) under the Exchange Act (17 CFR 240.16e-4(c))
Indicate by check mark whether the registrant is an emerging growth company as defined in Rule 405 of the Securities Act of 1933 (17 CFR §230.405) or Rule 12b-2 of the Securities Exchange Act of 1934 (17 CFR §240.12b-2). Emerging growth company ☐
If an emerging growth company, indicate by check mark if the registrant has elected not to use the extended transition period for complying with any new or revised financial accounting standards provided pursuant to Section 13(a) of the Exchange Act. ☐
| ITEM 7.01 | Regulation FD Disclosure |
The management of Chemung Financial Corporation (the “Corporation”) conducted one-on-one meetings with institutional investors and analysts on November 16, 2023, at the 2023 Piper Sandler East Coast Financial Services Forum to discuss the Corporation’s strategies and recent financial performance. Anders M. Tomson, Chief Executive Officer, and Dale M. McKim III, Chief Financial Officer and Treasurer, presented.
The investor presentation prepared by the Corporation for use in these meetings is available on the Corporation’s website at www.chemungcanal.com under Investor Relations and “Investor Presentation.” Investors should note that the Corporation announces material information in Securities and Exchange Commission (the “SEC”) filings and press releases. Based on guidance from the SEC, the Corporation may also use the Investor Relations section of its corporate website, www.chemungcanal.com, to communicate with investors about the Corporation. It is possible that the information posted there could be deemed to be material information. The information on the Corporation’s website is not incorporated by reference into this Current Report on Form 8-K.
This investor presentation is furnished pursuant to Item 7.01 of Form 8-K and shall not be deemed to be “filed” for the purposes of Section 18 of the Securities Exchange Act of 1934 (the “Exchange Act”), as amended, or otherwise subject to the liabilities of that section, nor shall it be deemed incorporated by reference in any filing under the Securities Act of 1933, as amended, or the Exchange Act, whether made before or after the date of this report, except as shall be expressly set forth by specific reference in such filing.
The investor presentation is furnished as Exhibit 99.1 to this report.
| ITEM 9.01 | Financial Statements and Exhibits | |
| (d) | Exhibits | |
| Exhibit No. | ||
| 99.1 | Investor Presentation on November 16, 2023. | |
| 104 | Cover Page Interactive Data File (embedded within the Inline XBRL document) | |
SIGNATURES
Pursuant to the requirements of the Securities Exchange Act of 1934, the registrant has duly caused this report to be signed on its behalf by the undersigned, hereunto duly authorized.
| CHEMUNG FINANCIAL CORPORATION | ||
| November 16, 2023 | By: | /s/ Dale M. McKim, III |
| Dale M. McKim, III | ||
| Chief Financial Officer and Treasurer | ||
Exhibit 99.1

Chemung Financial Corporation 2023 Piper Sandler East Coast Financial Services Forum 1


With Y ou Today Anders Tomson President and Chief Executive Officer Dale McKim Executive Vice President and Chief Financial Officer 2 Safe Harbor Statement This presentation contains certain statements that may be considered forward - looking statements within the meaning of Section 27 A of the Securities Act, Section 21 E of the Exchange Act, and the Private Securities Litigation Reform Act of 1995 , which are subject to numerous risks and uncertainties . Forward looking statements can be identified by words such as "anticipates," "believes," "contemplates," "feels", "expects," "estimates," "seeks," "strives," "plans," "intends," "outlook," "forecast," "position," "target," "mission," "assume," "achievable," "potential," "strategy," "goal," "aspiration," "opportunity," "initiative," "outcome," "continue," "remain," "maintain," "on course," "trend," "objective," "looks forward," "projects," "models" and variations of such words and similar expressions, or future or conditional verbs such as "will," "would," "should," "could," "might," "can," "may," or similar expressions, which predict or indicate future events or trends and which do not relate to historical matters . These forward - looking statements are predicated on the beliefs and assumptions of Chemung Financial Corporation’s management based on information known to management as of the date of this presentation and do not purport to speak as of any other date . Forward looking statements should not be relied upon, because they involve known and unknown risks, uncertainties and other factors, some of which are beyond the control of the company . Should one or more of these risks materialize or should underlying beliefs or assumptions prove incorrect, the Corporation’s actual results, performance or achievements could differ materially from those discussed . Factors that could cause or contribute to such differences include but are not limited to : changes in general economic, political or industry conditions ; changes in monetary and fiscal policies, including changes in interest rates ; volatility and disruptions in capital and credit markets ; changes in regulation or oversight ; unfavorable developments concerning credit quality ; the effects of more stringent capital or liquidity requirements ; declines or other changes in the businesses or industries of customers of the Corporation’s and its subsidiaries ; operational difficulties, failure of technology, infrastructure or information security incidents ; the implementation of the Corporation’s strategies and business initiatives ; changes in the financial markets, including fluctuations in interest rates ; competitive product and pricing pressures among financial institutions within the Corporation’s markets ; changes in customer behavior ; any future strategic acquisitions or divestitures ; management's ability to maintain and expand customer relationships ; management's ability to retain key officers and employees ; the impact of legal and regulatory proceedings or determinations ; the effectiveness of methods of reducing risk exposures ; the effects of terrorist activities and other hostilities ; the effects of catastrophic events including, but not limited to, severe weather events and storms ; and changes in accounting standards . The Corporation cautions that the foregoing list of factors is not exclusive . For a discussion of factors that may cause actual results to differ from expectations, please refer to "Item 1 A . Risk Factors" of the Chemung Financial Corporation’s Annual Report on Form 10 - K for the year ended December 31 , 2022 , as updated by our filings on Form 10 - Q and other filings with the SEC . Forward - looking statements speak only as of the date they are made . The Corporation does not undertake to update forward - looking statements to reflect facts, circumstances, assumptions or events that occur after the date the forward - looking statements are made . For any forward - looking statements made in this presentation or in any documents, the Corporation claims the protection of the safe harbor for forward - looking statements contained in the Private Securities Litigation Reform Act of 1995 . 3 Key Takeaways 4 Continued strength and momentum in underlying business High customer engagement across all business lines and geographies.

Stable deposit base and ample liquidity Majority of deposits sourced from stable, legacy markets. Commercial loan growth throughout footprint Demand remained strong through first three quarters of 2023; 9.9% annualized growth rate . Continued confidence in the strategy Expansion of the franchise in higher growth markets of Albany and Buffalo Solid and stable credit quality Consistently low non - performing assets and charge - offs. Valuable wealth management business High touch relationships with affluent borrowers provides dependable non - interest income stream.

About Us History • Oldest locally owned and managed community bank in New York State, dating to 1833 . Operations • Subsidiary bank - Chemung Canal Trust Company - operates with 31 branches over 14 counties in New York and Pennsylvania. Operating as Capital Bank division in Albany, New York market. • Trust and Wealth Management division with $2.1 bn in assets under management or administration. Legal & Market • New York chartered bank and member of the Federal Reserve • Listed on NASDAQ Global Select (Ticker: CHMG) • Market Capitalization of $187.7 million at September 30, 2023 Elmira, New York 5 Core Strategies Build through organic growth and acquisitions x 3 whole bank acquisitions since 1994 plus 12 branches acquired.
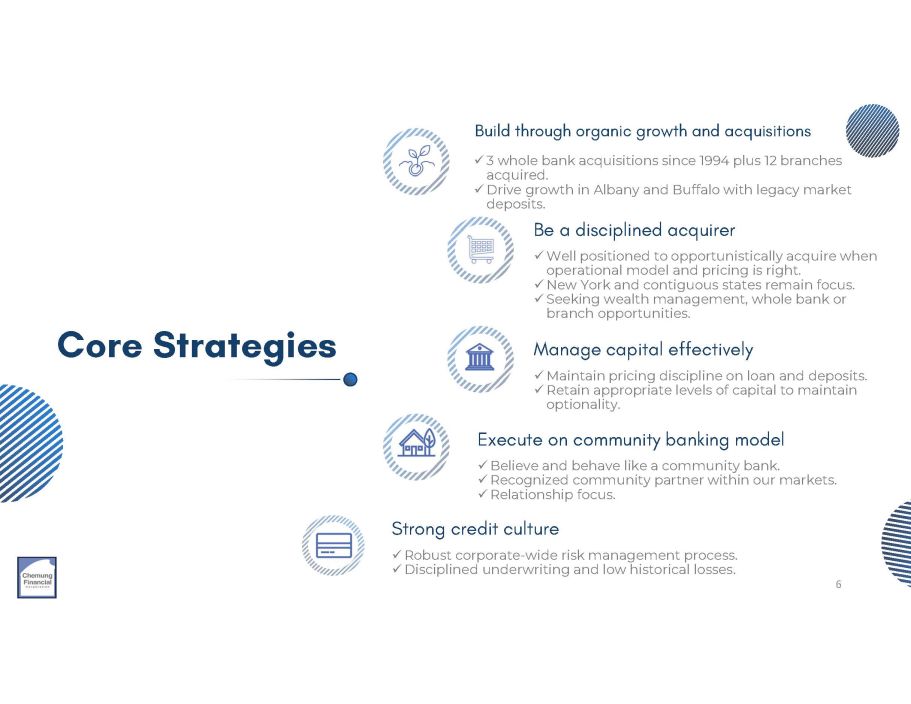
x Drive growth in Albany and Buffalo with legacy market deposits. Be a disciplined acquirer x Well positioned to opportunistically acquire when operational model and pricing is right. x New York and contiguous states remain focus. x Seeking wealth management, whole bank or branch opportunities. Manage capital effectively x Maintain pricing discipline on loan and deposits. x Retain appropriate levels of capital to maintain optionality. Execute on community banking model x Believe and behave like a community bank. x Recognized community partner within our markets. x Relationship focus. Strong credit culture x Robust corporate - wide risk management process. x Disciplined underwriting and low historical losses. 6 Third Quarter 2023 Highlights • Net interest margin 2.73% • Adjusted efficiency ratio 66.55% • Non - interest expense to average assets improved 8 bps from prior quarter • Total deposits increased 3.5% from prior quarter - end • Loans - to - deposits 78.05% • Dividend of $0.31 declared 7


Company and Financial Highlights 2 Loans Page 15 x Loan Growth x Portfolio Composition x Commercial Portfolio x CECL Adoption x Non - Performers Investments Page 23 x Portfolio Composition x Yield and Duration x Fair Value and AOCI 3 4 Deposits Page 27 x Deposit Costs x Deposits Composition x Liquidity 5 Performance Page 31 Appendices 1 8 Background Page 9 x Corporate Organization x Markets and Share x Management Team x Core Strategies x Community x Net Income Trend x Net Interest Margin x Non - Interest Income x Non - Interest Expense x Expense Management x Capital Management Corporate Organization Nevada based captive insurer Trust and Wealth Management services Provides mutual funds, securities and insurance brokerage services through LPL Financial Banking operations in Southern Tier and Western New York Chemung Risk Management, Inc. Wealth Management Group Banking operations in the Capital District of New York 10

Background 9


Markets Legacy Markets Long, deep relationships since 1833 provide stable funding and earnings engine. Steady and even economy, powered by large corporations (Corning, Inc.), higher education (Cornell University, SUNY Binghamton) and tourism. Growth Opportunity New York’s Capital and Western New York regions offer larger population centers undergoing economic renaissances. Large bank consolidation providing market disruption opportunities. 11 Market Share Legacy Markets Dominant market share of deposits Growth Markets Small share of much larger markets; a lot of room to grow.

Competitive Advantage Deployment of lower cost deposits to higher growth markets .

Share 2023 Deposits County 61.49% $959,331 Chemung 1.45% $360,232 Albany 26.22% $139,572 Tioga 69.99% $181,089 Schuyler 9.39% $126,414 Steuben 7.56% $121,273 Cayuga 4.17% $111,292 Tompkins 4.10% $65,042 Bradford (PA) 3.18% $110,897 Broome 1.89% $123,069 Saratoga 3.93% $28,742 Seneca 2.18% $19,922 Cortland 1.24% $44,654 Schenectady 0.00% $3,061 Erie $2,394,590 Total 12 Albany, New York ($ Thousands) * As of June 30, 2023 Experienced Management Team Anders Tomson President and CEO Industry Experience: 30 years Years with CHMG: 12 years Previously with Citizens Dale McKim EVP & CFO Industry Experience: 27 years Previously with KPMG LLP and Evans Bancorp Jeffrey Kenefick Regional President Industry Experience: 34 years Years with CHMG: 4 Previously with Five Star Bank Daniel Fariello President, Capital Bank Industry Experience: 22 years Years with CHMG: 10 Previously with First Niagara Thomas Wirth EVP, Wealth Management Industry Experience: 36 years Years with CHMG: 36 years Kimberly Hazelton EVP, Senior Banking Officer Industry Experience: 30 years Years with CHMG: 7 years Previously with TD Bank 13 Peter Cosgrove EVP, Chief Credit and Risk Officer Industry Experience: 41 years Years with CHMG: 4 years Previously with First Niagara Dale Cole EVP and Chief Information Officer Industry Experience: 25 years Years with CHMG: 6 years Previously with BOK Financial Supporting our Communities Volunteering over 8,000 Hours Distributing nearly $550,000 in donations and sponsorships 14


Loans 15

$576.4 $658.5 $592.2 $651.5 $660.8 $732.8 $878.0 $879.0 $1,098.1 $1,174.0 $47.0 $79.8 $95.8 $ - $500 $1,000 $1,500 $2,000 $2,500 Loans by Division ($ Millions) Chemung Capital Buffalo • Total loans: $1.931 billion as of September 30, 2023 • Originated $291.3MM in Commercial Loans through September 2023 • Originated $66.8MM in Indirect Loans through September 2023 • Originated $21.4MM in Mortgage Loans through September 2023 • Originated $20.4MM in Home Equity Loans through September 2023 • Opened Loan Production Office in Buffalo, NY in 2021. $95.8MM in loans as of September 30, 2023 . Summary of Loan Growth *CAGR: 12/31/18 to 09/30/2023 *September 30, 2023 figures unaudited 2023 2022 2021 2020 2019 34.26% 35.58% 39.00% 42.86% 44.03% 60.78% 60.06% 57.91% 57.14% 55.97% 4.96% 4.36% 3.09% N/A N/A Chemung Capital Buffalo 16 17.6% 14.3% 14.1% 13.8% 13.2% 49.5% 46.6% 52.9% 54.5% 56.3% 9.8% 2.8% 14.4% 15.6% 17.1% 15.6% 14.6% 10.3% 7.8% 7.8% 11.0% 10.9% 8.2% 5.9% 5.0% Loans by Type (%) 5.3% 5.1% 40.0% 30.0% 20.0% 10.0% 0.0% 80.0% 70.0% 60.0% 50.0% 100.0% 90.0% Other Cons. Indirect Cons. Res. Mort. PPP Comm. Mort. Comm. & Ind.

• Effectively managing portfolio composition by establishing limits such as exposure and percentage of capital deployed for each category. • Tactical use of participations to manage risk and capital. Loan Composition 2021 2022 YTD 2023 *September 30, 2023 figures unaudited 17 13.18% 56.28% 14.57% 15.97% Portfolio Concentrations to Total Loans September 30, 2023 Commercial & Ind. Commercial RE Residential Mort. Consumer 2019 2020 2021 2022 Q3 2023 C&I 122% 188% 118% 105% 103% CRE 343% 365% 370% 416% 440% RRE 99% 122% 119% 119% 114% 125% 350% 300% 250% 200% 150% 100% 50% 0% 400% 500% 450% Portfolio Composition to Tier 1 Capital & ACL September 30, 2023 9.95% 3.59% 10.72% 10.27% 3.17% $189.3 $196.1 $217.2 $239.5 $247.1 0.00% 2.00% 4.00% 6.00% 8.00% 10.00% 12.00% $0 $50 $100 $150 $200 $250 $300 2019 2020 Consumer 128% 108% 92% 123% *The CRE Ratio above does not agree to the regulatory guidelines due to the inclusion of owner occupied loans. The regulatory guideline measure was 380% at 2023.

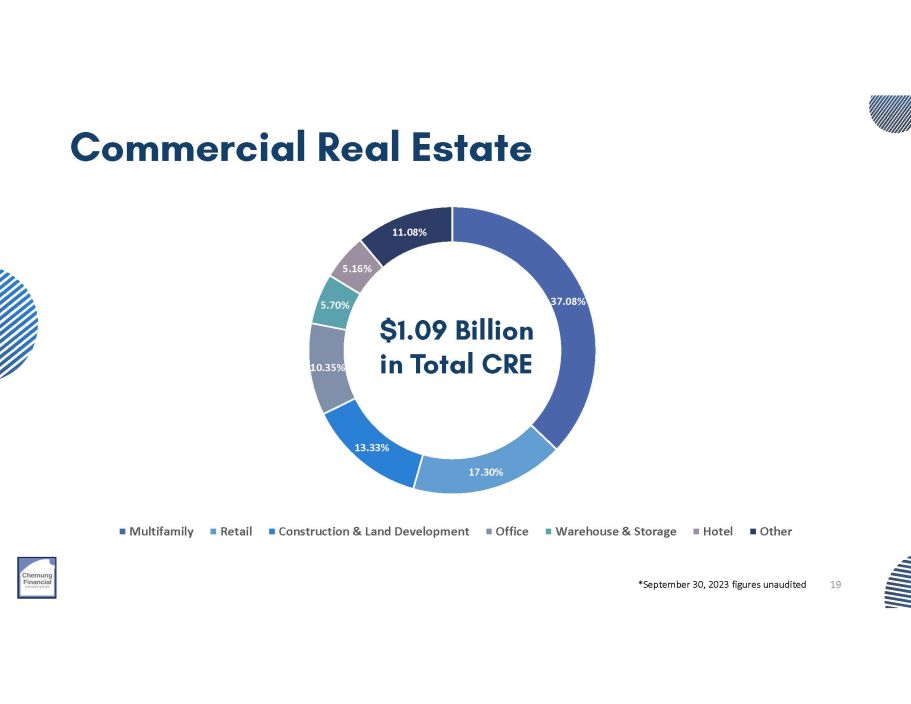
Tier 1 Capital & ACL ***CECL Adopted 1/1/2023 Growth Tier 1 Capital and ACL Commercial Loan Portfolio – September 30, 2023 70.67% 2.83% 5.75% 2.97% 1.38% 3.91% NAICS Descriptions 10.02% 2.47% Real Estate, Rental & Leasing Manufacturing Health Care & Social Assistance Wholesale Trade Construction Accommodation & Food Services Arts, Entertainment & Recreation Other 33.71% 17.62% 24.53% 8.82% 10.77% 0.07% 4.48% Loan Types Non - Owner Occupied Commercial & Industrial Multi - Family Owner Occupied Construction Agricultural & Farmland Other NAICS Code / Descriptions Balances ($ Thousands) Percentage 70.67% $ 947,770 Real Estate, Rental & Leasing 2.83% 37,974 Manufacturing 3.91% 52,416 Health Care & Social Assistance 1.38% 18,459 Wholesale Trade 2.97% 39,817 Construction 5.75% 77,054 Accommodation & Food Services 2.47% 33,092 Arts, Entertainment & Recreation 10.02% 134,435 Other 100.00% $ 1,341,017 Total 33.71% $ 451,960 Loan Types Non - Owner Occupied 17.62% 236,350 Commercial & Industrial 24.53% 328,963 Multi - Family 8.82% 118,243 Owner Occupied 10.77% 144,434 Construction 0.07% 955 Agricultural & Farmland 4.48% 60,112 Other 100.00% $ 1,341,017 Total *September 30, 2023 figures unaudited 18 Commercial Real Estate 37.08% 17.30% 13.33% 10.35% 5.70% 11.08% 5.16% Multifamily Retail Construction & Land Development Office Warehouse & Storage Hotel Other $1.09 Billion in Total CRE *September 30, 2023 figures unaudited 19

CECL Adoption $17,485 $18,631 $19,659 $374 $20,033 $20,075 $20,172 $20,252 1.08% 1.07% 1.07% 1.10% 1.07% 1.07% 1.05% 1.10% 1.09% 1.08% 1.07% 1.06% 1.05% 1.04% $20,000 $15,000 $10,000 $5,000 $ - Allowance Allowance/Loans • Recorded a net decrease to retained earnings of $1.1 million, net of taxes. • The allowance for unfunded commitments increased by $1.1 million, reflected in other liabilities on the balance sheet. *March 31, 2023, June 30, 2023 and September 30, 2023 figures unaudited 20 Trends in Non - Performing Assets 0.26% 0.35% 0.20% 0.00% 0.40% 1.60% 1.40% 1.20% 1.00% 0.80% 0.60% Non - Performing Loans and Assets (% of Total) Non - performing assets to total assets Non - performing loans to total loans *September 30, 2023 figures unaudited 21


Trends in Non - Performing Assets $6,826 $7,055 $5,000 $7,500 $20,000 $17,500 $15,000 $12,500 $10,000 Non - Performing Loans and Assets ($ Thousands) Non Performing Loans Non Performing Assets *September 30, 2023 figures unaudited 22 Investment Portfolio Composition *September 30, 2023 figures unaudited 0.0% 0.0% 15.6% 16.3% 14.1% 7.8% 5.6% 15.1% 7.8% 6.4% 6.1% 5.3% 84.4% 73.0% 79.3% 68.3% 68.8% 9.7% 8.8% 7.6% 0.0% 100.0% 90.0% 80.0% 70.0% 60.0% 50.0% 40.0% 30.0% 20.0% 10.0% 2019 2020 2021 2022 Q3 2023 Securities Available for Sale by Type (%) U.S. Government & Enterprises MBS States & Political Other Sec. 24

Investments 23


Investment Portfolio – Yield & Duration * September 30, 2023 figures unaudited • Utilizing cashflows from principal and interest payments to fund loans and pay down borrowings. • Approximately $5 million a month in cash flows. • Principal cash flows representing over 40% of the portfolio to be received in the next five years.

2.21% 4.2 3.8 4.0 4.2 4.4 4.6 4.8 Investment Portfolio 5.00% 5.0 0.00% 1.00% 2.00% 3.00% 4.00% 2019 2020 2021 2022 Q3 2023 Yield Duration - Years 25 Investment Portfolio – Fair Value and AOCI 26 * September 30, 2023 figures unaudited $60,431 $55,574 $55,000 $225,029 $467,866 $577,361 $435,131 $389,031 $43,405 $42,303 $38,892 $36,153 $15,962 $41,265 $43,340 $111,931 $102,992 $88,820 $1,834 $12,249 $3,383 $(96,609) $(114,833) $(140,000) $(120,000) $(100,000) $(80,000) $(60,000) $(40,000) $(20,000) $ - $900,000 $20,000 $ - $100,000 $200,000 $300,000 $400,000 $500,000 $600,000 $700,000 $800,000 2019 2020 2021 2022 Q3 2023 Fair Values ($000) U.S.

Deposits 27
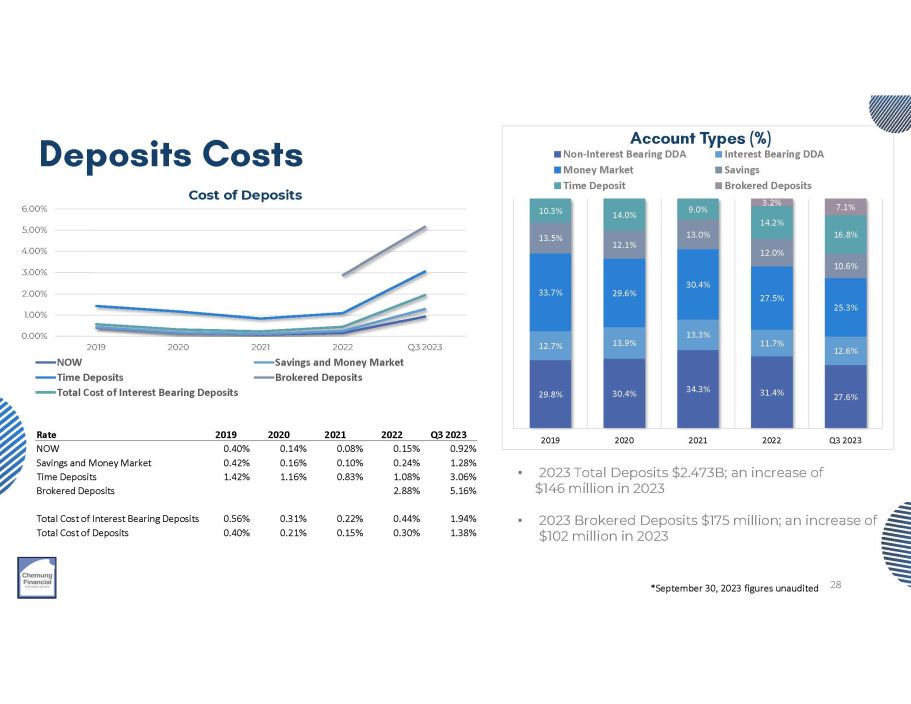
Government & Enterprises MBS States & Political Other Unrealized (Loss)/Gain 29.8% 30.4% 34.3% 31.4% 27.6% 12.7% 13.9% 13.3% 11.7% 12.6% 33.7% 29.6% 30.4% 27.5% 25.3% 13.5% 12.1% 13.0% 12.0% 10.6% 10.3% 14.0% 9.0% 16.8% 3.2% 14.2% 7.1% 2019 2020 2021 2022 Q3 2023 Account Types (%) Non - Interest Bearing DDA Money Market Time Deposit Interest Bearing DDA Savings Brokered Deposits Deposits Costs *September 30, 2023 figures unaudited • 2023 Total Deposits $2.473B; an increase of $146 million in 2023 • 2023 Brokered Deposits $175 million; an increase of $102 million in 2023 28 Rate 2019 2020 2021 2022 Q3 2023 0.92% 0.15% 0.08% 0.14% 0.40% NOW 1.28% 0.24% 0.10% 0.16% 0.42% Savings and Money Market 3.06% 1.08% 0.83% 1.16% 1.42% Time Deposits 5.16% 2.88% Brokered Deposits 1.94% 0.44% 0.22% 0.31% 0.56% Total Cost of Interest Bearing Deposits 1.38% 0.30% 0.15% 0.21% 0.40% Total Cost of Deposits 0.00% 1.00% 2.00% 3.00% 4.00% 5.00% 6.00% 2019 2020 NOW Time Deposits Total Cost of Interest Bearing Deposits 2021 2022 Savings and Money Market Brokered Deposits Q3 2023 Cost of Deposits $1,317.3 $1,686.3 $1,738.0 $1,815.5 $1,901.3 $254.9 $351.4 $415.6 $435.2 $391.9 $73.5 $175.0 $1.8 $3.0 $5.3 29.6% 32.0% 33.6% 30.1% 27.2% 0.0% 10.0% 20.0% 30.0% 40.0% 50.0% 60.0% 70.0% 80.0% 90.0% 100.0% $ - $500 $1,000 $1,500 $2,000 $2,500 $3,000 2021 2022 Q3 2023 Deposits by Division ($ Millions) Capital Bank Uninsured Deposits Brokered 2019 2020 CCTC Western New York Deposit Composition *September 30, 2023 figures unaudited 29 *CAGR 12/31/2018 to 09/30/2023 50.5% 43.8% 45.0% 44.0% 41.0% 29.4% 34.0% 34.1% 30.1% 27.9% 8.7% 6.6% 7.5% 6.8% 7.1% 3.2% 7.1% 11.4% 15.6% 13.4% 15.9% 16.9% DEPOSITS BY CUSTOMER (%) Consumer Commerical Public Brokered ICS / CDARS


Liquidity Williamsville, New York Branch 30 Dollars in Thousands Total Available Outstanding Remaining Available $ 231,334 - $ $ 231,334 FHLB Advances 60,000 - 60,000 Correspondent Bank Lines of Credit 95,783 175,000 270,783 Brokered Deposits 296,347 - 296,347 Unencumbered Securities $ 683,464 $ 175,000 $ 858,464 Total Sources of Liquidity $ 671,914 Uninsured Deposits 27.2% Uninsured Deposits to Total Deposits *Includes $174.5 million in collateralized municipal deposits As of September 30, 2023, unaudited Net Income – Quarterly Trend ($ Thousands) *March 31, 2023, June 30, 2023 and September 30, 2023 figures unaudited $15.6MM $19.2MM $26.4MM 2020 $28.8MM 2022 $21.2 MM YTD 2023 2019 2021 32 $4,468 $4,981 $1,956 $4,204 $2,491 $5,827 $5,711 $5,233 $6,795 $6,646 $6,867 $6,530 $6,454 $8,024 $6,453 $7,439 $7,270 $6,280 $7,648 $2,000 $1,000 $ - $3,000 $4,000 $5,000 $6,000 $7,000 $8,000 $9,000 Q1 Q2 Q3 Q4 Q1 Q2 Q3 Q4 Q1 Q2 Q3 Q4 Q1 Q2 Q3 Q4 Q1 Q2 Q3 Q4

Performance 31


Net Interest Margin • 25.45% of the loan portfolio reprices or matures within the next 90 days • 21.86% of the commercial loan portfolio reprices or matures within the next 90 days • 48.66% of the commercial loan portfolio reprices or matures within the next 5 years • 71.16% of the commercial loan portfolio is variable *September 30, 2023 figures unaudited 33 2023 2022 2021 2020 2019 .00% 3.14% 2.87% 2.86% 3.55% 3.71% Q1 2.87% 2.97% 2.76% 3.26% 3.69% Q2 2.73% 3.08% 2.88% 3.20% 3.63% Q3 3.26% 2.85% 3.06% 3.56% Q4 0 3.00% 2.50% 2.00% 1.50% 1.00% 0.50% 4.00% 3.50% Fully Taxable Equivalent Net Interest Margin (%) Q1 Q2 Q3 Q4 2.91% 3.05% 2.84% 3.64% 3.25% 1.00% 1.80% 1.40% 2.20% 2.60% 3.00% 3.40% 3.80% 2019 2020 2021 2022 YTD 2023 Fully Taxable Equivalent Net Interest Margin (%)

Non - Interest Income Components 12.36% 3.27% 18.57% 41.31% 4.01% - 0.53% 0.48% 20.53% $18.7 Million 9/30/2023 Overdraft Fees Interchange Income CFS Group, Inc.

Revenue Change in FV of Equity Securities Service Charges on Deposits Wealth Management Revenue Net Gains on Sales of Loans Other *September 30, 2023 figures unaudited 34 Non - Interest Income Components YTD 2023 2022 2021 2020 2019 $7,716 $10,280 $11,072 $9,492 $9,503 Wealth Management Revenue $3,468 $4,603 $4,844 $4,068 $4,104 Interchange Income $2,308 $2,501 $2,266 $2,304 $3,653 Overdraft Fees $610 $1,287 $948 $830 $807 Service Charges on Deposits $749 $1,079 $1,044 $657 $673 CFS Group, Inc. Revenue $(99) $(349) $246 $89 $81 Change in FV of Equity Securities $90 $107 $1,073 $1,730 $248 Net Gains on Sales of Loans $3,836 $1,928 $2,377 $1,954 $1,004 Other $30,000 $25,000 $20,000 $15,000 $10,000 $5,000 $ - *September 30, 2023 figures unaudited 35 Non - Interest Income ($ Thousands)


Non - Interest Expense Components 42.23% 10.43% 15.47% 8.95% 3.39% 3.37% 1.52% 2.60% 12.04% $47.4 Million 9/30/2023 Salaries Net Occupancy Furniture/Equipment Data Processing FDIC Insurance Marketing Employee Benefits Professional Services Other 36 *September 30, 2023 figures unaudited Non - Interest Expense Components YTD Q3 2023 2022 2021 2020 2019 $20,029 $25,054 $24,413 $24,250 $23,420 Salaries $4,945 $6,020 $4,503 $4,536 $5,361 Employee Benefits $4,242 $5,539 $5,873 $5,885 $5,969 Net Occupancy $7,334 $8,919 $8,519 $7,576 $7,386 Data Processing $1,596 $2,171 $1,932 $1,725 $1,885 Professional Services $1,232 $1,906 $1,669 $2,078 $2,497 Furniture/Equipment $720 $941 $792 $631 $932 Marketing $1,608 $1,356 $1,408 $987 $537 FDIC Insurance $5,711 $7,374 $6,573 $8,267 $7,709 Other $ - 37 *September 30, 2023 figures unaudited $10,000 $20,000 $30,000 $40,000 $50,000 $60,000 Non - Interest Expense ($ Thousands)

• Goal is both cost containment and cost savings • Increase efficiency in banking operations (e.g., hub and spoke) • Identify internal best practices • Develop clear action plans to implement best practices across the organization • Growth without adding cost • Cost savings recognized: • Reduction in headcount • Frozen pension plan and post - retirement healthcare accruals • Consolidation of five branch locations within existing footprint, with the most recent being two locations in 2020 Expense Management and Control 58.00 2017 2018 2019 2020 2021 2022 Q3 2023 **Efficiency ratio (adjusted) is non - interest expense less amortization of intangible assets less legal reserve less employee retention tax credit divided by the total of fully taxable equivalent net interest income plus non - interest income less net gains or losses on securities transactions *September 30, 2023 figures unaudited 38 66.60 67.22 67.95 65.71 61.71 61.71 64.83 59.00 60.00 61.00 62.00 63.00 64.00 65.00 66.00 67.00 68.00 69.00 Efficiency Ratio (%)** • Grow capital organically through earnings • Continue to remain profitable and pay dividends • Announced share repurchase program of 250,000 shares in January 2021.

• As of September 30, 2023 - 49,184 shares had been repurchased. • Positive stress testing results Capital Management 12.73% 9.35% 7.90% 8.06% 8.23% 8.64% 12.37% 12.96% 11.54% 11.94% 13.98% 13.62% 14.21% 12.57% 13.02% 9.07% 7.87% 7.91% 5.51% 5.52% 4.00% 6.00% 8.00% 10.00% 12.00% 14.00% 16.00% Chemung Financial Corporation - Capital Ratios (%) Tier 1 Leverage Tier 1 Capital / CET1 Total Capital TCE Ratio YTD 2023 2022 2021 2020 2019 $4.48 $6.13 $5.64 $4.01 $3.21 EPS $0.93 $1.24 $1.19 $1.04 $1.04 Dividends / Share $35.90 $35.32 $45.09 $42.53 $37.35 Book Value / Share $31.29 $30.69 $40.44 $37.83 $32.74 Tangible Book Value / Share $ - *September 30, 2023 figures unaudited 39 $1.00 $2.00 $3.00 $4.00 $5.00 $6.00 $7.00 $ - $5.00 $10.00 $15.00 $20.00 $25.00 $30.00 $35.00 $40.00 $45.00 $50.00 Earnings and Dividends Per Share Tangible Book Value Per Share 4.7 million Shares Outstanding* $187.7M Market Capitalization* $0.93 YTD Dividend Per Share^ 3.13% Dividend Yield (TTM)* 13,074 Average Daily Volume^ $35.90 Book Value Per Share* $31.29 Tangible Book Value Per Share* $39.61 Stock Price* 6.61x Price to Earnings (TTM)* 1.27x Price to Tangible Book* 1.07% Return on Average Assets^ 15.93% Return on Average Equity^ • As of September 30, 2023 (unaudited) • ^ YTD, September 30, 2023 (unaudited) CHMG Stock at a Glance 40

Get In Touch Chemung Financial Corporation is a $2.7 billion financial services holding company headquartered in Elmira, New York and operates 31 retail offices through its principal subsidiary, Chemung Canal Trust Company, a full service community bank with trust powers. Established in 1833, Chemung Canal Trust Company is the oldest locally - owned and managed community bank in New York State. Chemung Financial Corporation is also the parent of CFS Group, Inc., a financial services subsidiary offering non - traditional services including mutual funds, annuities, brokerage services, tax preparation services and insurance, and Chemung Risk Management, Inc., a captive insurance company based in the State of Nevada. Dale McKim atomson@chemungcanal.com One Chemung Canal Plaza Elmira, New York 14901 607 737 - 3756 Anders Tomson 607 737 - 3714 dmckim@chemungcanal.com 41