UNITED STATES
SECURITIES AND EXCHANGE COMMISSION
Washington, D.C. 20549
FORM 8-K
CURRENT REPORT
Pursuant to Section 13 or 15(d) of the Securities Exchange Act of 1934
Date of Report (Date of earliest event reported) July 25, 2023
SIMMONS FIRST NATIONAL CORPORATION
(Exact name of registrant as specified in its charter)
| Arkansas | 0-6253 | 71-0407808 |
| (State or other jurisdiction of incorporation) | (Commission File Number) | (I.R.S. Employer Identification No.) |
| 501 Main Street, Pine Bluff, Arkansas | 71601 | |
| (Address of principal executive offices) | (Zip Code) |
(870) 541-1000
(Registrant's telephone number, including area code)
Not Applicable
(Former name or former address, if changed since last report.)
Check the appropriate box below if the Form 8-K filing is intended to simultaneously satisfy the filing obligation of the registrant under any of the following provisions (see General Instruction A.2. below):
☐ Written communications pursuant to Rule 425 under the Securities Act (17 CFR 230.425)
☐ Soliciting material pursuant to Rule 14a-12 under the Exchange Act (17 CFR 240.14a-12)
☐ Pre-commencement communications pursuant to Rule 14d-2(b) under the Exchange Act (17 CFR 240.14d-2(b))
☐ Pre-commencement communications pursuant to Rule 13e-4(c) under the Exchange Act (17 CFR 240.13e-4(c))
Securities registered pursuant to Section 12(b) of the Act:
| Title of each class | Trading Symbol(s) | Name of each exchange on which registered |
| Common stock, par value $0.01 per share | SFNC | The Nasdaq Global Select Market |
Indicate by check mark whether the registrant is an emerging growth company as defined in Rule 405 of the Securities Act of 1933 (17 CFR §230.405) or Rule 12b-2 of the Securities Exchange Act of 1934 (17 CFR §240.12b-2). Emerging growth company ☐
If an emerging growth company, indicate by check mark if the registrant has elected not to use the extended transition period for complying with any new or revised financial accounting standards provided pursuant to Section 13(a) of the Exchange Act. ☐
| Item 2.02 | Results of Operations and Financial Condition. |
On July 25, 2023, the Registrant issued a press release, a copy of which is attached hereto as Exhibit 99.1 and is incorporated herein by reference.
The information provided pursuant to this Item 2.02, including Exhibit 99.1, is being furnished and shall not be deemed "filed" for purposes of Section 18 of the Securities Exchange Act of 1934 (“Exchange Act”) or otherwise subject to the liabilities under that Section and shall not be deemed to be incorporated by reference into any filing of the Registrant under the Securities Act of 1933 (“Securities Act”) or the Exchange Act, except as shall be expressly set forth by specific reference in such filing.
| Item 7.01 | Regulation FD Disclosure. |
On July 25, 2023, the Registrant issued an investor presentation, a copy of which is attached hereto as Exhibit 99.2 and is incorporated herein by reference.
The information provided pursuant to this Item 7.01, including Exhibit 99.2, is being furnished and shall not be deemed "filed" for purposes of Section 18 of the Exchange Act or otherwise subject to the liabilities under that Section and shall not be deemed to be incorporated by reference into any filing of the Registrant under the Securities Act or the Exchange Act, except as shall be expressly set forth by specific reference in such filing.
| Item 9.01 | Financial Statements and Exhibits. |
| Exhibit 99.1 | Press Release dated July 25, 2023 | |
| Exhibit 99.2 | Investor Presentation issued on July 25, 2023 | |
| Exhibit 104 | Cover Page Interactive Data File (embedded within the Inline XBRL Document) |
SIGNATURE
Pursuant to the requirements of the Securities Exchange Act of 1934, the registrant has duly caused this report to be signed on its behalf by the undersigned hereunto duly authorized.
| SIMMONS FIRST NATIONAL CORPORATION | |
| /s/ James M. Brogdon | |
| Date: July 25, 2023 | James M. Brogdon, President and Chief |
| Financial Officer |
Exhibit 99.1

July 25, 2023
Simmons First National Corporation Reports Second Quarter 2023 Results
| Bob Fehlman, Simmons’ Chief Executive Officer, commented on second quarter 2023 results: |
Simmons posted net income of $58.3 million and diluted earnings per share of $0.46 for the quarter. Adjusted earnings1 were $61.1 million and adjusted diluted earnings per share1 were $0.48. Balance sheet growth was steady, with total loans ending the quarter at $16.8 billion, up 2 percent, and total deposits at $22.5 billion, up slightly, both on a linked quarter basis.
Our Better Bank Initiative, which is focused on programs designed to optimize operational processes and increase capacity to capitalize on organic growth opportunities, achieved continued success across multiple fronts. During the quarter, we substantially completed our early retirement program, which is expected to result in approximately $5.1 million in annual cost savings. Extensive progress was also completed on other identified opportunities related to process improvements and streamlining or upgrading systems; and, as a result, we are on track to meet or exceed the estimated $15 million in annual cost savings we have identified to date by the end of 2023.
While we continue to navigate the challenging economic environment, like many in our industry we have experienced an increase in funding costs given the rapid rise in interest rates and resulting steps taken to defend our core customer deposit base. Given our strong liquidity and capital positions, our focus on maintaining prudent underwriting standards and our 120-year history, we believe we are in a position to continue to serve our customers and expand market share across our attractive footprint.
| Financial Highlights | 2Q23 | 1Q23 | 2Q22 | Q2 23 Highlights | |
| Balance Sheet (in millions) |
Metrics as of quarter end:
· Net income of $58.3 million and diluted EPS of $0.46
· Adjusted earnings1 of $61.1 million and adjusted diluted EPS1 of $0.48
· Strong expense management with noninterest expense down 2% on a linked quarter basis
· Maintained strong funding and liquidity positions as deposits increased on a linked quarter basis and coverage of uninsured deposits rose to 2.3x
· Disciplined loan growth as total loans increased 2% on a linked quarter basis
· 4 bps of net charge-offs; ACL to total loans unchanged at 1.25%
· Book value per share up 5% and tangible book value per share1 up 8%, both year-over-year
· Repurchased 1.1 million shares in the quarter |
||||
| Total deposits | $22,489 | $22,452 | $22,036 | ||
| Total loans | 16,834 | 16,555 | 15,110 | ||
| Total investment securities | 7,337 | 7,521 | 8,161 | ||
| Total shareholders’ equity | 3,356 | 3,340 | 3,260 | ||
| Asset Quality | |||||
| Net charge-off ratio | 0.04% | 0.03% | 0.02% | ||
| Nonperforming loan ratio | 0.43 | 0.38 | 0.42 | ||
| Nonperforming assets to total assets | 0.28 | 0.26 | 0.26 | ||
| Allowance for credit losses to total loans | 1.25 | 1.25 | 1.41 | ||
| Nonperforming loan coverage ratio | 292 | 324 | 334 | ||
| Capital Ratios | |||||
| Equity to assets | 12.00% | 12.11% | 11.98% | ||
| Tangible common equity (TCE) ratio 1 | 7.22 | 7.25 | 7.03 | ||
| Common equity tier 1 (CET1) ratio | 11.92 | 11.87 | 12.10 | ||
| Total risk-based capital ratio | 14.17 | 14.47 | 14.83 | ||
| Liquidity ($ in millions) | |||||
| Loan to deposit ratio | 74.85% | 73.74% | 68.57% | ||
| Borrowed funds to total liabilities | 7.49% | 6.32% | 6.83% | ||
| Uninsured deposits | $ 4,817 | $ 5,268 | $6,516 | ||
| Additional liquidity sources | $11,096 | $10,780 | $7,808 | ||
| Coverage ratio of uninsured deposits | 2.3x | 2.0x | 1.2x | ||
| Performance Measures (in millions) | |||||
| Total revenue | $208.2 | $223.7 | $225.3 | ||
| Pre-provision net revenue1 | 68.9 | 80.4 | 68.6 | ||
| Adjusted pre-provision net revenue1 | 72.6 | 82.8 | 89.9 | ||
| Provision for credit losses on loans | 0.1 | 10.9 | 33.9 | ||
| Provision for credit losses on securities | - | 13.3 | - | ||
| Noninterest income | 45.0 | 45.8 | 40.2 | ||
| Noninterest expense | 139.7 | 143.2 | 156.8 |
P.O. BOX 7009 501 MAIN STREET PINE BLUFF, ARKANSAS 71611-7009 (870) 541-1000 www.simmonsbank.com
Simmons First National Corporation (NASDAQ: SFNC) (Simmons or Company) today reported net income of $58.3 million for the second quarter of 2023, compared to $45.6 million in the first quarter of 2023 and $27.5 million in the second quarter of 2022. Diluted earnings per share were $0.46 for the second quarter of 2023, compared to $0.36 in the first quarter of 2023 and $0.21 in the second quarter of 2022. Adjusted earnings1 for the second quarter of 2023 were $61.1 million, compared to $47.3 million in the first quarter of 2023 and $68.1 million in the second quarter of 2022. A summary of certain items, consisting primarily of merger related costs, branch right-sizing costs and early retirement program costs are described in the “Reconciliation of Non-GAAP Financial Measures” tables below.
Net Interest Income
Net interest income for the second quarter of 2023 totaled $163.2 million, compared to $177.8 million in the first quarter of 2023 and $185.1 million for the second quarter of 2022. Included in net interest income is accretion recognized on assets acquired, which totaled $2.3 million in the second quarter of 2023, $2.6 million in the first quarter of 2023 and $9.9 million in the second quarter of 2022. On a linked quarter basis, interest income increased $18.1 million, while interest expense increased $32.7 million reflecting the competitive interest rate environment and resulting pricing measures to defend the core deposit base, continued customer migration to higher rate deposit products and a strategic decision to utilize short-term borrowings to elevate our liquidity position given the macroeconomic environment and the debt ceiling debate. On April 1, 2023, approximately $330.0 million of the Company’s outstanding subordinated debt converted from fixed rate to floating rate, resulting in a $2.1 million increase in interest expense during the quarter.
The yield on loans for the second quarter of 2023 was 5.89 percent, compared to 5.67 percent in the first quarter of 2023 and 4.54 percent in the second quarter of 2022. The yield on investment securities for the second quarter of 2023 was 2.91 percent, compared to 2.92 percent in the first quarter of 2023 and 2.08 percent in the second quarter of 2022. Cost of deposits for the second quarter of 2023 was 1.96 percent, compared to 1.58 percent in the first quarter of 2023 and 0.18 percent in the second quarter of 2022. The increase in the cost of deposits reflected the dramatic increase in interest rates, customer migration to higher rate deposit products and increased competition for deposits. The net interest margin on a fully taxable equivalent basis for the second quarter of 2023 was 2.76 percent, compared to 3.09 percent in the first quarter of 2023 and 3.24 percent in the second quarter of 2022.
| Q2 23 | Q1 23 | Q4 22 | Q3 22 | Q2 22 | ||||||||||||||||
| Loan yield (FTE)2 | 5.89 | % | 5.67 | % | 5.40 | % | 4.86 | % | 4.54 | % | ||||||||||
| Investment securities yield (FTE)2 | 2.91 | 2.92 | 2.68 | 2.29 | 2.08 | |||||||||||||||
| Cost of interest bearing deposits | 2.57 | 2.10 | 1.41 | 0.65 | 0.25 | |||||||||||||||
| Cost of deposits | 1.96 | 1.58 | 1.02 | 0.47 | 0.18 | |||||||||||||||
| Cost of borrowed funds | 5.31 | 4.29 | 3.92 | 2.66 | 2.13 | |||||||||||||||
| Net interest spread (FTE)2 | 2.10 | 2.52 | 2.87 | 3.11 | 3.11 | |||||||||||||||
| Net interest margin (FTE)2 | 2.76 | 3.09 | 3.31 | 3.34 | 3.24 | |||||||||||||||
Noninterest Income
Noninterest income for the second quarter of 2023 was $45.0 million, compared to $45.8 million in the first quarter of 2023 and $40.2 million in the second quarter of 2022. Included in first quarter 2023 results is a $4.0 million legal reserve recapture associated with previously disclosed legal matters. On a linked quarter and year-over-year basis, most fee-based businesses posted positive gains, led by service charges on deposits accounts, wealth management fees and mortgage lending income, offset in part by a decline in bank owned life insurance. Other noninterest income increased on a year-over year basis, primarily as a result of fair value adjustments associated with certain equity investments and death benefits from bank owned life insurance.
|
Noninterest Income $ in millions |
Q2 23 | Q1 23 | Q4 22 | Q3 22 | Q2 22 | |||||||||||||||
| Service charges on deposit accounts | $ | 12.9 | $ | 12.4 | $ | 11.9 | $ | 12.6 | $ | 11.4 | ||||||||||
| Wealth management fees | 7.4 | 7.4 | 8.2 | 8.6 | 7.2 | |||||||||||||||
| Debit and credit card fees | 8.0 | 8.0 | 7.8 | 7.7 | 8.2 | |||||||||||||||
| Mortgage lending income | 2.4 | 1.6 | 1.1 | 2.6 | 2.2 | |||||||||||||||
| Other service charges and fees | 2.3 | 2.3 | 2.0 | 2.1 | 1.9 | |||||||||||||||
| Bank owned life insurance | 2.6 | 3.0 | 3.0 | 2.9 | 2.6 | |||||||||||||||
| Gain (loss) on sale of securities | (0.4 | ) | - | (0.1 | ) | - | (0.2 | ) | ||||||||||||
| Gain on insurance settlement | - | - | 4.1 | - | - | |||||||||||||||
| Other income | 9.8 | 11.3 | 6.6 | 6.7 | 6.8 | |||||||||||||||
| Adjusted other income1 | 9.8 | 11.3 | 6.6 | 6.3 | 6.9 | |||||||||||||||
Noninterest Expense
Noninterest expense for the second quarter of 2023 was $139.7 million, compared to $143.2 million in the first quarter of 2023 and $156.8 million in the second quarter of 2022. Included in noninterest expense are certain items consisting primarily of merger related costs, branch right sizing costs and early retirement program costs, totaling $3.7 million in the second quarter of 2023, $2.4 million in the first quarter of 2023 and $21.2 million in the second quarter of 2022. Excluding these items (which are described in the “Reconciliation of Non-GAAP Financial Measures” tables below), adjusted noninterest expense1 was $136.0 million in the second quarter of 2023, $140.9 million in the first quarter of 2023 and $135.7 million in the second quarter of 2022. The decrease in adjusted noninterest expense on a linked quarter basis was primarily attributable to successful execution of our Better Bank Initiative as well as a $3.0 million incentive accrual adjustment recorded in the second quarter of 2023.
|
Noninterest Expense $ in millions |
Q2 23 | Q1 23 | Q4 22 | Q3 22 | Q2 22 | |||||||||||||||
| Salaries and employee benefits | $ | 74.7 | $ | 77.0 | $ | 73.0 | $ | 71.9 | $ | 74.1 | ||||||||||
| Occupancy expense, net | 11.4 | 11.6 | 11.6 | 11.7 | 11.0 | |||||||||||||||
| Furniture and equipment | 5.1 | 5.1 | 5.4 | 5.4 | 5.1 | |||||||||||||||
| Deposit insurance | 5.2 | 4.9 | 3.7 | 3.3 | 2.8 | |||||||||||||||
| Other real estate and foreclosure expense | 0.3 | 0.2 | 0.4 | 0.2 | 0.1 | |||||||||||||||
| Merger related costs | - | 1.4 | - | 1.4 | 19.1 | |||||||||||||||
| Other operating expenses | 42.9 | 43.1 | 48.5 | 45.1 | 44.5 | |||||||||||||||
| Adjusted salaries and employee benefits1 | 71.1 | 77.0 | 73.0 | 71.9 | 74.1 | |||||||||||||||
| Adjusted other operating expenses1 | 43.0 | 42.3 | 47.5 | 44.1 | 42.7 | |||||||||||||||
| Efficiency ratio | 65.18 | % | 62.28 | % | 58.33 | % | 57.22 | % | 67.77 | % | ||||||||||
| Adjusted efficiency ratio1 | 61.29 | % | 59.38 | % | 56.97 | % | 54.41 | % | 56.74 | % | ||||||||||
Loans and Unfunded Loan Commitments
Total loans at the end of the second quarter of 2023 were $16.8 billion, an increase of $279 million, or 2 percent, compared to $16.6 billion at the end of the first quarter of 2023. On a year-over-year basis, total loans were up $1.7 billion, or 11 percent. While loan growth has moderated as expected, the increase in total loans on a linked quarter basis was broad-based, both in terms of industry type and geographic market. Unfunded commitments at the end of the second quarter of 2023 were $4.4 million, compared to $4.7 billion at the end of the first quarter of 2023 and $4.5 billion at the end of the second quarter of 2022. While unfunded commitments are considered a key indicator of future loan growth, the rapid increase in interest rates, coupled with softer economic conditions, have resulted in lower activity in our commercial loan pipeline. Commercial loans approved and ready to close at the end of the second quarter of 2023 totaled $274 million, and the rate on ready to close commercial loans was 7.94 percent, up 62 basis points on a linked quarter basis.
| $ in millions | Q2 23 | Q1 23 | Q4 22 | Q3 22 | Q2 22 | |||||||||||||||
| Total loans | $ | 16,834 | $ | 16,555 | $ | 16,142 | $ | 15,607 | $ | 15,110 | ||||||||||
| Unfunded loan commitments | $ | 4,443 | $ | 4,725 | $ | 5,000 | $ | 5,138 | $ | 4,473 | ||||||||||
Deposits
Total deposits at the end of the second quarter of 2023 were $22.5 billion, up slightly from the end of the first quarter of 2023, and up $453 million compared to the second quarter of 2022. Noninterest bearing deposits totaled $5.3 billion at the end of the second quarter of 2023, compared to $5.5 billion at the end of the first quarter of 2023 and $6.1 billion at the end of the second quarter of 2022. Interest bearing transaction accounts totaled $10.9 billion at the end of the second quarter of 2023, compared to $11.3 billion at the end of the first quarter of 2023 and $12.8 billion at the end of the second quarter of 2022. Time deposits totaled $6.4 billion at the end of the second quarter of 2023, compared to $5.7 billion at the end of the first quarter of 2023 and $3.2 billion at the end of the second quarter of 2022. The change in mix of deposits, both on a linked quarter and year-over-year basis, reflects continued customer migration into higher rate deposits, principally certificates of deposits, given the rapid rise in interest rates, as well as increased market competition. The loan to deposit ratio ended the second quarter of 2023 at 75 percent, compared to 74 percent at the end of the first quarter of 2023 and 69 percent at the end of the second quarter of 2022.
| $ in millions | Q2 23 | Q1 23 | Q4 22 | Q3 22 | Q2 22 | |||||||||||||||
| Noninterest bearing deposits | $ | 5,265 | $ | 5,489 | $ | 6,017 | $ | 6,218 | $ | 6,057 | ||||||||||
| Interest bearing transaction accounts | 10,866 | 11,284 | 11,763 | 12,104 | 12,816 | |||||||||||||||
| Time deposits | 6,358 | 5,679 | 4,768 | 3,827 | 3,163 | |||||||||||||||
| Total deposits | $ | 22,489 | $ | 22,452 | $ | 22,548 | $ | 22,149 | $ | 22,036 | ||||||||||
| Noninterest bearing deposits to total deposits | 23 | % | 24 | % | 27 | % | 28 | % | 27 | % | ||||||||||
| Total loans to total deposits | 75 | 74 | 72 | 70 | 69 | |||||||||||||||
Asset Quality
Total nonperforming loans at the end of the second quarter of 2023 were $72.0 million, compared to $63.7 million at the end of the first quarter of 2023 and $63.6 million at the end of the second quarter of 2022. Total nonperforming assets as a percentage of total assets were 0.28 percent at the end of the second quarter of 2023, compared to 0.26 percent at the end of both the first quarter of 2023 and the second quarter of 2022. The increase in nonperforming assets on a linked quarter basis was primarily due to a single, commercial relationship totaling $9.6 million, offset, in part, by a $2.8 million decrease in other nonperforming assets. Shortly after the end of the quarter, an initial payment of $2.9 million was received on the commercial relationship previously noted. Net charge-offs as a percentage of average loans for the second quarter of 2023 were 4 basis points, compared to 3 basis points in the first quarter of 2023 and 2 basis points in the second quarter of 2022. Net charge-offs as a percentage of average total loans, excluding credit cards, were 1 basis point for the second quarter of 2023.
Provision for credit losses totaled $0.1 million in the second quarter of 2023, compared to $33.9 million in the second quarter of 2022. Included in the year ago period was $30.3 million of Day 2 CECL provision recorded in connection with the Company’s acquisition of Spirt of Texas Bancshares, Inc. The allowance for credit losses on loans at the end of the second quarter of 2023 was $210.0 million compared to $206.6 million at the end of the first quarter of 2023 and $212.6 million at the end of the second quarter of 2022. The allowance for credit losses as a percentage of total loans at the end of the second quarter of 2023 was 1.25 percent, unchanged on a linked quarter basis. The nonperforming loan coverage ratio ended the quarter at 292 percent, compared to 324 percent at the end of the first quarter of 2023 and 334 percent at the end of the second quarter of 2022. The reserve for unfunded commitments totaled $36.9 million at the end of the second quarter of 2023, compared to $41.9 million at the end of the first quarter of 2023 and $25.9 million at the end of the second quarter of 2022. The decrease in the reserve for unfunded commitments on a linked quarter basis was primarily due to a decline in unfunded commitments resulting from customers utilizing lines of credit.
| $ in millions | Q2 23 | Q1 23 | Q4 22 | Q3 22 | Q2 22 | |||||||||||||||
| Allowance for credit losses on loans to total loans | 1.25 | % | 1.25 | % | 1.22 | % | 1.27 | % | 1.41 | % | ||||||||||
| Allowance for credit losses on loans to nonperforming loans | 292 | 324 | 334 | 342 | 334 | |||||||||||||||
| Nonperforming loans to total loans | 0.43 | 0.38 | 0.37 | 0.37 | 0.42 | |||||||||||||||
| Net charge-off ratio (annualized) | 0.04 | 0.03 | 0.13 | - | 0.02 | |||||||||||||||
| Net charge-off ratio YTD (annualized) | 0.04 | 0.03 | 0.09 | 0.07 | 0.11 | |||||||||||||||
| Total nonperforming loans | $ | 72.0 | $ | 63.7 | $ | 58.9 | $ | 57.8 | $ | 63.6 | ||||||||||
| Total other nonperforming assets | 4.9 | 7.7 | 3.6 | 4.7 | 6.4 | |||||||||||||||
| Total nonperforming assets | $ | 76.9 | $ | 71.4 | $ | 62.5 | $ | 62.5 | $ | 70.0 | ||||||||||
| Reserve for unfunded commitments | $ | 36.9 | $ | 41.9 | $ | 41.9 | $ | 41.9 | $ | 25.9 | ||||||||||
Capital
Total common stockholders’ equity at the end of the second quarter of 2023 was $3.4 billion, compared to $3.3 billion at the end of both the first quarter of 2023 and the second quarter of 2022. Book value per share at the end of the second quarter of 2023 was $26.59, compared to $26.24 at the end of the first quarter of 2023 and $25.31 at the end of the second quarter of 2022. Tangible book value per share1 was $15.17 at the end of the second quarter of 2023, compared to $14.88 per share at the end of the first quarter of 2023 and $14.07 at the end of the second quarter of 2022. Stockholders’ equity to total assets at June 30, 2023, was 12.0 percent, compared to 12.1 percent at the end of the first quarter of 2023 and unchanged from the levels reported at the end of the second quarter of 2022. Tangible common equity to tangible assets1 was 7.2 percent at June 30, 2023, compared to 7.3 percent at the end of the first quarter of 2023 and 7.0 percent at the end of the second quarter of 2022. All of Simmons’ regulatory capital ratios continue to significantly exceed “well capitalized” guidelines.
| Q2 23 | Q1 23 | Q4 22 | Q3 22 | Q2 22 | ||||||||||||||||
| Stockholders’ equity to total assets | 12.0 | % | 12.1 | % | 11.9 | % | 11.7 | % | 12.0 | % | ||||||||||
| Tangible common equity to tangible assets1 | 7.2 | 7.3 | 7.0 | 6.7 | 7.0 | |||||||||||||||
| Common equity tier 1 (CET1) ratio | 11.9 | 11.9 | 11.9 | 11.7 | 12.1 | |||||||||||||||
| Tier 1 leverage ratio | 9.2 | 9.2 | 9.3 | 9.2 | 9.2 | |||||||||||||||
| Tier 1 risk-based capital ratio | 11.9 | 11.9 | 11.9 | 11.7 | 12.1 | |||||||||||||||
| Total risk-based capital ratio | 14.2 | 14.5 | 14.2 | 14.1 | 14.8 | |||||||||||||||
Share Repurchase Program
During the second quarter of 2023, Simmons repurchased approximately 1.1 million shares of its Class A common stock at an average price of $17.75 under its 2022 stock repurchase program (2022 Program). Remaining authorization under the 2022 Program as of June 30, 2023, was approximately $60 million. Market conditions and our capital needs will drive the decision regarding future stock repurchases; the timing, pricing and amount of any repurchases under the 2022 Program will be determined by Simmons’ management at its discretion; and the 2022 Program does not obligate Simmons to repurchase any common stock and may be modified, discontinued or suspended at any time without prior notice.
__________________________________________________________
(1) Non-GAAP measurement. See “Non-GAAP Financial Measures” and “Reconciliation of Non-GAAP Financial Measures” below
(2) FTE – fully taxable equivalent using an effective tax rate of 26.135%
Conference Call
Management will conduct a live conference call to review this information beginning at 9:00 a.m. Central Time today, Tuesday, July 25, 2023. Interested persons can listen to this call by dialing toll-free 1-844-481-2779 (North America only) and asking for the Simmons First National Corporation conference call, conference ID 10180510. In addition, the call will be available live or in recorded version on Simmons’ website at simmonsbank.com for at least 60 days following the date of the call.
Simmons First National Corporation
Simmons First National Corporation (NASDAQ: SFNC) is a Mid-South based financial holding company that has paid cash dividends to its shareholders for 114 consecutive years. Its principal subsidiary, Simmons Bank, operates 231 branches in Arkansas, Kansas, Missouri, Oklahoma, Tennessee and Texas. Founded in 1903, Simmons Bank offers comprehensive financial solutions delivered with a client-centric approach. In 2023, Simmons Bank was recognized by Forbes as one of America’s Best Midsize Employers and among the World’s Best Banks for the fourth consecutive year. In 2022, Simmons Bank was named to Forbes’ list of "America's Best Banks" for the second consecutive year. Additional information about Simmons Bank can be found on our website at simmonsbank.com, by following @Simmons_Bank on Twitter or by visiting our newsroom.
Non-GAAP Financial Measures
This press release contains financial information determined by methods other than in accordance with U.S. generally accepted accounting principles (GAAP). The Company’s management uses these non-GAAP financial measures in their analysis of the Company’s performance. These measures adjust GAAP performance measures to, among other things, include the tax benefit associated with revenue items that are tax-exempt, as well as exclude from net income (including on a per share diluted basis), pre-tax, pre-provision earnings, net charge-offs, income available to common shareholders, non-interest income, and non-interest expense certain income and expense items attributable to, for example, merger activity (primarily including merger-related expenses and Day 2 CECL provisions), gains and/or losses on sale of branches, net branch right-sizing initiatives, loss on redemption of trust preferred securities and gain on sale of intellectual property. In addition, the Company also presents certain figures based on tangible common stockholders’ equity, tangible assets and tangible book value, which exclude goodwill and other intangible assets. The Company further presents certain figures that are exclusive of the impact of PPP loans, deposits and/or loans acquired through acquisitions, mortgage warehouse loans, and/or energy loans, or gains and/or losses on the sale of securities. The Company’s management believes that these non-GAAP financial measures are useful to investors because they, among other things, present the results of the Company’s ongoing operations without the effect of mergers or other items not central to the Company’s ongoing business, as well as normalize for tax effects, the effects of the PPP, and certain other effects. Management, therefore, believes presentations of these non-GAAP financial measures provide useful supplemental information that is essential to a proper understanding of the operating results of the Company’s ongoing businesses, and management uses these non-GAAP financial measures to assess the performance of the Company’s ongoing businesses as related to prior financial periods. These non-GAAP disclosures should not be viewed as a substitute for operating results determined in accordance with GAAP, nor are they necessarily comparable to non-GAAP performance measures that may be presented by other companies. Where non-GAAP financial measures are used, the comparable GAAP financial measure, as well as the reconciliation to the comparable GAAP financial measure, can be found in the tables of this release.
Forward-Looking Statements
Certain statements in this press release may not be based on historical facts and should be considered “forward-looking statements” within the meaning of the Private Securities Litigation Reform Act of 1995. These forward-looking statements, including, without limitation, statements made in Mr. Fehlman’s quote, may be identified by reference to future periods or by the use of forward-looking terminology, such as “believe,” “budget,” “expect,” “foresee,” “anticipate,” “intend,” “indicate,” “target,” “estimate,” “plan,” “project,” “continue,” “contemplate,” “positions,” “prospects,” “predict,” or “potential,” by future conditional verbs such as “will,” “would,” “should,” “could,” “might” or “may,” or by variations of such words or by similar expressions. These forward-looking statements include, without limitation, statements relating to Simmons’ future growth, business strategies, lending capacity and lending activity, loan demand, revenue, assets, asset quality, profitability, dividends, net interest margin, non-interest revenue, share repurchase program, acquisition strategy, digital banking initiatives, the Company’s ability to recruit and retain key employees, the estimated cost savings associated with the Company’s Better Bank Initiative, the adequacy of the allowance for credit losses, and future economic conditions and interest rates. Any forward-looking statement speaks only as of the date of this news release, and Simmons undertakes no obligation to update these forward-looking statements to reflect events or circumstances that occur after the date of this news release. By nature, forward-looking statements are based on various assumptions and involve inherent risk and uncertainties. Various factors, including, but not limited to, changes in economic conditions, changes in credit quality, changes in interest rates and related governmental policies, changes in loan demand, changes in deposit flows, changes in real estate values, changes in the assumptions used in making the forward-looking statements, changes in the securities markets generally or the price of Simmons’ common stock specifically, and changes in information technology affecting the financial industry; changes in customer behaviors, including consumer spending, borrowing, and saving habits; the effects of the COVID-19 pandemic on, among other things, the Company’s operations, liquidity, and credit quality; general economic and market conditions; market disruptions including pandemics or significant health hazards, severe weather conditions, natural disasters, terrorist activities, financial crises, political crises, war and other military conflicts (including the ongoing military conflict between Russia and Ukraine) or other major events, or the prospect of these events; the soundness of other financial institutions and indirect exposure related to the closings of Silicon Valley Bank (SVB), Signature Bank and Silvergate Bank and their impact on the broader market through other customers, suppliers and partners (or that the conditions which resulted in the liquidity concerns with SVB, Signature Bank and Silvergate Bank may also adversely impact, directly or indirectly, other financial institutions and market participants with which the Company has commercial or deposit relationships); increased inflation; the loss of key employees; increased competition in the markets in which the Company operates; increased unemployment; labor shortages; claims, damages, and fines related to litigation or government actions; changes in accounting principles relating to loan loss recognition (current expected credit losses); the Company’s ability to manage and successfully integrate its mergers and acquisitions and to fully realize cost savings and other benefits associated with those transactions; cyber threats, attacks or events; reliance on third parties for key services; government legislation; and other factors, many of which are beyond the control of the Company, could cause actual results to differ materially from those projected in or contemplated by the forward-looking statements. Additional information on factors that might affect the Company’s financial results is included in the Company’s Form 10-K for the year ended December 31, 2022, the Company’s Form 10-Q for the quarterly period ended March 31, 2023, and other reports that the Company has filed with or furnished to the U.S. Securities and Exchange Commission (the SEC), all of which are available from the SEC on its website, www.sec.gov. In addition, there can be no guarantee that the board of directors (Board) of Simmons will approve a quarterly dividend in future quarters, and the timing, payment, and amount of future dividends (if any) is subject to, among other things, the discretion of the Board and may differ significantly from past dividends.
FOR MORE INFORMATION CONTACT:
Ed Bilek, EVP, Director of Investor and Media Relations
ed.bilek@simmonsbank.com
205.612.3378 (cell)
| Simmons First National Corporation | SFNC | |||||||||||||||||||
| Consolidated End of Period Balance Sheets | ||||||||||||||||||||
| For the Quarters Ended | Jun 30 | Mar 31 | Dec 31 | Sep 30 | Jun 30 | |||||||||||||||
| (Unaudited) | 2023 | 2023 | 2022 | 2022 | 2022 | |||||||||||||||
| ($ in thousands) | ||||||||||||||||||||
| ASSETS | ||||||||||||||||||||
| Cash and noninterest bearing balances due from banks | $ | 181,268 | $ | 199,316 | $ | 200,616 | $ | 175,547 | $ | 193,473 | ||||||||||
| Interest bearing balances due from banks and federal funds sold | 564,644 | 325,135 | 481,506 | 503,863 | 771,374 | |||||||||||||||
| Cash and cash equivalents | 745,912 | 524,451 | 682,122 | 679,410 | 964,847 | |||||||||||||||
| Interest bearing balances due from banks - time | 545 | 795 | 795 | 1,290 | 1,535 | |||||||||||||||
| Investment securities - held-to-maturity | 3,756,754 | 3,765,483 | 3,759,706 | 3,787,076 | 3,819,682 | |||||||||||||||
| Investment securities - available-for-sale | 3,579,758 | 3,755,956 | 3,852,854 | 3,937,543 | 4,341,647 | |||||||||||||||
| Mortgage loans held for sale | 10,342 | 4,244 | 3,486 | 12,759 | 14,437 | |||||||||||||||
| Other loans held for sale | - | - | - | 2,292 | 16,375 | |||||||||||||||
| Loans: | ||||||||||||||||||||
| Loans | 16,833,653 | 16,555,098 | 16,142,124 | 15,607,135 | 15,110,344 | |||||||||||||||
| Allowance for credit losses on loans | (209,966 | ) | (206,557 | ) | (196,955 | ) | (197,589 | ) | (212,611 | ) | ||||||||||
| Net loans | 16,623,687 | 16,348,541 | 15,945,169 | 15,409,546 | 14,897,733 | |||||||||||||||
| Premises and equipment | 562,025 | 564,497 | 548,741 | 549,932 | 553,062 | |||||||||||||||
| Foreclosed assets and other real estate owned | 3,909 | 2,721 | 2,887 | 3,612 | 4,084 | |||||||||||||||
| Interest receivable | 103,431 | 98,775 | 102,892 | 86,637 | 82,332 | |||||||||||||||
| Bank owned life insurance | 494,370 | 493,191 | 491,340 | 488,364 | 486,355 | |||||||||||||||
| Goodwill | 1,320,799 | 1,320,799 | 1,319,598 | 1,309,000 | 1,310,528 | |||||||||||||||
| Other intangible assets | 120,758 | 124,854 | 128,951 | 133,059 | 137,285 | |||||||||||||||
| Other assets | 636,833 | 579,139 | 622,520 | 675,554 | 588,707 | |||||||||||||||
| Total assets | $ | 27,959,123 | $ | 27,583,446 | $ | 27,461,061 | $ | 27,076,074 | $ | 27,218,609 | ||||||||||
| LIABILITIES AND STOCKHOLDERS' EQUITY | ||||||||||||||||||||
| Deposits: | ||||||||||||||||||||
| Noninterest bearing transaction accounts | $ | 5,264,962 | $ | 5,489,434 | $ | 6,016,651 | $ | 6,218,283 | $ | 6,057,186 | ||||||||||
| Interest bearing transaction accounts and savings deposits | 10,866,078 | 11,283,584 | 11,762,885 | 12,103,994 | 12,816,198 | |||||||||||||||
| Time deposits | 6,357,682 | 5,678,757 | 4,768,558 | 3,826,415 | 3,162,479 | |||||||||||||||
| Total deposits | 22,488,722 | 22,451,775 | 22,548,094 | 22,148,692 | 22,035,863 | |||||||||||||||
| Federal funds purchased and securities sold | ||||||||||||||||||||
| under agreements to repurchase | 102,586 | 142,862 | 160,403 | 168,513 | 155,101 | |||||||||||||||
| Other borrowings | 1,373,339 | 1,023,826 | 859,296 | 964,772 | 1,060,244 | |||||||||||||||
| Subordinated notes and debentures | 366,065 | 366,027 | 365,989 | 365,951 | 421,693 | |||||||||||||||
| Accrued interest and other liabilities | 272,085 | 259,055 | 257,917 | 270,995 | 285,813 | |||||||||||||||
| Total liabilities | 24,602,797 | 24,243,545 | 24,191,699 | 23,918,923 | 23,958,714 | |||||||||||||||
| Stockholders' equity: | ||||||||||||||||||||
| Common stock | 1,262 | 1,273 | 1,270 | 1,269 | 1,288 | |||||||||||||||
| Surplus | 2,516,398 | 2,533,589 | 2,530,066 | 2,527,153 | 2,569,060 | |||||||||||||||
| Undivided profits | 1,308,654 | 1,275,720 | 1,255,586 | 1,196,459 | 1,139,975 | |||||||||||||||
| Accumulated other comprehensive (loss) income | (469,988 | ) | (470,681 | ) | (517,560 | ) | (567,730 | ) | (450,428 | ) | ||||||||||
| Total stockholders' equity | 3,356,326 | 3,339,901 | 3,269,362 | 3,157,151 | 3,259,895 | |||||||||||||||
| Total liabilities and stockholders' equity | $ | 27,959,123 | $ | 27,583,446 | $ | 27,461,061 | $ | 27,076,074 | $ | 27,218,609 | ||||||||||
Page 1
| Simmons First National Corporation | SFNC | |||||||||||||||||||
| Consolidated Statements of Income - Quarter-to-Date | ||||||||||||||||||||
| For the Quarters Ended | Jun 30 | Mar 31 | Dec 31 | Sep 30 | Jun 30 | |||||||||||||||
| (Unaudited) | 2023 | 2023 | 2022 | 2022 | 2022 | |||||||||||||||
| ($ in thousands, except per share data) | ||||||||||||||||||||
| INTEREST INCOME | ||||||||||||||||||||
| Loans (including fees) | $ | 244,292 | $ | 227,498 | $ | 216,091 | $ | 187,347 | $ | 163,578 | ||||||||||
| Interest bearing balances due from banks and federal funds sold | 4,023 | 2,783 | 2,593 | 1,141 | 1,117 | |||||||||||||||
| Investment securities | 48,751 | 48,774 | 45,689 | 40,954 | 37,848 | |||||||||||||||
| Mortgage loans held for sale | 154 | 82 | 152 | 178 | 200 | |||||||||||||||
| Other loans held for sale | - | - | 59 | 998 | 2,063 | |||||||||||||||
| TOTAL INTEREST INCOME | 297,220 | 279,137 | 264,584 | 230,618 | 204,806 | |||||||||||||||
| INTEREST EXPENSE | ||||||||||||||||||||
| Time deposits | 53,879 | 39,538 | 22,434 | 8,204 | 2,875 | |||||||||||||||
| Other deposits | 54,485 | 47,990 | 34,615 | 17,225 | 6,879 | |||||||||||||||
| Federal funds purchased and securities | ||||||||||||||||||||
| sold under agreements to repurchase | 318 | 323 | 449 | 305 | 119 | |||||||||||||||
| Other borrowings | 18,612 | 8,848 | 9,263 | 6,048 | 4,844 | |||||||||||||||
| Subordinated notes and debentures | 6,696 | 4,603 | 4,797 | 5,251 | 4,990 | |||||||||||||||
| TOTAL INTEREST EXPENSE | 133,990 | 101,302 | 71,558 | 37,033 | 19,707 | |||||||||||||||
| NET INTEREST INCOME | 163,230 | 177,835 | 193,026 | 193,585 | 185,099 | |||||||||||||||
| PROVISION FOR CREDIT LOSSES | ||||||||||||||||||||
| Provision for credit losses on loans | 5,061 | 10,916 | 26 | (15,897 | ) | 30,406 | ||||||||||||||
| Provision for credit losses on unfunded commitments | (5,000 | ) | - | - | 16,000 | 3,453 | ||||||||||||||
| Provision for credit losses on investment securities - AFS | (1,326 | ) | 12,800 | - | - | - | ||||||||||||||
| Provision for credit losses on investment securities - HTM | 1,326 | 500 | - | - | - | |||||||||||||||
| TOTAL PROVISION FOR CREDIT LOSSES | 61 | 24,216 | 26 | 103 | 33,859 | |||||||||||||||
| NET INTEREST INCOME AFTER PROVISION | ||||||||||||||||||||
| FOR CREDIT LOSSES | 163,169 | 153,619 | 193,000 | 193,482 | 151,240 | |||||||||||||||
| NONINTEREST INCOME | ||||||||||||||||||||
| Service charges on deposit accounts | 12,882 | 12,437 | 11,892 | 12,560 | 11,379 | |||||||||||||||
| Debit and credit card fees | 7,986 | 7,952 | 7,845 | 7,685 | 8,224 | |||||||||||||||
| Wealth management fees | 7,440 | 7,365 | 8,151 | 8,562 | 7,214 | |||||||||||||||
| Mortgage lending income | 2,403 | 1,570 | 1,139 | 2,593 | 2,240 | |||||||||||||||
| Bank owned life insurance income | 2,555 | 2,973 | 2,975 | 2,902 | 2,563 | |||||||||||||||
| Other service charges and fees (includes insurance income) | 2,262 | 2,282 | 2,023 | 2,085 | 1,871 | |||||||||||||||
| Gain (loss) on sale of securities | (391 | ) | - | (52 | ) | (22 | ) | (150 | ) | |||||||||||
| Gain on insurance settlement | - | - | 4,074 | - | - | |||||||||||||||
| Other income | 9,843 | 11,256 | 6,600 | 6,658 | 6,837 | |||||||||||||||
| TOTAL NONINTEREST INCOME | 44,980 | 45,835 | 44,647 | 43,023 | 40,178 | |||||||||||||||
| NONINTEREST EXPENSE | ||||||||||||||||||||
| Salaries and employee benefits | 74,723 | 77,038 | 73,018 | 71,923 | 74,135 | |||||||||||||||
| Occupancy expense, net | 11,410 | 11,578 | 11,620 | 11,674 | 11,004 | |||||||||||||||
| Furniture and equipment expense | 5,128 | 5,051 | 5,392 | 5,394 | 5,104 | |||||||||||||||
| Other real estate and foreclosure expense | 289 | 186 | 350 | 168 | 142 | |||||||||||||||
| Deposit insurance | 5,201 | 4,893 | 3,680 | 3,278 | 2,812 | |||||||||||||||
| Merger-related costs | 19 | 1,396 | 35 | 1,422 | 19,133 | |||||||||||||||
| Other operating expenses | 42,926 | 43,086 | 48,480 | 45,084 | 44,483 | |||||||||||||||
| TOTAL NONINTEREST EXPENSE | 139,696 | 143,228 | 142,575 | 138,943 | 156,813 | |||||||||||||||
| NET INCOME BEFORE INCOME TAXES | 68,453 | 56,226 | 95,072 | 97,562 | 34,605 | |||||||||||||||
| Provision for income taxes | 10,139 | 10,637 | 11,812 | 16,959 | 7,151 | |||||||||||||||
| NET INCOME | $ | 58,314 | $ | 45,589 | $ | 83,260 | $ | 80,603 | $ | 27,454 | ||||||||||
| BASIC EARNINGS PER SHARE | $ | 0.46 | $ | 0.36 | $ | 0.66 | $ | 0.63 | $ | 0.21 | ||||||||||
| DILUTED EARNINGS PER SHARE | $ | 0.46 | $ | 0.36 | $ | 0.65 | $ | 0.63 | $ | 0.21 | ||||||||||
Page 2
| Simmons First National Corporation | SFNC | |||||||||||||||||||
| Consolidated Risk-Based Capital | ||||||||||||||||||||
| For the Quarters Ended | Jun 30 | Mar 31 | Dec 31 | Sep 30 | Jun 30 | |||||||||||||||
| (Unaudited) | 2023 | 2023 | 2022 | 2022 | 2022 | |||||||||||||||
| ($ in thousands) | ||||||||||||||||||||
| Tier 1 capital | ||||||||||||||||||||
| Stockholders' equity | $ | 3,356,326 | $ | 3,339,901 | $ | 3,269,362 | $ | 3,157,151 | $ | 3,259,895 | ||||||||||
| CECL transition provision (1) | 61,746 | 61,746 | 92,619 | 92,619 | 92,619 | |||||||||||||||
| Disallowed intangible assets, net of deferred tax | (1,406,500 | ) | (1,410,141 | ) | (1,412,667 | ) | (1,416,453 | ) | (1,423,323 | ) | ||||||||||
| Unrealized loss (gain) on AFS securities | 469,988 | 470,681 | 517,560 | 567,730 | 450,428 | |||||||||||||||
| Total Tier 1 capital | 2,481,560 | 2,462,187 | 2,466,874 | 2,401,047 | 2,379,619 | |||||||||||||||
| Tier 2 capital | ||||||||||||||||||||
| Subordinated notes and debentures | 366,065 | 366,027 | 365,989 | 365,951 | 421,693 | |||||||||||||||
| Subordinated debt phase out | (66,000 | ) | - | - | - | - | ||||||||||||||
| Qualifying allowance for loan losses and | ||||||||||||||||||||
| reserve for unfunded commitments | 169,409 | 173,077 | 115,627 | 116,257 | 114,733 | |||||||||||||||
| Total Tier 2 capital | 469,474 | 539,104 | 481,616 | 482,208 | 536,426 | |||||||||||||||
| Total risk-based capital | $ | 2,951,034 | $ | 3,001,291 | $ | 2,948,490 | $ | 2,883,255 | $ | 2,916,045 | ||||||||||
| Risk weighted assets | $ | 20,821,075 | $ | 20,748,605 | $ | 20,738,727 | $ | 20,470,918 | $ | 19,669,149 | ||||||||||
| Adjusted average assets for leverage ratio | $ | 26,896,289 | $ | 26,632,691 | $ | 26,407,061 | $ | 25,986,938 | $ | 25,807,113 | ||||||||||
| Ratios at end of quarter | ||||||||||||||||||||
| Equity to assets | 12.00 | % | 12.11 | % | 11.91 | % | 11.66 | % | 11.98 | % | ||||||||||
| Tangible common equity to tangible assets (2) | 7.22 | % | 7.25 | % | 7.00 | % | 6.69 | % | 7.03 | % | ||||||||||
| Common equity Tier 1 ratio (CET1) | 11.92 | % | 11.87 | % | 11.90 | % | 11.73 | % | 12.10 | % | ||||||||||
| Tier 1 leverage ratio | 9.23 | % | 9.24 | % | 9.34 | % | 9.24 | % | 9.22 | % | ||||||||||
| Tier 1 risk-based capital ratio | 11.92 | % | 11.87 | % | 11.90 | % | 11.73 | % | 12.10 | % | ||||||||||
| Total risk-based capital ratio | 14.17 | % | 14.47 | % | 14.22 | % | 14.08 | % | 14.83 | % | ||||||||||
(1) The Company has elected to use the CECL transition provision allowed for in the year of adopting ASC 326.
(2) Calculations of tangible common equity to tangible assets and the reconciliations to GAAP are included in the schedules accompanying this release.
Page 3
| Simmons First National Corporation | SFNC | |||||||||||||||||||
| Consolidated Investment Securities | ||||||||||||||||||||
| For the Quarters Ended | Jun 30 | Mar 31 | Dec 31 | Sep 30 | Jun 30 | |||||||||||||||
| (Unaudited) | 2023 | 2023 | 2022 | 2022 | 2022 | |||||||||||||||
| ($ in thousands) | ||||||||||||||||||||
| Investment Securities - End of Period | ||||||||||||||||||||
| Held-to-Maturity | ||||||||||||||||||||
| U.S. Government agencies | $ | 451,737 | $ | 451,052 | $ | 448,012 | $ | 447,400 | $ | 446,789 | ||||||||||
| Mortgage-backed securities | 1,193,118 | 1,201,418 | 1,190,781 | 1,214,882 | 1,244,713 | |||||||||||||||
| State and political subdivisions | 1,859,022 | 1,859,970 | 1,860,992 | 1,865,203 | 1,868,924 | |||||||||||||||
| Other securities | 252,877 | 253,043 | 259,921 | 259,591 | 259,256 | |||||||||||||||
| Total held-to-maturity (net of credit losses) | 3,756,754 | 3,765,483 | 3,759,706 | 3,787,076 | 3,819,682 | |||||||||||||||
| Available-for-Sale | ||||||||||||||||||||
| U.S. Treasury | $ | 2,209 | $ | 2,220 | $ | 2,197 | $ | 2,191 | $ | 1,441 | ||||||||||
| U.S. Government agencies | 176,564 | 181,843 | 184,279 | 188,060 | 198,333 | |||||||||||||||
| Mortgage-backed securities | 2,282,328 | 2,433,530 | 2,542,902 | 2,670,348 | 2,963,934 | |||||||||||||||
| State and political subdivisions | 885,505 | 895,896 | 871,074 | 822,509 | 915,255 | |||||||||||||||
| Other securities | 233,152 | 242,467 | 252,402 | 254,435 | 262,684 | |||||||||||||||
| Total available-for-sale (net of credit losses) | 3,579,758 | 3,755,956 | 3,852,854 | 3,937,543 | 4,341,647 | |||||||||||||||
| Total investment securities (net of credit losses) | $ | 7,336,512 | $ | 7,521,439 | $ | 7,612,560 | $ | 7,724,619 | $ | 8,161,329 | ||||||||||
| Fair value - HTM investment securities | $ | 3,094,958 | $ | 3,148,976 | $ | 3,063,233 | $ | 2,984,040 | $ | 3,278,962 | ||||||||||
Page 4
| Simmons First National Corporation | SFNC | |||||||||||||||||||
| Consolidated Loans | ||||||||||||||||||||
| For the Quarters Ended | Jun 30 | Mar 31 | Dec 31 | Sep 30 | Jun 30 | |||||||||||||||
| (Unaudited) | 2023 | 2023 | 2022 | 2022 | 2022 | |||||||||||||||
| ($ in thousands) | ||||||||||||||||||||
| Loan Portfolio - End of Period | ||||||||||||||||||||
| Consumer: | ||||||||||||||||||||
| Credit cards | $ | 209,452 | $ | 188,590 | $ | 196,928 | $ | 192,559 | $ | 189,684 | ||||||||||
| Other consumer | 148,333 | 142,817 | 152,882 | 180,604 | 204,692 | |||||||||||||||
| Total consumer | 357,785 | 331,407 | 349,810 | 373,163 | 394,376 | |||||||||||||||
| Real Estate: | ||||||||||||||||||||
| Construction | 2,930,586 | 2,777,122 | 2,566,649 | 2,372,294 | 2,082,688 | |||||||||||||||
| Single-family residential | 2,633,365 | 2,589,831 | 2,546,115 | 2,467,008 | 2,357,942 | |||||||||||||||
| Other commercial real estate | 7,546,130 | 7,520,964 | 7,468,498 | 7,249,891 | 7,082,055 | |||||||||||||||
| Total real estate | 13,110,081 | 12,887,917 | 12,581,262 | 12,089,193 | 11,522,685 | |||||||||||||||
| Commercial: | ||||||||||||||||||||
| Commercial | 2,569,330 | 2,669,731 | 2,632,290 | 2,525,218 | 2,612,256 | |||||||||||||||
| Agricultural | 280,541 | 220,641 | 205,623 | 263,539 | 218,743 | |||||||||||||||
| Total commercial | 2,849,871 | 2,890,372 | 2,837,913 | 2,788,757 | 2,830,999 | |||||||||||||||
| Other | 515,916 | 445,402 | 373,139 | 356,022 | 362,284 | |||||||||||||||
| Total loans | $ | 16,833,653 | $ | 16,555,098 | $ | 16,142,124 | $ | 15,607,135 | $ | 15,110,344 | ||||||||||
Page 5
| Simmons First National Corporation | SFNC | |||||||||||||||||||
| Consolidated Allowance and Asset Quality | ||||||||||||||||||||
| For the Quarters Ended | Jun 30 | Mar 31 | Dec 31 | Sep 30 | Jun 30 | |||||||||||||||
| (Unaudited) | 2023 | 2023 | 2022 | 2022 | 2022 | |||||||||||||||
| ($ in thousands) | ||||||||||||||||||||
| Allowance for Credit Losses on Loans | ||||||||||||||||||||
| Beginning balance | $ | 206,557 | $ | 196,955 | $ | 197,589 | $ | 212,611 | $ | 178,924 | ||||||||||
| Day 1 PCD allowance from acquisitions: | ||||||||||||||||||||
| Spirit of Texas (04/08/2022) | - | - | 4,523 | 1,057 | 4,043 | |||||||||||||||
| Total Day 1 PCD allowance | - | - | 4,523 | 1,057 | 4,043 | |||||||||||||||
| Loans charged off: | ||||||||||||||||||||
| Credit cards | 1,409 | 1,076 | 1,035 | 903 | 1,004 | |||||||||||||||
| Other consumer | 666 | 456 | 439 | 505 | 518 | |||||||||||||||
| Real estate | 435 | 1,204 | 3,392 | 130 | 115 | |||||||||||||||
| Commercial | 1,225 | 413 | 5,389 | 1,874 | 688 | |||||||||||||||
| Total loans charged off | 3,735 | 3,149 | 10,255 | 3,412 | 2,325 | |||||||||||||||
| Recoveries of loans previously charged off: | ||||||||||||||||||||
| Credit cards | 298 | 234 | 251 | 250 | 249 | |||||||||||||||
| Other consumer | 436 | 240 | 230 | 278 | 302 | |||||||||||||||
| Real estate | 878 | 294 | 4,117 | 1,982 | 391 | |||||||||||||||
| Commercial | 471 | 1,067 | 475 | 720 | 621 | |||||||||||||||
| Total recoveries | 2,083 | 1,835 | 5,073 | 3,230 | 1,563 | |||||||||||||||
| Net loans charged off | 1,652 | 1,314 | 5,182 | 182 | 762 | |||||||||||||||
| Provision for credit losses on loans | 5,061 | 10,916 | 25 | (15,897 | ) | 30,406 | ||||||||||||||
| Balance, end of quarter | $ | 209,966 | $ | 206,557 | $ | 196,955 | $ | 197,589 | $ | 212,611 | ||||||||||
| Nonperforming assets | ||||||||||||||||||||
| Nonperforming loans: | ||||||||||||||||||||
| Nonaccrual loans | $ | 71,279 | $ | 63,218 | $ | 58,434 | $ | 57,534 | $ | 62,670 | ||||||||||
| Loans past due 90 days or more | 738 | 437 | 507 | 242 | 904 | |||||||||||||||
| Total nonperforming loans | 72,017 | 63,655 | 58,941 | 57,776 | 63,574 | |||||||||||||||
| Other nonperforming assets: | ||||||||||||||||||||
| Foreclosed assets and other real estate owned | 3,909 | 2,721 | 2,887 | 3,612 | 4,084 | |||||||||||||||
| Other nonperforming assets | 1,013 | 5,012 | 644 | 1,146 | 2,314 | |||||||||||||||
| Total other nonperforming assets | 4,922 | 7,733 | 3,531 | 4,758 | 6,398 | |||||||||||||||
| Total nonperforming assets | $ | 76,939 | $ | 71,388 | $ | 62,472 | $ | 62,534 | $ | 69,972 | ||||||||||
| Performing FDMs (modifications to borrowers | ||||||||||||||||||||
| experiencing financial difficulty) | $ | 2,996 | $ | 2,183 | $ | 1,849 | $ | 1,869 | $ | 2,655 | ||||||||||
| Ratios | ||||||||||||||||||||
| Allowance for credit losses on loans to total loans | 1.25 | % | 1.25 | % | 1.22 | % | 1.27 | % | 1.41 | % | ||||||||||
| Allowance for credit losses to nonperforming loans | 292 | % | 324 | % | 334 | % | 342 | % | 334 | % | ||||||||||
| Nonperforming loans to total loans | 0.43 | % | 0.38 | % | 0.37 | % | 0.37 | % | 0.42 | % | ||||||||||
| Nonperforming assets (including performing FDMs) | ||||||||||||||||||||
| to total assets | 0.29 | % | 0.27 | % | 0.23 | % | 0.24 | % | 0.27 | % | ||||||||||
| Nonperforming assets to total assets | 0.28 | % | 0.26 | % | 0.23 | % | 0.23 | % | 0.26 | % | ||||||||||
| Annualized net charge offs to average loans (QTD) | 0.04 | % | 0.03 | % | 0.13 | % | 0.00 | % | 0.02 | % | ||||||||||
| Annualized net charge offs to average loans (YTD) | 0.04 | % | 0.03 | % | 0.09 | % | 0.07 | % | 0.11 | % | ||||||||||
| Annualized net credit card charge offs to | ||||||||||||||||||||
| average credit card loans (QTD) | 2.25 | % | 1.69 | % | 1.52 | % | 1.30 | % | 1.55 | % | ||||||||||
Page 6
| Simmons First National Corporation | SFNC | |||||||||||||||||||||||||||||||||||
| Consolidated - Average Balance Sheet and Net Interest Income Analysis | ||||||||||||||||||||||||||||||||||||
| For the Quarters Ended | ||||||||||||||||||||||||||||||||||||
| (Unaudited) | ||||||||||||||||||||||||||||||||||||
| Three Months Ended Jun 2023 |
Three Months Ended Mar 2023 |
Three Months Ended Jun 2022 |
||||||||||||||||||||||||||||||||||
| ($ in thousands) | Average Balance |
Income/ Expense |
Yield/ Rate |
Average Balance |
Income/ Expense |
Yield/ Rate |
Average Balance |
Income/ Expense |
Yield/ Rate |
|||||||||||||||||||||||||||
| ASSETS | ||||||||||||||||||||||||||||||||||||
| Earning assets: | ||||||||||||||||||||||||||||||||||||
| Interest bearing balances due from banks | ||||||||||||||||||||||||||||||||||||
| and federal funds sold | $ | 404,639 | $ | 4,023 | 3.99 | % | $ | 315,307 | $ | 2,783 | 3.58 | % | $ | 777,098 | $ | 1,117 | 0.58 | % | ||||||||||||||||||
| Investment securities - taxable | 4,821,231 | 32,745 | 2.72 | % | 4,930,945 | 32,804 | 2.70 | % | 5,674,470 | 21,794 | 1.54 | % | ||||||||||||||||||||||||
| Investment securities - non-taxable (FTE) | 2,627,192 | 21,253 | 3.24 | % | 2,624,642 | 21,522 | 3.33 | % | 2,725,610 | 21,733 | 3.20 | % | ||||||||||||||||||||||||
| Mortgage loans held for sale | 9,560 | 154 | 6.46 | % | 5,470 | 82 | 6.08 | % | 17,173 | 200 | 4.67 | % | ||||||||||||||||||||||||
| Other loans held for sale | - | - | 0.00 | % | - | - | 0.00 | % | 22,114 | 2,063 | 37.42 | % | ||||||||||||||||||||||||
| Loans - including fees (FTE) | 16,702,403 | 245,151 | 5.89 | % | 16,329,761 | 228,257 | 5.67 | % | 14,478,183 | 163,995 | 4.54 | % | ||||||||||||||||||||||||
| Total interest earning assets (FTE) | 24,565,025 | 303,326 | 4.95 | % | 24,206,125 | 285,448 | 4.78 | % | 23,694,648 | 210,902 | 3.57 | % | ||||||||||||||||||||||||
| Non-earning assets | 3,201,114 | 3,282,607 | 3,074,384 | |||||||||||||||||||||||||||||||||
| Total assets | $ | 27,766,139 | $ | 27,488,732 | $ | 26,769,032 | ||||||||||||||||||||||||||||||
| LIABILITIES AND STOCKHOLDERS' EQUITY | ||||||||||||||||||||||||||||||||||||
| Interest bearing liabilities: | ||||||||||||||||||||||||||||||||||||
| Interest bearing transaction and | ||||||||||||||||||||||||||||||||||||
| savings accounts | $ | 11,011,746 | $ | 54,485 | 1.98 | % | $ | 11,722,591 | $ | 47,990 | 1.66 | % | $ | 12,807,502 | $ | 6,879 | 0.22 | % | ||||||||||||||||||
| Time deposits | 5,911,139 | 53,879 | 3.66 | % | 5,155,055 | 39,538 | 3.11 | % | 2,586,567 | 2,875 | 0.45 | % | ||||||||||||||||||||||||
| Total interest bearing deposits | 16,922,885 | 108,364 | 2.57 | % | 16,877,646 | 87,528 | 2.10 | % | 15,394,069 | 9,754 | 0.25 | % | ||||||||||||||||||||||||
| Federal funds purchased and securities | ||||||||||||||||||||||||||||||||||||
| sold under agreement to repurchase | 119,985 | 318 | 1.06 | % | 148,673 | 323 | 0.88 | % | 210,280 | 119 | 0.23 | % | ||||||||||||||||||||||||
| Other borrowings | 1,449,403 | 18,612 | 5.15 | % | 787,783 | 8,848 | 4.56 | % | 1,241,501 | 4,844 | 1.56 | % | ||||||||||||||||||||||||
| Subordinated notes and debentures | 366,047 | 6,696 | 7.34 | % | 366,009 | 4,603 | 5.10 | % | 418,327 | 4,990 | 4.78 | % | ||||||||||||||||||||||||
| Total interest bearing liabilities | 18,858,320 | 133,990 | 2.85 | % | 18,180,111 | 101,302 | 2.26 | % | 17,264,177 | 19,707 | 0.46 | % | ||||||||||||||||||||||||
| Noninterest bearing liabilities: | ||||||||||||||||||||||||||||||||||||
| Noninterest bearing deposits | 5,276,267 | 5,642,779 | 5,926,304 | |||||||||||||||||||||||||||||||||
| Other liabilities | 272,628 | 295,191 | 216,848 | |||||||||||||||||||||||||||||||||
| Total liabilities | 24,407,215 | 24,118,081 | 23,407,329 | |||||||||||||||||||||||||||||||||
| Stockholders' equity | 3,358,924 | 3,370,651 | 3,361,703 | |||||||||||||||||||||||||||||||||
| Total liabilities and stockholders' equity | $ | 27,766,139 | $ | 27,488,732 | $ | 26,769,032 | ||||||||||||||||||||||||||||||
| Net interest income (FTE) | $ | 169,336 | $ | 184,146 | $ | 191,195 | ||||||||||||||||||||||||||||||
| Net interest spread (FTE) | 2.10 | % | 2.52 | % | 3.11 | % | ||||||||||||||||||||||||||||||
| Net interest margin (FTE) | 2.76 | % | 3.09 | % | 3.24 | % | ||||||||||||||||||||||||||||||
Page 7
| Simmons First National Corporation | SFNC | |||||||||||||||||||
| Consolidated - Selected Financial Data | ||||||||||||||||||||
| For the Quarters Ended | Jun 30 | Mar 31 | Dec 31 | Sep 30 | Jun 30 | |||||||||||||||
| (Unaudited) | 2023 | 2023 | 2022 | 2022 | 2022 | |||||||||||||||
| ($ in thousands, except share data) | ||||||||||||||||||||
| QUARTER-TO-DATE | ||||||||||||||||||||
| Financial Highlights - As Reported | ||||||||||||||||||||
| Net Income | $ | 58,314 | $ | 45,589 | $ | 83,260 | $ | 80,603 | $ | 27,454 | ||||||||||
| Diluted earnings per share | 0.46 | 0.36 | 0.65 | 0.63 | 0.21 | |||||||||||||||
| Return on average assets | 0.84 | % | 0.67 | % | 1.22 | % | 1.19 | % | 0.41 | % | ||||||||||
| Return on average common equity | 6.96 | % | 5.49 | % | 10.27 | % | 9.71 | % | 3.28 | % | ||||||||||
| Return on tangible common equity (non-GAAP) (1) | 12.85 | % | 10.25 | % | 19.29 | % | 17.99 | % | 6.28 | % | ||||||||||
| Net interest margin (FTE) | 2.76 | % | 3.09 | % | 3.31 | % | 3.34 | % | 3.24 | % | ||||||||||
| Efficiency ratio (2) | 65.18 | % | 62.28 | % | 58.33 | % | 57.22 | % | 67.77 | % | ||||||||||
| FTE adjustment | 6,106 | 6,311 | 6,770 | 6,203 | 6,096 | |||||||||||||||
| Average diluted shares outstanding | 127,379,976 | 127,516,478 | 127,505,996 | 128,336,422 | 128,720,078 | |||||||||||||||
| Shares repurchased under plan | 1,128,087 | - | - | 1,883,713 | 2,035,324 | |||||||||||||||
| Average price of shares repurchased | 17.73 | - | - | 23.91 | 24.59 | |||||||||||||||
| Cash dividends declared per common share | 0.200 | 0.200 | 0.190 | 0.190 | 0.190 | |||||||||||||||
| Accretable yield on acquired loans | 2,267 | 2,579 | 4,473 | 5,834 | 9,898 | |||||||||||||||
| Financial Highlights - Adjusted (non-GAAP) (1) | ||||||||||||||||||||
| Adjusted earnings | $ | 61,065 | $ | 47,343 | $ | 81,093 | $ | 82,281 | $ | 68,102 | ||||||||||
| Adjusted diluted earnings per share | 0.48 | 0.37 | 0.64 | 0.64 | 0.53 | |||||||||||||||
| Adjusted return on average assets | 0.88 | % | 0.70 | % | 1.18 | % | 1.21 | % | 1.02 | % | ||||||||||
| Adjusted return on average common equity | 7.29 | % | 5.70 | % | 10.01 | % | 9.92 | % | 8.13 | % | ||||||||||
| Adjusted return on tangible common equity | 13.42 | % | 10.62 | % | 18.81 | % | 18.35 | % | 14.65 | % | ||||||||||
| Adjusted efficiency ratio (2) | 61.29 | % | 59.38 | % | 56.97 | % | 54.41 | % | 56.74 | % | ||||||||||
| YEAR-TO-DATE | ||||||||||||||||||||
| Financial Highlights - GAAP | ||||||||||||||||||||
| Net Income | $ | 103,903 | $ | 45,589 | $ | 256,412 | $ | 173,152 | $ | 92,549 | ||||||||||
| Diluted earnings per share | 0.82 | 0.36 | 2.06 | 1.40 | 0.77 | |||||||||||||||
| Return on average assets | 0.76 | % | 0.67 | % | 0.97 | % | 0.88 | % | 0.72 | % | ||||||||||
| Return on average common equity | 6.23 | % | 5.49 | % | 7.87 | % | 7.07 | % | 5.71 | % | ||||||||||
| Return on tangible common equity (non-GAAP) (1) | 11.55 | % | 10.25 | % | 14.33 | % | 12.77 | % | 10.24 | % | ||||||||||
| Net interest margin (FTE) | 2.92 | % | 3.09 | % | 3.17 | % | 3.12 | % | 3.01 | % | ||||||||||
| Efficiency ratio (2) | 63.68 | % | 62.28 | % | 62.14 | % | 63.54 | % | 67.14 | % | ||||||||||
| FTE adjustment | 12,417 | 6,311 | 24,671 | 17,901 | 11,698 | |||||||||||||||
| Average diluted shares outstanding | 127,421,034 | 127,516,478 | 124,470,184 | 123,387,503 | 120,826,798 | |||||||||||||||
| Cash dividends declared per common share | 0.400 | 0.200 | 0.760 | 0.570 | 0.380 | |||||||||||||||
| Financial Highlights - Adjusted (non-GAAP) (1) | ||||||||||||||||||||
| Adjusted earnings | $ | 108,408 | $ | 47,343 | $ | 298,635 | $ | 217,542 | $ | 135,261 | ||||||||||
| Adjusted diluted earnings per share | 0.85 | 0.37 | 2.40 | 1.76 | 1.12 | |||||||||||||||
| Adjusted return on average assets | 0.79 | % | 0.70 | % | 1.13 | % | 1.11 | % | 1.06 | % | ||||||||||
| Adjusted return on average common equity | 6.50 | % | 5.70 | % | 9.16 | % | 8.88 | % | 8.35 | % | ||||||||||
| Adjusted return on tangible common equity | 12.03 | % | 10.62 | % | 16.59 | % | 15.89 | % | 14.70 | % | ||||||||||
| Adjusted efficiency ratio (2) | 60.30 | % | 59.38 | % | 57.50 | % | 57.69 | % | 59.56 | % | ||||||||||
| END OF PERIOD | ||||||||||||||||||||
| Book value per share | $ | 26.59 | $ | 26.24 | $ | 25.73 | $ | 24.87 | $ | 25.31 | ||||||||||
| Tangible book value per share | 15.17 | 14.88 | 14.33 | 13.51 | 14.07 | |||||||||||||||
| Shares outstanding | 126,224,707 | 127,282,192 | 127,046,654 | 126,943,467 | 128,787,764 | |||||||||||||||
| Full-time equivalent employees | 3,066 | 3,189 | 3,236 | 3,206 | 3,233 | |||||||||||||||
| Total number of financial centers | 231 | 231 | 230 | 230 | 233 | |||||||||||||||
(1) Non-GAAP measurement that management believes aids in the understanding and discussion of results. Reconciliations to GAAP are included in the schedules accompanying this release.
(2) Efficiency ratio is noninterest expense as a percent of net interest income (fully taxable equivalent) and noninterest revenues. Adjusted efficiency ratio is noninterest expense before foreclosed property expense, amortization of intangibles and certain adjusting items as a percent of net interest income (fully taxable equivalent) and noninterest revenues, excluding gains and losses from securities transactions and certain adjusting items, and is a non-GAAP measurement.
Page 8
| Simmons First National Corporation | SFNC | |||||||||||||||||||
| Reconciliation Of Non-GAAP Financial Measures - Adjusted Earnings - Quarter-to-Date | ||||||||||||||||||||
| For the Quarters Ended | Jun 30 | Mar 31 | Dec 31 | Sep 30 | Jun 30 | |||||||||||||||
| (Unaudited) | 2023 | 2023 | 2022 | 2022 | 2022 | |||||||||||||||
| (in thousands, except per share data) | ||||||||||||||||||||
| QUARTER-TO-DATE | ||||||||||||||||||||
| Net income | $ | 58,314 | $ | 45,589 | $ | 83,260 | $ | 80,603 | $ | 27,454 | ||||||||||
| Certain items: | ||||||||||||||||||||
| (Gain) loss from early retirement of TruPS | - | - | - | 365 | - | |||||||||||||||
| Gain on sale of intellectual property | - | - | - | (750 | ) | - | ||||||||||||||
| Gain on insurance settlement | - | - | (4,074 | ) | - | - | ||||||||||||||
| Donation to Simmons First Foundation | - | - | - | - | 1,738 | |||||||||||||||
| Merger related costs | 19 | 1,396 | 35 | 1,422 | 19,133 | |||||||||||||||
| Early retirement program | 3,609 | - | - | - | - | |||||||||||||||
| Branch right sizing (net) | 95 | 979 | 1,104 | 1,235 | 380 | |||||||||||||||
| Day 2 CECL provision | - | - | - | - | 33,779 | |||||||||||||||
| Tax effect (1) | (972 | ) | (621 | ) | 768 | (594 | ) | (14,382 | ) | |||||||||||
| Certain items, net of tax | 2,751 | 1,754 | (2,167 | ) | 1,678 | 40,648 | ||||||||||||||
| Adjusted earnings (non-GAAP) | $ | 61,065 | $ | 47,343 | $ | 81,093 | $ | 82,281 | $ | 68,102 | ||||||||||
| Diluted earnings per share | $ | 0.46 | $ | 0.36 | $ | 0.65 | $ | 0.63 | $ | 0.21 | ||||||||||
| Certain items: | ||||||||||||||||||||
| (Gain) loss from early retirement of TruPS | - | - | - | - | - | |||||||||||||||
| Gain on sale of intellectual property | - | - | - | (0.01 | ) | - | ||||||||||||||
| Gain on insurance settlement | - | - | (0.03 | ) | ||||||||||||||||
| Donation to Simmons First Foundation | - | - | - | - | 0.01 | |||||||||||||||
| Merger related costs | - | 0.01 | - | 0.01 | 0.15 | |||||||||||||||
| Early retirement program | 0.03 | - | - | - | - | |||||||||||||||
| Branch right sizing (net) | - | 0.01 | 0.01 | 0.01 | - | |||||||||||||||
| Day 2 CECL provision | - | - | - | - | 0.27 | |||||||||||||||
| Tax effect (1) | (0.01 | ) | (0.01 | ) | 0.01 | - | (0.11 | ) | ||||||||||||
| Certain items, net of tax | 0.02 | 0.01 | (0.01 | ) | 0.01 | 0.32 | ||||||||||||||
| Adjusted diluted earnings per share (non-GAAP) | $ | 0.48 | $ | 0.37 | $ | 0.64 | $ | 0.64 | $ | 0.53 | ||||||||||
(1) Effective tax rate of 26.135%.
| Reconciliation of Certain Noninterest Income and Expense Items (non-GAAP) | ||||||||||||||||||||
| QUARTER-TO-DATE | ||||||||||||||||||||
| Noninterest income | $ | 44,980 | $ | 45,835 | $ | 44,647 | $ | 43,023 | $ | 40,178 | ||||||||||
| Certain noninterest income items (1) | ||||||||||||||||||||
| Gain on insurance settlement | - | - | (4,074 | ) | - | - | ||||||||||||||
| (Gain) loss from early retirement of TruPS | - | - | - | 365 | - | |||||||||||||||
| Gain on sale of intellectual property | - | - | - | (750 | ) | - | ||||||||||||||
| Branch right sizing income | - | - | - | 65 | 88 | |||||||||||||||
| Adjusted noninterest income (non-GAAP) | $ | 44,980 | $ | 45,835 | $ | 40,573 | $ | 42,703 | $ | 40,266 | ||||||||||
| Other income | $ | 9,843 | $ | 11,256 | $ | 6,600 | $ | 6,658 | $ | 6,837 | ||||||||||
| Certain other income items (1) | ||||||||||||||||||||
| (Gain) loss from early retirement of TruPS | - | - | - | 365 | - | |||||||||||||||
| Gain on sale of intellectual property | - | - | - | (750 | ) | - | ||||||||||||||
| Branch right sizing income | - | - | - | 65 | 88 | |||||||||||||||
| Adjusted other income (non-GAAP) | $ | 9,843 | $ | 11,256 | $ | 6,600 | $ | 6,338 | $ | 6,925 | ||||||||||
| Noninterest expense | $ | 139,696 | $ | 143,228 | $ | 142,575 | $ | 138,943 | $ | 156,813 | ||||||||||
| Certain noninterest expense items (1) | ||||||||||||||||||||
| Merger related costs | (19 | ) | (1,396 | ) | (35 | ) | (1,422 | ) | (19,133 | ) | ||||||||||
| Early retirement program | (3,609 | ) | - | - | - | - | ||||||||||||||
| Donation to Simmons First Foundation | - | - | - | - | (1,738 | ) | ||||||||||||||
| Branch right sizing expense | (95 | ) | (979 | ) | (1,104 | ) | (1,170 | ) | (292 | ) | ||||||||||
| Adjusted noninterest expense (non-GAAP) | $ | 135,973 | $ | 140,853 | $ | 141,436 | $ | 136,351 | $ | 135,650 | ||||||||||
| Salaries and employee benefits | $ | 74,723 | $ | 77,038 | $ | 73,018 | $ | 71,923 | $ | 74,135 | ||||||||||
| Certain salaries and employee benefits items (1) | ||||||||||||||||||||
| Early retirement program | (3,609 | ) | - | - | - | - | ||||||||||||||
| Other | - | - | - | - | - | |||||||||||||||
| Adjusted salaries and employee benefits (non-GAAP) | $ | 71,114 | $ | 77,038 | $ | 73,018 | $ | 71,923 | $ | 74,135 | ||||||||||
| Other operating expenses | $ | 42,926 | $ | 43,086 | $ | 48,480 | $ | 45,084 | $ | 44,483 | ||||||||||
| Certain other operating expenses items (1) | ||||||||||||||||||||
| Donation to Simmons First Foundation | - | - | - | - | (1,738 | ) | ||||||||||||||
| Branch right sizing expense | 53 | (816 | ) | (953 | ) | (973 | ) | (7 | ) | |||||||||||
| Adjusted other operating expenses (non-GAAP) | $ | 42,979 | $ | 42,270 | $ | 47,527 | $ | 44,111 | $ | 42,738 | ||||||||||
(1) Certain items include gain from early retirement of trust preferred securities, gain on sale of intellectual property, gain on insurance settlement, donation to Simmons First Foundation, merger related costs, early retirement program costs, branch right sizing costs and Day 2 CECL provision.
Page 9
| Simmons First National Corporation | SFNC | |||||||||||||||||||
| Reconciliation Of Non-GAAP Financial Measures - Adjusted Earnings - Year-to-Date | ||||||||||||||||||||
| For the Quarters Ended | Jun 30 | Mar 31 | Dec 31 | Sep 30 | Jun 30 | |||||||||||||||
| (Unaudited) | 2023 | 2023 | 2022 | 2022 | 2022 | |||||||||||||||
| (in thousands, except per share data) | ||||||||||||||||||||
| YEAR-TO-DATE | ||||||||||||||||||||
| Net income | $ | 103,903 | $ | 45,589 | $ | 256,412 | $ | 173,152 | $ | 92,549 | ||||||||||
| Certain items: | ||||||||||||||||||||
| (Gain) loss from early retirement of TruPS | - | - | 365 | 365 | - | |||||||||||||||
| Gain on sale of intellectual property | - | - | (750 | ) | (750 | ) | - | |||||||||||||
| Gain on insurance settlement | - | - | (4,074 | ) | - | - | ||||||||||||||
| Donation to Simmons First Foundation | - | - | 1,738 | 1,738 | 1,738 | |||||||||||||||
| Merger related costs | 1,415 | 1,396 | 22,476 | 22,441 | 21,019 | |||||||||||||||
| Early retirement program | 3,609 | - | - | - | - | |||||||||||||||
| Branch right sizing (net) | 1,074 | 979 | 3,628 | 2,524 | 1,289 | |||||||||||||||
| Day 2 CECL provision | - | - | 33,779 | 33,779 | 33,779 | |||||||||||||||
| Tax effect (1) | (1,593 | ) | (621 | ) | (14,939 | ) | (15,707 | ) | (15,113 | ) | ||||||||||
| Certain items, net of tax | 4,505 | 1,754 | 42,223 | 44,390 | 42,712 | |||||||||||||||
| Adjusted earnings (non-GAAP) | $ | 108,408 | $ | 47,343 | $ | 298,635 | $ | 217,542 | $ | 135,261 | ||||||||||
| Diluted earnings per share | $ | 0.82 | $ | 0.36 | $ | 2.06 | $ | 1.40 | $ | 0.77 | ||||||||||
| Certain items: | ||||||||||||||||||||
| (Gain) loss from early retirement of TruPS | - | - | - | - | - | |||||||||||||||
| Gain on sale of intellectual property | - | - | (0.01 | ) | (0.01 | ) | - | |||||||||||||
| Gain on insurance settlement | - | - | (0.03 | ) | - | - | ||||||||||||||
| Donation to Simmons First Foundation | - | - | 0.01 | 0.01 | 0.01 | |||||||||||||||
| Merger related costs | 0.01 | 0.01 | 0.18 | 0.18 | 0.17 | |||||||||||||||
| Early retirement program | 0.03 | - | - | - | - | |||||||||||||||
| Branch right sizing (net) | 0.01 | 0.01 | 0.03 | 0.02 | 0.01 | |||||||||||||||
| Day 2 CECL provision | - | - | 0.28 | 0.28 | 0.28 | |||||||||||||||
| Tax effect (1) | (0.02 | ) | (0.01 | ) | (0.12 | ) | (0.12 | ) | (0.12 | ) | ||||||||||
| Certain items, net of tax | 0.03 | 0.01 | 0.34 | 0.36 | 0.35 | |||||||||||||||
| Adjusted diluted earnings per share (non-GAAP) | $ | 0.85 | $ | 0.37 | $ | 2.40 | $ | 1.76 | $ | 1.12 | ||||||||||
(1) Effective tax rate of 26.135%.
| Reconciliation of Certain Noninterest Income and Expense Items (non-GAAP) | ||||||||||||||||||||
| YEAR-TO-DATE | ||||||||||||||||||||
| Noninterest income | $ | 90,815 | $ | 45,835 | $ | 170,066 | $ | 125,419 | $ | 82,396 | ||||||||||
| Certain noninterest income items (1) | ||||||||||||||||||||
| Gain on insurance settlement | - | - | (4,074 | ) | - | - | ||||||||||||||
| (Gain) loss from early retirement of TruPS | - | - | 365 | 365 | - | |||||||||||||||
| Gain on sale of intellectual property | - | - | (750 | ) | (750 | ) | - | |||||||||||||
| Branch right sizing income | - | - | 153 | 153 | 88 | |||||||||||||||
| Adjusted noninterest income (non-GAAP) | $ | 90,815 | $ | 45,835 | $ | 165,760 | $ | 125,187 | $ | 82,484 | ||||||||||
| Other income | $ | 21,099 | $ | 11,256 | $ | 27,361 | $ | 20,761 | $ | 14,103 | ||||||||||
| Certain other income items (1) | ||||||||||||||||||||
| (Gain) loss from early retirement of TruPS | - | - | 365 | 365 | - | |||||||||||||||
| Gain on sale of intellectual property | - | - | (750 | ) | (750 | ) | - | |||||||||||||
| Branch right sizing income | - | - | 153 | 153 | 88 | |||||||||||||||
| Adjusted other income (non-GAAP) | $ | 21,099 | $ | 11,256 | $ | 27,129 | $ | 20,529 | $ | 14,191 | ||||||||||
| Noninterest expense | $ | 282,924 | $ | 143,228 | $ | 566,748 | $ | 424,173 | $ | 285,230 | ||||||||||
| Certain noninterest expense items (1) | ||||||||||||||||||||
| Merger related costs | (1,415 | ) | (1,396 | ) | (22,476 | ) | (22,441 | ) | (21,019 | ) | ||||||||||
| Early retirement program | (3,609 | ) | - | - | - | - | ||||||||||||||
| Donation to Simmons First Foundation | - | - | (1,738 | ) | (1,738 | ) | (1,738 | ) | ||||||||||||
| Branch right sizing expense | (1,074 | ) | (979 | ) | (3,475 | ) | (2,371 | ) | (1,201 | ) | ||||||||||
| Adjusted noninterest expense (non-GAAP) | $ | 276,826 | $ | 140,853 | $ | 539,059 | $ | 397,623 | $ | 261,272 | ||||||||||
| Salaries and employee benefits | $ | 151,761 | $ | 77,038 | $ | 286,982 | $ | 213,964 | $ | 142,041 | ||||||||||
| Certain salaries and employee benefits items (1) | ||||||||||||||||||||
| Early retirement program | (3,609 | ) | - | - | - | - | ||||||||||||||
| Other | - | - | - | - | - | |||||||||||||||
| Adjusted salaries and employee benefits (non-GAAP) | $ | 148,152 | $ | 77,038 | $ | 286,982 | $ | 213,964 | $ | 142,041 | ||||||||||
| Other operating expenses | $ | 86,012 | $ | 43,086 | $ | 179,693 | $ | 131,213 | $ | 86,129 | ||||||||||
| Certain other operating expenses items (1) | ||||||||||||||||||||
| Donation to Simmons First Foundation | - | - | (1,738 | ) | (1,738 | ) | (1,738 | ) | ||||||||||||
| Branch right sizing expense | (763 | ) | (816 | ) | (2,650 | ) | (1,697 | ) | (724 | ) | ||||||||||
| Adjusted other operating expenses (non-GAAP) | $ | 85,249 | $ | 42,270 | $ | 175,305 | $ | 127,778 | $ | 83,667 | ||||||||||
(1) Certain items include gain from early retirement of trust preferred securities, gain on sale of intellectual property, gain on insurance settlement, donation to Simmons First Foundation, merger related costs, early retirement program costs, branch right sizing costs and Day 2 CECL provision.
Page 10
| Simmons First National Corporation | SFNC | |||||||||||||||||||
| Reconciliation Of Non-GAAP Financial Measures - End of Period | ||||||||||||||||||||
| For the Quarters Ended | Jun 30 | Mar 31 | Dec 31 | Sep 30 | Jun 30 | |||||||||||||||
| (Unaudited) | 2023 | 2023 | 2022 | 2022 | 2022 | |||||||||||||||
| ($ in thousands, except per share data) | ||||||||||||||||||||
| Calculation of Tangible Common Equity and the Ratio of Tangible Common Equity to Tangible Assets | ||||||||||||||||||||
| Total common stockholders' equity | $ | 3,356,326 | $ | 3,339,901 | $ | 3,269,362 | $ | 3,157,151 | $ | 3,259,895 | ||||||||||
| Intangible assets: | ||||||||||||||||||||
| Goodwill | (1,320,799 | ) | (1,320,799 | ) | (1,319,598 | ) | (1,309,000 | ) | (1,310,528 | ) | ||||||||||
| Other intangible assets | (120,758 | ) | (124,854 | ) | (128,951 | ) | (133,059 | ) | (137,285 | ) | ||||||||||
| Total intangibles | (1,441,557 | ) | (1,445,653 | ) | (1,448,549 | ) | (1,442,059 | ) | (1,447,813 | ) | ||||||||||
| Tangible common stockholders' equity | $ | 1,914,769 | $ | 1,894,248 | $ | 1,820,813 | $ | 1,715,092 | $ | 1,812,082 | ||||||||||
| Total assets | $ | 27,959,123 | $ | 27,583,446 | $ | 27,461,061 | $ | 27,076,074 | $ | 27,218,609 | ||||||||||
| Intangible assets: | ||||||||||||||||||||
| Goodwill | (1,320,799 | ) | (1,320,799 | ) | (1,319,598 | ) | (1,309,000 | ) | (1,310,528 | ) | ||||||||||
| Other intangible assets | (120,758 | ) | (124,854 | ) | (128,951 | ) | (133,059 | ) | (137,285 | ) | ||||||||||
| Total intangibles | (1,441,557 | ) | (1,445,653 | ) | (1,448,549 | ) | (1,442,059 | ) | (1,447,813 | ) | ||||||||||
| Tangible assets | $ | 26,517,566 | $ | 26,137,793 | $ | 26,012,512 | $ | 25,634,015 | $ | 25,770,796 | ||||||||||
| Ratio of common equity to assets | 12.00 | % | 12.11 | % | 11.91 | % | 11.66 | % | 11.98 | % | ||||||||||
| Ratio of tangible common equity to tangible assets | 7.22 | % | 7.25 | % | 7.00 | % | 6.69 | % | 7.03 | % | ||||||||||
| Calculation of Tangible Book Value per Share | ||||||||||||||||||||
| Total common stockholders' equity | $ | 3,356,326 | $ | 3,339,901 | $ | 3,269,362 | $ | 3,157,151 | $ | 3,259,895 | ||||||||||
| Intangible assets: | ||||||||||||||||||||
| Goodwill | (1,320,799 | ) | (1,320,799 | ) | (1,319,598 | ) | (1,309,000 | ) | (1,310,528 | ) | ||||||||||
| Other intangible assets | (120,758 | ) | (124,854 | ) | (128,951 | ) | (133,059 | ) | (137,285 | ) | ||||||||||
| Total intangibles | (1,441,557 | ) | (1,445,653 | ) | (1,448,549 | ) | (1,442,059 | ) | (1,447,813 | ) | ||||||||||
| Tangible common stockholders' equity | $ | 1,914,769 | $ | 1,894,248 | $ | 1,820,813 | $ | 1,715,092 | $ | 1,812,082 | ||||||||||
| Shares of common stock outstanding | 126,224,707 | 127,282,192 | 127,046,654 | 126,943,467 | 128,787,764 | |||||||||||||||
| Book value per common share | $ | 26.59 | $ | 26.24 | $ | 25.73 | $ | 24.87 | $ | 25.31 | ||||||||||
| Tangible book value per common share | $ | 15.17 | $ | 14.88 | $ | 14.33 | $ | 13.51 | $ | 14.07 | ||||||||||
| Calculation of Uninsured Deposit Coverage Ratio | ||||||||||||||||||||
| Uninsured deposits at Simmons Bank | $ | 5,491,062 | $ | 5,896,752 | $ | 7,267,220 | $ | 7,071,483 | ||||||||||||
| Less: Intercompany eliminations | 674,552 | 628,592 | 527,542 | 555,636 | ||||||||||||||||
| Total uninsured deposits | $ | 4,816,510 | $ | 5,268,160 | $ | 6,739,678 | $ | 6,515,847 | ||||||||||||
| FHLB borrowing availability | $ | 5,345,000 | $ | 5,574,000 | $ | 5,442,000 | $ | 3,707,000 | ||||||||||||
| Unpledged securities | 3,877,000 | 3,000,000 | 3,180,000 | 3,597,000 | ||||||||||||||||
| Fed funds lines, Fed discount window and | ||||||||||||||||||||
| Bank Term Funding Program | 1,874,000 | 2,206,000 | 1,982,000 | 504,000 | ||||||||||||||||
| Additional liquidity sources | $ | 11,096,000 | $ | 10,780,000 | $ | 10,604,000 | $ | 7,808,000 | ||||||||||||
| Uninsured deposit coverage ratio | 2.3 | 2.0 | 1.6 | 1.2 | ||||||||||||||||
Page 11
| Simmons First National Corporation | SFNC | |||||||||||||||||||
| Reconciliation Of Non-GAAP Financial Measures - Quarter-to-Date | ||||||||||||||||||||
| For the Quarters Ended | Jun 30 | Mar 31 | Dec 31 | Sep 30 | Jun 30 | |||||||||||||||
| (Unaudited) | 2023 | 2023 | 2022 | 2022 | 2022 | |||||||||||||||
| ($ in thousands) | ||||||||||||||||||||
| Calculation of Adjusted Return on Average Assets | ||||||||||||||||||||
| Net income | $ | 58,314 | $ | 45,589 | $ | 83,260 | $ | 80,603 | $ | 27,454 | ||||||||||
| Certain items (non-GAAP) | ||||||||||||||||||||
| (Gain) loss from early retirement of TruPS | - | - | - | 365 | - | |||||||||||||||
| Gain on sale of intellectual property | - | - | - | (750 | ) | - | ||||||||||||||
| Gain on insurance settlement | - | - | (4,074 | ) | - | - | ||||||||||||||
| Donation to Simmons First Foundation | - | - | - | - | 1,738 | |||||||||||||||
| Merger related costs | 19 | 1,396 | 35 | 1,422 | 19,133 | |||||||||||||||
| Early retirement program | 3,609 | - | - | - | - | |||||||||||||||
| Branch right sizing (net) | 95 | 979 | 1,104 | 1,235 | 380 | |||||||||||||||
| Day 2 CECL provision | - | - | - | - | 33,779 | |||||||||||||||
| Tax effect of certain items (2) | (972 | ) | (621 | ) | 768 | (594 | ) | (14,382 | ) | |||||||||||
| Adjusted earnings (non-GAAP) | $ | 61,065 | $ | 47,343 | $ | 81,093 | $ | 82,281 | $ | 68,102 | ||||||||||
| Average total assets | $ | 27,766,139 | $ | 27,488,732 | $ | 27,180,575 | $ | 26,868,731 | $ | 26,769,032 | ||||||||||
| Return on average assets | 0.84 | % | 0.67 | % | 1.22 | % | 1.19 | % | 0.41 | % | ||||||||||
| Adjusted return on average assets (non-GAAP) | 0.88 | % | 0.70 | % | 1.18 | % | 1.21 | % | 1.02 | % | ||||||||||
| Calculation of Return on Tangible Common Equity | ||||||||||||||||||||
| Net income available to common stockholders | $ | 58,314 | $ | 45,589 | $ | 83,260 | $ | 80,603 | $ | 27,454 | ||||||||||
| Amortization of intangibles, net of taxes | 3,026 | 3,026 | 3,035 | 3,121 | 3,025 | |||||||||||||||
| Total income available to common stockholders | $ | 61,340 | $ | 48,615 | $ | 86,295 | $ | 83,724 | $ | 30,479 | ||||||||||
| Certain items (non-GAAP) | ||||||||||||||||||||
| (Gain) loss from early retirement of TruPS | - | - | - | 365 | - | |||||||||||||||
| Gain on sale of intellectual property | - | - | - | (750 | ) | - | ||||||||||||||
| Gain on insurance settlement | - | - | (4,074 | ) | - | - | ||||||||||||||
| Donation to Simmons First Foundation | - | - | - | - | 1,738 | |||||||||||||||
| Merger related costs | 19 | 1,396 | 35 | 1,422 | 19,133 | |||||||||||||||
| Early retirement program | 3,609 | - | - | - | - | |||||||||||||||
| Branch right sizing (net) | 95 | 979 | 1,104 | 1,235 | 380 | |||||||||||||||
| Day 2 CECL provision | - | - | - | - | 33,779 | |||||||||||||||
| Tax effect of certain items (2) | (972 | ) | (621 | ) | 768 | (594 | ) | (14,382 | ) | |||||||||||
| Adjusted earnings (non-GAAP) | 61,065 | 47,343 | 81,093 | 82,281 | 68,102 | |||||||||||||||
| Amortization of intangibles, net of taxes | 3,026 | 3,026 | 3,035 | 3,121 | 3,025 | |||||||||||||||
| Total adjusted earnings available to common stockholders (non-GAAP) | $ | 64,091 | $ | 50,369 | $ | 84,128 | $ | 85,402 | $ | 71,127 | ||||||||||
| Average common stockholders' equity | $ | 3,358,924 | $ | 3,370,651 | $ | 3,214,912 | $ | 3,292,071 | $ | 3,361,703 | ||||||||||
| Average intangible assets: | ||||||||||||||||||||
| Goodwill | (1,320,799 | ) | (1,319,624 | ) | (1,309,124 | ) | (1,309,804 | ) | (1,299,821 | ) | ||||||||||
| Other intangibles | (123,173 | ) | (127,394 | ) | (131,229 | ) | (135,718 | ) | (114,195 | ) | ||||||||||
| Total average intangibles | (1,443,972 | ) | (1,447,018 | ) | (1,440,353 | ) | (1,445,522 | ) | (1,414,016 | ) | ||||||||||
| Average tangible common stockholders' equity (non-GAAP) | $ | 1,914,952 | $ | 1,923,633 | $ | 1,774,559 | $ | 1,846,549 | $ | 1,947,687 | ||||||||||
| Return on average common equity | 6.96 | % | 5.49 | % | 10.27 | % | 9.71 | % | 3.28 | % | ||||||||||
| Return on tangible common equity | 12.85 | % | 10.25 | % | 19.29 | % | 17.99 | % | 6.28 | % | ||||||||||
| Adjusted return on average common equity (non-GAAP) | 7.29 | % | 5.70 | % | 10.01 | % | 9.92 | % | 8.13 | % | ||||||||||
| Adjusted return on tangible common equity (non-GAAP) | 13.42 | % | 10.62 | % | 18.81 | % | 18.35 | % | 14.65 | % | ||||||||||
| Calculation of Efficiency Ratio and Adjusted Efficiency Ratio (1) | ||||||||||||||||||||
| Noninterest expense (efficiency ratio numerator) | $ | 139,696 | $ | 143,228 | $ | 142,575 | $ | 138,943 | $ | 156,813 | ||||||||||
| Certain noninterest expense items (non-GAAP) | ||||||||||||||||||||
| Merger related costs | (19 | ) | (1,396 | ) | (35 | ) | (1,422 | ) | (19,133 | ) | ||||||||||
| Early retirement program | (3,609 | ) | - | - | - | - | ||||||||||||||
| Donation to Simmons First Foundation | - | - | - | - | (1,738 | ) | ||||||||||||||
| Branch right sizing expense | (95 | ) | (979 | ) | (1,104 | ) | (1,170 | ) | (292 | ) | ||||||||||
| Other real estate and foreclosure expense adjustment | (289 | ) | (186 | ) | (350 | ) | (168 | ) | (142 | ) | ||||||||||
| Amortization of intangibles adjustment | (4,098 | ) | (4,096 | ) | (4,108 | ) | (4,225 | ) | (4,096 | ) | ||||||||||
| Adjusted efficiency ratio numerator | $ | 131,586 | $ | 136,571 | $ | 136,978 | $ | 131,958 | $ | 131,412 | ||||||||||
| Net interest income | $ | 163,230 | $ | 177,835 | $ | 193,026 | $ | 193,585 | $ | 185,099 | ||||||||||
| Noninterest income | 44,980 | 45,835 | 44,647 | 43,023 | 40,178 | |||||||||||||||
| Fully tax-equivalent adjustment (effective tax rate of 26.135%) | 6,106 | 6,311 | 6,770 | 6,203 | 6,096 | |||||||||||||||
| Efficiency ratio denominator | 214,316 | 229,981 | 244,443 | 242,811 | 231,373 | |||||||||||||||
| Certain noninterest income items (non-GAAP) | ||||||||||||||||||||
| Gain on insurance settlement | - | - | (4,074 | ) | - | - | ||||||||||||||
| (Gain) loss from early retirement of TruPS | - | - | - | 365 | - | |||||||||||||||
| Gain on sale of intellectual property | - | - | - | (750 | ) | - | ||||||||||||||
| Branch right sizing income | - | - | - | 65 | 88 | |||||||||||||||
| (Gain) loss on sale of securities | 391 | - | 52 | 22 | 150 | |||||||||||||||
| Adjusted efficiency ratio denominator | $ | 214,707 | $ | 229,981 | $ | 240,421 | $ | 242,513 | $ | 231,611 | ||||||||||
| Efficiency ratio (1) | 65.18 | % | 62.28 | % | 58.33 | % | 57.22 | % | 67.77 | % | ||||||||||
| Adjusted efficiency ratio (non-GAAP) (1) | 61.29 | % | 59.38 | % | 56.97 | % | 54.41 | % | 56.74 | % | ||||||||||
(1) Efficiency ratio is noninterest expense as a percent of net interest income (fully taxable equivalent) and noninterest revenues. Adjusted efficiency ratio is noninterest expense before foreclosed property expense, amortization of intangibles and certain adjusting items as a percent of net interest income (fully taxable equivalent) and noninterest revenues, excluding gains and losses from securities transactions and certain adjusting items, and is a non-GAAP measurement.
(2) Effective tax rate of 26.135%.
Page 12
| Simmons First National Corporation | SFNC | |||||||||||||||||||
| Reconciliation Of Non-GAAP Financial Measures - Quarter-to-Date (continued) | ||||||||||||||||||||
| For the Quarters Ended | Jun 30 | Mar 31 | Dec 31 | Sep 30 | Jun 30 | |||||||||||||||
| (Unaudited) | 2023 | 2023 | 2022 | 2022 | 2022 | |||||||||||||||
| ($ in thousands) | ||||||||||||||||||||
| Calculation of Pre-Provision Net Revenue (PPNR) | ||||||||||||||||||||
| Net interest income | $ | 163,230 | $ | 177,835 | $ | 193,026 | $ | 193,585 | $ | 185,099 | ||||||||||
| Noninterest income | 44,980 | 45,835 | 44,647 | 43,023 | 40,178 | |||||||||||||||
| Revenue | 208,210 | 223,670 | 237,673 | 236,608 | 225,277 | |||||||||||||||
| Less: Gain (loss) on sale of securities | (391 | ) | - | (52 | ) | (22 | ) | (150 | ) | |||||||||||
| Less: Noninterest expense | 139,696 | 143,228 | 142,575 | 138,943 | 156,813 | |||||||||||||||
| Pre-Provision Net Revenue (PPNR) | $ | 68,905 | $ | 80,442 | $ | 95,150 | $ | 97,687 | $ | 68,614 | ||||||||||
| Calculation of Adjusted Pre-Provision Net Revenue | ||||||||||||||||||||
| Pre-Provision Net Revenue (PPNR) | $ | 68,905 | $ | 80,442 | $ | 95,150 | $ | 97,687 | $ | 68,614 | ||||||||||
| Plus: Loss from early retirement of TruPS | - | - | - | 365 | - | |||||||||||||||
| Less: Gain on sale of intellectual property | - | - | - | (750 | ) | - | ||||||||||||||
| Less: Gain on insurance settlement | - | - | (4,074 | ) | - | - | ||||||||||||||
| Plus: Donation to Simmons First Foundation | - | - | - | - | 1,738 | |||||||||||||||
| Plus: Merger related costs | 19 | 1,396 | 35 | 1,422 | 19,133 | |||||||||||||||
| Plus: Early retirement program costs | 3,609 | - | - | - | - | |||||||||||||||
| Plus: Branch right sizing costs | 95 | 979 | 1,104 | 1,235 | 380 | |||||||||||||||
| Adjusted Pre-Provision Net Revenue | $ | 72,628 | $ | 82,817 | $ | 92,215 | $ | 99,959 | $ | 89,865 | ||||||||||
Page 13
| Simmons First National Corporation | SFNC | |||||||||||||||||||
| Reconciliation Of Non-GAAP Financial Measures - Year-to-Date | ||||||||||||||||||||
| For the Quarters Ended | Jun 30 | Mar 31 | Dec 31 | Sep 30 | Jun 30 | |||||||||||||||
| (Unaudited) | 2023 | 2023 | 2022 | 2022 | 2022 | |||||||||||||||
| ($ in thousands) | ||||||||||||||||||||
| Calculation of Adjusted Return on Average Assets | ||||||||||||||||||||
| Net income | $ | 103,903 | $ | 45,589 | $ | 256,412 | $ | 173,152 | $ | 92,549 | ||||||||||
| Certain items (non-GAAP) | ||||||||||||||||||||
| (Gain) loss from early retirement of TruPS | - | - | 365 | 365 | - | |||||||||||||||
| Gain on sale of intellectual property | - | - | (750 | ) | (750 | ) | - | |||||||||||||
| Gain on insurance settlement | - | - | (4,074 | ) | - | - | ||||||||||||||
| Donation to Simmons First Foundation | - | - | 1,738 | 1,738 | 1,738 | |||||||||||||||
| Merger related costs | 1,415 | 1,396 | 22,476 | 22,441 | 21,019 | |||||||||||||||
| Early retirement program | 3,609 | - | - | - | - | |||||||||||||||
| Branch right sizing (net) | 1,074 | 979 | 3,628 | 2,524 | 1,289 | |||||||||||||||
| Day 2 CECL provision | - | - | 33,779 | 33,779 | 33,779 | |||||||||||||||
| Tax effect of certain items (2) | (1,593 | ) | (621 | ) | (14,939 | ) | (15,707 | ) | (15,113 | ) | ||||||||||
| Adjusted earnings (non-GAAP) | $ | 108,408 | $ | 47,343 | $ | 298,635 | $ | 217,542 | $ | 135,261 | ||||||||||
| Average total assets | $ | 27,628,202 | $ | 27,488,732 | $ | 26,418,838 | $ | 26,162,136 | $ | 25,802,982 | ||||||||||
| Return on average assets | 0.76 | % | 0.67 | % | 0.97 | % | 0.88 | % | 0.72 | % | ||||||||||
| Adjusted return on average assets (non-GAAP) | 0.79 | % | 0.70 | % | 1.13 | % | 1.11 | % | 1.06 | % | ||||||||||
| Calculation of Return on Tangible Common Equity | ||||||||||||||||||||
| Net income available to common stockholders | $ | 103,903 | $ | 45,589 | $ | 256,412 | $ | 173,152 | $ | 92,549 | ||||||||||
| Amortization of intangibles, net of taxes | 6,052 | 3,026 | 11,756 | 8,721 | 5,600 | |||||||||||||||
| Total income available to common stockholders | $ | 109,955 | $ | 48,615 | $ | 268,168 | $ | 181,873 | $ | 98,149 | ||||||||||
| Certain items (non-GAAP) | ||||||||||||||||||||
| (Gain) loss from early retirement of TruPS | $ | - | $ | - | $ | 365 | $ | 365 | $ | - | ||||||||||
| Gain on sale of intellectual property | - | - | (750 | ) | (750 | ) | - | |||||||||||||
| Gain on insurance settlement | - | - | (4,074 | ) | - | - | ||||||||||||||
| Donation to Simmons First Foundation | - | - | 1,738 | 1,738 | 1,738 | |||||||||||||||
| Merger related costs | 1,415 | 1,396 | 22,476 | 22,441 | 21,019 | |||||||||||||||
| Early retirement program | 3,609 | - | - | - | - | |||||||||||||||
| Branch right sizing (net) | 1,074 | 979 | 3,628 | 2,524 | 1,289 | |||||||||||||||
| Day 2 CECL provision | - | - | 33,779 | 33,779 | 33,779 | |||||||||||||||
| Tax effect of certain items (2) | (1,593 | ) | (621 | ) | (14,939 | ) | (15,707 | ) | (15,113 | ) | ||||||||||
| Adjusted earnings (non-GAAP) | 108,408 | 47,343 | 298,635 | 217,542 | 135,261 | |||||||||||||||
| Amortization of intangibles, net of taxes | 6,052 | 3,026 | 11,756 | 8,721 | 5,600 | |||||||||||||||
| Total adjusted earnings available to common stockholders (non-GAAP) | $ | 114,460 | $ | 50,369 | $ | 310,391 | $ | 226,263 | $ | 140,861 | ||||||||||
| Average common stockholders' equity | $ | 3,364,755 | $ | 3,370,651 | $ | 3,259,664 | $ | 3,274,743 | $ | 3,265,935 | ||||||||||
| Average intangible assets: | ||||||||||||||||||||
| Goodwill | (1,320,215 | ) | (1,319,624 | ) | (1,266,762 | ) | (1,252,486 | ) | (1,223,352 | ) | ||||||||||
| Other intangibles | (125,272 | ) | (127,394 | ) | (121,622 | ) | (118,385 | ) | (109,575 | ) | ||||||||||
| Total average intangibles | (1,445,487 | ) | (1,447,018 | ) | (1,388,384 | ) | (1,370,871 | ) | (1,332,927 | ) | ||||||||||
| Average tangible common stockholders' equity (non-GAAP) | $ | 1,919,268 | $ | 1,923,633 | $ | 1,871,280 | $ | 1,903,872 | $ | 1,933,008 | ||||||||||
| Return on average common equity | 6.23 | % | 5.49 | % | 7.87 | % | 7.07 | % | 5.71 | % | ||||||||||
| Return on tangible common equity | 11.55 | % | 10.25 | % | 14.33 | % | 12.77 | % | 10.24 | % | ||||||||||
| Adjusted return on average common equity (non-GAAP) | 6.50 | % | 5.70 | % | 9.16 | % | 8.88 | % | 8.35 | % | ||||||||||
| Adjusted return on tangible common equity (non-GAAP) | 12.03 | % | 10.62 | % | 16.59 | % | 15.89 | % | 14.70 | % | ||||||||||
| Calculation of Efficiency Ratio and Adjusted Efficiency Ratio (1) | ||||||||||||||||||||
| Noninterest expense (efficiency ratio numerator) | $ | 282,924 | $ | 143,228 | $ | 566,748 | $ | 424,173 | $ | 285,230 | ||||||||||
| Certain noninterest expense items (non-GAAP) | ||||||||||||||||||||
| Merger related costs | (1,415 | ) | (1,396 | ) | (22,476 | ) | (22,441 | ) | (21,019 | ) | ||||||||||
| Early retirement program | (3,609 | ) | - | - | - | - | ||||||||||||||
| Donation to Simmons First Foundation | - | - | (1,738 | ) | (1,738 | ) | (1,738 | ) | ||||||||||||
| Branch right sizing expense | (1,074 | ) | (979 | ) | (3,475 | ) | (2,371 | ) | (1,201 | ) | ||||||||||
| Other real estate and foreclosure expense adjustment | (475 | ) | (186 | ) | (1,003 | ) | (653 | ) | (485 | ) | ||||||||||
| Amortization of intangibles adjustment | (8,194 | ) | (4,096 | ) | (15,915 | ) | (11,807 | ) | (7,582 | ) | ||||||||||
| Adjusted efficiency ratio numerator | $ | 268,157 | $ | 136,571 | $ | 522,141 | $ | 385,163 | $ | 253,205 | ||||||||||
| Net interest income | $ | 341,065 | $ | 177,835 | $ | 717,316 | $ | 524,290 | $ | 330,705 | ||||||||||
| Noninterest income | 90,815 | 45,835 | 170,066 | 125,419 | 82,396 | |||||||||||||||
| Fully tax-equivalent adjustment (effective tax rate of 26.135%) | 12,417 | 6,311 | 24,671 | 17,901 | 11,698 | |||||||||||||||
| Efficiency ratio denominator | 444,297 | 229,981 | 912,053 | 667,610 | 424,799 | |||||||||||||||
| Certain noninterest income items (non-GAAP) | ||||||||||||||||||||
| Gain on insurance settlement | - | - | (4,074 | ) | - | - | ||||||||||||||
| (Gain) loss from early retirement of TruPS | - | - | 365 | 365 | - | |||||||||||||||
| Gain on sale of intellectual property | - | - | (750 | ) | (750 | ) | - | |||||||||||||
| Branch right sizing income | - | - | 153 | 153 | 88 | |||||||||||||||
| (Gain) loss on sale of securities | 391 | - | 278 | 226 | 204 | |||||||||||||||
| Adjusted efficiency ratio denominator | $ | 444,688 | $ | 229,981 | $ | 908,025 | $ | 667,604 | $ | 425,091 | ||||||||||
| Efficiency ratio (1) | 63.68 | % | 62.28 | % | 62.14 | % | 63.54 | % | 67.14 | % | ||||||||||
| Adjusted efficiency ratio (non-GAAP) (1) | 60.30 | % | 59.38 | % | 57.50 | % | 57.69 | % | 59.56 | % | ||||||||||
(1) Efficiency ratio is noninterest expense as a percent of net interest income (fully taxable equivalent) and noninterest revenues. Adjusted efficiency ratio is noninterest expense before foreclosed property expense, amortization of intangibles and certain adjusting items as a percent of net interest income (fully taxable equivalent) and noninterest revenues, excluding gains and losses from securities transactions and certain adjusting items, and is a non-GAAP measurement.
(2) Effective tax rate of 26.135%.
Page 14
Exhibit 99.2

Nasdaq: SFNC 2 nd Quarter 2023 Earnings Presentation Contents 3 Company Profile 4 Q2 Financial Highlights 12 Deposits, Securities, Liquidity, Interest Rate Sensitivity and Capital 18 Loan Portfolio 22 Credit Quality 26 Q2 23 Key Takeaways 28 Appendix
2 Forward - Looking Statements and Non - GAAP Financial Measures Forward - Looking Statements . Certain statements by Simmons First National Corporation (the “Company”, which where appropriate includes the Company’s wholly - owned banking subsidiary, Simmons Bank) contained in this presentation may not be based on historical facts and should be considered "forward - looking statements" within the meaning of the Private Securities Litigation Reform Act of 1995 . These forward - looking statements may be identified by reference to a future period(s) or by the use of forward - looking terminology, such as "anticipate," “believe,” “continue,” "estimate," "expect," "foresee,“ “indicate,” “plan,” “potential,” “project,” “target,” "may," "might," "will," "would," "could,“ “should,” “likely” or "intend," future or conditional verb tenses, and variations or negatives of such terms or by similar expressions . These forward - looking statements include, without limitation, statements relating to the Company’s future growth ; business strategies ; product development ; revenue ; expenses (including interest expense and non - interest expenses) ; assets ; loan demand (including loan growth, loan capacity, and other lending activity) ; deposit levels ; asset quality ; profitability ; earnings ; critical accounting policies ; accretion ; net interest margin ; noninterest income ; the Company's common stock repurchase program ; adequacy of the allowance for credit losses ; income tax deductions ; credit quality ; level of credit losses from lending commitments ; net interest revenue ; interest rate sensitivity (including, among other things, the potential impact of rising rates) ; loan loss experience ; liquidity ; capital resources ; future economic conditions and market risk ; interest rates ; the expected benefits, milestones, timelines, and costs associated with the Company’s merger and acquisition strategy and activity ; the Company’s ability to recruit and retain key employees ; increases in, and cash flows associated with, the Company’s securities portfolio ; legal and regulatory limitations and compliance and competition ; anticipated loan principal reductions ; plans for investments in and cash flows from securities ; projections regarding securities investments and maturities thereof ; statements contained in the “ 2023 Efficiency Targets Update” and “Long - Term Objectives” set forth on slide 11 ; the interest rate sensitivity estimates, as well as the estimated interest income effect of the fair value hedges, noted on slide 16 ; digital bank initiatives ; and dividends . Readers are cautioned not to place undue reliance on the forward - looking statements contained in this presentation in that actual results could differ materially from those indicated in or implied by such forward - looking statements due to a variety of factors . These factors include, but are not limited to, changes in the Company's operating or expansion strategy ; the availability of and costs associated with obtaining adequate and timely sources of liquidity ; the ability to maintain credit quality ; the effects of the pandemic on, among other things, the Company’s operations, liquidity, and credit quality ; changes in general market and economic conditions ; increased unemployment ; labor shortages ; possible adverse rulings, judgments, settlements and other outcomes of pending or future litigation ; the ability of the Company to collect amounts due under loan agreements ; changes in consumer preferences and loan demand ; the effectiveness of the Company's interest rate risk management strategies ; laws and regulations affecting financial institutions in general or relating to taxes ; the effect of pending or future legislation ; the ability of the Company to repurchase its common stock on favorable terms ; the ability of the Company to successfully manage and implement its acquisition strategy and integrate acquired institutions ; difficulties and delays in integrating an acquired business or fully realizing cost savings and other benefits of mergers and acquisitions ; changes in interest rates, deposit flows, real estate values, and capital markets ; increased inflation ; customer acceptance of the Company's products and services ; changes or disruptions in technology and IT systems (including cyber threats, attacks and events) ; changes in accounting principles relating to loan loss recognition (current expected credit losses, or CECL) ; the benefits associated with the Company’s early retirement program ; political crises, war, and other military conflicts (including the ongoing military conflict between Russia and Ukraine) or other major events, or the prospect of these events ; increased competition ; changes in governmental policies ; loss of key employees ; the soundness of other financial institutions and indirect exposure related to the closings of Silicon Valley Bank (“SVB”), Signature Bank and Silvergate Bank and their impact on the broader market through other customers, suppliers and partners (or that the conditions which resulted in the liquidity concerns with SVB, Signature Bank and Silvergate Bank may also adversely impact, directly or indirectly, other financial institutions and market participants with which the Company has commercial or deposit relationships) ; and other risk factors . Other relevant risk factors may be detailed from time to time in the Company's press releases and filings with the U . S . Securities and Exchange Commission, including, without limitation, the Company’s Form 10 - K for the year ended December 31 , 2022 , and the Company’s Form 10 - Q for the quarterly period ended March 31 , 2023 . In addition, there can be no guarantee that the board of directors (“Board”) of the Company will approve a quarterly dividend in future quarters, and the timing, payment, and amount of future dividends (if any) is subject to, among other things, the discretion of the Board and may differ significantly from past dividends . Any forward - looking statement speaks only as of the date of this presentation, and the Company undertakes no obligation to update these forward - looking statements to reflect events or circumstances that occur after the date of this presentation . Annualized, pro forma, projected and estimated numbers are used for illustrative purpose only, are not forecasts and may not reflect actual results . Non - GAAP Financial Measures . This presentation contains financial information determined by methods other than in accordance with U . S . generally accepted accounting principles (“GAAP”) . The Company’s management uses these non - GAAP financial measures in their analysis of the Company’s performance and capital adequacy . These measures adjust GAAP performance measures to, among other things, include the tax benefit associated with revenue items that are tax - exempt, as well as exclude from net income (including on a per share diluted basis), pre - tax, pre - provision earnings, net charge - offs, income available to common shareholders, non - interest income, and non - interest expense certain income and expense items attributable to, for example, merger activity (primarily including merger - related expenses and Day 2 CECL provisions), gains and/or losses on sale of branches, net branch right - sizing initiatives, loss on redemption of trust preferred securities and gain on sale of intellectual property . In addition, the Company also presents certain figures based on tangible common stockholders’ equity, tangible assets and tangible book value, which exclude goodwill and other intangible assets, and presents certain other figures to include the effect that accumulated other comprehensive income could have on the Company’s capital levels . The Company further presents certain figures that are exclusive of the impact of Paycheck Protection Program (“PPP”) loans, deposits and/or loans acquired through acquisitions, mortgage warehouse loans, and/or energy loans, or gains and/or losses on the sale of securities . The Company’s management believes that these non - GAAP financial measures are useful to investors because they, among other things, present the results of the Company’s ongoing operations without the effect of mergers or other items not central to the Company’s ongoing business, present the Company’s capital inclusive of the potential impact of AOCI (primarily comprised of unrealized losses on securities), as well as normalize for tax effects, the effects of the PPP, and certain other effects . Management, therefore, believes presentations of these non - GAAP financial measures provide useful supplemental information that is essential to a proper understanding of the operating results of the Company’s ongoing businesses, and management uses these non - GAAP financial measures to assess the performance of the Company’s ongoing businesses as related to prior financial periods . These non - GAAP disclosures should not be viewed as a substitute for operating results determined in accordance with GAAP, nor are they necessarily comparable to non - GAAP performance measures that may be presented by other companies . Where non - GAAP financial measures are used, the comparable GAAP financial measure, as well as the reconciliation to the comparable GAAP financial measure, can be found in the appendix to this presentation .
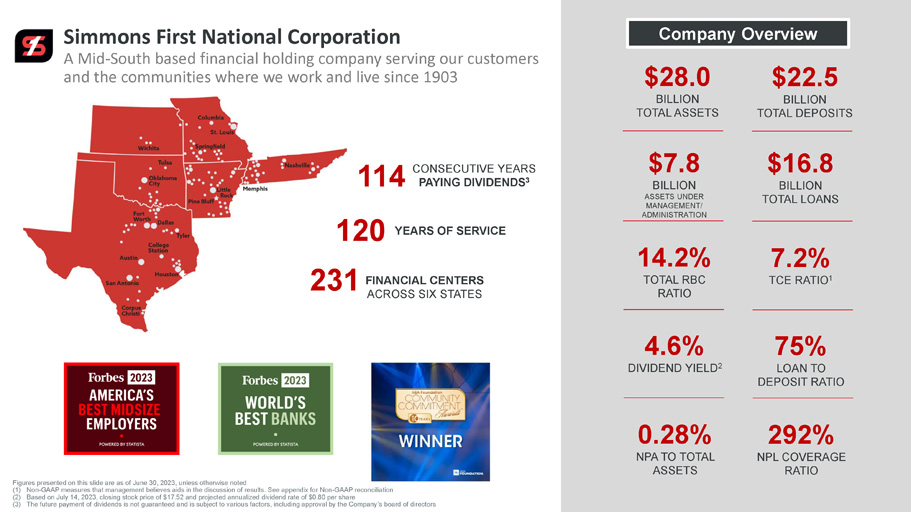
3 Simmons First National Corporation A Mid - South based financial holding company serving our customers and the communities where we work and live since 1903 Company Overview $28.0 BILLION TOTAL ASSETS $22.5 BILLION TOTAL DEPOSITS 114 CONSECUTIVE YEARS PAYING DIVIDENDS 3 $7.8 BILLION ASSETS UNDER MANAGEMENT/ ADMINISTRATION $16.8 BILLION TOTAL LOANS 120 YEARS OF SERVICE 231 FINANCIAL CENTERS ACROSS SIX STATES 14.2% TOTAL RBC RATIO 7.2% TCE RATIO 1 4.6% DIVIDEND YIELD 2 75% LOAN TO DEPOSIT RATIO 0.28% NPA TO TOTAL ASSETS 292% NPL COVERAGE RATIO Figures presented on this slide are as of June 30, 2023, unless otherwise noted (1) Non - GAAP measures that management believes aids in the discussion of results.

Q2 23 Financial Highlights
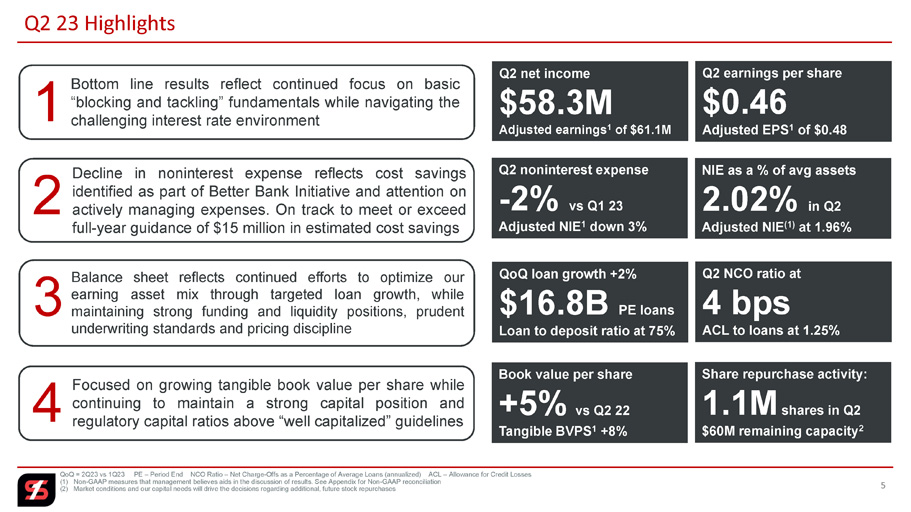
See appendix for Non - GAAP reconciliation (2) Based on July 14, 2023, closing stock price of $17.52 and projected annualized dividend rate of $0.80 per share (3) The future payment of dividends is not guaranteed and is subject to various factors, including approval by the Company’ s b oard of directors 5 Q2 23 Highlights Q 2 net income $58.3M Adjusted earnings 1 of $61.1M 1 Q 2 earnings per share $0.46 Adjusted EPS 1 of $0.48 1 Bottom line results reflect continued focus on basic “blocking and tackling” fundamentals while navigating the challenging interest rate environment Q 2 noninterest expense - 2% vs Q1 23 Adjusted NIE 1 down 3% 2 Decline in noninterest expense reflects cost savings identified as part of Better Bank Initiative and attention on actively managing expenses . On track to meet or exceed full - year guidance of $ 15 million in estimated cost savings NIE as a % of avg assets 2.02% in Q2 Adjusted NIE (1) at 1.96% QoQ loan growth + 2 % $16.8B PE loans Loan to deposit ratio at 75% 3 Balance sheet reflects continued efforts to optimize our earning asset mix through targeted loan growth, while maintaining strong funding and liquidity positions, prudent underwriting standards and pricing discipline Q 2 NCO ratio at 4 bps ACL to loans at 1.25% Book value per share +5% vs Q2 22 Tangible BVPS 1 +8% 4 Focused on growing tangible book value per share while continuing to maintain a strong capital position and regulatory capital ratios above “well capitalized” guidelines Share repurchase activity : 1.1M shares in Q2 $60M remaining capacity 2 QoQ = 2Q23 vs 1Q23 PE – Period End NCO Ratio – Net Charge - Offs as a Percentage of Average Loans (annualized) ACL – Allowan ce for Credit Losses (1) Non - GAAP measures that management believes aids in the discussion of results.
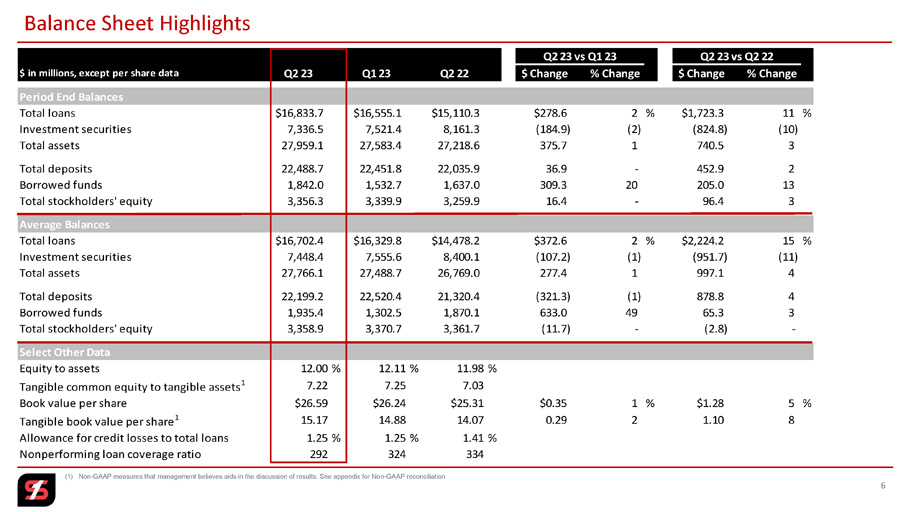
See Appendix for Non - GAAP reconciliation (2) Market conditions and our capital needs will drive the decisions regarding additional, future stock repurchases 6 Balance Sheet Highlights $ in millions, except per share data Q2 23 Q1 23 Q2 22 $ Change % Change $ Change % Change Period End Balances Total loans $16,833.7 $16,555.1 $15,110.3 $278.6 2 % $1,723.3 11 % Investment securities 7,336.5 7,521.4 8,161.3 (184.9) (2) (824.8) (10) Total assets 27,959.1 27,583.4 27,218.6 375.7 1 740.5 3 Total deposits 22,488.7 22,451.8 22,035.9 36.9 - 452.9 2 Borrowed funds 1,842.0 1,532.7 1,637.0 309.3 20 205.0 13 Total stockholders' equity 3,356.3 3,339.9 3,259.9 16.4 - 96.4 3 Average Balances Total loans $16,702.4 $16,329.8 $14,478.2 $372.6 2 % $2,224.2 15 % Investment securities 7,448.4 7,555.6 8,400.1 (107.2) (1) (951.7) (11) Total assets 27,766.1 27,488.7 26,769.0 277.4 1 997.1 4 Total deposits 22,199.2 22,520.4 21,320.4 (321.3) (1) 878.8 4 Borrowed funds 1,935.4 1,302.5 1,870.1 633.0 49 65.3 3 Total stockholders' equity 3,358.9 3,370.7 3,361.7 (11.7) - (2.8) - Select Other Data Equity to assets 12.00% 12.11% 11.98% Tangible common equity to tangible assets 1 7.22 7.25 7.03 Book value per share $26.59 $26.24 $25.31 $0.35 1 % $1.28 5 % Tangible book value per share 1 15.17 14.88 14.07 0.29 2 1.10 8 Allowance for credit losses to total loans 1.25% 1.25% 1.41% Nonperforming loan coverage ratio 292 324 334 Q2 23 vs Q1 23 Q2 23 vs Q2 22 (1) Non - GAAP measures that management believes aids in the discussion of results.
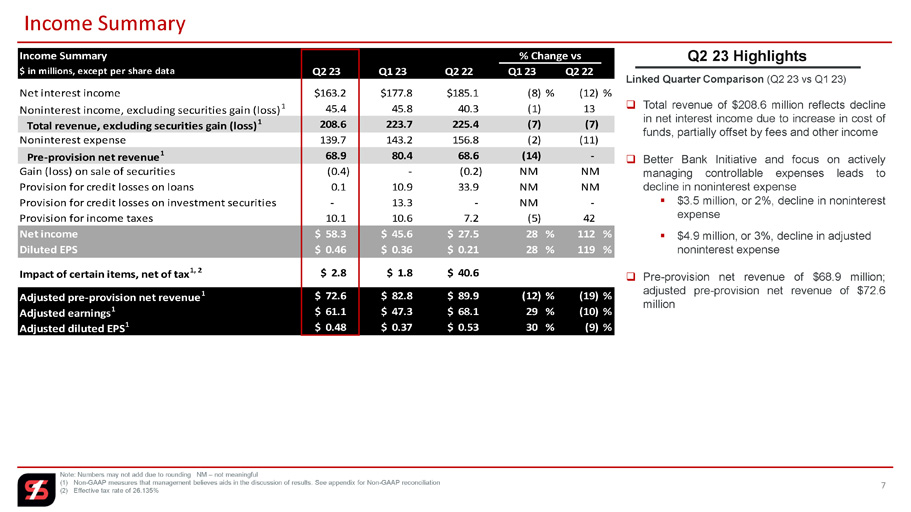
See appendix for Non - GAAP reconciliation Q2 23 Highlights Linked Quarter Comparison (Q2 23 vs Q1 23) □ Total revenue of $ 208 . 6 million reflects decline in net interest income due to increase in cost of funds, partially offset by fees and other income □ Better Bank Initiative and focus on actively managing controllable expenses leads to decline in noninterest expense ▪ $ 3 . 5 million, or 2 % , decline in noninterest expense ▪ $4.9 million, or 3%, decline in adjusted noninterest expense □ Pre - provision net revenue of $ 68 . 9 million ; adjusted pre - provision net revenue of $ 72 . 6 million % Change vs Q1 23 Q2 22 Q1 23 Q2 22 Q2 23 Income Summary $ in millions, except per share data (12) % (8) % $177.8 $185.1 $163.2 Net interest income 13 (1) 45.8 40.3 45.4 Noninterest income, excluding securities gain (loss) 1 (7) (7) 223.7 225.4 208.6 Total revenue, excluding securities gain (loss) 1 (11) (2) 143.2 156.8 139.7 Noninterest expense - (14) 80.4 68.6 68.9 Pre - provision net revenue 1 NM NM - (0.2) (0.4) Gain (loss) on sale of securities NM NM 10.9 33.9 0.1 Provision for credit losses on loans - NM 13.3 - - Provision for credit losses on investment securities 42 (5) 10.6 7.2 10.1 Provision for income taxes 112 % 28 % $ 45.6 $ 27.5 $ 58.3 Net income 119 % 28 % $ 0.36 $ 0.21 $ 0.46 Diluted EPS $ 1.8 $ 40.6 $ 2.8 Impact of certain items, net of tax 1, 2 (19) % (12) % $ 82.8 $ 89.9 $ 72.6 Adjusted pre - provision net revenue 1 (10) % 29 % $ 47.3 $ 68.1 $ 61.1 Adjusted earnings 1 (9) % 30 % $ 0.37 $ 0.53 $ 0.48 Adjusted diluted EPS 1 7 Income Summary Note: Numbers may not add due to rounding NM – not meaningful (1) Non - GAAP measures that management believes aids in the discussion of results.
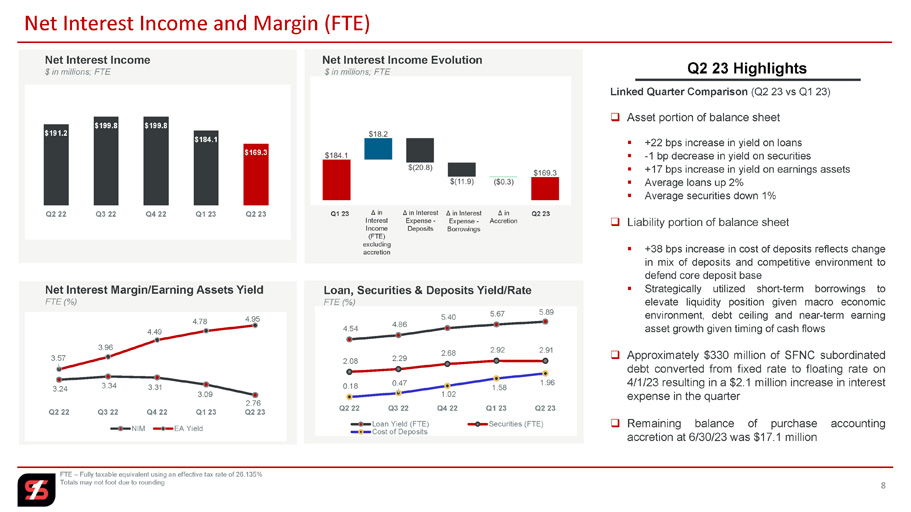
See appendix for Non - GAAP reconciliation (2) Effective tax rate of 26.135% Q2 23 Highlights 8 Net Interest Income and Margin (FTE) FTE – Fully taxable equivalent using an effective tax rate of 26.135% Totals may not foot due to rounding $191.2 $199.8 $199.8 $184.1 $169.3 Q2 22 Q3 22 Q4 22 Q1 23 Q2 23 Net Interest Income $ in millions; FTE Δ in Interest Income (FTE) excluding accretion Δ in Interest Expense - Deposits Δ in Accretion Net Interest Income Evolution $ in millions; FTE Net Interest Margin/Earning Assets Yield FTE (%) 3.24 3.34 3.31 3.09 2.76 3.57 3.96 4.49 4.78 4.95 Q2 22 Q3 22 Q4 22 Q1 23 Q2 23 NIM EA Yield 4.54 4.86 5.40 5.67 5.89 2.08 2.29 2.68 2.92 2.91 0.18 0.47 1.02 1.58 1.96 Q2 22 Q3 22 Q4 22 Q1 23 Q2 23 Loan Yield (FTE) Securities (FTE) Cost of Deposits Loan, Securities & Deposits Yield/Rate FTE (%) Q1 23 Q2 23 Linked Quarter Comparison (Q 2 23 vs Q 1 23 ) □ Asset portion of balance sheet ▪ + 22 bps increase in yield on loans ▪ - 1 bp decrease in yield on securities ▪ + 17 bps increase in yield on earnings assets ▪ Average loans up 2 % ▪ Average securities down 1 % □ Liability portion of balance sheet ▪ + 38 bps increase in cost of deposits reflects change in mix of deposits and competitive environment to defend core deposit base ▪ Strategically utilized short - term borrowings to elevate liquidity position given macro economic environment, debt ceiling and near - term earning asset growth given timing of cash flows □ Approximately $ 330 million of SFNC subordinated debt converted from fixed rate to floating rate on 4 / 1 / 23 resulting in a $ 2 . 1 million increase in interest expense in the quarter □ Remaining balance of purchase accounting accretion at 6 / 30 / 23 was $ 17 .
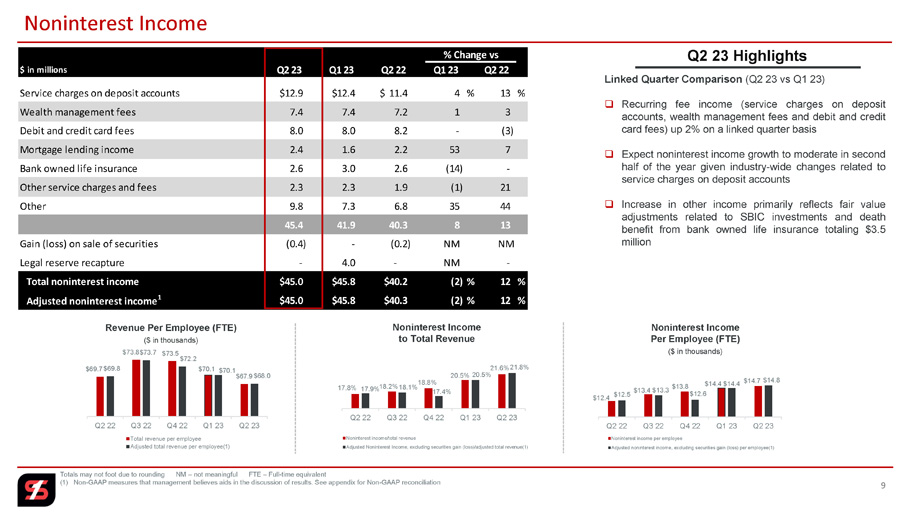
1 million Δ in Interest Expense - Borrowings $12.4 $13.4 $13.8 $14.4 $14.7 $12.5 $13.3 $12.6 $14.4 $14.8 Q2 22 Q3 22 Q4 22 Q1 23 Q2 23 Noninterest income per employee Adjusted noninterest income, excluding securities gain (loss) per employee(1) Noninterest Income Per Employee (FTE) ($ in thousands) $ in millions Q2 23 Q1 23 Q2 22 Q1 23 Q2 22 Service charges on deposit accounts $12.9 $12.4 $ 11.4 4 % 13 % Wealth management fees 7.4 7.4 7.2 1 3 Debit and credit card fees 8.0 8.0 8.2 - (3) Mortgage lending income 2.4 1.6 2.2 53 7 Bank owned life insurance 2.6 3.0 2.6 (14) - Other service charges and fees 2.3 2.3 1.9 (1) 21 Other 9.8 7.3 6.8 35 44 45.4 41.9 40.3 8 13 Gain (loss) on sale of securities (0.4) - (0.2) NM NM Legal reserve recapture - 4.0 - NM - Total noninterest income $45.0 $45.8 $40.2 (2) % 12 % Adjusted noninterest income 1 $45.0 $45.8 $40.3 (2) % 12 % % Change vs 17.8% 18.2% 18.8% 20.5% 21.6% 17.9% 18.1% 17.4% 20.5% 21.8% Q2 22 Q3 22 Q4 22 Q1 23 Q2 23 Noninterest income/total revenue Adjusted Noninterest Income, excluding securities gain (loss)/adjusted total revenue(1) Noninterest Income to Total Revenue $69.7 $73.8 $73.5 $70.1 $67.9 $69.8 $73.7 $72.2 $70.1 $68.0 Q2 22 Q3 22 Q4 22 Q1 23 Q2 23 Total revenue per employee Adjusted total revenue per employee(1) Revenue Per Employee (FTE) ($ in thousands) 9 Noninterest Income Totals may not foot due to rounding NM – not meaningful FTE – Full - time equivalent (1) Non - GAAP measures that management believes aids in the discussion of results. See appendix for Non - GAAP reconciliation Q2 23 Highlights Linked Quarter Comparison (Q 2 23 vs Q 1 23 ) □ Recurring fee income (service charges on deposit accounts, wealth management fees and debit and credit card fees) up 2 % on a linked quarter basis □ Expect noninterest income growth to moderate in second half of the year given industry - wide changes related to service charges on deposit accounts □ Increase in other income primarily reflects fair value adjustments related to SBIC investments and death benefit from bank owned life insurance totaling $ 3 .
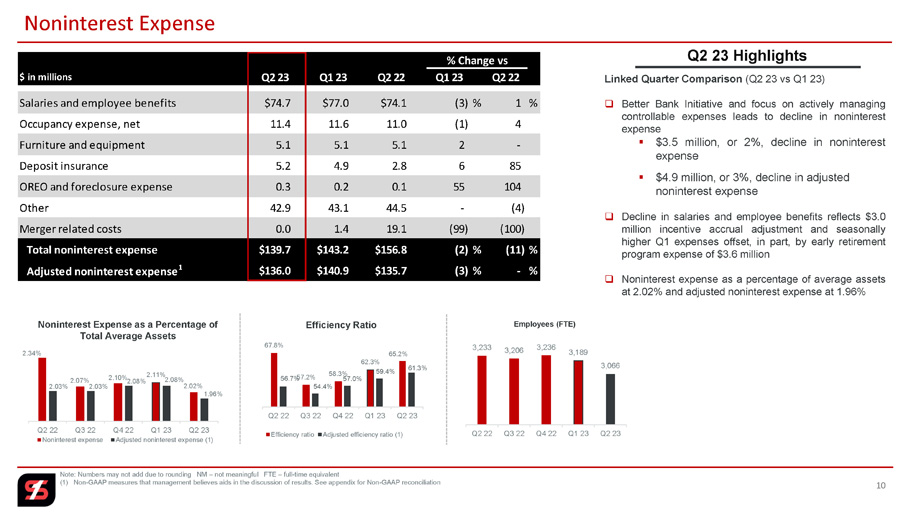
5 million $ in millions Q2 23 Q1 23 Q2 22 Q1 23 Q2 22 Salaries and employee benefits $74.7 $77.0 $74.1 (3) % 1 % Occupancy expense, net 11.4 11.6 11.0 (1) 4 Furniture and equipment 5.1 5.1 5.1 2 - Deposit insurance 5.2 4.9 2.8 6 85 OREO and foreclosure expense 0.3 0.2 0.1 55 104 Other 42.9 43.1 44.5 - (4) Merger related costs 0.0 1.4 19.1 (99) (100) Total noninterest expense $139.7 $143.2 $156.8 (2) % (11)% Adjusted noninterest expense 1 $136.0 $140.9 $135.7 (3) % - % % Change vs 3,233 3,206 3,236 3,189 3,066 Q2 22 Q3 22 Q4 22 Q1 23 Q2 23 Employees (FTE) 67.8% 57.2% 58.3% 62.3% 65.2% 56.7% 54.4% 57.0% 59.4% 61.3% Q2 22 Q3 22 Q4 22 Q1 23 Q2 23 Efficiency ratio Adjusted efficiency ratio (1) Efficiency Ratio 2.34% 2.07% 2.10% 2.11% 2.02% 2.03% 2.03% 2.08% 2.08% 1.96% Q2 22 Q3 22 Q4 22 Q1 23 Q2 23 Noninterest expense Adjusted noninterest expense (1) Noninterest Expense as a Percentage of Total Average Assets 10 Noninterest Expense Note: Numbers may not add due to rounding NM – not meaningful FTE – full - time equivalent (1) Non - GAAP measures that management believes aids in the discussion of results. See appendix for Non - GAAP reconciliation Q2 23 Highlights Linked Quarter Comparison (Q 2 23 vs Q 1 23 ) □ Better Bank Initiative and focus on actively managing controllable expenses leads to decline in noninterest expense ▪ $ 3 . 5 million, or 2 % , decline in noninterest expense ▪ $4.9 million, or 3%, decline in adjusted noninterest expense □ Decline in salaries and employee benefits reflects $ 3 . 0 million incentive accrual adjustment and seasonally higher Q 1 expenses offset, in part, by early retirement program expense of $ 3 . 6 million □ Noninterest expense as a percentage of average assets at 2 . 02 % and adjusted noninterest expense at 1 .
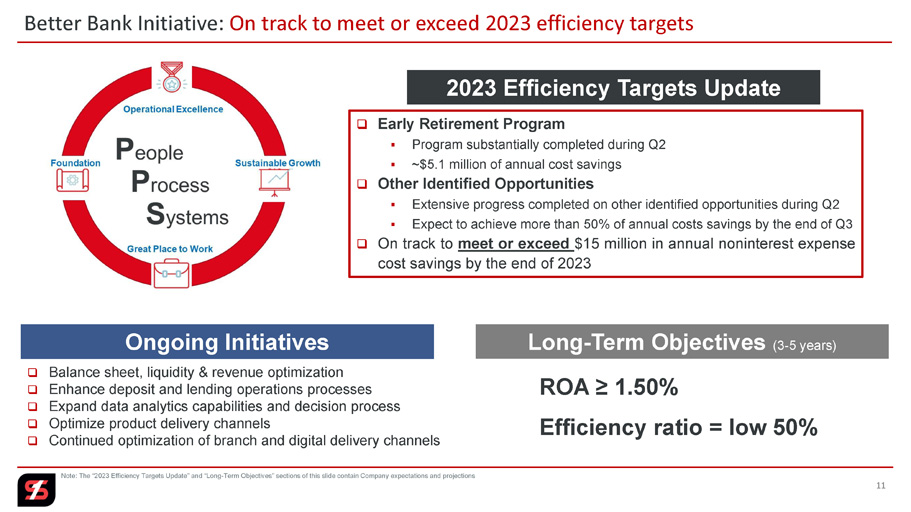
96 % Note: The “2023 Efficiency Targets Update” and “Long - Term Objectives” sections of this slide contain Company expectations and pr ojections Better Bank Initiative: On track to meet or exceed 2023 efficiency targets Long - Term Objectives (3 - 5 years) ROA ≥ 1.50% Efficiency ratio = low 50% 11 2023 Efficiency Targets Update Ongoing Initiatives □ Balance sheet, liquidity & revenue optimization □ Enhance deposit and lending operations processes □ Expand data analytics capabilities and decision process □ Optimize product delivery channels □ Continued optimization of branch and digital delivery channels □ Early Retirement Program ▪ Program substantially completed during Q 2 ▪ ~ $ 5 . 1 million of annual cost savings □ Other Identified Opportunities ▪ Extensive progress completed on other identified opportunities during Q 2 ▪ Expect to achieve more than 50 % of annual costs savings by the end of Q 3 □ On track to meet or exceed $ 15 million in annual noninterest expense cost savings by the end of 2023 Deposits, Securities, Liquidity, Interest Rate Sensitivity and Capital

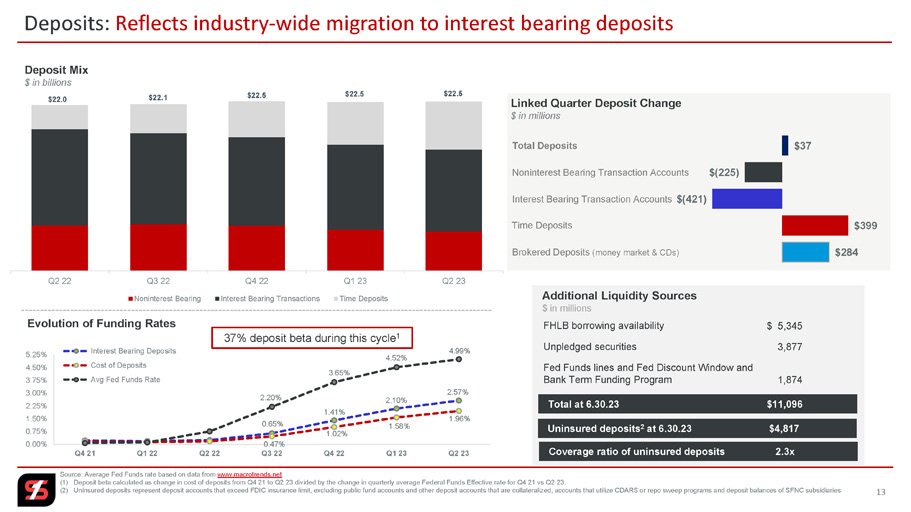
0.65% 1.41% 2.10% 2.57% 0.47% 1.02% 1.58% 1.96% 2.20% 3.65% 4.52% 4.99% 0.00% 0.75% 1.50% 2.25% 3.00% 3.75% 4.50% 5.25% Q4 21 Q1 22 Q2 22 Q3 22 Q4 22 Q1 23 Q2 23 Interest Bearing Deposits Cost of Deposits Avg Fed Funds Rate Q2 22 Q3 22 Q4 22 Q1 23 Q2 23 Noninterest Bearing Interest Bearing Transactions Time Deposits 13 Deposits: Reflects industry - wide migration to interest bearing deposits Source: Average Fed Funds rate based on data from www.macrotrends.net (1) Deposit beta calculated as change in cost of deposits from Q4 21 to Q2 23 divided by the change in quarterly average Fe der al Funds Effective rate for Q4 21 vs Q2 23.
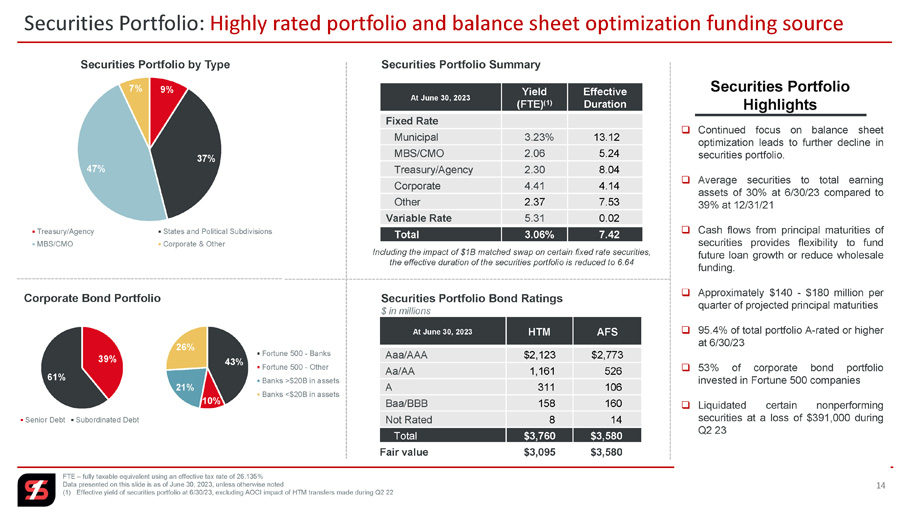
(2) Uninsured deposits represent deposit accounts that exceed FDIC insurance limit, excluding public fund accounts and othe r d eposit accounts that are collateralized, accounts that utilize CDARS or repo sweep programs and deposit balances of SFNC subs idi aries $22.0 Evolution of Funding Rates $22.1 $22.5 $284 $399 $(421) $(225) $37 Linked Quarter Deposit Change $ in millions Total Deposits Noninterest Bearing Transaction Accounts Interest Bearing Transaction Accounts Time Deposits Deposit Mix $ in billions $22.5 Brokered Deposits (money market & CDs) 37% deposit beta during this cycle 1 $22.5 FHLB borrowing availability Unpledged securities Fed Funds lines and Fed Discount Window and Bank Term Funding Program Additional Liquidity Sources $ in millions Total at 6.30.23 $11,096 $ 5,345 3,877 1,874 Uninsured deposits 2 at 6.30.23 $4,817 Coverage ratio of uninsured deposits 2.3x Securities Portfolio: Highly rated portfolio and balance sheet optimization funding source FTE – fully taxable equivalent using an effective tax rate of 26.135% Data presented on this slide is as of June 30, 2023, unless otherwise noted (1) Effective yield of securities portfolio at 6/30/23, excluding AOCI impact of HTM transfers made during Q2 22 14 9% 37% 47% 7% Securities Portfolio by Type Treasury/Agency States and Political Subdivisions MBS/CMO Corporate & Other AFS HTM At June 30, 2023 $2,773 $2,123 Aaa /AAA 526 1,161 Aa/AA 106 311 A 160 158 Baa/BBB 14 8 Not Rated $3,580 $ 3 , 760 Total $3,580 $ 3 , 095 Fair value Securities Portfolio Bond Ratings $ in millions 39% 61% Senior Debt Subordinated Debt Corporate Bond Portfolio Effective Duration Yield (FTE) (1) At June 30, 2023 Fixed Rate 13.12 3.23% Municipal 5.24 2.06 MBS/CMO 8.04 2.30 Treasury/Agency 4.14 4.41 Corporate 7.53 2.37 Other 0.02 5.31 Variable Rate 7.42 3.06% Total Securities Portfolio Summary Including the impact of $1B matched swap on certain fixed rate securities, the effective duration of the securities portfolio is reduced to 6.64 Securities Portfolio Highlights □ Continued focus on balance sheet optimization leads to further decline in securities portfolio . □ Average securities to total earning assets of 30 % at 6 / 30 / 23 compared to 39 % at 12 / 31 / 21 □ Cash flows from principal maturities of securities provides flexibility to fund future loan growth or reduce wholesale funding . □ Approximately $ 140 - $ 180 million per quarter of projected principal maturities □ 95 .
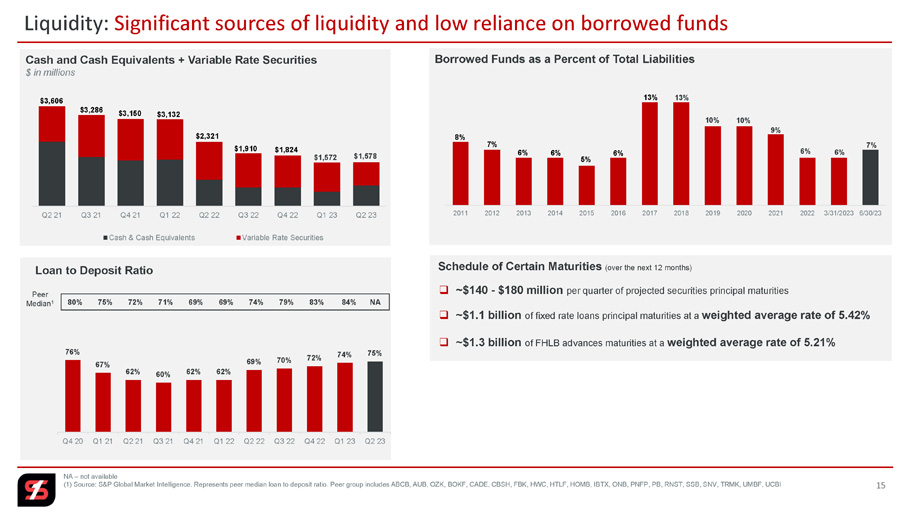
4 % of total portfolio A - rated or higher at 6 / 30 / 23 □ 53 % of corporate bond portfolio invested in Fortune 500 companies □ Liquidated certain nonperforming securities at a loss of $ 391 , 000 during Q 2 23 43% 10% 21% 26% Fortune 500 - Banks Fortune 500 - Other Banks >$20B in assets Banks <$20B in assets Loan to Deposit Ratio 76% 67% 62% 60% 62% 62% 69% 70% 72% 74% 75% Q4 20 Q1 21 Q2 21 Q3 21 Q4 21 Q1 22 Q2 22 Q3 22 Q4 22 Q1 23 Q2 23 Peer Median 1 80% 75% 72% 71% 69% 69% 74% 79% 83% 84% NA Schedule of Certain Maturities (over the next 12 months) 15 Liquidity: Significant sources of liquidity and low reliance on borrowed funds Cash and Cash Equivalents + Variable Rate Securities $ in millions Q2 21 Q3 21 Q4 21 Q1 22 Q2 22 Q3 22 Q4 22 Q1 23 Q2 23 Cash & Cash Equivalents Variable Rate Securities $3,606 $3,286 $3,150 $3,132 $2,321 $1,910 $1,824 NA – not available (1) Source: S&P Global Market Intelligence. Represents peer median loan to deposit ratio. Peer group includes ABCB, AUB, OZK, BO KF, CADE, CBSH, FBK, HWC, HTLF, HOMB, IBTX, ONB, PNFP, PB, RNST, SSB, SNV, TRMK, UMBF, UCBI Borrowed Funds as a Percent of Total Liabilities 2011 2012 2013 2014 2015 2016 2017 2018 2019 2020 2021 2022 3/31/2023 6/30/23 8% 7% 6% 6% 5% 6% 13% 13% 10% 10% 9% 6% 6% $1,572 □ ~ $ 140 - $ 180 million per quarter of projected securities principal maturities □ ~ $ 1 . 1 billion of fixed rate loans principal maturities at a weighted average rate of 5 . 42 % □ ~ $ 1 . 3 billion of FHLB advances maturities at a weighted average rate of 5 .
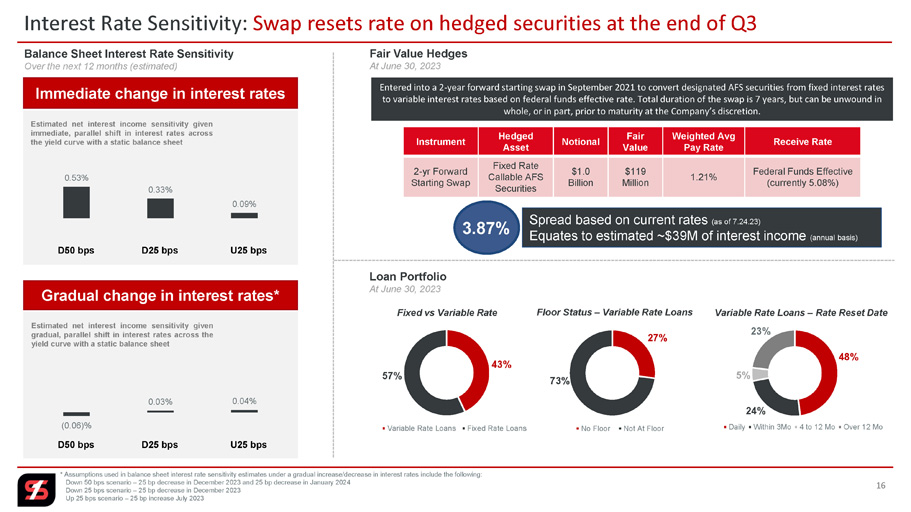
21 % $1,578 7% 16 Interest Rate Sensitivity: Swap resets rate on hedged securities at the end of Q3 Balance Sheet Interest Rate Sensitivity Over the next 12 months (estimated) 0.53% 0.33% 0.09% D50 bps D25 bps U25 bps Estimated net interest income sensitivity given immediate, parallel shift in interest rates across the yield curve with a static balance sheet Immediate change in interest rates Loan Portfolio At June 30, 2023 43% 57% Variable Rate Loans Fixed Rate Loans Fixed vs Variable Rate 27% 73% No Floor Not At Floor Floor Status – Variable Rate Loans 48% 24% 5% 23% Daily Within 3Mo 4 to 12 Mo Over 12 Mo Variable Rate Loans – Rate Reset Date Gradual change in interest rates* Estimated net interest income sensitivity given gradual, parallel shift in interest rates across the yield curve with a static balance sheet Fair Value Hedges At June 30, 2023 * Assumptions used in balance sheet interest rate sensitivity estimates under a gradual increase/decrease in interest rates i ncl ude the following: Down 50 bps scenario – 25 bp decrease in December 2023 and 25 bp decrease in January 2024 Down 25 bps scenario – 25 bp decrease in December 2023 Up 25 bps scenario – 25 bp increase July 2023 Entered into a 2 - year forward starting swap in September 2021 to convert designated AFS securities from fixed interest rates to variable interest rates based on federal funds effective rate. Total duration of the swap is 7 years, but can be unwound i n whole, or in part, prior to maturity at the Company’s discretion. Receive Rate Weighted Avg Pay Rate Fair Value Notional Hedged Asset Instrument Federal Funds Effective (currently 5.08%) 1.21% $119 Million $1.0 Billion Fixed Rate Callable AFS Securities 2 - yr Forward Starting Swap Spread based on current rates (as of 7.24.23) Equates to estimated ~$39M of interest income (annual basis) 3.87% (0.06)% 0.03% 0.04% D50 bps D25 bps U25 bps 17 Capital: Focused on growing tangible book value while maintaining a strong capital position (1) Q2 23 data as of June 30, 2023, Q1 23 data as of March 31, 2023, and Q2 22 data as of June 30, 2022 (2) Non - GAAP measure that management believes aids in the discussion of results.
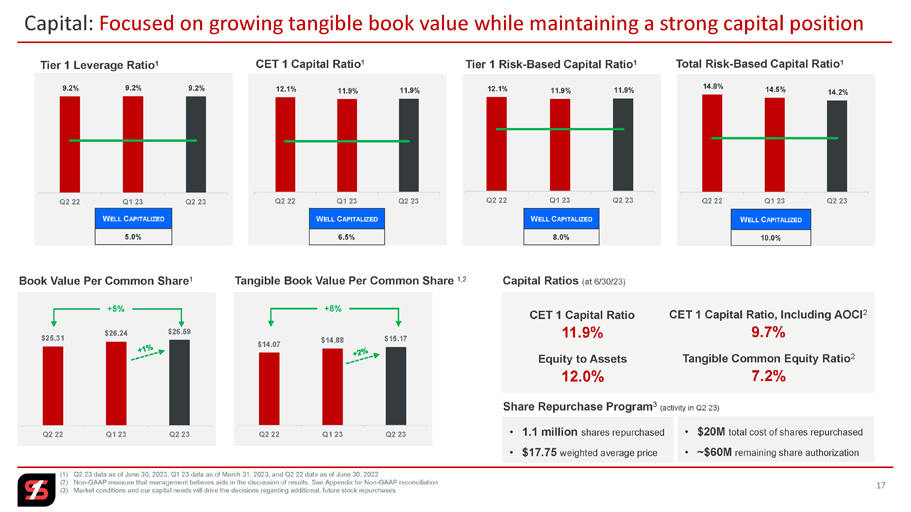
See Appendix for Non - GAAP reconciliation (3) Market conditions and our capital needs will drive the decisions regarding additional, future stock repurchases 9.2% 9.2% 9.2% Q2 22 Q1 23 Q2 23 W ELL C APITALIZED 5.0% Tier 1 Leverage Ratio 1 12.1% 11.9% 11.9% Q2 22 Q1 23 Q2 23 CET 1 Capital Ratio 1 W ELL C APITALIZED 6.5% 12.1% 11.9% 11.9% Q2 22 Q1 23 Q2 23 Tier 1 Risk - Based Capital Ratio 1 14.8% 14.5% 14.2% Q2 22 Q1 23 Q2 23 Total Risk - Based Capital Ratio 1 W ELL C APITALIZED 10.0% W ELL C APITALIZED 8.0% $25.31 $26.24 $26.59 Q2 22 Q1 23 Q2 23 Book Value Per Common Share 1 +5% $14.07 $14.88 $15.17 Q2 22 Q1 23 Q2 23 Tangible Book Value Per Common Share 1,2 Capital Ratios (at 6/30/23) CET 1 Capital Ratio 11.9% CET 1 Capital Ratio, Including AOCI 2 9.7% Equity to Assets 12.0% Tangible Common Equity Ratio 2 7.2% +8% Share Repurchase Program 3 (activity in Q2 23) • 1.1 million shares repurchased • $17.75 weighted average price • $20M total cost of shares repurchased • ~$60M remaining share authorization $4,473 $5,138 $5,000 $4,725 $4,443 Q2 22 Q3 22 Q4 22 Q1 23 Q2 23 Unfunded Commitments $ in millions Mortgage Warehouse / PPP Agricultural 19 Loan Portfolio: Solid growth that was geographically widespread PPP – Paycheck Protection Program Total loans at 6/30/23 Total loans at 3/31/23 $62 $60 $34 $43 $(99) $154 $25 $279 Linked Quarter Loan Growth $ in millions Total Loans RE - Commercial RE - Construction Commercial RE – Single Family Loan Portfolio Waterfall $ in millions Consumer & Other Funded loan /advances Paydowns/ payoffs +2% 82% variable rate • 73% tied to Prime • 27% tied to SOFR Loan Portfolio Highlights □ Well diversified growth by type and geographic market □ Expect loan growth to moderate throughout the year given current economic forecasts and as unfunded commitments draw down □ Highly focused on maintaining conservative underwriting standards and structure guidelines while emphasizing prudent pricing discipline □ Office portfolio (non - owner occupied) represents 5 % of total loan portfolio ( 6 % at end of Q 1 ) ; granular portfolio with average loan size of $ 2 . 1 million and average LTV less than 49 %

Loan Portfolio
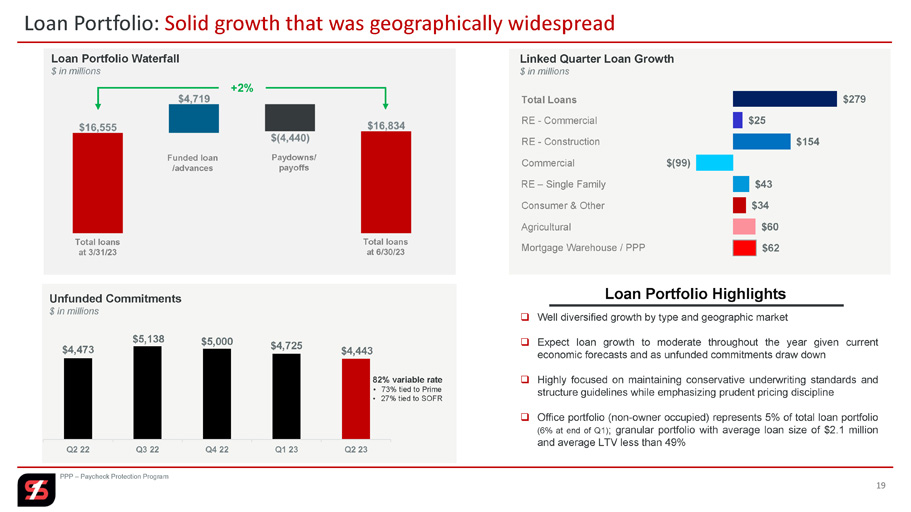
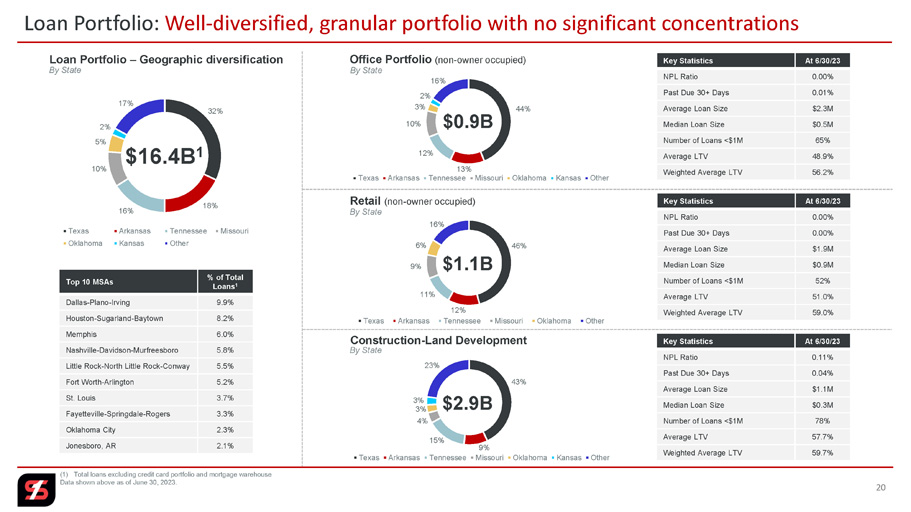
$2.9B Office Portfolio (non - owner occupied) 20 Loan Portfolio: Well - diversified, granular portfolio with no significant concentrations (1) Total loans excluding credit card portfolio and mortgage warehouse Data shown above as of June 30, 2023. By State Loan Portfolio – Geographic diversification 32% 18% 16% 10% 5% 2% 17% Texas Arkansas Tennessee Missouri Oklahoma Kansas Other % of Total Loans 1 Top 10 MSAs 9.9% Dallas - Plano - Irving 8.2% Houston - Sugarland - Baytown 6.0% Memphis 5.8% Nashville - Davidson - Murfreesboro 5.5% Little Rock - North Little Rock - Conway 5.2% Fort Worth - Arlington 3.7% St.
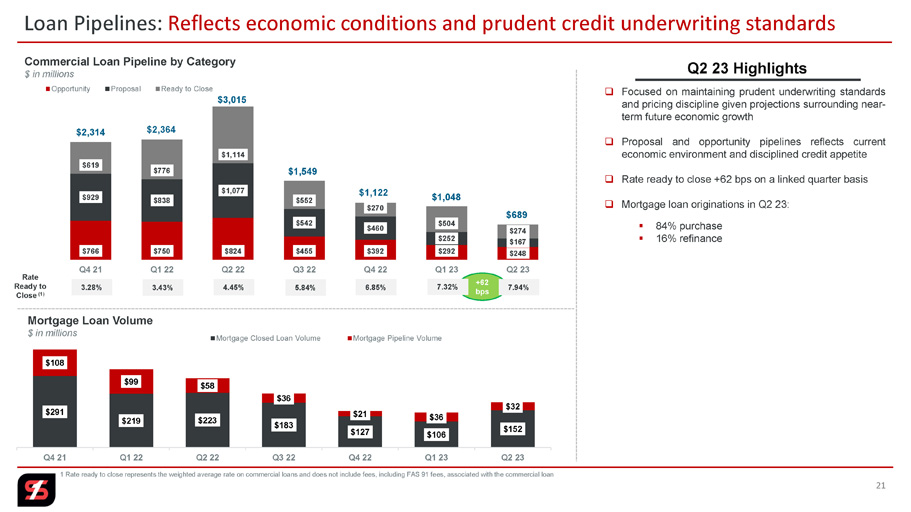
Louis 3.3% Fayetteville - Springdale - Rogers 2.3% Oklahoma City 2.1% Jonesboro, AR 44% 13% 12% 10% 3% 2% 16% Texas Arkansas Tennessee Missouri Oklahoma Kansas Other At 6/30/23 Key Statistics 0.00% NPL Ratio 0.01% Past Due 30+ Days $2.3M Average Loan Size $0.5M Median Loan Size 65% Number of Loans <$1M 48.9% Average LTV 56.2% Weighted Average LTV $16.4B 1 At 6/30/23 Key Statistics 0.00% NPL Ratio 0.00% Past Due 30+ Days $1.9M Average Loan Size $0.9M Median Loan Size 52% Number of Loans <$1M 51.0% Average LTV 59.0% Weighted Average LTV Retail (non - owner occupied) 46% 12% 11% 9% 6% 16% Texas Arkansas Tennessee Missouri Oklahoma Other Construction - Land Development 43% 9% 15% 4% 3% 3% 23% Texas Arkansas Tennessee Missouri Oklahoma Kansas Other At 6/30/23 Key Statistics 0.11% NPL Ratio 0.04% Past Due 30+ Days $1.1M Average Loan Size $0.3M Median Loan Size 78% Number of Loans <$1M 57.7% Average LTV 59.7% Weighted Average LTV By State By State By State $0.9B $1.1B +62 bps $766 $750 $824 $455 $392 $292 $248 $929 $838 $1,077 $542 $460 $252 $167 $619 $776 $1,114 $552 $270 $504 $274 Q4 21 Q1 22 Q2 22 Q3 22 Q4 22 Q1 23 Q2 23 Opportunity Proposal Ready to Close $2,314 $2,364 $3,015 $1,549 $1,122 21 Loan Pipelines: Reflects economic conditions and prudent credit underwriting standards 1 Rate ready to close represents the weighted average rate on commercial loans and does not include fees, including FAS 91 fe es, associated with the commercial loan Rate Ready to Close (1) 3.28% 3.43% 4.45% 5.84% 6.85% 7.32% 7.94% Commercial Loan Pipeline by Category $ in millions $291 $219 $223 $183 $127 $106 $152 $108 $99 $58 $36 $21 $36 $32 Q4 21 Q1 22 Q2 22 Q3 22 Q4 22 Q1 23 Q2 23 Mortgage Closed Loan Volume Mortgage Pipeline Volume Mortgage Loan Volume $ in millions $1,048 Q2 23 Highlights □ Focused on maintaining prudent underwriting standards and pricing discipline given projections surrounding near - term future economic growth □ Proposal and opportunity pipelines reflects current economic environment and disciplined credit appetite □ Rate ready to close + 62 bps on a linked quarter basis □ Mortgage loan originations in Q 2 23 : ▪ 84 % purchase ▪ 16 % refinance $689 23 Credit Quality: Remains at historically low - levels in the current environment Source: S&P Global Market Intelligence 2017 – 2022 (1) As of December 31, for each respective year shown above; quarterly data as of the end of the quarter for each respectiv e p eriod (2) Net charge - offs to average loans for the full - year for each respective year shown above; quarterly annualized data for eac h respective quarter Change 3/31/23 6/30/23 Annual Trend 5 bps 0.38% 0.43% NPL / Loans $8.3 $63.7 $72.0 Nonperforming Loans (in millions) 2 bps 0.26% 0.28% NPA / Assets $5.5 $71.4 $76.9 Nonperforming Assets (in millions) (5) bps 0.15% 0.10% Past Due 30+ Days / Loans 1 bp 0.03% 0.04% Net Charge - offs / Average Loans (32) bps 324% 292% NPL Coverage Ratio - 1.25% 1.25% ACL / Loans $279 $16,555 $16,834 Total Loans (in millions) Credit metrics reflect strategic decision in 2019 to de - risk certain elements of acquired loan portfolios 0.81% 0.67% 0.65% 0.96% 0.57% 0.37% 0.37% 0.37% 0.38% 0.43% 2017 2018 2019 2020 2021 2022 Q3 22 Q4 22 Q1 23 Q2 23 Annual Nonperforming loans / loans 1 Strategic decision to de - risk certain elements of the loan portfolio through planned run - off of particular acquired non - relationship credits Quarterly Nonperforming assets / total assets 1 0.83% 0.64% 0.55% 0.64% 0.31% 0.23% 0.23% 0.23% 0.26% 0.28% 2017 2018 2019 2020 2021 2022 Q3 22 Q4 22 Q1 23 Q2 23 Annual Quarterly Net charge - offs to average loans 2 0.31% 0.21% 0.24% 0.45% 0.13% 0.09% 0.00% 0.13% 0.03% 0.04% 2017 2018 2019 2020 2021 2022 Q3 22 Q4 22 Q1 23 Q2 23 Annual Quarterly K ey Credit Metrics : ▪ Average FICO Scores 755 ▪ Balance Weighted Average FICO Score 746 ▪ Line Utilization 20% 1.61% 1.64% 1.86% 1.60% 1.40% 1.44% 1.30% 1.52% 1.69% 2.25% 2017 2018 2019 2020 2021 2022 Q3 22 Q4 22 Q1 23 Q2 23 Credit card portfolio net charge - off ratio 2 Annual Quarterly □ Increase in nonperforming loans was principally driven by a single, C&I relationship totaling $ 9 . 6 million □ Shortly after the end of the quarter, received $ 2 . 9 million initial payment on nonperforming relationship noted above □ 1 basis point of net charge offs, excluding credit card portfolio □ Credit card charge - offs reflects industry - wide trend albeit at lower levels □ Loans past due 30 + days down 5 bps on a linked quarter basis Key Highlights

Credit Quality
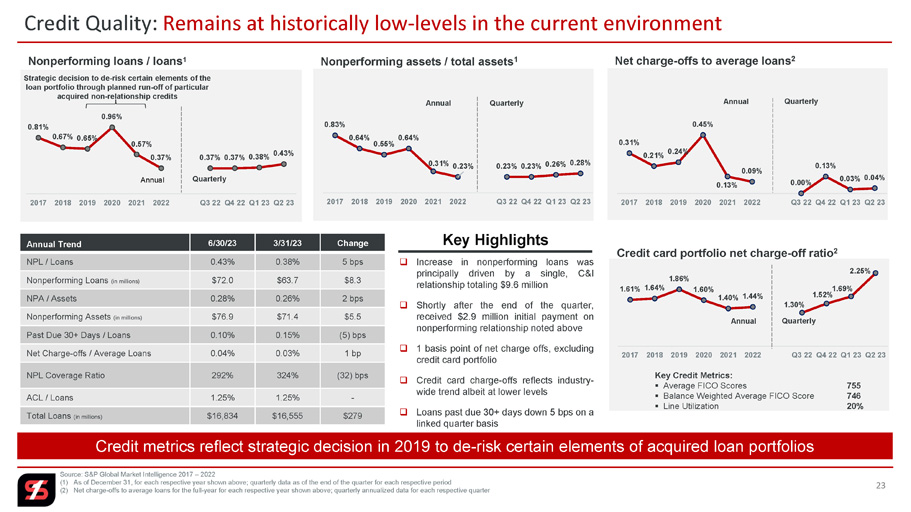
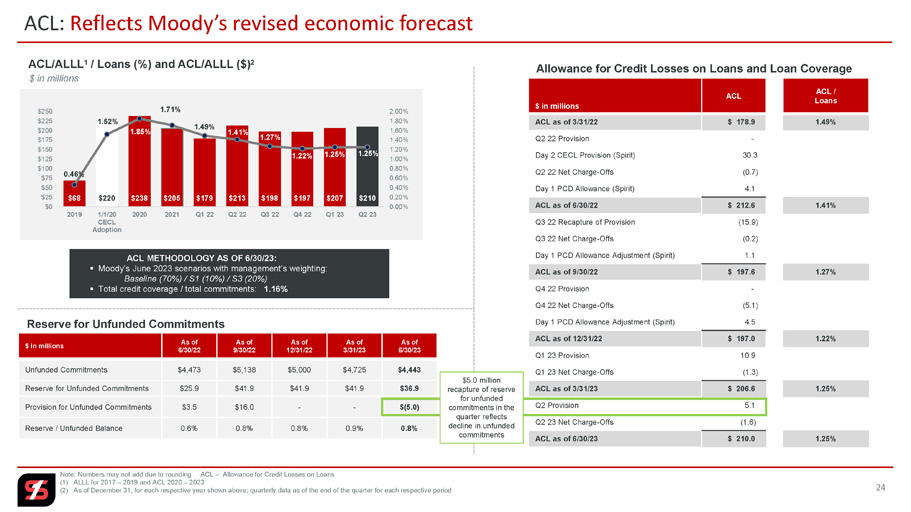
24 ACL: Reflects Moody’s revised economic forecast Note: Numbers may not add due to rounding ACL – Allowance for Credit Losses on Loans (1) ALLL for 2017 – 2019 and ACL 2020 – 2023 (2) As of December 31, for each respective year shown above; quarterly data as of the end of the quarter for each respectiv e p eriod ACL / Loans ACL $ in millions 1.49% $ 178.9 ACL as of 3/31/22 - Q2 22 Provision 30.3 Day 2 CECL Provision (Spirit) (0.7) Q2 22 Net Charge - Offs 4.1 Day 1 PCD Allowance (Spirit) 1.41% $ 212.6 ACL as of 6/30/22 (15.9) Q3 22 Recapture of Provision (0.2) Q3 22 Net Charge - Offs 1.1 Day 1 PCD Allowance Adjustment (Spirit) 1.27% $ 197.6 ACL as of 9/30/22 - Q4 22 Provision (5.1) Q4 22 Net Charge - Offs 4.5 Day 1 PCD Allowance Adjustment (Spirit) 1.22% $ 197.0 ACL as of 12/31/22 10.9 Q1 23 Provision (1.3) Q1 23 Net Charge - Offs 1.25% $ 206.6 ACL as of 3/31/23 5.1 Q2 Provision (1.6) Q2 23 Net Charge - Offs 1.25% $ 210.0 ACL as of 6/30/23 Allowance for Credit Losses on Loans and Loan Coverage Reserve for Unfunded Commitments As of 6/30/23 As of 3/31/23 As of 12/31/22 As of 9/30/22 As of 6/30/22 $ in millions $4,443 $4,725 $5,000 $5,138 $4,473 Unfunded Commitments $36.9 $41.9 $41.9 $41.9 $25.9 Reserve for Unfunded Commitments $(5.0) - - $16.0 $3.5 Provision for Unfunded Commitments 0.8% 0.9% 0.8% 0.8% 0.6% Reserve / Unfunded Balance ACL METHODOLOGY AS OF 6/30/23: ▪ Moody’s June 2023 scenarios with management’s weighting: Baseline (70%) / S1 (10%) / S3 (20%) ▪ Total credit coverage / total commitments: 1.16% ACL/ALLL 1 / Loans (%) and ACL/ALLL ($) 2 $ in millions $68 $220 $238 $205 $179 $213 $198 $197 $207 $210 0.46% 1.52% 1.85% 1.71% 1.49% 1.41% 1.27% 1.22% 1.25% 1.25% 0.00% 0.20% 0.40% 0.60% 0.80% 1.00% 1.20% 1.40% 1.60% 1.80% 2.00% $0 $25 $50 $75 $100 $125 $150 $175 $200 $225 $250 2019 1/1/20 CECL Adoption 2020 2021 Q1 22 Q2 22 Q3 22 Q4 22 Q1 23 Q2 23 $5.0 million recapture of reserve for unfunded commitments in the quarter reflects decline in unfunded commitments 25 Breakout: Loan portfolio by category as of June 30, 2023 as of March 31, 2023 Unfunded Commitment Reserve ACL % Unfunded Commitment $ Nonperforming $ Classified $ % of Total Loans Balance $ % of Total Loans Balance $ $ in millions Total Loan Portfolio - 3.1% - 1 1 1% 210 1% 189 Consumer - Credit Card 0.5% 2.2% 24 1 - 1% 148 1% 143 Consumer - Other 1.3% 1.3% 2,415 3 9 17% 2,931 17% 2,777 Real Estate - Construction 0.5% 1.0% 249 14 105 45% 7,546 45% 7,521 Real Estate - Commercial 0.4% 1.9% 326 22 28 16% 2,633 16% 2,590 Real Estate - Single - family 0.1% 1.1% 1,307 29 35 15% 2,562 16% 2,661 Commercial - - - - - - 7 - 8 PPP - 0.2% - - - 1% 215 1% 152 Mortgage Warehouse 0.2% 0.9% 121 2 3 2% 281 1% 221 Agriculture 0.2% 1.0% 1 - - 2% 301 2% 293 Other 0.8% 1.25% 4,443 72 181 100% 16,834 100% 16,555 Total Loan Portfolio Loan Concentration (Holding Company Level) : 99% 92% C&D 273% 263% CRE Select Loan Categories (excluding PPP) 1.5% 1.4% 115 3 6 8% 1,332 9% 1,465 Retail 0.3% 0.7% 4 - - 2% 329 2% 338 Nursing / Extended Care 0.6% 0.6% 162 1 9 3% 553 3% 528 Healthcare 1.1% 0.9% 902 1 16 7% 1,228 7% 1,130 Multifamily 2.4% 2.1% 67 5 52 4% 745 5% 793 Hotel 0.6% 1.0% 41 1 2 3% 520 3% 519 Restaurant 3.5% 2.2% 92 - 4 5% 924 6% 962 NOO Office 0.5% 0.2% 527 - - 8% 1,423 7% 1,211 NOO Industrial Warehouse
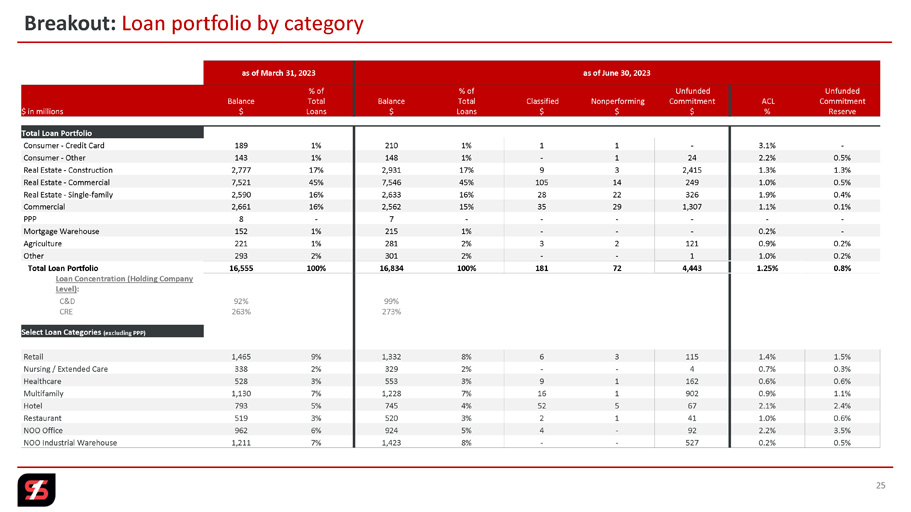

Q2 23 Key Takeaways
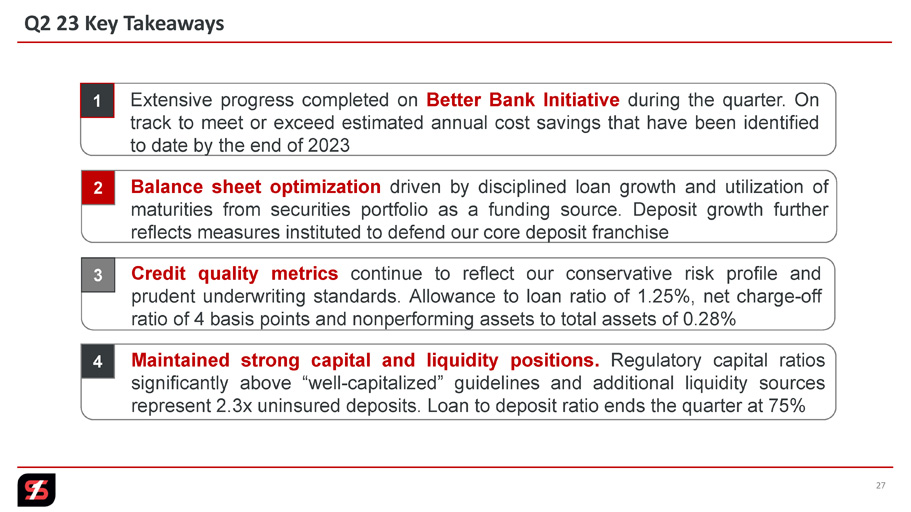
27 Q2 23 Key Takeaways 1 Extensive progress completed on Better Bank Initiative during the quarter . On track to meet or exceed estimated annual cost savings that have been identified to date by the end of 2023 2 Maintained strong capital and liquidity positions . Regulatory capital ratios significantly above “well - capitalized” guidelines and additional liquidity sources represent 2 . 3 x uninsured deposits . Loan to deposit ratio ends the quarter at 75 % 3 Credit quality metrics continue to reflect our conservative risk profile and prudent underwriting standards . Allowance to loan ratio of 1 . 25 % , net charge - off ratio of 4 basis points and nonperforming assets to total assets of 0 . 28 % 4 Balance sheet optimization driven by disciplined loan growth and utilization of maturities from securities portfolio as a funding source .

Appendix
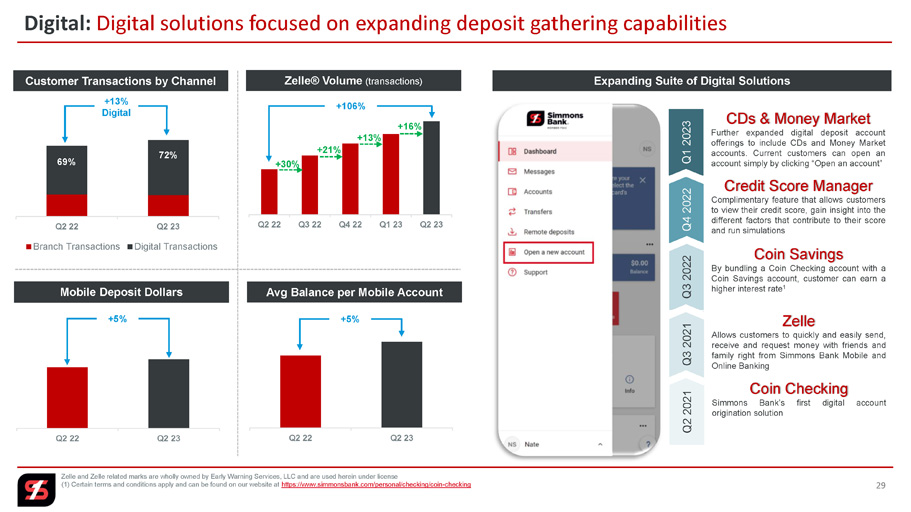
Deposit growth further reflects measures instituted to defend our core deposit franchise Digital: Digital solutions focused on expanding deposit gathering capabilities Zelle and Zelle related marks are wholly owned by Early Warning Services, LLC and are used herein under license (1) Certain terms and conditions apply and can be found on our website at https://www.simmonsbank.com/personal/checking/coin - checking 29 Q2 22 Q3 22 Q4 22 Q1 23 Q2 23 Zelle ® Volume (transactions) +30% +21% +13% +106% Q2 22 Q2 23 Avg Balance per Mobile Account +5% Q2 22 Q2 23 Mobile Deposit Dollars +5% Q2 22 Q2 23 Branch Transactions Digital Transactions Customer Transactions by Channel 69% 70% 72% +13% Digital Expanding Suite of Digital Solutions +16% Q2 2021 Coin Checking Simmons Bank’s first digital account origination solution Zelle Allows customers to quickly and easily send, receive and request money with friends and family right from Simmons Bank Mobile and Online Banking Q3 2021 Q3 2022 Coin Savings By bundling a Coin Checking account with a Coin Savings account, customer can earn a higher interest rate 1 Q4 2022 Credit Score Manager Complimentary feature that allows customers to view their credit score, gain insight into the different factors that contribute to their score and run simulations Q1 2023 CDs & Money Market Further expanded digital deposit account offerings to include CDs and Money Market accounts . Current customers can open an account simply by clicking “Open an account”
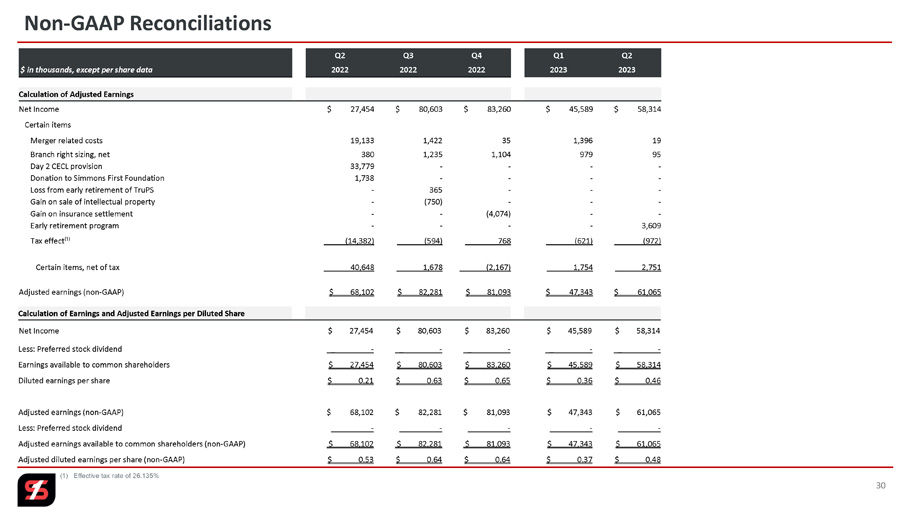
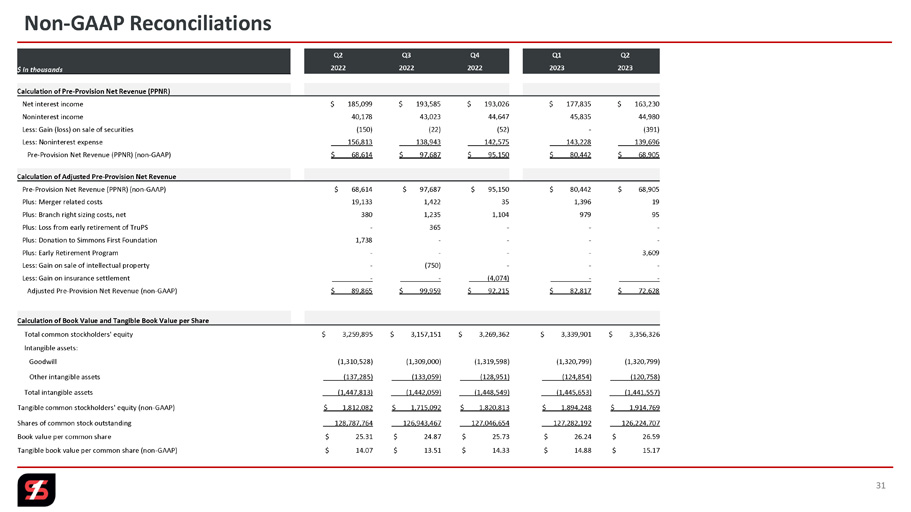
30 Non - GAAP Reconciliations Q2 Q1 Q4 Q3 Q2 2023 2023 2022 2022 2022 $ in thousands, except per share data Calculation of Adjusted Earnings $ 58,314 $ 45,589 $ 83,260 $ 80,603 $ 27,454 Net Income Certain items 19 1,396 35 1,422 19,133 Merger related costs 95 979 1,104 1,235 380 Branch right sizing, net - - - - 33,779 Day 2 CECL provision - - - - 1,738 Donation to Simmons First Foundation - - - 365 - Loss from early retirement of TruPS - - - (750) - Gain on sale of intellectual property - - (4,074) - - Gain on insurance settlement 3,609 - - - - Early retirement program (972) (621) _ 768 _ (594) _ (14,382) Tax effect⁽¹⁾ 2,751 1,754 (2,167) 1,678 40,648 Certain items, net of tax $ 61,065 $ 47,343 $ 81,093 $ 82,281 $ 68,102 Adjusted earnings (non - GAAP) Calculation of Earnings and Adjusted Earnings per Diluted Share $ 58,314 $ 45,589 $ 83,260 $ 80,603 $ 27,454 Net Income _ - _ - _ - _ - _ - Less: Preferred stock dividend $ 58,314 $ 45,589 $ 83,260 $ 80,603 $ 27,454 Earnings available to common shareholders $ 0.46 $ 0.36 $ 0.65 $ 0.63 $ 0.21 Diluted earnings per share $ 61,065 $ 47,343 $ 81,093 $ 82,281 $ 68,102 Adjusted earnings (non - GAAP) - - - - - Less: Preferred stock dividend $ 61,065 $ 47,343 $ 81,093 $ 82,281 $ 68,102 Adjusted earnings available to common shareholders (non - GAAP) $ 0.48 $ 0.37 $ 0.64 $ 0.64 $ 0.53 Adjusted diluted earnings per share (non - GAAP) (1) Effective tax rate of 26.135% Q2 Q1 Q4 Q3 Q2 2023 2023 2022 2022 2022 $ in thousands Calculation of Pre - Provision Net Revenue (PPNR) $ 163,230 $ 177,835 $ 193,026 $ 193,585 $ 185,099 Net interest income 44,980 45,835 44,647 43,023 40,178 Noninterest income (391) - (52) (22) (150) Less: Gain (loss) on sale of securities 139,696 143,228 142,575 138,943 156,813 Less: Noninterest expense $ 68,905 $ 80,442 $ 95,150 $ 97,687 $ 68,614 Pre - Provision Net Revenue (PPNR) (non - GAAP) Calculation of Adjusted Pre - Provision Net Revenue $ 68,905 $ 80,442 $ 95,150 $ 97,687 $ 68,614 Pre - Provision Net Revenue (PPNR) (non - GAAP) 19 1,396 35 1,422 19,133 Plus: Merger related costs 95 979 1,104 1,235 380 Plus: Branch right sizing costs, net - - - 365 - Plus: Loss from early retirement of TruPS - - - - 1,738 Plus: Donation to Simmons First Foundation 3,609 - - - - Plus: Early Retirement Program - - - (750) - Less: Gain on sale of intellectual property - - (4,074) - - Less: Gain on insurance settlement $ 72,628 $ 82,817 $ 92,215 $ 99,959 $ 89,865 Adjusted Pre - Provision Net Revenue (non - GAAP) 31 Non - GAAP Reconciliations Calculation of Book Value and Tangible Book Value per Share $ 3,356,326 $ 3,339,901 $ 3,269,362 $ 3,157,151 $ 3,259,895 Total common stockholders' equity Intangible assets: (1,320,799) (1,320,799) (1,319,598) (1,309,000) (1,310,528) Goodwill (120,758) (124,854) (128,951) (133,059) (137,285) Other intangible assets (1,441,557) (1,445,653) (1,448,549) (1,442,059) (1,447,813) Total intangible assets $ 1,914,769 $ 1,894,248 $ 1,820,813 $ 1,715,092 $ 1,812,082 Tangible common stockholders' equity (non - GAAP) 126,224,707 127,282,192 127,046,654 126,943,467 128,787,764 Shares of common stock outstanding $ 26.59 $ 26.24 $ 25.73 $ 24.87 $ 25.31 Book value per common share $ 15.17 $ 14.88 $ 14.33 $ 13.51 $ 14.07 Tangible book value per common share (non - GAAP)
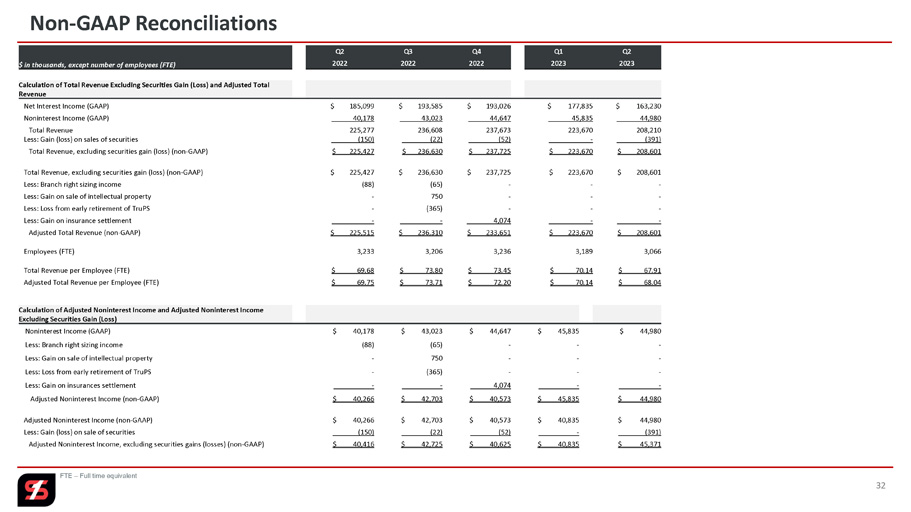
32 Non - GAAP Reconciliations Q2 Q1 Q4 Q3 Q2 2023 2023 2022 2022 2022 $ in thousands, except number of employees (FTE) Calculation of Total Revenue Excluding Securities Gain (Loss) and Adjusted Total Revenue $ 163,230 $ 177,835 $ 193,026 $ 193,585 $ 185,099 Net Interest Income (GAAP) 44,980 45,835 44,647 43,023 40,178 Noninterest Income (GAAP) 208,210 223,670 237,673 236,608 225,277 Total Revenue (391) - (52) (22) (150) Less: Gain (loss) on sales of securities $ 208,601 $ 223,670 $ 237,725 $ 236,630 $ 225,427 Total Revenue, excluding securities gain (loss) (non - GAAP) $ 208,601 $ 223,670 $ 237,725 $ 236,630 $ 225,427 Total Revenue, excluding securities gain (loss) (non - GAAP) - - - (65) (88) Less: Branch right sizing income - - - 750 - Less: Gain on sale of intellectual property - - - (365) - Less: Loss from early retirement of TruPS - - 4,074 - - Less: Gain on insurance settlement $ 208,601 $ 223,670 $ 233,651 $ 236,310 $ 225,515 Adjusted Total Revenue (non - GAAP) 3,066 3,189 3,236 3,206 3,233 Employees (FTE) $ 67.91 $ 70.14 $ 73.45 $ 73.80 $ 69.68 Total Revenue per Employee (FTE) $ 68.04 $ 70.14 $ 72.20 $ 73.71 $ 69.75 Adjusted Total Revenue per Employee (FTE) FTE – Full time equivalent Calculation of Adjusted Noninterest Income and Adjusted Noninterest Income Excluding Securities Gain (Loss) $ 44,980 $ 45,835 $ 44,647 $ 43,023 $ 40,178 Noninterest Income (GAAP) - - - (65) (88) Less: Branch right sizing income - - - 750 - Less: Gain on sale of intellectual property - - - (365) - Less: Loss from early retirement of TruPS - - 4,074 - - Less: Gain on insurances settlement $ 44,980 $ 45,835 $ 40,573 $ 42,703 $ 40,266 Adjusted Noninterest Income (non - GAAP) $ 44,980 $ 40,835 $ 40,573 $ 42,703 $ 40,266 Adjusted Noninterest Income (non - GAAP) (391) - (52) _ (22) _(150) Less: Gain (loss) on sale of securities $ 45,371 $ 40,835 $ 40,625 $ 42,725 $ 40,416 Adjusted Noninterest Income, excluding securities gains (losses) (non - GAAP)
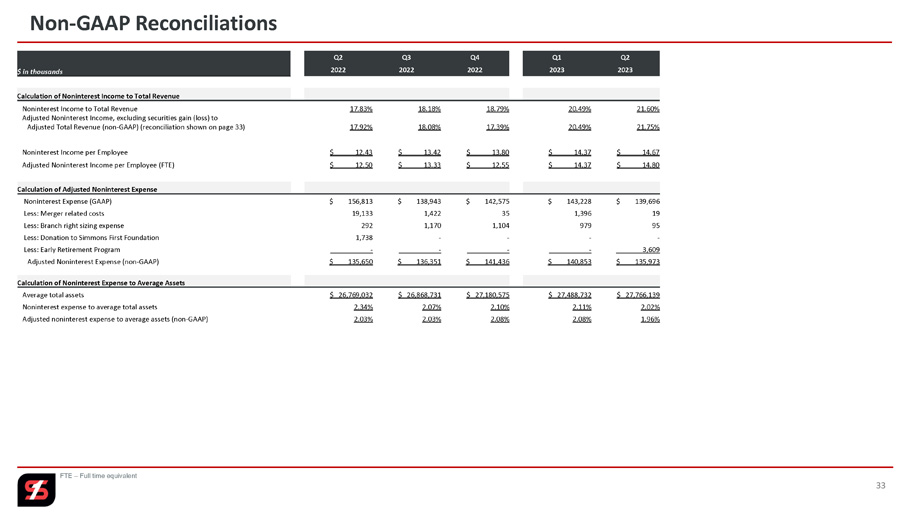
33 Non - GAAP Reconciliations Calculation of Adjusted Noninterest Expense $ 139,696 $ 143,228 $ 142,575 $ 138,943 $ 156,813 Noninterest Expense (GAAP) 19 1,396 35 1,422 19,133 Less: Merger related costs 95 979 1,104 1,170 292 Less: Branch right sizing expense - - - - 1,738 Less: Donation to Simmons First Foundation 3,609 - - - - Less: Early Retirement Program $ 135,973 $ 140,853 $ 141,436 $ 136,351 $ 135,650 Adjusted Noninterest Expense (non - GAAP) Calculation of Noninterest Expense to Average Assets $ 27,766,139 $ 27,488,732 $ 27,180,575 $ 26,868,731 $ 26,769,032 Average total assets 2.02% 2.11% 2.10% 2.07% 2.34% Noninterest expense to average total assets 1.96% 2.08% 2.08% 2.03% 2.03% Adjusted noninterest expense to average assets (non - GAAP) FTE – Full time equivalent Q2 Q1 Q4 Q3 Q2 2023 2023 2022 2022 2022 $ in thousands Calculation of Noninterest Income to Total Revenue 21.60% 20.49% 18.79% 18.18% 17.83% Noninterest Income to Total Revenue 21.75% 20.49% 17.39% 18.08% 17.92% Adjusted Noninterest Income, excluding securities gain (loss) to Adjusted Total Revenue (non - GAAP) (reconciliation shown on page 33) $ 14.67 $ 14.37 $ 13.80 $ 13.42 $ 12.43 Noninterest Income per Employee $ 14.80 $ 14.37 $ 12.55 $ 13.33 $ 12.50 Adjusted Noninterest Income per Employee (FTE)
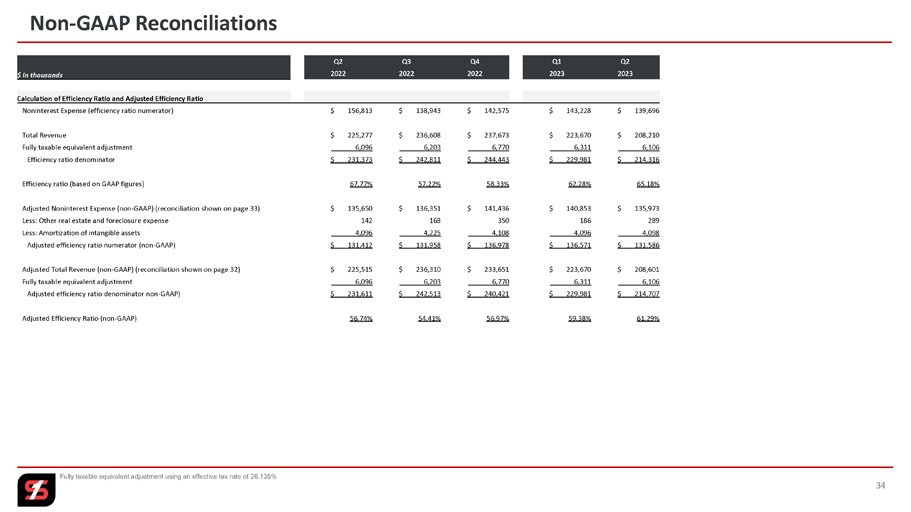
34 Non - GAAP Reconciliations Q2 Q1 Q4 Q3 Q2 2023 2023 2022 2022 2022 $ in thousands Calculation of Efficiency Ratio and Adjusted Efficiency Ratio $ 139,696 $ 143,228 $ 142,575 $ 138,943 $ 156,813 Noninterest Expense (efficiency ratio numerator) $ 208,210 $ 223,670 $ 237,673 $ 236,608 $ 225,277 Total Revenue ___ _ _6,106 ___ _ _6,311 ___ _ _6,770 ___ _ _6,203 ___ _ _6,096 Fully taxable equivalent adjustment $ 214,316 $ 229,981 $ 244,443 $ 242,811 $ 231,373 Efficiency ratio denominator 65.18% 62.28% 58.33% 57.22% 67.77% Efficiency ratio (based on GAAP figures) $ 135,973 $ 140,853 $ 141,436 $ 136,351 $ 135,650 Adjusted Noninterest Expense (non - GAAP) (reconciliation shown on page 33) 289 186 350 168 142 Less: Other real estate and foreclosure expense ___ __ 4,098 ___ __ 4,096 ___ __ 4,108 ___ __ 4,225 ___ _ _4,096 Less: Amortization of intangible assets $ 131,586 $ 136,571 $ 136,978 $ 131,958 $ 131,412 Adjusted efficiency ratio numerator (non - GAAP) $ 208,601 $ 223,670 $ 233,651 $ 236,310 $ 225,515 Adjusted Total Revenue (non - GAAP) (reconciliation shown on page 32) ___ _ _6,106 ___ _ _6,311 ___ _ _6,770 ___ _ _6,203 ___ _ _6,096 Fully taxable equivalent adjustment $ 214,707 $ 229,981 $ 240,421 $ 242,513 $ 231,611 Adjusted efficiency ratio denominator non - GAAP) 61.29% 59.38% 56.97% 54.41% 56.74% Adjusted Efficiency Ratio (non - GAAP) Fully taxable equivalent adjustment using an effective tax rate of 26.135% 35 Non - GAAP Reconciliations FTE - Fully taxable equivalent adjustment using an effective tax rate of 26.135% Q2 Q1 Q2 2023 2023 2022 $ in thousands Calculation of Tangible Common Equity (TCE) $ 3,356,326 $ 3,339,901 $ 3,259,895 Total stockholders’ equity _______ _ - _______ _ - _______ _ - Less: Preferred stock $ 3,356,326 $ 3,339,901 $ 3,259,895 Total common stockholders’ equity $ 27,959,123 $ 27,583,446 $ 27,218,609 Total assets (1,441,557) (1,445,653) (1,447,813) Less: Intangible assets $ 26,517,566 $ 26,137,793 $ 25,770,796 Total tangible assets 12.00% 12.11% 11.98% Common equity to total assets 7.22% 7.25% 7.03% Tangible common equity to tangible common assets (non - GAAP) Calculation of CET 1 Capital Ratio, Including the Impact of AOCI $ 3,356,326 $ 3,339,901 $ 3,259,895 Total stockholders’ equity 61,746 61,746 92,619 CECL transition provision (1,406,500) (1,410,141) (1,423,323) Disallowed allowed intangible assets, net of deferred tax ____ _ 469,988 ____ _ 470,681 ____ _ 450,428 Unrealized loss (gain) on available for sale securities (AOCI) $ 2,481,560 $ 2,462,187 $ 2,379,619 Total tier 1 capital (CET 1) $ 2,481,560 $ 2,462,187 $ 2,379,619 Total tier 1 capital (CET 1) 469,988 470,681 450,428 Less: Unrealized loss (gain) on available for sale securities (AOCI) $ 2,011,572 $ 1,991,506 $ 1,929,191 Total tier 1 capital, including AOCI (non - GAAP) $ 20,821,075 $ 20,748,605 $ 19,669,149 Risk weighted assets 11.92% 11.87% 12.10% CET 1 capital ratio 9.66% 9.60% 9.81% CET 1 capital ratio, including AOCI
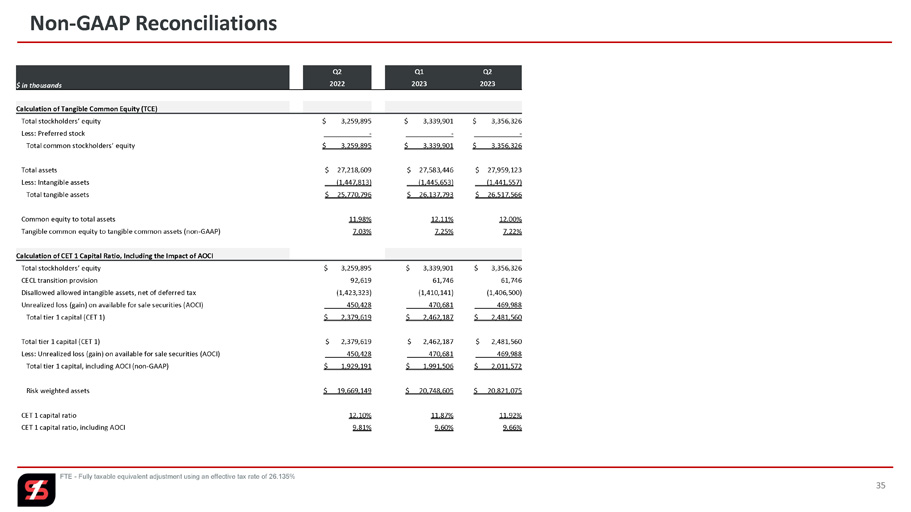
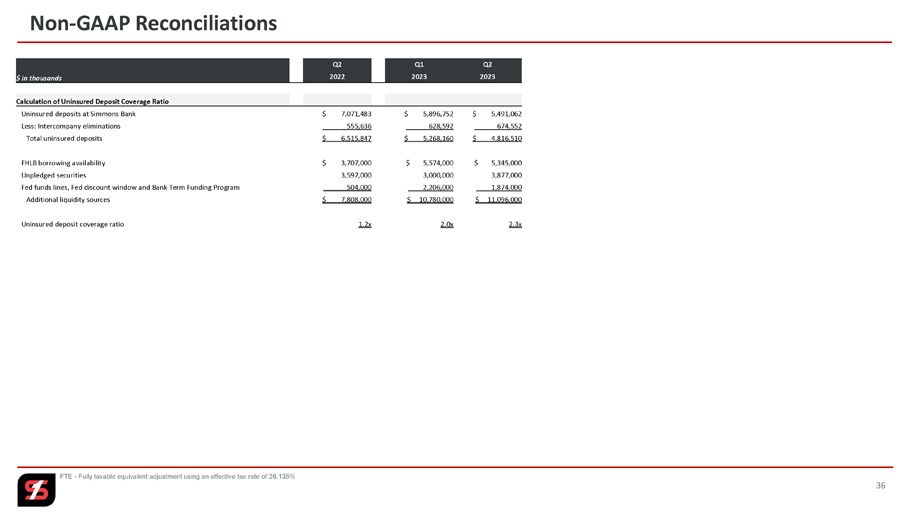
36 Non - GAAP Reconciliations FTE - Fully taxable equivalent adjustment using an effective tax rate of 26.135% Q2 Q1 Q2 2023 2023 2022 $ in thousands Calculation of Uninsured Deposit Coverage Ratio $ 5,491,062 $ 5,896,752 $ 7,071,483 Uninsured deposits at Simmons Bank ______674,552 ______628,592 ____ _555,636 Less: Intercompany eliminations $ 4,816,510 $ 5,268,160 $ 6,515,847 Total uninsured deposits $ 5,345,000 $ 5,574,000 $ 3,707,000 FHLB borrowing availability 3,877,000 3,000,000 3,597,000 Unpledged securities 1,874,000 2,206,000 504,000 Fed funds lines, Fed discount window and Bank Term Funding Program $ 11,096,000 $ 10,780,000 $ 7,808,000 Additional liquidity sources 2.3x 2.0x 1.2x Uninsured deposit coverage ratio

Nasdaq: SFNC 2 nd Quarter 2023 Earnings Presentation Contents 3 Company Profile 4 Q2 Financial Highlights 12 Deposits, Securities, Liquidity, Interest Rate Sensitivity and Capital 18 Loan Portfolio 22 Credit Quality 26 Q2 23 Key Takeaways 28 Appendix