UNITED STATES
SECURITIES AND EXCHANGE COMMISSION
Washington, D.C. 20549
_________________
FORM 8-K
_________________
CURRENT REPORT
Pursuant to Section 13 or 15(d)
of the Securities Exchange Act of 1934
Date of Report (Date of earliest event reported): March 9, 2023
_______________________________
The Joint Corp.
(Exact name of registrant as specified in its charter)
_______________________________
| Delaware | 001-36724 | 90-0544160 |
| (State or Other Jurisdiction of Incorporation) | (Commission File Number) | (I.R.S. Employer Identification No.) |
16767 N. Perimeter Drive, Suite 110
Scottsdale, Arizona 85260
(Address of Principal Executive Offices) (Zip Code)
(480) 245-5960
(Registrant's telephone number, including area code)
(Former name or former address, if changed since last report)
_______________________________
Check the appropriate box below if the Form 8-K filing is intended to simultaneously satisfy the filing obligation of the registrant under any of the following provisions:
| ☐ | Written communications pursuant to Rule 425 under the Securities Act (17 CFR 230.425) |
| ☐ | Soliciting material pursuant to Rule 14a-12 under the Exchange Act (17 CFR 240.14a-12) |
| ☐ | Pre-commencement communications pursuant to Rule 14d-2(b) under the Exchange Act (17 CFR 240.14d-2(b)) |
| ☐ | Pre-commencement communications pursuant to Rule 13e-4(c) under the Exchange Act (17 CFR 240.13e-4(c)) |
Securities registered pursuant to Section 12(b) of the Act:
| Title of each class | Trading Symbol(s) | Name of each exchange on which registered |
| Common Stock, $0.001 Par Value Per Share | JYNT | The NASDAQ Capital Market LLC |
Indicate by check mark whether the registrant is an emerging growth company as defined in Rule 405 of the Securities Act of 1933 (§230.405 of this chapter) or Rule 12b-2 of the Securities Exchange Act of 1934 (§240.12b-2 of this chapter).
Emerging growth company ☐
If an emerging growth company, indicate by check mark if the registrant has elected not to use the extended transition period for complying with any new or revised financial accounting standards provided pursuant to Section 13(a) of the Exchange Act. ☐
On March 9, 2023, The Joint Corp. (the “Company”) issued a press release announcing its financial results for the fourth quarter and full year ended December 31, 2022. The press release is furnished as Exhibit 99.1 to this Current Report on Form 8-K.
The information furnished in this Item 2.02 and Exhibit 99.1 shall not be deemed “filed” for purposes of Section 18 of the Securities Exchange Act of 1934, as amended (the “Exchange Act”), or otherwise subject to the liabilities of that section, nor shall it be incorporated by reference in any filing under the Securities Act of 1933, as amended, or the Exchange Act, except as expressly set forth by specific reference in such a filing.
The Company is posting an earnings presentation to its website at https://ir.thejoint.com/. A copy of the earnings presentation is being furnished herewith as Exhibit 99.2. The Company will use the earnings presentation during its earnings conference call on March 9, 2023 and also may use the earnings presentation from time to time in conversations with analysts, investors and others.
The information furnished in this Item 7.01 and Exhibit 99.2 shall not be deemed “filed” for purposes of Section 18 of the Exchange Act, or otherwise subject to the liabilities of that section, nor shall it be incorporated by reference in any filing under the Securities Act of 1933, as amended, or the Exchange Act, except as expressly set forth by specific reference in such a filing.
The information contained in Exhibit 99.2 is summary information that is intended to be considered in the context of the Company’s filings with the SEC. The Company undertakes no duty or obligation to publicly update or revise the information contained in this report, although it may do so from time to time as its management believes is warranted. Any such updating may be made through the filing of other reports or documents with the SEC, through press releases or through other public disclosure.
(d) Exhibits
| Exhibit Number | Description | |||
| 99.1 | Press Release dated March 9, 2023 | |||
| 99.2 | The Joint Corp. Earnings Presentation, March 2023 | |||
| 104 | Cover Page Interactive Data File (embedded within the Inline XBRL document) |
SIGNATURE
Pursuant to the requirements of the Securities Exchange Act of 1934, the registrant has duly caused this report to be signed on its behalf by the undersigned hereunto duly authorized.
| The Joint Corp. | ||
| Date: March 9, 2023 | By: | /s/ Peter D. Holt |
| Peter D. Holt | ||
| President and Chief Executive Officer | ||
EXHIBIT 99.1
The Joint Corp. Reports Fourth Quarter and Year-end 2022 Financial Results
- Grew Q4 2022 Revenue 26%, System-wide Sales 18%, and System-wide Comp Sales 8% vs. Q4 2021 -
- Increased Clinic Count to 838 at Year-end 2022, Including 126 Company-Owned or Managed Clinics -
SCOTTSDALE, Ariz., March 09, 2023 (GLOBE NEWSWIRE) -- The Joint Corp. (NASDAQ: JYNT), a national operator, manager, and franchisor of chiropractic clinics, reported its financial results for the quarter and year ended December 31, 2022.
Financial Highlights: Q4 2022 Compared to Q4 2021
Financial Highlights: 2022 Compared to 2021
2022 Full Year Operating Highlights
“Our strong close to 2022 bolstered our foundation for continued management of near-term consumer uncertainty and enhanced our positioning for long-term growth,” said Peter D. Holt, President and Chief Executive Officer of The Joint Corp. “In Q4, our system-wide comps reflect the success of our annual holiday promotions: “Back Friday” increased 32% and “End-of-Year” increased 44% over 2021. Already in 2023, we have won several awards from Entrepreneur, Franchise Business Review and Franchise Times, recognizing our leadership among all franchise concepts for performance and profitability, and in particular, as the top chiropractic services franchisor. Maintaining our focus on our three strategic initiatives, we are continuing to invest in attracting and retaining the most talented chiropractors; to leverage our data; and to expand our clinic network toward our near-term target of 1,000 clinics. We are dedicated to serving our patients to drive long-term value for all stakeholders.”
Financial Results for Fourth Quarter Ended December 31: 2022 Compared to 2021
Revenue was $27.8 million in the fourth quarter of 2022, compared to $22.1 million in the fourth quarter of 2021. The increase reflects a greater number of franchised and corporate clinics and continued organic growth. Cost of revenue was $2.6 million, compared to $2.4 million in the fourth quarter of 2021, reflecting the associated higher regional developer royalties and commissions.
Selling and marketing expenses were $3.3 million, up 13%, driven by the increase in advertising expenses from the larger number of franchised and company-owned or managed clinics. Depreciation and amortization expenses increased for the fourth quarter of 2022, as compared to the prior year period, primarily due to the depreciation and amortization expenses associated with our continued greenfield development and acquired clinics.
General and administrative expenses were $18.3 million, compared to $14.9 million in the fourth quarter of 2021, reflecting increases in costs to support clinic growth and in payroll to remain competitive in the tight labor market.
Operating income was $1.3 million, compared to $7,000 in the fourth quarter of 2021. Income tax expense was $660,000, compared to $351,000 in the fourth quarter of 2021. Net income was $547,000, or $0.04 per diluted share, compared to a net loss of $360,000, or $0.02 per basic share, in the fourth quarter of 2021.
Adjusted EBITDA was $4.0 million, compared to $2.1 million in the fourth quarter of 2021. The company defines Adjusted EBITDA, a non-GAAP measure, as EBITDA before acquisition-related expenses, bargain purchase gain, net (gain)/loss on disposition or impairment, and stock-based compensation expenses. The company defines EBITDA as net income/(loss) before net interest, tax expense, depreciation, and amortization expenses.
Financial Results for Year Ended December 31: 2022 Compared to 2021
Revenue was $101.9 million in 2022, compared to $80.9 million in 2021. Net income was $1.2 million, or $0.08 per diluted share, compared to $6.6 million, or $0.44 per diluted share, in 2021. Adjusted EBITDA was $11.5 million, compared to $12.6 million in 2021.
Balance Sheet Liquidity
Unrestricted cash was $9.7 million at December 31, 2022, compared to $19.5 million at December 31, 2021. During 2022, investing activities of $20.8 million consisted of the acquisition of three regional developer territory rights and 16 previously franchised clinics as well as the development of 16 greenfield clinics, which were partially offset by $11.1 million provided by operating activities.
2023 Guidance
For 2023, management provided financial and clinic opening guidance. Historically, company-owned or managed clinic openings included a combination of both greenfields and acquisitions. The company will continue to acquire previously franchised clinics. However, as these transactions are opportunistic, management will no longer include the acquired clinic estimate in guidance. To provide greater clarity, the 2023 company-owned or managed guidance includes greenfield clinic openings only.
Conference Call
The Joint Corp. management will host a conference call at 5:00 p.m. ET on Thursday, March 9, 2023 to discuss the fourth quarter and year-end 2022 financial results. Shareholders and interested participants may listen to a live broadcast of the conference call by dialing (833) 630-0823 or (412) 317-1831 and ask to be joined into the ‘The Joint’ call approximately 15 minutes prior to the start time.
The live webcast of the call with accompanying slide presentation can be accessed in the IR events section https://ir.thejoint.com/events and will be available for approximately one year. An audio archive can be accessed for one week by dialing (877) 344-7529 or (412) 317-0088 and entering conference ID 5287939
Commonly Discussed Performance Metrics
This release includes a presentation of commonly discussed performance metrics. System-wide sales include revenues at all clinics, whether operated by the company or by franchisees. While franchised sales are not recorded as revenues by the company, management believes the information is important in understanding the company’s financial performance, because these sales are the basis on which the company calculates and records royalty fees and are indicative of the financial health of the franchisee base. Comp sales include the revenues from both company-owned or managed clinics and franchised clinics that in each case have been open at least 13 full months and exclude any clinics that have closed.
Non-GAAP Financial Information
This release also includes a presentation of non-GAAP financial measures. EBITDA and Adjusted EBITDA are presented because they are important measures used by management to assess financial performance, as management believes they provide a more transparent view of the company’s underlying operating performance and operating trends. Reconciliation of net income/(loss) to EBITDA and Adjusted EBITDA is presented in the table below. The company defines Adjusted EBITDA as EBITDA before acquisition-related expenses, bargain purchase gain, net (gain)/loss on disposition or impairment, and stock-based compensation expenses. The company defines EBITDA as net income/(loss) before net interest, tax expense, depreciation, and amortization expenses.
EBITDA and Adjusted EBITDA do not represent and should not be considered alternatives to net income or cash flows from operations, as determined by accounting principles generally accepted in the United States, or GAAP. While EBITDA and Adjusted EBITDA are used as measures of financial performance and the ability to meet debt service requirements, they are not necessarily comparable to other similarly titled captions of other companies due to potential inconsistencies in the methods of calculation. EBITDA and Adjusted EBITDA should be reviewed in conjunction with the company’s financial statements filed with the SEC.
Forward-Looking Statements
This press release contains statements about future events and expectations that constitute forward-looking statements. Forward-looking statements are based on our beliefs, assumptions and expectations of industry trends, our future financial and operating performance and our growth plans, taking into account the information currently available to us. These statements are not statements of historical fact. Forward-looking statements involve risks and uncertainties that may cause our actual results to differ materially from the expectations of future results we express or imply in any forward-looking statements, and you should not place undue reliance on such statements. Factors that could contribute to these differences include, but are not limited to, our inability to identify and recruit enough qualified chiropractors and other personnel to staff our clinics, due in part to the nationwide labor shortage, and an increase in operating expenses due to measures we may need to take to address such shortage, inflation, exacerbated by COVID-19 and the current war in Ukraine, which has increased our costs and which could otherwise negatively impact our business, the potential for further disruption to our operations and the unpredictable impact on our business of the COVID-19 outbreak and outbreaks of other contagious diseases, our failure to develop or acquire company-owned or managed clinics as rapidly as we intend, our failure to profitably operate company-owned or managed clinics, short-selling strategies and negative opinions posted on the internet which could drive down the market price of our common stock and result in class action lawsuits, our failure to remediate future material weaknesses in our internal control over financial reporting, which could negatively impact our ability to accurately report our financial results, prevent fraud, or maintain investor confidence, and other factors described in our filings with the SEC, including in the section entitled “Risk Factors” in our Annual Report on Form 10-K for the year ended December 31, 2022 expected to be filed with the SEC on March 10, 2023 and subsequently-filed current and quarterly reports. Words such as, "anticipates," "believes," "continues," "estimates," "expects," "goal," "objectives," "intends," "may," "opportunity," "plans," "potential," "near-term," "long-term," "projections," "assumptions," "projects," "guidance," "forecasts," "outlook," "target," "trends," "should," "could," "would," "will," and similar expressions are intended to identify such forward-looking statements. We qualify any forward-looking statements entirely by these cautionary factors. We assume no obligation to update or revise any forward-looking statements for any reason or to update the reasons actual results could differ materially from those anticipated in these forward-looking statements, even if new information becomes available in the future. Comparisons of results for current and any prior periods are not intended to express any future trends or indications of future performance, unless expressed as such, and should only be viewed as historical data.
About The Joint Corp. (NASDAQ: JYNT)
The Joint Corp. (NASDAQ: JYNT) revolutionized access to chiropractic care when it introduced its retail healthcare business model in 2010. Today, it is the nation’s largest operator, manager and franchisor of chiropractic clinics through The Joint Chiropractic network. The company is making quality care convenient and affordable, while eliminating the need for insurance, for millions of patients seeking pain relief and ongoing wellness. With more than 800 locations nationwide and more than 12 million patient visits annually, The Joint Chiropractic is a key leader in the chiropractic industry. Consistently named to Franchise Times “Top 500+ Franchises” and Entrepreneur’s “Franchise 500” lists and recognized by FRANdata with the TopFUND award, as well as Franchise Business Review’s “Top Franchise for 2023,” “Most Profitable Franchises” and “Top Franchises for Veterans” ranking, The Joint Chiropractic is an innovative force, where healthcare meets retail. For more information, visit www.thejoint.com. To learn about franchise opportunities, visit www.thejointfranchise.com.
Business Structure
The Joint Corp. is a franchisor of clinics and an operator of clinics in certain states. In Arkansas, California, Colorado, District of Columbia, Florida, Illinois, Kansas, Kentucky, Maryland, Michigan, Minnesota, New Jersey, New York, North Carolina, Oregon, Pennsylvania, Rhode Island, South Dakota, Tennessee, Washington, West Virginia and Wyoming, The Joint Corp. and its franchisees provide management services to affiliated professional chiropractic practices.
Media Contact: Margie Wojciechowski, The Joint Corp., margie.wojciechowski@thejoint.com
Investor Contact: Kirsten Chapman, LHA Investor Relations, 415-433-3777, thejoint@lhai.com
– Financial Tables Follow –
THE JOINT CORP. AND SUBSIDIARY AND AFFILIATES
CONDENSED CONSOLIDATED BALANCE SHEETS
(unaudited)
| Dec. 31,2022 | Dec. 31,2021 | ||||||
| ASSETS | |||||||
| Current assets: | |||||||
| Cash and cash equivalents | $ | 9,745,066 | $ | 19,526,119 | |||
| Restricted cash | 805,351 | 386,219 | |||||
| Accounts receivable | 3,911,272 | 3,700,810 | |||||
| Deferred franchise and regional development costs, current portion | 1,054,060 | 994,587 | |||||
| Prepaid expenses and other current assets | 2,098,359 | 2,281,765 | |||||
| Total current assets | 17,614,108 | 26,889,500 | |||||
| Property and equipment, net | 17,475,152 | 14,388,946 | |||||
| Operating lease right-of-use asset | 20,587,199 | 18,425,914 | |||||
| Deferred franchise and regional development costs, net of current portion | 5,707,678 | 5,505,420 | |||||
| Intangible assets, net | 12,867,529 | 5,403,390 | |||||
| Goodwill | 8,493,407 | 5,085,203 | |||||
| Deferred tax assets | 8,441,713 | 9,188,634 | |||||
| Deposits and other assets | 756,386 | 567,202 | |||||
| Total assets | $ | 91,943,172 | $ | 85,454,209 | |||
| LIABILITIES AND STOCKHOLDERS' EQUITY | |||||||
| Current liabilities: | |||||||
| Accounts payable | $ | 2,966,589 | $ | 1,705,568 | |||
| Accrued expenses | 1,069,610 | 1,809,460 | |||||
| Co-op funds liability | 805,351 | 386,219 | |||||
| Payroll liabilities ($0.6 million and $0.4 million attributable to VIEs as of Dec. 31, 2022 and 2021) | 2,030,510 | 3,906,317 | |||||
| Operating lease liability, current portion | 5,295,830 | 4,613,843 | |||||
| Finance lease liability, current portion | 24,433 | 49,855 | |||||
| Deferred franchise and regional development fee revenue, current portion | 2,955,851 | 3,191,892 | |||||
| Deferred revenue from company clinics ($4.7 million and $3.5 million attributable to VIEs as of Dec. 31, 2022 and 2021) | 7,471,549 | 5,235,745 | |||||
| Other current liabilities | 499,250 | 539,500 | |||||
| Total current liabilities | 23,118,973 | 21,438,399 | |||||
| Operating lease liability, net of current portion | 18,672,719 | 16,872,093 | |||||
| Finance lease liability, net of current portion | 63,507 | 87,939 | |||||
| Debt under the Credit Agreement | 2,000,000 | 2,000,000 | |||||
| Deferred franchise and regional development fee revenue, net of current portion | 15,661,412 | 15,458,921 | |||||
| Other liabilities | 27,230 | 27,230 | |||||
| Total liabilities | 59,543,841 | 55,884,582 | |||||
| Commitments and contingencies (note 10) | |||||||
| Stockholders' equity: | |||||||
| Series A preferred stock, $0.001 par value; 50,000 shares authorized, 0 issued and outstanding, as of Dec. 31, 2022 and 2021 | — | — | |||||
| Common stock, $0.001 par value; 20,000,000 shares authorized, 14,560,353 shares issued and 14,528,487 shares outstanding as of Dec. 31, 2022 and 14,451,355 shares issued and 14,419,712 outstanding as of Dec. 31, 2021 | 14,560 | 14,450 | |||||
| Additional paid-in capital | 45,558,305 | 43,900,157 | |||||
| Treasury stock 31,866 shares as of Dec. 31, 2022 and 31,643 shares as of Dec.31, 2021, at cost | (856,642 | ) | (850,838 | ) | |||
| Accumulated deficit | (12,341,892 | ) | (13,519,142 | ) | |||
| Total The Joint Corp. stockholders' equity | 32,374,331 | 29,544,627 | |||||
| Non-controlling Interest | 25,000 | 25,000 | |||||
| Total equity | 32,399,331 | 29,569,627 | |||||
| Total liabilities and stockholders' equity | $ | 91,943,172 | $ | 85,454,209 | |||
THE JOINT CORP. AND SUBSIDIARY AND AFFILIATES
CONDENSED CONSOLIDATED INCOME STATEMENTS
(unaudited)
| Three Months Ended | Year Ended | ||||||||||||||
| Dec. 31, | Dec. 31, | ||||||||||||||
| 2022 | 2021 | 2022 | 2021 | ||||||||||||
| Revenues: | |||||||||||||||
| Revenues from company-owned or managed clinics | $ | 16,485,996 | $ | 11,820,917 | $ | 59,422,294 | $ | 44,348,234 | |||||||
| Royalty fees | 7,165,732 | 6,246,489 | 26,190,531 | 22,062,989 | |||||||||||
| Franchise fees | 471,070 | 691,418 | 2,441,325 | 2,659,097 | |||||||||||
| Advertising fund revenue | 2,038,855 | 1,777,581 | 7,456,696 | 6,298,924 | |||||||||||
| Software fees | 1,124,007 | 996,313 | 4,290,739 | 3,383,856 | |||||||||||
| Regional developer fees | 134,176 | 206,599 | 659,099 | 848,640 | |||||||||||
| Other revenues | 392,717 | 361,953 | 1,450,725 | 1,257,913 | |||||||||||
| Total revenues | 27,812,553 | 22,101,270 | 101,911,409 | 80,859,653 | |||||||||||
| Cost of revenues: | |||||||||||||||
| Franchise and regional developer cost of revenues | 2,242,857 | 2,088,847 | 8,462,503 | 7,408,125 | |||||||||||
| IT cost of revenues | 357,212 | 320,954 | 1,367,659 | 1,105,652 | |||||||||||
| Total cost of revenues | 2,600,069 | 2,409,801 | 9,830,162 | 8,513,777 | |||||||||||
| Selling and marketing expenses | 3,296,210 | 2,920,798 | 13,962,709 | 11,424,416 | |||||||||||
| Depreciation and amortization | 2,302,560 | 1,813,807 | 7,643,980 | 6,088,947 | |||||||||||
| General and administrative expenses | 18,284,032 | 14,939,927 | 67,987,482 | 49,453,305 | |||||||||||
| Total selling, general and administrative expenses | 23,882,802 | 19,674,532 | 89,594,171 | 66,966,668 | |||||||||||
| Net loss (gain) on disposition or impairment | 50,075 | 9,822 | 410,215 | 26,789 | |||||||||||
| Income from operations | 1,279,607 | 7,115 | 2,076,861 | 5,352,419 | |||||||||||
| Other expense, net | (72,433 | ) | (15,829 | ) | (133,101 | ) | (69,878 | ) | |||||||
| Income before income tax expense (benefit) | 1,207,174 | (8,714 | ) | 1,943,760 | 5,282,541 | ||||||||||
| Income tax expense (benefit) | 659,983 | 351,267 | 766,510 | (1,293,229 | ) | ||||||||||
| Net income | $ | 547,191 | $ | (359,981 | ) | $ | 1,177,250 | $ | 6,575,770 | ||||||
| Earnings per share: | |||||||||||||||
| Basic earnings per share | $ | 0.04 | $ | (0.02 | ) | $ | 0.08 | $ | 0.46 | ||||||
| Diluted earnings per share | $ | 0.04 | $ | (0.02 | ) | $ | 0.08 | $ | 0.44 | ||||||
| Basic weighted average shares | 14,529,829 | 14,416,273 | 14,488,314 | 14,319,448 | |||||||||||
| Diluted weighted average shares | 14,817,591 | 14,946,865 | 14,868,093 | 14,935,577 | |||||||||||
THE JOINT CORP. AND SUBSIDIARY AND AFFILIATES
CONDENSED CONSOLIDATED STATEMENTS OF CASH FLOWS
(unaudited)
| Year Ended Dec. 31, | |||||||
| 2022 | 2021 | ||||||
| Cash flows from operating activities: | |||||||
| Net income | $ | 1,177,250 | $ | 6,575,770 | |||
| Adjustments to reconcile net income to net cash provided by operating activities: | |||||||
| Depreciation and amortization | 7,643,980 | 6,088,947 | |||||
| Net loss on disposition or impairment (non-cash portion) | 410,215 | 125,237 | |||||
| Net franchise fees recognized upon termination of franchise agreements | (68,537 | ) | (133,007 | ) | |||
| Deferred income taxes | 746,921 | (1,247,198 | ) | ||||
| Stock based compensation expense | 1,273,989 | 1,056,015 | |||||
| Changes in operating assets and liabilities: | |||||||
| Accounts receivable | (154,672 | ) | (1,637,589 | ) | |||
| Prepaid expenses and other current assets | 183,406 | (715,740 | ) | ||||
| Deferred franchise costs | (351,151 | ) | (1,418,235 | ) | |||
| Deposits and other assets | (189,184 | ) | (148,516 | ) | |||
| Accounts payable | 818,265 | (14,373 | ) | ||||
| Accrued expenses | (1,170,070 | ) | 886,738 | ||||
| Payroll liabilities | (1,875,807 | ) | 1,130,281 | ||||
| Deferred revenue | 2,230,041 | 3,624,944 | |||||
| Other liabilities | 409,938 | 1,059,506 | |||||
| Net cash provided by operating activities | 11,084,584 | 15,232,780 | |||||
| Cash flows from investing activities: | |||||||
| Acquisition of AZ clinics | (6,966,923 | ) | (1,925,000 | ) | |||
| Acquisition of NC clinics | (3,289,312 | ) | (3,840,135 | ) | |||
| Acquisition of CA clinics | (1,850,000 | ) | — | ||||
| Proceeds from sale of clinics | 105,200 | — | |||||
| Purchase of property and equipment | (5,899,080 | ) | (6,989,534 | ) | |||
| Reacquisition and termination of regional developer rights | (2,875,000 | ) | (1,388,700 | ) | |||
| Net cash used in investing activities | (20,775,115 | ) | (14,143,369 | ) | |||
| Cash flows from financing activities: | |||||||
| Payments of finance lease obligation | (49,855 | ) | (80,322 | ) | |||
| Purchases of treasury stock under employee stock plans | (5,804 | ) | (707,727 | ) | |||
| Proceeds from exercise of stock options | 384,269 | 1,519,317 | |||||
| Repayment of debt under the Paycheck Protection Program | — | (2,727,970 | ) | ||||
| Net cash provided by (used in) financing activities | 328,610 | (1,996,702 | ) | ||||
| Decrease in cash | (9,361,921 | ) | (907,291 | ) | |||
| Cash, cash equivalents and restricted cash, beginning of period | 19,912,338 | 20,819,629 | |||||
| Cash, cash equivalents and restricted cash, end of period | $ | 10,550,417 | $ | 19,912,338 | |||
| Dec. 31, 2022 | Dec. 31, 2021 | ||||||
| Reconciliation of cash, cash equivalents and restricted cash: | |||||||
| Cash and cash equivalents | $ | 9,745,066 | $ | 19,526,119 | |||
| Restricted cash | 805,351 | 386,219 | |||||
| $ | 10,550,417 | $ | 19,912,338 | ||||
THE JOINT CORP. AND SUBSIDIARY AND AFFILIATES
RECONCILIATION FOR GAAP TO NON-GAAP
(unaudited)
| Three Months Ended | Year Ended | |||||||||||||
| Dec. 31, | Dec. 31, | |||||||||||||
| Non-GAAP Financial Data: | 2022 | 2021 | 2022 | 2021 | ||||||||||
| Net income | $ | 547,191 | $ | (359,981 | ) | $ | 1,177,250 | $ | 6,575,770 | |||||
| Net interest | 72,433 | 15,829 | 133,102 | 69,878 | ||||||||||
| Depreciation and amortization expense | $ | 2,302,560 | $ | 1,813,807 | $ | 7,643,980 | $ | 6,088,947 | ||||||
| Income tax expense (benefit) | 659,983 | 351,267 | 766,510 | (1,293,229 | ) | |||||||||
| EBITDA | $ | 3,582,167 | $ | 1,820,922 | $ | 9,720,842 | $ | 11,441,366 | ||||||
| Stock compensation expense | 304,427 | 229,107 | 1,273,989 | 1,056,015 | ||||||||||
| Acquisition related expenses | 31,787 | 20,370 | 110,085 | 68,716 | ||||||||||
| Net loss (gain) on disposition or impairment | 50,075 | 9,822 | 410,215 | 26,789 | ||||||||||
| Adjusted EBITDA | $ | 3,968,456 | $ | 2,080,221 | $ | 11,515,131 | $ | 12,592,886 | ||||||
1 System-wide sales include revenues at all clinics, whether operated or managed by the company or by franchisees. While franchised sales are not recorded as revenues by the company, management believes the information is important in understanding the company’s financial performance, because these revenues are the basis on which the company calculates and records royalty fees and are indicative of the financial health of the franchisee base.
2 Comp sales include the revenues from both company-owned or managed clinics and franchised clinics that in each case have been open at least 13 full months and exclude any clinics that have closed.
Exhibit 99.2

Q4 2022 Financial Results As of December 31, 2022 | Reported on March 9, 2023

2 Safe Harbor Statements Certain statements contained in this presentation are "forward - looking statements” about future events and expectations. Forward - looking statements are based on our beliefs, assumptions and expectations of industry trends, our future financial and operating performance and our growth plans, taking into account the in formation currently available to us. These statements are not statements of historical fact. Forward - looking statements involve risks and uncertainties that may cause our actual results to d iffer materially from the expectations of future results we express or imply in any forward - looking statements, and you should not place undue reliance on such statements. Factors that could contribu te to these differences include, our inability to identify and recruit enough qualified chiropractors and other personnel to staff our clinics, due in part to the nationwide labor shortage, and an in crease in operating expenses due to measures we may need to take to address such shortage, inflation, exacerbated by COVID - 19 and the current war in Ukraine, which has increased our costs and whic h could otherwise negatively impact our business, the potential for further disruption to our operations and the unpredictable impact on our business of the COVID - 19 outbreak and outbreaks of othe r contagious diseases, our failure to develop or acquire company - owned or managed clinics as rapidly as we intend, our failure to profitably operate company - owned or managed clinics, short - sell ing strategies and negative opinions posted on the internet which could drive down the market price of our common stock and result in class action lawsuits, our failure to remediate future ma ter ial weaknesses in our internal control over financial reporting, which could negatively impact our ability to accurately report our financial results, prevent fraud, or maintain investor confidenc e, and other factors described in our filings with the SEC, including in the section entitled “Risk Factors” in our Annual Report on Form 10 - K for the year ended December 31, 2022 expected to be filed with the SEC on March 10, 2023 and subsequently - filed current and quarterly reports. Words such as, "anticipates," "believes," "continues," "estimates," "expects," "goal," "objectives," "inte nds ," "may," "opportunity," "plans," "potential," "near - term," "long - term," "projections," "assumptions," "projects," "guidance," "forecasts," "outlook," "target," "trends," "should," "could," "would," "w ill," and similar expressions are intended to identify such forward - looking statements. We qualify any forward - looking statements entirely by these cautionary factors. We assume no obligation to u pdate or revise any forward - looking statements for any reason or to update the reasons actual results could differ materially from those anticipated in these forward - looking statements, even if ne w information becomes available in the future. Comparisons of results for current and any prior periods are not intended to express any future trends or indications of future performance, unless exp ressed as such, and should only be viewed as historical data. Business Structure The Joint Corp. is a franchisor of clinics and an operator of clinics in certain states. In Arkansas, California, Colorado, D ist rict of Columbia, Florida, Illinois, Kansas, Kentucky, Maryland, Michigan, Minnesota, New Jersey, New York, North Carolina, Oregon, Pennsylvania, Rhode Island, South Dakota, Tennessee, Washington, Wes t V irginia and Wyoming, The Joint Corp. and its franchisees provide management services to affiliated professional chiropractic practices. © 2023 The Joint Corp. All Rights Reserved.

© 2023 The Joint Corp. All Rights Reserved. 3 Forging the Chiropractic Dream Accelerating the Pace of Clinic Growth Harnessing the Power of Our Data Strong Operational KPIs © 2022 The Joint Corp.

All Rights Reserved. 4 1 New patient survey completed early 2023. 1.6M unique patients treated in 2022 845K new patients in 2022 12.2M adjustments in 2022 34% of new patients were new to chiropractic 1 84% system - wide gross sales from monthly memberships in 2022 Up from 1.4M in 2021 ~287K patients had never been to a chiropractor before in 2022 Compared to 807K in 2021 Up from 10.9M in 2021 Compared to 85% in 2021 © 2023 The Joint Corp. All Rights Reserved.
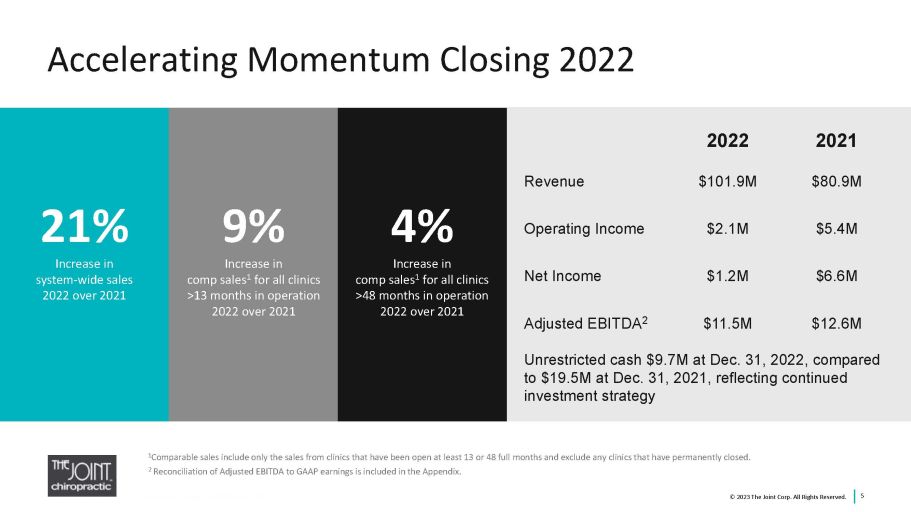
Accelerating Momentum Closing 2022 5 2022 2021 Revenue $101.9M $80.9M Operating Income $2.1M $5.4M Net Income $1.2M $6.6M Adjusted EBITDA 2 $11.5M $12.6M Unrestricted cash $9.7M at Dec. 31, 2022, compared to $19.5 M at Dec. 31, 2021, reflecting continued investment strategy © 2022 The Joint Corp. All Rights Reserved. 1 Comparable sales include only the sales from clinics that have been open at least 13 or 48 full months and exclude any clinics that have permanently closed. 2 Reconciliation of Adjusted EBITDA to GAAP earnings is included in the Appendix. 5 21 % Increase in system - wide sales 2022 over 2021 9% In crease in comp sales 1 for all clinics >13 months in operation 2022 over 2021 4 % In crease in comp sales 1 for all clinics >48 months in operation 2022 over 2021 © 2023 The Joint Corp. All Rights Reserved.

12 26 82 175 242 265 309 352 394 453 515 610 712 4 47 61 47 48 60 64 96 126 2010 2011 2012 2013 2014 2015 2016 2017 2018 2019 2020 2021 2022 TOTAL CLINICS OPEN Franchise Company Owned/Managed © 2023 The Joint Corp. All Rights Reserved. 6 Opened Record 137 Clinics in 2022, Up from 130 in 2021 2021 2022 Franchise Licenses Sold 156 75 Total New Franchised Clinics Opened 110 121 Greenfield Clinics Opened 20 16 Franchised Clinics Acquired, Net 1 12 14 Clinics in Development 283 235 370 399 442 513 312 246 579 706 838 1 During 2022, the company acquired 16 previously owned franchised clinics and sold 2 company - owned or managed clinics to franchisees.

67% sold by Regional Developers in 2022 69% of clinics supported by 18 RDs as of Dec. 31, 2022 RD territories cover 55% of Metropolitan Statistical Areas (MSAs) as of Dec. 31, 2022 37 99 126 121 156 75 Dec. 31, 2017 Dec. 31, 2018 Dec. 31, 2019 Dec. 31, 2020 Dec. 31, 2021 Dec. 31, 2022 616 715 841 962 1118 1193 Dec. 31, 2017 Dec. 31, 2018 Dec. 31, 2019 Dec. 31, 2020 Dec. 31, 2021 Dec. 31, 2022 112 155 204 253 283 235 Dec. 31, 2017 Dec. 31, 2018 Dec. 31, 2019 Dec. 31, 2020 Dec. 31, 2021 Dec. 31, 2022 Solid Foundation for Growth © 2022 The Joint Corp. All Rights Reserved. 7 1 Of the 1,193 franchise licenses sold as of December 31, 2022, 235 are in active development, 712 are currently operating and the balance represents terminated/closed licenses. Gross Cumulative Franchise Licenses Sold 1 Franchise Licenses Sold Annually Clinics in Active Development 1 © 2023 The Joint Corp. All Rights Reserved.
Top Franchise Recognition... Again 8 © 2023 The Joint Corp. All Rights Reserved.

Marketing Driving Growth “Give Thanks, Give Back” S ocial C ampaign Sweepstakes • 2,700% increase in engagement by our patients and followers Annual Promotions • “Back Friday” package sale up 32% over 2021 • “End - of - Year” membership sale up 44% over 2021 9 © 2023 The Joint Corp. All Rights Reserved.
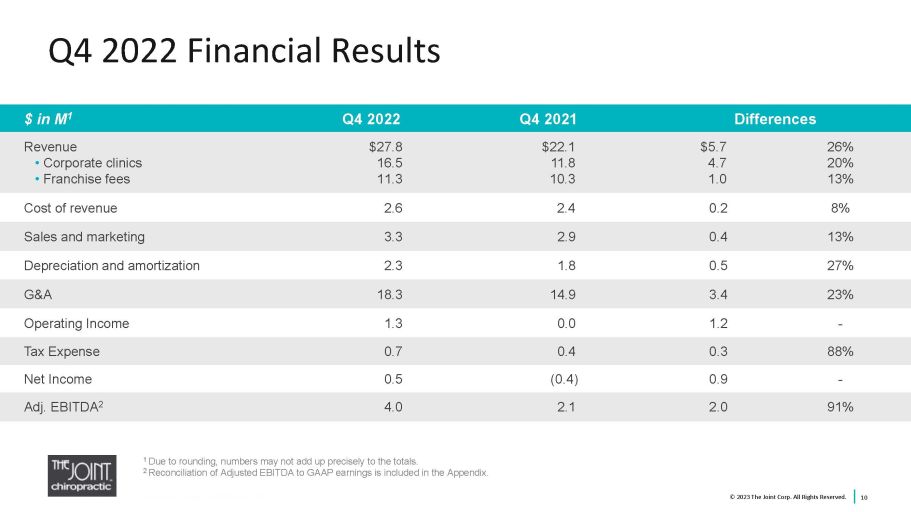
Q4 2022 Financial Results 10 $ in M 1 Q4 2022 Q4 2021 Differences Revenue • Corporate clinics • Franchise fees $27.8 16.5 11.3 $22.1 11.8 10.3 $5.7 4.7 1.0 26% 20% 13% Cost of revenue 2.6 2.4 0.2 8% Sales and marketing 3.3 2.9 0.4 13% Depreciation and amortization 2.3 1.8 0.5 27% G&A 18.3 14.9 3.4 23% Operating Income 1.3 0.0 1.2 - Tax Expense 0.7 0.4 0.3 88% Net Income 0.5 (0.4) 0.9 - Adj. EBITDA 2 4.0 2.1 2.0 91% 1 Due to rounding, numbers may not add up precisely to the totals. 2 Reconciliation of Adjusted EBITDA to GAAP earnings is included in the Appendix. © 2023 The Joint Corp. All Rights Reserved.
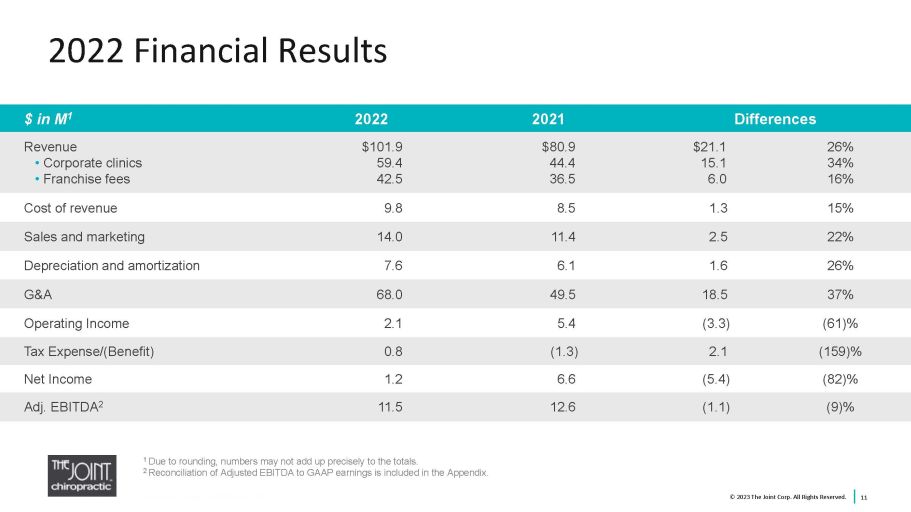
2022 Financial Results 11 $ in M 1 2022 2021 Differences Revenue • Corporate clinics • Franchise fees $101.9 59.4 42.5 $80.9 44.4 36.5 $21.1 15.1 6.0 26% 34% 16% Cost of revenue 9.8 8.5 1.3 15% Sales and marketing 14.0 11.4 2.5 22% Depreciation and amortization 7.6 6.1 1.6 26% G&A 68.0 49.5 18.5 37% Operating Income 2.1 5.4 (3.3) (61)% Tax Expense/(Benefit) 0.8 (1.3) 2.1 (159)% Net Income 1.2 6.6 (5.4) (82)% Adj. EBITDA 2 11.5 12.6 (1.1) (9)% 1 Due to rounding, numbers may not add up precisely to the totals. 2 Reconciliation of Adjusted EBITDA to GAAP earnings is included in the Appendix. © 2023 The Joint Corp. All Rights Reserved.
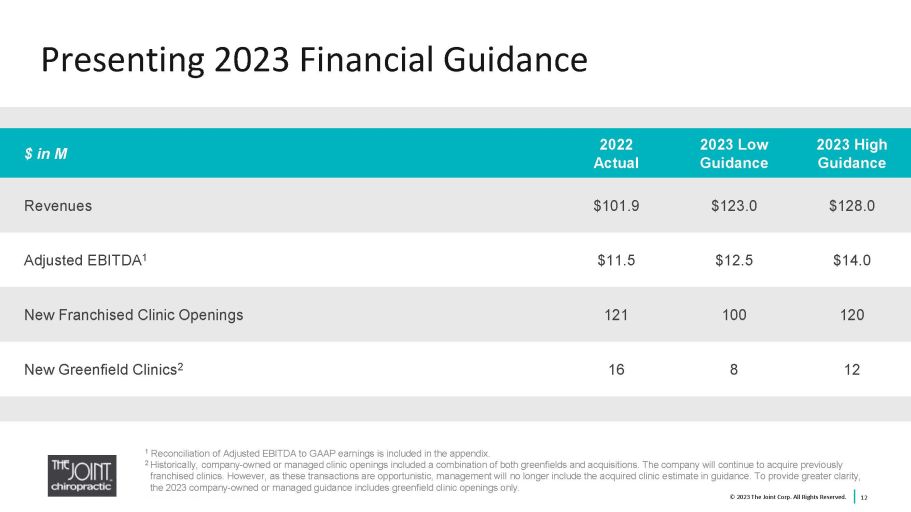
1 Reconciliation of Adjusted EBITDA to GAAP earnings is included in the appendix. 2 Historically, company - owned or managed clinic openings included a combination of both greenfields and acquisitions. The company will continue to acquire previously franchised clinics. However, as these transactions are opportunistic, management will no longer include the acquired clinic e s timate in guidance. To provide greater clarity, the 2023 company - owned or managed guidance includes greenfield clinic openings only. Presenting 2023 Financial Guidance 12 $ in M 2022 Actual 2023 Low Guidance 2023 High Guidance Revenues $101.9 $123.0 $128.0 Adjusted EBITDA 1 $11.5 $12.5 $14.0 New Franchised Clinic Openings 121 100 120 New Greenfield Clinics 2 16 8 12 © 2023 The Joint Corp. All Rights Reserved.
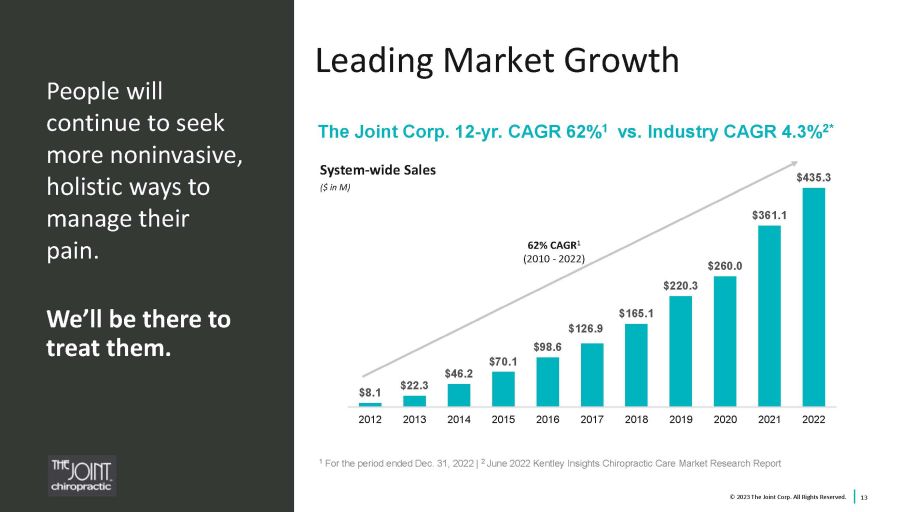
$8.1 $22.3 $46.2 $70.1 $98.6 $126.9 $165.1 $220.3 $260.0 $361.1 $435.3 2012 2013 2014 2015 2016 2017 2018 2019 2020 2021 2022 Leading Market Growth People will continue to seek more noninvasive, holistic ways to manage their pain. We’ll be there to treat them. System - wide Sales ($ in M) 62 % CAGR 1 (2010 - 2022) The Joint Corp. 12 - yr. CAGR 62% 1 vs. Industry CAGR 4.3% 2* 1 For the period ended Dec. 31, 2022 | 2 June 2022 Kentley Insights Chiropractic Care Market Research Report 13 © 2023 The Joint Corp. All Rights Reserved.
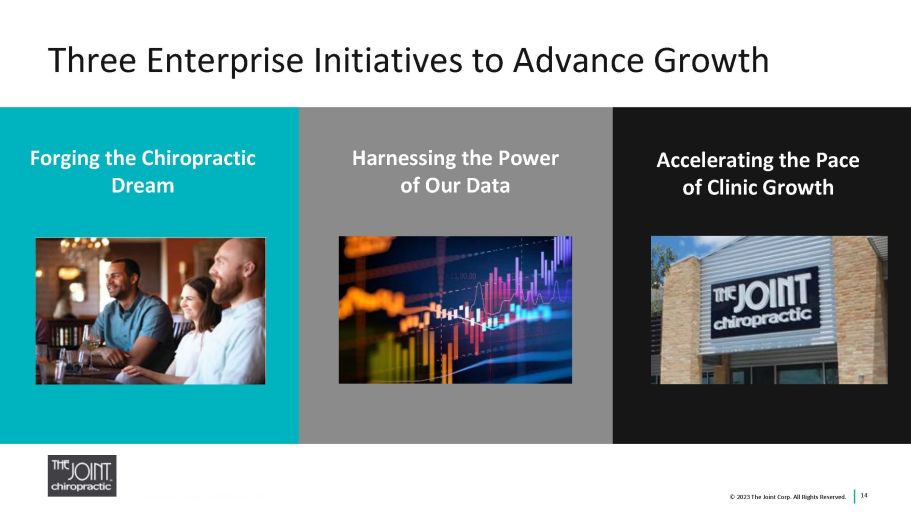
Three Enterprise Initiatives to Advance Growth 14 Forging the Chiropractic Dream Accelerating the Pace of Clinic Growth Harnessing the Power of Our Data © 2023 The Joint Corp. All Rights Reserved.

Driving Long - term Shareholder Value 15 © 2023 The Joint Corp. All Rights Reserved.

16 Appendix Source: © 2023 The Joint Corp. All Rights Reserved.
Performance Metrics and Non - GAAP Measures 17 This presentation includes commonly discussed performance metrics. System - wide sales include sales at all clinics, whether operated by the company or by franchisees. While franchised sales are not recorded as revenues by the company, management believes the information is impor tan t in understanding the company’s financial performance, because these sales are the basis on which the company calculates and records royalty fees a nd are indicative of the financial health of the franchisee base. Comp sales include the sales from both company - owned or managed clinics and franchised clinics that in each case have been open at least 13 full months and exclude any clinics that have closed. This presentation includes non - GAAP financial measures. EBITDA and Adjusted EBITDA are presented because they are important measures used by management to assess financial performance, as management believes they provide a more transparent view of the Company’s underlying operating performance and operating trends than GAAP measures alone. Reconciliations of net loss to EBITDA and Adjusted EBITDA are pres ent ed where applicable. The Company defines EBITDA as net income/(loss) before net interest, tax expense, depreciation, and amortization expenses. Th e C ompany defines Adjusted EBITDA as EBITDA before acquisition - related expenses, bargain purchase net gain, gain/(loss) on disposition or impairment, and stock - based compensation expenses. EBITDA and Adjusted EBITDA do not represent and should not be considered alternatives to net income or cash flows from operat ion s, as determined by accounting principles generally accepted in the United States, or GAAP. While EBITDA and Adjusted EBITDA are frequently used as measures of financial performance and the ability to meet debt service requirements, they are not necessarily comparable to other similarly titled cap tions of other companies due to potential inconsistencies in the methods of calculation. EBITDA and Adjusted EBITDA should be reviewed in conjunction with th e Company’s financial statements filed with the SEC. © 2023 The Joint Corp. All Rights Reserved.
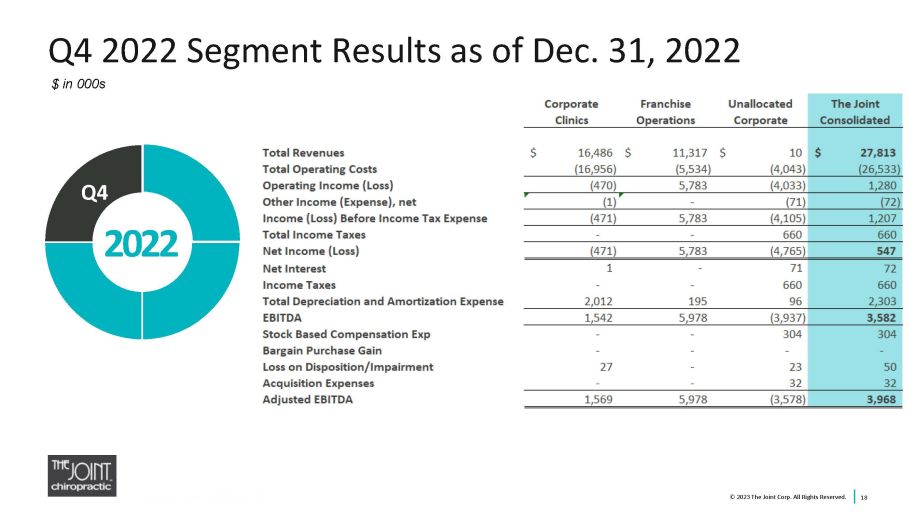
Q4 2022 Segment Results as of Dec. 31, 2022 18 2022 Q4 © 2022 The Joint Corp. All Rights Reserved. $ in 000s © 2023 The Joint Corp. All Rights Reserved.
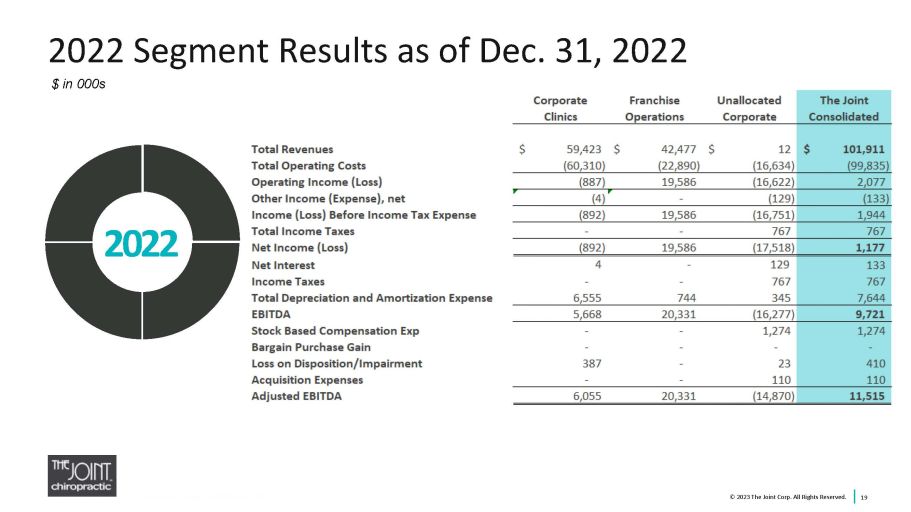
2022 Segment Results as of Dec. 31, 2022 19 2022 © 2022 The Joint Corp. All Rights Reserved. $ in 000s © 2023 The Joint Corp. All Rights Reserved.
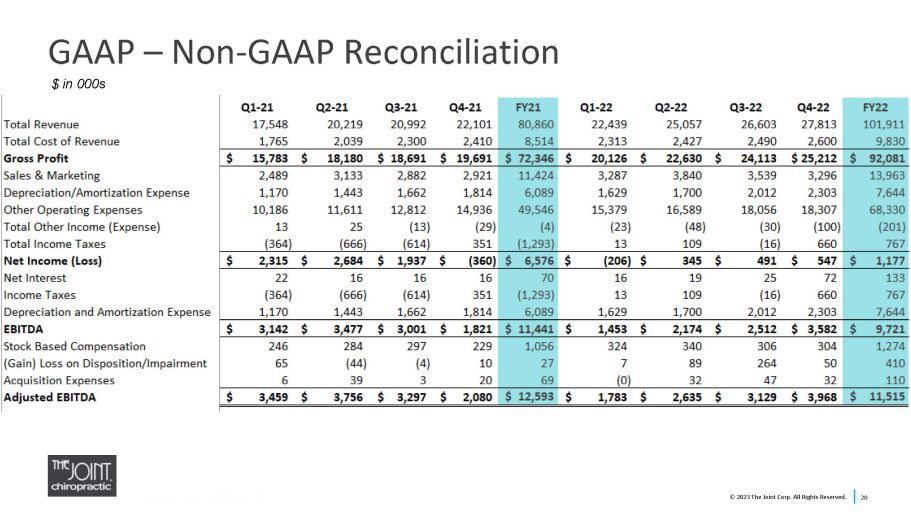
GAAP – Non - GAAP Reconciliation 20 $ in 000s © 2023 The Joint Corp. All Rights Reserved.

Jake Singleton, CFO jake.singleton@thejoint.com The Joint Corp. | 16767 N. Perimeter Dr., Suite 110, Scottsdale, AZ 85260 | (480) 245 - 5960 https://www.facebook.com/thejointchiro @thejointchiro https://twitter.com/thejointchiro @thejointchiro https://www.youtube.com/thejointcorp @thejointcorp Peter D. Holt, President & CEO peter.holt@thejoint.com The Joint Corp. | 16767 N. Perimeter Dr., Suite 110, Scottsdale, AZ 85260 | (480) 245 - 5960 Kirsten Chapman, LHA Investor Relations thejoint@lhai.com LHA Investor Relations | 50 California Street, Suite 1500 | San Francisco, CA 94111| (415) 433 - 3777 Contact Information 21 © 2023 The Joint Corp. All Rights Reserved.