COMMVAULT SYSTEMS INC00011695612022FYfalsehttp://fasb.org/us-gaap/2021-01-31#AccountingStandardsUpdate201613MemberP10YP3YP1Y
00011695612021-04-012022-03-3100011695612021-09-30iso4217:USD00011695612022-05-03xbrli:shares00011695612022-03-3100011695612021-03-31iso4217:USDxbrli:shares0001169561us-gaap:ProductMember2021-04-012022-03-310001169561us-gaap:ProductMember2020-04-012021-03-310001169561us-gaap:ProductMember2019-04-012020-03-310001169561us-gaap:ServiceMember2021-04-012022-03-310001169561us-gaap:ServiceMember2020-04-012021-03-310001169561us-gaap:ServiceMember2019-04-012020-03-3100011695612020-04-012021-03-3100011695612019-04-012020-03-310001169561us-gaap:CommonStockMember2019-03-310001169561us-gaap:AdditionalPaidInCapitalMember2019-03-310001169561us-gaap:RetainedEarningsMember2019-03-310001169561us-gaap:AccumulatedOtherComprehensiveIncomeMember2019-03-3100011695612019-03-310001169561us-gaap:AdditionalPaidInCapitalMember2019-04-012020-03-310001169561us-gaap:CommonStockMember2019-04-012020-03-310001169561us-gaap:RetainedEarningsMember2019-04-012020-03-310001169561us-gaap:AccumulatedOtherComprehensiveIncomeMember2019-04-012020-03-310001169561us-gaap:CommonStockMember2020-03-310001169561us-gaap:AdditionalPaidInCapitalMember2020-03-310001169561us-gaap:RetainedEarningsMember2020-03-310001169561us-gaap:AccumulatedOtherComprehensiveIncomeMember2020-03-3100011695612020-03-310001169561srt:CumulativeEffectPeriodOfAdoptionAdjustmentMemberus-gaap:RetainedEarningsMember2020-03-310001169561srt:CumulativeEffectPeriodOfAdoptionAdjustmentMember2020-03-310001169561us-gaap:AdditionalPaidInCapitalMember2020-04-012021-03-310001169561us-gaap:CommonStockMember2020-04-012021-03-310001169561us-gaap:RetainedEarningsMember2020-04-012021-03-310001169561us-gaap:AccumulatedOtherComprehensiveIncomeMember2020-04-012021-03-310001169561us-gaap:CommonStockMember2021-03-310001169561us-gaap:AdditionalPaidInCapitalMember2021-03-310001169561us-gaap:RetainedEarningsMember2021-03-310001169561us-gaap:AccumulatedOtherComprehensiveIncomeMember2021-03-310001169561us-gaap:AdditionalPaidInCapitalMember2021-04-012022-03-310001169561us-gaap:CommonStockMember2021-04-012022-03-310001169561us-gaap:RetainedEarningsMember2021-04-012022-03-310001169561us-gaap:AccumulatedOtherComprehensiveIncomeMember2021-04-012022-03-310001169561us-gaap:CommonStockMember2022-03-310001169561us-gaap:AdditionalPaidInCapitalMember2022-03-310001169561us-gaap:RetainedEarningsMember2022-03-310001169561us-gaap:AccumulatedOtherComprehensiveIncomeMember2022-03-310001169561us-gaap:SalesRevenueNetMembercvlt:ArrowMemberus-gaap:CustomerConcentrationRiskMember2021-04-012022-03-31xbrli:pure0001169561us-gaap:SalesRevenueNetMembercvlt:ArrowMemberus-gaap:CustomerConcentrationRiskMember2020-04-012021-03-310001169561us-gaap:SalesRevenueNetMembercvlt:ArrowMemberus-gaap:CustomerConcentrationRiskMember2019-04-012020-03-310001169561us-gaap:AccountsReceivableMembercvlt:ArrowMemberus-gaap:CustomerConcentrationRiskMember2021-04-012022-03-310001169561us-gaap:AccountsReceivableMembercvlt:ArrowMemberus-gaap:CustomerConcentrationRiskMember2020-04-012021-03-310001169561srt:MinimumMemberus-gaap:BuildingMember2021-04-012022-03-310001169561srt:MaximumMemberus-gaap:BuildingMember2021-04-012022-03-310001169561srt:MinimumMemberus-gaap:ComputerEquipmentMember2021-04-012022-03-310001169561srt:MaximumMemberus-gaap:ComputerEquipmentMember2021-04-012022-03-310001169561srt:MinimumMemberus-gaap:FurnitureAndFixturesMember2021-04-012022-03-310001169561srt:MaximumMemberus-gaap:FurnitureAndFixturesMember2021-04-012022-03-310001169561us-gaap:DevelopedTechnologyRightsMember2021-04-012022-03-310001169561cvlt:CommissionPlansModificationMember2021-04-012022-03-31cvlt:source0001169561srt:MinimumMember2021-04-012022-03-310001169561srt:MaximumMember2021-04-012022-03-310001169561cvlt:SoftwareLicensesMember2021-04-012022-03-310001169561cvlt:ProfessionalServicesOtherMember2021-04-012022-03-310001169561cvlt:ProfessionalServicesEducationServicesMember2021-04-012022-03-31cvlt:segment0001169561srt:AmericasMemberus-gaap:ProductMember2021-04-012022-03-310001169561us-gaap:EMEAMemberus-gaap:ProductMember2021-04-012022-03-310001169561srt:AsiaPacificMemberus-gaap:ProductMember2021-04-012022-03-310001169561srt:AmericasMembercvlt:CustomerSupportMember2021-04-012022-03-310001169561us-gaap:EMEAMembercvlt:CustomerSupportMember2021-04-012022-03-310001169561srt:AsiaPacificMembercvlt:CustomerSupportMember2021-04-012022-03-310001169561cvlt:CustomerSupportMember2021-04-012022-03-310001169561srt:AmericasMembercvlt:OtherServicesMember2021-04-012022-03-310001169561us-gaap:EMEAMembercvlt:OtherServicesMember2021-04-012022-03-310001169561srt:AsiaPacificMembercvlt:OtherServicesMember2021-04-012022-03-310001169561cvlt:OtherServicesMember2021-04-012022-03-310001169561srt:AmericasMember2021-04-012022-03-310001169561us-gaap:EMEAMember2021-04-012022-03-310001169561srt:AsiaPacificMember2021-04-012022-03-310001169561srt:AmericasMemberus-gaap:ProductMember2020-04-012021-03-310001169561us-gaap:EMEAMemberus-gaap:ProductMember2020-04-012021-03-310001169561srt:AsiaPacificMemberus-gaap:ProductMember2020-04-012021-03-310001169561srt:AmericasMembercvlt:CustomerSupportMember2020-04-012021-03-310001169561us-gaap:EMEAMembercvlt:CustomerSupportMember2020-04-012021-03-310001169561srt:AsiaPacificMembercvlt:CustomerSupportMember2020-04-012021-03-310001169561cvlt:CustomerSupportMember2020-04-012021-03-310001169561srt:AmericasMembercvlt:OtherServicesMember2020-04-012021-03-310001169561us-gaap:EMEAMembercvlt:OtherServicesMember2020-04-012021-03-310001169561srt:AsiaPacificMembercvlt:OtherServicesMember2020-04-012021-03-310001169561cvlt:OtherServicesMember2020-04-012021-03-310001169561srt:AmericasMember2020-04-012021-03-310001169561us-gaap:EMEAMember2020-04-012021-03-310001169561srt:AsiaPacificMember2020-04-012021-03-310001169561srt:AmericasMemberus-gaap:ProductMember2019-04-012020-03-310001169561us-gaap:EMEAMemberus-gaap:ProductMember2019-04-012020-03-310001169561srt:AsiaPacificMemberus-gaap:ProductMember2019-04-012020-03-310001169561srt:AmericasMembercvlt:CustomerSupportMember2019-04-012020-03-310001169561us-gaap:EMEAMembercvlt:CustomerSupportMember2019-04-012020-03-310001169561srt:AsiaPacificMembercvlt:CustomerSupportMember2019-04-012020-03-310001169561cvlt:CustomerSupportMember2019-04-012020-03-310001169561srt:AmericasMembercvlt:OtherServicesMember2019-04-012020-03-310001169561us-gaap:EMEAMembercvlt:OtherServicesMember2019-04-012020-03-310001169561srt:AsiaPacificMembercvlt:OtherServicesMember2019-04-012020-03-310001169561cvlt:OtherServicesMember2019-04-012020-03-310001169561srt:AmericasMember2019-04-012020-03-310001169561us-gaap:EMEAMember2019-04-012020-03-310001169561srt:AsiaPacificMember2019-04-012020-03-310001169561us-gaap:TradeAccountsReceivableMember2021-03-310001169561us-gaap:OtherAssetsMember2021-03-310001169561cvlt:DeferredRevenueCurrentMember2021-03-310001169561cvlt:DeferredRevenueNoncurrentMember2021-03-310001169561us-gaap:TradeAccountsReceivableMember2021-04-012022-03-310001169561us-gaap:OtherAssetsMember2021-04-012022-03-310001169561cvlt:DeferredRevenueCurrentMember2021-04-012022-03-310001169561cvlt:DeferredRevenueNoncurrentMember2021-04-012022-03-310001169561us-gaap:TradeAccountsReceivableMember2022-03-310001169561us-gaap:OtherAssetsMember2022-03-310001169561cvlt:DeferredRevenueCurrentMember2022-03-310001169561cvlt:DeferredRevenueNoncurrentMember2022-03-310001169561us-gaap:ProductMember2022-03-310001169561cvlt:TrapXSecurityMember2022-01-310001169561cvlt:TrapXSecurityMember2022-01-312022-01-310001169561cvlt:TrapXSecurityMember2022-01-312022-03-310001169561cvlt:TrapXSecurityMember2021-04-012022-03-310001169561cvlt:TrapXSecurityMember2020-04-012021-03-310001169561us-gaap:DevelopedTechnologyRightsMember2022-03-310001169561us-gaap:DevelopedTechnologyRightsMember2021-03-310001169561us-gaap:DevelopedTechnologyRightsMember2020-04-012021-03-310001169561us-gaap:CustomerRelationshipsMember2021-03-310001169561us-gaap:CustomerRelationshipsMember2020-04-012021-03-310001169561us-gaap:LandMember2022-03-310001169561us-gaap:LandMember2021-03-310001169561us-gaap:BuildingMember2022-03-310001169561us-gaap:BuildingMember2021-03-310001169561us-gaap:ComputerEquipmentMember2022-03-310001169561us-gaap:ComputerEquipmentMember2021-03-310001169561us-gaap:FurnitureAndFixturesMember2022-03-310001169561us-gaap:FurnitureAndFixturesMember2021-03-310001169561us-gaap:LeaseholdImprovementsMember2022-03-310001169561us-gaap:LeaseholdImprovementsMember2021-03-310001169561us-gaap:ComputerSoftwareIntangibleAssetMember2022-03-310001169561us-gaap:ComputerSoftwareIntangibleAssetMember2021-03-310001169561us-gaap:ConstructionInProgressMember2022-03-310001169561us-gaap:ConstructionInProgressMember2021-03-310001169561us-gaap:SubsequentEventMember2022-04-210001169561cvlt:A2016IncentivePlanMember2021-10-130001169561cvlt:A2016IncentivePlanMember2021-10-132021-10-130001169561cvlt:A2016IncentivePlanMember2022-03-310001169561us-gaap:RestrictedStockUnitsRSUMember2021-03-310001169561us-gaap:RestrictedStockUnitsRSUMember2021-04-012022-03-310001169561us-gaap:RestrictedStockUnitsRSUMember2022-03-310001169561cvlt:CostOfServicesRevenueMember2021-04-012022-03-310001169561cvlt:CostOfServicesRevenueMember2020-04-012021-03-310001169561cvlt:CostOfServicesRevenueMember2019-04-012020-03-310001169561us-gaap:SellingAndMarketingExpenseMember2021-04-012022-03-310001169561us-gaap:SellingAndMarketingExpenseMember2020-04-012021-03-310001169561us-gaap:SellingAndMarketingExpenseMember2019-04-012020-03-310001169561us-gaap:ResearchAndDevelopmentExpenseMember2021-04-012022-03-310001169561us-gaap:ResearchAndDevelopmentExpenseMember2020-04-012021-03-310001169561us-gaap:ResearchAndDevelopmentExpenseMember2019-04-012020-03-310001169561us-gaap:GeneralAndAdministrativeExpenseMember2021-04-012022-03-310001169561us-gaap:GeneralAndAdministrativeExpenseMember2020-04-012021-03-310001169561us-gaap:GeneralAndAdministrativeExpenseMember2019-04-012020-03-310001169561us-gaap:RestructuringChargesMember2021-04-012022-03-310001169561us-gaap:RestructuringChargesMember2020-04-012021-03-310001169561us-gaap:RestructuringChargesMember2019-04-012020-03-310001169561cvlt:PerformanceRestrictedStockUnitsMember2021-05-012021-05-310001169561cvlt:PerformanceRestrictedStockUnitsMember2021-06-012021-06-300001169561cvlt:PerformanceRestrictedStockUnitsMember2021-04-012022-03-310001169561srt:MaximumMembercvlt:PerformanceRestrictedStockUnitsMember2021-04-012022-03-310001169561cvlt:PerformanceStockUnitsGrantedInMay2021Member2021-04-012022-03-310001169561cvlt:PerformanceStockUnitsGrantedInJune2021Member2021-04-012022-03-310001169561cvlt:PerformanceRestrictedStockUnitsMember2020-04-012021-03-310001169561us-gaap:PerformanceSharesMember2021-04-012022-03-31cvlt:tranche0001169561srt:MaximumMemberus-gaap:PerformanceSharesMember2021-04-012022-03-310001169561srt:MinimumMemberus-gaap:PerformanceSharesMember2021-04-012022-03-310001169561us-gaap:PerformanceSharesMember2020-04-012021-03-310001169561srt:MaximumMemberus-gaap:PerformanceSharesMember2020-04-012021-03-310001169561srt:MinimumMemberus-gaap:PerformanceSharesMember2020-04-012021-03-310001169561us-gaap:EmployeeStockMember2021-04-012022-03-310001169561us-gaap:EmployeeStockMember2022-03-310001169561us-gaap:EmployeeStockMember2020-04-012021-03-310001169561us-gaap:EmployeeStockMember2019-04-012020-03-310001169561cvlt:NOLExpiringBetween2036Member2022-03-310001169561cvlt:NOLsNotExpiringMember2022-03-310001169561us-gaap:ForeignCountryMember2022-03-310001169561us-gaap:DomesticCountryMemberus-gaap:ResearchMember2022-03-310001169561us-gaap:ResearchMemberus-gaap:StateAndLocalJurisdictionMember2022-03-310001169561country:US2021-04-012022-03-310001169561country:US2020-04-012021-03-310001169561country:US2019-04-012020-03-310001169561us-gaap:NonUsMember2021-04-012022-03-310001169561us-gaap:NonUsMember2020-04-012021-03-310001169561us-gaap:NonUsMember2019-04-012020-03-310001169561country:US2022-03-310001169561country:US2021-03-310001169561us-gaap:NonUsMember2022-03-310001169561us-gaap:NonUsMember2021-03-31cvlt:office0001169561us-gaap:RevolvingCreditFacilityMembercvlt:SeniorSecuredRevolvingCreditFacilityMember2021-12-132021-12-130001169561us-gaap:RevolvingCreditFacilityMembercvlt:SeniorSecuredRevolvingCreditFacilityMember2021-12-130001169561us-gaap:RevolvingCreditFacilityMemberus-gaap:SecuredOvernightFinancingRateSofrOvernightIndexSwapRateMembercvlt:SeniorSecuredRevolvingCreditFacilityMember2021-12-132021-12-130001169561us-gaap:RevolvingCreditFacilityMembercvlt:SeniorSecuredRevolvingCreditFacilityMember2022-03-310001169561us-gaap:RevolvingCreditFacilityMembercvlt:SeniorSecuredRevolvingCreditFacilityMember2021-04-012022-03-310001169561us-gaap:RevolvingCreditFacilityMembercvlt:SeniorSecuredRevolvingCreditFacilityMember2020-04-012021-03-31
UNITED STATES SECURITIES AND EXCHANGE COMMISSION
Washington, D.C. 20549
FORM 10-K
☑ ANNUAL REPORT PURSUANT TO SECTION 13 OR 15(d) OF THE SECURITIES EXCHANGE ACT OF 1934
For the fiscal year ended March 31, 2022
OR
☐ TRANSITION REPORT PURSUANT TO SECTION 13 OR 15(d) OF THE SECURITIES EXCHANGE ACT OF 1934
Commission File Number: 1-33026
Commvault Systems, Inc.
(Exact name of registrant as specified in its charter)
|
|
|
|
|
|
|
|
|
| Delaware |
|
22-3447504 |
| (State or other jurisdiction of incorporation or organization) |
|
(I.R.S. Employer Identification No.) |
1 Commvault Way
Tinton Falls, New Jersey 07724
(Address of principal executive offices, including zip code)
(732) 870-4000
(Registrant’s telephone number, including area code)
Securities registered pursuant to Section 12(b) of the Act:
|
|
|
|
|
|
|
|
|
| Title of each class |
Trading Symbol(s) |
Name of each exchange on which registered |
| Common Stock, $0.01 par value |
CVLT |
The Nasdaq Stock Market |
Securities registered pursuant to Section 12(g) of the Act: None
Indicate by check mark if the registrant is a well-known seasoned issuer, as defined in Rule 405 of the Securities Act. Yes þ No ¨
Indicate by check mark if the registrant is not required to file reports pursuant to Section 13 or Section 15(d) of the Act. Yes ¨ No þ
Indicate by check mark whether the registrant (1) has filed all reports required to be filed by Section 13 or 15(d) of the Securities Exchange Act of 1934 during the preceding 12 months (or for such shorter period that the registrant was required to file such reports), and (2) has been subject to such filing requirements for the past 90 days. Yes þ No ¨
Indicate by check mark whether the registrant has submitted electronically every Interactive Data File required to be submitted pursuant to Rule 405 of Regulation S-T (§232.405 of this chapter) during the preceding 12 months (or for such shorter period that the registrant was required to submit such files.) Yes þ No ¨
Indicate by check mark whether the registrant is a large accelerated filer, an accelerated filer, a non-accelerated filer, a smaller reporting company, or an emerging growth company. See the definitions of “large accelerated filer,” “accelerated filer,” "smaller reporting company" and “emerging growth company” in rule 12b-2 of the Exchange Act.
|
|
|
|
|
|
|
|
|
|
|
|
|
|
|
|
|
|
|
|
|
|
|
|
| Large accelerated filer |
þ |
Accelerated filer |
☐ |
Non-accelerated filer |
☐ |
Smaller reporting company |
☐ |
| Emerging growth company |
☐ |
|
|
|
|
|
|
If an emerging growth company, indicate by check mark if the registrant has elected not to use the extended transition period for complying with any new or revised financial accounting standards provided pursuant to Section 13 (a) of the Exchange Act ¨
Indicate by check mark whether the registrant has filed a report on and attestation to its management’s assessment of the effectiveness of its internal control over financial reporting under Section 404(b) of the Sarbanes-Oxley Act (15 U.S.C. 7262(b)) by the registered public accounting firm that prepared or issued its audit report. ☑
Indicate by check mark whether the registrant is a shell company (as defined in Rule 12b-2 of the Exchange Act). Yes ☐ No þ
As of September 30, 2021, the last business day of the registrant’s most recently completed second fiscal quarter; the aggregate market value of voting and non-voting common stock held by non-affiliates of the registrant (based upon the closing price of the common stock as reported by The Nasdaq Stock Market) was approximately $3.4 billion.
As of May 3, 2022, there were 44,602,631 shares of the registrant’s common stock ($0.01 par value) outstanding.
DOCUMENTS INCORPORATED BY REFERENCE
Information required by Part III (Items 10, 11, 12, 13 and 14) is incorporated by reference to portions of the registrant’s definitive Proxy Statement for its 2022 Annual Meeting of Stockholders (the “Proxy Statement”), which is expected to be filed not later than 120 days after the registrant’s fiscal year ended March 31, 2022. Except as expressly incorporated by reference, the Proxy Statement shall not be deemed to be part of this report on Form 10-K.
COMMVAULT SYSTEMS, INC.
FORM 10-K
FISCAL YEAR ENDED MARCH 31, 2022
TABLE OF CONTENTS
|
|
|
|
|
|
|
|
|
| |
|
Page |
|
PART I |
|
| Item 1. |
|
|
| Item 1A. |
|
|
| Item 1B. |
|
|
| Item 2. |
|
|
| Item 3. |
|
|
| Item 4. |
|
|
|
PART II |
|
| Item 5. |
|
|
| Item 6. |
|
|
| Item 7. |
|
|
| Item 7A. |
|
|
| Item 8. |
|
|
| Item 9. |
|
|
| Item 9A. |
|
|
| Item 9B. |
|
|
| Item 9C. |
|
|
|
PART III |
|
| Item 10. |
|
|
| Item 11. |
|
|
| Item 12. |
|
|
| Item 13. |
|
|
| Item 14. |
|
|
|
PART IV |
|
| Item 15. |
|
|
| Item 16. |
|
|
|
|
FORWARD-LOOKING STATEMENTS
The discussion throughout this Annual Report on Form 10-K contains forward-looking statements. In some cases, you can identify these statements by our use of forward-looking words such as “may,” “will,” “should,” “anticipate,” “estimate,” “expect,” “plan,” “believe,” “predict,” “potential,” “project,” “intend,” “could,” "feel" or similar expressions. In particular, statements regarding our plans, strategies, prospects and expectations regarding our business are forward-looking statements within the meaning of Section 21E of the Securities Exchange Act of 1934, as amended (the "Exchange Act"). You should be aware that these statements and any other forward-looking statements in this document reflect only our expectations and are not guarantees of performance. These statements involve risks, uncertainties and assumptions. Many of these risks, uncertainties and assumptions are beyond our control and may cause actual results and performance to differ materially from our expectations. Important factors that could cause our actual results to be materially different from our expectations include the risks and uncertainties set forth under the heading “Risk Factors.” Accordingly, you should not place undue reliance on the forward-looking statements contained in this Annual Report on Form 10-K. These forward-looking statements speak only as of the date on which the statements were made. We undertake no obligation to update or revise publicly any forward-looking statements, whether as a result of new information, future events or otherwise, except as required by law.
References in this Annual Report on Form 10-K to "Commvault," the "Company", "we," "our" or "us" refer to Commvault Systems, Inc., including as the context requires, its direct and indirect subsidiaries.
PART I
Company Overview
Incorporated in Delaware in 1996, Commvault Systems, Inc. is a global data management company offering customers enterprise level, intelligent data services via a single platform and unified code base.
We believe in solving hard problems for our customers by enabling our customers to accelerate their digital transformation in today's ever-evolving workforce. Our product portfolio includes intuitive tools and powerful machine learning technology that drives automation, reduces complexity, reigns in data fragmentation, and accelerates a customer’s cloud journey. Our product functionality share the same back-end technologies to deliver the benefits of a holistic approach to protecting, managing, and securing data. Our products address many aspects of data management, from data protection and security, to data governance, transformation and insights, while providing scalability. We believe our technology and professional services provide the broadest set of capabilities in the industry, which enables customers to efficiently and cost-effectively scale their data on premise or in the cloud.
Products
Commvault provides a portfolio of intelligent data management solutions that help organizations securely manage their data without increasing costs or complexity. We call the seamless integration of our products the ‘Power of AND’, which creates an intuitive data management experience across customer-managed enterprise software AND SaaS-delivered cloud native solutions that mitigates data sprawl, facilitates cloud adoption, and meets customers wherever they are on their journey to modernize and transform their enterprise IT environment. These offerings are organized into three categories - (1) Data Protection, (2) Data Insights and (3) Data Storage.
All of Commvault's products are managed seamlessly through a single pane of glass called the Commvault Command Center, which is our user interface for managing data protection and disaster recovery by providing configuration values and streamlined procedures for data protection and recovery tasks. Customers use the Command Center to establish their data protection environment, identify content to be protected, and initiate and monitor backups and restores. The main navigation pane provides customers with easy access to various components including downloads, forms, analytics, and monitoring. The Command Center provides a controlled foundation for self-service, helping to reduce the load on administrators and IT support staff.
Data Protection
Commvault Backup and Recovery (“CBR”) is designed to meet the needs of any size business covering workloads across all locations: hybrid environments including on-premise and multiple cloud providers; physical servers; virtual machines; applications and databases; endpoint devices; cloud applications and more. CBR provides backup, verifiable recovery and cost-optimized cloud workload mobility, helping to ensure data availability, even across multiple clouds. Our simplified backup and recovery solution allows customers to manage all workloads – cloud, virtual machines ("VMs"), containers, applications, databases and endpoints – from the Command Center while flexible copy data management allows users to multi-purpose backed-up data for DevOps, replication and more, across an entire infrastructure.
Commvault Disaster Recovery (“CDR”) provides an easy-to-use replication and disaster recovery solution from a single extensible platform, all managed through the Command Center. Commvault’s standalone disaster recovery solution is both easy to implement and cost-effective. It provides orchestration and automated compliance reporting, flexible replication, cost-optimized cloud data mobility, and verifiable recoverability via copy data management.
Commvault Complete Data Protection is a comprehensive, easy-to-use data protection solution that combines CBR with CDR. It delivers backup, replication, and disaster recovery for all workloads, on-premises, in the cloud, across multiple clouds, and in hybrid environments. It provides trusted recovery of data and applications, virtual machines, and containers, along with verifiable recoverability of replicas, cost-optimized cloud data mobility, security and resilient ransomware protection, and flexible copy data management to leverage protected data for DevOps, testing, and analytics.
Data Insights
Commvault's Data Insights portfolio is an integrated family of solutions for actionable insights, combining Commvault Data Governance, Commvault File Storage Optimization, and Commvault eDiscovery and Compliance. These solutions can operate independent of Commvault Complete Data Protection or as part of a combined solution to maximize data management capabilities for any business. This means that customers can gain insights to data that isn’t managed by Commvault to drive analytics and other tasks.
Data Backup
Hyperscale X
Commvault HyperScale X is an intuitive and easy-to-deploy, scale-out solution that is fully integrated with Commvault’s intelligent data management platform to help enterprises transition from legacy scale-up infrastructures. It provides scalability, security and resiliency to accelerate an organization’s digital transformation journey as they move to hybrid cloud, container and virtualized environments. Its flexible architecture allows customers to get up and run quickly and scale. HyperScale X technology accelerates hybrid cloud adoption with an integrated solution that delivers comprehensive data management for all workloads, including containers, VMs and databases, from a single, extensible platform. With HyperScale X, customers can leverage the entire Commvault portfolio giving them access to all the features, functions, and industry leading integration with applications, databases, public cloud environments, hypervisors, operating systems, NAS systems and primary storage arrays, wherever the data resides. It is available in two form factors giving customers the flexibility to choose an implementation based on specific needs and preferences:
•Commvault HyperScale X Appliance: A fully integrated appliance that streamlines operations and infrastructure and is ideally suited for smaller deployments with capacity requirements less than 150 terabytes that want the simplicity of an all-in-one integrated appliance from a single vendor.
•Commvault HyperScale X Architecture: Our pre-validated designs for popular server platforms provides greater flexibility and allows customer to leverage existing vendor relationships and is ideally suited for larger environments that require greater scale.
Commvault Distributed Storage
Commvault Distributed Storage provides software-defined storage built on HyperScale architecture that uses modern distributed system techniques to meet our customers primary, secondary and cloud data needs. With the capability to be deployed on any operating system, hypervisor, container or cloud, this unique platform also has the versatility to deploy in hyperscale or hyperconverged mode. Commvault Distributed Storage stores, protects and replicates data across any number of private and public cloud data centers and is integrated into our Hyperscale X technology. The advanced software stack of Commvault Distributed Storage simplifies all aspects of storage with a full set of enterprise data capabilities that can be provisioned at the application level and automated.
Metallic Cloud Storage Service
Metallic Cloud Storage Service ("MCSS") is the “easy button” to adopt secure and scalable cloud storage in minutes, right from the Commvault Command Center — delivering against an organization's hybrid cloud strategy, without the need for additional cloud expertise. It is an integrated cloud storage target that enables IT organizations to efficiently adopt cloud storage for Commvault Backup & Recovery or HyperScale X – to ease digital transformation, save costs, reduce risk and scale.
Metallic Software-as-a-Service
Metallic Software-as-a-Service (“Metallic”) delivers data protection technology with simplicity and agility, getting companies up and running to protect critical business data within minutes. Powered by Commvault’s intelligent data management platform, Metallic delivers enterprise-grade data protection on a cloud-delivered platform, with advanced built-in security controls. Application program interfaces manage functions including billing, metrics, and identity management. Current Metallic offerings include data protection for Office 365, virtual machines and Kubernetes, databases, files, Dynamics 365, Salesforce and endpoints.
Professional Services
Commvault offers a wide range of professional services to complement its product portfolio. We offer multiple levels of customer service that can be tailored to our customers’ needs.
Our customer support services consist of:
•Real-Time Support. Customers have 24/7 access to support with our support staff available by phone for first responses and to manage resolutions, and our customers have access to an online support database for help with troubleshooting and operational questions. Innovative use of web-based diagnostic tools provides problem analysis and resolution. Our solution design is also an important element in our comprehensive customer support, including “root cause” problem analysis, intelligent alerting and troubleshooting assistance. Our solutions are directly linked to our online support database allowing customers to analyze problems without engaging our technical support personnel.
•Broad Expertise. Our support engineers have extensive knowledge of complex applications, servers and networks. We proactively take ownership of the customer’s problem, regardless of whether the issue is directly related to our products or to those of another vendor. We have also developed and maintain a knowledge library of storage systems and software products to further enable our support organization to quickly and effectively resolve customer problems.
•Global Operations. We offer global customer support options from physical locations in Tinton Falls, New Jersey; Reading, United Kingdom; Sydney, Australia; and Bangalore, India which are complemented by numerous regional support centers. Our cloud-based support system creates a virtual global support center combining these locations to allow for the fastest possible resolution times for customer incidents. We have designed our support infrastructure to be able to scale with the increasing globalization of our customers.
•Enhanced Support Options. We offer several enhanced customer support services such as Enterprise Support. Our Enterprise Support service is for customers with critical support needs and builds on our 24/7 real-time support deliverables and includes various levels of enhanced services to ensure dedicated support and customized reporting. Enterprise Support adds a specialized team of technical support engineers, an assigned support account manager and innovative tools to achieve our customers’ mission.
•Technology Consulting Services. Our technology consultants ensure customers' environments are designed for optimal results and deliver over the long term by installing, configuring, personalizing and validating those environments. We also offer architecture design; implementation; personalization; data migration; and health assessment services. In addition, we offer customers staff-augmentation options to assist with rapid expert deployment of the Commvault suite.
•Business Consulting Services. Our business consultants provide insights that align to how specific businesses gather, retain and employ data. We offer disaster recovery readiness and policy implementation; private cloud services design; data classification and archive policy implementation; and operational efficiency assessment services.
•Education Services. We provide global on- and off-site training, and self-paced online alternatives for our products.
•Remote Managed Services. Commvault Remote Managed Services provides remote monitoring and management of the Commvault's solutions deployed on a customer's environment. Our engineers configure, maintain and optimize a customer's Commvault software environment remotely via a secure connection.
Customers
Our current customer base spans thousands of organizations across a variety of sizes, including large global enterprise companies, and small or mid-sized businesses and government agencies. We support customers in a range of industries, including banking, insurance and financial services, government, healthcare, pharmaceuticals and medical services, technology, legal, manufacturing, utilities and energy.
Strategic Relationships
An important element of Commvault’s strategy is to establish partnerships that support development, marketing, selling and implementation of our technology solutions. We believe that strategic and technology-based relationships with industry leaders are fundamental to our success. We have forged numerous relationships with software application, hardware and cloud vendors to enhance our combined capabilities and to create the optimal combination of data and information management applications. We believe this approach enhances our ability to expand our product offerings and customer base and to enter new markets. We have established the following types of strategic relationships:
Alliance and Technology Partners. We maintain strategic product and technology relationships with major industry leaders to ensure that our products are integrated with, supported by and add value to our partners’ portfolios. Collaboration with these market leaders allows us to provide applications that enable our customers to improve data and information management efficiency. We also maintain relationships with a broad range of industry operating system, application and infrastructure vendors to verify and demonstrate the interoperability of our portfolio with their equipment and technologies.
Distributors, Value-Added Reseller, Systems Integrator, Corporate Reseller and Original Equipment Manufacturer Relationships. Our corporate resellers bundle or sell our solutions together with their own products, and our value-added resellers resell our solutions independently.
In order to broaden our market coverage, we work closely with our global original equipment manufacturer ("OEM") partners, investing significant time and resources to deliver unique, joint solutions incorporating Commvault solutions. These partners team with our technical, engineering, marketing and sales force to enhance integration, tuning, operational management, implementation and vision for solutions that are designed to meet current and future data management needs. Our alliance managers work directly with global OEM partners to design, deliver and support field activities that make it easier for customers to locate, learn about, and purchase these differentiated solutions.
Additionally, we have a non-exclusive distribution agreement covering our North American commercial markets and our U.S. Federal Government markets with Arrow Enterprise Computing Solutions, Inc. ("Arrow"), a subsidiary of Arrow Electronics, Inc. Arrow's primary role is to enable a more efficient and effective distribution channel for our products and services by managing our reseller partners and leveraging their own industry experience. Sales generated through our distribution agreement with Arrow accounted for 37% of our total revenue in fiscal 2022 and 36% of our total revenue in fiscal 2021.
Service Provider Partners. Our solutions are the data protection platform for many service providers, which provide cloud-based solutions to customers worldwide. As companies of all sizes and markets rapidly adopt cloud infrastructures for cost efficiencies, speed and agility, we remain committed to these strategic relationships to address this growing trend. Customers looking to move IT operations to the cloud depend on service providers to migrate, manage and protect their data and cloud infrastructures. We partner with a broad ecosystem of managed service providers and cloud partners to effectively deliver data management-as-a-service solutions based on Commvault solutions across geographies, vertical markets and offerings.
Competition
The data storage management market is intensely competitive, highly fragmented and characterized by either legacy technology or rapidly changing technology and evolving standards. The principal competitive factors in our industry include product functionality, performance, integration, platform coverage, scalability, price, global sales infrastructure, technical support, branding and reputation. The ability of major system vendors to bundle solutions is also a significant competitive factor in our industry.
Our primary competitors in the data and information management software applications market, each of which has one or more products that compete with a part of or our entire product suite, are Dell-EMC, IBM, Veritas, Veeam, Rubrik, Cohesity, Druva, Avepoint and Datto.
Some of our competitors have greater financial resources and may have the ability to offer their products at lower prices than ours. In addition, some have greater name recognition, longer operating histories, substantially larger technical, sales, marketing and other global resources, and larger installed customer base with broader product offerings. As a result, these competitors can devote greater resources to the development, promotion, sale and support of their products than we can. Refer to our "Risk Factors" below.
Sales and Marketing
We sell our data management solutions to businesses of all sizes, and government agencies. We sell through our global direct sales force and partner channels.
We have a variety of marketing programs designed to create brand awareness and market recognition for our product offerings and sales lead generation. Our marketing efforts include sales campaigns, webinars, active participation at trade shows, technical conferences and seminars; advertising; content development and distribution; public relations; social media; industry analyst relations; publication of technical and educational articles in industry journals; sales training; and preparation of competitive analyses. In addition, our strategic partners augment our marketing and sales campaigns through seminars, trade shows, joint public relations and advertising campaigns. Our customers and strategic partners provide references and recommendations that we often feature in external marketing activities.
Research and Development
Our research and development organization is responsible for the design, development, testing and certification of our data management solutions. Our engineering efforts support product development across all major operating systems, databases, applications and network storage devices. A substantial amount of our development effort goes into certification, integration and support of our solutions to ensure interoperability with our strategic partners’ solutions. We have also made substantial investments in the automation of our product test and quality assurance laboratories.
Technology, Intellectual Property and Proprietary Rights
We believe our solutions are a major differentiator versus our competitors’ portfolios. Our solutions’ unique indexing, cataloging, data movement, media management and policy technologies are the source of the performance, scale, management, cost of ownership benefits and seamless interoperability inherent in all of our data management solutions. Additional options enable content search, data encryption and auditing features to support data discovery and compliance. Our success and ability to compete depend on our continued development and protection of our solutions. We rely primarily on a combination of trade secret, patent, copyright and trademark laws, as well as contractual provisions, to establish and protect our intellectual property rights.
We patent our technical infrastructure and key usability and design concepts. Our software’s unique capabilities are covered by a robust portfolio of over 1,000 patents worldwide. Areas such as data protection, security, transformation, insights, and compliance and governance, including our Metallic SaaS and HyperScale X solutions, are core to our competitive advantage. During fiscal year 2022, we were awarded over 120 patents. As of March 31, 2022, we had 968 issued patents and 381 pending patent applications in the United States, as well as 135 issued patents in foreign countries and 12 pending foreign patent applications. We also have established proprietary trademark rights in markets across the globe, and Commvault owns hundreds of U.S. and foreign trademark registrations and pending registration applications. Refer to our “Risk Factors” below.
Government Regulations
The legal environment of technology businesses, both in the United States and internationally, is evolving rapidly and is often unclear. These topics include data privacy and security, pricing, advertising, taxation, content regulation and intellectual property ownership and infringement.
We are subject to several local, state, federal and foreign laws and regulations regarding privacy and data protection. Regulators around the world have adopted or proposed limitations on, or requirements regarding, the collection, distribution, use, security and storage of personal information, payment card information or other confidential information of individuals, and the FTC and many state attorneys general are applying federal and state consumer protection laws to impose standards on the online collection, use and dissemination of data. In the event of a security breach, these laws may subject us to incident response, notice and remediation costs. Failure to safeguard data adequately or to destroy data securely could subject us to regulatory investigations or enforcement actions under applicable data security, unfair practices or consumer protection laws. The scope and interpretation of these laws could change and the associated burdens and our compliance costs could increase in the future.
We are also subject to U.S. and foreign laws and regulations that govern or restrict our business and activities in certain countries and with certain persons, including the U.S. Commerce Department’s Export Administration Regulations and economic and trade sanctions regulations maintained by OFAC, as well as anti-bribery and anti-corruption laws and regulations, including the FCPA and the U.K. Bribery Act.
People
Commvault aims to unlock potential in data, customers and our employees. To accomplish that, our employees are empowered to drive innovation and help our customers—by inspiring one another and working to make what’s already great, even greater—whether that’s product, process or team. As of March 31, 2022, we had 2,848 employees worldwide, including 1,041 in sales and marketing, 763 in research and development, 669 in customer services and support and 375 in general and administration. Approximately 45% were in the United States and 55% were located internationally.
Inclusion and Diversity
At Commvault, we believe that diversity is a business imperative at the heart of our human capital management strategy. In partnership with our leadership team, we not only drive the ability to be a best-in-class data management organization but also uphold our value in the marketplace by leading as an employer of choice. Our commitment is driven and executed by a three-pronged approach to Inclusion and Diversity ("I&D"): Workplace Inclusion, Workforce Diversity and Personal Accountability.
We continue to elevate our employee engagement efforts – which is the foundation of our approach. We have implemented an Employee Resource Group (“ERG”) operating model and have established four ERGs for cross-cultural learning, mentoring and relationship building across employees:
1.CV WIT (Women in Technology),
2.Multi-Culture,
3.LGBTQ+ & Allies, and
4.VALOR (Veterans)
In addition to our continued employee engagement initiatives, we launched a Courageous Conversations platform. Courageous Conversations was designed as a forum where difficult conversations can be broached in an open, safe and respectful manner. This platform has become the hub for all I&D related conversations, where employees and senior leaders share courageous life experiences related to bias and social injustice. Since its inception, we have hosted several powerful sessions, each virtually, reaching our workforce around the globe.
We continue to be committed to securing the very best talent, with a concerted effort to expound on and build an inclusive and diverse pipeline of candidates. We are committed to providing a clear vision to career progression while investing in the development, creativity and aspirational needs of all employees.
Safety and Well-being
Commvault values its people. We are focused on driving business globally while honoring and caring for the health and safety of our employees, customers, and partners. Since 2020, the vast majority of our employees shifted to a remote working environment and have been delivering successful and proactive results ever since. We continue to monitor the COVID-19 pandemic and are adhering to guidelines set forth by the World Health Organization and Centers for Disease Control as we begin to reopen offices. We are committed to creating an environment that supports our employees’ health and overall well-being, focusing on physical, emotional, financial, and personal wellness.
Information about our Executive Officers
The following table presents information with respect to our executive officers as of May 3, 2022:
|
|
|
|
|
|
|
|
|
|
|
|
|
|
|
| Name |
|
Age |
|
Position |
| Sanjay Mirchandani |
|
57 |
|
President and Chief Executive Officer |
| Brian Carolan |
|
51 |
|
Chief Financial Officer |
| Riccardo Di Blasio |
|
50 |
|
Chief Revenue Officer |
Sanjay Mirchandani, has served as our President and Chief Executive Officer since February 2019. Prior to joining Commvault, Mr. Mirchandani served from September 2016 to January 2019 as the Chief Executive Officer of Puppet, Inc. (“Puppet”), an Oregon-based IT automation company. Mr. Mirchandani joined Puppet in May 2016 as President and Chief Operating Officer. Mr. Mirchandani brings a wealth of international business experience through his diverse well-rounded career in technology. Before joining Puppet, from October 2013 to April 2016, Mr.
Mirchandani served as Corporate Senior Vice President and General Manager of Asia Pacific and Japan at VMware, Inc. and, from June 2006 to October 2013, Mr. Mirchandani held various senior leadership positions at EMC Corporation, including Chief Information Officer and leader of the Global Centers of Excellence. Prior to that, Mr. Mirchandani held various positions at Microsoft Corporation and Arthur Andersen LLP. Mr. Mirchandani has a Master of Business Administration degree from the University of Pittsburgh and a bachelor’s degree in mathematics from Drew University.
Brian Carolan has served as our Chief Financial Officer since October 2012. Prior to his current role, Mr. Carolan served as our Vice President, Finance and Chief Accounting Officer from July 2006 until September 2012. He also held the position of Controller from February 2001 until June 2006. Prior to joining Commvault, Mr. Carolan was with Ernst & Young LLP in its Technology, Communications and Entertainment audit practice from 1993 until January 2001. Mr. Carolan obtained his bachelor’s degree in accounting from Villanova University, his master’s degree in business administration from New York University and is a certified public accountant in the State of New Jersey.
Riccardo Di Blasio has served as our Chief Revenue Officer since May 2019. Prior to joining Commvault, Mr. Di Blasio led DXC Technology as Global Head of Sales for VMware Cloud Platform Services. Prior to that role, he was Chief Executive Officer at Globetouch, Inc., leading the company growth in the IoT and connected cars industry from January 2017 until April 2018. He also served as Chief Operating Officer at Cohesity from October 2015 until November 2016, where he significantly grew the sales and support organizations while expanding global operations and achieving double digit growth in sales. Previous to those positions, he served in various leadership roles for more than a decade across US and Europe, as Senior Vice President of Sales and Marketing at VMware and EMC Corporation.
Available Information
Our internet address is www.commvault.com. On the investor relations section of this website, we post filings as soon as reasonably practicable after they are electronically filed with or furnished to the U.S. Securities and Exchange Commission ("SEC"), including: our Annual Reports on Form 10-K, our quarterly reports on Form 10-Q, our current reports on Form 8-K, our proxy statements related to our annual stockholders’ meetings and any amendment to those reports or statements filed or furnished pursuant to Section 13(a) or 15(d) of the Securities Exchange Act of 1934, as amended. All such filings are available on the Investors Relations portion of our web site free of charge. The contents of our web site are not incorporated by reference into this Form 10-K or in any other report, statement or document we file with the SEC.
You should consider each of the following factors as well as the other information in this Annual Report in evaluating our business and our prospects. The risks and uncertainties described below are not the only ones we face. Additional risks and uncertainties not presently known to us or that we currently consider immaterial may also impair our business operations. If any of the following risks actually occur, our business and financial results could be harmed. In that case, the trading price of our common stock could decline. You should also refer to the other information set forth in this Annual Report, including our financial statements and the related notes.
Risks Related to Our Business
We have engaged, and may continue to engage, in strategic acquisitions or transactions, which could have a material adverse effect on our business, results of operations, financial condition and cash flows.
Acquisitions involve a number of risks, including diversion of management’s attention, ability to finance the acquisition on attractive terms, failure to retain key personnel or valuable customers, legal liabilities, the need to amortize acquired intangible assets, and intellectual property ownership and infringement risks, any of which could have a material adverse effect on our business, results of operations, financial condition and cash flows. Any additional future acquisitions may also result in the incurrence of indebtedness or the issuance of additional equity securities.
We could also experience financial or other setbacks if transactions encounter unanticipated problems, including problems related to execution, integration or underperformance relative to prior expectations. Acquisitions may not result in long-term benefits to us or we may not be able to further develop the acquired business in the manner we anticipated.
Following the completion of acquisitions, we may have to rely on the seller to provide administrative and other support, including financial reporting and internal controls, and other transition services to the acquired business for a period of time. There can be no assurance that the seller will do so in a manner that is acceptable to us.
Our industry is intensely competitive, and many of our competitors have greater financial, technical and sales and marketing resources and larger installed customer bases, which could enable them to compete more effectively than we do.
The data and information management software market is intensely competitive, highly fragmented and characterized by rapidly changing technology and evolving standards, changing customer requirements and frequent new product introductions. Competitors vary in size and in the scope and breadth of the products and services offered.
The principal competitive factors in our industry include product functionality and integration, platform coverage, ability to scale, price, worldwide sales infrastructure, global technical support, name recognition and reputation. If we are unable to address these factors, our competitive position could weaken and we could experience a decline in revenues that could adversely affect our business.
It is also costly and time-consuming to change data and information management systems. Most of our new customers have installed data and information management systems, which gives an incumbent competitor an advantage in retaining a customer because it already understands the network infrastructure, user demands and information technology needs of the customer, and also because some customers are reluctant to invest the time and money necessary to change vendors.
New competitors entering our markets can have a negative impact on our competitive positioning. In addition, we expect to encounter new competitors as we enter new markets. Furthermore, many of our existing competitors are broadening their operating systems platform coverage. We also expect increased competition from OEMs, including those we partner with, and from systems and network management companies, especially those that have historically focused on the mainframe computer market and have been making acquisitions and broadening their efforts to include data management and products. We expect that competition will increase as a result of future industry consolidation. Increased competition could harm our business by causing, among other things, price reductions of our products, reduced profitability and loss of market share.
We rely on indirect sales channels, such as value-added resellers, systems integrators, corporate resellers, distributors, and OEMs, for the distribution of our solutions, and the failure of these channels to effectively sell our solutions could have a material adverse effect on our revenues and results of operations.
We rely significantly on our value-added resellers, systems integrators and corporate resellers, which we collectively refer to as resellers, for the marketing and distribution of our software applications and services. Resellers are our most significant distribution channel. However, our agreements with resellers are generally not exclusive, are generally renewable annually, typically do not contain minimum sales requirements and in many cases may be terminated by either party without cause. Many of our resellers carry data management solutions that compete with ours. These resellers may give a higher priority to other software applications, including those of our competitors, or may not continue to carry data management solutions. If a number of resellers were to discontinue or reduce the sales of our products, or were to promote our competitors’ products in lieu of our own, it could have a material adverse effect on our future revenues. Events or occurrences of this nature could seriously harm our sales and results of operations. If we fail to manage our resellers successfully, there may be conflicts between resellers or they could fail to perform as we anticipate, including required compliance with the terms and obligations of our agreement, either of which could reduce our sales or impact our reputation in the market. In addition, we expect that a portion of our sales growth will depend upon our ability to identify and attract new resellers. Our competitors also use reseller arrangements and may be more successful in attracting reseller partners and could enter into exclusive relationships with resellers that make it difficult to expand our reseller network. Any failure on our part to maintain and/or expand our network of resellers could impair our ability to grow revenues in the future.
Some of our resellers may, either independently or jointly with our competitors, develop and market solutions that compete with our offerings. If this were to occur, these resellers might discontinue marketing and distributing our solutions. In addition, these resellers would have an advantage over us when marketing their competing products and related services because of their existing customer relationships. The occurrence of any of these events could have a material adverse effect on our revenues and results of operations.
In addition, we have a distribution agreement covering our North American commercial markets and our U.S. Federal Government market with Arrow. Pursuant to this distribution agreement, Arrow’s primary role is to enable a more efficient and effective distribution channel for our products and services by managing our resellers and leveraging their industry experience. Arrow accounted for approximately 37% of our total revenues for fiscal 2022 and 36% of our total revenues for fiscal 2021. If Arrow was to discontinue or reduce the sales of our solutions or if our agreement with Arrow was terminated, and if we were unable to take back the management of our reseller channel or find another North American distributor to replace Arrow, then it could have a material adverse effect on our future revenues.
Our OEMs sell and integrate our solutions which represents a material portion of our revenues. We have no control over the shipping dates or volumes of systems these OEMs sell and they have no obligation to sell systems incorporating our solutions. They also have no obligation to recommend or offer our solutions exclusively or at all. They have no minimum sales requirements and can terminate our relationship at any time. These OEMs also could choose to develop their own data management solutions. Our OEM partners compete with one another. If one of our OEM partners views our arrangement with another OEM as competing, it may decide to stop doing business with us. Any material decrease in the volume of sales generated by OEMs could have a material adverse effect on our revenues and results of operations in future periods.
If the cost for maintenance and support agreements, or our term-based subscription licenses, with our customers is not competitive in the market or if our customers do not renew their agreements either at all, or on terms that are less favorable to us, our business and financial performance might be adversely impacted.
Most of our support and maintenance agreements are for a one-year term and thereafter, we pursue renewal thereof. Historically, such renewals have represented a significant portion of our total revenue. If our customers do not renew their annual maintenance and support agreements or transition to other products or services, either at all, or on terms that are less favorable to us, our business and financial performance might be adversely impacted.
Additionally, a significant amount of our revenues are from term-based, or subscription license arrangements. The arrangements are typically one to three years in duration. If at the end of the initial term, customers elect to not renew, or they renew terms that are less favorable to us, our business and financial performance might be adversely impacted.
In periods of volatile economic conditions, our exposure to credit risk and payment delinquencies on our accounts receivable significantly increases.
Our outstanding accounts receivables are generally not secured. Our standard terms and conditions permit payment within a specified number of days following the receipt of our solution. Volatile economic conditions, including those related to the COVID-19 pandemic and its variants, or the war in Ukraine and the global response, could result in our customers and resellers facing liquidity concerns leading to them not being able to satisfy their payment obligations to us, which would have a material adverse effect on our financial condition, operating results and cash flows.
In addition, we have transitioned a more significant percentage of our revenue to subscription, or term based, arrangements. In these arrangements, our customers may pay for solutions over a period of several years. Due to the potential for extended period of collection, we may be exposed to more significant credit risk.
Actual or threatened public health crises could adversely affect our business in a material way.
As a global company, with employees and customers located around the world in a variety of industries, our performance may be impacted by public health crises, including the COVID-19 pandemic, which has caused global economic uncertainty. The emergence of a public health threat could pose the risk that our employees, partners, and clients may be prevented from conducting business activities at full capacity for an indefinite period, due to the spread of the disease or suggested or mandated by governmental authorities. Moreover, these conditions can affect the rate of information technology spending and may adversely affect our clients’ willingness to purchase our solutions, delay prospective clients’ purchasing decisions, reduce the value or duration of their contracts, cause our clients to request concessions including extended payment terms or better pricing, or affect attrition rates, all of which could adversely affect our future sales and operating results. The global spread of COVID-19 has created significant uncertainty, and economic disruption. We have undertaken measures to protect our employees, partners, and clients, including allowing our employees to work remotely; however, there can be no assurance that these measures will be sufficient or that we can implement them without adversely affecting our business operations.
We develop solutions that interoperate with certain products, operating systems and hardware developed by others, and if the developers of those operating systems and hardware do not cooperate with us or we are unable to devote the necessary resources so that our solutions interoperate with those systems, our development efforts may be delayed or foreclosed and our business and results of operations may be adversely affected.
Our solutions operate primarily on the Windows, UNIX, Linux and Novell Netware operating systems; used in conjunction with Microsoft SQL; and on hardware devices of numerous manufacturers. When new or updated versions of these operating systems, solution applications, and hardware devices are introduced, it is often necessary for us to develop updated versions of our solution applications so that they interoperate properly with these systems and devices. We may not accomplish these development efforts quickly or cost-effectively, and it is not clear what the relative growth rates of these operating systems and hardware will be.
We sell a backup appliance which integrates our solution with hardware. If we fail to accurately predict manufacturing requirements and manage our supply chain we could incur additional costs or experience manufacturing delays that could harm our business.
We generally provide forecasts of our requirements to our supply chain partners on a rolling basis. If our forecast exceeds our actual requirements, a supply chain partner may assess additional charges or we may incur costs for excess inventory they hold, each of which could negatively affect our gross margins. If our forecast is less than our actual requirements, the applicable supply chain partner may have insufficient time or components to produce or fulfill our solutions' requirements, which could delay or interrupt manufacturing of our products or fulfillment of orders for our solutions, and result in delays in shipments, customer dissatisfaction, and deferral or loss of revenue. If we fail to accurately predict our requirements, we may be unable to fulfill those orders or we may be required to record charges for excess inventory. Any of the foregoing could adversely affect our business, financial condition or results of operations.
We encounter long sales and implementation cycles, particularly for our larger customers, which could have an adverse effect on the size, timing and predictability of our revenues.
Potential or existing customers, particularly larger enterprise customers, generally commit significant resources to an evaluation of available solutions and require us to expend substantial time, effort and money educating them as to the value of our solutions. Sales often require an extensive education and marketing effort.
We could expend significant funds and resources during a sales cycle and ultimately fail to win the customer. Our sales cycle for all of our products and services is subject to significant risks and delays over which we have little or no control, including:
•our customers’ budgetary constraints;
•the timing of our customers’ budget cycles and approval processes;
•our customers’ willingness to replace their current software solutions;
•our need to educate potential customers about the uses and benefits of our solutions; and
•the timing of the expiration of our customers’ current agreements for similar solutions.
If our sales cycles lengthen unexpectedly, they could adversely affect the timing of our revenues or increase costs, which may cause fluctuations in our quarterly revenues and results of operations. Finally, if we are unsuccessful in closing sales of our solutions after spending significant funds and management resources, our operating margins and results of operations could be adversely impacted, and the price of our common stock could decline.
We depend on growth in the data management solutions market, and lack of growth or contraction in this market could have a material adverse effect on our sales and financial condition.
Demand for data management solutions is linked to growth in the amount of data generated and stored, demand for data retention and management (whether as a result of regulatory requirements or otherwise) and demand for and adoption of new backup devices and networking technologies. Because our solutions are concentrated within the data management market, if the demand for backup and data management solutions devices declines, our sales, profitability and financial condition would be materially adversely affected.
Furthermore, the data management solutions market is dynamic and evolving. Our future financial performance will depend in large part on continued growth in the number of organizations adopting data management solutions for their environments. The market for data management solutions may not continue to grow at historic rates, or at all. If this market fails to grow or grows more slowly than we currently anticipate, our sales and profitability could be adversely affected.
Our complex solutions may contain undetected errors, which could adversely affect not only their performance but also our reputation and the acceptance of our solutions in the market.
Our complex solutions may contain undetected errors or failures, especially when they are made generally available or new versions are released. Despite extensive testing by us and customers, we have discovered errors in our solutions in the past and will do so in the future. As a result of past discovered errors, we experienced delays and lost revenues while we corrected those solutions. In addition, customers in the past have brought to our attention “bugs” in our software created by the customers’ unique operating environments, which are often characterized by a wide variety of both standard and non-standard configurations that make pre-release testing very difficult and time consuming. Although we have been able to fix these bugs in the past, we may not always be able to do so. Our solutions may also be subject to intentional attacks by viruses that seek to take advantage of these bugs, errors or other weaknesses. Any of these events may result in the loss of, or delay in, market acceptance of our solutions or damage to our reputation, which would seriously harm our sales, results of operations and financial condition.
We may not receive significant revenues from our current research and development efforts for several years, if at all.
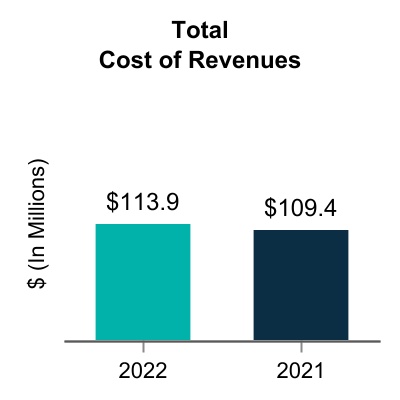
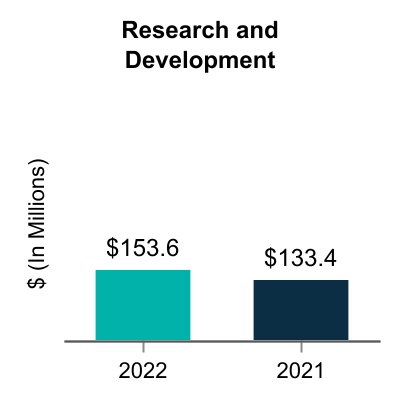
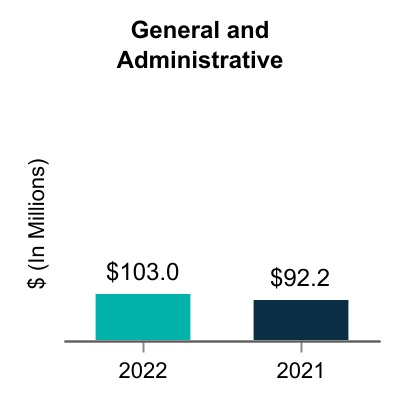
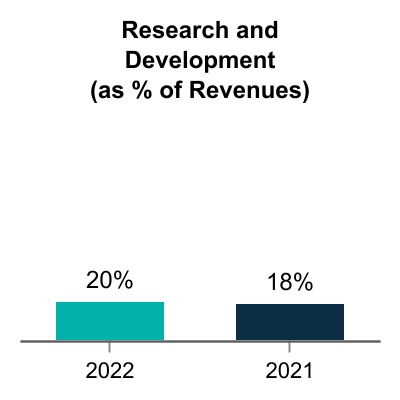
Developing software is expensive, and the investment in product development may involve a long payback cycle. Our research and development expenses were $153.6 million, or 20% of our total revenues in fiscal 2022, $133.4 million, or 18% of our total revenues in fiscal 2021 and $110.0 million, or 16% of our total revenues in fiscal 2020. We believe that we must continue to dedicate a significant amount of resources to our research and development efforts to maintain our competitive position. However, we may not recognize significant revenues from these investments for several years, if at all.
Our ability to sell our solutions is highly dependent on the quality of our customer support and professional services, and failure to offer high quality customer support and professional services would have a material adverse effect on our sales and results of operations.
Our services include the assessment and design of solutions to meet our customers’ storage management requirements and the efficient installation and deployment of our software applications based on specified business objectives. Further, once our software applications are deployed, our customers depend on us to resolve issues relating to our software applications. A high level of service is critical for the successful marketing and sale of our software. If we or our partners do not effectively install or deploy our applications, or succeed in helping our customers quickly resolve post-deployment issues, it would adversely affect our ability to sell software products to existing customers and could harm our reputation with prospective customers. As a result, our failure to maintain high quality support and professional services would have a material adverse effect on our sales of software applications and results of operations.
A portion of our revenue is generated by sales to government entities, which are subject to a number of challenges and risks.
Sales to U.S. and foreign federal, state, and local governmental agencies account for a portion of our revenue, and we may in the future increase sales to government entities. This customer base experiences budgetary constraints or shifts in spending priorities regularly which may adversely affect sales of our solutions to government entities.
Selling to government entities can be highly competitive, expensive and time consuming, often requiring significant upfront time and expense without any assurance that we will successfully sell our solutions. Government entities may require contract terms that differ from our standard terms and conditions including termination rights favorable for the customer, audit rights, and maintenance of certain security clearances for facilities and employees which can entail administrative time and effort resulting in costs and delays. Government demand for our solutions may be more volatile as they are affected by public sector budgetary cycles, funding authorizations, and the potential for funding reductions or delays, making the time to close such transactions more difficult to predict.
We are subject to several local, state, federal and foreign laws and regulations regarding privacy and data protection.
In the event of a security breach, these laws may subject us to incident response, notice and remediation costs. Failure to safeguard data adequately or to destroy data securely could subject us to regulatory investigations or enforcement actions under applicable data security, unfair practices or consumer protection laws which could have an adverse effect on our business, financial condition or operating results. The scope and interpretation of these laws could change and the associated burdens and our compliance costs could increase in the future.
Change in senior management or key personnel could cause disruption in the Company and have a material effect on our business.
We have had, and could have, changes in senior management which could be disruptive to management and operations of the Company and could have a material effect on our business, operating results and financial conditions. Turnover at the senior management level may create instability within the Company, which could impede the Company’s day-to-day operations. Such instability could impede our ability to fully implement our business plan and growth strategy, which would harm our business and prospects.
We rely on our key personnel to execute our existing business operations and identify and pursue new growth opportunities. The loss of key employees could result in significant disruptions to our business, and the integration and training of replacement personnel could be costly, time consuming, cause additional disruptions to our business and be unsuccessful.
Borrowing against our revolving credit facility could adversely affect our operations and financial results.
We have a $100 million revolving credit facility. If we were to borrow substantially against this facility the indebtedness could have adverse consequences, including:
•requiring us to devote a portion of our cash flow from operations to payments of indebtedness, which would reduce the availability of cash flow to fund working capital requirements, capital expenditures and other general purposes;
•limiting our flexibility in planning for, or reacting to, general adverse economic conditions or changes in our business and the industry in which we operate in;
•placing us at a competitive disadvantage compared to our competitors that have less debt; and
•limiting our ability to fund potential acquisitions.
Risks Related to our International Operations
Volatility in the global economy could adversely impact our continued growth, results of operations and our ability to forecast future business.
As a global company, we have become increasingly subject to the risks arising from adverse changes in domestic and global economic and political conditions. Uncertainty in the macroeconomic environment and associated global economic conditions have resulted in volatility in credit, equity, debt and foreign currency markets.
These global economic conditions can result in slower economic activity, decreased consumer confidence, reduced corporate profits and capital spending, inflation, adverse business conditions and liquidity concerns. There has also been increased volatility in foreign exchange markets. These factors make it difficult for our customers, our vendors and us to accurately forecast and plan future business activities. These factors could cause customers to slow or defer spending on our solutions, which would delay and lengthen sales cycles and negatively affect our results of operations. If such conditions deteriorate or if the pace of economic recovery is slower or more uneven, our results of operations could be adversely affected, we may not be able to sustain the growth rates we have experienced recently, and we could fail to meet the expectations of stock analysts and investors, which could cause the price of our common stock to decline.
We continue to invest in our business internationally where there may be significant risks with overseas investments and growth prospects. Increased volatility or declines in the credit, equity, debt and foreign currency markets in these regions could cause delays in or cancellations of orders. Deterioration of economic conditions in the countries in which we do business could also cause slower or impaired collections on accounts receivable.
Our international sales and operations are subject to factors that could have an adverse effect on our results of operations.
We have significant sales and services operations outside the United States and derive a substantial portion of our revenues from these operations. We also plan to continue to expand our international operations. We generated approximately 48% of our revenues from outside the United States in both fiscal 2022 and fiscal 2021. International revenue increased 8% in fiscal 2022 compared to fiscal 2021. Expansion of our international operations will require a significant amount of attention from our management and substantial financial resources and might require us to add qualified management in these markets.
In addition to facing risks similar to the risks faced by our domestic operations, our international operations are also subject to risks related to the differing legal, political, social and regulatory requirements and economic conditions of many countries, including:
•adverse effects in economic conditions in the countries in which we operate related specifically to the COVID-19 pandemic and the governmental regulations put in place as a result of the virus, and the war in Ukraine;
•difficulties in staffing and managing our international operations;
•foreign countries may impose additional withholding taxes or otherwise tax our foreign income, impose tariffs or adopt other restrictions on foreign trade or investment, including currency exchange controls;
•difficulties in coordinating the activities of our geographically dispersed and culturally diverse operations;
•general economic conditions in the countries in which we operate, including seasonal reductions in business activity in the summer months in Europe and in other periods in other countries, could have an adverse effect on our earnings from operations in those countries;
•imposition of, or unexpected adverse changes in, foreign laws or regulatory requirements may occur, including those pertaining to sanctions, export restrictions, privacy and data protection, trade and employment restrictions and intellectual property protections;
•longer payment cycles for sales in foreign countries and difficulties in collecting accounts receivable;
•competition from local suppliers;
•greater risk of a failure of our employees and partners to comply with both U.S. and foreign laws, including antitrust regulations, the U.S. Foreign Corrupt Practices Act, the U.K. Bribery Act of 2010, and any trade regulations ensuring fair trade practices;
•costs and delays associated with developing solutions in multiple languages; and
•political unrest, war or acts of terrorism.
Our business in emerging markets requires us to respond to rapid changes in market conditions in those markets. Our overall success in international markets depends, in part, upon our ability to succeed in differing legal, regulatory, economic, social and political conditions. We may not continue to succeed in developing and implementing policies and strategies that will be effective in each location where we do business. The occurrence of any of the foregoing factors may have a material adverse effect on our business and results of operations.
We may experience fluctuations in foreign currency exchange rates that could adversely impact our results of operations.
Our international sales are generally denominated in foreign currencies, and this revenue could be materially affected by currency fluctuations. Our primary exposure is to fluctuations in exchange rates for the U.S. dollar versus the Euro and, to a lesser extent, the Australian dollar, British pound sterling, Canadian dollar, Chinese yuan, Indian rupee, Korean won and Singapore dollar. Changes in currency exchange rates could adversely affect our reported revenues and could require us to reduce our prices to remain competitive in foreign markets, which could also have a material adverse effect on our results of operations. An unfavorable change in the exchange rate of foreign currencies against the U.S. dollar would result in lower revenues when translated into U.S. dollars, although operating expenditures would be lower as well.
In recent fiscal years, we have selectively hedged our exposure to changes in foreign currency exchange rates on the balance sheet. In the future, we may enter into additional foreign currency-based hedging contracts to reduce our exposure to significant fluctuations in currency exchange rates on the balance sheet, although there can be no assurances that we will do so. However, as our international operations grow, or if dramatic fluctuations in foreign currency exchange rates continue or increase or if our hedging strategies become ineffective, the effect of changes in the foreign currency exchange rates could become material to revenue, operating expenses, and income.
Risks Related to Information Technology and Security
We may be subject to IT system failures, network disruptions and breaches in data security.
IT system failures, network disruptions and breaches of data security could disrupt our operations by causing delays or cancellation of customer orders, impeding the delivery of our solutions, negatively affecting customer support or professional services, preventing the processing of transactions and reporting of financial results, and disturbing our enterprise resource planning system. IT system failures, network disruptions and breaches of data security could also result in the unintentional disclosure of customer or our information as well as damage our reputation. There can be no assurance that a system failure, network disruption or data security breach will not have a material adverse effect on our financial condition and operating results.
Bad actors regularly attempt to gain unauthorized access to our IT systems, and many such attempts are increasingly sophisticated. The perception that the COVID-19 pandemic has made companies’ IT systems more vulnerable has increased the already significant volume of such attempts. These attempts, which might be related to industrial, corporate or other espionage, criminal hackers or state-sponsored intrusions, include trying to covertly introduce malware or ransomware to our environments and impersonating authorized users.
Third-party service providers that we may rely on to back up and process our confidential information may also be subject to similar threats. Such threats could result in the misappropriation, theft, misuse, disclosure, loss or destruction of the technology, intellectual property, or the proprietary, confidential or personal information, of us or our employees, customers, licensees, suppliers or partners, as well as damage to or disruptions in our IT systems. These threats are constantly evolving, increasing the difficulty of successfully defending against them or implementing adequate preventative measures. We seek to detect and investigate all security incidents and to prevent their recurrence, but attempts to gain unauthorized access to our IT systems or other attacks may be successful, and in some cases, we might be unaware of an incident or its magnitude and effects.
Risks Related to Legal Matters
We have been, and may in the future become, involved in litigation that may have a material adverse effect on our business.
From time to time, we may become involved in various other legal proceedings relating to matters incidental to the ordinary course of our business, including intellectual property, commercial, product liability, employment, class action, whistleblower and other litigation and claims, and governmental and other regulatory investigations and proceedings. Such matters can be time-consuming, divert management’s attention and resources and cause us to incur significant expenses. Furthermore, because litigation is inherently uncertain, there can be no assurance that the results of any of these actions will not have a material adverse effect on our business, results of operations or financial condition.
Risks Related to Tax and Accounting
Our effective tax rate is difficult to project, and changes in such tax rate or adverse results of tax examinations could adversely affect our operating results.
We are a U.S.-based multinational company subject to tax in multiple U.S. and foreign tax jurisdictions. Our results of operations would be adversely affected to the extent that our geographical mix of income becomes more weighted toward jurisdictions with higher tax rates and would be favorably affected to the extent the relative geographic mix shifts to lower tax jurisdictions. Any change in our mix of earnings is dependent upon many factors and is therefore difficult to predict.
The process of determining our anticipated tax liabilities involves many calculations and estimates that are inherently complex and make the ultimate tax obligation determination uncertain. As part of the process of preparing our consolidated financial statements, we are required to estimate our income taxes in each of the jurisdictions in which we operate prior to the completion and filing of tax returns for such periods. These estimates involve complex issues, require extended periods of time to resolve, and require us to make judgments, such as anticipating the outcomes of audits with tax authorities and the positions that we will take on tax returns prior to our actually preparing the returns.
Furthermore, our overall effective income tax rate and tax expenses may be affected by various factors in our business, including changes in our entity structure, geographic mix of income and expenses, tax laws, and variations in the estimated and actual level of annual profits before income tax.
Our reported financial results may be adversely affected by changes in accounting principles generally accepted in the United States.
Generally accepted accounting principles in the United States are subject to interpretation by the Financial Accounting Standards Board, the SEC, and various bodies formed to promulgate and interpret appropriate accounting principles. A change in these principles or interpretations could have a significant effect on our reported financial results, and may even affect the reporting of transactions completed before the announcement or effectiveness of a change.
Risks Related to our Common Stock
Certain provisions of our certificate of formation and our amended and restated bylaws or Delaware law could prevent or delay a potential acquisition of control of our Company, which could decrease the trading price of our common stock.
Our certificate of formation, amended and restated bylaws and the laws in the State of Delaware contain provisions that are intended to deter coercive takeover practices and inadequate takeover bids by making such practices or bids unacceptably expensive to the prospective acquirer and to encourage prospective acquirers to negotiate with our Board of Directors rather than to attempt a hostile takeover. Delaware law also imposes restrictions on mergers and other business combinations between us and any holder of 15% or more of our outstanding common stock.
We believe that these provisions protect our shareholders from coercive or otherwise unfair takeover tactics by effectively requiring those who seek to obtain control of the Company to negotiate with our Board of Directors and by providing our Board of Directors with more time to assess any acquisition of control. However, these provisions could apply even if an acquisition of control of the Company may be considered beneficial by some shareholders and could delay or prevent an acquisition of control that our Board of Directors determines is not in the best interests of our Company and our shareholders.
Although we believe we currently have adequate internal control over financial reporting, we are required to assess our internal control over financial reporting on an annual basis, and any future adverse results from such assessment could result in a loss of investor confidence in our financial reports and have an adverse effect on our stock price.
Management has assessed that our internal control over financial reporting is effective and lacks any material weaknesses. Such assessment is made through subjective judgment of our management that may be open to interpretation. The effectiveness of our internal control in the future is subject to the risk that such internal controls may become inadequate. In the future, if we fail to timely complete this assessment, or if our independent auditors are unable to express an opinion on the effectiveness of our internal controls, there may be a loss of public confidence financial reporting, the market price of our stock could decline and we could be subject to regulatory sanctions or investigations by the Nasdaq Stock Market, the SEC or other regulatory authorities, which would require additional financial and management resources. Any failure to implement required new or improved controls, or difficulties encountered in their implementation, could harm our operating results or cause us to fail to timely meet our regulatory reporting obligations.
We may experience a decline in revenues or volatility in our quarterly operating results, which may adversely affect the market price of our common stock.
We cannot predict our future quarterly revenues or operating results with certainty because of many factors outside of our control. A significant revenue or profit decline, lowered forecasts or volatility in our operating results could cause the market price of our common stock to decline substantially. Factors that could affect our revenues and operating results include the following:
•the unpredictability of the timing and magnitude of orders for our solutions, particularly transactions greater than $100,000 in recent fiscal years, a majority of our quarterly revenues were earned and recorded near the end of each quarter;
•the possibility that our customers may cancel, defer or limit purchases as a result of reduced information technology budgets;
•the possibility that our customers may defer purchases of our solutions in anticipation of new solutions or updates from us or our competitors;
•the ability of our OEMs and resellers to meet their sales objectives;
•market acceptance of our new solutions and enhancements;
•our ability to control expenses;
•changes in our pricing, packaging and distribution terms or those of our competitors; and
•the demands on our management, sales force and customer services infrastructure as a result of the introduction of new solutions or updates.
Our expense levels are relatively fixed and are based, in part, on our expectations of future revenues. If revenue levels fall below our expectations and we are profitable at the time, our net income would decrease because only a small portion of our expenses varies with our revenues. Therefore, any significant decline in revenues for any period could have an immediate adverse impact on our results of operations for that period. We believe that period-to-period comparisons of our results of operations should not be relied upon as an indication of future performance. Our results of operations could be below expectations of public market analysts and investors in future periods which would likely cause the market price of our common stock to decline.
The price of our common stock may be highly volatile and may decline regardless of our operating performance.
The market price of our common stock could be subject to significant fluctuations in response to:
•variations in our quarterly or annual operating results;
•changes in financial estimates, treatment of our tax assets or liabilities or investment recommendations by securities analysts following our business or our competitors;
•the public’s response to our press releases, rumors, our other public announcements and our filings with the SEC;
•changes in accounting standards, policies, guidance or interpretations or principles;
•sales of common stock by our directors, officers and significant stockholders;
•announcements of technological innovations or enhanced or new products by us or our competitors;
•our failure to achieve operating results consistent with securities analysts’ projections;
•the operating and stock price performance of other companies that investors may deem comparable to us;
•broad market and industry factors; and
•other events or factors, including those resulting from war, incidents of terrorism or responses to such events.
The market prices of data management solutions companies have been extremely volatile. Stock prices of many of those companies have often fluctuated in a manner unrelated or disproportionate to their operating performance. In the past, following periods of market volatility, stockholders have often instituted securities class action litigation. Securities litigation could have a substantial cost and divert resources and the attention of management from our business.
General Risks
Our business could be materially and adversely affected as a result of natural disasters, terrorism or other catastrophic events.
Any economic failure or other material disruption caused by war or natural disasters, including fires, floods, hurricanes, earthquakes, and tornadoes; power loss or shortages; environmental disasters; telecommunications or business information systems failures or similar events could also adversely affect our ability to conduct business. If such disruptions result in cancellations of customer orders or contribute to a general decrease in economic activity or corporate spending on IT, or impair our ability to meet our customer demands, our operating results and financial condition could be materially adversely affected.
Our business may be adversely affected by the impact of the war in Ukraine and a widespread outbreak of contagious diseases, including the COVID-19 pandemic and its variants. These events may cause us or our customers to temporarily suspend operations and could adversely affect the economies and financial markets of many countries, resulting in an economic downturn that could affect demand for our solutions, our ability to collect against existing trade receivables and our operating results.
|
|
|
|
|
|
| Item 1B. |
Unresolved Staff Comments |
None.
Our principal administrative, sales, marketing, customer support and research and development facility is located at our owned corporate headquarters in Tinton Falls, New Jersey.
In addition, we have offices in the United States in California and Texas; and outside the United States in Australia, Austria, Belgium, Brazil, Canada, China, Denmark, France, Germany, Hong Kong, India, Israel, Italy, Japan, Netherlands, Poland, Russia, Saudi Arabia, Singapore, South Africa, South Korea, Spain, Sweden, Switzerland, Taiwan, United Arab Emirates, and United Kingdom.
|
|
|
|
|
|
| Item 3. |
Legal Proceedings |
From time to time, we may become involved in legal proceedings arising in the ordinary course of business. We do not believe that we are currently party to any pending legal action that could reasonably be expected to have a material adverse effect on our business or operating results.
|
|
|
|
|
|
| Item 4. |
Mine Safety Disclosures |
Not Applicable.
PART II
|
|
|
|
|
|
| Item 5. |
Market for Registrant’s Common Equity, Related Stockholder Matters and Issuer Purchases of Equity Securities |
Market for our Common Stock
Our common stock is listed and traded on The Nasdaq Global Market under the symbol “CVLT”.
Stockholders
As of May 3, 2022, there were approximately 45 holders of our common stock. The number of record holders does not represent the actual number of beneficial owners of shares of our common stock because shares are frequently held in street name by securities dealers and others for the benefit of individual owners who have the right to vote their shares.
Dividend Policy
We have never paid cash dividends on our common stock, and we intend to retain our future earnings, if any, to fund the growth of our business. We therefore do not anticipate paying any cash dividends on our common stock in the foreseeable future. Our future decisions concerning the payment of dividends on our common stock will depend upon our results of operations, financial condition and capital expenditure plans, as well as any other factors that the Board of Directors, in its sole discretion, may consider relevant.
Stock Performance Graph
The graph set forth below compares the cumulative total stockholder return on our common stock between March 31, 2017 and March 31, 2022, with the cumulative total return of (i) The Nasdaq Computer Index and (ii) The Nasdaq Composite Index, over the same period. This graph assumes the investment of $100,000 on March 31, 2017 in our common stock, The Nasdaq Composite Index and The Nasdaq Computer Index, and assumes the reinvestment of dividends, if any. The graph assumes the initial value of our common stock on March 31, 2017 was the closing sales price of $50.80 per share.
The comparisons shown in the graph below are based upon historical data. The stock price performance shown in the graph below is not necessarily indicative of, nor is it intended to forecast, the future performance of our common stock. Information used in the graph was obtained from Nasdaq, a source we believe to be reliable, but we are not responsible for any errors or omissions in such information.
The performance graph shall not be deemed “filed” for purposes of Section 18 of the Exchange Act or otherwise subject to the liabilities under that Section, and shall not be deemed to be incorporated by reference into any filing of Commvault under the Securities Act or the Exchange Act.
|
|
|
|
|
|
|
|
|
|
|
|
|
|
|
|
|
|
|
|
|
|
3/31/2017 |
3/31/2018 |
3/31/2019 |
3/31/2020 |
3/31/2021 |
3/31/2022 |
| Commvault |
100.0 |
|
112.6 |
|
127.4 |
|
79.7 |
|
127.0 |
|
130.6 |
|
| Nasdaq Composite Index |
100.0 |
|
119.5 |
|
130.7 |
|
130.3 |
|
224.1 |
|
240.5 |
|
| Nasdaq Computer Index |
100.0 |
|
126.0 |
|
140.5 |
|
157.6 |
|
276.4 |
|
332.1 |
|
Issuer Purchases of Equity Securities
During the three months ended March 31, 2022, we repurchased $39.8 million of common stock, or approximately 0.6 million shares, under our repurchase program. During the year ended March 31, 2022, we repurchased $305.2 million of common stock, or approximately 4.3 million shares, under our repurchase program.
|
|
|
|
|
|
|
|
|
|
|
|
|
|
|
|
|
|
|
|
|
|
|
|
|
|
|
| Period |
|
Total number of shares purchased |
|
Average price paid per share |
|
Total number of shares purchased as part of publicly announced programs |
|
Approximate dollar value of shares that may yet be purchased under the program |
| January 1-31, 2022 |
|
277,900 |
|
|
$ |
68.15 |
|
|
277,900 |
|
|
* |
| February 1-28, 2022 |
|
144,900 |
|
|
65.16 |
|
|
144,900 |
|
|
* |
| March 1-31, 2022 |
|
178,000 |
|
|
64.29 |
|
|
178,000 |
|
|
* |
| Three months ended March 31, 2022 |
|
600,800 |
|
|
$ |
66.29 |
|
|
600,800 |
|
|
|
*During the fourth quarter of fiscal 2022 we completed a share repurchase program that was commenced in January 2021. On April 21, 2022 the Board of Directors approved a new share repurchase program of $250.0 million. The Board's authorization has no expiration date.
|
|
|
|
|
|
| Item 7. |
Management’s Discussion and Analysis of Financial Condition and Results of Operations |
You should read the following discussion and analysis along with our consolidated financial statements and the related notes included elsewhere in this Annual Report on Form 10-K. The statements in this discussion regarding our expectations of our future performance, liquidity and capital resources, and other non-historical statements are forward-looking statements. These forward-looking statements are subject to numerous risks and uncertainties, including, but not limited to, the risks and uncertainties described under “Risk Factors” and elsewhere in this Annual Report on Form 10-K. Our actual results may differ materially from those contained in or implied by any forward-looking statements.
Overview
Incorporated in Delaware in 1996, Commvault Systems, Inc. is a global data management company offering customers enterprise level, intelligent data services via a single platform and unified code base.
We believe in solving hard problems for our customers by enabling our customers to accelerate their digital transformation in today's ever-evolving workforce. Our product portfolio includes intuitive tools and powerful machine learning technology that drives automation, reduces complexity, reigns in data fragmentation, and accelerates a customer’s cloud journey. Our product functionality share the same back-end technologies to deliver the benefits of a holistic approach to protecting, managing, and securing data. Our products address many aspects of data management from data protection and security, to data governance, transformation and insights, while providing scalability. We believe our technology and professional services provide the broadest set of capabilities in the industry, which enables customers to efficiently and cost-effectively scale their data on premise or in the cloud.
Industry
The industry in which we currently operate continues to go through accelerating changes as the result of compounding data growth and the introduction of new technologies. We are continuing to pursue an aggressive product development program in both data and information management solutions. Our data management solutions include not only traditional backup, but also new innovations in de-duplication, data movement, virtualization, snap-based backups and enterprise reporting. Our information management innovations are primarily in the areas of archiving, eDiscovery, records management, governance, operational reporting and compliance. We remain focused on both the data and information management trends in the marketplace and, in fact, a material portion of our existing research and development expenses are utilized toward the development of such new technologies discussed above. While we feel confident in our ability to meet these changing industry demands with our Commvault suite and potential future releases, the development, release and timing of any features or functionality remain at our sole discretion and our solutions or other technologies may not be widely adopted.
Given the nature of the industry in which we operate, our software applications are subject to obsolescence. We continually develop and introduce updates to our existing software applications in order to keep pace with evolving industry technologies. In addition, we must address evolving industry standards, changing customer requirements and competitive software applications that may render our existing software applications obsolete.
For each of our software applications, we provide full support for the current generally available release and one prior release. When we declare a product release obsolete, a customer notice is delivered twelve months prior to the effective date of obsolescence announcing continuation of full product support for the first six months. We provide an additional six months of extended assistance support in which we only provide existing workarounds or fixes that do not require additional development activity. We do not have existing plans to make any of our software products permanently obsolete.
Sources of Revenues
We derive a significant portion of our total revenues from sales of licenses of our software applications and related appliance products. We do not customize our software or products for a specific end-user customer. We sell our software applications and products to end-user customers both directly through our sales force and indirectly through our global network of value-added reseller partners, systems integrators, corporate resellers and original equipment manufacturers. Our software and products revenue was 46% of our total revenues for fiscal 2022, 45% in fiscal 2021 and 41% in fiscal 2020.
During fiscal 2022, we continued to focus on subscription and other recurring revenue arrangements and began generating revenue from the renewals of subscription licenses sold in prior years. Any of our licensing models (capacity, instance based, etc.) can be sold via a subscription arrangement. In these arrangements the customer has the right to use the software over a designated period of time. The capacity of the license is fixed and the customer has made an unconditional commitment to pay. Software revenue in these arrangements is generally recognized when the software is delivered. During the fiscal year ended March 31, 2022, approximately 69% of software license revenue was sold under a subscription model. Software license revenue sold under a subscription model was 59% and 41% in the fiscal years ended March 31, 2021 and 2020, respectively. We also sell to some customers, primarily managed service providers, via utility, or pay-as-you-go models. In these arrangements actual usage is regularly measured and billed. Revenue in these utility arrangements is recognized as the software is used.
In recent fiscal years, including the periods presented, we generated an average of 80% of our software and products revenue from our existing customer base and approximately 20% of our software and products revenue from new customers. In addition, our total software and products revenue in any particular period is, to a certain extent, dependent upon our ability to generate revenues from large customer software and products deals, which we refer to as larger deal transactions. Larger deal transactions (transactions greater than $0.1 million of software and product revenue) represented approximately 72% of our software and products revenue in fiscal 2022, 69% in fiscal 2021 and 65% in fiscal 2020.
Software and products revenue generated through indirect distribution channels accounted for approximately 90% of total software and products revenue in recent fiscal years. Software and products revenue generated through direct distribution channels accounted for approximately 10% of total software and products revenue in recent fiscal years. Deals initiated by our direct sales force are sometimes transacted through indirect channels based on end-user customer requirements, which are not always in our control and can cause this overall percentage split to vary from fiscal year to fiscal year. As such, there may be fluctuations in the dollars and percentage of software and products revenue generated through our direct distribution channels from time to time. We believe that the growth of our software and products revenue, derived from both our indirect channel partners and direct sales force, are key attributes to our long-term growth strategy. We intend to continue to invest in both our channel relationships and direct sales force in the future, but we continue to expect more revenue to be generated through indirect distribution channels over the long term. The failure of our indirect distribution channels or our direct sales force to effectively sell our software applications could have a material adverse effect on our revenues and results of operations.
We have a non-exclusive distribution agreement covering our North American commercial markets and our U.S. Federal Government market with Arrow Enterprise Computing Solutions, Inc. ("Arrow"), a subsidiary of Arrow Electronics, Inc. Pursuant to this distribution agreement, Arrow's primary role is to enable a more efficient and effective distribution channel for our products and services by managing our reseller partners and leveraging their own industry experience. We generated approximately 37% of our total revenues through Arrow in fiscal 2022, approximately 36% of our total revenues in fiscal 2021 and approximately 37% of our total revenues in fiscal 2020. If Arrow was to discontinue or reduce the sales of our products or if our agreement with Arrow was terminated, and if we were unable to take back the management of our reseller channel or find another North American distributor to replace Arrow, then it could have a material adverse effect on our future business.
Our services revenue was 54% of our total revenues for fiscal 2022, 55% in fiscal 2021 and 59% in fiscal 2020. Our services revenue is made up of fees from the delivery of customer support and other professional services, which are typically sold in connection with the sale of our software applications. Customer support agreements provide technical support and unspecified software updates on a when-and-if-available basis for an annual fee based on licenses purchased and the level of service subscribed. Other professional services include consulting, assessment and design services, implementation and post-deployment services and training, all of which to date have predominantly been sold in connection with the sale of software applications. Metallic, our software-as-a-service solution, allows customers to use hosted software over the contract period without taking possession of the software. Revenue related to Metallic is generally recognized ratably over the contract term as services revenue.
Most of our customer support agreements related to perpetual licenses are for a one-year term. As the end of the annual period approaches, we pursue the renewal of the agreement with the customer. Historically, maintenance renewals have represented a significant portion of our total revenue. Because of this characteristic of our business, if our customers choose not to renew their maintenance and support agreements with us on beneficial terms, or at all, our business, operating results and financial condition could be harmed.
The gross margin of our services revenue was 76% for fiscal 2022, 79% for fiscal 2021 and 78% for fiscal 2020. Overall, our services revenue has lower gross margins than our software and products revenue. The gross margin of our software and products revenue was 96% for fiscal 2022, 92% for fiscal 2021 and 90% for fiscal 2020. The increase in gross margin percentage of software and products is a result of reduced sales of hardware associated with our appliance as well as reduced software royalties associated with sales of HyperScale appliances and software. With the launch of HyperScale X in the second half of fiscal 2021, we typically sell software to a third party that sells an integrated appliance to end user customers. As a result, our hardware revenues and cost of sales have been decreasing.
Description of Costs and Expenses
Our cost of revenues is as follows:
•Cost of Software and Products Revenue, consists primarily of the cost of third-party royalties and other costs such as media, manuals, translation and distribution costs, and hardware associated with our appliances; and
•Cost of Services Revenue, consists primarily of salary and employee benefit costs in providing customer support and other professional services as well as third-party hosting fees.
Our operating expenses are as follows:
•Sales and Marketing, consists primarily of salaries, commissions, employee benefits, stock-based compensation and other direct and indirect business expenses, including travel and related expenses, sales promotion expenses, public relations expenses and costs for marketing materials and other marketing events (such as trade shows and advertising);
•Research and Development, which is primarily the expense of developing new software applications and modifying existing software applications, consists principally of salaries, stock-based compensation and benefits for research and development personnel and related expenses; contract labor expense and consulting fees as well as other expenses associated with the design, certification and testing of our software applications; and legal costs associated with the patent registration of such software applications;
•General and Administrative, consists primarily of salaries, stock-based compensation and benefits for our executive, accounting, human resources, legal, information systems and other administrative personnel. Also included in this category are other general corporate expenses, such as outside legal and accounting services, compliance costs and insurance; and
•Depreciation and Amortization, consists of depreciation expense primarily for our owned corporate campus headquarters location, computer equipment we use for information services and in our development and test labs and amortization of intangible assets.
Foreign Currency Exchange Rates’ Impact on Results of Operations
Sales outside the United States were approximately 48% of our total revenue for both fiscal 2022 and fiscal 2021 and 49% for fiscal 2020. The income statements of our non-U.S. operations are translated into U.S. dollars at the average exchange rates for each applicable month in a period. To the extent the U.S. dollar weakens against foreign currencies, the translation of these foreign currency denominated transactions generally results in increased revenue, operating expenses and income from operations for our non-U.S. operations. Similarly, our revenue, operating expenses and net income will generally decrease for our non-U.S. operations if the U.S. dollar strengthens against foreign currencies.
Using the average foreign currency exchange rates from fiscal 2021, our software and products revenue would have been lower by $0.1 million, our services revenue would have been lower by $2.5 million, our cost of sales would have been lower by $0.3 million and our operating expenses would have been lower by $1.6 million from non-U.S. operations for fiscal 2022.
In addition, we are exposed to risks of foreign currency fluctuation primarily from cash balances, accounts receivables and intercompany accounts denominated in foreign currencies and are subject to the resulting transaction gains and losses, which are recorded as a component of general and administrative expenses. Net foreign currency transaction losses in fiscal 2022 were not significant. We recognized net foreign currency transaction losses of $1.9 million in fiscal 2021 and gains of $0.4 million in fiscal 2020.
Critical Accounting Policies
In presenting our consolidated financial statements in conformity with U.S. generally accepted accounting principles, we are required to make estimates and judgments that affect the amounts reported therein. Some of the estimates and assumptions we are required to make relate to matters that are inherently uncertain as they pertain to future events. We base these estimates on historical experience and on various other assumptions that we believe to be reasonable and appropriate. Actual results may differ significantly from these estimates. The following is a description of our accounting policies that we believe require subjective and complex judgments, which could potentially have a material effect on our reported financial condition or results of operations.
Revenue Recognition
We account for revenue in accordance with ASC 606, Revenue from Contracts with Customers. Our revenue recognition policies require us to make significant judgments and estimates. In applying our revenue recognition policy, we must determine which portions of our revenue are recognized currently (generally software and products revenue) and which portions must be deferred and recognized in future periods (generally services revenue). We analyze various factors including, but not limited to, the selling price of undelivered services when sold on a stand-alone basis, our pricing policies, the credit-worthiness of our customers, and contractual terms and conditions in helping us to make such judgments about revenue recognition. Changes in judgment on any of these factors could materially impact the timing and amount of revenue recognized in a given period.
We derive revenue from two primary sources: software and products, and services. Software and products revenue includes our software and integrated appliances that combine our software with hardware. Services include customer support (software updates and technical support), consulting, assessment and design services, installation services, customer education and Commvault software-as-a-service, which is branded as Metallic.
We sell both perpetual and term-based licenses of our software. We refer to our term-based software licenses as subscription arrangements. We do not customize our software and installation services are not required. The software is delivered before related services are provided and is functional without professional services, updates and technical support. We have concluded that our software licenses (both perpetual and subscription) are functional intellectual property that is distinct as the user can benefit from the software on its own. Software revenue for both perpetual and subscription licenses is typically recognized when the software is delivered and/or made available for download as this is the point the user of the software can direct the use of, and obtain substantially all of the remaining benefits from the functional intellectual property. We do not recognize software revenue related to the renewal of subscription software licenses earlier than the beginning of the new subscription period.
Services revenue includes revenue from customer support and other professional services. Customer support includes software updates on a when-and-if-available basis, telephone support, integrated web-based support and bug fixes or patches. Commvault sells its customer support contracts as a percentage of net software purchases the support is related to. Customer support revenue is recognized ratably over the term of the customer support agreement, which is typically one year. The term of our subscription arrangements is typically three years.
Our other professional services include consulting, assessment and design services, installation services and customer education. Customer education services include courses taught by our instructors or third-party contractors. Revenue related to other professional services and customer education services is typically recognized as the services are performed.
Commvault software-as-a-service, which is branded as Metallic, allows customers to use hosted software over the contract period without taking possession of the software. Revenue related to Metallic is generally recognized ratably over the contract term as services revenue.
Most of our contracts with customers contain multiple performance obligations. For these contracts, we account for individual performance obligations separately if they are distinct. The transaction price is allocated to the separate performance obligations on a relative standalone selling price basis. Standalone selling prices of software and appliances are typically estimated using the residual approach. Standalone selling prices of services are typically estimated based on observable transactions when these services are sold on a standalone basis.
Our typical performance obligations include the following:
|
|
|
|
|
|
|
|
|
|
|
|
| Performance Obligation |
When Performance Obligation
is Typically Satisfied |
When Payment is
Typically Due |
How Standalone Selling Price is
Typically Estimated |
| Software and Products Revenue |
| Software Licenses |
Upon shipment or made available for download (point in time) |
Within 90 days of shipment except for certain subscription licenses which are paid for over time |
Residual approach |
| Customer Support Revenue |
| Software Updates |
Ratably over the course of the support contract (over time) |
At the beginning of the contract period |
Observable in renewal transactions |
| Customer Support |
Ratably over the course of the support contract (over time) |
At the beginning of the contract period |
Observable in renewal transactions |
| Other Services Revenue |
| Other Professional Services (except for education services) |
As work is performed (over time) |
Within 90 days of services being performed |
Observable in transactions without multiple performance obligations |
| Education Services |
When the class is taught (point in time) |
Within 90 days of services being performed |
Observable in transactions without multiple performance obligations |
| Software-as-a-service (Metallic) |
Ratably over the course of the contract (over time) |
Annual or monthly payments |
Observable in transactions without multiple performance obligations |
Accounting for Income Taxes
Under ASC 740, deferred income taxes arise from temporary differences between the tax basis of assets and liabilities and their reported amounts. Valuation allowances are established when, in our judgment, it is more likely than not that deferred tax assets will not be realized. In assessing the need for a valuation allowance, we weigh the available positive and negative evidence, including historical levels of pre-tax income, legislative developments, expectations and risks associated with estimates of future pre-tax income, and prudent and feasible tax planning strategies. We believe that it is more likely than not that we will not realize the benefits of our gross deferred tax assets and therefore have recorded a valuation allowance to reduce the carrying value of these gross deferred tax assets, net of the impact of the reversal of taxable temporary differences, to zero. The valuation allowance is material to our financial statements. In the future, changes to our estimates regarding the realizability of our gross deferred tax assets could materially impact our results of operations.
We conduct business globally and as a result, file income tax returns in the United States and in various state and foreign jurisdictions. In the normal course of business, we are subject to examination by taxing authorities throughout the world, including such major jurisdictions as the United States, Australia, Canada, Germany, Netherlands and United Kingdom.
Goodwill
We test goodwill for impairment at least annually, on January 1, by performing a quantitative assessment of whether the fair value of each reporting unit or asset exceeds its carrying amount. We have one reporting unit. Goodwill is tested at this reporting unit level. This requires us to assess and make judgments regarding a variety of factors which impact the fair value of the reporting unit or asset being tested, including business plans, anticipated future cash flows, economic projections and other market data. Because there are inherent uncertainties involved in these factors, significant differences between these estimates and actual results could result in future impairment charges and could materially impact our future financial results. During the fourth quarter of 2022, we completed the annual impairment test for goodwill and determined that it had not been impaired as of the test date, January 1, 2022.
Results of Operations
Fiscal year ended March 31, 2022 compared to fiscal year ended March 31, 2021
Revenues (in millions)
- Total revenues increased $46.1 million, or 6%
- Software and products revenue represented 46% of our total revenues in fiscal 2022 and 45% of our total revenues in fiscal 2021. Software and products revenue increased $29.6 million, or 9%, primarily due to the following:
•Increase of $30.0 million, or 13%, in larger deal transactions (deals greater than $0.1 million in software and products revenue);
•Increase of 19% in the number of larger deal transactions partially offset by a decrease of 4% in the average dollar amount of such transactions;
•The average dollar amount of larger deal transactions was approximately $320 thousand in fiscal 2022 and approximately $335 thousand in fiscal 2021;
•Larger deal transactions represented approximately 72% of our software and products revenue in fiscal 2022 and 69% of our software and products revenue in fiscal 2021; and
•The increase in larger deal transaction revenue was partially offset by a decrease of $0.3 million in transactions less than $0.1 million.
- Services revenue represented 54% of our total revenues in fiscal 2022 and 55% of our total revenues in fiscal 2021. Services revenue increased $16.5 million, primarily due to an increase in professional services and software-as-a-service revenue, partially offset by a decline in customer support revenue.
We track software and products revenue on a geographic basis. The geographic regions that are tracked are the Americas (United States, Canada, Latin America), EMEA (Europe, Middle East, Africa) and APJ (Australia, Japan, Southeast Asia, China). Americas, EMEA and APJ represented 59%, 30% and 11% of total software and products revenue, respectively, for the fiscal year ended March 31, 2022. The year over year increase of software and products revenue was 15% and 2% in the Americas and in EMEA, respectively, and declined 2% in APJ.
▪The increase in Americas software and products revenue was primarily due to a 15% increase from larger deal transactions. This was the result of an increase in the number of transactions compared to the prior year partially offset by a decrease in average deal size.
▪EMEA software and products revenue increased primarily as a result of a 13% increase in larger deal revenue driven by an increase in average deal size.
▪APJ revenue from deals less than $0.1 million decreased 5% compared to the prior year partially offset by a 1% increase in larger deal transactions.
Our software and products revenue in EMEA and APJ is subject to changes in foreign exchange rates as more fully discussed above in the “Foreign Currency Exchange Rates’ Impact on Results of Operations” section.
Cost of Revenues and Gross Margin ($ in millions)
- Total cost of revenues increased $4.5 million and represented 15% of our total revenues in both fiscal 2022 and fiscal 2021.
- Cost of software and products revenue decreased $13.2 million and represented 4% of software and products revenue in fiscal 2022 compared to 8% in fiscal 2021. The decrease was the result of reduced sales of hardware associated with our appliances as well as reduced software royalties associated with sales of HyperScale appliances and software. Our appliances are now typically sold by third parties that integrate our software with hardware.
- Cost of services revenue increased $17.6 million and represented 24% of our services revenue in fiscal 2022 compared to 21% in fiscal 2021. The increase in cost of services revenue related to an increase in the cost of infrastructure related to our software-as-a-service offerings, as well as an increase in employee compensation and related expenses compared to the prior year due to temporary pay cuts enacted in 2021.
Operating Expenses ($ in millions)
- Sales and marketing expenses: increased $9.7 million, or 3%, primarily due to an increase in employee compensation and sales commissions associated with increased revenue.
- Research and development expenses: increased $20.2 million, or 15%, as a result of an increase in employee compensation and related expenses attributable to the expansion of our engineering group.
•Increase in employee compensation, including an increase in stock-based compensation of $9.0 million compared to prior year.
•Investing in research and development has been a priority for Commvault, and we anticipate continued spending related to the development of our data management software applications.
- General and administrative expenses: increased $10.8 million, or 12%, primarily due to the following:
•Increase in employee compensation and related expenses compared to prior year. Stock-based compensation increased $9.3 million compared to the prior year.
•Increase in legal expenses for costs related to intellectual property matters partially offset by $7.9 million of settlement gains netted against related legal expenses.
- Restructuring: Our restructuring plan is intended to increase efficiency in our sales, marketing and distribution functions as well as reduce costs across all functional areas. Restructuring expenses were $6.2 million and $23.5 million for the years ended March 31, 2022 and 2021, respectively. These restructuring charges relate primarily to severance and related costs associated with headcount reductions. These charges include $1.7 million in fiscal 2022 and $2.7 million in fiscal 2021 of stock-based compensation related to modifications of existing awards granted to certain employees included in the restructuring. We cannot guarantee the restructuring program will achieve its intended result. Risks associated with this restructuring program also include additional unexpected costs, adverse effects on employee morale and the failure to meet operational and growth targets due to the loss of key employees, any of which may impair our ability to achieve anticipated results of operations or otherwise harm our business.
- Depreciation and amortization expense: decreased $5.0 million, from $14.6 million in fiscal 2021 to $9.7 million in fiscal 2022, driven by the elimination of amortization of intangible assets related to Hedvig due to their impairment in the second quarter of fiscal 2021.
Current year amortization of intangible assets related to TrapX is $0.2 million.
Interest Income
Interest income decreased $0.3 million, from $1.0 million in fiscal 2021 to $0.7 million in fiscal 2022 primarily as a result of declines in market interest rates and the amount of invested funds.
Interest Expense
Interest expense increased $0.1 million as a result of entering into a revolving credit facility in fiscal 2022.
Income Tax Expense
Income tax expense was $9.8 million in fiscal 2022 compared to expense of $9.7 million in fiscal 2021. The income tax expense for the year ended March 31, 2022 relates primarily to current foreign taxes.
Liquidity and Capital Resources
As of March 31, 2022, our cash balance was $267.5 million. In recent fiscal years, our principal source of liquidity has been cash provided by operations. The amount of cash and cash equivalents held outside of the United States by our foreign legal entities was approximately $184.0 million. These balances are dispersed across many international locations around the world. We believe that such dispersion meets the current and anticipated future liquidity needs of our foreign legal entities. If we need to repatriate funds from outside of the United States, such repatriation would likely be subject to restrictions by local laws and/or tax consequences including foreign withholding taxes.
On December 13, 2021, we entered into a five-year $100 million senior secured revolving credit facility (the “Credit Facility”) with J.P. Morgan. The Credit Facility is available for share repurchases, general corporate purposes, and letters of credit. The Credit Facility contains financial maintenance covenants including a leverage ratio and interest coverage ratio. The Credit Facility also contains certain customary events of default which would permit the lender to, among other things, declare all loans then outstanding to be immediately due and payable if such default is not cured within applicable grace periods. The Credit Facility also limits our ability to incur certain additional indebtedness, create or permit liens on assets, make acquisitions, make investments, loans or advances, sell or transfer assets, pay dividends or distributions, and engage in certain transactions with foreign affiliates. Outstanding borrowings under the Credit Facility accrue interest at an annual rate equal to Secured Overnight Financing Rate plus 1.25% subject to increases based on our actual leverage. The unused balance on the Credit Facility is also subject to a 0.25% annual interest charge subject to increases based on our actual leverage. As of March 31, 2022, there were no borrowings under the Credit Facility and we were in compliance with all covenants.
During the year ended March 31, 2022, we repurchased $305.2 million of common stock, or approximately 4.3 million shares, under our share repurchase program. This program commenced in January of 2021 and was completed on March 31, 2022. On April 21, 2022 the Board of Directors approved a new share repurchase program of $250.0 million. The Board's authorization has no expiration date. Our stock repurchase program has been funded by our existing cash and cash equivalent balances as well as cash flows provided by our operations.
The following chart summarizes the cash used to repurchase shares of our common stock:
A summary of the cash used for the stock repurchase program consists of the following:
|
|
|
|
|
|
|
|
|
|
|
|
|
|
|
|
|
|
|
|
|
|
|
|
|
|
|
|
|
|
|
|
|
| |
|
Year Ended March 31, |
| |
|
2022 |
|
2021 |
|
2020 |
|
2019 |
|
2018 |
| Cash used for repurchases (in thousands) |
|
$ |
305,239 |
|
|
$ |
95,259 |
|
|
$ |
77,198 |
|
|
$ |
132,697 |
|
|
$ |
112,218 |
|
| Shares repurchased (in thousands) |
|
4,307 |
|
|
1,643 |
|
|
1,701 |
|
|
2,115 |
|
|
2,098 |
|
| Average price per share |
|
$ |
70.87 |
|
|
$ |
57.97 |
|
|
$ |
45.37 |
|
|
$ |
62.74 |
|
|
$ |
53.49 |
|
Our summarized annual cash flow information is as follows (in thousands):
|
|
|
|
|
|
|
|
|
|
|
|
|
|
|
|
|
|
|
|
|
| |
|
Year Ended March 31, |
| |
|
2022 |
|
2021 |
|
2020 |
| Net cash provided by operating activities |
|
$ |
177,180 |
|
|
$ |
123,955 |
|
|
$ |
88,464 |
|
| Net cash provided by (used in) investing activities |
|
(24,444) |
|
|
35,469 |
|
|
(74,005) |
|
| Net cash used in financing activities |
|
(276,088) |
|
|
(74,738) |
|
|
(39,403) |
|
| Effects of exchange rate — changes in cash |
|
(6,378) |
|
|
16,469 |
|
|
(6,966) |
|
| Net increase (decrease) in cash and cash equivalents |
|
$ |
(129,730) |
|
|
$ |
101,155 |
|
|
$ |
(31,910) |
|
- Net cash provided by operating activities was impacted by:
•Fiscal 2022: net income adjusted for the impact of non-cash charges, increases in deferred revenue and accrued expenses, partially offset by increases in accounts receivable and deferred commissions.
•Fiscal 2021: net loss adjusted for the impact of non-cash charges, including the impairment of intangible assets, and increases in deferred revenue and accrued expenses, partially offset by increases in accounts receivable and deferred commissions.
•Fiscal 2020: net loss adjusted for the impact of non-cash charges and decreases in accounts receivable.
- Net cash provided by or used in investing activities was impacted by:
•Fiscal 2022: $16.9 million used for the acquisition of TrapX, $3.9 million of capital expenditures and $4.1 million for the purchase of equity securities partially offset by proceeds of $0.5 million related to the sale of an equity investment.
•Fiscal 2021: $43.6 million of proceeds of short-term investments of U.S. Treasury bills, partially offset by $8.1 million of capital expenditures.
•Fiscal 2020: $157.5 million used for the acquisition of Hedvig and $3.2 million of capital expenditures, partially offset by $86.7 million of net proceeds of short-term investments of U.S. Treasury Bills.
- Net cash used in financing activities was impacted by:
•Fiscal 2022: $305.2 million used to repurchase shares of our common stock under our repurchase program, $0.6 million of debt issuance costs paid partially offset by $29.7 million of proceeds from the exercise of stock options and the employee stock purchase plan.
•Fiscal 2021: $95.3 million used to repurchase shares of our common stock under our repurchase program, partially offset by $20.5 million of proceeds from the exercise of stock options and the employee stock purchase plan.
•Fiscal 2020: $77.2 million used to repurchase shares of our common stock under our repurchase program, partially offset by $37.8 million of proceeds from the exercise of stock options and the employee stock purchase plan.
Working capital decreased $144.4 million from $234.4 million as of March 31, 2021 to $90.0 million as of March 31, 2022. The decrease in working capital is primarily due to cash used for share repurchases during the fiscal year.
We believe that our existing cash, cash equivalents and our cash from operations will be sufficient to meet our anticipated cash needs for working capital, capital expenditures and potential stock repurchases for at least the next 12 months. We may seek additional funding through public or private financings or other arrangements during this period. Adequate funds may not be available when needed or may not be available on terms favorable to us, or at all. If additional funds are raised by issuing equity securities, dilution to existing stockholders will result. If we raise additional funds by obtaining loans from third parties, the terms of those financing arrangements may include negative covenants or other restrictions on our business that could impair our operational flexibility, and would also require us to fund additional interest expense. If funding is insufficient at any time in the future, we may be unable to develop or enhance our products or services, take advantage of business opportunities or respond to competitive pressures, any of which could have a material adverse effect on our business, financial condition and results of operations.
Summary Disclosures about Contractual Obligations and Commercial Commitments
Our material capital commitments consist of obligations under facilities and operating leases. Some of these leases have free or escalating rent payment provisions. Refer to Notes 2 and 15 of the notes to the consolidated financial statements for further discussion on operating leases.
We have certain software royalty commitments associated with the shipment and licensing of certain products. Royalty expense is generally based on a fixed cost per unit shipped or a fixed fee for unlimited units shipped over a designated period. Royalty expense, included in cost of software and products revenues, was $11.2 million in fiscal 2022 and $16.3 million in fiscal 2021.
We offer a 90-day limited product warranty for our software. To date, costs relating to this product warranty have not been material.
Off-Balance Sheet Arrangements
As of March 31, 2022, we did not have off-balance sheet financing arrangements, including any relationships with unconsolidated entities or financial partnerships, such as entities often referred to as structured finance or special purpose entities.
Indemnifications
Certain of our software licensing agreements contain certain provisions that indemnify our customers from any claim, suit or proceeding arising from alleged or actual intellectual property infringement. These provisions continue in perpetuity along with our software licensing agreements. We have never incurred a liability relating to one of these indemnification provisions in the past and we believe that the likelihood of any future payout relating to these provisions is remote. Therefore, we have not recorded a liability during any period related to these indemnification provisions.
Impact of Recently Issued Accounting Standards
See Note 2 of the notes to the consolidated financial statements for a discussion of the impact of recently issued accounting standards.
|
|
|
|
|
|
| Item 7A. |
Quantitative and Qualitative Disclosures about Market Risk |
Interest Rate Risk
None.
Foreign Currency Risk
Economic Exposure
As a global company, we face exposure to adverse movements in foreign currency exchange rates. Our international sales are generally denominated in foreign currencies and this revenue could be materially affected by currency fluctuations. Approximately 48% of our sales were outside the United States in both fiscal 2022 and fiscal 2021. Our primary exposures are to fluctuations in exchange rates for the U.S. dollar versus the Euro, and to a lesser extent, the Australian dollar, British pound sterling, Canadian dollar, Chinese yuan, Indian rupee, Korean won and Singapore dollar. Changes in currency exchange rates could adversely affect our reported revenues and require us to reduce our prices to remain competitive in foreign markets, which could also have a material adverse effect on our results of operations. Historically, we have periodically reviewed and revised the pricing of our products available to our customers in foreign countries and we have not maintained excess cash balances in foreign accounts.
We estimate that a 10% change in all foreign exchange rates would impact our reported operating profit by approximately $11.8 million annually. This sensitivity analysis disregards the possibilities that rates can move in opposite directions and that losses from one geographic area may be offset by gains from another geographic area.
Transaction Exposure
Our exposure to foreign currency transaction gains and losses is primarily the result of certain net receivables due from our foreign subsidiaries and customers being denominated in currencies other than the functional currency of the subsidiary. Our foreign subsidiaries conduct their businesses in local currency and we generally do not maintain excess U.S. dollar cash balances in foreign accounts.
Foreign currency transaction gains and losses are recorded in General and administrative expenses in the Consolidated Statements of Operation. Net foreign currency transaction activity in fiscal 2022 was not significant. We recognized net foreign currency transaction losses of $1.9 million and gains of $0.4 million in fiscal 2021 and fiscal 2020, respectively.
|
|
|
|
|
|
| Item 8. |
Financial Statements and Supplementary Data |
Commvault Systems, Inc.
Consolidated Financial Statements
Fiscal Years Ended March 31, 2022, 2021 and 2020
Index to Consolidated Financial Statements
Report of Independent Registered Public Accounting Firm
To the Board of Directors and Stockholders of Commvault Systems, Inc.
Opinion on the Financial Statements
We have audited the accompanying consolidated balance sheets of Commvault Systems, Inc. (the Company) as of March 31, 2022 and 2021, the related consolidated statements of operations, comprehensive income (loss), stockholders' equity and cash flows for each of the three years in the period ended March 31, 2022, and the related notes (collectively referred to as the “consolidated financial statements”). In our opinion, the consolidated financial statements present fairly, in all material respects, the financial position of the Company at March 31, 2022 and 2021, and the results of its operations and its cash flows for each of the three years in the period ended March 31, 2022, in conformity with U.S. generally accepted accounting principles.
We also have audited, in accordance with the standards of the Public Company Accounting Oversight Board (United States) (PCAOB), the Company’s internal control over financial reporting as of March 31, 2022, based on criteria established in Internal Control-Integrated Framework issued by the Committee of Sponsoring Organizations of the Treadway Commission (2013 framework) and our report dated May 6, 2022 expressed an unqualified opinion thereon.
Basis for Opinion
These financial statements are the responsibility of the Company’s management. Our responsibility is to express an opinion on the Company’s financial statements based on our audits. We are a public accounting firm registered with the PCAOB and are required to be independent with respect to the Company in accordance with the U.S. federal securities laws and the applicable rules and regulations of the Securities and Exchange Commission and the PCAOB.
We conducted our audits in accordance with the standards of the PCAOB. Those standards require that we plan and perform the audit to obtain reasonable assurance about whether the financial statements are free of material misstatement, whether due to error or fraud. Our audits included performing procedures to assess the risks of material misstatement of the financial statements, whether due to error or fraud, and performing procedures that respond to those risks. Such procedures included examining, on a test basis, evidence regarding the amounts and disclosures in the financial statements. Our audits also included evaluating the accounting principles used and significant estimates made by management, as well as evaluating the overall presentation of the financial statements. We believe that our audits provide a reasonable basis for our opinion.
Critical Audit Matter
The critical audit matter communicated below is a matter arising from the current period audit of the financial statements that was communicated or required to be communicated to the audit committee and that: (1) relates to accounts or disclosures that are material to the financial statements and (2) involved our especially challenging, subjective or complex judgments. The communication of the critical audit matter does not alter in any way our opinion on the consolidated financial statements, taken as a whole, and we are not, by communicating the critical audit matter below, providing a separate opinion on the critical audit matter or on the account or disclosure to which it relates.
|
|
|
|
|
|
|
|
|
|
|
Accounting for Revenue Recognition |
Description of the Matter
|
|
As described in Note 3 to the consolidated financial statements, the Company derives revenues from two primary sources: software and services. Most of the Company’s contracts with customers contain multiple performance obligations which are accounted for separately if they are distinct. The transaction price is allocated to separate performance obligations on a relative standalone selling price basis.
Auditing the identification of performance obligations in a software contract requires significant judgment as it relates to the evaluation of the contractual terms of the arrangement.
|
How We Addressed the Matter in Our Audit
|
|
We obtained an understanding, evaluated the design and tested the operating effectiveness of controls over the Company’s revenue recognition process, including the evaluation of the contractual terms of the revenue arrangements.
To test the amount of revenue recognized, we performed audit procedures that included, among others, testing a sample of revenue transactions during the year and evaluating the identification of performance obligations based on analysis of the contractual terms and independent confirmations of the terms and conditions of the contract directly with customers.
|
|
|
|
We have served as the Company’s auditor since 1998.
/s/ Ernst & Young LLP
Iselin, New Jersey
May 6, 2022
Commvault Systems, Inc.
Consolidated Balance Sheets
(In thousands, except per share data)
|
|
|
|
|
|
|
|
|
|
|
|
|
|
|
| |
|
March 31, |
| |
|
2022 |
|
2021 |
| ASSETS |
| Current assets: |
|
|
|
|
| Cash and cash equivalents |
|
$ |
267,507 |
|
|
$ |
397,237 |
|
|
|
|
|
|
|
|
|
|
|
| Trade accounts receivable, net |
|
194,238 |
|
|
188,126 |
|
| Other current assets |
|
22,336 |
|
|
22,237 |
|
| Total current assets |
|
484,081 |
|
|
607,600 |
|
| Property and equipment, net |
|
106,513 |
|
|
112,779 |
|
| Operating lease assets |
|
14,921 |
|
|
20,778 |
|
| Deferred commissions cost |
|
52,974 |
|
|
38,444 |
|
| Intangible assets, net |
|
3,542 |
|
|
— |
|
| Goodwill |
|
127,780 |
|
|
112,435 |
|
| Other assets |
|
26,269 |
|
|
12,137 |
|
| Total assets |
|
$ |
816,080 |
|
|
$ |
904,173 |
|
|
|
|
|
|
| LIABILITIES AND STOCKHOLDERS’ EQUITY |
| Current liabilities: |
|
|
|
|
| Accounts payable |
|
$ |
432 |
|
|
$ |
374 |
|
| Accrued liabilities |
|
121,837 |
|
|
112,148 |
|
| Current portion of operating lease liabilities |
|
4,778 |
|
|
7,469 |
|
| Deferred revenue |
|
267,017 |
|
|
253,211 |
|
| Total current liabilities |
|
394,064 |
|
|
373,202 |
|
| Deferred revenue, less current portion |
|
150,180 |
|
|
119,231 |
|
| Deferred tax liabilities, net |
|
808 |
|
|
761 |
|
| Long-term operating lease liabilities |
|
11,270 |
|
|
15,419 |
|
| Other liabilities |
|
3,929 |
|
|
1,526 |
|
| Commitments and contingencies (Note 8) |
|
|
|
|
| Stockholders’ equity: |
|
|
|
|
Preferred stock, $0.01 par value: 50,000 shares authorized, no shares issued and outstanding |
|
— |
|
|
— |
|
Common stock, $0.01 par value, 250,000 shares authorized, 44,511 shares and 46,482 shares issued and outstanding at March 31, 2022 and 2021, respectively |
|
443 |
|
|
463 |
|
| Additional paid-in capital |
|
1,165,948 |
|
|
1,069,695 |
|
| Accumulated deficit |
|
(898,699) |
|
|
(665,774) |
|
| Accumulated other comprehensive loss |
|
(11,863) |
|
|
(10,350) |
|
| Total stockholders’ equity |
|
255,829 |
|
|
394,034 |
|
| Total liabilities and stockholders’ equity |
|
$ |
816,080 |
|
|
$ |
904,173 |
|
|
|
|
|
|
See accompanying notes to consolidated financial statements
Commvault Systems, Inc.
Consolidated Statements of Operations
(In thousands, except per share data)
|
|
|
|
|
|
|
|
|
|
|
|
|
|
|
|
|
|
|
|
|
| |
|
Year Ended March 31, |
| |
|
2022 |
|
2021 |
|
2020 |
| Revenues: |
|
|
|
|
|
|
| Software and products |
|
$ |
356,487 |
|
|
$ |
326,843 |
|
|
$ |
275,308 |
|
| Services |
|
413,104 |
|
|
396,629 |
|
|
395,577 |
|
| Total revenues |
|
769,591 |
|
|
723,472 |
|
|
670,885 |
|
| Cost of revenues: |
|
|
|
|
|
|
| Software and products |
|
14,057 |
|
|
27,218 |
|
|
28,082 |
|
| Services |
|
99,802 |
|
|
82,155 |
|
|
88,996 |
|
| Total cost of revenues |
|
113,859 |
|
|
109,373 |
|
|
117,078 |
|
| Gross margin |
|
655,732 |
|
|
614,099 |
|
|
553,807 |
|
| Operating expenses: |
|
|
|
|
|
|
| Sales and marketing |
|
341,644 |
|
|
331,948 |
|
|
335,785 |
|
| Research and development |
|
153,615 |
|
|
133,401 |
|
|
110,020 |
|
| General and administrative |
|
103,049 |
|
|
92,214 |
|
|
92,130 |
|
| Restructuring |
|
6,192 |
|
|
23,471 |
|
|
21,348 |
|
| Depreciation and amortization |
|
9,666 |
|
|
14,628 |
|
|
15,815 |
|
| Impairment of intangible assets |
|
— |
|
|
40,700 |
|
|
— |
|
| Net change in contingent consideration |
|
— |
|
|
— |
|
|
(3,783) |
|
| Total operating expenses |
|
614,166 |
|
|
636,362 |
|
|
571,315 |
|
| Income (loss) from operations |
|
41,566 |
|
|
(22,263) |
|
|
(17,508) |
|
| Interest income |
|
656 |
|
|
1,028 |
|
|
4,962 |
|
| Interest expense |
|
(109) |
|
|
— |
|
|
— |
|
| Other income, net |
|
1,301 |
|
|
— |
|
|
— |
|
| Income (loss) before income taxes |
|
43,414 |
|
|
(21,235) |
|
|
(12,546) |
|
| Income tax expense (benefit) |
|
9,790 |
|
|
9,719 |
|
|
(6,901) |
|
| Net income (loss) |
|
$ |
33,624 |
|
|
$ |
(30,954) |
|
|
$ |
(5,645) |
|
| Net income (loss) per common share: |
|
|
|
|
|
|
| Basic |
|
$ |
0.74 |
|
|
$ |
(0.66) |
|
|
$ |
(0.12) |
|
| Diluted |
|
$ |
0.71 |
|
|
$ |
(0.66) |
|
|
$ |
(0.12) |
|
| Weighted average common shares outstanding: |
|
|
|
|
|
|
| Basic |
|
45,443 |
|
|
46,652 |
|
|
45,793 |
|
| Diluted |
|
47,220 |
|
|
46,652 |
|
|
45,793 |
|
See accompanying notes to consolidated financial statements
Commvault Systems, Inc.
Consolidated Statements of Comprehensive Income (Loss)
(In thousands)
|
|
|
|
|
|
|
|
|
|
|
|
|
|
|
|
|
|
|
|
|
| |
|
Year Ended March 31, |
| |
|
2022 |
|
2021 |
|
2020 |
| Net income (loss) |
|
$ |
33,624 |
|
|
$ |
(30,954) |
|
|
$ |
(5,645) |
|
| Other comprehensive income (loss): |
|
|
|
|
|
|
| Foreign currency translation adjustment |
|
(1,513) |
|
|
3,073 |
|
|
(1,855) |
|
| Comprehensive income (loss) |
|
$ |
32,111 |
|
|
$ |
(27,881) |
|
|
(7,500) |
|
See accompanying notes to consolidated financial statements
Commvault Systems, Inc.
Consolidated Statements of Stockholders’ Equity
(In thousands)
|
|
|
|
|
|
|
|
|
|
|
|
|
|
|
|
|
|
|
|
|
|
|
|
|
|
|
|
|
|
|
|
|
|
|
|
|
|
|
| |
|
Common Stock |
|
Additional
Paid-In
Capital |
|
Accumulated
Deficit |
|
Accumulated
Other
Comprehensive
Loss |
|
Total |
| |
|
Shares |
|
Amount |
|
| Balance at March 31, 2019 |
|
45,582 |
|
|
$ |
454 |
|
|
$ |
887,907 |
|
|
$ |
(485,490) |
|
|
$ |
(11,568) |
|
|
$ |
391,303 |
|
| Stock-based compensation |
|
|
|
|
|
65,888 |
|
|
|
|
|
|
65,888 |
|
| Share issuances related to business combinations |
|
|
|
|
|
1,616 |
|
|
|
|
|
|
1,616 |
|
| Share issuance related to stock-based compensation |
|
2,131 |
|
|
21 |
|
|
37,774 |
|
|
|
|
|
|
37,795 |
|
| Repurchase of common stock |
|
(1,702) |
|
|
(17) |
|
|
(14,526) |
|
|
(62,655) |
|
|
|
|
(77,198) |
|
| Net loss |
|
|
|
|
|
|
|
(5,645) |
|
|
|
|
(5,645) |
|
| Other comprehensive loss |
|
|
|
|
|
|
|
|
|
(1,855) |
|
|
(1,855) |
|
| Balance at March 31, 2020 |
|
46,011 |
|
|
458 |
|
|
978,659 |
|
|
(553,790) |
|
|
(13,423) |
|
|
411,904 |
|
| Cumulative effect of adoption of ASU 2016-13 |
|
|
|
|
|
|
|
(84) |
|
|
|
|
(84) |
|
| Stock-based compensation |
|
|
|
|
|
84,833 |
|
|
|
|
|
|
84,833 |
|
| Share issuance related to stock-based compensation |
|
2,115 |
|
|
21 |
|
|
20,500 |
|
|
|
|
|
|
20,521 |
|
| Repurchase of common stock |
|
(1,644) |
|
|
(16) |
|
|
(14,297) |
|
|
(80,946) |
|
|
|
|
(95,259) |
|
| Net loss |
|
|
|
|
|
|
|
(30,954) |
|
|
|
|
(30,954) |
|
| Other comprehensive income |
|
|
|
|
|
|
|
|
|
3,073 |
|
|
3,073 |
|
| Balance at March 31, 2021 |
|
46,482 |
|
|
463 |
|
|
1,069,695 |
|
|
(665,774) |
|
|
(10,350) |
|
|
394,034 |
|
| Stock-based compensation |
|
|
|
|
|
105,163 |
|
|
|
|
|
|
105,163 |
|
| Share issuance related to stock-based compensation |
|
2,336 |
|
|
23 |
|
|
29,737 |
|
|
|
|
|
|
29,760 |
|
| Repurchase of common stock |
|
(4,307) |
|
|
(43) |
|
|
(38,647) |
|
|
(266,549) |
|
|
|
|
(305,239) |
|
| Net income |
|
|
|
|
|
|
|
33,624 |
|
|
|
|
33,624 |
|
| Other comprehensive loss |
|
|
|
|
|
|
|
|
|
(1,513) |
|
|
(1,513) |
|
| Balance at March 31, 2022 |
|
44,511 |
|
|
$ |
443 |
|
|
$ |
1,165,948 |
|
|
$ |
(898,699) |
|
|
$ |
(11,863) |
|
|
$ |
255,829 |
|
See accompanying notes to consolidated financial statements
Commvault Systems, Inc.
Consolidated Statements of Cash Flows
(In thousands)
|
|
|
|
|
|
|
|
|
|
|
|
|
|
|
|
|
|
|
|
|
| |
|
Year Ended March 31, |
| |
|
2022 |
|
2021 |
|
2020 |
| Cash flows from operating activities |
|
|
|
|
|
|
| Net income (loss) |
|
$ |
33,624 |
|
|
$ |
(30,954) |
|
|
$ |
(5,645) |
|
| Adjustments to reconcile net income (loss) to net cash provided by operating activities: |
|
|
|
|
|
|
| Depreciation and amortization |
|
10,950 |
|
|
15,878 |
|
|
17,065 |
|
| Noncash stock-based compensation |
|
105,163 |
|
|
84,833 |
|
|
65,888 |
|
| Noncash change in fair value of equity securities |
|
(301) |
|
|
— |
|
|
— |
|
| Noncash change in contingent consideration |
|
— |
|
|
— |
|
|
(3,783) |
|
| Impairment of intangible assets |
|
— |
|
|
40,700 |
|
|
— |
|
|
|
|
|
|
|
|
| Deferred income taxes |
|
49 |
|
|
(92) |
|
|
(1,783) |
|
|
|
|
|
|
|
|
| Amortization of deferred commissions cost |
|
18,339 |
|
|
18,318 |
|
|
17,717 |
|
| Impairment of operating lease assets |
|
— |
|
|
1,684 |
|
|
2,761 |
|
| Changes in operating assets and liabilities: |
|
|
|
|
|
|
| Trade accounts receivable |
|
(20,371) |
|
|
(34,622) |
|
|
26,096 |
|
| Operating lease assets and liabilities, net |
|
(925) |
|
|
(1,157) |
|
|
(1,226) |
|
| Other current assets and Other assets |
|
3,732 |
|
|
11,887 |
|
|
(1,246) |
|
| Deferred commissions cost |
|
(33,512) |
|
|
(24,095) |
|
|
(16,063) |
|
| Accounts payable |
|
60 |
|
|
49 |
|
|
(2,474) |
|
| Accrued liabilities |
|
10,400 |
|
|
10,660 |
|
|
(1,997) |
|
| Deferred revenue |
|
48,295 |
|
|
31,740 |
|
|
(6,230) |
|
| Other liabilities |
|
1,677 |
|
|
(874) |
|
|
(616) |
|
| Net cash provided by operating activities |
|
177,180 |
|
|
123,955 |
|
|
88,464 |
|
| Cash flows from investing activities |
|
|
|
|
|
|
| Purchase of short-term investments |
|
— |
|
|
— |
|
|
(43,645) |
|
| Proceeds from maturity of short-term investments |
|
— |
|
|
43,645 |
|
|
130,338 |
|
| Purchase of property and equipment |
|
(3,911) |
|
|
(8,176) |
|
|
(3,203) |
|
| Purchase of equity securities |
|
(4,139) |
|
|
— |
|
|
— |
|
| Business combination, net of cash acquired |
|
(16,894) |
|
|
— |
|
|
(157,495) |
|
| Other |
|
500 |
|
|
— |
|
|
— |
|
| Net cash provided by (used in) investing activities |
|
(24,444) |
|
|
35,469 |
|
|
(74,005) |
|
| Cash flows from financing activities |
|
|
|
|
|
|
| Repurchase of common stock |
|
(305,239) |
|
|
(95,259) |
|
|
(77,198) |
|
| Proceeds from stock-based compensation plans |
|
29,760 |
|
|
20,521 |
|
|
37,795 |
|
| Debt issuance costs |
|
(609) |
|
|
— |
|
|
— |
|
| Net cash used in financing activities |
|
(276,088) |
|
|
(74,738) |
|
|
(39,403) |
|
| Effects of exchange rate — changes in cash |
|
(6,378) |
|
|
16,469 |
|
|
(6,966) |
|
| Net increase (decrease) in cash, cash equivalents and restricted cash |
|
(129,730) |
|
|
101,155 |
|
|
(31,910) |
|
| Cash, cash equivalents and restricted cash at beginning of year |
|
397,237 |
|
|
296,082 |
|
|
327,992 |
|
| Cash, cash equivalents and restricted cash at end of year |
|
$ |
267,507 |
|
|
$ |
397,237 |
|
|
$ |
296,082 |
|
|
|
|
|
|
|
|
| Supplemental disclosures of cash flow information |
|
|
|
|
|
|
| Interest paid |
|
$ |
13 |
|
|
$ |
— |
|
|
$ |
— |
|
| Income taxes paid |
|
$ |
(1,493) |
|
|
$ |
2,959 |
|
|
$ |
6,002 |
|
See accompanying notes to consolidated financial statements
Commvault Systems, Inc.
Notes to Consolidated Financial Statements
(In thousands, except per share data)
1. Nature of Business
Commvault Systems, Inc. and its subsidiaries ("Commvault," "we," "us," or "our") is a provider of data protection and information management software applications and products. We develop, market and sell a suite of software applications and services, globally, that provides our customers with data protection solutions. We also provide our customers with a broad range of professional and customer support services, including data management-as-a-service, branded as Metallic.
2. Summary of Significant Accounting Policies
Basis of Presentation
The consolidated financial statements include the accounts of Commvault. All intercompany transactions and balances have been eliminated in consolidation.
Use of Estimates
The preparation of financial statements and related disclosures in conformity with U.S. generally accepted accounting principles ("U.S. GAAP") requires management to make judgments and estimates that affect the amounts reported in our consolidated financial statements and the accompanying notes. We base our estimates and judgments on historical experience and on various other assumptions that we believe are reasonable under the circumstances. The amounts of assets and liabilities reported in our balance sheets and the amounts of revenues and expenses reported for each of the periods presented are affected by estimates and assumptions, which are used for, but not limited to, the accounting for revenue recognition, income taxes and related reserves, deferred commissions, purchased intangible assets and goodwill. Actual results could differ from those estimates.
Revenue
We account for revenue in accordance with Accounting Standards Codification ("ASC") Topic 606, Revenue from Contracts with Customers ("ASC 606"). For a further discussion of our accounting policies related to revenue, see Note 3 of the consolidated financial statements.
Shipping and Handling Costs
Shipping and handling costs are included in cost of revenues for all periods presented.
Sales Tax
We record revenue net of sales tax.
Accounting for Stock-Based Compensation
Restricted stock units without a market condition are measured based on the fair market values of the underlying stock on the date of grant. We recognize stock-based compensation expense using the straight-line method for all stock awards that do not include a market or performance condition. Awards that include a market or performance condition are expensed using the accelerated method.
Software Development Costs
The costs for the development of new products and substantial enhancements to existing products are expensed as incurred until technological feasibility has been established, at which time any additional costs would be capitalized in accordance with the accounting guidance for software. Because our current process for developing software is essentially completed concurrently with the establishment of technological feasibility, which occurs upon the completion of a working model, no costs have been capitalized for any of the periods presented.
Commvault Systems, Inc.
Notes to Consolidated Financial Statements — (Continued)
(In thousands, except per share data)
Advertising Costs
We expense advertising costs as incurred. Advertising expenses were $9,572, $9,560, and $5,579 for the years ended March 31, 2022, 2021 and 2020, respectively.
Accounting for Income Taxes
We account for income taxes in accordance with ASC Topic 740, Income Taxes ("ASC 740"). The provision for income taxes and effective tax rates are calculated by legal entity and jurisdiction and are based on a number of factors, including the level of pre-tax earnings, income tax planning strategies, differences between tax laws and accounting rules, statutory tax rates and credits, uncertain tax positions and valuation allowances. We use significant judgment and estimates in evaluating tax positions. The effective tax rate in a given financial statement period may be materially impacted by changes in the mix and level of earnings by taxing jurisdiction.
Under ASC 740, deferred income taxes arise from temporary differences between the tax basis of assets and liabilities and their reported amounts. Valuation allowances are established when, in our judgment, it is more likely than not that deferred tax assets will not be realized. In assessing the need for a valuation allowance, we weigh the available positive and negative evidence, including historical levels of pre-tax income, legislative developments, expectations and risks associated with estimates of future pre-tax income, and prudent and feasible tax planning strategies.
Foreign Currency Translation
The functional currencies of our foreign operations are deemed to be the local country’s currency. Assets and liabilities of our international subsidiaries are translated at their respective period-end exchange rates, and revenues and expenses are translated at average currency exchange rates for the period. The resulting balance sheet translation adjustments are included in Other comprehensive income (loss) and are reflected as a separate component of Stockholders’ equity.
Foreign currency transaction gains and losses are recorded in General and administrative expenses in the Consolidated Statements of Operations. These gains and losses relate primarily to receivables and payables that are not denominated in the functional currency of the subsidiary they relate to. Net foreign currency transaction losses were not significant for the year ended March 31, 2022. We recognized net foreign currency transaction losses of $1,918 and gains of $355 in the years ended March 31, 2021 and 2020, respectively.
Net Income (Loss) per Common Share
Basic net income (loss) per common share is computed by dividing net income (loss) by the weighted average number of common shares during the period. Diluted net income (loss) per share is computed using the weighted average number of common shares and, if dilutive, potential common shares outstanding during the period. Potential common shares consist of the incremental common shares issuable upon the exercise of stock options, vesting of restricted stock units and shares to be purchased under the Employee Stock Purchase Plan. The dilutive effect of such potential common shares is reflected in diluted earnings per share by application of the treasury stock method.
Commvault Systems, Inc.
Notes to Consolidated Financial Statements — (Continued)
(In thousands, except per share data)
The following table sets forth the reconciliation of basic and diluted common share:
|
|
|
|
|
|
|
|
|
|
|
|
|
|
|
|
|
|
|
|
|
| |
|
Year Ended March 31, |
| |
|
2022 |
|
2021 |
|
2020 |
| Net income (loss) |
|
$ |
33,624 |
|
|
$ |
(30,954) |
|
|
$ |
(5,645) |
|
| Basic net income (loss) per common share: |
|
|
|
|
|
|
| Basic weighted average shares outstanding |
|
45,443 |
|
|
46,652 |
|
|
45,793 |
|
| Basic net income per common share |
|
$ |
0.74 |
|
|
$ |
(0.66) |
|
|
$ |
(0.12) |
|
| Diluted net income (loss) per common share: |
|
|
|
|
|
|
| Basic weighted-average shares outstanding |
|
45,443 |
|
|
46,652 |
|
|
45,793 |
|
Dilutive effect of stock options, restricted stock units, and employee stock purchase plan (1) |
|
1,777 |
|
|
— |
|
|
— |
|
| Diluted weighted-average shares outstanding |
|
47,220 |
|
|
46,652 |
|
|
45,793 |
|
(1) The fiscal 2021 and 2020 shares have been excluded from the diluted weighted-average shares outstanding calculation as we were in a net loss position; therefore, these shares would have been anti-dilutive.
The following table summarizes our potential outstanding common stock equivalents at the end of each period, which have been excluded from the computation of diluted net income (loss) per common share, as their effect is anti-dilutive.
|
|
|
|
|
|
|
|
|
|
|
|
|
|
|
|
|
|
|
|
|
| |
|
Year Ended March 31, |
| |
|
2022 |
|
2021 |
|
2020 |
| Stock options, restricted stock units, and shares under the employee stock purchase plan |
|
505 |
|
|
5,024 |
|
|
4,933 |
|
Cash, Cash Equivalents and Restricted Cash
We consider all highly liquid investments purchased with maturities of three months or less at the date of purchase to be cash equivalents, primarily in the form of money market funds.
Trade and Other Receivables
Trade and other receivables are primarily comprised of trade receivables that are recorded at the invoice amount, net of an allowance for doubtful accounts, which is not material. Unbilled receivables represent amounts for which revenue has been recognized but which have not yet been invoiced to the customer. The current portion of unbilled receivables is included in Trade accounts receivable on the Consolidated Balance Sheets. Long-term unbilled receivables are included in Other assets. The allowance for doubtful accounts was $705 as of March 31, 2022 and $483 as of March 31, 2021. For the years ended March 31, 2022, 2021 and 2020, bad debt expense was immaterial.
Historically, we have not experienced material losses related to the inability to collect receivables from our customers. While there is presently no indication that we will not collect material amounts of accounts receivable as of March 31, 2022, we continue to closely monitor the impact of COVID-19 and the war in Ukraine on our customers. In these current economic conditions, payment from our customers may be delayed or receivables may become uncollectible. The inability to collect receivables could have a material impact on our results of operations.
Concentration of Credit Risk
We grant credit to customers in a wide variety of industries worldwide and generally do not require collateral. Credit losses relating to these customers have been minimal.
Sales through our distribution agreement with Arrow Enterprise Computing Solutions, Inc. ("Arrow") totaled approximately 37%, 36% and 37% of total revenues for the years ended March 31, 2022, 2021 and 2020, respectively.
Commvault Systems, Inc.
Notes to Consolidated Financial Statements — (Continued)
(In thousands, except per share data)
Arrow accounted for approximately 30% and 33% of total accounts receivable as of March 31, 2022 and 2021, respectively.
Fair Value of Financial Instruments
The carrying amounts of our cash, cash equivalents, accounts receivable, accounts payable and accrued expenses approximate their fair values due to the short-term maturity of these instruments.
Fair value is defined as the exchange price that would be received for an asset or paid to transfer a liability (an exit price) in the principal or most advantageous market for such asset or liability in an orderly transaction between market participants on the measurement date. Valuation techniques used to measure fair value should maximize the use of observable inputs and minimize the use of unobservable inputs. To measure fair value, we use the following fair value hierarchy based on three levels of inputs, of which the first two are considered observable and the last unobservable:
Level 1 — Observable inputs such as quoted prices in active markets for identical assets or liabilities;
Level 2 — Inputs other than Level 1, that are observable for the asset or liability, either directly or indirectly; and
Level 3 — Unobservable inputs that are supported by little or no market activity and that require the reporting entity to develop its own assumptions.
There were no financial assets or liabilities measured at fair value on a recurring basis for the years ended March 31, 2022 or 2021.
Equity Securities Accounted for at Net Asset Value
We held equity interests in private equity funds of $4,237 as of March 31, 2022, which are accounted for under the net asset value practical expedient as permitted under ASC 820, Fair Value Measurement. These investments are included in Other assets in the accompanying Consolidated Balance Sheets. The net asset values of these investments are determined using quarterly capital statements from the funds, which are based on our contributions to the funds, allocation of profit and loss and changes in fair value of the underlying fund investments. Changes in fair value as reported on the capital statements are recorded through profit and loss as non-operating income or expense. These private equity funds focus on making investments in key technology sectors, principally by investing in companies at expansion capital and growth equity stages. We have total unfunded commitments in private equity funds of $6,889 as of March 31, 2022. We did not own interests in any of these funds prior to fiscal year 2022.
Leases
We account for leases in accordance with ASC 842, Leases. For a further discussion of our accounting policies related to leases, see Note 15 of the consolidated financial statements.
Property and Equipment
Property and equipment are stated at cost, less accumulated depreciation and amortization. Land is not depreciated. We provide for depreciation on a straight-line basis over the estimated useful lives of the assets. The depreciable assets that comprise our owned headquarters are classified as Buildings and are being depreciated over lives ranging from ten to sixty years. Computer and related equipment is generally depreciated over eighteen months to three years and furniture and fixtures are generally depreciated over three to twelve years. Leasehold improvements are amortized over the shorter of the useful life of the improvement or the term of the related lease. Expenditures for routine maintenance and repairs are charged against operations. Major replacements, improvements and additions are capitalized.
Commvault Systems, Inc.
Notes to Consolidated Financial Statements — (Continued)
(In thousands, except per share data)
Goodwill and Intangible Assets
Goodwill is recorded when the consideration paid for an acquisition exceeds the fair value of net tangible and intangible assets acquired. The carrying value of goodwill is tested for impairment on an annual basis on January 1, or more often if an event occurs or circumstances change that would more likely than not reduce the fair value of its carrying amount. For the purpose of impairment testing, we have a single reporting unit. The impairment test consists of comparing the fair value of the reporting unit with its carrying amount that includes goodwill. If the carrying amount of the reporting unit exceeds the fair value of the reporting unit, an impairment loss would be recognized to reduce the carrying amount to its fair value.
Our finite lived purchased intangible asset, developed technology, was valued using the replacement cost method and is being amortized on a straight-line basis over its economic life of three years as we believed this method most closely reflects the pattern in which the economic benefits of the assets will be consumed. Impairment losses are recognized if the carrying amount of an intangible asset is both not recoverable and exceeds its fair value.
Long-Lived Assets
We review our long-lived assets for impairment whenever events or changes in circumstances indicate that the carrying amount of the assets may not be fully recoverable. To determine the recoverability of our long-lived assets, we evaluate the estimated future undiscounted cash flows that are directly associated with, and that are expected to arise as a direct result of, the use and eventual disposition of the long-lived asset. If the estimated future undiscounted cash flows demonstrate that recoverability is not probable, an impairment loss would be recognized. An impairment loss would be calculated based on the excess carrying amount of the long-lived asset over the long-lived asset’s fair value. The fair value would be determined based on valuation techniques such as a comparison to fair values of similar assets.
Deferred Commissions Cost
Sales commissions, bonuses, and related payroll taxes earned by our employees are considered incremental and recoverable costs of obtaining a contract with a customer. Our typical contracts include performance obligations related to software licenses, software updates, customer support and other services, including software-as-a-service offerings. In these contracts, incremental costs of obtaining a contract are allocated to the performance obligations based on the relative estimated standalone selling prices and then recognized on a systematic basis that is consistent with the transfer of the goods or services to which the asset relates. We do not pay commissions on annual renewals of contracts for software updates and customer support for perpetual licenses. The costs allocated to software and products are expensed at the time of sale, when revenue for the functional software license or appliance is recognized. The costs allocated to software updates and customer support for perpetual licenses are amortized ratably over a period of approximately five years, the expected period of benefit of the asset capitalized. We currently estimate a period of five years is appropriate based on consideration of historical average customer life and the estimated useful life of the underlying software or appliance sold as part of the transaction.
Beginning in fiscal 2022, we modified the terms of our commission plans, and as a result, the commission paid on the renewal of a term-based, or subscription software license, was not commensurate with the commission paid on the initial purchase. As a result, the cost of commissions allocated to software updates and customer support on the initial transaction are now amortized over a period of approximately five years, consistent with the accounting for these costs associated with perpetual licenses. The costs of commissions allocated to software updates and support for the renewal of term-based software licenses is limited to the contractual period of the arrangement, as we pay a commensurate renewal commission upon the next renewal of the subscription license and related updates and support. This change in commission plans also resulted in a change in the estimate of the amortization period of our existing Deferred commissions cost associated with term licenses. This change in amortization period resulted in an approximate $3,575 reduction in Sales and marketing expense, than if the change in estimate did not occur, for the year ended March 31, 2022.
The costs related to professional services are amortized over the period the related professional services are provided and revenue is recognized. Amortization expense related to these costs is included in Sales and marketing expenses in the accompanying Consolidated Statements of Operations.
Commvault Systems, Inc.
Notes to Consolidated Financial Statements — (Continued)
(In thousands, except per share data)
Deferred Revenue
Deferred revenues represent amounts collected from, or invoiced to, customers in excess of revenues recognized. This results primarily from the billing of annual customer support agreements, and billings for other professional services fees that have not yet been performed by us. The value of deferred revenues will increase or decrease based on the timing of invoices and recognition of revenue.
Share Repurchases
We consider all shares repurchased as canceled shares restored to the status of authorized but unissued shares on the trade date. The aggregate purchase price of the shares of our common stock repurchased is reflected as a reduction to Stockholders’ equity. We account for shares repurchased as an adjustment to common stock (at par value) with the excess repurchase price allocated between Additional paid-in capital and Accumulated deficit.
Comprehensive Income (Loss)
Comprehensive income (loss) is defined to include all changes in equity, except those resulting from investments by stockholders and distribution to stockholders.
Recently Adopted Accounting Standards
|
|
|
|
|
|
|
|
|
|
|
|
| Standard |
Description |
Effective Date |
Effect on the Consolidated Financial Statements (or Other Significant Matters) |
| ASU No. 2019-12 (Topic 740), Income Taxes |
In December 2019, the Financial Accounting Standards Board ("FASB") issued a new standard to simplify the accounting for income taxes. The guidance eliminates certain exceptions related to the approach for intraperiod tax allocation, the methodology for calculating income taxes in an interim period, and the recognition of deferred tax liabilities for outside basis differences related to changes in ownership of equity method investments and foreign subsidiaries. The guidance also simplifies aspects of accounting for franchise taxes and enacted changes in tax laws or rates, and clarifies the accounting for transactions that result in a step-up in the tax basis of goodwill. |
We adopted this standard as of April 1, 2021. |
The standard did not have a significant impact on our financial statements. |
| ASU No. 2021-08 (Topic 805), Business Combinations |
In October 2021, the FASB issued a new standard to improve the accounting for acquired revenue
contracts with customers in a business combination. The new guidance requires companies to apply revenue guidance under ASC Topic 606 to recognize and measure contract assets and contract liabilities acquired in a business combination on the acquisition date. |
We elected to early adopt effective January 1, 2022. |
The standard did not have a significant impact in our consolidated financial statements, including accounting policies, processes and systems. |
Commvault Systems, Inc.
Notes to Consolidated Financial Statements — (Continued)
(In thousands, except per share data)
3. Revenue
We derive revenues from two primary sources: software and products, and services. Software and products revenue includes our software and integrated appliances that combine our software with hardware. Services include customer support (software updates and technical support), consulting, assessment and design services, installation services, customer education and Commvault software-as-a-service, which is branded as Metallic.
We sell both perpetual and term-based licenses of our software. We refer to our term-based software licenses as subscription arrangements. We do not customize our software and installation services are not required. The software is delivered before related services are provided and is functional without professional services, updates and technical support. We have concluded that our software licenses (both perpetual and subscription) are functional intellectual property that is distinct as the user can benefit from the software on its own. Software revenue for both perpetual and subscription licenses is typically recognized when the software is delivered and/or made available for download as this is the point the user of the software can direct the use of, and obtain substantially all of the remaining benefits from the functional intellectual property. We do not recognize software revenue related to the renewal of subscription software licenses earlier than the beginning of the new subscription period.
We also sell appliances that integrate our software with hardware and address a wide-range of business needs and use cases, ranging from support for remote or branch offices with limited IT staff up to large corporate data centers. Revenue related to appliances is recognized when control of the appliances passes to the customer; typically upon delivery. In the second half of fiscal 2021 we began transitioning to a software only model in which we typically sell software to a third party, which assembles an integrated appliance that is sold to end user customers. As a result, the revenue and costs associated with hardware have declined from recent fiscal years.
Services revenue includes revenue from customer support and other professional services. Customer support includes software updates on a when-and-if-available basis, telephone support, integrated web-based support and bug fixes or patches. We sell our customer support contracts as a percentage of net software purchases the support is related to. Customer support revenue is recognized ratably over the term of the customer support agreement, which is typically one year on our perpetual licenses. The term of our subscription arrangements is typically three years, but can range between one and five years.
Our other professional services include consulting, assessment and design services, installation services and customer education. Customer education services include courses taught by our instructors or third-party contractors. Revenue related to other professional services and customer education services is typically recognized as the services are performed.
Commvault software-as-a-service, which is branded as Metallic, allows customers to use hosted software over the contract period without taking possession of the software. Revenue related to Metallic is generally recognized ratably over the contract term as services revenue.
Most of our contracts with customers contain multiple performance obligations. For these contracts, we account for individual performance obligations separately if they are distinct. The transaction price is allocated to the separate performance obligations on a relative standalone selling price basis. Standalone selling prices of software and appliances are typically estimated using the residual approach. Standalone selling prices of services are typically estimated based on observable transactions when these services are sold on a standalone basis.
Commvault Systems, Inc.
Notes to Consolidated Financial Statements — (Continued)
(In thousands, except per share data)
Our typical performance obligations include the following:
|
|
|
|
|
|
|
|
|
|
|
|
| Performance Obligation |
When Performance Obligation
is Typically Satisfied |
When Payment is
Typically Due |
How Standalone Selling Price is
Typically Estimated |
| Software and Products Revenue |
| Software Licenses |
Upon shipment or made available for download (point in time) |
Within 90 days of shipment except for certain subscription licenses which are paid for over time |
Residual approach |
| Customer Support Revenue |
| Software Updates |
Ratably over the course of the support contract (over time) |
At the beginning of the contract period |
Observable in renewal transactions |
| Customer Support |
Ratably over the course of the support contract (over time) |
At the beginning of the contract period |
Observable in renewal transactions |
| Other Services Revenue |
| Other Professional Services (except for education services) |
As work is performed (over time) |
Within 90 days of services being performed |
Observable in transactions without multiple performance obligations |
| Education Services |
When the class is taught (point in time) |
Within 90 days of services being performed |
Observable in transactions without multiple performance obligations |
| Software-as-a-service (Metallic) |
Ratably over the course of the contract (over time) |
Annual or monthly payments |
Observable in transactions without multiple performance obligations |
Disaggregation of Revenue
We disaggregate revenue from contracts with customers into the nature of the products and services and geographical regions. The geographic regions that are tracked are the Americas (United States, Canada, Latin America), EMEA (Europe, Middle East, Africa) and APJ (Australia, New Zealand, Southeast Asia, China). We operate in one segment.
|
|
|
|
|
|
|
|
|
|
|
|
|
|
|
|
Year Ended March 31, 2022 |
|
Americas |
EMEA |
APJ |
Total |
| Software and Products Revenue |
$ |
215,264 |
|
$ |
103,749 |
|
$ |
37,474 |
|
$ |
356,487 |
|
| Customer Support Revenue |
202,867 |
|
104,524 |
|
39,724 |
|
347,115 |
|
| Other Services Revenue |
39,764 |
|
19,068 |
|
7,157 |
|
65,989 |
|
| Total Revenue |
$ |
457,895 |
|
$ |
227,341 |
|
$ |
84,355 |
|
$ |
769,591 |
|
|
|
|
|
|
|
|
|
|
|
|
|
|
|
|
|
Year Ended March 31, 2021 |
|
Americas |
EMEA |
APJ |
Total |
| Software and Products Revenue |
$ |
187,027 |
|
$ |
101,673 |
|
$ |
38,143 |
|
$ |
326,843 |
|
| Customer Support Revenue |
215,831 |
|
100,620 |
|
41,330 |
|
357,781 |
|
| Other Services Revenue |
21,264 |
|
12,138 |
|
5,446 |
|
38,848 |
|
| Total Revenue |
$ |
424,122 |
|
$ |
214,431 |
|
$ |
84,919 |
|
$ |
723,472 |
|
Commvault Systems, Inc.
Notes to Consolidated Financial Statements — (Continued)
(In thousands, except per share data)
|
|
|
|
|
|
|
|
|
|
|
|
|
|
|
|
Year Ended March 31, 2020 |
|
Americas |
EMEA |
APJ |
Total |
| Software and Products Revenue |
$ |
141,856 |
|
$ |
95,356 |
|
$ |
38,096 |
|
$ |
275,308 |
|
| Customer Support Revenue |
230,226 |
|
88,965 |
|
40,939 |
|
360,130 |
|
| Other Services Revenue |
18,778 |
|
10,459 |
|
6,210 |
|
35,447 |
|
| Total Revenue |
$ |
390,860 |
|
$ |
194,780 |
|
$ |
85,245 |
|
$ |
670,885 |
|
Information about Contract Balances
Amounts collected in advance of services being provided are accounted for as deferred revenue. Nearly all of our deferred revenue balance is related to services revenue, primarily customer support contracts and software-as-a-service contracts.
In some arrangements we allow customers to pay for term-based software licenses and products over the term of the software license. Amounts recognized as revenue in excess of amounts billed are recorded as unbilled receivables. Unbilled receivables, which are anticipated to be invoiced in the next twelve months, are included in Accounts Receivable on the Consolidated Balance Sheets. Long-term unbilled receivables are included in Other assets. The opening and closing balances of our Accounts receivable, Unbilled receivables and Deferred revenues are as follows:
|
|
|
|
|
|
|
|
|
|
|
|
|
|
|
|
|
|
|
Accounts Receivable |
Unbilled Receivable
(current) |
Unbilled Receivable
(long-term) |
Deferred Revenue
(current) |
Deferred Revenue
(long-term) |
Opening Balance as of March 31, 2021 |
$ |
168,985 |
|
$ |
19,141 |
|
$ |
7,463 |
|
$ |
253,211 |
|
$ |
119,231 |
|
| Increase/(decrease), net |
8,197 |
|
(2,085) |
|
6,833 |
|
13,806 |
|
30,949 |
|
Ending Balance as of March 31, 2022 |
$ |
177,182 |
|
$ |
17,056 |
|
$ |
14,296 |
|
$ |
267,017 |
|
$ |
150,180 |
|
The net increase in accounts receivable (inclusive of unbilled receivables) is a result of an increase in software and products revenue relative to the prior year. The increase in deferred revenue is primarily the result of an increase in deferred revenue associated with software-as-a-service contracts that are billed upfront and recognized ratably over the contract period.
The amount of revenue recognized in the period that was included in the opening deferred revenue balance was approximately $254,100 for the year ended March 31, 2022. The vast majority of this revenue consists of customer support arrangements. The amount of revenue recognized from performance obligations satisfied in prior periods was not material.
Remaining Performance Obligations
In addition to the amounts included in deferred revenue as of March 31, 2022, approximately $83,500 of revenue may be recognized from remaining performance obligations, of which approximately $21,250 was related to software and products. We expect most of the software and products revenue to be recognized in the first half of fiscal 2022. The majority of the services revenue is related to other professional services which may be recognized over the next twelve months but is contingent upon a number of factors, including customers’ needs and schedules.
Commvault Systems, Inc.
Notes to Consolidated Financial Statements — (Continued)
(In thousands, except per share data)
4. Business Combination
On January 31, 2022, we completed the acquisition of TrapX Security ("TrapX"), an Israeli-based cyber deception technology company, acquiring 100% of the equity interest for a purchase price of $18,653, paid in cash. The primary reason for the business combination is to expand the security features of our software-as-a-service offerings. The technology was valued using the replacement method. The following table summarizes the purchase price allocation as of the date of acquisition:
|
|
|
|
|
|
| Assets acquired and liabilities assumed: |
|
| Cash |
$ |
1,759 |
|
| Trade accounts receivable |
700 |
|
| Developed technology |
3,750 |
|
| Pre-acquisition tax contingencies |
(736) |
|
| Accrued expenses |
(523) |
|
| Deferred revenue |
(1,642) |
|
| Total identifiable net assets acquired and liabilities assumed |
3,308 |
|
| Goodwill |
15,345 |
|
| Total purchase price |
$ |
18,653 |
|
Actual and Unaudited Pro Forma Information
We completed the acquisition for TrapX on January 31, 2022, and accordingly, TrapX's operations for the period from January 31, 2022 to March 31, 2022 are included in our Consolidated Statements of Operations. TrapX contributed revenues of approximately $535 and estimated net loss of $948 for the period from the completion of acquisition through March 31, 2022.
The following unaudited pro forma results of operations have been prepared using the acquisition method of accounting to give effect to the TrapX acquisition as though it occurred on April 1, 2020. The pro forma amounts reflect certain adjustments, such as expenses related to the noncash amortization of intangible assets. The fiscal 2022 supplemental pro forma net income was adjusted to exclude $1,379 of acquisition-related costs incurred in fiscal 2022. The fiscal 2021 supplemental pro forma net loss was adjusted to include these charges. In addition to estimated operating expenses, both periods include noncash amortization expenses related to intangible assets as if the acquisition had taken place on April 1, 2020.
The unaudited pro forma financial information is presented for illustrative purposes only, is based on a purchase price allocation, and is not necessarily indicative of the results of operations that would have actually been reported had the acquisition occurred on April 1, 2020, nor is it necessarily indicative of the future results of operations of the combined company.
|
|
|
|
|
|
|
|
|
|
|
|
|
Unaudited |
|
Year Ended March 31, |
|
2022 |
|
2021 |
| Revenue |
$ |
774,161 |
|
|
$ |
729,120 |
|
| Net income (loss) |
$ |
33,104 |
|
|
$ |
(37,601) |
|
Commvault Systems, Inc.
Notes to Consolidated Financial Statements — (Continued)
(In thousands, except per share data)
5. Goodwill and Intangible Assets, Net
Goodwill
Goodwill represents the residual purchase price paid in a business combination after the fair value of all identified assets and liabilities have been recorded. It includes the estimated value of potential expansion with new customers, the opportunity to further develop sales relationships with new customers and intangible assets that do not qualify for separate recognition. Goodwill is not amortized. None of the goodwill recorded is expected to be deductible for income tax purposes.
There were no impairments to the carrying amount of goodwill during either fiscal year ended March 31, 2022 or 2021.
Goodwill balances are as follows:
|
|
|
|
|
|
|
|
|
|
|
|
|
|
|
|
|
2022 |
|
2021 |
| Opening balance |
|
$ |
112,435 |
|
|
$ |
112,435 |
|
| Additions |
|
15,345 |
|
|
— |
|
| Ending balance |
|
$ |
127,780 |
|
|
$ |
112,435 |
|
Intangible assets, net
Intangible assets are recorded at cost and amortized over their estimated useful lives.
|
|
|
|
|
|
|
|
|
|
|
|
|
|
|
|
|
|
|
|
|
|
|
|
|
|
|
|
|
March 31, 2022 |
|
|
Gross Carrying Amount |
|
Accumulated Amortization |
|
Net Carrying Value |
|
Remaining Useful Life (in months) |
| Developed technology |
|
$ |
3,750 |
|
|
$ |
(208) |
|
|
$ |
3,542 |
|
|
34 |
|
|
|
|
|
|
|
|
|
|
|
|
|
|
|
|
|
|
|
|
|
|
|
|
|
|
|
|
|
March 31, 2021 |
|
|
Gross Carrying Amount |
|
Accumulated Amortization |
|
Impairment Charge |
|
Net Carrying Value |
| Developed technology |
|
$ |
49,000 |
|
|
$ |
(9,800) |
|
|
$ |
(39,200) |
|
|
$ |
— |
|
| Customer relationships |
|
3,000 |
|
|
(1,500) |
|
|
(1,500) |
|
|
— |
|
| Total intangible assets |
|
$ |
52,000 |
|
|
$ |
(11,300) |
|
|
$ |
(40,700) |
|
|
$ |
— |
|
Amortization expense from acquired intangible assets was $208 for the fiscal year ended March 31, 2022 and $5,650 for the fiscal year ended 2021. During the second quarter of fiscal year 2021 we identified an indicator of impairment and concluded that the carrying values of the developed technology and customer relationships acquired in connection with the Hedvig transaction were not recoverable on an undiscounted basis. As a result, we remeasured the fair value of these assets and concluded their value was de minimis. We recorded a $40,700 impairment charge in the accompanying Consolidated Statements of Operations for the year ended March 31, 2021. These non-recurring fair value measurements were categorized as Level 3, as significant unobservable inputs were used in the valuation analysis. Key assumptions used in the valuation include forecasts of revenue and expenses over an extended period, the useful life of the asset, tax rates, and estimated costs of debt and equity capital to discount the projected cash flows. Certain of these assumptions involve significant judgment and are based on management’s estimate of current and forecasted market conditions.
Commvault Systems, Inc.
Notes to Consolidated Financial Statements — (Continued)
(In thousands, except per share data)
Estimated future amortization expense of intangible assets with finite lives as of March 31, 2022 is as follows:
|
|
|
|
|
|
|
|
|
| Year ending March 31, |
|
|
| 2023 |
|
$ |
1,250 |
|
| 2024 |
|
1,250 |
|
| 2025 |
|
1,042 |
|
| Total |
|
$ |
3,542 |
|
6. Property and Equipment
Property and equipment consist of the following:
|
|
|
|
|
|
|
|
|
|
|
|
|
|
|
| |
|
March 31, |
| |
|
2022 |
|
2021 |
| Land |
|
$ |
9,445 |
|
|
$ |
9,445 |
|
| Buildings |
|
103,244 |
|
|
103,244 |
|
| Computers, servers and other equipment |
|
45,557 |
|
|
42,117 |
|
| Furniture and fixtures |
|
15,031 |
|
|
14,689 |
|
| Leasehold improvements |
|
9,349 |
|
|
8,089 |
|
| Purchased software |
|
2,016 |
|
|
1,955 |
|
| Construction in process |
|
2,119 |
|
|
4,304 |
|
|
|
186,761 |
|
|
183,843 |
|
| Less: Accumulated depreciation and amortization |
|
(80,248) |
|
|
(71,064) |
|
|
|
$ |
106,513 |
|
|
$ |
112,779 |
|
We recorded depreciation and amortization expense of $10,708, $10,228, and $11,415 for the years ended 2022, 2021 and 2020, respectively. Approximately $1,250 of depreciation expense is allocated to our cost of goods sold for the years ended 2022, 2021 and 2020.
7. Accrued Liabilities
Accrued liabilities consist of the following:
|
|
|
|
|
|
|
|
|
|
|
|
|
|
|
| |
|
March 31, |
| |
|
2022 |
|
2021 |
| Compensation and related payroll taxes |
|
$ |
73,409 |
|
|
$ |
69,890 |
|
| Other |
|
48,428 |
|
|
42,258 |
|
|
|
$ |
121,837 |
|
|
$ |
112,148 |
|
8. Commitments and Contingencies
Purchase Commitments
We, in the normal course of business, enter into various purchase commitments for goods or services. Total non-cancellable purchase commitments as of March 31, 2022, which relate primarily to marketing and IT services are as follows:
|
|
|
|
|
|
|
|
|
|
|
|
|
|
|
|
|
|
|
|
|
|
|
|
|
|
|
|
|
|
|
|
|
|
|
2023 |
|
2024 |
|
2025 |
|
2025 and beyond |
|
Total |
| Purchase commitments |
|
$ |
19,693 |
|
|
$ |
4,969 |
|
|
$ |
7,976 |
|
|
$ |
215 |
|
|
$ |
32,853 |
|
Commvault Systems, Inc.
Notes to Consolidated Financial Statements — (Continued)
(In thousands, except per share data)
We have certain software royalty commitments associated with the shipment and licensing of certain products. Royalty expense is generally based on a fixed cost per unit shipped or a fixed fee for unlimited units shipped over a designated period. Royalty expense, included in Cost of software and products revenues, was as follows:
|
|
|
|
|
|
|
|
|
|
|
|
|
|
|
|
|
|
|
|
|
|
|
Year Ended March 31, |
|
|
2022 |
|
2021 |
|
2020 |
| Royalty expense |
|
$ |
11,188 |
|
|
$ |
16,256 |
|
|
$ |
12,545 |
|
Warranties and Indemnifications
We typically offer a 90-day limited product warranty for our software. To date, costs related to this product warranty have not been significant.
We provide certain provisions within our software licensing agreements to indemnify our customers from any claim, suit or proceeding arising from alleged or actual intellectual property infringement. These provisions continue in perpetuity, along with our software licensing agreements. We have never incurred a liability relating to one of these indemnification provisions, and management believes that the likelihood of any future payout relating to these provisions is remote. Therefore, we have not recorded a liability during any period for these indemnification provisions.
Legal Proceedings
During fiscal 2022, we entered into settlement agreements resulting in a $7,900 gain which resolved certain legal matters. The settlement amounts are recorded in General and administrative expenses net against related legal expenses.
We do not believe that we are currently party to any pending legal action that could reasonably be expected to have a material adverse effect on our business or operating results.
9. Capitalization
Common Stock
We have 44,511 and 46,482 shares of common stock, par value $0.01, outstanding at March 31, 2022 and March 31, 2021, respectively.
During fiscal 2022, we repurchased $305,239 of common stock, or approximately 4,307 shares, under our share repurchase program. This program commenced in January 2021 and ended on March 31, 2022. Our share repurchase program has been funded by our existing cash and cash equivalent balances as well as cash flows provided by our operations.
Subsequent Event
On April 21, 2022 the Board of Directors approved a new share repurchase program of $250,000. The Board's authorization has no expiration date.
Shares Reserved for Issuance
At March 31, 2022, we have reserved 5,354 shares in connection with our Stock Plans discussed in Note 10 of the notes to the consolidated financial statements.
Commvault Systems, Inc.
Notes to Consolidated Financial Statements — (Continued)
(In thousands, except per share data)
10. Stock Plans
We maintain the Omnibus Incentive Plan (the “2016 Incentive Plan”) for granting awards to employees. On August 19, 2021, our shareholders approved an amendment to the 2016 Incentive Plan to increase the maximum number of shares of common stock that may be delivered under plan to 10,050, an increase of 2,000 shares. The 2016 Incentive Plan authorizes a broad range of awards including stock options, stock appreciation rights, full value awards (including restricted stock, restricted stock units, performance shares or units and other stock-based awards) and cash-based awards. As of March 31, 2022, approximately 2,090 shares were available for future issuance under the 2016 Incentive Plan.
As of March 31, 2022, we have granted non-qualified stock options, restricted stock units and performance stock awards under our stock incentive plans. Historically, most equity awards granted by us under our stock incentive plans generally vest quarterly over a three-year period, except that the shares that would otherwise vest quarterly over the first twelve months do not vest until the first anniversary of the grant. We anticipate that future grants under our stock incentive plans will be restricted stock units and performance stock awards and do not anticipate that we will grant stock options.
As of March 31, 2022, there was approximately $146,077 of unrecognized stock-based compensation expense related to all of our employee stock plans that is expected to be recognized over a weighted-average period of 1.74 years. To the extent the actual forfeiture rate is different from what we have anticipated, stock-based compensation related to these awards will be different from our expectations.
Restricted stock unit activity is as follows:
|
|
|
|
|
|
|
|
|
|
|
|
|
|
|
| Non-Vested Restricted Stock Units |
|
Number
of
Awards |
|
Weighted-
Average
Grant Date
Fair Value |
| Non-vested as of March 31, 2021 |
|
3,451 |
|
|
$ |
44.90 |
|
| Granted |
|
1,958 |
|
|
69.77 |
|
| Vested |
|
(1,743) |
|
|
45.90 |
|
| Forfeited |
|
(356) |
|
|
52.93 |
|
| Non-vested as of March 31, 2022 |
|
3,310 |
|
|
$ |
58.16 |
|
The total fair value of the restricted stock units that vested during the years ended March 31, 2022, 2021 and 2020 was $122,259, $72,544 and $48,221, respectively.
The following summarizes the activity for our stock incentive plans from March 31, 2021 to March 31, 2022:
|
|
|
|
|
|
|
|
|
|
|
|
|
|
|
|
|
|
|
|
|
|
|
|
|
|
|
| Options |
|
Number of
Options |
|
Weighted-
Average
Exercise Price |
|
Weighted-
Average
Remaining
Contractual
Term (Years) |
|
Aggregate
Intrinsic
Value |
| Outstanding at March 31, 2021 |
|
1,357 |
|
|
$ |
62.06 |
|
|
|
|
|
| Options granted |
|
— |
|
|
— |
|
|
|
|
|
| Options exercised |
|
(406) |
|
|
46.56 |
|
|
|
|
|
| Options forfeited |
|
— |
|
|
— |
|
|
|
|
|
| Options expired |
|
(34) |
|
|
86.25 |
|
|
|
|
|
| Outstanding at March 31, 2022 |
|
917 |
|
|
$ |
68.03 |
|
|
1.46 |
|
$ |
7,070 |
|
|
|
|
|
|
|
|
|
|
| Exercisable at March 31, 2022 |
|
917 |
|
|
$ |
68.03 |
|
|
1.46 |
|
$ |
7,070 |
|
Commvault Systems, Inc.
Notes to Consolidated Financial Statements — (Continued)
(In thousands, except per share data)
The total intrinsic value of options exercised was $12,704, $4,306, and $13,428 in the years ended March 31, 2022, 2021 and 2020, respectively. Our policy is to issue new shares upon exercise of options as we do not hold shares in treasury.
The following table presents the stock-based compensation expense included in Cost of services revenue, Sales and marketing, Research and development, General and administrative and Restructuring expenses for the years ended March 31, 2022, 2021 and 2020.
|
|
|
|
|
|
|
|
|
|
|
|
|
|
|
|
|
|
|
|
|
| |
|
Year Ended March 31, |
| |
|
2022 |
|
2021 |
|
2020 |
| Cost of services revenue |
|
$ |
4,474 |
|
|
$ |
3,317 |
|
|
$ |
2,604 |
|
| Sales and marketing |
|
37,431 |
|
|
35,577 |
|
|
31,779 |
|
| Research and development |
|
33,870 |
|
|
24,823 |
|
|
14,594 |
|
| General and administrative |
|
27,679 |
|
|
18,369 |
|
|
15,158 |
|
| Restructuring |
|
1,709 |
|
|
2,747 |
|
|
1,753 |
|
| Stock-based compensation expense |
|
$ |
105,163 |
|
|
$ |
84,833 |
|
|
$ |
65,888 |
|
Performance Based Awards
In May 2021, we granted 105 performance stock units ("PSUs") to certain executives and in June 2021, we granted an additional 14 PSUs to certain executives for a total of 119 PSUs for fiscal 2022. Vesting of these awards is contingent upon i) us meeting certain revenue and non-GAAP performance goals (performance-based) in fiscal 2022 and ii) our customary service periods. The awards vest over three years. These awards generally have potential to vest at 200% based on actual fiscal 2022 performance. The related stock-based compensation expense is determined based on the value of the underlying shares on the date of grant and is recognized over the vesting term using the accelerated method. During each financial period, management estimates the probable number of PSUs that would vest until the ultimate achievement of the performance goals is known. Based on our results, the PSUs granted in May 2021, will be eligible to vest at approximately 150% and the PSUs granted in June 2021 will be eligible to vest at 200%. The awards are included in the restricted stock unit table.
There were no performance based stock units granted during fiscal 2021.
Awards with a Market Condition
In fiscal 2022, we granted 105 market performance stock units to certain executives. The vesting of these awards is contingent upon us meeting certain total shareholder return ("TSR") levels as compared to the Russell 3000 market index over the three years subsequent to grant date. The awards vest in three annual tranches and have a maximum potential to vest at 200% and a minimum of 0% based on TSR performance. The related stock-based compensation expense is determined based on the estimated fair value of the underlying shares on the date of grant and is recognized using the accelerated method over the vesting term. The estimated fair value was calculated using a Monte Carlo simulation model. The fair value of the awards granted during the year was $87.74 per share, which approximated the market value of a share of stock at the time of grant. The awards are included in the restricted stock unit table above.
In fiscal 2021, we granted 299 market performance stock units to certain executives. The vesting of these awards is contingent upon us meeting certain total shareholder return ("TSR") levels as compared to the Russell 3000 market index over the three years subsequent to grant date. The awards vest in three annual tranches and have a maximum potential to vest at 200% and a minimum of 0% based on TSR performance. The related stock-based compensation expense is determined based on the estimated fair value of the underlying shares on the date of grant and is recognized using the accelerated method over the vesting term. The estimated fair value was calculated using a Monte Carlo simulation model. The fair value of the awards granted during the year was $36.76 per share, which approximated the market value of a share of stock at the time of grant. The awards are included in the restricted stock unit table above.
Commvault Systems, Inc.
Notes to Consolidated Financial Statements — (Continued)
(In thousands, except per share data)
Employee Stock Purchase Plan
The Employee Stock Purchase Plan (the “Purchase Plan”) is a shareholder approved plan under which substantially all employees may purchase our common stock through payroll deductions at a price equal to 85% of the lower of the fair market values of the stock as of the beginning or the end of six-month offering periods. An employee’s payroll deductions under the Purchase Plan are limited to 10% of the employee’s salary and employees may not purchase more than $25 of stock during any calendar year. Employees purchased 187 shares in exchange for $10,816 of proceeds in fiscal 2022 and 272 shares in exchange for $9,812 of proceeds in fiscal 2021. The Purchase Plan is considered compensatory and the fair value of the discount and look back provision are estimated using the Black-Scholes formula and recognized over the six-month withholding period prior to purchase. The total expense associated with the Purchase Plan for fiscal 2022, 2021 and 2020 was $3,341, $3,417 and $2,939, respectively. As of March 31, 2022, there was approximately $1,448 of unrecognized cost related to the current purchase period of our Purchase Plan.
11. Income Taxes
Global Intangible Low-Tax Income ("GILTI")
The Tax Cuts and Jobs Act (the "Act") was enacted on December 22, 2017. The Act subjects a U.S. shareholder to tax on Global Intangible Low-Taxed Income ("GILTI") earned by certain foreign subsidiaries. The FASB Staff Q&A, Topic 740, No. 5, Accounting for GILTI, states that an entity can make an accounting policy election to either recognize deferred taxes for temporary basis differences expected to reverse as GILTI in future years or to provide for the tax expense related to GILTI in the year the tax is incurred as a period expense only. The Company has elected to account for GILTI in the year the tax is incurred, and has recorded an estimate of GILTI as a component of the tax provision for the fiscal years ending March 31, 2022, 2021 and 2020.
The components of income (loss) before income taxes were as follows:
|
|
|
|
|
|
|
|
|
|
|
|
|
|
|
|
|
|
|
|
|
| |
|
Year Ended March 31, |
| |
|
2022 |
|
2021 |
|
2020 |
| Domestic |
|
$ |
25,905 |
|
|
$ |
(28,628) |
|
|
$ |
(16,670) |
|
| Foreign |
|
17,509 |
|
|
7,393 |
|
|
4,124 |
|
|
|
$ |
43,414 |
|
|
$ |
(21,235) |
|
|
$ |
(12,546) |
|
The components of income tax expense (benefit) were as follows:
|
|
|
|
|
|
|
|
|
|
|
|
|
|
|
|
|
|
|
|
|
| |
|
Year Ended March 31, |
| |
|
2022 |
|
2021 |
|
2020 |
| Current: |
|
|
|
|
|
|
| Federal |
|
$ |
284 |
|
|
$ |
3,399 |
|
|
$ |
(10,071) |
|
| State |
|
361 |
|
|
196 |
|
|
(613) |
|
| Foreign |
|
9,096 |
|
|
6,215 |
|
|
5,566 |
|
| Deferred: |
|
|
|
|
|
|
| Federal |
|
28 |
|
|
(113) |
|
|
284 |
|
| State |
|
— |
|
|
— |
|
|
— |
|
| Foreign |
|
21 |
|
|
22 |
|
|
(2,067) |
|
|
|
$ |
9,790 |
|
|
$ |
9,719 |
|
|
$ |
(6,901) |
|
Commvault Systems, Inc.
Notes to Consolidated Financial Statements — (Continued)
(In thousands, except per share data)
A reconciliation of the statutory tax rates and the effective tax rates for the years ended March 31, 2022, 2021 and 2020 are as follows:
|
|
|
|
|
|
|
|
|
|
|
|
|
|
|
|
|
|
|
|
|
| |
|
Year Ended March 31, |
| |
|
2022 |
|
2021 |
|
2020 |
| Statutory federal income tax expense (benefit) rate |
|
21.0 |
% |
|
(21.0) |
% |
|
(21.0) |
% |
| State and local income tax expense, net of federal income tax effect |
|
0.8 |
% |
|
0.9 |
% |
|
(4.9) |
% |
| Foreign earnings taxed at different rates |
|
6.2 |
% |
|
10.0 |
% |
|
12.3 |
% |
| U.S. tax on Global Intangible Low-Taxed Income |
|
0.5 |
% |
|
1.8 |
% |
|
14.5 |
% |
| Domestic permanent differences including acquisition items |
|
3.6 |
% |
|
1.7 |
% |
|
7.7 |
% |
| Foreign tax credits |
|
(5.3) |
% |
|
(7.8) |
% |
|
(19.3) |
% |
| Research credits |
|
(28.3) |
% |
|
(68.6) |
% |
|
(32.9) |
% |
| Tax reserves |
|
2.6 |
% |
|
(0.1) |
% |
|
(0.6) |
% |
| Valuation allowance |
|
18.3 |
% |
|
74.4 |
% |
|
64.0 |
% |
| Enacted tax law changes |
|
0.3 |
% |
|
— |
% |
|
10.6 |
% |
| Stock-based compensation |
|
(1.6) |
% |
|
36.3 |
% |
|
(43.1) |
% |
| CARES Act Impact |
|
— |
% |
|
15.0 |
% |
|
(82.1) |
% |
| Reduction of NOL for carryback |
|
— |
% |
|
— |
% |
|
59.2 |
% |
| Other differences, net |
|
4.5 |
% |
|
3.2 |
% |
|
(19.4) |
% |
| Effective income tax expense (benefit) |
|
22.6 |
% |
|
45.8 |
% |
|
(55.0) |
% |
The significant components of our deferred tax assets and liabilities are as follows:
|
|
|
|
|
|
|
|
|
|
|
|
|
|
|
| |
|
March 31, |
| |
|
2022 |
|
2021 |
| Deferred tax assets: |
|
|
|
|
| Net operating losses |
|
$ |
12,937 |
|
|
$ |
12,586 |
|
| Equity investment |
|
948 |
|
|
1,193 |
|
| Stock-based compensation |
|
15,726 |
|
|
16,280 |
|
| Deferred revenue |
|
19,125 |
|
|
14,879 |
|
| Tax credits |
|
50,587 |
|
|
39,062 |
|
| Accrued expenses |
|
2,148 |
|
|
3,568 |
|
| Allowance for doubtful accounts and other reserves |
|
493 |
|
|
801 |
|
| Other |
|
115 |
|
|
— |
|
| Less: valuation allowance |
|
(90,242) |
|
|
(78,339) |
|
| Total deferred tax assets |
|
11,837 |
|
|
10,030 |
|
| Deferred tax liabilities: |
|
|
|
|
| Depreciation and amortization |
|
(3,945) |
|
|
(4,553) |
|
| Deferred commissions and other |
|
(8,700) |
|
|
(6,238) |
|
| Total deferred tax liabilities |
|
$ |
(12,645) |
|
|
$ |
(10,791) |
|
| Net deferred tax liability |
|
$ |
(808) |
|
|
$ |
(761) |
|
Commvault Systems, Inc.
Notes to Consolidated Financial Statements — (Continued)
(In thousands, except per share data)
Net deferred tax assets arise due to the recognition of income and expense items for tax purposes, which differ from those used for financial statement purposes. ASC 740, Income Taxes, provides for the recognition of deferred tax assets if realization of such assets is more likely than not. In assessing the need for a valuation allowance, we considered all available objective and verifiable evidence both positive and negative, including historical levels of pre-tax income (loss) both on a consolidated basis and tax reporting entity basis, legislative developments, expectations and risks associated with estimates of future pre-tax income, and prudent and feasible tax planning strategies. As a result of this analysis, we determined that it is more likely than not that we will not realize the benefits of our gross deferred tax assets and therefore have recorded a valuation allowance to reduce the carrying value of these gross deferred tax assets, net of the impact of the reversal of taxable temporary differences. At March 31, 2022 and 2021, we recorded valuation allowances of $90,242 and $78,339, respectively, representing an increase in the valuation allowance of $11,903 in 2022, due to the uncertainty regarding the realization of such deferred tax assets. Included in the March 31, 2022 valuation allowance of $90,242 was $3,894 related to purchase accounting.
During fiscal 2019, the Company could no longer assert that it had the intent to indefinitely reinvest the earnings and profits of the foreign subsidiaries, with the exception of India. Accordingly, the Company was required to adjust its deferred tax liability for the effects of this change in assertion. This effect was not significant. Our position during fiscal 2022 remains unchanged.
At March 31, 2022, we had federal NOL carry forwards of $33,978. There are $8,062 NOLs that will expire by 2036 and $25,915 NOLs that will not expire. As of March 31, 2022, we had deferred tax assets related to state NOL carry forwards of $1,793 which expire over various years beginning in 2031 depending on the jurisdiction. As of March 31, 2022, we had foreign NOL carry forwards of $38,391 that will not expire.
We also had federal and state research tax credits ("R&D credit") carryforwards of approximately $35,140 and $18,873, respectively. The federal R&D credit carryforwards expire from 2033 through 2042, and the state R&D credit carryforwards expire from 2023 through 2037.
We conduct business globally and as a result, file income tax returns in the United States and in various state and foreign jurisdictions. In the normal course of business, we are subject to examination by taxing authorities throughout the world. The following table summarizes the tax years subject to income tax examinations by tax authorities as of March 31, 2022. The years subject to income tax examination in our foreign jurisdictions cover the maximum time period with respect to these jurisdictions. Due to NOLs, in some cases the tax years continue to remain subject to examination with respect to such NOLs.
|
|
|
|
|
|
| Tax Jurisdiction |
Years Subject to Income
Tax Examination |
| U.S. Federal |
2018 - Present |
| Foreign jurisdictions |
2012 - Present |
Commvault Systems, Inc.
Notes to Consolidated Financial Statements — (Continued)
(In thousands, except per share data)
The calculation of our tax liabilities involves dealing with uncertainties in the application of complex tax regulations in each of our tax jurisdictions. The number of years with open tax audits varies depending on the tax jurisdiction. A number of years may lapse before a particular matter is audited and finally resolved. A reconciliation of the amounts of unrecognized tax benefits is as follows:
|
|
|
|
|
|
| Balance at March 31, 2019 |
$ |
1,592 |
|
| Additions for tax positions related to fiscal 2020 |
170 |
|
| Additions for tax positions related to prior years |
— |
|
| Settlements and effective settlements with tax authorities and remeasurements |
— |
|
| Reductions related to the expiration of statutes of limitations |
(100) |
|
| Foreign currency translation adjustment |
— |
|
| Balance at March 31, 2020 |
1,662 |
|
| Additions for tax positions related to fiscal 2021 |
614 |
|
| Additions for tax positions related to prior years |
— |
|
| Settlements and effective settlements with tax authorities and remeasurements |
— |
|
| Reductions related to the expiration of statutes of limitations |
(65) |
|
| Foreign currency translation adjustment |
— |
|
| Balance at March 31, 2021 |
2,211 |
|
| Additions for tax positions related to fiscal 2022 |
2,808 |
|
| Additions for tax positions related to prior years |
90 |
|
| Settlements and effective settlements with tax authorities and remeasurements |
— |
|
| Reductions related to the expiration of statutes of limitations |
(117) |
|
| Additions for tax positions related to purchase accounting |
4,232 |
|
| Foreign currency translation adjustment |
— |
|
| Balance at March 31, 2022 |
$ |
9,224 |
|
We estimate that no significant remaining unrecognized tax benefits will be realized during the fiscal year ending March 31, 2023. Interest income, expense and penalties related to unrecognized tax benefits are recorded in Income tax expense in the Consolidated Statements of Operations. In the year ended March 31, 2022, we recognized interest income of $8 related to the release of reserves. In the years ended March 31, 2021 and 2020, we recognized expense of $9 and $6, respectively, related to interest and penalties.
12. Employee Benefit Plan
We have a defined contribution plan, as allowed under Section 401(k) of the Internal Revenue Code, covering substantially all employees. Effective January 1, 2012, we make contributions equal to a discretionary percentage of the employee’s contributions determined by us. During the years ended March 31, 2022, 2021 and 2020, we made contributions of $2,923, $2,445, and $2,487, respectively.
13. Segment Information
We operate in one segment. Our products and services are sold throughout the world, through direct and indirect sales channels. Our chief operating decision maker (the “CODM”) is the Chief Executive Officer. The CODM makes operating performance assessment and resource allocation decisions on a global basis. The CODM does not receive discrete financial information about asset allocation, expense allocation or profitability by product or geography.
Commvault Systems, Inc.
Notes to Consolidated Financial Statements — (Continued)
(In thousands, except per share data)
Revenues by geography are based upon the billing address of the customer. All transfers between geographic regions have been eliminated from consolidated revenues. The following table sets forth revenue and long-lived assets by geographic area:
|
|
|
|
|
|
|
|
|
|
|
|
|
|
|
|
|
|
|
|
|
| |
|
Year Ended March 31, |
| |
|
2022 |
|
2021 |
|
2020 |
| Revenue: |
|
|
|
|
|
|
| United States |
|
$ |
398,632 |
|
|
$ |
379,106 |
|
|
$ |
342,660 |
|
| Other |
|
370,959 |
|
|
344,366 |
|
|
328,225 |
|
|
|
$ |
769,591 |
|
|
$ |
723,472 |
|
|
$ |
670,885 |
|
No individual country other than the United States accounts for 10% or more of revenues in the years ended March 31, 2022, 2021 and 2020. Revenue included in the “Other” caption above primarily relates to our operations in Europe, Australia, Canada and Asia.
|
|
|
|
|
|
|
|
|
|
|
|
|
|
|
| |
|
March 31, |
| |
|
2022 |
|
2021 |
| Long-lived assets: |
|
|
|
|
| United States |
|
$ |
275,546 |
|
|
$ |
248,386 |
|
| Other |
|
56,453 |
|
|
48,187 |
|
|
|
$ |
331,999 |
|
|
$ |
296,573 |
|
At March 31, 2022 and 2021 no individual country, other than the United States, accounts for 10% or more of long-lived assets.
14. Restructuring
Our restructuring plans are aimed to increase efficiency in our sales, marketing and distribution functions as well as reduce costs across all functional areas. In the fourth quarter of fiscal 2022, we initiated a restructuring plan to combine the management of our EMEA and APJ field organizations. Restructuring charges relate primarily to severance and related costs associated with headcount reductions, stock-based compensation related to modifications of existing unvested awards granted to certain employees impacted by the restructuring plan and lease abandonment charges.
For the years ended March 31, 2022, 2021 and 2020, restructuring charges were comprised of the following:
|
|
|
|
|
|
|
|
|
|
|
|
|
|
|
|
|
|
|
|
|
|
|
Year Ended March 31, |
| |
|
2022 |
|
2021 |
|
2020 |
| Employee severance and related costs |
|
$ |
4,483 |
|
|
$ |
19,040 |
|
|
$ |
16,834 |
|
Lease impairments related costs (1) |
|
— |
|
|
1,684 |
|
|
2,761 |
|
| Stock-based compensation |
|
1,709 |
|
|
2,747 |
|
|
1,753 |
|
| Total restructuring charges |
|
$ |
6,192 |
|
|
$ |
23,471 |
|
|
$ |
21,348 |
|
(1) There were no lease impairment charges for the year ended March 31, 2022. Lease impairment charges relate to seven and six offices for the years ended March 31, 2021 and 2020, respectively.
Commvault Systems, Inc.
Notes to Consolidated Financial Statements — (Continued)
(In thousands, except per share data)
Restructuring accrual
The activity in our restructuring accrual for the years ended March 31, 2022 and 2021 is as follows:
|
|
|
|
|
|
|
|
|
|
|
|
|
|
|
|
|
Year Ended March 31, |
| |
|
2022 |
|
2021 |
| Beginning balance |
|
$ |
3,095 |
|
|
$ |
2,531 |
|
| Employee severance and related costs |
|
4,483 |
|
|
19,040 |
|
| Payments |
|
(5,317) |
|
|
(18,476) |
|
| Ending balance |
|
$ |
2,261 |
|
|
$ |
3,095 |
|
15. Leases
We determine if an arrangement contains a lease at inception. We generally lease our facilities under operating leases. Operating lease right-of-use ("ROU") assets are included in Operating lease assets on our Consolidated Balance Sheets. Current portion of operating lease liabilities and Long-term operating lease liabilities are included on our Consolidated Balance Sheets.
ROU assets represent our right to use an underlying asset for the lease term and lease liabilities represent our obligation to make lease payments arising from the lease. Operating lease ROU assets and liabilities are recognized at the commencement date based on the present value of lease payments over the lease term. As most of our leases do not provide an implicit rate, we generally use our incremental borrowing rate based on the estimated rate of interest for collateralized borrowing over a similar term of the lease payments at the commencement date.
We recognize operating lease costs over the estimated term of the lease, which includes options to extend lease terms that are reasonably certain of being exercised, starting when possession of the property is taken from the landlord. When a lease contains a predetermined fixed escalation of the minimum rent, we recognize the related operating lease cost on a straight-line basis over the lease term. In addition, certain of our lease agreements include variable lease payments, such as estimated tax and maintenance charges. These variable lease payments are excluded from minimum lease payments and are included in the determination of lease cost when it is probable that the expense has been incurred and the amount can be reasonably estimated.
Our lease liabilities relate primarily to operating leases for our global office infrastructure. These operating leases expire at various dates through fiscal 2031. We did not have any material finance leases for either the years ended March 31, 2022 or 2021.
Commvault Systems, Inc.
Notes to Consolidated Financial Statements — (Continued)
(In thousands, except per share data)
Net lease cost recognized in our Consolidated Statements of Operations is summarized as follows:
|
|
|
|
|
|
|
|
|
|
|
|
|
|
|
|
|
|
|
Year Ended March 31, |
|
2022 |
|
2021 |
|
2020 |
| Operating lease cost |
$ |
7,129 |
|
|
$ |
9,048 |
|
|
$ |
8,795 |
|
| Short-term lease cost |
123 |
|
|
232 |
|
|
410 |
|
| Variable lease cost |
1,608 |
|
|
1,938 |
|
|
2,088 |
|
| Net lease cost |
$ |
8,860 |
|
|
$ |
11,218 |
|
|
$ |
11,293 |
|
Cash flow information
|
|
|
|
|
|
|
|
|
|
|
|
|
|
|
|
|
|
|
Year Ended March 31, |
|
2022 |
|
2021 |
|
2020 |
| Cash paid for operating lease liabilities |
$ |
8,277 |
|
|
$ |
10,370 |
|
|
$ |
9,476 |
|
| Additions of operating lease assets (non-cash) |
$ |
1,827 |
|
|
$ |
17,603 |
|
|
$ |
8,448 |
|
As of March 31, 2022, the minimum lease commitment amount for operating leases signed but not yet commenced was immaterial.
As of March 31, 2022, the maturities of lease liabilities based on the total minimum lease commitment amount including options to extend lease terms that are reasonably certain of being exercised are as follows:
|
|
|
|
|
|
| 2023 |
$ |
4,745 |
|
| 2024 |
4,226 |
|
| 2025 |
3,904 |
|
| 2026 |
2,080 |
|
| 2027 |
568 |
|
| Thereafter |
1,846 |
|
| Total minimum lease payments |
$ |
17,369 |
|
| Less: Imputed interest |
1,321 |
|
| Present value of operating lease liabilities |
$ |
16,048 |
|
| Less: Current portion of operating lease liabilities |
4,778 |
|
| Long-term operating lease liabilities |
$ |
11,270 |
|
Lease term and Discount rate
|
|
|
|
|
|
|
|
|
|
|
|
|
Year Ended March 31, |
|
2022 |
|
2021 |
| Weighted-average remaining term (in years) |
4.18 |
|
4.43 |
| Weighted-average discount rate |
4 |
% |
|
4 |
% |
Commvault Systems, Inc.
Notes to Consolidated Financial Statements — (Continued)
(In thousands, except per share data)
16. Revolving Credit Facility
On December 13, 2021, we entered into a five-year $100,000 senior secured revolving credit facility (the “Credit Facility”) with J.P. Morgan. The Credit Facility is available for share repurchases, general corporate purposes, and letters of credit. The Credit Facility contains financial maintenance covenants including a leverage ratio and interest coverage ratio. The Credit Facility also contains certain customary events of default which would permit the lender to, among other things, declare all loans then outstanding to be immediately due and payable if such default is not cured within applicable grace periods. The Credit Facility also limits our ability to incur certain additional indebtedness, create or permit liens on assets, make acquisitions, make investments, loans or advances, sell or transfer assets, pay dividends or distributions, and engage in certain transactions with foreign affiliates. Outstanding borrowings under the Credit Facility accrue interest at an annual rate equal to Secured Overnight Financing Rate plus 1.25% subject to increases based on our actual leverage. The unused balance on the Credit Facility is also subject to a 0.25% annual interest charge subject to increases based on our actual leverage. As of March 31, 2022, there were no borrowings under the Credit Facility and we were in compliance with all covenants.
We have deferred the expense related to debt issuance costs, which are classified as Other assets, and will amortize the costs into interest expense over the term of the Credit Facility. Unamortized amounts at March 31, 2022 were $543. The amortization of debt issuance costs and interest expense incurred for the year ended March 31, 2022 was $109. There was no amortization or expense incurred for the year ended March 31, 2021.
|
|
|
|
|
|
| Item 9. |
Changes in and Disagreements With Accountants on Accounting and Financial Disclosure |
None.
|
|
|
|
|
|
| Item 9A. |
Controls and Procedures |
(a)Evaluation of Disclosure Controls and Procedures
Our management, with the participation of the Chief Executive Officer and Chief Financial Officer, has evaluated the effectiveness of our disclosure controls and procedures, as defined in Rules 13a-15(e) and 15d-15(e) of the Securities Exchange Act of 1934, as of March 31, 2022. Based on that evaluation, the Chief Executive Officer and Chief Financial Officer concluded that our disclosure controls and procedures were effective as of March 31, 2022.
(b)Management’s Report on Internal Control over Financial Reporting
Our management is responsible for establishing and maintaining adequate internal control over our financial reporting as defined in Rules 13a-15(f) of the Exchange Act. There are inherent limitations in the effectiveness of any internal control, including the possibility of human error and the circumvention or overriding of controls. Accordingly, even an effective internal control can provide only reasonable assurance with respect to financial statement preparation. Further, because of changes in conditions, the effectiveness of any internal control may vary over time.
Our management, with the participation of our principal executive officer and principal financial officer, has evaluated the effectiveness of our internal control over financial reporting as of March 31, 2022. In making this assessment, management used the framework set forth by the Committee of Sponsoring Organizations of the Treadway Commission ("COSO") in the 2013 Internal Control—Integrated Framework.
Based on our assessment, using those criteria, our management concluded that, as of March 31, 2022, our internal control over financial reporting was effective. The effectiveness of our internal control over financial reporting as of March 31, 2022 has been audited by Ernst & Young LLP, our independent registered public accounting firm, as stated in their report, which is included below in this Annual Report on Form 10-K.
(c)Changes in Internal Control over Financial Reporting
There was no change in our internal control over financial reporting that occurred during the fourth quarter of fiscal 2022 that has materially affected, or is reasonably likely to materially affect, our internal control over financial reporting.
Report of Independent Registered Public Accounting Firm
To the Board of Directors and Stockholders of Commvault Systems, Inc.
Opinion on Internal Control over Financial Reporting
We have audited Commvault Systems, Inc.’s internal control over financial reporting as of March 31, 2022, based on criteria established in Internal Control—Integrated Framework issued by the Committee of Sponsoring Organizations of the Treadway Commission (2013 framework) (the COSO criteria). In our opinion, Commvault Systems, Inc. (the Company) maintained, in all material respects, effective internal control over financial reporting as of March 31, 2022, based on the COSO criteria.
We also have audited, in accordance with the standards of the Public Company Accounting Oversight Board (United States) (PCAOB), the consolidated balance sheets of the Company as of March 31, 2022 and 2021, the related consolidated statements of operations, comprehensive income (loss), stockholders' equity and cash flows for each of the three years in the period ended March 31, 2022, and the related notes and our report dated May 6, 2022 expressed an unqualified opinion thereon.
Basis for Opinion
The Company’s management is responsible for maintaining effective internal control over financial reporting and for its assessment of the effectiveness of internal control over financial reporting included in the accompanying Management’s Report on Internal Control over Financial Reporting. Our responsibility is to express an opinion on the Company’s internal control over financial reporting based on our audit. We are a public accounting firm registered with the PCAOB and are required to be independent with respect to the Company in accordance with the U.S. federal securities laws and the applicable rules and regulations of the Securities and Exchange Commission and the PCAOB.
We conducted our audit in accordance with the standards of the PCAOB. Those standards require that we plan and perform the audit to obtain reasonable assurance about whether effective internal control over financial reporting was maintained in all material respects.
Our audit included obtaining an understanding of internal control over financial reporting, assessing the risk that a material weakness exists, testing and evaluating the design and operating effectiveness of internal control based on the assessed risk, and performing such other procedures as we considered necessary in the circumstances. We believe that our audit provides a reasonable basis for our opinion.
Definition and Limitations of Internal Control Over Financial Reporting
A company’s internal control over financial reporting is a process designed to provide reasonable assurance regarding the reliability of financial reporting and the preparation of financial statements for external purposes in accordance with generally accepted accounting principles. A company’s internal control over financial reporting includes those policies and procedures that (1) pertain to the maintenance of records that, in reasonable detail, accurately and fairly reflect the transactions and dispositions of the assets of the company; (2) provide reasonable assurance that transactions are recorded as necessary to permit preparation of financial statements in accordance with generally accepted accounting principles, and that receipts and expenditures of the company are being made only in accordance with authorizations of management and directors of the company; and (3) provide reasonable assurance regarding prevention or timely detection of unauthorized acquisition, use, or disposition of the company’s assets that could have a material effect on the financial statements.
Because of its inherent limitations, internal control over financial reporting may not prevent or detect misstatements. Also, projections of any evaluation of effectiveness to future periods are subject to the risk that controls may become inadequate because of changes in conditions, or that the degree of compliance with the policies or procedures may deteriorate.
/s/ Ernst & Young LLP
Iselin, New Jersey
May 6, 2022
|
|
|
|
|
|
| Item 9B. |
Other Information |
None.
|
|
|
|
|
|
| Item 9C. |
Disclosure Regarding Foreign Jurisdictions that Prevent Inspections |
Not applicable.
PART III
|
|
|
|
|
|
| Item 10. |
Directors, Executive Officers and Corporate Governance |
We will furnish to the SEC a definitive Proxy Statement not later than 120 days after the close of the fiscal year ended March 31, 2022. Information with respect to this Item is incorporated herein by reference from the sections of our 2022 Proxy Statement captioned, “Our Board of Directors” and “Corporate Governance”.
Our Board of Directors has adopted a code of business ethics and conduct, which applies to all of our employees. The code of business ethics and conduct is in addition to our code of ethics for senior financial officers. The full texts of our code of business ethics and conduct and our code of ethics for senior financial officers can be found on our website, www.commvault.com.
|
|
|
|
|
|
| Item 11. |
Executive Compensation |
Information with respect to this Item is incorporated herein by reference from the sections of our 2022 Proxy Statement captioned “Executive Compensation” and "Compensation Committee Report".
|
|
|
|
|
|
| Item 12. |
Security Ownership of Certain Beneficial Owners and Management and Related Stockholder Matters |
Information with respect to this Item is incorporated herein by reference from the section of our 2022 Proxy Statement captioned “Security Ownership of Certain Beneficial Ownership and Management”.
Securities Authorized for Issuance under Equity Compensation Plans
The following table provides information as of March 31, 2022 with respect to the shares of our common stock that may be issuable upon the exercise of options, warrants and rights under or existing equity compensation plans. The following information is as of March 31, 2022:
|
|
|
|
|
|
|
|
|
|
|
|
|
|
|
|
|
|
|
|
|
|
|
Number of Securities
to be Issued Upon Exercise of
Outstanding Options,
Warrants and Rights
(a) |
|
Weighted-Average
Exercise Price of
Outstanding
Options, Warrants
and Rights
(b) |
|
Number of Securities
Remaining Available for
Future Issuance Under Equity
Compensation Plans
(Excluding
Securities Reflected in
Column (a))
(c) |
| Equity compensation plans approved by security holders (1) |
|
4,227,157 |
|
|
$ |
60.30 |
|
|
2,089,949 |
|
| Equity compensation plans not approved by security holder |
|
— |
|
|
— |
|
|
— |
|
| Totals |
|
4,227,157 |
|
|
$ |
60.30 |
|
|
2,089,949 |
|
(1)Consists of shares of common stock to be issued upon exercise of outstanding options and vesting of restricted stock awards under our Omnibus Incentive Plan. These amounts do not include potentially issuable shares under the Employee Stock Purchase Plan. We have reserved 3,264 thousand shares for the future issuance of shares under the Employee Stock Purchase Plan.
|
|
|
|
|
|
| Item 13. |
Certain Relationships and Related Transactions, and Director Independence |
Information with respect to this Item is incorporated herein by reference from the sections of our 2022 Proxy Statement captioned “Transactions with Related Persons”, "Corporate Governance - Independence and Composition of our Board of Directors" and "Corporate Governance - The Board of Directors and Its Committees-General".
|
|
|
|
|
|
| Item 14. |
Principal Accountant Fees and Services |
Information with respect to this Item is incorporated herein by reference from the section of our 2022 Proxy Statement captioned “Ratification of the Appointment of Independent Auditors - Audit, Audit-related, Tax and All Other Fees”.
PART IV
|
|
|
|
|
|
| Item 15. |
Exhibits and Financial Statement Schedules |
Financial Statements
See “Index to Consolidated Financial Statements” set forth in Item 8 for a list of financial statements filed as part of this report.
Financial Statement Schedules
All schedules are omitted because they are not required or because the required information is included in the Consolidated Financial Statements or notes thereto.
Exhibits
The following exhibits are incorporated by reference or filed herewith.
|
|
|
|
|
|
| Exhibit No. |
Description |
|
Amended and Restated Certificate of Incorporation of Commvault Systems, Inc., as amended (Incorporated by reference to Exhibit 3.1 to the Registrant’s Form 10-Q for the quarter ended September 30, 2019). |
|
Certificate of Amendment of Amended and Restated Certificate of Incorporation of Commvault Systems, Inc. (Incorporated by reference to Exhibit 3.1 to the Registrant's Form 8-K dated August 28, 2020). |
|
Amended and Restated Bylaws of Commvault Systems, Inc. |
|
Certification of Designation of Series A Junior Participating Preferred Stock of Commvault Systems, Inc. (Incorporated by reference to Exhibit 3.1 to the Registrant’s Form 8-K dated November 14, 2008). |
|
Form of Common Stock Certificate (Incorporated by reference to Exhibit 4.1 to the Registrant’s Registration Statement on Form S-1, Commission File No. 333-132550). |
|
Description of Securities. |
|
Form of Voting Trust Agreement (Incorporated by reference to Exhibit 9.1 to the Registrant’s Registration Statement on Form S-1, Commission File No. 333-132550). |
|
Form of Non-Qualified Stock Option Agreement (Incorporated by reference to Exhibit 10.4 to the Registrant’s Registration Statement on Form S-1, Commission File No. 333-132550). |
|
Form of Restricted Stock Unit Agreement (Incorporated by reference to Exhibit 10.5 to the Registrant’s Annual Report on Form 10-K for the year ended March 31, 2007). |
|
Form of Indemnity Agreement between Commvault Systems, Inc. and each of its current officers and directors. |
|
Commvault Systems, Inc. Employee Stock Purchase Plan dated December 9, 2013 (Incorporated by reference to Exhibit 10.10 to the Registrant’s Annual Report on Form 10-K for the year ended March 31, 2014). |
|
Employment Agreement, dated January 8, 2019, between the Company and Sanjay Mirchandani. (Incorporated by reference to Exhibit 10.1 to the Registrant’s Form 8-K dated February 5, 2019). |
|
Executive Retention and Severance Agreement, dated April 1, 2019, between Commvault Systems, Inc. and Jay Whalen (Incorporated by reference to Exhibit 10.1 to the Registrant’s Form 8-K dated March 31, 2019). |
|
Commvault Systems, Inc. Omnibus Incentive Plan (as amended by the Fifth Amendment thereof) (Incorporated by reference to Exhibit 10.1 to the Registrant's Form 10-Q for the quarter ended September 30, 2021). |
|
Credit Agreement, dated December 13, 2021, by and among Commvault Systems, Inc., the Lenders from time to time party thereto, and JPMorgan Chase Bank, N.A., as Administrative Agent (Incorporated by reference to Exhibit 10.1 to the Registrant's Form 10-Q for the quarter ended December 31, 2021). |
|
Offer Letter, dated April 28, 2022, between the Company and Gary Merrill. (Incorporated by reference to Exhibit 10.1 to the Registrant’s Form 8-K dated May 3, 2022). |
|
List of Subsidiaries of Commvault Systems, Inc. |
|
Consent of Ernst & Young LLP |
|
Certification of Chief Executive Officer Pursuant to Section 302 of the Sarbanes-Oxley Act of 2002 |
|
Certification of Chief Financial Officer Pursuant to Section 302 of the Sarbanes-Oxley Act of 2002 |
|
Certification of Chief Executive Officer Pursuant to Section 906 of the Sarbanes-Oxley Act of 2002 |
|
Certification of Chief Financial Officer Pursuant to Section 906 of the Sarbanes-Oxley Act of 2002 |
| 101.INS |
XBRL Instance Document |
| 101.SCH |
XBRL Taxonomy Extension Schema Document |
| 101.CAL |
XBRL Taxonomy Extension Calculation Linkbase Document |
| 101.DEF |
XBRL Taxonomy Extension Definition Linkbase Document |
| 101.LAB |
XBRL Taxonomy Extension Label Linkbase Document |
| 101.PRE |
XBRL Taxonomy Extension Presentation Linkbase Document |
| 104 |
Cover Page Interactive Data File (formatted as Inline XBRL and contained in Exhibit 101) |
|
|
|
|
|
|
| * |
Management contract or compensatory plan or arrangement. |
| ** |
Furnished herewith. |
|
|
|
|
|
|
| Item 16. |
Form 10-K Summary |
None.
SIGNATURES
Pursuant to the requirements of Section 13 or 15(d) of the Securities Exchange Act of 1934, the registrant has duly caused this report to be signed on its behalf by the undersigned, thereunto duly authorized, in the city of Tinton Falls, State of New Jersey, on May 6, 2022.
|
|
|
|
|
|
| COMMVAULT SYSTEMS, INC. |
|
|
| By: |
/s/ SANJAY MIRCHANDANI |
|
Sanjay Mirchandani |
|
Director, President and Chief Executive Officer |
Pursuant to the requirements of the Securities Exchange Act of 1934, this report has been signed below by the following persons on behalf of the registrant and in the capacities indicated on May 6, 2022.
|
|
|
|
|
|
|
|
|
| Signature |
|
Title |
|
|
| /s/ SANJAY MIRCHANDANI |
|
Director, President and Chief Executive Officer (Principal Executive Officer) |
| Sanjay Mirchandani |
|
| /s/ BRIAN CAROLAN |
|
Chief Financial Officer (Principal Financial Officer) |
| Brian Carolan |
|
| /s/ JAMES WHALEN |
|
Chief Accounting Officer (Principal Accounting Officer) |
| James Whalen |
|
| /s/ NICHOLAS ADAMO |
|
Chairman of the Board |
| Nicholas Adamo |
|
| /s/ MARTHA H. BEJAR |
|
Director |
| Martha H. Bejar |
|
|
| /s/ R. TODD BRADLEY |
|
Director |
| R. Todd Bradley |
|
| /s/ KEITH GEESLIN |
|
Director |
| Keith Geeslin |
|
| /s/ VIVIE LEE |
|
Director |
| Vivie Lee |
|
| /s/ CHARLES E. MORAN |
|
Director |
| Charles E. Moran |
|
| /s/ ALLISON PICKENS |
|
Director |
| Allison Pickens |
|
| /s/ ARLEN SHENKMAN |
|
Director |
| Arlen Shenkman |
|
| /s/ DAVID F. WALKER |
|
Director |
| David F. Walker |
|