|
Delaware
|
001-11015
|
36-1169950
|
|
(State or other jurisdiction
of incorporation)
|
(Commission File Number)
|
(IRS Employer
Identification No.)
|
|
7000 East 1st Avenue
Scottsdale, Arizona
|
85251-4304
|
|
|
(Address of principal executive offices)
|
(Zip Code)
|
| ☐ |
Written communications pursuant to Rule 425 under the Securities Act (17 CFR 230.425)
|
|
☐
|
Soliciting material pursuant to Rule 14a-12 under the Exchange Act (17 CFR 240.14a-12)
|
|
☐
|
Pre-commencement communications pursuant to Rule 14d-2(b) under the Exchange Act (17 CFR 240.14d-2(b))
|
|
☐
|
Pre-commencement communications pursuant to Rule 13e-4(c) under the Exchange Act (17 CFR 240.13e-4(c))
|
|
Title of each class
|
Trading
Symbol(s)
|
Name of each exchange on which registered
|
||
|
Common Stock, $1.50 Par Value
|
VVI
|
New York Stock Exchange
|
|
Exhibit
Number
|
Description
|
|
|
104
|
Cover Page Interactive Data File (embedded within the Inline XBRL document)
|
|
Viad Corp
|
||
|
(Registrant)
|
||
|
November 2, 2023
|
By:
|
/s/ Leslie S. Striedel
|
|
Leslie S. Striedel
|
||
|
Chief Accounting Officer
|
||
|
•
|
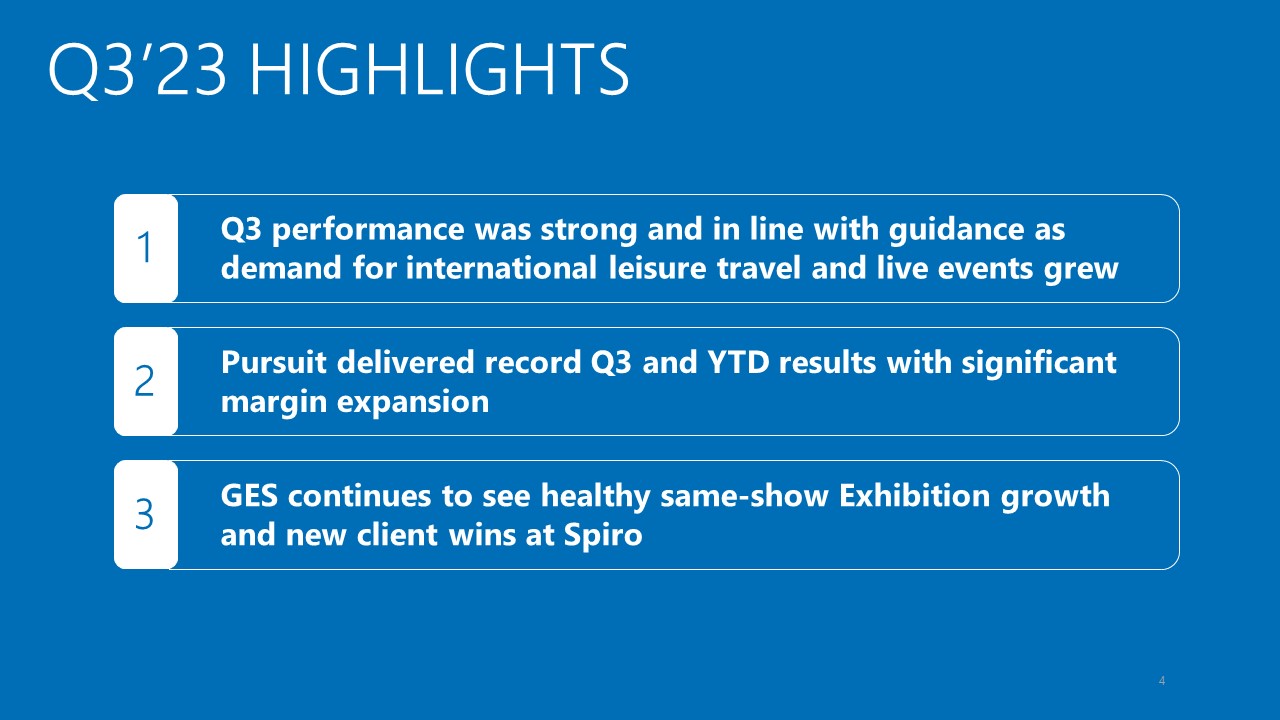
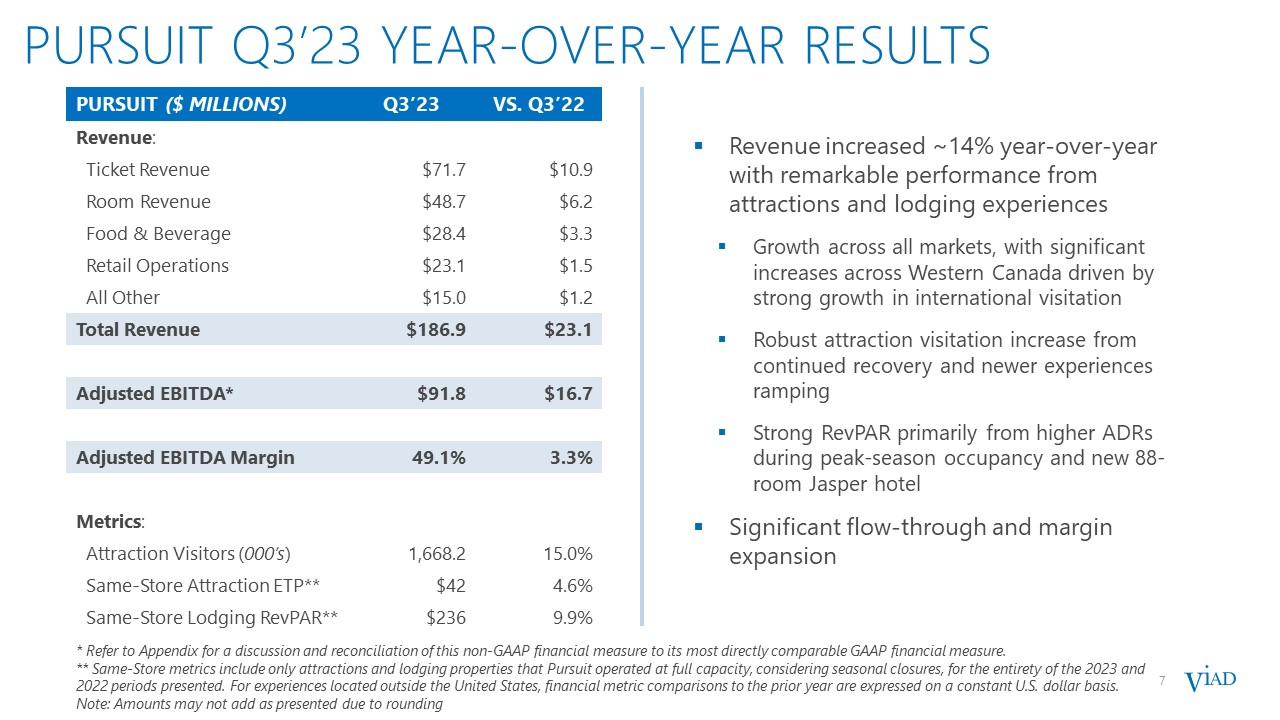
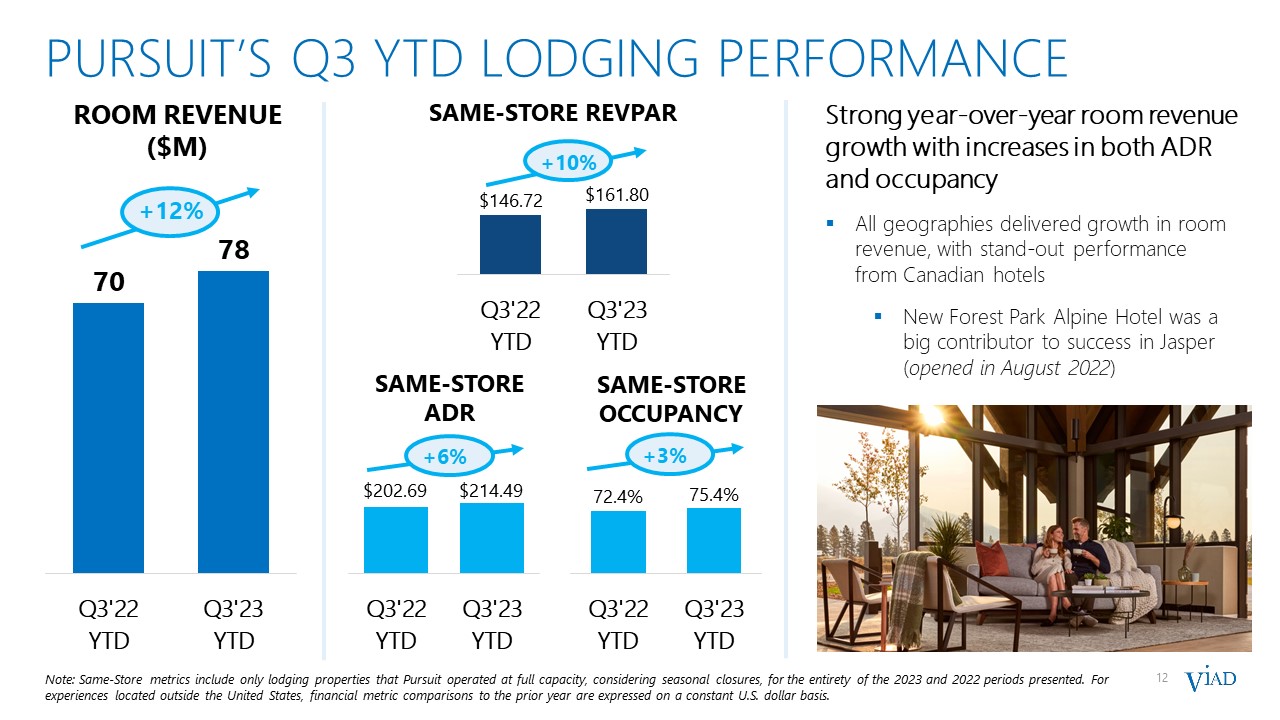
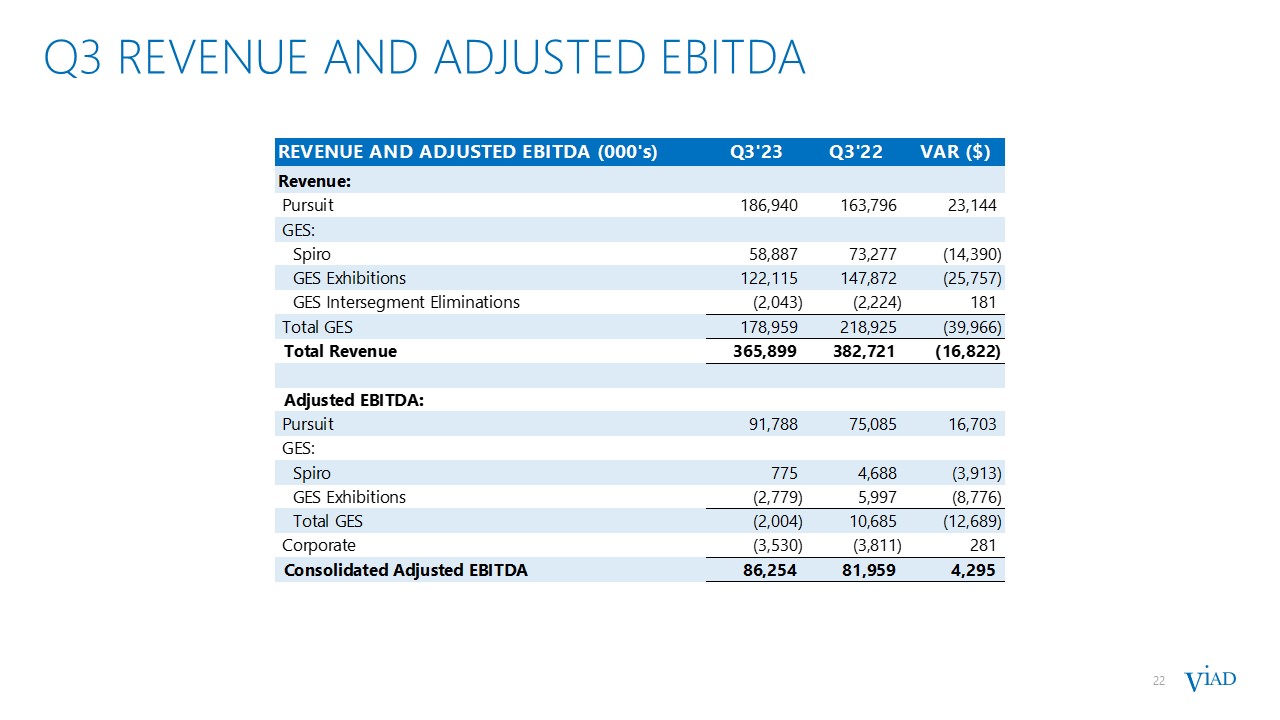
Third quarter performance was strong and in line with guidance as demand for international leisure travel and live events grew
|
|
•
|
Pursuit delivered record results with significant margin expansion
|
|
•
|
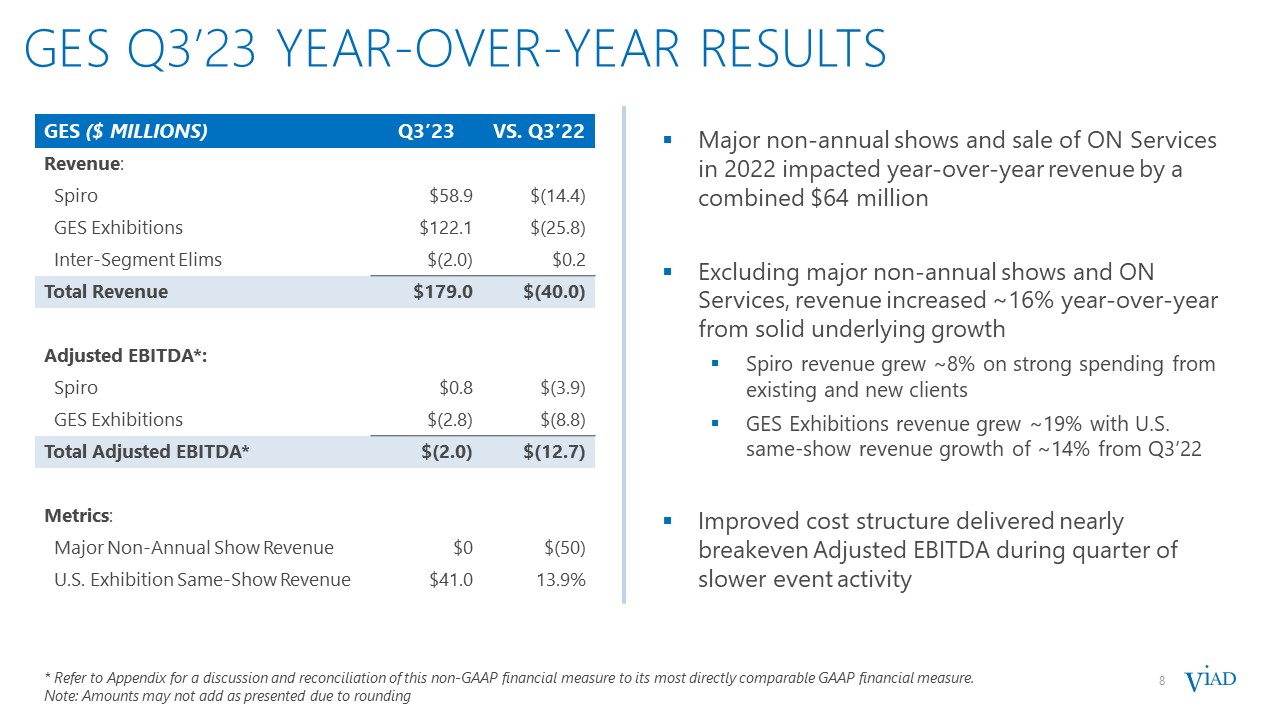
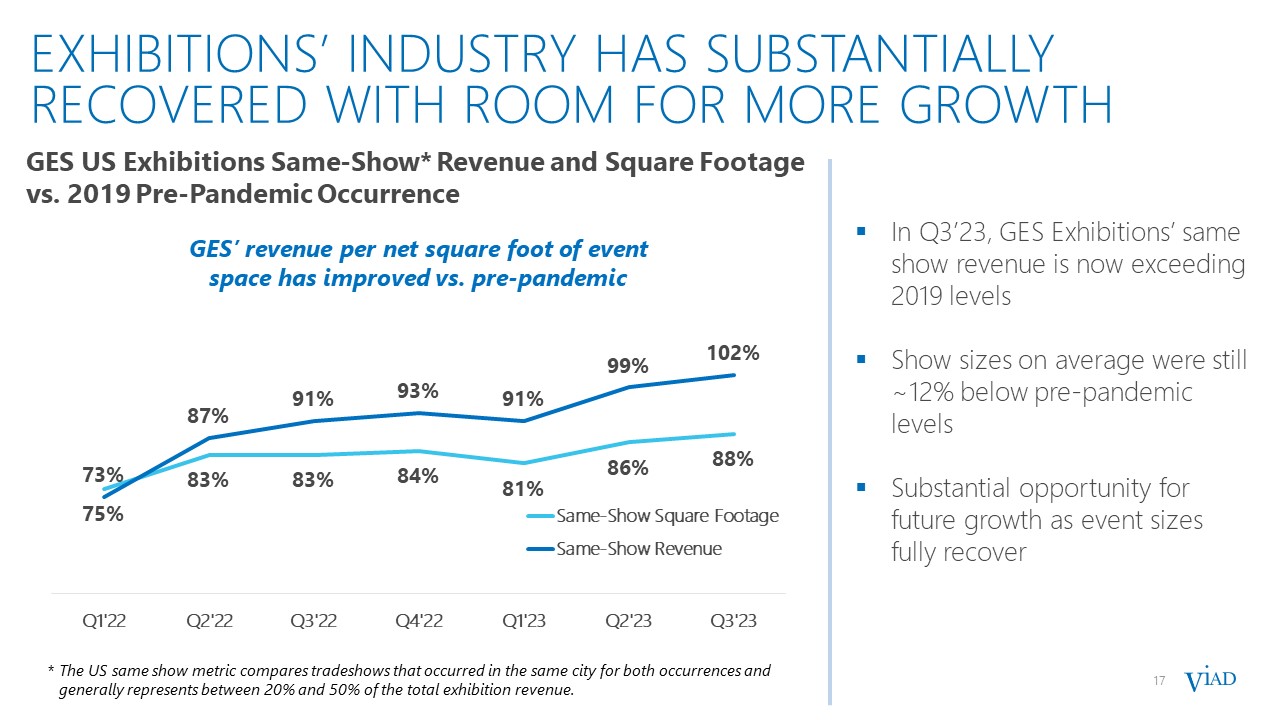
GES continues to see healthy same-show Exhibition growth and new client wins at Spiro
|
|
Three months ended September 30,
|
||||||||||||
|
(in millions)
|
2023
|
2022
|
Change
|
|||||||||
|
Revenue
|
$
|
365.9
|
$
|
382.7
|
$
|
(16.8
|
)
|
|||||
|
Net Income Attributable to Viad
|
$
|
41.3
|
$
|
38.1
|
$
|
3.2
|
||||||
|
Net Income Before Other Items*
|
$
|
43.3
|
$
|
43.4
|
$
|
(0.1
|
)
|
|||||
|
Consolidated Adjusted EBITDA*
|
$
|
86.3
|
$
|
82.0
|
$
|
4.3
|
||||||
|
•
|
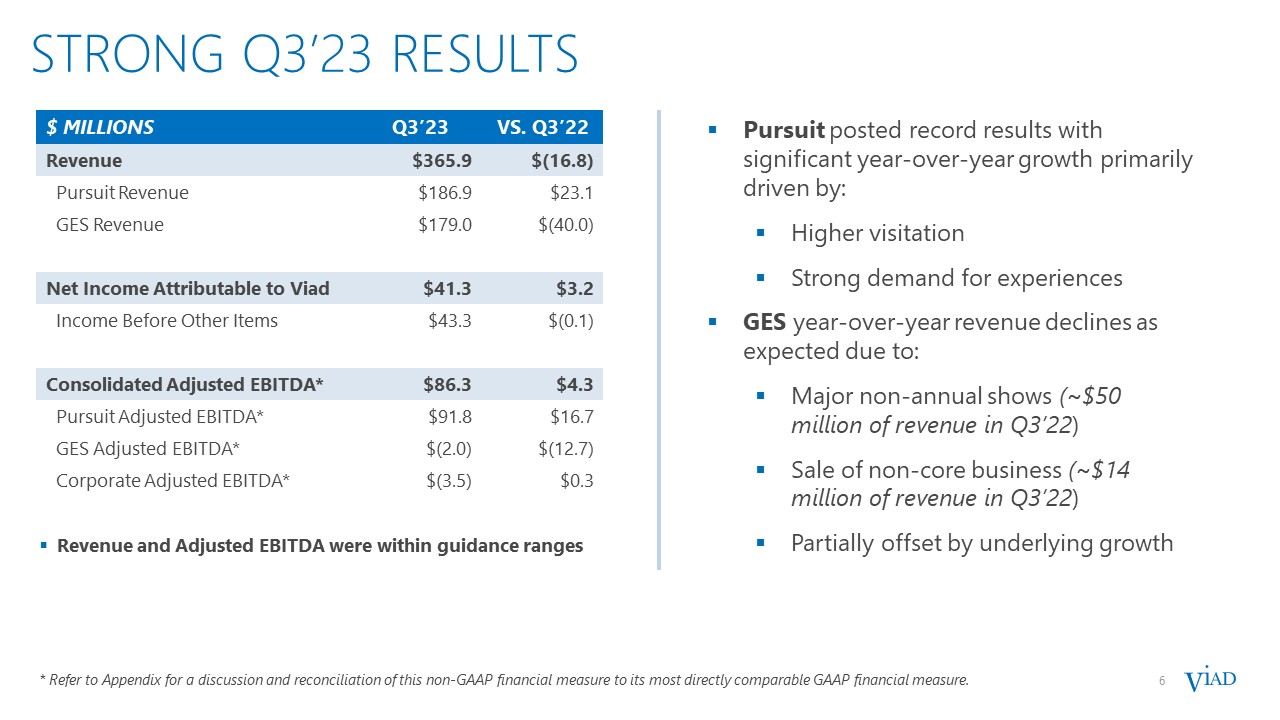
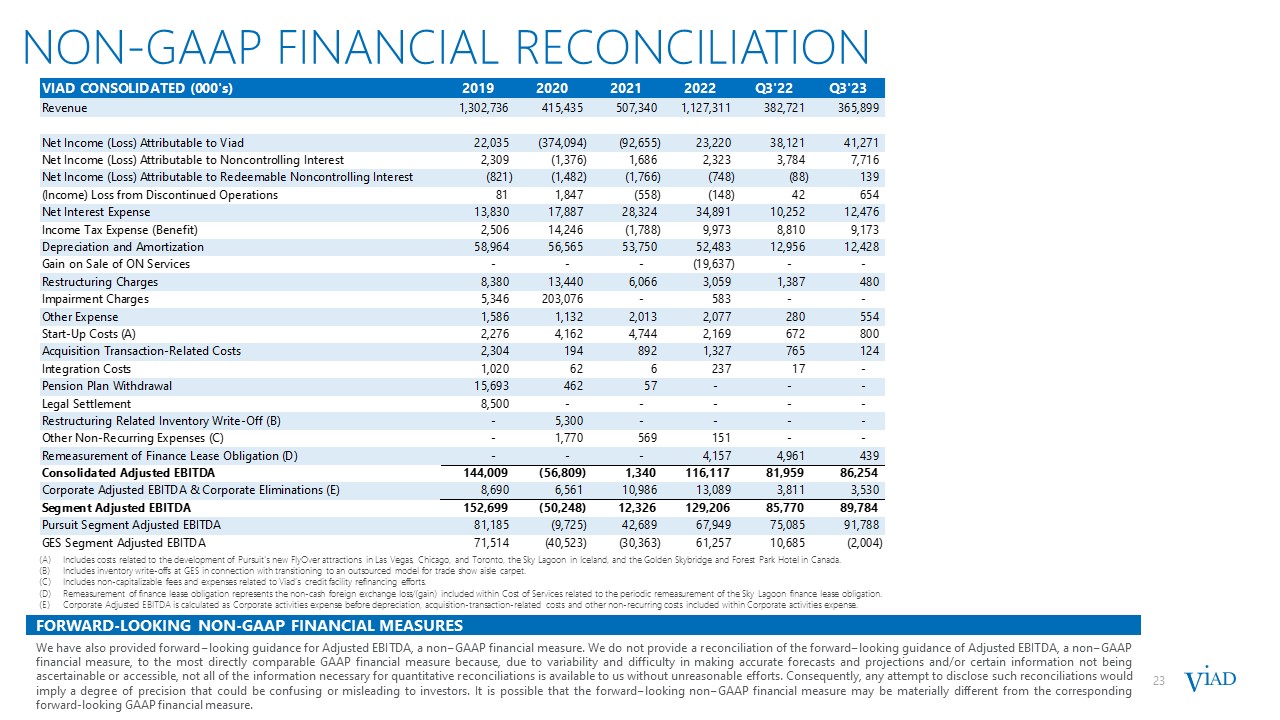
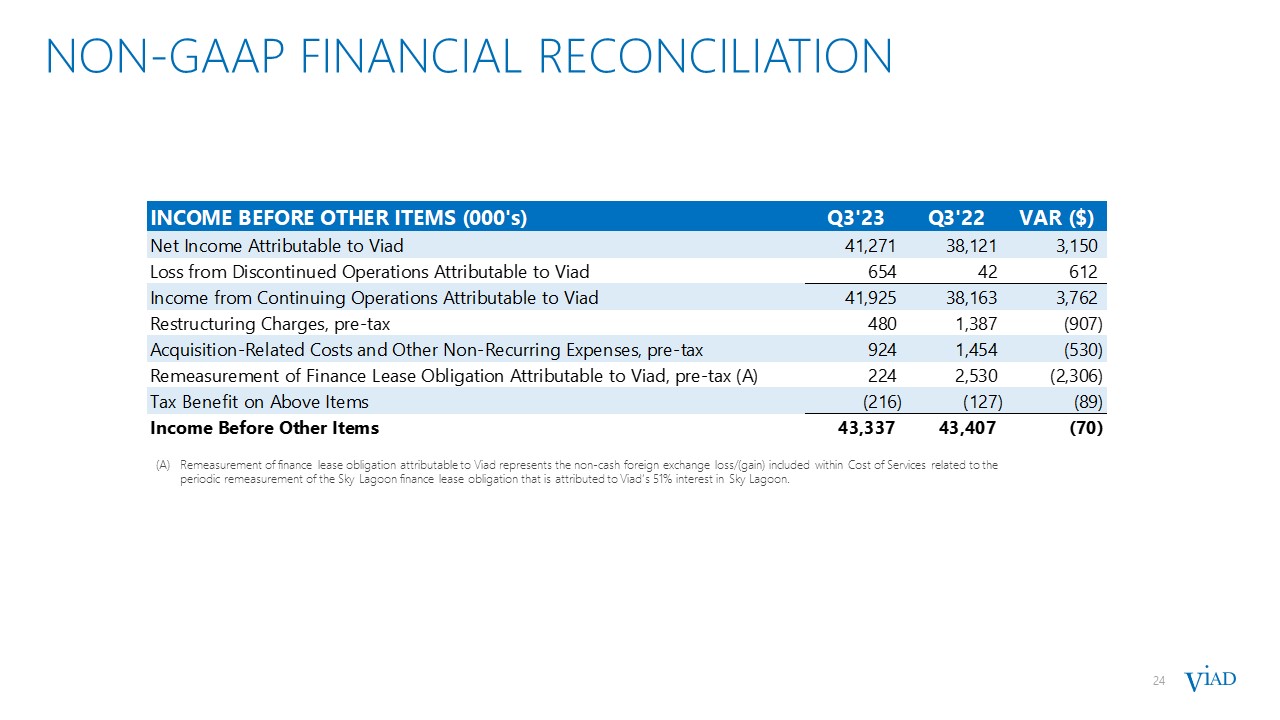
Net income attributable to Viad of $41.3 million increased $3.2 million. Net income before other items of $43.3 million was essentially flat primarily due to higher Adjusted EBITDA, offset by increased
interest expense and income attributable to non-controlling interests.
|
|
•
|
Consolidated adjusted EBITDA* of $86.3 million increased $4.3 million primarily due to strong growth and margin performance at Pursuit.
|
|
•
|
Revenue of $365.9 million decreased $16.8 million primarily due to the timing of major non-annual shows and the sale of our non-core audio visual business, partially offset by strong underlying growth.
|
|
Three months ended September 30,
|
||||||||||||
|
(in millions)
|
2023
|
2022
|
Change
|
|||||||||
|
Revenue
|
$
|
186.9
|
$
|
163.8
|
$
|
23.1
|
||||||
|
Adjusted EBITDA*
|
$
|
91.8
|
$
|
75.1
|
$
|
16.7
|
||||||
|
•
|
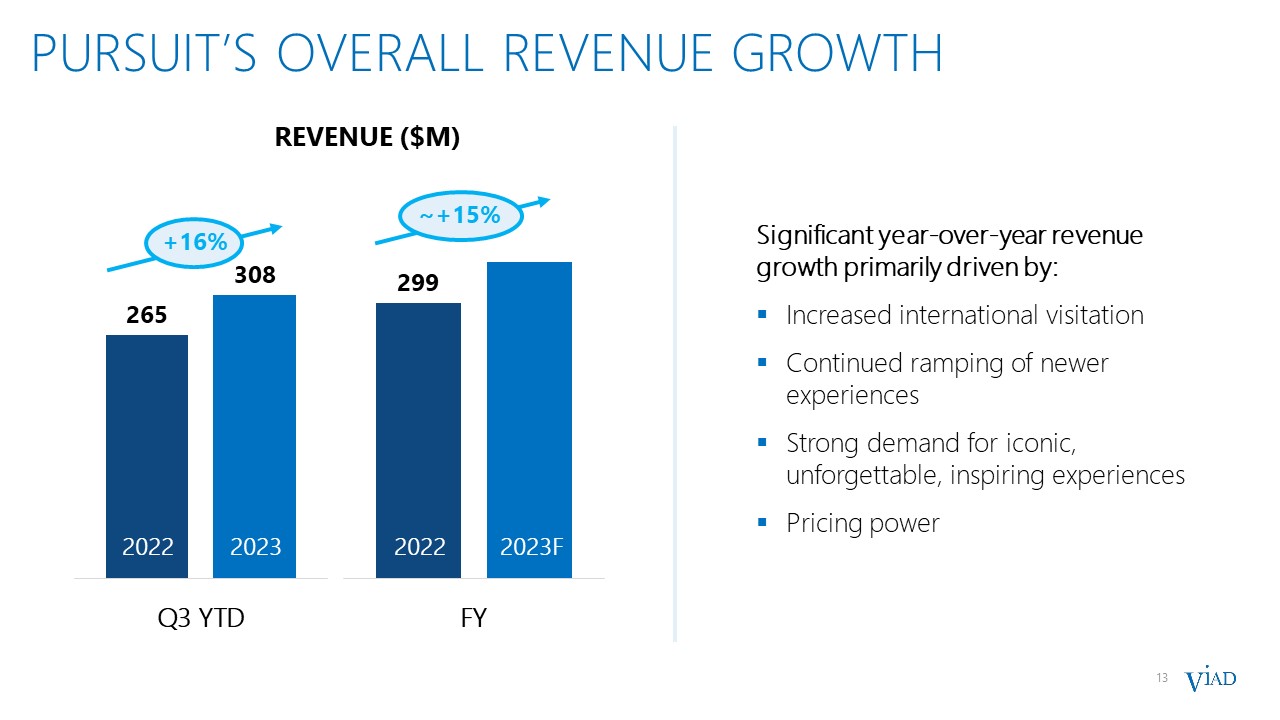
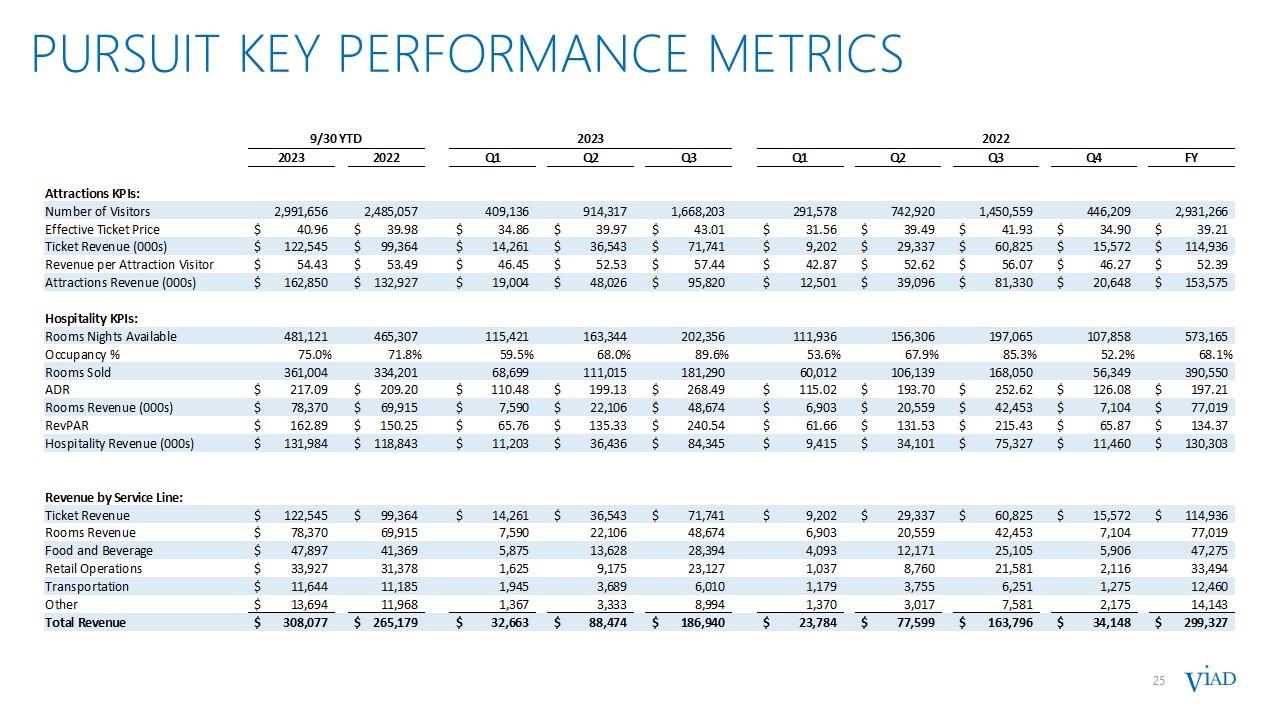
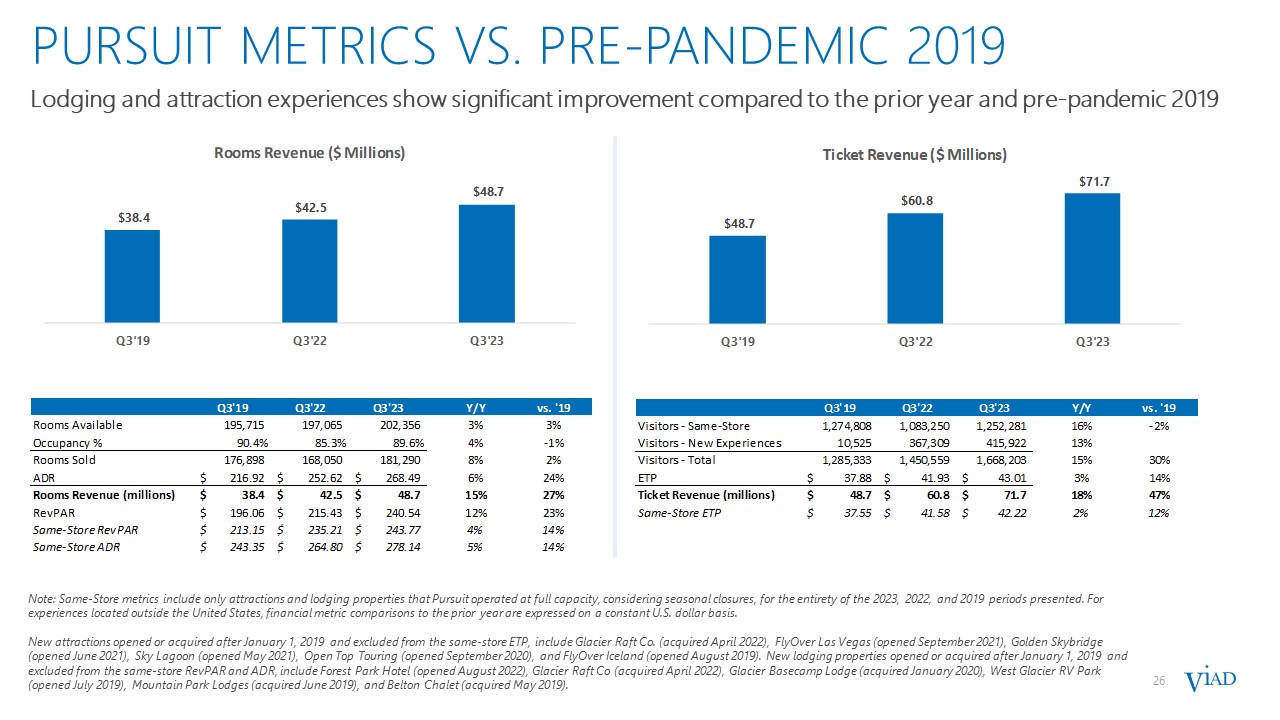
Pursuit revenue of $186.9 million increased $23.1 million (14.1%) from the 2022 third quarter primarily due to higher visitation and revenue management efforts to capture higher revenue per guest.
|
|
•
|
Pursuit adjusted EBITDA of $91.8 million improved by $16.7 million from the 2022 third quarter primarily due to higher revenue and improved margin.
|
|
Three months ended September 30,
|
||||||||||||
|
(in millions)
|
2023
|
2022
|
Change
|
|||||||||
|
Revenue
|
||||||||||||
|
Spiro
|
$
|
58.9
|
$
|
73.3
|
$
|
(14.4
|
)
|
|||||
|
GES Exhibitions
|
122.1
|
147.9
|
(25.8
|
)
|
||||||||
|
Inter-segment Eliminations
|
(2.0
|
)
|
(2.2
|
)
|
0.2
|
|||||||
|
Total GES
|
$
|
179.0
|
$
|
218.9
|
$
|
(40.0
|
)
|
|||||
|
Adjusted EBITDA*
|
||||||||||||
|
Spiro
|
$
|
0.8
|
$
|
4.7
|
$
|
(3.9
|
)
|
|||||
|
GES Exhibitions
|
(2.8
|
)
|
6.0
|
(8.8
|
)
|
|||||||
|
Total GES
|
$
|
(2.0
|
)
|
$
|
10.7
|
$
|
(12.7
|
)
|
||||
|
•
|
Total GES revenue of $179.0 million decreased 18.3% from the 2022 third quarter primarily due to the timing of major non-annual shows and the sale of ON Services, which impacted year-over-year revenue by
approximately $64 million, partially offset by strong underlying growth. Excluding major non-annual shows and ON Services, GES’ revenue grew approximately 16% versus the 2022 third quarter.
|
|
•
|
Total GES adjusted EBITDA of negative $2.0 million decreased by $12.7 million from the 2022 third quarter primarily due to lower revenue.
|
|
(in millions)
|
Fourth Quarter
|
Full Year
|
|
|
Viad Consolidated
|
|||
|
Revenue
|
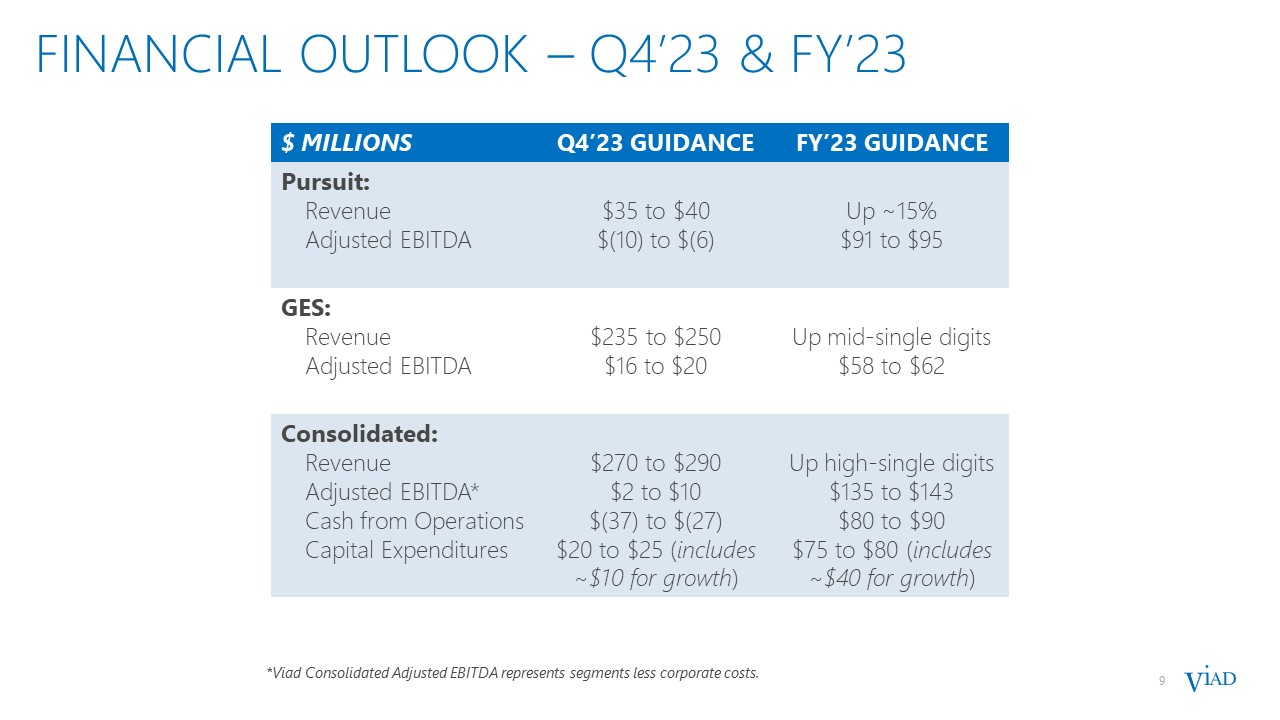
$270 to $290
vs. $248.0 in 2022
|
Up high-single digits
vs. $1,127.3 in 2022
|
|
|
Adjusted EBITDA
|
$2 to $10
vs $(2.0) in 2022
|
$135 to $143
vs. $116.1 in 2022
|
|
|
Cash flow from Operations
|
$(37) to $(27)
|
$80 to $90
|
|
|
Capital Expenditures
|
$20 to $25
(including growth
capex of ~$10)
|
$75 to $80
(including growth
capex of ~$40)
|
|
(in millions)
|
Fourth Quarter
|
Full Year
|
Key Assumptions
|
||||
|
Pursuit
|
|||||||
|
Revenue
|
$35 to $40
|
Up ~15%
|
• |
Revenue growth in 2023 driven by:
|
|||
| vs. $34.1 in 2022 |
vs. $299.3 in 2022 |
o |
Lifting of all COVID restrictions at the Canadian border |
||||
| o |
Acceleration of new experiences |
||||||
| o |
Ongoing focus on improving the guest experience |
||||||
|
Adjusted EBITDA
|
$(10) to $(6)
vs. $(11.3) in 2022
|
$91 to $95
vs. $67.9 in 2022
|
• |
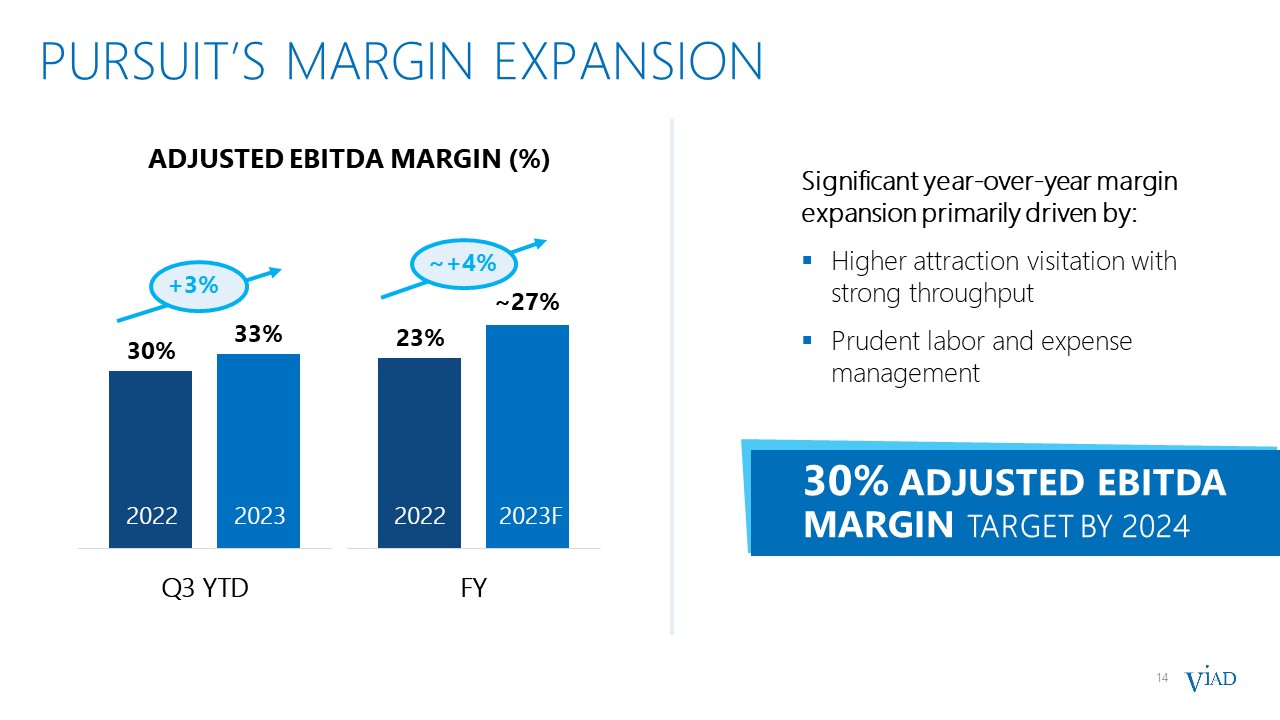
FY margin expands as visitation increases, the performance of newer experiences improves, and pandemic-era cost pressures ease
|
|||
|
(in millions)
|
Fourth Quarter
|
Full Year
|
Key Assumptions
|
||||
|
GES
|
|||||||
|
Revenue
|
$235 to $250
vs. $213.9 in 2022
|
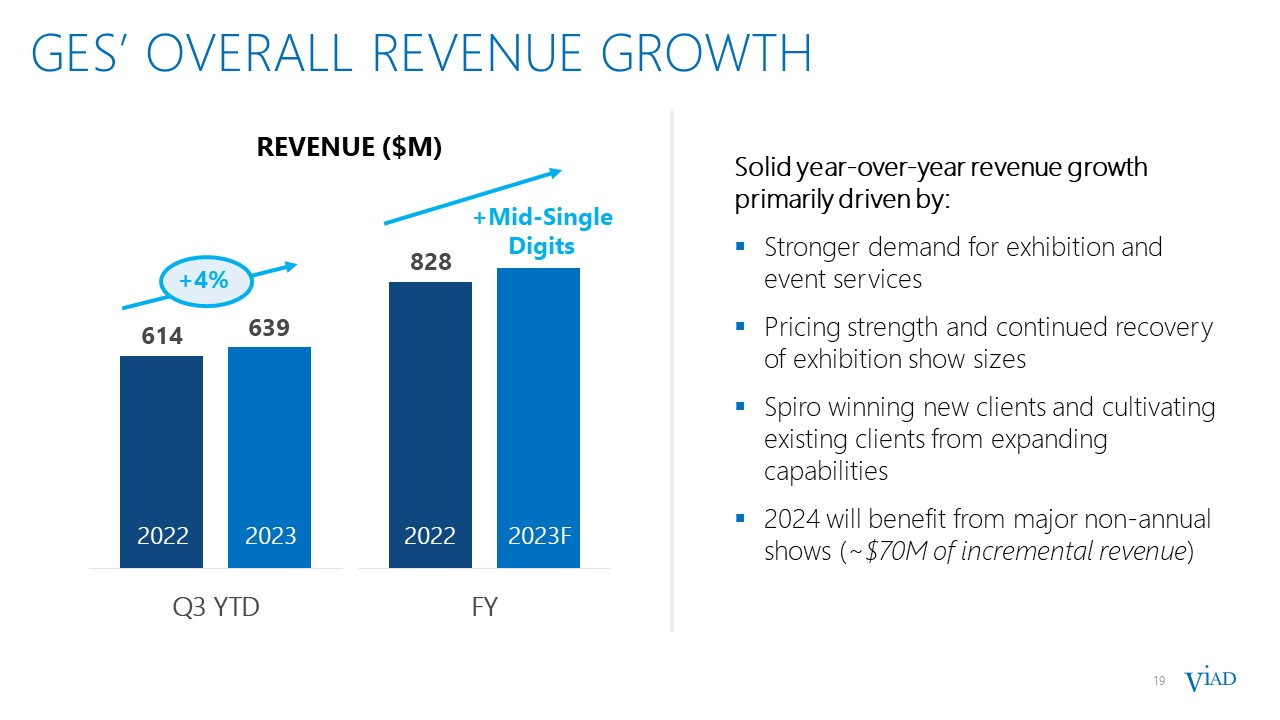
Up mid-single digits
vs. $828.0 in 2022
|
• |
FY revenue growth driven by stronger demand for exhibition and event services and new Spiro wins, partially offset by impact of non-annual shows ($30M for FY)
and the sale of ON Services ($50M for FY)
|
|||
| o |
Exhibitions same show revenue expected to return to
2019 levels |
||||||
| o |
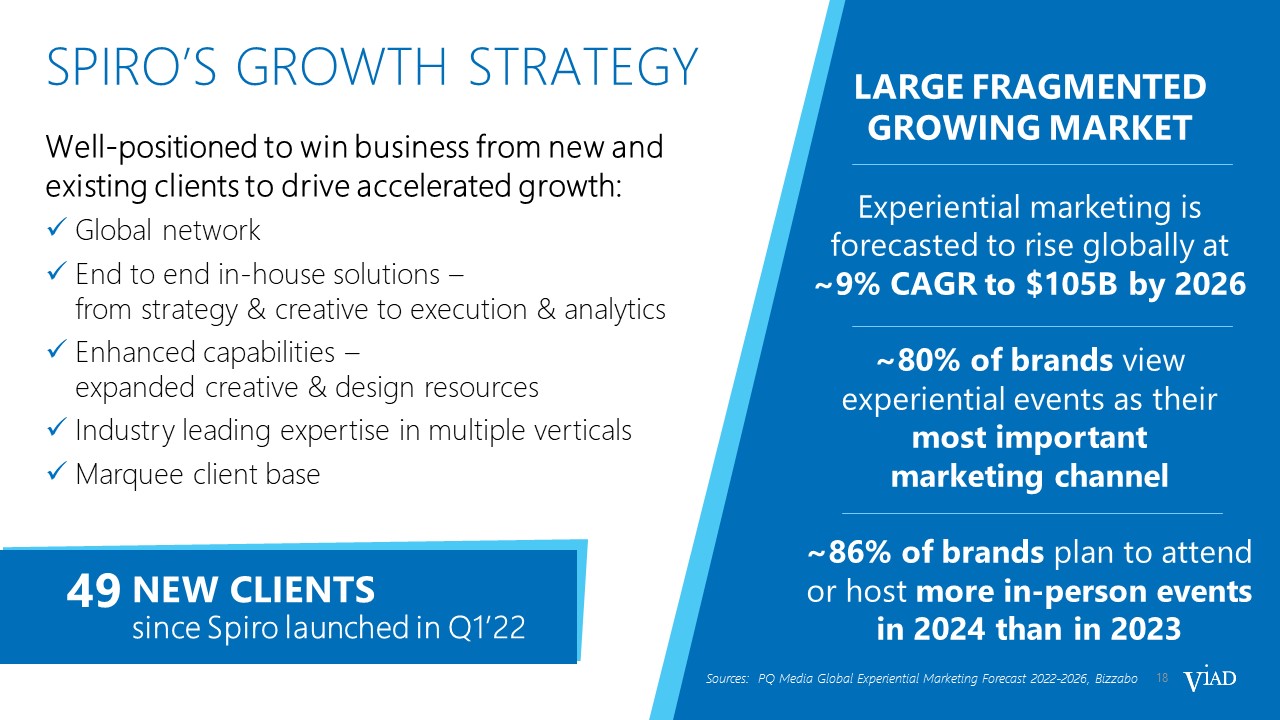
Spiro clients’ marketing spend expected to be similar
to 2022, plus new client wins |
||||||
|
Adjusted EBITDA
|
$16 to $20
vs. $12.7 in 2022
|
$58 to $62
vs. $61.3 in 2022
|
• |
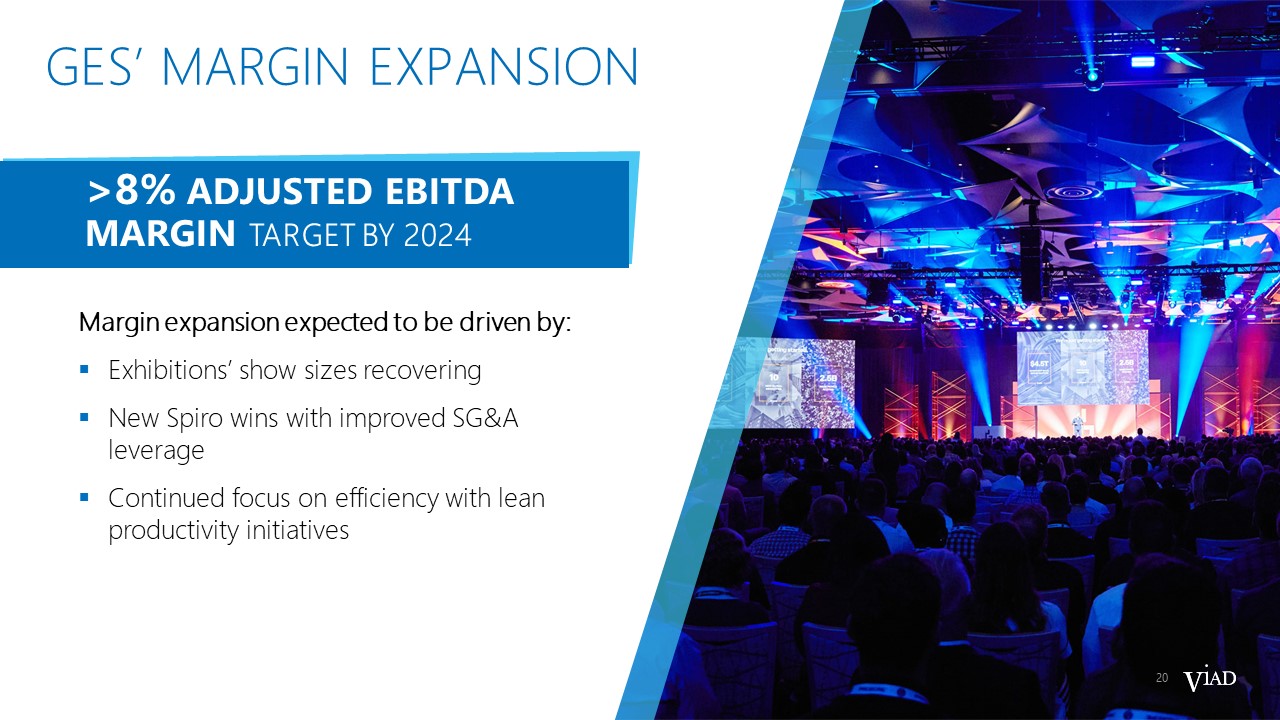
Higher revenue and restaffing of the workforce from pandemic levels plus select investments in talent and capabilities at Spiro to fuel growth
|
|||
|
•
|
general economic uncertainty in key global markets and a worsening of global economic conditions;
|
|
•
|
travel industry disruptions;
|
|
•
|
the impact of our overall level of indebtedness, as well as our financial flexibility;
|
|
•
|
identified material weaknesses in our internal control over financial reporting;
|
|
•
|
seasonality of our businesses;
|
|
•
|
the impact of the COVID-19 pandemic on our financial condition, liquidity, and cash flow;
|
|
•
|
our ability to anticipate and adjust for new and emerging challenges presented by the ramifications of the COVID-19 pandemic on our businesses;
|
|
•
|
unanticipated delays and cost overruns of our capital projects, and our ability to achieve established financial and strategic goals for such projects;
|
|
•
|
our exposure to labor shortages, turnover, and labor cost increases;
|
|
•
|
the importance of key members of our account teams to our business relationships;
|
|
•
|
our ability to manage our business and continue our growth if we lose any of our key personnel;
|
|
•
|
the competitive nature of the industries in which we operate;
|
|
•
|
our dependence on large exhibition event clients;
|
|
•
|
adverse effects of show rotation on our periodic results and operating margins;
|
|
•
|
transportation disruptions and increases in transportation costs;
|
|
•
|
natural disasters, weather conditions, accidents, and other catastrophic events;
|
|
•
|
our exposure to labor cost increases and work stoppages related to unionized employees;
|
|
•
|
our multi-employer pension plan funding obligations;
|
|
•
|
our ability to successfully integrate and achieve established financial and strategic goals from acquisitions;
|
|
•
|
our exposure to cybersecurity attacks and threats;
|
|
•
|
our exposure to currency exchange rate fluctuations;
|
|
•
|
liabilities relating to prior and discontinued operations; and
|
|
•
|
compliance with laws governing the storage, collection, handling, and transfer of personal data and our exposure to legal claims and fines for data breaches or improper handling of
such data.
|
|
VIAD CORP AND SUBSIDIARIES
|
||||||||||||||||||||||||||||||||
|
TABLE ONE - QUARTERLY RESULTS
|
||||||||||||||||||||||||||||||||
|
(UNAUDITED)
|
||||||||||||||||||||||||||||||||
|
Three months ended September 30,
|
Nine months ended September 30,
|
|||||||||||||||||||||||||||||||
|
(in thousands, except per share data)
|
2023
|
2022
|
$ Change
|
% Change
|
2023
|
2022
|
$ Change
|
% Change
|
||||||||||||||||||||||||
|
Revenue:
|
||||||||||||||||||||||||||||||||
|
Pursuit
|
$
|
186,940
|
$
|
163,796
|
$
|
23,144
|
14.1
|
%
|
$
|
308,077
|
$
|
265,179
|
$
|
42,898
|
16.2
|
%
|
||||||||||||||||
|
GES:
|
||||||||||||||||||||||||||||||||
|
Spiro
|
58,887
|
73,277
|
(14,390
|
)
|
-19.6
|
%
|
199,617
|
205,518
|
(5,901
|
)
|
-2.9
|
%
|
||||||||||||||||||||
|
GES Exhibitions
|
122,115
|
147,872
|
(25,757
|
)
|
-17.4
|
%
|
446,146
|
414,303
|
31,843
|
7.7
|
%
|
|||||||||||||||||||||
|
Inter-segment eliminations
|
(2,043
|
)
|
(2,224
|
)
|
181
|
8.1
|
%
|
(6,839
|
)
|
(5,716
|
)
|
(1,123
|
)
|
-19.6
|
%
|
|||||||||||||||||
|
Total GES
|
178,959
|
218,925
|
(39,966
|
)
|
-18.3
|
%
|
638,924
|
614,105
|
24,819
|
4.0
|
%
|
|||||||||||||||||||||
|
Total revenue
|
$
|
365,899
|
$
|
382,721
|
$
|
(16,822
|
)
|
-4.4
|
%
|
$
|
947,001
|
$
|
879,284
|
$
|
67,717
|
7.7
|
%
|
|||||||||||||||
|
Segment operating income (loss):
|
||||||||||||||||||||||||||||||||
|
Pursuit
|
$
|
81,375
|
$
|
59,749
|
$
|
21,626
|
36.2
|
%
|
$
|
72,074
|
$
|
44,122
|
$
|
27,952
|
63.4
|
%
|
||||||||||||||||
|
GES:
|
||||||||||||||||||||||||||||||||
|
Spiro
|
179
|
3,720
|
(3,541
|
)
|
-95.2
|
%
|
11,632
|
18,328
|
(6,696
|
)
|
-36.5
|
%
|
||||||||||||||||||||
|
GES Exhibitions
|
(5,529
|
)
|
2,870
|
(8,399
|
)
|
** |
|
20,235
|
17,788
|
2,447
|
13.8
|
%
|
||||||||||||||||||||
|
Total GES
|
(5,350
|
)
|
6,590
|
(11,940
|
)
|
** |
|
31,867
|
36,116
|
(4,249
|
)
|
-11.8
|
%
|
|||||||||||||||||||
|
Segment operating income
|
$
|
76,025
|
$
|
66,339
|
$
|
9,686
|
14.6
|
%
|
$
|
103,941
|
$
|
80,238
|
$
|
23,703
|
29.5
|
%
|
||||||||||||||||
|
Corporate eliminations
|
17
|
17
|
-
|
0.0
|
%
|
49
|
51
|
(2
|
)
|
-3.9
|
%
|
|||||||||||||||||||||
|
Corporate activities
|
(3,579
|
)
|
(3,768
|
)
|
189
|
5.0
|
%
|
(10,255
|
)
|
(9,881
|
)
|
(374
|
)
|
-3.8
|
%
|
|||||||||||||||||
|
ON Services sale purchase price adjustment
|
-
|
-
|
-
|
** |
|
(204
|
)
|
-
|
(204
|
)
|
** |
|
||||||||||||||||||||
|
Restructuring charges (Note A)
|
(480
|
)
|
(1,387
|
)
|
907
|
65.4
|
%
|
(1,125
|
)
|
(3,467
|
)
|
2,342
|
67.6
|
%
|
||||||||||||||||||
|
Impairment charges
|
-
|
-
|
-
|
** |
|
-
|
(583
|
)
|
583
|
-100.0
|
%
|
|||||||||||||||||||||
|
Other expense, net
|
(554
|
)
|
(280
|
)
|
(274
|
)
|
-97.9
|
%
|
(1,533
|
)
|
(1,530
|
)
|
(3
|
)
|
-0.2
|
%
|
||||||||||||||||
|
Net interest expense (Note B)
|
(12,476
|
)
|
(10,252
|
)
|
(2,224
|
)
|
-21.7
|
%
|
(37,081
|
)
|
(23,890
|
)
|
(13,191
|
)
|
-55.2
|
%
|
||||||||||||||||
|
Income from continuing operations before income taxes
|
58,953
|
50,669
|
8,284
|
16.3
|
%
|
53,792
|
40,938
|
12,854
|
31.4
|
%
|
||||||||||||||||||||||
|
Income tax expense (Note C)
|
(9,173
|
)
|
(8,810
|
)
|
(363
|
)
|
-4.1
|
%
|
(13,623
|
)
|
(9,587
|
)
|
(4,036
|
)
|
-42.1
|
%
|
||||||||||||||||
|
Income from continuing operations
|
49,780
|
41,859
|
7,921
|
18.9
|
%
|
40,169
|
31,351
|
8,818
|
28.1
|
%
|
||||||||||||||||||||||
|
Income (loss) from discontinued operations (Note D)
|
(654
|
)
|
(42
|
)
|
(612
|
)
|
** |
|
(855
|
)
|
285
|
(1,140
|
)
|
** |
|
|||||||||||||||||
|
Net income
|
49,126
|
41,817
|
7,309
|
17.5
|
%
|
39,314
|
31,636
|
7,678
|
24.3
|
%
|
||||||||||||||||||||||
|
Net income attributable to noncontrolling interest
|
(7,716
|
)
|
(3,784
|
)
|
(3,932
|
)
|
** |
|
(8,221
|
)
|
(3,031
|
)
|
(5,190
|
)
|
** |
|
||||||||||||||||
|
Net (income) loss attributable to redeemable noncontrolling interest
|
(139
|
)
|
88
|
(227
|
)
|
** |
|
270
|
354
|
(84
|
)
|
-23.7
|
%
|
|||||||||||||||||||
|
Net income attributable to Viad
|
$
|
41,271
|
$
|
38,121
|
$
|
3,150
|
8.3
|
%
|
$
|
31,363
|
$
|
28,959
|
$
|
2,404
|
8.3
|
%
|
||||||||||||||||
|
Amounts Attributable to Viad:
|
||||||||||||||||||||||||||||||||
|
Income from continuing operations
|
$
|
41,925
|
$
|
38,163
|
$
|
3,762
|
9.9
|
%
|
$
|
32,218
|
$
|
28,674
|
$
|
3,544
|
12.4
|
%
|
||||||||||||||||
|
Income (loss) from discontinued operations (Note D)
|
(654
|
)
|
(42
|
)
|
(612
|
)
|
** |
|
(855
|
)
|
285
|
(1,140
|
)
|
** |
|
|||||||||||||||||
|
Net income
|
$
|
41,271
|
$
|
38,121
|
$
|
3,150
|
8.3
|
%
|
$
|
31,363
|
$
|
28,959
|
$
|
2,404
|
8.3
|
%
|
||||||||||||||||
|
Income per common share attributable to Viad (Note E):
|
||||||||||||||||||||||||||||||||
|
Basic income per common share
|
$
|
1.43
|
$
|
1.30
|
$
|
0.13
|
10.0
|
%
|
$
|
0.93
|
$
|
0.80
|
$
|
0.13
|
16.3
|
%
|
||||||||||||||||
|
Diluted income per common share
|
$
|
1.41
|
$
|
1.29
|
$
|
0.12
|
9.3
|
%
|
$
|
0.92
|
$
|
0.79
|
$
|
0.13
|
16.5
|
%
|
||||||||||||||||
|
Weighted-average common shares outstanding:
|
||||||||||||||||||||||||||||||||
|
Basic weighted-average outstanding common shares
|
20,885
|
20,612
|
273
|
1.3
|
%
|
20,825
|
20,567
|
258
|
1.3
|
%
|
||||||||||||||||||||||
|
Additional dilutive shares related to share-based compensation
|
289
|
277
|
12
|
4.3
|
%
|
200
|
214
|
(14
|
)
|
-6.5
|
%
|
|||||||||||||||||||||
|
Diluted weighted-average outstanding common shares
|
21,174
|
20,889
|
285
|
1.4
|
%
|
21,025
|
20,781
|
244
|
1.2
|
%
|
||||||||||||||||||||||
|
Adjusted EBITDA* by Reportable Segment:
|
||||||||||||||||||||||||||||||||
|
Pursuit
|
$
|
91,788
|
$
|
75,085
|
$
|
16,703
|
22.2
|
%
|
$
|
100,955
|
$
|
79,200
|
$
|
21,755
|
27.5
|
%
|
||||||||||||||||
|
GES:
|
||||||||||||||||||||||||||||||||
|
Spiro
|
775
|
4,688
|
(3,913
|
)
|
-83.5
|
%
|
13,452
|
21,180
|
(7,728
|
)
|
-36.5
|
%
|
||||||||||||||||||||
|
GES Exhibitions
|
(2,779
|
)
|
5,997
|
(8,776
|
)
|
** |
|
28,133
|
27,356
|
777
|
2.8
|
%
|
||||||||||||||||||||
|
Total GES
|
(2,004
|
)
|
10,685
|
(12,689
|
)
|
** |
|
41,585
|
48,536
|
(6,951
|
)
|
-14.3
|
%
|
|||||||||||||||||||
|
Corporate
|
(3,530
|
)
|
(3,811
|
)
|
281
|
7.4
|
%
|
(10,037
|
)
|
(9,613
|
)
|
(424
|
)
|
-4.4
|
%
|
|||||||||||||||||
|
Consolidated Adjusted EBITDA
|
$
|
86,254
|
$
|
81,959
|
$
|
4,295
|
5.2
|
%
|
$
|
132,503
|
$
|
118,123
|
$
|
14,380
|
12.2
|
%
|
||||||||||||||||
|
As of September 30,
|
||||||||||||||||||||||||||||||||
|
Capitalization Data:
|
2023
|
2022
|
$ Change
|
% Change
|
||||||||||||||||||||||||||||
|
Cash and cash equivalents
|
$
|
106,268
|
$
|
79,151
|
$
|
27,117
|
34.3
|
%
|
|
|||||||||||||||||||||||
|
Total debt
|
477,645
|
484,758
|
(7,113
|
)
|
-1.5
|
%
|
|
|
|
|
||||||||||||||||||||||
|
Viad shareholders' equity
|
51,750
|
5,316
|
46,434
|
** |
|
|||||||||||||||||||||||||||
|
Non-controlling interests (redeemable and non-redeemable)
|
94,500
|
86,941
|
7,559
|
8.7
|
%
|
|||||||||||||||||||||||||||
|
Convertible Series A Preferred Stock (Note F):
|
||||||||||||||||||||||||||||||||
|
Convertible preferred stock (including accumulated dividends paid in kind)***
|
141,827
|
141,827
|
-
|
0.0
|
%
|
|||||||||||||||||||||||||||
|
Equivalent number of common shares
|
6,674
|
6,674
|
-
|
0.0
|
%
|
|||||||||||||||||||||||||||
|
* Refer to Table Two for a discussion and reconciliation of this non-GAAP financial measure to its most directly comparable
GAAP financial measure.
|
|||||||||||||||
|
** Change is greater than +/- 100 percent
|
|||||||||||||||
|
*** Amount shown excludes transaction costs, which are netted against the value of the preferred shares when presented on
Viad's balance sheet.
|
|||||||||||||||
|
VIAD CORP AND SUBSIDIARIES
|
|
TABLE ONE - NOTES TO QUARTERLY RESULTS
|
|
(UNAUDITED)
|
|
(A)
|
Restructuring Charges – The decrease in restructuring charges during the three and nine months ended September 30, 2023 was
primarily related to our 2022 transformation and streamlining efforts at GES to significantly reduce costs and create a lower and more flexible cost structure focused on servicing our more profitable market segments.
|
|
(B)
|
Net Interest Expense – The increase in interest expense during the three and nine months ended September 30, 2023 was
primarily due to higher interest rates in 2023, and to a lesser extent to a $1.4 million reduction in capitalized interest recorded during the nine months ended September 30, 2023 as compared to the nine months ended September 30,
2022.
|
|
(C)
|
Income tax expense – The effective tax rate was 15.6% for the three months ended September 30, 2023 and 17.4% for the three
months ended September 30, 2022. The effective tax rate was 25.3% for the nine months ended September 30, 2023 and 23.4% for nine months ended September 30, 2022. The effective rate differed from the 21% federal rate for the three
months ended September 30, 2023 and 2022 as a result of excluding the tax benefit in jurisdictions where we have a valuation allowance and the change in income or loss in those jurisdictions. The effective rate differed from the 21%
federal rate for the nine months ended September 20, 2023 and 2022 also as a result of excluding tax benefits in certain jurisdictions, the mix of income or loss by jurisdiction, partially offset by the $2.1 million benefit taken in
the first quarter of 2023 on certain separate U.S. state jurisdictions.
|
|
(D)
|
Income (Loss) from Discontinued Operations —The loss from discontinued operations during the three and nine months ended
September 30, 2023 was primarily due to legal matters related to previously sold operations.
|
|
(E)
|
Income (Loss) per Common Share — We apply the two-class method in calculating income (loss) per common share as preferred
stock and unvested share-based payment awards that contain nonforteitable rights to dividends are considered participating securities. Accordingly, such securities are included in the earnings allocation in calculating income per
share.
|
|
Diluted income (loss) per common share is calculated using the more dilutive of the two-class method or as-converted method.
The two-class method uses net income (loss) available to common stockholders and assumes conversion of all potential shares other than participating securities. The as-converted method uses net income (loss) available to common
shareholders and assumes conversion of all potential shares including participating securities. Dilutive potential common shares include outstanding stock options, unvested restricted share units and convertible preferred stock.
|
|
|
Additionally, the adjustment to the carrying value of redeemable non-controlling interests is reflected in income (loss) per
common share.
|
|
| The components of basic and diluted income (loss) per share are as follows: |
|
Three months ended September 30,
|
Nine months ended September 30,
|
|||||||||||||||||||||||||||||||
|
(in thousands)
|
2023
|
2022
|
$ Change
|
% Change
|
2023
|
2022
|
$ Change
|
% Change
|
||||||||||||||||||||||||
|
Net income attributable to Viad
|
$
|
41,271
|
$
|
38,121
|
$
|
3,150
|
8.3
|
%
|
$
|
31,363
|
$
|
28,959
|
$
|
2,404
|
8.3
|
%
|
||||||||||||||||
|
Convertible preferred stock dividends paid in cash
|
(1,950
|
)
|
(1,950
|
)
|
-
|
0.0
|
%
|
(5,850
|
)
|
(5,850
|
)
|
-
|
0.0
|
%
|
||||||||||||||||||
|
Adjustment to the redemption value of redeemable noncontrolling interest
|
-
|
-
|
-
|
** |
|
-
|
(763
|
)
|
763
|
-100.0
|
%
|
|||||||||||||||||||||
|
Undistributed income attributable to Viad
|
39,321
|
36,171
|
3,150
|
8.7
|
%
|
25,513
|
22,346
|
3,167
|
14.2
|
%
|
||||||||||||||||||||||
|
Less: Allocation to participating securities
|
(9,522
|
)
|
(9,368
|
)
|
(154
|
)
|
-1.6
|
%
|
(6,194
|
)
|
(5,991
|
)
|
(203
|
)
|
-3.4
|
%
|
||||||||||||||||
|
Net income allocated to Viad common shareholders (basic)
|
$
|
29,799
|
$
|
26,803
|
$
|
2,996
|
11.2
|
%
|
$
|
19,319
|
$
|
16,355
|
$
|
2,964
|
18.1
|
%
|
||||||||||||||||
|
Add: Allocation to participating securities
|
98
|
94
|
-
|
4.3
|
%
|
44
|
46
|
-
|
-4.3
|
%
|
||||||||||||||||||||||
|
Net income allocated to Viad common shareholders (diluted)
|
$
|
29,897
|
$
|
26,897
|
$
|
2,996
|
11.2
|
%
|
$
|
19,363
|
$
|
16,401
|
$
|
2,964
|
18.1
|
%
|
||||||||||||||||
|
Basic weighted-average outstanding common shares
|
20,885
|
20,612
|
273
|
1.3
|
%
|
20,825
|
20,567
|
258
|
1.3
|
%
|
||||||||||||||||||||||
|
Additional dilutive shares related to share-based compensation
|
289
|
277
|
12
|
4.3
|
%
|
200
|
214
|
(14
|
)
|
-6.5
|
%
|
|||||||||||||||||||||
|
Diluted weighted-average outstanding common shares
|
21,174
|
20,889
|
285
|
1.4
|
%
|
21,025
|
20,781
|
244
|
1.2
|
%
|
||||||||||||||||||||||
|
(F)
|
Convertible Series A Preferred Stock — On August 5, 2020, we entered into an Investment Agreement with funds managed by
private equity firm Crestview Partners, relating to the issuance of 135,000 shares of newly issued Convertible Series A Preferred Stock, par value $0.01 per share, for an aggregate purchase price of $135 million or $1,000 per share.
The Convertible Series A Preferred Stock carries a 5.5% cumulative quarterly dividend, which is payable in cash or in-kind at Viad’s option and is convertible into shares of our common stock at a conversion price of $21.25 per share.
|
|
VIAD CORP AND SUBSIDIARIES
|
|||||||||||||||||
|
TABLE TWO - NON-GAAP FINANCIAL MEASURES
|
|||||||||||||||||
|
(UNAUDITED)
|
|||||||||||||||||
|
IMPORTANT DISCLOSURES REGARDING NON-GAAP FINANCIAL MEASURES
|
|||||||||||||||||
|
This document includes the presentation of "Income (Loss) Before Other Items", "Adjusted EBITDA", "Segment Operating Income
(Loss)", and "Adjusted Segment Operating Income (Loss)", which are supplemental to results presented under accounting principles generally accepted in the United States of America (“GAAP”) and may not be comparable to similarly titled
measures presented by other companies. These non-GAAP measures are utilized by management to facilitate period-to-period comparisons and analysis of Viad’s operating performance and should be considered in addition to, but not as
substitutes for, other similar measures reported in accordance with GAAP. The use of these non-GAAP financial measures is limited, compared to the GAAP measure of net income attributable to Viad, because they do not consider a
variety of items affecting Viad’s consolidated financial performance as reconciled below. Because these non-GAAP measures do not consider all items affecting Viad’s consolidated financial performance, a user of Viad’s financial
information should consider net income attributable to Viad as an important measure of financial performance because it provides a more complete measure of the Company’s performance.
|
|||||||||||||||||
|
Income (Loss) Before Other Items, Segment Operating Income (Loss), and Adjusted Segment Operating Income (Loss) are considered
useful operating metrics, in addition to net income attributable to Viad, as potential variations arising from non-operational expenses/income are eliminated, thus resulting in additional measures considered to be indicative of Viad’s
performance. Management believes that the presentation of Adjusted EBITDA provides useful information to investors regarding Viad’s results of operations for trending, analyzing and benchmarking the performance and value of Viad’s
business. Management also believes that the presentation of Adjusted EBITDA for acquisitions and other major capital projects enables investors to assess how effectively management is investing capital into major corporate development
projects, both from a valuation and return perspective.
|
|
Three months ended September 30,
|
Nine months ended September 30,
|
|||||||||||||||||||||||||||||||
|
(in thousands, except per share data)
|
2023
|
2022
|
$ Change
|
% Change
|
2023
|
2022
|
$ Change
|
% Change
|
||||||||||||||||||||||||
|
Income before other items:
|
||||||||||||||||||||||||||||||||
|
Net income attributable to Viad
|
$
|
41,271
|
$
|
38,121
|
$
|
3,150
|
8.3
|
%
|
$
|
31,363
|
$
|
28,959
|
$
|
2,404
|
8.3
|
%
|
||||||||||||||||
|
(Income) loss from discontinued operations attributable to Viad
|
654
|
42
|
612
|
** |
|
855
|
(285
|
)
|
1,140
|
** |
|
|||||||||||||||||||||
|
Income from continuing operations attributable to Viad
|
41,925
|
38,163
|
3,762
|
9.9
|
%
|
32,218
|
28,674
|
3,544
|
12.4
|
%
|
||||||||||||||||||||||
|
ON Services sale purchase price adjustment, pre-tax
|
-
|
-
|
-
|
** |
|
204
|
-
|
204
|
** |
|
||||||||||||||||||||||
|
Restructuring charges, pre-tax
|
480
|
1,387
|
(907
|
)
|
-65.4
|
%
|
1,125
|
3,467
|
(2,342
|
)
|
-67.6
|
%
|
||||||||||||||||||||
|
Impairment charges, pre-tax
|
-
|
-
|
-
|
** |
|
-
|
583
|
(583
|
)
|
-100.0
|
%
|
|||||||||||||||||||||
|
Acquisition-related costs and other non-recurring expenses, pre-tax (Note A)
|
924
|
1,454
|
(530
|
)
|
-36.5
|
%
|
2,235
|
3,312
|
(1,077
|
)
|
-32.5
|
%
|
||||||||||||||||||||
|
Remeasurement of finance lease obligation attributable to Viad, pre-tax (Note B)
|
224
|
2,530
|
(2,306
|
)
|
-91.1
|
%
|
(599
|
)
|
2,530
|
(3,129
|
)
|
** |
|
|||||||||||||||||||
|
Tax expense (benefit) on above items
|
(216
|
)
|
(127
|
)
|
(89
|
)
|
-70.1
|
%
|
93
|
(265
|
)
|
358
|
** |
|
||||||||||||||||||
|
Favorable tax matters
|
-
|
-
|
-
|
** |
|
(2,103
|
)
|
-
|
(2,103
|
)
|
** |
|
||||||||||||||||||||
|
Income before other items
|
$
|
43,337
|
$
|
43,407
|
$
|
(70
|
)
|
-0.2
|
%
|
$
|
33,173
|
$
|
38,301
|
$
|
(5,128
|
)
|
-13.4
|
%
|
||||||||||||||
|
Income (loss) before other items (as reconciled above)
|
$
|
43,337
|
$
|
43,407
|
$
|
(70
|
)
|
-0.2
|
%
|
$
|
33,173
|
$
|
38,301
|
$
|
(5,128
|
)
|
-13.4
|
%
|
||||||||||||||
|
Convertible preferred stock dividends paid in cash
|
(1,950
|
)
|
(1,950
|
)
|
-
|
0.0
|
%
|
(5,850
|
)
|
(5,850
|
)
|
-
|
0.0
|
%
|
||||||||||||||||||
|
Undistributed income (loss) before other items attributable to Viad (Note C)
|
41,387
|
41,457
|
(70
|
)
|
-0.2
|
%
|
27,323
|
32,451
|
(5,128
|
)
|
-15.8
|
%
|
||||||||||||||||||||
|
Less: Allocation to participating securities (Note D)
|
(9,919
|
)
|
(10,066
|
)
|
147
|
1.5
|
%
|
(6,586
|
)
|
(7,915
|
)
|
1,329
|
16.8
|
%
|
||||||||||||||||||
|
Diluted income (loss) before other items allocated to Viad common shareholders
|
$
|
31,468
|
$
|
31,391
|
$
|
77
|
0.2
|
%
|
$
|
20,737
|
$
|
24,536
|
$
|
(3,799
|
)
|
-15.5
|
%
|
|||||||||||||||
|
Diluted weighted-average outstanding common shares
|
21,174
|
20,889
|
285
|
1.4
|
%
|
21,025
|
20,781
|
244
|
1.2
|
%
|
||||||||||||||||||||||
|
Income (loss) before other items per common share
|
$
|
1.49
|
$
|
1.50
|
$
|
(0.01
|
)
|
-0.7
|
%
|
$
|
0.99
|
$
|
1.18
|
$
|
(0.19
|
)
|
-16.1
|
%
|
|
(A)
|
Acquisition-related costs and other non-recurring expenses include:
|
|
Three months ended September 30,
|
Nine months ended September 30,
|
|||||||||||||||
|
(in thousands)
|
2023
|
2022
|
2023
|
2022
|
||||||||||||
|
Acquisition integration costs - Pursuit1
|
$
|
-
|
$
|
17
|
$
|
30
|
$
|
136
|
||||||||
|
Acquisition transaction-related costs - Pursuit1
|
110
|
834
|
184
|
1,235
|
||||||||||||
|
Acquisition transaction-related costs - Corporate2
|
14
|
(69
|
)
|
17
|
39
|
|||||||||||
|
Attraction start-up costs1, 3
|
800
|
672
|
1,909
|
1,751
|
||||||||||||
|
Other non-recurring expenses2, 4
|
-
|
-
|
95
|
151
|
||||||||||||
|
Acquisition-related and other non-recurring expenses, pre-tax
|
$
|
924
|
$
|
1,454
|
$
|
2,235
|
$
|
3,312
|
||||||||
|
1 Included in segment operating loss
|
|
2 Included in corporate activities
|
|
3 Includes costs related to the development of Pursuit's new FlyOver attractions in Chicago and Toronto, and Forest Park Hotel in Canada.
|
|
4 Includes non-capitalizable fees and expenses related to Viad’s credit facility refinancing efforts.
|
| (B) |
Remeasurement of finance lease obligation attributable to Viad represents the non-cash foreign exchange loss/(gain) included within Cost of Services related to
the periodic remeasurement of the Sky Lagoon finance lease obligation that is attributed to Viad’s 51% interest in Sky Lagoon. |
| (C) |
We exclude the adjustment to the redemption value of redeemable noncontrolling interest from the calculation of income before other items per share as it is a
non-cash adjustment that does not affect net income or loss attributable to Viad. |
| (D) |
Preferred stock and unvested share-based payment awards that contain nonforteitable rights to dividends are considered participating securities. Accordingly,
such securities are included in the earnings allocation in calculating income (loss) before other items per common share unless the effect of such inclusion is anti-dilutive. The following table provides the share data used for
calculating the allocation to participating securities if applicable: |
|
Three months ended September 30,
|
Nine months ended September 30,
|
|||||||||||||||
|
(in thousands)
|
2023
|
2022
|
2023
|
2022
|
||||||||||||
|
Weighted-average outstanding common shares
|
21,174
|
20,889
|
21,025
|
20,781
|
||||||||||||
|
Effect of participating convertible preferred shares (if applicable)
|
6,674
|
6,674
|
6,674
|
6,674
|
||||||||||||
|
Effect of participating non-vested shares (if applicable)
|
-
|
24
|
3
|
30
|
||||||||||||
|
Weighted-average shares including effect of participating interests (if applicable)
|
27,848
|
27,587
|
27,702
|
27,485
|
||||||||||||
|
** Change is greater than +/- 100 percent
|
|
VIAD CORP AND SUBSIDIARIES
|
||||||||||||||||||||||||||||||||
|
TABLE TWO - NON-GAAP FINANCIAL MEASURES (CONTINUED)
|
||||||||||||||||||||||||||||||||
|
(UNAUDITED)
|
||||||||||||||||||||||||||||||||
|
Three months ended September 30,
|
Nine months ended September 30,
|
|||||||||||||||||||||||||||||||
|
($ in thousands)
|
2023
|
2022
|
$ Change
|
% Change
|
2023
|
2022
|
$ Change
|
% Change
|
||||||||||||||||||||||||
|
Viad Consolidated:
|
||||||||||||||||||||||||||||||||
|
Revenue
|
$
|
365,899
|
$
|
382,721
|
$
|
(16,822
|
)
|
-4.4
|
%
|
$
|
947,001
|
$
|
879,284
|
$
|
67,717
|
7.7
|
%
|
|||||||||||||||
|
Net income attributable to Viad
|
$
|
41,271
|
$
|
38,121
|
$
|
3,150
|
8.3
|
%
|
$
|
31,363
|
$
|
28,959
|
$
|
2,404
|
8.3
|
%
|
||||||||||||||||
|
Net income attributable to noncontrolling interest
|
7,716
|
3,784
|
3,932
|
** |
|
8,221
|
3,031
|
5,190
|
** |
|
||||||||||||||||||||||
|
Net income (loss) attributable to redeemable noncontrolling interest
|
139
|
(88
|
)
|
227
|
** |
|
(270
|
)
|
(354
|
)
|
84
|
23.7
|
%
|
|||||||||||||||||||
|
(Income) loss from discontinued operations
|
654
|
42
|
612
|
** |
|
855
|
(285
|
)
|
1,140
|
** |
|
|||||||||||||||||||||
|
Net interest expense
|
12,476
|
10,252
|
2,224
|
21.7
|
%
|
37,081
|
23,890
|
13,191
|
55.2
|
%
|
||||||||||||||||||||||
|
Income tax expense
|
9,173
|
8,810
|
363
|
4.1
|
%
|
13,623
|
9,587
|
4,036
|
42.1
|
%
|
||||||||||||||||||||||
|
Depreciation and amortization
|
12,428
|
12,956
|
(528
|
)
|
-4.1
|
%
|
37,707
|
39,442
|
(1,735
|
)
|
-4.4
|
%
|
||||||||||||||||||||
|
ON Services sale purchase price adjustment
|
-
|
-
|
-
|
** |
|
204
|
-
|
204
|
** |
|
||||||||||||||||||||||
|
Restructuring charges
|
480
|
1,387
|
(907
|
)
|
-65.4
|
%
|
1,125
|
3,467
|
(2,342
|
)
|
-67.6
|
%
|
||||||||||||||||||||
|
Impairment charges
|
-
|
-
|
-
|
** |
|
-
|
583
|
(583
|
)
|
-100.0
|
%
|
|||||||||||||||||||||
|
Other expense
|
554
|
280
|
274
|
97.9
|
%
|
1,533
|
1,530
|
3
|
0.2
|
%
|
||||||||||||||||||||||
|
Start-up costs (A)
|
800
|
672
|
128
|
19.0
|
%
|
1,909
|
1,751
|
158
|
9.0
|
%
|
||||||||||||||||||||||
|
Acquisition transaction-related costs
|
124
|
765
|
(641
|
)
|
-83.8
|
%
|
201
|
1,274
|
(1,073
|
)
|
-84.2
|
%
|
||||||||||||||||||||
|
Integration costs
|
-
|
17
|
(17
|
)
|
-100.0
|
%
|
30
|
136
|
(106
|
)
|
-77.9
|
%
|
||||||||||||||||||||
|
Other non-recurring expenses
|
-
|
-
|
-
|
** |
|
95
|
151
|
(56
|
)
|
-37.1
|
%
|
|||||||||||||||||||||
|
Remeasurement of finance lease obligation (B)
|
439
|
4,961
|
(4,522
|
)
|
-91.2
|
%
|
(1,174
|
)
|
4,961
|
(6,135
|
)
|
** |
|
|||||||||||||||||||
|
Consolidated Adjusted EBITDA
|
$
|
86,254
|
$
|
81,959
|
$
|
4,295
|
5.2
|
%
|
$
|
132,503
|
$
|
118,123
|
$
|
14,380
|
12.2
|
%
|
||||||||||||||||
|
Adjusted EBITDA attributable to noncontrolling interest
|
(11,347
|
)
|
(8,300
|
)
|
(3,047
|
)
|
-36.7
|
%
|
(14,773
|
)
|
(10,704
|
)
|
(4,069
|
)
|
-38.0
|
%
|
||||||||||||||||
|
Consolidated Adjusted EBITDA attributable to Viad
|
$
|
74,907
|
$
|
73,659
|
$
|
1,248
|
1.7
|
%
|
$
|
117,730
|
$
|
107,419
|
$
|
10,311
|
9.6
|
%
|
||||||||||||||||
|
Consolidated Adjusted EBITDA by Business:
|
||||||||||||||||||||||||||||||||
|
Pursuit
|
$
|
91,788
|
$
|
75,085
|
$
|
16,703
|
22.2
|
%
|
$
|
100,955
|
$
|
79,200
|
$
|
21,755
|
27.5
|
%
|
||||||||||||||||
|
Total GES
|
(2,004
|
)
|
10,685
|
(12,689
|
)
|
** |
|
41,585
|
48,536
|
(6,951
|
)
|
-14.3
|
%
|
|||||||||||||||||||
|
Total Segment EBITDA
|
89,784
|
85,770
|
4,014
|
4.7
|
%
|
142,540
|
127,736
|
14,804
|
11.6
|
%
|
||||||||||||||||||||||
|
Corporate EBITDA
|
(3,530
|
)
|
(3,811
|
)
|
281
|
7.4
|
%
|
(10,037
|
)
|
(9,613
|
)
|
(424
|
)
|
-4.4
|
%
|
|||||||||||||||||
|
Consolidated Adjusted EBITDA
|
$
|
86,254
|
$
|
81,959
|
$
|
4,295
|
5.2
|
%
|
$
|
132,503
|
$
|
118,123
|
$
|
14,380
|
12.2
|
%
|
||||||||||||||||
|
Pursuit Adjusted EBITDA:
|
||||||||||||||||||||||||||||||||
|
Revenue
|
$
|
186,940
|
$
|
163,796
|
$
|
23,144
|
14.1
|
%
|
$
|
308,077
|
$
|
265,179
|
$
|
42,898
|
16.2
|
%
|
||||||||||||||||
|
Cost of services and products
|
(105,565
|
)
|
(104,047
|
)
|
(1,518
|
)
|
-1.5
|
%
|
(236,003
|
)
|
(221,057
|
)
|
(14,946
|
)
|
-6.8
|
%
|
||||||||||||||||
|
Segment operating income
|
81,375
|
59,749
|
21,626
|
36.2
|
%
|
72,074
|
44,122
|
27,952
|
63.4
|
%
|
||||||||||||||||||||||
|
Depreciation
|
7,708
|
7,501
|
207
|
2.8
|
%
|
24,121
|
23,149
|
972
|
4.2
|
%
|
||||||||||||||||||||||
|
Amortization
|
1,356
|
1,351
|
5
|
0.4
|
%
|
3,811
|
3,846
|
(35
|
)
|
-0.9
|
%
|
|||||||||||||||||||||
|
Start-up costs (A)
|
800
|
672
|
128
|
19.0
|
%
|
1,909
|
1,751
|
158
|
9.0
|
%
|
||||||||||||||||||||||
|
Acquisition transaction-related costs
|
110
|
834
|
(724
|
)
|
-86.8
|
%
|
184
|
1,235
|
(1,051
|
)
|
-85.1
|
%
|
||||||||||||||||||||
|
Integration costs
|
-
|
17
|
(17
|
)
|
-100.0
|
%
|
30
|
136
|
(106
|
)
|
-77.9
|
%
|
||||||||||||||||||||
|
Remeasurement of finance lease obligation (B)
|
439
|
4,961
|
(4,522
|
)
|
-91.2
|
%
|
(1,174
|
)
|
4,961
|
(6,135
|
)
|
** |
|
|||||||||||||||||||
|
Adjusted EBITDA
|
$
|
91,788
|
$
|
75,085
|
$
|
16,703
|
22.2
|
%
|
$
|
100,955
|
$
|
79,200
|
$
|
21,755
|
27.5
|
%
|
||||||||||||||||
|
Adjusted EBITDA attributable to noncontrolling interest
|
(11,347
|
)
|
(8,300
|
)
|
(3,047
|
)
|
-36.7
|
%
|
(14,773
|
)
|
(10,704
|
)
|
(4,069
|
)
|
-38.0
|
%
|
||||||||||||||||
|
Adjusted EBITDA attributable to Viad
|
$
|
80,441
|
$
|
66,785
|
$
|
13,656
|
20.4
|
%
|
$
|
86,182
|
$
|
68,496
|
$
|
17,686
|
25.8
|
%
|
||||||||||||||||
|
Pursuit Operating margin
|
43.5
|
%
|
36.5
|
%
|
7.1
|
%
|
23.4
|
%
|
16.6
|
%
|
6.8
|
%
|
||||||||||||||||||||
|
Pursuit Adjusted EBITDA margin
|
49.1
|
%
|
45.8
|
%
|
3.3
|
%
|
32.8
|
%
|
29.9
|
%
|
2.9
|
%
|
||||||||||||||||||||
|
Total GES Adjusted EBITDA:
|
||||||||||||||||||||||||||||||||
|
Revenue
|
$
|
178,959
|
$
|
218,925
|
$
|
(39,966
|
)
|
-18.3
|
%
|
$
|
638,924
|
$
|
614,105
|
$
|
24,819
|
4.0
|
%
|
|||||||||||||||
|
Cost of services and products
|
(184,309
|
)
|
(212,335
|
)
|
28,026
|
13.2
|
%
|
(607,057
|
)
|
(577,989
|
)
|
(29,068
|
)
|
-5.0
|
%
|
|||||||||||||||||
|
Segment operating income (loss)
|
(5,350
|
)
|
6,590
|
(11,940
|
)
|
** |
|
31,867
|
36,116
|
(4,249
|
)
|
-11.8
|
%
|
|||||||||||||||||||
|
Depreciation
|
2,357
|
2,970
|
(613
|
)
|
-20.6
|
%
|
6,775
|
9,112
|
(2,337
|
)
|
-25.6
|
%
|
||||||||||||||||||||
|
Amortization
|
989
|
1,125
|
(136
|
)
|
-12.1
|
%
|
2,943
|
3,308
|
(365
|
)
|
-11.0
|
%
|
||||||||||||||||||||
|
Total GES Adjusted EBITDA
|
$
|
(2,004
|
)
|
$
|
10,685
|
$
|
(12,689
|
)
|
** |
|
$
|
41,585
|
$
|
48,536
|
$
|
(6,951
|
)
|
-14.3
|
%
|
|||||||||||||
|
Total GES Operating margin
|
-3.0
|
%
|
3.0
|
%
|
-6.0
|
%
|
5.0
|
%
|
5.9
|
%
|
-0.9
|
%
|
||||||||||||||||||||
|
Total GES Adjusted EBITDA margin
|
-1.1
|
%
|
4.9
|
%
|
-6.0
|
%
|
6.5
|
%
|
7.9
|
%
|
-1.4
|
%
|
||||||||||||||||||||
|
GES Adjusted EBITDA by Reportable Segment:
|
||||||||||||||||||||||||||||||||
|
Spiro
|
$
|
775
|
$
|
4,688
|
$
|
(3,913
|
)
|
-83.5
|
%
|
$
|
13,452
|
$
|
21,180
|
$
|
(7,728
|
)
|
-36.5
|
%
|
||||||||||||||
|
GES Exhibitions
|
(2,779
|
)
|
5,997
|
(8,776
|
)
|
** |
|
28,133
|
27,356
|
777
|
2.8
|
%
|
||||||||||||||||||||
|
Total GES
|
$
|
(2,004
|
)
|
$
|
10,685
|
$
|
(12,689
|
)
|
** |
|
$
|
41,585
|
$
|
48,536
|
$
|
(6,951
|
)
|
-14.3
|
%
|
|||||||||||||
|
Spiro Revenue
|
$
|
58,887
|
$
|
73,277
|
$
|
(14,390
|
)
|
-19.6
|
%
|
$
|
199,617
|
$
|
205,518
|
$
|
(5,901
|
)
|
-2.9
|
%
|
||||||||||||||
|
Spiro Adjusted EBITDA Margin
|
1.3
|
%
|
6.4
|
%
|
-5.1
|
%
|
6.7
|
%
|
10.3
|
%
|
-3.6
|
%
|
||||||||||||||||||||
|
GES Exhibitions Revenue
|
$
|
122,115
|
$
|
147,872
|
$
|
(25,757
|
)
|
-17.4
|
%
|
$
|
446,146
|
$
|
414,303
|
$
|
31,843
|
7.7
|
%
|
|||||||||||||||
|
GES Exhibitions Adjusted EBITDA Margin
|
-2.3
|
%
|
4.1
|
%
|
-6.3
|
%
|
6.3
|
%
|
6.6
|
%
|
-0.3
|
%
|
||||||||||||||||||||
|
(A) Includes costs related to the development of Pursuit's new FlyOver attractions in Chicago and Toronto, and Forest Park
Hotel in Canada.
|
|
(B) Remeasurement of finance lease obligation represents the non-cash foreign exchange loss/(gain) included within Cost of
Services related to the periodic remeasurement of the Sky Lagoon finance lease obligation.
|
|
VIAD CORP AND SUBSIDIARIES
|
||||||||||||||||||||
|
TABLE TWO - NON-GAAP FINANCIAL MEASURES (CONTINUED)
|
||||||||||||||||||||
|
(UNAUDITED)
|
||||||||||||||||||||
|
The following table provides 2022 revenue and Adjusted EBITDA, along with reconciliations of Adjusted EBITDA to the nearest GAAP measure, net
income attributable to Viad.
|
||||||||||||||||||||
|
2022
|
||||||||||||||||||||
|
($ in thousands)
|
First Quarter
|
Second Quarter
|
Third Quarter
|
Fourth Quarter
|
Full Year
|
|||||||||||||||
|
Viad Consolidated:
|
||||||||||||||||||||
|
Net income (loss) attributable to Viad
|
$
|
(29,001
|
)
|
$
|
19,839
|
$
|
38,121
|
$
|
(5,739
|
)
|
$
|
23,220
|
||||||||
|
Net income (loss) attributable to noncontrolling interest
|
(1,204
|
)
|
451
|
3,784
|
(708
|
)
|
2,323
|
|||||||||||||
|
Net loss attributable to redeemable noncontrolling interest
|
(138
|
)
|
(128
|
)
|
(88
|
)
|
(394
|
)
|
(748
|
)
|
||||||||||
|
(Income) loss from discontinued operations
|
(275
|
)
|
(52
|
)
|
42
|
137
|
(148
|
)
|
||||||||||||
|
Net interest expense
|
5,877
|
7,761
|
10,252
|
11,001
|
34,891
|
|||||||||||||||
|
Income tax expense (benefit)
|
(2,582
|
)
|
3,359
|
8,810
|
386
|
9,973
|
||||||||||||||
|
Depreciation and amortization
|
13,279
|
13,207
|
12,956
|
13,041
|
52,483
|
|||||||||||||||
|
Gain on sale of ON Services
|
-
|
-
|
-
|
(19,637
|
)
|
(19,637
|
)
|
|||||||||||||
|
Restructuring charges (recoveries)
|
654
|
1,426
|
1,387
|
(408
|
)
|
3,059
|
||||||||||||||
|
Impairment charges
|
583
|
-
|
-
|
-
|
583
|
|||||||||||||||
|
Other expense
|
638
|
612
|
280
|
547
|
2,077
|
|||||||||||||||
|
Start-up costs (A)
|
431
|
648
|
672
|
418
|
2,169
|
|||||||||||||||
|
Acquisition transaction-related costs
|
418
|
91
|
765
|
53
|
1,327
|
|||||||||||||||
|
Integration costs
|
-
|
119
|
17
|
101
|
237
|
|||||||||||||||
|
Remeasurement of finance lease obligation (B)
|
-
|
-
|
4,961
|
(804
|
)
|
4,157
|
||||||||||||||
|
Other non-recurring expenses (C)
|
8
|
143
|
-
|
-
|
151
|
|||||||||||||||
|
Consolidated Adjusted EBITDA
|
$
|
(11,312
|
)
|
$
|
47,476
|
$
|
81,959
|
$
|
(2,006
|
)
|
$
|
116,117
|
||||||||
|
Consolidated Adjusted EBITDA by Business:
|
||||||||||||||||||||
|
Pursuit
|
$
|
(11,498
|
)
|
$
|
15,613
|
$
|
75,085
|
$
|
(11,251
|
)
|
$
|
67,949
|
||||||||
|
Total GES
|
2,720
|
35,131
|
10,685
|
12,721
|
61,257
|
|||||||||||||||
|
Total Segment EBITDA
|
(8,778
|
)
|
50,744
|
85,770
|
1,470
|
129,206
|
||||||||||||||
|
Corporate EBITDA
|
(2,534
|
)
|
(3,268
|
)
|
(3,811
|
)
|
(3,476
|
)
|
(13,089
|
)
|
||||||||||
|
Consolidated Adjusted EBITDA
|
$
|
(11,312
|
)
|
$
|
47,476
|
$
|
81,959
|
$
|
(2,006
|
)
|
$
|
116,117
|
||||||||
|
Pursuit Adjusted EBITDA:
|
||||||||||||||||||||
|
Revenue
|
$
|
23,784
|
$
|
77,599
|
$
|
163,796
|
$
|
34,148
|
$
|
299,327
|
||||||||||
|
Cost of services and products
|
(44,982
|
)
|
(72,028
|
)
|
(104,047
|
)
|
(54,239
|
)
|
(275,296
|
)
|
||||||||||
|
Segment operating income (loss)
|
(21,198
|
)
|
5,571
|
59,749
|
(20,091
|
)
|
24,031
|
|||||||||||||
|
Depreciation
|
7,782
|
7,866
|
7,501
|
7,926
|
31,075
|
|||||||||||||||
|
Amortization
|
1,179
|
1,316
|
1,351
|
1,175
|
5,021
|
|||||||||||||||
|
Start-up costs (A)
|
431
|
648
|
672
|
418
|
2,169
|
|||||||||||||||
|
Acquisition transaction-related costs
|
308
|
93
|
834
|
24
|
1,259
|
|||||||||||||||
|
Integration costs
|
-
|
119
|
17
|
101
|
237
|
|||||||||||||||
|
Remeasurement of finance lease obligation (B)
|
-
|
-
|
4,961
|
(804
|
)
|
4,157
|
||||||||||||||
|
Adjusted EBITDA
|
$
|
(11,498
|
)
|
$
|
15,613
|
$
|
75,085
|
$
|
(11,251
|
)
|
$
|
67,949
|
||||||||
|
Pursuit Operating margin
|
-89.1
|
%
|
7.2
|
%
|
36.5
|
%
|
-58.8
|
%
|
8.0
|
%
|
||||||||||
|
Pursuit Adjusted EBITDA margin
|
-48.3
|
%
|
20.1
|
%
|
45.8
|
%
|
-32.9
|
%
|
22.7
|
%
|
||||||||||
|
Total GES Adjusted EBITDA:
|
||||||||||||||||||||
|
Revenue
|
$
|
153,576
|
$
|
241,604
|
$
|
218,925
|
$
|
213,879
|
$
|
827,984
|
||||||||||
|
Cost of services and products
|
(155,170
|
)
|
(210,484
|
)
|
(212,335
|
)
|
(205,082
|
)
|
(783,071
|
)
|
||||||||||
|
Segment operating income (loss)
|
(1,594
|
)
|
31,120
|
6,590
|
8,797
|
44,913
|
||||||||||||||
|
Depreciation
|
3,220
|
2,922
|
2,970
|
2,802
|
11,914
|
|||||||||||||||
|
Amortization
|
1,094
|
1,089
|
1,125
|
1,122
|
4,430
|
|||||||||||||||
|
Total GES Adjusted EBITDA
|
$
|
2,720
|
$
|
35,131
|
$
|
10,685
|
$
|
12,721
|
$
|
61,257
|
||||||||||
|
Total GES Operating margin
|
-1.0
|
%
|
12.9
|
%
|
3.0
|
%
|
4.1
|
%
|
5.4
|
%
|
||||||||||
|
Total GES Adjusted EBITDA margin
|
1.8
|
%
|
14.5
|
%
|
4.9
|
%
|
5.9
|
%
|
7.4
|
%
|
||||||||||
|
GES Adjusted EBITDA by Reportable Segment:
|
||||||||||||||||||||
|
Spiro
|
$
|
742
|
$
|
15,750
|
$
|
4,688
|
$
|
5,795
|
$
|
26,975
|
||||||||||
|
GES Exhibitions
|
1,978
|
19,381
|
5,997
|
6,926
|
34,282
|
|||||||||||||||
|
Total GES
|
$
|
2,720
|
$
|
35,131
|
$
|
10,685
|
$
|
12,721
|
$
|
61,257
|
||||||||||
|
Spiro Revenue
|
$
|
42,816
|
$
|
89,425
|
$
|
73,277
|
$
|
72,123
|
$
|
277,641
|
||||||||||
|
Spiro Adjusted EBITDA Margin
|
1.7
|
%
|
17.6
|
%
|
6.4
|
%
|
8.0
|
%
|
9.7
|
%
|
||||||||||
|
GES Exhibitions Revenue
|
$
|
111,831
|
$
|
154,600
|
$
|
147,872
|
$
|
143,577
|
$
|
557,880
|
||||||||||
|
GES Exhibitions Adjusted EBITDA Margin
|
1.8
|
%
|
12.5
|
%
|
4.1
|
%
|
4.8
|
%
|
6.1
|
%
|
||||||||||
|
(A) Includes costs related to the development of Pursuit's new FlyOver attractions in Chicago and Toronto, and Forest Park
Hotel in Canada.
|
|
(B) Remeasurement of finance lease obligation represents the non-cash foreign exchange loss/(gain) included within Cost of
Services related to the periodic remeasurement of the Sky Lagoon finance lease obligation.
|
|
(C) Includes non-capitalizable fees and expenses related to Viad’s credit facility refinancing efforts.
|