| For the fiscal year ended | Dec. 31, 2023 |
Commission file number | 001-15214 | ||||||||
| Title of each class | Trading Symbols | Name of each exchange | ||||||
| on which registered | ||||||||
| Common Shares, no par value | TAC | New York Stock Exchange | ||||||
| Common Share Purchase Rights | TAC | New York Stock Exchange | ||||||
☒ Annual information form |
☒ Audited annual financial statements |
||||
Yes x |
No o |
||||
Yes x |
No o |
||||
| Form | Registration No. | ||||
| S-8 | 333-72454 | ||||
| S-8 | 333-101470 | ||||
| S-8 | 333-236894 | ||||
| S-8 | 333-260935 | ||||
| F-10 | 333-271953 |
||||
| Year Ended Dec. 31 | 2023 | 2022 | ||||||||||||
| Audit Fees | $ | 3,206,475 | $ | 3,175,932 | ||||||||||
Audit-related fees(1) |
1,224,851 | 1,754,943 | ||||||||||||
| Tax fees | 5,850 | 66,050 | ||||||||||||
| All other fees | 39,025 | — | ||||||||||||
| Total | $ | 4,476,201 | $ | 4,996,925 | ||||||||||
| 13.1 | TransAlta Corporation Annual Information Form for the year ended Dec. 31, 2023 | |||||||
| 13.2 | Management’s Discussion and Analysis for the year ended Dec. 31, 2023 | |||||||
| 13.3 | Consolidated Audited Annual Financial Statements for the year ended Dec. 31, 2023 | |||||||
| 13.4 | Management’s Annual Report on Internal Control over Financial Reporting (included on page F2 of Exhibit 13.3 filed herewith) |
|||||||
| 23.1 | Consent of Independent Registered Public Accounting Firm | |||||||
| 31.1 | Certification of President and Chief Executive Officer pursuant to Section 302 of the Sarbanes-Oxley Act of 2002 |
|||||||
| 31.2 | Certification of Chief Financial Officer pursuant to Section 302 of the Sarbanes-Oxley Act of 2002 |
|||||||
| 32.1 | Certification of President and Chief Executive Officer pursuant to Section 906 of the Sarbanes-Oxley Act of 2002 |
|||||||
| 32.2 | Certification of Chief Financial Officer pursuant to Section 906 of the Sarbanes-Oxley Act of 2002 |
|||||||
97 |
Executive Compensation Clawback Policy |
|||||||
| 101 | Interactive Data File (formatted as Inline XBRL) | |||||||
| 104 | Cover Page Interactive Data File (formatted as Inline XBRL and contained in Exhibit 101) | |||||||
| TRANSALTA CORPORATION | |||||
/s/ Todd J. Stack |
|||||
Todd J. Stack |
|||||
| Executive Vice-President, Finance and Chief Financial Officer | |||||
Dated: February 22, 2024 |
|||||
Credit Ratings |
|||||
Dividends |
|||||
Market for Securities |
|||||
2023 Revenues |
2022 Revenues |
|||||||
| Hydro | 16 | % | 20 | % | ||||
| Wind and Solar | 10 | % | 10 | % | ||||
| Gas | 45 | % | 41 | % | ||||
| Energy Transition | 22 | % | 24 | % | ||||
| Energy Marketing | 7 | % | 5 | % | ||||
| Facility Name | Province/ State | Nameplate Capacity (MW)(1) |
Consolidated Interest | Gross Installed Capacity(1) |
Ownership | Net Capacity Ownership Interest (MW)(1) |
Commercial Operation Date(2) |
Revenue Source(3) |
Contract Expiry Date(4) |
||||||||||||||||||||
Alberta - Bow River System |
|||||||||||||||||||||||||||||
Barrier(5)(6) |
AB | 13 | 100 | % | 13 | 100 | % | 13 | 1947 | Merchant | ‑ | ||||||||||||||||||
Bearspaw(5)(6) |
AB | 17 | 100 | % | 17 | 100 | % | 17 | 1954 | Merchant | ‑ | ||||||||||||||||||
Cascade(5)(6) |
AB | 36 | 100 | % | 36 | 100 | % | 36 | 1942, 1957 | Merchant | ‑ | ||||||||||||||||||
Ghost(5)(6) |
AB | 54 | 100 | % | 54 | 100 | % | 54 | 1929, 1954 | Merchant | ‑ | ||||||||||||||||||
Horseshoe(5)(6) |
AB | 14 | 100 | % | 14 | 100 | % | 14 | 1911 | Merchant | ‑ | ||||||||||||||||||
Interlakes(5)(6) |
AB | 5 | 100 | % | 5 | 100 | % | 5 | 1955 | Merchant | ‑ | ||||||||||||||||||
Kananaskis(5)(6) |
AB | 19 | 100 | % | 19 | 100 | % | 19 | 1913, 1951 | Merchant | ‑ | ||||||||||||||||||
Pocaterra(6) |
AB | 15 | 100 | % | 15 | 100 | % | 15 | 1955 | Merchant | ‑ | ||||||||||||||||||
Rundle(5)(6) |
AB | 50 | 100 | % | 50 | 100 | % | 50 | 1951, 1960 | Merchant | ‑ | ||||||||||||||||||
Spray(5)(6) |
AB | 112 | 100 | % | 112 | 100 | % | 112 | 1951, 1960 | Merchant | ‑ | ||||||||||||||||||
Three Sisters(5) |
AB | 3 | 100 | % | 3 | 100 | % | 3 | 1951 | Merchant | ‑ | ||||||||||||||||||
Alberta - Oldman River System |
|||||||||||||||||||||||||||||
Belly River(6) |
AB | 3 | 100 | % | 3 | 100 | % | 3 | 1991 | Merchant | ‑ | ||||||||||||||||||
St. Mary(6) |
AB | 2 | 100 | % | 2 | 100 | % | 2 | 1992 | Merchant | ‑ | ||||||||||||||||||
Taylor(6) |
AB | 13 | 100 | % | 13 | 100 | % | 13 | 2000 | Merchant | ‑ | ||||||||||||||||||
Waterton(6) |
AB | 3 | 100 | % | 3 | 100 | % | 3 | 1992 | Merchant | ‑ | ||||||||||||||||||
Alberta - North Saskatchewan River System(6) |
|||||||||||||||||||||||||||||
Bighorn(5)(6) |
AB | 120 | 100 | % | 120 | 100 | % | 120 | 1972 | Merchant | ‑ | ||||||||||||||||||
Brazeau(5)(6) |
AB | 355 | 100 | % | 355 | 100 | % | 355 | 1965, 1967 | Merchant | ‑ | ||||||||||||||||||
| BC Hydro | |||||||||||||||||||||||||||||
Akolkolex(6) |
BC | 10 | 100 | % | 10 | 100 | % | 10 | 1995 | LTC | 2046 | ||||||||||||||||||
Bone Creek(6) |
BC | 19 | 100 | % | 19 | 100 | % | 19 | 2011 | LTC | 2031 | ||||||||||||||||||
Pingston(6) |
BC | 45 | 50 | % | 22.5 | 100 | % | 23 | 2003, 2004 | LTC | 2043 | ||||||||||||||||||
Upper Mamquam(6) |
BC | 25 | 100 | % | 25 | 100 | % | 25 | 2005 | LTC | 2025 | ||||||||||||||||||
| Ontario Hydro | |||||||||||||||||||||||||||||
Misema |
ON | 3 | 100 | % | 3 | 100 | % | 3 | 2003 | LTC | 2027 | ||||||||||||||||||
Moose Rapids(6) |
ON | 1 | 100 | % | 1 | 100 | % | 1 | 1997 | LTC | 2030 | ||||||||||||||||||
Ragged Chute |
ON | 7 | 100 | % | 7 | 100 | % | 7 | 1991 | LTC | 2029 | ||||||||||||||||||
| Total Hydroelectric Capacity | 944 | 921.5 | 922 | ||||||||||||||||||||||||||
| Facility Name | Province/ State | Nameplate Capacity (MW)(1) |
Consolidated Interest | Gross Installed Capacity(1) |
Ownership | Net Capacity Ownership Interest (MW)(1) |
Commercial Operation Date(2) |
Revenue Source(3) |
Contract Expiry Date(4) |
||||||||||||||||||||
| Alberta Wind | |||||||||||||||||||||||||||||
Ardenville(5) |
AB | 69 | 100 | % | 69 | 100 | % | 69 | 2010 | Merchant | ‑ | ||||||||||||||||||
Blue Trail and Macleod Flats(5) |
AB | 69 | 100 | % | 69 | 100 | % | 69 | 2009 and 2004 | Merchant | ‑ | ||||||||||||||||||
Castle River(5)(6) |
AB | 44 | 100 | % | 44 | 100 | % | 44 | 1997‑2001 | Merchant | - | ||||||||||||||||||
Cowley North(5) |
AB | 20 | 100 | % | 20 | 100 | % | 20 | 2001 | Merchant | ‑ | ||||||||||||||||||
Garden Plain |
AB |
130 | 100 | % | 130 | 100 | % | 130 | 2023 | LTC |
2035-2041 |
||||||||||||||||||
McBride Lake(5) |
AB | 75 | 50 | % | 38 | 100 | % | 38 | 2004 | LTC | 2024 | ||||||||||||||||||
Oldman(5) |
AB | 4 | 100 | % | 4 | 100 | % | 4 | 2007 | Merchant | - | ||||||||||||||||||
Sinnott(5) |
AB | 7 | 100 | % | 7 | 100 | % | 7 | 2001 | Merchant | ‑ | ||||||||||||||||||
Soderglen(5) |
AB | 71 | 50 | % | 36 | 100 | % | 36 | 2006 | Merchant | ‑ | ||||||||||||||||||
Summerview 1(5) |
AB | 68 | 100 | % | 68 | 100 | % | 68 | 2004 | Merchant | ‑ | ||||||||||||||||||
Summerview 2 (5) |
AB | 66 | 100 | % | 66 | 100 | % | 66 | 2010 | Merchant | ‑ | ||||||||||||||||||
Windrise |
AB | 206 | 100 | % | 206 | 100 | % | 206 | 2021 | LTC | 2041 | ||||||||||||||||||
| Alberta Battery Energy Storage | |||||||||||||||||||||||||||||
WindCharger |
AB | 10 | 100 | % | 10 | 100 | % | 10 | 2020 | Merchant | ‑ | ||||||||||||||||||
| Eastern Canada Wind | |||||||||||||||||||||||||||||
Kent Breeze |
ON | 20 | 100 | % | 20 | 100 | % | 20 | 2011 | LTC | 2031 | ||||||||||||||||||
Kent Hills 1 |
NB | 96 | 100 | % | 96 | 83 | % | 80 | 2008 | LTC | 2045 | ||||||||||||||||||
Kent Hills 2 |
NB | 54 | 100 | % | 54 | 83 | % | 45 | 2010 | LTC | 2045 | ||||||||||||||||||
Kent Hills 3 |
NB | 17 | 100 | % | 17 | 83 | % | 14 | 2018 | LTC | 2045 | ||||||||||||||||||
Le Nordais(5)(7) |
QC | 98 | 100 | % | 98 | 100 | % | 98 | 1999 | LTC | 2033 | ||||||||||||||||||
Melancthon 1 |
ON | 68 | 100 | % | 68 | 100 | % | 68 | 2006 | LTC | 2031 | ||||||||||||||||||
Melancthon 2 |
ON | 132 | 100 | % | 132 | 100 | % | 132 | 2008 | LTC | 2028 | ||||||||||||||||||
New Richmond(5) |
QC | 68 | 100 | % | 68 | 100 | % | 68 | 2013 | LTC | 2033 | ||||||||||||||||||
Wolfe Island |
ON | 198 | 100 | % | 198 | 100 | % | 198 | 2009 | LTC | 2029 | ||||||||||||||||||
US Wind |
|||||||||||||||||||||||||||||
Antrim |
NH | 29 | 100 | % | 29 | 100 | % | 29 | 2019 | LTC | 2039 | ||||||||||||||||||
Big Level |
PA | 90 | 100 | % | 90 | 100 | % | 90 | 2019 | LTC | 2034 | ||||||||||||||||||
Lakeswind |
MN | 50 | 100 | % | 50 | 100 | % | 50 | 2014 | LTC | 2034 | ||||||||||||||||||
Skookumchuck Wind |
WA | 137 | 49 | % | 67 | 100 | % | 67 | 2020 | LTC | 2040 | ||||||||||||||||||
Wyoming Wind |
WY | 140 | 100 | % | 140 | 100 | % | 140 | 2003 | LTC | 2028 | ||||||||||||||||||
US Solar |
|||||||||||||||||||||||||||||
Mass Solar (7) |
MA | 21 | 100 | % | 21 | 100 | % | 21 | 2012-2015 | LTC | 2032-2045 | ||||||||||||||||||
North Carolina Solar(7) |
NC | 122 | 100 | % | 122 | 100 | % | 122 | 2019-2021 | LTC | 2033 | ||||||||||||||||||
Australian Solar |
|||||||||||||||||||||||||||||
Northern Goldfields(7) |
WA |
38 | 100 | % | 38 | 100 | % | 38 | 2023 | LTC |
2038 | ||||||||||||||||||
Australia Battery Energy Storage |
|||||||||||||||||||||||||||||
Northern Goldfields Battery |
WA |
10 | 100 | % | 10 | 100 | % | 10 | 2023 | LTC |
2038 | ||||||||||||||||||
Total Wind and Solar Capacity (8) |
2,227 | 2,085 | 2,057 | ||||||||||||||||||||||||||
| Facility Name | Type | Province/ State | Nameplate Capacity (MW)(1) |
Target Commercial Operation Date | Revenue Source | ||||||||||||
| US Facilities | |||||||||||||||||
Horizon Hill |
Wind | OK | 200 | Q1 2024 | LTC | ||||||||||||
White Rock |
Wind | OK | 300 | Q1 2024 | LTC | ||||||||||||
| Total Facilities Under Construction | 500 | ||||||||||||||||
| Facility Name | Province/ State | Nameplate Capacity (MW)(1) |
Consolidated Interest | Gross Installed Capacity(1) |
Ownership | Net Capacity Ownership Interest (MW)(1) |
Commercial Operation Date | Revenue Source(2) |
Contract Expiry Date(3) |
||||||||||||||||||||
| Alberta | |||||||||||||||||||||||||||||
Fort Saskatchewan(4) |
AB | 118 | 60 | % | 71 | 50 | % | 35 | 1999 | LTC/Merchant | 2029 | ||||||||||||||||||
Keephills Unit No. 2 |
AB | 395 | 100 | % | 395 | 100 | % | 395 | 1984 | Merchant | - | ||||||||||||||||||
| Keephills Unit No. 3 | AB | 463 | 100 | % | 463 | 100 | % | 463 | 2011 | Merchant | - | ||||||||||||||||||
Poplar Creek(5) |
AB | 230 | 100 | % | 230 | 100 | % | 230 | 2001 | LTC | 2030 | ||||||||||||||||||
Sheerness Unit No.1(4) |
AB | 400 | 50 | % | 200 | 50 | % | 100 | 1986 | Merchant | - | ||||||||||||||||||
Sheerness Unit No.2(4) |
AB | 400 | 50 | % | 200 | 50 | % | 100 | 1990 | Merchant | - | ||||||||||||||||||
Sundance Unit No. 6 |
AB | 401 | 100 | % | 401 | 100 | % | 401 | 1980 | Merchant | - | ||||||||||||||||||
| Total Alberta Gas Capacity | 2,407 | 1,960 | 1,724 | ||||||||||||||||||||||||||
Ontario and US |
|||||||||||||||||||||||||||||
Ada |
MI | 29 | 100 | % | 29 | 100 | % | 29 | 1991 | LTC | 2026 | ||||||||||||||||||
Ottawa(4) |
ON | 74 | 100 | % | 74 | 50 | % | 37 | 1992 | LTC/Merchant | 2033 | ||||||||||||||||||
Sarnia |
ON | 499 | 100 | % | 499 | 100 | % | 499 | 2003 | LTC | 2031 | ||||||||||||||||||
Windsor(4) |
ON | 72 | 100 | % | 72 | 50 | % | 36 | 1996 | LTC/Merchant | 2031 | ||||||||||||||||||
Total Ontario and US Gas Capacity |
674 | 674 | 601 | ||||||||||||||||||||||||||
| Australia | |||||||||||||||||||||||||||||
Fortescue River Gas Pipeline |
WA |
N/A | 100 | % | N/A | 43 | % | N/A | 2015 | LTC | 2035 | ||||||||||||||||||
Parkeston |
WA |
110 | 50 | % | 55 | 100 | % | 55 | 1996 | LTC/Merchant | 2026 | ||||||||||||||||||
South Hedland |
WA |
150 | 100 | % | 150 | 100 | % | 150 | 2017 | LTC |
2042 | ||||||||||||||||||
Southern Cross (6) |
WA |
245 | 100 | % | 245 | 100 | % | 245 | 1996 | LTC | 2038 | ||||||||||||||||||
Total Australian Gas Capacity |
505 | 450 | 450 | ||||||||||||||||||||||||||
Total Gas Capacity |
3,586 | 3,084 | 2,775 | ||||||||||||||||||||||||||
| Facility Name | Type | Province/ State | Nameplate Capacity (MW) |
Target Commercial Operation Date | Revenue Source | ||||||||||||
Mount Keith 132kV Expansion |
Transmission | WA | N/A |
Q1 2024 | LTC | ||||||||||||
| Facility Name | Province/ State | Nameplate Capacity (MW)(1) |
Consolidated Interest | Gross Installed Capacity(1) |
Ownership | Net Capacity Ownership Interest (MW)(1) |
Commercial Operation Date | Revenue Source | Contract Expiry Date | ||||||||||||||||||||
| US | |||||||||||||||||||||||||||||
| Centralia | WA | 670 | 100 | % | 670 | 100 | % | 670 | 1971 | LTC/Merchant | 2025 | ||||||||||||||||||
Skookumchuck(2) |
WA | 1 | 100 | % | 1 | 100 | % | 1 | 1970 | LTC | 2025 | ||||||||||||||||||
| Total Energy Transition Capacity | 671 | 671 | 671 | ||||||||||||||||||||||||||
| Mine or Operating Name/MSHA Identification Number |
Total Number of Section
104
Violations
for which
Citations
Received
|
Total Number of Orders Issued Under Section 104(b)) |
Total Number of Citations and Orders for Unwarrantable Failure to Comply with Mandatory Health or Safety Standards Under Section 104(d) |
Total Number of Flagrant Violations Under Section 110(b)(2) |
Total Number of Imminent Danger Orders Issued Under Section 107(a) |
Total Dollar
Value of
MSHA
Assessments
Proposed
|
Total
Number
of
Mining
Related
Fatalities
|
Received Notice of Pattern Violations Under Section 104(e) (yes/no) |
Received Notice of Potential to Have Pattern Under Section 104(e) (yes/no) |
Number of Legal
Actions Initiated or
Pending
During Period
|
||||||||||||||||||||||
| 4500416 | 10(1) |
0 | 0 | 0 | 0 | 1,430 (2) |
0 | No | No | 0 | ||||||||||||||||||||||
Number of shares (millions) |
|||||||||||
| As at | Feb. 22, 2024 | Dec. 31, 2023 | Dec. 31, 2022 | ||||||||
| Common shares issued and outstanding, end of period | 307.1 | 308.6 | 268.1 | ||||||||
| Preferred shares | |||||||||||
| Series A | 9.6 | 9.6 | 9.6 | ||||||||
| Series B | 2.4 | 2.4 | 2.4 | ||||||||
| Series C | 10.0 | 10.0 | 10.0 | ||||||||
| Series D | 1.0 | 1.0 | 1.0 | ||||||||
| Series E | 9.0 | 9.0 | 9.0 | ||||||||
| Series G | 6.6 | 6.6 | 6.6 | ||||||||
| Preferred shares issued and outstanding in equity | 38.6 | 38.6 | 38.6 | ||||||||
Series I - Exchangeable Securities |
0.4 | 0.4 | 0.4 | ||||||||
| Preferred shares issued and outstanding | 39.0 | 39.0 | 39.0 | ||||||||
Morningstar DBRS |
Moody's | S&P Global Ratings |
|||||||||
| Issuer Rating | BBB (low) | Not applicable | BB+ | ||||||||
| Corporate Family Rating | Not applicable | Ba1 | Not applicable | ||||||||
| Preferred Shares | Pfd-3 (low)(1) |
Not applicable | P-4(High) |
||||||||
| Unsecured Debt/MTNs | BBB (low) | Ba1/LGD4 | BB+ | ||||||||
| Rating Outlook | Stable | Stable | Stable | ||||||||
| Period | Dividend per Common Share | |||||||
| 2021 | First Quarter | $0.0450 | ||||||
| Second Quarter | $0.0450 | |||||||
| Third Quarter | $0.0450 | |||||||
| Fourth Quarter | $0.0500 | |||||||
| 2022 | First Quarter | $0.0500 | ||||||
| Second Quarter | $0.0500 | |||||||
| Third Quarter | $0.0500 | |||||||
| Fourth Quarter | $0.0550 | |||||||
| 2023 | First Quarter | $0.0550 | ||||||
| Second Quarter | $0.0550 | |||||||
| Third Quarter | $0.0550 | |||||||
| Fourth Quarter | $0.0550 | |||||||
2024 |
First Quarter(1) |
$0.0600 | ||||||
| Period | Dividend per Series A Share | |||||||
| 2021 | First Quarter | $0.16931 | ||||||
| Second Quarter | $0.17981 | |||||||
| Third Quarter | $0.17981 | |||||||
| Fourth Quarter | $0.17981 | |||||||
| 2022 | First Quarter | $0.17981 | ||||||
| Second Quarter | $0.17981 | |||||||
| Third Quarter | $0.17981 | |||||||
| Fourth Quarter | $0.17981 | |||||||
| 2023 | First Quarter |
$0.17981 | ||||||
| Second Quarter | $0.17981 | |||||||
| Third Quarter | $0.17981 | |||||||
| Fourth Quarter | $0.17981 | |||||||
2024 |
First Quarter(1) |
$0.17981 | ||||||
| Period | Dividend per Series B Share | |||||||
| 2021 | First Quarter | $0.13186 | ||||||
| Second Quarter | $0.13108 | |||||||
| Third Quarter | $0.13479 | |||||||
| Fourth Quarter | $0.13970 | |||||||
| 2022 | First Quarter | $0.13309 | ||||||
| Second Quarter | $0.16505 | |||||||
| Third Quarter | $0.22099 | |||||||
| Fourth Quarter | $0.33700 | |||||||
| 2023 | First Quarter |
$0.37991 | ||||||
| Second Quarter | $0.41100 | |||||||
| Third Quarter | $0.41545 | |||||||
| Fourth Quarter | $0.45288 | |||||||
2024 |
First Quarter(1) |
$0.43958 | ||||||
| Period | Dividend per Series C Share | |||||||
| 2021 | First Quarter | $0.25169 | ||||||
| Second Quarter | $0.25169 | |||||||
| Third Quarter | $0.25169 | |||||||
| Fourth Quarter | $0.25169 | |||||||
| 2022 | First Quarter | $0.25169 | ||||||
| Second Quarter | $0.25169 | |||||||
| Third Quarter | $0.36588 | |||||||
| Fourth Quarter | $0.36588 | |||||||
| 2023 | First Quarter |
$0.36588 | ||||||
| Second Quarter | $0.36588 | |||||||
| Third Quarter | $0.36588 | |||||||
| Fourth Quarter | $0.36588 | |||||||
2024 |
First Quarter(1) |
$0.36588 | ||||||
| Period | Dividend per Series D Share |
|||||||
| 2022 | Third Quarter | $0.28841 | ||||||
| Fourth Quarter | $0.40442 | |||||||
| 2023 | First Quarter |
$0.45578 | ||||||
Second Quarter |
$0.47769 | |||||||
Third Quarter |
$0.48287 | |||||||
| Fourth Quarter | $0.52030 | |||||||
| 2024 | First Quarter(1) |
$0.50609 | ||||||
| Period | Dividend per Series E Share | |||||||
| 2021 | First Quarter | $0.32463 | ||||||
| Second Quarter | $0.32463 | |||||||
| Third Quarter | $0.32463 | |||||||
| Fourth Quarter | $0.32463 | |||||||
| 2022 | First Quarter | $0.32463 | ||||||
| Second Quarter | $0.32463 | |||||||
| Third Quarter | $0.32463 | |||||||
| Fourth Quarter | $0.43088 | |||||||
| 2023 | First Quarter |
$0.43088 | ||||||
| Second Quarter | $0.43088 | |||||||
| Third Quarter | $0.43088 | |||||||
| Fourth Quarter | $0.43088 | |||||||
2024 |
First Quarter(1) |
$0.43088 | ||||||
| Period | Dividend per Series G Share | |||||||
| 2021 | First Quarter | $0.31175 | ||||||
| Second Quarter | $0.31175 | |||||||
| Third Quarter | $0.31175 | |||||||
| Fourth Quarter | $0.31175 | |||||||
| 2022 | First Quarter | $0.31175 | ||||||
| Second Quarter | $0.31175 | |||||||
| Third Quarter | $0.31175 | |||||||
| Fourth Quarter | $0.31175 | |||||||
| 2023 | First Quarter |
$0.31175 | ||||||
| Second Quarter | $0.31175 | |||||||
| Third Quarter | $0.31175 | |||||||
| Fourth Quarter | $0.31175 | |||||||
2024 |
First Quarter(1) |
$0.31175 | ||||||
| Price ($) | |||||||||||
| Month | High | Low | Volume | ||||||||
| 2023 | |||||||||||
| January | 13.64 | 11.85 | 10,563,874 | ||||||||
| February | 12.87 |
11.02 |
13,935,699 |
||||||||
| March | 11.93 |
10.60 |
14,287,018 |
||||||||
| April | 12.47 |
11.65 |
10,688,815 | ||||||||
| May | 13.48 |
12.04 |
12,229,463 |
||||||||
| June | 13.45 |
12.02 |
11,660,760 |
||||||||
| July | 13.68 |
11.54 |
11,732,249 | ||||||||
| August | 13.97 |
12.92 |
13,230,445 |
||||||||
| September | 13.24 |
11.76 |
14,112,624 |
||||||||
| October | 12.00 |
10.11 |
23,842,700 | ||||||||
| November | 11.68 |
10.02 |
17,583,646 | ||||||||
| December | 11.22 | 10.20 | 14,301,948 | ||||||||
| 2024 | |||||||||||
| January | 11.17 | 9.72 | 16,050,874 | ||||||||
February 1-22 |
9.89 | 9.16 | 8,843,459 | ||||||||
| Date of Issuance | Number of Securities(1)(2) |
Issue Price per Security | Description of Transaction | ||||||||
Dec. 10, 2010(1) |
12,000,000 Series A Shares | $25.00 | Public Offering | ||||||||
March 31, 2021(2) |
871,871 Series A Shares | N/A | Conversion of Series B Shares | ||||||||
| Price ($) | |||||||||||
| Month | High | Low | Volume | ||||||||
| 2023 | |||||||||||
| January | 14.17 | 13.11 | 57,996 | ||||||||
| February | 14.17 | 13.54 | 104,594 | ||||||||
| March | 13.95 | 12.81 | 123,624 | ||||||||
| April | 12.98 | 12.67 | 195,787 | ||||||||
| May | 12.99 | 12.30 | 55,875 | ||||||||
| June | 12.51 | 12.05 | 73,649 | ||||||||
| July | 12.30 | 12.00 | 80,427 | ||||||||
| August | 12.28 | 11.51 | 860,451 | ||||||||
| September | 11.95 | 11.52 | 100,471 | ||||||||
| October | 11.91 | 11.35 | 69,987 | ||||||||
| November | 12.67 | 11.67 | 94,725 | ||||||||
| December | 12.82 | 11.70 | 139,058 | ||||||||
| 2024 | |||||||||||
| January | 13.97 | 12.16 | 111,246 | ||||||||
February 1-22 |
14.30 | 13.33 | 58,871 | ||||||||
| Date of Issuance | Number of Securities(1)(2) |
Issue Price per Security | Description of Transaction | ||||||||
March 31, 2016(1) |
1,824,620 Series B Shares | N/A | Conversion of Series A Shares | ||||||||
March 31, 2021(2) |
1,417,338 Series B Shares | N/A | Conversion of Series A Shares | ||||||||
| Price ($) | |||||||||||
| Month | High | Low | Volume | ||||||||
| 2023 | |||||||||||
| January | 16.94 | 15.20 | 24,040 | ||||||||
| February | 16.95 | 16.20 | 19,346 | ||||||||
| March | 16.71 | 15.81 | 11,575 | ||||||||
| April | 16.29 | 15.32 | 6,438 | ||||||||
| May | 15.95 | 15.07 | 20,696 | ||||||||
| June | 15.34 | 14.90 | 32,390 | ||||||||
| July | 15.43 | 14.95 | 18,212 | ||||||||
| August | 15.43 | 14.83 | 68,244 | ||||||||
| September | 14.90 | 13.55 | 31,294 | ||||||||
| October | 15.00 | 13.60 | 76,142 | ||||||||
| November | 15.35 | 14.21 | 72,928 | ||||||||
| December | 15.40 | 14.25 | 83,476 | ||||||||
| 2024 | |||||||||||
| January | 16.23 | 14.34 | 85,144 | ||||||||
February 1-22 |
16.71 | 16.00 | 37,358 | ||||||||
| Date of Issuance | Number of Securities(1)(2) |
Issue Price per Security | Description of Transaction | ||||||||
Nov. 30, 2011(1) |
11,000,000 Series C Shares | $25.00 | Public Offering | ||||||||
June 30, 2022(2) |
9,955,701 Series C Shares | N/A | Conversion of Series D Shares | ||||||||
| Price ($) | |||||||||||
| Month | High | Low | Volume | ||||||||
| 2023 | |||||||||||
| January | 21.13 | 18.94 | 122,303 | ||||||||
| February | 20.89 | 19.87 | 33,135 | ||||||||
| March | 20.20 | 18.46 | 94,206 | ||||||||
| April | 19.00 | 18.60 | 56,167 | ||||||||
| May | 18.92 | 17.86 | 109,117 | ||||||||
| June | 18.78 | 17.92 | 33,155 | ||||||||
| July | 18.40 | 17.90 | 60,132 | ||||||||
| August | 18.32 | 17.32 | 76,745 | ||||||||
| September | 17.71 | 16.25 | 153,207 | ||||||||
| October | 16.88 | 15.88 | 84,963 | ||||||||
| November | 18.47 | 16.45 | 99,711 | ||||||||
| December | 18.14 | 17.45 | 89,476 | ||||||||
| 2024 | |||||||||||
| January | 18.68 | 17.85 | 105,265 | ||||||||
February 1-22 |
18.70 | 18.24 | 61,931 | ||||||||
| Date of Issuance | Number of Securities(1) |
Issue Price per Security | Description of Transaction | ||||||||
June 30, 2022(1) |
1,044,299 Series E Shares | N/A | Conversion of Series C Shares | ||||||||
| Price ($) | |||||||||||
| Month | High | Low | Volume | ||||||||
| 2023 | |||||||||||
January |
23.40 | 21.35 | 2,150 | ||||||||
February |
22.50 | 21.65 | 4,700 | ||||||||
March |
22.50 | 20.65 | 1,015 | ||||||||
April |
21.00 | 19.40 | 3,250 | ||||||||
May |
21.00 | 19.40 | 3,250 | ||||||||
June |
20.00 | 19.00 | 10,100 | ||||||||
July |
20.00 | 19.10 | 2,900 | ||||||||
| August | 20.00 | 18.20 | 15,100 | ||||||||
| September | 18.90 | 17.50 | 5,916 | ||||||||
| October | 19.79 | 17.19 | 1,800 | ||||||||
| November | 19.99 | 17.51 | 7,585 | ||||||||
| December | 19.65 | 17.75 | 4,500 | ||||||||
| 2024 | |||||||||||
| January | 20.10 | 18.40 | 6,770 | ||||||||
February 1-22 |
21.00 | 19.25 | 5,288 | ||||||||
| Date of Issuance | Number of Securities(1) |
Issue Price per Security | Description of Transaction | ||||||||
Aug. 10, 2012(1) |
9,000,000 Series E Shares | $25.00 | Public Offering | ||||||||
| Price ($) | |||||||||||
| Month | High | Low | Volume | ||||||||
| 2023 | |||||||||||
| January | 23.36 | 22.08 | 139,424 | ||||||||
| February | 23.68 | 22.70 | 69,503 | ||||||||
| March | 23.09 | 21.71 | 72,576 | ||||||||
| April | 21.86 | 21.17 | 79,646 | ||||||||
| May | 21.74 | 20.80 | 81,612 | ||||||||
| June | 21.44 | 20.80 | 48,456 | ||||||||
| July | 21.56 | 20.80 | 91,039 | ||||||||
| August | 21.74 | 20.00 | 64,826 | ||||||||
| September | 20.40 | 19.60 | 63,719 | ||||||||
| October | 19.85 | 18.25 | 81,082 | ||||||||
| November | 22.00 | 18.52 | 115,144 | ||||||||
| December | 21.83 | 20.45 | 199,707 | ||||||||
| 2024 | |||||||||||
| January | 21.99 | 21.17 | 97,836 | ||||||||
February 1-22 |
21.78 | 21.33 | 52,931 | ||||||||
| Date of Issuance | Number of Securities(1) |
Issue Price per Security | Description of Transaction | ||||||||
Aug. 15, 2014(1) |
6,600,000 Series G Shares | $25.00 | Public Offering | ||||||||
| Price ($) | |||||||||||
| Month | High | Low | Volume | ||||||||
| 2023 | |||||||||||
| January | 21.48 | 20.04 | 57,218 | ||||||||
| February | 21.98 | 21.22 | 66,452 | ||||||||
| March | 21.89 | 20.04 | 72,473 | ||||||||
| April | 20.38 | 19.89 | 51,270 | ||||||||
| May | 20.10 | 19.01 | 49,851 | ||||||||
| June | 19.55 | 18.99 | 59,824 | ||||||||
| July | 19.96 | 18.92 | 88,652 | ||||||||
| August | 20.11 | 18.90 | 99,684 | ||||||||
| September | 20.49 | 18.60 | 68,908 | ||||||||
| October | 19.18 | 18.18 | 63,364 | ||||||||
| November | 20.30 | 18.50 | 158,554 | ||||||||
| December | 19.75 | 18.60 | 103,796 | ||||||||
| 2024 | |||||||||||
| January | 21.48 | 19.60 | 96,742 | ||||||||
February 1-22 |
21.49 | 20.61 | 35,569 | ||||||||
| Name, Province (State) and Country of Residence | Year First Became Director | Principal Occupation | ||||||
|
Rona H. Ambrose
Alberta, Canada
|
2017 | The Honourable Rona Ambrose is Chair of the Governance, Safety and Sustainability Committee. Ms. Ambrose is the Deputy Chairwoman of TD Securities. She was the former Leader of Canada's Official Opposition in the House of Commons and former leader of the Conservative Party of Canada until 2017. As a key member of the federal cabinet for a decade, she solved problems as a minister of the Crown across nine government departments, including serving as Vice Chair of the Treasury Board for several years and Chair of the cabinet committee for public safety, justice and Aboriginal issues. As the former environment minister responsible for the GHG regulatory regime across several industrial sectors, she understands the challenges facing the fossil fuel industry. Ms. Ambrose was personally responsible for the development of several federal policies, ranging from industrial strategies in military procurement to health innovation and improvements to sexual assault laws. She is a passionate advocate for women in Canada and around the world and led the global movement to create the "International Day of the Girl" at the United Nations. She was also responsible for ensuring that Aboriginal women in Canada were granted equal matrimonial rights. She successfully fought for the creation of a Canadian refugee program to bring Yazidi women and girls who have been sexually enslaved by ISIS to safety in Canada. She is Chair of Plan International Canada Inc., a charity dedicated to girls rights globally which is working in 80 countries presently. She is a Global Fellow at the Wilson Centre's Canada Institute in Washington, DC, serves on the advisory board of the Canadian Global Affairs Institute and is a director of Andlauer Healthcare Group. She has a Bachelor of Arts from the University of Victoria and a Master of Arts from the University of Alberta. She is also a graduate of the Harvard Kennedy School of Government Senior Leaders Program. Ms. Ambrose brings to the Company and the Board an extensive track record of strong leadership acquired through a wide range of experience at the most senior levels of the Canadian government. |
||||||
| Name, Province (State) and Country of Residence | Year First Became Director | Principal Occupation | ||||||
|
John P. Dielwart
Alberta, Canada
|
2014 | Mr. Dielwart is the Chair of the Board of Directors. He was formerly Chief Executive Officer of ARC Resources Ltd., overseeing the growth of the company from a start-up in 1996 to a company with a total capitalization of approximately $10 billion at the time of his retirement in 2013. After his retirement from ARC Resources, Mr. Dielwart re-joined ARC Financial Corp. as Vice-Chair and Partner. ARC Financial is Canada's leading energy-focused private equity manager. In 2020, Mr. Dielwart resigned from the Board of ARC Financial but remained as Partner and a member of ARC Financial's Investment Committee. He is currently representing ARC Financial on the board of Aspenleaf Energy Limited. He is a past-Chair of the Board of Governors of the Canadian Association of Petroleum Producers and a member of the Association of Professional Engineers and Geoscientists of Alberta. Mr. Dielwart has a Bachelor of Science with distinction (civil engineering) from the University of Calgary. The Board believes that Mr. Dielwart is a diligent, independent director who provides the Company with a wealth of experience in leadership, finance and entrepreneurship along with a strong understanding of the commodity markets in which we operate, specifically the oil and gas markets. |
||||||
|
Alan J. Fohrer
California, US
|
2013 | Mr. Fohrer is the former Chair and Chief Executive Officer of Southern California Edison Company, a subsidiary of Edison International ("Edison") that is one of the largest electric utilities in the US. Mr. Fohrer served as President and Chief Executive Officer of Edison Mission Energy ("EME") from 2000 to 2001, a former subsidiary of Edison that owned and operated independent power facilities. During his tenure at EME, Mr. Fohrer restructured a number of international projects, which enhanced the value of the assets sold in subsequent years. Mr. Fohrer also served as Vice-President, Senior Vice-President, Executive Vice-President and Chief Financial Officer of both Edison and Southern California Edison from 1991 to 2000. After 37 years with Edison, Mr. Fohrer retired in December 2010. Mr. Fohrer is currently an independent member of the board of PNM Resources, Inc., a publicly traded energy holding company. He is also a member of the Viterbi School of Engineering Board of Councilors for the University of Southern California and on the Board of the California Science Center Foundation. Mr. Fohrer has served on boards of directors of the Institute of Nuclear Power Operations, the California Chamber of Commerce, Duratek, Inc., Osmose Utilities Services, Inc., MWH, Inc., Blue Shield of California and Synagro. Mr. Fohrer holds a Master of Science in civil engineering from the University of Southern California, Los Angeles, as well as a Master of Business Administration from California State University in Los Angeles. Mr. Fohrer brings to the Company and the Board experience in accounting, finance, dam safety and the power industry from both a regulated and unregulated market perspective. |
||||||
| Name, Province (State) and Country of Residence | Year First Became Director | Principal Occupation | ||||||
|
Laura W. Folse
Texas, US
|
2021 | Ms. Folse was the Chief Executive Officer of BP Wind Energy North America Inc. until 2016. As Chief Executive Officer for BP Wind Energy she led a business with over 500 employees and contractors that consisted of 14 wind farms across eight states with an operating capacity of over 2.5 gigawatts. Prior to her role as Chief Executive Officer of BP Wind Energy, she served at BP p.l.c. as Executive Vice President, Science, Technology, Environment and Regulatory Affairs, in which she led the operational, scientific and technological programs within the multi-billion dollar cleanup and restoration effort in response to the 2010 BP Macondo well explosion off the coast of Louisiana. At its peak, the cleanup project team that she led consisted of over 45,000 people working across the US Gulf and Mexico. She successfully negotiated with federal, state and local government officials to implement and conclude the offshore and onshore cleanup efforts. Prior thereto, she held numerous leadership roles with increasing responsibility and complexity within BP p.l.c. Ms. Folse is currently an independent member of the Board of Directors of Enerflex Ltd., a publicly traded energy services company and she is an independent member of the Board of Directors of Pacolet Milliken, a private investment company operating in real estate and power and infrastructure. Ms. Folse is a Board member for the Auburn University College of Arts and Sciences and was a Board member for the American Wind Energy Association from 2016 to 2019. Ms. Folse has a Master of Management in Business from Stanford University, a Master of Science in Geology from the University of Alabama and a Bachelor of Science in Geology from Auburn University. Ms. Folse brings to the Company and the Board experience in corporate risk management, large-scale crisis management, leveraging data analysis, leading large and complex organizations, and driving cultural change while realizing improvements in safety, operational and financial performance. |
||||||
| Name, Province (State) and Country of Residence | Year First Became Director | Principal Occupation | ||||||
|
Harry A. Goldgut
Ontario, Canada
|
2019 | Mr. Goldgut is Vice Chair of Brookfield's Infrastructure and Renewable Power and Transition groups and provides strategic advice related to Brookfield's open-ended Infrastructure Fund. He is also one of two Brookfield nominees to the Board. Mr. Goldgut was the Chief Executive Officer or Co-CEO and Chair of Brookfield Renewable Power Inc., from 2000 to 2008, and thereafter, until 2015, he was Chair of Brookfield's Power and Utilities Group. From 2015 to 2018, he served as Executive Chair of Brookfield's Infrastructure and Renewable Power groups. He joined Brookfield in 1997 and led the expansion of Brookfield's renewable power and utilities operations. He had primary responsibility for strategic initiatives, acquisitions and senior regulatory relationships. He was responsible for the acquisition of the majority of Brookfield's renewable power assets. He also played a role in the restructuring of the electricity industry in Ontario as a member of several governmental committees, including the Electricity Market Design Committee, the Minister of Energy's Advisory Committee, the Clean Energy Task Force, the Ontario Energy Board Chair's Advisory Roundtable and the Ontario Independent Electricity Operator CEO Roundtable on Market Renewal. Mr. Goldgut also serves on the board of directors of Isagen S.A. ESP, the third-largest power generation company in Colombia, and the Princess Margaret Cancer Foundation in Toronto. He holds a Bachelor of Laws degree from Osgoode Hall Law School at York University. Mr. Goldgut brings to the Company and the Board extensive experience in regulatory and government affairs, as well as experience in acquiring and operating renewable energy assets. Mr. Goldgut's background in renewable energy provides important insight to the Board. |
||||||
|
John H. Kousinioris
Alberta, Canada
|
2021 | Mr. Kousinioris is President and Chief Executive Officer of TransAlta. Prior to his appointment as President and CEO in 2021, Mr. Kousinioris served as Chief Operating Officer of the Company. As Chief Operating Officer, he was responsible for overseeing operations, shared services, commercial, trading, customer solutions, hedging and optimization at the Company. Prior thereto, Mr. Kousinioris was TransAlta's Chief Growth Officer and Chief Legal and Compliance Officer. Mr. Kousinioris’ prior leadership roles have provided him with responsibility for almost every aspect of the Company’s business. He was also the President of TransAlta Renewables Inc. until Feb. 5, 2021. Prior to joining TransAlta, Mr. Kousinioris was a partner and co-head of the corporate commercial department at Bennett Jones LLP with 30 years of experience in securities law, mergers and acquisitions and corporate governance matters. He is also Vice Chair of the Board of Governors of Bow Valley College and a member of the Board of Directors of the Calgary Stampede Foundation. Mr. Kousinioris has a Bachelor of Arts degree in Honors Business Administration from the Ivey Business School at the University of Western Ontario, a Master of Business Administration degree from York University and a Bachelor of Laws degree from Osgoode Hall Law School at York University. He has attended the Advanced Management Program at Harvard University. Mr. Kousinioris is responsible for the overall stewardship of the Company, including providing strategic leadership. Mr. Kousinioris has demonstrated outstanding vision and leadership with an unwavering commitment to the Company's long-term success. |
||||||
| Name, Province (State) and Country of Residence | Year First Became Director | Principal Occupation | ||||||
|
Candace J. MacGibbon
Ontario, Canada
|
2023 |
Ms. MacGibbon is the former Chief Executive Officer and Director of INV Metals Inc., a TSX-listed mining company, from 2015 to 2021, where she was responsible for determining and implementing corporate strategy. Prior thereto, Ms. MacGibbon was the former President and Chief Financial Officer of INV Metals Inc. from 2008 to 2015, responsible for financial and regulatory reporting and for the company's treasury, financial strength and investment policy. Ms. MacGibbon previously held roles within global mining institutional equity sales with RBC Capital Markets and in base metals research as an equity research associate with BMO Capital Markets. Ms. MacGibbon was a former manager at Deloitte LLP and cost analyst with Inco Limited. She is also a board member of Osisko Gold Royalties and a member of Osisko Gold Royalties Audit and Human Resources Committees. Ms. MacGibbon is the president-elect of the Canadian Institute of Mining, Petroleum and Metallurgy. She is a Chartered Professional Accountant with over 25 years’ experience in the mining sector and capital markets. She holds a Bachelor of Arts degree in Economics from the University of Western Ontario and a Diploma in Accounting from Sir Wilfred Laurier University. Ms. MacGibbon brings to the Board attributes and skills focused on leadership, collaboration and integrity, which she has demonstrated through her prior successful senior leadership roles, including as a chief executive officer and a chief financial officer of INV Metals Inc. Ms. MacGibbon provides the Company and the Board energy and motivation with a focus on delivering results, which is complemented by her expertise in strategy, risk management, finance and accounting. |
||||||
| Name, Province (State) and Country of Residence | Year First Became Director | Principal Occupation | ||||||
|
Thomas M. O'Flynn
New Jersey, US
|
2021 | Mr. O’Flynn was the Chief Executive Officer and Chief Investment Officer, AES Infrastructure Advisors. Prior thereto, until 2019, he was Executive Vice President and Chief Financial Officer at AES Corporation and responsible for all aspects of global finance and merger and acquisition teams across six global regions. During his tenure, Mr. O’Flynn helped lead AES through a significant transformation, including strategic exits of non-core markets, which resulted in improved financial stability and allowed for the redeployment of cash to primary growth markets. AES's total shareholder return increased 54 per cent during his tenure and its credit rating improved significantly. Mr. O’Flynn was also a key driver in initiating a major transition to renewables and green energy to significantly improve AES’s growth profile and reduce its carbon footprint. Mr. O'Flynn is the Lead Operating Director of Dimension Renewable Energy, a community solar company. He is a Director of Exus Management Partners, a renewables management and development company. Mr. O'Flynn is a Senior Advisor with Energy Impact Partners, a private energy technology fund investing in high-growth companies in the energy, utility and transportation industries. Mr. O’Flynn was Chief Financial Officer of Powin Energy from December 2021 until December 2022, a battery energy storage company in which Energy Impact Partners is a significant investor. Mr. O’Flynn was with The Blackstone Group Inc. where he was Senior Advisor, Power and Utility Sector, and Chief Operating Officer and Chief Financial Officer of Transmission Developers Inc., a Blackstone-controlled entity that develops innovative power transmission projects in an environmentally responsible manner. Prior thereto he was Executive Vice President and Chief Financial Officer at Public Service Enterprise Group Incorporated and was Head of North American Power at Morgan Stanley. Mr. O’Flynn has a Bachelor of Arts in Economics from Northwestern University and a Master of Business Administration in Finance from the University of Chicago. He is also an adjunct professor at Northwestern University for a master’s program at the Institute for Sustainability and Energy. He has led successful organizational transformations, including by focusing on acquisitions and greenfield development. Mr. O’Flynn provides the Company and Board with demonstrated ability to realize shareholder value through his significant senior executive experience at large electricity companies. |
||||||
| Name, Province (State) and Country of Residence | Year First Became Director | Principal Occupation | ||||||
|
Bryan D. Pinney
Alberta, Canada
|
2018 | Mr. Pinney has over 30 years of experience serving many of Canada's largest corporations, primarily in energy and resources and construction. Mr. Pinney served as Calgary Managing Partner of Deloitte LLP from 2002 through 2007 and as National Managing Partner of Audit & Assurance from 2007 to 2011 and Vice-Chair until June 2015. Mr. Pinney was a past member of Deloitte LLP's Board of Directors. He was a partner at Andersen LLP and served as Calgary Managing Partner from 1991 through May 2002. Mr. Pinney is currently the lead director for North American Construction Group Ltd. (NYSE, TSX) and a director of SNDL Inc. (NASDAQ). Mr. Pinney is the former chair of the Board of Governors of Mount Royal University and has served on a number of non-profit boards. He is a Fellow of the Institute of Chartered Accountants, a Chartered Business Valuator and is a graduate of the Ivey Business School at the University of Western Ontario with an undergraduate honours degree in Business Administration. He is also a graduate of the Canadian Institute of Corporate Directors. Mr. Pinney's extensive leadership accomplishments, financial expertise, knowledge of regulatory and compliance matters and diverse range of industry experience make him an important contributor to the Board. |
||||||
|
James Reid
Alberta, Canada
|
2021 | Mr. Reid is a former Managing Partner of Brookfield Asset Management Inc. who led Brookfield's Private Equity Group in Calgary, Alberta, until 2021. In that role he was responsible for originating, evaluating and structuring investments and financings in the energy sector and overseeing operations in Brookfield's private equity energy segment. Prior to moving into the private equity group, Mr. Reid was the Chief Investment Officer, Energy for Brookfield’s Infrastructure Group. He established Brookfield’s Calgary office in 2003 after spending several years as Chief Financial Officer for two oil and gas exploration and production companies in Western Canada. Mr. Reid is also one of two Brookfield nominees to the Board pursuant to the Investment Agreement. Mr. Reid obtained his Chartered Accountant designation at PricewaterhouseCoopers in Toronto and holds a Bachelor of Arts in commerce from the University of Toronto. Mr. Reid brings to the Company and the Board considerable experience in leadership, finance, mergers and acquisitions and organizational change. His wealth of knowledge in the energy sector and his former role with Brookfield, our long-term shareholder, makes him an important addition to the Board. |
||||||
| Name, Province (State) and Country of Residence | Year First Became Director | Principal Occupation | ||||||
|
Manjit K. Sharma
Ontario, Canada
|
2023 | Ms. Sharma has over 30 years of experience that spans a variety of industries (power generation, oil and gas, financial services, manufacturing, engineering services and others). Until 2021, she was the Chief Financial Officer of WSP Canada Inc. In this role, she was responsible for leading the finance, real estate, procurement, tax and shared services functions across Canada. She is a former member of the national executive team of General Electric Canada ("GE Canada"), serving as Chief Financial Officer from 2016 to 2019. From 1999 to 2016, she held various senior positions with GE Canada, with responsibilities that spanned business strategy development and execution, business product and services development, mergers and acquisitions, tax oversight, risk, governance, key components of human resources strategy (including compensation, union negotiations, pension and benefits), and diversity and inclusion. Ms. Sharma currently serves as a board member of each of Vermilion Energy Inc., Finning International Inc. and Export Development Canada. Ms. Sharma holds a Bachelor of Commerce degree (with Honours) from the University of Toronto, is a Fellow Chartered Accountant and holds the ICD.D Directors designation and the GCB.D Global Competent Boards designation. Ms. Sharma provides the Company and Board with diverse board experience, including executive, finance and leadership within different industries and businesses. |
||||||
| Name, Province (State) and Country of Residence | Year First Became Director | Principal Occupation | ||||||
|
Sandra R. Sharman
Ontario, Canada
|
2020 | Ms. Sharman is the Senior Vice President and Group Head, People, Culture and Brand of Canadian Imperial Bank of Commerce ("CIBC"). In this role, she leads the Human Resources, Communications, Marketing and Enterprise Real Estate teams at CIBC, supporting execution of business strategy, transforming to a purpose-driven bank and enabling a world-class culture. Ms. Sharman and her team are responsible for developing and delivering the Global Human Capital Strategy designed to challenge conventional thinking, drive business solutions and shape the culture of the bank. Her key areas of accountabilities also include workplace transformation, compensation and benefits, employee relations, policy and governance, talent management, marketing, corporate real estate, including the bank’s new global headquarters, CIBC Square, and all aspects of internal and external communications and public affairs, including government relations and awards. Ms. Sharman is a proven business leader with over 30 years of human resources and financial services experience in both Canada and the US, and she has played a leading role in shaping an inclusive and collaborative culture at CIBC, focused on empowering and enabling employees to reach their full potential. Ms. Sharman assumed the leadership of Human Resources at CIBC in 2014 and added accountability for communications and public affairs in 2017. Since then, her portfolio has expanded to encompass purpose, brand, marketing and, most recently, corporate real estate. Ms. Sharman earned her Master of Business Administration from Dalhousie University. Ms. Sharman provides the Company and Board with executive experience, diversity and inclusion related competencies and leadership accomplishments within an international and complex business. |
||||||
|
Sarah A. Slusser
Washington, US
|
2021 | Ms. Slusser is the Chief Executive Officer of Cypress Creek Renewables, LLC ("Cypress Creek"), a solar and storage independent power producer that develops, owns and operates projects in the US. She joined Cypress Creek as Chief Executive Officer in 2019 to reposition the company for sustainable growth. Prior to this, she founded Point Reyes Energy Partners LLC, a solar and energy storage advisory and development company, where she provided strategic advice to a number of large companies in the renewable sector until 2016. She remains a founding partner of Point Reyes Energy Partners. Prior to this, she co-founded GeoGlobal Energy LLC, a geothermal company in the US, Chile and Germany, which was sold to its cornerstone investor in 2015. Before co-founding GeoGlobal Energy, Ms. Slusser worked at AES for 21 years, where she advanced into increasingly significant leadership roles, ultimately being appointed Senior Vice President and Managing Director reporting directly to the Chief Executive Officer and leading the corporate group. She was President of one of eight divisions of AES that was responsible for all development, construction and operations in the Caribbean, Mexico and Central America. Ms. Slusser is a member of the Board of Directors of the Redwood Foundation, a family foundation promoting education and the environment and Our Food Chain, a non-profit promoting healthy eating. Ms. Slusser holds a Bachelor of Arts (cum laude) in geology from Harvard University and a Master of Business Administration from the Yale School of Management. Ms. Slusser’s brings to the Company and the Board a broad range of experience in the electricity sector at innovative, competitive renewable and electricity companies and provides the Board with significant capital allocation and M&A expertise. |
||||||
| Name | Principal Occupation | Residence | ||||||
John H. Kousinioris |
President and Chief Executive Officer | Alberta, Canada | ||||||
| Todd J. Stack | Executive Vice President, Finance and Chief Financial Officer | Alberta, Canada | ||||||
Jane N. Fedoretz |
Executive Vice President, People, Culture and Chief Administrative Officer |
Alberta, Canada | ||||||
Kerry L. O'Reilly Wilks |
Executive Vice President, Growth and Energy Marketing |
Alberta, Canada | ||||||
| Christopher D. Fralick | Executive Vice President, Generation | Alberta, Canada | ||||||
Blain M. van Melle |
Executive Vice President, Commercial and Customer Relations |
Alberta, Canada | ||||||
Aron J. Willis |
Executive Vice President, Project Delivery and Construction |
Alberta, Canada | ||||||
Scott T. Jeffers |
Acting Executive Vice President, Legal and Corporate Secretary |
Alberta, Canada | ||||||
| Brent V. Ward | Senior Vice President, M&A, Strategy and Treasurer | Alberta, Canada | ||||||
David C. Little |
Senior Vice President, Growth |
California, USA |
||||||
| Name of AFRC Member | Relevant Education and Experience | ||||
| Bryan D. Pinney (Chair) | Mr. Pinney has 40 years of experience in financial auditing, valuation and advising companies in energy and natural resources. He is an independent director of North American Construction Group Ltd. and chair of its Audit and Finance Committee. He is also an independent director of SNDL, Inc. and chair of its Audit and Finance Committee. He served as a member of Deloitte’s Board of Directors and chair of the Finance and Audit Committee. He was the recent Chair and a member of the Board of Governors of Mount Royal University and has previously served on a number of non-profit boards. He has been a Chartered Accountant since December 1978, a Fellow of the Chartered Professional Accountants of Alberta since January 2009 and a Chartered Business Valuator of Canada since December 1990. Mr. Pinney obtained a Bachelor of Arts in business administration from the University of Western Ontario in 1975 and also completed the Directors Education Program offered by the Institute of Corporate Directors in Canada in 2012. | ||||
| Alan J. Fohrer | Prior to his retirement in December 2010, Mr. Fohrer was Chair and Chief Executive Officer of Southern California Edison Company, a subsidiary of Edison and one of the largest electric utilities in the US. Prior to that, Mr. Fohrer served as Vice-President, Senior Vice-President, Executive Vice-President and Chief Financial Officer of both Edison and Southern California Edison Company. Mr. Fohrer also serves on the audit committee of PNM Resources Inc., a public company. Mr. Fohrer holds a Master of Business Administration from California State University in Los Angeles. |
||||
| Thomas M. O'Flynn | Mr. O'Flynn was the Chief Financial Officer of Powin Energy, an entity in which Energy Impact Partners LP (a private energy technology fund) is a major investor. Prior thereto, Mr. O'Flynn was Chief Executive Officer and Chief Investment Officer at the AES Corporation, Executive Vice President and Chief Financial Officer at Public Service Enterprise Group Incorporated and Head of North American Power at Morgan Stanley. Mr. O'Flynn has a Bachelor of Arts in economics from Northwestern University and a Master of Business Administration, Finance from the University of Chicago. |
||||
Manjit K. Sharma |
Ms. Sharma was the Chief Financial Officer of WSP Canada Inc. Prior to WSP Canada Inc., she was on the National Executive Team of General Electric Canada (GE Canada), serving as Chief Financial Officer from 2016 to 2019. Ms. Sharma currently serves as a board member of each of Vermilion Energy Inc., Finning International Inc. and Export Development Canada. Ms. Sharma holds a Bachelor of Commerce degree (with honours) from the University of Toronto, is a Fellow Chartered Accountant and holds the ICD.D Directors designation and the GCB.D Global Competent Boards designation. |
||||
Candace J. MacGibbon(1) |
Ms. MacGibbon was the former Chief Executive Officer and Chief Financial Officer of INV Metals Inc. Prior to this, she was a former manager at Deloitte LLP and held roles within RBC Capital Markets and BMO Capital Markets. Ms. MacGibbon currently serves as a board member of each of Carbon Streaming Corp. and Osisko Gold Royalties, and she is a member of the Audit of Human Resources Committees of Osisko Gold Royalties. Ms. MacGibbon holds a Bachelor of Arts degree in economics from the University of Western Ontario and is a Chartered Professional Accountant with over 25 years of experience in the mining sector and capital markets. |
||||
| Governance, Safety and Sustainability Committee | Human Resources Committee | |||||||
Chair: Rona H. Ambrose |
Chair: Sandra R. Sharman | |||||||
| Alan J. Fohrer | Rona H. Ambrose | |||||||
| Laura W. Folse | Bryan D. Pinney | |||||||
| Sandra R. Sharman | Sarah A. Slusser | |||||||
Candace J. MacGibbon |
Manjit K. Sharma | |||||||
| Investment Performance Committee | ||||||||
Chair: Laura W. Folse |
||||||||
Thomas M. O'Flynn |
||||||||
Harry A. Goldgut |
||||||||
James Reid |
||||||||
Sarah A. Slusser |
||||||||
| Ernst & Young LLP | ||||||||||||||||||||
Year Ended Dec. 31 |
2023 | 2022 | ||||||||||||||||||
| Audit Fees | $ | 3,368,977 | $ | 2,873,395 | ||||||||||||||||
Audit-related fees(1) |
1,374,803 | 1,618,751 | ||||||||||||||||||
| Tax fees | 5,850 | 116,112 | ||||||||||||||||||
| All other fees | 39,025 | — | ||||||||||||||||||
| Total | $ | 4,788,655 | $ | 4,608,258 | ||||||||||||||||

M2
|
M59
|
|||||||||||||
M4
|
M59
|
|||||||||||||
M6
|
M62
|
|||||||||||||
M11
|
M67
|
|||||||||||||
M12
|
M67
|
|||||||||||||
M15
|
M69
|
|||||||||||||
M23
|
M70
|
|||||||||||||
M23
|
M72
|
|||||||||||||
M26
|
M75
|
|||||||||||||
M28
|
M81
|
|||||||||||||
M29
|
M84
|
|||||||||||||
M31
|
M94
|
|||||||||||||
M31
|
M97
|
|||||||||||||
M36
|
M103
|
|||||||||||||
M37
|
M106
|
|||||||||||||
M42
|
M112
|
|||||||||||||
M44
|
M113
|
|||||||||||||
M46
|
M114
|
|||||||||||||
M48
|
M125
|
|||||||||||||
| TransAlta Corporation | 2023 Integrated Report | M1 |
||||||

M2 |
TransAlta Corporation | 2023 Integrated Report | ||||||
| TransAlta Corporation | 2023 Integrated Report | M3 |
||||||
M4 |
TransAlta Corporation | 2023 Integrated Report | ||||||
| Hydro | Wind & Solar | Gas | Energy Transition | Total | ||||||||||||||||||||||||||||
|
Year ended
Dec. 31, 2023
|
Gross
Installed
Capacity
(MW)
|
Number of facilities |
Gross
Installed
Capacity
(MW)(1)
|
Number of facilities |
Gross
Installed
Capacity
(MW)(1)
|
Number of
facilities
|
Gross
Installed
Capacity
(MW)
|
Number of facilities |
Gross
Installed
Capacity
(MW)(1)
|
Number of facilities |
||||||||||||||||||||||
| Alberta | 834 | 17 | 766 | 14 | 1,960 | 7 | — | — | 3,560 | 38 | ||||||||||||||||||||||
Canada, excluding Alberta |
88 | 7 | 751 | 9 | 645 | 3 | — | — | 1,484 | 19 | ||||||||||||||||||||||
| US | — | — | 519 | 7 | 29 | 1 | 671 | 2 | 1,219 | 10 | ||||||||||||||||||||||
| Australia | — | — | 48 | 3 | 450 | 6 | — | — | 498 | 9 | ||||||||||||||||||||||
| Total | 922 | 24 | 2,084 | 33 | 3,084 | 17 | 671 | 2 | 6,761 | 76 | ||||||||||||||||||||||
As at Dec. 31, 2023 |
Hydro |
Wind &
Solar
|
Gas |
Energy
Transition
|
Total | ||||||||||||
| Alberta | — | 374 | 511 | — | 885 | ||||||||||||
Canada, excluding Alberta |
88 | 751 | 645 | — | 1,484 | ||||||||||||
| US | — | 519 | 29 | 381 | 929 | ||||||||||||
| Australia | — | 48 | 450 | — | 498 | ||||||||||||
| Total contracted capacity (MW) | 88 | 1,692 | 1,635 | 381 | 3,796 | ||||||||||||
| Contracted capacity as a % of total capacity (%) | 10 | % | 81 | % | 53 | % | 57 | % | 56 | % | |||||||
As at Dec. 31, 2023 |
Hydro |
Wind &
Solar
|
Gas |
Energy
Transition
|
Total | ||||||||||||
Alberta(1)(2) |
— | 16 | 7 | — | 11 | ||||||||||||
Canada, excluding Alberta(2) |
10 | 10 | 8 | — | 9 | ||||||||||||
US(2) |
— | 10 | 2 | 2 | 7 | ||||||||||||
Australia(2) |
— | 15 | 15 | — | 15 | ||||||||||||
Total weighted contract life (years)(2) |
10 | 12 | 10 | 2 | 10 | ||||||||||||
| TransAlta Corporation | 2023 Integrated Report | M5 |
||||||
| Year ended Dec. 31 | 2023 | 2022 | 2021 | ||||||||
| Operational information | |||||||||||
| Adjusted availability (%) | 88.8 | 90.0 | 86.6 | ||||||||
| Production (GWh) | 22,029 | 21,258 | 22,105 | ||||||||
| Select financial information | |||||||||||
| Revenues | 3,355 | 2,976 | 2,721 | ||||||||
| Earnings (loss) before income taxes | 880 | 353 | (380) | ||||||||
Adjusted EBITDA(1) |
1,632 | 1,634 | 1,286 | ||||||||
| Net earnings (loss) attributable to common shareholders | 644 | 4 | (576) | ||||||||
| Cash flows | |||||||||||
| Cash flow from operating activities | 1,464 | 877 | 1,001 | ||||||||
Funds from operations(1) |
1,351 | 1,346 | 994 | ||||||||
Free cash flow(1) |
890 | 961 | 585 | ||||||||
| Per share | |||||||||||
| Weighted average number of common shares outstanding | 276 | 271 | 271 | ||||||||
Net earnings (loss) per share attributable to common shareholders, basic and diluted |
2.33 | 0.01 | (2.13) | ||||||||
Dividends declared per common share |
0.22 | 0.21 | 0.19 | ||||||||
Funds from operations per share(1)(2) |
4.89 | 4.97 | 3.67 | ||||||||
Free cash flow per share(1)(2) |
3.22 | 3.55 | 2.16 | ||||||||
Liquidity and capital resources |
|||||||||||
| Available liquidity | 1,738 | 2,118 | 2,177 | ||||||||
Adjusted net debt to adjusted EBITDA(1) (times) |
2.5 | 2.2 | 2.6 | ||||||||
Total consolidated net debt(1)(3) |
3,453 | 2,854 | 2,636 | ||||||||
| As at Dec. 31 | 2023 | 2022 | 2021 | ||||||||
| Total assets | 8,659 | 10,741 | 9,226 | ||||||||
| Total long-term liabilities | 5,253 | 5,864 | 4,702 | ||||||||
| Total liabilities | 6,995 | 8,752 | 6,633 | ||||||||
M6 |
TransAlta Corporation | 2023 Integrated Report | ||||||
| Year ended Dec. 31 | 2023 | 2022 | 2021 | ||||||||
| Hydro | 90.8 | 96.7 | 92.4 | ||||||||
| Wind and Solar | 86.9 | 83.8 | 91.9 | ||||||||
| Gas | 91.6 | 94.6 | 85.7 | ||||||||
Energy Transition(1) |
79.8 | 79.0 | 78.8 | ||||||||
| Adjusted availability (%) | 88.8 | 90.0 | 86.6 | ||||||||
| 2023 | 2022 | 2021 | |||||||||||||||||||||||||||
| Year ended Dec. 31 |
Actual
production
(GWh)
|
LTA
generation
(GWh)
|
Production
as a % of
LTA
|
Actual
production
(GWh)
|
LTA
generation
(GWh)
|
Production
as a % of
LTA
|
Actual
production
(GWh)
|
LTA
generation
(GWh)
|
Production
as a % of
LTA
|
||||||||||||||||||||
| Hydro | 1,769 | 2,015 | 88 | % | 1,988 | 2,015 | 99 | % | 1,936 | 2,030 | 95 | % | |||||||||||||||||
| Wind and Solar | 4,243 | 5,387 | 79 | % | 4,248 | 4,950 | 86 | % | 3,898 | 4,345 | 90 | % | |||||||||||||||||
| Gas | 11,873 | 11,448 | 10,565 | ||||||||||||||||||||||||||
| Energy Transition | 4,144 | 3,574 | 5,706 | ||||||||||||||||||||||||||
| Total | 22,029 | 21,258 | 22,105 | ||||||||||||||||||||||||||
| TransAlta Corporation | 2023 Integrated Report | M7 |
||||||
Year ended Dec. 31, 2023 |
2023 | 2022 | 2021 | ||||||||
Alberta spot power price ($/MWh) |
134 | 162 | 102 | ||||||||
Mid-Columbia spot power price (US$/MWh) |
76 | 82 | 49 | ||||||||
Ontario spot power price ($/MWh) |
28 | 47 | 30 | ||||||||
Natural gas price (AECO) per GJ ($) |
2.54 | 5.08 | 3.39 | ||||||||
| Year ended Dec. 31 | 2023 | 2022 | 2021 | |||||||||||
| Revenues | 3,355 | 2,976 | 2,721 | |||||||||||
| Fuel and purchased power | 1,060 | 1,263 | 1,054 | |||||||||||
| Carbon compliance | 112 | 78 | 178 | |||||||||||
| Operations, maintenance and administration | 539 | 521 | 511 | |||||||||||
| Depreciation and amortization | 621 | 599 | 529 | |||||||||||
| Asset impairment charges (reversals) | (48) | 9 | 648 | |||||||||||
Interest income |
59 | 24 | 11 | |||||||||||
| Earnings (loss) before income taxes | 880 | 353 | (380) | |||||||||||
| Income tax expense | 84 | 192 | 45 | |||||||||||
| Net earnings (loss) attributable to common shareholders | 644 | 4 | (576) | |||||||||||
Net earnings attributable to non-controlling interests |
101 | 111 | 112 | |||||||||||
M8 |
TransAlta Corporation | 2023 Integrated Report | ||||||
| TransAlta Corporation | 2023 Integrated Report | M9 |
||||||
|
Year ended
Dec. 31
|
|||||
| Adjusted EBITDA for the year ended Dec. 31, 2022 | 1,634 | ||||
Hydro: lower primarily due to lower ancillary services volumes, lower spot power and ancillary services prices and lower than average water resources, partially offset by realized gains from hedging and sales of environmental attributes. |
(68) | ||||
Wind and Solar: lower primarily due to lower environmental attribute revenues, lower spot power pricing in Alberta, lower wind resource across the operating fleets, lower liquidated damages recognized at the Windrise wind facility and higher OM&A, partially offset by the commercial operation of the Garden Plain wind facility, the Northern Goldfields solar facilities and the partial return of service of the Kent Hills wind facilities. |
(54) | ||||
Gas: higher primarily due to higher power price hedges partially offsetting the impacts of lower Alberta spot prices, lower natural gas commodity costs and higher production, partially offset by lower thermal revenues, higher carbon prices and higher carbon costs and fuel usage related to production. The Gas fleet significantly exceeded management's expectations. |
172 | ||||
Energy Transition: higher primarily due to higher production from higher availability and higher merchant sales volumes, partially offset by lower market prices compared to the prior year. |
36 | ||||
Energy Marketing: lower primarily due to lower realized settled trades during the year on market positions in comparison to prior year and higher OM&A. Energy Marketing results were in line with management's expectations and performance was consistent with our revised full year financial guidance provided in the second quarter of 2023. |
(74) | ||||
Corporate: lower primarily due to increased spending to support strategic and growth initiatives and higher costs associated with the relocation of the Company's head office. |
(14) | ||||
Adjusted EBITDA(1) for the year ended Dec. 31, 2023 |
1,632 | ||||
M10 |
TransAlta Corporation | 2023 Integrated Report | ||||||
|
Year ended
Dec. 31
|
|||||
FCF for the year ended Dec. 31, 2022 |
961 | ||||
Lower adjusted EBITDA: lower FCF due to the items noted in Adjusted EBITDA above. |
(2) | ||||
Higher interest income: Higher cash balances and favourable interest rates positively impacting FCF. |
35 | ||||
Lower current income tax expense: Previously restricted non-capital loss carryforwards were utilized to offset taxable income resulting in higher FCF. |
15 | ||||
Higher sustaining capital expenditures: Higher planned major maintenance costs for the Hydro and Gas segments, partially offset by lower planned major maintenance in Wind and Solar and Energy Transition segments, resulting in lower FCF. |
(31) | ||||
Higher distributions paid to subsidiaries' non-controlling interests: Related to timing of distributions paid to TA Cogen, partially offset by lower distributions paid to TransAlta Renewables resulting in lower FCF. |
(36) | ||||
Lower provisions: Lower provisions being accrued compared to the prior year, with no notable settlements being recorded in either year resulting in lower FCF due to the timing of provisions accrued. |
(26) | ||||
Other non-cash items(1) |
(12) | ||||
Other(2) |
(14) | ||||
FCF(3) for the year ended Dec. 31, 2023 |
890 | ||||
| Year ended Dec. 31 | 2023 | 2022 | 2021 | ||||||||
| Hydro | 41 | 35 | 26 | ||||||||
| Wind and Solar | 15 | 18 | 13 | ||||||||
| Gas | 76 | 41 | 128 | ||||||||
| Energy Transition | 15 | 19 | 19 | ||||||||
| Corporate | 27 | 29 | 13 | ||||||||
| Total sustaining capital expenditures | 174 | 142 | 199 | ||||||||
| TransAlta Corporation | 2023 Integrated Report | M11 |
||||||
| Year ended Dec. 31 | 2023 | 2022 | 2021 | ||||||||
| Hydro | 6 | 2 | 3 | ||||||||
| Wind and Solar | 659 | 759 | 124 | ||||||||
| Gas | 13 | 3 | 38 | ||||||||
| Energy Transition | — | — | 70 | ||||||||
Corporate(1) |
61 | 10 | 47 | ||||||||
| Total growth and development expenditures | 739 | 774 | 282 | ||||||||
M12 |
TransAlta Corporation | 2023 Integrated Report | ||||||
| TransAlta Corporation | 2023 Integrated Report | M13 |
||||||
M14 |
TransAlta Corporation | 2023 Integrated Report | ||||||
Adjusted EBITDA(1) |
|||||||||||
Year ended Dec. 31 |
2023 | 2022 | 2021 | ||||||||
| Hydro | 459 | 527 | 322 | ||||||||
| Wind and Solar | 257 | 311 | 262 | ||||||||
| Gas | 801 | 629 | 488 | ||||||||
| Energy Transition | 122 | 86 | 133 | ||||||||
| Energy Marketing | 109 | 183 | 166 | ||||||||
| Corporate | (116) | (102) | (85) | ||||||||
Total adjusted EBITDA(1) |
1,632 | 1,634 | 1,286 | ||||||||
| Earnings (loss) before income taxes | 880 | 353 | (380) | ||||||||
| TransAlta Corporation | 2023 Integrated Report | M15 |
||||||
| Year ended Dec. 31 | 2023 | 2022 | Change | 2021 | Change | ||||||||||||||||||
Gross installed capacity (MW)(1) |
922 | 922 | — | — | % | 925 | (3) | — | % | ||||||||||||||
LTA generation (GWh)(2) |
2,015 | 2,015 | — | — | % | 2,030 | (15) | (1) | % | ||||||||||||||
| Availability (%) | 90.8 | 96.7 | (5.9) | (6) | % | 92.4 | 4.3 | 5 | % | ||||||||||||||
| Production | |||||||||||||||||||||||
| Contract production (GWh) | 277 | 323 | (46) | (14) | % | 434 | (111) | (26) | % | ||||||||||||||
| Merchant production (GWh) | 1,492 | 1,665 | (173) | (10) | % | 1,502 | 163 | 11 | % | ||||||||||||||
| Total energy production (GWh) | 1,769 | 1,988 | (219) | (11) | % | 1,936 | 52 | 3 | % | ||||||||||||||
Ancillary service volumes (GWh)(3) |
2,582 | 3,124 | (542) | (17) | % | 2,897 | 227 | 8 | % | ||||||||||||||
Alberta Hydro Assets revenues(4)(5) |
291 | 328 | (37) | (11) | % | 185 | 143 | 77 | % | ||||||||||||||
Other Hydro Assets and other revenues(4)(6) |
51 | 42 | 9 | 21 | % | 41 | 1 | 2 | % | ||||||||||||||
Alberta Hydro ancillary services revenues(3) |
173 | 236 | (63) | (27) | % | 160 | 76 | 48 | % | ||||||||||||||
| Environmental attribute revenues | 14 | 1 | 13 | 1300 | % | 1 | — | — | % | ||||||||||||||
| Total gross revenues | 529 | 607 | (78) | (13) | % | 387 | 220 | 57 | % | ||||||||||||||
Net payment relating to Alberta Hydro PPA |
— | — | — | — | % | (4) | 4 | (100) | % | ||||||||||||||
Revenues(7) |
529 | 607 | (78) | (13) | % | 383 | 224 | 58 | % | ||||||||||||||
| Fuel and purchased power | 19 | 22 | (3) | (14) | % | 16 | 6 | 38 | % | ||||||||||||||
Gross margin(8) |
510 | 585 | (75) | (13) | % | 367 | 218 | 59 | % | ||||||||||||||
| OM&A | 48 | 55 | (7) | (13) | % | 42 | 13 | 31 | % | ||||||||||||||
| Taxes, other than income taxes | 3 | 3 | — | — | % | 3 | — | — | % | ||||||||||||||
Adjusted EBITDA(8) |
459 | 527 | (68) | (13) | % | 322 | 205 | 64 | % | ||||||||||||||
| Supplemental Information: | |||||||||||||||||||||||
| Gross revenues per MWh | |||||||||||||||||||||||
Alberta Hydro Assets energy ($/MWh)(4)(5) |
175 | 197 | (22) | (11) | % | 123 | 74 | 60 | % | ||||||||||||||
Alberta Hydro Assets ancillary ($/MWh)(3) |
67 | 76 | (9) | (12) | % | 55 | 21 | 38 | % | ||||||||||||||
M16 |
TransAlta Corporation | 2023 Integrated Report | ||||||
| TransAlta Corporation | 2023 Integrated Report | M17 |
||||||
| Year ended Dec. 31 | 2023 | 2022 | Change | 2021 | Change | ||||||||||||||||||||||||
Gross installed capacity (MW)(1) |
2,084 | 1,906 | 178 | 9 | % | 1,906 | — | — | % | ||||||||||||||||||||
| LTA generation (GWh) | 5,387 | 4,950 | 437 | 9 | % | 4,345 | 605 | 14 | % | ||||||||||||||||||||
| Availability (%) | 86.9 | 83.8 | 3.1 | 4 | % | 91.9 | (8.1) | (9) | % | ||||||||||||||||||||
| Production | |||||||||||||||||||||||||||||
| Contract production (GWh) | 3,095 | 3,182 | (87) | (3) | % | 2,850 | 332 | 12 | % | ||||||||||||||||||||
| Merchant production (GWh) | 1,148 | 1,066 | 82 | 8 | % | 1,048 | 18 | 2 | % | ||||||||||||||||||||
| Total production (GWh) | 4,243 | 4,248 | (5) | — | % | 3,898 | 350 | 9 | % | ||||||||||||||||||||
| Wind and Solar revenues | 347 | 357 | (10) | (3) | % | 320 | 37 | 12 | % | ||||||||||||||||||||
| Environmental attribute revenues | 26 | 50 | (24) | (48) | % | 28 | 22 | 79 | % | ||||||||||||||||||||
Revenues(2) |
373 | 407 | (34) | (8) | % | 348 | 59 | 17 | % | ||||||||||||||||||||
| Fuel and purchased power | 30 | 31 | (1) | (3) | % | 17 | 14 | 82 | % | ||||||||||||||||||||
| Carbon compliance | — | 1 | (1) | (100) | % | — | 1 | 100 | % | ||||||||||||||||||||
Gross margin(3) |
343 | 375 | (32) | (9) | % | 331 | 44 | 13 | % | ||||||||||||||||||||
| OM&A | 80 | 68 | 12 | 18 | % | 59 | 9 | 15 | % | ||||||||||||||||||||
| Taxes, other than income taxes | 12 | 12 | — | — | % | 10 | 2 | 20 | % | ||||||||||||||||||||
Net other operating income(2) |
(6) | (16) | 10 | (63) | % | — | (16) | (100) | % | ||||||||||||||||||||
Adjusted EBITDA(3) |
257 | 311 | (54) | (17) | % | 262 | 49 | 19 | % | ||||||||||||||||||||
| Supplemental information: | |||||||||||||||||||||||||||||
Kent Hills wind rehabilitation expenditures(4) |
87 | 77 | 10 | 13 | % | — | 77 | 100 | % | ||||||||||||||||||||
| Insurance proceeds - Kent Hills | (1) | (7) | 6 | (86) | % | — | (7) | (100) | % | ||||||||||||||||||||
M18 |
TransAlta Corporation | 2023 Integrated Report | ||||||
| TransAlta Corporation | 2023 Integrated Report | M19 |
||||||
| Year ended Dec. 31 | 2023 | 2022 | Change | 2021 | Change | ||||||||||||||||||||||||
| Gross installed capacity (MW) | 3,084 | 3,084 | — | — | % | 3,084 | — | — | % | ||||||||||||||||||||
| Availability (%) | 91.6 | 94.6 | (3.0) | (3) | % | 85.7 | 8.9 | 10 | % | ||||||||||||||||||||
| Production | |||||||||||||||||||||||||||||
Contract sales volume (GWh) |
4,172 | 3,609 | 563 | 16 | % | 3,622 | (13) | — | % | ||||||||||||||||||||
Merchant sales volume (GWh) |
7,889 | 7,927 | (38) | — | % | 7,084 | 843 | 12 | % | ||||||||||||||||||||
Purchased power (GWh)(1) |
(188) | (88) | (100) | 114 | % | (141) | 53 | (38) | % | ||||||||||||||||||||
| Total production (GWh) | 11,873 | 11,448 | 425 | 4 | % | 10,565 | 883 | 8 | % | ||||||||||||||||||||
Revenues(2) |
1,525 | 1,521 | 4 | — | % | 1,126 | 395 | 35 | % | ||||||||||||||||||||
Fuel and purchased power(2) |
449 | 637 | (188) | (30) | % | 374 | 263 | 70 | % | ||||||||||||||||||||
| Carbon compliance | 112 | 83 | 29 | 35 | % | 118 | (35) | (30) | % | ||||||||||||||||||||
Gross margin(3) |
964 | 801 | 163 | 20 | % | 634 | 167 | 26 | % | ||||||||||||||||||||
| OM&A | 192 | 195 | (3) | (2) | % | 173 | 22 | 13 | % | ||||||||||||||||||||
| Taxes, other than income taxes | 11 | 15 | (4) | (27) | % | 13 | 2 | 15 | % | ||||||||||||||||||||
| Net other operating income | (40) | (38) | (2) | 5 | % | (40) | 2 | (5) | % | ||||||||||||||||||||
Adjusted EBITDA(3) |
801 | 629 | 172 | 27 | % | 488 | 141 | 29 | % | ||||||||||||||||||||
M20 |
TransAlta Corporation | 2023 Integrated Report | ||||||
| Year ended Dec. 31 | 2023 | 2022 | Change | 2021 | Change | ||||||||||||||||||||||||
Gross installed capacity (MW)(1) |
671 | 671 | — | — | % | 1,472 | (801) | (54) | % | ||||||||||||||||||||
| Availability (%) | 79.8 | 77.2 | 2.6 | 3 | % | 75.3 | 1.9 | 3 | % | ||||||||||||||||||||
Adjusted availability (%)(2) |
79.8 | 79.0 | 0.8 | 1 | % | 78.8 | 0.2 | — | % | ||||||||||||||||||||
| Production | |||||||||||||||||||||||||||||
Contract sales volume (GWh) |
3,329 | 3,329 | — | — | % | 3,329 | — | — | % | ||||||||||||||||||||
Merchant sales volume (GWh) |
4,417 | 3,951 | 466 | 12 | % | 6,052 | (2,101) | (35) | % | ||||||||||||||||||||
Purchased power (GWh)(3) |
(3,602) | (3,706) | 104 | (3) | % | (3,675) | (31) | 1 | % | ||||||||||||||||||||
| Total production (GWh) | 4,144 | 3,574 | 570 | 16 | % | 5,706 | (2,132) | (37) | % | ||||||||||||||||||||
Revenues(4) |
746 | 724 | 22 | 3 | % | 728 | (4) | (1) | % | ||||||||||||||||||||
| Fuel and purchased power | 557 | 566 | (9) | (2) | % | 432 | 134 | 31 | % | ||||||||||||||||||||
| Carbon compliance | — | (1) | 1 | (100) | % | 60 | (61) | (102) | % | ||||||||||||||||||||
Gross margin(5) |
189 | 159 | 30 | 19 | % | 236 | (77) | (33) | % | ||||||||||||||||||||
| OM&A | 64 | 69 | (5) | (7) | % | 97 | (28) | (29) | % | ||||||||||||||||||||
| Taxes, other than income taxes | 3 | 4 | (1) | (25) | % | 6 | (2) | (33) | % | ||||||||||||||||||||
Adjusted EBITDA(5) |
122 | 86 | 36 | 42 | % | 133 | (47) | (35) | % | ||||||||||||||||||||
| Supplemental information: | |||||||||||||||||||||||||||||
| Highvale mine reclamation spend | 15 | 12 | 3 | 25 | % | 6 | 6 | 100 | % | ||||||||||||||||||||
| Centralia mine reclamation spend | 13 | 16 | (3) | (19) | % | 9 | 7 | 78 | % | ||||||||||||||||||||
| TransAlta Corporation | 2023 Integrated Report | M21 |
||||||
| Year ended Dec. 31 | 2023 | 2022 | Change | 2021 | Change | ||||||||||||||||||
Revenues(1) |
152 | 218 | (66) | (30) | % | 202 | 16 | 8 | % | ||||||||||||||
| OM&A | 43 | 35 | 8 | 23 | % | 36 | (1) | (3) | % | ||||||||||||||
Adjusted EBITDA(2) |
109 | 183 | (74) | (40) | % | 166 | 17 | 10 | % | ||||||||||||||
| Year ended Dec. 31 | 2023 | 2022 | Change | 2021 | Change | ||||||||||||||||||||||||
| OM&A | 115 | 101 | 14 | 14 | % | 84 | 17 | 20 | % | ||||||||||||||||||||
| Taxes, other than income taxes | 1 | 1 | — | — | % | 1 | — | — | % | ||||||||||||||||||||
Adjusted EBITDA(1) |
(116) | (102) | (14) | 14 | % | (85) | (17) | 20 | % | ||||||||||||||||||||
M22 |
TransAlta Corporation | 2023 Integrated Report | ||||||
| Year ended Dec. 31, 2023 | Hydro | Wind & Solar |
Gas | Energy Transition | Energy Marketing | Corporate | Total | ||||||||||||||||
| Alberta | 451 | 77 | 571 | (10) | 109 | (116) | 1,082 | ||||||||||||||||
| Canada, excluding Alberta | 8 | 95 | 89 | — | — | — | 192 | ||||||||||||||||
| US | — | 84 | 10 | 132 | — | — | 226 | ||||||||||||||||
| Australia | — | 1 | 131 | — | — | — | 132 | ||||||||||||||||
Adjusted EBITDA(1) |
459 | 257 | 801 | 122 | 109 | (116) | 1,632 | ||||||||||||||||
| Earnings before income taxes | 880 | ||||||||||||||||||||||
| Year ended Dec. 31, 2022 | Hydro | Wind & Solar |
Gas | Energy Transition |
Energy Marketing |
Corporate | Total | ||||||||||||||||
| Alberta | 515 | 114 | 404 | (18) | 183 | (102) | 1,096 | ||||||||||||||||
| Canada, excluding Alberta | 12 | 106 | 87 | — | — | — | 205 | ||||||||||||||||
| US | — | 91 | 8 | 104 | — | — | 203 | ||||||||||||||||
| Australia | — | — | 130 | — | — | — | 130 | ||||||||||||||||
Adjusted EBITDA(1) |
527 | 311 | 629 | 86 | 183 | (102) | 1,634 | ||||||||||||||||
| Earnings before income taxes | 353 | ||||||||||||||||||||||
| TransAlta Corporation | 2023 Integrated Report | M23 |
||||||
| 2023 | 2022 | 2021 | |||||||||||||||||||||||||||||||||||||||||||||
Year ended Dec. 31 |
Hydro | Wind & Solar | Gas |
Energy
Transition
|
Total | Hydro | Wind & Solar | Gas | Energy Transition | Total | Hydro | Wind & Solar | Gas |
Energy
Transition
|
Total | ||||||||||||||||||||||||||||||||
| Gross installed capacity (MW) |
834 | 766 | 1,960 | — | 3,560 | 834 | 636 | 1,960 | — | 3,430 | 834 | 636 | 1,960 | 801 | 4,231 | ||||||||||||||||||||||||||||||||
| Total production (GWh) |
1,492 | 1,907 | 8,360 | — | 11,759 | 1,665 | 1,686 | 8,106 | 19 | 11,476 | 1,586 | 1,319 | 7,281 | 2,591 | 12,777 | ||||||||||||||||||||||||||||||||
| Contract production (GWh) | — | 774 | 861 | — | 1,635 | — | 620 | 526 | — | 1,146 | — | 271 | 509 | — | 780 | ||||||||||||||||||||||||||||||||
| Merchant production (GWh) | 1,492 | 1,133 | 7,499 | — | 10,124 | 1,665 | 1,066 | 7,580 | 19 | 10,330 | 1,586 | 1,048 | 6,772 | 2,591 | 11,997 | ||||||||||||||||||||||||||||||||
| Hedged production (GWh) | 378 | — | 7,172 | — | 7,550 | — | — | 7,228 | — | 7,228 | — | — | 6,992 | — | 6,992 | ||||||||||||||||||||||||||||||||
| Production contracted or hedged (%) | 25 | % | 41 | % | 96 | % | — | % | 78 | % | — | % | 37 | % | 96 | % | — | % | 73 | % | — | % | 21 | % | 103 | % | — | % | 61 | % | |||||||||||||||||
Revenues(1) ($) |
509 | 130 | 1,083 | 5 | 1,727 | 583 | 155 | 989 | 6 | 1,733 | 358 | 97 | 674 | 257 | 1,386 | ||||||||||||||||||||||||||||||||
| Fuel and purchased power ($) | 17 | 20 | 336 | — | 373 | 18 | 21 | 442 | 5 | 486 | 13 | 9 | 258 | 92 | 372 | ||||||||||||||||||||||||||||||||
| Carbon compliance ($) | — | — | 106 | — | 106 | — | 1 | 70 | (1) | 70 | — | — | 96 | 60 | 156 | ||||||||||||||||||||||||||||||||
| Gross margin ($) | 492 | 110 | 641 | 5 | 1,248 | 565 | 133 | 477 | 2 | 1,177 | 345 | 88 | 320 | 105 | 858 | ||||||||||||||||||||||||||||||||
M24 |
TransAlta Corporation | 2023 Integrated Report | ||||||
Year ended Dec. 31, 2023 |
2023 | 2022 | 2021 | ||||||||
| Alberta Market | |||||||||||
| Spot power price average per MWh | 134 | 162 | 102 | ||||||||
| Natural gas price (AECO) per GJ | 2.54 | 5.08 | 3.39 | ||||||||
| Carbon compliance price per tonne | 65 | 50 | 40 | ||||||||
| Alberta Portfolio Results | |||||||||||
Realized merchant power price per MWh(1) |
136 | 126 | 91 | ||||||||
| Hydro energy spot power price per MWh | 175 | 197 | 122 | ||||||||
| Hydro ancillary spot price per MWh | 67 | 76 | 55 | ||||||||
| Wind energy spot power price per MWh | 73 | 90 | 63 | ||||||||
| Gas and Energy Transition spot power price per MWh | 162 | 194 | 114 | ||||||||
| Hedged power price average per MWh | 111 | 86 | 72 | ||||||||
Hedged volume (GWh) |
7,550 | 7,228 | 6,992 | ||||||||
Fuel and purchased power per MWh(2) |
45 | 60 | 38 | ||||||||
Carbon compliance cost per MWh(2) |
13 | 9 | 16 | ||||||||
| TransAlta Corporation | 2023 Integrated Report | M25 |
||||||
| Three months ended Dec. 31 | 2023 | 2022 | |||||||||
| Operational information | |||||||||||
| Adjusted availability (%) | 86.9 | 89.5 | |||||||||
| Production (GWh) | 5,783 | 6,005 | |||||||||
| Select financial information | |||||||||||
| Revenues | 624 | 854 | |||||||||
| Earnings (loss) before income taxes | (35) | 7 | |||||||||
Adjusted EBITDA(1) |
289 | 541 | |||||||||
Net (loss) attributable to common shareholders |
(84) | (163) | |||||||||
| Cash flows | |||||||||||
| Cash flow from operating activities | 310 | 351 | |||||||||
Funds from operations(1) |
229 | 459 | |||||||||
Free cash flow(1) |
121 | 315 | |||||||||
| Per share | |||||||||||
| Weighted average number of common shares outstanding | 308 | 269 | |||||||||
Net (loss) per share attributable to common shareholders, basic and diluted |
(0.27) | (0.61) | |||||||||
Dividends declared per common share |
0.12 | 0.11 | |||||||||
Funds from operations per share(1)(2) |
0.74 | 1.71 | |||||||||
Free cash flow per share(1)(2) |
0.39 | 1.17 | |||||||||
Three months ended Dec. 31 |
2023 | 2022 | ||||||
| Hydro | 76.6 | 96.8 | ||||||
| Wind and Solar | 90.3 | 85.7 | ||||||
| Gas | 89.5 | 92.8 | ||||||
| Energy Transition | 79.6 | 76.4 | ||||||
| Adjusted availability (%) | 86.9 | 89.5 | ||||||
M26 |
TransAlta Corporation | 2023 Integrated Report | ||||||
| 2023 | 2022 | ||||||||||||||||||||||
Three months ended Dec. 31 |
Actual production (GWh) | LTA generation (GWh) | Production as a % of LTA | Actual production (GWh) | LTA generation (GWh) | Production as a % of LTA | |||||||||||||||||
| Hydro | 326 | 447 | 73 | % | 344 | 435 | 79 | % | |||||||||||||||
| Wind and Solar | 1,479 | 1,621 | 91 | % | 1,222 | 1,499 | 82 | % | |||||||||||||||
| Gas | 2,892 | 3,375 | |||||||||||||||||||||
| Energy Transition | 1,086 | 1,064 | |||||||||||||||||||||
| Total | 5,783 | 6,005 | |||||||||||||||||||||
| Three months ended Dec. 31 | 2023 | 2022 | |||||||||
| Revenues | 624 | 854 | |||||||||
| Fuel and purchased power | 278 | 446 | |||||||||
| Carbon compliance | 27 | 27 | |||||||||
| Operations, maintenance and administration | 150 | 157 | |||||||||
| Depreciation and amortization | 132 | 188 | |||||||||
Gain on sale of assets and other |
— | 46 | |||||||||
| Earnings (loss) before income taxes | (35) | 7 | |||||||||
| Income tax expense | 19 | 89 | |||||||||
| Net loss attributable to common shareholders | (84) | (163) | |||||||||
Net earnings attributable to non-controlling interests |
5 | 56 | |||||||||
| TransAlta Corporation | 2023 Integrated Report | M27 |
||||||
Adjusted EBITDA(1) |
|||||||||||
| Three months ended Dec. 31 | 2023 | 2022 | |||||||||
| Hydro | 56 | 133 | |||||||||
| Wind and Solar | 82 | 92 | |||||||||
| Gas | 141 | 264 | |||||||||
| Energy Transition | 26 | 19 | |||||||||
| Energy Marketing | 14 | 63 | |||||||||
| Corporate | (30) | (30) | |||||||||
Total adjusted EBITDA(1) |
289 | 541 | |||||||||
| Earnings (loss) before income taxes | (35) | 7 | |||||||||
M28 |
TransAlta Corporation | 2023 Integrated Report | ||||||
|
Three months
ended Dec. 31
|
|||||
| Adjusted EBITDA for the three months ended Dec. 31, 2022 | 541 | ||||
Hydro: lower due to decreased revenues from lower merchant and ancillary prices in the Alberta market and lower ancillary services volumes. |
(77) | ||||
Wind and Solar: lower due to lower merchant pricing in Alberta, lower wind resource in Eastern Canada and the US and higher OM&A due to new long-term service agreements, partially offset by higher revenues related to the partial return to service of the Kent Hills facilities and the addition of the Garden Plain wind facility and Northern Goldfields solar facilities. |
(10) | ||||
Gas: lower due to lower realized prices and production volume in the Alberta market, lower thermal revenues due to lower steam revenue pricing at the Sarnia facility compared to 2022, and higher OM&A with the inventory writedown at the Sundance and Keephills 2 facilities. |
(123) | ||||
Energy Transition: higher due to higher production due to lower unplanned outages, partially offset by lower revenues as a result of lower market prices. |
7 | ||||
Energy Marketing: lower realized settled trades during the fourth quarter on market positions in comparison to the prior period in 2022. |
(49) | ||||
Corporate: consistent with the same period in 2022. |
— | ||||
Adjusted EBITDA(1) for the three months ended Dec. 31, 2023 |
289 | ||||
| Three months ended Dec. 31 | |||||
FCF for the three months ended Dec. 31, 2022 |
315 | ||||
Lower adjusted EBITDA: lower FCF due to the items noted above. |
(252) | ||||
Lower distributions paid to subsidiaries' non-controlling interests: lower net earnings in TA Cogen and no dividends paid to TransAlta Renewables shareholders resulting in higher FCF. |
42 | ||||
Other(1) |
16 | ||||
FCF(2) for the three months ended Dec. 31, 2023 |
121 | ||||
| TransAlta Corporation | 2023 Integrated Report | M29 |
||||||
| Q1 2023 | Q2 2023 | Q3 2023 | Q4 2023 | |||||||||||
| Revenues | 1,089 | 625 | 1,017 | 624 | ||||||||||
Earnings (loss) before income taxes |
383 | 79 | 453 | (35) | ||||||||||
Net earnings (loss) attributable to common shareholders |
294 | 62 | 372 | (84) | ||||||||||
Net earnings (loss) per share attributable to common shareholders, basic and diluted(1) |
1.10 | 0.23 | 1.41 | (0.27) | ||||||||||
| Cash flow from operating activities | 462 | 11 | 681 | 310 | ||||||||||
| Q1 2022 | Q2 2022 | Q3 2022 | Q4 2022 | |||||||||||
| Revenues | 735 | 458 | 929 | 854 | ||||||||||
| Earnings (loss) before income taxes | 242 | (22) | 126 | 7 | ||||||||||
| Net earnings (loss) attributable to common shareholders | 186 | (80) | 61 | (163) | ||||||||||
Net earnings (loss) per share attributable to common shareholders, basic and diluted(1) |
0.69 | (0.30) | 0.23 | (0.61) | ||||||||||
Cash flow from (used in) operating activities(2) |
451 | (129) | 204 | 351 | ||||||||||
M30 |
TransAlta Corporation | 2023 Integrated Report | ||||||
| TransAlta Corporation | 2023 Integrated Report | M31 |
||||||
| Goals | Target | Results | Comments | ||||||||
| Optimize Alberta portfolio | Continue to optimize our existing asset base and maximize the value of our hydro fleet in Alberta. |
On Track |
The acquisition of Heartland will add 1,844 MW of complementary flexible capacity to the Alberta portfolio including contracted cogeneration, peaking generation, transmission capacity and development opportunities in hydrogen. |
||||||||
Execute Clean Electricity Growth Plan |
Deliver up to 1.75 GW of renewable capacity with an estimated capital investment of $3.5 billion by the end of 2028. |
On Track |
The Company is currently advancing 418 MW of advanced-stage projects towards final investment decision in 2024. |
||||||||
Deliver incremental average annual EBITDA of $350 million by the end of 2028. |
On Track |
In 2024, the Company plans to make investment decisions on new projects that will produce at least $80 million in incremental EBITDA. |
|||||||||
Expand the Company's development pipeline to 10 GW by the end of 2028. |
On Track |
In 2024, The Company plans to add an additional 1,500 MW to its development pipeline to further support our Clean Electricity Growth Plan. |
|||||||||
Selective Expansion of Flexible Generation and Reliability Assets |
Selectively expand our portfolio offerings in flexible generation and reliability assets such as peaking generation and short-term and long-term storage. |
On Track |
The Company plans to selectively invest in peaking generation and battery storage assets to optimize our portfolio. The acquisition of Heartland will add 387 MW of peaking gas capacity to our portfolio, the peaking assets will be optimized by the Company to address increasing intermittency in Alberta. |
||||||||
Maintain Our Financial Strength and Capital Allocation Discipline |
Deliver strong cash flow from our existing portfolio to allocate towards our funding priorities including growth, dividends, debt repayments and share repurchases. |
On Track |
The Company had liquidity of $1.7 billion as at Dec. 31, 2023.
The Company increased the annual common share dividend by 9 per cent to $0.24 per year effective April 1, 2024. In 2024, the Company announced that it intends to repurchase up to $150 million of common shares. The increased annual common share dividend, along with the share repurchase commitment, will represent a return of up to approximately 40 per cent of the midpoint of our 2024 FCF guidance to shareholders.
|
||||||||
Define the Next Generation of Power Solutions |
Meet the needs of our customers and communities through the implementation of innovative electricity solutions and parallel investments in new complementary sectors by the end of 2028. |
On Track |
The Company established an Energy Innovation team to progress our goals in this area. The team has completed an equity investment in Ekona Power Inc. ("Ekona"), an early-stage hydrogen production company, in order to pursue commercialization of low cost, net-zero aligned hydrogen. The Company also committed to invest US$25 million over the next four years in the Energy Impact Partners Frontier Fund, which provides a portfolio approach to investing in emerging technologies focused on net-zero emissions. In total, the Company invested US$12 million to this fund as at Dec. 31, 2023. |
||||||||
| Lead in ESG and Market Policy Development | Actively participate in policy development to ensure the electricity that we provide contributes to emissions reduction, grid reliability and competitive energy prices to enable the successful evolution of the markets in which we operate and compete. |
On Track |
The Company is actively engaging the Government of Canada and Government of Alberta on the proposed federal Clean Electricity Regulations, as well as electricity market and renewable approval changes under review in Alberta. This includes participation in the AESO's Executive Working Group and the Canada Electricity Advisory Council. TransAlta's input is focused on how to achieve emissions reductions while maintaining reliability and affordability.
The Company continues to work with the Government of Canada on the design details of the investment tax credits and clean technology funding provided through the Government of Canada, as well as exploring funding opportunities through the Government of Alberta.
|
||||||||
M32 |
TransAlta Corporation | 2023 Integrated Report | ||||||
Project |
Type | Region | Target investment date |
MW | Estimated spend | Average annual EBITDA(1) |
||||||||||||||
| Tempest | Wind | Alberta | 2024 | 100 | $260-$280 |
$22-$26 |
||||||||||||||
SCE Capacity Expansion |
Gas | Western Australia | 2024 | 94 | AU$210-AU$230 | AU$28-AU$32 | ||||||||||||||
| WaterCharger | Battery Storage | Alberta | 2024 | 180 | $160-$180(2) |
$15-$17 |
||||||||||||||
| Pinnacle 1 & 2 | Gas | Alberta | 2024 | 44 | $65-$75 |
$13-$15 |
||||||||||||||
Total(3) |
418 | $740 - $813 | $82 - $94 | |||||||||||||||||
| TransAlta Corporation | 2023 Integrated Report | M33 |
||||||
| Project | Type | Region | Potential investment date(1) |
MW | ||||||||||
| Canada | ||||||||||||||
| Riplinger Wind | Wind | Alberta | 2025 | 300 | ||||||||||
| Sunhills Solar | Solar | Alberta | 2025 | 170 | ||||||||||
| McNeil Solar | Solar | Alberta | 2025 | 57 | ||||||||||
| New Brunswick Battery | Battery | New Brunswick | 2025 | 10 | ||||||||||
Tent Mountain Pumped Storage(2) |
Hydro | Alberta | 2026 | 160 | ||||||||||
| Provost | Wind | Alberta | 2026 | 170 | ||||||||||
| Antelope Coulee | Wind | Saskatchewan | 2027+ | 200 | ||||||||||
| Red Rock | Wind | Alberta | 2027 | 100 | ||||||||||
| Willow Creek 1 | Wind | Alberta | 2027 | 70 | ||||||||||
| Willow Creek 2 | Wind | Alberta | 2027 | 70 | ||||||||||
| Other Canadian Opportunities | Wind | Various | 2026+ | 190 | ||||||||||
| Brazeau Pumped Hydro | Hydro | Alberta | TBD | 300-900 | ||||||||||
Alberta Thermal Redevelopment(3) |
Various | Alberta | TBD | 250-500 | ||||||||||
| Total | 2,047 - 2,897 | |||||||||||||
| United States | ||||||||||||||
| Monument Road | Wind | Nebraska | 2025 | 152 | ||||||||||
| Swan Creek | Wind | Nebraska | 2025 | 126 | ||||||||||
| Dos Rios | Wind | Oklahoma | 2025 | 242 | ||||||||||
| Cotton Belle 1 | Solar | Texas | 2025 | 104 | ||||||||||
| Cotton Belle 2 | Solar | Texas | 2025 | 81 | ||||||||||
| Square Top | Solar | Oklahoma | 2026 | 195 | ||||||||||
| Old Town | Wind | Illinois | 2026 | 185 | ||||||||||
| Canadian River | Wind | Oklahoma | 2026 | 250 | ||||||||||
| Prairie Violet | Wind | Illinois | 2026 | 130 | ||||||||||
| Quick Draw | Wind | Texas | 2026 | 174 | ||||||||||
| Big Timber | Wind | Pennsylvania | 2026 | 50 | ||||||||||
| Trapper Valley | Wind | Wyoming | 2027 | 225 | ||||||||||
| Wild Waters | Wind | Minnesota | 2027+ | 40 | ||||||||||
| Coolspring | Wind | Pennsylvania | 2027+ | 120 | ||||||||||
| Other US Opportunities | Wind | Various | 2026+ | 144 | ||||||||||
Centralia Site Redevelopment(3) |
Various | Washington | TBD | 250-500 | ||||||||||
| Total | 2,468 - 2,718 | |||||||||||||
| Australia | ||||||||||||||
| Boodarie Solar | Solar | Western Australia | 2024 | 50 | ||||||||||
| Southern Cross Energy | Wind and Solar | Western Australia | TBD | 120 | ||||||||||
| Other Australian Opportunities | Gas, Solar, Transmission | Western Australia | 2024+ | 230 | ||||||||||
| Total | 400 | |||||||||||||
| Canada, United States and Australia | Total | 4,915 - 6,015 | ||||||||||||
M34 |
TransAlta Corporation | 2023 Integrated Report | ||||||
| Total project (millions) | ||||||||||||||||||||||||||||||||||||||
| Project | Type | Region | MW | Estimated spend |
Spent to date |
Target
completion
date
|
PPA
Term(1)
|
Average
annual
EBITDA(2)
|
Status | |||||||||||||||||||||||||||||
| United States | ||||||||||||||||||||||||||||||||||||||
|
White
Rock
|
Wind | OK | 300 | US$510 | — | US$530 | US$477 | Q1 2024 | — | US$53-US$57 |
•Long-term PPAs executed
•Installation/assembly complete
•Final stages of commissioning underway
|
|||||||||||||||||||||||||||
|
Horizon
Hill
|
Wind | OK | 200 | US$330 | — | US$340 | US$307 | Q1 2024 | — | US$31-US$33 |
•Long-term PPA executed
•Installation/assembly complete
•Final stages of commissioning underway
|
|||||||||||||||||||||||||||
| Australia | ||||||||||||||||||||||||||||||||||||||
|
Mount
Keith
132kV
Expansion
|
Transmission | WA | n/a | AU$54 | — | AU$57 | AU$45 | Q1 2024 | 15 | AU$6 - AU$7 |
•Installation/assembly complete
•Final stages of commissioning underway
|
|||||||||||||||||||||||||||
| Mount Keith West Network Upgrade | Transmission | WA | n/a | AU$37 | — | AU$40 | AU$12 | Q2 2025 | 14 | AU$6 - AU$7 |
•Major equipment orders placed
•Detailed design and execution planning underway
•On track to be completed on schedule
|
|||||||||||||||||||||||||||
Total(3) |
500 | $1,228 | — | $1,274 | 1,360 | $125 - $135 | ||||||||||||||||||||||||||||||||
| TransAlta Corporation | 2023 Integrated Report | M35 |
||||||
| Dec. 31, 2023 | Dec. 31, 2022 | Increase/(decrease) | |||||||||
| Assets | |||||||||||
| Current assets | |||||||||||
| Cash and cash equivalents | 348 | 1,134 | (786) | ||||||||
| Trade and other receivables | 807 | 1,589 | (782) | ||||||||
| Risk management assets | 151 | 709 | (558) | ||||||||
Other current assets(1) |
274 | 282 | (8) | ||||||||
| Total current assets | 1,580 | 3,714 | (2,134) | ||||||||
| Non-current assets | |||||||||||
| Risk management assets | 52 | 161 | (109) | ||||||||
| Property, plant and equipment, net | 5,714 | 5,556 | 158 | ||||||||
Long-term portion of finance lease receivable |
171 | 129 | 42 | ||||||||
Other non-current assets(2) |
1,142 | 1,181 | (39) | ||||||||
| Total non-current assets | 7,079 | 7,027 | 52 | ||||||||
| Total assets | 8,659 | 10,741 | (2,082) | ||||||||
| Liabilities | |||||||||||
| Current liabilities | |||||||||||
| Accounts payable and accrued liabilities | 797 | 1,346 | (549) | ||||||||
| Risk management liabilities | 314 | 1,129 | (815) | ||||||||
| Income taxes payable | 9 | 73 | (64) | ||||||||
| Credit facilities, long-term debt and lease liabilities | 532 | 178 | 354 | ||||||||
Other current liabilities(3) |
90 | 162 | (72) | ||||||||
| Total current liabilities | 1,742 | 2,888 | (1,146) | ||||||||
| Non-current liabilities | |||||||||||
| Credit facilities, long-term debt and lease liabilities | 2,934 | 3,475 | (541) | ||||||||
| Risk management liabilities (long-term) | 274 | 333 | (59) | ||||||||
| Defined benefit obligation and other long-term liabilities | 251 | 294 | (43) | ||||||||
Deferred income tax liabilities |
386 | 352 | 34 | ||||||||
Other non-current liabilities(4) |
1,408 | 1,410 | (2) | ||||||||
| Total non-current liabilities | 5,253 | 5,864 | (611) | ||||||||
| Total liabilities | 6,995 | 8,752 | (1,757) | ||||||||
| Equity | |||||||||||
| Equity attributable to shareholders | 1,537 | 1,110 | 427 | ||||||||
| Non-controlling interests | 127 | 879 | (752) | ||||||||
| Total equity | 1,664 | 1,989 | (325) | ||||||||
| Total liabilities and equity | 8,659 | 10,741 | (2,082) | ||||||||
M36 |
TransAlta Corporation | 2023 Integrated Report | ||||||
| TransAlta Corporation | 2023 Integrated Report | M37 |
||||||
| 2023 | 2022 | 2021 | ||||||||||||||||||||||||
| $ | % | $ | % | $ | % | |||||||||||||||||||||
| Net senior unsecured debt | ||||||||||||||||||||||||||
Recourse debt - CAD debentures |
251 | 5 | 251 | 5 | 251 | 4 | ||||||||||||||||||||
Recourse debt - US senior notes |
911 | 17 | 934 | 18 | 888 | 16 | ||||||||||||||||||||
Credit facilities |
397 | 7 | 428 | 9 | — | — | ||||||||||||||||||||
| Other | — | — | 1 | — | 4 | — | ||||||||||||||||||||
Less: cash and cash equivalents(1) |
(345) | (6) | (1,118) | (21) | (947) | (17) | ||||||||||||||||||||
Less: other cash and liquid assets(2) |
(12) | — | (20) | — | (19) | — | ||||||||||||||||||||
| Net senior unsecured debt | 1,202 | 23 | 476 | 11 | 177 | 3 | ||||||||||||||||||||
| Other debt liabilities | ||||||||||||||||||||||||||
| Exchangeable debentures | 344 | 6 | 339 | 6 | 335 | 6 | ||||||||||||||||||||
| Non-recourse debt | ||||||||||||||||||||||||||
| TAPC Holdings LP bond | 85 | 1 | 94 | 2 | 102 | 2 | ||||||||||||||||||||
| Pingston bond | 39 | 1 | 45 | 1 | 45 | 1 | ||||||||||||||||||||
| Melancthon Wolfe Wind bond | 168 | 3 | 202 | 4 | 235 | 4 | ||||||||||||||||||||
| New Richmond Wind bond | 103 | 2 | 112 | 2 | 120 | 2 | ||||||||||||||||||||
| Kent Hills Wind bond | 193 | 3 | 206 | 4 | 221 | 4 | ||||||||||||||||||||
| Windrise Wind bond | 164 | 3 | 170 | 3 | 171 | 3 | ||||||||||||||||||||
| South Hedland non-recourse debt | 691 | 13 | 711 | 14 | 732 | 13 | ||||||||||||||||||||
| OCP Bond | 217 | 4 | 241 | 4 | 263 | 5 | ||||||||||||||||||||
| US tax equity financing | 104 | 1 | 123 | 2 | 135 | 2 | ||||||||||||||||||||
| Lease liabilities | 143 | 3 | 135 | 2 | 100 | 2 | ||||||||||||||||||||
Total consolidated net debt(3)(4)(5) |
3,453 | 63 | 2,854 | 55 | 2,636 | 47 | ||||||||||||||||||||
Exchangeable preferred securities(5) |
400 | 7 | 400 | 7 | 400 | 7 | ||||||||||||||||||||
| Equity attributable to shareholders | ||||||||||||||||||||||||||
| Common shares | 3,285 | 60 | 2,863 | 54 | 2,901 | 51 | ||||||||||||||||||||
| Preferred shares | 942 | 17 | 942 | 18 | 942 | 17 | ||||||||||||||||||||
| Contributed surplus, deficit and accumulated other comprehensive loss | (2,690) | (49) | (2,695) | (51) | (2,261) | (40) | ||||||||||||||||||||
| Non-controlling interests | 127 | 2 | 879 | 17 | 1,011 | 18 | ||||||||||||||||||||
| Total capital | 5,517 | 100 | 5,243 | 100 | 5,629 | 100 | ||||||||||||||||||||
M38 |
TransAlta Corporation | 2023 Integrated Report | ||||||
| As at Dec. 31, 2023 | Utilized | Available capacity |
Maturity date |
||||||||||||||
| Credit facilities | Facility size |
Outstanding letters of credit(1) |
Cash drawings | ||||||||||||||
| Committed | |||||||||||||||||
TransAlta syndicated credit facility |
1,950 | 417 | — | 1,533 | Q2 2027 | ||||||||||||
TransAlta bilateral credit facilities |
240 | 178 | — | 62 | Q2 2025 | ||||||||||||
TransAlta Term Facility |
400 | — | 400 | — | Q3 2024 | ||||||||||||
Total committed |
2,590 | 595 | 400 | 1,595 | |||||||||||||
Non-committed |
|||||||||||||||||
TransAlta demand facilities |
400 | 187 | — | 213 | N/A | ||||||||||||
Total non-committed |
400 | 187 | — | 213 | |||||||||||||
| TransAlta Corporation | 2023 Integrated Report | M39 |
||||||
| Facility |
Commercial
operation date
|
Expected Flip
Point
|
Initial TEI
investment ($)
|
Expected
annual PTC ($)
|
TEI allocation
of cash
distributions
(pre-Flip Point)
Undiscounted(1)
($)
|
TEI allocation
of taxable
income and
PTCs
(pre-Flip Point)
|
||||||||||||||
| Lakeswind | 2014 | 2029 | 45 | 1 | 11 | 99 | % | |||||||||||||
| Big Level and Antrim | 2019 | 2030 | 126 | 10 | 46 | 99 | % | |||||||||||||
Skookumchuck(2) |
2020 | 2030 | 121 | 10 | 21 | 99 | % | |||||||||||||
M40 |
TransAlta Corporation | 2023 Integrated Report | ||||||
| Year ended Dec. 31 | 2023 | 2022 | 2021 | ||||||||
| Interest income | 59 | 24 | 11 | ||||||||
| Interest on debt | 203 | 164 | 163 | ||||||||
| Interest on exchangeable debentures | 29 | 29 | 29 | ||||||||
| Interest on exchangeable preferred shares | 28 | 28 | 28 | ||||||||
| Capitalized interest | (57) | (16) | (14) | ||||||||
| Interest on lease liabilities | 9 | 7 | 7 | ||||||||
| Credit facility fees, bank charges and other interest | 21 | 27 | 20 | ||||||||
| Tax shield on tax equity financing | — | (2) | (9) | ||||||||
| Accretion of provisions | 48 | 49 | 32 | ||||||||
| Interest expense | 281 | 286 | 256 | ||||||||
| Number of shares (millions) | |||||||||||
| As at | Feb. 22, 2024 | Dec. 31, 2023 | Dec. 31, 2022 | ||||||||
| Common shares issued and outstanding, end of period | 307.1 | 308.6 | 268.1 | ||||||||
| Preferred shares | |||||||||||
| Series A | 9.6 | 9.6 | 9.6 | ||||||||
| Series B | 2.4 | 2.4 | 2.4 | ||||||||
| Series C | 10.0 | 10.0 | 10.0 | ||||||||
| Series D | 1.0 | 1.0 | 1.0 | ||||||||
| Series E | 9.0 | 9.0 | 9.0 | ||||||||
| Series G | 6.6 | 6.6 | 6.6 | ||||||||
| Preferred shares issued and outstanding in equity | 38.6 | 38.6 | 38.6 | ||||||||
Series I - Exchangeable Securities(1) |
0.4 | 0.4 | 0.4 | ||||||||
| Preferred shares issued and outstanding | 39.0 | 39.0 | 39.0 | ||||||||
| TransAlta Corporation | 2023 Integrated Report | M41 |
||||||
| Year ended Dec. 31 | 2023 | 2022 | Increase/ (decrease) | |||||||||||
Cash and cash equivalents, beginning of year |
1,134 | 947 | 187 | |||||||||||
| Provided by (used in): | ||||||||||||||
| Operating activities | 1,464 | 877 | 587 | |||||||||||
| Investing activities | (814) | (741) | (73) | |||||||||||
| Financing activities | (1,432) | 45 | (1,477) | |||||||||||
| Translation of foreign currency cash | (4) | 6 | (10) | |||||||||||
Cash and cash equivalents, end of year |
348 | 1,134 | (786) | |||||||||||
| Year ended Dec. 31 | |||||
| Cash flow from operating activities for the year ended Dec. 31, 2022 | 877 | ||||
Higher gross margin: Lower natural gas costs included in fuel and purchased power, partially offset by lower revenues net of unrealized gains and losses from risk management activities and higher carbon compliance costs. |
127 | ||||
Higher OM&A: Increased spending on strategic and growth initiatives; higher costs associated with the relocation of the Company's head office; and increased costs due to inflationary pressures. |
(18) | ||||
Lower current income tax expense: Previously restricted non-capital loss carryforwards were utilized to offset taxable income. |
15 | ||||
Higher interest income: Higher cash balances and favourable interest rates |
35 | ||||
Favourable change in non-cash operating working capital balances: Lower accounts receivable and collateral provided as a result of volatility in the market and market prices, partially offset by lower accounts payable and collateral received related to derivative instruments. |
440 | ||||
| Other | (12) | ||||
| Cash flow from operating activities for the year ended Dec. 31, 2023 | 1,464 | ||||
M42 |
TransAlta Corporation | 2023 Integrated Report | ||||||
| Year ended Dec. 31 | |||||
Cash flow used in investing activities for the year ended Dec. 31, 2022 |
(741) | ||||
Lower additions to PP&E: Additions in 2022 were mainly for the construction of the White Rock wind projects, Garden Plain wind facility, the Horizon Hill wind project and the Northern Goldfields solar facilities. In 2023, most of these facilities achieved commercial operation. |
43 | ||||
Lower intangible assets: Lower additions of intangibles under development. |
18 | ||||
Lower proceeds on sale of PP&E: In 2022, the Company closed the sale of two hydro facilities and sold equipment related to its Sundance Unit 5 energy transition assets and other equipment. |
(37) | ||||
Unfavourable change in non-cash investing working capital balances: Lower capital accruals. |
(28) | ||||
Other(1) |
(69) | ||||
Cash flow used in investing activities for the year ended Dec. 31, 2023 |
(814) | ||||
| Year ended Dec. 31 | |||||
| Cash flow from financing activities for the year ended Dec. 31, 2022 | 45 | ||||
Lower repayment of long-term debt: In 2022, the Company repaid the US$400 million senior notes. |
457 | ||||
Higher share capital issuance: Used cash and issued shares to acquire TransAlta Renewables. |
(811) | ||||
Lower net increase in borrowings under credit facilities: In 2022, the Company fully utilized the $400 million Term Facility, which continues to remain outstanding. |
(495) | ||||
Lower issuance of long-term debt: In 2022, the Company issued US$400 million senior notes. |
(493) | ||||
Lower realized gains on financial instruments: The Company recognized a gain on the repayment of US$400 million senior notes in 2022. |
(72) | ||||
Higher distributions paid to non-controlling interests: Timing of distributions to TA Cogen, partially offset by lower distributions to TransAlta. |
(36) | ||||
Higher repurchases of common shares under the NCIB. |
(35) | ||||
| Other | 8 | ||||
Cash flow used in financing activities for the year ended Dec. 31, 2023 |
(1,432) | ||||
| TransAlta Corporation | 2023 Integrated Report | M43 |
||||||
| 2024 | 2025 | 2026 | 2027 | 2028 | 2029 and thereafter | Total | |||||||||||||||||
Natural gas and transportation contracts(1) |
55 | 49 | 50 | 48 | 57 | 436 | 695 | ||||||||||||||||
Transmission(1) |
9 | 9 | 6 | 4 | 5 | 93 | 126 | ||||||||||||||||
Coal supply and mining agreements(1) |
86 | 71 | — | — | — | — | 157 | ||||||||||||||||
Long-term service agreements(1) |
60 | 57 | 42 | 44 | 37 | 184 | 424 | ||||||||||||||||
Operating leases(1,2) |
3 | 3 | 2 | 2 | 2 | 25 | 37 | ||||||||||||||||
Long-term debt(3) |
526 | 142 | 143 | 153 | 162 | 2,237 | 3,363 | ||||||||||||||||
Exchangeable securities(4) |
— | — | — | — | — | 750 | 750 | ||||||||||||||||
Principal payments on lease liabilities(5) |
4 | 4 | 4 | 4 | 4 | 123 | 143 | ||||||||||||||||
Interest on long-term debt and lease liabilities(1,6) |
186 | 167 | 158 | 151 | 143 | 711 | 1,516 | ||||||||||||||||
Interest on exchangeable securities(1,4) |
53 | 53 | 53 | 53 | 53 | 13 | 278 | ||||||||||||||||
Growth(1,7) |
47 | — | — | — | — | — | 47 | ||||||||||||||||
| Total | 1,029 | 555 | 458 | 459 | 463 | 4,572 | 7,536 | ||||||||||||||||
M44 |
TransAlta Corporation | 2023 Integrated Report | ||||||
| TransAlta Corporation | 2023 Integrated Report | M45 |
||||||
M46 |
TransAlta Corporation | 2023 Integrated Report | ||||||
| TransAlta Corporation | 2023 Integrated Report | M47 |
||||||
M48 |
TransAlta Corporation | 2023 Integrated Report | ||||||
| TransAlta Corporation | 2023 Integrated Report | M49 |
||||||
| Hydro | Wind & Solar(1) |
Gas | Energy Transition | Energy Marketing |
Corporate | Total | Equity- accounted investments(1) |
Reclass adjustments | IFRS financials | |||||||||||||||||||||||
| Revenues | 533 | 357 | 1,514 | 751 | 220 | 1 | 3,376 | (21) | — | 3,355 | ||||||||||||||||||||||
| Reclassifications and adjustments: | ||||||||||||||||||||||||||||||||
| Unrealized mark-to-market (gain) loss | (4) | 16 | (67) | (5) | 23 | — | (37) | — | 37 | — | ||||||||||||||||||||||
| Realized gain (loss) on closed exchange positions | — | — | 10 | — | (91) | — | (81) | — | 81 | — | ||||||||||||||||||||||
| Decrease in finance lease receivable | — | — | 55 | — | — | — | 55 | — | (55) | — | ||||||||||||||||||||||
| Finance lease income | — | — | 12 | — | — | — | 12 | — | (12) | — | ||||||||||||||||||||||
| Unrealized foreign exchange loss on commodity | — | — | 1 | — | — | — | 1 | — | (1) | — | ||||||||||||||||||||||
| Adjusted revenues | 529 | 373 | 1,525 | 746 | 152 | 1 | 3,326 | (21) | 50 | 3,355 | ||||||||||||||||||||||
| Fuel and purchased power | 19 | 30 | 453 | 557 | — | 1 | 1,060 | — | — | 1,060 | ||||||||||||||||||||||
| Reclassifications and adjustments: | ||||||||||||||||||||||||||||||||
| Australian interest income | — | — | (4) | — | — | — | (4) | — | 4 | — | ||||||||||||||||||||||
| Adjusted fuel and purchased power | 19 | 30 | 449 | 557 | — | 1 | 1,056 | — | 4 | 1,060 | ||||||||||||||||||||||
| Carbon compliance | — | — | 112 | — | — | — | 112 | — | — | 112 | ||||||||||||||||||||||
| Gross margin | 510 | 343 | 964 | 189 | 152 | — | 2,158 | (21) | 46 | 2,183 | ||||||||||||||||||||||
| OM&A | 48 | 80 | 192 | 64 | 43 | 115 | 542 | (3) | — | 539 | ||||||||||||||||||||||
| Taxes, other than income taxes | 3 | 12 | 11 | 3 | — | 1 | 30 | (1) | — | 29 | ||||||||||||||||||||||
| Net other operating income | — | (7) | (40) | — | — | — | (47) | — | — | (47) | ||||||||||||||||||||||
| Reclassifications and adjustments: | ||||||||||||||||||||||||||||||||
| Insurance recovery | — | 1 | — | — | — | — | 1 | — | (1) | — | ||||||||||||||||||||||
| Adjusted net other operating income | — | (6) | (40) | — | — | — | (46) | — | (1) | (47) | ||||||||||||||||||||||
Adjusted EBITDA(2) |
459 | 257 | 801 | 122 | 109 | (116) | 1,632 | |||||||||||||||||||||||||
| Equity income | 4 | |||||||||||||||||||||||||||||||
| Finance lease income | 12 | |||||||||||||||||||||||||||||||
| Depreciation and amortization | (621) | |||||||||||||||||||||||||||||||
| Asset impairment reversals | 48 | |||||||||||||||||||||||||||||||
Interest income |
59 | |||||||||||||||||||||||||||||||
Interest expense |
(281) | |||||||||||||||||||||||||||||||
| Foreign exchange loss | (7) | |||||||||||||||||||||||||||||||
Gain on sale of assets and other |
4 | |||||||||||||||||||||||||||||||
| Earnings before income taxes | 880 | |||||||||||||||||||||||||||||||
M50 |
TransAlta Corporation | 2023 Integrated Report | ||||||
| Hydro | Wind & Solar(1) |
Gas | Energy Transition | Energy Marketing |
Corporate | Total | Equity- accounted investments(1) |
Reclass adjustments | IFRS financials | |||||||||||||||||||||||
| Revenues | 606 | 303 | 1,209 | 714 | 160 | (2) | 2,990 | (14) | — | 2,976 | ||||||||||||||||||||||
| Reclassifications and adjustments: | ||||||||||||||||||||||||||||||||
| Unrealized mark-to-market loss | 1 | 104 | 251 | 10 | 12 | — | 378 | — | (378) | — | ||||||||||||||||||||||
| Realized gain (loss) on closed exchange positions | — | — | (4) | — | 47 | — | 43 | — | (43) | — | ||||||||||||||||||||||
| Decrease in finance lease receivable | — | — | 46 | — | — | — | 46 | — | (46) | — | ||||||||||||||||||||||
| Finance lease income | — | — | 19 | — | — | — | 19 | — | (19) | — | ||||||||||||||||||||||
Unrealized foreign exchange gain on commodity |
— | — | — | — | (1) | — | (1) | — | 1 | — | ||||||||||||||||||||||
| Adjusted revenues | 607 | 407 | 1,521 | 724 | 218 | (2) | 3,475 | (14) | (485) | 2,976 | ||||||||||||||||||||||
| Fuel and purchased power | 22 | 31 | 641 | 566 | — | 3 | 1,263 | — | — | 1,263 | ||||||||||||||||||||||
| Reclassifications and adjustments: | ||||||||||||||||||||||||||||||||
| Australian interest income | — | — | (4) | — | — | — | (4) | — | 4 | — | ||||||||||||||||||||||
| Adjusted fuel and purchased power | 22 | 31 | 637 | 566 | — | 3 | 1,259 | — | 4 | 1,263 | ||||||||||||||||||||||
| Carbon compliance | — | 1 | 83 | (1) | — | (5) | 78 | — | — | 78 | ||||||||||||||||||||||
| Gross margin | 585 | 375 | 801 | 159 | 218 | — | 2,138 | (14) | (489) | 1,635 | ||||||||||||||||||||||
| OM&A | 55 | 68 | 195 | 69 | 35 | 101 | 523 | (2) | — | 521 | ||||||||||||||||||||||
| Taxes, other than income taxes | 3 | 12 | 15 | 4 | — | 1 | 35 | (2) | — | 33 | ||||||||||||||||||||||
| Net other operating income | — | (23) | (38) | — | — | — | (61) | 3 | — | (58) | ||||||||||||||||||||||
| Reclassifications and adjustments: | ||||||||||||||||||||||||||||||||
| Insurance recovery | — | 7 | — | — | — | — | 7 | — | (7) | — | ||||||||||||||||||||||
Adjusted net other operating income |
— | (16) | (38) | — | — | — | (54) | 3 | (7) | (58) | ||||||||||||||||||||||
Adjusted EBITDA(2) |
527 | 311 | 629 | 86 | 183 | (102) | 1,634 | |||||||||||||||||||||||||
| Equity income | 9 | |||||||||||||||||||||||||||||||
| Finance lease income | 19 | |||||||||||||||||||||||||||||||
| Depreciation and amortization | (599) | |||||||||||||||||||||||||||||||
| Asset impairment charges | (9) | |||||||||||||||||||||||||||||||
Interest income |
24 | |||||||||||||||||||||||||||||||
Interest expense |
(286) | |||||||||||||||||||||||||||||||
| Foreign exchange gain | 4 | |||||||||||||||||||||||||||||||
Gain on sale of assets and other |
52 | |||||||||||||||||||||||||||||||
| Earnings before income taxes | 353 | |||||||||||||||||||||||||||||||
| TransAlta Corporation | 2023 Integrated Report | M51 |
||||||
| Hydro | Wind & Solar(1) |
Gas | Energy Transition | Energy Marketing |
Corporate | Total | Equity- accounted investments(1) |
Reclass adjustments | IFRS financials | |||||||||||||||||||||||
| Revenues | 383 | 323 | 1,109 | 709 | 211 | 4 | 2,739 | (18) | — | 2,721 | ||||||||||||||||||||||
| Reclassifications and adjustments: | ||||||||||||||||||||||||||||||||
| Unrealized mark-to-market (gain) loss | — | 25 | (40) | 19 | (38) | — | (34) | — | 34 | — | ||||||||||||||||||||||
| Realized gain (loss) on closed exchange positions | — | — | (6) | — | 29 | — | 23 | — | (23) | — | ||||||||||||||||||||||
| Decrease in finance lease receivable | — | — | 41 | — | — | — | 41 | — | (41) | — | ||||||||||||||||||||||
| Finance lease income | — | — | 25 | — | — | — | 25 | — | (25) | — | ||||||||||||||||||||||
| Unrealized foreign exchange gain on commodity | — | — | (3) | — | — | — | (3) | — | 3 | — | ||||||||||||||||||||||
| Adjusted revenues | 383 | 348 | 1,126 | 728 | 202 | 4 | 2,791 | (18) | (52) | 2,721 | ||||||||||||||||||||||
| Fuel and purchased power | 16 | 17 | 457 | 560 | — | 4 | 1,054 | — | — | 1,054 | ||||||||||||||||||||||
| Reclassifications and adjustments: | ||||||||||||||||||||||||||||||||
| Australian interest income | — | — | (4) | — | — | — | (4) | — | 4 | — | ||||||||||||||||||||||
| Mine depreciation | — | — | (79) | (111) | — | — | (190) | — | 190 | — | ||||||||||||||||||||||
Coal inventory writedown |
— | — | — | (17) | — | — | (17) | — | 17 | — | ||||||||||||||||||||||
| Adjusted fuel and purchased power | 16 | 17 | 374 | 432 | — | 4 | 843 | — | 211 | 1,054 | ||||||||||||||||||||||
| Carbon compliance | — | — | 118 | 60 | — | — | 178 | — | — | 178 | ||||||||||||||||||||||
| Gross margin | 367 | 331 | 634 | 236 | 202 | — | 1,770 | (18) | (263) | 1,489 | ||||||||||||||||||||||
| OM&A | 42 | 59 | 175 | 117 | 36 | 84 | 513 | (2) | — | 511 | ||||||||||||||||||||||
| Reclassifications and adjustments: | ||||||||||||||||||||||||||||||||
Parts and materials writedown |
— | — | (2) | (26) | — | — | (28) | — | 28 | — | ||||||||||||||||||||||
| Curtailment gain | — | — | — | 6 | — | — | 6 | — | (6) | — | ||||||||||||||||||||||
| Adjusted OM&A | 42 | 59 | 173 | 97 | 36 | 84 | 491 | (2) | 22 | 511 | ||||||||||||||||||||||
| Taxes, other than income taxes | 3 | 10 | 13 | 6 | — | 1 | 33 | (1) | — | 32 | ||||||||||||||||||||||
| Net other operating income | — | — | (40) | 48 | — | — | 8 | — | — | 8 | ||||||||||||||||||||||
| Reclassifications and adjustments: | ||||||||||||||||||||||||||||||||
| Royalty onerous contract and contract termination penalties | — | — | — | (48) | — | — | (48) | — | 48 | — | ||||||||||||||||||||||
| Adjusted net other operating income | — | — | (40) | — | — | — | (40) | — | 48 | 8 | ||||||||||||||||||||||
Adjusted EBITDA(2) |
322 | 262 | 488 | 133 | 166 | (85) | 1,286 | |||||||||||||||||||||||||
| Equity income | 9 | |||||||||||||||||||||||||||||||
| Finance lease income | 25 | |||||||||||||||||||||||||||||||
| Depreciation and amortization | (529) | |||||||||||||||||||||||||||||||
| Asset impairment charges | (648) | |||||||||||||||||||||||||||||||
| Interest income | 11 | |||||||||||||||||||||||||||||||
| Interest expense | (256) | |||||||||||||||||||||||||||||||
| Foreign exchange gain | 16 | |||||||||||||||||||||||||||||||
| Gain on sale of assets and other | 54 | |||||||||||||||||||||||||||||||
| Loss before income taxes | (380) | |||||||||||||||||||||||||||||||
M52 |
TransAlta Corporation | 2023 Integrated Report | ||||||
| 2023 | 2022 | 2021 | ||||||||||||
Cash flow from operating activities(1) |
1,464 | 877 | 1,001 | |||||||||||
| Change in non-cash operating working capital balances | (124) | 316 | (174) | |||||||||||
| Cash flow from operations before changes in working capital | 1,340 | 1,193 | 827 | |||||||||||
| Adjustments | ||||||||||||||
Share of adjusted FFO from joint venture(1) |
8 | 8 | 13 | |||||||||||
| Decrease in finance lease receivable | 55 | 46 | 41 | |||||||||||
Clean energy transition provisions and adjustments(2) |
11 | 42 | 79 | |||||||||||
| Realized gain (loss) on closed exchanged positions | (81) | 37 | 23 | |||||||||||
Other(3) |
18 | 20 | 11 | |||||||||||
FFO(4) |
1,351 | 1,346 | 994 | |||||||||||
| Deduct: | ||||||||||||||
Sustaining capital(1) |
(174) | (142) | (199) | |||||||||||
| Productivity capital | (3) | (4) | (4) | |||||||||||
| Dividends paid on preferred shares | (51) | (43) | (39) | |||||||||||
| Distributions paid to subsidiaries’ non-controlling interests | (223) | (187) | (159) | |||||||||||
| Principal payments on lease liabilities | (10) | (9) | (8) | |||||||||||
FCF(4) |
890 | 961 | 585 | |||||||||||
| Weighted average number of common shares outstanding in the period | 276 | 271 | 271 | |||||||||||
FFO per share(4) |
4.89 | 4.97 | 3.67 | |||||||||||
FCF per share(4) |
3.22 | 3.55 | 2.16 | |||||||||||
| TransAlta Corporation | 2023 Integrated Report | M53 |
||||||
| Year ended Dec. 31 | 2023 | 2022 | 2021 | |||||||||||
Adjusted EBITDA(1)(4) |
1,632 | 1,634 | 1,286 | |||||||||||
| Provisions | (1) | 25 | (43) | |||||||||||
Net interest expense(2) |
(164) | (200) | (200) | |||||||||||
| Current income tax expense | (50) | (65) | (56) | |||||||||||
Realized foreign exchange loss |
(4) | — | (2) | |||||||||||
| Decommissioning and restoration costs settled | (37) | (35) | (18) | |||||||||||
| Other non-cash items | (25) | (13) | 27 | |||||||||||
FFO(3)(4) |
1,351 | 1,346 | 994 | |||||||||||
| Deduct: | ||||||||||||||
Sustaining capital(4) |
(174) | (142) | (199) | |||||||||||
| Productivity capital | (3) | (4) | (4) | |||||||||||
| Dividends paid on preferred shares | (51) | (43) | (39) | |||||||||||
| Distributions paid to subsidiaries’ non-controlling interests | (223) | (187) | (159) | |||||||||||
| Principal payments on lease liabilities | (10) | (9) | (8) | |||||||||||
FCF(4) |
890 | 961 | 585 | |||||||||||
M54 |
TransAlta Corporation | 2023 Integrated Report | ||||||
| Hydro | Wind & Solar(1) |
Gas | Energy Transition | Energy Marketing |
Corporate | Total | Equity- accounted investments(1) |
Reclass adjustments | IFRS financials | |||||||||||||||||||||||
| Revenues | 77 | 94 | 246 | 175 | 39 | — | 631 | (7) | — | 624 | ||||||||||||||||||||||
| Reclassifications and adjustments: | ||||||||||||||||||||||||||||||||
| Unrealized mark-to-market (gain) loss | (2) | 20 | 53 | 7 | (19) | — | 59 | — | (59) | — | ||||||||||||||||||||||
| Realized gain on closed exchange positions | — | — | 23 | — | 4 | — | 27 | — | (27) | — | ||||||||||||||||||||||
Decrease in finance lease receivable |
— | — | 15 | — | — | — | 15 | — | (15) | — | ||||||||||||||||||||||
| Finance lease income | — | — | 2 | — | — | — | 2 | — | (2) | — | ||||||||||||||||||||||
Unrealized foreign exchange gain on commodity |
— | — | 1 | — | — | — | 1 | — | (1) | — | ||||||||||||||||||||||
| Adjusted revenues | 75 | 114 | 340 | 182 | 24 | — | 735 | (7) | (104) | 624 | ||||||||||||||||||||||
| Fuel and purchased power | 5 | 8 | 127 | 138 | — | — | 278 | — | — | 278 | ||||||||||||||||||||||
Reclassifications and adjustments: |
||||||||||||||||||||||||||||||||
| Australian interest income | — | — | (1) | — | — | — | (1) | — | 1 | — | ||||||||||||||||||||||
Adjusted fuel and purchased power |
5 | 8 | 126 | 138 | — | — | 277 | — | 1 | 278 | ||||||||||||||||||||||
| Carbon compliance | — | — | 27 | — | — | — | 27 | — | — | 27 | ||||||||||||||||||||||
| Gross margin | 70 | 106 | 187 | 44 | 24 | — | 431 | (7) | (105) | 319 | ||||||||||||||||||||||
| OM&A | 13 | 25 | 56 | 18 | 10 | 29 | 151 | (1) | — | 150 | ||||||||||||||||||||||
Taxes, other than income taxes |
1 | 1 | — | — | — | 1 | 3 | — | — | 3 | ||||||||||||||||||||||
| Net other operating income | — | (3) | (10) | — | — | — | (13) | — | — | (13) | ||||||||||||||||||||||
| Reclassifications and adjustments: | ||||||||||||||||||||||||||||||||
| Insurance recovery | — | 1 | — | — | — | — | 1 | — | (1) | — | ||||||||||||||||||||||
Adjusted net other operating income |
— | (2) | (10) | — | — | — | (12) | — | (1) | (13) | ||||||||||||||||||||||
Adjusted EBITDA(2) |
56 | 82 | 141 | 26 | 14 | (30) | 289 | |||||||||||||||||||||||||
| Equity income | 3 | |||||||||||||||||||||||||||||||
| Finance lease income | 2 | |||||||||||||||||||||||||||||||
| Depreciation and amortization | (132) | |||||||||||||||||||||||||||||||
| Asset impairment reversals | (26) | |||||||||||||||||||||||||||||||
| Interest income | 12 | |||||||||||||||||||||||||||||||
| Interest expense | (66) | |||||||||||||||||||||||||||||||
| Foreign exchange loss | (7) | |||||||||||||||||||||||||||||||
| Loss before income taxes | (35) | |||||||||||||||||||||||||||||||
| TransAlta Corporation | 2023 Integrated Report | M55 |
||||||
| Hydro | Wind & Solar(1) |
Gas | Energy Transition | Energy Marketing |
Corporate | Total | Equity- accounted investments(1) |
Reclass adjustments | IFRS financials | |||||||||||||||||||||||
| Revenues | 159 | 98 | 276 | 281 | 44 | — | 858 | (4) | — | 854 | ||||||||||||||||||||||
| Reclassifications and adjustments: | ||||||||||||||||||||||||||||||||
| Unrealized mark-to-market (gain) loss | 1 | 23 | 238 | (7) | 12 | — | 267 | — | (267) | — | ||||||||||||||||||||||
| Realized gain on closed exchange positions | — | — | 7 | — | 20 | — | 27 | — | (27) | — | ||||||||||||||||||||||
Decrease in finance lease receivable |
— | — | 12 | — | — | — | 12 | — | (12) | — | ||||||||||||||||||||||
| Finance lease income | — | — | 4 | — | — | — | 4 | — | (4) | — | ||||||||||||||||||||||
| Unrealized foreign exchange gain on commodity | — | — | — | — | (1) | — | (1) | — | 1 | — | ||||||||||||||||||||||
| Adjusted revenues | 160 | 121 | 537 | 274 | 75 | — | 1,167 | (4) | (309) | 854 | ||||||||||||||||||||||
| Fuel and purchased power | 5 | 11 | 196 | 234 | — | — | 446 | — | — | 446 | ||||||||||||||||||||||
| Reclassifications and adjustments: | ||||||||||||||||||||||||||||||||
| Australian interest income | — | — | (1) | — | — | — | (1) | — | 1 | — | ||||||||||||||||||||||
Adjusted fuel and purchased power |
5 | 11 | 195 | 234 | — | — | 445 | — | 1 | 446 | ||||||||||||||||||||||
| Carbon compliance | — | — | 27 | — | — | — | 27 | — | — | 27 | ||||||||||||||||||||||
| Gross margin | 155 | 110 | 315 | 40 | 75 | — | 695 | (4) | (310) | 381 | ||||||||||||||||||||||
| OM&A | 22 | 18 | 57 | 19 | 12 | 30 | 158 | (1) | — | 157 | ||||||||||||||||||||||
Taxes, other than income taxes |
— | 5 | 2 | 2 | — | — | 9 | (1) | — | 8 | ||||||||||||||||||||||
| Net other operating income | — | (5) | (8) | — | — | — | (13) | 3 | — | (10) | ||||||||||||||||||||||
Adjusted EBITDA(2) |
133 | 92 | 264 | 19 | 63 | (30) | 541 | |||||||||||||||||||||||||
| Equity income | 4 | |||||||||||||||||||||||||||||||
| Finance lease income | 4 | |||||||||||||||||||||||||||||||
| Depreciation and amortization | (188) | |||||||||||||||||||||||||||||||
| Asset impairment charges | (5) | |||||||||||||||||||||||||||||||
Interest income |
10 | |||||||||||||||||||||||||||||||
Interest expense |
(77) | |||||||||||||||||||||||||||||||
| Foreign exchange loss | (13) | |||||||||||||||||||||||||||||||
| Gain on sale of assets and other | 46 | |||||||||||||||||||||||||||||||
Earnings before income taxes |
7 | |||||||||||||||||||||||||||||||
M56 |
TransAlta Corporation | 2023 Integrated Report | ||||||
| Three months ended Dec. 31 | 2023 | 2022 | |||||||||
Cash flow from operating activities(1) |
310 | 351 | |||||||||
| Change in non-cash operating working capital balances | (135) | 64 | |||||||||
| Cash flow from operations before changes in working capital | 175 | 415 | |||||||||
| Adjustments | |||||||||||
Share of adjusted FFO from joint venture(1) |
(2) | 1 | |||||||||
| Decrease in finance lease receivable | 15 | 12 | |||||||||
Clean energy transition provisions and adjustments(2) |
4 | 7 | |||||||||
Realized gain on closed exchanged positions |
27 | 21 | |||||||||
Other(3) |
10 | 3 | |||||||||
FFO(3) |
229 | 459 | |||||||||
| Deduct: | |||||||||||
Sustaining capital(1) |
(74) | (67) | |||||||||
| Productivity capital | (1) | (1) | |||||||||
| Dividends paid on preferred shares | (12) | (12) | |||||||||
| Distributions paid to subsidiaries’ non-controlling interests | (19) | (61) | |||||||||
| Principal payments on lease liabilities | (2) | (3) | |||||||||
FCF(4) |
121 | 315 | |||||||||
| Weighted average number of common shares outstanding in the period | 308 | 269 | |||||||||
FFO per share(4) |
0.74 | 1.71 | |||||||||
FCF per share(4) |
0.39 | 1.17 | |||||||||
| TransAlta Corporation | 2023 Integrated Report | M57 |
||||||
| Three months ended Dec. 31 | 2023 | 2022 | |||||||||
Adjusted EBITDA(1)(4) |
289 | 541 | |||||||||
| Provisions | (1) | 20 | |||||||||
Net interest expense(2) |
(41) | (49) | |||||||||
Current income tax recovery (expense) |
5 | (29) | |||||||||
| Realized foreign exchange gain (loss) | 9 | (18) | |||||||||
| Decommissioning and restoration costs settled | (15) | (12) | |||||||||
| Other non-cash items | (17) | 6 | |||||||||
FFO(3)(4) |
229 | 459 | |||||||||
| Deduct: | |||||||||||
Sustaining capital(4) |
(74) | (67) | |||||||||
| Productivity capital | (1) | (1) | |||||||||
| Dividends paid on preferred shares | (12) | (12) | |||||||||
| Distributions paid to subsidiaries’ non-controlling interests | (19) | (61) | |||||||||
| Principal payments on lease liabilities | (2) | (3) | |||||||||
FCF(4) |
121 | 315 | |||||||||
M58 |
TransAlta Corporation | 2023 Integrated Report | ||||||
| Year ended Dec. 31 | 2023 | 2022 | 2021 | |||||||||||
Period-end long-term debt(1) |
3,466 | 3,653 | 3,267 | |||||||||||
Exchangeable debentures |
344 | 339 | 335 | |||||||||||
Less: Cash and cash equivalents(2) |
(345) | (1,118) | (947) | |||||||||||
Add: 50 per cent of issued preferred shares and exchangeable preferred shares(3) |
671 | 671 | 671 | |||||||||||
Other(4) |
(12) | (20) | (19) | |||||||||||
Adjusted net debt(5) |
4,124 | 3,525 | 3,307 | |||||||||||
Adjusted EBITDA(6) |
1,632 | 1,634 | 1,286 | |||||||||||
| Adjusted net debt to adjusted EBITDA (times) | 2.5 | 2.2 | 2.6 | |||||||||||
| TransAlta Corporation | 2023 Integrated Report | M59 |
||||||
| Measure | 2024 Target | Updated Target 2023 | 2023 Actuals | ||||||||
Adjusted EBITDA(1)(2) |
$1,150 million - $1,300 million | $1,700 million - $1,800 million | $1,632 million | ||||||||
FCF(1)(2) |
$450 million - $600 million | $850 million - $950 million | $890 million | ||||||||
| FCF per share | $1.47 - $1.96 |
$2.77 - $3.10 |
$3.22 |
||||||||
| Dividend | $0.24 per share annualized | $0.22 per share annualized | $0.22 per share annualized |
||||||||
| Market | 2024 Assumptions | Updated Target 2023 | 2023 Actuals | ||||||||
Alberta spot ($/MWh) |
$75 to $95 | $150 to $170 | $134 | ||||||||
Mid-C spot (US$/MWh) |
US$85 to US$95 | US$90 to US$110 | US$76 | ||||||||
AECO gas price ($/GJ) |
$2.50 to $3.00 | $2.50 | $2.54 | ||||||||
| 2024 Expectations | |||||
| Energy Marketing gross margin | $110 million to $130 million |
||||
| Sustaining capital | $130 million to $150 million | ||||
| Corporate cash taxes | $95 million to $130 million |
||||
| Cash interest | $240 million to $260 million | ||||
| Range of hedging assumptions | 2024 | ||||
| Hedged production (GWh) | 8,152 | ||||
| Hedge price ($/MWh) | $85 | ||||
| Hedged gas volumes (GJ) | 62 million | ||||
| Hedge gas prices ($/GJ) | $2.76 | ||||
M60 |
TransAlta Corporation | 2023 Integrated Report | ||||||
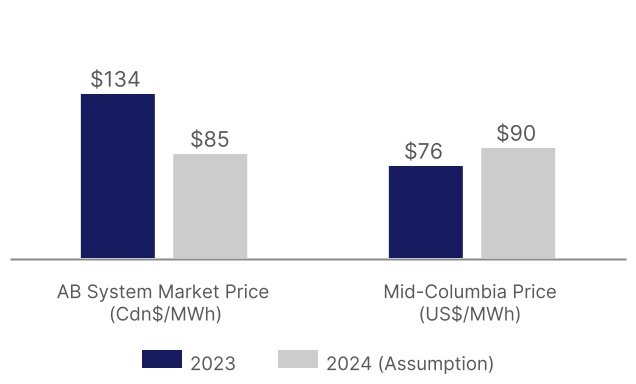
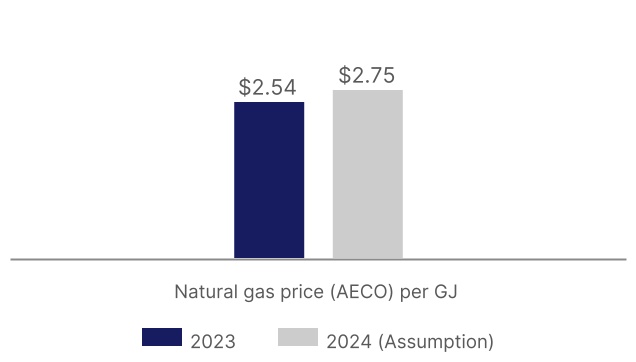
| Spent in 2023 | Expected spend in 2024 | |||||||
Total sustaining capital (millions) |
174 | 130-150 |
||||||
| TransAlta Corporation | 2023 Integrated Report | M61 |
||||||
M62 |
TransAlta Corporation | 2023 Integrated Report | ||||||
| TransAlta Corporation | 2023 Integrated Report | M63 |
||||||
M64 |
TransAlta Corporation | 2023 Integrated Report | ||||||
| TransAlta Corporation | 2023 Integrated Report | M65 |
||||||
M66 |
TransAlta Corporation | 2023 Integrated Report | ||||||
| TransAlta Corporation | 2023 Integrated Report | M67 |
||||||
M68 |
TransAlta Corporation | 2023 Integrated Report | ||||||
| TransAlta Corporation | 2023 Integrated Report | M69 |
||||||
| Sustainability goal | Sustainability target |
Results |
Comments |
||||||||
| Reduce GHG emissions | By 2026, achieve a 75 per cent reduction of scope 1 and 2 GHG emissions from 2015 base year(1) |
On track | Since 2015, we have reduced scope 1 and 2 GHG emissions by 21.3 MT CO2e or 66 per cent |
||||||||
By 2045, achieve net-zero for 100 per cent of TransAlta’s scope 1 and 2 GHG emissions(2) |
On track | ||||||||||
By 2024, verify and disclose 80 per cent of TransAlta’s scope 3 emissions(3) |
On track | We completed a pre-assessment of 80 per cent of TransAlta’s scope 3 emissions to prepare for limited assurance in 2024 |
|||||||||
| Reduce air emissions | By 2026, achieve a 95 per cent reduction of SO2 emissions and an 80 per cent reduction of NOx emissions below 2005 levels |
Achieved |
Our total air emissions in 2023 retained similar performance to 2022 levels. We achieved this target in 2022 through the reduction of our SO2 emissions by 98 per cent and NOx emissions by 83 per cent from 2005 levels |
||||||||
Reclaim land utilized for mining |
By 2040, complete full reclamation of our Centralia coal mine in Washington State | On track | Reclamation work at Centralia is underway and 40 per cent of the coal mine land has been reclaimed |
||||||||
| By 2046, complete full reclamation of our Highvale coal mine in Alberta | On track | Our Highvale coal mine in Alberta closed in 2021. Reclamation work is underway and 22 per cent of the coal mine land has been reclaimed |
|||||||||
| Responsible water management | By 2026, reduce fleet-wide water consumption (withdrawals minus discharge) by 20 million m3 or 40 per cent over a 2015 baseline |
Achieved in 2022 |
Water consumption increased to 30 million m3 in 2023 primarily due to an increase in production compared to last year. We achieved this target in 2022 through the reduction of our fleet-wide water consumption by approximately 20 million m3 or 43 per cent from 2015 levels |
||||||||
| Protecting nature and biodiversity | By 2024, assess and disclose nature-related risks and opportunities including TransAlta’s dependencies and impacts on ecosystems, land, water and air | On track | Assessment of nature-related risks and opportunities is underway |
||||||||
Achieve zero biodiversity-related incidents(4) |
Achieved |
We recorded zero (0) biodiversity-related incidents |
|||||||||
M70 |
TransAlta Corporation | 2023 Integrated Report | ||||||
| Sustainability goal | Sustainability target | Results | Comments |
||||||||
| Reduce safety incidents | Achieve a Total Recordable Injury Frequency rate below 0.32 | Achieved | We achieved a TRIF rate of 0.30 compared to 0.39 in 2022. Our strong safety performance can be attributed to our focus on maturing our safety culture, reducing hazards, assessing and addressing risk tolerance and standardizing safety information and data collection technology |
||||||||
| Integrate sustainability into supply chain | By 2024, 80 per cent of our spend will be with suppliers that have a sustainability policy or commitment |
On track |
On average, 78 per cent of our spend in 2022 and 2023 was with suppliers that have a sustainability policy or commitment |
||||||||
| Support prosperous Indigenous communities | Support equal access to all levels of education for youth and Indigenous peoples through financial support and employment opportunities | Achieved | Support represented a total value of $453,000, or 14 per cent of TransAlta’s total community investment |
||||||||
| Provide Indigenous cultural awareness training to all TransAlta employees by the end of 2023 | Achieved | We provided Indigenous awareness training to all Canadian, Australian and US employees |
|||||||||
| Sustainability goal | Sustainability target | Results | Comments |
||||||||
| Strengthen gender equality | Achieve 50 per cent female representation on the Board by 2030 |
On track | As at Dec. 31, 2023, women represented 46 per cent of our Board composition compared to 36 per cent in 2022(1) |
||||||||
| Achieve at least 40 per cent female employment among all employees of the Company by 2030 | On track | As at Dec. 31, 2023, women represented 27 per cent of all employees, an increase over 2022 levels (26 per cent) |
|||||||||
| Maintain equal pay for women in equivalent roles as men | Achieved | We achieved a 97 per cent female/male pay equity ratio. We strive to maintain this ratio within a deviation of plus or minus three per cent |
|||||||||
| Demonstrate leadership on ESG reporting within financial disclosures | Maintain our position as a leader on integrated ESG disclosure through increased annual alignment with leading sustainability disclosure frameworks | Achieved | TransAlta's MSCI ESG Rating was upgraded to 'AA' from 'A'. The upgrade reflects the Company's strong renewable energy growth compared to peers. We also received an award for best ESG reporting (mid-cap) by the IR Magazine Canada. In 2023, TransAlta demonstrated some of the most comprehensive disclosures among utilities companies assessed in the inaugural Climate Engagement Canada Net Zero Benchmark, which evaluates corporate issuers’ progress towards aligning with the Paris Agreement’s goals |
||||||||
| TransAlta Corporation | 2023 Integrated Report | M71 |
||||||
| Sustainability goal | Sustainability target | Results | Comments |
||||||||
| Coal transition | No further coal generation by the end of 2025 with 100 per cent of our owned net generation capacity to be from renewables and gas | On track | We retired 670 MW of Centralia at Dec. 31, 2020. In 2021, we retired or converted all coal plants in Canada and closed the Highvale coal mine, thus ceasing all coal generation in Canada. Our remaining Centralia plant in the US is set to retire on Dec. 31, 2025 |
||||||||
| Clean energy solutions for customers | Develop new renewable projects that support customer sustainability goals to achieve both long-term power price affordability and carbon reductions | On track | Since 2021, we have added over 800 MW of new capacity through renewable projects such as Windrise (206 MW), Garden Plain (130 MW), Northern Goldfields Solar (48 MW), White Rock (300 MW) and Horizon Hill (200 MW). We also acquired TransAlta Renewables (1.2 GW) in 2023 and North Carolina Solar (122 MW) in 2021. In 2023, our Clean Electricity Growth Plan was updated to continue our priorities. By 2028, the plan will see the Company execute on an incremental 1.75 GW of renewables growth and a 10 GW growth pipeline |
||||||||
M72 |
TransAlta Corporation | 2023 Integrated Report | ||||||
| Sustainability goal | Sustainability target |
Alignment with UN SDG Target or Future-Fit Business Benchmark | ||||||
| Reduce GHG emissions | By 2026, achieve a 75 per cent reduction of scope 1 and 2 GHG emissions from 2015 base year(1) |
UN SDG Target 13.2: "Integrate climate change measures into national policies, strategies and planning" |
||||||
By 2045, achieve net-zero for 100 per cent of TransAlta’s scope 1 and 2 GHG emissions(2) | ||||||||
By 2024, verify and disclose 80 per cent of TransAlta’s scope 3 emissions(3) | ||||||||
| Reduce air emissions | By 2026, achieve a 95 per cent reduction of SO2 emissions and an 80 per cent reduction of NOx emissions below 2005 levels |
UN SDG Target 9.4: "By 2030, upgrade infrastructure and retrofit industries to make them sustainable, with increased resource-use efficiency and greater adoption of clean and environmentally sound technologies and industrial processes" |
||||||
| Reclaim land utilized for mining | By 2040, complete full reclamation of our Centralia coal mine in Washington State |
Future-Fit Business Benchmark: "Positive Pursuits 13: Ecosystems are restored"
|
||||||
| By 2046, complete full reclamation of our Highvale coal mine in Alberta | Future-Fit Business Benchmark: "Positive Pursuits 13: Ecosystems are restored" |
|||||||
| Responsible water management | By 2026, reduce fleet-wide water consumption (withdrawals minus discharge) by 20 million m3 or 40 per cent over the 2015 baseline |
UN SDG Target 6.4: "By 2030, substantially increase water-use efficiency across all sectors and ensure sustainable withdrawals and supply of freshwater to address water scarcity and substantially reduce the number of people suffering from water scarcity" |
||||||
| Protecting nature and biodiversity | By 2024, assess and disclose nature-related risks and opportunities including TransAlta’s dependencies and impacts on ecosystems, land, water and air |
UN SDG Target 15.5: "Take urgent and significant action to reduce the degradation of natural habitats, halt the loss of biodiversity and, by 2020, protect and prevent the extinction of threatened species” |
||||||
Achieve zero biodiversity-related incidents(4) | ||||||||
| TransAlta Corporation | 2023 Integrated Report | M73 |
||||||
| Sustainability goal | Sustainability target | Alignment with UN SDG Target or Future-Fit Business Benchmark | ||||||
| Reduce safety incidents | Achieve a Total Recordable Injury Frequency rate below 0.32 with a goal of 0.00 |
UN SDG Target 8.8: "Protect labour rights and promote safe and secure working environments for all workers, including migrant workers, in particular women migrants, and those in precarious employment" |
||||||
| Integrate sustainability into supply chain | By 2024, 80 per cent of our spend will be with suppliers that have a sustainability policy or commitment |
UN SDG Target 12.7: “Promote public procurement practices that are sustainable, in accordance with national policies and priorities” |
||||||
Support prosperous Indigenous communities |
Support equal access to all levels of education for youth and Indigenous peoples through financial support and employment opportunities | UN SDG Target 4.5: "By 2030, eliminate gender disparities in education and ensure equal access to all levels of education and vocational training for the vulnerable, including persons with disabilities, Indigenous peoples and children in vulnerable situations" |
||||||
| Provide Indigenous cultural awareness training during the onboarding of all new TransAlta employees | UN SDG Target 12.8: "By 2030, ensure that people everywhere have the relevant information and awareness for sustainable development and lifestyles in harmony with nature" |
|||||||
| Sustainability goal | Sustainability target | Alignment with UN SDG Target or Future-Fit Business Benchmark |
||||||
| Strengthen gender equality | Achieve 50 per cent female representation on the Board by 2030 | UN SDG Target 5.5: "Ensure women’s full and effective participation and equal opportunities for leadership at all levels of decision making in political, economic and public life" |
||||||
| Achieve at least 40 per cent female employment among all employees of the Company by 2030 | ||||||||
| Maintain equal pay for women in equivalent roles as men | ||||||||
| Demonstrate leadership on ESG reporting within financial disclosures | Maintain our position as a leader on integrated ESG disclosure through increased annual alignment with leading sustainability disclosure frameworks |
UN SDG Target 12.6: "Encourage companies, especially large and transnational companies, to adopt sustainable practices and to integrate sustainability information into their reporting cycle" |
||||||
| Sustainability goal | Sustainability target | Alignment with UN SDG Target or Future-Fit Business Benchmark |
||||||
| Coal transition | No further coal generation by the end of 2025 with 100 per cent of our owned net generation capacity to be from renewables and gas |
UN SDG Target 7.1: "By 2030, ensure universal access to affordable, reliable and modern energy services"
|
||||||
| Clean energy solutions for customers | Develop new renewable projects that support customer sustainability goals to achieve both long-term power price affordability and carbon reductions |
UN SDG Target 7.2: "By 2030, increase substantially the share of renewable energy in the global energy mix" |
||||||
M74 |
TransAlta Corporation | 2023 Integrated Report | ||||||
| TransAlta Corporation | 2023 Integrated Report | M75 |
||||||
M76 |
TransAlta Corporation | 2023 Integrated Report | ||||||
| Past actions | Short-term actions (2024-2025) |
Medium to long-term actions (2026 +) | |||||||||
| Hydro | Became the largest producer of hydro power in Alberta (C) |
Advance 1500 MW of early-stage wind and solar projects in all jurisdictions (C)
Complete development and commence construction on 100 MW wind project in Canada (C)
|
Deliver an incremental 1.75 GW of clean electricity capacity by 2028 (C)
Deploy approximately $3.5 billion of growth capital by 2028 (C)
Expand our growth pipeline to 10 GW by 2028 with focus on renewables and storage (C)
|
||||||||
| Wind and Solar | From 2000 to 2023, we grew our nameplate renewables capacity by approximately 2,000 MW (C) |
||||||||||
| Battery Storage |
First battery storage facility delivered in 2020 (C)
In 2023, completed the construction of a 48 MW solar and battery storage system in Australia (C)
|
Complete development and commence construction on 180 MW battery storage in Canada (C)
Evaluate and deploy battery storage alongside renewable facilities where appropriate (C)
|
|||||||||
| Natural Gas |
Completed our coal-to-gas conversions in Canada in 2021 (C)
Converted 1,659 MW from coal to natural gas since 2018 (C)
|
Operate simple-cycle, combined-cycle and cogeneration facilities in Canada, the United States and Australia (C)
Assess deployment of nature-based or engineered solutions to neutralize unabated gas-fired generation where appropriate (C)
Evaluate use of renewable and low-carbon natural gas (C)
|
Neutralize residual emissions from gas-fired generation through fuel switching, new technologies or nature-based solutions (C) | ||||||||
| Emerging Abatement Technologies and Solutions |
Started exploring new technologies such as storage, hydrogen and carbon capture (P)
In 2023, continued to support the development of low-cost, low-emissions hydrogen production through $2 million investment in a Canadian-based venture (P)
In 2023, started partnership with leading global companies to target early-stage revolutionary technologies through a US$25 million investment in a deep decarbonization fund (P)
In 2023, started an electric vehicle pilot project in our hydro operations (C)
|
Identify the next generation of power solutions and technologies and potential for parallel investments in new complementary sectors by the end of 2025 (P)
Assess ways to support customers with broader decarbonization technologies beyond electrification (P)
Identify opportunities to partner, pilot and deploy novel, net-zero generation technologies (P)
Assess and deploy GHG removal technologies where appropriate (C)
Evaluate the electrification of our vehicle fleet (C)
|
Deploy new net-zero generation technologies and solutions where appropriate (C)
Choose materials, products and processes that generate fewer GHG emissions, mainly through energy savings (C)
Evaluate the electrification of our vehicle fleet (C)
|
||||||||
| Energy Transition (Coal) | Retired 4,664 MW of coal-fired generation capacity since 2018 including ending coal generation in Canada in 2021 (C) |
Continue to execute reclamation work at our coal mines (C)
Contribute to a circular economy through mining waste reuse or by-product sales (C)
|
Cease coal generation by 2026 (C)
Complete full reclamation in Washington State by 2040 and in Alberta by 2046 (C)
|
||||||||
| TransAlta Corporation | 2023 Integrated Report | M77 |
||||||
| Past actions | Short-term actions (2024-2025) |
Medium to long-term actions (2026 +) |
|||||||||
| Supply Chain | Enhanced supplier management functionality within the corporate procurement system (C) |
Develop ESG criteria for supply chain engagement (C)
Understand direct suppliers, GHG emissions profile and targets (C)
Incorporate ESG data reporting capability in corporate procurement system (C)
|
Engage with suppliers to explore enhancement of their GHG emissions reduction targets (I)
Set direction for engaging suppliers with GHG emissions reduction targets (C)
|
||||||||
| Value Chain |
Disclosed range of scope 3 GHG emissions at company level (C)
|
Update scope 3 GHG emissions reporting methodology (C)
Verify and disclose 80 per cent of our total scope 3 emissions (C)
|
Consider scope 3 GHG emissions targets (C) | ||||||||
| Sustainable Finance |
In 2021, converted existing $1.3 billion loan into a Sustainability-Linked Loan aligned with GHG emissions reduction and female employment targets at the company level (C)
In 2021, secured $173 million green bond financing for eligible wind project in Alberta (C)
In 2022, issued US$400 million Senior Green Bonds for eligible renewable energy and energy-efficiency projects (C)
Linked ESG performance to employees’ and executive remuneration (C)
|
Continue to evaluate the use of sustainable or green financing instruments to fund renewable energy and battery storage projects (C)
Link ESG performance to employees’ and executive remuneration (C)
|
Continue to evaluate the use of sustainable or green financing instruments to grow our renewables and storage capacity (C)
Link ESG performance to employees’ and executive remuneration (C)
|
||||||||
| Inclusive Transition |
Developed a five-year Equity, Diversity and Inclusion (ED&I) strategy (C)
Conducted ED&I census to help drive a greater sense of belonging for all employees (C)
Set employee engagement and ED&I targets as part of ESG-linked compensation (C)
In 2023, launched two employee resource groups (C)
In 2023, provided Indigenous cultural awareness training to all employees (C)
In 2015, announced community investment of US$55 million over 10 years to support energy efficiency, economic and community development and education and retraining initiatives in Washington State (P)
In 2016, agreed to invest in the communities impacted by the phase-out of coal generation in Alberta (P)
|
Expand number of employee resource groups available (C)
Adapt workplaces to incorporate structural changes for inclusive work environments (C)
Deliver year-round ED&I learning and awareness, and celebration campaigns (C)
Continue energy transition investment in Washington State communities of up to US$55 million by 2025 (P)
Continue to invest in the communities impacted by the phase-out of coal generation in Alberta (P)
Strengthen Indigenous relations focused on community engagement and consultation, community investment and partnership opportunities (P)
Promote supplier diversity in our operations (C)
|
Enhance recruitment and retention of female employees to achieve gender-based targets (C)
Maintain succession practices to increase female representation at senior management level (C)
Increase female representation in Generation by encouraging women to pursue a career in electricity (C)
Enhance opportunities for diverse suppliers in our procurement processes (C)
Continue to enhance our Indigenous relations focused on partnership opportunities with local communities (P)
Ongoing support to local community organizations aligned with our community investment pillars where we operate and grow communities (P)
|
||||||||
M78 |
TransAlta Corporation | 2023 Integrated Report | ||||||
| TransAlta Corporation | 2023 Integrated Report | M79 |
||||||
M80 |
TransAlta Corporation | 2023 Integrated Report | ||||||
| Increased competition | Decreased demand of natural gas electricity |
Increased operational costs | |||||||||
| Description | Subsidies/funds available for clean energy transition increase as governments aim to grow installed capacity of renewables to meet rising electricity demand and compensate for the closure of carbon-intensive power plants. In Canada, it is expected that major grid decarbonization investments will flow into Alberta as most other provincial markets are heavily regulated and/or are already low carbon. This will increase competition in the merchant market, making a large part of the generating fleet frequently bid at zero, driving down the average price of dispatched electricity. Simultaneously the cost of renewables, expected to decline across all scenarios, decreases the capital barrier to entry. These combined factors will increase competition for TransAlta. The IEA scenarios do not provide clear indication of electricity pricing and how it can be affected by increased competition. As such, this remains a point of uncertainty. Some structural market changes may be required to guarantee returns for power generators and successfully decarbonize the grid. |
Demand for power from natural gas declines as the market shifts towards cleaner power with gas shifting to a reliability backstop role. An additional decline from Canadian oil and gas customers can occur as oil production levels drop under NZE and SDS. The transition to a lower-carbon world will likely result in volatility and market uncertainty. Natural gas power may be necessary to provide power in the transition if the pace of decarbonization is slower than expected in the scenarios or if grid-scale storage solutions do not develop/commercialize as modelled. In these cases, with coal phased out, natural gas assets will be relied on for baseload generation. This means that natural gas assets may still play a role for a smooth and efficient energy transition. Optimization of natural gas assets is required, and additional investments need to be assessed with caution to consider the pace of decarbonization and consequent risk of decreased demand for natural gas power. |
Carbon price increases the cost of natural gas operations. Additional mandated emissions reductions could force remaining plants to invest in technologies like CCUS, increasing the operating costs for natural gas plants further. Natural gas assets in the US and Australia face less risk compared to assets in Alberta as they are contracted and can pass down carbon costs to their clients. Current and anticipated regional carbon pricing monitoring is required to plan and assess increases in operational costs and impacts on new projects and investments. | ||||||||
| TransAlta Corporation | 2023 Integrated Report | M81 |
||||||
| Increased competition | Decreased demand of natural gas electricity |
Increased operational costs | |||||||||
| NZE | By 2040, renewables are expected to comprise over 85 per cent of the total electricity generation in the regions we operate. This surge in renewables will increase competition and drive electricity pricing down depending on availability and the cost of energy storage. The change in electricity prices and increased market uncertainty are expected to impact our profits. |
The share of natural gas electricity generation is expected to decline over 50 per cent in the regions in which we operate by 2040 compared to 2019 levels. This lower demand for natural gas power is expected to impact our natural gas assets if no management responses are implemented. |
Higher operational costs driven by an increase in carbon price to US$205/tonne CO2e by 2040 in all our operating regions (advanced economies under IEA scenarios) and lower operational capacity is expected to impact the profits from our natural gas assets. | ||||||||
| SDS | Fewer subsidies/funds are expected under this scenario compared to NZE. However, renewable costs will still decline approximately 10 per cent in wind and 55 per cent in solar by 2040 compared to 2019 levels. This decline with some level of subsidy will increase competition and potentially decrease electricity prices, which is expected to impact our profits. |
Natural gas electricity generation still falls over 50 per cent in North America while remaining flat in Australia by 2040 when compared to 2019 levels. Demand for natural gas power is expected to decrease at a slower pace than under NZE. This could potentially impact our natural gas assets if no management responses are implemented. |
Increase in operational costs would happen at a slower rate compared to NZE but carbon costs are still expected to reach US$140/tonne CO2e by 2040 in all of our operating regions. This could potentially impact the operational capacity and profits from our natural gas assets, depending on the ability to pass carbon prices on through our contracts. |
||||||||
| STEPS | While minimal subsidies are expected and the cost of entry will not decline at the same rate as SDS or NZE, renewable costs are still expected to decline approximately 8 per cent in wind and 45 per cent in solar by 2040 compared to 2019 levels. This will still cause an increase in competition that is expected to be offset by additional electricity demand and therefore it is not expected to impact our profits. |
Natural gas electricity generation is expected to increase over 15 per cent in the regions in which we operate by 2040 compared to 2019 levels. These changes are not expected to affect our natural gas assets. |
Operational costs are not expected to significantly increase under this scenario as only Canada sees a carbon price in 2040. |
||||||||
| Management Response | Navigating the uncertainty around market dynamics (structure, pricing and competition), government policies and planning is critical for TransAlta. We use hedging and PPAs to stabilize pricing and are planning on leading clean energy growth in the regions in which we operate. See more details of our strategy and risk management under the Climate Strategy section and the Managing Climate Change Risks and Opportunities section of this MD&A. |
Optimize gas assets to maximize value and cash flows to support renewables and storage growth. Our converted natural gas units' CO2 intensity is approximately 57 per cent less than coal generation. Repurposing the coal facilities rather than decommissioning them reduces the cost and emissions associated with new construction and aligns with the UN SDGs, specifically "Goal 9: Industry, Innovation and Infrastructure." In parallel, we continue growing our renewable fleet; by the end of 2025 we will have achieved a 100 per cent portfolio mix of renewables and natural gas. |
We have taken significant steps to reduce our carbon footprint. Since 2015, we have reduced scope 1 and 2 GHG emissions by 66 per cent. By 2026, we have a commitment to reduce scope 1 and 2 GHG emissions by 75 per cent from 2015 base year and plan to achieve net-zero emissions by 2045. Further, our corporate functions apply regionally specific carbon pricing, both current and anticipated, as a mechanism to manage future risks of uncertainty in the carbon market. |
||||||||
M82 |
TransAlta Corporation | 2023 Integrated Report | ||||||
| Renewables become major energy source | New technology development | |||||||
| Description | Opportunities to grow the renewable fleet exist across all scenarios. Renewable assets (hydro, wind, solar) are expected to become the default form of generation with demand for power from these types of assets increasing. Hydro is likely to grow in value given increased renewables penetration and the need for reliable zero-emitting generation. This can make hydroelectric power a stronger source of baseload electricity in many regions. The decreasing cost of renewables also facilitates the growth of a renewable fleet, especially under NZE and SDS. |
Opportunities for development of battery or hydroelectric storage systems and ancillary services exist across all scenarios as renewable energy continues to penetrate the grid. Developments in these areas are required to keep electricity flowing when the renewables in a region are not producing. Storage is especially anticipated to play an important role in the energy transition. Cost-competitive battery storage enables greater adoption of renewables. | ||||||
| NZE | A growth of renewable electricity generation of approximately 950 per cent is expected by 2040 compared to 2019 levels. This results in renewables comprising more than 85 per cent of the electricity generation in the regions in which we operate. The transition of hydro to baseload capacity is expected to create upside for TransAlta. An increase in TransAlta’s renewable capacity and demand are expected to enable growth and higher revenues. |
Increased revenues through access to new and emerging markets are expected to enable growth and higher revenues under NZE. With more than 85 per cent of electricity in areas in which we operate made up of renewables, there will be big steps forward in storage and ancillary services technologies. Storage capacity is expected to grow to approximately 250 GW in the US by 2040. | ||||||
| SDS | A growth of renewable electricity generation of approximately 550 per cent is expected by 2040 compared to 2019 levels. This results in renewables comprising more than 75 per cent of the electricity generation in the regions in which we operate. An increase in TransAlta’s renewable capacity and demand are expected to enable growth and higher revenues. |
Increased revenues through access to new and emerging markets are expected to enable growth and higher revenues under SDS. A lower share of renewables than in NZE will allow swing production to remain present; however, growth in ancillary and storage capacity will still be needed to support the market. Storage capacity is expected to grow to approximately 110 GW in the US by 2040. | ||||||
| STEPS | STEPS growth is muted relative to the other scenarios but still sees a growth of renewables of 280 per cent by 2040 compared to 2019 levels. This growth will allow approximately 50 per cent of electricity generation to come from renewables in areas in which we operate by 2040. An increase in TransAlta’s renewable capacity and demand are expected to enable growth and higher revenues. |
Access to new and emerging markets would be limited under this scenario compared to NZE and SDS. While growth in renewables is expected, the need for new technologies is not a necessity in this market and may not be profitable. Therefore, our revenues are not expected to be affected. | ||||||
| Management Response | Our renewable energy commitment began more than 100 years ago when we built the first hydro assets in Alberta, which still operate today. We now operate 57 renewable facilities across Canada, the US and Australia. By the end of 2028, we expect 70 per cent of our EBITDA to be derived from renewables. Our strategy is focused on the operation of our existing assets (wind, hydro, solar, gas, storage and coal) and the development of renewable energy, storage and responsive and flexible natural gas generation for reliability. Our investments and growth in renewable energy are highlighted by our portfolio of renewable energy-generating assets. From 2000 to 2023, we grew our nameplate renewables capacity from approximately 900 MW to over 2,900 MW. Today, our diversified renewable fleet makes us one of the largest renewable producers in North America, one of the largest producers of wind power in Canada and the largest producer of hydro power in Alberta. |
To leverage this opportunity and combat the challenges of renewable energy intermittency, we continue to invest in battery storage. In 2020, we launched WindCharger, a "first of its kind in Alberta" battery storage project that stores energy produced by our Summerview II wind facility and discharges electricity onto the Alberta grid during system supply shortages. Further, in 2021, we agreed to provide renewable solar electricity supported with a battery energy storage system to BHP Nickel West through the construction of the Northern Goldfields solar project in Western Australia. This project was completed in November 2023 and will support BHP in meeting its emissions reduction targets and delivering lower-carbon, sustainable nickel to its customers. In 2023, TransAlta’s early-stage development pipeline included four energy storage projects in Canada with a total capacity in excess of 1 GW. |
||||||
| TransAlta Corporation | 2023 Integrated Report | M83 |
||||||
M84 |
TransAlta Corporation | 2023 Integrated Report | ||||||
| TransAlta Corporation | 2023 Integrated Report | M85 |
||||||
M86 |
TransAlta Corporation | 2023 Integrated Report | ||||||
| TransAlta Corporation | 2023 Integrated Report | M87 |
||||||
| Clean energy growth | ||||||||||||||
| Sustainability Target | Develop new renewable projects that support our customers' sustainability goals to achieve both long-term power price affordability and carbon reductions.(1) |
No further coal generation; 100 per cent of our owned net generation capacity from renewables and gas. | ||||||||||||
| Target Year | 2025 | 2025 | ||||||||||||
| Progress |
Renewables Growth
 |
Net Generation Capacity (renewable and gas)
 |
||||||||||||
| Notes | Since 2021, we have added over 800 MW of new capacity through renewable projects such as Windrise (206 MW), Garden Plain (130 MW), Northern Goldfields Solar (48 MW), White Rock (300 MW) and Horizon Hill (200 MW). In November 2023, our Clean Electricity Growth Plan was updated to continue our priorities. By 2028, the plan will see the Company execute on an incremental 1.75 GW of renewables growth and a 10 GW growth pipeline. |
In 2023, our owned net generation capacity from renewables and gas represented approximately 90 per cent of our total 6,425 MW owned net generation capacity. In 2021, we achieved full phase-out of coal in Canada. In the US, the remaining unit at Centralia is set to retire on Dec. 31, 2025. |
||||||||||||
| UN SDG Alignment | Target 7.2: "By 2030, increase substantially the share of renewable energy in the global energy mix" |
Target 7.1: "By 2030, ensure universal access to affordable, reliable and modern energy services”. | ||||||||||||
M88 |
TransAlta Corporation | 2023 Integrated Report | ||||||
| Emissions reduction | ||||||||||||||
| Sustainability Target | By 2026, achieve a 75 per cent reduction of scope 1 and 2 GHG emissions from a 2015 base year. | By 2045, achieve net-zero for 100 per cent of TransAlta’s scope 1 and 2 GHG emissions. | ||||||||||||
| Target Year | 2026 | 2045 | ||||||||||||
| Progress |
GHG Emissions Reduction
 |
GHG Emission (million tonnes CO2e)
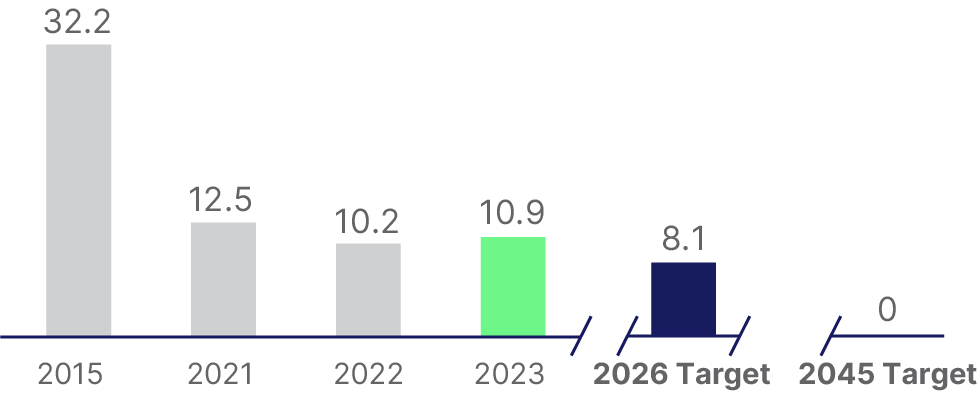 |
||||||||||||
| Notes | We are well on track to achieve our target of 75 per cent scope 1 and 2 GHG emissions reductions by 2026. Since 2015, we have reduced scope 1 and 2 GHG emissions by 21.3 MT CO2e or 66 per cent. |
In 2022, we adopted a more ambitious target to be net-zero by 2045. We believe our Clean Electricity Growth Plan supports achieving our net-zero target. |
||||||||||||
| UN SDG Alignment | Target 13.2: "Integrate climate change measures into national policies, strategies and planning". | Target 13.2: "Integrate climate change measures into national policies, strategies and planning". | ||||||||||||
| TransAlta Corporation | 2023 Integrated Report | M89 |
||||||
| Year ended Dec. 31 | 2023 | 2022 | 2021 | ||||||||
| Scope 1 | 10.9 | 10.2 | 12.4 | ||||||||
| Scope 2 | 0.0 | 0.1 | 0.1 | ||||||||
| Total scope 1 and 2 GHG emissions | 10.9 | 10.2 | 12.5 | ||||||||
| Year ended Dec. 31 | 2023 | 2022 | 2021 | ||||||||
| Hydro | 0.0 | 0.0 | 0.0 | ||||||||
| Wind and Solar | 0.0 | 0.0 | 0.0 | ||||||||
| Gas | 6.4 | 6.3 | 6.5 | ||||||||
| Energy Transition | 4.5 | 4.0 | 6.0 | ||||||||
| Corporate and Energy Marketing | 0.0 | 0.0 | 0.0 | ||||||||
| Total scope 1 and 2 GHG emissions | 10.9 | 10.2 | 12.5 | ||||||||
| Year ended Dec. 31 | 2023 | 2022 | 2021 | ||||||||
| Australia | 1.0 | 0.9 | 1.0 | ||||||||
| Canada | 5.3 | 5.2 | 7.9 | ||||||||
| US | 4.6 | 4.1 | 3.6 | ||||||||
| Total scope 1 and 2 GHG emissions | 10.9 | 10.2 | 12.5 | ||||||||
| Year ended Dec. 31 | 2026 (forecast) | 2023 | 2015 | ||||||||
Total scope 1 and 2 GHG emissions (million tonnes CO2e) |
8.1 | 10.9 | 32.2 | ||||||||
M90 |
TransAlta Corporation | 2023 Integrated Report | ||||||
| Year ended Dec. 31 | 2023 | 2022 | 2021 | ||||||||
Total GHG emissions avoided (million tonnes CO2e) |
2.3 | 2.7 | 2.6 | ||||||||
| TransAlta Corporation | 2023 Integrated Report | M91 |
||||||
| As at Dec. 31 (in millions of Canadian dollars) | 2023 | 2022 | 2021 | ||||||||
Green bonds (1) |
684 | 703 | 171 | ||||||||
| Sustainability-linked loans | 1,950 | 1,250 | 1,250 | ||||||||
| Year ended Dec. 31 (in millions of Canadian dollars) | 2023 | 2022 | 2021 | ||||||||
Growth capital expenditures for renewable energy generation(1) |
630 | 666 | 326 | ||||||||
Renewable energy adjusted EBITDA(2) |
716 | 838 | 584 | ||||||||
Environmental attribute sales revenue(3) |
36 | 53 | 40 | ||||||||
Renewable energy adjusted revenue(4) |
902 | 1,014 | 731 | ||||||||
Investments in low-carbon research and development(5) |
4 | 12 | — | ||||||||
M92 |
TransAlta Corporation | 2023 Integrated Report | ||||||
TCFD Recommended Disclosures |
Other Alignments |
Location | ||||||
| Governance | ||||||||
| Describe the board’s oversight of climate-related risks and opportunities | IFRS S2: 6; CDP: C1.1 | Oversight by the Board of Directors | ||||||
| Describe management’s role in assessing and managing climate-related risks and opportunities | IFRS S2: 6; CDP: C1.2 | Role of Senior Management | ||||||
| Strategy | ||||||||
| Describe the climate-related risks and opportunities the organization has identified over the short, medium and long term | IFRS S2: 8-9; CDP: C2.1 | Key Scenario Findings | ||||||
| Describe the impact of climate-related risks and opportunities on the organization’s businesses, strategy and financial planning | IFRS S2: 8-9; CDP: C2.3, C2.4, C3.3, C3.4 | Climate Change Strategy, Key Climate Scenario Findings | ||||||
| Describe the resilience of the organization’s strategy, taking into consideration different climate-related scenarios, including a 2°C or lower scenario | IFRS S2: 22-23; CDP: C3.1, C3.2 | Climate Scenarios, Key Climate Scenario Findings | ||||||
| Risk management | ||||||||
| Describe the organization’s processes for identifying and assessing climate-related risks | IFRS S2: 10; CDP: C2.2 | Climate Change Strategy | ||||||
| Describe the organization’s processes for managing climate-related risks | IFRS S2: 24-25; CDP: C2.2 | Managing Climate Change Risks and Opportunities | ||||||
| Describe how processes for identifying, assessing and managing climate-related risks are integrated into the organization’s overall risk management | IFRS S2: 24-25; CDP: C2.2 | Managing Climate Change Risks and Opportunities | ||||||
| Metrics and targets | ||||||||
| Disclose the metrics used by the organization to assess climate-related risks and opportunities in line with its strategy and risk management process | IFRS S2: 27-28; CDP: C6.1, C6.3, C6.5, C9.1 | Climate Change Metrics and Targets | ||||||
| Disclose scope 1, scope 2 and, if appropriate, scope 3 greenhouse gas (GHG) emissions and the related risks | IFRS S2: 29-32; CDP: C6.1, C6.3, C6.5 | Climate Change Metrics and Targets | ||||||
| Describe the targets used by the organization to manage climate-related risks and opportunities and performance against targets | IFRS S2: 33-36; CDP: C4.1, C4.2 | Climate Change Metrics and Targets | ||||||
| TransAlta Corporation | 2023 Integrated Report | M93 |
||||||
M94 |
TransAlta Corporation | 2023 Integrated Report | ||||||
| TransAlta Corporation | 2023 Integrated Report | M95 |
||||||
M96 |
TransAlta Corporation | 2023 Integrated Report | ||||||
| TransAlta Corporation | 2023 Integrated Report | M97 |
||||||
| Power generation type | Operating experience (years) | ||||
| Hydro | 112 | ||||
| Natural Gas | 73 | ||||
| Wind | 26 | ||||
| Solar | 9 | ||||
| Battery Energy Storage Systems | 3 | ||||
M98 |
TransAlta Corporation | 2023 Integrated Report | ||||||
| TransAlta Corporation | 2023 Integrated Report | M99 |
||||||
M100 |
TransAlta Corporation | 2023 Integrated Report | ||||||
| TransAlta stakeholders | ||||||||
| Non-governmental organizations | Community associations |
Transmission facility operators |
||||||
| Regulators | Industry organizations | Communities | ||||||
| Charitable organizations/Non-profit | Standards organizations | Retirees | ||||||
| All levels of government | Media | Residents/Landowners | ||||||
| Suppliers | Business partners | Investor organizations | ||||||
| Contractors | Unions/Labour organizations | Financial institutions | ||||||
| Government agencies | Forest associations/Industry | Mineral rights owners | ||||||
| System operators | Oil and gas associations/Industry | Railroad owners | ||||||
| Customers | Think tanks | Utility owners | ||||||
Shareholders |
Academics | Employees | ||||||
| Information and communication | Dialogue and consultation | Relationship building | ||||||
| Open houses, town halls and public information sessions | In-person meetings with local groups and communities | Community advisory bodies | ||||||
| Newsletters, telephone conversations, emails and letters | Meetings with individual stakeholders (e.g., landowners and residents) | Capacity agreements | ||||||
| Websites | Targeted audience sessions | Sponsorships and donations | ||||||
| Social media postings | Tours of our facilities and sites | Hosting and attending events | ||||||
| TransAlta Corporation | 2023 Integrated Report | M101 |
||||||
M102 |
TransAlta Corporation | 2023 Integrated Report | ||||||
| TransAlta Corporation | 2023 Integrated Report | M103 |
||||||
| Year ended Dec. 31 | 2023 | 2022 | 2021 | ||||||||
| Lost-time injuries | 1 | 0 | 3 | ||||||||
| Medical aids | 4 | 6 | 9 | ||||||||
| Restricted work injuries | 0 | 0 | 5 | ||||||||
| Exposure hours | 3,362,000 | 3,058,000 | 4,134,000 | ||||||||
| Total Recordable Injury Frequency (TRIF) | 0.30 | 0.39 | 0.82 | ||||||||
M104 |
TransAlta Corporation | 2023 Integrated Report | ||||||
| TransAlta Corporation | 2023 Integrated Report | M105 |
||||||
| Year ended Dec. 31 | 2023 | 2022 | 2021 | ||||||||
| Critically Endangered | 0 | 0 | 0 | ||||||||
| Endangered | 0 | 0 | 0 | ||||||||
| Vulnerable | 0 | 0 | 0 | ||||||||
| Near threatened | 0 | 0 | 0 | ||||||||
| Total biodiversity-related incidents | 0 | 0 | 0 | ||||||||
M106 |
TransAlta Corporation | 2023 Integrated Report | ||||||
| TransAlta Corporation | 2023 Integrated Report | M107 |
||||||
| Year ended Dec. 31 | 2023 | 2022 | 2021 | ||||||||
| Hydro | 0 | 0 | 0 | ||||||||
| Wind and Solar | 0 | 0 | 0 | ||||||||
| Gas | 123 | 130 | 118 | ||||||||
| Energy Transition | 73 | 64 | 86 | ||||||||
| Corporate and Energy Marketing | 0 | 0 | 0 | ||||||||
| Total energy use (million gigajoules) | 197 | 195 | 204 | ||||||||
| Year ended Dec. 31 | 2023 | 2022 | 2021 | ||||||||
SO2 (tonnes) |
1,100 | 1,200 | 7,300 | ||||||||
NOx (tonnes) |
11,000 | 11,000 | 15,000 | ||||||||
| Particulate matter (tonnes) | 460 | 360 | 2,200 | ||||||||
| Mercury (kilograms) | 18 | 21 | 41 | ||||||||
M108 |
TransAlta Corporation | 2023 Integrated Report | ||||||
| Year ended Dec. 31 | 2023 | 2022 | 2021 | ||||||||
| Water withdrawal | 273 | 233 | 241 | ||||||||
| Water discharge | 239 | 207 | 209 | ||||||||
Total water consumption (million m3) |
34 | 26 | 32 | ||||||||
| TransAlta Corporation | 2023 Integrated Report | M109 |
||||||
| Year ended Dec. 31 | 2023 | 2022 | 2021 | ||||||||
| Total waste generation (tonnes equivalent) | 479,000 | 204,000 | 514,000 | ||||||||
| Waste to landfill (tonne eq.) | 1,000 | 1,900 | 1,000 | ||||||||
| Waste recycled (tonne eq.) | 19,000 | 22,000 | 31,000 | ||||||||
| Waste reuse (tonne eq.) | 457,000 | 151,000 | 176,000 | ||||||||
| % of total waste to landfill | 0.2 | 0.9 | 0.2 | ||||||||
| % of total waste: hazardous | 3 | 9 | 5 | ||||||||
| % hazardous waste to landfill | 0.0 | 0.6 | 1.0 | ||||||||
M110 |
TransAlta Corporation | 2023 Integrated Report | ||||||
| Year ended Dec. 31 | 2023 | 2022 | 2021 | ||||||||
| Regulatory non-compliance environmental incidents | 0 | 1 | 2 | ||||||||
| Year ended Dec. 31 | 2023 | 2022 | 2021 | ||||||||
| Significant environmental incidents | 0 | 0 | 0 | ||||||||
| TransAlta Corporation | 2023 Integrated Report | M111 |
||||||
M112 |
TransAlta Corporation | 2023 Integrated Report | ||||||
| TransAlta Corporation | 2023 Integrated Report | M113 |
||||||
M114 |
TransAlta Corporation | 2023 Integrated Report | ||||||
| TransAlta Corporation | 2023 Integrated Report | M115 |
||||||
M116 |
TransAlta Corporation | 2023 Integrated Report | ||||||
| Factor |
Increase or
decrease
(per cent)
|
Approximate
impact on net
earnings
(millions)
|
||||||
| Availability/production | 1 | $20 | ||||||
| TransAlta Corporation | 2023 Integrated Report | M117 |
||||||
M118 |
TransAlta Corporation | 2023 Integrated Report | ||||||
|
Investment
grade
(per cent)
|
Non-investment
grade
(per cent)
|
Total
(per cent)
|
Total
amount
($)
|
|||||||||||
Trade and other receivables(1,2) |
95 | 5 | 100 | 807 | ||||||||||
| Long-term finance lease receivables | 100 | — | 100 | 171 | ||||||||||
Risk management assets(1) |
75 | 25 | 100 | 203 | ||||||||||
Loan receivable(2) |
— | 100 | 100 | 26 | ||||||||||
| Total | 1,207 | |||||||||||||
| TransAlta Corporation | 2023 Integrated Report | M119 |
||||||
| Factor |
Increase or
decrease
|
Approximate impact
on net earnings
(millions)
|
||||||
| Exchange rate | $0.03 | $14 | ||||||
M120 |
TransAlta Corporation | 2023 Integrated Report | ||||||
| Factor |
Increase or
decrease
(per cent)
|
Approximate impact
on net earnings
(millions)
|
||||||
| Interest rate | 50 bps | $2 | ||||||
| TransAlta Corporation | 2023 Integrated Report | M121 |
||||||
M122 |
TransAlta Corporation | 2023 Integrated Report | ||||||
| TransAlta Corporation | 2023 Integrated Report | M123 |
||||||
| Factor |
Increase or
decrease
(per cent)
|
Approximate impact
on net earnings
(millions)
|
||||||
| Tax rate | 1 | $9 | ||||||
M124 |
TransAlta Corporation | 2023 Integrated Report | ||||||
| TransAlta Corporation | 2023 Integrated Report | M125 |
||||||
 |

|
||||
| John Kousinioris | Todd Stack | ||||
| President and Chief Executive Officer | Executive Vice President, Finance and Chief Financial Officer |
||||
F1 |
TransAlta Corporation | 2023 Integrated Report | ||||||

| TransAlta Corporation | 2023 Integrated Report | F2 |
||||||
|
|
||||
| John Kousinioris | Todd Stack | ||||
| President and Chief Executive Officer | Executive Vice President, Finance and Chief Financial Officer |
||||
F3 |
TransAlta Corporation | 2023 Integrated Report | ||||||
| TransAlta Corporation | 2023 Integrated Report | F4 |
||||||
F5 |
TransAlta Corporation | 2023 Integrated Report | ||||||
| TransAlta Corporation | 2023 Integrated Report | F6 |
||||||
Valuation of Long-Lived Assets related to certain cash generating units (“CGU”s) and Goodwill related to the Wind & Solar segment | |||||
| Description of the Matter |
As disclosed in notes 2(G), 2(H), 2(P)(I), 7 and 21 of the consolidated financial statements, the Company owns significant Wind & Solar generation assets and has recognized goodwill from historical acquisitions which must be tested for impairment at least annually or when indicators of impairment are present. The carrying value of Goodwill related to the Wind & Solar segment as at December 31, 2023 was $176 million and the recoverable amount of long-lived assets in the Wind & Solar segment that had indicators of impairment or impairment reversal during the year was $670 million.
Determining the recoverable amounts for the Wind & Solar segment for the purposes of the goodwill impairment test and of certain CGUs in the Wind & Solar segment with indicators of impairment or impairment reversal (“Wind & Solar CGUs”) for the asset impairment test was identified as a critical audit matter due to the significant estimation uncertainty and judgment applied by management in determining the recoverable amount, primarily due to the sensitivity of the significant assumptions to the future cash flows and the effect that changes in these assumptions would have on the recoverable amount. The estimates with a high degree of subjectivity include electricity production, sales prices, cost inputs, and determining the appropriate discount rate.
|
||||
| How We Addressed the Matter in Our Audit | We obtained an understanding of management’s process for estimating the recoverable amount of the Wind & Solar segment and the Wind & Solar CGUs. We evaluated the design and tested the operating effectiveness of controls over the Company’s processes to determine the recoverable amount. Our audit procedures to test the Company’s recoverable amount of the Wind & Solar segment and the Wind & Solar CGUs with indicators of impairment or impairment reversal included, among others, comparing the significant assumptions used to estimate cash flows to current contracts with external parties and historical trends and obtaining historical electricity generation data to evaluate future electricity production forecasts. We assessed the historical accuracy of management’s forecasts by comparing them with actual results and performed a sensitivity analysis to evaluate the assumptions that were most significant to the determination of the recoverable amount. We evaluated the Company’s determination of future sales prices by comparing them to externally available third-party future electricity price estimates. We also involved our internal valuation specialist to assist in our evaluation of the discount rates, which involved benchmarking the inputs against available market data. |
||||
Valuation of Level III Derivative Instruments | |||||
| Description of the Matter |
As disclosed in notes 2(P)(IV), 14 and 25 of the consolidated financial statements, the Company enters into transactions that are accounted for as derivative financial instruments and are recorded at fair value. The valuation of derivative instruments classified as level III are determined using assumptions that are not readily observable. As at December 31, 2023 the fair value of the Company’s derivative financial instruments classified as level III was a $147 million net risk management liability.
Auditing the determination of fair value of level III derivative instruments that rely on significant unobservable inputs can be complex and relies on judgments and estimates concerning future prices, discount rates, credit value adjustments, liquidity and delivery volumes, and can fluctuate significantly depending on market conditions. Therefore, such determination of fair value was identified as a critical audit matter.
|
||||
| How We Addressed the Matter in Our Audit | We obtained an understanding of the Company’s processes and we evaluated and tested the design and operating effectiveness of internal controls addressing the determination and review of inputs used in establishing level III fair values. Our audit procedures included, among others, testing a sample of level III derivative instrument internal models used by management and evaluating the significant assumptions utilized. We also compared management's future pricing assumptions, credit value adjustments, and liquidity assumptions to third-party data as well as comparing terms such as delivery volumes and timing to executed commodity contracts. We compared the delivery volume assumptions to historical information. We performed a sensitivity analysis to evaluate assumptions including future commodity prices, delivery volumes and discount rates. For a sample of level III derivative instruments, we involved our internal valuation specialist to assist in our evaluation of the appropriateness of the fair value by evaluating the key assumptions and methodologies. |
||||
F7 |
TransAlta Corporation | 2023 Integrated Report | ||||||
| Year ended Dec. 31 | 2023 | 2022 | 2021 | |||||||||||
Revenues (Note 5) |
3,355 | 2,976 | 2,721 | |||||||||||
Fuel and purchased power (Note 6) |
1,060 | 1,263 | 1,054 | |||||||||||
Carbon compliance (Note 16) |
112 | 78 | 178 | |||||||||||
| Gross margin | 2,183 | 1,635 | 1,489 | |||||||||||
Operations, maintenance and administration (Note 6) |
539 | 521 | 511 | |||||||||||
| Depreciation and amortization | 621 | 599 | 529 | |||||||||||
Asset impairment charges (reversals) (Note 7) |
(48) | 9 | 648 | |||||||||||
| Taxes, other than income taxes | 29 | 33 | 32 | |||||||||||
Net other operating (income) loss (Note 8) |
(47) | (58) | 8 | |||||||||||
| Operating income (loss) | 1,089 | 531 | (239) | |||||||||||
Equity income (Note 9) |
4 | 9 | 9 | |||||||||||
| Finance lease income | 12 | 19 | 25 | |||||||||||
Interest income |
59 | 24 | 11 | |||||||||||
Interest expense (Note 10) |
(281) | (286) | (256) | |||||||||||
| Foreign exchange gain (loss) | (7) | 4 | 16 | |||||||||||
| Gain on sale of assets and other | 4 | 52 | 54 | |||||||||||
| Earnings (loss) before income taxes | 880 | 353 | (380) | |||||||||||
Income tax expense (Note 11) |
84 | 192 | 45 | |||||||||||
| Net earnings (loss) | 796 | 161 | (425) | |||||||||||
| Net earnings (loss) attributable to: | ||||||||||||||
| TransAlta shareholders | 695 | 50 | (537) | |||||||||||
Non-controlling interests (Note 12) |
101 | 111 | 112 | |||||||||||
| 796 | 161 | (425) | ||||||||||||
| Net earnings (loss) attributable to TransAlta shareholders | 695 | 50 | (537) | |||||||||||
Preferred share dividends (Note 28) |
51 | 46 | 39 | |||||||||||
| Net earnings (loss) attributable to common shareholders | 644 | 4 | (576) | |||||||||||
Weighted average number of common shares outstanding in the year (millions) |
276 | 271 | 271 | |||||||||||
Net earnings (loss) per share attributable to common shareholders, basic and diluted (Note 27) |
2.33 | 0.01 | (2.13) | |||||||||||
| TransAlta Corporation | 2023 Integrated Report | F8 |
||||||
| Year ended Dec. 31 | 2023 | 2022 | 2021 | |||||||||||
| Net earnings (loss) | 796 | 161 | (425) | |||||||||||
| Other comprehensive income (loss) | ||||||||||||||
Net actuarial gains (losses) on defined benefit plans, net of tax(1) |
(5) | 37 | 37 | |||||||||||
Fair value loss on third-party investments, net of tax (Note 9) |
— | (1) | — | |||||||||||
Total items that will not be reclassified subsequently to net earnings (loss) |
(5) | 36 | 37 | |||||||||||
| Gains (losses) on translating net assets of foreign operations, net of tax | (6) | 21 | (14) | |||||||||||
Gains (losses) on financial instruments designated as hedges of foreign operations, net of tax(2) |
9 | (25) | — | |||||||||||
Gains (losses) on derivatives designated as cash flow hedges, net of tax(3) |
41 | (556) | (200) | |||||||||||
Reclassification of (gains) losses on derivatives designated as cash flow hedges to net earnings (loss), net of tax(4) |
58 | 100 | (8) | |||||||||||
| Total items that will be reclassified subsequently to net earnings (loss) | 102 | (460) | (222) | |||||||||||
| Other comprehensive income (loss) | 97 | (424) | (185) | |||||||||||
| Total comprehensive income (loss) | 893 | (263) | (610) | |||||||||||
| Total comprehensive income (loss) attributable to: | ||||||||||||||
| TransAlta shareholders | 817 | (318) | (693) | |||||||||||
Non-controlling interests (Note 12) |
76 | 55 | 83 | |||||||||||
| 893 | (263) | (610) | ||||||||||||
F9 |
TransAlta Corporation | 2023 Integrated Report | ||||||
| As at Dec. 31 | 2023 | 2022 | |||||||||
| Current assets | |||||||||||
| Cash and cash equivalents | 348 | 1,134 | |||||||||
Restricted cash (Note 24) |
69 | 70 | |||||||||
Trade and other receivables (Note 13) |
807 | 1,589 | |||||||||
| Prepaid expenses and other | 48 | 55 | |||||||||
Risk management assets (Note 14 and 15) |
151 | 709 | |||||||||
Inventory (Note 16) |
157 | 157 | |||||||||
| 1,580 | 3,714 | ||||||||||
| Non-current assets | |||||||||||
Investments (Note 9) |
138 | 129 | |||||||||
Long-term portion of finance lease receivables (Note 17) |
171 | 129 | |||||||||
Risk management assets (Note 14 and 15) |
52 | 161 | |||||||||
Property, plant and equipment (Note 18) |
5,714 | 5,556 | |||||||||
Right-of-use assets (Note 19) |
117 | 126 | |||||||||
Intangible assets (Note 20) |
223 | 252 | |||||||||
Goodwill (Note 21) |
464 | 464 | |||||||||
Deferred income tax assets (Note 11) |
21 | 50 | |||||||||
Other assets (Note 22) |
179 | 160 | |||||||||
| Total assets | 8,659 | 10,741 | |||||||||
| Current liabilities | |||||||||||
Bank overdraft (Note 14) |
3 | 16 | |||||||||
Accounts payable and accrued liabilities (Note 13) |
797 | 1,346 | |||||||||
Current portion of decommissioning and other provisions (Note 23) |
35 | 70 | |||||||||
Risk management liabilities (Note 14 and 15) |
314 | 1,129 | |||||||||
| Current portion of contract liabilities | 3 | 8 | |||||||||
| Income taxes payable | 9 | 73 | |||||||||
Dividends payable (Note 27 and 28) |
49 | 68 | |||||||||
Current portion of long-term debt and lease liabilities (Note 24) |
532 | 178 | |||||||||
| 1,742 | 2,888 | ||||||||||
| Non-current liabilities | |||||||||||
Credit facilities, long-term debt and lease liabilities (Note 24) |
2,934 | 3,475 | |||||||||
Exchangeable securities (Note 25) |
744 | 739 | |||||||||
Decommissioning and other provisions (Note 23) |
654 | 659 | |||||||||
Deferred income tax liabilities (Note 11) |
386 | 352 | |||||||||
Risk management liabilities (Note 14 and 15) |
274 | 333 | |||||||||
| Contract liabilities | 10 | 12 | |||||||||
Defined benefit obligation and other long-term liabilities (Note 26) |
251 | 294 | |||||||||
| Equity | |||||||||||
Common shares (Note 27) |
3,285 | 2,863 | |||||||||
Preferred shares (Note 28) |
942 | 942 | |||||||||
| Contributed surplus | 41 | 41 | |||||||||
| Deficit | (2,567) | (2,514) | |||||||||
Accumulated other comprehensive loss (Note 29) |
(164) | (222) | |||||||||
| Equity attributable to shareholders | 1,537 | 1,110 | |||||||||
Non-controlling interests (Note 12) |
127 | 879 | |||||||||
| Total equity | 1,664 | 1,989 | |||||||||
| Total liabilities and equity | 8,659 | 10,741 | |||||||||
 |
 |
|||||||
| On behalf of the Board: | John P. Dielwart Director |
Bryan D. Pinney
Chair of Audit, Finance and Risk Committee
|
||||||
| TransAlta Corporation | 2023 Integrated Report | F10 |
||||||
| Common shares |
Preferred shares |
Contributed surplus |
Deficit |
Accumulated other comprehensive
income (loss)(1)
|
Attributable to shareholders |
Attributable to non-controlling interests |
Total | |||||||||||||||||||
| Balance, Dec. 31, 2021 | 2,901 | 942 | 46 | (2,453) | 146 | 1,582 | 1,011 | 2,593 | ||||||||||||||||||
| Net earnings | — | — | — | 50 | — | 50 | 111 | 161 | ||||||||||||||||||
| Other comprehensive income (loss): | ||||||||||||||||||||||||||
| Net losses on translating net assets of foreign operations, net of hedges and of tax | — | — | — | — | (4) | (4) | — | (4) | ||||||||||||||||||
| Net losses on derivatives designated as cash flow hedges, net of tax | — | — | — | — | (456) | (456) | — | (456) | ||||||||||||||||||
| Net actuarial gains on defined benefits plans, net of tax | — | — | — | — | 37 | 37 | — | 37 | ||||||||||||||||||
| Intercompany and third-party FVTOCI investments | — | — | — | — | 55 | 55 | (56) | (1) | ||||||||||||||||||
| Total comprehensive income (loss) | — | — | — | 50 | (368) | (318) | 55 | (263) | ||||||||||||||||||
Common share dividends (Note 27) |
— | — | — | (57) | — | (57) | — | (57) | ||||||||||||||||||
Preferred share dividends (Note 28) |
— | — | — | (46) | — | (46) | — | (46) | ||||||||||||||||||
Shares purchased under NCIB program (Note 27) |
(46) | — | — | (8) | — | (54) | — | (54) | ||||||||||||||||||
Share-based payment plans and stock options exercised (Note 30) |
8 | — | (5) | — | — | 3 | — | 3 | ||||||||||||||||||
Distributions declared to non-controlling interests (Note 12) |
— | — | — | — | — | — | (187) | (187) | ||||||||||||||||||
| Balance, Dec. 31, 2022 | 2,863 | 942 | 41 | (2,514) | (222) | 1,110 | 879 | 1,989 | ||||||||||||||||||
| Net earnings | — | — | — | 695 | — | 695 | 101 | 796 | ||||||||||||||||||
| Other comprehensive income (loss): | ||||||||||||||||||||||||||
| Net losses on translating net assets of foreign operations, net of hedges and tax | — | — | — | — | 3 | 3 | — | 3 | ||||||||||||||||||
| Net gains on derivatives designated as cash flow hedges, net of tax | — | — | — | — | 99 | 99 | — | 99 | ||||||||||||||||||
| Net actuarial gains on defined benefits plans, net of tax | — | — | — | — | (5) | (5) | — | (5) | ||||||||||||||||||
| Intercompany FVTOCI investments | — | — | — | — | 25 | 25 | (25) | — | ||||||||||||||||||
| Total comprehensive income | — | — | — | 695 | 122 | 817 | 76 | 893 | ||||||||||||||||||
Common share dividends (Note 27) |
— | — | — | (65) | — | (65) | — | (65) | ||||||||||||||||||
Preferred share dividends (Note 28) |
— | — | — | (51) | — | (51) | — | (51) | ||||||||||||||||||
Shares purchased under normal course issuer bid ("NCIB") (Note 27) |
(80) | — | — | (7) | — | (87) | — | (87) | ||||||||||||||||||
Changes in non-controlling interests in TransAlta Renewables (Note 4) |
510 | — | — | (625) | (64) | (179) | (630) | (809) | ||||||||||||||||||
Provision for repurchase of shares under the automatic share purchase plan (Note 27) |
(19) | — | — | — | — | (19) | — | (19) | ||||||||||||||||||
Share-based payment plans and stock options exercised (Note 30) |
11 | — | — | — | — | 11 | — | 11 | ||||||||||||||||||
Distributions declared to non-controlling interests (Note 12) |
— | — | — | — | — | — | (198) | (198) | ||||||||||||||||||
Balance, Dec. 31, 2023 |
3,285 | 942 | 41 | (2,567) | (164) | 1,537 | 127 | 1,664 | ||||||||||||||||||
F11 |
TransAlta Corporation | 2023 Integrated Report | ||||||
| Year ended Dec. 31 | 2023 | 2022 | 2021 | |||||||||||
| Operating activities | ||||||||||||||
Net earnings (loss) |
796 | 161 | (425) | |||||||||||
Depreciation and amortization (Note 37) |
621 | 599 | 719 | |||||||||||
| Gain on sale of assets and other | (3) | (32) | (54) | |||||||||||
Accretion of provisions (Note 10 and 23) |
48 | 49 | 32 | |||||||||||
Decommissioning and restoration costs settled (Note 23) |
(37) | (35) | (18) | |||||||||||
Deferred income tax expense (recovery) (Note 11) |
34 | 127 | (11) | |||||||||||
| Unrealized loss (gain) from risk management activities | (36) | 385 | (34) | |||||||||||
| Unrealized foreign exchange gain | (9) | (82) | (24) | |||||||||||
| Provisions and contract liabilities | (1) | 19 | (41) | |||||||||||
Asset impairment charges (reversals) (Note 7) |
(48) | 9 | 648 | |||||||||||
Equity (income) loss, net of distributions from investments (Note 9) |
2 | (4) | (5) | |||||||||||
| Other non-cash items | (27) | (3) | 40 | |||||||||||
| Cash flow from operations before changes in working capital | 1,340 | 1,193 | 827 | |||||||||||
Change in non-cash operating working capital balances (Note 33) |
124 | (316) | 174 | |||||||||||
| Cash flow from operating activities | 1,464 | 877 | 1,001 | |||||||||||
| Investing activities | ||||||||||||||
Additions to property, plant and equipment (Note 18 and 37) |
(875) | (918) | (480) | |||||||||||
Additions to intangible assets (Note 20 and 37) |
(13) | (31) | (9) | |||||||||||
Restricted cash (Note 24) |
1 | — | (1) | |||||||||||
Repayment (advances) from loan receivable (Note 22) |
11 | 18 | (3) | |||||||||||
Acquisitions, net of cash acquired |
— | (10) | (120) | |||||||||||
Investments (Note 9) |
(13) | (10) | — | |||||||||||
| Proceeds on sale of Pioneer Pipeline | — | — | 128 | |||||||||||
| Proceeds on sale of property, plant and equipment | 29 | 66 | 39 | |||||||||||
| Realized gain (loss) on financial instruments | 18 | 27 | (6) | |||||||||||
| Decrease in finance lease receivable | 55 | 46 | 41 | |||||||||||
| Other | (25) | 45 | (16) | |||||||||||
| Change in non-cash investing working capital balances | (2) | 26 | (45) | |||||||||||
| Cash flow used in investing activities | (814) | (741) | (472) | |||||||||||
| Financing activities | ||||||||||||||
Net increase (decrease) in borrowings under credit facilities (Note 24 and 33) |
(46) | 449 | (114) | |||||||||||
Repayment of long-term debt (Note 24 and 33) |
(164) | (621) | (92) | |||||||||||
Issuance of long-term debt (Note 24 and 33) |
39 | 532 | 173 | |||||||||||
Dividends paid on common shares (Note 27) |
(58) | (54) | (48) | |||||||||||
Dividends paid on preferred shares (Note 28) |
(51) | (43) | (39) | |||||||||||
Repurchase of common shares under NCIB (Note 27) |
(87) | (52) | (4) | |||||||||||
| Proceeds on issuance of common shares | 5 | 3 | 8 | |||||||||||
Realized gain (loss) on financial instruments |
(30) | 42 | 3 | |||||||||||
Acquisition of TransAlta Renewables (Note 4) |
(811) | — | — | |||||||||||
Distributions paid to subsidiaries' non-controlling interests (Note 12) |
(223) | (187) | (156) | |||||||||||
Decrease in lease liabilities (Note 24 and 33) |
(10) | (9) | (8) | |||||||||||
| Financing fees and other | 1 | (13) | (4) | |||||||||||
| Change in non-cash financing working capital balances | 3 | (2) | (1) | |||||||||||
| Cash flow from (used in) financing activities | (1,432) | 45 | (282) | |||||||||||
| Cash flow from (used in) operating, investing and financing activities | (782) | 181 | 247 | |||||||||||
| Effect of translation on foreign currency cash | (4) | 6 | (3) | |||||||||||
| Increase (decrease) in cash and cash equivalents | (786) | 187 | 244 | |||||||||||
| Cash and cash equivalents, beginning of year | 1,134 | 947 | 703 | |||||||||||
| Cash and cash equivalents, end of year | 348 | 1,134 | 947 | |||||||||||
| Cash taxes paid | 94 | 67 | 57 | |||||||||||
| Cash interest paid | 277 | 229 | 220 | |||||||||||
Cash interest received |
54 | 20 | 7 | |||||||||||
| TransAlta Corporation | 2023 Integrated Report | F12 |
||||||
F13 |
TransAlta Corporation | 2023 Integrated Report | ||||||

| TransAlta Corporation | 2023 Integrated Report | F14 |
||||||
| Good or service | Description | ||||
| Capacity | Capacity refers to the availability of an asset to deliver goods or services. Customers typically pay for capacity for each defined time period (e.g., monthly) in an amount representative of the availability of the asset for the defined time period. Obligations to deliver capacity are satisfied over time and revenue is recognized using a time-based measure. Contracts for capacity are typically long term in nature. Payments are typically received from customers on a monthly basis. |
||||
| Contract power | The sale of contract power refers to the delivery of units of electricity to a customer under the terms of a contract. Customers pay a contractually specified price for the output at the end of predefined contractual periods (e.g., monthly). Obligations to deliver electricity are satisfied over time and revenue is recognized using a units-based output measure (i.e., megawatt hours). Contracts for power are typically long term in nature and payments are typically received on a monthly basis. | ||||
| Thermal energy | Thermal energy refers to the delivery of units of steam to a customer under the terms of a contract. Customers pay a contractually specified price for the output at the end of predefined contractual periods (e.g., monthly). Obligations to deliver steam are satisfied over time and revenue is recognized using a units-based output measure (i.e., gigajoules). Contracts for thermal energy are typically long term in nature. Payments are typically received from customers on a monthly basis. | ||||
| Environmental attributes | Environmental attributes refers to the delivery of renewable energy certificates, green attributes and other similar items. Customers may contract for environmental attributes in conjunction with the purchase of power, in which case the customer pays for the attributes in the month subsequent to the delivery of the power. Alternatively, customers pay upon delivery of the environmental attributes. Obligations to deliver environmental attributes are satisfied at a point in time, generally upon delivery of the item. | ||||
| Generation byproducts | Generation byproducts refers to the sale of byproducts from the use of coal in the Company’s current US and previous Canadian coal operations. Obligations to deliver byproducts are satisfied at a point in time, generally upon delivery of the item. Payments are received upon satisfaction of delivery of the byproducts. |
||||
F15 |
TransAlta Corporation | 2023 Integrated Report | ||||||
| TransAlta Corporation | 2023 Integrated Report | F16 |
||||||
F17 |
TransAlta Corporation | 2023 Integrated Report | ||||||
| TransAlta Corporation | 2023 Integrated Report | F18 |
||||||
| Hydro generation | 1-49 years |
||||
| Wind and Solar generation | 1-30 years |
||||
| Gas generation | 1-34 years |
||||
| Energy Transition | 1-9 years |
||||
| Capital spares and other | 1-49 years |
||||
| Software | 1-7 years |
||||
| Power sale contracts | 1-18 years |
||||
F19 |
TransAlta Corporation | 2023 Integrated Report | ||||||
| TransAlta Corporation | 2023 Integrated Report | F20 |
||||||
F21 |
TransAlta Corporation | 2023 Integrated Report | ||||||
| TransAlta Corporation | 2023 Integrated Report | F22 |
||||||
F23 |
TransAlta Corporation | 2023 Integrated Report | ||||||
| TransAlta Corporation | 2023 Integrated Report | F24 |
||||||
F25 |
TransAlta Corporation | 2023 Integrated Report | ||||||
| TransAlta Corporation | 2023 Integrated Report | F26 |
||||||
F27 |
TransAlta Corporation | 2023 Integrated Report | ||||||
| TransAlta Corporation | 2023 Integrated Report | F28 |
||||||
| Year ended Dec. 31, 2023 | Hydro | Wind and Solar |
Gas | Energy Transition | Energy Marketing |
Corporate | Total | ||||||||||||||||
| Revenues from contracts with customers | |||||||||||||||||||||||
Power and other |
30 | 190 | 400 | 12 | — | — | 632 | ||||||||||||||||
Environmental attributes(1) |
14 | 26 | — | — | — | — | 40 | ||||||||||||||||
| Revenue from contracts with customers | 44 | 216 | 400 | 12 | — | — | 672 | ||||||||||||||||
Revenue from leases(2) |
— | — | 32 | — | — | — | 32 | ||||||||||||||||
Revenue from derivatives and other trading activities(3) |
44 | (2) | (172) | 251 | 220 | — | 341 | ||||||||||||||||
| Revenue from merchant sales | 434 | 104 | 1,247 | 488 | — | — | 2,273 | ||||||||||||||||
Other(4) |
11 | 18 | 7 | — | — | 1 | 37 | ||||||||||||||||
| Total revenue | 533 | 336 | 1,514 | 751 | 220 | 1 | 3,355 | ||||||||||||||||
| Revenues from contracts with customers | |||||||||||||||||||||||
| Timing of revenue recognition | |||||||||||||||||||||||
At a point in time |
14 | 26 | — | 12 | — | — | 52 | ||||||||||||||||
Over time |
30 | 190 | 400 | — | — | — | 620 | ||||||||||||||||
Total revenue from contracts with customers |
44 | 216 | 400 | 12 | — | — | 672 | ||||||||||||||||
F29 |
TransAlta Corporation | 2023 Integrated Report | ||||||
| Year ended Dec. 31, 2022 | Hydro | Wind and Solar |
Gas | Energy Transition | Energy Marketing |
Corporate | Total | ||||||||||||||||
| Revenues from contracts with customers | |||||||||||||||||||||||
Power and other |
33 | 220 | 462 | 10 | — | — | 725 | ||||||||||||||||
Environmental attributes(1) |
1 | 50 | — | — | — | — | 51 | ||||||||||||||||
| Revenue from contracts with customers | 34 | 270 | 462 | 10 | — | — | 776 | ||||||||||||||||
Revenue from leases(2) |
— | — | 32 | — | — | — | 32 | ||||||||||||||||
Revenue from derivatives and other trading activities(3) |
— | (121) | (821) | 243 | 160 | (2) | (541) | ||||||||||||||||
| Revenue from merchant sales | 564 | 119 | 1,529 | 461 | — | — | 2,673 | ||||||||||||||||
Other(4) |
8 | 21 | 7 | — | — | — | 36 | ||||||||||||||||
| Total revenue | 606 | 289 | 1,209 | 714 | 160 | (2) | 2,976 | ||||||||||||||||
| Revenues from contracts with customers | |||||||||||||||||||||||
| Timing of revenue recognition | |||||||||||||||||||||||
At a point in time |
1 | 50 | — | 12 | — | — | 63 | ||||||||||||||||
Over time |
33 | 220 | 462 | (2) | — | — | 713 | ||||||||||||||||
| Total revenue from contracts with customers | 34 | 270 | 462 | 10 | — | — | 776 | ||||||||||||||||
| TransAlta Corporation | 2023 Integrated Report | F30 |
||||||
| Year ended Dec. 31, 2021 | Hydro | Wind and Solar |
Gas | Energy Transition | Energy Marketing |
Corporate | Total | ||||||||||||||||
| Revenues from contracts with customers | |||||||||||||||||||||||
Power and other |
28 | 207 | 395 | 24 | — | — | 654 | ||||||||||||||||
Environmental attributes(1) |
— | 28 | — | — | — | — | 28 | ||||||||||||||||
| Revenue from contracts with customers | 28 | 235 | 395 | 24 | — | — | 682 | ||||||||||||||||
Revenue from leases(2) |
— | — | 19 | — | — | — | 19 | ||||||||||||||||
Revenue from derivatives and other trading activities(3) |
— | (22) | (118) | 138 | 211 | 4 | 213 | ||||||||||||||||
| Revenue from merchant sales | 345 | 35 | 808 | 546 | — | — | 1,734 | ||||||||||||||||
Other(4) |
10 | 57 | 5 | 1 | — | — | 73 | ||||||||||||||||
| Total revenue | 383 | 305 | 1,109 | 709 | 211 | 4 | 2,721 | ||||||||||||||||
| Revenues from contracts with customers | |||||||||||||||||||||||
| Timing of revenue recognition | |||||||||||||||||||||||
At a point in time |
— | 28 | 2 | 23 | — | — | 53 | ||||||||||||||||
Over time |
28 | 207 | 393 | 1 | — | — | 629 | ||||||||||||||||
| Total revenue from contracts with customers | 28 | 235 | 395 | 24 | — | — | 682 | ||||||||||||||||
F31 |
TransAlta Corporation | 2023 Integrated Report | ||||||
| Year ended Dec. 31 | 2023 | 2022 | 2021 | |||||||||||||||||
| Fuel and purchased power |
OM&A | Fuel and purchased power |
OM&A | Fuel and purchased power |
OM&A | |||||||||||||||
| Gas fuel costs | 384 | — | 578 | — | 306 | — | ||||||||||||||
Coal fuel costs(1) |
177 | — | 146 | — | 164 | — | ||||||||||||||
| Royalty, land lease, other direct costs | 25 | — | 25 | — | 19 | — | ||||||||||||||
| Purchased power | 474 | — | 514 | — | 339 | — | ||||||||||||||
Mine depreciation(2) |
— | — | — | — | 190 | — | ||||||||||||||
| Salaries and benefits | — | 254 | — | 263 | 36 | 234 | ||||||||||||||
Other operating expenses(3) |
— | 285 | — | 258 | — | 277 | ||||||||||||||
| Total | 1,060 | 539 | 1,263 | 521 | 1,054 | 511 | ||||||||||||||
| TransAlta Corporation | 2023 Integrated Report | F32 |
||||||
| Year ended Dec. 31 | 2023 | 2022 | 2021 | |||||||||||
| Segments: | ||||||||||||||
| Hydro | (10) | 21 | 5 | |||||||||||
| Wind and Solar | (4) | 43 | 12 | |||||||||||
| Gas | — | 5 | ||||||||||||
| Energy Transition | — | — | 540 | |||||||||||
| Corporate | — | (2) | 27 | |||||||||||
Changes in decommissioning and restoration provisions on retired assets(1) |
(34) | (53) | 32 | |||||||||||
Intangible asset impairment charges - coal rights |
— | — | 17 | |||||||||||
Project development costs |
— | — | 10 | |||||||||||
| Asset impairment charges (reversals) | (48) | 9 | 648 | |||||||||||
F33 |
TransAlta Corporation | 2023 Integrated Report | ||||||
| Location of assets |
Current year contract
and merchant
discount rates
|
Prior year contract
and merchant
discount rates
|
|||||||||
| Wind and Solar | Canada | 6.4 and 7.0 per cent |
6.4 and 7.1 per cent |
||||||||
| US | 6.9 and 7.5 per cent |
6.5 and 7.7 per cent |
|||||||||
| Hydro | Canada | 6.1 and 6.4 per cent |
5.9 and 6.4 per cent |
||||||||
| TransAlta Corporation | 2023 Integrated Report | F34 |
||||||
| Year ended Dec. 31 | 2023 | 2022 | 2021 | |||||||||||
| Alberta Off-Coal Agreement | (40) | (40) | (40) | |||||||||||
| Liquidated damages recoverable | (6) | (12) | — | |||||||||||
| Insurance recoveries | (1) | (7) | — | |||||||||||
| Supplier, other contract settlements and other | — | 1 | 34 | |||||||||||
| Onerous contract provisions | — | — | 14 | |||||||||||
Net other operating (income) loss |
(47) | (58) | 8 | |||||||||||
F35 |
TransAlta Corporation | 2023 Integrated Report | ||||||
| EMG | Skookumchuck |
Tent
Mountain
|
EIP | Ekona | Total | |||||||||||||||
| Classification | Equity-accounted | Equity-accounted | Equity-accounted | FVTPL | FVTOCI | |||||||||||||||
| Balance, Dec. 31, 2021 | 12 | 93 | — | — | — | 105 | ||||||||||||||
| Investment | — | — | — | 10 | 2 | 12 | ||||||||||||||
| Equity income (loss) | (1) | 10 | — | — | — | 9 | ||||||||||||||
| Distributions received | — | (5) | — | — | — | (5) | ||||||||||||||
Changes in foreign exchange rates |
1 | 7 | — | 1 | — | 9 | ||||||||||||||
Net change in fair value recognized in OCI |
— | — | — | — | (1) | (1) | ||||||||||||||
| Balance, Dec. 31, 2022 | 12 | 105 | — | 11 | 1 | 129 | ||||||||||||||
| Investment | — | — | 10 | 4 | — | 14 | ||||||||||||||
| Equity income (loss) | (4) | 8 | — | — | — | 4 | ||||||||||||||
| Distributions received | — | (6) | — | — | — | (6) | ||||||||||||||
Changes in foreign exchange rates |
— | (3) | — | — | — | (3) | ||||||||||||||
| Balance, Dec. 31, 2023 | 8 | 104 | 10 | 15 | 1 | 138 | ||||||||||||||
| TransAlta Corporation | 2023 Integrated Report | F36 |
||||||
| Year ended Dec. 31 | 2023 | 2022 | 2021 | |||||||||||
| Results of operations | ||||||||||||||
| Revenues and other operating income | 22 | 24 | 19 | |||||||||||
| Expenses | (18) | (15) | (10) | |||||||||||
| Proportionate share of net earnings | 4 | 9 | 9 | |||||||||||
| 2023 | 2022 | 2021 | ||||||||||||
| Interest on debt | 203 | 164 | 163 | |||||||||||
Interest on exchangeable debentures (Note 25) |
29 | 29 | 29 | |||||||||||
Interest on exchangeable preferred shares (Note 25) |
28 | 28 | 28 | |||||||||||
Capitalized interest (Note 18) |
(57) | (16) | (14) | |||||||||||
| Interest on lease liabilities | 9 | 7 | 7 | |||||||||||
| Credit facility fees, bank charges and other interest | 21 | 27 | 20 | |||||||||||
Tax shield on tax equity financing (Note 24) |
— | (2) | (9) | |||||||||||
Accretion of provisions (Note 23) |
48 | 49 | 32 | |||||||||||
| Interest expense | 281 | 286 | 256 | |||||||||||
F37 |
TransAlta Corporation | 2023 Integrated Report | ||||||
| Year ended Dec. 31 | 2023 | 2022 | 2021 | ||||||||
| Earnings (loss) before income taxes | 880 | 353 | (380) | ||||||||
Net earnings attributable to non-controlling interests not subject to tax |
(80) | (94) | (33) | ||||||||
| Adjusted earnings (loss) before income taxes | 800 | 259 | (413) | ||||||||
| Statutory Canadian federal and provincial income tax rate (%) | 23.4 | % | 23.4 | % | 23.6 | % | |||||
| Expected income tax expense (recovery) | 187 | 61 | (98) | ||||||||
| Increase (decrease) in income taxes resulting from: | |||||||||||
| Differences in effective foreign tax rates | 9 | (1) | 4 | ||||||||
Non-deductible expense(1) |
58 | 130 | — | ||||||||
Taxable capital (gain) loss |
(2) | 18 | — | ||||||||
Deferred income tax recovery related to temporary difference on investment in subsidiaries |
(3) | (2) | — | ||||||||
|
Write-down (reversal of write-down) of unrecognized deferred income tax
assets
|
(178) | (24) | 134 | ||||||||
| Statutory and other rate differences | 1 | (3) | 4 | ||||||||
| Adjustments in respect of deferred income tax of previous years | 1 | 6 | (4) | ||||||||
| Other | 11 | 7 | 5 | ||||||||
| Income tax expense | 84 | 192 | 45 | ||||||||
| Effective tax rate (%) | 11 | % | 74 | % | (11 | %) | |||||
| TransAlta Corporation | 2023 Integrated Report | F38 |
||||||
| Year ended Dec. 31 | 2023 | 2022 | 2021 | |||||||||||
| Current income tax expense | 50 | 65 | 56 | |||||||||||
Deferred income tax expense (recovery) related to the origination and reversal of temporary differences |
215 | 153 | (145) | |||||||||||
Deferred income tax recovery related to temporary difference on investment in subsidiaries |
(3) | (2) | — | |||||||||||
Write-down (reversal of write-down) of unrecognized deferred income tax assets(1) |
(178) | (24) | 134 | |||||||||||
| Income tax expense | 84 | 192 | 45 | |||||||||||
| Current income tax expense | 50 | 65 | 56 | |||||||||||
| Deferred income tax expense (recovery) | 34 | 127 | (11) | |||||||||||
| Income tax expense | 84 | 192 | 45 | |||||||||||
| Year ended Dec. 31 | 2023 | 2022 | 2021 | |||||||||||
| Income tax expense (recovery) related to: | ||||||||||||||
| Net impact related to cash flow hedges | 27 | (112) | (57) | |||||||||||
| Net impact related to hedges of foreign operations | 1 | (3) | — | |||||||||||
Net impact related to net actuarial gains (losses) |
(1) | 12 | 11 | |||||||||||
| Transaction costs for the acquisition of TransAlta Renewables | (2) | — | — | |||||||||||
| Income tax expense (recovery) reported in equity | 25 | (103) | (46) | |||||||||||
F39 |
TransAlta Corporation | 2023 Integrated Report | ||||||
| As at Dec. 31 | 2023 | 2022 | |||||||||
Non-capital losses(1) |
88 | 244 | |||||||||
| Future decommissioning and restoration costs | 111 | 119 | |||||||||
| Property, plant and equipment | (605) | (553) | |||||||||
| Risk management assets and liabilities, net | 144 | 193 | |||||||||
| Employee future benefits and compensation plans | 50 | 48 | |||||||||
| Foreign exchange differences on US-denominated debt | 12 | 13 | |||||||||
Other taxable temporary differences |
(8) | (5) | |||||||||
Net deferred income tax asset (liability), before write-down of deferred income tax assets |
(208) | 59 | |||||||||
| Unrecognized deferred income tax assets | (157) | (361) | |||||||||
| Net deferred income tax liability, after write-down of deferred income tax assets | (365) | (302) | |||||||||
| As at Dec. 31 | 2023 | 2022 | |||||||||
Deferred income tax assets(1) |
21 | 50 | |||||||||
| Deferred income tax liabilities | (386) | (352) | |||||||||
| Net deferred income tax liability | (365) | (302) | |||||||||
| TransAlta Corporation | 2023 Integrated Report | F40 |
||||||
| Subsidiary / Operation | Non-controlling interest owner | Non-controlling interest as at Dec. 31, 2023 | Non-controlling interest as at Dec. 31, 2022 | |||||||||||
TransAlta Cogeneration LP |
Canadian Power Holdings Inc. | 49.99% |
49.99% |
|||||||||||
| Kent Hills Wind LP | Natural Forces Technologies Inc. | 17% |
17% |
|||||||||||
| TransAlta Renewables Inc. | Public shareholders | nil(1) |
39.9% |
|||||||||||
| Year ended Dec. 31 | 2023 | 2022 | 2021 | ||||||||
| Revenues | 290 | 347 | 265 | ||||||||
Net earnings and total comprehensive income |
121 | 143 | 103 | ||||||||
| Amounts attributable to the non-controlling interest: | |||||||||||
| Net earnings | 80 | 91 | 62 | ||||||||
| Total comprehensive income | 80 | 91 | 62 | ||||||||
| Distributions paid to Canadian Power Holdings Inc. | 148 | 87 | 56 | ||||||||
| As at Dec. 31 | 2023 | 2022 | |||||||||
| Current assets | 43 | 127 | |||||||||
| Long-term assets | 193 | 253 | |||||||||
| Current liabilities | (41) | (62) | |||||||||
| Long-term liabilities | (34) | (27) | |||||||||
| Total equity | (161) | (291) | |||||||||
| Equity attributable to Canadian Power Holdings Inc. | (79) | (147) | |||||||||
| Non-controlling interest share (per cent) | 49.99 | 49.99 | |||||||||
F41 |
TransAlta Corporation | 2023 Integrated Report | ||||||
| Year ended Dec. 31 | 2023(1) |
||||
| Revenues | 7 | ||||
| Net earnings and total comprehensive income | 2 | ||||
| Amounts attributable to the non-controlling interest: | |||||
| Net earnings and total comprehensive income | — | ||||
| As at Dec. 31 | 2023 | |||||||
| Current assets | 35 | |||||||
| Long-term assets | 481 | |||||||
| Current liabilities | (42) | |||||||
| Long-term liabilities | (188) | |||||||
| Total equity | (285) | |||||||
| Equity attributable to non-controlling interests | (48) | |||||||
| Non-controlling interest share (per cent) | 17 |
|||||||
| Year ended Dec. 31 | 2023(1) |
2022 | 2021 | |||||||||||
| Revenues | 303 | 560 | 470 | |||||||||||
| Net earnings | 56 | 74 | 139 | |||||||||||
| Total comprehensive income (loss) | (7) | (67) | 66 | |||||||||||
| Amounts attributable to the non-controlling interests: | ||||||||||||||
| Net earnings | 21 | 20 | 50 | |||||||||||
| Total comprehensive income (loss) | (4) | (36) | 21 | |||||||||||
| Distributions paid to non-controlling interests | 75 | 100 | 100 | |||||||||||
| TransAlta Corporation | 2023 Integrated Report | F42 |
||||||
| As at Dec. 31 | 2022 | ||||
| Current assets | 240 | ||||
| Long-term assets | 2,989 | ||||
| Current liabilities | (306) | ||||
| Long-term liabilities | (1,118) | ||||
| Total equity | (1,805) | ||||
| Equity attributable to non-controlling interests | (732) | ||||
| Non-controlling interests’ share (per cent) | 39.9 | ||||
| As at Dec. 31 | 2023 | 2022 | ||||||
| Trade accounts receivable | 600 | 1,165 | ||||||
Collateral provided (Note 15) |
145 | 304 | ||||||
Current portion of finance lease receivables (Note 17) |
19 | 52 | ||||||
Loan receivable (Note 22) |
1 | 4 | ||||||
| Income taxes receivable | 42 | 64 | ||||||
| Trade and other receivables | 807 | 1,589 | ||||||
| As at Dec. 31 | 2023 | 2022 | ||||||
| Accounts payable and accrued liabilities | 772 | 1,069 | ||||||
| Interest payable | 16 | 17 | ||||||
Collateral held (Note 15) |
9 | 260 | ||||||
| Accounts payable and accrued liabilities | 797 | 1,346 | ||||||
F43 |
TransAlta Corporation | 2023 Integrated Report | ||||||
| Carrying value as at Dec. 31, 2023 | Derivatives used for hedging |
Derivatives held for trading (FVTPL) |
Amortized cost | Other financial assets (FVTPL) | Other financial assets (FVOCI) | Total | ||||||||||||||
| Financial assets | ||||||||||||||||||||
Cash and cash equivalents(1) |
— | — | 348 | — | — | 348 | ||||||||||||||
| Restricted cash | — | — | 69 | — | — | 69 | ||||||||||||||
| Trade and other receivables | — | — | 807 | — | — | 807 | ||||||||||||||
| Long-term portion of finance lease receivables | — | — | 171 | — | — | 171 | ||||||||||||||
Long-term portion of loan receivable(2) |
— | — | 25 | — | — | 25 | ||||||||||||||
Other investments(3) |
— | — | — | 15 | 1 | 16 | ||||||||||||||
| Risk management assets | ||||||||||||||||||||
| Current | — | 151 | — | — | — | 151 | ||||||||||||||
| Long-term | — | 52 | — | — | — | 52 | ||||||||||||||
| Financial liabilities | ||||||||||||||||||||
| Bank overdraft | — | — | 3 | — | — | 3 | ||||||||||||||
Accounts payable and accrued liabilities |
— | — | 797 | — | — | 797 | ||||||||||||||
| Dividends payable | — | — | 49 | — | — | 49 | ||||||||||||||
| Risk management liabilities | ||||||||||||||||||||
| Current | 125 | 189 | — | — | — | 314 | ||||||||||||||
| Long-term | 80 | 194 | — | — | — | 274 | ||||||||||||||
Credit facilities, long-term debt and lease liabilities(4) |
— | — | 3,466 | — | — | 3,466 | ||||||||||||||
| Exchangeable securities | — | — | 744 | — | — | 744 | ||||||||||||||
| TransAlta Corporation | 2023 Integrated Report | F44 |
||||||
| Carrying value as at Dec. 31, 2022 | Derivatives used for hedging |
Derivatives held for trading (FVTPL) |
Amortized cost | Other financial assets (FVTPL) | Other financial assets (FVTOCI) | Total | ||||||||||||||
| Financial assets | ||||||||||||||||||||
Cash and cash equivalents(1) |
— | — | 1,134 | — | — | 1,134 | ||||||||||||||
| Restricted cash | — | — | 70 | — | — | 70 | ||||||||||||||
| Trade and other receivables | — | — | 1,589 | — | — | 1,589 | ||||||||||||||
| Long-term portion of finance lease receivables | — | — | 129 | — | — | 129 | ||||||||||||||
Long-term portion of loan receivable(2) |
— | — | 33 | — | — | 33 | ||||||||||||||
Other investments(3) |
— | — | — | 11 | 1 | 12 | ||||||||||||||
| Risk management assets | ||||||||||||||||||||
| Current | — | 709 | — | — | — | 709 | ||||||||||||||
| Long-term | — | 161 | — | — | — | 161 | ||||||||||||||
| Financial liabilities | ||||||||||||||||||||
| Bank overdraft | — | — | 16 | — | — | 16 | ||||||||||||||
| Accounts payable and accrued liabilities | — | — | 1,346 | — | — | 1,346 | ||||||||||||||
| Dividends payable | — | — | 68 | — | — | 68 | ||||||||||||||
| Risk management liabilities | ||||||||||||||||||||
| Current | 271 | 858 | — | — | — | 1,129 | ||||||||||||||
| Long-term | 76 | 257 | — | — | — | 333 | ||||||||||||||
Credit facilities, long-term debt and lease liabilities(4) |
— | — | 3,653 | — | — | 3,653 | ||||||||||||||
| Exchangeable securities | — | — | 739 | — | — | 739 | ||||||||||||||
F45 |
TransAlta Corporation | 2023 Integrated Report | ||||||
| TransAlta Corporation | 2023 Integrated Report | F46 |
||||||
| Year ended Dec. 31, 2023 | Year ended Dec. 31, 2022 | ||||||||||||||||||||||
| Hedge | Non-hedge | Total | Hedge | Non-hedge | Total | ||||||||||||||||||
| Opening balance | (347) | (435) | (782) | 285 | (126) | 159 | |||||||||||||||||
| Changes attributable to: | |||||||||||||||||||||||
| Market price changes on existing contracts | (123) | (6) | (129) | (611) | (298) | (909) | |||||||||||||||||
Market price changes on new contracts |
— | 18 | 18 | — | (124) | (124) | |||||||||||||||||
| Contracts settled | 256 | 269 | 525 | (38) | 118 | 80 | |||||||||||||||||
| Change in foreign exchange rates | 9 | 7 | 16 | 17 | (5) | 12 | |||||||||||||||||
Transfers out of Level III(1) |
205 | — | 205 | — | — | — | |||||||||||||||||
Net risk management assets (liabilities) at end of year |
— | (147) | (147) | (347) | (435) | (782) | |||||||||||||||||
| Additional Level III information: | |||||||||||||||||||||||
| Losses recognized in other comprehensive loss | (114) | — | (114) | (594) | — | (594) | |||||||||||||||||
Total gains (losses) included in earnings before income taxes |
(256) | 19 | (237) | 38 | (427) | (389) | |||||||||||||||||
Unrealized gains (losses) included in earnings before income taxes relating to net assets (liabilities) held at year end |
— | 288 | 288 | — | (309) | (309) | |||||||||||||||||
F47 |
TransAlta Corporation | 2023 Integrated Report | ||||||
| As at | Dec. 31, 2023 | |||||||||||||
| Description | Valuation technique | Unobservable input | Reasonably possible change | Sensitivity(1) |
||||||||||
| Coal transportation – US | Numerical derivative valuation |
Volatility | 80% to 120% |
+6 |
||||||||||
| Rail rate escalation | zero to 10% |
-4 |
||||||||||||
Full requirements – Eastern US |
Scenario analysis | Volume | 96% to 104% |
+3 |
||||||||||
| Cost of supply |
Decrease of $2.30 per MWh
or increase of $2.40 per MWh
|
-3 |
||||||||||||
Long-term wind energy sale – Eastern US |
Long-term price forecast | Illiquid future power prices (per MWh) |
Price decrease
or increase of US$6
|
+24 |
||||||||||
| Illiquid future REC prices (per unit) |
Price decrease of US$12
or increase of US$8
|
|||||||||||||
| Wind discounts | 0% decrease or 9% increase |
-28 |
||||||||||||
Long-term wind energy sale – Canada |
Long-term price forecast | Illiquid future power prices (per MWh) |
Price decrease of C$81
or increase of C$5
|
+65 | ||||||||||
| Wind discounts | 16% decrease or 5% increase |
-23 | ||||||||||||
Long-term wind energy sale - Central US |
Long-term price forecast | Illiquid future power prices (per MWh) |
Price decrease of US$1
or increase of US$2
|
+81 | ||||||||||
| Wind discounts | 5% decrease or 2% increase |
-36 | ||||||||||||
| TransAlta Corporation | 2023 Integrated Report | F48 |
||||||
| As at | Dec. 31, 2022 | |||||||||||||
| Description | Valuation technique |
Unobservable input | Reasonably possible change | Sensitivity(1) |
||||||||||
Coal transportation – US |
Numerical derivative valuation | Illiquid future power prices (per MWh) |
Price decrease of US$5
or increase of US$55
|
+14 |
||||||||||
| Volatility | 80% to 120% |
|||||||||||||
| Rail rate escalation | zero to 10% |
-13 |
||||||||||||
Full requirements - Eastern US |
Scenario analysis | Volume | 96% to 104% |
+3 |
||||||||||
| Cost of supply |
Decrease of US$0.50 per MWh
or increase of US$3.30 per MWh
|
-21 |
||||||||||||
Long-term wind energy sale – Eastern US |
Long-term price forecast | Illiquid future power prices (per MWh) |
Price decrease
or increase of US$6
|
+22 |
||||||||||
| Illiquid future REC prices (per unit) |
Price decrease
or increase of US$2
|
|||||||||||||
| Wind discounts | 0% decrease or 5% increase |
-18 |
||||||||||||
Long-term wind energy sale – Canada |
Long-term price forecast | Illiquid future power prices (per MWh) |
Price decrease of C$85
or increase of C$5
|
+47 |
||||||||||
| Wind discounts | 28% decrease or 5% increase |
-25 |
||||||||||||
| Long-term wind energy sale – Central US | Long-term price forecast | Illiquid future power prices (per MWh) |
Price decrease
or increase of US$2
|
+74 |
||||||||||
| Wind discounts | 2% decrease or 5% increase |
-28 |
||||||||||||
Long-term power sale – US |
Long-term price forecast | Illiquid future power prices (per MWh) |
Price decrease of US$5
or increase of US$55
|
+15 |
||||||||||
-163 | ||||||||||||||
F49 |
TransAlta Corporation | 2023 Integrated Report | ||||||
| TransAlta Corporation | 2023 Integrated Report | F50 |
||||||
Fair value(1) |
Total
carrying
value(1)
|
||||||||||||||||
| Level I | Level II | Level III | Total | ||||||||||||||
| Exchangeable securities — Dec. 31, 2023 | — | 718 | — | 718 | 744 | ||||||||||||
| Long-term debt — Dec. 31, 2023 | — | 3,104 | — | 3,104 | 3,323 | ||||||||||||
| Loan receivable — Dec. 31, 2023 | — | 26 | — | 26 | 26 | ||||||||||||
| Exchangeable securities — Dec. 31, 2022 | — | 685 | — | 685 | 739 | ||||||||||||
| Long-term debt — Dec. 31, 2022 | — | 3,200 | — | 3,200 | 3,518 | ||||||||||||
| Loan receivable — Dec. 31, 2022 | — | 37 | — | 37 | 37 | ||||||||||||
| As at Dec. 31 | 2023 | 2022 | 2021 | |||||||||||
Unamortized net loss at beginning of year |
(213) | (131) | (33) | |||||||||||
New inception gains (losses)(1) |
47 | (37) | (79) | |||||||||||
Change resulting from amended contract(2) |
190 | — | — | |||||||||||
| Change in foreign exchange rates | 6 | (10) | — | |||||||||||
| Amortization recorded in net earnings during the year | (27) | (35) | (19) | |||||||||||
| Unamortized net gain (loss) at end of year | 3 | (213) | (131) | |||||||||||
F51 |
TransAlta Corporation | 2023 Integrated Report | ||||||
| TransAlta Corporation | 2023 Integrated Report | F52 |
||||||
| As at Dec. 31, 2023 | |||||||||||
| Cash flow hedges |
Not designated as a hedge |
Total | |||||||||
| Commodity risk management | |||||||||||
| Current | (125) | (53) | (178) | ||||||||
| Long-term | (80) | (146) | (226) | ||||||||
| Net commodity risk management liabilities | (205) | (199) | (404) | ||||||||
| Other | |||||||||||
| Current | — | 15 | 15 | ||||||||
| Long-term | — | 4 | 4 | ||||||||
| Net other risk management assets | — | 19 | 19 | ||||||||
| Total net risk management liabilities | (205) | (180) | (385) | ||||||||
| As at Dec. 31, 2022 | |||||||||||
| Cash flow hedges |
Not designated as a hedge |
Total | |||||||||
| Commodity risk management | |||||||||||
| Current | (271) | (143) | (414) | ||||||||
| Long-term | (76) | (96) | (172) | ||||||||
| Net commodity risk management liabilities | (347) | (239) | (586) | ||||||||
| Other | |||||||||||
| Current | — | (6) | (6) | ||||||||
| Long-term | — | — | — | ||||||||
| Net other risk management liabilities | — | (6) | (6) | ||||||||
| Total net risk management liabilities | (347) | (245) | (592) | ||||||||
F53 |
TransAlta Corporation | 2023 Integrated Report | ||||||
| As at Dec. 31, 2023 | Gross amounts of recognized financial assets (liabilities) | Amounts set off | Net amounts included on the statement of financial position |
Master netting arrangements(1) |
Net amount | ||||||||||||
| Current risk management assets | 528 | (355) | 173 | (7) | 166 | ||||||||||||
| Long-term risk management assets | 161 | (91) | 70 | (2) | 68 | ||||||||||||
| Current risk management liabilities | (504) | 355 | (149) | 7 | (142) | ||||||||||||
| Long-term risk management liabilities | (145) | 91 | (54) | 2 | (52) | ||||||||||||
Trade and other receivables(2) |
789 | (646) | 143 | (11) | 132 | ||||||||||||
|
Accounts payable and accrued
liabilities(2)
|
(760) | 646 | (114) | 11 | (103) | ||||||||||||
| As at Dec. 31, 2022 | Gross amounts of recognized financial assets (liabilities) | Amounts set off | Net amounts included on the statement of financial position |
Master netting arrangements(1) |
Net amount | ||||||||||||
| Current risk management assets | 1,602 | (883) | 719 | (62) | 657 | ||||||||||||
| Long-term risk management assets | 204 | (43) | 161 | (7) | 154 | ||||||||||||
| Current risk management liabilities | (1,953) | 883 | (1,070) | 62 | (1,008) | ||||||||||||
| Long-term risk management liabilities | (449) | 43 | (406) | 7 | (399) | ||||||||||||
Trade and other receivables(2) |
1,330 | (934) | 396 | (176) | 220 | ||||||||||||
Accounts payable and accrued liabilities(2) |
(1,344) | 934 | (410) | 176 | (234) | ||||||||||||
| TransAlta Corporation | 2023 Integrated Report | F54 |
||||||
F55 |
TransAlta Corporation | 2023 Integrated Report | ||||||
| As at Dec. 31 | 2023 | 2022 | ||||||||||||
| Type (thousands) |
Notional amount sold |
Notional amount purchased |
Notional amount sold |
Notional amount purchased |
||||||||||
Electricity (MWh) |
54,043 | 12,628 | 55,821 | 13,934 | ||||||||||
| Natural gas (GJ) | 50,949 | 209,348 | 23,464 | 162,384 | ||||||||||
| Transmission (MWh) | — | 856 | — | 1,643 | ||||||||||
| Emissions (MWh) | 212 | 804 | 274 | 2,297 | ||||||||||
| Emissions (tonnes) | 4,450 | 5,125 | 300 | 300 | ||||||||||
Coal (tonnes) |
— | 5,172 | — | 7,746 | ||||||||||
| TransAlta Corporation | 2023 Integrated Report | F56 |
||||||
| As at Dec. 31 | 2023 | 2022 | |||||||||||||||||||||
| Notional amount sold |
Notional amount purchased |
Fair value asset (liability) |
Maturity | Notional amount sold |
Notional amount purchased |
Fair value asset (liability) |
Maturity | ||||||||||||||||
| Foreign exchange forward contracts – foreign-denominated receipts/expenditures | |||||||||||||||||||||||
| AUD125 | CAD113 | (1) | 2024-2027 | AUD183 | CAD168 | (1) | 2023-2026 | ||||||||||||||||
| USD828 | CAD1,113 | 19 | 2024-2027 | USD573 | CAD761 | (12) | 2023-2025 | ||||||||||||||||
| USD100 | AUD152 | 5 | 2024 | USD66 | AUD102 | 4 | 2023 | ||||||||||||||||
| Foreign exchange forward contracts – foreign-denominated debt | |||||||||||||||||||||||
| CAD190 | USD140 | (4) | 2024 | CAD159 | USD120 | 3 | 2023 | ||||||||||||||||
F57 |
TransAlta Corporation | 2023 Integrated Report | ||||||
| Year ended Dec. 31 | 2023 | 2022 | 2021 | |||||||||||||||||
| Currency |
Net earnings
decrease(1)
|
OCI gain(1)(2) |
Net earnings increase
(decrease)(1)
|
OCI gain(1)(2) |
Net earnings
decrease(1)
|
OCI gain(1)(2) |
||||||||||||||
| USD | (11) | — | (12) | — | (13) | 1 | ||||||||||||||
| AUD | (3) | — | (2) | — | 1 | — | ||||||||||||||
| Total | (14) | — | (14) | — | (12) | 1 | ||||||||||||||
|
Investment grade
(per cent)
|
Non-investment grade
(per cent)
|
Total
(per cent)
|
Total amount |
|||||||||||
Trade and other receivables(1) |
95 | 5 | 100 | 807 | ||||||||||
| Long-term finance lease receivable | 100 | — | 100 | 171 | ||||||||||
Risk management assets(1) |
75 | 25 | 100 | 203 | ||||||||||
Loans receivable(2) |
— | 100 | 100 | 26 | ||||||||||
| Total | 1,207 | |||||||||||||
| TransAlta Corporation | 2023 Integrated Report | F58 |
||||||
| 2024 | 2025 | 2026 | 2027 | 2028 | 2029 and thereafter | Total | |||||||||||||||||
| Bank overdraft | 3 | — | — | — | — | — | 3 | ||||||||||||||||
| Accounts payable and accrued liabilities | 797 | — | — | — | — | — | 797 | ||||||||||||||||
Long-term debt(1) |
|||||||||||||||||||||||
Credit facilities(1) |
400 | — | — | — | — | — | 400 | ||||||||||||||||
| Debentures | — | — | — | — | — | 251 | 251 | ||||||||||||||||
| Senior notes | — | — | — | — | — | 924 | 924 | ||||||||||||||||
Non-recourse – Hydro |
— | — | — | — | — | 39 | 39 | ||||||||||||||||
Non-recourse – Wind & Solar |
66 | 69 | 67 | 70 | 75 | 289 | 636 | ||||||||||||||||
Non-recourse and other – Gas |
46 | 58 | 61 | 65 | 66 | 707 | 1,003 | ||||||||||||||||
| Tax equity financing | 14 | 15 | 15 | 18 | 21 | 27 | 110 | ||||||||||||||||
Exchangeable securities(2) |
— | — | — | — | — | 750 | 750 | ||||||||||||||||
| Commodity risk management liabilities | 169 | 123 | 15 | 12 | 12 | 73 | 404 | ||||||||||||||||
| Other risk management assets | (16) | (3) | — | — | — | — | (19) | ||||||||||||||||
Lease liabilities(3) |
4 | 4 | 4 | 4 | 4 | 123 | 143 | ||||||||||||||||
Interest on long-term debt and lease liabilities(4) |
186 | 167 | 158 | 151 | 143 | 711 | 1,516 | ||||||||||||||||
Interest on exchangeable securities(2)(4) |
53 | 53 | 53 | 53 | 53 | 13 | 278 | ||||||||||||||||
| Dividends payable | 49 | — | — | — | — | — | 49 | ||||||||||||||||
| Total | 1,771 | 486 | 373 | 373 | 374 | 3,907 | 7,284 | ||||||||||||||||
F59 |
TransAlta Corporation | 2023 Integrated Report | ||||||
| Maturity | ||||||||||||||||||||
| 2024 | 2025 | 2026 | 2027 | 2028 | 2029 | |||||||||||||||
| Cash flow hedges | ||||||||||||||||||||
| Commodity derivative instruments | ||||||||||||||||||||
Electricity |
||||||||||||||||||||
Notional amount (thousands of MWh) |
3,338 | 2,628 | — | — | — | — | ||||||||||||||
Average price ($ per MWh) |
78.18 | 80.13 | — | — | — | — | ||||||||||||||
| As at Dec. 31, 2023 | Notional amount | Carrying amount | Line item in the statement of financial position | Change in fair value used for measuring ineffectiveness | ||||||||||
| Commodity price risk | ||||||||||||||
| Cash flow hedges | ||||||||||||||
Physical power sales(1) |
5,966 | (205) | Risk management liabilities | (114) | ||||||||||
| Foreign currency risk | ||||||||||||||
| Net investment hedges | ||||||||||||||
| Foreign-denominated debt | USD370 | CAD489 | Credit facilities, long-term debt and lease liabilities | — | ||||||||||
| TransAlta Corporation | 2023 Integrated Report | F60 |
||||||
| As at Dec. 31, 2022 | Notional amount | Carrying amount | Line item in the statement of financial position | Change in fair value used for measuring ineffectiveness | ||||||||||
| Commodity price risk | ||||||||||||||
| Cash flow hedges | ||||||||||||||
Physical power sales(1) |
9,295 | (347) | Risk management liabilities | (594) | ||||||||||
| Foreign currency risk | ||||||||||||||
| Net investment hedges | ||||||||||||||
| Foreign-denominated debt | USD370 | CAD502 | Credit facilities, long-term debt and lease liabilities | — | ||||||||||
| As at Dec. 31 | 2023 | 2022 | |||||||||||||||
| Change in fair value used for measuring ineffectiveness | Cash flow hedge reserve(1) |
Change in fair value used for measuring ineffectiveness | Cash flow hedge reserve(1) |
||||||||||||||
| Commodity price risk | |||||||||||||||||
| Cash flow hedges | |||||||||||||||||
Power forecast sales – Centralia |
(114) | (129) | (594) | (279) | |||||||||||||
| Change in fair value used for measuring ineffectiveness | Foreign currency translation reserve(1) |
Change in fair value used for measuring ineffectiveness | Foreign currency translation reserve(1) |
||||||||||||||
| Foreign currency risk | |||||||||||||||||
| Net investment hedges | |||||||||||||||||
Net investment in foreign subsidiaries |
— | (36) | — | (39) | |||||||||||||
| Year ended Dec. 31, 2023 | |||||||||||||||||
| Effective portion | Ineffective portion | ||||||||||||||||
| Derivatives in cash flow hedging relationships |
Pre-tax gain recognized in OCI |
Location of gain reclassified from OCI | Pre-tax (gain) loss reclassified from OCI |
Location of (gain) loss
reclassified from OCI
|
Pre-tax (gain) loss recognized in earnings |
||||||||||||
| Commodity contracts | 51 | Revenue | 83 | Revenue | — | ||||||||||||
| Forward starting interest rate swaps | — | Interest expense | (8) | Interest expense | — | ||||||||||||
| OCI impact | 51 | OCI impact | 75 | Net earnings impact | — | ||||||||||||
F61 |
TransAlta Corporation | 2023 Integrated Report | ||||||
| Year ended Dec. 31, 2022 | ||||||||||||||||||||||||||||||||
| Effective portion | Ineffective portion | |||||||||||||||||||||||||||||||
| Derivatives in cash flow hedging relationships |
Pre-tax gain (loss) recognized in OCI |
Location of (gain) loss reclassified from OCI |
Pre-tax (gain) loss reclassified from OCI |
Location of (gain) loss reclassified from OCI | Pre-tax (gain) loss recognized in earnings |
|||||||||||||||||||||||||||
| Commodity contracts | (747) | Revenue | 124 | Revenue | — | |||||||||||||||||||||||||||
| Forward starting interest rate swaps | 53 | Interest expense | 2 | Interest expense | — | |||||||||||||||||||||||||||
| OCI impact | (694) | OCI impact | 126 | Net earnings impact | — | |||||||||||||||||||||||||||
| Year ended Dec. 31, 2021 | |||||||||||||||||||||||||||||
| Effective portion | Ineffective portion | ||||||||||||||||||||||||||||
| Derivatives in cash flow hedging relationships |
Pre-tax gain (loss) recognized in OCI |
Location of (gain) loss reclassified from OCI |
Pre-tax (gain) loss reclassified from OCI |
Location of (gain) loss reclassified from OCI |
Pre-tax (gain) loss recognized in earnings |
||||||||||||||||||||||||
| Commodity contracts | (268) | Revenue | (13) | Revenue | — | ||||||||||||||||||||||||
| Foreign exchange forwards on project hedges | — | Property, plant and equipment | 1 |
Foreign exchange
(gain) loss
|
— | ||||||||||||||||||||||||
| Forward starting interest rate swaps | 13 | Interest expense | 4 | Interest expense | — | ||||||||||||||||||||||||
| OCI impact | (255) | OCI impact | (8) | Net earnings impact | — | ||||||||||||||||||||||||
| TransAlta Corporation | 2023 Integrated Report | F62 |
||||||
As at Dec. 31 |
2023 | 2022 | ||||||
| Parts, materials and supplies | 72 | 83 | ||||||
| Coal | 38 | 43 | ||||||
| Emission credits | 45 | 27 | ||||||
| Natural gas | 2 | 4 | ||||||
| Total | 157 | 157 | ||||||
F63 |
TransAlta Corporation | 2023 Integrated Report | ||||||
| As at Dec. 31 | 2023 | 2022 | ||||||||||||
| Minimum lease receipts |
Present value
of minimum lease
receipts
|
Minimum lease receipts |
Present value
of minimum lease
receipts
|
|||||||||||
| Within one year | 28 | 28 | 62 | 55 | ||||||||||
| Second to fifth years inclusive | 112 | 98 | 81 | 75 | ||||||||||
| More than five years | 117 | 64 | 60 | 51 | ||||||||||
| 257 | 190 | 203 | 181 | |||||||||||
| Less: unearned finance lease income | 67 | — | 22 | — | ||||||||||
| Total finance lease receivables | 190 | 190 | 181 | 181 | ||||||||||
| Included in the Consolidated Statements of Financial Position as: | ||||||||||||||
Current portion of finance lease receivables (Note 13) |
19 | 52 | ||||||||||||
Long-term portion of finance lease receivables |
171 | 129 | ||||||||||||
| Total finance lease receivables | 190 | 181 | ||||||||||||
| TransAlta Corporation | 2023 Integrated Report | F64 |
||||||
| Assets under construction |
Land | Hydro |
Wind and
Solar
|
Gas generation | Energy Transition |
Capital spares
and other(1)
|
Total | |||||||||||||||||||
| Cost | ||||||||||||||||||||||||||
As at Dec. 31, 2021 |
184 | 96 | 867 | 3,276 | 4,087 | 4,513 | 366 | 13,389 | ||||||||||||||||||
Additions(2) |
891 | — | — | — | — | — | 6 | 897 | ||||||||||||||||||
| Additions from development projects | 17 | — | — | — | — | — | 12 | 29 | ||||||||||||||||||
| Disposals | — | (3) | — | — | (1) | (216) | — | (220) | ||||||||||||||||||
Impairment (charges) reversals (Note 7) |
2 | — | (21) | (43) | — | — | — | (62) | ||||||||||||||||||
Changes to decommissioning and restoration costs (Note 23) |
— | — | (15) | (59) | (12) | 10 | 2 | (74) | ||||||||||||||||||
| Retirement of assets | — | — | (9) | (9) | (12) | (7) | (2) | (39) | ||||||||||||||||||
| Change in foreign exchange rates | 13 | — | — | 45 | (4) | 97 | 2 | 153 | ||||||||||||||||||
Transfers of assets(3) |
(144) | — | 18 | 23 | 472 | (423) | (7) | (61) | ||||||||||||||||||
As at Dec. 31, 2022 |
963 | 93 | 840 | 3,233 | 4,530 | 3,974 | 379 | 14,012 | ||||||||||||||||||
Additions(2) |
869 | — | — | — | — | — | 6 | 875 | ||||||||||||||||||
| Disposals | — | (3) | — | — | — | (30) | — | (33) | ||||||||||||||||||
Impairment reversals (Note 7) |
— | — | 10 | 4 | — | — | — | 14 | ||||||||||||||||||
Changes to decommissioning and restoration costs (Note 23) |
— | — | 3 | 14 | (22) | 3 | (1) | (3) | ||||||||||||||||||
| Retirement of assets | — | — | (7) | (18) | (124) | (7) | (108) | (264) | ||||||||||||||||||
| Change in foreign exchange rates | (26) | — | — | (18) | (7) | (42) | (1) | (94) | ||||||||||||||||||
Transfers of assets(3) |
(572) | — | 38 | 439 | 50 | 16 | 31 | 2 | ||||||||||||||||||
Transfers to finance lease receivable (Note 17) |
— | — | — | (61) | (4) | — | — | (65) | ||||||||||||||||||
As at Dec. 31, 2023 |
1,234 | 90 | 884 | 3,593 | 4,423 | 3,914 | 306 | 14,444 | ||||||||||||||||||
| Accumulated depreciation | ||||||||||||||||||||||||||
As at Dec. 31, 2021 |
— | — | 468 | 1,093 | 2,178 | 4,150 | 180 | 8,069 | ||||||||||||||||||
| Depreciation | — | — | 21 | 130 | 308 | 63 | 16 | 538 | ||||||||||||||||||
| Retirement of assets | — | — | (8) | (6) | (10) | (7) | (2) | (33) | ||||||||||||||||||
| Disposals | — | — | — | — | (1) | (211) | — | (212) | ||||||||||||||||||
| Change in foreign exchange rates | — | — | — | 11 | 2 | 89 | — | 102 | ||||||||||||||||||
Transfers of assets(3) |
— | — | (3) | — | 335 | (340) | — | (8) | ||||||||||||||||||
As at Dec. 31, 2022 |
— | — | 478 | 1,228 | 2,812 | 3,744 | 194 | 8,456 | ||||||||||||||||||
| Depreciation | — | — | 25 | 129 | 342 | 73 | 16 | 585 | ||||||||||||||||||
| Retirement of assets | — | — | (4) | (15) | (101) | (7) | (108) | (235) | ||||||||||||||||||
| Disposals | — | — | — | — | — | (30) | — | (30) | ||||||||||||||||||
| Change in foreign exchange rates | — | — | — | (5) | (3) | (39) | — | (47) | ||||||||||||||||||
Transfers in (out) of PP&E(3) |
— | — | — | — | (1) | 2 | — | 1 | ||||||||||||||||||
As at Dec. 31, 2023 |
— | — | 499 | 1,337 | 3,049 | 3,743 | 102 | 8,730 | ||||||||||||||||||
| Carrying amount | ||||||||||||||||||||||||||
As at Dec. 31, 2021 |
184 | 96 | 399 | 2,183 | 1,909 | 363 | 186 | 5,320 | ||||||||||||||||||
As at Dec. 31, 2022 |
963 | 93 | 362 | 2,005 | 1,718 | 230 | 185 | 5,556 | ||||||||||||||||||
As at Dec. 31, 2023 |
1,234 | 90 | 385 | 2,256 | 1,374 | 171 | 204 | 5,714 | ||||||||||||||||||
F65 |
TransAlta Corporation | 2023 Integrated Report | ||||||
| Land | Buildings | Vehicles | Equipment | Total | |||||||||||||
As at Dec. 31, 2021 |
68 | 20 | 1 | 6 | 95 | ||||||||||||
| Additions | 36 | — | 1 | 3 | 40 | ||||||||||||
| Depreciation | (4) | (5) | — | (2) | (11) | ||||||||||||
| Change in foreign exchange rates | 2 | — | — | — | 2 | ||||||||||||
| As at Dec. 31, 2022 | 102 | 15 | 2 | 7 | 126 | ||||||||||||
| Additions | 2 | 2 | 1 | — | 5 | ||||||||||||
| Depreciation | (5) | (5) | — | (2) | (12) | ||||||||||||
| Change in foreign exchange rates | (2) | — | — | — | (2) | ||||||||||||
| As at Dec. 31, 2023 | 97 | 12 | 3 | 5 | 117 | ||||||||||||
| TransAlta Corporation | 2023 Integrated Report | F66 |
||||||
|
Power sale
contracts
|
Software and other |
Intangibles under
development
|
Coal rights | Total | |||||||||||||
| Cost | |||||||||||||||||
As at Dec. 31, 2021 |
269 | 422 | 4 | 132 | 827 | ||||||||||||
Additions |
— | — | 31 | — | 31 | ||||||||||||
| Change in foreign exchange rates | 3 | 3 | 1 | — | 7 | ||||||||||||
| Transfers | — | 12 | (9) | — | 3 | ||||||||||||
As at Dec. 31, 2022 |
272 | 437 | 27 | 132 | 868 | ||||||||||||
| Additions | — | — | 13 | — | 13 | ||||||||||||
| Asset impairment charges | — | (1) | — | — | (1) | ||||||||||||
| Change in foreign exchange rates | (2) | (2) | (1) | — | (5) | ||||||||||||
| Transfers | — | 12 | (12) | — | — | ||||||||||||
As at Dec. 31, 2023 |
270 | 446 | 27 | 132 | 875 | ||||||||||||
| Accumulated amortization | |||||||||||||||||
| As at Dec. 31, 2021 | 140 | 299 | — | 132 | 571 | ||||||||||||
| Amortization | 17 | 26 | — | — | 43 | ||||||||||||
| Change in foreign exchange rates | 1 | 1 | — | — | 2 | ||||||||||||
| As at Dec. 31, 2022 | 158 | 326 | — | 132 | 616 | ||||||||||||
| Amortization | 17 | 21 | — | — | 38 | ||||||||||||
| Change in foreign exchange rates | (1) | (1) | — | — | (2) | ||||||||||||
| As at Dec. 31, 2023 | 174 | 346 | — | 132 | 652 | ||||||||||||
| Carrying amount | |||||||||||||||||
As at Dec. 31, 2021 |
129 | 123 | 4 | — | 256 | ||||||||||||
| As at Dec. 31, 2022 | 114 | 111 | 27 | — | 252 | ||||||||||||
As at Dec. 31, 2023 |
96 | 100 | 27 | — | 223 | ||||||||||||
F67 |
TransAlta Corporation | 2023 Integrated Report | ||||||
| As at Dec. 31 | 2023 | 2022 | ||||||
| Hydro | 258 | 258 | ||||||
| Wind and Solar | 176 | 176 | ||||||
| Energy Marketing | 30 | 30 | ||||||
| Total goodwill | 464 | 464 | ||||||
| TransAlta Corporation | 2023 Integrated Report | F68 |
||||||
| As at Dec. 31 | 2023 | 2022 | ||||||
| South Hedland prepaid transmission access and distribution costs | 60 | 61 | ||||||
| Long-term prepaids and other assets | 41 | 40 | ||||||
| Project development costs | 35 | 10 | ||||||
Loans receivable |
26 | 37 | ||||||
| Transmission infrastructure | 18 | 16 | ||||||
| Total Other assets | 180 | 164 | ||||||
| Included in the Consolidated Statements of Financial Position as: | ||||||||
Total current other assets (Note 13) |
1 | 4 | ||||||
| Total long-term other assets | 179 | 160 | ||||||
| Total Other assets | 180 | 164 | ||||||
F69 |
TransAlta Corporation | 2023 Integrated Report | ||||||
| Decommissioning and restoration |
Other provisions | Total | |||||||||
| Balance, Dec. 31, 2021 | 793 | 34 | 827 | ||||||||
| Liabilities incurred | 1 | 23 | 24 | ||||||||
| Liabilities settled | (35) | (12) | (47) | ||||||||
| Accretion | 49 | — | 49 | ||||||||
| Disposals | (5) | — | (5) | ||||||||
| Revisions in estimated cash flows | 95 | 5 | 100 | ||||||||
| Revisions in discount rates | (225) | — | (225) | ||||||||
| Reversals | — | (9) | (9) | ||||||||
| Change in foreign exchange rates | 15 | — | 15 | ||||||||
| Balance, Dec. 31, 2022 | 688 | 41 | 729 | ||||||||
| Liabilities incurred | 1 | 4 | 5 | ||||||||
| Liabilities settled | (37) | (13) | (50) | ||||||||
Accretion (Note 10) |
47 | 1 | 48 | ||||||||
| Revisions in estimated cash flows | (89) | — | (89) | ||||||||
| Revisions in discount rates | 52 | — | 52 | ||||||||
| Change in foreign exchange rates | (6) | — | (6) | ||||||||
| Balance, Dec. 31, 2023 | 656 | 33 | 689 | ||||||||
| Included in the Consolidated Statements of Financial Position as: | ||||||||
| As at | Dec. 31, 2023 | Dec. 31, 2022 | ||||||
| Current portion | 35 | 70 | ||||||
| Non-current portion | 654 | 659 | ||||||
| Total Decommissioning and other provisions | 689 | 729 | ||||||
| TransAlta Corporation | 2023 Integrated Report | F70 |
||||||
F71 |
TransAlta Corporation | 2023 Integrated Report | ||||||
| As at Dec. 31 | 2023 | 2022 | |||||||||||||||||||||||||||
| Segment | Maturity | Currency | Carrying value |
Face value |
Interest(1) |
Carrying value |
Face value |
Interest | |||||||||||||||||||||
| Credit facilities | |||||||||||||||||||||||||||||
Committed syndicated bank facility(2) |
Corporate | 2027 | CAD | — | — | — | 32 | 33 | 4.7 | % | |||||||||||||||||||
| Term Facility | Corporate | 2024 | CAD | 397 | 400 | 7.4 | % | 396 | 400 | 6.5 | % | ||||||||||||||||||
| Debentures | |||||||||||||||||||||||||||||
7.3% Medium term notes |
Corporate | 2029 | CAD | 110 | 110 | 7.3 | % | 110 | 110 | 7.3 | % | ||||||||||||||||||
6.9% Medium term notes |
Corporate | 2030 | CAD | 141 | 141 | 6.9 | % | 141 | 141 | 6.9 | % | ||||||||||||||||||
Senior notes(3) |
|||||||||||||||||||||||||||||
7.8% Senior notes(4) |
Corporate | 2029 | USD | 520 | 528 | 7.8 | % | 533 | 542 | 7.8 | % | ||||||||||||||||||
6.5% Senior notes |
Corporate | 2040 | USD | 391 | 396 | 6.5 | % | 401 | 407 | 6.5 | % | ||||||||||||||||||
| Non-recourse | |||||||||||||||||||||||||||||
Melancthon Wolfe Wind LP bond |
Wind & Solar | 2028 | CAD | 168 | 169 | 3.8 | % | 202 | 203 | 3.8 | % | ||||||||||||||||||
New Richmond Wind LP bond |
Wind & Solar | 2032 | CAD | 103 | 104 | 4.0 | % | 112 | 113 | 4.0 | % | ||||||||||||||||||
| Kent Hills Wind LP bond | Wind & Solar | 2033 | CAD | 193 | 196 | 4.5 | % | 206 | 209 | 4.5 | % | ||||||||||||||||||
| Windrise Wind LP bond | Wind & Solar | 2041 | CAD | 164 | 167 | 3.4 | % | 170 | 173 | 3.4 | % | ||||||||||||||||||
| Pingston bond | Hydro | 2043 | CAD | 39 | 39 | 6.2 | % | 45 | 45 | 3.0 | % | ||||||||||||||||||
TAPC Holdings LP bond (Poplar Creek) |
Gas | 2030 | CAD | 85 | 86 | 9.4 | % | 94 | 95 | 8.9 | % | ||||||||||||||||||
TEC Hedland PTY Ltd bond(5) |
Gas | 2042 | AUD | 691 | 699 | 4.1 | % | 711 | 720 | 4.1 | % | ||||||||||||||||||
| TransAlta OCP LP bond | Gas | 2030 | CAD | 217 | 218 | 4.5 | % | 241 | 242 | 4.5 | % | ||||||||||||||||||
| Tax equity financing | |||||||||||||||||||||||||||||
Big Level & Antrim(6) |
Wind & Solar | 2029 | USD | 91 | 97 | 6.6 | % | 102 | 108 | 6.6 | % | ||||||||||||||||||
Lakeswind(7) |
Wind & Solar | 2029 | USD | 10 | 10 | 10.5 | % | 15 | 15 | 10.5 | % | ||||||||||||||||||
North Carolina Solar(8) |
Wind & Solar | 2028 | USD | 3 | 3 | 7.3 | % | 6 | 6 | 7.3 | % | ||||||||||||||||||
Other(9) |
Corporate | CAD | — | — | — | 1 | 1 | 5.9 | % | ||||||||||||||||||||
| Total long-term debt | 3,323 | 3,363 | 3,518 | 3,563 | |||||||||||||||||||||||||
Lease liabilities(10) |
143 | 135 | |||||||||||||||||||||||||||
| Total long-term debt and lease liabilities | 3,466 | 3,653 | |||||||||||||||||||||||||||
| Less: current portion of long-term debt | (526) | (170) | |||||||||||||||||||||||||||
| Less: current portion of lease liabilities | (6) | (8) | |||||||||||||||||||||||||||
| Total current long-term debt and lease liabilities | (532) | (178) | |||||||||||||||||||||||||||
Total non-current credit facilities, long-term debt and lease liabilities |
2,934 | 3,475 | |||||||||||||||||||||||||||
| TransAlta Corporation | 2023 Integrated Report | F72 |
||||||
| As at Dec. 31, 2023 | Utilized | ||||||||||||||||
| Credit Facilities | Facility size |
Outstanding letters of credit(1) |
Cash drawings | Available capacity |
Maturity date |
||||||||||||
| Committed | |||||||||||||||||
| TransAlta syndicated credit facility | 1,950 | 417 | — | 1,533 | Q2 2027 | ||||||||||||
| TransAlta bilateral credit facilities | 240 | 178 | — | 62 | Q2 2025 | ||||||||||||
| TransAlta Term Facility | 400 | — | 400 | — | Q3 2024 | ||||||||||||
| Total Committed | 2,590 | 595 | 400 | 1,595 | |||||||||||||
| Non-Committed | |||||||||||||||||
| TransAlta demand facilities | 400 | 187 | — | 213 | N/A | ||||||||||||
| Total Non-Committed | 400 | 187 | — | 213 | |||||||||||||
F73 |
TransAlta Corporation | 2023 Integrated Report | ||||||
| TransAlta Corporation | 2023 Integrated Report | F74 |
||||||
| 2024 | 2025 | 2026 | 2027 | 2028 | 2029 and thereafter | Total | |||||||||||||||||
Principal repayments(1) |
526 | 142 | 143 | 153 | 162 | 2,237 | 3,363 | ||||||||||||||||
Lease liabilities(2) |
4 | 4 | 4 | 4 | 4 | 123 | 143 | ||||||||||||||||
F75 |
TransAlta Corporation | 2023 Integrated Report | ||||||
| As at | Dec. 31, 2023 | Dec. 31, 2022 | ||||||||||||||||||
| Carrying value | Face value | Interest | Carrying value | Face value | Interest | |||||||||||||||
Exchangeable debentures – due May 1, 2039(1) |
344 | 350 | 7 | % | 339 | 350 | 7 | % | ||||||||||||
Exchangeable preferred shares(2) |
400 | 400 | 7 | % | 400 | 400 | 7 | % | ||||||||||||
| Total exchangeable securities | 744 | 750 | 739 | 750 | ||||||||||||||||
| As at | Dec. 31, 2023 | Dec. 31, 2022 | |||||||||||||||
| Description | Base fair value | Sensitivity | Base fair value | Sensitivity | |||||||||||||
| Option to exchange – embedded derivative | — |
+nil
-25
|
— |
+nil
-25
|
|||||||||||||
| TransAlta Corporation | 2023 Integrated Report | F76 |
||||||
| As at Dec. 31 | 2023 | 2022 | ||||||
Defined benefit obligation (Note 31) |
155 | 150 | ||||||
| Retail power contract liability | 83 | 126 | ||||||
| Other | 13 | 18 | ||||||
| Total | 251 | 294 | ||||||
F77 |
TransAlta Corporation | 2023 Integrated Report | ||||||
| As at Dec. 31 | 2023 | 2022 | |||||||||||||||
| Common shares (millions) |
Amount | Common shares (millions) |
Amount | ||||||||||||||
| Issued and outstanding, beginning of period | 268.1 | 2,863 | 271.0 | 2,901 | |||||||||||||
| Purchased and cancelled under the NCIB | (7.5) | (80) | (4.3) | (46) | |||||||||||||
Share-based payment plans |
0.8 | 6 | 0.9 | 5 | |||||||||||||
| Stock options exercised | 0.7 | 5 | 0.5 | 3 | |||||||||||||
Issued for acquisition of TransAlta Renewables(1) (Note 4) |
46.5 | 510 | — | — | |||||||||||||
| Issued and outstanding, end of year, prior to ASPP | 308.6 | 3,304 | 268.1 | 2,863 | |||||||||||||
| Provision for repurchase of common shares under ASPP | (1.7) | (19) | — | — | |||||||||||||
| Issued and outstanding, end of year | 306.9 | 3,285 | 268.1 | 2,863 | |||||||||||||
| For the year ended Dec. 31 | 2023 | 2022 | |||||||||
Total shares purchased(1) |
7,537,500 | 4,342,300 | |||||||||
| Average purchase price per share | 11.49 | 12.48 | |||||||||
| Total cost (millions) | 87 | 54 | |||||||||
Book value of shares cancelled |
80 | 46 | |||||||||
| Amount recorded in deficit | (7) | (8) | |||||||||
| TransAlta Corporation | 2023 Integrated Report | F78 |
||||||
| Year ended Dec. 31 | 2023 | 2022 | 2021 | ||||||||
| Net earnings (loss) attributable to common shareholders | 644 | 4 | (576) | ||||||||
Basic and diluted weighted average number of common shares outstanding (millions) |
276 | 271 | 271 | ||||||||
Net earnings (loss) per share attributable to common shareholders, basic and diluted |
2.33 | 0.01 | (2.13) | ||||||||
F79 |
TransAlta Corporation | 2023 Integrated Report | ||||||
| As at Dec. 31 | 2023 | 2022 | |||||||||||||||
Series(1) |
Number of shares (millions) |
Amount | Number of shares (millions) |
Amount | |||||||||||||
| Series A | 9.6 | 235 | 9.6 | 235 | |||||||||||||
| Series B | 2.4 | 58 | 2.4 | 58 | |||||||||||||
| Series C | 10.0 | 243 | 10.0 | 243 | |||||||||||||
| Series D | 1.0 | 26 | 1.0 | 26 | |||||||||||||
| Series E | 9.0 | 219 | 9.0 | 219 | |||||||||||||
| Series G | 6.6 | 161 | 6.6 | 161 | |||||||||||||
| Issued and outstanding, end of period | 38.6 | 942 | 38.6 | 942 | |||||||||||||
| TransAlta Corporation | 2023 Integrated Report | F80 |
||||||
Series(1) |
Rate during
term
|
Annual dividend
rate per share
($)(2)
|
Next conversion
date
|
Rate spread over benchmark (per cent) |
Convertible
to Series
|
||||||||||||
| A | Fixed | 0.71924 | March 31, 2026 | 2.03 | B | ||||||||||||
| B | Floating | 1.718910 | March 31, 2026 | 2.03 | A | ||||||||||||
| C | Fixed | 1.46352 | June 30, 2027 | 3.10 | D | ||||||||||||
| D | Floating | 1.98695 | June 30, 2027 | 3.10 | C | ||||||||||||
| E | Fixed | 1.72352 | Sept. 30, 2027 | 3.65 | F | ||||||||||||
| G | Fixed | 1.24700 | Sept. 30, 2024 | 3.80 | H | ||||||||||||
| Total dividends declared | ||||||||
| Series | 2023(1) |
2022(1) |
||||||
| A | 7 | 7 | ||||||
B(2) |
4 | 3 | ||||||
| C | 15 | 14 | ||||||
D(3) |
2 | 1 | ||||||
| E | 15 | 13 | ||||||
| G | 8 | 8 | ||||||
| Total for the year | 51 | 46 | ||||||
F81 |
TransAlta Corporation | 2023 Integrated Report | ||||||
| 2023 | 2022 | ||||||||||
| Currency translation adjustment | |||||||||||
| Opening balance, Jan. 1 | (39) | (35) | |||||||||
(Losses) gains on translating net assets of foreign operations, net of reclassifications to net earnings, net of tax |
(6) | 21 | |||||||||
Gains (losses) on financial instruments designated as hedges of foreign operations, net of reclassifications to net earnings, net of tax(1) |
9 | (25) | |||||||||
| Balance, Dec. 31 | (36) | (39) | |||||||||
| Cash flow hedges | |||||||||||
| Opening balance, Jan. 1 | (228) | 228 | |||||||||
Gains (losses) on derivatives designated as cash flow hedges, net of reclassifications to net earnings and to non-financial assets, net of tax(2) |
99 | (456) | |||||||||
| Balance, Dec. 31 | (129) | (228) | |||||||||
| Employee future benefits | |||||||||||
| Opening balance, Jan. 1 | 8 | (29) | |||||||||
Net actuarial gains on defined benefit plans, net of tax(3) |
(5) | 37 | |||||||||
| Balance, Dec. 31 | 3 | 8 | |||||||||
| Other | |||||||||||
| Opening balance, Jan. 1 | 37 | (18) | |||||||||
| Change in ownership of TransAlta Renewables | (64) | — | |||||||||
| Intercompany and third-party investments at FVTOCI | 25 | 55 | |||||||||
| Balance, Dec. 31 | (2) | 37 | |||||||||
| Accumulated other comprehensive loss | (164) | (222) | |||||||||
| TransAlta Corporation | 2023 Integrated Report | F82 |
||||||
| Options outstanding | |||||||||||
|
Range of exercise prices(1)
($ per share)
|
Number of options (millions) |
Weighted average remaining contractual life (years) | Weighted average exercise price ($ per share) |
||||||||
5.00-12.00 |
2.5 | 3.60 | 9.17 | ||||||||
F83 |
TransAlta Corporation | 2023 Integrated Report | ||||||
| Year ended Dec. 31, 2023 | Registered | Supplemental | Other | Total | ||||||||||
| Current service cost | 1 | 1 | — | 2 | ||||||||||
| Administration expenses | 1 | — | — | 1 | ||||||||||
| Interest cost on defined benefit obligation | 16 | 4 | 1 | 21 | ||||||||||
| Interest on plan assets | (13) | (1) | — | (14) | ||||||||||
| Defined benefit expense | 5 | 4 | 1 | 10 | ||||||||||
| Defined contribution expense | 11 | — | — | 11 | ||||||||||
| Net expense | 16 | 4 | 1 | 21 | ||||||||||
| Year ended Dec. 31, 2022 | Registered | Supplemental | Other | Total | ||||||||||
| Current service cost | 1 | 1 | — | 2 | ||||||||||
| Administration expenses | 1 | — | — | 1 | ||||||||||
| Interest cost on defined benefit obligation | 13 | 3 | — | 16 | ||||||||||
| Interest on plan assets | (9) | — | — | (9) | ||||||||||
| Defined benefit expense | 6 | 4 | — | 10 | ||||||||||
| Defined contribution expense | 11 | — | — | 11 | ||||||||||
| Net expense | 17 | 4 | — | 21 | ||||||||||
| Year ended Dec. 31, 2021 | Registered | Supplemental | Other | Total | ||||||||||
| Current service cost | 3 | 2 | 1 | 6 | ||||||||||
| Administration expenses | 1 | — | — | 1 | ||||||||||
| Interest cost on defined benefit obligation | 12 | 2 | — | 14 | ||||||||||
| Interest on plan assets | (8) | — | — | (8) | ||||||||||
| Curtailment and amendment gain | (7) | — | — | (7) | ||||||||||
| Defined benefit expense | 1 | 4 | 1 | 6 | ||||||||||
| Defined contribution expense | 8 | — | — | 8 | ||||||||||
| Net expense | 9 | 4 | 1 | 14 | ||||||||||
| TransAlta Corporation | 2023 Integrated Report | F84 |
||||||
| Year ended Dec. 31, 2023 | Registered | Supplemental | Other | Total | ||||||||||
| Fair value of plan assets | 269 | 15 | — | 284 | ||||||||||
| Present value of defined benefit obligation | (340) | (89) | (17) | (446) | ||||||||||
| Funded status – plan deficit | (71) | (74) | (17) | (162) | ||||||||||
| Amount recognized in the Consolidated Financial Statements: | ||||||||||||||
| Accrued current liabilities | (1) | (5) | (1) | (7) | ||||||||||
| Other long-term liabilities | (70) | (69) | (16) | (155) | ||||||||||
| Total amount recognized | (71) | (74) | (17) | (162) | ||||||||||
| Year ended Dec. 31, 2022 | Registered | Supplemental | Other | Total | ||||||||||
| Fair value of plan assets | 274 | 15 | — | 289 | ||||||||||
| Present value of defined benefit obligation | (345) | (85) | (17) | (447) | ||||||||||
| Funded status – plan deficit | (71) | (70) | (17) | (158) | ||||||||||
| Amount recognized in the Consolidated Financial Statements: | ||||||||||||||
| Accrued current liabilities | (1) | (6) | (1) | (8) | ||||||||||
| Other long-term liabilities | (70) | (64) | (16) | (150) | ||||||||||
| Total amount recognized | (71) | (70) | (17) | (158) | ||||||||||
F85 |
TransAlta Corporation | 2023 Integrated Report | ||||||
| Registered | Supplemental | Other | Total | |||||||||||
| As at Dec. 31, 2021 | 339 | 14 | — | 353 | ||||||||||
| Interest on plan assets | 9 | — | — | 9 | ||||||||||
| Net loss on plan assets | (55) | — | — | (55) | ||||||||||
Contributions(1) |
38 | 6 | — | 44 | ||||||||||
| Benefits paid | (57) | (5) | — | (62) | ||||||||||
| Administration expenses | (1) | — | — | (1) | ||||||||||
| Change in foreign exchange rates | 1 | — | — | 1 | ||||||||||
| As at Dec. 31, 2022 | 274 | 15 | — | 289 | ||||||||||
| Interest on plan assets | 13 | 1 | — | 14 | ||||||||||
| Net return on plan assets | 15 | (1) | — | 14 | ||||||||||
Contributions(2) |
5 | 6 | 2 | 13 | ||||||||||
| Benefits paid | (36) | (6) | (2) | (44) | ||||||||||
| Administration expenses | (1) | — | — | (1) | ||||||||||
| Change in foreign exchange rates | (1) | — | — | (1) | ||||||||||
| As at Dec. 31, 2023 | 269 | 15 | — | 284 | ||||||||||
| TransAlta Corporation | 2023 Integrated Report | F86 |
||||||
| As at Dec. 31, 2023 | Level I | Level II | Level III | Total | ||||||||||
| Equity securities | ||||||||||||||
| Canadian | — | 12 | — | 12 | ||||||||||
| US | — | 6 | — | 6 | ||||||||||
| International | — | 86 | — | 86 | ||||||||||
| Private | — | — | 1 | 1 | ||||||||||
| Bonds | ||||||||||||||
A - AAA |
— | 30 | 62 | 92 | ||||||||||
| BBB | 1 | 5 | 10 | 16 | ||||||||||
| Below BBB | — | — | 4 | 4 | ||||||||||
Loans(1) |
— | 2 | — | 2 | ||||||||||
Alternative funds(2) |
— | — | 44 | 44 | ||||||||||
| Money market and cash and cash equivalents | 2 | 19 | — | 21 | ||||||||||
| Total | 3 | 160 | 121 | 284 | ||||||||||
Dec. 31, 2022(1) |
Level I | Level II | Level III | Total | ||||||||||
| Equity securities | ||||||||||||||
| Canadian | — | 18 | — | 18 | ||||||||||
| US | — | 17 | — | 17 | ||||||||||
| International | — | 79 | — | 79 | ||||||||||
| Private | — | — | 1 | 1 | ||||||||||
| Bonds | ||||||||||||||
A - AAA |
— | 27 | 61 | 88 | ||||||||||
| BBB | 1 | 6 | 12 | 19 | ||||||||||
| Below BBB | — | — | 6 | 6 | ||||||||||
Loans(2) |
— | 2 | — | 2 | ||||||||||
Alternative funds(3) |
— | — | 39 | 39 | ||||||||||
| Money market and cash and cash equivalents | — | 20 | — | 20 | ||||||||||
| Total | 1 | 169 | 119 | 289 | ||||||||||
F87 |
TransAlta Corporation | 2023 Integrated Report | ||||||
| Registered | Supplemental | Other | Total | |||||||||||
| Present value of defined benefit obligation as at Dec. 31, 2021 | 469 | 101 | 23 | 593 | ||||||||||
| Current service cost | 1 | 1 | — | 2 | ||||||||||
| Interest cost | 13 | 3 | — | 16 | ||||||||||
| Benefits paid | (57) | (5) | 1 | (61) | ||||||||||
| Actuarial gain arising from financial assumptions | (83) | (22) | (5) | (110) | ||||||||||
| Actuarial gain arising from experience adjustments | 1 | 7 | (2) | 6 | ||||||||||
| Change in foreign exchange rates | 1 | — | — | 1 | ||||||||||
| Present value of defined benefit obligation as at Dec. 31, 2022 | 345 | 85 | 17 | 447 | ||||||||||
| Current service cost | 1 | 1 | — | 2 | ||||||||||
| Interest cost | 16 | 4 | 1 | 21 | ||||||||||
| Benefits paid | (36) | (6) | (2) | (44) | ||||||||||
| Actuarial loss arising from demographic assumptions | 1 | — | — | 1 | ||||||||||
| Actuarial loss arising from financial assumptions | 12 | 4 | 1 | 17 | ||||||||||
| Actuarial loss arising from experience adjustments | 2 | 1 | — | 3 | ||||||||||
| Change in foreign exchange rates | (1) | — | — | (1) | ||||||||||
| Present value of defined benefit obligation as at Dec. 31, 2023 | 340 | 89 | 17 | 446 | ||||||||||
| Registered | Supplemental | Other | Total | |||||||||||
| Expected employer contributions | 3 | 5 | 1 | 9 | ||||||||||
| TransAlta Corporation | 2023 Integrated Report | F88 |
||||||
| 2023 | 2022 | ||||||||||||||||||||||
| As at Dec. 31 (per cent) | Registered | Supplemental | Other | Registered | Supplemental | Other | |||||||||||||||||
| Accrued benefit obligation | |||||||||||||||||||||||
| Discount rate | 4.6 | 4.6 | 4.7 | 4.7 | 5.0 | 5.0 | |||||||||||||||||
| Rate of compensation increase | 2.9 | 3.0 | — | 2.6 | 3.0 | — | |||||||||||||||||
| Assumed health-care cost trend rate | |||||||||||||||||||||||
Health-care cost escalation(1)(3) |
— | — | 6.8 | — | — | 7.1 | |||||||||||||||||
| Dental-care cost escalation | — | — | 4.2 | — | — | 4.2 | |||||||||||||||||
| Benefit cost for the year | |||||||||||||||||||||||
| Discount rate | 5.0 | 5.0 | 5.0 | 2.8 | 2.8 | 2.7 | |||||||||||||||||
| Rate of compensation increase | 2.7 | 3.0 | — | 2.9 | 3.0 | — | |||||||||||||||||
| Assumed health-care cost trend rate | |||||||||||||||||||||||
Health-care cost escalation(2)(4) |
— | — | 7.1 | — | — | 6.8 | |||||||||||||||||
| Dental-care cost escalation | — | — | 4.7 | — | — | 4.7 | |||||||||||||||||
| Canadian plans | US plans | ||||||||||||||||
As at Dec. 31, 2023 |
Registered | Supplemental | Other | Pension | |||||||||||||
1% decrease in the discount rate |
30 | 10 | 1 | 2 | |||||||||||||
1% increase in the salary scale |
1 | — | — | — | |||||||||||||
1% increase in the health-care cost trend rate |
— | — | 1 | — | |||||||||||||
10% improvement in mortality rates |
13 | 3 | — | 1 | |||||||||||||
F89 |
TransAlta Corporation | 2023 Integrated Report | ||||||
| Joint operations | Segment | Ownership (per cent) |
Description | ||||||||
| Sheerness | Gas | 50 | Dual-fuel facility in Alberta, of which TA Cogen has a 50 per cent interest, operated by Heartland Generation Ltd., an affiliate of Energy Capital Partners | ||||||||
| Goldfields Power | Gas | 50 | Gas-fired facility in Australia operated by TransAlta | ||||||||
| Fort Saskatchewan | Gas | 60 | Cogeneration facility in Alberta, of which TA Cogen has a 60 per cent interest, operated by TransAlta | ||||||||
| Fortescue River Gas Pipeline | Gas | 43 | Natural gas pipeline in Western Australia, operated by DBP Development Group | ||||||||
| McBride Lake | Wind and Solar | 50 | Wind generation facility in Alberta operated by TransAlta | ||||||||
| Soderglen | Wind and Solar | 50 | Wind generation facility in Alberta operated by TransAlta | ||||||||
| Pingston | Hydro | 50 | Hydro facility in British Columbia operated by TransAlta | ||||||||
| Joint venture | Segment | Ownership (per cent) |
Description | ||||||||
| Skookumchuck | Wind and Solar | 49 | Wind generation facility in Washington operated by Southern Power | ||||||||
| Tent Mountain | Hydro | 50 | Pumped hydro energy storage development project in Alberta | ||||||||
| Year ended Dec. 31 | 2023 | 2022 | 2021 | |||||||||||
| (Use) source: | ||||||||||||||
| Accounts receivable | 715 | (869) | (28) | |||||||||||
| Prepaid expenses | — | — | 9 | |||||||||||
| Income taxes receivable | 27 | (61) | — | |||||||||||
| Inventory | (2) | 6 | 42 | |||||||||||
| Accounts payable, accrued liabilities and provisions | (550) | 548 | 153 | |||||||||||
| Income taxes payable | (66) | 60 | (2) | |||||||||||
| Change in non-cash operating working capital | 124 | (316) | 174 | |||||||||||
| TransAlta Corporation | 2023 Integrated Report | F90 |
||||||
Balance Dec. 31, 2022 |
Cash issuances |
Repayments and dividends paid(1) |
New leases | Dividends declared | Foreign exchange impact | Other | Balance Dec. 31, 2023 |
||||||||||||||||||||||
Long-term debt and lease liabilities(2) |
3,669 | 39 | (220) | 5 | — | (36) | 12 | 3,469 | |||||||||||||||||||||
| Exchangeable securities | 739 | — | — | — | — | — | 5 | 744 | |||||||||||||||||||||
Dividends payable (common and preferred)(3) |
68 | — | (109) | — | 116 | — | (26) | 49 | |||||||||||||||||||||
|
Total liabilities from
financing activities
|
4,476 | 39 | (329) | 5 | 116 | (36) | (9) | 4,262 | |||||||||||||||||||||
Balance Dec. 31, 2021 |
Cash issuances(1) |
Repayments and dividends paid(2) |
New leases | Dividends declared | Foreign exchange impact | Other |
Balance
Dec. 31, 2022
|
|||||||||||||||||||
Long-term debt and lease liabilities(3) |
3,267 | 981 | (630) | 40 | — | 39 | (28) | 3,669 | ||||||||||||||||||
| Exchangeable securities | 735 | — | — | — | — | — | 4 | 739 | ||||||||||||||||||
| Dividends payable (common and preferred) | 62 | — | (97) | — | 103 | — | — | 68 | ||||||||||||||||||
| Total liabilities from financing activities | 4,064 | 981 | (727) | 40 | 103 | 39 | (24) | 4,476 | ||||||||||||||||||
F91 |
TransAlta Corporation | 2023 Integrated Report | ||||||
| As at Dec. 31 | 2023 | 2022 | Increase/ (decrease) |
|||||||||||
Long-term debt(1) |
3,466 | 3,653 | (187) | |||||||||||
| Exchangeable securities | 744 | 739 | 5 | |||||||||||
| Bank overdraft | 3 | 16 | (13) | |||||||||||
| Equity | ||||||||||||||
| Common shares | 3,285 | 2,863 | 422 | |||||||||||
| Preferred shares | 942 | 942 | — | |||||||||||
| Contributed surplus | 41 | 41 | — | |||||||||||
| Deficit | (2,567) | (2,514) | (53) | |||||||||||
| Accumulated other comprehensive income (loss) | (164) | (222) | 58 | |||||||||||
| Non-controlling interests | 127 | 879 | (752) | |||||||||||
Less: available cash and cash equivalents(2) |
(348) | (1,134) | 786 | |||||||||||
Less: principal portion of restricted cash on TransAlta OCP bonds(3) |
(17) | (17) | — | |||||||||||
Less: fair value liability (asset) of hedging instruments on long-term debt(4) |
5 | (3) | 8 | |||||||||||
| Total capital | 5,517 | 5,243 | 274 | |||||||||||
| TransAlta Corporation | 2023 Integrated Report | F92 |
||||||
| Year ended Dec. 31 | 2023 | 2022 | Increase (decrease) |
|||||||||||
| Cash flow from operating activities | 1,464 | 877 | 587 | |||||||||||
| Change in non-cash working capital | (124) | 316 | (440) | |||||||||||
| Cash flow from operations before changes in working capital | 1,340 | 1,193 | 147 | |||||||||||
| Dividends paid on common shares | (58) | (54) | (4) | |||||||||||
| Dividends paid on preferred shares | (51) | (43) | (8) | |||||||||||
| Distributions paid to subsidiaries’ non-controlling interests | (223) | (187) | (36) | |||||||||||
| Property, plant and equipment expenditures | (875) | (918) | 43 | |||||||||||
| Inflow (outflow) | 133 | (9) | 142 | |||||||||||
| Subsidiary | Country | Ownership (per cent) |
Principal activity | ||||||||
| TransAlta Generation Partnership | Canada | 100 | Generation and sale of electricity | ||||||||
| TransAlta Cogeneration, L.P. | Canada | 50.01 | Generation and sale of electricity | ||||||||
| TransAlta Centralia Generation, LLC | US | 100 | Generation and sale of electricity | ||||||||
| TransAlta Energy Marketing Corp. | Canada | 100 | Energy marketing | ||||||||
| TransAlta Energy Marketing (U.S.), Inc. | US | 100 | Energy marketing | ||||||||
| TransAlta Energy (Australia), Pty Ltd. | Australia | 100 | Generation and sale of electricity | ||||||||
| TransAlta Renewables Inc. | Canada | 100(1) |
Generation and sale of electricity | ||||||||
| Associate or joint venture | Country | Ownership (per cent) |
Principal activity | ||||||||
| SP Skookumchuck Investment, LLC | US | 49 | Generation and sale of electricity | ||||||||
F93 |
TransAlta Corporation | 2023 Integrated Report | ||||||
| Year ended Dec. 31 | 2023 | 2022 | 2021 | ||||||||
| Total compensation | 21 | 23 | 30 | ||||||||
| Comprised of: | |||||||||||
| Short-term employee benefits | 11 | 11 | 14 | ||||||||
| Post-employment benefits | 1 | 1 | 1 | ||||||||
| Termination benefits | 1 | — | — | ||||||||
| Share-based payments | 8 | 11 | 15 | ||||||||
| Year ended Dec. 31 | 2023 | 2022 | 2021 | ||||||||
| Power sales | 135 | 127 | 27 | ||||||||
| Purchased power | 2 | 12 | 3 | ||||||||
| Asset management fees paid | 1 | 2 | 2 | ||||||||
| TransAlta Corporation | 2023 Integrated Report | F94 |
||||||
| 2024 | 2025 | 2026 | 2027 | 2028 |
2029 and
thereafter
|
Total | |||||||||||||||||
| Natural gas, transportation and other contracts | 55 | 49 | 50 | 48 | 57 | 436 | 695 | ||||||||||||||||
| Transmission | 9 | 9 | 6 | 4 | 5 | 93 | 126 | ||||||||||||||||
| Coal supply agreements | 86 | 71 | — | — | — | — | 157 | ||||||||||||||||
| Long-term service agreements | 60 | 57 | 42 | 44 | 37 | 184 | 424 | ||||||||||||||||
| Operating leases | 3 | 3 | 2 | 2 | 2 | 25 | 37 | ||||||||||||||||
Growth |
47 | — | — | — | — | — | 47 | ||||||||||||||||
| Total | 260 | 189 | 100 | 98 | 101 | 738 | 1,486 | ||||||||||||||||
F95 |
TransAlta Corporation | 2023 Integrated Report | ||||||
| TransAlta Corporation | 2023 Integrated Report | F96 |
||||||
F97 |
TransAlta Corporation | 2023 Integrated Report | ||||||
| Year ended Dec. 31, 2023 | Hydro |
Wind &
Solar(1)
|
Gas |
Energy
Transition
|
Energy Marketing |
Corporate | Total |
Equity-
accounted
investments(1)
|
Reclass
adjustments
|
IFRS
financials
|
||||||||||||||||||||||||||||||||||||||||||||||||||||
| Revenues | 533 | 357 | 1,514 | 751 | 220 | 1 | 3,376 | (21) | — | 3,355 | ||||||||||||||||||||||||||||||||||||||||||||||||||||
| Reclassifications and adjustments: | ||||||||||||||||||||||||||||||||||||||||||||||||||||||||||||||
| Unrealized mark-to-market (gain) loss | (4) | 16 | (67) | (5) | 23 | — | (37) | — | 37 | — | ||||||||||||||||||||||||||||||||||||||||||||||||||||
| Realized gain (loss) on closed exchange positions | — | — | 10 | — | (91) | — | (81) | — | 81 | — | ||||||||||||||||||||||||||||||||||||||||||||||||||||
| Decrease in finance lease receivable | — | — | 55 | — | — | — | 55 | — | (55) | — | ||||||||||||||||||||||||||||||||||||||||||||||||||||
| Finance lease income | — | — | 12 | — | — | — | 12 | — | (12) | — | ||||||||||||||||||||||||||||||||||||||||||||||||||||
| Unrealized foreign exchange loss on commodity | — | — | 1 | — | — | — | 1 | — | (1) | — | ||||||||||||||||||||||||||||||||||||||||||||||||||||
| Adjusted revenues | 529 | 373 | 1,525 | 746 | 152 | 1 | 3,326 | (21) | 50 | 3,355 | ||||||||||||||||||||||||||||||||||||||||||||||||||||
| Fuel and purchased power | 19 | 30 | 453 | 557 | — | 1 | 1,060 | — | — | 1,060 | ||||||||||||||||||||||||||||||||||||||||||||||||||||
| Reclassifications and adjustments: | ||||||||||||||||||||||||||||||||||||||||||||||||||||||||||||||
| Australian interest income | — | — | (4) | — | — | — | (4) | — | 4 | — | ||||||||||||||||||||||||||||||||||||||||||||||||||||
| Adjusted fuel and purchased power | 19 | 30 | 449 | 557 | — | 1 | 1,056 | — | 4 | 1,060 | ||||||||||||||||||||||||||||||||||||||||||||||||||||
| Carbon compliance | — | — | 112 | — | — | — | 112 | — | — | 112 | ||||||||||||||||||||||||||||||||||||||||||||||||||||
| Gross margin | 510 | 343 | 964 | 189 | 152 | — | 2,158 | (21) | 46 | 2,183 | ||||||||||||||||||||||||||||||||||||||||||||||||||||
| OM&A | 48 | 80 | 192 | 64 | 43 | 115 | 542 | (3) | — | 539 | ||||||||||||||||||||||||||||||||||||||||||||||||||||
| Taxes, other than income taxes | 3 | 12 | 11 | 3 | — | 1 | 30 | (1) | — | 29 | ||||||||||||||||||||||||||||||||||||||||||||||||||||
| Net other operating income | — | (7) | (40) | — | — | — | (47) | — | — | (47) | ||||||||||||||||||||||||||||||||||||||||||||||||||||
| Reclassifications and adjustments: | ||||||||||||||||||||||||||||||||||||||||||||||||||||||||||||||
| Insurance recovery | — | 1 | — | — | — | — | 1 | — | (1) | — | ||||||||||||||||||||||||||||||||||||||||||||||||||||
| Adjusted net other operating income | — | (6) | (40) | — | — | — | (46) | — | (1) | (47) | ||||||||||||||||||||||||||||||||||||||||||||||||||||
Adjusted EBITDA(2) |
459 | 257 | 801 | 122 | 109 | (116) | 1,632 | |||||||||||||||||||||||||||||||||||||||||||||||||||||||
| Equity income | 4 | |||||||||||||||||||||||||||||||||||||||||||||||||||||||||||||
| Finance lease income | 12 | |||||||||||||||||||||||||||||||||||||||||||||||||||||||||||||
| Depreciation and amortization | (621) | |||||||||||||||||||||||||||||||||||||||||||||||||||||||||||||
| Asset impairment reversals | 48 | |||||||||||||||||||||||||||||||||||||||||||||||||||||||||||||
Interest income |
59 | |||||||||||||||||||||||||||||||||||||||||||||||||||||||||||||
Interest expense |
(281) | |||||||||||||||||||||||||||||||||||||||||||||||||||||||||||||
| Foreign exchange loss | (7) | |||||||||||||||||||||||||||||||||||||||||||||||||||||||||||||
Gain on sale of assets and other |
4 | |||||||||||||||||||||||||||||||||||||||||||||||||||||||||||||
| Earnings before income taxes | 880 | |||||||||||||||||||||||||||||||||||||||||||||||||||||||||||||
| TransAlta Corporation | 2023 Integrated Report | F98 |
||||||
| Year ended Dec. 31, 2022 | Hydro |
Wind &
Solar(1)
|
Gas | Energy Transition |
Energy Marketing |
Corporate | Total |
Equity-
accounted
investments(1)
|
Reclass adjustments |
IFRS
financials
|
||||||||||||||||||||||||||||||||||||||||||||||||||||
| Revenues | 606 | 303 | 1,209 | 714 | 160 | (2) | 2,990 | (14) | — | 2,976 | ||||||||||||||||||||||||||||||||||||||||||||||||||||
| Reclassifications and adjustments: | ||||||||||||||||||||||||||||||||||||||||||||||||||||||||||||||
| Unrealized mark-to-market loss | 1 | 104 | 251 | 10 | 12 | — | 378 | — | (378) | — | ||||||||||||||||||||||||||||||||||||||||||||||||||||
| Realized gain (loss) on closed exchange positions | — | — | (4) | — | 47 | — | 43 | — | (43) | — | ||||||||||||||||||||||||||||||||||||||||||||||||||||
| Decrease in finance lease receivable | — | — | 46 | — | — | — | 46 | — | (46) | — | ||||||||||||||||||||||||||||||||||||||||||||||||||||
| Finance lease income | — | — | 19 | — | — | — | 19 | — | (19) | — | ||||||||||||||||||||||||||||||||||||||||||||||||||||
Unrealized foreign exchange gain on commodity |
— | — | — | — | (1) | — | (1) | — | 1 | — | ||||||||||||||||||||||||||||||||||||||||||||||||||||
| Adjusted revenues | 607 | 407 | 1,521 | 724 | 218 | (2) | 3,475 | (14) | (485) | 2,976 | ||||||||||||||||||||||||||||||||||||||||||||||||||||
| Fuel and purchased power | 22 | 31 | 641 | 566 | — | 3 | 1,263 | — | — | 1,263 | ||||||||||||||||||||||||||||||||||||||||||||||||||||
| Reclassifications and adjustments: | ||||||||||||||||||||||||||||||||||||||||||||||||||||||||||||||
| Australian interest income | — | — | (4) | — | — | — | (4) | — | 4 | — | ||||||||||||||||||||||||||||||||||||||||||||||||||||
| Adjusted fuel and purchased power | 22 | 31 | 637 | 566 | — | 3 | 1,259 | — | 4 | 1,263 | ||||||||||||||||||||||||||||||||||||||||||||||||||||
| Carbon compliance | — | 1 | 83 | (1) | — | (5) | 78 | — | — | 78 | ||||||||||||||||||||||||||||||||||||||||||||||||||||
| Gross margin | 585 | 375 | 801 | 159 | 218 | — | 2,138 | (14) | (489) | 1,635 | ||||||||||||||||||||||||||||||||||||||||||||||||||||
| OM&A | 55 | 68 | 195 | 69 | 35 | 101 | 523 | (2) | — | 521 | ||||||||||||||||||||||||||||||||||||||||||||||||||||
| Taxes, other than income taxes | 3 | 12 | 15 | 4 | — | 1 | 35 | (2) | — | 33 | ||||||||||||||||||||||||||||||||||||||||||||||||||||
| Net other operating income | — | (23) | (38) | — | — | — | (61) | 3 | — | (58) | ||||||||||||||||||||||||||||||||||||||||||||||||||||
| Reclassifications and adjustments: | ||||||||||||||||||||||||||||||||||||||||||||||||||||||||||||||
| Insurance recovery | — | 7 | — | — | — | — | 7 | — | (7) | — | ||||||||||||||||||||||||||||||||||||||||||||||||||||
| Adjusted net other operating income |
— | (16) | (38) | — | — | — | (54) | 3 | (7) | (58) | ||||||||||||||||||||||||||||||||||||||||||||||||||||
Adjusted EBITDA(2) |
527 | 311 | 629 | 86 | 183 | (102) | 1,634 | |||||||||||||||||||||||||||||||||||||||||||||||||||||||
| Equity income | 9 | |||||||||||||||||||||||||||||||||||||||||||||||||||||||||||||
| Finance lease income | 19 | |||||||||||||||||||||||||||||||||||||||||||||||||||||||||||||
| Depreciation and amortization | (599) | |||||||||||||||||||||||||||||||||||||||||||||||||||||||||||||
| Asset impairment charges | (9) | |||||||||||||||||||||||||||||||||||||||||||||||||||||||||||||
Interest income |
24 | |||||||||||||||||||||||||||||||||||||||||||||||||||||||||||||
Interest expense |
(286) | |||||||||||||||||||||||||||||||||||||||||||||||||||||||||||||
| Foreign exchange gain | 4 | |||||||||||||||||||||||||||||||||||||||||||||||||||||||||||||
Gain on sale of assets and other |
52 | |||||||||||||||||||||||||||||||||||||||||||||||||||||||||||||
| Earnings before income taxes | 353 | |||||||||||||||||||||||||||||||||||||||||||||||||||||||||||||
F99 |
TransAlta Corporation | 2023 Integrated Report | ||||||
| Year ended Dec. 31, 2021 | Hydro | Wind & Solar(1) |
Gas | Energy Transition | Energy Marketing |
Corporate | Total |
Equity-
accounted
investments(1)
|
Reclass adjustments | IFRS financials | ||||||||||||||||||||||||||||||||||||||||||||||||||||
| Revenues | 383 | 323 | 1,109 | 709 | 211 | 4 | 2,739 | (18) | — | 2,721 | ||||||||||||||||||||||||||||||||||||||||||||||||||||
| Reclassifications and adjustments: | ||||||||||||||||||||||||||||||||||||||||||||||||||||||||||||||
|
Unrealized mark-to-market
(gain) loss
|
— | 25 | (40) | 19 | (38) | — | (34) | — | 34 | — | ||||||||||||||||||||||||||||||||||||||||||||||||||||
|
Realized gain (loss) on closed
exchange positions
|
— | — | (6) | — | 29 | — | 23 | — | (23) | — | ||||||||||||||||||||||||||||||||||||||||||||||||||||
|
Decrease in finance lease
receivable
|
— | — | 41 | — | — | — | 41 | — | (41) | — | ||||||||||||||||||||||||||||||||||||||||||||||||||||
| Finance lease income | — | — | 25 | — | — | — | 25 | — | (25) | — | ||||||||||||||||||||||||||||||||||||||||||||||||||||
|
Unrealized foreign exchange
gain on commodity
|
— | — | (3) | — | — | — | (3) | — | 3 | — | ||||||||||||||||||||||||||||||||||||||||||||||||||||
| Adjusted revenues | 383 | 348 | 1,126 | 728 | 202 | 4 | 2,791 | (18) | (52) | 2,721 | ||||||||||||||||||||||||||||||||||||||||||||||||||||
| Fuel and purchased power | 16 | 17 | 457 | 560 | — | 4 | 1,054 | — | — | 1,054 | ||||||||||||||||||||||||||||||||||||||||||||||||||||
| Reclassifications and adjustments: | ||||||||||||||||||||||||||||||||||||||||||||||||||||||||||||||
| Australian interest income | — | — | (4) | — | — | — | (4) | — | 4 | — | ||||||||||||||||||||||||||||||||||||||||||||||||||||
| Mine depreciation | — | — | (79) | (111) | — | — | (190) | — | 190 | — | ||||||||||||||||||||||||||||||||||||||||||||||||||||
Coal inventory writedown |
— | — | — | (17) | — | — | (17) | — | 17 | — | ||||||||||||||||||||||||||||||||||||||||||||||||||||
Adjusted fuel and purchased power |
16 | 17 | 374 | 432 | — | 4 | 843 | — | 211 | 1,054 | ||||||||||||||||||||||||||||||||||||||||||||||||||||
| Carbon compliance | — | — | 118 | 60 | — | — | 178 | — | — | 178 | ||||||||||||||||||||||||||||||||||||||||||||||||||||
| Gross margin | 367 | 331 | 634 | 236 | 202 | — | 1,770 | (18) | (263) | 1,489 | ||||||||||||||||||||||||||||||||||||||||||||||||||||
| OM&A | 42 | 59 | 175 | 117 | 36 | 84 | 513 | (2) | — | 511 | ||||||||||||||||||||||||||||||||||||||||||||||||||||
| Reclassifications and adjustments: | ||||||||||||||||||||||||||||||||||||||||||||||||||||||||||||||
Parts and materials writedown |
— | — | (2) | (26) | — | — | (28) | — | 28 | — | ||||||||||||||||||||||||||||||||||||||||||||||||||||
| Curtailment gain | — | — | — | 6 | — | — | 6 | — | (6) | — | ||||||||||||||||||||||||||||||||||||||||||||||||||||
| Adjusted OM&A | 42 | 59 | 173 | 97 | 36 | 84 | 491 | (2) | 22 | 511 | ||||||||||||||||||||||||||||||||||||||||||||||||||||
Taxes, other than income taxes |
3 | 10 | 13 | 6 | — | 1 | 33 | (1) | — | 32 | ||||||||||||||||||||||||||||||||||||||||||||||||||||
Net other operating loss (income) |
— | — | (40) | 48 | — | — | 8 | — | — | 8 | ||||||||||||||||||||||||||||||||||||||||||||||||||||
| Reclassifications and adjustments: | ||||||||||||||||||||||||||||||||||||||||||||||||||||||||||||||
| Royalty onerous contract and contract termination penalties |
— | — | — | (48) | — | — | (48) | — | 48 | — | ||||||||||||||||||||||||||||||||||||||||||||||||||||
|
Adjusted net other operating
loss (income)
|
— | — | (40) | — | — | — | (40) | — | 48 | 8 | ||||||||||||||||||||||||||||||||||||||||||||||||||||
Adjusted EBITDA(2) |
322 | 262 | 488 | 133 | 166 | (85) | 1,286 | |||||||||||||||||||||||||||||||||||||||||||||||||||||||
| Equity income | 9 | |||||||||||||||||||||||||||||||||||||||||||||||||||||||||||||
| Finance lease income | 25 | |||||||||||||||||||||||||||||||||||||||||||||||||||||||||||||
| Depreciation and amortization | (529) | |||||||||||||||||||||||||||||||||||||||||||||||||||||||||||||
| Asset impairment charges | (648) | |||||||||||||||||||||||||||||||||||||||||||||||||||||||||||||
Interest income |
11 | |||||||||||||||||||||||||||||||||||||||||||||||||||||||||||||
Interest expense |
(256) | |||||||||||||||||||||||||||||||||||||||||||||||||||||||||||||
| Foreign exchange gain | 16 | |||||||||||||||||||||||||||||||||||||||||||||||||||||||||||||
Gain on sale of assets and other |
54 | |||||||||||||||||||||||||||||||||||||||||||||||||||||||||||||
| Loss before income taxes | (380) | |||||||||||||||||||||||||||||||||||||||||||||||||||||||||||||
| TransAlta Corporation | 2023 Integrated Report | F100 |
||||||
| As at As at Dec. 31, 2023 | Hydro |
Wind and
Solar
|
Gas |
Energy
Transition
|
Energy Marketing |
Corporate | Total | ||||||||||||||||
| PP&E | 462 | 3,360 | 1,543 | 251 | — | 98 | 5,714 | ||||||||||||||||
| Right-of-use assets | 7 | 94 | 5 | — | — | 11 | 117 | ||||||||||||||||
| Intangible assets | 2 | 141 | 40 | 4 | 5 | 31 | 223 | ||||||||||||||||
| Goodwill | 258 | 176 | — | — | 30 | — | 464 | ||||||||||||||||
| As at As at Dec. 31, 2022 | Hydro |
Wind and
Solar
|
Gas |
Energy
Transition
|
Energy Marketing |
Corporate | Total | ||||||||||||||||
| PP&E | 437 | 2,837 | 1,858 | 313 | — | 111 | 5,556 | ||||||||||||||||
| Right-of-use assets | 6 | 98 | 6 | 2 | — | 14 | 126 | ||||||||||||||||
| Intangible assets | 2 | 157 | 49 | 5 | 8 | 31 | 252 | ||||||||||||||||
| Goodwill | 258 | 176 | — | — | 30 | — | 464 | ||||||||||||||||
| Year ended Dec. 31, 2023 | Hydro |
Wind and
Solar
|
Gas |
Energy
Transition
|
Energy Marketing |
Corporate | Total | ||||||||||||||||
| Additions to non-current assets: | |||||||||||||||||||||||
PP&E |
42 | 674 | 89 | 16 | — | 54 | 875 | ||||||||||||||||
Intangible assets |
— | — | — | — | — | 13 | 13 | ||||||||||||||||
| Year ended Dec. 31, 2022 | Hydro |
Wind and
Solar
|
Gas |
Energy
Transition
|
Energy Marketing |
Corporate | Total | ||||||||||||||||
| Additions to non-current assets: | |||||||||||||||||||||||
PP&E |
36 | 745 | 43 | 19 | — | 75 | 918 | ||||||||||||||||
Intangible assets |
— | 19 | — | — | 3 | 9 | 31 | ||||||||||||||||
| Year ended Dec. 31, 2021 | Hydro |
Wind and
Solar
|
Gas |
Energy
Transition
|
Energy Marketing |
Corporate | Total | ||||||||||||||||
| Additions to non-current assets: | |||||||||||||||||||||||
PP&E |
29 | 166 | 167 | 90 | — | 28 | 480 | ||||||||||||||||
Intangible assets |
— | — | — | 1 | — | 8 | 9 | ||||||||||||||||
F101 |
TransAlta Corporation | 2023 Integrated Report | ||||||
| Year ended Dec. 31 | 2023 | 2022 | 2021 | ||||||||
| Depreciation and amortization expense on the Consolidated Statements of Earnings (Loss) | 621 | 599 | 529 | ||||||||
Depreciation included in fuel and purchased power (Note 6) |
— | — | 190 | ||||||||
Depreciation and amortization on the Consolidated Statements of Cash Flows |
621 | 599 | 719 | ||||||||
| Year ended Dec. 31 | 2023 | 2022 | 2021 | ||||||||
| Canada | 2,218 | 1,905 | 1,854 | ||||||||
| US | 987 | 940 | 731 | ||||||||
| Australia | 150 | 131 | 136 | ||||||||
| Total revenue | 3,355 | 2,976 | 2,721 | ||||||||
| Property, plant and equipment |
Right-of-use assets | Intangible assets | Other assets | |||||||||||||||||||||||
| As at Dec. 31 | 2023 | 2022 | 2023 | 2022 | 2023 | 2022 | 2023 | 2022 | ||||||||||||||||||
| Canada | 3,578 | 3,817 | 43 | 49 | 108 | 123 | 68 | 62 | ||||||||||||||||||
| US | 1,749 | 1,307 | 71 | 74 | 88 | 101 | 42 | 34 | ||||||||||||||||||
| Australia | 387 | 432 | 3 | 3 | 27 | 28 | 69 | 64 | ||||||||||||||||||
| Total | 5,714 | 5,556 | 117 | 126 | 223 | 252 | 179 | 160 | ||||||||||||||||||
| TransAlta Corporation | 2023 Integrated Report | F102 |
||||||

| /s/Ernst & Young LLP | |||||
|
Calgary, Alberta
February 22, 2024
|
Chartered Professional Accountants | ||||
| February 22, 2024 | |||||
| /s/ John H. Kousinioris | |||||
| John H. Kousinioris | |||||
| President and Chief Executive Officer | |||||
| February 22, 2024 | |||||
| /s/ Todd J. Stack | |||||
| Todd J. Stack | |||||
| Executive Vice President, Finance and Chief Financial Officer | |||||
| /s/ John H. Kousinioris | ||
| John H. Kousinioris | ||
| President and Chief Executive Officer | ||
| /s/ Todd J. Stack | |||||
| Todd J. Stack | |||||
| Executive Vice President, Finance and Chief Financial Officer | |||||