Document
MANAGEMENT'S DISCUSSION AND ANALYSIS
TRANSALTA CORPORATION
Management’s Discussion and Analysis
Second Quarter Report for 2023
This Management’s Discussion and Analysis (“MD&A”) contains forward-looking statements. These statements are based on certain estimates and assumptions and involve risks and uncertainties. Actual results may differ materially. Refer to the Forward-Looking Statements section of this MD&A for additional information.
Table of Contents
|
|
|
|
|
|
|
|
|
|
|
|
|
|
|
|
|
|
|
|
|
Forward-Looking Statements |
|
|
Financial Instruments |
|
Description of the Business |
|
|
Additional IFRS Measures and Non-IFRS Measures |
|
Highlights |
|
|
Financial Highlights on a Proportional Basis of TransAlta Renewables |
|
Significant and Subsequent Events |
|
|
Key Non-IFRS Financial Ratios |
|
Segmented Financial Performance and Operating Results |
|
|
2023 Outlook |
|
Alberta Electricity Portfolio |
|
|
Strategy and Capability to Deliver Results |
|
Selected Quarterly Information |
|
|
Material Accounting Policies and Critical Accounting Estimates |
|
Financial Position |
|
|
Accounting Changes |
|
Financial Capital |
|
|
Governance and Risk Management |
|
Other Consolidated Analysis |
|
|
Regulatory Updates |
|
Cash Flows |
|
|
Disclosure Controls and Procedures |
|
|
|
|
|
|
|
|
|
|
|
|
|
|
|
|
|
|
|
|
|
|
|
|
|
|
|
|
|
|
|
|
|
|
|
|
|
|
|
|
|
|
|
|
|
|
|
|
|
|
This MD&A should be read in conjunction with the unaudited interim condensed consolidated financial statements of TransAlta Corporation as at and for the three and six months ended June 30, 2023 and 2022, and should also be read in conjunction with the audited annual consolidated financial statements and MD&A ("2022 Annual MD&A") contained within our 2022 Annual Integrated Report. In this MD&A, unless the context otherwise requires, “we”, “our”, “us”, the “Company” and “TransAlta” refers to TransAlta Corporation and its subsidiaries. Our unaudited interim condensed consolidated financial statements have been prepared in accordance with International Financial Reporting Standards (“IFRS”) International Accounting Standards (“IAS”) 34 Interim Financial Reporting for Canadian publicly accountable enterprises as issued by the International Accounting Standards Board (“IASB”) and in effect at June 30, 2023. All tabular amounts in the following discussion are in millions of Canadian dollars unless otherwise noted. This MD&A is dated Aug. 3, 2023. Additional information respecting TransAlta, including our Annual Information Form ("AIF") for the year ended Dec. 31, 2022, is available on SEDAR at www.sedarplus.ca, on EDGAR at www.sec.gov and on our website at www.transalta.com. Information on or connected to our website is not incorporated by reference herein.
MANAGEMENT'S DISCUSSION AND ANALYSIS
Forward-Looking Statements
This MD&A includes "forward-looking information" within the meaning of applicable Canadian securities laws and "forward-looking statements" within the meaning of applicable United States ("US") securities laws, including the United States Private Securities Litigation Reform Act of 1995 (collectively referred to herein as "forward-looking statements"). All forward-looking statements are based on our beliefs as well as assumptions based on information available at the time the assumptions were made and on management's experience and perception of historical trends, current conditions and expected future developments, as well as other factors deemed appropriate in the circumstances. Forward-looking statements are not facts, but only predictions and generally can be identified by the use of statements that include phrases such as "may", "will", "can", "could", "would", "shall", "believe", "expect", "estimate", "anticipate", "intend", "plan", "forecast", "foresee", "potential", "enable", "continue" or other comparable terminology. These statements are not guarantees of our future performance, events or results and are subject to risks, uncertainties and other important factors that could cause our actual performance, events or results to be materially different from that set out in or implied by the forward-looking statements.
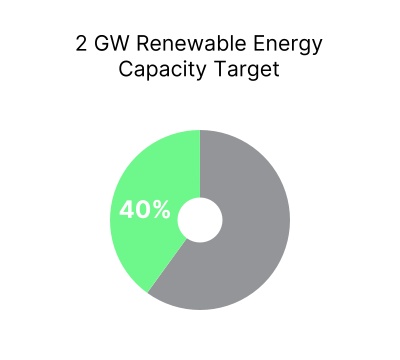
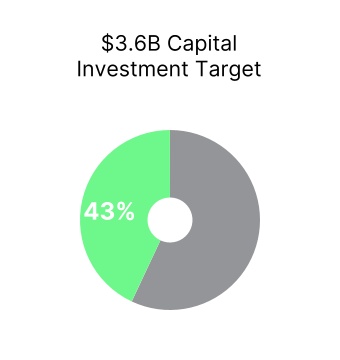
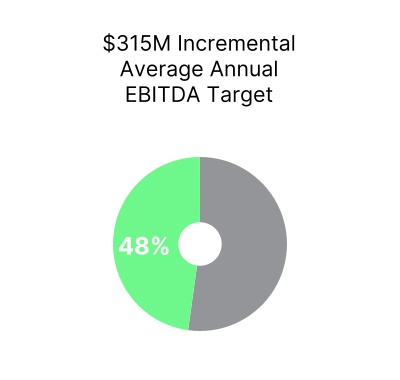
In particular, this MD&A contains forward-looking statements including, but not limited to, statements relating to: the acquisition by the Company of all of the outstanding common shares of TransAlta Renewables Inc. ("TransAlta Renewables") not already owned by TransAlta pursuant to the definitive arrangement agreement dated July 10, 2023, including the benefits of such transaction and the timing and completion of such transaction; our Clean Electricity Growth Plan and ability to achieve the target of 2 gigawatts ("GW") of incremental clean electricity capacity with an estimated capital investment of $3.6 billion and that is expected to deliver incremental average annual EBITDA of $315 million; the expansion of the Company's early stage development pipeline to 5 GW; advancing 418 MW of advanced-stage projects; the Company's projects under construction, including the timing of commercial operations, expected annual EBITDA and associated costs, including in respect of the Horizon Hill wind project, the White Rock wind projects, the Northern Goldfields solar project, the Garden Plain wind project and the Mount Keith 132kV transmission expansion; the development of the early-stage Tent Mountain Renewable Energy Complex; the proportion of EBITDA to be generated from renewable sources by the end of 2025; the achievement of the 2023 Outlook (defined below), including adjusted EBITDA, free cash flow, annualized dividend per share and sustaining capital; expected power prices in Alberta, Ontario and the Pacific Northwest; forecasted AECO gas prices; the hedge assumptions for the remainder of 2023 as well as for 2024 and 2025, including in relation to production and price; the Company's ability to enhance shareholder value through its NCIB (as defined below); the reduction of carbon emissions by 75 per cent from 2015 emissions levels by 2026; the rehabilitation of the Kent Hills 1 and 2 wind facilities, including, the timing and cost of such rehabilitation; the expected impact and quantum of carbon compliance costs; regulatory developments and their expected impact on the Company, including the Canadian federal climate plan and the implementation of the major aspects thereof (including increased carbon pricing and increased funding for clean technology); the potential value of emission reduction credits; the cyclicality of the business, including as it relates to maintenance costs, production and loads; expectations regarding refinancing debt; and the Company continuing to maintain adequate liquidity.
The forward-looking statements contained in this MD&A are based on many assumptions including, but not limited to, the following: no significant changes to applicable laws and regulations beyond those that have already been announced; no significant changes to fuel and purchased power costs; no material adverse impacts to long-term investment and credit markets; no significant changes to power price and hedging assumptions, including Alberta spot prices of $150 to $170 per MWh in 2023, Mid-Columbia spot prices of US$90 to US$100 per MWh in 2023, and AECO gas prices of $2.50 per GJ in 2023; hedged volumes and prices in 2023; sustaining capital of $140 million - $170 million in 2023; Energy Marketing gross margin of $130 million - $150 million in 2023; no significant changes to gas commodity prices and transport costs; no significant changes to the decommissioning and restoration costs of the retired Alberta assets; no significant changes to interest rates; no significant changes to the demand and growth of renewables generation; and no significant changes to the Company's debt and credit ratings.
MANAGEMENT'S DISCUSSION AND ANALYSIS
Forward-looking statements are subject to a number of significant risks and uncertainties that could cause actual plans, performance, results or outcomes to differ materially from current expectations. Factors that may adversely impact what is expressed or implied by forward-looking statements contained in this MD&A include risks relating to: the completion and timing of the arrangement with TransAlta Renewables; the ability of the Company and TransAlta Renewables to receive, in a timely manner, the necessary regulatory, court, shareholder, stock exchange and other third-party approvals and to satisfy the other conditions to closing of the arrangement; fluctuations in power prices, including merchant pricing in Alberta, Ontario and Mid-Columbia; reductions in production; restricted access to capital and increased borrowing costs, including any difficulty raising debt, equity or tax equity, as applicable, on reasonable terms or at all; reduced labour availability and ability to continue to staff our operations and facilities; disruptions to our supply chains, including our ability to secure necessary equipment; force majeure claims; our ability to obtain regulatory and any other third-party approvals on the expected timelines or at all in respect of our growth projects; long term commitments on gas transportation capacity that may not be fully utilized over time; risks associated with development and construction projects, including as it pertains to increased capital costs, permitting, labour and engineering risks, disputes with contractors and potential delays in the construction or commissioning of such projects; significant fluctuations in the Canadian dollar against the US dollar and Australian dollar; changes in short-term and long-term electricity supply and demand; counterparty credit risk and any higher rate of losses on our accounts receivables; inability to achieve our environmental, social and governance ("ESG") targets; impairments and/or write-downs of assets; adverse impacts on our information technology systems and our internal control systems, including cybersecurity threats; commodity risk management and energy trading risks, including the effectiveness of the Company’s risk management tools associated with hedging and trading procedures to protect against significant losses; our ability to contract our generation for prices that will provide expected returns and to replace contracts as they expire; changes to the legislative, regulatory and political environments in the jurisdictions in which we operate; environmental requirements and changes in, or liabilities under, these requirements; disruptions in the transmission and distribution of electricity; the effects of weather, including man-made or natural disasters and other climate-change related risks; increases in costs; reductions to our generating units’ relative efficiency or capacity factors; disruptions in the source of fuels, including natural gas, coal, water, solar or wind resources required to operate our facilities; operational risks, unplanned outages and equipment failure and our ability to carry out or have completed any repairs in a cost-effective or timely manner or at all, including as it applies to the rehabilitation and replacement of turbine foundations of the Kent Hills 1 and 2 wind facilities; general economic risks, including deterioration of equity markets, increasing interest rates or rising inflation; failure to meet financial expectations; general domestic and international economic and political developments; armed hostilities, including the war in Ukraine and associated impacts; the threat of terrorism; adverse diplomatic developments or other similar events that could adversely affect our business; industry risk and competition; structural subordination of securities; public health crisis risks; inadequacy or unavailability of insurance coverage; our provision for income taxes and any risk of reassessment; legal, regulatory and contractual disputes and proceedings involving the Company; reliance on key personnel; and labour relations matters. The foregoing risk factors, among others, are described in further detail in the Governance and Risk Management section of our 2022 Annual MD&A and the Risk Factors section in our AIF for the year ended Dec. 31, 2022.
Readers are urged to consider these factors carefully in evaluating the forward-looking statements, which reflect the Company's expectations only as of the date hereof and are cautioned not to place undue reliance on them. The forward-looking statements included in this document are made only as of the date hereof and we do not undertake to publicly update these forward-looking statements to reflect new information, future events or otherwise, except as required by applicable laws. The purpose of the financial outlooks contained herein is to give the reader information about management's current expectations and plans and readers are cautioned that such information may not be appropriate for other purposes. In light of these risks, uncertainties and assumptions, the forward-looking statements might occur to a different extent or at a different time than we have described, or might not occur at all. We cannot assure that projected results or events will be achieved.
MANAGEMENT'S DISCUSSION AND ANALYSIS
Description of the Business
Portfolio of Assets
TransAlta is a Canadian corporation and one of Canada's largest publicly traded power generators with over 112 years of operating experience. We own, operate and manage a geographically diversified portfolio of assets utilizing a broad range of input resources that includes water, wind, solar, natural gas and thermal coal. We are one of the largest producers of wind power in Canada and the largest producer of hydro power in Alberta.
The following table provides our consolidated ownership of our facilities across the regions in which we operate as of June 30, 2023:
|
|
|
|
|
|
|
|
|
|
|
|
|
|
|
|
|
|
|
|
|
|
|
As at June 30, 2023 |
Hydro |
Wind and Solar |
Gas |
Energy Transition |
|
|
Total |
| Alberta |
Gross installed capacity (MW)(1) |
834 |
|
636 |
|
1,960 |
|
— |
|
|
|
3,430 |
|
|
|
|
|
|
|
|
|
| Number of facilities |
17 |
|
13 |
|
7 |
|
— |
|
|
|
37 |
|
Weighted average contract life (years)(2)(3)(4) |
— |
|
6 |
|
1 |
|
— |
|
|
|
2 |
|
| Canada, Excluding Alberta |
Gross installed capacity (MW)(1) |
88 |
|
751 |
|
645 |
|
— |
|
|
|
1,484 |
|
|
|
|
|
|
|
|
|
| Number of facilities |
7 |
|
9 |
|
3 |
|
— |
|
|
|
19 |
|
Weighted average contract life (years)(3) |
11 |
|
11 |
|
9 |
|
— |
|
|
|
10 |
|
| US |
Gross installed capacity (MW) |
— |
|
519 |
|
29 |
|
671 |
|
|
|
1,219 |
|
|
|
|
|
|
|
|
|
| Number of facilities |
— |
|
7 |
|
1 |
|
2 |
|
|
|
10 |
|
Weighted average contract life (years)(3) |
— |
|
11 |
|
3 |
|
3 |
|
|
|
6 |
|
| Australia |
Gross installed capacity (MW) |
— |
|
— |
|
450 |
|
— |
|
|
|
450 |
|
|
|
|
|
|
|
|
|
| Number of facilities |
— |
|
— |
|
6 |
|
— |
|
|
|
6 |
|
Weighted average contract life (years)(3) |
— |
|
— |
|
15 |
|
— |
|
|
|
15 |
|
|
|
|
|
|
|
|
|
| Total |
Gross installed capacity (MW) |
922 |
|
1,906 |
|
3,084 |
|
671 |
|
|
|
6,583 |
|
|
|
|
|
|
|
|
|
| Number of facilities |
24 |
|
29 |
|
17 |
|
2 |
|
|
|
72 |
|
Weighted average contract life (years)(3) |
1 |
|
9 |
|
5 |
|
3 |
|
|
|
5 |
|
(1) Gross installed capacity for consolidated reporting represents 100 per cent output of a facility. Capacity figures for the Wind and Solar segment includes 100 per cent of the Kent Hills wind facilities; Gas includes 100 per cent of the Ottawa and Windsor facilities, 100 per cent of the Poplar Creek facility, 50 per cent of the Sheerness facility and 60 per cent of the Fort Saskatchewan facility. Gross installed capacity as at June 30, 2023, does not include the Garden Plain wind project.
(2) The weighted average contract life for Hydro and certain gas and wind assets in Alberta are nil as they are operating primarily on a merchant basis in the Alberta market. The Garden Plain wind project is fully contracted but will not be included in the weighted average contract life until fully commissioned. Refer to the Alberta Electricity Portfolio section of this MD&A for more information.
(3) For power generated under long-term power purchase agreements ("PPAs"), power hedge contracts and short-term and long-term industrial contracts, the PPAs have a weighted-average remaining contract life based on long-term average gross installed capacity.
(4) The weighted-average remaining contract life is related to the contract period for McBride Lake (38 MW), Windrise (206 MW), Poplar Creek (115 MW) and Fort Saskatchewan (71 MW), with the remaining wind and gas facilities operated on a merchant basis in the Alberta market.
MANAGEMENT'S DISCUSSION AND ANALYSIS
Highlights
Consolidated Financial Highlights
|
|
|
|
|
|
|
|
|
|
|
|
|
|
|
|
|
3 months ended June 30 |
6 months ended June 30 |
|
| (in millions of Canadian dollars except where noted) |
2023 |
2022 |
2023 |
2022 |
|
| Adjusted availability (%) |
84.6 |
|
87.3 |
|
88.2 |
|
88.2 |
|
|
| Production (GWh) |
4,596 |
|
4,461 |
|
10,568 |
|
9,820 |
|
|
| Revenues |
625 |
|
458 |
|
1,714 |
|
1,193 |
|
|
| Fuel and purchased power |
188 |
|
231 |
|
513 |
|
469 |
|
|
| Carbon compliance |
25 |
|
9 |
|
57 |
|
28 |
|
|
| Operations, maintenance and administration |
134 |
|
117 |
|
258 |
|
229 |
|
|
Adjusted EBITDA(1) |
387 |
|
279 |
|
890 |
|
538 |
|
|
| Earnings (loss) before income taxes |
79 |
|
(22) |
|
462 |
|
220 |
|
|
| Net earnings (loss) attributable to common shareholders |
62 |
|
(80) |
|
356 |
|
106 |
|
|
| Cash flow from (used in) operating activities |
11 |
|
(129) |
|
473 |
|
322 |
|
|
Funds from operations(1) |
391 |
|
220 |
|
765 |
|
399 |
|
Free cash flow(1) |
278 |
|
145 |
|
541 |
|
253 |
|
| Net earnings (loss) per share attributable to common shareholders, basic and diluted |
0.23 |
|
(0.30) |
|
1.34 |
|
0.39 |
|
|
Dividends declared per common share(2) |
0.0550 |
|
0.0500 |
|
0.0550 |
|
0.0500 |
|
|
Dividends declared per preferred share(2) |
0.3312 |
|
0.2557 |
|
0.3312 |
|
0.2557 |
|
|
Funds from operations per share(1)(3) |
1.48 |
|
0.81 |
|
2.88 |
|
1.47 |
|
|
Free cash flow per share(1)(3) |
1.05 |
|
0.54 |
|
2.03 |
|
0.93 |
|
|
|
|
|
|
|
|
| As at |
|
|
June 30, 2023 |
Dec. 31, 2022 |
|
| Total assets |
|
|
9,582 |
|
10,741 |
|
|
Total consolidated net debt(1)(4) |
|
|
2,981 |
|
2,854 |
|
|
Total long-term liabilities |
|
|
5,759 |
|
5,864 |
|
|
| Total liabilities |
|
|
7,309 |
|
8,752 |
|
|
(1) These items are not defined and have no standardized meaning under IFRS. Presenting these items from period to period provides management and investors with the ability to evaluate earnings (loss) trends more readily in comparison with prior periods’ results. Refer to the Segmented Financial Performance and Operating Results section of this MD&A for further discussion of these items, including, where applicable, reconciliations to measures calculated in accordance with IFRS. Also, refer to the Additional IFRS Measures and Non-IFRS Measures section of this MD&A.
(2) Weighted average of the Series A, B, C, E and G preferred share dividends declared. Dividends declared vary period over period due to timing of dividend declarations and quarterly floating rates.
(3) Funds from operations ("FFO") per share and free cash flow ("FCF") per share are calculated using the weighted average number of common shares outstanding during the period. The weighted average number of common shares outstanding for June 30, 2023, was 266 million shares (June 30, 2022 – 271 million). Refer to the Additional IFRS Measures and Non-IFRS Measures section of this MD&A for the purpose of these non-IFRS ratios.
(4) Total consolidated net debt includes long-term debt, including the current portion, amounts due under credit facilities, exchangeable securities, US tax equity financing and lease liabilities, net of available cash and cash equivalents, the principal portion of restricted cash on our subsidiary TransAlta OCP LP ("TransAlta OCP") and the fair value of economic hedging instruments on debt. Refer to the table in the Financial Capital section of this MD&A for more details on the composition of total consolidated net debt.
MANAGEMENT'S DISCUSSION AND ANALYSIS
For the three and six months ended June 30, 2023, the Company demonstrated strong performance in the Alberta Electricity Portfolio led by the Alberta Gas and Hydro segments which benefited from the higher pricing environment, higher production in the Hydro segment from increased precipitation and snowpack melt, lower fuel commodity prices and favourable hedging impact resulting in higher gross margins. These factors contributed to the portfolio's overall performance and together demonstrate the value of our strategically diversified fleet in Alberta and its ability to generate cash flow under dynamic market conditions. The Energy Marketing segment has also exceeded expected results year-to-date due to short-term trading of both physical and financial power and gas products across North American markets. The Energy Marketing team has been able to capitalize on short-term volatility in the markets in which we trade without materially changing the risk profile of the business unit.
Adjusted availability for the three and six months ended June 30, 2023, was 84.6 per cent and 88.2 per cent, respectively, compared to 87.3 per cent and 88.2 per cent, respectively, for the same periods in 2022. For the three months ended June 30, 2023, the decrease in adjusted availability was due to higher planned outages in the Hydro and Gas segments, partially offset by lower planned outages in the Energy Transition segment and improved performance at the Windrise wind facility in the Wind and Solar segment. Adjusted availability for the six months ended June 30, 2023, was consistent with the same period in 2022.
Production for the three months ended June 30, 2023, was 4,596 gigawatt hours ("GWh") compared to 4,461 GWh for the same period in 2022. The increase in production was primarily due to higher market demand, improved availability in the Energy Transition segment and higher water resources at the Alberta Hydro Assets. Production for the six months ended June 30, 2023, was 10,568 GWh compared to 9,820 GWh for the same period in 2022. The increase in production was primarily due to stronger market conditions in Alberta and the Pacific Northwest in the Gas and Energy Transition segments, respectively, and higher adjusted availability in the Energy Transition segment. Production for the three and six months ended June 30, 2023, was partially offset by lower wind and solar resources in all regions.
Revenues for the three and six months ended June 30, 2023, increased by $167 million and $521 million, respectively, compared to the same periods in 2022, mainly as a result of higher realized energy prices within the Alberta electricity market and the Pacific Northwest, higher realized ancillary service prices within the Hydro segment and an increase in production within the Energy Transition segment and Hydro segment. This was partially offset by lower wind and solar production due to lower resource, lower environmental attribute sales and reduced ancillary volumes in the Hydro segment. For the six months ended, June 30, 2023, revenues were favourably impacted by stronger market conditions from our Alberta merchant gas assets. Energy Marketing revenues for the six months ended June 30, 2023, were higher mainly due to short-term trading of both physical and financial power and gas products across all North American deregulated markets.
Fuel and purchased power costs for the three months ended June 30, 2023, decreased by $43 million compared to the same period in 2022, benefiting from lower natural gas commodity prices in the Gas segment, partially offset by higher fuel usage in the Energy Transition segment. Fuel and purchased power costs for the six months ended June 30, 2023, increased by $44 million compared to the same period in 2022, primarily due to the higher purchased power costs incurred to meet contractual obligations during planned outages within the Energy Transition segment, higher fuel usage in the Energy Transition segment and the Gas segment, partially offset by lower natural gas commodity prices in the Gas segment.
Carbon compliance costs for the three and six months ended June 30, 2023, increased by $16 million and $29 million, respectively, compared to the same periods in 2022, primarily due an increase in the carbon price per tonne and the utilization of emission credits in the prior periods to settle a portion of our GHG obligation, which reduced the 2022 costs by $12 million for both periods. In addition, carbon compliance costs during the six months ended June 30, 2023, further increased from higher production in the Gas segment.
Operations, maintenance and administration ("OM&A") expenses for the three and six months ended June 30, 2023, increased by $17 million and $29 million, respectively, compared to the same periods in 2022. OM&A expenses increased primarily due to higher spending on strategic and growth initiatives, increased costs due to inflationary pressures and higher performance-related incentive accruals.
MANAGEMENT'S DISCUSSION AND ANALYSIS
Adjusted EBITDA for the three and six months ended June 30, 2023, increased by $108 million and $352 million, respectively, compared to the same periods in 2022. The increases were largely due to higher revenue from the Alberta Electricity Portfolio, as a result of higher merchant prices realized primarily by the gas and hydro facilities. The Hydro segment also benefited from higher ancillary service prices in the Alberta market. Adjusted EBITDA was further improved by higher revenue in the Energy Transition segment due to higher merchant pricing and higher production, and lower input costs in the Gas segment. These increases were partially offset by higher carbon compliance costs in the Gas segment, lower production in the Wind and Solar segment and higher OM&A in the Corporate segment. Changes in segmented adjusted EBITDA are discussed in the Segmented Financial Performance and Operating Results section of this MD&A.
Earnings (loss) before income taxes for the three and six months ended June 30, 2023, increased by $101 million and $242 million, respectively, compared to the same periods in 2022. Net earnings (loss) attributable to common shareholders for the three and six months ended June 30, 2023, were $62 million and $356 million compared to a net loss of $80 million and net earnings of $106 million in the same periods in 2022. For the three and six months ended June 30, 2023, the Company benefited from higher revenues, lower natural gas prices, higher income tax recoveries, largely due to realized current income tax benefits from an internal reorganization that occurred in the second quarter and higher asset impairment reversals. This was partially offset by higher depreciation due to the acceleration of useful lives on certain facilities in the third quarter of 2022, higher carbon compliance costs resulting from the previous years obligation being settled partially with emission credits, higher OM&A costs related to the Corporate and Energy Marketing segments and higher net earnings allocated to non-controlling interests. In the six months ended June 30, 2023, the Gas segment had higher production which resulted in higher fuel usage and higher carbon compliance costs and the Energy Transition segment had higher power purchases during planned outages.
Cash flow from operating activities for the three and six months ended June 30, 2023, increased by $140 million and $151 million, respectively, compared with the same periods in 2022, primarily due to higher revenues net of unrealized gains and losses from risk management activities. This was partially offset by higher unfavourable changes in working capital and higher fuel and purchased power, OM&A and carbon compliance costs.
FCF, one of the Company's key financial metrics, totaled $278 million and $541 million, respectively, for the three and six months ended June 30, 2023 compared to $145 million and $253 million, respectively, in the same periods in 2022. For the three and six months ended June 30, 2023, this represented an increase of $133 million and $288 million, respectively, primarily due to higher adjusted EBITDA, lower interest expense mainly driven by higher interest income due to higher interest rates, higher interest capitalized on construction capital expenditures and lower income tax expense due to a current income tax recovery in the second quarter of 2023. This was partially offset by higher distributions paid to subsidiaries' non-controlling interests, higher sustaining capital expenditures and higher realized foreign exchange losses compared to 2022.
MANAGEMENT'S DISCUSSION AND ANALYSIS
Significant and Subsequent Events
TransAlta Corporation to Acquire TransAlta Renewables Inc. to Simplify Structure and Enhance Strategic Position
On July 10, 2023, the Company and TransAlta Renewables entered into a definitive arrangement agreement (the "Arrangement Agreement") under which the Company will acquire all of the outstanding common shares of TransAlta Renewables not already owned, directly or indirectly, by TransAlta and certain of its affiliates, subject to the approval of TransAlta Renewables shareholders.
The transaction will provide shareholders of the combined company with a single strategy and a clear and compelling opportunity for long-term growth, with greater clarity around the execution of the Clean Electricity Growth Plan. TransAlta Renewables shareholders will benefit from a fair offer reflecting an attractive premium, a clear and sustainable path going forward, ownership in an expanded pool of assets and exposure to the Alberta electricity market. For TransAlta shareholders, the transaction will provide an enhanced strategic position, sustainable and attractive transition metrics, and increased liquidity and synergies, while maintaining the Company's financial strength.
Under the terms of the Arrangement Agreement, each TransAlta Renewables share will be exchanged for, at the election of each holder of common shares of TransAlta Renewables, (i) 1.0337 common shares of TransAlta or (ii) $13.00 in cash. The consideration payable to TransAlta Renewables shareholders is subject to pro-rationing based on a maximum aggregate number of TransAlta shares that may be issued to TransAlta Renewables shareholders of 46,441,779 and a maximum aggregate cash amount of $800 million.
The consideration payable to TransAlta Renewables shareholders represents an 18.3 per cent premium based on the closing price of TransAlta Renewables shares on the Toronto Stock Exchange ("TSX") as of July 10, 2023, and a 13.6 per cent premium relative to TransAlta Renewables' 20-day volume-weighted average price per share as of July 10, 2023. The total consideration paid to TransAlta Renewables shareholders is valued at $1.4 billion on July 10, 2023 of which $800 million will be paid in cash, and the remaining balance in common shares of TransAlta. The combined company will operate as TransAlta and remain listed on the TSX and the New York Stock Exchange ("NYSE"), under the symbols "TA" and "TAC", respectively.
A special meeting of TransAlta Renewables shareholders to consider the transaction will be held on or about Sept. 26, 2023. If all approvals are received and other closing conditions satisfied, the transaction is expected to be completed in early October 2023.
Normal Course Issuer Bid
On May 26, 2023, the TSX accepted the notice filed by the Company to implement a normal course issuer bid (“NCIB”) for a portion of its common shares. Pursuant to the NCIB, TransAlta may repurchase up to a maximum of 14,000,000 common shares, representing approximately 7.29 per cent of its public float of common shares as at May 17, 2023. Purchases under the NCIB may be made through open market transactions on the TSX and any alternative Canadian trading platforms on which the common shares are traded, based on the prevailing market price. Any common shares purchased under the NCIB will be cancelled. The period during which TransAlta is authorized to make purchases under the NCIB commenced on May 31, 2023 and ends on May 30, 2024, or such earlier date on which the maximum number of common shares are purchased under the NCIB or the NCIB is terminated at the Company’s election.
The NCIB provides the Company with a capital allocation alternative with a view to ensuring long-term shareholder value. TransAlta’s Board of Directors and management believe that, from time to time, the market price of the common shares might not be reflective of the underlying value and purchases of common shares for cancellation under the NCIB may provide an opportunity to enhance shareholder value.
Annual Shareholder Meeting
On April 28, 2023, the Company held its annual meeting of shareholders. All director nominees were elected to the Board, including Candace MacGibbon, a new member to the Board. The Company also received strong support on all other items of business, including say-on-pay and the proposed amendment to the Company's Share Unit Plan.
Automatic Share Purchase Plan
On March 27, 2023, the Company entered into an automatic share purchase plan (“ASPP”) in order to facilitate repurchases of TransAlta’s common shares under its previously announced NCIB.
MANAGEMENT'S DISCUSSION AND ANALYSIS
Under the ASPP, the Company’s broker purchased 2,943,600 common shares. The ASPP terminated on May 30, 2023. All common shares acquired pursuant to the ASPP were cancelled.
During the six months ended June 30, 2023, the Company purchased and cancelled a total of 6,112,900 common shares, including those purchased under the ASPP, at an average price of $11.62 per common share, for a total cost of $71 million.
Tent Mountain Pumped Hydro Development Project
On April 24, 2023, the Company acquired a 50 per cent interest in the Tent Mountain Renewable Energy Complex (“Tent Mountain”), an early-stage 320 MW pumped hydro energy storage development project, located in southwest Alberta, from Montem Resources Limited (“Montem”). The acquisition includes the land rights, fixed assets and intellectual property associated with the pumped hydro development project. The Company paid Montem approximately $8 million on closing of the transaction and additional contingent payments of up to $17 million (approximately $25 million total) may become payable to Montem based on the achievement of specific development and commercial milestones. The Company and Montem own the Tent Mountain project within a special purpose partnership that is jointly managed, with the Company acting as project developer. The partnership is actively seeking an offtake agreement for the energy and environmental attributes generated by the facility.
Refer to the audited annual 2022 consolidated financial statements within our 2022 Annual Integrated Report and our unaudited interim condensed consolidated financial statements for the three and six months ended June 30, 2023, for significant events impacting both prior and current year results.
MANAGEMENT'S DISCUSSION AND ANALYSIS
Segmented Financial Performance and Operating Results
Segmented information is prepared on the same basis that the Company manages its business, evaluates financial results and makes key operating decisions.
The following table reflects the generation and summary financial information on a consolidated basis for each of our segments:
|
|
|
|
|
|
|
|
|
|
|
|
|
|
|
|
|
|
|
|
|
|
|
|
|
LTA generation (GWh)(1) |
Actual production (GWh)(2) |
Adjusted EBITDA(3) |
| 3 months ended June 30 |
2023 |
2022 |
|
2023 |
2022 |
|
2023 |
2022 |
|
| Hydro |
593 |
|
596 |
|
|
616 |
|
533 |
|
|
147 |
|
88 |
|
|
| Wind and Solar |
1,097 |
|
1,121 |
|
|
859 |
|
1,072 |
|
|
50 |
|
88 |
|
|
| Renewables |
1,690 |
|
1,717 |
|
|
1,475 |
|
1,605 |
|
|
197 |
|
176 |
|
|
| Gas |
|
|
|
2,515 |
|
2,566 |
|
|
166 |
|
65 |
|
|
| Energy Transition |
|
|
|
606 |
|
290 |
|
|
13 |
|
11 |
|
|
| Energy Marketing |
|
|
|
|
|
|
43 |
|
50 |
|
|
| Corporate |
|
|
|
|
|
|
(32) |
|
(23) |
|
|
| Total |
|
|
|
4,596 |
|
4,461 |
|
|
387 |
|
279 |
|
|
| Earnings (loss) before income taxes |
|
|
|
|
|
|
79 |
|
(22) |
|
|
|
|
|
|
|
|
|
|
|
|
|
|
|
|
|
|
|
|
|
|
|
|
|
|
|
LTA generation (GWh)(1) |
Actual production (GWh)(2) |
Adjusted EBITDA(3) |
| 6 months ended June 30 |
2023 |
2022 |
|
2023 |
2022 |
|
2023 |
2022 |
|
| Hydro |
995 |
|
1,004 |
|
|
922 |
|
905 |
|
|
253 |
|
149 |
|
|
| Wind and Solar |
2,520 |
|
2,574 |
|
|
2,056 |
|
2,341 |
|
|
138 |
|
177 |
|
|
| Renewables |
3,515 |
|
3,578 |
|
|
2,978 |
|
3,246 |
|
|
391 |
|
326 |
|
|
| Gas |
|
|
|
5,687 |
|
5,231 |
|
|
406 |
|
170 |
|
|
| Energy Transition |
|
|
|
1,903 |
|
1,343 |
|
|
67 |
|
16 |
|
|
| Energy Marketing |
|
|
|
|
|
|
82 |
|
67 |
|
|
| Corporate |
|
|
|
|
|
|
(56) |
|
(41) |
|
|
| Total |
|
|
|
10,568 |
|
9,820 |
|
|
890 |
|
538 |
|
|
| Earnings before income taxes |
|
|
|
|
|
|
462 |
|
220 |
|
|
(1) Long-term average production ("LTA Generation (GWh)") is calculated based on our portfolio as at June 30, 2023, on an annualized basis from the average annual energy yield predicted from our simulation model based on historical resource data performed over a period of typically greater than 25 years. LTA Generation (GWh) for Energy Transition is not considered as we are currently transitioning these units with the expectation that they will retire by the end of 2025 and the LTA Generation (GWh) for Gas is not considered as it is largely dependent on market conditions and merchant demand. Wind and Solar LTA Generation (GWh) for the three and six months ended June 30, 2023, excluding the Kent Hills 1 and 2 wind facilities which are currently not in operation, is approximately 1,009 GWh and 2,326 GWh.
(2) Actual production levels are compared against the long-term average to highlight the impact of an important factor that affects the variability in our business results. In the short-term, for each of the Hydro and Wind and Solar segments, the conditions will vary from one period to the next and over time facilities will continue to produce in line with their long-term averages, which has proven to be a reliable indicator of performance.
(3) This item is not defined and has no standardized meaning under IFRS. Refer to the Additional IFRS Measures and Non-IFRS Measures section of this MD&A.
TransAlta Corporation M10
MANAGEMENT'S DISCUSSION AND ANALYSIS
Hydro
|
|
|
|
|
|
|
|
|
|
|
|
|
|
|
|
3 months ended June 30 |
6 months ended June 30 |
|
2023 |
2022 |
2023 |
2022 |
Gross installed capacity (MW)(1) |
922 |
|
925 |
|
922 |
|
925 |
LTA (GWh)(2) |
593 |
|
596 |
|
995 |
|
1,004 |
|
| Availability (%) |
94.8 |
|
95.5 |
|
94.4 |
|
96.1 |
|
|
|
|
|
|
| Production |
|
|
|
|
| Contract production (GWh) |
119 |
|
127 |
|
142 |
|
163 |
|
| Merchant production (GWh) |
497 |
|
406 |
|
780 |
|
742 |
|
| Total energy production (GWh) |
616 |
|
533 |
|
922 |
|
905 |
|
Ancillary service volumes (GWh)(3) |
570 |
|
785 |
|
1,213 |
|
1,527 |
|
Alberta Hydro Assets revenues(4)(5) |
95 |
|
53 |
|
166 |
|
89 |
|
Other Hydro Assets and other revenues(4)(6) |
18 |
|
15 |
|
24 |
|
22 |
|
Alberta Hydro ancillary services revenues(3) |
53 |
|
37 |
|
92 |
|
70 |
|
|
|
|
|
|
| Environmental attribute revenues |
1 |
|
— |
|
9 |
|
1 |
|
|
|
|
|
|
|
|
|
|
|
Revenues(7) |
167 |
|
105 |
|
291 |
|
182 |
|
| Fuel and purchased power |
5 |
|
6 |
|
10 |
|
10 |
|
Gross margin(8) |
162 |
|
99 |
|
281 |
|
172 |
|
| OM&A |
14 |
|
10 |
|
26 |
|
21 |
|
| Taxes, other than income taxes |
1 |
|
1 |
|
2 |
|
2 |
|
Adjusted EBITDA(8) |
147 |
|
88 |
|
253 |
|
149 |
|
|
|
|
|
|
| Supplemental Information: |
|
|
|
|
| Gross revenues per MWh |
|
|
|
|
Alberta Hydro Assets energy ($/MWh)(4)(5) |
201 |
131 |
222 |
121 |
Alberta Hydro Assets ancillary ($/MWh)(3) |
94 |
47 |
76 |
46 |
|
|
|
|
|
| Sustaining capital |
8 |
|
6 |
|
14 |
|
12 |
|
(1) In the fourth quarter of 2022, the Company closed the sale of two Hydro assets resulting in a reduction in capacity of 3 MW.
(2) 2022 LTA revised for consistency with calculation methodology used in 2023.
(3) Ancillary services as described in the AESO Consolidated Authoritative Document Glossary.
(4) Alberta Hydro Assets include 13 hydro facilities on the Bow and North Saskatchewan river systems. Other Hydro assets includes our hydro facilities in BC and Ontario, hydro facilities in Alberta (other than the Alberta Hydro Assets) and transmission revenues.
(5) The Company entered into forward hedges for the first quarter of 2023 that are included in the Alberta Hydro Asset revenues.
(6) Other revenue includes revenues from our transmission business and other contractual arrangements, including the flood mitigation agreement with the Government of Alberta and black start services.
(7) For details of the adjustments to revenues included in adjusted EBITDA refer to the Additional IFRS and Non-IFRS Measures section of this MD&A.
(8) Adjusted EBITDA and gross margin are not defined and have no standardized meaning under IFRS. Refer to the Additional IFRS and Non-IFRS Measures section of this MD&A.
Availability for the three and six months ended June 30, 2023, decreased compared to the same periods in 2022, primarily due to planned outages at our Alberta Hydro Assets.
Production for the three and six months ended June 30, 2023, increased by 83 GWh and 17 GWh, respectively, compared to the same periods in 2022 from higher water resources partially offset by lower availability. In addition, in the six months ended June 30, 2023 production was negatively impacted by icing constraints at our Alberta Hydro Assets compared to the same period in 2022.
Ancillary services volumes for the three and six months ended June 30, 2023, decreased by 215 GWh and 314 GWh, respectively, compared to the same periods in 2022, due to the AESO procuring lower volumes of ancillary services given its decision to reduce the cumulative volume of imports into Alberta via the British Columbia and Montana transmission interconnections and the Company managing higher energy output due to the timing of runoff and precipitation.
TransAlta Corporation M11
MANAGEMENT'S DISCUSSION AND ANALYSIS
Given the flexibility of our portfolio, we were able to partially offset this impact by shifting these ancillary volumes to the Gas segment.
Adjusted EBITDA for the three and six months ended June 30, 2023, increased by $59 million and $104 million, respectively, compared to the same periods in 2022, primarily due to higher realized energy and ancillary service prices in the Alberta market and higher production. The three months ended June 30, 2023, further benefited from higher energy production, partially offset by lower revenues from lower ancillary service volumes. The six months ended June 30, 2023, benefited from higher sales of environmental attributes and the Company captured revenue through forward hedging for the Alberta Hydro Assets and realized gains from the hedging strategy. OM&A in both periods increased primarily due to higher insurance costs, salary escalations and incentive accruals, and higher legal fees. For further discussion on the Alberta market conditions and pricing, refer to the Alberta Electricity Portfolio section of this MD&A.
Sustaining capital expenditures for the three and six months ended June 30, 2023, were higher by $2 million compared to the same periods in 2022 due to higher planned dam safety costs.
Wind and Solar
|
|
|
|
|
|
|
|
|
|
|
|
|
|
|
|
|
3 months ended June 30 |
6 months ended June 30 |
|
|
2023 |
2022 |
2023 |
2022 |
|
Gross installed capacity (MW)(1) |
1,906 |
|
1,906 |
|
1,906 |
|
1,906 |
|
| LTA (GWh) |
1,097 |
|
1,121 |
|
2,520 |
|
2,574 |
|
| Availability (%) |
87.1 |
|
85.7 |
|
85.0 |
|
82.2 |
|
|
|
|
|
|
|
| Contract production (GWh) |
631 |
|
802 |
|
1,502 |
|
1,711 |
|
|
| Merchant production (GWh) |
228 |
|
270 |
|
554 |
|
630 |
|
|
| Total production (GWh) |
859 |
|
1,072 |
|
2,056 |
|
2,341 |
|
|
| Wind and Solar revenues |
71 |
|
88 |
|
173 |
|
189 |
|
|
| Environmental attribute revenues |
7 |
|
23 |
|
20 |
|
30 |
|
|
Revenues(2) |
78 |
|
111 |
|
193 |
|
219 |
|
|
| Fuel and purchased power |
7 |
|
6 |
|
16 |
|
14 |
|
|
| Carbon compliance |
— |
|
1 |
|
— |
|
1 |
|
|
Gross margin(3) |
71 |
|
104 |
|
177 |
|
204 |
|
|
| OM&A |
18 |
|
15 |
|
35 |
|
31 |
|
|
| Taxes, other than income taxes |
4 |
|
4 |
|
7 |
|
6 |
|
|
Net other operating income(2) |
(1) |
|
(3) |
|
(3) |
|
(10) |
|
|
Adjusted EBITDA(3) |
50 |
|
88 |
|
138 |
|
177 |
|
|
|
|
|
|
|
|
| Supplemental information: |
|
|
|
|
|
| Sustaining capital |
3 |
|
3 |
|
6 |
|
7 |
|
|
Kent Hills wind rehabilitation expenditures(4) |
21 |
|
10 |
|
42 |
|
10 |
|
|
| Insurance proceeds - Kent Hills |
— |
|
(7) |
|
(1) |
|
(7) |
|
|
(1) Gross installed capacity and availability as at June 30, 2023 do not include the 130 MW Garden Plain wind project.
(2) For details of the adjustments to revenues and net other operating income included in adjusted EBITDA refer to the Additional IFRS Measures and Non-IFRS Measures section of this MD&A.
(3) Adjusted EBITDA and gross margin are not defined and have no standardized meaning under IFRS. Refer to the Additional IFRS and Non-IFRS Measures section of this MD&A.
(4) The Kent Hills wind facilities rehabilitation capital expenditures are segregated from the sustaining capital expenditures due to the extraordinary nature of the expenditures and have been reflected separately.
Availability for the three and six months ended June 30, 2023, increased compared to the same periods in 2022, primarily as a result of improved performance at the Windrise wind facility. The six months ended June 30, 2023, was unfavourably impacted by an extended forced outage at the Windrise facility in the first quarter of 2023 caused by a manufacturing defect on a transformer bushing that has since been repaired under warranty and resolved. Availability for both the three and six months ended June 30, 2023, has been impacted by the Kent Hills rehabilitation project which is expected to fully return to service in the second half of 2023.
TransAlta Corporation M12
MANAGEMENT'S DISCUSSION AND ANALYSIS
Availability adjusted for the Kent Hills extended outage for the three and six months ended June 30, 2023, was 98.4 per cent and 94.7 per cent, respectively, and 94.0 per cent and 93.3 per cent for the same periods in 2022.
Production for the three and six months ended June 30, 2023, decreased by 213 GWh and 285 GWh, respectively, compared to the same periods in 2022, primarily due to lower wind and solar resources in all regions, partially offset by pre-commissioning production from the Garden Plain wind project.
Adjusted EBITDA for the three and six months ended June 30, 2023, decreased by $38 million and $39 million, respectively, compared to the same periods in 2022, primarily due to lower production due to lower wind resource, lower environmental attribute revenue, lower realized merchant prices in Alberta in the second quarter, and lower liquidated damages recognized at the Windrise wind facility. During the six months ended June 30, 2023, lower adjusted EBITDA was partially offset by higher realized merchant prices in Alberta. OM&A in both periods increased due to salary escalations, higher insurance costs and long-term service agreement escalations.
Sustaining capital expenditures for the three and six months ended June 30, 2023, were consistent compared to the same periods in 2022.
Gas
|
|
|
|
|
|
|
|
|
|
|
|
|
|
|
|
|
3 months ended June 30 |
6 months ended June 30 |
|
|
2023 |
2022 |
2023 |
2022 |
|
| Gross installed capacity (MW) |
3,084 |
|
3,084 |
|
3,084 |
|
3,084 |
|
|
| Availability (%) |
85.8 |
|
93.9 |
|
91.1 |
|
93.9 |
|
|
| Contract production (GWh) |
905 |
|
831 |
|
1,908 |
|
1,771 |
|
|
| Merchant production (GWh) |
1,649 |
|
1,746 |
|
3,898 |
|
3,486 |
|
|
| Purchased power (GWh) |
(39) |
|
(11) |
|
(119) |
|
(26) |
|
|
| Total production (GWh) |
2,515 |
|
2,566 |
|
5,687 |
|
5,231 |
|
|
Revenues(1) |
320 |
|
262 |
|
755 |
|
553 |
|
|
Fuel and purchased power(1) |
84 |
|
146 |
|
213 |
|
276 |
|
|
| Carbon compliance |
25 |
|
12 |
|
57 |
|
30 |
|
|
Gross margin(2) |
211 |
|
104 |
|
485 |
|
247 |
|
|
| OM&A |
50 |
|
45 |
|
91 |
|
89 |
|
|
| Taxes, other than income taxes |
4 |
|
4 |
|
8 |
|
8 |
|
|
| Net other operating income |
(9) |
|
(10) |
|
(20) |
|
(20) |
|
|
Adjusted EBITDA(2) |
166 |
|
65 |
|
406 |
|
170 |
|
|
|
|
|
|
|
|
| Supplemental information: |
|
|
|
|
|
| Sustaining capital: |
14 |
|
3 |
|
17 |
|
8 |
|
|
(1) For details of the adjustments to revenues and fuel and purchased power included in adjusted EBITDA, refer to the Additional IFRS Measures and Non-IFRS Measures section of this MD&A.
(2) Adjusted EBITDA and gross margin are not defined and have no standardized meaning under IFRS. Refer to the Additional IFRS Measures and Non-IFRS Measures section of this MD&A.
Availability for the three and six months ended June 30, 2023, decreased by 8.1 per cent and 2.8 per cent, respectively, compared to the same periods in 2022, primarily due to higher planned outages at Sheerness Unit 1 and Keephills Unit 3, and derates at Sundance Unit 6 in the second quarter. For the six months ended June 30, 2023, the Company experienced lower unplanned outages than the same period in the prior year.
Production for the three months ended June 30, 2023 decreased by 51 GWh compared to the same period in 2022, due to lower availability, partially offset by higher contract production in Ontario. Production for the six months ended June 30, 2023, increased by 456 GWh compared to the same period in 2022, mainly due to stronger market conditions for our Alberta merchant gas assets and higher contract production in Ontario, partially offset by lower merchant production in Ontario due to weaker market conditions.
Adjusted EBITDA for the three and six months ended June 30, 2023, increased by $101 million and $236 million, respectively, compared to the same periods in 2022, mainly due to higher realized energy prices for our Alberta gas merchant assets, net of hedging, and lower natural gas prices, partially offset by higher carbon compliance costs and higher OM&A from higher contract labour related to planned major maintenance in Australia.
TransAlta Corporation M13
MANAGEMENT'S DISCUSSION AND ANALYSIS
The six months ended June 30, 2023, benefited from higher production due to stronger market conditions in Alberta partially offset by higher carbon costs and fuel usage related to production.
Sustaining capital expenditures for the three and six months ended June 30, 2023, increased by $11 million and $9 million, respectively, compared to the same periods in 2022, mainly due to planned major maintenance costs at the gas facilities.
Energy Transition
|
|
|
|
|
|
|
|
|
|
|
|
|
|
|
|
|
3 months ended June 30 |
6 months ended June 30 |
|
|
2023 |
2022 |
2023 |
2022 |
|
| Gross installed capacity (MW) |
671 |
|
671 |
|
671 |
|
671 |
|
|
| Availability (%) |
58.8 |
|
45.2 |
|
76.6 |
|
68.4 |
|
|
Adjusted availability (%)(1) |
58.8 |
|
52.7 |
|
76.6 |
|
71.9 |
|
|
| Contract sales volume (GWh) |
830 |
|
830 |
|
1,650 |
|
1,650 |
|
|
| Merchant sales volume (GWh) |
656 |
|
328 |
|
1,999 |
|
1,529 |
|
|
| Purchased power (GWh) |
(880) |
|
(868) |
|
(1,746) |
|
(1,836) |
|
|
| Total production (GWh) |
606 |
|
290 |
|
1,903 |
|
1,343 |
|
|
Revenues(2) |
118 |
|
96 |
|
371 |
|
213 |
|
|
| Fuel and purchased power |
90 |
|
71 |
|
271 |
|
165 |
|
|
| Carbon compliance |
— |
|
(4) |
|
— |
|
(3) |
|
|
Gross margin(3) |
28 |
|
29 |
|
100 |
|
51 |
|
|
| OM&A |
14 |
|
17 |
|
31 |
|
33 |
|
|
| Taxes, other than income taxes |
1 |
|
1 |
|
2 |
|
2 |
|
|
|
|
|
|
|
|
Adjusted EBITDA(3) |
13 |
|
11 |
|
67 |
|
16 |
|
|
|
|
|
|
|
|
| Supplemental information: |
|
|
|
|
|
| Highvale mine reclamation spend |
4 |
|
3 |
|
6 |
|
5 |
|
| Centralia mine reclamation spend |
4 |
|
3 |
|
7 |
|
7 |
|
|
|
|
|
|
|
| Sustaining capital |
11 |
|
16 |
|
11 |
|
16 |
|
|
(1) Adjusted for dispatch optimization.
(2) For details of the adjustments to revenues included in adjusted EBITDA refer to the Additional IFRS Measures and Non-IFRS Measures section of this MD&A.
(3) Adjusted EBITDA and gross margin are not defined and have no standardized meaning under IFRS. Refer to the Additional IFRS Measures and Non-IFRS Measures section of this MD&A.
Adjusted availability for the three and six months ended June 30, 2023, increased compared with the same periods in 2022 due to lower planned outages at Centralia Unit 2 in the second quarter of 2023 and lower unplanned outages in the six months ended June 30, 2023.
Production increased by 316 GWh and 560 GWh, respectively, for the three and six months ended June 30, 2023, compared to the same periods in 2022, primarily due to higher dispatch related to merchant pricing and higher availability at Centralia Unit 2.
Adjusted EBITDA increased by $2 million and $51 million, respectively, for the three and six months ended June 30, 2023, compared to the same periods in 2022, primarily due to higher merchant pricing and higher production, partially offset by higher fuel usage. During the six months ended June 30, 2023, adjusted EBITDA was negatively impacted by higher purchased power costs required to fulfill contractual obligations during planned outages. OM&A decreased due to the retirement of Sundance Unit 4 in the first quarter of 2022.
Mine reclamation spending for the Highvale and Centralia mines was consistent with 2022.
Sustaining capital expenditures for the three and six months ended June 30, 2023, decreased by $5 million, respectively, compared to the same periods in 2022, due to a reduction in planned major maintenance.
TransAlta Corporation M14
MANAGEMENT'S DISCUSSION AND ANALYSIS
Energy Marketing
|
|
|
|
|
|
|
|
|
|
|
|
|
|
|
|
|
3 months ended June 30 |
6 months ended June 30 |
|
|
2023 |
2022 |
2023 |
2022 |
|
Revenues(1) |
49 |
|
57 |
|
102 |
|
81 |
|
|
| OM&A |
6 |
|
7 |
|
20 |
|
14 |
|
|
Adjusted EBITDA(2) |
43 |
|
50 |
|
82 |
|
67 |
|
|
(1) For details of the adjustments to revenues included in adjusted EBITDA, refer to the Additional IFRS Measures and Non-IFRS Measures section of this MD&A. Adjusted EBITDA is not defined and has no standardized meaning under IFRS.
(2) Adjusted EBITDA is not defined and has no standardized meaning under IFRS. Refer to the Additional IFRS Measures and Non-IFRS Measures section of this MD&A.
Adjusted EBITDA for the three and six months ended June 30, 2023, decreased by $7 million and increased by $15 million, respectively, compared to the same periods in 2022. Year-to-date results exceeded segment expectations from short-term trading of both physical and financial power and gas products across all North American deregulated markets. The Company was able to capitalize on short-term volatility in the trading markets while maintaining the overall risk profile of the business unit.
Corporate
|
|
|
|
|
|
|
|
|
|
|
|
|
|
|
|
|
3 months ended June 30 |
6 months ended June 30 |
|
|
2023 |
2022 |
2023 |
2022 |
|
| OM&A |
32 |
|
23 |
|
56 |
|
41 |
|
|
|
|
|
|
|
|
Adjusted EBITDA(1) |
(32) |
|
(23) |
|
(56) |
|
(41) |
|
|
|
|
|
|
|
|
|
|
|
|
|
|
|
|
|
|
|
|
|
|
|
|
|
|
|
|
|
|
|
|
|
|
|
|
|
|
|
|
|
|
|
|
| Supplemental information: |
|
|
|
|
|
| Sustaining capital: |
8 |
|
3 |
|
16 |
|
5 |
|
(1) Adjusted EBITDA is not defined and has no standardized meaning under IFRS. Refer to the Additional IFRS Measures and Non-IFRS Measures section of this MD&A.
Adjusted EBITDA for the three and six months ended June 30, 2023, decreased by $9 million and $15 million, respectively, compared to the same periods in 2022, primarily due to higher incentive accruals reflecting the Company's performance, increased spending to support strategic and growth initiatives and increased costs due to inflationary pressures.
For the three and six months ended June 30, 2023, sustaining capital expenditures increased by $5 million and $11 million, respectively, compared to the same periods in 2022, mainly due to higher spend on leasehold improvements and information technology associated with the relocation of the Company's head office.
TransAlta Corporation M15
MANAGEMENT'S DISCUSSION AND ANALYSIS
Performance by Segment with Supplemental Geographical Information
The following table provides adjusted EBITDA performance of our facilities across the regions we operate in:
|
|
|
|
|
|
|
|
|
|
|
|
|
|
|
|
|
|
|
|
|
|
|
|
|
| 3 months ended June 30, 2023 |
|
Hydro |
Wind and Solar |
Gas |
Energy Transition |
Energy Marketing |
Corporate |
Total |
| Alberta |
|
144 |
|
12 |
|
109 |
|
(2) |
|
43 |
|
(32) |
|
274 |
|
| Canada, excluding Alberta |
|
3 |
|
20 |
|
21 |
|
— |
|
— |
|
— |
|
44 |
|
| US |
|
— |
|
18 |
|
2 |
|
15 |
|
— |
|
— |
|
35 |
|
| Australia |
|
— |
|
— |
|
34 |
|
— |
|
— |
|
— |
|
34 |
|
Adjusted EBITDA(1) |
|
147 |
|
50 |
|
166 |
|
13 |
|
43 |
|
(32) |
|
387 |
|
| Earnings before income taxes |
|
|
|
|
|
|
|
79 |
|
|
|
|
|
|
|
|
|
|
| 3 months ended June 30, 2022 |
|
Hydro |
Wind and Solar |
Gas |
Energy Transition |
Energy Marketing(3) |
Corporate |
Total |
| Alberta |
|
82 |
|
41 |
|
8 |
|
(3) |
|
50 |
|
(23) |
|
155 |
|
| Canada, excluding Alberta |
|
6 |
|
22 |
|
21 |
|
— |
|
— |
|
— |
|
49 |
|
| US |
|
— |
|
25 |
|
2 |
|
14 |
|
— |
|
— |
|
41 |
|
| Australia |
|
— |
|
— |
|
34 |
|
— |
|
— |
|
— |
|
34 |
|
Adjusted EBITDA(1) |
|
88 |
|
88 |
|
65 |
|
11 |
|
50 |
|
(23) |
|
279 |
|
| Loss before income taxes |
|
|
|
|
|
|
|
(22) |
|
|
|
|
|
|
|
|
|
|
| 6 months ended June 30, 2023 |
|
Hydro |
Wind and Solar |
Gas |
Energy Transition |
Energy Marketing |
Corporate |
Total |
| Alberta |
|
250 |
|
43 |
|
287 |
|
(4) |
|
82 |
|
(56) |
|
602 |
|
| Canada, excluding Alberta |
|
3 |
|
50 |
|
46 |
|
— |
|
— |
|
— |
|
99 |
|
| US |
|
— |
|
45 |
|
4 |
|
71 |
|
— |
|
— |
|
120 |
|
| Australia |
|
— |
|
— |
|
69 |
|
— |
|
— |
|
— |
|
69 |
|
Adjusted EBITDA(1) |
|
253 |
|
138 |
|
406 |
|
67 |
|
82 |
|
(56) |
|
890 |
|
| Earnings before income taxes |
|
|
|
|
|
|
|
462 |
|
|
|
|
|
|
|
|
|
|
| 6 months ended June 30, 2022 |
|
Hydro |
Wind and Solar |
Gas |
Energy Transition(2) |
Energy Marketing(3) |
Corporate |
Total |
| Alberta |
|
143 |
|
71 |
|
55 |
|
(6) |
|
67 |
|
(41) |
|
289 |
|
| Canada, excluding Alberta |
|
6 |
|
56 |
|
43 |
|
— |
|
— |
|
— |
|
105 |
|
| US |
|
— |
|
50 |
|
4 |
|
22 |
|
— |
|
— |
|
76 |
|
| Australia |
|
— |
|
— |
|
68 |
|
— |
|
— |
|
— |
|
68 |
|
Adjusted EBITDA(1) |
|
149 |
|
177 |
|
170 |
|
16 |
|
67 |
|
(41) |
|
538 |
|
| Earnings before income taxes |
|
|
|
|
|
|
|
220 |
|
(1) Adjusted EBITDA is not defined and has no standardized meaning under IFRS. Presenting this from period to period provides management and investors with the ability to evaluate earnings (loss) trends more readily in comparison with prior periods’ results. Refer to the Segmented Financial Performance and Operating Results section of this MD&A for further discussion of these items, including, where applicable, reconciliations to measures calculated in accordance with IFRS. Also, refer to the Additional IFRS Measures and Non-IFRS Measures section of this MD&A.
(2) The Sundance Unit 4 was retired March 31, 2022.
(3) The adjusted EBITDA for the Energy Marketing segment was reclassified to the Alberta region to reflect where the operations reside.
TransAlta Corporation M16
MANAGEMENT'S DISCUSSION AND ANALYSIS
Alberta Electricity Portfolio
Generating capacity in Alberta is subject to market forces, rather than rate regulation. Power from commercial generation is cleared through a wholesale electricity market. Power is dispatched in accordance with an economic merit order administered by the Alberta Electric System Operator ("AESO"), based upon offers by generators to sell power in the real-time energy-only market. Our merchant Alberta fleet operates under this framework and we internally manage our offers to sell power.
Approximately 52 per cent of our gross installed capacity is located in Alberta. Our portfolio of merchant assets in Alberta consists of hydro facilities, wind facilities, a battery storage facility, cogeneration facilities and converted natural-gas-fired thermal facilities. Some of the wind and gas facilities within the Alberta electricity portfolio operate on long-term contracts. Optimization of portfolio performance is driven by the diversity of fuel types, which enables portfolio management and allows for maximization of operating margins. It also provides us with capacity that can be monetized as ancillary services or dispatched into the energy market during times of supply tightness. A portion of the installed generation capacity in the portfolio has been hedged to provide cash flow certainty.
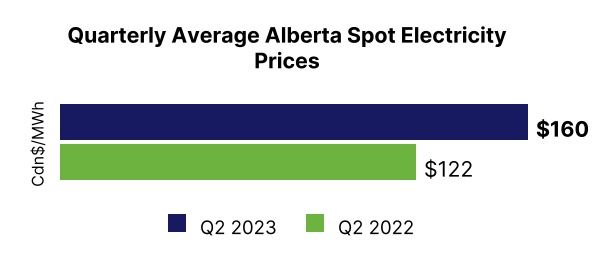
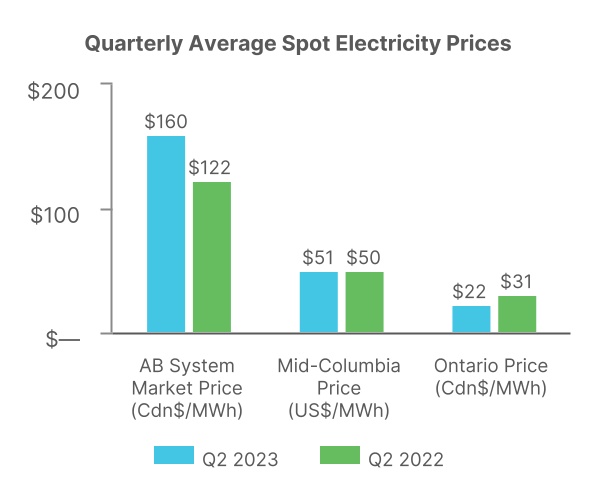
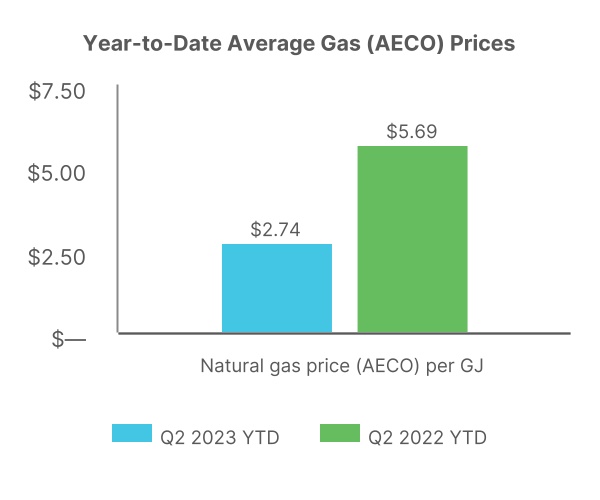
Alberta power prices for the second quarter of 2023 were higher compared to same period in 2022 as a result of lower volumes of power imported from adjacent markets, and higher prices during periods of overlapping outages and low renewable generation. Due to higher industrial outages compared to the prior year, demand decreased approximately 0.6 per cent compared to the same period in 2022.
On balance, the average pool price increased as a result of these factors from $122 per MWh in 2022 to $160 per MWh in 2023.
|
|
|
|
|
|
|
|
|
|
|
|
|
|
|
|
|
|
|
|
|
|
|
|
|
|
|
|
|
|
|
|
|
|
|
|
|
|
|
|
2023 |
2022 |
|
|
| 3 months ended June 30 |
Hydro |
Wind & Solar |
Gas |
Energy Transition |
Total |
Hydro |
Wind & Solar |
Gas |
Energy Transition |
Total |
|
|
|
|
|
|
| Total production (GWh) |
497 |
|
337 |
|
1,691 |
|
— |
|
2,525 |
|
406 |
|
450 |
|
1,826 |
|
— |
|
2,682 |
|
|
|
|
|
|
|
| Contract production (GWh) |
— |
|
110 |
|
137 |
|
— |
|
247 |
|
— |
|
180 |
|
125 |
|
— |
|
305 |
|
|
|
|
|
|
|
| Merchant production (GWh) |
497 |
|
227 |
|
1,554 |
|
— |
|
2,278 |
|
406 |
|
270 |
|
1,701 |
|
— |
|
2,377 |
|
|
|
|
|
|
|
Revenues(1) |
160 |
|
26 |
|
212 |
|
— |
|
398 |
|
96 |
|
49 |
|
134 |
|
2 |
|
281 |
|
|
|
|
|
|
|
| Fuel and purchased power |
5 |
|
4 |
|
65 |
|
— |
|
74 |
|
4 |
|
4 |
|
99 |
|
1 |
|
108 |
|
|
|
|
|
|
|
| Carbon compliance |
— |
|
— |
|
22 |
|
— |
|
22 |
|
— |
|
— |
|
9 |
|
(4) |
|
5 |
|
|
|
|
|
|
|
| Gross margin |
155 |
|
22 |
|
125 |
|
— |
|
302 |
|
92 |
|
45 |
|
26 |
|
5 |
|
168 |
|
|
|
|
|
|
|
|
|
|
|
|
|
|
|
|
|
|
|
|
|
|
|
|
|
2023 |
2022 |
|
|
|
|
|
|
| 6 months ended June 30 |
Hydro |
Wind & Solar |
Gas |
Energy Transition |
Total |
Hydro |
Wind & Solar |
Gas |
Energy Transition |
Total |
|
|
|
|
|
|
| Total production (GWh) |
780 |
|
840 |
|
4,060 |
|
— |
|
5,680 |
|
742 |
|
953 |
|
3,544 |
|
19 |
|
5,258 |
|
|
|
|
|
|
|
| Contract production (GWh) |
— |
|
286 |
|
287 |
|
— |
|
573 |
|
— |
|
322 |
|
258 |
|
— |
|
580 |
|
|
|
|
|
|
|
| Merchant production (GWh) |
780 |
|
554 |
|
3,773 |
|
— |
|
5,107 |
|
742 |
|
631 |
|
3,286 |
|
19 |
|
4,678 |
|
|
|
|
|
|
|
Revenues(1) |
281 |
|
70 |
|
537 |
|
2 |
|
890 |
|
170 |
|
84 |
|
298 |
|
7 |
|
559 |
|
|
|
|
|
|
|
| Fuel and purchased power |
9 |
|
11 |
|
168 |
|
— |
|
188 |
|
8 |
|
9 |
|
184 |
|
5 |
|
206 |
|
|
|
|
|
|
|
| Carbon compliance |
— |
|
— |
|
51 |
|
— |
|
51 |
|
— |
|
— |
|
24 |
|
(3) |
|
21 |
|
|
|
|
|
|
|
| Gross margin |
272 |
|
59 |
|
318 |
|
2 |
|
651 |
|
162 |
|
75 |
|
90 |
|
5 |
|
332 |
|
|
|
|
|
|
|
|
|
|
|
|
|
|
|
|
|
|
|
|
|
|
|
|
|
|
|
|
|
|
|
|
|
|
|
|
|
|
|
|
|
|
|
|
|
|
|
|
|
|
|
|
|
|
|
|
|
|
(1) Revenue has been adjusted to exclude the impact of unrealized mark-to-market gains or losses and realized gains and losses on closed exchange positions in order to depict revenue realized in the periods.
TransAlta Corporation M17
MANAGEMENT'S DISCUSSION AND ANALYSIS
For the three and six months ended June 30, 2023, the Alberta electricity portfolio generated 2,525 GWh and 5,680 GWh of energy, respectively. This was a decrease of 157 GWh and an increase of 422 GWh, respectively, compared to the same periods in 2022. Lower production in the three months ended June 30, 2023, was primarily due to lower wind resources and slightly lower merchant production from the Gas assets due to lower availability, partially offset by strong generation from the Hydro assets due to precipitation and snowpack melt. For the six months ended June 30, 2023, generation was higher overall due to increased merchant production in the Gas segment driven by market opportunities as well as higher production from the Hydro segment in the second quarter of 2023.
Gross margin for the three and six months ended June 30, 2023, was $302 million and $651 million, respectively, an increase of $134 million and $319 million, respectively, compared to the same periods in 2022. Higher gross margin was the result of higher merchant prices for our Gas segment, strong production and realized prices from the Hydro assets, as well as hedging contributions. The six months ended June 30, 2023, benefited from increased merchant production from our Gas assets.
The following table provides information for the Company's Alberta electricity portfolio:
|
|
|
|
|
|
|
|
|
|
|
|
|
|
|
|
3 months ended June 30 |
6 months ended June 30 |
|
2023 |
2022 |
2023 |
2022 |
| Spot power price average per MWh |
$160 |
|
$122 |
|
$151 |
|
$106 |
|
| Natural gas price (AECO) per GJ |
$2.39 |
|
$6.86 |
|
$2.74 |
|
$5.69 |
|
| Carbon compliance price per tonne |
$65 |
|
$50 |
|
$65 |
|
$50 |
|
|
|
|
|
|
Realized merchant power price per MWh(1) |
$175 |
|
$105 |
|
$174 |
|
$106 |
|
| Hydro energy spot power price per MWh |
$199 |
|
$131 |
|
$189 |
|
$121 |
|
| Hydro ancillary spot price per MWh |
$94 |
|
$47 |
|
$76 |
|
$46 |
|
| Wind energy spot power price per MWh |
$75 |
|
$96 |
|
$83 |
|
$75 |
|
| Gas and Energy Transition spot power price per MWh |
$202 |
|
$127 |
|
$175 |
|
$116 |
|
|
|
|
|
|
Hedged volume (GWh)(2) |
1,667 |
|
1,901 |
|
3,713 |
|
3,639 |
|
| Hedged power price average per MWh |
$91 |
|
$73 |
|
$116 |
|
$78 |
|
|
|
|
|
|
Fuel and purchased power per MWh(3) |
$33 |
|
$59 |
|
$46 |
|
$58 |
|
Carbon compliance cost per MWh(3) |
$10 |
|
$3 |
|
$13 |
|
$6 |
|
(1) Realized merchant power price for the Alberta electricity portfolio is the average price realized as a result of the Company's merchant power sales (excluding assets under long-term contract and ancillary revenues) and portfolio optimization activities divided by total merchant GWh produced.
(2) Hedge volumes are for production volumes primarily from the Gas segment.
(3) Fuel and purchased power per MWh and carbon compliance cost per MWh are calculated on production from carbon-emitting generation in the Gas and Energy Transition segments, and carbon compliance cost per MWh may include emission credits to settle a portion of our GHG carbon pricing obligations.
For the three and six months ended June 30, 2023, the realized merchant power price per MWh of production increased by $70 per MWh and $68 per MWh, respectively, compared with the same periods in 2022. Higher realized merchant power pricing for energy across the portfolio was due to higher market prices and optimization of our available capacity across all fuel types. The segment spot prices exclude gains and losses from hedging positions that are entered into in order to mitigate the impact of unfavourable market pricing.
For the three and six months ended June 30, 2023, the fuel and purchased power cost per MWh of production decreased by $26 per MWh and $12 per MWh, respectively, compared with the same periods in 2022 primarily due to lower natural gas prices.
For the three and six months ended June 30, 2023, carbon compliance costs per MWh of production increased by $7 per MWh, compared with the same periods in 2022, due to an increase in carbon compliance prices from $50 per tonne in 2022 to $65 per tonne in 2023. In 2023, the 2022 carbon compliance obligation was settled with cash. In 2022, the Company utilized emission credits to settle a portion of the 2021 carbon compliance obligation resulting in a lower carbon cost per MWh.
TransAlta Corporation M18
MANAGEMENT'S DISCUSSION AND ANALYSIS
Selected Quarterly Information
Our results are seasonal due to the nature of the electricity market and related fuel costs. Higher maintenance costs are often incurred in the spring and fall when electricity prices are expected to be lower; electricity prices generally increase in the peak winter and summer months in our main markets due to increased heating and cooling loads. Margins are also typically impacted in the second quarter due to the volume of hydro production resulting from spring runoff and rainfall in the Pacific Northwest, which impacts production at Centralia. Typically, hydroelectric facilities generate most of their electricity and revenues during the spring months when melting snow starts feeding watersheds and rivers. Inversely, wind speeds are historically greater during the cold winter months and lower in the warm summer months.
|
|
|
|
|
|
|
|
|
|
|
|
|
|
|
| |
Q3 2022 |
Q4 2022 |
Q1 2023 |
Q2 2023 |
|
|
|
|
|
| Revenues |
929 |
|
854 |
|
1,089 |
|
625 |
|
|
|
|
|
|
| Earnings before income taxes |
126 |
|
7 |
|
383 |
|
79 |
|
| Cash flow from operating activities |
204 |
|
351 |
|
462 |
|
11 |
|
|
|
|
|
|
|
|
|
|
|
| Net earnings (loss) attributable to common shareholders |
61 |
|
(163) |
|
294 |
|
62 |
|
|
Net earnings (loss) per share attributable to common shareholders,
basic and diluted(2)
|
0.23 |
|
(0.61) |
|
1.10 |
|
0.23 |
|
|
|
|
|
|
| |
Q3 2021 |
Q4 2021 |
Q1 2022 |
Q2 2022 |
|
|
|
|
|
| Revenues |
850 |
|
610 |
|
735 |
|
458 |
|
|
|
|
|
|
| Earnings (loss) before income taxes |
(441) |
|
(32) |
|
242 |
|
(22) |
|
Cash flow from (used in) operating activities(1) |
610 |
|
54 |
|
451 |
|
(129) |
|
|
|
|
|
|
|
|
|
|
|
| Net earnings (loss) attributable to common shareholders |
(456) |
|
(78) |
|
186 |
|
(80) |
|
|
Net earnings (loss) per share attributable to common shareholders,
basic and diluted(2)
|
(1.68) |
|
(0.29) |
|
0.69 |
|
(0.30) |
|
(1) The cash flow used in operating activities for the second quarter of 2022 was negative due to unfavourable changes in working capital mainly due to movements in our collateral accounts related to higher commodity prices and volatility in the markets.
(2) Basic and diluted earnings (loss) per share attributable to common shareholders is calculated in each period using the basic and diluted weighted average common shares outstanding during the period, respectively. As a result, the sum of the earnings (loss) per share for the four quarters making up the calendar year may sometimes differ from the annual earnings (loss) per share.
TransAlta Corporation M19
MANAGEMENT'S DISCUSSION AND ANALYSIS
Net earnings (loss) attributable to common shareholders over the prior eight quarters has also been impacted by the following variations and events:
•Higher revenues arising from higher overall availability during periods of peak pricing and higher power prices in Alberta in 2022 and 2023;
•Lower natural gas pricing in 2023 and higher natural gas pricing in 2022;
•Increased natural gas consumption in 2022 and 2023 for the units that were converted to gas in 2021;
•Lower carbon costs in 2022 related to our transition off coal and the utilization of emission credits to settle a portion of our GHG obligation in the second quarter of 2022. Higher carbon costs in the first and second quarters of 2023 due to higher carbon costs per tonne and, in the first quarter of 2023, higher production;
•The continued extended outage of the Kent Hills 1 and 2 wind facilities from the fourth quarter of 2021 through to the second quarter of 2023. The extended outage is expected to continue into the second half of 2023;
•The effects of asset impairment reversals recognized in the first and second quarters of 2023 and the effects of asset impairment charges and reversals during all periods shown;
•The effects of changes in decommissioning provisions for retired assets from changes in discount rates in 2023;
•The effects of changes in decommissioning provisions for retired assets from changes in estimated cash flows and discount rates in all other periods shown;
•Accelerated timing of decommissioning cash flows and changes in useful lives recognized in the third quarter of 2022;
•Insurance proceeds for the single tower failure at Kent Hills wind facilities of $7 million recognized in the second quarter of 2022;
•Liquidated damages recoverable from turbine availability being below the contractual target at the Windrise wind facility recorded in each quarter in 2022 and the first and second quarters of 2023;
•Keephills Unit 1 being retired in the fourth quarter of 2021 and Sundance Unit 4 being retired in the first quarter of 2022;
•The acquisition of North Carolina Solar facility in the fourth quarter of 2021;
•Commissioning of the Windrise wind facility in the fourth quarter of 2021;
•The suspension of the Sundance Unit 5 repowering project in the third quarter of 2021;
•The retirement of the Sundance Unit 5 in 2021;
•Gains relating to the sale of assets being recognized in the fourth quarter of 2022 and gains on the sale of Gas equipment in the third quarter of 2021;
•Accelerated plans to shut down the Highvale mine resulting in remaining future royalty payments being recognized as an onerous contract in the third quarter of 2021;
•Accelerated shutdown of the Highvale mine increasing mine depreciation included in the cost of coal. Coal inventory write-down incurred in the third quarter of 2021;
•Coal-related parts and materials inventory write-down incurred in the third quarter of 2021;
•Fluctuations in the Canadian dollar relative to the US dollar resulting in foreign exchange gains and losses on our US denominated long-term debt balances not designated as hedges; and
•Fluctuations in current and future tax expense with earnings before tax across the quarters. Future tax expense decreased from 2022 mainly due to an adjustment in the US to mitigate cash tax relating to the Base Erosion and Anti-Avoidance Tax ("BEAT").
TransAlta Corporation M20
MANAGEMENT'S DISCUSSION AND ANALYSIS
Financial Position
The following table highlights significant changes in the Consolidated Statements of Financial Position from Dec. 31, 2022, to June 30, 2023:
|
|
|
|
|
|
|
|
|
|
|
|
|
June 30, 2023 |
Dec. 31, 2022 |
Increase/(decrease) |
| Assets |
|
|
|
| Current assets |
|
|
|
| Cash and cash equivalents |
952 |
|
1,134 |
|
(182) |
|
|
|
|
|
| Trade and other receivables |
1,098 |
|
1,589 |
|
(491) |
|
| Risk management assets |
225 |
|
709 |
|
(484) |
|
| Inventory |
200 |
|
157 |
|
43 |
|
|
|
|
|
Other current assets(1) |
102 |
|
125 |
|
(23) |
|
| Total current assets |
2,577 |
|
3,714 |
|
(1,137) |
|
|
|
|
|
| Non-current assets |
|
|
|
| Risk management assets |
77 |
|
161 |
|
(84) |
|
| Property, plant and equipment, net |
5,669 |
|
5,556 |
|
113 |
|
|
|
|
|
Other non-current assets(2) |
1,259 |
|
1,310 |
|
(51) |
|
| Total non-current assets |
7,005 |
|
7,027 |
|
(22) |
|
| Total assets |
9,582 |
|
10,741 |
|
(1,159) |
|
|
|
|
|
| Liabilities |
|
|
|
| Current liabilities |
|
|
|
| Accounts payable and accrued liabilities |
661 |
|
1,346 |
|
(685) |
|
| Risk management liabilities |
627 |
|
1,129 |
|
(502) |
|
| Income taxes payable |
17 |
|
73 |
|
(56) |
|
| Credit facilities, long-term debt and lease liabilities |
132 |
|
178 |
|
(46) |
|
Other current liabilities(3) |
113 |
|
162 |
|
(49) |
|
| Total current liabilities |
1,550 |
|
2,888 |
|
(1,338) |
|
|
|
|
|
| Non-current liabilities |
|
|
|
| Credit facilities, long-term debt and lease liabilities |
3,454 |
|
3,475 |
|
(21) |
|
|
|
|
|
| Risk management liabilities (long-term) |
237 |
|
333 |
|
(96) |
|
Other non-current liabilities(4) |
2,068 |
|
2,056 |
|
12 |
|
| Total non-current liabilities |
5,759 |
|
5,864 |
|
(105) |
|
| Total liabilities |
7,309 |
|
8,752 |
|
(1,443) |
|
|
|
|
|
| Equity |
|
|
|
| Equity attributable to shareholders |
1,475 |
|
1,110 |
|
365 |
|
| Non-controlling interests |
798 |
|
879 |
|
(81) |
|
| Total equity |
2,273 |
|
1,989 |
|
284 |
|
| Total liabilities and equity |
9,582 |
|
10,741 |
|
(1,159) |
|
(1) Includes restricted cash, prepaid expenses and assets held for sale.
(2) Includes investments, long-term portion of finance lease receivables, right-of-use assets, intangible assets, goodwill, deferred income tax assets and other assets.
(3) Includes bank overdraft, current portion of decommissioning and other provisions, current portion of contract liabilities and dividends payable.
(4) Includes exchangeable securities, long-term decommissioning and other provisions, deferred income tax liabilities, contract liabilities and defined benefit obligation and other long-term liabilities.
TransAlta Corporation M21
MANAGEMENT'S DISCUSSION AND ANALYSIS
Significant changes in TransAlta's unaudited interim condensed consolidated statements of financial position were as follows:
Working Capital
Current assets decreased by $1,137 million to $2,577 million as at June 30, 2023, from $3,714 million as at Dec. 31, 2022, primarily due to lower trade receivables related to collections from higher revenues recognized in the fourth quarter of 2022 and from lower receivables in the Energy Marketing segment. Risk management assets decreased due to lower market prices and contract settlements since year-end. Additionally, lower cash and cash equivalents resulted from higher spending on growth capital projects and the purchase of common shares under the NCIB. These decreases were partially offset by an increase in inventory due to the continued receipt of scheduled coal deliveries during a planned maintenance outage at Centralia Unit 2.
Current liabilities decreased by $1,338 million from $2,888 million as at Dec. 31, 2022, to $1,550 million as at June 30, 2023, mainly due to the payment of year-end accounts payable and accrued liabilities including the settlement of the 2022 GHG obligation, lower accruals and payables in the Energy Marketing segment, and lower income taxes payable. Current liabilities also decreased as the $46 million Pingston non-recourse bond matured and was paid out in May 2023. Additionally, collateral held and risk management liabilities decreased due to lower market prices as well as contract settlements since year-end. As at June 30, 2023, the Company held nil (Dec. 31, 2022 – $260 million) of cash collateral received related to derivative instruments in a net asset position.
The excess of current assets over current liabilities, including the current portion of long-term debt and lease liabilities, was $1,027 million as at June 30, 2023 (Dec. 31, 2022 – $826 million). Our working capital increased mainly due to lower accounts payable of $685 million and lower risk management liabilities of $502 million primarily from lower market prices and contract settlements. This was partially offset by lower trade and other receivables of $491 million due to collections from higher revenues recognized in the fourth quarter of 2022, lower receivables for the Energy Marketing segment, lower risk management assets of $484 million primarily from lower market prices and contract settlements, and by lower cash and cash equivalents.
Non-Current Assets
Non-current assets as at June 30, 2023, were $7,005 million, a decrease of $22 million from $7,027 million as at Dec. 31, 2022. Lower risk management assets resulted from changes in market pricing across multiple markets and contract settlements. This was partially offset by the increase in additions to property, plant and equipment ("PP&E") of $476 million mainly related to the construction of the Garden Plain wind project, the White Rock wind projects, the Horizon Hill wind project, the Northern Goldfields solar project, the Mount Keith 132kv transmission expansion, the Kent Hills rehabilitation costs, and other planned major maintenance. The increase to PP&E also includes revisions and additions to decommissioning and restoration costs of $11 million, and asset impairment reversals of $20 million, offset by depreciation of $339 million.
Non-Current Liabilities
Non-current liabilities as at June 30, 2023, were $5,759 million, a decrease of $105 million from $5,864 million as at Dec. 31, 2022, mainly due to lower risk management liabilities of $96 million due to contract settlements and pricing, a $21 million decrease in long-term debt and lease liabilities related to scheduled debt repayments of $64 million and a $54 million unfavourable foreign exchange impact, partially offset by higher drawings on the credit facilities of $87 million.
Total Equity
As at June 30, 2023, the increase in total equity of $284 million was due to net earnings of $431 million and gains on derivatives from cash flow hedges of $84 million, partially offset by distributions to non-controlling interests of $129 million, share repurchases under the NCIB of $71 million and dividends declared on common and preferred shares of $27 million.
TransAlta Corporation M22
MANAGEMENT'S DISCUSSION AND ANALYSIS
Financial Capital
The Company is focused on maintaining a strong balance sheet and financial position to ensure access to sufficient financial capital.
Capital Structure
Our capital structure consists of the following components as shown below:
|
|
|
|
|
|
|
|
|
|
|
|
|
|
|
|
|
|
June 30, 2023 |
Dec. 31, 2022 |
|
|
$ |
% |
$ |
% |
|
|
| TransAlta Corporation |
|
|
|
|
|
|
| Net senior unsecured debt |
|
|
|
|
|
|
Recourse debt - CAD debentures |
251 |
4 |
251 |
5 |
|
|
Recourse debt - US senior notes |
914 |
16 |
934 |
18 |
|
|
|
|
|
|
|
|
|
| Term Facility |
396 |
7 |
396 |
8 |
|
|
| Other |
— |
— |
1 |
— |
|
|
Less: cash and cash equivalents(1) |
(800) |
(14) |
(884) |
(17) |
|
|
Less: other cash and liquid assets(2) |
— |
— |
(20) |
— |
|
|
| Net senior unsecured debt |
761 |
13 |
678 |
14 |
|
|
|
|
|
|
|
|
|
| Other debt liabilities |
|
|
|
|
|
|
| Exchangeable debentures |
342 |
6 |
339 |
6 |
|
|
| Non-recourse debt |
|
|
|
|
|
|
TAPC Holdings LP bond |
90 |
2 |
94 |
2 |
|
|
| OCP Bond |
229 |
4 |
241 |
4 |
|
|
| Lease liabilities |
109 |
2 |
112 |
2 |
|
|
Total net debt(3) - TransAlta Corporation |
1,531 |
27 |
1,464 |
28 |
|
|
|
|
|
|
|
|
|
| TransAlta Renewables |
|
|
|
|
|
|
| Net TransAlta Renewables reported debt |
|
|
|
|
|
|
| Committed credit facility |
130 |
2 |
32 |
1 |
|
|
| Pingston bond |
— |
— |
45 |
1 |
|
|
| Melancthon Wolfe Wind bond |
185 |
3 |
202 |
4 |
|
|
| New Richmond Wind bond |
107 |
2 |
112 |
2 |
|
|
| Kent Hills Wind bond |
200 |
4 |
206 |
4 |
|
|
| Windrise Wind bond |
167 |
3 |
170 |
3 |
|
|
| Lease liabilities |
24 |
— |
23 |
— |
|
|
Less: cash and cash equivalents(4) |
(147) |
(3) |
(234) |
(4) |
|
|
|
|
|
|
|
|
|
| Debt on TransAlta Renewables Economic Investments |
|
|
|
|
|
|
US tax equity financing(5) |
114 |
2 |
123 |
2 |
|
|
South Hedland non-recourse debt(5) |
670 |
12 |
711 |
14 |
|
|
Total net debt(3) - TransAlta Renewables |
1,450 |
25 |
1,390 |
27 |
|
|
Total consolidated net debt(3)(6)(7) |
2,981 |
52 |
2,854 |
55 |
|
|
| Non-controlling interests |
798 |
14 |
879 |
17 |
|
|
Exchangeable preferred securities(7) |
400 |
7 |
400 |
7 |
|
|
| Equity attributable to shareholders |
|
|
|
|
|
|
| Common shares |
2,808 |
50 |
2,863 |
54 |
|
|
| Preferred shares |
942 |
17 |
942 |
18 |
|
|
| Contributed surplus, deficit and accumulated other comprehensive income |
(2,275) |
(40) |
(2,695) |
(51) |
|
|
| Total capital |
5,654 |
100 |
5,243 |
100 |
|
|
(1) Cash and cash equivalents is net of bank overdraft.
(2) Includes principal portion of the TransAlta OCP restricted cash related to the TransAlta OCP non-recourse bonds as this cash is restricted specifically to repay outstanding debt and also includes the fair value of economic and designated hedging instruments on debt, as the carrying value of the related debt is impacted by changes in foreign exchange rates.
(3) These items are not defined and have no standardized meaning under IFRS. Refer to the Additional IFRS Measures and Non-IFRS Measures section of this MD&A for further discussion, including, reconciliations to measures calculated in accordance with IFRS.
(4) Includes $98 million (AU$112 million) cash held within TransAlta Energy (Australia) Pty Ltd. reserved for future funding of Australia growth projects by TransAlta Renewables.
(5) TransAlta Renewables has an economic interest in the US entities, which includes the US tax equity financings of US$90 million (Dec. 31, 2022 - US$95 million) and an economic interest in the Australian entities, which includes the AU$774 million (Dec. 31, 2022 – AU$786 million) senior secured notes.
(6) The tax equity financing for the Skookumchuck wind facility, an equity accounted joint venture, is not represented in these amounts.
(7) The total consolidated net debt excludes the exchangeable preferred securities as they are considered equity with dividend payments for credit purposes.
TransAlta Corporation M23
MANAGEMENT'S DISCUSSION AND ANALYSIS
Between 2023 and 2025, we have $724 million of debt maturing, including $400 million of recourse debt relating to the Term Facility, with the balance mainly related to scheduled non-recourse debt repayments. The $750 million exchangeable securities can be exchanged at the earliest on Jan. 1, 2025.
Credit Facilities
The Company's credit facilities are summarized in the table below:
|
|
|
|
|
|
|
|
|
|
|
|
|
|
|
|
|
|
| As at June 30, 2023 |
Facility
size |
Utilized |
Available
capacity |
Maturity
date |
| Credit facilities |
Outstanding letters of credit(1) |
Cash drawings |
| Committed |
|
|
|
|
|
| TransAlta Corporation syndicated credit facility |
1,250 |
264 |
— |
986 |
Q2 2027 |
| TransAlta Renewables syndicated credit facility |
700 |
3 |
131 |
566 |
Q2 2027 |
| TransAlta Corporation bilateral credit facilities |
240 |
180 |
— |
60 |
Q2 2025 |
| TransAlta Corporation Term Facility |
400 |
— |
400 |
— |
Q3 2024 |
| Total Committed |
2,590 |
447 |
531 |
1,612 |
|
|
|
|
|
|
|
| Non-Committed |
|
|
|
|
|
| TransAlta Corporation demand facilities |
250 |
151 |
— |
99 |
N/A |
| TransAlta Renewables demand facility |
150 |
98 |
— |
52 |
N/A |
| Total Non-Committed |
400 |
249 |
— |
151 |
|
(1) TransAlta has obligations to issue letters of credit and cash collateral to secure potential liabilities to certain parties, including those related to potential environmental obligations, commodity risk management and hedging activities, pension plan obligations, construction projects and purchase obligations. Letters of credit drawn against the non-committed facilities reduce available capacity under the committed syndicated credit facilities.
In June 2023, the TransAlta Corporation syndicated credit facility and TransAlta Renewables syndicated credit facility were amended and maturity dates were extended from June 30, 2026 to June 30, 2027. The TransAlta Corporation bilateral credit facilities were also amended and maturity dates were extended from June 30, 2024 to June 30, 2025.
Non-Recourse Debt
The Melancthon Wolfe Wind LP, TAPC Holdings LP, New Richmond Wind LP, Kent Hills Wind LP, TEC Hedland Pty Ltd, Windrise Wind LP and TransAlta OCP LP non-recourse bonds, are subject to customary financing conditions and covenants that may restrict the Company’s ability to access funds generated by the facilities’ operations. Upon meeting certain distribution tests, typically performed once per quarter, the funds are able to be distributed by the subsidiary entities to their respective parent entity. These conditions include meeting a debt service coverage ratio prior to distribution, which was met by these entities in the second quarter of 2023 with the exception of Kent Hills Wind LP and TAPC Holdings LP. Kent Hills Wind LP cannot make any distributions to its partners until the foundation replacement work has been completed and TAPC Holdings LP has been impacted by higher interest rates in 2023. The funds in these entities that have accumulated since the second quarter test will remain there until the next debt service coverage ratio can be calculated in the third quarter of 2023. At June 30, 2023, $65 million (Dec. 31, 2022 – $50 million) of cash was subject to these financial restrictions. Additionally, certain non-recourse bonds require that certain reserve accounts be established and funded through cash held on deposit and/or by providing letters of credit.
TransAlta Corporation M24
MANAGEMENT'S DISCUSSION AND ANALYSIS
Returns to Providers of Capital
Net Interest Expense
The components of net interest expense are shown below:
|
|
|
|
|
|
|
|
|
|
|
|
|
|
|
|
|
3 months ended June 30 |
6 months ended June 30 |
|
|
2023 |
2022 |
2023 |
2022 |
|
| Interest on debt |
51 |
|
40 |
|
101 |
|
81 |
|
|
| Interest on exchangeable debentures |
8 |
|
8 |
|
15 |
|
15 |
|
|
| Interest on exchangeable preferred shares |
7 |
|
7 |
|
14 |
|
14 |
|
|
| Interest income |
(16) |
|
(4) |
|
(31) |
|
(7) |
|
|
| Capitalized interest |
(13) |
|
(3) |
|
(26) |
|
(4) |
|
|
| Interest on lease liabilities |
2 |
|
2 |
|
4 |
|
3 |
|
|
| Credit facility fees, bank charges and other interest |
3 |
|
5 |
|
11 |
|
11 |
|
|
| Tax shield on tax equity financing |
1 |
|
(3) |
|
— |
|
(3) |
|
|
|
|
|
|
|
|
|
|
|
|
|
|
| Accretion of provisions |
13 |
|
10 |
|
27 |
|
19 |
|
|
| Net interest expense |
56 |
|
62 |
|
115 |
|
129 |
|
|
Net interest expense for the three and six months ended June 30, 2023, was lower than the same periods in 2022 primarily due to higher capitalized interest resulting from higher capital expenditures on growth projects, and interest income due to higher cash balances and favourable interest rates. This is partially offset by interest on credit facility borrowings and higher accretion of provisions.
Share Capital
The following tables outline the common and preferred shares issued and outstanding:
|
|
|
|
|
|
|
|
|
|
|
|
| |
Number of shares (millions) |
| As at |
Aug. 3, 2023 |
June 30, 2023 |
Dec. 31, 2022 |
|
|
|
|
| Common shares issued and outstanding, end of period |
263.4 |
|
263.4 |
|
268.1 |
|
|
|
|
|
|
|
|
|
| Preferred shares |
|
|
|
| Series A |
9.6 |
|
9.6 |
|
9.6 |
|
| Series B |
2.4 |
|
2.4 |
|
2.4 |
|
| Series C |
10.0 |
|
10.0 |
|
10.0 |
|
| Series D |
1.0 |
|
1.0 |
|
1.0 |
|
| Series E |
9.0 |
|
9.0 |
|
9.0 |
|
| Series G |
6.6 |
|
6.6 |
|
6.6 |
|
| Preferred shares issued and outstanding in equity |
38.6 |
|
38.6 |
|
38.6 |
|
Series I - Exchangeable Securities(1) |
0.4 |
|
0.4 |
|
0.4 |
|
| Preferred shares issued and outstanding |
39.0 |
|
39.0 |
|
39.0 |
|
(1) Brookfield invested $400 million in consideration for redeemable, retractable, first preferred shares. For accounting purposes, these preferred shares are considered debt and disclosed as such in the consolidated financial statements.
TransAlta Corporation M25
MANAGEMENT'S DISCUSSION AND ANALYSIS
Non-Controlling Interests
As at June 30, 2023, the Company owns 60.1 per cent (June 30, 2022 – 60.1 per cent) of TransAlta Renewables. TransAlta Renewables is a publicly traded company whose common shares are listed on the TSX under the symbol “RNW.” TransAlta Renewables holds a diversified, highly contracted portfolio of assets with comparatively lower carbon intensity.
We also own 50.01 per cent TransAlta Cogeneration, LP (“TA Cogen”) (June 30, 2022 – 50.01 per cent), which owns, operates or has an interest in three natural-gas-fired cogeneration facilities (Ottawa, Windsor and Fort Saskatchewan) and one natural-gas-fired facility (Sheerness). Sheerness operated as a dual-fuel generating facility in 2021.
Since we own a controlling interest in TA Cogen and TransAlta Renewables, we consolidate the entire earnings, assets and liabilities in relation to those subsidiaries.
The reported net earnings attributable to non-controlling interests for the three and six months ended June 30, 2023, increased by $12 million and $32 million, respectively, compared to the same periods in 2022. TA Cogen net earnings attributable to non-controlling interests have increased by $12 million and $28 million, respectively, compared to the same periods in 2022, primarily due to higher merchant pricing in the Alberta market.
TransAlta Renewables net earnings attributable to non-controlling interests for the three and six months ended June 30, 2023, remained the same and increased by $4 million, respectively, compared to the same periods in 2022. The increase for the six months ended June 30, 2023 was primarily due to asset impairment reversals and lower depreciation, partially offset by lower revenues, lower liquidated damages at the Windrise wind facility, lower insurance recoveries and higher OM&A expenses. Finance income related to subsidiaries of TransAlta was higher due to higher dividends from Australia in the first quarter of the year compared to the prior year. Refer to Note 8 of the unaudited interim condensed consolidated financial statements for further details.
On July 10, 2023, the Company entered into an agreement to acquire all of the outstanding common shares of TransAlta Renewables not already owned, directly or indirectly, by TransAlta and certain of its affiliates subject to the approval of TransAlta Renewables shareholders. See the Significant and Subsequent Events section of this MD&A for details.
Other Consolidated Analysis
Commitments
In addition to the commitments disclosed elsewhere in the financial statements and those disclosed in the 2022 annual audited financial statements, during 2023 the Company has incurred the following additional contractual commitments, either directly or through its interests in joint operations for the six months ended, June 30, 2023. Approximate future payments under these agreements are as follows:
|
|
|
|
|
|
|
|
|
|
|
|
|
|
|
|
|
|
|
|
|
|
|
|
| |
2024 |
2025 |
2026 |
2027 |
2028 |
2029 and thereafter |
Total |
|
|
|
|
|
|
|
|
| Transmission |
— |
|
2 |
|
2 |
|
3 |
|
4 |
|
56 |
|
67 |
|
| Total |
— |
|
2 |
|
2 |
|
3 |
|
4 |
|
56 |
|
67 |
|
Transmission
The Company has several agreements to purchase transmission network capacity in the Pacific Northwest. Provided certain conditions for delivering the service are met, the Company is committed to the transmission at the supplier’s tariff rate whether it is awarded immediately or delivered in the future after additional facilities are constructed. The table above includes the incremental change in transmission agreements, as compared to the amounts disclosed in the 2022 audited annual consolidated financial statements.
TransAlta Corporation M26
MANAGEMENT'S DISCUSSION AND ANALYSIS
Contingencies
For the current material outstanding contingencies, please refer to Note 37 of the 2022 audited annual consolidated financial statements. Material changes to the contingencies have been described below.
Hydro Power Purchase Arrangement ("Hydro PPA") Emissions Performance Credits
The Balancing Pool claimed entitlement to 1,750,000 Emission Performance Credits ("EPCs") earned by the Alberta Hydro facilities as a result of TransAlta opting those facilities into the Carbon Competitiveness Incentive Regulation and Technology Innovation and Emissions Reduction Regulation from 2018-2020 inclusive. The EPCs under dispute had no recorded book value as they were internally generated. The Balancing Pool claimed ownership of the EPCs because it believed the change-in-law provisions under the Hydro PPA required the EPCs to be passed through to the Balancing Pool. TransAlta disputed this claim. The parties have reached a confidential settlement and this matter is now resolved.
Brazeau Facility - Well Licence Applications to Consider Hydraulic Fracturing Activities
The Alberta Energy Regulator ("AER") issued a subsurface order on May 27, 2019, which does not permit any hydraulic fracturing within three kilometers of the Brazeau Facility but permits hydraulic fracturing in all formations (except the Duvernay) within three-to-five kilometers of the Brazeau Facility. Subsequently, two oil and gas operators submitted applications to the AER for 10 well licenses (which include hydraulic fracturing activities) within three-to-five kilometers of the Brazeau Facility. The regulatory hearing to consider these applications - Proceeding 379 - was scheduled to be heard from Feb. 27 to March 10, 2023, but was adjourned to permit the O'Chiese First Nation to intervene and make submissions. While we do not have a new hearing date, we anticipate it will be heard, at the earliest, in the fourth quarter of 2023.
The Company's position is that hydraulic fracturing activities within five kilometers of the Brazeau Facility pose an unacceptable risk and that the applications should be denied.
Brazeau Facility - Claim against the Government of Alberta
On Sept. 9, 2022, the Company filed a Statement of Claim against the Alberta Government in the Alberta Court of King’s Bench seeking a declaration that: (i) granting mineral leases within 5 km of the Brazeau Facility is a breach of the 1960 agreement between the Company and the Alberta Government; and (ii) the Alberta Government is required to indemnify the Company for any costs or damages that result from the risks of hydraulic fracturing near the Brazeau Facility. On Sept. 29, 2022, the Alberta Government filed its Statement of Defence, which asserts, among other things, that the Company: (i) is trying to usurp the jurisdiction of the Alberta Energy Regulator, and (ii) is out of time under the Limitations Act (Alberta). The trial has been scheduled for two weeks starting Feb. 26, 2024.
Garden Plain
Garden Plain I LP, a wholly owned subsidiary of the Company, retained an external supplier to construct the Garden Plain wind project near Hanna, Alberta. The supplier experienced scheduling delays, challenges with construction, and significant cost overruns, resulting in overdue deadlines and has asserted a claim for $49 million in damages. The Company disputes this claim in its entirety and asserts a counterclaim. The parties have initiated the dispute resolution procedure.
TransAlta Corporation M27
MANAGEMENT'S DISCUSSION AND ANALYSIS
Cash Flows
The following highlights significant changes in the Consolidated Statements of Cash Flows for the six months ended June 30, 2023 and June 30, 2022:
|
|
|
|
|
|
|
|
|
|
|
|
|
6 months ended June 30 |
|
|
2023 |
2022 |
Increase/ (decrease) |
| Cash and cash equivalents, beginning of period |
1,134 |
|
947 |
|
187 |
|
| Provided by (used in): |
|
|
|
| Operating activities |
473 |
|
322 |
|
151 |
|
| Investing activities |
(367) |
|
(166) |
|
(201) |
|
| Financing activities |
(280) |
|
(201) |
|
(79) |
|
| Translation of foreign currency cash |
(8) |
|
(4) |
|
(4) |
|
| Cash and cash equivalents, end of period |
952 |
|
898 |
|
54 |
|
Cash from operating activities for the six months ended June 30, 2023, increased compared with the same period in 2022 primarily due to higher revenues net of unrealized gains and losses from risk management activities. This was partially offset by higher unfavourable changes in working capital and higher fuel and purchased power, OM&A and carbon compliance costs.
Cash used in investing activities for the six months ended June 30, 2023, decreased compared with the same period in 2022, largely due to:
•Higher cash spent on growth projects and Kent Hills rehabilitation construction activities in PP&E ($275 million), partially offset by:
•Favourable change in non-cash working capital mainly related to the timing of construction payables for the assets under construction ($42 million);
•Higher proceeds from the sale of property, plant and equipment ($25 million); and
•Lower additions to intangibles during the year ($17 million).
Cash used in financing activities for the six months ended June 30, 2023, decreased compared with the same period in 2022, largely due to:
•Increased distributions paid to subsidiaries' non-controlling interests ($57 million);
•Higher common share repurchases under the NCIB ($55 million); and
•Higher repayments of long-term debt ($50 million),
partially offset by higher net borrowings under the Company's credit facilities ($87 million).
TransAlta Corporation M28
MANAGEMENT'S DISCUSSION AND ANALYSIS
Financial Instruments
Refer to Note 14 of the notes to the audited annual 2022 consolidated financial statements, and Note 10 and 11 of our unaudited interim condensed consolidated financial statements as at and for the three and six months ended June 30, 2023, for details on Financial Instruments.
We may enter into commodity transactions involving non-standard features for which observable market data is not available. These are defined under IFRS as Level III financial instruments. Level III financial instruments are not traded in an active market and fair value is, therefore, developed using valuation models based upon internally developed assumptions or inputs. Our Level III fair values are determined using data such as unit availability, transmission congestion, or demand profiles. Fair values are validated every quarter by using reasonably possible alternative assumptions as inputs to valuation techniques and any material differences are disclosed in the notes to the financial statements.
At June 30, 2023, Level III instruments had a net liabilities carrying value of $376 million (Dec. 31, 2022 – net liabilities of $782 million). Our risk management profile and practices have not changed materially from Dec. 31, 2022.
Additional IFRS Measures and Non-IFRS Measures
An additional IFRS measure is a line item, heading or subtotal that is relevant to an understanding of the consolidated financial statements but is not a minimum line item mandated under IFRS, or the presentation of a financial measure that is relevant to an understanding of the consolidated financial statements but is not presented elsewhere in the consolidated financial statements. We have included line items entitled gross margin and operating income (loss) in our unaudited interim condensed consolidated statements of earnings (loss) for the three and six months ended June 30, 2023 and 2022. Presenting these line items provides management and investors with a measurement of ongoing operating performance that is readily comparable from period to period.
We use a number of financial measures to evaluate our performance and the performance of our business segments, including measures and ratios that are presented on a non-IFRS basis, as described below. Unless otherwise indicated, all amounts are in Canadian dollars and have been derived from our audited annual 2022 consolidated financial statements and the unaudited interim condensed consolidated statements of earnings (loss) for the three and six months ended June 30, 2023, prepared in accordance with IFRS. We believe that these non-IFRS amounts, measures and ratios, read together with our IFRS amounts, provide readers with a better understanding of how management assesses results.
Non-IFRS amounts, measures and ratios do not have standardized meanings under IFRS. They are unlikely to be comparable to similar measures presented by other companies and should not be viewed in isolation from, as an alternative to, or more meaningful than, our IFRS results.
Non-IFRS Financial Measures
Adjusted EBITDA, FFO, FCF, total net debt, total consolidated net debt and adjusted net debt are non-IFRS measures that are presented in this MD&A. Refer to the Segmented Financial Performance and Operating Results, Segmented Financial Performance and Operating Results for the Fourth Quarter, Selected Quarterly Information, Financial Capital and Key Non-IFRS Financial Ratios sections of this MD&A for additional information, including a reconciliation of such non-IFRS measures to the most comparable IFRS measure.
TransAlta Corporation M29
MANAGEMENT'S DISCUSSION AND ANALYSIS
Adjusted EBITDA
Each business segment assumes responsibility for its operating results measured by adjusted EBITDA. Adjusted EBITDA is an important metric for management that represents our core business profitability. Interest, taxes, depreciation and amortization are not included, as differences in accounting treatments may distort our core business results. In addition, certain reclassifications and adjustments are made to better assess results, excluding those items that may not be reflective of ongoing business performance. This presentation may facilitate the readers' analysis of trends.
The following are descriptions of the adjustments made.
Adjustments to revenue
•Certain assets that we own in Canada and in Australia are fully contracted and recorded as finance leases under IFRS. We believe that it is more appropriate to reflect the payments we receive under the contracts as a capacity payment in our revenues instead of as finance lease income and a decrease in finance lease receivables.
•Adjusted EBITDA is adjusted to exclude the impact of unrealized mark-to-market gains or losses and unrealized foreign exchange gains or losses on commodity transactions.
•Adjustments made for gains and losses related to closed positions effectively settled by offsetting positions with exchanges that have been recorded in the period the positions are settled.
Adjustments to fuel and purchased power
•On the commissioning of the South Hedland facility in July 2017, we prepaid approximately $74 million of electricity transmission and distribution costs. Interest income is recorded on the prepaid funds. We reclassify this interest income as a reduction in the transmission and distribution costs expensed each period to reflect the net cost to the business.
Adjustments to net other operating income
•Insurance recoveries related to the Kent Hills tower collapse are not included as these relate to investing activities and are not reflective of ongoing business performance.
Adjustments to earnings (loss) in addition to interest, taxes, depreciation and amortization
•Asset impairment charges and reversals are not included as these are accounting adjustments that impact depreciation and amortization and do not reflect ongoing business performance.
•Any gains or losses on asset sales or foreign exchange gains or losses are not included as these are not part of operating income.
Adjustments for equity accounted investments
•During the fourth quarter of 2020, we acquired a 49 per cent interest in the Skookumchuck wind facility, which is treated as an equity investment under IFRS and our proportionate share of the net earnings is reflected as equity income on the statement of earnings under IFRS. As this investment is part of our regular power-generating operations, we have included our proportionate share of the adjusted EBITDA of the Skookumchuck wind facility in our total adjusted EBITDA. In addition, in the Wind and Solar adjusted results, we have included our proportionate share of revenues and expenses to reflect the full operational results of this investment. We have not included EMG International, LLC’s adjusted EBITDA in our total adjusted EBITDA as it does not represent our regular power-generating operations.
Average Annual EBITDA
Average annual EBITDA is a non-IFRS financial measure that is forward-looking, used to show the average annual EBITDA that the project currently under construction is expected to generate upon completion.
Funds From Operations ("FFO")
FFO is an important metric as it provides a proxy for cash generated from operating activities before changes in working capital and provides the ability to evaluate cash flow trends in comparison with results from prior periods. FFO is a non-IFRS measure.
TransAlta Corporation M30
MANAGEMENT'S DISCUSSION AND ANALYSIS
Adjustments to cash flow from operations
•FFO related to the Skookumchuk wind facility, which is treated as an equity accounted investment under IFRS and equity income, net of distributions from joint ventures is included in cash flow from operations under IFRS. As this investment is part of our regular power generating operations, we have included our proportionate share of FFO.
•Payments received on finance lease receivables are reclassified to reflect cash from operations.
•We adjust for items included in cash from operations related to the decision in 2020 to accelerate being off-coal and the shutdown of the Highvale mine in 2021 ("Clean energy transition provisions and adjustments").
•Cash received/paid on closed positions are reflected in the period that the position is settled.
•Other adjustments include payments/receipts for production tax credits, which are reductions to tax equity debt and include distributions from equity accounted joint venture.
Free Cash Flow ("FCF")
FCF is an important metric as it represents the amount of cash that is available to invest in growth initiatives, make scheduled principal repayments on debt, repay maturing debt, pay common share dividends or repurchase common shares. Changes in working capital are excluded so FFO and FCF are not distorted by changes that we consider temporary in nature, reflecting, among other things, the impact of seasonal factors and timing of receipts and payments. FCF is a non-IFRS measure.
Non-IFRS Ratios
FFO per share, FCF per share and adjusted net debt to adjusted EBITDA are non-IFRS ratios that are presented in the MD&A. Refer to the Reconciliation of Cash Flow from Operations to FFO and FCF and Key Non-IFRS Financial Ratios sections of this MD&A for additional information.
FFO per Share and FCF per Share
FFO per share and FCF per share are calculated using the weighted average number of common shares outstanding during the period. FFO per share and FCF per share are non-IFRS ratios.
Supplementary Financial Measures
Financial highlights presented on a proportional basis of TransAlta Renewables, deconsolidated adjusted EBITDA, deconsolidated FFO and deconsolidated adjusted EBITDA to deconsolidated FFO are supplementary financial measures that the Company uses to present adjusted EBITDA on a deconsolidated basis. Refer to the Financial Highlights on a Proportional Basis of TransAlta Renewables and Key Non-IFRS Financial Ratios sections of this MD&A for additional information.
The Alberta electricity portfolio metrics disclosed are also supplementary financial measures used to present the gross margin by segment for the Alberta market. Refer to the Alberta Electricity Portfolio section of this MD&A for additional information.
TransAlta Corporation M31
MANAGEMENT'S DISCUSSION AND ANALYSIS
Reconciliation of Non-IFRS Measures on a Consolidated Basis by Segment
The following table reflects adjusted EBITDA by segment and provides reconciliation to earnings before income taxes for the three months ended June 30, 2023:
|
|
|
|
|
|
|
|
|
|
|
|
|
|
|
|
|
|
|
|
|
|
|
|
|
|
|
|
|
|
|
|
|
|
Hydro |
Wind & Solar(1) |
Gas |
Energy Transition |
Energy
Marketing |
Corporate |
Total |
Equity accounted investments(1) |
Reclass adjustments |
IFRS financials |
| Revenues |
168 |
|
86 |
|
251 |
|
121 |
|
3 |
|
1 |
|
630 |
|
(5) |
|
— |
|
625 |
|
| Reclassifications and adjustments: |
|
|
|
|
|
|
|
|
|
Unrealized mark-to-market
(gain) loss |
(1) |
|
(8) |
|
56 |
|
(3) |
|
93 |
|
— |
|
137 |
|
— |
|
(137) |
|
— |
|
Realized loss on closed
exchange positions |
— |
|
— |
|
(4) |
|
— |
|
(48) |
|
— |
|
(52) |
|
— |
|
52 |
|
— |
|
Decrease in finance lease
receivable |
— |
|
— |
|
13 |
|
— |
|
— |
|
— |
|
13 |
|
— |
|
(13) |
|
— |
|
| Finance lease income |
— |
|
— |
|
4 |
|
— |
|
— |
|
— |
|
4 |
|
— |
|
(4) |
|
— |
|
Unrealized foreign
exchange loss on
commodity |
— |
|
— |
|
— |
|
— |
|
1 |
|
— |
|
1 |
|
— |
|
(1) |
|
— |
|
| Adjusted revenues |
167 |
|
78 |
|
320 |
|
118 |
|
49 |
|
1 |
|
733 |
|
(5) |
|
(103) |
|
625 |
|
| Fuel and purchased power |
5 |
|
7 |
|
85 |
|
90 |
|
— |
|
1 |
|
188 |
|
— |
|
— |
|
188 |
|
| Reclassifications and adjustments: |
|
|
|
|
|
|
|
|
|
| Australian interest income |
— |
|
— |
|
(1) |
|
— |
|
— |
|
— |
|
(1) |
|
— |
|
1 |
|
— |
|
Adjusted fuel and purchased
power |
5 |
|
7 |
|
84 |
|
90 |
|
— |
|
1 |
|
187 |
|
— |
|
1 |
|
188 |
|
| Carbon compliance |
— |
|
— |
|
25 |
|
— |
|
— |
|
— |
|
25 |
|
— |
|
— |
|
25 |
|
| Gross margin |
162 |
|
71 |
|
211 |
|
28 |
|
49 |
|
— |
|
521 |
|
(5) |
|
(104) |
|
412 |
|
| OM&A |
14 |
|
18 |
|
50 |
|
14 |
|
6 |
|
32 |
|
134 |
|
— |
|
— |
|
134 |
|
| Taxes, other than income taxes |
1 |
|
4 |
|
4 |
|
1 |
|
— |
|
— |
|
10 |
|
(1) |
|
— |
|
9 |
|
| Net other operating income |
— |
|
(1) |
|
(9) |
|
— |
|
— |
|
— |
|
(10) |
|
— |
|
— |
|
(10) |
|
Adjusted EBITDA(2) |
147 |
|
50 |
|
166 |
|
13 |
|
43 |
|
(32) |
|
387 |
|
|
|
|
| Equity income |
|
|
|
|
|
|
|
|
|
(1) |
|
Finance lease income |
|
|
|
|
|
|
|
|
|
4 |
|
Depreciation and amortization |
|
|
|
|
|
|
|
|
|
(173) |
|
Asset impairment reversals |
|
|
|
|
|
|
|
|
|
13 |
|
| Net interest expense |
|
|
|
|
|
|
|
|
|
(56) |
|
Foreign exchange loss |
|
|
|
|
|
|
|
|
|
8 |
|
|
Gain on sale of assets and
other
|
|
|
|
|
|
|
|
|
|
5 |
|
Earnings before income taxes |
|
|
|
|
|
|
|
|
|
79 |
|
(1) The Skookumchuck wind facility has been included on a proportionate basis in the Wind and Solar segment.
(2) Adjusted EBITDA is not defined and has no standardized meaning under IFRS. Refer to the Additional IFRS Measures and Non-IFRS Measures section of this MD&A.
TransAlta Corporation M32
MANAGEMENT'S DISCUSSION AND ANALYSIS
The following table reflects adjusted EBITDA by segment and provides reconciliation to loss before income taxes for the three months ended June 30, 2022:
|
|
|
|
|
|
|
|
|
|
|
|
|
|
|
|
|
|
|
|
|
|
|
|
|
|
|
|
|
|
|
|
|
|
Hydro |
Wind & Solar(1) |
Gas |
Energy Transition |
Energy
Marketing |
Corporate |
Total |
Equity accounted investments(1) |
Reclass adjustments |
IFRS financials |
| Revenues |
105 |
|
96 |
|
127 |
|
96 |
|
36 |
|
1 |
|
461 |
|
(3) |
|
— |
|
458 |
|
| Reclassifications and adjustments: |
|
|
|
|
|
|
|
|
|
Unrealized mark-to-market
(gain) loss |
— |
|
15 |
|
128 |
|
— |
|
(56) |
|
— |
|
87 |
|
— |
|
(87) |
|
— |
|
Realized gain (loss) on
closed exchange
positions |
— |
|
— |
|
(10) |
|
— |
|
75 |
|
— |
|
65 |
|
— |
|
(65) |
|
— |
|
Decrease in finance lease
receivable |
— |
|
— |
|
11 |
|
— |
|
— |
|
— |
|
11 |
|
— |
|
(11) |
|
— |
|
| Finance lease income |
— |
|
— |
|
6 |
|
— |
|
— |
|
— |
|
6 |
|
— |
|
(6) |
|
— |
|
Unrealized foreign
exchange loss on
commodity |
— |
|
— |
|
— |
|
— |
|
2 |
|
— |
|
2 |
|
— |
|
(2) |
|
— |
|
| Adjusted revenues |
105 |
|
111 |
|
262 |
|
96 |
|
57 |
|
1 |
|
632 |
|
(3) |
|
(171) |
|
458 |
|
| Fuel and purchased power |
6 |
|
6 |
|
147 |
|
71 |
|
— |
|
1 |
|
231 |
|
— |
|
— |
|
231 |
|
| Reclassifications and adjustments: |
|
|
|
|
|
|
|
|
|
| Australian interest income |
— |
|
— |
|
(1) |
|
— |
|
— |
|
— |
|
(1) |
|
— |
|
1 |
|
— |
|
|
|
|
|
|
|
|
|
|
|
|
|
|
|
|
|
|
|
|
|
|
|
Adjusted fuel and purchased
power |
6 |
|
6 |
|
146 |
|
71 |
|
— |
|
1 |
|
230 |
|
— |
|
1 |
|
231 |
|
| Carbon compliance |
— |
|
1 |
|
12 |
|
(4) |
|
— |
|
— |
|
9 |
|
— |
|
— |
|
9 |
|
| Gross margin |
99 |
|
104 |
|
104 |
|
29 |
|
57 |
|
— |
|
393 |
|
(3) |
|
(172) |
|
218 |
|
| OM&A |
10 |
|
15 |
|
45 |
|
17 |
|
7 |
|
23 |
|
117 |
|
— |
|
— |
|
117 |
|
|
|
|
|
|
|
|
|
|
|
|
|
|
|
|
|
|
|
|
|
|
|
|
|
|
|
|
|
|
|
|
|
|
|
|
|
|
|
|
|
|
|
|
Taxes, other than income
taxes |
1 |
|
4 |
|
4 |
|
1 |
|
— |
|
— |
|
10 |
|
(1) |
|
— |
|
9 |
|
| Net other operating income |
— |
|
(10) |
|
(10) |
|
— |
|
— |
|
— |
|
(20) |
|
— |
|
— |
|
(20) |
|
| Reclassifications and adjustments: |
|
|
|
|
|
|
|
|
|
|
|
|
|
|
|
|
|
|
|
|
| Insurance recovery |
— |
|
7 |
|
— |
|
— |
|
— |
|
— |
|
7 |
|
— |
|
(7) |
|
— |
|
Adjusted net other operating
income |
— |
|
(3) |
|
(10) |
|
— |
|
— |
|
— |
|
(13) |
|
— |
|
(7) |
|
(20) |
|
Adjusted EBITDA(2) |
88 |
|
88 |
|
65 |
|
11 |
|
50 |
|
(23) |
|
279 |
|
|
|
|
| Equity income |
|
|
|
|
|
|
|
|
|
2 |
|
Finance lease income |
|
|
|
|
|
|
|
|
|
6 |
|
| Depreciation and amortization |
|
|
|
|
|
|
|
|
|
(115) |
|
Asset impairment reversals |
|
|
|
|
|
|
|
|
|
24 |
|
| Net interest expense |
|
|
|
|
|
|
|
|
|
(62) |
|
Foreign exchange gain |
|
|
|
|
|
|
|
|
|
9 |
|
Gain on sale of assets and other |
|
|
|
|
|
|
|
|
|
2 |
|
Loss before income taxes |
|
|
|
|
|
|
|
|
|
(22) |
|
(1) The Skookumchuck wind facility has been included on a proportionate basis in the Wind and Solar segment.
(2) Adjusted EBITDA is not defined and has no standardized meaning under IFRS. Refer to the Additional IFRS Measures and Non-IFRS Measures section of this MD&A.
TransAlta Corporation M33
MANAGEMENT'S DISCUSSION AND ANALYSIS
The following table reflects adjusted EBITDA by segment and provides reconciliation to earnings before income taxes for the six months ended June 30, 2023:
|
|
|
|
|
|
|
|
|
|
|
|
|
|
|
|
|
|
|
|
|
|
|
|
|
|
|
|
|
|
|
|
|
|
Hydro |
Wind & Solar(1) |
Gas |
Energy Transition |
Energy
Marketing |
Corporate |
Total |
Equity accounted investments(1) |
Reclass adjustments |
IFRS financials |
| Revenues |
293 |
|
201 |
|
746 |
|
388 |
|
95 |
|
1 |
|
1,724 |
|
(10) |
|
— |
|
1,714 |
|
| Reclassifications and adjustments: |
|
|
|
|
|
|
|
|
|
| Unrealized mark-to-market (gain) loss |
(2) |
|
(8) |
|
(8) |
|
(17) |
|
109 |
|
— |
|
74 |
|
— |
|
(74) |
|
— |
|
| Realized loss on closed exchange positions |
— |
|
— |
|
(17) |
|
— |
|
(103) |
|
— |
|
(120) |
|
— |
|
120 |
|
— |
|
| Decrease in finance lease receivable |
— |
|
— |
|
26 |
|
— |
|
— |
|
— |
|
26 |
|
— |
|
(26) |
|
— |
|
| Finance lease income |
— |
|
— |
|
8 |
|
— |
|
— |
|
— |
|
8 |
|
— |
|
(8) |
|
— |
|
Unrealized foreign exchange
loss on commodity |
— |
|
— |
|
— |
|
— |
|
1 |
|
— |
|
1 |
|
— |
|
(1) |
|
— |
|
| Adjusted revenues |
291 |
|
193 |
|
755 |
|
371 |
|
102 |
|
1 |
|
1,713 |
|
(10) |
|
11 |
|
1,714 |
|
| Fuel and purchased power |
10 |
|
16 |
|
215 |
|
271 |
|
— |
|
1 |
|
513 |
|
— |
|
— |
|
513 |
|
| Reclassifications and adjustments: |
|
|
|
|
|
|
|
|
|
| Australian interest income |
— |
|
— |
|
(2) |
|
— |
|
— |
|
— |
|
(2) |
|
— |
|
2 |
|
— |
|
Adjusted fuel and purchased
power |
10 |
|
16 |
|
213 |
|
271 |
|
— |
|
1 |
|
511 |
|
— |
|
2 |
|
513 |
|
| Carbon compliance |
— |
|
— |
|
57 |
|
— |
|
— |
|
— |
|
57 |
|
— |
|
— |
|
57 |
|
| Gross margin |
281 |
177 |
|
485 |
|
100 |
|
102 |
|
— |
|
1,145 |
|
(10) |
|
9 |
|
1,144 |
|
| OM&A |
26 |
|
35 |
|
91 |
|
31 |
|
20 |
|
56 |
|
259 |
|
(1) |
|
— |
|
258 |
|
| Taxes, other than income taxes |
2 |
|
7 |
|
8 |
|
2 |
|
— |
|
— |
|
19 |
|
(1) |
|
— |
|
18 |
|
| Net other operating income |
— |
|
(3) |
|
(20) |
|
— |
|
— |
|
— |
|
(23) |
|
— |
|
— |
|
(23) |
|
|
|
|
|
|
|
|
|
|
|
|
|
|
|
|
|
|
|
|
|
|
|
|
|
|
|
|
|
|
|
|
|
|
|
|
|
|
|
|
|
|
|
|
Adjusted EBITDA(2) |
253 |
|
138 |
|
406 |
|
67 |
|
82 |
|
(56) |
|
890 |
|
|
|
|
| Equity income |
|
|
|
|
|
|
|
|
|
1 |
|
Finance lease income |
|
|
|
|
|
|
|
|
|
8 |
|
| Depreciation and amortization |
|
|
|
|
|
|
|
|
|
(349) |
|
Asset impairment reversals |
|
|
|
|
|
|
|
|
|
16 |
|
| Net interest expense |
|
|
|
|
|
|
|
|
|
(115) |
|
Foreign exchange loss |
|
|
|
|
|
|
|
|
|
5 |
|
|
Gain on sale of assets and
other
|
|
|
|
|
|
|
|
|
|
5 |
|
Earnings before income taxes |
|
|
|
|
|
|
|
|
|
462 |
|
(1) The Skookumchuck wind facility has been included on a proportionate basis in the Wind and Solar segment.
(2) Adjusted EBITDA is not defined and has no standardized meaning under IFRS. Refer to the Additional IFRS Measures and Non-IFRS Measures section of this MD&A.
TransAlta Corporation M34
MANAGEMENT'S DISCUSSION AND ANALYSIS
The following table reflects adjusted EBITDA by segment and provides reconciliation to earnings before income taxes for the six months ended June 30, 2022:
|
|
|
|
|
|
|
|
|
|
|
|
|
|
|
|
|
|
|
|
|
|
|
|
|
|
|
|
|
|
|
|
|
|
Hydro |
Wind & Solar(1) |
Gas |
Energy Transition |
Energy
Marketing |
Corporate |
Total |
Equity accounted investments(1) |
Reclass adjustments |
IFRS financials |
| Revenues |
182 |
|
191 |
|
561 |
|
202 |
|
62 |
|
2 |
|
1,200 |
|
(7) |
|
— |
|
1,193 |
|
| Reclassifications and adjustments: |
|
|
|
|
|
|
|
|
|
Unrealized mark-to-market
(gain) loss |
— |
|
28 |
|
(34) |
|
11 |
|
(46) |
|
— |
|
(41) |
|
— |
|
41 |
|
— |
|
Realized gain (loss) on closed
exchange positions |
— |
|
— |
|
(7) |
|
— |
|
65 |
|
— |
|
58 |
|
— |
|
(58) |
|
— |
|
Decrease in finance lease
receivable |
— |
|
— |
|
22 |
|
— |
|
— |
|
— |
|
22 |
|
— |
|
(22) |
|
— |
|
| Finance lease income |
— |
|
— |
|
11 |
|
— |
|
— |
|
— |
|
11 |
|
— |
|
(11) |
|
— |
|
|
|
|
|
|
|
|
|
|
|
|
| Adjusted revenues |
182 |
|
219 |
|
553 |
|
213 |
|
81 |
|
2 |
|
1,250 |
|
(7) |
|
(50) |
|
1,193 |
|
| Fuel and purchased power |
10 |
|
14 |
|
278 |
|
165 |
|
— |
|
2 |
|
469 |
|
— |
|
— |
|
469 |
|
| Reclassifications and adjustments: |
|
|
|
|
|
|
|
|
|
| Australian interest income |
— |
|
— |
|
(2) |
|
— |
|
— |
|
— |
|
(2) |
|
— |
|
2 |
|
— |
|
Adjusted fuel and purchased
power |
10 |
|
14 |
|
276 |
|
165 |
|
— |
|
2 |
|
467 |
|
— |
|
2 |
|
469 |
|
| Carbon compliance |
— |
|
1 |
|
30 |
|
(3) |
|
— |
|
— |
|
28 |
|
— |
|
— |
|
28 |
|
| Gross margin |
172 |
|
204 |
|
247 |
|
51 |
|
81 |
|
— |
|
755 |
|
(7) |
|
(52) |
|
696 |
|
| OM&A |
21 |
|
31 |
|
89 |
|
33 |
|
14 |
|
41 |
|
229 |
|
— |
|
— |
|
229 |
|
| Taxes, other than income taxes |
2 |
|
6 |
|
8 |
|
2 |
|
— |
|
— |
|
18 |
|
(1) |
|
— |
|
17 |
|
| Net other operating income |
— |
|
(17) |
|
(20) |
|
— |
|
— |
|
— |
|
(37) |
|
— |
|
— |
|
(37) |
|
| Reclassifications and adjustments: |
|
|
|
|
|
|
|
|
|
| Insurance recovery |
— |
|
7 |
|
— |
|
— |
|
— |
|
— |
|
7 |
|
— |
|
(7) |
|
— |
|
Adjusted net other operating
income |
— |
|
(10) |
|
(20) |
|
— |
|
— |
|
— |
|
(30) |
|
— |
|
(7) |
|
(37) |
|
Adjusted EBITDA(2) |
149 |
|
177 |
|
170 |
|
16 |
|
67 |
|
(41) |
|
538 |
|
|
|
|
| Equity income |
|
|
|
|
|
|
|
|
|
4 |
|
| Finance lease income |
|
|
|
|
|
|
|
|
|
11 |
|
| Depreciation and amortization |
|
|
|
|
|
|
|
|
|
(232) |
|
| Asset impairment reversals |
|
|
|
|
|
|
|
|
|
66 |
|
| Net interest expense |
|
|
|
|
|
|
|
|
|
(129) |
|
| Foreign exchange gain |
|
|
|
|
|
|
|
|
|
11 |
|
Gain on sale of assets and
other |
|
|
|
|
|
|
|
|
|
2 |
|
| Earnings before income taxes |
|
|
|
|
|
|
|
|
|
220 |
|
(1) The Skookumchuck wind facility has been included on a proportionate basis in the Wind and Solar segment.
(2) Adjusted EBITDA is not defined and has no standardized meaning under IFRS. Refer to the Additional IFRS Measures and Non-IFRS Measures section of this MD&A.
TransAlta Corporation M35
MANAGEMENT'S DISCUSSION AND ANALYSIS
Reconciliation of Cash Flow from Operations to FFO and FCF
The table below reconciles our cash flow from operating activities to our FFO and FCF:
|
|
|
|
|
|
|
|
|
|
|
|
|
|
|
|
3 months ended June 30 |
6 months ended June 30 |
|
2023 |
2022 |
2023 |
2022 |
Cash flow from (used in) operating activities(1) |
11 |
|
(129) |
|
473 |
|
322 |
|
| Change in non-cash operating working capital balances |
408 |
|
260 |
|
366 |
|
(24) |
|
| Cash flow from operations before changes in working capital |
419 |
|
131 |
|
839 |
|
298 |
|
| Adjustments |
|
|
|
|
Share of adjusted FFO from joint venture(1) |
5 |
|
2 |
|
8 |
|
5 |
|
| Decrease in finance lease receivable |
13 |
|
11 |
|
26 |
|
22 |
|
Clean energy transition provisions and adjustments(2) |
7 |
|
8 |
|
7 |
|
8 |
|
| Realized gain (loss) on closed exchanged positions |
(52) |
|
65 |
|
(120) |
|
58 |
|
Other(3) |
(1) |
|
3 |
|
5 |
|
8 |
|
FFO(4) |
391 |
|
220 |
|
765 |
|
399 |
|
| Deduct: |
|
|
|
|
Sustaining capital(1) |
(44) |
|
(31) |
|
(64) |
|
(48) |
|
| Productivity capital |
(1) |
|
(1) |
|
(1) |
|
(2) |
|
| Dividends paid on preferred shares |
(12) |
|
(10) |
|
(25) |
|
(20) |
|
| Distributions paid to subsidiaries’ non-controlling interests |
(53) |
|
(30) |
|
(129) |
|
(72) |
|
| Principal payments on lease liabilities |
(3) |
|
(3) |
|
(5) |
|
(4) |
|
FCF(4) |
278 |
|
145 |
|
541 |
|
253 |
|
| Weighted average number of common shares outstanding in the period |
264 |
|
271 |
|
266 |
|
271 |
|
FFO per share(4) |
1.48 |
|
0.81 |
|
2.88 |
|
1.47 |
|
FCF per share(4) |
1.05 |
|
0.54 |
|
2.03 |
|
0.93 |
|
(1) Includes our share of amounts for Skookumchuck wind facility, an equity accounted joint venture.
(2) Includes amounts related to onerous contracts recognized in 2021.
(3) Other consists of production tax credits, which is a reduction to tax equity debt, less distributions from equity accounted joint venture.
(4) These items are not defined and have no standardized meaning under IFRS. Refer to the Additional IFRS Measures and Non-IFRS Measures section of this MD&A.
TransAlta Corporation M36
MANAGEMENT'S DISCUSSION AND ANALYSIS
The table below provides a reconciliation of our adjusted EBITDA to our FFO and FCF:
|
|
|
|
|
|
|
|
|
|
|
|
|
|
|
|
|
|
3 months ended June 30 |
6 months ended June 30 |
|
|
|
2023 |
2022 |
2023 |
2022 |
|
|
Adjusted EBITDA(1)(4) |
387 |
|
279 |
|
890 |
|
538 |
|
|
|
| Provisions |
1 |
|
— |
|
4 |
|
10 |
|
|
|
| Interest expense |
(38) |
|
(50) |
|
(83) |
|
(104) |
|
|
|
Current income tax recovery (expense)(2) |
42 |
|
(13) |
|
(18) |
|
(25) |
|
|
|
| Realized foreign exchange gain (loss) |
1 |
|
13 |
|
(6) |
|
15 |
|
|
|
| Decommissioning and restoration costs settled |
(9) |
|
(7) |
|
(16) |
|
(14) |
|
|
|
| Other non-cash items |
7 |
|
(2) |
|
(6) |
|
(21) |
|
|
|
FFO(3)(4) |
391 |
|
220 |
|
765 |
|
399 |
|
|
|
| Deduct: |
|
|
|
|
|
|
Sustaining capital(4) |
(44) |
|
(31) |
|
(64) |
|
(48) |
|
|
|
| Productivity capital |
(1) |
|
(1) |
|
(1) |
|
(2) |
|
|
|
| Dividends paid on preferred shares |
(12) |
|
(10) |
|
(25) |
|
(20) |
|
|
|
| Distributions paid to subsidiaries’ non-controlling interests |
(53) |
|
(30) |
|
(129) |
|
(72) |
|
|
|
| Principal payments on lease liabilities |
(3) |
|
(3) |
|
(5) |
|
(4) |
|
|
|
FCF(3) |
278 |
|
145 |
|
541 |
|
253 |
|
|
|
(1) Adjusted EBITDA is defined in the Additional IFRS Measures and Non-IFRS Measures section of this MD&A and reconciled to earnings (loss) before income taxes above.
(2) The Company incurred lower current tax expense for 2023, due to the Company completing an internal reorganization during the second quarter of 2023, which allowed the Company to apply tax attributes, previously unavailable due to Canadian tax limitations, against taxable income in Canada.
(3) These items are not defined and have no standardized meaning under IFRS. FFO and FCF are defined in the Additional IFRS Measures and Non-IFRS Measures section of this MD&A and reconciled to cash flow from operating activities above.
(4) Includes our share of amounts for Skookumchuck wind facility, an equity accounted joint venture.
TransAlta Corporation M37
MANAGEMENT'S DISCUSSION AND ANALYSIS
Financial Highlights on a Proportional Basis of TransAlta Renewables
The proportionate financial information below reflects TransAlta's share of TransAlta Renewables relative to TransAlta's total consolidated figures. The financial highlights presented on a proportional basis of TransAlta Renewables are supplementary financial measures to reflect TransAlta Renewables' portion of the consolidated figures.
Consolidated Results
The following table reflects the generation and summary financial information on a consolidated basis for the period ended June 30:
|
|
|
|
|
|
|
|
|
|
|
|
|
|
|
|
|
|
|
|
|
|
|
|
|
|
|
|
|
|
|
|
|
|
|
|
|
|
Actual generation (GWh) |
|
|
|
|
Adjusted EBITDA(1) |
|
Earnings (loss) before income taxes(2) |
| 3 months ended June 30 |
2023 |
2022 |
|
|
|
|
|
|
|
|
|
2023 |
2022 |
|
|
2023 |
2022 |
|
| TransAlta Renewables |
|
|
|
|
|
|
|
|
|
|
|
|
|
|
|
|
|
|
| Hydro |
144 |
|
159 |
|
|
|
|
|
|
|
|
|
|
5 |
|
7 |
|
|
|
|
|
|
Wind and Solar(3) |
812 |
|
1,072 |
|
|
|
|
|
|
|
|
|
|
43 |
|
68 |
|
|
|
|
|
|
Gas(3) |
816 |
|
734 |
|
|
|
|
|
|
|
|
|
|
58 |
|
56 |
|
|
|
|
|
|
| Corporate |
— |
|
— |
|
|
|
|
|
|
|
|
|
|
(6) |
|
(5) |
|
|
|
|
|
|
| TransAlta Renewables before adjustments |
1,772 |
|
1,965 |
|
|
|
|
|
|
|
|
|
|
100 |
|
126 |
|
|
|
18 |
|
36 |
|
|
| Less: Proportion of TransAlta Renewables not owned by TransAlta Corporation |
(707) |
|
(784) |
|
|
|
|
|
|
|
|
|
|
(40) |
|
(50) |
|
|
|
(7) |
|
(14) |
|
|
| Portion of TransAlta Renewables owned by TransAlta Corporation |
1,065 |
|
1,181 |
|
|
|
|
|
|
|
|
|
|
60 |
|
76 |
|
|
|
11 |
|
22 |
|
|
| Add: TransAlta Corporation's owned assets excluding TransAlta Renewables |
|
|
|
|
|
|
|
|
|
|
|
|
|
|
|
|
|
|
| Hydro |
472 |
|
374 |
|
|
|
|
|
|
|
|
|
|
142 |
|
81 |
|
|
|
|
|
|
| Wind and Solar |
47 |
|
— |
|
|
|
|
|
|
|
|
|
|
7 |
|
20 |
|
|
|
|
|
|
| Gas |
1,699 |
|
1,832 |
|
|
|
|
|
|
|
|
|
|
108 |
|
9 |
|
|
|
|
|
|
| Energy Transition |
606 |
|
290 |
|
|
|
|
|
|
|
|
|
|
13 |
|
11 |
|
|
|
|
|
|
| Energy Marketing |
— |
|
— |
|
|
|
|
|
|
|
|
|
|
43 |
|
50 |
|
|
|
|
|
|
| Corporate |
— |
|
— |
|
|
|
|
|
|
|
|
|
|
(26) |
|
(18) |
|
|
|
|
|
|
| TransAlta Corporation with proportionate share of TransAlta Renewables |
3,889 |
|
3,677 |
|
|
|
|
|
|
|
|
|
|
347 |
|
229 |
|
|
|
72 |
|
(36) |
|
|
| Non-controlling interests |
707 |
|
784 |
|
|
|
|
|
|
|
|
|
|
40 |
|
50 |
|
|
|
7 |
|
14 |
|
|
| TransAlta consolidated |
4,596 |
|
4,461 |
|
|
|
|
|
|
|
|
|
|
387 |
|
279 |
|
|
|
79 |
|
(22) |
|
|
(1) Adjusted EBITDA is defined in the Additional IFRS Measures and Non-IFRS Measures section of this MD&A and reconciled to earnings (loss) before income taxes above.
(2) TransAlta Renewables amounts are comprised of its reported earnings before income taxes plus the reported earnings before income taxes of the assets in which it holds an economic interest less finance income related to subsidiaries of TransAlta.
(3) Wind and Solar and Gas segments include those assets in which TransAlta Renewables holds an economic interest.
TransAlta Corporation M38
MANAGEMENT'S DISCUSSION AND ANALYSIS
|
|
|
|
|
|
|
|
|
|
|
|
|
|
|
|
|
|
|
|
|
|
|
|
|
|
|
|
|
|
|
|
|
|
|
|
|
|
Actual generation (GWh) |
|
|
|
|
Adjusted EBITDA(1) |
|
Earnings before income taxes(2) |
| 6 months ended June 30 |
2023 |
2022 |
|
|
|
|
|
|
|
|
|
2023 |
2022 |
|
|
2023 |
2022 |
|
| TransAlta Renewables |
|
|
|
|
|
|
|
|
|
|
|
|
|
|
|
|
|
|
| Hydro |
171 |
|
200 |
|
|
|
|
|
|
|
|
|
|
4 |
|
8 |
|
|
|
|
|
|
Wind and Solar(3) |
2,006 |
|
2,341 |
|
|
|
|
|
|
|
|
|
|
120 |
|
156 |
|
|
|
|
|
|
Gas(3) |
1,618 |
|
1,669 |
|
|
|
|
|
|
|
|
|
|
116 |
|
112 |
|
|
|
|
|
|
| Corporate |
— |
|
— |
|
|
|
|
|
|
|
|
|
|
(12) |
|
(11) |
|
|
|
|
|
|
| TransAlta Renewables before adjustments |
3,795 |
|
4,210 |
|
|
|
|
|
|
|
|
|
|
228 |
|
265 |
|
|
|
91 |
|
69 |
|
|
| Less: Proportion of TransAlta Renewables not owned by TransAlta Corporation |
(1,514) |
|
(1,680) |
|
|
|
|
|
|
|
|
|
|
(91) |
|
(106) |
|
|
|
(36) |
|
(28) |
|
|
| Portion of TransAlta Renewables owned by TransAlta Corporation |
2,281 |
|
2,530 |
|
|
|
|
|
|
|
|
|
|
137 |
|
159 |
|
|
|
55 |
|
41 |
|
|
| Add: TransAlta Corporation's owned assets excluding TransAlta Renewables |
|
|
|
|
|
|
|
|
|
|
|
|
|
|
|
|
|
|
| Hydro |
751 |
|
705 |
|
|
|
|
|
|
|
|
|
|
249 |
|
141 |
|
|
|
|
|
|
| Wind and Solar |
50 |
|
— |
|
|
|
|
|
|
|
|
|
|
18 |
|
21 |
|
|
|
|
|
|
| Gas |
4,069 |
|
3,562 |
|
|
|
|
|
|
|
|
|
|
290 |
|
58 |
|
|
|
|
|
|
| Energy Transition |
1,903 |
|
1,343 |
|
|
|
|
|
|
|
|
|
|
67 |
|
16 |
|
|
|
|
|
|
| Energy Marketing |
— |
|
— |
|
|
|
|
|
|
|
|
|
|
82 |
|
67 |
|
|
|
|
|
|
| Corporate |
— |
|
— |
|
|
|
|
|
|
|
|
|
|
(44) |
|
(30) |
|
|
|
|
|
|
| TransAlta Corporation with proportionate share of TransAlta Renewables |
9,054 |
|
8,140 |
|
|
|
|
|
|
|
|
|
|
799 |
|
432 |
|
|
|
426 |
|
192 |
|
|
| Non-controlling interests |
1,514 |
|
1,680 |
|
|
|
|
|
|
|
|
|
|
91 |
|
106 |
|
|
|
36 |
|
28 |
|
|
| TransAlta consolidated |
10,568 |
|
9,820 |
|
|
|
|
|
|
|
|
|
|
890 |
|
538 |
|
|
|
462 |
|
220 |
|
|
(1) Adjusted EBITDA is defined in the Additional IFRS Measures and Non-IFRS Measures section of this MD&A and reconciled to earnings (loss) before income taxes above.
(2) TransAlta Renewables amounts are comprised of its reported earnings before income taxes plus the reported earnings before income taxes of the assets in which it holds an economic interest less finance income related to subsidiaries of TransAlta.
(3) Wind and Solar and Gas segments include those assets in which TransAlta Renewables holds an economic interest.
TransAlta Corporation M39
MANAGEMENT'S DISCUSSION AND ANALYSIS
Key Non-IFRS Financial Ratios
The methodologies and ratios used by rating agencies to assess our credit rating are not publicly disclosed. We have developed our own definitions of ratios and targets to help evaluate the strength of our financial position. These metrics and ratios are not defined and have no standardized meaning under IFRS and may not be comparable to those used by other entities or by rating agencies.
Adjusted Net Debt to Adjusted EBITDA
|
|
|
|
|
|
|
|
|
|
| As at |
June 30, 2023 |
Dec. 31, 2022 |
|
Period-end long-term debt(1) |
3,586 |
|
3,653 |
|
|
| Exchangeable securities |
342 |
|
339 |
|
|
Less: Cash and cash equivalents(2) |
(947) |
|
(1,118) |
|
|
Add: 50 per cent of issued preferred shares and exchangeable preferred shares(3) |
671 |
|
671 |
|
|
Other(4) |
— |
|
(20) |
|
|
Adjusted net debt(5) |
3,652 |
|
3,525 |
|
|
Adjusted EBITDA(6) |
1,986 |
|
1,634 |
|
|
Adjusted net debt to adjusted EBITDA(times) |
1.8 |
|
2.2 |
|
|
(1) Consists of current and long-term portion of debt, which includes lease liabilities and tax equity financing.
(2) Cash and cash equivalents, net of bank overdraft.
(3) Exchangeable preferred shares are considered equity with dividend payments for credit-rating purposes. For accounting purposes, they are accounted for as debt with interest expense in the consolidated financial statements. For purposes of this ratio, we consider 50 per cent of issued preferred shares, including those classified as debt.
(4) Includes principal portion of TransAlta OCP restricted cash (nil for the period ended June 30, 2023) and fair value of hedging instruments on debt (included in risk management assets and/or liabilities on the Consolidated Statements of Financial Position).
(5) The tax equity financing for the Skookumchuck wind facility, an equity accounted joint venture, is not represented in this amount. Adjusted net debt is not defined and has no standardized meaning under IFRS. Presenting this item from period to period provides management and investors with the ability to evaluate earnings trends more readily in comparison with prior periods’ results. Refer to the Additional IFRS Measures and Non-IFRS Measures section of this MD&A.
(6) Last 12 months.
The Company's capital is managed internally and evaluated by management using a net debt position. We use the adjusted net debt to adjusted EBITDA ratio as a measurement of financial leverage and to assess our ability to service debt. Our target for adjusted net debt to adjusted EBITDA is 3.0 to 3.5 times. Our adjusted net debt to adjusted EBITDA ratio for June 30, 2023 was lower compared to Dec. 31, 2022, as a result of higher adjusted EBITDA and debt repayments, partially offset by lower cash and cash equivalents.
TransAlta Corporation M40
MANAGEMENT'S DISCUSSION AND ANALYSIS
Deconsolidated Adjusted EBITDA by Segment
We invest in our assets directly as well as with joint venture partners. Deconsolidated financial information is a supplementary financial measure and is not intended to be presented in accordance with IFRS.
Adjusted EBITDA is a key metric for TransAlta and TransAlta Renewables and provides management and shareholders a representation of core business profitability. Deconsolidated adjusted EBITDA is used in key planning and credit metrics, and segment results highlight the operating performance of assets held directly at TransAlta that are comparable from period to period.
A reconciliation of adjusted EBITDA to deconsolidated adjusted EBITDA by segment results is set out below:
|
|
|
|
|
|
|
|
|
|
|
|
|
|
|
|
|
|
|
|
|
|
|
|
|
|
|
|
|
3 months ended June 30, 2023 |
|
3 months ended June 30, 2022 |
|
|
|
TransAlta Consolidated |
TransAlta Renewables |
TransAlta Deconsolidated |
|
TransAlta Consolidated |
TransAlta Renewables |
TransAlta Deconsolidated |
|
|
|
|
| Hydro |
147 |
|
5 |
|
|
|
88 |
|
7 |
|
|
|
|
|
|
| Wind and Solar |
50 |
|
43 |
|
|
|
88 |
|
68 |
|
|
|
|
|
|
| Gas |
166 |
|
58 |
|
|
|
65 |
|
56 |
|
|
|
|
|
|
| Energy Transition |
13 |
|
— |
|
|
|
11 |
|
— |
|
|
|
|
|
|
| Energy Marketing |
43 |
|
— |
|
|
|
50 |
|
— |
|
|
|
|
|
|
| Corporate |
(32) |
|
(6) |
|
|
|
(23) |
|
(5) |
|
|
|
|
|
|
| Adjusted EBITDA |
387 |
|
100 |
|
287 |
|
|
279 |
|
126 |
|
153 |
|
|
|
|
|
| Less: TA Cogen adjusted EBITDA |
|
|
(47) |
|
|
|
|
(15) |
|
|
|
|
|
|
|
|
|
|
|
|
|
|
|
|
|
Add: Dividend from TransAlta
Renewables |
|
|
37 |
|
|
|
|
37 |
|
|
|
|
|
| Add: Dividend from TA Cogen |
|
|
18 |
|
|
|
|
— |
|
|
|
|
|
Deconsolidated TransAlta
adjusted EBITDA |
|
|
295 |
|
|
|
|
175 |
|
|
|
|
|
|
|
|
|
|
|
|
|
|
|
|
|
|
6 months ended June 30, 2023 |
|
6 months ended June 30, 2022 |
|
|
|
|
|
TransAlta Consolidated |
TransAlta Renewables |
TransAlta Deconsolidated |
|
TransAlta Consolidated |
TransAlta Renewables |
TransAlta Deconsolidated |
|
|
|
|
| Hydro |
253 |
|
4 |
|
|
|
149 |
|
8 |
|
|
|
|
|
|
| Wind and Solar |
138 |
|
120 |
|
|
|
177 |
|
156 |
|
|
|
|
|
|
| Gas |
406 |
|
116 |
|
|
|
170 |
|
112 |
|
|
|
|
|
|
| Energy Transition |
67 |
|
— |
|
|
|
16 |
|
— |
|
|
|
|
|
|
| Energy Marketing |
82 |
|
— |
|
|
|
67 |
|
— |
|
|
|
|
|
|
| Corporate |
(56) |
|
(12) |
|
|
|
(41) |
|
(11) |
|
|
|
|
|
|
| Adjusted EBITDA |
890 |
|
228 |
|
662 |
|
|
538 |
|
265 |
|
273 |
|
|
|
|
|
| Less: TA Cogen adjusted EBITDA |
|
|
(103) |
|
|
|
|
(29) |
|
|
|
|
|
|
|
|
|
|
|
|
|
|
|
|
|
Add: Dividend from TransAlta
Renewables |
|
|
75 |
|
|
|
|
75 |
|
|
|
|
|
| Add: Dividend from TA Cogen |
|
|
59 |
|
|
|
|
10 |
|
|
|
|
|
Deconsolidated TransAlta
adjusted EBITDA |
|
|
693 |
|
|
|
|
329 |
|
|
|
|
|
TransAlta Corporation M41
MANAGEMENT'S DISCUSSION AND ANALYSIS
Deconsolidated FFO
The Company has set capital allocation targets based on deconsolidated FFO available to shareholders. Deconsolidated financial information is a supplementary financial measure and is not defined, has no standardized meaning under IFRS and may not be comparable to those used by other entities or by rating agencies. See also the Additional IFRS Measures and Non-IFRS Measures section of this MD&A for further details. Deconsolidated FFO for the period ended June 30, 2023 and 2022 is detailed below:
|
|
|
|
|
|
|
|
|
|
|
|
|
|
|
|
|
|
|
|
|
|
|
|
|
|
|
|
|
3 months ended June 30, 2023 |
|
3 months ended June 30, 2022 |
|
|
|
TransAlta Consolidated |
TransAlta Renewables |
TransAlta Deconsolidated |
|
TransAlta Consolidated |
TransAlta Renewables |
TransAlta Deconsolidated |
|
|
|
|
| Cash flow from (used in) operating activities |
11 |
|
41 |
|
|
|
(129) |
|
28 |
|
|
|
|
|
|
| Change in non-cash operating working capital balances |
408 |
|
(4) |
|
|
|
260 |
|
19 |
|
|
|
|
|
|
| Cash flow from operations before changes in working capital |
419 |
|
37 |
|
|
|
131 |
|
47 |
|
|
|
|
|
|
| Adjustments: |
|
|
|
|
|
|
|
|
|
|
|
| Decrease in finance lease receivable |
13 |
|
— |
|
|
|
11 |
|
— |
|
|
|
|
|
|
| Clean energy transition provisions and adjustments |
7 |
|
— |
|
|
|
8 |
|
— |
|
|
|
|
|
|
| Share of FFO from joint venture |
5 |
|
— |
|
|
|
2 |
|
— |
|
|
|
|
|
|
| Realized gain (loss) on closed exchange positions |
(52) |
|
— |
|
|
|
65 |
|
— |
|
|
|
|
|
|
| Finance income - economic interests |
— |
|
(3) |
|
|
|
— |
|
(3) |
|
|
|
|
|
|
FFO - economic interests(1) |
— |
|
63 |
|
|
|
— |
|
50 |
|
|
|
|
|
|
Other(2) |
(1) |
|
— |
|
|
|
3 |
|
— |
|
|
|
|
|
|
| FFO |
391 |
|
97 |
|
294 |
|
|
220 |
|
94 |
|
126 |
|
|
|
|
| Dividend from TransAlta Renewables |
|
|
37 |
|
|
|
|
37 |
|
|
|
|
|
| Distributions to TA Cogen's Partner |
|
|
(28) |
|
|
|
|
(4) |
|
|
|
|
|
|
|
|
|
|
|
|
|
|
|
|
|
| Deconsolidated TransAlta FFO |
|
|
303 |
|
|
|
|
159 |
|
|
|
|
|
(1) FFO - economic interests calculated as FCF economic interests plus sustaining capital expenditures economic interests.
(2) Other consists of production tax credits, which is a reduction to tax equity debt, less distributions from equity accounted joint venture.
TransAlta Corporation M42
MANAGEMENT'S DISCUSSION AND ANALYSIS
|
|
|
|
|
|
|
|
|
|
|
|
|
|
|
|
|
|
|
|
|
|
|
|
|
6 months ended June 30, 2023 |
|
6 months ended June 30, 2022 |
|
TransAlta Consolidated |
TransAlta Renewables |
TransAlta Deconsolidated |
|
TransAlta Consolidated |
TransAlta Renewables |
TransAlta Deconsolidated |
| Cash flow from operating activities |
473 |
|
108 |
|
|
|
322 |
|
131 |
|
|
| Change in non-cash operating working capital balances |
366 |
|
(2) |
|
|
|
(24) |
|
2 |
|
|
| Cash flow from operations before changes in working capital |
839 |
|
106 |
|
|
|
298 |
|
133 |
|
|
| Adjustments: |
|
|
|
|
|
|
|
| Decrease in finance lease receivable |
26 |
|
— |
|
|
|
22 |
|
— |
|
|
| Clean energy transition provisions and adjustments |
7 |
|
— |
|
|
|
8 |
|
— |
|
|
| Share of FFO from joint venture |
8 |
|
— |
|
|
|
5 |
|
— |
|
|
| Realized gain (loss) on closed exchange positions |
(120) |
|
— |
|
|
|
58 |
|
— |
|
|
| Finance income - economic interests |
— |
|
(26) |
|
|
|
— |
|
(22) |
|
|
FFO - economic interests(1) |
— |
|
115 |
|
|
|
— |
|
99 |
|
|
Other(2) |
5 |
|
— |
|
|
|
8 |
|
— |
|
|
| FFO |
765 |
|
195 |
|
570 |
|
|
399 |
|
210 |
|
189 |
| Dividend from TransAlta Renewables |
|
|
75 |
|
|
|
|
75 |
|
| Distributions to TA Cogen's Partner |
|
|
(79) |
|
|
|
|
(22) |
|
|
|
|
|
|
|
|
|
| Deconsolidated TransAlta FFO |
|
|
566 |
|
|
|
|
242 |
|
(1) FFO - economic interests calculated as FCF economic interests plus sustaining capital expenditures economic interests.
(2) Other consists of production tax credits, which is a reduction to tax equity debt, less distributions from equity accounted joint venture.
Deconsolidated Net Debt to Deconsolidated Adjusted EBITDA
In addition to reviewing fully consolidated ratios and results, management reviews net debt to adjusted EBITDA on a deconsolidated basis to highlight TransAlta's financial flexibility, balance sheet strength and leverage. Deconsolidated financial information is a supplementary financial measure and is not defined under IFRS, and may not be comparable to measures used by other entities or by rating agencies. Also, refer to the Additional IFRS Measures and Non-IFRS Measures section of this MD&A for further details.
|
|
|
|
|
|
|
|
|
|
| As at |
June 30, 2023 |
Dec. 31, 2022 |
|
|
|
|
|
|
|
|
|
|
|
|
|
|
|
|
|
|
|
|
|
Adjusted net debt(1) |
3,652 |
|
3,525 |
|
|
Add: TransAlta Renewables cash and cash equivalents(2) |
147 |
|
234 |
|
|
| Less: TransAlta Renewables long-term debt |
(813) |
|
(790) |
|
|
Less: US tax equity financing and South Hedland debt(3) |
(784) |
|
(834) |
|
|
| Deconsolidated net debt |
2,202 |
|
2,135 |
|
|
|
|
|
|
Deconsolidated adjusted EBITDA(4)(5) |
1,517 |
|
1,153 |
|
|
Deconsolidated net debt to deconsolidated adjusted EBITDA(6) (times) |
1.5 |
|
1.9 |
|
|
(1) Adjusted net debt is a Non-IFRS measure. Refer to the Adjusted Net Debt to Adjusted EBITDA calculation under the Key Financial Non-IFRS Financial Ratios section of this MD&A for the reconciliation and composition of adjusted net debt.
(2) Includes cash held within TransAlta Energy (Australia) Pty Ltd. reserved for future funding of Australian growth projects by TransAlta Renewables.
(3) Relates to assets where TransAlta Renewables has economic interests.
(4) Refer to the Deconsolidated Adjusted EBITDA by Segment section of this MD&A for the reconciliation and composition of deconsolidated adjusted EBITDA and the Additional IFRS Measures and Non-IFRS Measures section of this MD&A for the composition of adjusted EBITDA.
(5) Last 12 months.
(6) The non-IFRS ratio is not a standardized financial measure under IFRS and might not be comparable to similar financial measures disclosed by other issuers.
Our target for deconsolidated net debt to deconsolidated adjusted EBITDA is 2.5 to 3.0 times. Our deconsolidated net debt to deconsolidated adjusted EBITDA ratio for June 30, 2023 improved compared with Dec. 31, 2022, as higher deconsolidated adjusted EBITDA more than offset the increase in deconsolidated net debt.
2023 Outlook
TransAlta Corporation M43
MANAGEMENT'S DISCUSSION AND ANALYSIS
Our annual outlook highlights continued strong cash flow expectations for 2023 and, as a result we have revised our 2023 full year financial guidance upwards for both adjusted EBITDA and free cash flow to reflect stronger market conditions and solid operational performance. Our fleet remains well positioned to capture the ongoing strength that we see in the Alberta merchant market. The Company is focused on redeploying these cash flows towards growing our contracted clean electricity asset base.
The Company does not expect changes in our expectations of key financial targets and assumptions for 2023 as a result of the recently announced agreement where the Company will acquire all of the outstanding common shares of TransAlta Renewables, not already owned directly or indirectly by TransAlta and certain of its affiliates. Refer to the Significant and Subsequent Events section for more details.
The following table outlines our updated expectations on key financial targets and related assumptions for 2023 and should be read in conjunction with the narrative discussion that follows and the Governance and Risk Management section of this MD&A:
|
|
|
|
|
|
|
|
|
|
|
|
| Measure |
Updated Target 2023 |
Original Target 2023 |
2022 Actuals |
Adjusted EBITDA(1)(2) |
$1,700 million - $1,800 million |
$1,200 million -$1,320 million |
$1,634 million |
FCF(1)(2) |
$850 million - $950 million |
$560 million - $660 million |
$961 million |
| Dividend |
no change |
$0.22 per share annualized |
$0.20 per share annualized |
(1) These items are not defined and have no standardized meaning under IFRS. Refer to the Reconciliation of Non-IFRS Measures section of this MD&A for further discussion of these items, including, where applicable, reconciliations to measures calculated in accordance with IFRS. See also the Additional IFRS Measures and Non-IFRS Measures section of this MD&A.
(2) During the second quarter of 2023, the Company revised and increased our 2023 guidance for adjusted EBITDA and FCF based on the strong financial performance attained to date and our expectations for the balance of the year.
|
|
|
|
|
|
|
|
|
|
| Range of key 2023 power and gas price assumptions |
|
|
| Market |
Updated 2023 Assumptions |
2023 Original Assumptions |
|
| Alberta Spot ($/MWh) |
$150 to $170 |
$105 to $135 |
|
| Mid-C Spot (US$/MWh) |
US$90 to US$100 |
US$75 to US$85 |
|
| AECO Gas Price ($/GJ) |
$2.50 |
$4.60 |
|
Alberta spot price sensitivity: a +/- $1 per MWh change in spot price is expected to have a +/- $4 million impact on adjusted EBITDA for 2023.
|
|
|
|
|
|
|
|
|
|
| Other assumptions relevant to the 2023 outlook |
|
|
|
Updated 2023 Expectations |
2023 Original Expectations |
|
| Sustaining capital |
no change |
$140 million - $170 million |
|
| Energy Marketing gross margin |
$130 million - $150 million |
$90 million - $110 million |
|
Alberta Hedging
|
|
|
|
|
|
|
|
|
|
|
|
|
|
|
|
| Range of hedging assumptions |
|
Q3 2023 |
Q4 2023 |
Full year 2024 |
Full year 2025 |
|
|
|
|
|
|
| Hedged production (GWh) |
|
2,012 |
|
1,558 |
|
4,506 |
|
2,423 |
|
| Hedge price ($/MWh) |
|
$116 |
$84 |
$82 |
$83 |
| Hedged gas volumes (GJ) |
|
18 million |
15 million |
44 million |
22 million |
| Hedge gas prices ($/GJ) |
|
$2.27 |
$2.26 |
$2.64 |
$3.62 |
|
|
|
|
|
|
|
|
|
|
|
|
|
Refer to the 2023 Financial Outlook section in our 2022 Annual MD&A for further details relating to our Outlook and related assumptions.
TransAlta Corporation M44
MANAGEMENT'S DISCUSSION AND ANALYSIS
Operations
The following provides an update to our assumptions included in the 2023 Outlook.
Market Pricing
The following graphs include 2023 pricing based on a range of assumptions and are subject to change:
For 2023, we are seeing stronger merchant pricing levels in Alberta and the Pacific Northwest relative to our guidance ranges. Higher pricing in Alberta is expected to be driven by tighter supply conditions resulting from outage extensions, delays in new asset entrants, transmission announcements limiting imports as well as supportive prices in adjacent power and natural gas markets driving export demand. Stronger pricing in the Pacific Northwest is being driven by lower than normal hydrology for the region. Ontario power prices for 2023 are expected to be lower than 2022 due to lower natural gas prices despite ongoing nuclear refurbishment outages.
AECO natural gas prices for the six months ended June 30, 2023, were lower than for the same periods in 2022 mainly due to improved production and storage levels in Alberta and North America.
The objective of our portfolio management strategy in Alberta is to balance opportunity and risk and to deliver optimization strategies that contribute to our total investment, which includes a return of and on invested capital. We can be more or less hedged in a given period, and we expect to realize our annual targets through a combination of forward hedging and selling generation into the spot market. The assets within the Alberta electricity portfolio are managed as a portfolio to maximize the overall value of generation and capacity from our hydro, wind, energy storage and thermal facilities. Financial hedging is a key component of cash flow certainty and the hedges are primarily tied to our portfolio of gas assets and opportunistically allocated to our portfolio of hydro facilities rather than a single facility.
TransAlta Corporation M45
MANAGEMENT'S DISCUSSION AND ANALYSIS
Sustaining Capital Expenditures
Our estimate for total sustaining capital is as follows:
|
|
|
|
|
|
|
|
|
|
|
|
|
|
|
|
|
Spend for 3 months ended June 30, 2023 |
Spend to date for 6 months ended June 30, 2023 |
Expected spend in 2023 |
| Total sustaining capital |
44 |
|
64 |
|
140-170 |
Total sustaining capital expenditures for the three and six months ended June 30, 2023, were $13 million and $16 million higher, respectively, compared to the same periods in 2022, mainly due to higher spending on leasehold improvements and information technology associated with the relocation of the Company's head office and planned major maintenance at the gas facilities.
The Kent Hills foundation rehabilitation capital expenditure has been segregated from our sustaining capital range due to the extraordinary and rare nature of this expenditure.
Kent Hills Rehabilitation
The Kent Hills 1 and 2 wind facilities were taken out of operation following the tower failure event that occurred in September 2021. This event resulted in approximately 150 MW of gross production being taken offline temporarily as the Company replaces all 50 turbine foundations. The extended outage is expected to result in foregone revenue of approximately $3 million per month on an annualized basis (to the extent all 50 turbines at the Kent Hills 1 and 2 wind facilities are offline), based on average historical wind production, with revenue expected to be earned as the wind turbines are returned to service. Turbines have started to return to service and each of the remaining turbines at Kent Hills 1 and 2 wind facilities will return to service as soon as its foundation is replaced and the turbine is reassembled and tested.
Rehabilitation of the Kent Hills 1 and 2 wind facilities is well underway. All of the towers have been fully disassembled with foundation demolition and removal completed. All foundations have now been poured. 27 turbines have been fully reassembled. Turbines are being commissioned and returned to service as they are completed, to date 10 turbines have been placed back in operation and the remaining turbines are expected to return to service in the second half of 2023. The current estimate of the total capital expenditures is approximately $140 million, inclusive of insurance proceeds. Capital expenditures include amounts for opportunistic blade repairs stemming from condition assessments enabled by the rehabilitation program.
During the first quarter of 2023, the Company filed and served a statement of claim in the New Brunswick Court of King’s Bench against certain defendants who the Company believes are responsible for, or contributed to, the failure of the turbine foundations at the Kent Hills 1 and 2 wind facilities. The claim seeks damages for lost profits, replacement costs, and other related costs to perform the remediation of Kent Hills 1 and 2, net of any insurance recoveries. The ability to recover any amounts is uncertain at this time.
Liquidity and Capital Resources
We expect to maintain adequate available liquidity under our committed credit facilities. We currently have access to $2.3 billion in liquidity, including $0.9 billion in cash; well in excess of the funds required for committed growth, sustaining capital and productivity projects.
TransAlta Corporation M46
MANAGEMENT'S DISCUSSION AND ANALYSIS
Strategy and Capability to Deliver Results
Our goal is to be a leading customer-centred electricity company, committed to a sustainable future, focused on increasing shareholder value by growing our portfolio of high-quality generation facilities with stable and predictable cash flows. Our strategy includes meeting our customers' needs for clean, safe, low-cost, reliable electricity and providing operational excellence and continuous improvement in everything we do.
The Company's enhanced focus on renewable generation and storage solutions for customers is driven largely by global decarbonization policies and the increase in demand and growth projections in the renewable sector, namely by companies seeking to achieve their ESG ambitions. For additional information on regulatory developments, refer to the Regulatory Updates section of this MD&A.
On Sept. 28, 2021, TransAlta announced its strategic growth targets and a five-year Clean Electricity Growth Plan. Our 2023 priorities for the Clean Electricity Growth Plan include:
•Reaching final investment decision on 500 MW of additional clean energy projects across Canada, the US and Australia; and
•Adding at least 1,500 MW of new development sites to our pipeline.
We expect the Company's adjusted EBITDA generated from renewable sources, including hydro, wind and solar technologies, to increase to 70 per cent by the end of 2025. The Company has a long-term decarbonization goal of net-zero by 2045 target. The Clean Electricity Growth Plan will largely be funded from current cash balances, cash generated from operations and asset-level financing.
As of Aug. 3, 2023, we continue to make progress towards achieving the targets of the Clean Electricity Growth Plan.
TransAlta Corporation M47
MANAGEMENT'S DISCUSSION AND ANALYSIS
Our progress towards achieving our strategic targets is summarized below:
|
|
|
|
|
|
|
|
|
|
|
|
| Strategic Targets |
| Goals |
Target |
Results |
Comments |
Accelerate Growth in Customer-centered Renewables and Storage |
Deliver 2 GW of renewable capacity with an estimated capital investment of $3.6 billion by the end of 2025. |
On track |
Construction projects for 678 MW of renewable capacity and transmission is currently underway and expected to reach commercial operations in the second half of 2023 and the first half of 2024.
The Company is currently advancing an additional 418 MW of advanced-stage projects towards final investment decision.
In July, the Company announced that it intends to acquire all of the outstanding common shares of TransAlta Renewables not already owned, direct or indirectly, by the Company. The transaction will provide economic contribution from an incremental 1,187 MW of generating capacity and increase the proportion of the Company's contractedness.
|
Deliver incremental average annual EBITDA of $315 million. |
On track |
The cumulative progress towards our incremental EBITDA target is approximately $151 million. This comprises the acquisition of the North Carolina Solar project as well as the 678 MW of growth and transmission projects that are currently in the construction stage. |
| Expand the Company's development pipeline to 5 GW by 2025 to enable a two-fold increase in its renewables fleet between 2025 and 2030. |
On track |
The Company is actively developing our pipeline. In the second quarter of 2023, the Company acquired an opportunity to develop 160 MW of hydro pumped storage and a combined 300 MW of wind prospects in the United States and Australia. |
| Take a Targeted Approach to Diversification |
Grow our asset base in our core geographies of Canada, Australia and the US to realize diversification and value creation. |
On track |
The Company has successfully added new contracted renewable assets in each of its three core geographies. We have diversified within the US market through our North Carolina Solar facility acquisition in 2021 and the new Oklahoma investments, which added three new investment-grade customers in 2022 and 2021. |
| Maintain Our Financial Strength and Capital Allocation Discipline |
Deliver strong cash flow from our existing portfolio to allocate towards our funding priorities including growth, dividends and share buybacks. |
On track |
The Company had liquidity of $2.3 billion as at June 30, 2023.
The Company returned $71 million to shareholders through share buybacks in 2023 under our NCIB.
The Company increased the annual common share dividend by 10 per cent to $0.22 per year effective Jan. 1, 2023.
|
Define the Next Generation of Energy Solutions and Technologies |
Meet the needs of our customers and communities through the implementation of innovative energy solutions and parallel investments in new complementary sectors by the end of 2025. |
On track |
The Company established an Energy Innovation team to progress our goals in this area. The team has completed an equity investment in Ekona Power Inc., an early-stage hydrogen production company, in order to pursue commercialization of low cost, net-zero aligned hydrogen. The Company also committed to invest US$25 million over the next four years in the Energy Impact Partners Frontier Fund, which provides a portfolio approach to investing in emerging technologies focused on net-zero emissions. In total, the Company invested $14 million to this fund as at June 30, 2023. |
| Lead in ESG Policy Development |
Actively participate in policy development to ensure the electricity that we provide contributes to emissions reduction, grid reliability and competitive energy prices to enable the successful evolution of the markets in which we operate and compete. |
On track |
The Company is actively engaging the Government of Canada and Government of Alberta regarding the proposed federal Clean Electricity Regulations. TransAlta continues to provide input regarding how to achieve emissions reductions while maintaining reliability and affordability.
The Company continues to work with the Government of Canada on the design details of the investment tax credits and clean technology funding provided through the Government of Canada's 2023 budget.
|
|
|
|
|
TransAlta Corporation M48
MANAGEMENT'S DISCUSSION AND ANALYSIS
Growth
We have established, and are continuing to expand, our pipeline of potential growth projects. Our pipeline includes 418 MW of advanced-stage development projects along with 4,191 MW to 5,291 MW of projects in earlier stages of development.
During the six months ended June 30, 2023, we expanded our pipeline of potential growth projects by 630 MW.
We are primarily evaluating greenfield opportunities in Alberta, Western Australia and the US along with acquisitions in markets in which we have existing operations.
Projects under Construction
The following projects have been approved by the Board of Directors, have executed PPAs and are currently under construction. The projects under construction will be financed through existing liquidity in the near term. We will continue to explore project financing or tax equity as a long-term financing solution on an asset-by-asset basis.
|
|
|
|
|
|
|
|
|
|
|
|
|
|
|
|
|
|
|
|
|
|
|
|
|
|
|
|
|
|
|
|
|
|
|
|
|
|
|
|
Total project (millions) |
|
|
|
|
| Project |
Type |
Region |
MW |
Estimated
spend |
Spent to
date |
Target completion date(1) |
PPA Term(2) |
Average annual EBITDA(3) |
Status |
| Canada |
|
|
|
|
|
|
|
|
|
|
|
Garden
Plain |
Wind |
AB |
130 |
$190 |
|
— |
$200 |
$183 |
|
H2 2023 |
17 |
$14-$15 |
•Fully contracted
•Final commissioning is now underway
|
| United States |
|
|
|
|
|
|
|
|
|
|
White
Rock |
Wind |
OK |
300 |
US$500 |
|
— |
US$520 |
US$391 |
H1 2024 |
— |
US$48-US$52 |
•Long-term PPAs executed
•Wind turbine component deliveries in progress
•Construction activities are underway
|
Horizon
Hill |
Wind |
OK |
200 |
US$320 |
|
— |
US$330 |
US$258 |
H1 2024 |
— |
US$32-US$34 |
•Long-term PPA executed
•Wind turbine component deliveries are complete
•Construction activities are underway
|
| Australia |
|
|
|
|
|
|
|
|
|
|
Northern
Goldfields |
Hybrid Solar |
WA |
48 |
AU$69 |
|
— |
AU$73 |
AU$64 |
H2 2023 |
16 |
AU$9 - AU$10 |
•Construction nearing completion
•Commissioning is now underway
•On track to be completed in the second half of 2023
|
Mount
Keith
132kV
Expansion |
Transmission |
WA |
n/a |
AU$54 |
|
— |
AU$57 |
AU$34 |
H2 2023 |
15 |
AU$6 - AU$7 |
•Transmission line and transformer installation complete
•Remaining construction activities are progressing
•On track to be completed in the second half of 2023
|
Total (4) |
|
|
678 |
$ |
1,391 |
|
— |
$ |
1,447 |
|
1,137 |
|
|
$134 - $145 |
|
(1) H1 is defined as the first half of the year. H2 is defined as the second half of the year.
(2) The PPA term is confidential for the White Rock wind projects and Horizon Hill wind project.
(3) This item is not defined and has no standardized meaning under IFRS and is forward-looking. Refer to the Additional IFRS Measures and Non-IFRS Measures section of this MD&A for further discussion.
(4) Total expected spending and average annual EBITDA was converted using a Canadian dollar forward exchange rate for 2023. Spend to date was converted using the period end closing rate.
TransAlta Corporation M49
MANAGEMENT'S DISCUSSION AND ANALYSIS
Advanced-Stage Development
These projects have detailed engineering, advanced position in the interconnection queue and are progressing offtake opportunities. The following table shows the pipeline of future growth projects currently under advanced-stage development:
|
|
|
|
|
|
|
|
|
|
|
|
|
|
|
|
|
|
|
|
|
Project(1) |
Type |
Region |
Target completion date |
MW |
Estimated spend |
Average annual EBITDA(2) |
| Tempest |
Wind |
Alberta |
2025 |
100 |
$250-$270 |
$23-$25 |
| SCE Capacity Expansion |
Gas |
Western Australia |
2025 |
94 |
AU$180-AU$200 |
AU$24-AU$28 |
| WaterCharger |
Battery Storage |
Alberta |
2024 |
180 |
$195-$215 |
$17-$20 |
| Australia Transmission Expansion |
Transmission |
Western Australia |
2024 |
n/a |
AU$70-AU$75 |
AU$7-AU$8 |
| Pinnacle 1 & 2 |
Gas |
Alberta |
2025 |
44 |
$60-$70 |
$12-$15 |
Total(3) |
|
|
|
418 |
$733 - $805 |
$80 - $93 |
(1) Projects in advanced-stage development are progressing towards final investment decision and have not received final approval from the Board of Directors at time of reporting.
(2) This item is not defined, has no standardized meaning under IFRS and is forward-looking. Refer to the Additional IFRS Measures and Non-IFRS Measures section of this MD&A for further discussion.
(3) Total expected spending and average annual EBITDA was converted using a Canadian dollar forward exchange rate for 2023.
Early-Stage Development
These projects are in the early stages and may or may not move ahead. Generally, these projects will have:
•Collected meteorological data;
•Begun securing land control;
•Started environmental studies;
•Confirmed appropriate access to transmission; and
•Started preliminary permitting and other regulatory approval processes.
TransAlta Corporation M50
MANAGEMENT'S DISCUSSION AND ANALYSIS
The following table shows the pipeline of future growth projects currently under early-stage development:
|
|
|
|
|
|
|
|
|
|
|
|
|
|
|
| Project |
Type |
Region |
Potential completion date (1) |
MW |
|
|
|
|
|
| Canada |
|
|
|
|
| Riplinger Wind |
Wind |
Alberta |
2026 |
|
300 |
|
| Red Rock |
Wind |
Alberta |
2028 |
|
100 |
|
| Willow Creek 1 |
Wind |
Alberta |
2027 |
|
70 |
|
| Willow Creek 2 |
Wind |
Alberta |
2027 |
|
70 |
|
| Sunhills Solar |
Solar |
Alberta |
2026 |
|
115 |
|
| McNeil Solar |
Solar |
Alberta |
2026 |
|
57 |
|
| Canadian Battery opportunity |
Battery |
New Brunswick |
2025 |
|
10 |
|
| Canadian Wind opportunities |
Wind |
Various |
2027+ |
370 |
|
| Tent Mountain Pumped Storage |
Hydro |
Alberta |
2028-2030 |
160 |
|
| Brazeau Pumped Hydro |
Hydro |
Alberta |
2037 |
|
300-900 |
| Alberta Thermal Redevelopment |
Various |
Alberta |
TBD |
250-500 |
|
|
Total |
|
1,802 - 2,652 |
| United States |
|
|
|
|
| Old Town |
Wind |
Illinois |
2026 |
|
185 |
|
| Trapper Valley |
Wind |
Wyoming |
2028 |
|
225 |
|
| Monument Road |
Wind |
Nebraska |
2025 |
|
152 |
|
| Dos Rios |
Wind |
Oklahoma |
2026 |
|
242 |
|
| Prairie Violet |
Wind |
Illinois |
2027 |
|
130 |
|
| Big Timber |
Wind |
Pennsylvania |
2027 |
|
50 |
|
| Oklahoma Solar |
Solar |
Oklahoma |
2026 |
|
100 |
|
| Milligan 3 |
Wind |
Nebraska |
2026 |
|
126 |
|
| Other Wind and Solar prospects |
Wind and Solar |
Various |
2025+ |
659 |
|
| Centralia site redevelopment |
Various |
Washington |
TBD |
250-500 |
|
|
Total |
|
2,119 - 2,369 |
| Australia |
|
|
|
|
| Australian prospects |
Gas, Solar, Wind |
Western Australia |
2025+ |
220 |
|
| South Hedland Solar |
Solar |
Western Australia |
2026 |
|
50 |
|
|
|
Total |
|
270 |
|
| Canada, United States and Australia |
|
Total |
|
4,191 - 5,291 |
(1) Potential completion date is to be determined ("TBD").
TransAlta Corporation M51
MANAGEMENT'S DISCUSSION AND ANALYSIS
Material Accounting Policies and Critical Accounting Estimates
The preparation of unaudited interim condensed consolidated financial statements requires management to make judgments, estimates and assumptions that could affect the reported amounts of assets, liabilities, revenues, expenses and disclosures of contingent assets and liabilities during the period. These estimates are subject to uncertainty. Actual results could differ from these estimates due to factors such as fluctuations in interest rates, foreign exchange rates, inflation and commodity prices, and changes in economic conditions, legislation and regulations. The following were material changes in estimates in the quarter:
Decommissioning and Restoration Provisions
The Company recognizes provisions for decommissioning obligations. Initial decommissioning provisions and subsequent changes thereto, are determined using the Company’s best estimate of the required cash expenditures, adjusted to reflect the risks and uncertainties inherent in the timing and amount of settlement.
During the six months ended June 30, 2023, the decommissioning and restoration provision increased by $19 million from Dec. 31, 2022. Revisions in discount rates increased the decommissioning and restoration provision by $16 million due to a decrease in discount rates, largely driven by decreases in long-term market benchmark rates. On average, discount rates decreased with rates ranging from 6.8 to 9.5 per cent as at June 30, 2023 from 7.0 to 9.7 per cent as at Dec. 31, 2022. This has resulted in a corresponding increase in PP&E of $11 million on operating assets and recognition of a $5 million impairment charge in net earnings related to retired assets.
Reversals of Impairment of PP&E
An assessment is made at each reporting date as to whether there is any indication that an impairment loss may exist or that a previously recognized impairment loss may no longer exist or may have decreased. An impairment exists when the carrying amount of an asset exceeds its recoverable amount, which is the higher of its fair value less costs of disposal and its value in use. An impairment loss recognized in a prior period is reversed if there has been a change in the estimates used to determine the asset's recoverable amount.
During the three and six months ended June 30, 2023, the Company recognized asset impairment reversals, net of impairment charges, of $13 million and $16 million, respectively. Refer to Note 5 of the unaudited condensed consolidated financial statements for the three and six months ended June 30, 2023.
Accounting Changes
Current Accounting Changes
Amendments to IAS 12 Deferred Tax Related to Assets and Liabilities Arising from a Single Transaction
On May 7, 2021, the International Accounting Standards Board (“IASB”) issued amendments to IAS 12 Deferred Tax Related to Assets and Liabilities Arising from a Single Transaction. The amendments clarify that the initial recognition exemption under IAS 12 does not apply to transactions such as leases and decommissioning obligations. These transactions give rise to equal and offsetting temporary differences in which deferred tax should be recognized.
The amendments are effective for annual periods beginning on or after Jan. 1, 2023, and were adopted by the Company on that date. The Company's accounting aligns with the amendment and no financial impact arose upon adoption.
Future Accounting Changes
Please refer to Note 3 of the audited annual consolidated financial statements for the future accounting policies impacting the Company. For the three and six months ended June 30, 2023, no additional future accounting policy changes impacting the Company were identified.
TransAlta Corporation M52
MANAGEMENT'S DISCUSSION AND ANALYSIS
Governance and Risk Management
Our business activities expose us to a variety of risks and opportunities including, but not limited to, regulatory changes, rapidly changing market dynamics and increased volatility in our key commodity markets. Our goal is to manage these risks and opportunities so that we are in a position to develop our business and achieve our goals while remaining reasonably protected from an unacceptable level of risk or financial exposure. We use a multilevel risk management oversight structure to manage the risks and opportunities arising from our business activities, the markets in which we operate and the political environments and structures with which we interact.
Please refer to the Governance and Risk Management section of our 2022 Annual MD&A and Note 11 of our unaudited interim condensed consolidated financial statements for details on our risks and how we manage them. Our risk management profile and practices have not changed materially from Dec. 31, 2022.
Regulatory Updates
Refer to the Policy and Legal Risks discussion in our 2022 Annual MD&A for further details that supplement the recent developments as discussed below:
Canada
Federal Climate Plan
In April 2021, the Government of Canada announced a revised national greenhouse gas ("GHG") emissions reduction target of 40 per cent to 45 per cent below 2005 levels by 2030.
In 2022, the Government of Canada’s Department of Environment and Climate Change Canada (“ECCC”) released the proposed framework for the Clean Electricity Regulation to achieve a net-zero electricity sector in Canada by 2035. ECCC continues to develop the proposed regulation with the publication of a draft regulation now expected late in the third quarter of 2023.
In the 2023 federal budget, the government announced additional investment tax credit ("ITC") categories and details aimed at supporting the net zero transition. The ITCs are expected to support investments in net zero technologies in the electricity sector. On June 6, 2023 the Department of Finance launched consultations seeking feedback on design details regarding the ITC components included in Budget 2023.
Federal Carbon Pricing on Greenhouse Gas Emissions
On June 21, 2018, the Canadian federal Greenhouse Gas Pollution Pricing Act ("GGPPA") came into force. Under the GGPPA, the Canadian federal government implemented a national price on GHG emissions. Amendments to Schedule 4 of the GGPPA were completed in October 2022. These amendments aligned facility emission charges with the government's updated carbon price trajectory of $65 per tonne of CO2 in 2023 with increases of $15 per year to $170 per tonne by 2030.
On April 12, 2023, the federal government published Regulations Amending Schedule 2 to the GGPPA, Amending the Fuel Charge Regulations and Repealing the Part 1 of the Greenhouse Gas Pollution Pricing Act Regulations (Alberta) under sections 166 and 168 of the GGPPA. The amending regulations add a new table to Schedule 2 to the GGPPA that specifies the fuel charge rates out to 2030. These rates reflect the annual increase in the price on carbon pollution of $15 per tonne from 2023 to 2030 (from $65 per tonne in 2023–2024 to $170 per tonne in 2030–2031). This amendment is not expected to impact TransAlta as the Company received exemption certificates from the fuel charge due to coverage under the Alberta TIER and Ontario Emissions Performance Standards regulations.
Alberta
On April 19, 2023, the Government of Alberta released the Emissions Reduction and Energy Development Plan, which commits to an aspiration to achieve a carbon neutral economy by 2050. The plan frames Alberta's approach to enhance the province's position as a global leader in emissions reductions, clean technology and innovation, while maintaining Alberta's competitiveness from a sustainable resource development perspective. The plan is guided by eight strategic principles and outlines the actions, opportunities and new commitments that will reduce emissions and maintain energy security.
On Aug. 3, 2023, the Government of Alberta announced that the province will be pausing Alberta Utilities Commission approvals for new renewable energy development projects over one megawatt until Feb. 29, 2024. The Company will participate in the consultations that will be held by the Government of Alberta in relation to renewable project developments in the province and will continue to assess the impacts and opportunities as details become known.
TransAlta Corporation M53
MANAGEMENT'S DISCUSSION AND ANALYSIS
United States
On March 21, 2022, the U.S. Securities and Exchange Commission ("SEC") released proposed rules to enhance and standardize climate-related disclosure for investors. The proposed rules cover climate risk governance and risk management, disclosure of material impacts over all time horizons, impacts on business models, and the impact of climate-related events. The SEC invited comments on the proposed rules before finalization and we anticipate the final rules will face legal challenges. Both the Canadian Securities Administrators and the SEC have signalled that they are likely to release their climate disclosure rules in 2023. The Company is prepared to assess our disclosures to ensure compliance once the new rules are in force.
On Aug. 16, 2022, the Inflation Reduction Act ("IRA") of 2022 was signed into law by President Biden. This Act will invest approximately US$369 billion in Energy Security and Climate Change programs over the next 10 years. The administration estimates this funding will help reduce national carbon emissions by approximately 40 per cent by 2030, lower energy costs and increase clean energy production. The Treasury Department released a roadmap on March 22, 2023, to provide additional certainty regarding the timing for remaining guidance on the various components of the renewables and hydrogen tax incentives in the IRA. Additional guidance on the IRA Energy Community Tax Credit Bonus (for ITC and PTC) for projects, facilities and technologies located in energy communities was released on April 4, 2023, that helps identify areas that may be eligible for the energy communities bonus. It includes areas that have significant employment or local tax revenues from fossil fuels and higher than average unemployment. On June 14, 2023, the Treasury Department released guidance relating to domestic content, direct pay and transferability of tax credits. Additional guidance is expected for clean hydrogen ITC and prevailing wages and apprenticeship standards.
On May 11, 2023, the U.S. Environmental Protection Agency (“EPA”) announced proposed new Carbon Dioxide (“CO2”) emissions standards, under Section 111 of the Clean Air Act, for coal and gas-fired power plants by 2030. The EPA proposed CO2 limits on various subsets of new and existing power plants including: (i) new gas-fired combustion turbines; (ii) existing coal-fired generation; (iii) oil and gas-fired steam generating units; and (iv) certain existing gas-fired combustion turbines. If implemented, the regulations will complement recent Congressional investments in the IRA and the Bipartisan Infrastructure Law, along with other Clean Air Act regulations on ambient and toxic air emissions. The EPA extended the 60-day public comment period on the proposal to Aug. 8, 2023. At this time, the Company does not anticipate impacts to our operations.
Australia
Since the Labour Party formed the government on May 21, 2022, Australia has increased its Nationally Determined Contribution commitment to increase the country’s 2030 emissions reduction goal to 43 per cent below 2005 levels and confirmed its intent to boost renewable electricity production to 82 per cent of the electricity supply by 2030.
Prime Minister Anthony Albanese has worked quickly to implement one of his government’s key energy policies, the Powering Australia Plan, which includes; the Rewiring the Nation initiative that will provide AU$20 billion to support the Australian Energy Market Operator’s (“AEMO”) integrated system plan to modernize the transmission system and enable additional renewable penetration; Powering the Regions Fund (AU$1.9 billion) supporting industry to decarbonize, developing new clean energy industries and supporting workforce development; and a AU$15 billion National Reconstruction Fund to diversify and transform Australia’s economy and industry, including investments in green metals, clean energy component manufacturing and deployment of low-emissions technologies.
TransAlta Corporation M54
MANAGEMENT'S DISCUSSION AND ANALYSIS
Disclosure Controls and Procedures
Management is responsible for establishing and maintaining adequate internal control over financial reporting (‘‘ICFR’’) and disclosure controls and procedures (“DC&P’’). During the three and six months ended June 30, 2023, the majority of our workforce supporting and executing our ICFR and DC&P continue to work remotely on a hybrid basis. The Company has implemented appropriate controls and oversight for both in-office and remote work. There has been minimal impact to the design and performance of our internal controls.
ICFR is a framework designed to provide reasonable assurance regarding the reliability of financial reporting and the preparation of the consolidated financial statements for external purposes in accordance with IFRS. Management has used the Internal Control – Integrated Framework issued by the Committee of Sponsoring Organizations of the Treadway Commission (2013 framework) in order to assess the effectiveness of the Company’s ICFR.
DC&P refer to controls and other procedures designed to ensure that information required to be disclosed in the reports we file or submit under securities legislation is recorded, processed, summarized and reported within the time frame specified in applicable securities legislation. DC&P include, without limitation, controls and procedures designed to ensure that information required to be disclosed by us in our reports that we file or submit under applicable securities legislation is accumulated and communicated to management, including our Chief Executive Officer and Chief Financial Officer, as appropriate to allow timely decisions regarding our required disclosure.
Together, the ICFR and DC&P frameworks provide internal control over financial reporting and disclosure. In designing and evaluating our ICFR and DC&P, management recognizes that any controls and procedures, no matter how well designed and operated, can provide only reasonable assurance of achieving the desired control objectives and as such may not prevent or detect all misstatements and management is required to apply its judgment in evaluating and implementing possible controls and procedures. Further, the effectiveness of ICFR is subject to the risk that controls may become inadequate because of changes in conditions or that the degree of compliance with policies or procedures may change.
Management has evaluated, with the participation of our Chief Executive Officer and Chief Financial Officer, the effectiveness of our ICFR and DC&P as of the end of the period covered by this MD&A. Based on the foregoing evaluation, our Chief Executive Officer and Chief Financial Officer have concluded that, as at June 30, 2023, the end of the period covered by this MD&A, our ICFR and DC&P were effective.
TransAlta Corporation M55
Glossary of Key Terms
Adjusted Availability
Availability is adjusted when economic conditions exist, such that planned routine and major maintenance activities are scheduled to minimize expenditures. In high price environments, actual outage schedules would change to accelerate the generating unit's return to service.
Alberta Electric System Operator (AESO)
The independent system operator and regulatory authority for the Alberta Interconnected Electric System. authority for the Alberta Interconnected Electric System.
Alberta Hydro Assets
The Company's hydroelectric assets, owned through a wholly owned subsidiary, TransAlta Renewables Inc. These assets are located in Alberta consisting of the Barrier, Bearspaw, Cascade, Ghost, Horseshoe, Interlakes, Kananaskis, Pocaterra, Rundle, Spray, Three Sisters, Bighorn and Brazeau hydro facilities.
Alberta Thermal
The business segment previously disclosed as Canadian Coal has been renamed to reflect the ongoing conversion of the boilers to burn gas in place of coal. The segment includes the legacy and converted generating units at our Sundance and Keephills sites and includes the Highvale Mine.
Ancillary Services
As defined by the Electric Utilities Act, Ancillary Services are those services required to ensure that the interconnected electric system is operated in a manner that provides a satisfactory level of service with acceptable levels of voltage and frequency.
Automatic Share Purchase Plan (ASPP)
The ASPP is intended to facilitate repurchases of common shares under the NCIB, including at times when the Company would ordinarily not be permitted to make purchases due to regulatory restrictions or self-imposed blackout periods.
Availability
A measure of time, expressed as a percentage of continuous operation 24 hours a day, 365 days a year, that a generating unit is capable of generating electricity, regardless of whether or not it is actually generating electricity.
Balancing Pool
The Balancing Pool was established in 1999 by the Government of Alberta to help manage the transition to competition in Alberta's electric industry. Its current obligations and responsibilities are governed by the Electric Utilities Act (effective June 1, 2003) and the Balancing Pool Regulation. For more information go to www.balancingpool.ca.
Capacity
The rated continuous load-carrying ability, expressed in megawatts, of generation equipment.
Cogeneration
A generating facility that produces electricity and another form of useful thermal energy (such as heat or steam) used for industrial, commercial, heating or cooling purposes.
Disclosure Controls and Procedures (DC&P)
Refers to controls and other procedures designed to ensure that information required to be disclosed in the reports filed by the Company or submitted under securities legislation is recorded, processed, summarized and reported within the time frame specified in applicable securities legislation. DC&P include, without limitation, controls and procedures designed to ensure that information required to be disclosed by the Company in its reports that it files or submits under applicable securities legislation is accumulated and communicated to management, including the Chief Executive Officer and Chief Financial Officer, as appropriate to allow timely decisions regarding required disclosure.
Dispatch optimization
Purchasing power to fulfill contractual obligations, when economical.
Emissions Performance Standards (EPS)
Under the Government of Ontario, emission performance standards establish greenhouse gas (GHG) emissions limits for covered facilities.
EPCs
Emission Performance Credits.
Force Majeure
Literally means “greater force.” These clauses excuse a party from liability if some unforeseen event beyond the control of that party prevents it from performing its obligations under the contract.
TransAlta Corporation M56
Free Cash Flow (FCF)
Represents the amount of cash that is available to invest in growth initiatives, make scheduled principal repayments on debt, repay maturing debt, pay common share dividends or repurchase common shares. Amount is calculated as cash generated by the Company through its operations (cash from operations) minus the funds used by the Company for the purchase improvement, or maintenance of the long-term assets to improve the efficiency or capacity of the Company (capital expenditures).
Funds from Operations (FFO)
Represents a proxy for cash generated from operating activities before changes in working capital and provides the ability to evaluate cash flow trends in comparison with results from prior periods. Amount is calculated as cash flow from operating activities before changes in working capital and is adjusted for transactions and amounts that the Company believes are not representative of ongoing cash flows from operations.
Gigajoule (GJ)
A metric unit of energy commonly used in the energy industry. One GJ equals 947,817 British Thermal Units ("Btu"). One GJ is also equal to 277.8 kilowatt hours ("kWh").
Gigawatt (GW)
A measure of electric power equal to 1,000 megawatts.
Gigawatt hour (GWh)
A measure of electricity consumption equivalent to the use of 1,000 megawatts of power over a period of one hour.
Greenhouse Gas (GHG)
A gas that has the potential to retain heat in the atmosphere, including water vapour, carbon dioxide, methane, nitrous oxide, hydrofluorocarbons and perfluorocarbons.
ICFR
Internal control over financial reporting.
IFRS
International Financial Reporting Standards.
ITC
The investment tax credit ("ITC") is a federal income tax credit for investments in certain types of qualifying clean electricity projects.
Megawatt (MW)
A measure of electric power equal to 1,000,000 watts.
Megawatt Hour (MWh)
A measure of electricity consumption equivalent to the use of 1,000,000 watts of power over a period of one hour.
Merchant
A term used to describe assets that are not contracted and are exposed to market pricing.
NCIB
Normal Course Issuer Bid.
OM&A
Operations, maintenance and administration costs.
Other Hydro Assets
The Company's hydroelectric assets located in British Columbia, Ontario and assets owned by TransAlta Renewables which include the Taylor, Belly River, Waterton, St. Mary, Upper Mamquam, Pingston, Bone Creek, Akolkolex, Ragged Chute, Misema, Galetta, and Moose Rapids facilities.
Planned outage
Periodic planned shutdown of a generating unit for major maintenance and repairs. Duration is normally in weeks. The time is measured from unit shutdown to putting the unit back on line.
Power Purchase Agreement (PPA)
A long-term commercial agreement for the sale of electric energy to PPA buyers.
PP&E
Property, plant and equipment.
Turbine
A machine for generating rotary mechanical power from the energy of a stream of fluid (such as water, steam or hot gas). Turbines convert the kinetic energy of fluids to mechanical energy through the principles of impulse and reaction or a mixture of the two.
Unplanned outage
The shutdown of a generating unit due to an unanticipated breakdown.
TransAlta Corporation M57
TransAlta Corporation
TransAlta Place
Suite 1400, 1100 1 St SE
Calgary, Alberta T2G 1B1
Phone
403.267.7110
Website
www.transalta.com
Transfer Agent
Computershare Trust Company of Canada
Suite 600, 530 - 8th Avenue SW
Calgary, Alberta T2P 3S8
Phone
Toll-free in North America: 1.800.564.6253
Outside North America: 514.982.7555
Website
www.computershare.com
FOR MORE INFORMATION
Investor Inquiries
Phone
Toll-free in North America: 1.800.387.3598
Calgary or Outside North America: 403.267.2520
E-mail
investor_relations@transalta.com
Media Inquiries
Phone
Toll-free 1.855.255.9184
or 403.267.2540
E-mail
TA_Media_Relations@transalta.com
TransAlta Corporation M58