|
Texas
|
001-38895
|
75-2453320
|
|
(State or other jurisdiction of incorporation)
|
(Commission File Number)
|
(IRS Employer Identification No.)
|
|
5219 City Bank Parkway
Lubbock,
Texas
|
|
79407
|
|
(Address of principal executive offices)
|
|
(Zip Code)
|
| ☒ |
Written communications pursuant to Rule 425 under the Securities Act (17 CFR 230.425)
|
| ☐ |
Soliciting material pursuant to Rule 14a-12 under the Exchange Act (17 CFR 240.14a-12)
|
| ☐ |
Pre-commencement communications pursuant to Rule 14d-2(b) under the Exchange Act (17 CFR 240.14d-2(b))
|
| ☐ |
Pre-commencement communications pursuant to Rule 13e-4(c) under the Exchange Act (17 CFR 240.13e-4(c))
|
|
Title of each class
|
Trading Symbol(s)
|
Name of each exchange on which registered
|
|
Common Stock, par value $1.00 per share
|
SPFI
|
The Nasdaq Stock Market LLC
|
|
Item 2.02
|
Results of Operations and Financial Condition.
|
|
Item 7.01
|
Regulation FD Disclosure.
|
|
Item 9.01
|
Financial Statements and Exhibits.
|
|
(d)
|
Exhibits.
|
|
Press release, dated January 26, 2026, announcing fourth quarter and year-end 2025 financial results of South Plains Financial, Inc.
|
|
Earnings release slide presentation, dated January 26, 2026.
|
|
104
|
Cover Page Interactive Data File (formatted as Inline XBRL).
|
|
|
SOUTH PLAINS FINANCIAL, INC.
|
|
|
|
||
|
Date: January 26, 2026
|
By:
|
/s/ Steven B. Crockett
|
|
|
Steven B. Crockett
|
|
|
|
Chief Financial Officer and Treasurer
|

|
|
● |
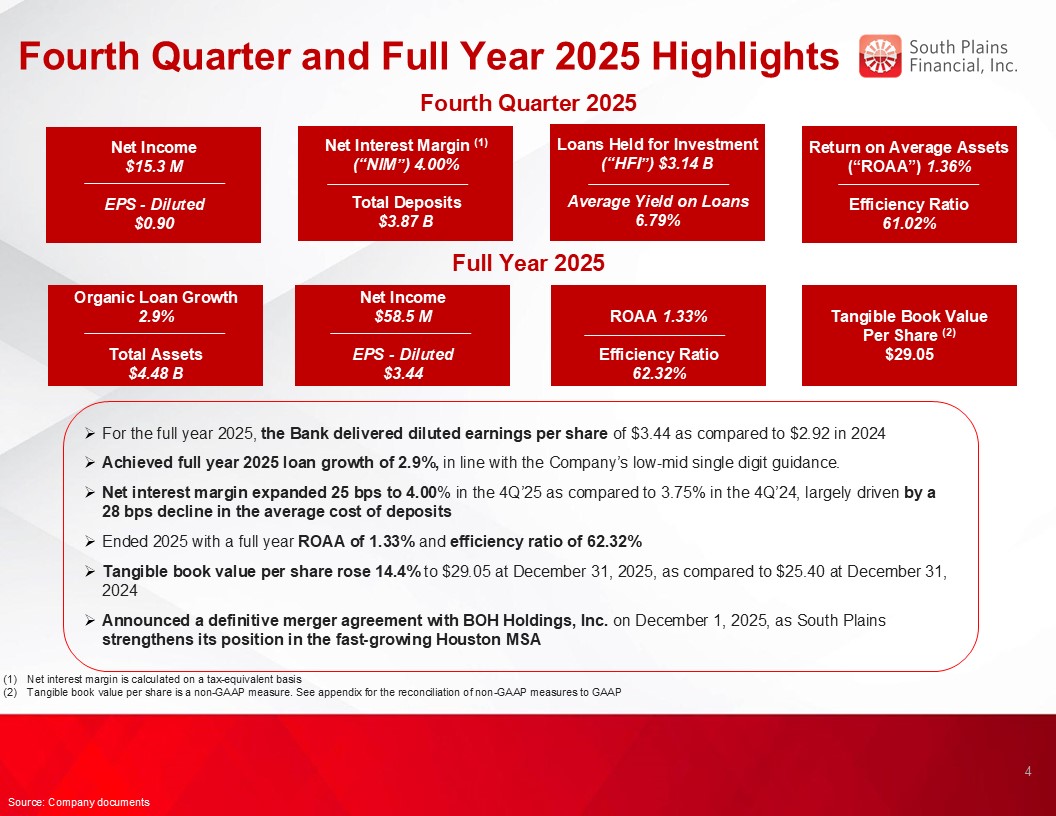
Net income for the fourth quarter of 2025 was $15.3 million, compared to $16.3 million for the third quarter of 2025 and $16.5 million for the fourth quarter of
2024.
|
|
|
● |
Diluted earnings per share for the fourth quarter of 2025 was $0.90, compared to $0.96 for the third quarter of 2025 and $0.96 for the fourth quarter of 2024.
|
|
|
● |
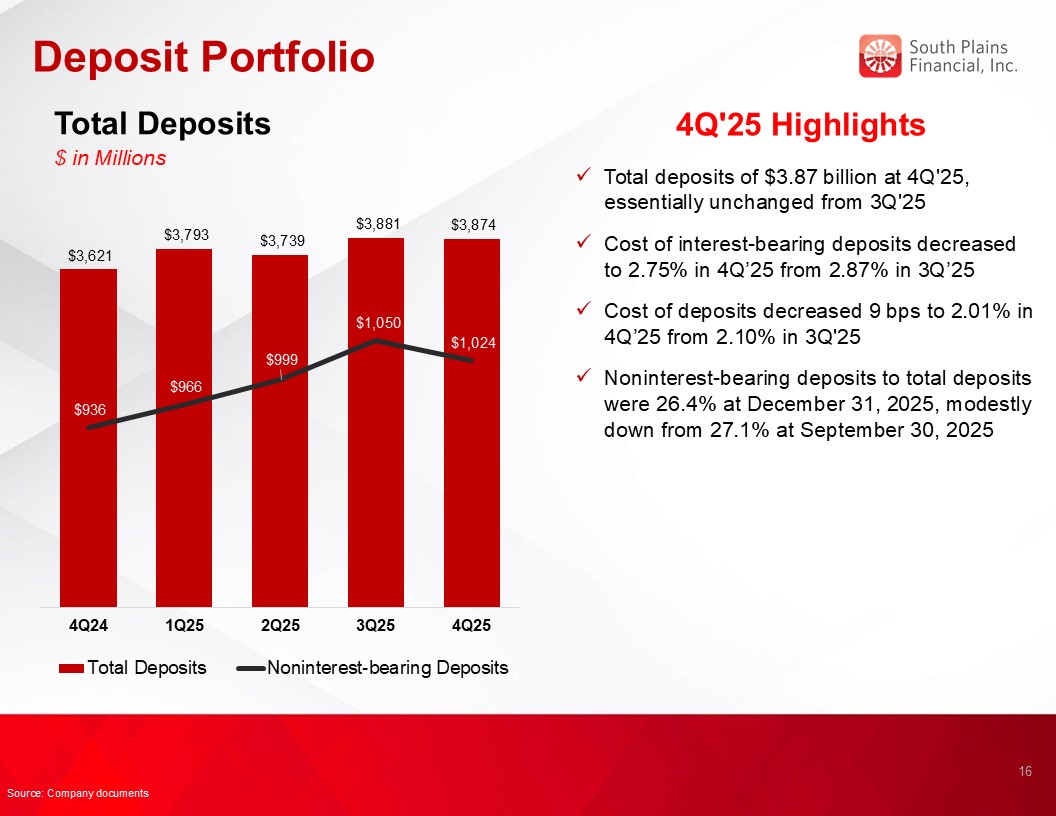
Average cost of deposits for the fourth quarter of 2025 was 201 basis points, compared to 210 basis points for the third quarter of 2025 and 229 basis points for
the fourth quarter of 2024.
|
|
|
● |
Net interest margin, on a tax-equivalent basis, was 4.00% for the fourth quarter of 2025, compared to 4.05% for the third quarter of 2025 and 3.75% for the fourth
quarter of 2024.
|
|
|
● |
Return on average assets for the fourth quarter of 2025 was 1.36%, compared to 1.47% for the third quarter of 2025 and 1.53% for the fourth quarter of 2024.
|
|
|
● |
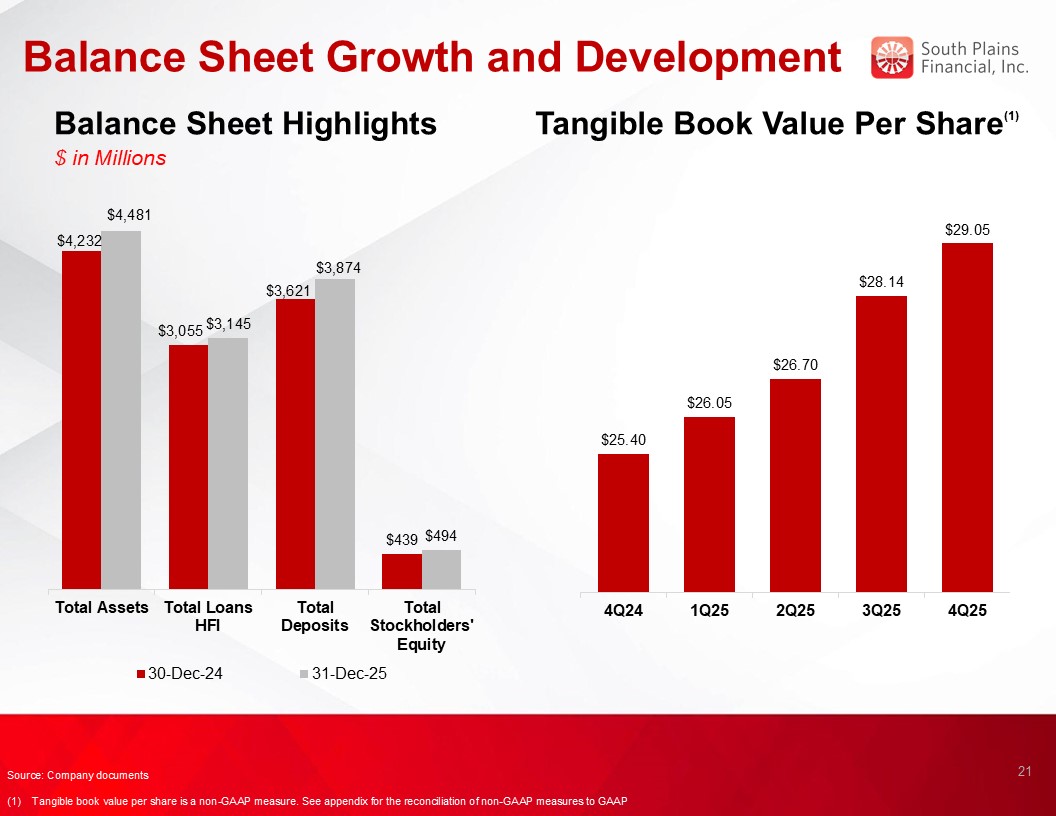
Tangible book value (non-GAAP) per share was $29.05 as of December 31, 2025, compared to $28.14 as of September 30, 2025 and $25.40 as of December 31, 2024.
|
|
|
● |
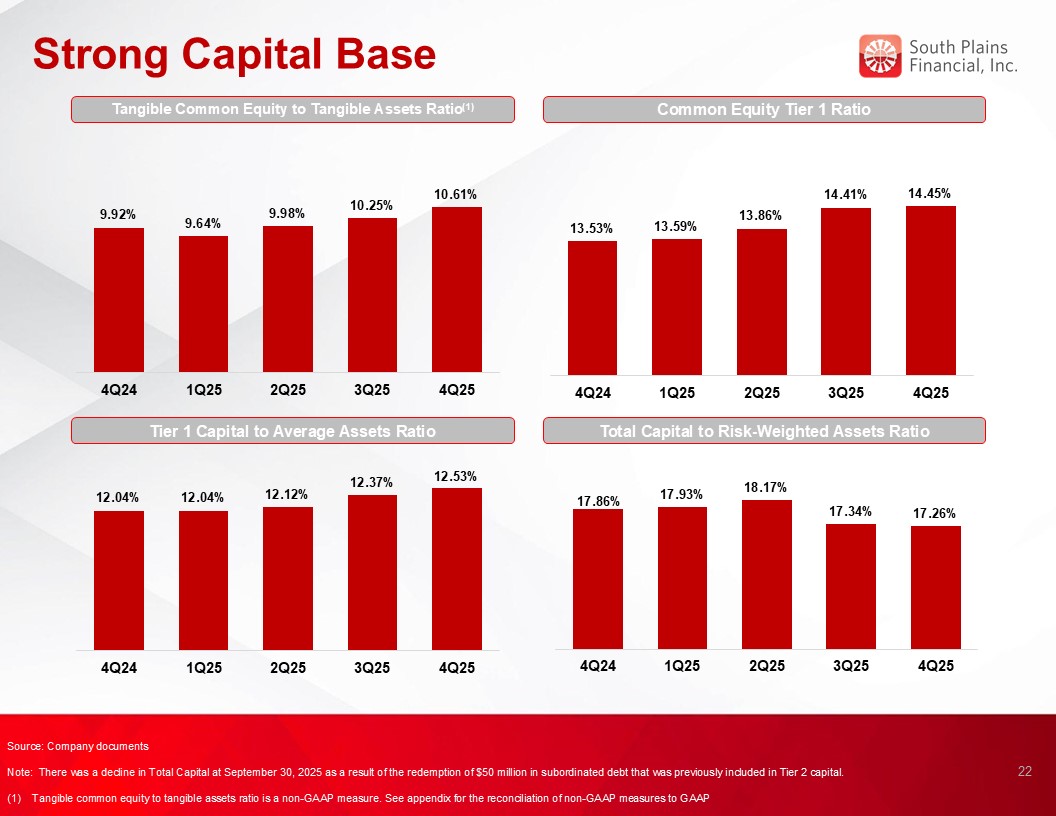
The consolidated total risk-based capital ratio, common equity tier 1 risk-based capital ratio, and tier 1 leverage ratio at December 31, 2025 were 17.26%, 14.45%,
and 12.53%, respectively.
|
|
|
● |
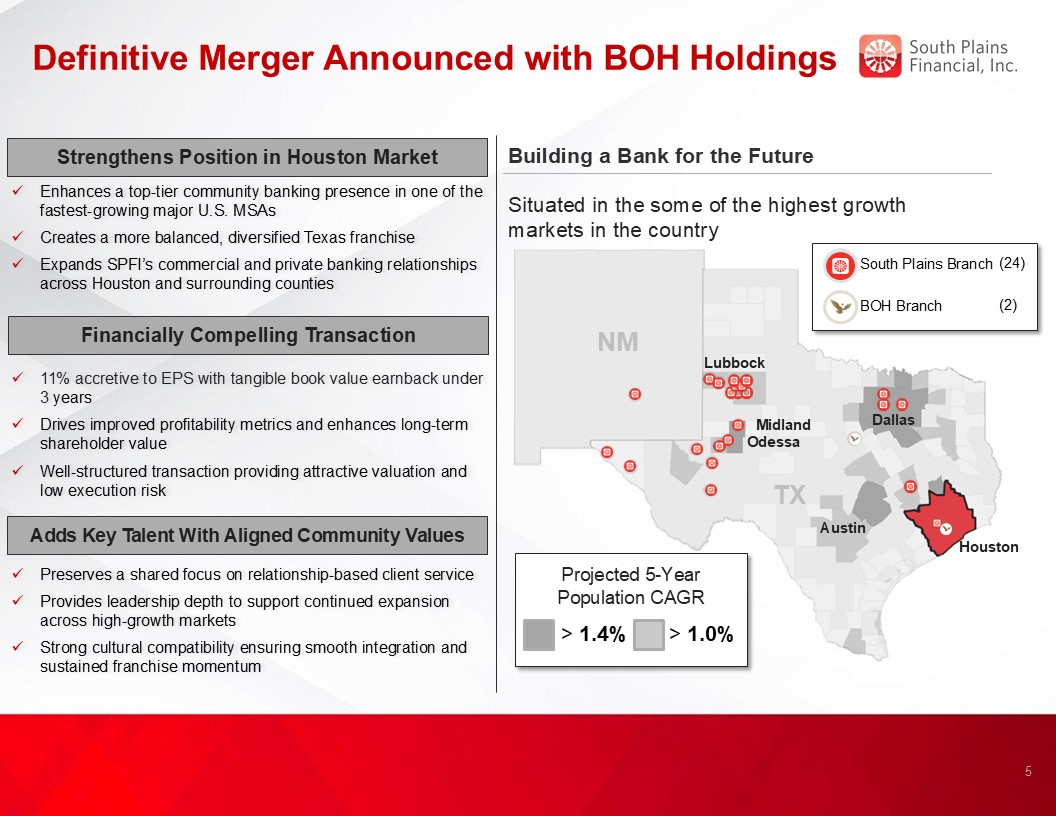
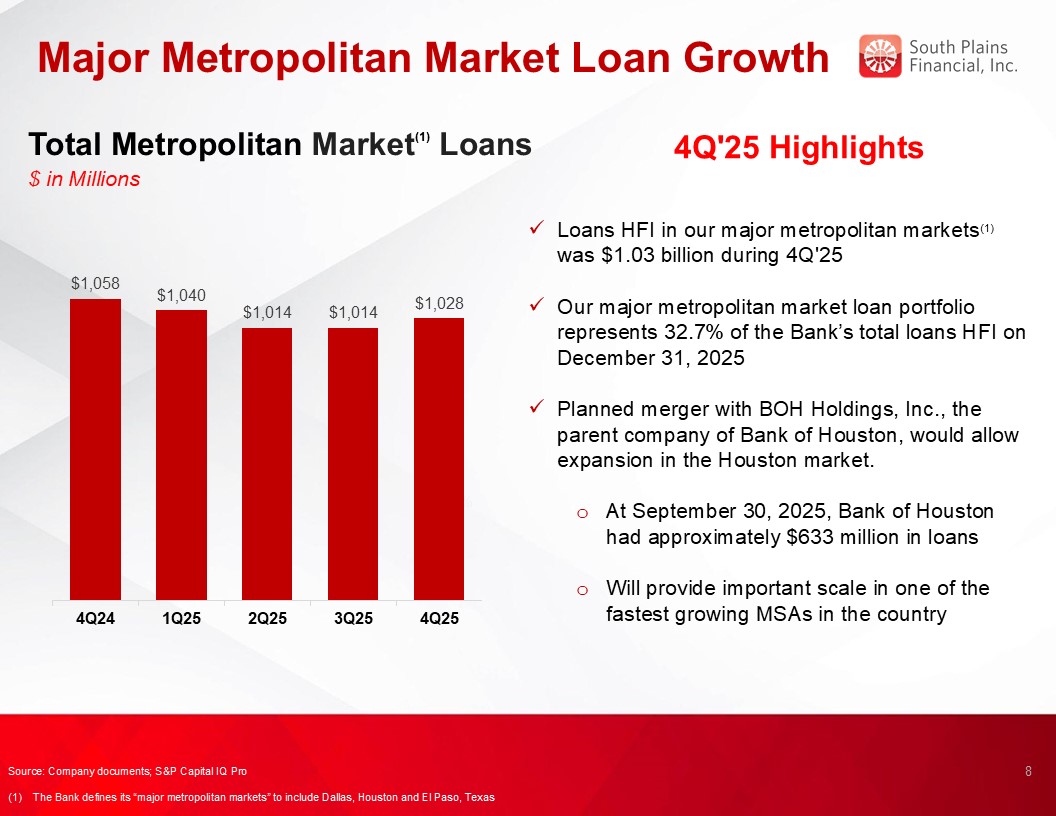
As previously reported, entered into a definitive agreement to acquire BOH Holdings, Inc. (“BOH”) and its banking subsidiary Bank of Houston on December 1, 2025. At
September 30, 2025, BOH had approximately $772 million in assets, $633 million in loans, and $629 million in deposits.
|
|
|
● |
Full year net income of $58.5 million in 2025, compared to $49.7 million in 2024.
|
|
|
● |
Diluted earnings per share of $3.44 in 2025, compared to $2.92 in 2024.
|
|
|
● |
Loans held for investment grew $89.4 million, or 2.9%, during 2025.
|
|
|
● |
Total assets were $4.48 billion at December 31, 2025, compared to $4.23 billion at December 31, 2024.
|
|
|
● |
Return on average assets of 1.33% for the full year 2025, compared to 1.17% for 2024.
|
|
Contact:
|
Mikella Newsom, Chief Risk Officer and Secretary
|
|
(866) 771-3347
|
|
|
investors@city.bank
|
|
As of and for the quarter ended
|
||||||||||||||||||||
|
December 31,
2025
|
September 30,
2025
|
June 30,
2025
|
March 31,
2025
|
December 31,
2024
|
||||||||||||||||
|
Selected Income Statement Data:
|
||||||||||||||||||||
|
Interest income
|
$
|
63,421
|
$
|
64,520
|
$
|
64,135
|
$
|
59,922
|
$
|
61,324
|
||||||||||
|
Interest expense
|
20,471
|
21,501
|
21,632
|
21,395
|
22,776
|
|||||||||||||||
|
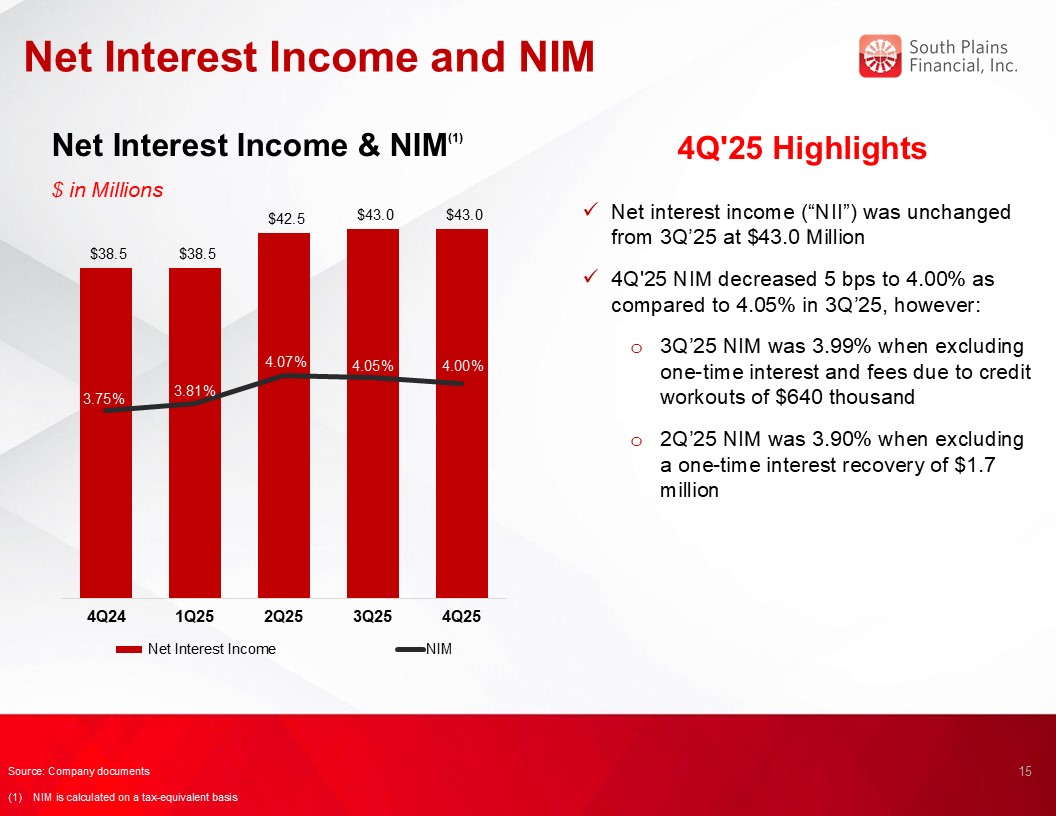
Net interest income
|
42,950
|
43,019
|
42,503
|
38,527
|
38,548
|
|||||||||||||||
|
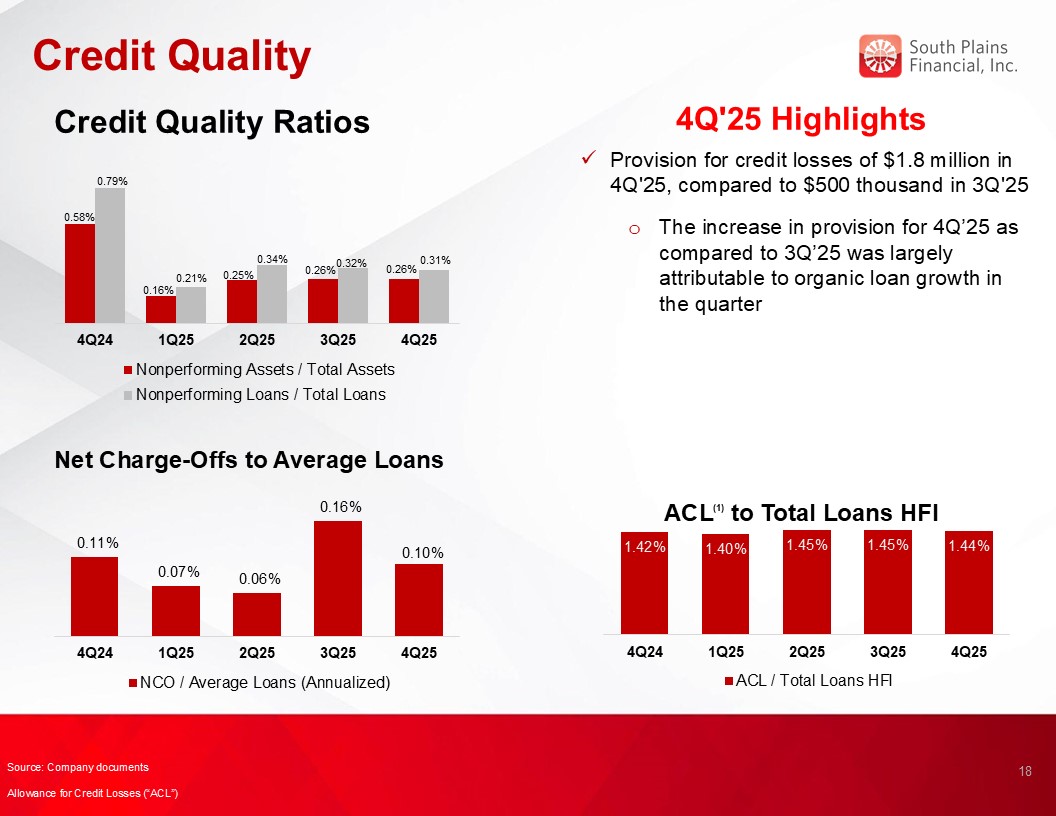
Provision for credit losses
|
1,775
|
500
|
2,500
|
420
|
1,200
|
|||||||||||||||
|
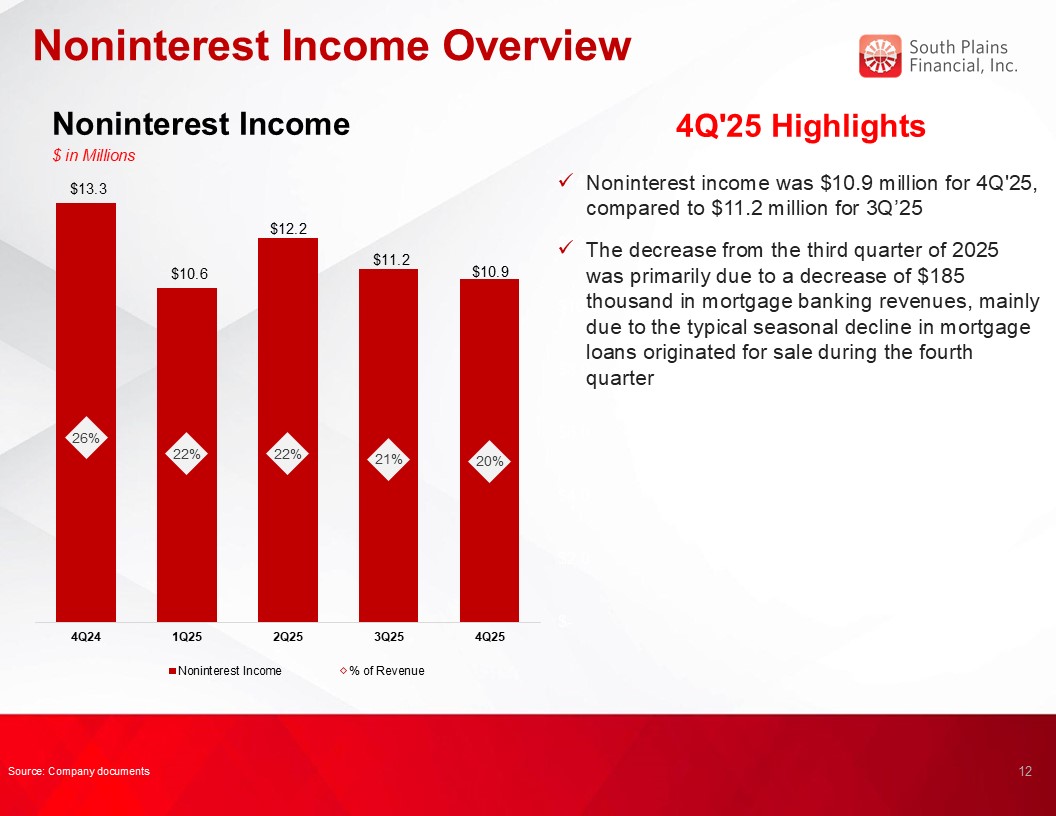
Noninterest income
|
10,934
|
11,165
|
12,165
|
10,625
|
13,319
|
|||||||||||||||
|
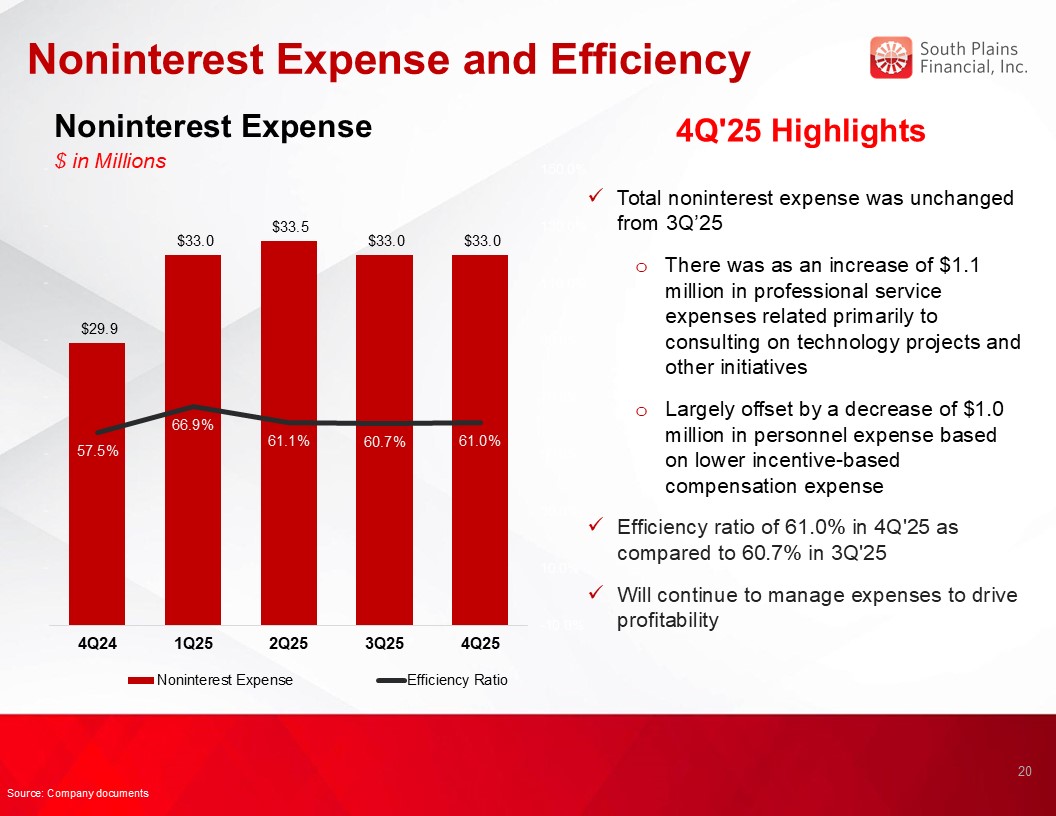
Noninterest expense
|
33,023
|
33,024
|
33,543
|
33,030
|
29,948
|
|||||||||||||||
|
Income tax expense
|
3,832
|
4,342
|
4,020
|
3,408
|
4,222
|
|||||||||||||||
|
Net income
|
15,254
|
16,318
|
14,605
|
12,294
|
16,497
|
|||||||||||||||
|
Per Share Data (Common Stock):
|
||||||||||||||||||||
|
Net earnings, basic
|
$
|
0.94
|
$
|
1.00
|
$
|
0.90
|
$
|
0.75
|
$
|
1.01
|
||||||||||
|
Net earnings, diluted
|
0.90
|
0.96
|
0.86
|
0.72
|
0.96
|
|||||||||||||||
|
Cash dividends declared and paid
|
0.16
|
0.16
|
0.15
|
0.15
|
0.15
|
|||||||||||||||
|
Book value
|
30.31
|
29.41
|
27.98
|
27.33
|
26.67
|
|||||||||||||||
|
Tangible book value (non-GAAP)
|
29.05
|
28.14
|
26.70
|
26.05
|
25.40
|
|||||||||||||||
|
Weighted average shares outstanding, basic
|
16,248,336
|
16,241,695
|
16,231,627
|
16,415,862
|
16,400,361
|
|||||||||||||||
|
Weighted average shares outstanding, dilutive
|
16,996,517
|
16,990,546
|
16,886,993
|
17,065,599
|
17,161,646
|
|||||||||||||||
|
Shares outstanding at end of period
|
16,293,577
|
16,247,839
|
16,230,475
|
16,235,647
|
16,455,826
|
|||||||||||||||
|
Selected Period End Balance Sheet Data:
|
||||||||||||||||||||
|
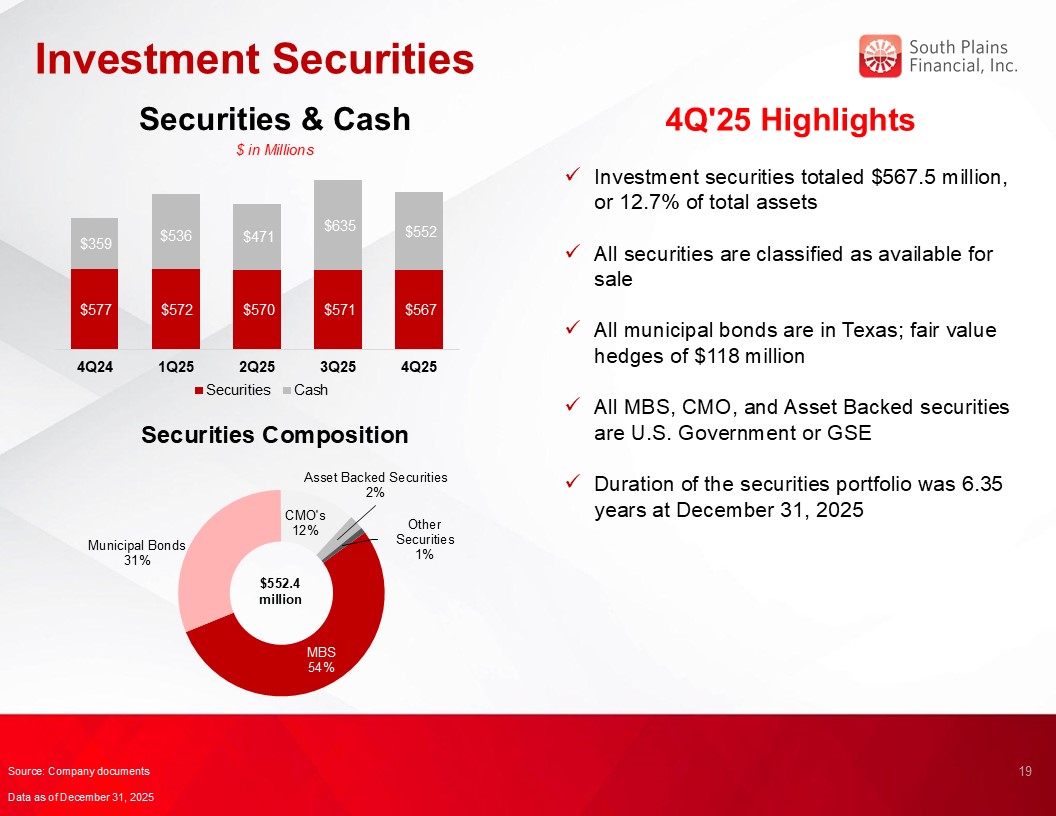
Cash and cash equivalents
|
$
|
552,439
|
$
|
635,046
|
$
|
470,496
|
$
|
536,300
|
$
|
359,082
|
||||||||||
|
Investment securities
|
567,540
|
571,138
|
570,000
|
571,527
|
577,240
|
|||||||||||||||
|
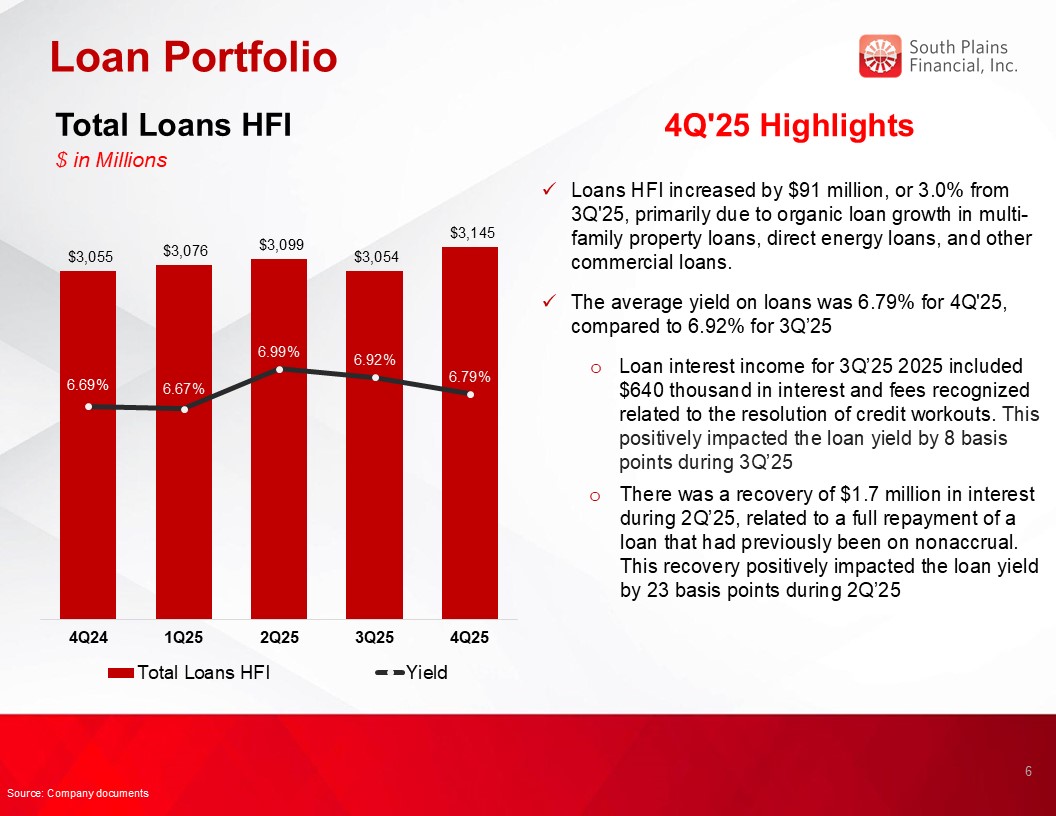
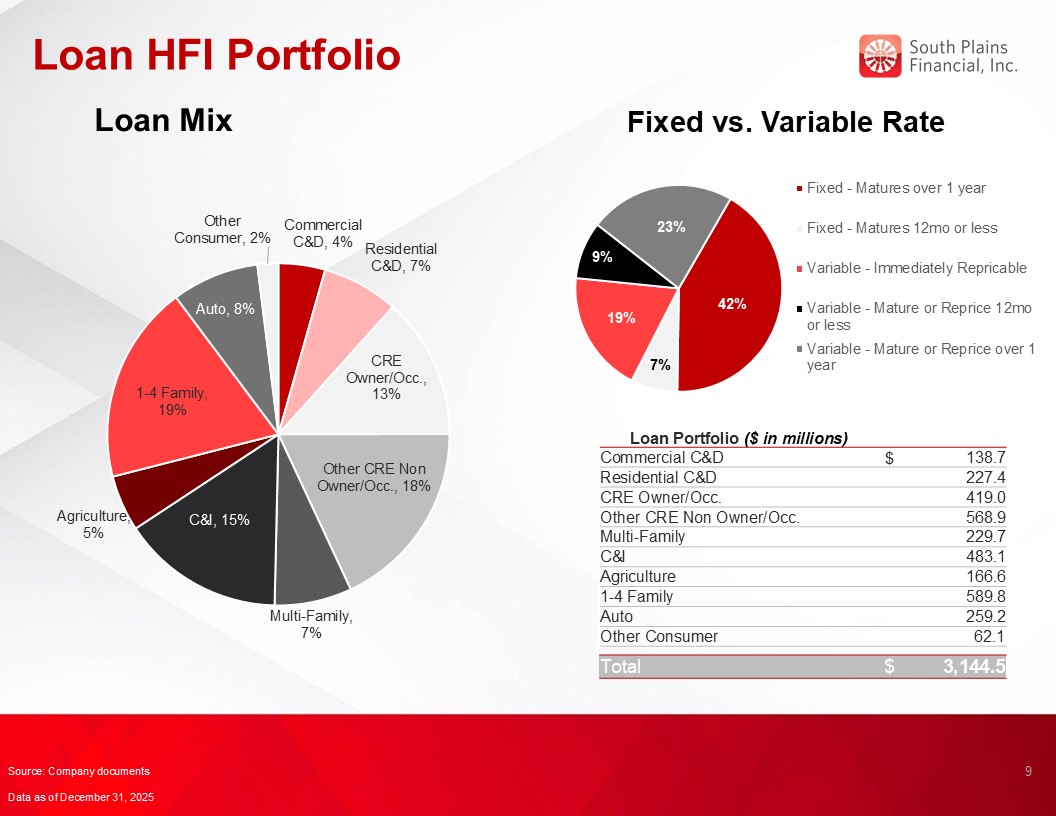
Total loans held for investment
|
3,144,502
|
3,053,503
|
3,098,978
|
3,075,860
|
3,055,054
|
|||||||||||||||
|
Allowance for credit losses
|
45,131
|
44,125
|
45,010
|
42,968
|
43,237
|
|||||||||||||||
|
Total assets
|
4,480,500
|
4,479,437
|
4,363,674
|
4,405,209
|
4,232,239
|
|||||||||||||||
|
Interest-bearing deposits
|
2,850,560
|
2,831,642
|
2,740,179
|
2,826,055
|
2,685,366
|
|||||||||||||||
|
Noninterest-bearing deposits
|
1,023,517
|
1,049,501
|
998,759
|
966,464
|
935,510
|
|||||||||||||||
|
Total deposits
|
3,874,077
|
3,881,143
|
3,738,938
|
3,792,519
|
3,620,876
|
|||||||||||||||
|
Borrowings
|
60,493
|
60,493
|
111,799
|
110,400
|
110,354
|
|||||||||||||||
|
Total stockholders’ equity
|
493,837
|
477,802
|
454,074
|
443,743
|
438,949
|
|||||||||||||||
|
Summary Performance Ratios:
|
||||||||||||||||||||
|
Return on average assets (annualized)
|
1.36
|
%
|
1.47
|
%
|
1.34
|
%
|
1.16
|
%
|
1.53
|
%
|
||||||||||
|
Return on average equity (annualized)
|
12.46
|
%
|
13.89
|
%
|
13.05
|
%
|
11.30
|
%
|
14.88
|
%
|
||||||||||
|
Net interest margin (1)
|
4.00
|
%
|
4.05
|
%
|
4.07
|
%
|
3.81
|
%
|
3.75
|
%
|
||||||||||
|
Yield on loans
|
6.79
|
%
|
6.92
|
%
|
6.99
|
%
|
6.67
|
%
|
6.69
|
%
|
||||||||||
|
Cost of interest-bearing deposits
|
2.75
|
%
|
2.87
|
%
|
2.91
|
%
|
2.93
|
%
|
3.12
|
%
|
||||||||||
|
Efficiency ratio
|
61.02
|
%
|
60.69
|
%
|
61.11
|
%
|
66.90
|
%
|
57.50
|
%
|
||||||||||
|
Summary Credit Quality Data:
|
||||||||||||||||||||
|
Nonperforming loans
|
$
|
9,805
|
$
|
9,709
|
$
|
10,463
|
$
|
6,467
|
$
|
24,023
|
||||||||||
|
Nonperforming loans to total loans held for investment
|
0.31
|
%
|
0.32
|
%
|
0.34
|
%
|
0.21
|
%
|
0.79
|
%
|
||||||||||
|
Other real estate owned
|
$
|
1,749
|
$
|
1,827
|
$
|
535
|
$
|
600
|
$
|
530
|
||||||||||
|
Nonperforming assets to total assets
|
0.26
|
%
|
0.26
|
%
|
0.25
|
%
|
0.16
|
%
|
0.58
|
%
|
||||||||||
|
Allowance for credit losses to total loans held for investment
|
1.44
|
%
|
1.45
|
%
|
1.45
|
%
|
1.40
|
%
|
1.42
|
%
|
||||||||||
|
Net charge-offs to average loans outstanding (annualized)
|
0.10
|
%
|
0.16
|
%
|
0.06
|
%
|
0.07
|
%
|
0.11
|
%
|
||||||||||
|
As of and for the quarter ended
|
||||||||||||||||||||
|
December 31
2025
|
September 30,
2025
|
June 30,
2025
|
March 31,
2025
|
December 31,
2024
|
||||||||||||||||
|
Capital Ratios:
|
||||||||||||||||||||
|
Total stockholders’ equity to total assets
|
11.02
|
%
|
10.67
|
%
|
10.41
|
%
|
10.07
|
%
|
10.37
|
%
|
||||||||||
|
Tangible common equity to tangible assets (non-GAAP)
|
10.61
|
%
|
10.25
|
%
|
9.98
|
%
|
9.64
|
%
|
9.92
|
%
|
||||||||||
|
Common equity tier 1 to risk-weighted assets
|
14.45
|
%
|
14.41
|
%
|
13.86
|
%
|
13.59
|
%
|
13.53
|
%
|
||||||||||
|
Tier 1 capital to average assets
|
12.53
|
%
|
12.37
|
%
|
12.12
|
%
|
12.04
|
%
|
12.04
|
%
|
||||||||||
|
Total capital to risk-weighted assets
|
17.26
|
%
|
17.34
|
%
|
18.17
|
%
|
17.93
|
%
|
17.86
|
%
|
||||||||||
| (1) |
Net interest margin is calculated as the annual net interest income, on a fully tax-equivalent basis, divided by average interest-earning assets.
|
|
For the Three Months Ended
|
||||||||||||||||||||||||
|
December 31, 2025
|
December 31, 2024
|
|||||||||||||||||||||||
|
Average
Balance
|
Interest
|
Yield/Rate
|
Average
Balance
|
Interest
|
Yield/Rate
|
|||||||||||||||||||
|
Assets
|
||||||||||||||||||||||||
|
Loans (1)
|
$
|
3,087,949
|
$
|
52,825
|
6.79
|
%
|
$
|
3,049,718
|
$
|
51,270
|
6.69
|
%
|
||||||||||||
|
Debt securities - taxable
|
502,249
|
4,604
|
3.64
|
%
|
518,646
|
4,994
|
3.83
|
%
|
||||||||||||||||
|
Debt securities - nontaxable
|
154,306
|
1,087
|
2.79
|
%
|
154,203
|
1,014
|
2.62
|
%
|
||||||||||||||||
|
Other interest-bearing assets
|
541,202
|
5,140
|
3.77
|
%
|
390,090
|
4,267
|
4.35
|
%
|
||||||||||||||||
|
Total interest-earning assets
|
4,285,706
|
63,656
|
5.89
|
%
|
4,112,657
|
61,545
|
5.95
|
%
|
||||||||||||||||
|
Noninterest-earning assets
|
179,087
|
189,422
|
||||||||||||||||||||||
|
Total assets
|
$
|
4,464,793
|
$
|
4,302,079
|
||||||||||||||||||||
|
Liabilities & stockholders’ equity
|
||||||||||||||||||||||||
|
NOW, Savings, MMDA’s
|
$
|
2,394,006
|
15,654
|
2.59
|
%
|
$
|
2,249,062
|
16,570
|
2.93
|
%
|
||||||||||||||
|
Time deposits
|
429,660
|
3,887
|
3.59
|
%
|
445,173
|
4,566
|
4.08
|
%
|
||||||||||||||||
|
Short-term borrowings
|
3
|
-
|
0.00
|
%
|
3
|
-
|
0.00
|
%
|
||||||||||||||||
|
Notes payable & other long-term borrowings
|
-
|
-
|
0.00
|
%
|
-
|
-
|
0.00
|
%
|
||||||||||||||||
|
Subordinated debt
|
14,100
|
225
|
6.33
|
%
|
63,938
|
834
|
5.19
|
%
|
||||||||||||||||
|
Junior subordinated deferrable interest debentures
|
46,393
|
705
|
6.03
|
%
|
46,393
|
806
|
6.91
|
%
|
||||||||||||||||
|
Total interest-bearing liabilities
|
2,884,162
|
20,471
|
2.82
|
%
|
2,804,569
|
22,776
|
3.23
|
%
|
||||||||||||||||
|
Demand deposits
|
1,032,323
|
978,742
|
||||||||||||||||||||||
|
Other liabilities
|
62,488
|
77,732
|
||||||||||||||||||||||
|
Stockholders’ equity
|
485,820
|
441,036
|
||||||||||||||||||||||
|
Total liabilities & stockholders’ equity
|
$
|
4,464,793
|
$
|
4,302,079
|
||||||||||||||||||||
|
Net interest income
|
$
|
43,185
|
$
|
38,769
|
||||||||||||||||||||
|
Net interest margin (2)
|
4.00
|
%
|
3.75
|
%
|
||||||||||||||||||||
| (1) |
Average loan balances include nonaccrual loans and loans held for sale.
|
| (2) |
Net interest margin is calculated as the annualized net interest income, on a fully tax-equivalent basis, divided by average interest-earning assets.
|
|
For the Twelve Months Ended
|
||||||||||||||||||||||||
|
December 31, 2025
|
December 31, 2024
|
|||||||||||||||||||||||
|
Average
Balance
|
Interest
|
Yield/Rate
|
Average
Balance
|
Interest
|
Yield/Rate
|
|||||||||||||||||||
|
Assets
|
||||||||||||||||||||||||
|
Loans (1)
|
$
|
3,087,635
|
$
|
211,231
|
6.84
|
%
|
$
|
3,054,189
|
$
|
202,301
|
6.62
|
%
|
||||||||||||
|
Debt securities - taxable
|
504,853
|
18,634
|
3.69
|
%
|
532,730
|
21,090
|
3.96
|
%
|
||||||||||||||||
|
Debt securities - nontaxable
|
153,691
|
4,196
|
2.73
|
%
|
155,168
|
4,076
|
2.63
|
%
|
||||||||||||||||
|
Other interest-bearing assets
|
468,655
|
18,847
|
4.02
|
%
|
312,917
|
14,319
|
4.58
|
%
|
||||||||||||||||
|
Total interest-earning assets
|
4,214,834
|
252,908
|
6.00
|
%
|
4,055,004
|
241,786
|
5.96
|
%
|
||||||||||||||||
|
Noninterest-earning assets
|
171,720
|
179,527
|
||||||||||||||||||||||
|
Total assets
|
$
|
4,386,554
|
$
|
4,234,531
|
||||||||||||||||||||
|
Liabilities & stockholders’ equity
|
||||||||||||||||||||||||
|
NOW, Savings, MMDA’s
|
$
|
2,337,103
|
63,062
|
2.70
|
%
|
$
|
2,250,942
|
70,362
|
3.13
|
%
|
||||||||||||||
|
Time deposits
|
433,760
|
16,293
|
3.76
|
%
|
411,028
|
16,719
|
4.07
|
%
|
||||||||||||||||
|
Short-term borrowings
|
8
|
-
|
0.00
|
%
|
3
|
-
|
0.00
|
%
|
||||||||||||||||
|
Notes payable & other long-term borrowings
|
-
|
-
|
0.00
|
%
|
-
|
-
|
0.00
|
%
|
||||||||||||||||
|
Subordinated debt
|
51,412
|
2,730
|
5.31
|
%
|
63,868
|
3,339
|
5.23
|
%
|
||||||||||||||||
|
Junior subordinated deferrable interest debentures
|
46,393
|
2,914
|
6.28
|
%
|
46,393
|
3,381
|
7.29
|
%
|
||||||||||||||||
|
Total interest-bearing liabilities
|
2,868,676
|
84,999
|
2.96
|
%
|
2,772,234
|
93,801
|
3.38
|
%
|
||||||||||||||||
|
Demand deposits
|
991,899
|
968,307
|
||||||||||||||||||||||
|
Other liabilities
|
65,476
|
70,777
|
||||||||||||||||||||||
|
Stockholders’ equity
|
460,503
|
423,213
|
||||||||||||||||||||||
|
Total liabilities & stockholders’ equity
|
$
|
4,386,554
|
$
|
4,234,531
|
||||||||||||||||||||
|
Net interest income
|
$
|
167,909
|
$
|
147,985
|
||||||||||||||||||||
|
Net interest margin (2)
|
3.98
|
%
|
3.65
|
%
|
||||||||||||||||||||
| (1) |
Average loan balances include nonaccrual loans and loans held for sale.
|
| (2) |
Net interest margin is calculated as the annualized net interest income, on a fully tax-equivalent basis, divided by average interest-earning assets.
|
|
As of
|
||||||||
|
December 31,
2025
|
December 31,
2024
|
|||||||
|
Assets
|
||||||||
|
Cash and due from banks
|
$
|
58,318
|
$
|
54,114
|
||||
|
Interest-bearing deposits in banks
|
494,121
|
304,968
|
||||||
|
Securities available for sale
|
567,540
|
577,240
|
||||||
|
Loans held for sale
|
9,993
|
20,542
|
||||||
|
Loans held for investment
|
3,144,502
|
3,055,054
|
||||||
|
Less: Allowance for credit losses
|
(45,131
|
)
|
(43,237
|
)
|
||||
|
Net loans held for investment
|
3,099,371
|
3,011,817
|
||||||
|
Premises and equipment, net
|
51,563
|
52,951
|
||||||
|
Goodwill
|
19,315
|
19,315
|
||||||
|
Intangible assets
|
1,133
|
1,720
|
||||||
|
Mortgage servicing rights
|
24,041
|
26,292
|
||||||
|
Other assets
|
155,105
|
163,280
|
||||||
|
Total assets
|
$
|
4,480,500
|
$
|
4,232,239
|
||||
|
Liabilities and Stockholders’ Equity
|
||||||||
|
Noninterest-bearing deposits
|
$
|
1,023,517
|
$
|
935,510
|
||||
|
Interest-bearing deposits
|
2,850,560
|
2,685,366
|
||||||
|
Total deposits
|
3,874,077
|
3,620,876
|
||||||
|
Short-term borrowings
|
-
|
—
|
||||||
|
Subordinated debt
|
14,100
|
63,961
|
||||||
|
Junior subordinated deferrable interest debentures
|
46,393
|
46,393
|
||||||
|
Other liabilities
|
52,093
|
62,060
|
||||||
|
Total liabilities
|
3,986,663
|
3,793,290
|
||||||
|
Stockholders’ Equity
|
||||||||
|
Common stock
|
16,294
|
16,456
|
||||||
|
Additional paid-in capital
|
91,065
|
97,287
|
||||||
|
Retained earnings
|
434,197
|
385,827
|
||||||
|
Accumulated other comprehensive income (loss)
|
(47,719
|
)
|
(60,621
|
)
|
||||
|
Total stockholders’ equity
|
493,837
|
438,949
|
||||||
|
Total liabilities and stockholders’ equity
|
$
|
4,480,500
|
$
|
4,232,239
|
||||
|
Three Months Ended
|
Twelve Months Ended
|
|||||||||||||||
|
December 31,
2025
|
December 31,
2024
|
December 31,
2025
|
December 31,
2024
|
|||||||||||||
|
Interest income:
|
||||||||||||||||
|
Loans, including fees
|
$
|
52,818
|
$
|
51,262
|
$
|
211,202
|
$
|
202,270
|
||||||||
|
Other
|
10,603
|
10,062
|
40,796
|
38,629
|
||||||||||||
|
Total interest income
|
63,421
|
61,324
|
251,998
|
240,899
|
||||||||||||
|
Interest expense:
|
||||||||||||||||
|
Deposits
|
19,541
|
21,136
|
79,355
|
87,081
|
||||||||||||
|
Subordinated debt
|
225
|
834
|
2,730
|
3,339
|
||||||||||||
|
Junior subordinated deferrable interest debentures
|
705
|
806
|
2,914
|
3,381
|
||||||||||||
|
Other
|
-
|
-
|
-
|
-
|
||||||||||||
|
Total interest expense
|
20,471
|
22,776
|
84,999
|
93,801
|
||||||||||||
|
Net interest income
|
42,950
|
38,548
|
166,999
|
147,098
|
||||||||||||
|
Provision for credit losses
|
1,775
|
1,200
|
5,195
|
4,300
|
||||||||||||
|
Net interest income after provision for credit losses
|
41,175
|
37,348
|
161,804
|
142,798
|
||||||||||||
|
Noninterest income:
|
||||||||||||||||
|
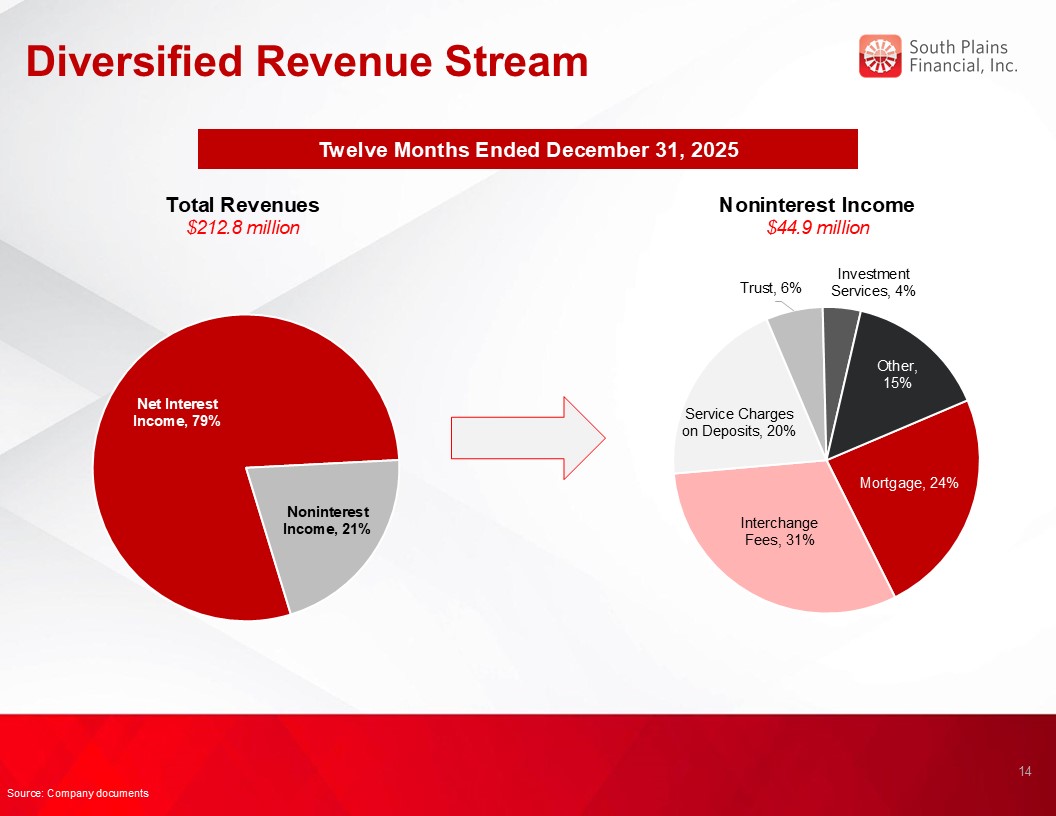
Service charges on deposits
|
2,318
|
2,241
|
8,823
|
8,026
|
||||||||||||
|
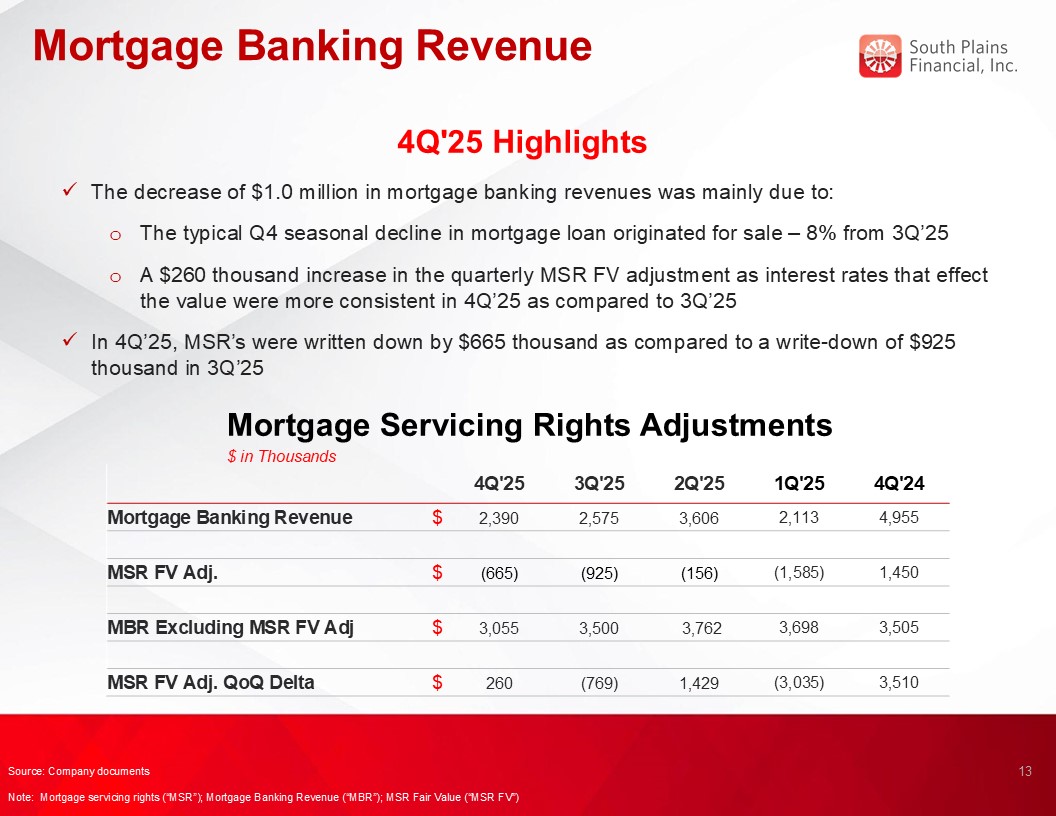
Mortgage banking activities
|
2,390
|
4,955
|
10,684
|
14,187
|
||||||||||||
|
Bank card services and interchange fees
|
3,359
|
3,225
|
13,912
|
13,640
|
||||||||||||
|
Other
|
2,867
|
2,898
|
11,470
|
12,219
|
||||||||||||
|
Total noninterest income
|
10,934
|
13,319
|
44,889
|
48,072
|
||||||||||||
|
Noninterest expense:
|
||||||||||||||||
|
Salaries and employee benefits
|
18,385
|
17,384
|
76,947
|
74,338
|
||||||||||||
|
Net occupancy expense
|
4,006
|
3,901
|
16,051
|
16,105
|
||||||||||||
|
Professional services
|
2,413
|
1,555
|
7,310
|
6,583
|
||||||||||||
|
Marketing and development
|
1,220
|
1,153
|
4,023
|
3,782
|
||||||||||||
|
Other
|
6,999
|
5,955
|
28,289
|
26,770
|
||||||||||||
|
Total noninterest expense
|
33,023
|
29,948
|
132,620
|
127,578
|
||||||||||||
|
Income before income taxes
|
19,086
|
20,719
|
74,073
|
63,292
|
||||||||||||
|
Income tax expense
|
3,832
|
4,222
|
15,602
|
13,575
|
||||||||||||
|
Net income
|
$
|
15,254
|
$
|
16,497
|
$
|
58,471
|
$
|
49,717
|
||||||||
|
As of
|
||||||||
|
December 31,
2025
|
December 31,
2024
|
|||||||
|
Loans:
|
||||||||
|
Commercial Real Estate
|
$
|
1,064,625
|
$
|
1,119,063
|
||||
|
Commercial - Specialized
|
409,351
|
388,955
|
||||||
|
Commercial - General
|
659,323
|
557,371
|
||||||
|
Consumer:
|
||||||||
|
1-4 Family Residential
|
589,851
|
566,400
|
||||||
|
Auto Loans
|
259,157
|
254,474
|
||||||
|
Other Consumer
|
62,092
|
64,936
|
||||||
|
Construction
|
100,103
|
103,855
|
||||||
|
Total loans held for investment
|
$
|
3,144,502
|
$
|
3,055,054
|
||||
|
As of
|
||||||||
|
December 31,
2025
|
December 31,
2024
|
|||||||
|
Deposits:
|
||||||||
|
Noninterest-bearing deposits
|
$
|
1,023,517
|
$
|
935,510
|
||||
|
NOW & other transaction accounts
|
1,307,596
|
498,718
|
||||||
|
MMDA & other savings
|
1,111,529
|
1,741,988
|
||||||
|
Time deposits
|
431,435
|
444,660
|
||||||
|
Total deposits
|
$
|
3,874,077
|
$
|
3,620,876
|
||||
|
For the quarter ended
|
||||||||||||||||||||
|
December 31,
2025
|
September 30,
2025
|
June 30,
2025
|
March 31,
2025
|
December 31,
2024
|
||||||||||||||||
|
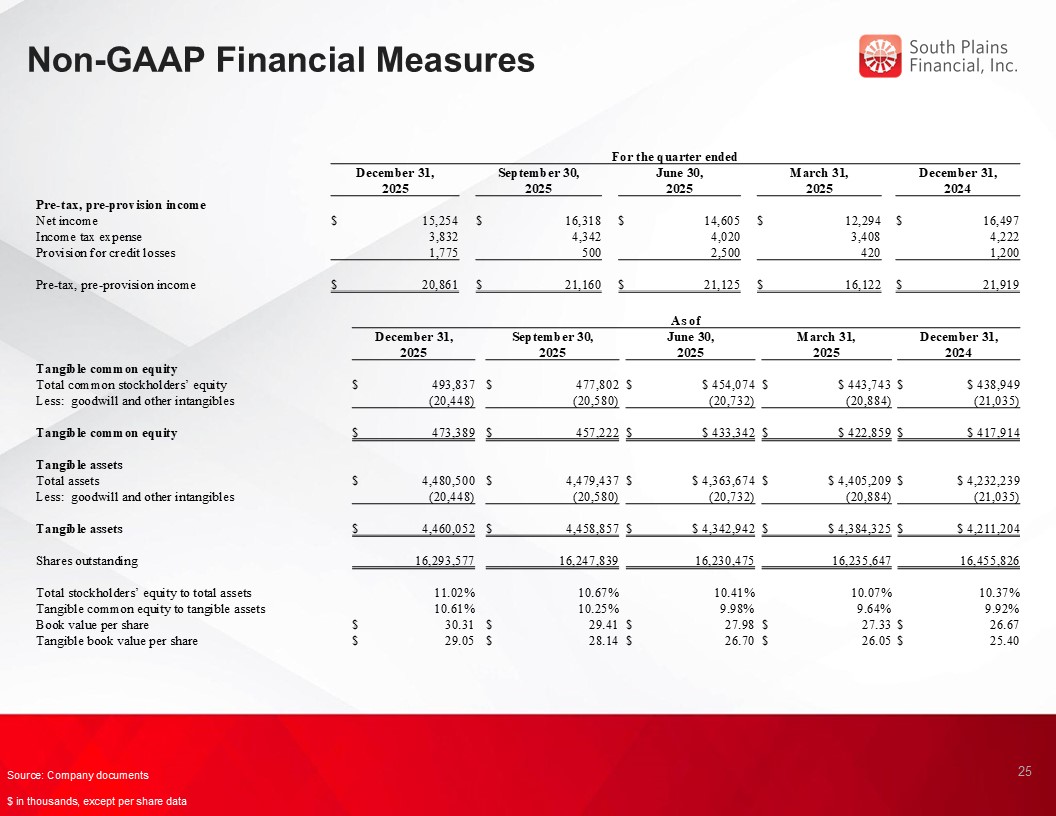
Pre-tax, pre-provision income
|
||||||||||||||||||||
|
Net income
|
$
|
15,254
|
$
|
16,318
|
$
|
14,605
|
$
|
12,294
|
$
|
16,497
|
||||||||||
|
Income tax expense
|
3,832
|
4,342
|
4,020
|
3,408
|
4,222
|
|||||||||||||||
|
Provision for credit losses
|
1,775
|
500
|
2,500
|
420
|
1,200
|
|||||||||||||||
|
Pre-tax, pre-provision income
|
$
|
20,861
|
$
|
21,160
|
$
|
21,125
|
$
|
16,122
|
$
|
21,919
|
||||||||||
|
As of
|
||||||||||||||||||||
|
December 31,
2025
|
September 30,
2025
|
June 30,
2025
|
March 31,
2025
|
December 31,
2024
|
||||||||||||||||
|
Tangible common equity
|
||||||||||||||||||||
|
Total common stockholders’ equity
|
$
|
493,837
|
$
|
477,802
|
$
|
$ 454,074
|
$
|
$ 443,743
|
$
|
$ 438,949
|
||||||||||
|
Less: goodwill and other intangibles
|
(20,448
|
)
|
(20,580
|
)
|
(20,732
|
)
|
(20,884
|
)
|
(21,035
|
)
|
||||||||||
|
Tangible common equity
|
$
|
473,389
|
$
|
457,222
|
$
|
$ 433,342
|
$
|
$ 422,859
|
$
|
$ 417,914
|
||||||||||
|
Tangible assets
|
||||||||||||||||||||
|
Total assets
|
$
|
4,480,500
|
$
|
4,479,437
|
$
|
$ 4,363,674
|
$
|
$ 4,405,209
|
$
|
$ 4,232,239
|
||||||||||
|
Less: goodwill and other intangibles
|
(20,448
|
)
|
(20,580
|
)
|
(20,732
|
)
|
(20,884
|
)
|
(21,035
|
)
|
||||||||||
|
Tangible assets
|
$
|
4,460,052
|
$
|
4,458,857
|
$
|
$ 4,342,942
|
$
|
$ 4,384,325
|
$
|
$ 4,211,204
|
||||||||||
|
Shares outstanding
|
16,293,577
|
16,247,839
|
16,230,475
|
16,235,647
|
16,455,826
|
|||||||||||||||
|
Total stockholders’ equity to total assets
|
11.02
|
%
|
10.67
|
%
|
10.41
|
%
|
10.07
|
%
|
10.37
|
%
|
||||||||||
|
Tangible common equity to tangible assets
|
10.61
|
%
|
10.25
|
%
|
9.98
|
%
|
9.64
|
%
|
9.92
|
%
|
||||||||||
|
Book value per share
|
$
|
30.31
|
$
|
29.41
|
$
|
27.98
|
$
|
27.33
|
$
|
26.67
|
||||||||||
|
Tangible book value per share
|
$
|
29.05
|
$
|
28.14
|
$
|
26.70
|
$
|
26.05
|
$
|
25.40
|
||||||||||