|
Press Release
|
|
|
99.2 |
Borr Drilling Limited Q3 2025 Earnings Release |
|
99.3 |
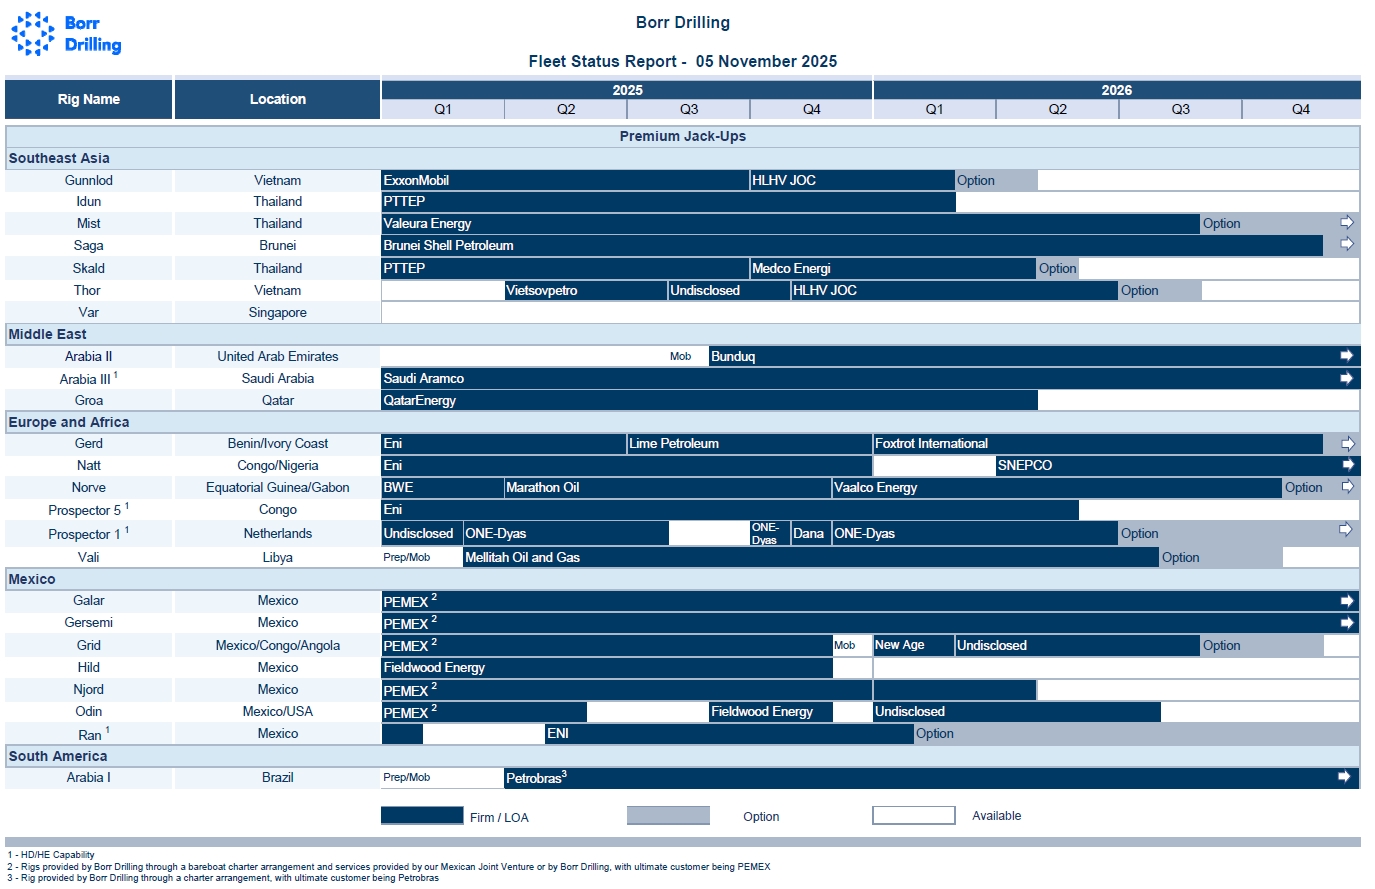
Borr Drilling Limited Fleet Status Report 5 November 2025 |
| |
BORR DRILLING LIMITED
|
|
|
|
|
|
|
Date: November 5, 2025
|
By:
|
/s/ Mi Hong Yoon
|
|
|
Name:
|
Mi Hong Yoon
|
|
|
Title:
|
Director
|
| • |
Total operating revenues of $277.1 million, an increase of $9.4 million or 4% compared to the second
quarter of 2025
|
| • |
Net income of $27.8 million, a decrease of $7.3 million or 21% compared to the second quarter
of 2025
|
| • |
Adjusted EBITDA of $135.6 million, an increase of $2.4 million or 2% compared to the second quarter of 2025
|
| • |
YTD 2025, the company was awarded 22 new contract commitments, representing more than 4,820 days and $625 million of potential contract revenue
|
|
a)
|
Webcast
|
|
b)
|
Conference Call
|

| • |
Total operating revenues of $277.1 million, an increase of $9.4 million or 4% compared to the second quarter of 2025
|
| • |
Net income of $27.8 million, a decrease of $7.3 million or 21% compared to the second quarter of 2025
|
| • |
Adjusted EBITDA1 of $135.6 million, an increase of $2.4
million or 2% compared to the second quarter of 2025
|
| • |
YTD 2025, the company was awarded 22 new contract commitments, representing more than 4,820 days and $625 million of potential contract revenue
|
|
In $ million
|
Q3 2025
|
Q2 2025
|
Change ($)
|
Change (%)
|
||||||||||||
|
Total operating revenues
|
277.1
|
267.7
|
9.4
|
4
|
%
|
|||||||||||
|
Total operating expenses
|
(178.9
|
)
|
(171.2
|
)
|
(7.7
|
)
|
4
|
%
|
||||||||
|
Operating income
|
98.0
|
96.5
|
1.5
|
2
|
%
|
|||||||||||
|
Total financial expenses, net
|
(58.6
|
)
|
(56.4
|
)
|
(2.2
|
)
|
4
|
%
|
||||||||
|
Income tax expense
|
(11.3
|
)
|
(4.8
|
)
|
(6.5
|
)
|
135
|
%
|
||||||||
|
Net income
|
27.8
|
35.1
|
(7.3
|
)
|
(21
|
)%
|
||||||||||
|
Adjusted EBITDA
|
135.6
|
133.2
|
2.4
|
2
|
%
|
|||||||||||
|
Cash and cash equivalents
|
227.8
|
92.4
|
135.4
|
147
|
%
|
|||||||||||
|
Total equity
|
1,140.1
|
1,012.6
|
127.5
|
13
|
%
|
|
(in US$ millions)
|
Q3 2025
|
Q2 2025
|
||||||
|
Net income
|
27.8
|
35.1
|
||||||
|
Depreciation of non-current assets
|
37.6
|
36.7
|
||||||
|
Loss from equity method investments
|
0.3
|
0.2
|
||||||
|
Total financial expense, net
|
58.6
|
56.4
|
||||||
|
Income tax expense
|
11.3
|
4.8
|
||||||
|
Adjusted EBITDA
|
135.6
|
133.2
|
||||||
|
Three months
ended September
30, 2025
|
Three months
ended September
30, 2024
|
Nine months
ended September
30, 2025
|
Nine months
ended September
30, 2024
|
|||||||||||||
|
Operating revenues
|
||||||||||||||||
|
Dayrate revenue
|
241.0
|
202.1
|
681.7
|
623.4
|
||||||||||||
|
Bareboat charter revenue
|
26.7
|
27.4
|
54.6
|
65.3
|
||||||||||||
|
Management contract revenue
|
9.4
|
12.1
|
25.1
|
23.8
|
||||||||||||
|
Related party revenue
|
—
|
—
|
—
|
35.0
|
||||||||||||
|
Total operating revenues
|
277.1
|
241.6
|
761.4
|
747.5
|
||||||||||||
|
(Loss) / gain on disposals
|
(0.2
|
)
|
0.2
|
0.2
|
0.6
|
|||||||||||
|
Operating expenses
|
||||||||||||||||
|
Rig operating and maintenance expenses
|
(128.5
|
)
|
(114.3
|
)
|
(360.5
|
)
|
(342.4
|
)
|
||||||||
|
Depreciation of non-current assets
|
(37.6
|
)
|
(31.8
|
)
|
(110.2
|
)
|
(95.5
|
)
|
||||||||
|
General and administrative expenses
|
(12.8
|
)
|
(12.0
|
)
|
(36.2
|
)
|
(37.0
|
)
|
||||||||
|
Total operating expenses
|
(178.9
|
)
|
(158.1
|
)
|
(506.9
|
)
|
(474.9
|
)
|
||||||||
|
Operating income
|
98.0
|
83.7
|
254.7
|
273.2
|
||||||||||||
|
(Loss) / income from equity method investments
|
(0.3
|
)
|
(1.6
|
)
|
(2.3
|
)
|
1.3
|
|||||||||
|
Financial income (expenses), net
|
||||||||||||||||
|
Interest income
|
1.1
|
1.6
|
2.2
|
5.4
|
||||||||||||
|
Interest expense
|
(56.4
|
)
|
(53.5
|
)
|
(171.7
|
)
|
(154.5
|
)
|
||||||||
|
Other financial expenses, net
|
(3.3
|
)
|
(5.0
|
)
|
(8.2
|
)
|
(21.0
|
)
|
||||||||
|
Total financial expenses, net
|
(58.6
|
)
|
(56.9
|
)
|
(177.7
|
)
|
(170.1
|
)
|
||||||||
|
Income before income taxes
|
39.1
|
25.2
|
74.7
|
104.4
|
||||||||||||
|
Income tax expense
|
(11.3
|
)
|
(15.5
|
)
|
(28.7
|
)
|
(48.6
|
)
|
||||||||
|
Net income attributable to shareholders of Borr Drilling Limited
|
27.8
|
9.7
|
46.0
|
55.8
|
||||||||||||
|
Total comprehensive income attributable to shareholders of Borr Drilling Limited
|
27.8
|
9.7
|
46.0
|
55.8
|
||||||||||||
|
Basic income per share
|
0.10
|
0.04
|
0.18
|
0.22
|
||||||||||||
|
Diluted income per share
|
0.10
|
0.04
|
0.18
|
0.22
|
||||||||||||
|
Weighted-average shares outstanding - basic
|
275,460,333
|
250,974,773
|
252,702,038
|
251,625,161
|
||||||||||||
|
Weighted-average shares outstanding - diluted
|
311,607,780
|
254,890,897
|
254,020,757
|
255,576,088
|
||||||||||||
|
September 30, 2025
|
December 31, 2024
|
|||||||
|
ASSETS
|
Unaudited
|
Audited
|
||||||
|
Current assets
|
||||||||
|
Cash and cash equivalents
|
227.8
|
61.6
|
||||||
|
Restricted cash
|
1.0
|
0.9
|
||||||
|
Trade receivables, net
|
224.0
|
184.3
|
||||||
|
Prepaid expenses
|
12.8
|
8.4
|
||||||
|
Deferred mobilization and contract preparation costs
|
31.2
|
40.6
|
||||||
|
Accrued revenue
|
125.8
|
107.7
|
||||||
|
Due from related parties
|
10.2
|
85.1
|
||||||
|
Other current assets
|
32.6
|
28.0
|
||||||
|
Total current assets
|
665.4
|
516.6
|
||||||
|
Non-current assets
|
||||||||
|
Property, plant and equipment
|
2.0
|
2.8
|
||||||
|
Jack-up drilling rigs, net
|
2,770.3
|
2,823.2
|
||||||
|
Equity method investments
|
12.2
|
14.5
|
||||||
|
Other non-current assets
|
72.1
|
62.5
|
||||||
|
Total non-current assets
|
2,856.6
|
2,903.0
|
||||||
|
Total assets
|
3,522.0
|
3,419.6
|
||||||
|
LIABILITIES AND EQUITY
|
||||||||
|
Current liabilities
|
||||||||
|
Trade accounts payables
|
58.4
|
81.6
|
||||||
|
Accrued expenses
|
71.7
|
68.0
|
||||||
|
Short-term accrued interest and other items
|
75.8
|
30.6
|
||||||
|
Short-term debt
|
118.1
|
118.1
|
||||||
|
Short-term deferred mobilization, demobilization and other revenue
|
34.2
|
27.1
|
||||||
|
Other current liabilities
|
51.0
|
84.2
|
||||||
|
Total current liabilities
|
409.2
|
409.6
|
||||||
|
Non-current liabilities
|
||||||||
|
Long-term debt
|
1,937.6
|
1,992.5
|
||||||
|
Long-term deferred mobilization, demobilization and other revenue
|
33.5
|
21.0
|
||||||
|
Other non-current liabilities
|
1.6
|
3.2
|
||||||
|
Total non-current liabilities
|
1,972.7
|
2,016.7
|
||||||
|
Total liabilities
|
2,381.9
|
2,426.3
|
||||||
|
Shareholders’ Equity
|
||||||||
|
Common shares of par value $0.10 per share: authorized 365,000,000 (2024:315,000,000) shares, issued 294,400,000 (2024: 264,080,391) shares and outstanding 285,872,798
(2024: 244,926,821) shares
|
29.5
|
26.5
|
||||||
|
Treasury shares
|
(19.5
|
)
|
(20.9
|
)
|
||||
|
Additional paid in capital
|
441.9
|
340.8
|
||||||
|
Contributed surplus
|
1,919.0
|
1,923.7
|
||||||
|
Accumulated deficit
|
(1,230.8
|
)
|
(1,276.8
|
)
|
||||
|
Total equity
|
1,140.1
|
993.3
|
||||||
|
Total liabilities and equity
|
3,522.0
|
3,419.6
|
||||||
|
Three months
ended September
30, 2025
|
Three months
ended September
30, 2024
|
Nine months
ended September
30, 2025
|
Nine months
ended September
30, 2024
|
|||||||||||||
|
Cash flows from operating activities
|
||||||||||||||||
|
Net income
|
27.8
|
9.7
|
46.0
|
55.8
|
||||||||||||
|
Adjustments to reconcile net income to net cash provided by operating activities:
|
||||||||||||||||
|
Non-cash compensation expense related to share based employee and directors’ compensation
|
2.5
|
2.5
|
8.5
|
6.1
|
||||||||||||
|
Depreciation of non-current assets
|
37.6
|
31.8
|
110.2
|
95.5
|
||||||||||||
|
Amortization of deferred mobilization and contract preparation costs
|
10.4
|
13.3
|
35.1
|
45.1
|
||||||||||||
|
Amortization of deferred mobilization, demobilization and other revenue
|
(13.1
|
)
|
(10.4
|
)
|
(35.2
|
)
|
(79.1
|
)
|
||||||||
|
Loss / (gain) on disposal of assets
|
0.2
|
(0.2
|
)
|
(0.2
|
)
|
(0.6
|
)
|
|||||||||
|
Amortization of debt discount
|
1.7
|
1.7
|
5.1
|
5.1
|
||||||||||||
|
Amortization of debt premium
|
(0.7
|
)
|
(0.4
|
)
|
(2.1
|
)
|
(0.7
|
)
|
||||||||
|
Amortization of deferred finance charges
|
3.3
|
3.1
|
9.7
|
8.6
|
||||||||||||
|
Bank commitment, guarantee and other fees
|
—
|
—
|
4.4
|
—
|
||||||||||||
|
Change in fair value of financial instruments
|
—
|
0.3
|
—
|
—
|
||||||||||||
|
Loss / (income) from equity method investments
|
0.3
|
1.6
|
2.3
|
(1.3
|
)
|
|||||||||||
|
Deferred income tax
|
0.9
|
3.0
|
(5.1
|
)
|
7.4
|
|||||||||||
|
Change in assets and liabilities:
|
||||||||||||||||
|
Amounts due from related parties
|
(3.8
|
)
|
0.1
|
71.5
|
10.8
|
|||||||||||
|
Accrued expenses
|
3.6
|
2.1
|
6.8
|
(9.9
|
)
|
|||||||||||
|
Accrued interest
|
46.1
|
39.7
|
48.6
|
37.5
|
||||||||||||
|
Other current and non-current assets
|
(43.0
|
)
|
(55.8
|
)
|
(85.2
|
)
|
(136.4
|
)
|
||||||||
|
Other current and non-current liabilities
|
(1.7
|
)
|
6.3
|
(3.3
|
)
|
44.4
|
||||||||||
|
Net cash provided by operating activities
|
72.1
|
48.4
|
217.1
|
88.3
|
||||||||||||
|
Cash flows from investing activities
|
||||||||||||||||
|
Additions to jack-up drilling rigs
|
(33.9
|
)
|
(14.1
|
)
|
(72.3
|
)
|
(36.1
|
)
|
||||||||
|
Purchase of property, plant and equipment
|
—
|
—
|
(0.1
|
)
|
(0.4
|
)
|
||||||||||
|
Additions to newbuildings
|
—
|
(173.3
|
)
|
—
|
(183.0
|
)
|
||||||||||
|
Net cash used in investing activities
|
(33.9
|
)
|
(187.4
|
)
|
(72.4
|
)
|
(219.5
|
)
|
||||||||
|
Cash flows from financing activities
|
||||||||||||||||
|
Proceeds from share issuance, net of issuance cost
|
96.9
|
—
|
96.9
|
—
|
||||||||||||
|
Repayment of debt (1)
|
—
|
(85.0
|
)
|
(70.7
|
)
|
(162.8
|
)
|
|||||||||
|
Cash distributions paid
|
—
|
(23.9
|
)
|
(4.7
|
)
|
(71.6
|
)
|
|||||||||
|
Debt proceeds, gross of premium / (net of discount) and issuance costs
|
—
|
239.4
|
—
|
447.7
|
||||||||||||
|
Purchase of treasury shares
|
—
|
—
|
(0.2
|
)
|
—
|
|||||||||||
|
Proceeds from exercise of share options
|
0.3
|
0.6
|
0.3
|
1.9
|
||||||||||||
|
Net cash provided by financing activities
|
97.2
|
131.1
|
21.6
|
215.2
|
||||||||||||
|
Net increase / (decrease) in cash, cash equivalents and restricted cash
|
135.4
|
(7.9
|
)
|
166.3
|
84.0
|
|||||||||||
|
Cash, cash equivalents and restricted cash at the beginning of the period
|
93.4
|
194.5
|
62.5
|
102.6
|
||||||||||||
|
Cash, cash equivalents and restricted cash at the end of the period
|
228.8
|
186.6
|
228.8
|
186.6
|
||||||||||||
|
Supplementary disclosure of cash flow information
|
||||||||||||||||
|
Interest paid
|
(6.0
|
)
|
(6.0
|
)
|
(110.4
|
)
|
(97.3
|
)
|
||||||||
|
Income taxes paid
|
(13.2
|
)
|
(9.7
|
)
|
(50.9
|
)
|
(39.7
|
)
|
||||||||
|
Non-cash offset of other current and non-current assets and jack-up rigs
|
(0.4
|
)
|
—
|
(9.5
|
)
|
—
|
|
(In $ millions)
|
September 30, 2025
|
December 31, 2024
|
||||||
|
Cash and cash equivalents
|
227.8
|
61.6
|
||||||
|
Restricted cash
|
1.0
|
0.9
|
||||||
|
Total cash and cash equivalents and restricted cash
|
228.8
|
62.5
|
||||||
|
Number of
outstanding
shares
|
Common
shares
|
Treasury
shares
|
Additional
paid in
capital
|
Contributed
Surplus
|
Accumulated
deficit
|
Total equity
|
||||||||||||||||||||||
|
Balance as at December 31, 2023
|
252,582,036
|
26.5
|
(8.9
|
)
|
337.2
|
1,988.1
|
(1,358.9
|
)
|
984.0
|
|||||||||||||||||||
|
Movement in treasury shares
|
3,067
|
—
|
—
|
—
|
—
|
—
|
—
|
|||||||||||||||||||||
|
Share-based compensation
|
411,336
|
—
|
0.1
|
3.0
|
—
|
—
|
3.1
|
|||||||||||||||||||||
|
Distribution to shareholders
|
—
|
—
|
—
|
—
|
(11.9
|
)
|
—
|
(11.9
|
)
|
|||||||||||||||||||
|
Total comprehensive income
|
—
|
—
|
—
|
—
|
—
|
14.4
|
14.4
|
|||||||||||||||||||||
|
Balance as at March 31, 2024
|
252,996,439
|
26.5
|
(8.8
|
)
|
340.2
|
1,976.2
|
(1,344.5
|
)
|
989.6
|
|||||||||||||||||||
|
Movement in treasury shares
|
(2,364,437
|
)
|
—
|
(0.3
|
)
|
0.3
|
—
|
—
|
—
|
|||||||||||||||||||
|
Share-based compensation
|
—
|
—
|
—
|
1.8
|
—
|
—
|
1.8
|
|||||||||||||||||||||
|
Distribution to shareholders
|
—
|
—
|
—
|
—
|
(23.9
|
)
|
—
|
(23.9
|
)
|
|||||||||||||||||||
|
Total comprehensive income
|
—
|
—
|
—
|
—
|
—
|
31.7
|
31.7
|
|||||||||||||||||||||
|
Balance as at June 30, 2024
|
250,632,002
|
26.5
|
(9.1
|
)
|
342.3
|
1,952.3
|
(1,312.8
|
)
|
999.2
|
|||||||||||||||||||
|
Movement in treasury shares
|
250,000
|
—
|
—
|
—
|
—
|
—
|
—
|
|||||||||||||||||||||
|
Share-based compensation
|
293,369
|
—
|
0.1
|
3.1
|
—
|
—
|
3.2
|
|||||||||||||||||||||
|
Distribution to shareholders
|
—
|
—
|
—
|
—
|
(23.9
|
)
|
—
|
(23.9
|
)
|
|||||||||||||||||||
|
Total comprehensive income
|
—
|
—
|
—
|
—
|
—
|
9.7
|
9.7
|
|||||||||||||||||||||
|
Balance as at September 30, 2024
|
251,175,371
|
26.5
|
(9.0
|
)
|
345.4
|
1,928.4
|
(1,303.1
|
)
|
988.2
|
|||||||||||||||||||
|
Number of
outstanding
shares
|
Common
shares
|
Treasury
shares
|
Additional
paid in
capital
|
Contributed
Surplus
|
Accumulated
deficit
|
Total equity
|
||||||||||||||||||||||
|
Balance as at December 31, 2024
|
244,926,821
|
26.5
|
(20.9
|
)
|
340.8
|
1,923.7
|
(1,276.8
|
)
|
993.3
|
|||||||||||||||||||
|
Cancellation of treasury shares
|
—
|
(2.0
|
)
|
2.0
|
—
|
—
|
—
|
—
|
||||||||||||||||||||
|
Repurchase of treasury shares
|
(50,000
|
)
|
—
|
(0.2
|
)
|
—
|
—
|
—
|
(0.2
|
)
|
||||||||||||||||||
|
Movement in treasury shares
|
(5,568,265
|
)
|
—
|
(0.6
|
)
|
0.6
|
—
|
—
|
—
|
|||||||||||||||||||
|
Share based compensation
|
—
|
—
|
—
|
3.4
|
—
|
—
|
3.4
|
|||||||||||||||||||||
|
Distribution to shareholders
|
—
|
—
|
—
|
—
|
(4.7
|
)
|
—
|
(4.7
|
)
|
|||||||||||||||||||
|
Total comprehensive loss
|
—
|
—
|
—
|
—
|
—
|
(16.9
|
)
|
(16.9
|
)
|
|||||||||||||||||||
|
Balance as at March 31, 2025
|
239,308,556
|
24.5
|
(19.7
|
)
|
344.8
|
1,919.0
|
(1,293.7
|
)
|
974.9
|
|||||||||||||||||||
|
Movement in treasury shares
|
(3,083,690
|
)
|
—
|
(0.3
|
)
|
0.3
|
—
|
—
|
—
|
|||||||||||||||||||
|
Share based compensation
|
—
|
—
|
—
|
2.6
|
—
|
—
|
2.6
|
|||||||||||||||||||||
|
Total comprehensive income
|
—
|
—
|
—
|
—
|
—
|
35.1
|
35.1
|
|||||||||||||||||||||
|
Balance as at June 30, 2025
|
236,224,866
|
24.5
|
(20.0
|
)
|
347.7
|
1,919.0
|
(1,258.6
|
)
|
1,012.6
|
|||||||||||||||||||
|
Issue of common shares
|
50,000,000
|
5.0
|
—
|
91.9
|
—
|
—
|
96.9
|
|||||||||||||||||||||
|
Movement in treasury shares
|
(508,734
|
)
|
—
|
(0.1
|
)
|
0.1
|
—
|
—
|
—
|
|||||||||||||||||||
|
Share based compensation
|
156,666
|
—
|
0.6
|
2.2
|
—
|
—
|
2.8
|
|||||||||||||||||||||
|
Total comprehensive income
|
—
|
—
|
—
|
—
|
—
|
27.8
|
27.8
|
|||||||||||||||||||||
|
Balance as at September 30, 2025
|
285,872,798
|
29.5
|
(19.5
|
)
|
441.9
|
1,919.0
|
(1,230.8
|
)
|
1,140.1
|
|||||||||||||||||||

 |
Borr Drilling
Fleet Status Report - 05 November 2025
|
|
New Contracts / Extensions / Amendments
|
||||
|
Prospector 1
|
||||
|
• Contract (from LOA): November 2025, Dana Petroleum
(Netherlands)
|
||||
|
Prospector 1
|
||||
|
• Contract (from LOA): December 2025 to June 2026, ONE-Dyas
(Netherlands)
|
||||
|
Letters of Award / Letters of Intent / Negotiations
|
||||
|
Galar
|
||||
|
• LOA: May 2026 to May 2028, PEMEX (Mexico)
|
||||
|
Gersemi
|
||||
|
• LOA: May 2026 to May 2028, PEMEX (Mexico)
|
||||
|
Njord
|
||||
|
• LOA: January 2026 to April 2026, PEMEX (Mexico)
|
||||
|
Odin
|
||||
|
• LOA: January 2026 to July 2026, Undisclosed (USA)
|
||||
|
Grid
|
||||
|
• LOA: February 2026 to August 2026, Undisclosed (Angola)
|
||||
|
Other Developments
|
||||
|
Natt
|
||||
|
• Continues with Eni in Congo through Q4 2025
• Previously disclosed contract with SNEPCO in Nigeria now expected to commence in April 2026
|
||||
|
Skald
|
||||
|
• Concluded operations with PTTEP in Thailand in late September 2025 and commenced operations with Medco Energi in Thailand in late October 2025
|
||||
|
Arabia II
|
||||
|
• Commenced operations with Bunduq in United Arab Emirates in mid September 2025
|
||||
|
Gunnlod
|
||||
|
• Concluded operations with ExxonMobil in Malaysia in early October 2025 and commenced operations with HLHV JOC in Vietnam in mid October 2025
|
||||
|
Thor
|
||||
|
• Concluded operations with an undisclosed customer in Vietnam in late October 2025 and will commence operations with HLHV JOC in Vietnam in November 2025
|
||||
|
Prospector 1
|
||||
|
• Commenced special standby rate with ONE-Dyas in Netherlands in mid October 2025
• Commenced operations with Dana Petroleum in Netherlands in early November 2025
|
||||
|
Grid
|
||||
|
• Operations with PEMEX in Mexico expected to conclude in November 2025
• Previously disclosed contract with New Age is now reassigned from the Natt to the Grid and is expected to commence in January 2026
|
||||
|
Odin and Hild
|
||||
|
• Issued contract termination notices following the recent implemetation of international sanctions affecting a counterparty. Operations will conclude in November 2025
|
||||
|
Borr Drilling
Fleet Status Report - 05 November 2025
|
|
|
Rig Name
|
Rig Design
|
Rig Water
Depth (ft)
|
Year Built
|
Customer / Status
|
Contract Start
|
Contract End
|
Location
|
Comments
|
||||||||
|
Contracted Rigs
|
||||||||||||||||
|
Arabia I
|
KFELS B Class
|
400 ft
|
2020
|
Petrobras 3
|
April - 2025
|
April - 2029
|
Brazil
|
Operating with option to extend
|
||||||||
|
Arabia II
|
KFELS B Class
|
400 ft
|
2019
|
Bunduq
|
September - 2025
|
January - 2027
|
United Arab Emirates
|
Operating with option to extend
|
||||||||
|
Arabia III 1
|
KFELS Super A Class
|
400 ft
|
2013
|
Saudi Aramco
|
September - 2023
|
September - 2028
|
Saudi Arabia
|
Operating with option to extend
|
||||||||
|
Galar
|
PPL Pacific Class 400
|
400 ft
|
2017
|
PEMEX 2
|
April - 2024
|
May - 2026
|
Mexico
|
Operating
|
||||||||
|
May - 2026
|
May - 2028
|
Mexico
|
LOA
|
|||||||||||||
|
Gerd
|
PPL Pacific Class 400
|
400 ft
|
2018
|
Lime Petroleum
|
July - 2025
|
December - 2025
|
Benin
|
Operating
|
||||||||
|
Foxtrot International
|
December - 2025
|
November - 2026
|
Ivory Coast
|
Committed with option to extend
|
||||||||||||
|
Gersemi
|
PPL Pacific Class 400
|
400 ft
|
2018
|
PEMEX 2
|
January - 2024
|
May - 2026
|
Mexico
|
Operating
|
||||||||
|
May - 2026
|
May - 2028
|
Mexico
|
LOA
|
|||||||||||||
|
Grid
|
PPL Pacific Class 400
|
400 ft
|
2018
|
PEMEX 2
|
January - 2024
|
November - 2025
|
Mexico
|
Operating
|
||||||||
|
New Age
|
January - 2026
|
February - 2026
|
Congo
|
Committed
|
||||||||||||
|
Undisclosed
|
February - 2026
|
August - 2026
|
Angola
|
LOA
|
||||||||||||
|
Groa
|
PPL Pacific Class 400
|
400 ft
|
2018
|
Qatar Energy
|
April - 2022
|
April - 2026
|
Qatar
|
Operating
|
||||||||
|
Gunnlod
|
PPL Pacific Class 400
|
400ft
|
2018
|
HLHV JOC
|
October - 2025
|
February - 2026
|
Vietnam
|
Operating with option to extend
|
||||||||
|
Hild
|
KFELS Super B Class
|
400 ft
|
2020
|
Fieldwood Energy
|
October - 2023
|
November - 2025
|
Mexico
|
Operating
|
||||||||
|
Idun
|
KFELS Super B Bigfoot Class
|
350 ft
|
2013
|
PTTEP
|
February - 2024
|
February - 2026
|
Thailand
|
Operating
|
||||||||
|
Mist
|
KFELS Super B Bigfoot Class
|
350 ft
|
2013
|
Valeura Energy
|
December - 2023
|
August - 2026
|
Thailand
|
Operating with option to extend
|
||||||||
|
Natt
|
PPL Pacific Class 400
|
400 ft
|
2018
|
Eni
|
August - 2024
|
December - 2025
|
Congo
|
Operating
|
||||||||
|
SNEPCO
|
April - 2026
|
February - 2027
|
Nigeria
|
Committed with option to extend
|
||||||||||||
|
Njord
|
PPL Pacific Class 400
|
400 ft
|
2019
|
PEMEX 2
|
April - 2024
|
December - 2025
|
Mexico
|
Operating
|
||||||||
|
January - 2026
|
April - 2026
|
Mexico
|
LOA
|
|||||||||||||
|
Norve
|
PPL Pacific Class 400
|
400 ft
|
2011
|
Marathon Oil
|
April - 2025
|
November - 2025
|
Equatorial Guinea
|
Operating
|
||||||||
|
Vaalco Energy
|
November - 2025
|
October - 2026
|
Gabon
|
Committed with option to extend
|
||||||||||||
|
Odin
|
KFELS Super B Bigfoot Class
|
350 ft
|
2013
|
Fieldwood Energy
|
August - 2025
|
November - 2025
|
Mexico
|
Operating
|
||||||||
|
Undisclosed
|
January - 2026
|
July - 2026
|
USA
|
LOA
|
||||||||||||
|
Prospector 1 1
|
F&G, JU2000E
|
400 ft
|
2013
|
ONE-Dyas
|
October - 2025
|
October - 2025
|
Netherlands
|
Standby
|
||||||||
|
Dana Petroleum
|
November - 2025
|
November - 2025
|
Netherlands
|
Operating
|
||||||||||||
|
ONE-Dyas
|
December - 2025
|
June - 2026
|
Netherlands
|
Committed with option to extend
|
||||||||||||
|
Prospector 5 1
|
F&G, JU2000E
|
400 ft
|
2014
|
Eni
|
April - 2024
|
May - 2026
|
Congo
|
Operating
|
||||||||
|
Ran 1
|
KFELS Super A Class
|
400 ft
|
2013
|
Eni
|
May - 2025
|
January - 2026
|
Mexico
|
Operating with option to extend
|
||||||||
|
Saga
|
KFELS Super B Bigfoot Class
|
400 ft
|
2018
|
Brunei Shell Petroleum
|
November - 2022
|
November - 2026
|
Brunei
|
Operating with option to extend
|
||||||||
|
Skald
|
KFELS Super B Bigfoot Class
|
400 ft
|
2018
|
Medco Energi
|
October - 2025
|
April - 2026
|
Thailand
|
Operating with option to extend
|
||||||||
|
Thor
|
KFELS Super B Bigfoot Class
|
400 ft
|
2019
|
HLHV JOC
|
November - 2025
|
June - 2026
|
Vietnam
|
Committed with option to extend
|
||||||||
|
Vali
|
KFELS Super B Bigfoot Class
|
400 ft
|
2024
|
Mellitah Oil and Gas
|
March - 2025
|
July - 2026
|
Libya
|
Operating with option to extend
|
||||||||
|
Available Rigs
|
||||||||||||||||
|
Var
|
KFELS Super B Bigfoot Class
|
400 ft
|
2024
|
December - 2024
|
Singapore
|
Warm Stacked
|
||||||||||
|
Operating / Committed
|
Available
|
Cold Stacked
|
||||||||||||
|
Total Fleet
|
24
|
23
|
1
|
0
|
||||||||||
|
Borr Drilling
Fleet Status Report - 05 November 2025
|
|
|
Additional information regarding this Fleet Status Report
|
|||||
|
This summary contains information on letters of intent/award and advanced negotiations. Letters of intent/award or advanced negotiations may not result in an actual drilling contract.
|
|||||
|
Forward Looking Statements:
The statements described in this status report that are not historical facts are “Forward Looking Statements”.
Forward Looking Statements reflect management’s current expectations and assumptions, and are subject to inherent uncertainties, risks and changes in circumstances that are difficult to predict. No assurance can be given that the
expectations expressed in these Forward-Looking Statements will prove to be correct. Actual results could differ materially from expectations expressed in, or implied by, the Forward-Looking Statements if one or more of the underlying
assumptions or expectations proves to be inaccurate or is unrealised. These include, but are not limited to, changes to commencement dates, contract duration, earned day rates, locations and other contractual terms; risks relating to
the delivery of drilling rigs under construction; sale and purchase of drilling units; oil and gas prices; and risks associated with international operations generally.
No Forward-Looking Statement contained in herein or expressed elsewhere should be relied upon as predicting future events.
We undertake no obligation to update or revise any Forward-Looking Statements to reflect events or circumstances that occur, or which we become aware of, after the date hereof, except as otherwise may be required by law.
|
|||||