|
Exhibit
|
Description
|
|
|
Press Release
|
|
ioneer Ltd
|
|||
|
(registrant)
|
|||
|
Date: October 29, 2025
|
By:
|
/s/ Ian Bucknell |
|
|
Name:
|
Ian Bucknell | |
|
Title:
|
Chief Financial Officer & Company Secretary |

|
|
||
|
Further Leach Optimisation Enhances
Project Economics
|
||
|
|
|
|
|
|
● |
19% increase in unlevered life of mine NPV to US$2,237 million
|
|
|
● |
8% increase in unlevered life of mine IRR to 18.0%
|
|
|
● |
9% increase in annual lithium hydroxide production to 27,800 tpa
|
|
|
● |
7% increase in annual boric acid production to 135,500 tpa
|
|
|
● |
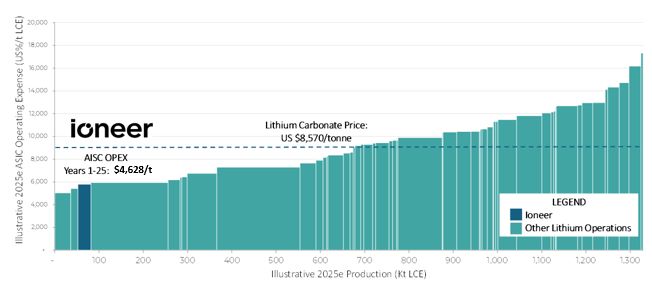
All-in sustaining cash cost of US$4,628 per metric tonne lithium carbonate equivalent
|
|
|
● |
Made possible by further reducing vat leach retention time from two (2) days to one and a half (1.5) days, enabling a reduction in acid consumption per tonne of ore processed and a subsequent 15% increase in
the amount of ore processed from 3.0 Mtpa to 3.4 Mtpa using the available surplus acid, far exceeding earlier expectations
|
| ● |
Rhyolite Ridge is the only known lithium deposit globally that is amenable to vat and heap leaching, reflecting its unique mineralogy and allowing for on-site production of lithium and boron high-purity
chemicals
|
|
| ● |
The large Ore Reserve and Mineral Resource supports future expansions to further increase lithium and boron production to supply the rapidly growing US strategic demand for both products
|
|
| ● |
Improvements made possible with minimal increase in project capital costs and no change to process plant design
|
|
|
KEY PARAMETERS
|
UNIT
|
YEARS 1-25
AVERAGE
|
LOM
AVERAGE
|
|
|
PHYSICALS
|
||||
|
Ore processing rate
|
Mtpa
|
3.4
|
3.4
|
|
|
Total tonnes processed
|
Mt
|
86.2
|
265.5
|
|
|
Lithium carbonate grade (equivalent)
|
%
|
0.91
|
0.77
|
|
|
Boric acid grade (equivalent)
|
%
|
5.22
|
2.91
|
|
|
Recoveries – Lithium carbonate
|
%
|
81.7
|
80.0
|
|
|
Recoveries – Lithium hydroxide (year three and beyond)
|
%
|
96.0
|
96.0
|
|
|
Recoveries – Boric acid
|
%
|
74.7
|
62.4
|
|
|
Lithium carbonate equivalent (LCE) production1
|
tpa
|
~24,500
|
~20,400
|
|
|
Lithium hydroxide (year three and beyond) production
|
tpa
|
~27,800
|
~23,200
|
|
|
Boric acid production
|
tpa
|
~135,500
|
~70,700
|
|
|
 |

|
 |
|
KEY PARAMETERS
|
UNIT
|
YEARS 1-25
AVERAGE
|
LOM
AVERAGE
|
|
|
OPERATING AND CAPITAL COSTS
|
||||
|
LCE All-in Sustaining Cost (AISC) (net of boric acid credit)
|
US$/t LCE
|
4,628
|
6,712
|
|
|
LCE direct cost (C1) (net of boric acid credit)
|
US$/t LCE
|
2,933
|
5,216
|
|
|
Mining cost per ore tonne (inclusive of waste)
|
US$/t
|
18.0
|
9.6
|
|
|
Processing cost per ore tonne
|
US$/t
|
55.8
|
49.3
|
|
|
Mining cost per total tonnes (ore and waste)
|
US$/t
|
2.32
|
2.21
|
|
|
PRICING ASSUMPTIONS
|
||||
|
Lithium hydroxide index price2
|
US$/t
|
23,040
|
23,012
|
|
|
Boric acid price3
|
US$/t
|
1,296
|
1,368
|
|
|
FINANCIAL PERFORMANCE
|
||||
|
Annual revenue
|
US$Mpa
|
790.1
|
607.5
|
|
|
Annual revenue – Lithium
|
US$Mpa
|
607.3
|
511.0
|
|
|
Annual revenue – Boric acid
|
US$Mpa
|
182.8
|
96.5
|
|
|
Annual EBITDA
|
US$Mpa
|
563.4
|
416.6
|
|
|
Annual EBITDA margin
|
%
|
71.3
|
68.6
|
|
|
After-tax unlevered NPV @ 8% real discount rate
|
US$M
|
2,237.3
|
||
|
After-tax Internal unlevered Rate of Return (IRR)
|
%
|
18.0
|
||
|
After-tax levered NPV @ 8% real discount rate
|
US$M
|
2,299.9
|
||
|
After-tax levered Internal Rate of Return (IRR)
|
%
|
23.2
|
||
|
Payback period (from start of operations)
|
years
|
7.0
|
||
|
KEY PARAMETERS
|
UNIT
|
YEARS 1-25
TOTAL
|
LOM
TOTAL
|
|
|
CAPITALIZED EXPENDITURE
|
||||
|
Initial capital expenditure (including contingencies)
|
US$M
|
1,683.2
|
||
|
Sustaining capital expenditure
|
US$M
|
916.6
|
2,168.1
|
|
|
Capitalized deferred pre-stripping costs4
|
US$M
|
701.1
|
933.0
|
|
|
|
|
|
|
|
|
|
|
|
|
|
|
• |
Lithium Carbonate (Technical Grade), available from start-up and reprocessed into lithium hydroxide monohydrate from
year 3,
|
|
|
• |
Lithium Hydroxide Monohydrate (Battery Grade) from year 3, and
|
|
|
• |
Boric Acid (technical grade), available from start-up.
|
|
|
|
|
|
|
|
|
|
|
|
|
|
|
KEY HIGHLIGHTS
|
||
|
|
|
● | Fully permitted and engineering ready |
|
|
|
● | Water rights fully secured |
|
|
|
● | Closed DOE LPO loan for US$996 million (including capitalised interest during construction of US$28 million5). DOE LPO loan has conditions to first draw. |
|
|
|
● | Robust, strategic partner process launched with Goldman Sachs in early July |
|
|
|
● | Compelling Project Economics for Stage One of Project |
|
|
|
● | All-in Sustaining Cash Cost in the lowest quartile of the Global Cost Curve |
|
|
|
● | Well Defined and Reliable Operating Cost and Capital Cost Estimates (AACE Class 2) |
|
|
|
● | Long-Life Resource with Optimisation Upside and Verified Expansion Potential |
|
|
|
● | US Advantage and Low-Risk, Mining-Friendly Jurisdiction |
|
|
|
|
|
|
|
|
|
|
|
|
|
Processing Stream
|
Group
|
Classification
|
Tonnes
(M)
|
Li
(ppm)
|
B
(ppm)
|
Li2CO3
(wt. %)
|
H3BO3
(wt. %)
|
Li2CO3
(kt) |
H3BO3
(kt)
|
|
Combined Streams
|
October 2025 Resource
|
Mea + Ind
|
440.3
|
1,424
|
5,026
|
0.76
|
2.87
|
3,337
|
12,655
|
|
Inf
|
108.3
|
1,310
|
3,384
|
0.70
|
1.93
|
755
|
2,095
|
||
|
Total
|
548.6
|
1,401
|
4,702
|
0.75
|
2.69
|
4,092
|
14,750
|
||
|
August 2025 Resource
|
Mea + Ind
|
434.3
|
1,437
|
5,092
|
0.76
|
2.91
|
3,321
|
12,645
|
|
|
Inf
|
105.1
|
1,332
|
3,472
|
0.71
|
1.99
|
745
|
2,088
|
||
|
Total
|
539.5
|
1,417
|
4,776
|
0.75
|
2.73
|
4,067
|
14,733
|
||
|
Variation
|
Mea + Ind
|
6.0
|
16
|
10
|
|||||
|
Inf
|
3.2
|
10
|
7
|
||||||
|
Total
|
9.1
|
25
|
17
|
|
Group
|
Classification
|
Tonnes
(Mt)
|
Li
(ppm)
|
B
(ppm)
|
Li2CO3
(wt. %)
|
H3BO3
(wt. %)
|
Li2CO3
(kt)
|
H3BO3
(kt)
|
|
October 2025
Reserve
|
Proved
|
91.6
|
1,575
|
6,460
|
0.84
|
3.69
|
768
|
3,384
|
|
Probable
|
173.9
|
1,373
|
4,401
|
0.73
|
2.52
|
1,271
|
4,377
|
|
|
Total
|
265.5
|
1,443
|
5,112
|
0.77
|
2.92
|
2,039
|
7,761
|
|
|
August 2025
Reserve
|
Proved
|
89.5
|
1,574
|
6,589
|
0.84
|
3.77
|
750
|
3,373
|
|
Probable
|
170.8
|
1,386
|
4,473
|
0.74
|
2.56
|
1,260
|
4,369
|
|
|
Total
|
260.3
|
1,451
|
5,201
|
0.77
|
2.97
|
2,010
|
7,742
|
|
|
Variation
|
Proved
|
2.1
|
1618
|
962
|
18
|
11
|
||
|
Probable
|
3.1
|
657
|
434
|
11
|
8
|
|||
|
Total
|
5.2
|
1045
|
647
|
29
|
19
|
|
|
• |
Secure equity financing to sit alongside U.S. Government debt ($996 million)7
|
|
|
• |
Final Investment Decision once equity and debt are in place
|
|
|
• |
Construction Phase. Expected to take approximately 36 months (including procurement of long lead items)
|
|
|
• |
First Production – 36 months from FID1
|
|
|
• |
Pathway to future growth
|
|
|
|
|
|
|
|
Chad Yeftich
Ioneer USA Corporation |
Ian Bucknell
Ioneer Limited |
||
|
Investor Relations (USA)
T: +1 775 993 8563 E: ir@ioneer.com |
Investor Relations (AUS)
T: +61 434 567 155 E: ibucknell@ioneer.com |
||
|
|
Daniel Francis, FGS Global |
|
|
|
||
| E: daniel.francis@fgsglobal.com |
|
|
|
|
|
|
|
|
|
|
|
|
|
|
|
|
|
|
June 2025
3-day leach |
August 2025
2-day leach |
October 2025
1.5-day leach |
|
Unlevered NPV8
|
$1,367 million
|
$1,888 million
|
$2,237 million
|
|
|
Avg. LOM Annual Revenue
|
$497 million
|
$575 million
|
$608 million
|
|
|
Avg. LOM Annual LCE Production
|
17,200 tpa
|
19,300 tpa
|
20,400 tpa
|
|
|
Avg. LOM Annual Boric Acid Production
|
60,400 tpa
|
68,000 tpa
|
70,700 tpa
|
|
|
Ore Processed
|
246.6 Mt
|
260.3 Mt
|
265.5 Mt
|
|
|
Life of Project
|
95 years
|
82 years
|
77 years
|
|
|
Average Annual EBITDA
|
$319 million
|
$384 million
|
$417 million
|
|
|
Capital Costs (AACE Class 2 estimate)
|
$1,667.9 million
|
$1,667.9 million
|
$1,683.2 million
|
|
|
Sustaining Capex
|
$1,830 million
|
$2,242 million
|
$2,168 million
|
|
|
Unlevered IRR
|
14.5%
|
16.8%
|
18.0%
|
|
|
Payback Period (from operations)
|
8.0 years
|
7.0 years
|
7.0 years
|
|
|
Confidence Level
|
P65
|
P65
|
P65
|
| |
|
|
Stream
|
Group
|
Classification
|
Tonnage
(ktonnes)
|
Li
ppm
|
B
ppm
|
Li2CO3
Wt. %
|
H3BO3
Wt. %
|
Contained
|
|
|
Li2CO3
(ktonnes)
|
H3BO3
(ktonnes)
|
||||||||
 Stream 1 (>= 5,000 ppm B)
|
Upper
Zone M5
Unit
|
Measured
|
4,562
|
2,350
|
7,592
|
1.25
|
4.34
|
57
|
198
|
|
Indicated
|
4,224
|
2,231
|
7,450
|
1.19
|
4.26
|
50
|
180
|
||
|
Inferred
|
763
|
2,197
|
6,515
|
1.17
|
3.73
|
9
|
28
|
||
|
Total
|
9,549
|
2,285
|
7,443
|
1.22
|
4.26
|
116
|
406
|
||
|
Upper
Zone B5 Unit
|
Measured
|
38,404
|
1,891
|
15,282
|
1.01
|
8.74
|
386
|
3,356
|
|
|
Indicated
|
38,670
|
1,743
|
13,996
|
0.93
|
8.00
|
359
|
3,095
|
||
|
Inferred
|
10,628
|
1,712
|
10,563
|
0.91
|
6.04
|
97
|
642
|
||
|
Total
|
87,702
|
1,804
|
14,143
|
0.96
|
8.09
|
842
|
7,092
|
||
|
Upper
Zone
S5 Unit
|
Measured
|
3,693
|
1,419
|
7,641
|
0.75
|
4.37
|
28
|
161
|
|
|
Indicated
|
4,747
|
1,285
|
7,415
|
0.68
|
4.24
|
32
|
201
|
||
|
Inferred
|
1,572
|
1,400
|
6,469
|
0.75
|
3.70
|
12
|
58
|
||
|
Total
|
10,013
|
1,352
|
7,350
|
0.72
|
4.20
|
72
|
421
|
||
|
Upper
Zone
Total
|
Measured
|
46,660
|
1,899
|
13,926
|
1.01
|
7.96
|
471
|
3,715
|
|
|
Indicated
|
47,641
|
1,741
|
12,760
|
0.93
|
7.30
|
441
|
3,476
|
||
|
Inferred
|
12,963
|
1,703
|
9,828
|
0.91
|
5.62
|
117
|
728
|
||
|
Total
|
107,264
|
1,805
|
12,913
|
0.96
|
7.38
|
1,030
|
7,920
|
||
|
Lower
Zone
L6 Unit
|
Measured
|
17,726
|
1,366
|
9,361
|
0.73
|
5.35
|
129
|
949
|
|
|
Indicated
|
39,731
|
1,324
|
9,507
|
0.70
|
5.44
|
280
|
2,160
|
||
|
Inferred
|
13,914
|
1,415
|
12,287
|
0.75
|
7.03
|
105
|
978
|
||
|
Total
|
71,370
|
1,352
|
10,012
|
0.72
|
5.73
|
514
|
4,086
|
||
|
Total
Stream 1
(all zones)
|
Measured
|
64,385
|
1,752
|
12,669
|
0.93
|
7.24
|
600
|
4,664
|
|
|
Indicated
|
87,372
|
1,551
|
11,280
|
0.83
|
6.45
|
721
|
5,636
|
||
|
Inferred
|
26,877
|
1,554
|
11,101
|
0.83
|
6.35
|
222
|
1,706
|
||
|
Total
|
178,634
|
1,624
|
11,754
|
0.86
|
6.72
|
1,544
|
12,006
|
||
 Stream 2 ($ Stream 2 ($11.13/tonne net value cut-off grade, Low Clay)
|
Upper
Zone
B5 Unit
|
Measured
|
4,967
|
2,228
|
2,211
|
1.19
|
1.26
|
59
|
63
|
|
Indicated
|
4,749
|
2,115
|
2,510
|
1.13
|
1.44
|
53
|
68
|
||
|
Inferred
|
3,617
|
1,688
|
2,357
|
0.90
|
1.01
|
33
|
37
|
||
|
Total
|
13,433
|
2,039
|
1,764
|
1.08
|
1.25
|
146
|
168
|
||
|
Upper
Zone
S5 Unit
|
Measured
|
25,799
|
982
|
1,116
|
0.52
|
0.64
|
135
|
165
|
|
|
Indicated
|
39,434
|
825
|
939
|
0.44
|
0.54
|
173
|
212
|
||
|
Inferred
|
17,145
|
847
|
934
|
0.45
|
0.53
|
77
|
92
|
||
|
Total
|
82,378
|
879
|
993
|
0.47
|
0.57
|
385
|
468
|
||
|
Upper
Zone
Total
|
Measured
|
30,766
|
1,183
|
1,293
|
0.63
|
0.74
|
194
|
227
|
|
|
Indicated
|
44,183
|
964
|
1,108
|
0.51
|
0.63
|
227
|
280
|
||
|
Inferred
|
20,862
|
997
|
1,082
|
0.53
|
0.62
|
111
|
129
|
||
|
Total
|
95,811
|
1,041
|
1,162
|
0.55
|
0.66
|
531
|
636
|
||
|
Lower
Zone
L6 Unit
|
Measured
|
44,093
|
1,209
|
1,579
|
0.64
|
0.90
|
284
|
398
|
|
|
Indicated
|
120,601
|
1,178
|
1,569
|
0.63
|
0.90
|
756
|
1,082
|
||
|
Inferred
|
48,433
|
1,232
|
794
|
0.66
|
0.45
|
318
|
220
|
||
|
Total
|
213,128
|
1,197
|
1,395
|
0.64
|
0.80
|
1,357
|
1,700
|
||
|
Total
Stream 2
(all zones)
|
Measured
|
74,859
|
1,198
|
1,461
|
0.64
|
0.84
|
477
|
626
|
|
|
Indicated
|
164,785
|
1,121
|
1,445
|
0.60
|
0.83
|
983
|
1,362
|
||
|
Inferred
|
69,295
|
1,161
|
881
|
0.62
|
0.50
|
428
|
349
|
||
|
Total
|
308,939
|
1,149
|
1,323
|
0.61
|
0.76
|
1,888
|
2,336
|
||
 Stream 3($11.13/tonne net value cut-off grade,
High Clay)
|
Total
Stream 3
(M5 zone)
|
Measured
|
19,223
|
2,201
|
1,550
|
1.17
|
0.89
|
225
|
170
|
|
Indicated
|
29,720
|
2,085
|
1,164
|
1.11
|
0.67
|
330
|
198
|
||
|
Inferred
|
12,118
|
1,621
|
579
|
0.86
|
0.33
|
105
|
40
|
||
|
Total
|
61,061
|
2,029
|
1,169
|
1.08
|
0.67
|
659
|
408
|
||
|
Grand Total All Streams
and All Units
|
Measured
|
158,467
|
1,545
|
6,026
|
0.82
|
3.45
|
1,303
|
5,460
|
|
|
Indicated
|
281,876
|
1,356
|
4,464
|
0.72
|
2.55
|
2,034
|
7,195
|
||
|
Inferred
|
108,290
|
1,310
|
3,384
|
0.70
|
1.93
|
755
|
2,095
|
||
|
Total
|
548,633
|
1,401
|
4,702
|
0.75
|
2.69
|
4,092
|
14,750
|
||
|
Processing
Stream
|
Group
|
Classification
|
Tonnes
(M)
|
Li
(ppm)
|
B
(ppm)
|
Li2CO3
(wt. %)
|
H3BO3
(wt. %)
|
Li2CO3
(kt)
|
H3BO3
(kt)
|
|
Combined
Streams
|
October
2025
Resource
|
Mea + Ind
|
440.3
|
1,424
|
5,026
|
0.76
|
2.87
|
3,337
|
12,655
|
|
Inf
|
108.3
|
1,310
|
3,384
|
0.70
|
1.93
|
755
|
2,095
|
||
|
Total
|
548.6
|
1,401
|
4,702
|
0.75
|
2.69
|
4,092
|
14,750
|
||
|
August 2025
Resource
|
Mea + Ind
|
434.3
|
1,437
|
5,092
|
0.76
|
2.91
|
3,321
|
12,645
|
|
|
Inf
|
105.1
|
1,332
|
3,472
|
0.71
|
1.99
|
745
|
2,088
|
||
|
Total
|
539.5
|
1,417
|
4,776
|
0.75
|
2.73
|
4,067
|
14,733
|
||
|
Variation
|
Mea + Ind
|
6.0
|
16
|
10
|
|||||
|
Inf
|
3.2
|
10
|
7
|
||||||
|
Total
|
9.1
|
25
|
17
|
| ● |
Leach retention time is reduced from two days to one and half days;
|
| ● |
The reduction in retention time reduced the recovery of lithium and boron in the B5, S5 and L6 seams, the predominate impact is to Stream 2;
|
| ● |
The reduction in retention time also reduced the acid consumption of the gangue minerals in the M5, B5, S5 and L6 seams for Streams 1,2 and 3;
|
| ● |
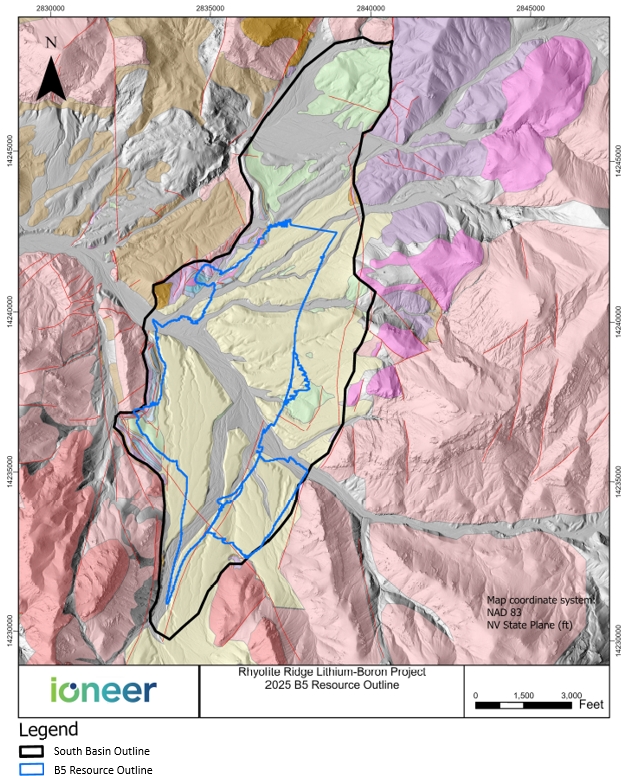
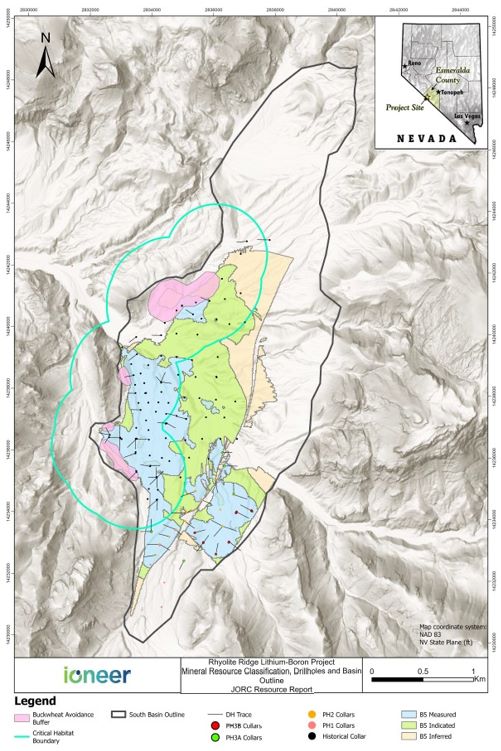
The Rhyolite Ridge Mineral Resource area extends over a north-south strike length of 4,240 m (from 4,337,540mN – 4,341,780mN), has a maximum width of 2,110m (863,330 mE – 865,440 mE)
and includes the 585 m vertical interval from 2,065mRL to 1,480 mRL.
|
| ● |
The Rhyolite Ridge Project tenements (unpatented mining claims) are owned by Ioneer Minerals Corporation, a company wholly owned by Ioneer Ltd. The unpatented mining claims are located
on US federal land administered by the Bureau of Land Management (BLM).
|
| ● |
Lithium and boron mineralisation is stratiform in nature and is hosted within Late Miocene-age carbonate-rich sedimentary rock, deposited in a lacustrine environment in the Basin and
Range terrain of Nevada, USA.
|
| ● |
Drill holes used in the Mineral Resource estimate included 50 reverse circulation (RC) holes and 110 core holes for a total of 32,530m within the
defined mineralisation. The full database for the South Basin contains records for 166 drill holes for 33,519m of drilling.
|
| ● |
Drill hole spacing is 100m by 100m (or less) over most of the deposit.
|
| ● |
Drill holes were logged for a combination of geological and geotechnical attributes. The core has been photographed and measured for RQD and core recovery.
|
| ● |
Drilling was conducted by American Lithium Minerals Inc., the previous owner of the property between 2010 and 2011 and by Ioneer in 2017 to 2019 and 2022 to 2024. For RC drilling, a
12.7-centimetre (cm) hammer was used with sampling conducted on 1.52m intervals and split using a rig mounted rotary splitter. The hammer was replaced with a tri-cone bit in instances of high
groundwater flow. For diamond core, PQ and HQ core size diameter with standard tube was used. Core recoveries of 93% were achieved by Ioneer at the project. The core was sampled as half core at 1.52m intervals using a standard
electric core saw.
|
| ● |
Samples were submitted to ALS Minerals Laboratory in Reno, Nevada for sample preparation and analysis. The entire sample was oven dried at 105˚C and crushed to -2 millimetre (mm). A sub-sample of the crushed material was then pulverised to better than 85% passing -75 microns (µm) using a LM5 pulveriser. The pulverised sample was
split with multiple feed in a Jones riffle splitter until a 100-200 gram (g) sub-sample was obtained for analysis.
|
| ● |
Analysis of the samples was conducted using aqua regia 2-acid for ICP-MS on a multi-element suite. This method is appropriate for understanding sedimentary lithium deposits and is a
total method.
|
| ● |
Standards for lithium and boron and blanks were routinely inserted into sample batches and acceptable levels of accuracy were reportedly obtained. Based on an evaluation of the quality
assurance and quality control (QA/QC) results all assay data has been deemed by the IMC Competent Person as suitable and fit for purpose in Mineral Resource estimation.
|
| ● |
The Mineral Resource estimate presented in this Report has been constrained by the application of an optimized Mineral Resource pit shell. The Mineral Resource pit shell was developed using the Independent Mining Consultants, Inc.
(IMC) Mine Planning software.
|
| ● |
The Mineral Resource estimate assumes the use of three processing streams: one which can process ore with boron content greater than 5,000 ppm and two which can process ore with boron content less than 5,000 ppm.
|
| ● |
The Mineral Resource estimate has been constrained by applying a 5,000 ppm Boron cut-off grade to HiB-Li mineralisation within the B5, M5, S5 and L6 geological units as well as a $11.13/tonne net value
cut-off grade to LoB-Li mineralisation in the M5, B5, S5 and L6 geological units.
|
|
●
|
Key input parameters and assumptions for the Mineral Resource pit shell included the following:
|
|
●
|
B cut-off grade of 5,000 ppm for HiB-Li processing stream and no B cut-off grade for LoB-Li processing stream
|
|
●
|
No Li cut-off grade for HiB-Li processing stream and net value cutoff of $11.13/tonne for LoB-Li processing stream
|
|
●
|
Overall pit slope angle of 42 degrees in all rock units (wall angle guidance provided by Geo-Logic Associates who developed the geotechnical design)
|
|
●
|
Fixed mining cost of US$1.69 /tonne and a variable incremental mining cost of $0.005/tonne per vertical meter from reference elevation of 6,210 ft amsl
|
|
●
|
G&A cost of US$11.13/tonne processed
|
|
●
|
Ore processing and grade control costs include a fixed cost per tonne and a variable cost of acid based on the acid consumption rate which is calculated for each block within the mineralized seams. For
Stream 1 the total (combined fixed and acid) cost is between $35.71/mt and $75.82/mt. For Stream 2, the combined cost ranges between $17.49/mt to $68.23/mt and for Stream 3 costs ranged between $41.84/mt and $80.11/mt. This wide
range is explained by the variability in acid consumption for each of these streams, mostly due to the variability in calcium grade.
|
|
●
|
Boron and Lithium recovery are variable by lithology for Stream 1 and are respectively for boron and lithium: M5 80.2% and 85.7%, B5 76.6% and 85.3%, S5 75.4% and 80.90%, L6 72.30% and 75.6%.
|
|
●
|
Boron Recovery for Stream 2 and 3 are variable by lithology as follows: 65% in M5 Unit, 76.6% in B5 unit, 45.2% in S5 unit, and 29.4% in L6 unit
|
|
●
|
Lithium Recovery for Stream 2 and 3 are variable by lithology as follows: 78% in M5 unit, 85.3% in B5 unit, 83.2% in S5 unit, and 74.9% in L6 unit
|
|
●
|
Boric Acid sales price of US$1,172.78/tonne
|
|
●
|
Lithium Carbonate sales price of US$19,351.38/tonne
|
|
●
|
Sales/Transport costs are included in the G&A cost
|
| ● |
Drill core samples were assayed on nominal 1.52 m lengths and this data set was composited to 1.52m lengths which respected seam contacts and was used for the interpolation of grade data into a 1.52m
bench height block model. The data set honoured geological contacts (i.e. assay intervals did not span unit contacts).
|
| ● |
Based on a statistical analysis, extreme B grade values were identified in some of the units other than the targeted G5, B5, M5, S5, G6, L6 and Lsi units. The units other than these units were not
estimated so no grade capping was applied to the drill hole database. The units B5, M5, S5 and L6 are the units of economic interest and the grades in these units and the adjacent units were estimated for completeness when
re-blocking to a 9.14m bench height block model used to tabulate the mineral resource.
|
| ● |
The geological model was developed as a gridded surface stratigraphic model with fault domains included which offset the stratigraphic units in various areas of the deposit. The geological model was
developed by GSI under direction of Ioneer and provided to IMC as the geologic basis for grade estimation. IMC has reviewed the geological model and accepts the interpretation.
|
| ● |
Domaining in the model was constrained by the roof and floor surfaces of the geological units. The unit boundaries were modelled as hard boundaries, with samples interpolated only within the unit in
which they occurred.
|
| ● |
The geological model used as the basis for estimating Mineral Resources was developed as a stratigraphic gridded surface model using a 7.6m regularized grid in plan. The grade block model was developed
using a 7.6m north-south by 7.6m east-west by 1.52m vertical block dimension (no sub-blocking was applied). The grid cell and block size dimensions represent 25 percent of the nominal drill hole spacing across the model area. The
model was reblocked to 9.14 m high blocks (six 1.52m blocks combined vertically) for assigning the economic attributes and tabulating the mineral resource.
|
| ● |
Inverse Distance Squared (‘ID2’) grade interpolation was used for the estimate, constrained by stratigraphic unit roof
and floor surfaces from the geological model. The search direction for estimating grade varied and followed the floor orientation of the seams which changed within the fault block domains. The search distances ranged from 533 m in
B5 to 229 m in S5. The number of drill hole composites used to estimate the grades of a model block ranges from a minimum of two composites to a maximum of 10 composites, with no more than 3 composites from one drill hole.
|
| ● |
The density values used to convert volumes to tonnages were assigned on a by-geological unit basis using mean values calculated from 120 density samples collected from drill core during the 2018 and
more recent 2022-2023 P1 and P2 drilling programs. The density values by seam ranged from 1.53 grams per cubic centimeter (‘g/cm3’) for S3 to 1.98/cm3 in seam L6. The density analyses performed by geotechnical consultants present during both the 2018 and 2022-2023 drilling programs (P1 and P2) followed
a strict repeatable process in sample collection and analysis utilizing the Archimedes-principle (water displacement) method for density determination, with values reported in dry basis. This provided consistent representative data.
The 2018 and 2022-2023 data aligned well and proved to be representative across the resource.
|
|
●
|
Estimated Mineral Resources were classified as follows:
|
|
●
|
Measured: Between 107 and 122m spacing between points of observation depending on the seam, with sample interpolation from a minimum of four drill holes.
|
|
●
|
Indicated: Between 168 and 244m spacing between points of observation depending on the seam, with sample interpolation from a minimum of two drill holes.
|
|
●
|
Inferred: To the limit of the estimation range (maximum 533m, depending on the seam), with sample interpolation from a minimum of one drill hole (2 composites).
|
| ● |
The Mineral Resource classification included the consideration of data reliability, spatial distribution and abundance of data and continuity of geology, fault structures and grade parameters.
|
| ● |
The Mineral Resource estimate presented in this Report was developed with the assumption that the mineralisation defined by Stream 1, 2 and 3 that resides within the Mineral Resource pit shell has a
reasonable prospect for eventual economic extraction using current conventional open pit mining methods.
|
|
|
● |
The basis of the mining assumptions made in establishing the reasonable prospects for eventual economic extraction of the mineralisation are based on the results from mine design and planning work that
is in-progress as part of an ongoing updates to the Feasibility Study for the Project based on new information.
|
|
|
● |
The basis of the metallurgical assumptions made in establishing the reasonable prospects for eventual economic extraction of the HiB-Li (Stream 1) mineralisation are based on results from metallurgical
and material processing work that was developed as part of the ongoing Feasibility Study for the Project. This test work was performed using current processing and recovery methods for producing Boric acid and Lithium carbonate
products.
|
|
|
● |
A second process stream (Stream 2) to recover Li from low boron mineralized- low clay (LoB-Li) units has been confirmed. Current results indicate a reasonable process and expectation for economic
extraction of the LoB-Li from the S5, B5 and L6 units. This test work was performed using current processing and recovery methods for producing Boric acid and Lithium carbonate products.
|
|
|
● |
A third process stream (Stream 3) to recover Li from low boron high clay mineralized (LoB-Li- HiClay) units has been confirmed. Current results indicate a reasonable process and expectation for economic
extraction of the LoB-Li from M5 unit. This test work was performed using current processing and recovery methods for producing Boric acid and Lithium carbonate products.
|
|
Area
|
Group
|
Classification
|
Metric
|
Lithium
|
Boron
|
Contained
Equivalent
Grade2
|
Contained6
Equivalent
Tonnes
|
Recovered6
Equivalent
Tonnes
|
|||||
|
Tonnes2
|
Grade7
|
Grade7
|
|||||||||||
|
Li
|
B
|
Li2CO3
|
H3BO3
|
Li2CO3
|
H3BO3
|
Li2CO3
|
H3BO3
|
||||||
|
(ktonnes)
|
(ppm)
|
(ppm)
|
(Wt.
%)
|
(Wt.
%)
|
(kt)
|
(kt)
|
(kt)
|
(kt)
|
|||||

(>= 5,000 ppm B)
|
Upper
Zone
M5 Unit
|
Proven
|
3,489
|
2,401
|
7,652
|
1.28
|
4.38
|
45
|
153
|
38
|
122
|
||
|
M5 Unit
|
Probable
|
3,411
|
2,262
|
7,430
|
1.20
|
4.25
|
41
|
145
|
35
|
116
|
|||
|
Sub-total
M5 Unit
|
6,900
|
2,332
|
7,542
|
1.24
|
4.31
|
86
|
298
|
73
|
239
|
||||
|
Upper
Zone
B5 Unit
|
Proven
|
27,990
|
1,880
|
15,364
|
1.00
|
8.78
|
280
|
2,459
|
239
|
1,884
|
|||
|
B5 Unit
|
Probable
|
31,456
|
1,742
|
14,169
|
0.93
|
8.10
|
292
|
2,549
|
249
|
1,952
|
|||
|
Subtotal
B5 Unit
|
59,446
|
1,807
|
14,732
|
0.96
|
8.42
|
572
|
5,007
|
488
|
3,836
|
||||
|
Upper Zone
S5 Unit
|
Proven
|
2,237
|
1,326
|
7,754
|
0.71
|
4.43
|
16
|
99
|
13
|
75
|
|||
|
S5 Unit
|
Probable
|
3,354
|
1,166
|
7,533
|
0.62
|
4.31
|
21
|
144
|
17
|
109
|
|||
|
Sub-total
S5 Unit
|
5,591
|
1,230
|
7,622
|
0.65
|
4.36
|
37
|
244
|
30
|
184
|
||||
|
Upper
Zone
(B5, M5 & S5)
Sub-Total
|
Proven
|
33,716
|
1,897
|
14,061
|
1.01
|
8.04
|
340
|
2,711
|
290
|
2,081
|
|||
|
(B5, M5 & S5)
|
Probable
|
38,221
|
1,738
|
12,985
|
0.93
|
7.43
|
354
|
2,838
|
301
|
2,177
|
|||
|
Sub-Total
|
Sub-total
Upper Zone
|
71,937
|
1,813
|
13,489
|
0.96
|
7.71
|
694
|
5,549
|
591
|
4,258
|
|||
|
Lower
Zone
L6 Unit
|
Proven
|
5,712
|
1,389
|
8,357
|
0.74
|
4.78
|
42
|
273
|
32
|
197
|
|||
|
L6 Unit
|
Probable
|
13,591
|
1,334
|
7,856
|
0.71
|
4.49
|
97
|
611
|
73
|
441
|
|||
|
Sub-total
Lower Zone
|
19,303
|
1,351
|
8,004
|
0.72
|
4.58
|
139
|
883
|
105
|
639
|
||||
|
Total
Stream 1
(all
zones)
|
Proven
|
39,428
|
1,823
|
13,235
|
0.97
|
7.57
|
383
|
2,984
|
322
|
2,278
|
|||
|
Probable
|
51,812
|
1,632
|
11,640
|
0.87
|
6.66
|
450
|
3,448
|
374
|
2,619
|
||||
|
Sub-total Stream 1
|
91,241
|
1,715
|
12,329
|
0.91
|
7.05
|
833
|
6,432
|
696
|
4,897
|
||||
($11.13/tonne net value cut-off grade, Low Clay)
|
Upper
Zone
B5 Unit
|
Proven
|
4,529
|
2,218
|
2,143
|
1.18
|
1.23
|
53
|
55
|
46
|
43
|
||
|
B5 Unit
|
Probable
|
4,386
|
2,117
|
2,414
|
1.13
|
1.38
|
49
|
61
|
42
|
46
|
|||
|
Sub-total B5 Unit
|
8,915
|
2,169
|
2,276
|
1.15
|
1.30
|
103
|
116
|
88
|
89
|
||||
|
Upper Zone
S5 Unit
|
Proven
|
15,672
|
998
|
1,087
|
0.53
|
0.62
|
83
|
97
|
69
|
44
|
|||
|
S5 Unit
|
Probable
|
30,409
|
789
|
805
|
0.42
|
0.46
|
128
|
140
|
106
|
63
|
|||
|
Sub-total S5 Unit
|
46,082
|
860
|
901
|
0.46
|
0.52
|
211
|
237
|
175
|
107
|
||||
|
Upper Zone
B5 & S5
Sub-Total
|
Proven
|
20,201
|
1,271
|
1,324
|
0.68
|
0.76
|
137
|
153
|
115
|
87
|
|||
|
(B5 & S5)
|
Probable
|
34,796
|
956
|
1,008
|
0.51
|
0.58
|
177
|
200
|
148
|
110
|
|||
|
Sub-Total
|
Sub-total Upper Zone
|
54,997
|
1,072
|
1,124
|
0.57
|
0.64
|
314
|
353
|
263
|
196
|
|||
|
Lower Zone
L6 Unit
|
Proven
|
24,999
|
1,253
|
1,277
|
0.67
|
0.73
|
167
|
182
|
125
|
54
|
|||
|
L6 Unit
|
Probable
|
69,104
|
1,195
|
1,532
|
0.64
|
0.88
|
440
|
605
|
329
|
178
|
|||
|
Sub-total Lower Zone
|
94,102
|
1,211
|
1,464
|
0.64
|
0.84
|
606
|
788
|
454
|
232
|
||||
|
Total
Stream 2
(all zones)
|
Proven
|
45,200
|
1,261
|
1,298
|
0.67
|
0.74
|
303
|
335
|
240
|
140
|
|||
|
Probable
|
103,899
|
1,115
|
1,356
|
0.59
|
0.78
|
617
|
806
|
478
|
288
|
||||
|
Sub-total Stream 2
|
149,099
|
1,159
|
1,339
|
0.62
|
0.77
|
920
|
1,141
|
717
|
428
|
||||
|
Stream 3
($11.13/tonne net value cut-off grade, High Clay)
|
Total
Stream 3
(M5 zone)
|
Proven
|
7,001
|
2,205
|
1,630
|
1.17
|
0.93
|
82
|
65
|
64
|
42
|
||
|
Probable
|
18,191
|
2,110
|
1,176
|
1.12
|
0.67
|
204
|
122
|
159
|
80
|
||||
|
Sub-total Stream 3
|
25,192
|
2,137
|
1,302
|
1.14
|
0.74
|
286
|
188
|
223
|
122
|
||||
|
TOTAL of All Streams, All Seams, and All
Proven & Probable
|
265,531 | 1,443 | 5,112 | 0.77 | 2.92 | 2,039 | 7,761 | 1,636 | 5,447 | ||||
|
1.
|
The statement of estimates of Ore Reserves has been compiled by Mr. Joseph S.C. McNaughton, a Competent Person is a Registered Professional Engineer in State of Arizona. Mr McNaughton is
a full-time employee of IMC Inc. and is independent of Ioneer and its affiliates. Mr. Joseph McNaughton is responsible for the estimate, has sufficient experience that is relevant to the style of mineralisation and type of deposit
under consideration and to the activity being undertaken to qualify as a Competent Person as defined in the JORC Code (2012).
|
|
2.
|
The ore reserve estimates the result of determining the measured and indicated resource that incorporates modifying factors demonstrating that it is economically minable, allowing for
the conversion to proven and probable. In making this determination, constraints were applied to the geological model based upon a pit optimization analysis that defined a conceptual pit shell limit. The conceptual pit shell was based
upon a net value per tonne calculation including a 5,000ppm boron cut-off grade for high boron – high lithium (HiB-Li) mineralisation (Stream 1) and a $11.13/tonne net value cut-off grade for low boron (LoB-Li) mineralisation below
5,000ppm boron broke into two material types, low clay and high clay material respectfully (Stream 2 and Stream 3). The pit shell was constrained by a conceptual Mineral Resource optimized pit shell for the purpose of establishing
reasonable prospects of eventual economic extraction based on potential mining, metallurgical and processing grade parameters identified by mining, metallurgical and processing studies performed to date on the Project. The conceptual
pit shell was used a guide to the engineered quarry designs used to constrain the Mineral Reserves.
|
|
3.
|
Key inputs in developing the Mineral Resource pit shell included a 5,000ppm boron cut-off grade for HiB-Li mineralisation, $11.13/tonne net value cut-off grade for LoB-Li low clay
mineralisation and LoB-Li high clay mineralisation; mining cost of US$1.69 /tonne; G&A cost of US$11.13 /process tonne; plant feed processing and grade control costs which range between US$17.49/tonne and US$80.11/tonne of plant
feed (based on the acid consumption per stream and the mineral resource average grades); boron and lithium recovery (respectively) for Stream 1: M5 80.2% and 85.7%, B5 76.6% and 85.3%, S5 75.4% and 80.9%, L6 72.3% and 75.6%; Stream 2
and 3: M5 65.0% and 78.0%, B5 76.6% and 85.3%, S5 45.2% and 83.2%, L6 29.4% and 74.9%, respectively; boric acid sales price of US$1,172.78/tonne; lithium carbonate sales price of US$19,351.38/tonne.
|
|
4.
|
Ore reserves are based on a block model that is 7.62m x 7.62m in plan and 9.14m high. The model block size used for the ore reserve estimate is based on selected mining equipment and
approached used within the mine plan. As a result, the dilution and ore loss are incorporated within the block model
|
|
5.
|
Ore reserves reported on a dry in-situ basis. The contained and recovered lithium carbonate and boric acid are reported in the table above in metric tonnes. Lithium is converted to
equivalent contained tonnes of lithium carbonate using a stochiometric conversion factor of 5.322, and boron is converted to equivalent contained tonnes of boric acid using a stochiometric conversion factor of 5.718. Equivalent
stochiometric conversion factors are derived from the molecular weights of the individual elements which make up lithium carbonate and boric acid. The equivalent recovered tons of lithium carbonate and boric acid is the portion of the
contained tonnage that can be recovered after processing.
|
|
6.
|
All ore reserve figures represent estimates as of October 2025. Ore reserve estimates are not precise calculations, being dependent on the interpretation of limited information on the
location, shape and continuity of the occurrence and on the available sampling results. The totals have been rounded to reflect the relative uncertainty of the estimate. Totals may not sum due to rounding.
|
|
7.
|
Kt – thousand metric tonnes, MT – million metric tonnes, ktonne = thousand metric tons; Li = lithium; B = boron; ppm= parts per million; Li2CO3 = lithium carbonate; H3BO3 = boric acid. Equivalent lithium carbonate and boric acid grades have been rounded to the nearest tenth of a percent.
|
|
Group
|
Classification
|
Tonnes
(Mt)
|
Li
(ppm)
|
B
(ppm)
|
Li2CO3
(wt. %)
|
H3BO3
(wt. %)
|
Li2CO3
(kt)
|
H3BO3
(kt)
|
|
October
2025
Reserve
|
Proven
|
91.6
|
1,575
|
6,460
|
0.84
|
3.69
|
768
|
3,384
|
|
Probable
|
173.9
|
1,373
|
4,401
|
0.73
|
2.52
|
1,271
|
4,377
|
|
|
Total
|
265.5
|
1,443
|
5,112
|
0.77
|
2.92
|
2,039
|
7,761
|
|
|
August
2025
Reserve
|
Proven
|
89.5
|
1,574
|
6,589
|
0.84
|
3.77
|
750
|
3,373
|
|
Probable
|
170.8
|
1,386
|
4,473
|
0.74
|
2.56
|
1,260
|
4,369
|
|
|
Total
|
260.3
|
1,451
|
5,201
|
0.77
|
2.97
|
2,010
|
7,742
|
|
|
Variation
|
Proven
|
2.1
|
1618
|
962
|
18
|
11
|
||
|
Probable
|
3.1
|
657
|
434
|
11
|
8
|
|||
|
Total
|
5.2
|
1045
|
647
|
29
|
19
|
|
●
|
Revised with increase of 2 % in proven and probable total tonnes.
|
|
●
|
With an increase in Stream2 Ore feed overall lithium grade has remained relatively the same but Boron grade decreased by 2%.
|
|
●
|
The changes as compared to the previous ore reserve estimate primarily relate to:
|
|
o
|
Decrease of vat resident leach time from two days to one and a half days
|
|
o
|
Decrease in acid consumption in seams M5, B5, S5 and L6
|
|
o
|
Inclusion of addition Stream 2 and Stream 3
|
|
o
|
Decrease in boron and lithium recovery in seams B5, S5 and L6.
|
| ● |
Modifying factors;
|
|
●
|
Unit costs, including mining, processing, and sales costs;
|
|
●
|
Metallurgical recovery;
|
|
●
|
Sales prices;
|
|
●
|
Cut-off grades;
|
|
●
|
Geotechnical criteria, including overall quarry slopes;
|
|
●
|
Other external constraints such as the locations of buckwheat, permit boundaries, public utilities and infrastructure.
|
|
Seam
|
Boron to Boric Acid
|
Lithium to Lithium Carbonate
|
|||||||
|
Stream 1
|
Streams 2 & 3
|
Stream 1
|
Streams 2 & 3
|
||||||
|
M5
|
80.20%
|
65.00%
|
85.7%
|
78.0%
|
|||||
|
B5
|
76.6%
|
76.6%
|
85.3%
|
85.3%
|
|||||
|
S5
|
75.4%
|
45.2%
|
80.9%
|
83.2%
|
|||||
|
L6
|
72.3%
|
29.4%
|
75.6%
|
74.9%
|
|||||
|
Item
|
Unit
|
Description
|
|||
|
Revenue
|
US$ million
|
46,775
|
|||
|
Pre-tax cash flow
|
US$ million
|
27,231
|
|||
|
Post-tax cash flow
|
US$ million
|
24.025
|
|||
|
Unlevered post-tax net present value
|
US$ million
|
2,237
|
|||
|
Unlevered post-tax internal rate of return
|
%
|
18.0
|
|||
|
Payback period (including construction)
|
Years
|
10
|
|||
|
Mine life
|
Years
|
78
|
|||
|
Ore Processing period
|
Years
|
77
|
|
|
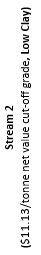
1.
|
North and South Basin plan showing the location of drill holes, Resource and tenement boundary.
|
|
|
2.
|
South Basin plan showing outlines of Measured, Indicated and Inferred Mineral Resources
|
|
|
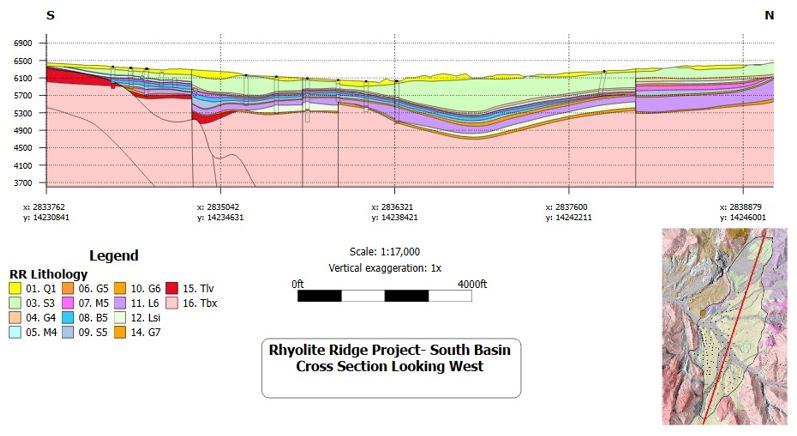
3.
|
South Basin South- North Cross Section looking West
|
|
|
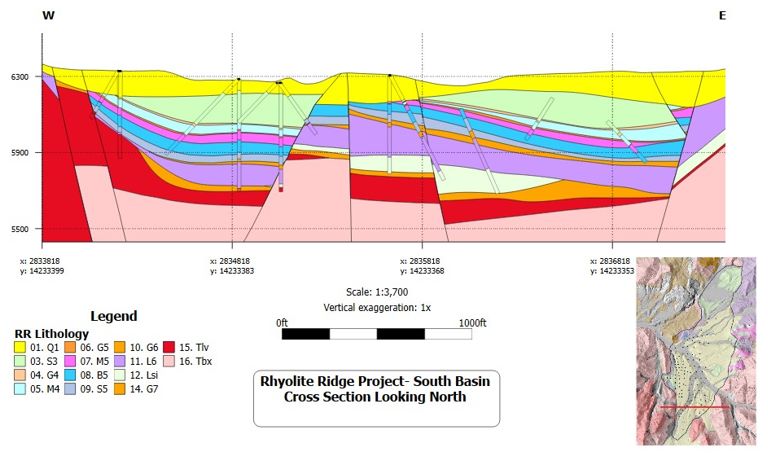
4.
|
South Basin Cross Section Looking North
|
|
|
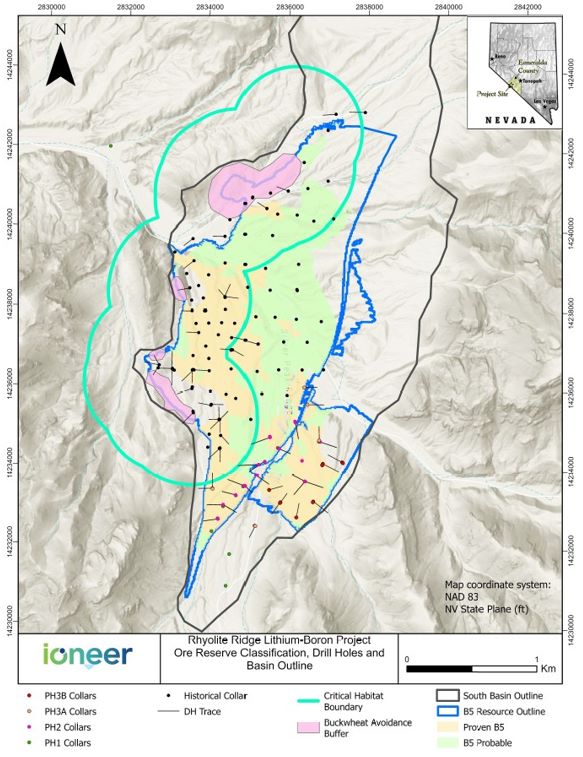
5.
|
South Basin plan showing outlines of Proved and Probable Ore Reserves
|
|
APPENDIX D: JORC Code, 2012 Edition - Table 1
|
|
|
Criteria
|
JORC Code 2012 Explanation
|
Commentary
|
|||||
|
Sampling
Techniques
|
• Nature and quality of sampling (e.g. cut channels, random chips, or specific specialised industry standard measurement tools appropriate to
the minerals under investigation, such as down hole gamma sondes, or handheld XRF instruments, etc.). These examples should not be taken as limiting the broad meaning of sampling
|
• The nature and quality of the sampling from the various sampling programs includes the following:
• Reverse circulation (RC) Drilling: a sample was collected every 1.52 metre (m) from a 127-millimetre (mm) diameter
drill hole and split using a rig-mounted rotary splitter. Samples, with a mean weight of 4.8 kilograms (kg) were submitted to ALS Minerals laboratory in Reno, NV where they were processed
for assay. RC samples represent 49% of the total intervals sampled to date.
• Core Drilling: Core samples were collected from HQ (63.5 mm core diameter) and PQ (85.0 mm core diameter) drill core, on a mean interval of 1.52 m, and
cut using a water-cooled diamond blade core saw. Samples, with a mean weight of 1.8 kg, were submitted to ALS where they were proceeded for assay.
• Drill Hole Deviation: Inclined core drill holes were surveyed to obtain downhole deviation by the survey company (International Directional Services, LLC)
or drilling company (Idea Drilling, Alford Drilling, IG Drilling, Boart Long Year, Major Drilling,) with a downhole Reflex Mems Gyros and Veracio TruShot tools and, for all but three of the drill holes. One drill hole could not be
surveyed due to tool error (SBH-72), and two were intentionally surveyed using an Acoustic Televiewer (SBH-60, SBH-79).
|
|
APPENDIX D: JORC Code, 2012 Edition - Table 1
|
|
|
Criteria
|
JORC Code 2012 Explanation
|
Commentary
|
|||||
|
• Trenches: In addition to sampling from drill holes, samples were collected from 19 mechanically excavated trenches in 2010. The trenches were excavated from the outcrop/subcrop
using a backhoe and or hand tools. Chip samples were then collected from the floor of the trench. Due to concerns with correlation and reliability of the results from the trenches, The Competent Person has not included any of this
data in the geological model or Mineral Resource estimate.
|
|||||||
|
• Include reference to measures taken to ensure sample representivity and the appropriate calibration of any measurement tools or systems used.
|
• Measures taken to ensure sample representivity include the following:
• Due to the nature of RC samples, lithological boundaries are not easily honoured; therefore, continuous 1.52 m sample intervals were taken to ensure as
representative a sample as possible. Lithological boundaries were adjusted as needed by a senior Ioneer geologist once the assay results were received.
• Core sample intervals were selected to reflect visually identifiable lithological boundaries wherever possible, to ensure sample representivity. In cases
where the lithological boundaries were gradational, the best possible interval was chosen and validated by geochemical assay results.
• All chip and core sampling were completed by or supervised by a senior Ioneer geologist. The senior Ioneer, Newfield’s and WSP geologists referenced here,
and throughout this Table 1, have sufficient relevant experience for the exploration methods employed, the type of mineralisation being evaluated, and are registered professional geologists in their jurisdiction; however, they are
not Competent Persons according to the definition presented in JORC as they are not members of one of the Recognized Professional Organization” included in the ASX list referenced by JORC.
• The Competent Person was not directly involved during the exploration drilling programs and except for observing sampling procedures on two drill holes
during the site visit (August 10, 2023), was not present to observe sample selection. Based on review of the procedures during the site visit and subsequent review of the data, it is the opinion of the Competent Person that the
measures taken to ensure sample representivity were reasonable for the purpose of estimating Mineral Resources.
|
|
APPENDIX D: JORC Code, 2012 Edition - Table 1
|
|
|
Criteria
|
JORC Code 2012 Explanation
|
Commentary
|
|||||
|
• Aspects of the determination of mineralisation that are Material to the Public Report. In cases where ‘industry standard’ work
has been done this would be relatively simple (eg ‘reverse circulation drilling was used to obtain 1 m samples from which 3 kg was pulverised to produce a 30 g charge for fire assay’). In other cases more explanation may be
required, such as where there is coarse gold that has inherent sampling problems. Unusual commodities or mineralisation types (e.g. submarine nodules) may warrant disclosure of detailed information
|
• Aspects of the determination of mineralisation included visual identification of mineralized intervals by a senior Ioneer geologist using lithological characteristics
including clay and carbonate content, grain size and the presence of key minerals such as Ulexite (hydrated sodium calcium borate hydroxide) and Searlesite (sodium borosilicate). A visual distinction between some units,
particularly where geological contacts were gradational was initially made. Final unit contacts were then determined by a senior Ioneer geologist once assay data were available.
• The Competent Person was not directly involved during the exploration drilling programs; however, the visual identification of mineralized zones and the
process for updating unit and mineralized contacts was reviewed with the Ioneer senior geologist during the site visit. The Competent Person evaluated the identified mineralized intervals against the analytical results and agrees
with the methodology used by Ioneer to determine material mineralisation.
|
||||||
|
Drilling techniques
|
• Drill type (e.g. core, reverse circulation, open-hole hammer, rotary air blast, auger, Bangka, sonic, etc..) and details (e.g. core
diameter, triple or standard tube, depth of diamond tails, face-sampling bit or other type, whether core is oriented and if so, by what method, etc.).
|
• Both RC and core drilling techniques have been used on the Project. Exploration drilling programs targeting Lithium-Boron (Li-B)
mineralisation on the Project have been implemented by American Lithium Minerals Inc. (2010-2012) and Ioneer (formerly Global Geoscience) in 2016, 2017, 2018, 2019, 2022, and 2023.
• Prior to 2018, all RC drilling was conducted using a 127 mm hammer. All pre-2018 core drill holes were drilled using HQ sized core with a double-tube core
barrel.
• For the 2018-2023 drilling programs, all core holes (vertical and inclined) were tricone drilled through unconsolidated alluvium, then cored through to the
end of the drill hole. A total of 91 core holes were drilled, 64 holes were PQ diameter and 27 were drilled as HQ diameter. Drilling was completed using a triple-tube core barrel (split inner tube) which was preferred to a
double-tube core barrel (solid inner tube) as the triple-tube improved core recovery and core integrity during core removal from the core barrel.
|
|||||
|
Drill sample recovery
|
• Method of recording and assessing core and chip sample recoveries and results assessed.
|
• Prior to 2017, chip recovery was not recorded for the RC drilling therefore the Competent Person cannot comment on drill sample recovery for this period
of drilling.
For the 2017 RC drilling program, the drill holes were geologically logged as they were being drilled; however, no estimates of chip recoveries were recorded.
Therefore, the Competent Person cannot comment on drill sample recovery for this period of drilling.
|
|
APPENDIX D: JORC Code, 2012 Edition - Table 1
|
|
|
Criteria
|
JORC Code 2012 Explanation
|
Commentary
|
|||||
|
• For the 2010-2012 and 2016 core drilling programs, both core recovery and rock quality index (RQD) were recorded for each cored
interval. Core recovery was determined by measuring the recovered linear core length and then calculating the recovered percentage against the total length of the core run from the drill advance. The core recovery for all the
drilling ranged from 0% to 100%, with over 65 % of the drill holes having greater than 80% mean core recovery. The core recovery values were recorded by the logging geologist and reviewed by the senior Ioneer geologist. The
majority of the 2010-2012 and 2016 core drill holes reported greater than 95% recovery in the B5, M5 and L6 mineralized intervals.
• For the 2018-2019 drilling program, both core recovery and RQD were recorded for each cored interval. Core recovery was determined by measuring the
recovered linear core length and then calculating the recovered percentage against the total length of the core run from the drill advance. The core recovery for all the drilling ranged from 41% to 100%, with over 65% of the
drill holes having greater than 90% mean core recovery. The core recovery values were recorded by the logging geologist and reviewed by the senior Ioneer geologist. In the target mineralized intervals (M5, B5 & L6), the mean
core recovery was 86% in the B5, 87% in the M5 and 95% in the L6 units, with most of the drill holes reporting greater than 90% recovery in the mineralized intervals.
• The Competent Person considers the core recovery for the 2023, 2022, 2018- 2019, 2016 and 2010-2012 core drilling programs to be acceptable based on
statistical analysis which identified no grade bias between sample intervals with high versus low core recoveries. On this basis, the Competent Person has made the reasonable assumption that the sample results are reliable for
use in estimating Mineral Resources.
|
|||||||
|
• Measures taken to maximise sample recovery and ensure representative nature of the samples.
|
• Chip recoveries were not recorded for the 2010-2012 and 2017 RC drilling programs, and there is no indication of measures taken to maximize sample
recovery and ensure representative nature of samples.
• No specific measures for maximizing sample recovery were documented for the 2010-2012 and 2016 core drilling programs.
• During the 2018-2023 drilling programs, Ioneer used a triple-tube core barrel to maximize sample recovery and ensure
|
|
APPENDIX D: JORC Code, 2012 Edition - Table 1
|
|
|
Criteria
|
JORC Code 2012 Explanation
|
Commentary
|
|||||
|
|
|
• representative nature of samples. The use of triple-tube was originally used during the 2018 drill program. A triple-tube core barrel generally
provides improved core recovery over double-tube core barrels, resulting in more complete and representative intercepts for core logging, sampling and geotechnical evaluation. It also limited any potential sample bias due to
preferential loss/gain of material.
|
|||||
|
• Whether a relationship exists between sample recovery and grade and whether sample bias may have occurred due to preferential loss/gain
of fine/coarse material.
|
• Chip recovery was not recorded for the 2010-2012 and 2017 RC drilling program and, therefore, there is no basis for evaluating the relationship
between grade and sample recovery for samples from these programs.
• Based on the Competent Person’s review of the 2010-2012, 2016 and 2018-2019, 2022-2023 core drilling recovery and grade data there was no observable
relationship between sample recovery and grade.
|
||||||
|
Logging
|
• Whether core and chip samples have been geologically and geotechnically logged to a level of detail to support appropriate Mineral
Resource estimation, mining studies and metallurgical studies.
|
• All core and chip samples have been geologically logged to a level of detail to support appropriate Mineral Resource estimation, such that there are
lithological intervals for each drill hole, with a correlatable geological/lithological unit assigned to each interval.
• The 2018-2019 and 2022-2023 drilling were also geotechnically logged to a level of detail to support appropriate Mineral Resource estimation.
• The Competent Person has reviewed all unit boundaries in conjunction with the Ioneer senior geologist, and where applicable, adjustments have been
made to the mineralized units based on the assay results intervals to limit geological dilution.
|
|||||
|
• Whether logging is qualitative or quantitative in nature.
|
• The RC and core logging were both qualitative (geological/lithological descriptions and observations) and quantitative (unit lengths, angles of
contacts and structural features and fabrics).
|
||||||
|
• Core (or costean, channel, etc.) photography.
|
• All chip trays and Core photography was completed on every core drill hole for the 2010-2012, 2016, 2018-2019 and 2022-2023 drilling programs.
|
||||||
|
• The total length and percentage of the relevant intersections logged.
|
• Prior to 2018, a total length of 8,900 m of RC drilling and 6,000 m of core drilling was completed for the Project, 100% of which was geologically
logged by a logging geologist and reviewed by the senior Ioneer geologist.
• For the 2018-2019 drilling, a total length of 548 m of RC drilling and
|
|
APPENDIX D: JORC Code, 2012 Edition - Table 1
|
|
|
Criteria
|
JORC Code 2012 Explanation
|
Commentary
|
|||||
|
• The total length and percentage of the relevant intersections logged. (Con’t)
|
• 9,321 m of core drilling was completed for the Project, 100% of which was geologically logged by a logging geologist and reviewed by the senior
Ioneer geologist
• For the 2018-2019 drilling, 86% of the 9,321 m of core was geotechnically logged by an engineering geologist/ geotechnical engineer and reviewed by
the senior Ioneer geologist.
• For the 2022-2023 drilling, 100% of the 7,362m of core was geotechnically logged by an engineering geologist/ geotechnical engineer and reviewed by
the senior Ioneer geologist
The Competent Person reviewed the geological core logging and sample selection for two drill holes.
|
||||||
|
• If core, whether cut or sawn and whether quarter, half or all core taken.
|
• The following sub-sampling techniques and sample selection procedures apply to drill core samples:
• During the 2010-2012 and 2016 program, core samples were collected on a mean 1.52 m down hole interval and cut in two halves using a manual core
splitter. The entire sample was submitted for analysis with no sub-sampling prior to submittal.
• During the 2018-2019 drilling program, core samples were collected for every 1.52 m down hole interval and cut using a water-cooled diamond blade
core saw utilizing the following methodology for the two target units. For the M5 unit, ½ core samples were submitted for assay, while the remaining ½ core was retained for reference. For the B5 unit, ¼ core samples were
submitted for assay, while ¼ was reserved for future metallurgical test work and ½ core was retained reference.
• During the 2022-2023 drilling programs, core samples were collected for target units every 1.52 m down hole interval. Target units were cut using a
water-cooled diamond blade core saw utilizing the following methodology for the target units. For the M4, M5, B5, S5 and L6 unit, ½ core samples (HQ) or ¼ core samples (PQ) were submitted for assay, while the remaining ½- ¾
core was retained for reference.
|
|
APPENDIX D: JORC Code, 2012 Edition - Table 1
|
|
|
Criteria
|
JORC Code 2012 Explanation
|
Commentary
|
|||||
|
Sub-sampling
techniques
and sample
preparation
Sub-sampling
techniques
and sample
preparation
|
• If core, whether cut or sawn and whether quarter, half or all core taken.
If non-core, whether riffled, tube sampled, rotary split, etc. and whether sampled wet or dry.
|
• The following sub-sampling techniques and sample selection procedures apply to drill core samples:
• During the 2010-2012 and 2016 program, core samples were collected on a mean 1.52 m down hole interval and cut in two halves using a manual core
splitter. The entire sample was submitted for analysis with no sub-sampling prior to submittal.
• During the 2018-2019 drilling program, core samples were collected for every 1.52 m down hole interval and cut using a water-cooled diamond blade
core saw utilizing the following methodology for the two target units. For the M5 unit, ½ core samples were submitted for assay, while the remaining ½ core was retained for reference. For the B5 unit, ¼ core samples were
submitted for assay, while ¼ was reserved for future metallurgical test work and ½ core was retained for reference.
• During the 2022-2024 drilling programs, core samples were collected for target units every 1.52 m down hole interval. Target units were cut using
a water-cooled diamond blade core saw utilizing the following methodology for the target units. For the M4, M5, B5, S5 and L6 unit, ½ core samples (HQ) or ¼ core samples (PQ) were submitted for assay, while the remaining
½- ¾ core was retained for reference.
• The following sub-sampling techniques and sample selection procedures apply to RC Chip Samples:
• Pre-2017 RC chips samples were collected using a wet rotary splitter approximately every 1.52 m depth interval. Two samples were collected for
every interval (one main sample and one duplicate). Only the main sample was submitted for analysis.
2017 RC chip samples were collected using a wet rotary splitter attached to a cyclone. One, approximately 10 kg, sample was collected every 1.52 m
depth interval. All samples were submitted for analysis.
|
|
APPENDIX D: JORC Code, 2012 Edition - Table 1
|
|
|
Criteria
|
JORC Code 2012 Explanation
|
Commentary
|
|||||
|
• For all sample types, the nature, quality and appropriateness of the sample preparation technique.
|
• The Competent Person considers the nature, type and quality of the sample preparation techniques to be appropriate based on the general
homogeneous nature of the mineralized zones and the drilling methods employed to obtain each sample (i.e., RC and core).
|
||||||
|
• Quality control procedures adopted for all sub-sampling stages to maximise representivity of samples.
|
• Quality control procedures adopted for sub-sampling to maximize representivity include the following:
• During 2016-2017 and 2018-2023 drilling programs, field duplicate/replicate samples were obtained. For the 2017 and 2023 RC drilling, a
duplicate sample was collected every 20th sample. For the 2016 and 2018-2023 core drilling programs two ¼ core samples were taken at the same time and were analysed in sequence by
the laboratory to assess the representivity.
• Twin drill holes at the same site were drilled during the 2010- 2012 drilling program. The twin drill hole pairing comprises one RC drill hole
(SBH-04) and one core drill hole (SBHC-01). The Competent Person recommends twinning additional drill hole pairs as part of any future pre-production or infill drilling programs to allow for a more robust review of
sample representivity.
• The Competent Person reviewed the results of the duplicate/replicate sampling and twin drill holes. For the duplicate/replicate samples, the R2 value is 0.99, which is very good. Visual observation of the lithological intervals and the assays for the twin drill holes show that they are very similar, despite the difference in
drilling techniques.
|
||||||
|
• Measures taken to ensure that the sampling is representative of the in situ material collected, including for instance results
for field duplicate/second-half sampling.
|
• The Competent Person considers the samples to be representative of the in-situ material as they conform to lithological boundaries determined
during core logging. A review of the primary and duplicate sample analyses indicates a high degree of agreement between the two sample sets (R2 value of 0.99).
|
|
APPENDIX D: JORC Code, 2012 Edition - Table 1
|
|
|
Criteria
|
JORC Code 2012 Explanation
|
Commentary
|
|||||
|
• Whether sample sizes are appropriate to the grain size of the material being sampled.
|
• The Competent Person considers the sample sizes to be appropriate given the general homogeneous nature of the mineralized zones. The two main types of
mineralisation are lithium mineralisation with high boron >/=5,000 parts per million (ppm) (HiB-Li) and lithium mineralisation with
low boron <5,000 ppm (LoB-Li). The HiB-Li mineralisation occurs consistently throughout the B5, M5 and L6 target zones, while LoB-Li mineralisation occurs throughout the M5,
S5 and L6 units, and is not nuggety or confined to discreet high-grade and low-grade bands.
|
||||||
|
Quality of
assay data
and
laboratory
tests
|
• The nature, quality and appropriateness of the assaying and laboratory procedures used and whether the technique is considered
partial or total.
|
• The nature and quality of the assaying and laboratory procedures used include the following:
• All RC and core samples were processed, crushed, split, and then a sub-sample was pulverized by ALS Minerals in Reno, Nevada.
• All sub-samples were analysed by Aqua Regia with ICP mass spectrometry (ICP-MS) finish for 51
elements (including Lithium (Li)) and Boron (B) by Na2O2 fusion/ICP high grade analysis (>/=10,000 ppm B).
• Additionally, 95% of the 2018-2019 samples were analysed for Inorganic Carbon and 30% were analysed for Fluorine (F).
• The laboratory techniques are total.
• The Competent Person considers the nature and quality of the laboratory analysis methods and procedures to be appropriate for the type of
mineralisation.
|
|||||
|
• For geophysical tools, spectrometers, handheld XRF instruments, etc., the parameters used in determining the analysis including
instrument make and model, reading times, calibrations factors applied and their derivation, etc..
|
• Not applicable to this Report, no geophysical tools, spectrometers, handheld XRF instruments were used on the Project.
|
||||||
|
• Nature of quality control procedures adopted (e.g. standards, blanks, duplicates, external laboratory checks) and whether
acceptable levels of accuracy (i.e. lack of bias) and precision have been established.
|
• The following Quality Assurance and Quality Control (QA/QC) procedures were adopted for the various
drilling programs:
• During the 2010-2012 program, Standard Reference Material (SRM) samples and a small number of field
blanks were also inserted regularly into the sample sequence to QA/QC of the laboratory analysis.
• For 2016-2017 program, a duplicate sample was collected every 20th primary sample. Field blanks and SRM’s were also inserted approximately
every 25 samples to assess QA/QC.
• During the 2018-2019 and 2022-2023 programs, QA/QC samples
|
|
APPENDIX D: JORC Code, 2012 Edition - Table 1
|
|
|
Criteria
|
JORC Code 2012 Explanation
|
Commentary
|
|||||
|
Quality of assay data and laboratory (Con’t)
|
• comprising 1 field blank and 1 SRM standard inserted into each sample batch every 25 samples. Submission of field duplicates, laboratory
coarse/pulp replicates and umpire assays were submitted in later stages of the 2018-2019 and 2022-2023 drilling programs.
• The Competent Person reviewed the SRM, field blanks and field duplicates and determined the following:
• SRMs: Review of the five SRMs used determined that there was a reasonable variability for Li between the upper and lower control limits (± 2
standard deviation (SD)), however B shows an overall bias towards lower than expected values (i.e. less than the mean) for all sample programs. For each of the 5 SRMs, there
were some sample outliers (both low and high); however, the majority fell within the control limits. Based on previous recommendations, new standards have been created with grades which more closely bracket the
cutoff grade for boron (5,000 ppm) for the process stream 1. Field Blanks: Review of the field blanks indicate that there is some variability in both the Li and B results. There are several samples that return higher
than expected values, with an increased number being from the 2018-2019 drilling program. The recent phases 1 –3 drilling results for the inserted blanks are normal expected values. Field Duplicates: No field
duplicates were submitted for the pre-2018 drilling programs. Review of the 315 field duplicate sample pairs through the phase 3 drilling program determined that there was a strong correlation between each pair, as
evidenced by an R2 value of 0.99 for Li (92% within 10% of each other for the four seams of interest, M5, B5, S5 and L6). Boron had 78% of the pairs matching within 10% for the
four seams of interest, but of those > 10%, 65% were in the grade range of < 1000 ppm B.
• Umpire Laboratory Duplicates: 20 assay pulp rejects were sent from ALS to American Assay Laboratories (AAL) in Sparks, NV for umpire
laboratory analysis in 2018 Review of the 20 umpire duplicate pairs found a strong correlation between each pair, with B returning an R2 value of 0.98. 44 Assay pulp rejects were sent from ALS to American Assay
Laboratories in Sparks, NV for umpire laboratory analysis in 2024. Review of the 44 umpire duplicate pairs returned similar results
• The Competent Person reviewed the control charts produced for each SRM, field blank and field duplicate, and determined that there was an
acceptable level of accuracy and precision for each for the purpose of estimating Mineral Resources.
|
|
APPENDIX D: JORC Code, 2012 Edition - Table 1
|
|
|
Criteria
|
JORC Code 2012 Explanation
|
Commentary
|
|||||
|
Verification of
sampling and
assaying
|
The verification of significant intersections by either independent or alternative company personnel.
|
• Significant intersections have been verified by visual inspection of the drill core intervals by at least two Ioneer geologists for all
drilling programs.
|
|||||
|
The use of twinned holes.
|
• One pair of twin drill holes at the same site were drilled during the 2010-2012 drilling program. The twin drill hole pairing comprises
one RC drill hole (SBH-04) and one core drill hole (SBHC-01).
• The Competent Person reviewed and assessed two drill holes and the variance for thickness and grade parameters were within acceptable
levels.
|
||||||
|
Documentation of primary data, data entry procedures, data verification, data storage (physical and electronic) protocols.
|
• For the 2022-2023 drilling programs, the field protocols utilized in the 2018-2019 drilling program were reviewed by both Ioneer and WSP.
These protocols were refined and improved to assure proper compliance. Formal Documentation and enforcement by WSP and Ioneer personnel actively involved in the program.
• For the 2018-2019 drilling program, Newfields developed a series of field protocols covering all aspects of the exploration program,
including surveying, logging, sampling and data documentation. These protocols were followed throughout the 2018-2019 drilling program. Formal documentation of field protocols does not exist prior to the 2018-2019
program; however, the same senior personnel were involved in the earlier programs and field protocols employed were essentially the same as those documented in the 2018-2019 protocols.
• Primary field data was captured on paper logs for the 2010-2012 drilling program, then transcribed into Microsoft (MS) Excel files. For the 2016 through 2019 drilling, all field data was captured directly into formatted MS Excel files by logging geologists. All primary field data was reviewed
by the senior Ioneer geologist.
• 2019 Data was stored in digital format in a MS Access database. This database was compiled, updated and maintained by Newfields personnel
during the 2018-2019 drilling program.
• In 2024 drill data including assays and drill logs were transitioned to a Hexagon Torque database. This data is updated and maintained by
Ioneer.
|
||||||
|
Documentation of primary data, data entry procedures, data verification, data storage (physical and electronic) protocols
|
• The Competent Person used the relevant information from various tabular data files provided by Ioneer and Newfields in a MS Access
database, which was reviewed and verified by the Competent Person prior to inclusion in the geological model.
|
|
APPENDIX D: JORC Code, 2012 Edition - Table 1
|
|
|
Criteria
|
JORC Code 2012 Explanation
|
Commentary
|
|||||
|
• Discuss any adjustment to assay data.
|
• There has been no adjustment to assay data.
|
||||||
|
Location of data
points
|
• Accuracy and quality of surveys used to locate drill holes (collar and down-hole surveys), trenches, mine workings and
other locations used in Mineral Resource estimation.
|
• Accuracy and quality of surveys used to locate drill holes is as follows:
• All inclined core drill holes were surveyed to obtain downhole deviation using a downhole Reflex Mems Gyros tool, except for SBH-72, which
could not be surveyed due to tool error. Two core drill holes (SBH-60, SBH-79) were surveyed using an Acoustic Televiewer instead of the Gyros tool.
• All 2018-2019 drill hole collars were surveyed using a differentially corrected GPS (DGPS).
• Locatable pre-2018 drill holes that were previously only surveyed by handheld GPS have been re-surveyed in 2019 using DPGS. Some pre-2018
drill holes could not be located by the surveyor in 2019, and the original locations were assumed to be correct.
• Upon completion, drill casing was removed, and drill collars were marked with a permanent concrete monument with the drill hole name and
date recorded on a metal tag on the monument.
|
|||||
|
• Specification of the grid system used.
|
• All pre-2018 and 2018-2019 drill holes were originally surveyed using handheld GPS units in UTM Zone 11 North, North American Datum 1983 (NAD83) coordinate system. Pre-2018 drill holes were re-surveyed using DPGS in NAD83 in 2017/2018.
• All 2018-2019 drill holes and locatable pre-2018 drill holes were re-surveyed in 2019 using DPGS in NAD83 coordinate system. All surveyed
coordinates were subsequently converted to Nevada
• State Plane Coordinate System of 1983, West Zone (NVSPW 1983) for use in developing the geological
model. Those holes that could not be located had the original coordinates converted to NVSPW 1983 and their locations verified against the original locations.
• All 2022-2023 holes were surveyed Nevada State Plane Coordinate
System of 1983, West Zone (NVSPW 1983) for use in developing the geological model.
|
||||||
|
• Quality and adequacy of topographic control.
|
• The quality and adequacy of the topographic surface and the topographic control is very good based on comparison against survey monuments,
surveyed drill hole collars and other surveyed surface features.
|
|
APPENDIX D: JORC Code, 2012 Edition - Table 1
|
|
|
Criteria
|
JORC Code 2012 Explanation
|
Commentary
|
|||||
|
Quality and adequacy of topographic control. (Con’t)
|
• A 2018 satellite survey with an accuracy of ± 0.17 m was produced for the Project by PhotoSat Information Ltd. The final report
generated by PhotoSat stated that the difference between the satellite and Ioneer provided ground survey control points was less than 0.8 m.
• The topographic survey was prepared in NAD83, which was converted to NVSPW 1983 by Newfields prior to geological modelling.
|
||||||
|
Data spacing
and
distribution
|
• Data spacing for reporting of Exploration Results.
|
• Drill holes are generally spaced between 90 m and 170 m on east- west cross-section lines spaced approximately 180 m apart. There was no
distinction between RC and core holes for the purpose of drill hole spacing.
• For the 2018-2023 drilling program, there were multiple occurrences where several inclined drill holes were drilled from the same drill
pad and oriented at varying angles away from each other. The collar locations for these inclined drill holes drilled from the same pad varied in distance from 0.3 m to 6.0 m apart; intercept distances on the
floors of the target units were typically in excess of 90 m spacing.
|
|||||
|
• Whether the data spacing and distribution is sufficient to establish the degree of geological and grade continuity
appropriate for the Mineral Resource and Ore Reserve estimation procedure(s) and classifications applied.
|
• The spacing is considered sufficient to establish geological and grade continuity appropriate for a Mineral Resource estimation.
|
||||||
|
• Whether sample compositing has been applied.
|
• Samples were predominately (91%) 1.52 m intervals honouring lithological boundaries. The sample intervals were composited to 1.52m
lengths, respecting the seam contacts to regularize the database used for grade estimation. The 1.52 m sample length represents the modal value of the sample length distribution and the 1.52m vertical block
height in the model.
|
||||||
|
Orientation of
data in relation to
geological
structure
|
Whether the orientation of sampling achieves unbiased sampling of possible structures and the extent to which this is known, considering the deposit type.
|
• Drill holes were angled between -45 and -90 degrees from horizontal and at an azimuth of between 0- and 350-degrees.
• Inclined drill holes orientated between 220- and 350-degrees azimuth introduced minimal sample bias, as they primarily intercepted the
mineralisation at angles near orthogonal (94 drill
• holes with intercept angles between 70-90 degrees) to the dip of the beds, approximating true-thickness.
|
|
APPENDIX D: JORC Code, 2012 Edition - Table 1
|
|
|
Criteria
|
JORC Code 2012 Explanation
|
Commentary
|
|||||
|
• If the relationship between the drilling orientation and the orientation of key mineralised structures is considered to
have introduced a sampling bias, this should be assessed and reported if material.
|
• Inclined drill holes orientated between 0- and 220-degrees azimuth, especially those that were drilled at between 20- and 135-degrees
azimuth, generally intercepted the beds down dip (14 drill holes with intercept angles between 20-70 degrees), exaggerating the mineralized zone widths in these drill holes.
|
||||||
|
Sample
security
|
• The measures taken to ensure sample security.
|
• The measures taken to ensure sample security include the following:
• For the 2010-2012 drill holes, samples were securely stored on-site and then collected from site by ALS. Chain of custody forms were
maintained by ALS.
• For the 2016-2017 drill holes, samples were securely stored on-site and then collected from site by ALS and transported to the
laboratory by truck. Chain of custody forms were maintained by ALS.
• For the 2018-2019 and 2022-2023 drill holes, core was transported daily by Ioneer and/or Newfields personnel from the drill site to
the Ioneer secure core shed (core storage) facility in Tonopah. Core awaiting logging was stored in the core shed until it was logged and sampled, at which time it was stored in secured sea cans inside a fenced
and locked core storage facility on site. Samples were sealed in poly-woven sample bags, labelled with a pre-form numbered and barcoded sample tag, and securely stored until shipped to or dropped off at the ALS
laboratory in Reno by either Ioneer or Newfields personnel. Chain of custody forms were maintained by either Newfields or Ioneer and ALS.
|
|||||
|
Audits or
reviews
|
• The results of any audits or reviews of sampling techniques and data.
|
• There were no audits performed on the RC sampling or for the pre-2018 drilling programs.
• The Competent Person reviewed the core and sampling techniques during a site visit in August 2023. The Competent Person found that the
sampling techniques were appropriate for collecting data for the purpose of preparing geological models and Mineral Resource estimates.
|
|
APPENDIX D: JORC Code, 2012 Edition - Table 1
|
|
|
Criteria
|
JORC Code 2012 Explanation
|
Commentary
|
|||||
|
Mineral
tenement and
land tenure
status
|
• Type, reference name/number, location and ownership including agreements or material issues with third parties such
as joint ventures, partnerships, overriding royalties, native title interests, historical sites, wilderness or national park and environmental settings.
|
• The mineral tenement and land tenure for the South Basin of Rhyolite Ridge (the Project) comprise 386 unpatented Lode Mining Claims
(totalling approximately 3,150 hectare (Ha)); claim groups SLB, SLM and RR, spatial extents of which are presented in maps and tables within the body of the Report are
held by Ioneer Minerals Corporation, a wholly owned subsidiary of Ioneer. The Competent Person has relied upon information provided by Ioneer regarding mineral tenement and land tenure for the Project; the
Competent Person has not performed any independent legal verification of the mineral tenement and land tenure.
• The Competent Person is not aware of any agreements or material issues with third parties such as joint ventures, partnerships,
overriding royalties, native title interests, historical sites, wilderness or national park and environmental settings relating to the 386 Lode Mining Claims for the Project.
• The mineral tenement and land tenure referenced above excludes 241 additional unpatented Lode Mining Claims (totalling approximately
2,000 Ha) for the North Basin which are located outside of the current South Basin Project Area presented in this Report. These additional claims are held by Ioneer subsidiaries (NLB claim group; 160 claims
and BH claim group; 81 claims).
|
|||||
|
• The security of the tenure held at the time of reporting along with any known impediments to obtaining a licence to
operate in the area.
|
• There are no identified concerns regarding the security of tenure nor are there any known impediments to obtaining a license to
operate within the limits of the Project. The 386 unpatented Lode Mining Claims for the Project are located on federal land and are administered by the United States Department of the Interior - Bureau of
Land Management (BLM).
|
||||||
|
Exploration
done by other
parties
|
• Acknowledgment and appraisal of exploration by other parties.
|
• There have been two previous exploration campaigns targeting Li-B mineralisation at the Project site.
|
|
APPENDIX D: JORC Code, 2012 Edition - Table 1
|
|
|
Criteria
|
JORC Code 2012 Explanation
|
Commentary
|
|||||
|
|
|
• US Borax conducted surface sampling and drilling in the 1980s, targeting B mineralisation, with less emphasis on Li
mineralisation. A total of 44 drill holes (totalling approximately 14,900 m) were drilled in the North Borate Hills area, with an additional 16 drill holes (unknown total meterage) in the South Basin area.
These drill holes were not available for use in the current Study.
• American Lithium Minerals Inc and Japan Oil, Gas and Metals National Corporation (JOGMEC)
conducted further Li exploration in the South Basin area in 2010-2012. The exploration included at least 465 surface and trench samples and 36 drill holes (totalling approximately 8,800 m), of which 21 were
core and 15 were RC. Data collected from this program, including drill core, was made available to Ioneer. The Competent Person reviewed the data available from this program and believes this exploration
program, except for the trench data, was conducted appropriately and the information generated is of high enough quality to include in preparing the current geological model and Mineral Resource estimate.
• Due to concerns regarding the ability to reliably correlate the trenches with specific geological units as well as concerns
regarding representivity of samples taken from incomplete exposures of the units in the trenches, the Competent Person does not feel the trench sample analytical results are appropriate for use and has
excluded them from use in preparing the geological model and Mineral Resource estimate.
|
|||||
|
Geology
|
• Deposit type, geological setting and style of mineralisation.
|
• The HiB-Li and LoB-Li mineralisation at Rhyolite Ridge occurs in two separate late-Miocene sedimentary basins; the North Basin and
the South Basin, located within the Silver Peak Range in the Basin and Range terrain of Nevada, USA. The South Basin is the focus of the Study presented in this Report and the following is focused on the
geology and mineralisation of the South Basin.
• The South Basin stratigraphy comprises lacustrine sedimentary rocks of the Cave Spring Formation overlaying volcanic flows and
volcaniclastic rocks of the Rhyolite Ridge Volcanic unit. The Rhyolite Ridge Volcanic unit is dated at approximately 6 mega-
annum (Ma) and comprises rhyolite tuffs, tuff breccias and flows. The Rhyolite Ridge Volcanic rocks are
underlain by sedimentary rocks of the Silver Peak Formation.
|
|
APPENDIX D: JORC Code, 2012 Edition - Table 1
|
|
|
Criteria
|
JORC Code 2012 Explanation
|
Commentary
|
|||||
|
• The Cave Spring Formation comprises a series of 11 sedimentary units deposited in a lacustrine environment, as shown in the
following table. Within the study area the Cave Spring Formation can reach total thickness in excess of 400 m. Age dating of overlying units outside of the area and dates for the underlying Rhyolite Ridge
Volcanic unit bracket deposition of the Cave Spring Formation between 4-6 Ma; this relatively young geological age indicates limited time for deep burial and compaction of the units. The Cave Spring
Formation units are generally laterally continuous over several miles across the extent of the South Basin; however, thickness of the units can vary due to both primary depositional and secondary
structural features. The sedimentary sequence generally fines upwards, from coarse clastic units at the base of the formation, upwards through siltstones, marls and carbonate units towards the top of the
sequence.
• The key mineralized units are in the Cave Spring Formation and are, from top to bottom, the M5 (high-grade Li, low- to
moderate- grade B bearing carbonate-clay rich marl), the B5 (high-grade B, moderate-grade Li marl), the S5 (low- to high Li, very low B) and the L6 (broad zone of laterally discontinuous low- to high-
grade Li and B mineralized horizons within a larger low-grade to barren sequence of siltstone-claystone). The sequence is marked by a series of four thin (generally on the scale of several meters or less)
coarse gritstone layers (G4 through G7); these units are interpreted to be pyroclastic deposits that blanketed the area. The lateral continuity across the South Basin along with the distinctive visual
appearance of the gritstone layers relative to the less distinguishable sequence of siltstone-claystone-marl that comprise the bulk of the Cave Spring Formation make the four grit stone units good marker
horizons within the stratigraphic sequence.
• The Cave Springs Formation is unconformably overlain by a unit of poorly sorted alluvium, ranging from 0 to 40 m (mean of 20 m)
within the Study Area. The alluvium is unconsolidated and comprises sand through cobble sized clasts (with isolated
occurrences of large boulder sized clasts) of the Rhyolite Ridge
|
|
APPENDIX D: JORC Code, 2012 Edition - Table 1
|
|
|
Criteria
|
JORC Code 2012 Explanation
|
Commentary
|
|||||
|
Volcanic Rocks and other nearby volcanic units.
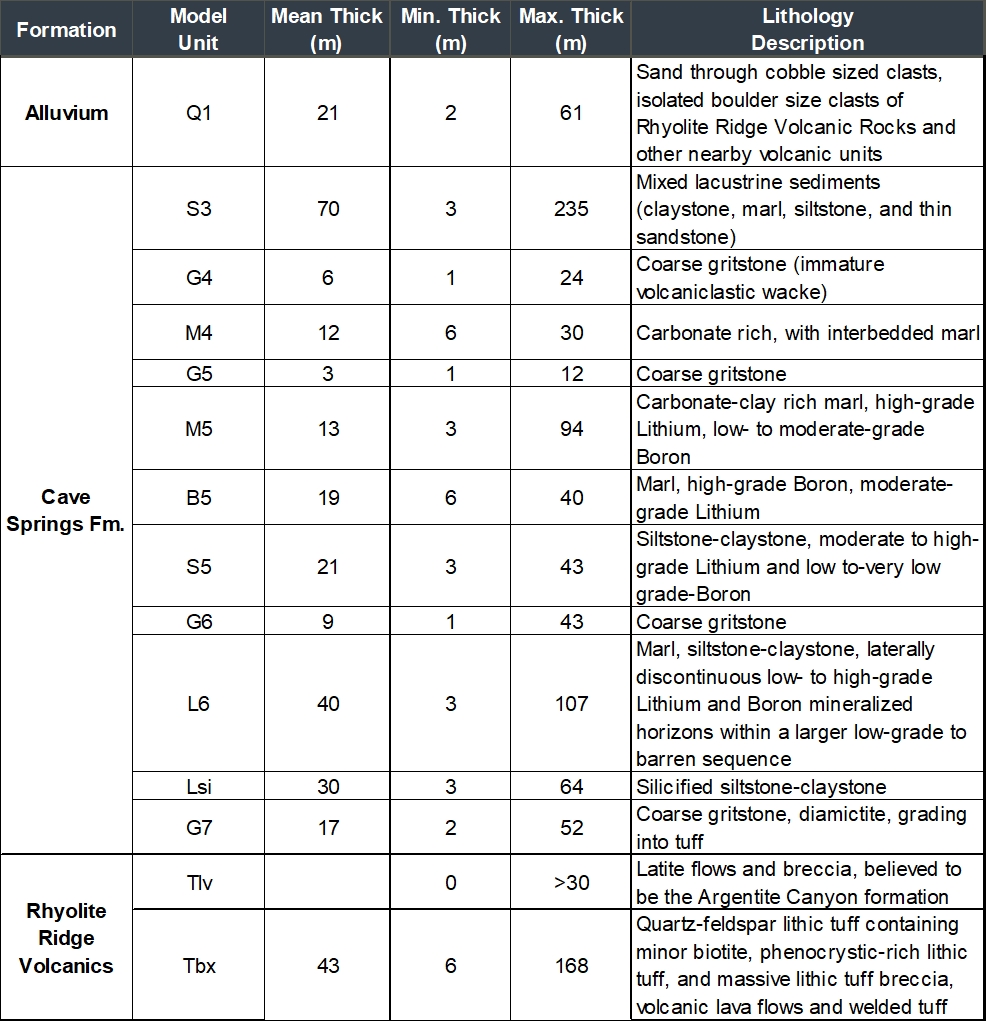
|
|
APPENDIX D: JORC Code, 2012 Edition - Table 1
|
|
|
Criteria
|
JORC Code 2012 Explanation
|
Commentary
|
|||||
|
• Structurally, the South Basin is bounded along its western and eastern margins by regional scale high angle faults of unknown displacement,
while localized steeply dipping normal, reverse and strike-slip faults transect the Cave Spring formation throughout the the basin. Displacement on these faults is generally poorly known but most
appear to be on the order of tens of meters of displacement although several located along the edge of the basin may have displacements greater than 30 m. Major fault structures within the basin
tend to have a series of minor faults associated with them. These tend to have smaller offset than the parent fault structure. Along the western side, South Basin is folded into a broad, open
syncline with the sub-horizontal fold axis oriented approximately north-south. The syncline is asymmetric, moderate to locally steep dips along the western limb. The stratigraphy is further
folded, including a significant southeast plunging syncline located in the southern part of the study area.
• HiB-Li and LoB-Li mineralisation is interpreted to have been emplaced by hydrothermal/epithermal fluids travelling up the
basin bounding faults; based on HiB-Li and LoB-Li grade distribution and continuity it is believed the primary fluid pathway was along the western bounding fault. Differential mineralogical and
permeability characteristics of the various units within the Cave Spring Formation resulted in the preferential emplacement of HiB-Li bearing minerals in the B5 and L6 units and LoB-Li bearing
minerals in the M5, S5 and L6 units. HiB-Li mineralisation occurs in isolated locations in some of the other units in the sequence, but with nowhere near the grade and continuity observed in the
aforementioned units.
|
|||||||
|
Drill hole
Information
|
• A summary of all information material to the understanding of the exploration results including a tabulation
of the following information for all Material drill holes:
o easting and northing of the drill hole collar
o elevation or RL (Reduced Level – elevation above sea level in feet) of the drill hole collar
o dip and azimuth of the hole
o down hole length and interception depth
o hole length.
|
• Exploration Results are not being reported.
• A summary table providing key details for all identified drill holes for the Project is presented by type and drilling
campaign in the following table:
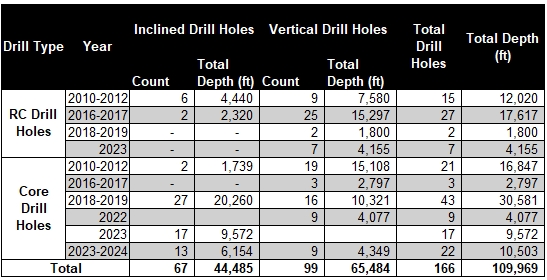 |
|
APPENDIX D: JORC Code, 2012 Edition - Table 1
|
|
|
Criteria
|
JORC Code 2012 Explanation
|
Commentary
|
|||||
|
• If the exclusion of this information is justified on the basis that the information is not Material and
this exclusion does not detract from the understanding of the report, the Competent Person should clearly explain why this is the case.
|
• Of the 166 drill holes reviewed, 162 (50 RC and 112 core) were included in the geological model and 4 were omitted. One RC
twin hole was omitted in favour of the cored hole at the same location. Three water/geotechnical drill holes were omitted due to a lack of lithology and quality data relevant to the geological
model.
|
||||||
|
Data aggregation
methods
|
• In reporting Exploration Results, weighting averaging techniques, maximum and/or minimum grade truncations
(e.g. cutting of high grades) and cut-off grades are usually Material and should be stated.
|
• Exploration Results are not being reported.
• All grade parameters presented as part of the Mineral Resource estimates prepared by IMC are presented as mass weighted
grades.
• Drill core samples are predominately 1.52 m lengths (91%) and this data set composited to regularized 1.52m lengths,
respecting seam contacts and used for the interpolation of grade data into the block model. The data set honoured geological contacts (i.e. composite intervals did not span unit contacts). The data
set is the 1.52 m composited developed from the drill hole assay database.
• No minimum bottom cuts or maximum top cuts were applied to the thickness or grade data used to construct the geological
models. No interpolation was applied to B and Li grade data for units other than the targeted units (G5, M5, B5, S5, G6, L6 and Lsi; discussed further in the Estimation and Modelling Techniques
section of this Table 1).
• A cut-off grade of 5,000 ppm B for the HiB-Li mineralisation and $11.13/tonne net value for the LoB-Li mineralisation was
applied during the Mineral Resource tabulation for the purpose of establishing reasonable prospects of eventual economic extraction based on high level mining, metallurgical and processing grade
parameters identified by mining, metallurgical and processing studies performed to date on the Project.
|
|||||
|
• Where aggregate intercepts incorporate short lengths of high grade results and longer
lengths of low grade results, the procedure used for such aggregation should be stated and some typical examples of such aggregations should be shown in detail.
|
• Not applicable as individual intercepts or Exploration Results are not being reported.
|
||||||
|
• The assumptions used for any reporting of metal equivalent values should be clearly stated.
|
• Metal equivalents were not used in the Mineral Resource estimates prepared by IMC.
|
|
APPENDIX D: JORC Code, 2012 Edition - Table 1
|
|
|
Criteria
|
JORC Code 2012 Explanation
|
Commentary
|
|||||
|
Relationship
between
mineralisation
widths and
intercept lengths
|
• These relationships are particularly important in the reporting of Exploration Results.
|
• All drill hole intercepts presented in the Report are down hole thickness not true thickness. As discussed in the
Orientation of Data section of this Table 1, most drill hole intercepts are approximately orthogonal to the dip of the beds (intercept angles between 70-90 degrees).
|
|||||
|
• If the geometry of the mineralisation with respect to the drill hole angle is known, its nature should be
reported.
|
• Based on the geometry of the mineralisation, it is reasonable to treat all samples collected from inclined drill holes at
intercept angles of greater than 70 degrees as representative of the true thickness of the zone sampled.
|
||||||
|
• If it is not known and only the down hole lengths are reported, there should be
a clear statement to this effect (e.g. ‘down hole length, true width not known’).
|
• Not applicable as individual down hole intercepts or Exploration Results are not being reported.
|
||||||
|
Diagrams
|
• Appropriate maps and sections (with scales) and tabulations of intercepts should be
included for any significant discovery being reported These should include, but not be limited to a plan view of drill hole collar locations and appropriate sectional views.
|
• Appropriate plan maps and sections are appended to the Report.
|
|||||
|
Balanced
reporting
|
• Where comprehensive reporting of all Exploration Results is not
practicable, representative reporting of both low and high grades and/or widths should be practiced to avoid misleading reporting of Exploration Results.
|
• Exploration Results are not being reported.
|
|||||
|
Other substantive
exploration data
|
• Other exploration data, if meaningful and material, should be reported including (but
not limited to): geological observations; geophysical survey results; geochemical survey results; bulk samples – size and method of treatment; metallurgical test results; bulk density,
groundwater, geotechnical and rock characteristics; potential deleterious or contaminating substances.
|
• Surficial geological mapping performed by a senior Ioneer geologist was used in support of the drill holes to define the
outcrops and subcrops as well as bedding dip attitudes in the geological modelling. Mapped geological contacts and faults were imported into the model and used as surface control points for the
corresponding beds or structures.
• Magnetic and Gravity geophysical surveys were performed and interpreted to inform the geological model, particularly in the
identification of faulting and geologic structures.
|
|||||
|
Further work
|
• The nature and scale of planned further work (e.g. tests for lateral extensions or
depth extensions or large-scale step-out drilling).
|
• Additional in-fill drilling and sampling may be performed based on the results of current mining project studies
|
|||||
|
• Diagrams clearly highlighting the areas of possible extensions, including the main
geological interpretations and future drilling areas, provided this information is not commercially sensitive.
|
• Refer to Figure 1 in the body of this report.
|
|
APPENDIX D: JORC Code, 2012 Edition - Table 1
|
|
|
Criteria
|
JORC Code 2012 explanation
|
Commentary
|
|||||
|
Database
integrity
|
• Measures taken to ensure that data has not been corrupted by, for example, transcription or keying errors,
between its initial collection and its use for Mineral Resource estimation purposes.
|
• Measures taken to ensure the data has not been corrupted by transcription or keying errors or omissions included recording
of drill hole data and observations by the logging geologists using formatted logging sheets in Microsoft (MS) Excel. Data and observations entered into the
logging sheets were reviewed by senior Ioneer geologists prior to importing into Torque Database
• IMC evaluated the tabular data provided by Ioneer for errors or omissions as part of the data validation procedures
described in the following section.
|
|||||
|
• Data validation procedures used.
|
• IMC performed data validation on the drill hole database records using available underlying data and documentation
including but not limited to original drill hole descriptive logs, core photos and laboratory assay certificates. Drill hole data validation checks were performed using a series of in-house data
checks to evaluate for common drill hole data errors including, but not limited to, data gaps and omissions, overlapping lithology or sample intervals, miscorrelated units, drill hole deviation
errors and other indicators of data corruption including transcription and keying errors.
• Database assay values for every sample were visually compared to the laboratory assay certificates to ensure the tabular
assay data was free of errors or omissions by Golder for the 2020 resource estimate. IMC compared database to certificates for about 20% of the phase 2 and 3 drill holes and found no errors.
|
||||||
|
Site visits
|
• Comment on any site visits undertaken by the Competent Person and the outcome of those visits.
|
• The IMC Competent Person Herbert E. Welhener made a personal site inspection, this visit was performed on the Project site
on August 10th 2023 for the Project.
During the site visit the IMC Competent Person visited the Ioneer core shed in Tonopah NV, and the South Basin area of
the Rhyolite Ridge Project site, which is the focus of the current exploration and resource evaluation efforts by Ioneer.
|
|
APPENDIX D: JORC Code, 2012 Edition - Table 1
|
|
|
Criteria
|
JORC Code 2012 explanation
|
Commentary
|
|||||
|
|
• The IMC Competent Person observed the active drilling, logging and sampling process and interviewed site personnel
regarding exploration drilling, logging, sampling and chain of custody procedures.
• The outcome of the site visit was that the IMC Competent Person developed an understanding of the general geology of the
Rhyolite Ridge Project. The IMC Competent Person was also able to visually confirm the presence of a selection of monumented drill holes from each of the previous drilling programs as well as to
observe drilling, logging and sampling procedures during the current drilling program and to review documentation for the logging, sampling and chain of custody protocols for previous drilling
programs.
|
||||||
|
• If no site visits have been undertaken indicate why this is the case.
|
• Not applicable.
|
||||||
|
Geological
interpretation
|
• Confidence in (or conversely, the uncertainty of) the geological interpretation of the mineral deposit.
|
• The IMC Competent Person is confident that the geological interpretation of the mineral deposit is reasonable for the
purposes of Mineral Resource estimation.
|
|||||
|
• Nature of the data used and of any assumptions made.
|
• The data used in the development of the geological interpretation included drill hole data and observations collected from
112 core and 50 RC drill holes, supplemented by surface mapping of outcrops and faults performed by Ioneer personnel. Regional scale public domain geological maps and studies were also incorporated
into the geological interpretation.
• It is assumed that the mineralized zones are continuous between drill holes as well as between drill holes and surface
mapping. It is also assumed that grades vary between drill holes based on a distance-weighted interpolator.
|
||||||
|
• The effect, if any, of alternative interpretations on Mineral Resource estimation.
|
• There are no known alternative interpretations.
|
||||||
|
• The use of geology in guiding and controlling Mineral Resource estimation.
|
• Geology was used directly in guiding and controlling the Mineral Resource estimation. The mineralized zones were modelled
as stratigraphically controlled HiB-Li and LoB-Li deposits. As such, the primary directions of continuity for the mineralisation are horizontally within the preferentially mineralized B5, M5, S5 and
L6 geological units.
|
|
APPENDIX D: JORC Code, 2012 Edition - Table 1
|
|
|
Criteria
|
JORC Code 2012 explanation
|
Commentary
|
|||||
|
• The factors affecting continuity both of grade and geology.
|
• The primary factor affecting the continuity of both geology and grade is the lithology of the geological units. HiB-Li
mineralisation is favourably concentrated in marl-claystone of the B5 and L6 units and LoB-Li in the M5, S5 and L6 units. Mineralogy of the units also has a direct effect on the continuity of the
mineralisation, with elevated B grades in the B5 and M5 units associated with a distinct reduction in carbonate and clay content in the units, while higher Li values tend to be associated with
elevated carbonate content in these units and sometimes k-felspar.
• Additional factors affecting the continuity of geology and grade include the spatial distribution and thickness of the
host rocks which have been impacted by both syn-depositional and post- depositional geological processes (i.e. localized faulting, erosion and so forth).
|
||||||
|
Dimensions
|
• The extent and variability of the Mineral Resource expressed as length (along strike or otherwise), plan
width, and depth below surface to the upper and lower limits of the Mineral Resource.
|
• The Mineral Resource evaluation presented in this Report covers an area of approximately 458 Ha within the South Basin of
Rhyolite Ridge. The Rhyolite Ridge Mineral Resource area extends over a north-south strike length of 4,240 m (from 4,337,540mN – 4,341,780mN), has a maximum width of 2,110m (863,330 mE – 865,440
mE) and includes the 585 m vertical interval from 2,065mRL to 1,480 mRL.
• Variability of the Mineral Resource is associated primarily with the petrophysical and geochemical properties of the
individual geological units in the Cave Spring Formation. These properties played a key role in determining units that were favourable for hosting HiB-Li and LoB-Li mineralisation versus those that
were not.
|
|||||
|
Estimation and
modelling
techniques
|
• The nature and appropriateness of the estimation technique(s) applied and key assumptions, including
treatment of extreme grade values, domaining, interpolation parameters and maximum distance of extrapolation from data points. If a computer assisted estimation method was chosen include a
description of computer software and parameters used.
|
• Geological modelling and Mineral Resource estimation for the Project was performed under the supervision of the Competent Person
• Based on a statistical analysis, extreme B grade values were identified in some of the units other than the targeted B5, M5, S5 and L6 units.
Boron, Lithium and the other elements were estimated in only units B5, M5, S5 and L6, and the adjacent units of G5, G6 and Lsi. Grades in the adjacent units were incorporated into the re-blocked
model with a 9.14m bench height (combined six 1.52 m benches).
|
|
APPENDIX D: JORC Code, 2012 Edition - Table 1
|
|
|
Criteria
|
JORC Code 2012 explanation
|
Commentary
|
||||||
| |
Estimation and
modelling
techniques
|
|
|
|
• The geological model was developed as a gridded surface stratigraphic model by GSI Environmental and Ioneer and provided
to IMC as surfaces and solids. The stratigraphically constrained grade block model was developed using Hexagon and IMC software, which are computer-assisted geological, grade modelling, and
estimation software applications.
• Domaining in the model was constrained by the roof and floor surfaces of the geological units. The unit boundaries were
modelled as hard boundaries, with samples interpolated only within the unit in which they occurred. The impact of faulting is represented in fault blocks which generated sub-sets of the seam
units. The faulting altered the orientation of the seam floors where were used during the grade estimation process. Grade continuity is assumed across faults which in some cases offset the seams
in a vertical direction. A larger vertical window was used during grade estimation to allow estimation of grades across faults, still limited to the seam being estimated.
• Key modelling and estimation parameters included the following:
|
|||
|
Estimation Parameter
|
Description
|
|||||||
|
Estimation Block Size
|
7.62 x 7.62 x 1.524 m
|
|||||||
|
Estimation Method
|
Inverse Distance Squared
|
|||||||
|
Seams for Grade Estimation
|
G5, M5, B5, S5, G6, L6, Lsi
|
|||||||
|
Maximum search distance, G5
|
305 x 305 x 61 m
|
|||||||
|
Maximum search distance, M5
|
533 x 305 x 61 m
|
|||||||
|
Maximum search distance, B5
|
533 x 305 x 61 m
|
|||||||
|
Maximum search distance, S5
|
229 x 229 x 61 m
|
|||||||
|
Maximum search distance, G6
|
229 x 229 x 61 m
|
|||||||
|
Maximum search distance, L6
|
305 x 305 x 61 m
|
|||||||
|
Maximum search distance, Lsi
|
305 x 305 x 61 m
|
|||||||
|
Minimum & Maximum samples
|
2 and 10
|
|||||||
|
Maximum samples per hole
|
3
|
|||||||
|
APPENDIX D: JORC Code, 2012 Edition - Table 1
|
|
|
Criteria
|
JORC Code 2012 explanation
|
Commentary
|
|||||
|
|
• The availability of check estimates, previous estimates and/or mine production records and whether the
Mineral Resource estimate takes appropriate account of such data.
|
• The Table below presents a summary comparison of the current October 2025 Mineral Resource estimate against the previous Mineral Resource
estimate for the Project, prepared by IMC in August 2025. The only change between the two resource estimates is the process vat leach retention time which was reduced from two days to one and one
half days.
|
|||||
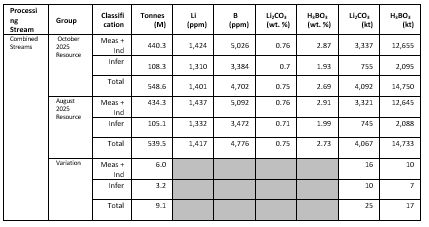
• There has been no HiB-Li or LoB-Li production on the Project to date.
|
|||||||
|
• The assumptions made regarding recovery of by-products.
|
• No by-products are being considered for recovery at present.
|
||||||
|
• Estimation of deleterious elements or other non-grade variables of economic significance (e.g. sulphur
for acid mine drainage characterisation).
|
• In addition to Li and B, the geological model also included 10 additional non-grade elements (Sr, Ca, Mg, Na, K, Rb,
Cs, Mo, Fe, Al) to allow for calculation of acid consumption values for the metallurgical process. No deleterious elements were estimated.
|
||||||
|
• In the case of block model interpolation, the block size in relation to the average sample spacing and
the search employed.
|
• The stratigraphic gridded surface model was developed using a 7.62 m regularized grid. The grade block model was
developed from the stratigraphic model using a 7.62 m North-South by 7.62 m East-West by 1.52 m vertical block dimension with no sub-blocks. The block size dimensions represent 12 percent of the
closer spaced drill hole spacing and 6 percent of the wider spaced spacing across the model area. Grade interpolation into the model blocks was performed using an Inverse Distance Squared (ID2) interpolator with unique search distances for each of the 7 seams being estimated as shown in the table above. The same search parameters were used for all of
the elements being estimated (B, Li, Sr, Ca, Mg, Na, K, Rb, Cs, Mo, Fe, Al) within each of the seams.
|
|
APPENDIX D: JORC Code, 2012 Edition - Table 1
|
|
|
Criteria
|
JORC Code 2012 explanation
|
Commentary
|
|||||
|
|
• Any assumptions behind modelling of selective mining units.
|
• The mining selective vertical unit of 9.14m is based on the selected mining equipment. The 1.52 m bench block model was
re-blocked after grade estimation to 9.14m bench height blocks keeping the horizontal dimensions the same at 7.62 by 7.62m.
• The re-blocked 9.14m was developed in the following steps:
• Seams and fault block domains were assigned to the model from the surfaces and solids files;
• Tonnes per block from the 1.52 m model were added together;
• Grades were weighted averaged by tonnes per 1.52 m blocks;
• Class was assigned by majority; when equal number of 1.52m blocks were present, the lower class was assigned;
• Fault block domains with no drill data and received grade estimates from surrounding data received a classification of
inferred.
|
|||||
|
• Any assumptions about correlation between variables.
|
• No assumptions or calculations relating to the correlation between variables were made at this time.
|
||||||
|
• Description of how the geological interpretation was used to control the resource estimates.
|
• The geological interpretation was used to control the Mineral Resource estimate by developing a contiguous stratigraphic
model (all units in the sequence were modelled) of the host rock units deposited within the basin, the roof and floor contacts of which then served as hard contacts for constraining the grade
interpolation. Grade values were interpolated within the geological units using only samples intersected within those units.
|
||||||
|
• Discussion of basis for using or not using grade cutting or capping.
|
• Grade capping or cutting was not applied for the targeted mineralized units B5, M5, S5 and L6, and adjacent units included
in the estimation process as a statistical analysis of the grade data indicated there was no bias or influence by extreme outlier grade values.
• Mineral Resources were not estimated for the other units. Grades have been estimated for adjacent units to allow for
potential mining dilution.
|
|
APPENDIX D: JORC Code, 2012 Edition - Table 1
|
|
|
Criteria
|
JORC Code 2012 explanation
|
Commentary
|
|||||
|
The process of validation, the checking process used, the comparison of model data to drill hole data, and use of reconciliation data if available.
|
The geological model validation and review process involved visual inspection of drill hole data as compared to model geology and grade parameters
using plan isopleth maps and approximately 300m spaced cross-sections through the model. Drill hole and model values were compared statistically along with grade estimates using polygon and ordinary
kriging approaches.
• No reconciliation data is available because the property is not in production.
|
||||||
|
Moisture
|
Whether the tonnages are estimated on a dry basis or with natural moisture, and the method of determination of the moisture content.
|
• The estimated Mineral Resource tonnages are presented on a dry basis.
• A moisture content evaluation needs to be done as part of future analytical programs.
|
|||||
|
Cut-off
parameters
|
• The basis of the adopted cut-off grade(s) or quality parameters applied.
|
• The Mineral Resource estimate presented in this Report has been constrained by the application of an optimized Mineral
Resource pit shell. The Mineral Resource pit shell was developed using the IMC Mine Planning software.
• The Mineral Resource estimate assumes the use of three processing streams: one which can process ore with boron content
greater than 5,000 ppm and two which can process ore with boron content less than 5,000 ppm.
• Key input parameters and assumptions for the Mineral Resource pit shell included the following:
• B cut-off grade of 5,000 ppm for HiB-Li processing stream and no B cut-off grade for LoB-Li processing stream
• No Li cut-off grade for HiB-Li processing stream and $11.13/t net value cutoff for LoB-Li processing stream
• Overall pit slope angle of 42 degrees (wall angle guidance provided by Geo-Logic Associates who developed the geotechnical
design).
• Mining cost of US$1.69/tonne based on recent studies by Ioneer.
• G&A cost of US$11.13/tonne processed based on recent studies by Ioneer.
• Ore processing and grade control costs vary by process stream and seam unit and are divided into fixed cost and the cost
of acid consumption. Shown below are the costs based on the average grades of the acid consuming elements in the Mineral Resource:
|
|
APPENDIX D: JORC Code, 2012 Edition - Table 1
|
|
|
Criteria
|
JORC Code 2012 explanation
|
Commentary
|
|||||
|
|
|
• Stream 1 (HiB-Li): fixed process cost = $30.50/mt and acid costs range between $5.21/mt and $45.32/mt based on the
average grades of the acid consuming elements in each seam.
• Streams 2 & 3 (LoB-Li): both the fixed and acid costs vary by seam with the fixed cost ranging between $15.19/mt to
$30.80/mt and the acid costs range between $2.30/mt and $49.31/mt.
• Boron and Lithium recovery of varied by seam for HiB-Li Processing Stream 1 with the respective recoveries being: M5 80.2%
and 85.7%, B5 76.6% and 85.3%, S5 75.4% and 80.9%, L6 72.3% and 75.6% .
• Boron Recovery for LoB-Li Processing Streams variable by lithology as follows: 65% in M5 Unit, 76.6% in B5 unit, 45.2% in
S5 unit, and 29.4% in L6 unit.
• Lithium Recovery for LoB-Li Processing Streams variable by lithology as follows: 78% in M5 unit, 85.3% in B5 unit, 83.2%
in S5 unit, and 74.9% in L6 unit.
• Boric Acid sales price of US$1,172.78/tonne.
• Lithium Carbonate sales price of US$19,351.38/tonne.
• Sales/Transport costs are included in the process fixed cost/t.
|
|||||
|
Mining factors
or assumptions
|
• Assumptions made regarding possible mining methods, minimum mining dimensions and internal (or, if
applicable, external) mining dilution. It is always necessary as part of the process of determining reasonable prospects for eventual economic extraction to consider potential mining methods, but
the assumptions made regarding mining methods and parameters when estimating Mineral Resources may not always be rigorous. Where this is the case, this should be reported with an explanation of
the basis of the mining assumptions made.
|
• The Mineral Resource estimate presented in this Report was developed with the assumption that the HiB-Li and LoB-Li
mineralisation within the Mineral Resource pit shell, as described in the preceding section, has a reasonable prospect for eventual economic extraction using current conventional open pit mining
methods.
• Except for the Mineral Resource pit shell criteria discussed in the preceding section, no other mining factors,
assumptions or mining parameters such as mining recovery, mining loss or dilution have been applied to the Mineral Resource estimate presented in this Report.
|
|
APPENDIX D: JORC Code, 2012 Edition - Table 1
|
|
|
Criteria
|
JORC Code 2012 explanation
|
Commentary
|
|||||
|
Metallurgical
factors or
assumptions
|
The basis for assumptions or predictions regarding metallurgical amenability. It is always necessary as part of the
process of determining reasonable prospects for eventual economic extraction to consider potential metallurgical methods, but the assumptions regarding metallurgical treatment processes and
parameters made when reporting Mineral Resources may not always be rigorous. Where this is the case, this should be reported with an explanation of the basis of the metallurgical assumptions made.
|
• The basis of the metallurgical assumptions made in establishing the reasonable prospects for eventual economic extraction
of the HiB-Li mineralisation are based on results from metallurgical and material processing work that was developed as part of the ongoing Feasibility Study for the Project. This test work was
performed using current processing and recovery methods for producing Boric acid and Lithium carbonate products
A second process stream to recover Li from low boron mineralized (LoB-Li) units is being developed. Current results
indicate a reasonable process and expectation for economic extraction of the LoB-Li from the S5, B5, M5 and L6 units. This test work was performed using current processing and recovery methods for
producing Boric acid and Lithium carbonate products.
|
|||||
|
Environment- al
factors or
assumptions
|
Assumptions made regarding possible waste and process residue disposal options. It is always necessary as part of the
process of determining reasonable prospects for eventual economic extraction to consider the potential environmental impacts of the mining and processing operation. While at this stage the
determination of potential environmental impacts, particularly for a greenfields project, may not always be well advanced, the status of early consideration of these potential environmental impacts
should be reported. Where these aspects have not been considered this should be reported with an explanation of the environmental assumptions made.
|
• The project will require waste and process residue disposal. Assumptions have been made that all environmental
requirements will be achieved through necessary studies, designs and permits.
• Currently, baseline studies and detailed designs have been completed for both waste and process residue disposal
facilities.
• In December 2022, the United States Fish and Wildlife Service (USFWS) listed Tiehm’s buckwheat as an endangered species
under the Endangered Species Act (ESA) and has designated critical habitat by way of applying a 500 m radius around several distinct plant populations that occur on the Project site. Ioneer is
committed to the protection and conservation of the Tiehm’s buckwheat. The Project’s Mine Plan of Operations was submitted to the BLM in July 2022. In October 2024, Ioneer received its federal
permit for the Rhyolite Ridge Lithium-Boron Project from the BLM. The formal Record of Decision (ROD) follows the issuance in September 2024 of the final Environmental Impact Statement (EIS) by the
BLM As part of the final EIS, the U.S. Fish and Wildlife Service, which oversees the administration of the Endangered Species Act (ESA), also formally released the ESA Section 7 Biological Opinion
concluding Rhyolite Ridge will not jeopardise Tiehm’s buckwheat or adversely modify its critical habitat.
• The mineral resource pit shell used to constrain the October 2025, mineral resource estimate was not adjusted to account
for any impacts from avoidance of Tiehm’s buckwheat or minimisation of disturbance within the designated critical habitat. Environmental and permitting assumptions and factors will be taken into
consideration during future modifying factors studies for the Project. These permitting assumptions and factors may result in potential changes to the Mineral Resource footprint in the future.
|
|
APPENDIX D: JORC Code, 2012 Edition - Table 1
|
|
|
Criteria
|
JORC Code 2012 explanation
|
Commentary
|
|||||
|
Bulk density
|
• The density values used to convert volumes to tonnages were assigned on a by-geological unit basis using mean values calculated from 120
density samples collected from drill core during the 2018-2019 and the 2023-2024 drilling programs. The density analyses were performed using the water displacement method for density determination,
with values reported in dry basis.
|
||||||
|
• Whether assumed or determined. If assumed, the basis for the assumptions. If determined, the method used,
whether wet or dry, the frequency of the measurements, the nature, size and representativeness of the samples.
|
• The application of assigned densities by geological unit assumes that there will be minimal variability in density within
each of the units across their spatial extents within the Project area. The use of assigned density with a very low number of samples, as is the case with several waste units, is a factor that
increases the uncertainty and represents a risk to the Mineral Resource estimate confidence
|
||||||
|
• The bulk density for bulk material must have been measured by methods that adequately
account for void spaces (vugs, porosity, etc.), moisture and differences between rock and alteration zones within the deposit.
|
• The Archimedes-principle method for density determination accounts for void spaces, moisture and differences in rock
type.
|
|
APPENDIX D: JORC Code, 2012 Edition - Table 1
|
|
|
Criteria
|
JORC Code 2012 explanation
|
Commentary
|
|||||
|
Bulk density
(Con’t)
|
Discuss assumptions for bulk density estimates used in the evaluation process of the different materials.
|
• Density values were assigned for all geological units in the model, including mineralized units as well as overburden, interburden and
underburden waste units. By-unit densities were assigned in the grade block model based on the block geological unit code as follows:
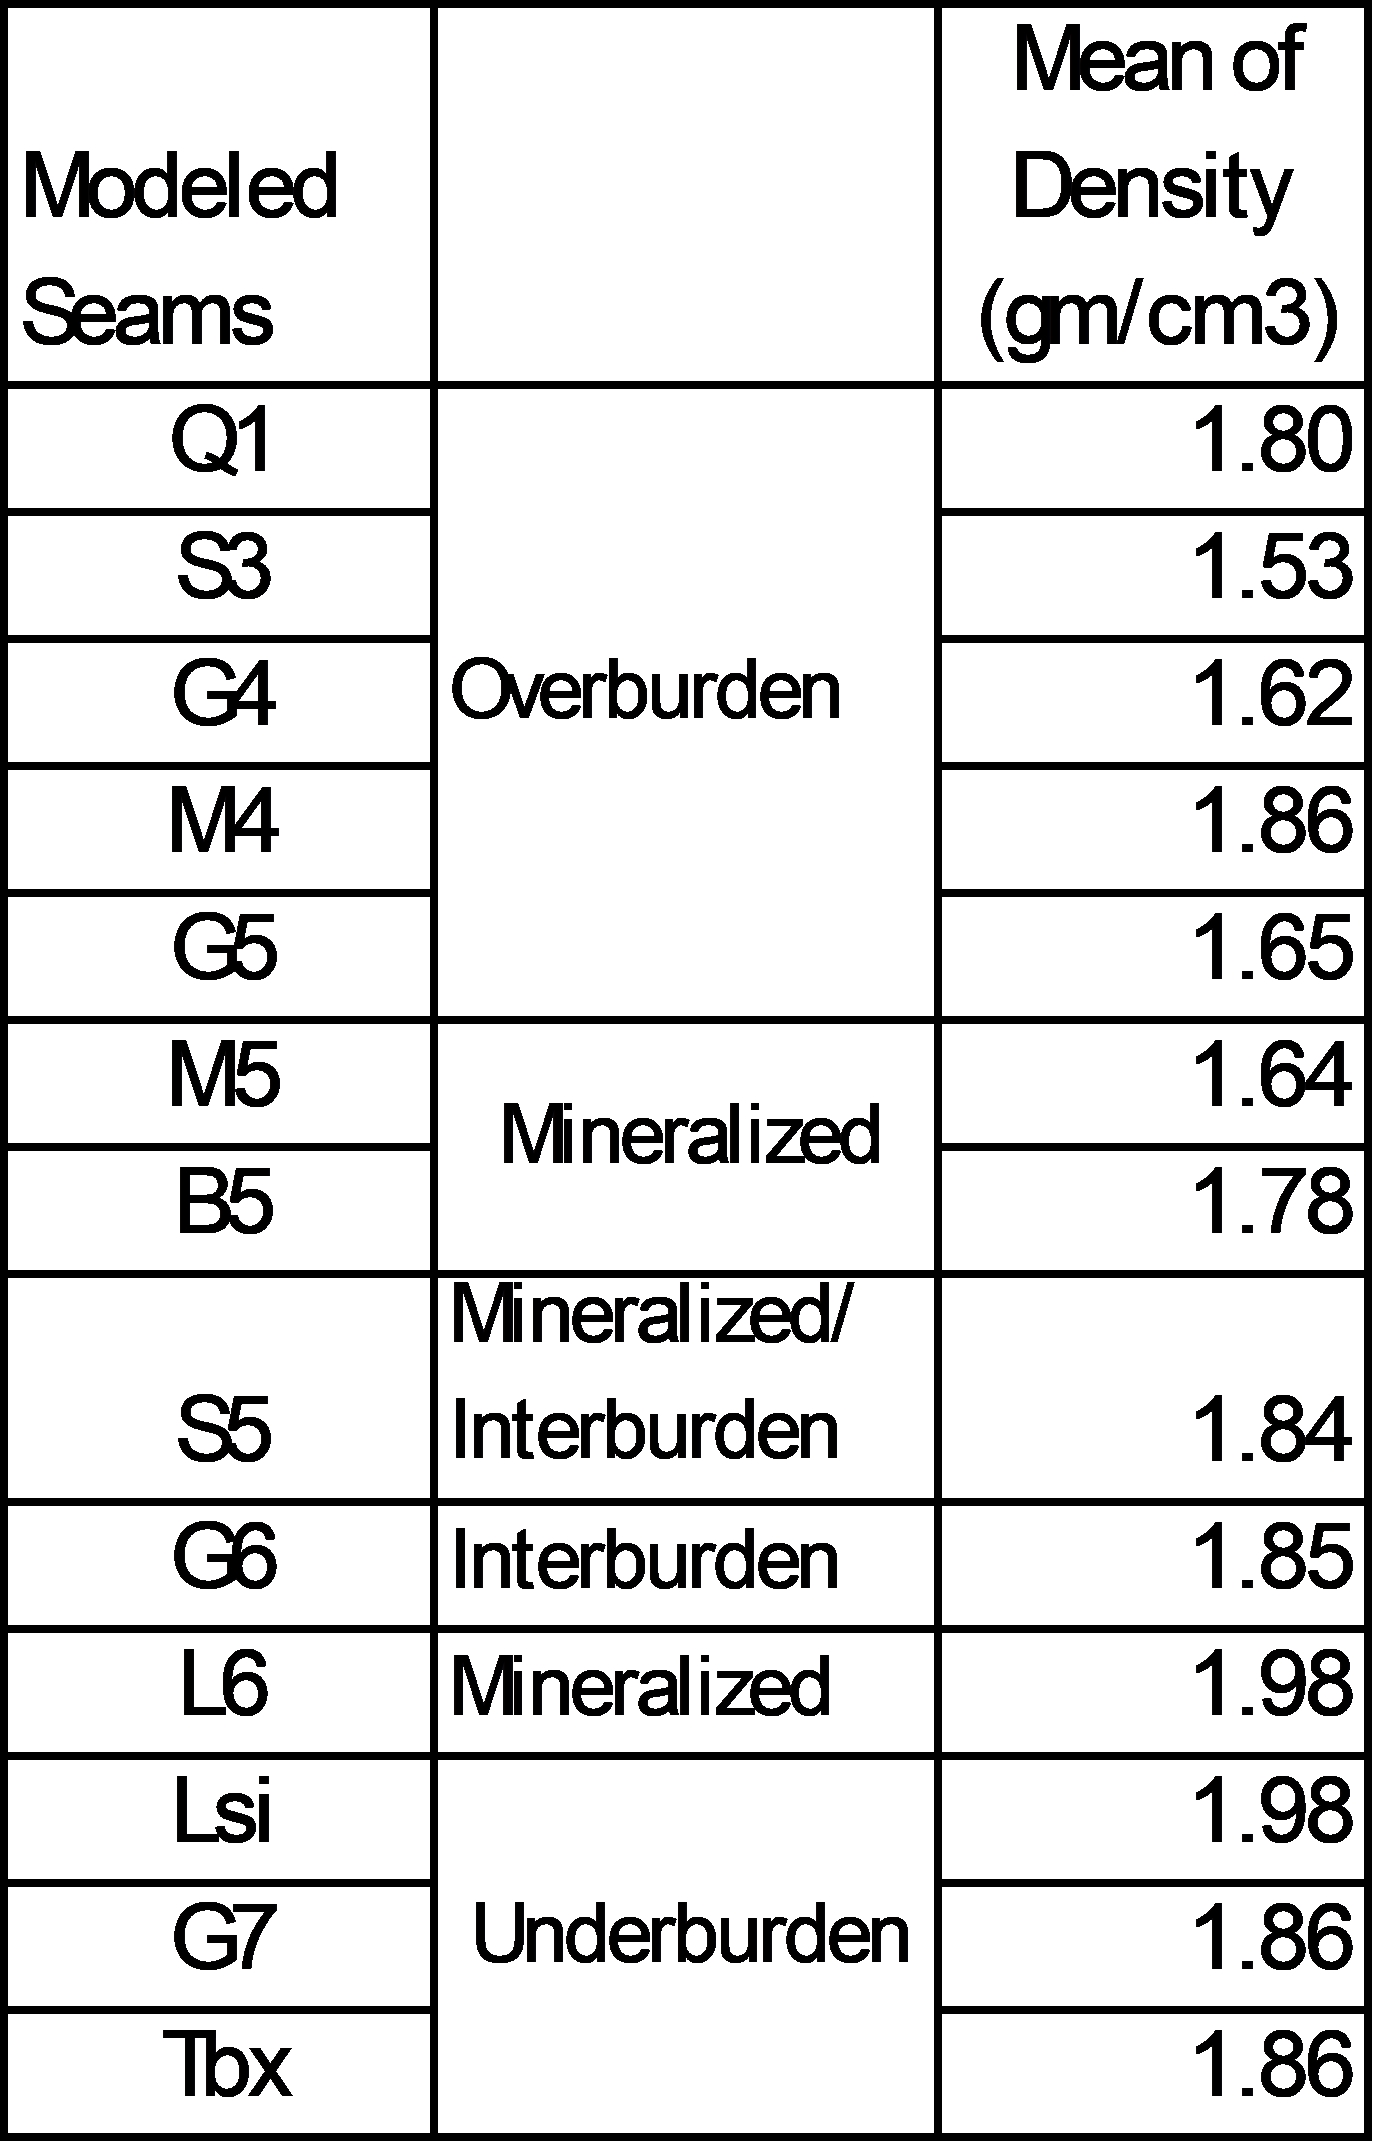 |
|
APPENDIX D: JORC Code, 2012 Edition - Table 1
|
|
|
Criteria
|
JORC Code 2012 explanation
|
Commentary
|
|||||
|
Classification
|
The basis for the classification of the Mineral Resources into varying confidence categories.
|
• The Mineral Resource estimate for the Project is reported here in accordance with the “Australian Code for Reporting
of Exploration Results, Mineral Resources and Ore Reserves” as prepared by the Joint Ore Reserves Committee (the JORC Code, 2012 Edition).
• IMC performed a statistical and geostatistical analysis for the purpose of evaluating the confidence of continuity of
the geological units and grade parameters. The results of this analysis were applied to developing the Mineral Resource classification criteria for the 1.52m bench height block model.
• Estimated Mineral Resources were classified as follows:
• Measured: Between 107 and 122 m spacing between points of observation depending on the seam, with sample interpolation
from a minimum of four drill holes.
• Indicated: Between 168 and 244 m spacing between points of observation, with sample interpolation from a minimum of two drill holes.
• Inferred: To the limit of the estimation range (maximum 533 m, depending on the seam), with sample interpolation from a minimum of one
drill hole (2 samples).
• The class was assigned from the 1.52m model to the 9.14m model by majority of the six 1.52m blocks combined to one 9.14m block, with the
following exceptions:
• If equal number of two classes (3 blocks and 3 blocks) the lower class was assigned,
• If the block is located within a fault block of a particular seam that has no drill data or less than two holes and was assigned grades
from surrounding data, the class was set to inferred.
|
|||||
|
• Whether appropriate account has been taken of all relevant factors (i.e. relative confidence in
tonnage/grade estimations, reliability of input data, confidence in continuity of geology and metal values, quality, quantity and distribution of the data).
|
• The Mineral Resource classification has included the consideration of data reliability, spatial distribution and
abundance of data and continuity of geology and grade parameters
|
||||||
|
• Whether the result appropriately reflects the Competent Person’s view of the deposit.
|
• It is the Competent Persons view that the classification criteria applied to the Mineral Resource estimate are
appropriate for the reliability and spatial distribution of the base data and reflect the confidence of continuity of the modelled geology and grade parameters.
|
|
APPENDIX D: JORC Code, 2012 Edition - Table 1
|
|
|
Criteria
|
JORC Code 2012 explanation
|
Commentary
|
|||||
|
• The results of any audits or reviews of Mineral Resource estimates.
|
• Beyond high level review for the purpose of understanding the Project history, no formal audits or reviews of previous
or historical Mineral Resource estimates were performed as part of the scope of work; Mineral Resource estimation evaluation is limited to the estimate prepared by IMC and presented in this
Report.
|
||||||
|
• Where appropriate a statement of the relative accuracy and confidence level in the Mineral Resource
estimate using an approach or procedure deemed appropriate by the Competent Person. For example, the application of statistical or geostatistical procedures to quantify the relative accuracy
of the resource within stated confidence limits, or, if such an approach is not deemed appropriate, a qualitative discussion of the factors that could affect the
• relative accuracy and confidence of the estimate.
|
• IMC performed a statistical and geostatistical analysis and applied Mineral Resource classification criteria to
reflect the relative confidence level of the estimated Mineral Resource tonnes and grades estimated globally across the model area for the Project.
|
||||||
|
Audits or
reviews
|
• The statement should specify whether it relates to global or local estimates, and, if local, state the
relevant tonnages, which should be relevant to technical and economic evaluation. Documentation should include assumptions
• made and the procedures used.
|
• The Mineral Resource tonnes and grade have been estimated globally across the model area for the Project.
|
|||||
|
Discussion of
relative
accuracy/
confidence
|
These statements of relative accuracy and confidence of the estimate should be compared with production data, where available.
|
• Reconciliation against production data/results was not possible as the Project is currently in the development stage
and there has been no production on the Project to date.
|
|
APPENDIX D: JORC Code, 2012 Edition - Table 1
|
|
|
Criteria
|
JORC Code 2012 Explanation
|
Commentary
|
|||||
|
Mineral
Resource
estimate for
conversion to
Ore Reserves
|
• Description of the Mineral Resource estimate used as a basis for the conversion to an Ore Reserve.
|
|
• The October 2025 Mineral Resource estimate is based on information compiled by Herbert E. Welhener, a Competent Person is a Registered Member
of the SME (Society for Mining, Metallurgy, and Exploration), and is a QP Member of MMSA (the Mining and Metallurgical Society of America). Mr. Welhener is a full-time employee of Independent Mining
Consultants, Inc. (IMC) and is independent of Ioneer and its affiliates. Mr. Welhener has sufficient experience that is relevant to the style of mineralisation and type of deposit under
consideration and to the activity being undertaken to qualify as a Competent Person as defined in the 2012 Edition of the ‘Australasian Code for Reporting of Exploration Results, Mineral Resources
and Ore Reserves’ (JORC Code 2012). Mr. Welhener consents to the inclusion in this report.
• The October 2025 Mineral Reserve estimate is based on information compiled by Joseph S.C. McNaughton, a Competent Person is a Registered PE
(Professional Engineer) in the state of Arizona. Mr. McNaughton is a full-time employee of Independent Mining Consultants, Inc. (IMC) and is independent of Ioneer and its affiliates. Mr. McNaughton
has sufficient experience that is relevant to the style of mineralisation and type of deposit under consideration and to the activity being undertaken to qualify as a Competent Person as defined in
the 2012 Edition of the ‘Australasian Code for Reporting of Exploration Results, Mineral Resources and Ore Reserves’ (JORC Code 2012). Mr. McNaughton consents to the inclusion in this report.
|
||||
|
• Clear statement as to whether the Mineral Resources are reported additional to, or inclusive of, the Ore
Reserves.
|
• The Mineral Resources are reported inclusive of the Ore Reserves.
|
||||||
|
Site visits
|
• Comment on any site visits undertaken by the Competent Person and the outcome of those visits.
|
• The IMC Competent Person Herbert E. Welhener and Joseph Mc Naughton made personal site inspections, this visit was
performed on the Project site on August 10th 2023 for the Project.
• During the site visit the IMC Competent Persons visited the Ioneer core shed in Tonopah NV, and the South Basin area of the Rhyolite Ridge
Project site, which is the focus of the current exploration and resource evaluation efforts by Ioneer.
• The IMC Competent Persons observed the active drilling, logging and sampling process and interviewed site personnel
regarding exploration drilling, logging, sampling and chain of custody procedures.
|
|
APPENDIX D: JORC Code, 2012 Edition - Table 1
|
|
|
Criteria
|
JORC Code 2012 Explanation
|
Commentary
|
|||||
|
|
|
• The outcome of the site visit was that the IMC Competent Persons developed an understanding of the general geology of the Rhyolite Ridge
Project. The IMC Competent Person was also able to visually confirm the presence of a selection of monumented drill holes from each of the previous drilling programs as well as to observe drilling,
logging and sampling procedures during the current drilling program and to review documentation for the logging, sampling and chain of custody protocols for previous drilling programs.
• During the site visit, the Competent Person confirmed that the type of data was applicable for Ore Reserve estimation. The Competent Person
observed project surface conditions for the purpose of understanding project boundaries, physical characteristics of the resource for determining appropriate extraction methodology. drainage and
infrastructure requirements, appropriate locations for overburden storage facilities (OSFs), as well as access from the proposed quarry to the proposed
process plant site location.
|
|||||
|
• If no site visits have been undertaken indicate why this is the case.
|
• Not Applicable
|
||||||
|
Study status
|
• The type and level of study undertaken to enable Mineral Resources to be converted to Ore Reserves.
|
• As part of the October 2025 Ore Reserves estimate, an open-pit mine plan was developed that was technically achievable and economically
viable. The mine plan considered material Modifying Factors such as dilution and ore loss, various boundary constraints, processing recoveries and all costs associated with mining, processing,
transportation and selling product.
|
|||||
|
• The Code requires that a study to at least Pre-Feasibility Study level has been undertaken to convert
Mineral Resources to Ore Reserves. Such studies will have been carried out and will have determined a mine plan that is technically achievable and economically viable, and that material Modifying
Factors have been considered.
|
• The 2025FS was undertaken to convert Mineral Resources to Ore Reserves. The 2025FS determined a mine plan that is technically achievable and
economically viable, and that material Modifying Factors were considered.
• The Mineral Resources have been converted to Ore Reserves by means of an open-pit optimisation and pit design, completed by IMC, and supported
by geotechnical studies undertaken by Geo-Logic Associates (GLA). Only Measured and Indicated Mineral Resources have been included in the Ore Reserves.
Modifying factors have been applied as stated below.
|
||||||
|
Cut-off
parameters
|
• The basis of the cut-off grade(s) or quality parameters applied.
|
• IMC applied a two-phase approach to defining the cut-off grade, including a grade-tonnage evaluation and an economic evaluation.
|
|
APPENDIX D: JORC Code, 2012 Edition - Table 1
|
|
|
Criteria
|
JORC Code 2012 Explanation
|
Commentary
|
|||||
|
|
• The grade tonnage evaluation limited the stream 1 process feed to material with boron grades >5,000 ppm boron cut-off grade for high boron
– high lithium (HiB-Li) mineralisation (M5, B5, L6) and net value (net of process) cut-off grade of $11.13/t for low boron (LoB-Li) mineralisation below 5,000 ppm boron which is split into two
material types: low clay and high clay material, respectfully, Stream 2 and Stream 3.
|
||||||
|
Mining factors or
assumptions
|
• The method and assumptions used as reported in the Pre-Feasibility or Feasibility Study
to convert the Mineral Resource to an Ore Reserve (i.e. either by application of appropriate factors by optimisation or by preliminary or detailed design).
|
• This Ore Reserve estimate is based on work completed for a 2025FS. The ore reserve was developed from the 9.14m(30ft) mine planning block
model and is the total of all proven and probable category ore that is planned for processing.
• The mineral ore reserve was estimated by tabulating the contained tonnage of measured and indicated mineral resources (proven and probable ore
reserves) within the designed final pit geometry at the planned cut-off grade. The final pit design and the internal phase (pushback) designs were guided by the results of the Lerchs-Grossmann
algorithm, project constraints, and other relevant factors. Multiple quarry design objectives and constraints were incorporated into the pit targeting exercise, resulting in five pushback designs
that guided the mine planning. These phase designs had a significant impact on various outcomes, including the final quarry designs, the quarrying approach, and the corresponding mine production
plan.
• Modifying Factors (listed below) and GLA’s geotechnical recommendations listed below IMC’s pit design was further analysed by GLA to check for
pit slope stability. The analysis found that the pit design is predicted to be in a stable configuration
|
|||||
|
• The choice, nature and appropriateness of the selected mining method(s) and other mining parameters
including associated design issues such as pre-strip, access, etc
|
• The deposit is to be mined by open-pit mining methods with 9.14 metre (m) bench heights using 27 cubic
metre (m3) wheel loader, and 136-tonne autonomous haul trucks (AHTs).
This is the most appropriate mining method for extraction of the resource due to the moderately steep dip of the deposit, moderate stripping ratio, mining equipment access requirements to remove
overburden and extract ore, and rock properties of the various stratigraphic units present in the deposit.
• The planned quarry area includes problematic adversely oriented bedding conditions where very low strength materials (i.e. layers M4, M5a, M5,
and B5) daylight on the proposed slope faces. GLA notes that
|
|
APPENDIX D: JORC Code, 2012 Edition - Table 1
|
|
|
Criteria
|
JORC Code 2012 Explanation
|
Commentary
|
|||||
|
|
|
• there are some aspects of the quarry design that are based on limited geotechnical laboratory testing, in particular, the northern extents of
the LOM quarry limits.
|
|||||
|
Mining factors or assumptions
(con’t)
|
The assumptions made regarding geotechnical parameters (e.g. pit slopes, stope sizes, etc), grade control and pre-production drilling.
|
• Geo-Logic Associates (GLA) completed the geotechnical quarry slope designs, which included limit equilibrium stability and kinematic stability
evaluations, including structurally controlled failures and toppling evaluations. The planned quarry area includes problematic adversely oriented bedding conditions where very low strength
materials (i.e. layers M4, M5a, M5, and B5) daylight on the proposed slope faces. The results of the kinematic and backbreak analyses indicate that these factors would not control the quarry
designs. The inter-ramp angle (IRA) results from the backbreak and kinematic analyses for the LOM quarry was 42° in all materials other than Alluvial, alluvial material has an IRA of 35°. The
ground anchor support structure recommended by GLA is included within the pit design and mine plan prepared by IMC.
|
|||||
|
The assumptions made regarding geotechnical parameters (e.g. pit slopes, stope sizes, etc), grade control and pre-production drilling.
|
• Control of blasting will be extremely important as production progresses; especially where steeply dipping materials are present. The
potential need for controlled blasting techniques near the final quarry wall may be required during normal operations. Such techniques may include buffer blasting, trim blasting, pre-splitting,
post-split blasting, and line drilling. GLA recommends that radar monitoring and prisms be implemented, at a minimum, for increased safety and productivity, as well as for protection of the Tiehm’s
buckwheat population
|
||||||
|
The major assumptions made and Mineral Resource model used for pit and slope optimisation (if appropriate).
|
• Pit optimisations were performed on the October 2025 Mineral Resource model, IMC performed numerous pit targeting exercises under various
scenarios and assumptions to identify the economic extents of the LOM Quarry using the 9.14m mine planning geological block model and Hexagon MinePlan® software’s quarry optimization capabilities.
Using the above geotechnical parameters and applied recovery, pro-forma mining cost, processing cost, transportation cost and sales price assumptions listed below:
• Boron cut-off grade of 5,000 ppm (Stream 1)
|
|
APPENDIX D: JORC Code, 2012 Edition - Table 1
|
|
|
Criteria
|
JORC Code 2012 Explanation
|
Commentary
|
|||||
|
Mining factors or assumptions
|
|
• Boron cutoff grade < 5,000 ppm and Net value of $11.13/t (Stream 2 & 3)
• Boron recovery of between 29.4% to 80.2%, based on process stream and seam.
• Lithium recovery between 74.9% to 85.7%, based on process stream and seam.
• Mining cost of US$1.69 per tonne (t)
• Additional haulage cost of US$0.0059/t per vertical metre
• Processing cost range between $17.49 to $80.11 per tonne based on process stream and seam.
• G&A cost of $11.13/t
• Boric Acid sales price of US$1,172.78/tonne
• Lithium Carbonate sales price of US$19,351.38/tonne
|
|||||
|
• The mining dilution factors used.
|
• Mining will be performed on a horizontal 9.14m high bench. It is assumed that no split benches will be mined. To
incorporate the estimate of dilution and ore loss from adjacent seams, a 9.14m bench height block model was developed for use in the mine plan and tabulation of the Ore Reserves.
The steps to develop this block model are:
• The geologic solids and surfaces were assigned to the block model with a block size of 7.62 by 7.62 meter in plan and
9.14m high. In instances where a model block intersected more than one seam, the seam with the majority of the block volume was assigned to the total block.
• The grades were averaged, weighted by ktonnes from the 1.52m model;
• Class was assigned by majority from the 1.52m model with the following modifications:
• If there were equal number of blocks (3 and 3), the classification used the lower class: measured moved to indicated or
indicated moved to inferred;
• In fault block domains with few or no composites, the following edits were done:
• Measured set to inferred if there are no composites in fault block,
• Measured set to inferred if less than four (< 4) composites in fault block,
|
|
APPENDIX D: JORC Code, 2012 Edition - Table 1
|
|
|
Criteria
|
JORC Code 2012 Explanation
|
Commentary
|
|||||
|
• Measured set to indicated if four to nine (4 – 9) composites in fault block,
• Indicated set to inferred if less than (< 4) composites in fault block
|
|||||||
|
• The mining recovery factors used.
|
• The mining recovery factor assumes the use of front end loaders and dozers outfitted with high- precision GPS and
integrated FMS and competent operators mining on a 9.14m bench. The recovery and losses are assumed to be incorporated into the 9.14m bench height model used to tabulate the ore
reserve and mine plan tonnages and grades.
|
||||||
|
• Any minimum mining widths used.
|
• Due to the continuous thickness of the B5 and L6 seams within the designed pit, no minimum mining
thickness was applied in the Ore Reserves estimate.
|
||||||
|
• The manner in which Inferred Mineral Resources are utilised in mining studies and the
sensitivity of the outcome to their inclusion.
|
• Stated Ore Reserves have only been reported from the Measured and Indicated Resource categories with Modifying Factors
applied.
|
||||||
|
• The infrastructure requirements of the selected mining methods.
|
• The Project is currently in the design stage, and no site-specific infrastructure has been built to date. Infrastructure
required for the Project includes haul roads, ground anchoring highwall support structure, Overburden Storage Facilities (OSFs), Spent Ore Storage Facility (SOSF), Contact Water
Ponds (CWPs), the processing plant which includes processing structures and facilities, maintenance facilities, warehousing, shipping and receiving, fuel island, Sulphuric Acid
Plant (SAP), Steam Turbine Generator (STG) responsible for power generation/transmission, and administrative buildings.
|
|
APPENDIX D: JORC Code, 2012 Edition - Table 1
|
|
|
Criteria
|
JORC Code 2012 Explanation
|
Commentary
|
|||||
|
Metallurgical
factors or
assumptions
|
• The metallurgical process proposed and the appropriateness of that process to the
style of mineralisation.
|
• The Rhyolite Ridge Li-B ore is unique, and no reference installations exist for processing this type of ore. Advanced
scientific investigative and confirmatory test work was therefore required to optimise the process flowsheet for the 2020FS. Bench and pilot plant testing were conducted at
Kemetco Research, Inc. (Kemetco) in Richmond, British Columbia, and overseen by Norm Chow and Anca Nacu PhD with Kemetco; Patrick Glynn
P.E., Jaegan Mohan and Kyle Marte, PEng with Fluor; and Peter Ehren and Michael Osborne with Ioneer. Kappes Cassiday Associates (KCA)
performed baseline metallurgical test work for vat leaching test work, FLSmidth performed crushing and filtration test work, and Veolia performed evaporation and
crystallisation test work that formed the basis of the 2020FS.
• Ore will be processed by ore sizing, vat acid leaching, impurity removal, evaporation, and crystallisation using a
flowsheet developed specifically for the Project to generate technical-grade lithium carbonate and boric acid. Test work has also confirmed that refining the technical-grade
lithium carbonate to battery-grade lithium hydroxide is technically and commercially feasible through a liming route. No impediments have been identified to the technical and
commercial feasibility for conversion of the technical-grade lithium carbonate to battery-grade lithium carbonate through the bicarbonation route.
• Key process engineering deliverables completed include the block flow diagram (BFD),
process flow diagrams (PFDs), process design criteria, piping and instrumentation diagrams (P&IDs),
and heat and mass balance (summarized on the PFDs). The heat and mass balance has been compiled using the Metsim process simulation software package and is a fully integrated
model comprising all major process unit operations and recycle streams. The model tracks all elements/compounds of interest throughout the process. Notably lithium wash losses,
which can be significant in lithium brine flowsheets, are estimated through detailed modelling of all dewatering and wash unit operations.
|
|
APPENDIX D: JORC Code, 2012 Edition - Table 1
|
|
|
Criteria
|
JORC Code 2012 Explanation
|
Commentary
|
|||||
|
|
• An on-site SAP will produce commercial-grade sulphuric acid for vat leaching the ore. The selection of the
technology for the large SAP is based on a proven operating design and specialty technology provider. The SAP is a double conversion, double adsorption system that has
proven to be reliable and predictable.
|
||||||
|
• Whether the metallurgical process is well-tested technology or novel in nature.
|
• The Rhyolite Ridge Li-B ore is unique, and no reference installations exist for processing this type of ore.
Advanced scientific investigative and confirmatory test work was therefore required to optimise the process flowsheet. Bench and pilot plant testing were performed by
Kemetco, KCA performed baseline metallurgical test work for vat leaching test work, FLSmidth performed crushing and filtration test work, and Veolia performed evaporation
and crystallisation test work that formed the basis of the 2025FS. However, the proposed metallurgical process uses known and commercially proven equipment and technology
and is ready for commercialisation.
|
||||||
|
• The nature, amount and representativeness of metallurgical test work undertaken,
the nature of the metallurgical domaining applied and the corresponding metallurgical recovery factors applied.
|
• The Rhyolite Ridge Li-B ore is unique, and no reference installations exist for processing this type of ore.
Advanced scientific investigative and confirmatory test work was therefore required on bulk samples taken from the outcrop and on core samples. Bench and pilot plant
testing were performed by Kemetco, KCA performed baseline metallurgical test work for vat leaching test work, FLSmidth performed crushing and filtration test work, and
Veolia performed evaporation and crystallisation test work that formed the basis of the 2020FS. The metallurgical testing programs were fit for purpose and no standardized
test methods were used to govern testing programs. Test work was structured and guided using the general principles and definition of the CIM Best Practice Guidelines for
mineral processing. At a finer level each metallurgical laboratory has their own standard operating procedures (SOPs) and use a wide
range of standards for individual test procedures and assaying. A list of these procedures has not been compiled. The majority of metallurgical test work has been performed
on material from the South Basin, which was the focus of the 2020FS and the proposed location of the quarry, though some test work has also been done on core from the North
Basin where operations could potentially expand in the future.
|
|
APPENDIX D: JORC Code, 2012 Edition - Table 1
|
|
|
Criteria
|
JORC Code 2012 Explanation
|
Commentary
|
|||||
|
• In-depth metallurgical test work and pilot plant programs were performed over the 18-month duration of the 2020FS
on over 27 tonnes of material (primarily limited to the B5 unit) to optimise the process flowsheet. Some metallurgical test work is still ongoing to confirm and further
reduce risk of specific areas in the process flowsheet. The results from the test work will be incorporated and updated during the detailed engineering phase, over the
next year, based on the criticality of the effect on the current design.
• The process flowsheet was customised to the metallurgical and chemical characteristics of the unique Rhyolite Ridge
ore to reflect each unit operation of the proposed Rhyolite Ridge processing facilities. This extensive effort has resulted in achieving a high level of confidence in the
process flowsheet and reducing process risk and uncertainty. The major unit operations of the Rhyolite Ridge flowsheet have been operated at pilot plant scale on over 27
tonnes of material. The metallurgical test work is representative of the process planned for treating the Rhyolite Ridge ore delivered from the mine.
• Based on the metallurgical test work, corresponding recoveries for lithium and for boron to be applied to all ore
planned to be mined based on stream and seam as follows.
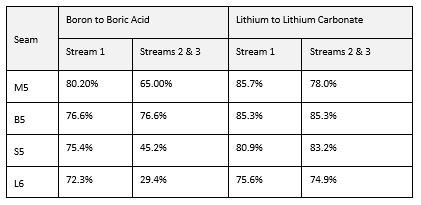 These figures are cumulative recoveries for the unit processes that span from vat leaching to product production.
|
|
APPENDIX D: JORC Code, 2012 Edition - Table 1
|
|
|
Criteria
|
JORC Code 2012 Explanation
|
Commentary
|
|||||
|
• Any assumptions or allowances made for deleterious elements.
|
|
• In addition to lithium and boron, deleterious elements including magnesium, calcium, aluminium, potassium, and iron
impact the amount of sulphuric acid consumed by processing plant feed material and annual ore throughputs. The process plant design is based on maximising the sulphuric
acid output by the SAP. The ore throughput through the processing plant is therefore variable to counter the effect of varying acid consumptions to give a constant annual
acid consumption. The ore throughput of the process plant is based on achieving the maximum ore throughput anticipated in the mine plan on a monthly basis.
|
|||||
|
• The existence of any bulk sample or pilot scale test work and the degree to which
such samples are considered representative of the orebody as a whole.
|
|
• Extensive test work and pilot plant programs were performed as part of the 2020FS on bulk samples taken from the
outcrop and on core samples. The majority of metallurgical test work has been performed on material from the proposed quarry location in the South Basin, which was the
focus of the 2020FS. Most test work was performed on B5. Test work has been performed on over 27 tonnes of material, and the samples are representative of the ore body as a
whole.
|
|||||
|
• For minerals that are defined by a specification, has the ore reserve
estimation been based on the appropriate mineralogy to meet the specifications?
|
|
• Kemetco, KCA, FLSmidth, and Veolia have performed sufficient bench scale and pilot plant test work to indicate that
technical grade lithium carbonate with 99% purity, battery-grade lithium hydroxide with 99.5% purity, and boric acid with 99.9% purity can be produced from the Rhyolite
Ridge ore. The Ore Reserves are of the mineralogy that the plant is designed to process and support these specifications based on metallurgical test work.
|
|||||
|
Environmental
|
• The status of studies of potential environmental impacts of the mining and
processing operation. Details of waste rock characterisation and the consideration of potential sites, status of design options considered and, where applicable, the
status of approvals for process residue storage and waste dumps should be reported.
|
|
• The Project is designed to be a sustainable, environmentally sensitive operation with no grid energy requirements,
low water usage, low emissions, and a modest surface footprint.
• The BLM permitting process required compliance with the National Environmental Policy Act (NEPA); The NEPA requirements included baseline reports for 14 different resource areas of the Project, including air quality, biology, cultural resources,
groundwater, recreation, socioeconomics, soils, and rangeland.
• Baseline environmental studies were performed as part of the 2020FS. Updates to the air quality impacts assessment,
and groundwater were completed in 2023 and 2024.
• The permits deemed critical to the advance of the overall Project included the Bureau of Land Management (BLM) Plan of Operations, the State of Nevada Water Pollution Control Permit (WPCP) required to
construct, operate, and close a mining facility, and the Nevada Bureau of Air Pollution Control air quality permit. Ioneer has received these three critical permits as of
October 2024.
• Bureau of Land Management (BLM) – Mine Plan of Operations, and
|
|
APPENDIX D: JORC Code, 2012 Edition - Table 1
|
|
|
Criteria
|
JORC Code 2012 Explanation
|
Commentary
|
|||||
|
|
|
|
|
State of Nevada Bureau of Mining Regulation and Reclamation (BMRR) – Nevada Reclamation Permit – applications were submitted
to both agencies, and the BLM determined the application complete on August 26, 2020. An amended version of the applications was submitted to the BLM and BMRR in July 2022.
• The State of Nevada Bureau of Air Pollution Control – Air Quality Permit – was obtained on June 14, 2021
(AP1099-4256).
• The State of Nevada BMRR – Water Pollution Control Permit (required to construct, operate, and close a mining
facility) – was obtained on July 1, 2021 (NVN-2020107).
• The Plan of Operations filing triggered the environmental review process under the NEPA that is expected to follow
an Environmental Impact Statement (EIS) pathway. The NEPA process was guided by the 2023 implemented requirements in the NEPA
regulations under 40 Code of Federal Regulations 1500 and other U.S. Department of Interior guidance, as well as the BLM Battle Mountain District Instruction that
streamline the overall environmental review and permitting processes. The BLM selected a third-party EIS contractor in September 2020. That contractor subsequently
commenced preliminary NEPA work for the BLM, including assessing the adequacy of the baseline data for use in the EIS. The BLM published a Notice of Intent to prepare an
EIS in December 2022. Scoping was completed in the first quarter of 2023. The Draft EIS was completed in April 2024 and the Notice of Availability was published in the
second quarter of 2024. In October 2024, Ioneer received its federal permit for the Rhyolite Ridge Lithium-Boron Project from the BLM. The formal Record of Decision (ROD)
follows the issuance in September 2024 of the final Environmental Impact Statement (EIS) by the BLM, which incorporated public feedback received during the April-June 2024
open comment period.
• Ioneer has focused its efforts to date on preparing permits for the initial phases of the quarry south of the county
road estimated to allow for the first 10 years, and little work has been done to date on preparing permit applications for the larger LOM, which is effectively an expansion
of the current planned quarry. The permitting process for the LOM Quarry will begin after the initial stages of project construction. Based on the current mine plan, the
LOM Quarry permits will need to be secured by the end of the fifth year of production, which is currently slated for 2034.
• A geochemistry study was conducted as part of the 2020FS to assess
|
|
APPENDIX D: JORC Code, 2012 Edition - Table 1
|
|
|
Criteria
|
JORC Code 2012 Explanation
|
Commentary
|
|||||
|
|
|
|
acid rock drainage (ARD), metals leaching (ML),
and salinity generation potential of all major lithologic units and residual process materials. The study also aimed to understand mineral composition and geochemical
controls on water quality, evaluate potential impacts from the project and associated protection measures and provide information to support geochemical models and
evaluations for water quality predictions. Overburden and ore samples were collected from existing exploration drill core and 137 samples representing 15 different units
were geochemically analysed to characterise the potential of these materials to generate acidic drainage or to leach metals based on regulatory guidance documents published
by the Nevada Division of Environmental Protection (NDEP) and the Nevada BLM. Testing included acid-base accounting (ABA), net acid generation pH, short-term leach testing by meteoric water mobility procedure, bulk elemental content, X-ray diffraction,
optical mineralogy, and humidity cell testing (HCT). While most Project materials are non-potentially acid generating (non-PAG), HCTs for all major lithologic units are required because a post-closure quarry lake will develop. A geochemistry study was
conducted by Piteau in 2023 to support the application to modify the Project’s existing WPCP NEV2020107 issued August 24, 2021. The updated Geochemical Report was completed
and submitted to NDEP with the modification application submitted July 17, 2024Two ex-pit OSFs have been designed to accommodate the storage of overburden and low-grade M5
material, namely, the South OSF and the North OSF. The South OSF is located to the south of the quarry. This site was selected due to its proximity to the quarry to
minimise haul distances and prevent sterilisation of Mineral Resources; as well as not move the OSF out of critical habitat. The North OSF is located approximately 1.1
kilometres (km) northwest of the quarry between the quarry limits and the processing plant. The North OSF site was selected due to
boundary restrictions and the location of the Cave Springs Formation outcroppings. In-pit storage of overburden and low-grade M5 material can commence as soon as sufficient
pit floor space is available, and the orientation of the advancing mining face becomes conducive to in-pit backfilling. The initial South OSF with an estimated three years
of capacity was designed to a relative accuracy and confidence level consistent with a Feasibility Study, whereas the North OSF, and In-Pit Overburden Backfill (IOB) designs were performed to a relative accuracy and confidence level consistent with
|
|
APPENDIX D: JORC Code, 2012 Edition - Table 1
|
|
|
Criteria
|
JORC Code 2012 Explanation
|
Commentary
|
|||||
|
|
|
|
a Pre-Feasibility Study. To date, no additional issues have been identified that would materially impact the proposed
locations of the South and North OSFs.
• A tail gas scrubber will be installed on the SAP to remove remaining sulphur dioxide (SO2) from the gas stream to make certain that environmental emissions
requirements are met.
• Process residue will be stacked in a Spent Ore Storage Facility (SOSF)
located 1.6 km south of the processing plant that has been designed to store a composite consisting of leached ore from the vats plus sulphate salts generated in the
evaporation and crystallisation circuits. This material is suitable for dry stacking, so there is no need for a conventional tailings dam. A double-sided, textured
high-density polyethylene (HDPE) geomembrane liner will provide containment and will be protected by a granular layer to facilitate
long-term drainage. The SOSF engineering has been completed to a detailed design level with drawings issued for construction as this level of engineering completion is
required by regulatory authorities and will be submitted as part of the overall permitting process. To date, no issues have been identified that would materially impact the
proposed location of the SOSF.
|
||||
|
|
Infrastructure
|
|
• The existence of appropriate infrastructure: availability of land for plant
development, power, water, transportation (particularly for bulk commodities), labour, accommodation; or the ease with which the infrastructure can be provided or
accessed.
|
|
• The Project is currently in the development stage, and no site-specific infrastructure has been built to date.
• Sufficient land exists to locate all proposed infrastructure required for the Project, including haul roads, ground
anchoring highwall support structures, Overburden Storage Facilities (OSFs), Spent Ore Storage Facility (SOSF), Contact Water Ponds (CWPs), the processing plant (which includes processing structures and facilities),
maintenance facilities, warehousing, shipping and receiving, fuel island, Sulphuric Acid Plant (SAP), Steam Turbine Generator (STG) responsible for power generation/transmission, and administrative buildings.
• The STG will generate 42 mega-Watts (‘MW’) of electricity using steam generated by the waste heat boiler in the SAP.
The STG power generation will exceed the power requirements to run the entire facility and will be separate from the Nevada state power grid
|
|
APPENDIX D: JORC Code, 2012 Edition - Table 1
|
|
|
Criteria
|
JORC Code 2012 Explanation
|
Commentary
|
|||||
|
Infrastructure
(con’t)
|
.
|
|
• Two backup diesel generators will also be available to provide black-start capability and provide power to essential
systems should the STG be down. The Project has been designed to be an environmentally sensitive operation with low water usage and water recycling and reuse where
possible. There is sufficient water available to meet processing and dust control requirements.
• For geotechnical stability the use of a system of ground anchors, primary located on the western wall will be
utilized to stabilize the slopes where low strength material could not be removed in preservation of the Tiehm’s Buckwheat populations and their proximity to the quarry
highwall. A constructability review of the recommended structural support has been completed to assure the feasibility of the design, availability of contractors to perform
the work and supply chain availability from 3 different source.
• The Rhyolite Ridge site is currently accessed from the cities of Reno and Las Vegas, Nevada from Nevada Stage
Highway 264 and the unpaved Hot Ditch and Cave Springs county roads. Ioneer is working with Esmeralda County officials in developing a traffic management plan that will
integrate new access roads to the facility with the existing county roads in the area. Consideration will be given to make certain that the safety of all users of county
roads is not compromised through development of the Project.
• Nevada is considered one of the world’s most favourable and stable mining jurisdictions, and there is a high degree
of experienced, competent, and skilled personnel available to meet workforce requirements for the Project.
A workforce camp is not foreseen for use in housing Owner personnel. Ioneer staff conducted a study of local housing options, Local housing,
apartments, motels, and recreational vehicle (RV) sites were located, evaluated, and quantified. Only a very limited amount of
accommodation is available in the nearest residential next closest available accommodations are in the city of Tonopah, Nevada, which is roughly 1.5 hours to the Project
site. A few inactive RV sites were located near the site, but re-activation potential was not evaluated, and these sites are limited to 25 by regulation due to needs for
infrastructure for larger RV areas. Due to the potential areas, the small town of Dyer, Nevada, and Bishop, California. The need to develop housing, Ioneer may contribute
individual housing support, which is included in the operating costs estimate for those employees hired before turnover. In addition, Ioneer
|
|
APPENDIX D: JORC Code, 2012 Edition - Table 1
|
|
|
Criteria
|
JORC Code 2012 Explanation
|
Commentary
|
|||||
|
|
|
|
|
may invest over two years in local housing infrastructure under the assumption that roughly 20% of the Ioneer workforce will be local hires
and an additional 20% of employees will be drive-in/drive-out.
• A project execution plan has been developed based on an Engineering, Procurement, and Construction Management (EPCM)delivery framework. Project execution is based on continuing with the same companies (Fluor, SNC-Lavalin, MECS, Kemetco, KCA,
FLSmidth, Veolia, EM Strategies, NewFields, and Trinity) that completed the FS to maintain continuity and retain project knowledge. In addition to new service providers
like IMC & GLA. Construction of processing plant, SAP, and SOSF facilities is planned to be facilitated by various consultants and contractors with Ioneer oversight,
whereas construction of the mine haul roads and initial box-cut is planned to be performed by Ioneer.
|
|||
|
Costs
|
• The derivation of, or assumptions made, regarding projected capital costs in the
study.
|
• The capital cost estimate is based on work completed to update the 2020FS to an AACE Class 2 capital cost estimate
with an accuracy range of -10%/+15% to produce an updated 2024FS, where engineering design is ~70% complete. The estimate reflects the Project’s EPCM execution strategy and
baseline project schedule.
• Capital costs for various Work Breakdown Structure (WBS) codes were
independently developed by third parties and consolidated by Fluor. More than 1,500 deliverables were produced during the 2024FS to support the capital costs estimate.
• The capital cost estimate covers the period from 2024FS completion to commissioning and is reported in first Quarter
(Q1) 2024 real US dollars without allowances for escalation or currency fluctuation. The estimate does not include sunk costs.
• A contingency of 10% was applied to the capital costs estimate using a Monte Carlo simulation to achieve a P65
(i.e., the probability at the 65th percentile) confidence level for the estimate and P50 for schedule according to the model and ranges established by Fluor. The estimate,
including contingency, has an expected accuracy range of +15%/-10% as per the basis of estimate. The capital schedule for mining equipment includes new equipment required
to meet production targets of the 96-year mine plan and replacement equipment based on useful service lives
|
|
APPENDIX D: JORC Code, 2012 Edition - Table 1
|
|
|
Criteria
|
JORC Code 2012 Explanation
|
Commentary
|
|||||
|
• provided by the vendor or based on other industry standards. Rebuilds have also been included in the capital
schedule at regular intervals based on rebuild lives provided by the vendor or other industry standards.
• Capital costs of mining equipment were derived from quotes received in April 2024 from an equipment vendor
with offices in Nevada. Taxes for the AHTs were estimated using a tax rate of 6.85%, but freight and assembly costs were assumed to remain unchanged from the
conventional haul truck.
• The capital cost estimates are not 100% equity based. Capital cost estimates for new and replacement mining
equipment assume that 80% of the total equipment cost inclusive of the base cost, taxes, freight, and assembly would be financed and included in the operating costs
estimate based on terms provided by the equipment manufacturer. The 20% down payment for equipment was included in the capital costs estimate.
Capital costs for the haul roads, OSFs, SOSF, CWPs, the processing plant (which includes processing structures and facilities),
maintenance facilities, warehousing, shipping and receiving, fuel island, SAP, STG, and administrative buildings were estimated from material take-off (MTO) quantities developed for the 2024FS by various third parties. Each of the above have an engineering design that is at least
30% complete with some items with a level of design maturity completed to detailed engineering and issued for construction.
|
|||||||
|
• The methodology used to estimate operating costs
|
• Operating costs are based on Ioneer’s basis of operating cost estimates dated March 2024 and their latest
operating cost estimate model.
• Sustaining capital costs have been included in the operating costs estimate.
• Operating cost estimates for the quarry and processing plant were developed by Ioneer and Fluor and
consolidated by Fluor for input into the cash flow model.
• Direct mine operating costs are zero-based and developed from first- principles from the mine plan production
statistics using methodologies consistent with a 2025FS. Except for blasting and preventative maintenance, all production tasks are assumed to be self-performed by
the owner (Ioneer). Mine mobile equipment will be monitored and
|
|
APPENDIX D: JORC Code, 2012 Edition - Table 1
|
|
|
Criteria
|
JORC Code 2012 Explanation
|
Commentary
|
|||||
|
|
• maintained through a Master Service Agreement with Empire Southwest the Caterpillar dealership. The
contract includes cost of service, management, supplies, and parts management. Operation costs and component sustainable capital costs were based on a firm bid.
• Blasting is assumed to be performed by a qualified subcontractor.
• Hourly operating costs for equipment were based on vendor guidelines and supported by budgetary quotes for
consumable items from local vendors, including fuel, diesel exhaust fluid, lubricants and greases, rubber tyres, ground-engaging tools, and wear parts. Hourly
undercarriage and general repair and replacement parts were estimated from a third-party cost database and escalated to 2019 US dollars.
• Annual costs for an integrated Fleet Management System (FMS) have been
included based on a budgetary quote provided by a local vendor. Based on information provided by the equipment vendor, an annual license fee was applied to each AHT
required to meet production in a given year.
• The mine was assumed to operate two-shifts-per-day, 365 days per year with no scheduled off days for the first
15 years of production. The mine was then assumed to transition to a one-shift-per-day basis from Year 51 through the remaining mine life. Labour wages are fully
burdened and were developed based on a survey of local mining wages.
• Costs for the “License Team” and Caterpillar “Run Team” personnel required to remotely monitor the AHTs each
shift and make sure they are performing to specifications have been included in the mine operating costs.
• Mining equipment financing costs are included in the operating costs. For the purposes of the estimate, 80% of
the total equipment cost inclusive of the base cost, taxes, freight, and assembly are assumed to be financed based on terms provided by the equipment manufacturer.
The 20% down payment was included in the capital costs estimate.
• Processing costs spent ore removal and SOSF costs, SAP costs, and other indirect operating costs were
estimated by Fluor and
|
|
APPENDIX D: JORC Code, 2012 Edition - Table 1
|
|
|
Criteria
|
JORC Code 2012 Explanation
|
Commentary
|
|||||
|
|
• SNC Lavalin from first principles using the ore production schedule from the mine plan. These costs were
estimated using methodologies consistent with a 2020FS and included quoted firm pricing from major reagent suppliers, quoted freight costs from transport firms, and
workforce costs based on industry norms for salary and wage data within the region consistent with the mine workforce costs. Reasonable scenarios for other
requirements such as outsourced services with quoted rates or estimates were also included. Quantities of reagents were established during pilot testing with ore.
|
||||||
|
• Allowances made for the content of deleterious elements.
|
• No penalties for deleterious elements were forecast in the economic analysis.
|
||||||
|
• The source of exchange rates used in the study.
|
• Exchange rates not applicable
|
||||||
|
• Derivation of transportation charges.
|
• Transportation charges for all significant materials were derived from quotes. Historical data were used for
some minor charges.
|
||||||
|
• The basis for forecasting or source of treatment and refining charges,
penalties for failure to meet
• specification, etc.
|
• Not applicable.
|
||||||
|
• The allowances made for royalties payable, both Government and private.
|
• Net proceeds (in the form of taxes) were included in the economic analysis. No royalties are paid to private
organisations or individuals.
|
||||||
|
• The derivation of, or assumptions made regarding revenue factors including
head grade, metal or commodity price(s) exchange rates, transportation and treatment charges, penalties, net smelter returns, etc.
|
• The revenue factors used in the economic analysis were based on work performed for the 2020FS and updated in
Q1 2025.
• Annual saleable lithium carbonate, lithium hydroxide, and boric acid tonnages reflect the head grade dictated
by the mine plan and anticipated metallurgical recoveries estimated from test work.
• Price forecasts for lithium carbonate and lithium hydroxide were obtained from a range of market research
companies, investment banks, and other reputable sources. For the financial model price forecasts rather than the current or historical prices were used. This
approach allows to better account for future market conditions and potential price trends, providing a more accurate financial assessment.
• The offtake agreement prices of technical-grade lithium carbonate are based on the delivered price formula
using the battery-grade lithium hydroxide index price from Benchmark
|
|
APPENDIX D: JORC Code, 2012 Edition - Table 1
|
|
|
Criteria
|
JORC Code 2012 Explanation
|
Commentary
|
|||||
|
•
|
Mineral Intelligence (Q1, 2025) battery-grade lithium hydroxide price forecast. The offtake price formulas are the agreed price
index minus the agreed conversion cost and discount, the agreed price index minus the agreed discount minus the agreed conversion cost, or the agreed price index
minus the conversion cost.
|
||||||
|
|
• The derivation of, or assumptions made regarding revenue factors
including head grade, metal or commodity price(s) exchange rates, transportation and treatment charges, penalties, net smelter returns, etc. (Con’t)
|
• The estimated price for boric acid was based on an analysis by Ioneer’s Sales and
Marketing team using 1) Ioneer current contracts, and 2) based on internal analysis of historical prices and volumes extracted from Datamyne’s trade data, import
prices and volumes from Japan, South Korea, Southeast Asia, and China, customers and distributors’ interviews, China Boron Association data, and Internal market
equilibrium assumptions.
• No exchange rates were applied to metal or commodity prices. All commodity prices are
transacted and stated in US Dollars.
• Transportation charges for all significant materials were derived from quotes in Q1
2025. Historical data were used for some minor charges not derived from quotes.
• No penalties were forecast in the economic analysis.
|
|||||
|
The derivation of assumptions made of metal or commodity price(s), for the principal metals, minerals and co-products.
|
• The revenue factors used in the economic analysis were based on work performed for the 2020FS and updated
in Q1 2025.
• Price forecasts for lithium carbonate and lithium hydroxide were obtained from a range of market research
companies, investment banks, and other reputable sources. For the financial model price forecasts rather than the current or historic prices were used. This
allows to better account for future market conditions and potential price trends, providing a more accurate financial assessment.
|
||||||
|
|
Revenue
factors
|
|
• The offtake agreement prices of lithium chemicals are based on the delivered
price formula using the battery-grade lithium hydroxide index price from Benchmark Mineral Q1 2025) battery-grade lithium hydroxide price forecast. The
offtake price formulas are the agreed price index minus the agreed conversion cost and minus discount, or the agreed price index minus the agreed discount
minus the agreed conversion cost, or the agreed price index minus conversion cost. In year three Ioneer will have completed construction of a Lithium
Hydroxide facility at site allowing the battery grade lithium hydroxide price to be realized thus eliminating the conversion cost.
• The estimated price for boric acid used in the economic analysis was
|
|
APPENDIX D: JORC Code, 2012 Edition - Table 1
|
|
|
Criteria
|
JORC Code 2012 Explanation
|
Commentary
|
|||||
| |
based on an analysis by Ioneer’s Sales and Marketing team using 1) Ioneer current contracts, and 2) based on
internal analysis of historical prices and volumes extracted from Datamyne’s trade data, import prices and volumes from Japan, South Korea, Southeast Asia, and
China, customers and distributors interviews, China Boron Association data, and Internal market equilibrium assumptions.
|
||||||
|
Market
assessment
|
• The demand, supply and stock situation for the particular commodity,
consumption trends and factors likely to affect supply and demand into the future.
|
• Market demand and supply trends for lithium products and borates were completed by
Ioneer’s Sales & Marketing team.
• Ioneer’s efforts were led by Yoshio Nagai, Ioneer’s Vice President of Sales &
Marketing. Mr. Nagai has more than 30 years of experience in the chemical and mining industry sales and marketing, most recently as Sales Vice President of Rio Tinto
Minerals, accountable for borates, salt, and talc products in Asia and the USA.
• Lithium
• Lithium extraction produces lithium carbonate, lithium hydroxide, lithium chloride, butyl
lithium, and lithium metal. Lithium carbonate can be produced with different qualities, such as industrial grade (typically ≥98.5% purity), technical grade (≥99%
purity), and battery grade (≥99.5% purity). Some industrial-grade lithium carbonate (i.e., from brines in China) has a lower purity than 95%. Industrial-grade and
technical-grade lithium carbonate are typically used for glass, fluxing agents, ceramics, and lubricants, and feedstock to produce various battery-grade lithium
products. Battery-grade lithium carbonate and hydroxide are used to produce lithium-ion battery cathodes.
• Lithium Supply Demand Balance -The current market demand for lithium is substantial,
driven primarily by the increasing adoption of electric vehicles (EVs) and the growing use of lithium-ion batteries in various applications, including consumer
electronics and energy storage systems. While the lithium market is experiencing price pressures due to the market oversupply, the market is forecasted to enter a
market deficit from 2030, and the long-term outlook remains positive, driven by the ongoing shift towards electric mobility and renewable energy storage solutions.
• Lithium demand will increase from 1.45 Mt in 2025 to 2.445 Mt in 2030 and 4.37 Mt in 2040
(Wood Mackenzie, Q1 2025).
• According to Wood Mackenzie, regarding battery chemistry, Lithium Iron Phosphate (LFP) is
projected to experience strong growth until 2031, after which its growth rate is expected to decelerate. Concurrently, high-
|
|
APPENDIX D: JORC Code, 2012 Edition - Table 1
|
|
|
Criteria
|
JORC Code 2012 Explanation
|
Commentary
|
|||||
|
|
|
nickel cathodes are forecast to maintain robust demand, surpassing LFP by 2035. This shift reflects
the saturation of the Chinese market and the expansion of Western markets, which tend to favour high-nickel chemistries. Consequently, battery-grade lithium
carbonate is expected to dominate demand until 2039. Technical-grade lithium chemical demand is projected to grow in line with broader macroeconomic trends.
• Longterm, the most significant growth is expected in
battery-grade lithium hydroxide. It is forecasted to increase by a CAGR of 9.46%, reaching 969 kt by 2030 and 2.09 Mt by 2040. It is driven by the
increased adoption of medium to higher-density cathodes, providing higher density and a more extended range.
Battery-grade lithium carbonate is expected to grow at a CAGR of 6.7%, reaching 1.26 Mt by 2030 and 1.97 Mt
by 2040. This growth will be driven by the global market adoption of lower-density, less expensive lithium iron phosphate (LFP) cathodes.
• According to Wood Mackenzie’s “all-case scenario,” the battery-grade lithium
chemicals market is expected to be oversupplied over the next four years, with the surplus peaking in 2026/2027 and then a shortage starting in 2030 (Wood
Mackenzie, Q1 2025). In contrast, Benchmark Mineral Intelligence (Q1 2025) forecasts a market surplus from 2025 to 2028 and a deficit beginning in 2029. It is
essential to consider the new supply risks in market balance forecasting.
• Boric acid
• Large-scale borate commercial production is confined to five main areas of the world: Turkey, the
southwest US, the Andes belt of South America, Northeast China, and the eastern region of Russia. The borates market is supplied principally by two major
players, Eti Maden (Eti) and Rio Tinto, though there are other smaller players. The term “borates” describes a
commercial source of chemical boric oxide (B2O3) in the form of sodium borate compounds, minerals, refined (i.e., boric acid), calcined, or
specialty forms of borate.
• Borate is typically refined, but some producers sell some of the raw or concentrated minerals as a
substitute for the refined product at a lower price.
• Borates have more than 300 applications, including specialty glasses (i.e., borosilicate and TFT
glasses), fiberglass, ceramics, insulation, agricultural, industrial/chemical, pesticides, cleaning products, cosmetics, and pharmaceuticals, etc.
|
|
APPENDIX D: JORC Code, 2012 Edition - Table 1
|
|
|
Criteria
|
JORC Code 2012 Explanation
|
Commentary
|
|||||
|
• Boric Acid Supply-Demand Balance
• The 2024 boric acid demand was estimated at 1,138 ktpy at a 78% utilization
rate of the nameplate capacity of 1,445 ktpy, with a historic industry capacity utilization rate of 85%. Demand
is expected to grow at a minimum of 3% (compound annual growth rate, CAGR) through 2040. The growth of borate demand is relative to the growth of global
gross domestic product (GDP).
• The utilization rate is expected to increase through 2040 and exceed
historic capacity utilization of 85%, reaching 86% by 2033, and 100% by 2037. Additional boric acid will be required from 2033, when the utilization rate
exceeds 85%.
• Boric acid demand may fluctuate as customers switch between various borate products, considering
price, product availability, and technology developments.
|
|||||||
|
|
• A customer and competitor analysis along with the identification
of likely market windows for the product.
|
• Customer and competitor analyses were performed as part of the 2020FS and
updates in Q1 2025.
• Lithium
o The major producer of lithium concentrates and brine, such as Albemarle,
Sociedad Química y Minera de Chile (SQM), and Ganfeng Lithium, continue to promote production capacity expansion (Wood Mackenzie, Q1 2025). Albemarle is
undertaking an expansion project to increase its production capacity from 184.1 ktpy in 2025 to 282.8 ktpy in 2035; however, it is delaying and adjusting
production due to the existing oversupply market. SQM will increase its production capacity from 242.8 ktpy in 2025 to 274.4 ktpy in 2035. The largest
Chinese producer, Ganfeng Lithium, is also expected to increase its production capacity from 190.9 ktpy in 2025 to 309.7 ktpy in 2035, surpassing
Albemarle and becoming the largest lithium supplier.
o Existing producers have experienced extreme price volatility over the past
few years due to oversupply and new production entering the market, which will peak in 2026 to 2027. The current price is below many producers cost and
Wood Mackenzie expects minor price correction in second half of 2025.
o Lithium prices are in cyclical low, and as a result, some existing spodumene producers have
temporarily or permanently been
|
|
|
APPENDIX D: JORC Code, 2012 Edition - Table 1
|
|
|
Criteria
|
JORC Code 2012 Explanation
|
Commentary
|
|||||
|
|
o shut down, and new greenfield producers are delaying or suspending the project. This
will impact the market long-term, as demand grow through decarbonization efforts, and new supplies takes time to build, the deficit market impact will be larger.
o Lithium prices are anticipated to rebound when the market enters the deficit from
2030. The offtake agreements have been secured with four customers in the lithium-ion battery sector, with diversified customers in various industrial sectors, such
as cathode manufacturers, battery makers, and OEMs who will further process the carbonate and convert it to battery-grade lithium.
o A lithium compound operating cost curve was developed as part of the 2020FS, updated
in Q1 2025. If Ioneer can produce as anticipated, all-in cost per tonne, it will be at the competitive end of the cost curve.
• Boric acid
• The borates market is supplied principally by two major players, Eti and Rio Tinto,
though other smaller players exist. Eti, a Turkish state-owned mining and chemicals company, is the world’s largest borate supplier by market share and Proven Ore
Reserves and holds 72% of worldwide borate reserves. Rio Tinto has a large borate product portfolio but has not announced any plans to expand borate production.
However, they have built a pilot plant to produce lithium from mine waste with a plan to invest additional money to
produce a small amount of borate as a by-product of lithium production if the associated pilot production of boric acid is successful, but with no progress update.
MCC Russian Bor CJSC (Bor) in south-eastern Russia supplies 6% of boric acid demand and is regarded as the best quality in terms of impurities. However, Bor has
historically struggled with production due to financial and employee relationship issues and has faced sanctions from Western countries. In addition to Rhyolite
Ridge, five other boron greenfield projects worldwide are in various exploration and engineering development stages. These greenfield projects are the Rio Tinto
Jadar project, which was stopped due to local protests, the 5E/Fort Cady project in California, the Magdalena Basin project in Mexico, the Pobrdje project in
Serbia, and some exploration work in the Balkans. The Fort Cady project is expected to commence production in 2028, subject to financing, while production of the
other projects is delayed or cancelled.
|
|
APPENDIX D: JORC Code, 2012 Edition - Table 1
|
|
|
Criteria
|
JORC Code 2012 Explanation
|
Commentary
|
|||||
|
Price and volume forecasts and the basis for these forecasts.
|
• Lithium
• Consensus price (in real terms) and volume forecasts for lithium carbonate and
lithium hydroxide are based on Q1 2025 Benchmark Mineral Intelligence Lithium report, an internationally recognized research organization that have focused on
lithium supply and demand studies, providing short and long-term forecasts. Suppliers and customers use their information/data sets to make pricing decisions.
• Price forecasts rather than the current or historic prices were used. This approach
allows to better account for future market conditions and potential price trends, providing a more accurate and forward-looking financial assessment.
• The Ioneer prices of technical-grade lithium carbonate are based on the delivered
price formula using the battery-grade lithium hydroxide index price.
• Benchmark Mineral Intelligences’ price forecast for:
• battery-grade lithium hydroxide in real terms ranges from US$9,928/t to US$23,000/t
between 2025 and 2040. The average price from 2025 to 2040 is US$21,099/t.
• Lithium demand will increase from 1.45 Mt in 2025 to 2.45 Mt in 2030 and 4.37 Mt in 2040
(Wood Mackenzie, Q1 2025).
• According to Wood Mackenzie, regarding battery chemistry, Lithium Iron Phosphate (LFP)
is projected to experience strong growth until 2031, after which its growth rate is expected to decelerate. Concurrently, high-nickel cathodes are forecast to
maintain robust demand, surpassing LFP by 2035. This shift reflects the saturation of the Chinese market and the expansion of Western markets, which tend to favour
high-nickel chemistries. Consequently, battery-grade lithium carbonate is expected to dominate demand until 2039. Technical-grade lithium chemical demand is
projected to grow in line with broader macroeconomic trends.
• Longterm, the most significant growth is expected in battery-grade lithium hydroxide.
It is forecasted to increase by a CAGR of 9.46%,
|
|
APPENDIX D: JORC Code, 2012 Edition - Table 1
|
|
|
Criteria
|
JORC Code 2012 Explanation
|
Commentary
|
|||||
|
|
o reaching 969 kt by 2030 and 2.09 Mt by 2040, driven by the increased adoption of medium
to higher-density cathodes, providing higher density and longer range
o Battery-grade lithium carbonate is expected to grow at a CAGR of 6.7%, reaching 1.26
Mt by 2030 and 1.97 Mt by 2040. This growth will be driven by the global market adoption of lower-density, less expensive lithium iron phosphate (LFP) cathodes.
• Boric acid
o The boric acid market is opaque, and there are no reliable market intelligence
providers, therefore requiring expertise. In line with major borate supplier Rio Tinto Minerals, Ioneer boric acid price forecasts were based on internal analysis
of historical prices and volumes extracted from Datamyne’s trade data, import prices, and volumes from Japan, South Korea, Southeast Asia, and China, customers and
dealers’ interviews, China Boron Association data, and Internal market equilibrium assumptions.
o Q1 2025 delivered boric acid price (CIF and FOB West Coast) ranged from US$900 -
$1100/t, and Asian prices from US$835 - $1,180/t.
o Price arbitration exists between regions, and by customer size results in wider
price ranges.
o Ioneer’s price forecast is based on demand and supply assumptions.
o Trend analysis was used as the methodology for price forecasting. The price forecast
ranges from US$830/t to US$1,400/t between 2025 and 2040, with an average price of US$1,172.78/t.
o The 2024 boric acid demand was estimated at 1,138 ktpy at a 78% utilization rate of
the nameplate capacity of 1,455 ktpy, with a historic industry capacity utilization rate of 85%. Demand is expected to
grow at a minimum of 3% (compound annual growth rate, CAGR) through 2040. The growth of borate demand is relative to the growth of global gross domestic product
(GDP).
o The utilization rate is expected to increase
through 2040 and exceed historic capacity utilization of 85%, reaching 86% by 2033, and 100% by 2037.
|
|
APPENDIX D: JORC Code, 2012 Edition - Table 1
|
|
|
Criteria
|
JORC Code 2012 Explanation
|
Commentary
|
|||||
|
|
• Additional boric acid will be required from 2033, when the utilization rate reaches 86%,
exceeding historic capacity rate of 85%.
|
||||||
|
• For industrial minerals the customer specification, testing and acceptance requirements prior to a supply contract.
|
• Lithium carbonate: Ioneer technical grade specification is approved under all four
offtake agreements.
• Boric acid: Ioneer technical grade boric acid specification is of the highest quality,
comparable to leading quality supplier Rio Tinto.
• Received pre-approval based on pilot production samples from major customers. Major
customers must undergo a large-scale commercial production trial for final product approval. Note that some customers only require lab tests to confirm the
specifications for product approval.
|
||||||
|
• The inputs to the economic analysis to produce the net present value
(NPV) in the study, the source and confidence of these economic inputs including estimated inflation, discount rate, etc.
|
• The production schedule and associated capital and operating costs estimates were
analyzed using an economic model developed by Ioneer. Inputs into the economic analysis include the capital and operating costs, saleable lithium carbonate, and
boric acid tonnages, commodity price and revenue forecasts, and transportation and management costs. An AACE Class 2 cost estimate with an accuracy range of -10% /
+15% was produced for the 2024FS, and engineering design is ~70% complete. The estimate reflects the Project’s EPCM execution strategy and baseline project
schedule. An 8% discount rate was applied to estimate Project Net Present Value (NPV).
|
|
APPENDIX D: JORC Code, 2012 Edition - Table 1
|
|
|
|
Criteria |
|
JORC Code 2012 Explanation |
|
Commentary |
|
||||
|
|
|
|
|
|
|
|
||||
|
|
|
|
• NPV ranges and sensitivity to variations in the significant assumptions and inputs.
|
|
Sensitivity Factor
|
NPV with
(-15%)
Adjustment
Factor (US$
Millions)
|
NPV with
(+15%)
Adjustment
Factor (US$
Millions)
|
|
||
|
|
|
|
|
Lithium Grade
|
1,541
|
2,914
|
|
|||
|
|
|
|
|
Lithium Recovery
|
1,541
|
2,914
|
|
|||
|
|
|
|
|
Lithium Carbonate Price
|
1,549
|
2,860
|
|
|||
|
|
|
|
|
Capital Costs
|
2,509
|
1,965
|
|
|||
|
|
|
|
|
Operating Costs
|
2,559
|
1,926
|
|
|||
|
|
|
|
|
Boric Acid Price
|
2,077
|
2.398
|
|
|||
|
|
|
|
|
Boron Grade
|
2,093
|
2,382
|
|
|||
|
|
|
|
|
Boric Acid Recovery
|
2,093
|
2,382
|
|
|||
|
|
|
|
|
Labour
|
2,278
|
2,197
|
|
|||
|
|
Value (NPV) in real dollars was calculated at an applied 8% discount rate. The outcomes of this analysis are shown in the
table below in order of highest to lowest sensitivity.
• A sensitivity analysis on the applied discount rate used to estimate
Project NPV below was also performed. The results of this analysis are summarised in the table below.
|
|||||||||
|
Discount
Rate (%)
|
NPV (US $
Millions)
|
|||||||||
|
12%
|
816 | |||||||||
|
11%
|
1,065 | |||||||||
|
10%
|
1,372
|
|||||||||
|
9%
|
1,755 | |||||||||
|
8%
|
2,237 | |||||||||
|
7%
|
2,856 | |||||||||
|
6%
|
3,664 | |||||||||
|
APPENDIX D: JORC Code, 2012 Edition - Table 1
|
|
|
Criteria
|
JORC Code 2012 Explanation
|
Commentary
|
|||||
|
Economic
|
•
|
• Based on the above sensitivity factors, the Project is most sensitive to increases in discount rate and
least sensitive to changes in labour cost.
|
|||||
|
Social
|
• The status of agreements with key stakeholders and matters leading to social licence to operate.
|
• The Project has been evaluated under an EIS, completed by a BLM-approved third-party contractor selected by
Ioneer. Public comment periods were required as part of the EIS process and taken into consideration in the final EIS published in September 2024. A Record of
Decision was issued by the BLM in October 2024.
• Ioneer executed a Development Agreement with Esmeralda County (Nevada) in April 2025 to provide funding for
expanded public services, infrastructure upgrades, and establishes a framework for continued collaboration.
• Ioneer has entered into three different water rights lease, purchase, and options agreements with a local
corporation and LLC (limited liability corporation) along with local landowners that grant rights for water usage, primarily for irrigation.
|
|||||
|
Other
|
• To the extent relevant, the impact of the following on the project and/or on the estimation and classification of the
• Ore Reserves:
|
• No Comment
|
|||||
|
• Any identified material naturally occurring risks.
|
• See the “Mining factors or assumptions” subsection above for a discussion on the risks associated with the
M5a geological unit.
• No hydrogeological data was incorporated into the geotechnical analyses of the underlying geology, pit
configurations, or pit design parameters. As such, GLA’s geotechnical analyses were completed under the assumption that the underlying geology and pit walls would
be dry. If the pit walls cannot be fully dewatered, then the outcomes of pit slope stability analyses may change and could result in a decrease of the maximum
allowable inter-ramp angle used to design the pit walls, thereby increasing strip ratio and associated overburden tonnages. If the M5 material that is stockpiled
within the OSFs is above 18% moisture saturation by weight, then the Engineer should be contacted to review and provide recommendations for design or material
handling revisions. Actions that can be performed to remedy high moisture M5 are: spreading and drying prior to stockpiling; stacking and sequencing revisions;
additional geotechnical testing and analyses to support higher moisture contents;
|
|
APPENDIX D: JORC Code, 2012 Edition - Table 1
|
|
|
Criteria
|
JORC Code 2012 Explanation
|
Commentary
|
|||||
|
|
or design revision to achieve geotechnical stability (which may result in reduced storage capacity of the OSFs).
• The Project area is in a moderately high seismic zone as determined by the NewFields Seismic Hazard
Assessment prepared for the SOSF. The pit wall slope stability analyses have been performed assuming from a seismic return period of 475-years as determined by the
USGS. However, there are always a risk of larger earthquakes occurring. A 475-year event has a probability of annual exceedance of 2%. As the probability of
recurrence is increased (e.g., from 475 years to 2,475 years) the probability decreases while intensity increases. Typically, pit walls are designed to remain
stable during the 475-year earthquake. A larger earthquake than the 475-year event could cause pit wall failure in areas of the quarry where there is no in-pit
backfill stacked against the pit walls.
• The OSF slope stability analysis has been performed assuming an earthquake with a peak ground acceleration of
0.31g, resulting from a seismic return period of 475-years as determined by NewFields. However, there is always a risk of larger earthquakes occurring. A 475-year
event has a probability of annual exceedance of 2%. As the probability of recurrence is increased (e.g., from 475 years to 2,475 years) the probability decreases
while intensity increases. Dumps are typically designed to remain stable during the 475-year earthquake an earthquake with a peak ground acceleration of 0.25g,
resulting The Project area is in an area with low annual precipitation where most precipitation is obtained through short duration monsoon storms resulting in flash
floods. Permanent surface water controls around the OSFs, SOSF, and quarry have been designed to convey the 500-year, 24-hour peak design storm event. Haul roads
outside of permanent facilities risk being washed out during minor storm events that could cause a short-term disruption in ore delivery to the processing plant.
|
|
APPENDIX D: JORC Code, 2012 Edition - Table 1
|
|
|
Criteria
|
JORC Code 2012 Explanation
|
Commentary
|
|||||
|
• The status of material legal agreements and
marketing arrangements.
|
• Ioneer currently holds a Water Rights Lease Agreement, an Option and Purchase Agreement, and an Option for
Water Rights Lease. These permits are for non-mining and milling purposes. The Water Rights Lease Agreement and the Option and Purchase Agreement allow for
permitted use of water for irrigation. The Option for Water Rights Lease grants the rights to lease water for irrigation, stockwater, and commercial use on an
annual basis with the option to increase leased water rights.
• Ioneer has signed offtake and sales distribution company for lithium and boric acid as follows.
Lithium agreements
- EcoPro Innovation Co. Ltd.’s offtake agreement dated June 30th, 2021, and volume amendment agreement dated February 14, 2022.
- Ford Motor Company offtake agreement dated July 21, 2022.
- Prime Planet Energy & Solutions, Inc. offtake agreement dated August 1, 2022.
- Dragonfly Energy Corporation offtake agreement dated May 9, 2023.
Boric acid agreements
- Dalian Jinma Boron Technology Group Co. Ltd offtake agreement dated December 16,
2019.
- Iwatani Corporation sales/distributor agreement dated July 15, 2020.
- Kintatamani Resources Pte Ltd sales/distributor agreement dated April 20, 2020.
- Boron Bazar Ltd sales/distributor agreement dated April 20, 2020.
- Ioneer plans to secure additional boric acid distributor sales agreements in North
America following Financial Investment Decision (FID) to increase sales.
- Ioneer’s contracts embed a volume adjustment clause to mitigate increased or
decreased volume risk. Even in oversupplied markets, Ioneer can increase sales across all contracts through market intelligence and existing customer relationships.
|
||||||
|
APPENDIX D: JORC Code, 2012 Edition - Table 1
|
|
|
Criteria
|
JORC Code 2012 Explanation
|
Commentary
|
|||||
|
• The status of governmental agreements and
approvals critical to the viability of the project, such as mineral tenement status, and government and statutory approvals. There must be reasonable grounds to
expect that all necessary Government approvals will be received within the timeframes anticipated in the Pre-Feasibility or Feasibility study. Highlight and
discuss the materiality of
any unresolved matter that is dependent on a third party on which extraction of the reserve is contingent.
|
Please refer to the “Environmental” subsection for a discussion on the status of government agreements and
approvals for permits.
|
||||||
|
The basis for the classification of the Ore Reserves into varying confidence categories.
|
• The Ore Reserves estimate for the Project is reported in accordance with the “Australian Code for Reporting
of Exploration Results, Mineral Resources and Ore Reserves” as prepared by the Joint Ore Reserves Committee (the JORC Code, 2012
Edition).
• Only Measured and Indicated Mineral Resources within the final 78 year pit design with the above Modifying
Factors applied have been included in the Ore Reserves and classified into Proved and Probable categories. Ore Reserves within the Measured Mineral Resource
classification have been categorised as Proved Ore Reserves, whereas Ore Reserves within the Indicated Mineral Resource classification have been categorised as
Probable Ore Reserves.
• The Ore Reserves are stated as dry tonnes of ore delivered at the processing plant ore stockpile.
|
||||||
|
Classification
|
• Whether the result appropriately reflects the Competent Person’s view of the deposit.
|
• The Ore Reserves consist of 34.5% Proved Reserve
• The Competent Person is satisfied that the stated Ore Reserves classification reflects the outcome of the
technical and economic studies performed as part of the 2025AFS.
|
|||||
|
• The proportion of Probable Ore Reserves that have been derived from Measured Mineral Resources (if any).
|
• No Probable Reserves have been derived from Measured Mineral Resources.
|
|
APPENDIX D: JORC Code, 2012 Edition - Table 1
|
|
|
Criteria
|
JORC Code 2012 Explanation
|
Commentary
|
|||||
|
Audits or reviews
|
The results of any audits or reviews of Ore Reserve estimates
|
• Not applicable.
|
|||||
|
Discussion of relative accuracy/ confidence
|
Where appropriate a statement of the relative accuracy and confidence level in the Ore Reserve estimate using
an approach or procedure deemed appropriate by the Competent Person. For example, the application of statistical or geostatistical procedures to quantify the
relative accuracy of the reserve within staged confidence limits, or, if such an approach is not deemed appropriate, a qualitative discussion of the factors which
could affect the relative accuracy and confidence of the estimate.
|
• The economic analysis supporting the Ore Reserve has been completed with a relative accuracy and confidence
level consistent with a Feasibility Study.
• An AACE Class 2 cost estimate with an accuracy range of -10% / +15% was produced for the 2024FS, and
engineering design is ~70% complete.
• Appropriate assessments and studies have been carried out and include consideration of and modification by
realistically assumed mining, metallurgical, economic, marketing, legal, environmental, social, and governmental factors. These assessments demonstrate at the time
of reporting that the extraction could be reasonably justified.
Project economics were tested with a suite of sensitivities (described in the “Economics” subsection) which indicate that the Project
is economic under reasonable variations in key cost and price parameters.
|
|||||
|
• The statement should specify whether it relates to global or local
estimates, and, if local, state the relevant tonnages, which should be relevant to technical and economic evaluation. Documentation should include
• assumptions made and procedures used.
|
• The Ore Reserve tonnes and grade have been estimated globally across the model area (i.e., the South Basin)
for the Project.
|
||||||
|
• Accuracy and confidence discussions should extend to specific discussions
of any applied Modifying Factors that may have a material impact on Ore Reserve viability, or for which there are remaining areas of uncertainty at the current
study stage.
• It is recognised that this may not be possible or appropriate in all
circumstances. These statements of relative accuracy and confidence of the estimate should
• be compared with production data, where available.
|
• Reconciliation against production data/results was not possible as the Project is currently in the
development stage and there has been no production on the Project to date.
• Ore head grade, lithium recovery and price have the largest impacts on NPV and Ore Reserve viability.
|