|
☐
|
REGISTRATION STATEMENT PURSUANT TO SECTION 12(b) OR (g) OF THE SECURITIES EXCHANGE ACT OF 1934
|
|
☒
|
ANNUAL REPORT PURSUANT TO SECTION 13 OR 15(d) OF THE SECURITIES EXCHANGE ACT OF 1934
|
| ☐ |
TRANSITION REPORT PURSUANT TO SECTION 13 OR 15(d) OF THE SECURITIES EXCHANGE ACT OF 1934
|
| ☐ |
SHELL COMPANY REPORT PURSUANT TO SECTION 13 OR 15(d) OF THE SECURITIES EXCHANGE ACT OF 1934
|
|
N/A
|
AUSTRALIA
|
|
|
(Translation of Registrant’s name into English)
|
(Jurisdiction of incorporation or organization)
|
|
Title of each class:
|
Trading Symbol(s):
|
Name of each exchange on which registered or to be registered:
|
|
American Depositary Shares each representing 40 Ordinary Shares, no par value
|
IONR
|
The Nasdaq Capital Market
|
|
(1)
|
Evidenced by American Depositary Receipts
|
|
Large accelerated filer ☐
|
Accelerated filer ☐
|
Non-accelerated filer ☒
|
Emerging growth company ☒
|
|
3
|
|
|
|
|
|
5
|
|
|
|
|
|
6
|
|
|
|
|
|
7
|
|
|
|
|
|
8
|
|
9
|
|||
|
|
|
|
|
|
|
ITEM 1.
|
9
|
|
|
|
ITEM 2.
|
9
|
|
|
|
ITEM 3.
|
9
|
|
|
|
A.
|
9
|
|
|
|
B.
|
9
|
|
|
|
C.
|
9
|
|
|
|
D.
|
9
|
|
|
|
ITEM 4.
|
26
|
|
|
|
A.
|
26
|
|
|
|
B.
|
39
|
|
|
|
C.
|
42
|
|
|
|
D.
|
43
|
|
|
|
ITEM 4A.
|
44
|
|
|
|
ITEM 5.
|
44
|
|
|
|
A.
|
45
|
|
|
|
B.
|
48
|
|
|
|
C.
|
49
|
|
|
|
D.
|
49
|
|
|
|
E.
|
49
|
|
|
|
ITEM 6.
|
50
|
|
|
|
A.
|
50
|
|
|
|
B.
|
52
|
|
|
|
C.
|
62
|
|
|
|
D.
|
63
|
|
|
|
E.
|
64
|
|
|
|
ITEM 7.
|
65
|
|
|
|
A.
|
65
|
|
|
|
B.
|
66
|
|
|
|
C.
|
66
|
|
|
|
ITEM 8.
|
66
|
|
|
|
A.
|
66
|
|
|
|
B.
|
66
|
|
|
|
ITEM 9.
|
66
|
|
|
|
A.
|
66
|
|
|
|
B.
|
67
|
|
|
|
C.
|
67
|
|
|
|
D.
|
67
|
|
|
|
E.
|
67
|
|
|
|
F.
|
67
|
|
|
|
ITEM 10.
|
67
|
|
|
|
A.
|
67
|
|
|
|
B.
|
67
|
|
|
C.
|
79
|
||
|
D.
|
80
|
||
|
E.
|
80
|
||
|
F.
|
89
|
||
|
G.
|
89
|
||
|
H.
|
89
|
||
|
I.
|
89
|
||
|
J.
|
90
|
||
|
ITEM 11.
|
90
|
||
|
ITEM 12.
|
90
|
||
|
A.
|
90
|
||
|
B.
|
90
|
||
|
C.
|
90
|
||
|
D.
|
90
|
||
|
|
|
|
|
|
92
|
|||
|
|
|
|
|
|
ITEM 13.
|
92
|
||
|
ITEM 14.
|
92
|
||
|
ITEM 15.
|
92
|
||
|
ITEM 16.
|
93
|
||
|
ITEM 16A.
|
93
|
||
|
ITEM 16B.
|
93
|
||
|
ITEM 16C.
|
93
|
||
|
ITEM 16D.
|
94
|
||
|
ITEM 16E.
|
94
|
||
|
ITEM 16F.
|
94
|
||
|
ITEM 16G.
|
94
|
||
|
ITEM 16H.
|
95
|
||
|
ITEM 16I.
|
95
|
||
|
ITEM 16J.
|
95
|
||
|
ITEM 16K.
|
95
|
||
|
|
96
|
||
|
|
|
|
|
|
ITEM 17.
|
96
|
||
|
ITEM 18.
|
96
|
||
|
ITEM 19.
|
97
|
||

| • |
“ioneer” refers to ioneer Ltd, unless otherwise indicated;
|
| • |
“the Company”, “we”, “us”, or “our” refer to
ioneer Ltd and its consolidated subsidiaries, through which it conducts its business, unless otherwise indicated;
|
| • |
“shares” or “ordinary shares” refers to our ordinary shares;
|
| • |
“ADS” refers to the American depositary shares; and
|
| • |
“ASX” refers to the Australian Securities Exchange.
|
| • |
risks related to our limited operating history in the lithium and boron industry;
|
| • |
risks related to our status as a development stage company;
|
| • |
risks related to our ability to identify mineralization and achieve commercial mining at the Project;
|
| • |
risks related to mining, exploration and mine construction, if warranted, on our properties;
|
| • |
risks related to our ability to achieve and maintain profitability and to develop positive cash flow from our mining activities;
|
| • |
risks related to investment risk and operational costs associated with our exploration activities;
|
| • |
risks related to our ability to access capital and the financial markets;
|
| • |
risks related to compliance with government regulations;
|
| • |
risks related to our ability to acquire necessary mining licenses, permits or access rights;
|
| • |
risks related to environmental liabilities and reclamation costs;
|
| • |
risks related to volatility in lithium or boron prices or demand for lithium or boron;
|
| • |
risks related to stock price and trading volume volatility;
|
| • |
risks relating to the development of an active trading market for the ADSs;
|
| • |
risks related to ADS holders not having certain shareholder rights;
|
| • |
risks related to ADS holders not receiving certain distributions; and
|
| • |
risks related to our status as a foreign private issuer and emerging growth company.
|
| ITEM 1. |
IDENTITY OF DIRECTORS, SENIOR MANAGEMENT AND ADVISERS
|
| ITEM 2. |
OFFER STATISTICS AND EXPECTED TIMETABLE
|
| ITEM 3. |
KEY INFORMATION
|
| A. |
[Reserved]
|
| B. |
Capitalization and Indebtedness
|
| C. |
Reasons for the Offer and Use of Proceeds
|
| D. |
Risk Factors
|
| • |
the discovery of unusual or unexpected geological formations;
|
| • |
accidental fires, floods, earthquakes or other natural disasters;
|
| • |
unplanned power outages and water shortages;
|
| • |
controlling water and other similar mining hazards;
|
| • |
operating labor disruptions and labor disputes;
|
| • |
the ability to obtain suitable or adequate machinery, equipment, or labor;
|
| • |
our liability for pollution or other hazards; and
|
| • |
other known and unknown risks involved in the conduct of exploration and operation of mines.
|
| • |
a significant, prolonged decrease in the market prices of lithium or boron;
|
| • |
difficulty in marketing and/or selling lithium or boron;
|
| • |
significantly higher than expected capital costs to construct our mine;
|
| • |
significantly higher than expected extraction costs;
|
| • |
significantly lower than expected ore extraction quantities;
|
| • |
significantly lower than expected recoveries;
|
| • |
significant delays, reductions or stoppages of ore extraction activities;
|
| • |
significant delays in achieving commercial operations; and
|
| • |
the introduction of significantly more stringent regulatory laws and regulations.
|
| • |
adverse economic conditions;
|
| • |
adverse general capital market conditions;
|
| • |
poor performance and health of the lithium or mining industries in general;
|
| • |
bankruptcy or financial distress of unrelated lithium companies or marketers;
|
| • |
significant decrease in the demand for lithium; or
|
| • |
adverse regulatory actions that affect our exploration and construction plans or the use of lithium generally.
|
| • |
our ability to develop existing properties;
|
| • |
our ability to obtain leases or options on properties;
|
| • |
our ability to identify and acquire new exploratory prospects;
|
| • |
our ability to continue to retain and attract skilled personnel;
|
| • |
our ability to maintain or enter into new relationships with project partners and independent contractors;
|
| • |
the results of our development and exploration programs;
|
| • |
the market prices for our production;
|
| • |
our access to capital; and
|
| • |
our ability to enter into sales arrangements.
|
| • |
changes or delays in development or exploration activities;
|
| • |
actual or expected fluctuations in our prospects or operating results;
|
| • |
changes in the demand for, or market prices of, lithium or boron;
|
| • |
additions to or departures of our key personnel;
|
| • |
fluctuations of exchange rates between the U.S. dollar and the Australian dollar;
|
| • |
changes or proposed changes in laws and regulations;
|
| • |
changes in trading volume of ADSs on Nasdaq and of our ordinary shares on the ASX;
|
| • |
sales or perceived potential sales of the ADSs or ordinary shares by us, our directors, senior management or our shareholders in the future;
|
| • |
announcement or expectation of additional financing efforts; and
|
| • |
conditions in the U.S. or Australian financial markets or changes in general economic conditions.
|
| • |
it did not have jurisdiction;
|
| • |
it was not an appropriate forum for such proceedings;
|
| • |
applying Australian conflict of laws rule, U.S. law (including U.S. securities laws) did not apply to the relationship between holders of our ordinary shares or ADSs and us or our directors and officers; or
|
| • |
the U.S. securities laws were of a public or penal nature and should not be enforced by the Australian court.
|
| • |
effect service of process within the United States upon certain directors and executive officers or on us;
|
| • |
enforce in U.S. courts judgments obtained against any of our directors and executive officers or us in the U.S. courts in any action, including actions under the civil liability provisions of U.S.
securities laws;
|
| • |
enforce in U.S. courts judgments obtained against any of our directors and senior management or us in courts of jurisdictions outside the United States in any action, including actions under the civil
liability provisions of U.S. securities laws; or
|
| • |
bring an original action in an Australian court to enforce liabilities against any of our directors and executive officers or us based upon U.S. securities laws.
|
| • |
the last day of the fiscal year during which we have total annual gross revenues of US$1,235,000,000 (as such amount is indexed for inflation every five years by the United States Securities and Exchange
Commission, or SEC) or more;
|
| • |
the last day of our fiscal year following the fifth anniversary of the completion of our first sale of common equity securities pursuant to an effective registration statement under the Securities Act,
which is currently expected to be June 30, 2028, unless we change our fiscal year to December 31, in which case such date will be December 31, 2027;
|
| • |
the date on which we have, during the previous three-year period, issued more than US$1,000,000,000 in non-convertible debt; or
|
| • |
the date on which we are deemed to be a “large accelerated filer”, as defined in Rule 12b-2 of the Exchange Act, which would occur in future fiscal years if the
market value of our ordinary shares and ADSs that are held by non-affiliates exceeds US$700,000,000 as of the last day of our most recently-completed second fiscal quarter.
|
| ITEM 4. |
INFORMATION ON THE COMPANY
|
| A. |
History and Development of the Company
|
| • |
Stauffer Chemicals drilling boreholes in the vicinity more than 50 years ago.
|
| • |
U.S. Borax drilled 16 holes on the Cave Spring property between 1987 and 1992 and excavated and sampled numerous trenches. U.S. Borax held claims until sometime after 2000, at which time the property was
released by U.S. Borax and acquired by Gold Summit Corp.
|
| • |
In 2003, our predecessor, Global Geoscience Limited, began exploratory operations in Nevada under the leadership of our current Managing Director, Bernard Rowe.
|
| • |
In 2010 and 2011, JOGMEC-American Lithium, after acquiring the property from Gold Summit, resampled existing trenches and drilled a total of 21 diamond core HQ-sized core holes (approximately 16,850 feet)
as well as 15 reverse circulation (RC) rotary percussion holes (approximately 12,000 feet) in the South Basin, for a total of nearly 29,000 feet of drilling.
|
| • |
In 2015, Boundary Peak Minerals acquired mineral rights to the property prior to its transfer to us in 2016.
|
| • |
In 2016, we acquired our initial interest in the Rhyolite Ridge Project under a Mining Lease and Option to Purchase Agreement with Boundary Peak Minerals dated June 3, 2016. We exercised our option to
purchase and acquired title to the unpatented mining claims in May 2017.
|
| • |
During 2016 and 2017, we drilled an additional 28 RC holes (17,330 feet) and 3 diamond HQ core holes (about 2,800 feet) at the property, for a total of over 20,000 feet of drilling.
|
| • |
During 2017 and 2018, we performed all payment obligations under the mining lease.
|
| • |
In October 2018, we completed a Prefeasibility Study (“PFS”).
|
| • |
During 2018 and 2019, we commissioned additional infill drilling to further define the lithium-boron resource at the site, collecting and testing approximately 29,000 feet of additional core and installing
one test well, three monitoring wells, and five vibrating wire piezometers. In addition, we signed our first binding offtake agreement for boron.
|
| • |
In 2020, we completed a Definitive Feasibility Study (“DFS”) which affirmed the Project’s scale, long life and potential to become a low-cost and globally significant
producer of both lithium and boron products.
|
| • |
During 2021, we announced our first lithium offtake agreement and continued to advance engineering, funding discussions and project permitting.
|
| • |
In June 2021, we agreed a binding 3-year offtake agreement with EcoPro Innovation for 2,000 tpa of lithium carbonate.
|
| • |
In September 2021, we agreed to enter into the Strategic Partnership with Sibanye-Stillwater to develop the Rhyolite Ridge Project. Under the terms of the agreement, subject to the satisfaction of
conditions precedent, Sibanye-Stillwater will contribute US$490 million for a 50% interest in the Joint Venture holding the project, with ioneer maintaining a 50% interest and retaining operatorship.
|
| • |
In October 2021, the Company completed a US$70 million strategic investment by Sibanye-Stillwater.
|
| • |
In February 2022, we announced that EcoPro Innovation, a major Korean battery manufacturer had increased its 3-year lithium offtake volume to 7,000 tpa.
|
| • |
In June 2022, our ADSs were listed and commenced trading on Nasdaq.
|
| • |
In July 2022, we agreed a binding 5-year offtake agreement with the Ford Motor Company for 7,000 tpa of lithium carbonate.
|
| • |
In August 2022, we announced a binding 5-year offtake agreement with Prime Planet Energy & Solutions, Inc. (“PPES”), a joint venture between Toyota Motor
Corporation and Panasonic Corporation, for 4,000 tpa of lithium carbonate.
|
| • |
In December 2022, the BLM announced its decision to publish the Notice of Intent for Rhyolite Ridge Lithium-Boron Project in the federal register, representing a major milestone toward completion of the
NEPA process and approval of the Project’s Plan of Operations.
|
| • |
In January 2023, we announced finalization of a term sheet and offer of a Conditional Commitment for a proposed loan of up to US$700 million from the DOE Loan Programs Office for financing the construction
of the Rhyolite Ridge Lithium-Boron Project.
|
| • |
In May 2023, we announced a lithium offtake agreement with Dragonfly Energy Holdings Corp. (NASDAQ: DFLI), a Nevada-based industry leader in energy storage for 250 tpa of lithium carbonate.
|
| • |
In October 2023, we announced a Research and Development Memorandum of Understanding with EcoPro Innovation Co Ltd, a global leader in battery grade high purity lithium hydroxide conversion. The Lithium
Clay R&D project is currently excluded from the Stage 1 Project design and economics.
|
| • |
In April 2024, we announced the draft Environmental Impact Statement (“DEIS”) for the Project was made public by the Federal Bureau of Land Management (BLM) and was
published in the Federal Register.
|
| • |
In April 2024, we announced that we had completed three separate geotechnical drilling programs (53 drill holes in total) under 2920 permits with a primary reason to collect geotechnical data. The 53 holes
were drilled outside of the then mineral resource over an area of approximately 0.8 km2 – compared to the 3 km2 footprint of the current Resource.
|
| • |
In September 2024, the BLM published the Final Environmental Impact Statement (“EIS”) regarding the Rhyolite
Ridge Project, which included the FWS Biological Opinion concluding the Project would not jeopardize ESA-listed Tiehm’s buckwheat or adversely modify its critical habitat. Publication of the Final EIS begins a 30-day statutory
waiting period before a Record of Decision can be issued.
|
| • |
In October 2024, ioneer announced it had received a positive Record of Decision, being final approval from the U.S. Government to develop the Rhyolite Ridge Project.
|
| • |
In January 2025, ioneer announced the closing of a US$996 million loan (consisting of $968 million in principal and $28 million of capitalized interest) from the U.S. Department of Energy Loan
Programs Office under the Advanced Technology Vehicles Manufacturing program to support the development of an on-site processing facility at the Rhyolite Ridge Lithium-Boron Project.
|
| • |
In February 2025, Sibanye-Stillwater announced that it had decided not to proceed with the proposed joint venture in the Rhyolite Ridge Project.
|
| • |
In March 2025, the Company announced a 45% increase in the mineral resource estimate for the Rhyolite Ridge Project to 510 Million tonne (“Mt”).
|
| • |
In June 2025, ioneer announced the more than quadrupling of ore reserve to 247 Mt, and updated economics for the Project.
|
| • |
In September 2025, ioneer announced a further material improvement in Project economics achieved through leach optimization.
|
| • |
Demonstrated potential to become a world-class lithium-boron producer
|
| • |
Definitive Feasibility Study (2020) and updated Project economics (2025) confirm plans for a large, long-life, low-cost operation
|
| • |
Strategically advantageous location in a tier-one mining jurisdiction with easy access to key US and Asian markets
|
| • |
Set to produce two materials essential in a modern world and well-positioned to capitalize on expected lithium demand boom
|
| • |
Completed offtake strategy for both boron and lithium production, obtained significant debt financing, subject to the satisfaction of conditions precedent, via the US$996 million conditional loan from U.S.
Department of Energy Loan Programs Office
|
| • |
Engaged top-tier mining, engineering, processing and environmental partners in Fluor, Veolia, and AtkinsRealis (previously SNC Lavalin). Approximately 70% detailed engineering has been completed on a
state-of-the-art facility
|
| • |
Highly experienced board and management with necessary skills to develop, build and operate a world-class lithium-boron mine
|
| • |
Complete required permitting and zoning activities. Though we must obtain several permits, there are three key permits necessary before we can begin
construction at Rhyolite Ridge, namely:
|
| • |
a Class II Air Quality Permit from the Nevada State Government (Received in June 2021) was resubmitted for approval to amend it for the updated approved mine plan - received July 2025
|
| • |
a Water Pollution Control Permit from the Nevada State Government (Received July 2021) was resubmitted for approval to amend it for the updated approved mine plan – received August 2025; and
|
| • |
completion of an environmental review and final decision by the federal government authorizing the use of federal land under the National Environmental Policy Act (“NEPA”)
– received in October 2024.
|
| • |
Undertake discussions with potential offtake parties for future sales of lithium and boron products.
|
| • |
Lithium – We announced our first lithium offtake agreement on June 30, 2021 with EcoPro Innovation (“EcoPro”), a large Korean lithium and battery materials
manufacturer. On February 16, 2022 we announced that EcoPro had exercised an option under the agreement to increase the annual supply volume. Under the agreement, we will deliver 7,000 tonnes per annum (tpa) of lithium carbonate to
EcoPro over a three-year term, which we estimate will represent approximately one-third of our projected lithium carbonate production over that period. On July 22, 2022 we announced a five-year binding offtake agreement with the Ford
Motor Company for the supply of 7,000 tpa of technical grade lithium carbonate. On August 1, 2022 we announced the signing of a further five-year binding offtake agreement with PPES, a joint venture battery company between Toyota Motor
Corporation and Panasonic Corporation. The agreement is for a total of 4,000 tonnes per annum of lithium carbonate from ioneer’s Rhyolite Ridge Lithium-Boron operation in Nevada and represents approximately 20% of annual output in the
first five years of production. In total, the three binding offtake agreements account for approximately 90% of our expected first three years of production of lithium carbonate. In May 2023, we announced a commercial offtake agreement
partnership with Dragonfly Energy Holdings Corp. (“Dragonfly”) for a variable amount of surplus tonnes available after meeting previously announced offtake commitments. The contract duration is three years beginning when ioneer notifies
Dragonfly that the project has been fully completed and commissioned.
|
| • |
Boron – On December 18, 2019, we announced our first binding offtake agreement for the sale of boric acid to Dalian Jinma Boron Technology Group Co. Ltd (“Jinma”)
for 105,000 tpa of boric acid which included a distribution agreement for the territories of China and Taiwan. On May 21, 2020, we announced that we had secured two separate boric acid Distribution and Sales Agreements for the supply of
boric acid to Kintamani Resources Pte Limited and Boron Bazar Limited. In aggregate, the volume commitments and minimum volume targets in these agreements place 100% of our first four years of projected boric acid production. As with
our lithium carbonate agreements, we anticipate entering into offtake and other sales agreements with a variety of partners to build a diversified customer base for our boric acid production. We anticipate that our boric acid production
will account for approximately 25% of the Project’s revenue.
|
| • |
Complete pre-construction engineering. This workstream includes progressing engineering to the start of the Full Notice to Proceed (“FNTP”) phase; also known as the Engineering, Procurement, and Construction Management (“EPCM”) phase. The key aim of ongoing activities is to be construction
ready to support construction mobilization following FNTP award. The FNTP award will be dependent on the receipt of all permitting.
|
| • |
Complete required financing activities. We estimated in June 2025 that development of the Rhyolite Ridge Project would require approximately US$1,668
million, and we will update the cost estimate prior to making a FID. If we ultimately make an FID to develop the Project, we will need to secure substantial additional funds to complete development. We plan to fund the capital expense by
raising equity capital by selling an interest in the Rhyolite Ridge Project to a strategic partner and drawing on the DOE Loan Program’s Office loan of US$996 million, subject to the satisfaction of conditions precedent. Even if the
conditions precedent to first draw of the DOE loan are met, we may need to secure substantial additional funds, through future debt or equity financings, to complete development of the Project.
|
| • |
Complete Construction at the Rhyolite Ridge Project. We are targeting to commence construction as soon as all permitting is received, funding is in
place and the Company makes an FID to construct the Project. The timing of making an FID and starting construction is dependent on the outcomes of the strategic partnering process. Construction is expected to be approximately 36 months
(including the supply of long-lead items). We anticipate a 6-month period of ramp-up of production post the start of construction.
|
| • |
Continue our exploration programs. Our development of the Rhyolite Ridge Project is situated in the southern basin (the “South Basin”) and all resource and reserve estimates are for the South Basin. Pursuant to our mine plan of operations, we intend to conduct further activities to define additional reserves and resources in the South
Basin. We are also currently undertaking technical studies to assess the additional economic potential of the northern basin of Rhyolite Ridge (the “North Basin”) and defining additional reserves
and resources.
|
|
Stream
|
Group
|
Classification
|
Tonnage
kt
|
Li
ppm
|
B
ppm
|
Li2CO3
wt. %
|
H3BO3
wt. %
|
Contained
Li2CO3 kt
|
Contained
H3BO3 kt
|
|
Stream 1 (>= 5,000 ppm B)
|
Upper Zone
B5 Unit |
Measured
|
10,414
|
1,921
|
15,063
|
1.02
|
8.61
|
106
|
897
|
|
Indicated
|
7,214
|
1,749
|
13,240
|
0.93
|
7.57
|
67
|
546
|
||
|
Total (M&I)
|
17,628
|
1,850
|
14,317
|
0.98
|
8.19
|
174
|
1,443
|
||
|
Inferred
|
10,628
|
1,712
|
10,563
|
0.91
|
6.04
|
97
|
642
|
||
|
Total (MII)
|
28,255
|
1,798
|
12,905
|
0.96
|
7.38
|
270
|
2,085
|
||
|
Upper Zone
M5 Unit |
Measured
|
1,073
|
2,186
|
7,397
|
1.16
|
4.23
|
12
|
45
|
|
|
Indicated
|
814
|
2,100
|
7,535
|
1.12
|
4.31
|
9
|
35
|
||
|
Total (M&I)
|
1,887
|
2,149
|
7,456
|
1.14
|
4.26
|
22
|
80
|
||
|
Inferred
|
763
|
2,197
|
6,515
|
1.17
|
3.73
|
9
|
28
|
||
|
Total (MII)
|
2,650
|
2,163
|
7,185
|
1.15
|
4.11
|
31
|
109
|
||
|
Upper Zone
S5 Unit |
Measured
|
1,456
|
1,561
|
7,467
|
0.83
|
4.27
|
12
|
62
|
|
|
Indicated
|
1,393
|
1,571
|
7,132
|
0.84
|
4.08
|
12
|
57
|
||
|
Total (M&I)
|
2,849
|
1,566
|
7,303
|
0.83
|
4.18
|
24
|
119
|
||
|
Inferred
|
1,572
|
1,400
|
6,469
|
0.75
|
3.70
|
12
|
58
|
||
|
Total (MII)
|
4,421
|
1,507
|
7,006
|
0.80
|
4.01
|
35
|
177
|
||
|
Upper Zone Total
|
Measured
|
12,943
|
1,902
|
13,573
|
1.01
|
7.76
|
131
|
1,004
|
|
|
Indicated
|
9,420
|
1,753
|
11,844
|
0.93
|
6.77
|
88
|
638
|
||
|
Total (M&I)
|
22,363
|
1,839
|
12,845
|
0.98
|
7.34
|
219
|
1,642
|
||
|
Inferred
|
12,963
|
1,703
|
9,828
|
0.91
|
5.62
|
117
|
728
|
||
|
Total (MII)
|
35,326
|
1,789
|
11,738
|
0.95
|
6.71
|
336
|
2,371
|
||
|
Lower Zone
L6 Unit |
Measured
|
12,014
|
1,355
|
9,838
|
0.72
|
5.63
|
87
|
676
|
|
|
Indicated
|
26,139
|
1,319
|
10,365
|
0.70
|
5.93
|
183
|
1,549
|
||
|
Total (M&I)
|
38,153
|
1,330
|
10,199
|
0.71
|
5.83
|
270
|
2,225
|
||
|
Inferred
|
13,914
|
1,415
|
12,287
|
0.75
|
7.03
|
105
|
978
|
||
|
Total (MII)
|
52,067
|
1,353
|
10,757
|
0.72
|
6.15
|
375
|
3,203
|
||
|
Total Stream 1 (all zones)
|
Measured
|
24,957
|
1,639
|
11,775
|
0.87
|
6.73
|
218
|
1,680
|
|
|
Indicated
|
35,559
|
1,434
|
10,757
|
0.76
|
6.15
|
271
|
2,187
|
||
|
Total (M&I)
|
60,516
|
1,518
|
11,177
|
0.81
|
6.39
|
489
|
3,867
|
||
|
Inferred
|
26,877
|
1,554
|
11,101
|
0.83
|
6.35
|
222
|
1,706
|
||
|
Total (MII)
|
87,393
|
1,529
|
11,153
|
0.81
|
6.38
|
711
|
5,573
|
||
|
Stream 2 (>= 11.13/tonne net value, < 5,000 ppm B. Low Clay)
|
Upper Zone
B5 Unit |
Measured
|
438
|
2,321
|
2,925
|
1.24
|
1.67
|
5
|
7
|
|
Indicated
|
362
|
2,092
|
3,674
|
1.11
|
2.10
|
4
|
8
|
||
|
Total (M&I)
|
800
|
2,217
|
3,264
|
1.18
|
1.87
|
9
|
15
|
||
|
Inferred
|
3,690
|
1,695
|
1,776
|
0.90
|
1.02
|
33
|
37
|
||
|
Total (MII)
|
4,491
|
1,788
|
2,041
|
0.95
|
1.17
|
43
|
52
|
||
|
Upper Zone
S5 Unit |
Measured
|
9,400
|
996
|
1,226
|
0.53
|
0.70
|
50
|
66
|
|
|
Indicated
|
7,981
|
1,012
|
1,524
|
0.54
|
0.87
|
43
|
70
|
||
|
Total (M&I)
|
17,382
|
1,003
|
1,363
|
0.53
|
0.78
|
93
|
135
|
||
|
Inferred
|
15,491
|
889
|
1,014
|
0.47
|
0.58
|
73
|
90
|
||
|
Total (MII)
|
32,873
|
949
|
1,198
|
0.51
|
0.69
|
166
|
225
|
||
|
Upper Zone Total
|
Measured
|
9,839
|
1,055
|
1,302
|
0.56
|
0.74
|
55
|
73
|
|
|
Indicated
|
8,343
|
1,059
|
1,617
|
0.56
|
0.92
|
47
|
77
|
||
|
Total (M&I)
|
18,182
|
1,057
|
1,447
|
0.56
|
0.83
|
102
|
150
|
||
|
Inferred
|
19,187
|
1,044
|
1,160
|
0.56
|
0.66
|
107
|
127
|
||
|
Total (MII)
|
37,369
|
1,050
|
1,300
|
0.56
|
0.74
|
209
|
278
|
||
|
Lower Zone
L6 Unit |
Measured
|
19,043
|
1,155
|
1,979
|
0.61
|
1.13
|
117
|
215
|
|
|
Indicated
|
51,191
|
1,158
|
1,624
|
0.62
|
0.93
|
316
|
475
|
||
|
Total (M&I)
|
70,234
|
1,157
|
1,720
|
0.62
|
0.98
|
433
|
691
|
||
|
Inferred
|
47,474
|
1,244
|
790
|
0.66
|
0.45
|
314
|
214
|
||
|
Total (MII)
|
117,708
|
1,192
|
1,345
|
0.63
|
0.77
|
747
|
905
|
||
|
Total Stream 2 (all zones)
|
Measured
|
28,881
|
1,121
|
1,748
|
0.60
|
1.00
|
172
|
289
|
|
|
Indicated
|
59,535
|
1,144
|
1,623
|
0.61
|
0.93
|
363
|
553
|
||
|
Total (M&I)
|
88,416
|
1,137
|
1,664
|
0.60
|
0.95
|
535
|
841
|
||
|
Inferred
|
66,662
|
1,186
|
897
|
0.63
|
0.51
|
421
|
342
|
||
|
Total (MII)
|
155,078
|
1,158
|
1,334
|
0.62
|
0.76
|
956
|
1,183
|
||
|
Stream 3(>= 11.13/tonne net value, < 5,000 ppm B, High Clay)
|
Total Stream 3 (M5 zone)
|
Measured
|
13,602
|
2,202
|
1,487
|
1.17
|
0.85
|
159
|
116
|
|
Indicated
|
11,437
|
2,100
|
1,205
|
1.12
|
0.69
|
128
|
79
|
||
|
Total (M&I)
|
25,039
|
2,155
|
1,358
|
1.15
|
0.78
|
287
|
194
|
||
|
Inferred
|
11,608
|
1,654
|
601
|
0.88
|
0.34
|
102
|
40
|
||
|
Total (MII)
|
36,647
|
1,997
|
1,118
|
1.06
|
0.64
|
389
|
234
|
||
|
All Streams
|
M&I Resource
|
Measured
|
67,440
|
1,530
|
5,406
|
0.81
|
3.09
|
549
|
2,085
|
|
Indicated
|
106,531
|
1,344
|
4,627
|
0.72
|
2.65
|
762
|
2,818
|
||
|
Total (M&I)
|
173,971
|
1,416
|
4,929
|
0.75
|
2.82
|
1,311
|
4,903
|
||
|
Inferred Resource
|
Inferred
|
105,147
|
1,332
|
3,472
|
0.71
|
1.99
|
745
|
2,088
|
|
|
Total (MII)
|
279,117
|
1,384
|
4,380
|
0.74
|
2.50
|
2,056
|
6,991
|
| 1. |
Ktonnes = thousand tonnes; Li = Lithium; B = Boron; ppm = parts per million; Li2CO3 = Lithium carbonate; H3BO3 =
boric acid.
|
| 2. |
Totals may differ due to rounding, mineral resources reported on a dry in-situ basis. Lithium is converted to Equivalent Contained Tonnes of Lithium Carbonate (Li2CO3) using a stochiometric conversion
factor of 5.322, and boron is converted to Equivalent Contained Tonnes of Boric Acid (H3BO3) using a stochiometric conversion factor of 5.718. Equivalent stochiometric conversion factors are derived from the molecular weights of the
individual elements which make up Lithium Carbonate (Li2CO3) and Boric Acid (H3BO3).
|
| 3. |
The statement of estimates of mineral resources has been compiled by Independent Mining Consultants, Inc. (“IMC”) and is independent of ioneer and its affiliates. IMC has sufficient experience that is
relevant to the style of mineralization and type of deposit under consideration and to the activity being undertaken to qualify as a Qualified Person as defined in Subpart 1300.
|
| 4. |
All mineral resource figures reported in the table above represent estimates at August 2025. Mineral resource estimates are not precise calculations, being dependent on the interpretation of limited
information on the location, shape and continuity of the occurrence and on the available sampling results. The totals contained in the above table have been rounded to reflect the relative uncertainty of the estimate.
|
| 5. |
Mineral resources have been prepared in accordance with requirements of Subpart 1300. Mineral resources are also reported in accordance with the Australasian Code for Reporting of Exploration Results,
Mineral Resources and Ore Reserves (The Joint Ore Reserves Committee Code – JORC 2012 Edition).
|
| 6. |
The mineral resource estimate is the result of determining the mineralized material that has a reasonable prospect of economic extraction. In making this determination, constraints were applied to the
geological model based upon a pit optimization analysis that defined a conceptual pit shell limit. The conceptual pit shell was based upon a net value per tonne calculation including a 5,000ppm boron cut-off grade for high boron – high
lithium (HiB-Li) mineralization (Stream 1) and a $11.13/tonne net value cut-off grade for low boron (LoB-Li) mineralization below 5,000ppm boron broke into two material types, low clay and high clay material respectfully (Stream 2 and
Stream 3). The pit shell was constrained by a conceptual mineral resource optimized pit shell for the purpose of establishing reasonable prospects of eventual economic extraction based on potential mining, metallurgical and processing
grade parameters identified by mining, metallurgical and processing studies performed to date on the Project. Key inputs in developing the mineral resource pit shell included a 5,000ppm boron cut-off grade for HiB-Li mineralization,
$11.13/tonne net value cut-off grade for LoB-Li low clay mineralization and LoB-Li high clay mineralization; mining cost of US$1.69 /tonne; G&A cost of US$11.13 /process tonne; plant feed processing and grade control costs which range
between US$18.87/tonne and US$98.63/tonne of plant feed (based on the acid consumption per stream and the mineral resource average grades); boron and lithium recovery (respectively) for Stream 1: M5 80.2% and 85.7%, B5 78.3% and 85.2%, S5
77.0% and 82.5%, L6 75.8% and 79.4%; Stream 2 and 3: M5 65.0% and 78.0%, B5 78.3% and 85.2%, S5 46.8% and 84.8%, L6 32.9% and 78.7%, respectively; boric acid sales price of US$1,172.78/tonne; lithium carbonate sales price of
US$19,351.38/tonne.
|
| 7. |
The mineral resource is reported exclusive of the mineral reserves.
|
|
Category
|
Tonnage (MT)1
|
Li, ppm
|
B,ppm
|
Li2CO3 ktonnes
|
H3BO3 ktonnes
|
|
|
August 2025
|
||||||
|
Measured
|
67.4
|
1,530
|
5,406
|
549
|
2,085
|
|
|
Indicated
|
106.5
|
1,344
|
4,627
|
762
|
2,818
|
|
|
Sum M&I
|
174.0
|
1,416
|
4,929
|
1,311
|
4,903
|
|
|
Inferred
|
105.1
|
1,332
|
3,472
|
745
|
2,088
|
|
|
Total
|
279.1
|
1,384
|
4,380
|
2,056
|
6,991
|
|
|
October 2023
|
||||||
|
Measured
|
17.1
|
1,503
|
9,374
|
137
|
919
|
|
|
Indicated
|
220.1
|
1,760
|
4,654
|
2,061
|
5,856
|
|
|
Sum M&I
|
237.2
|
1,741
|
4,995
|
2,198
|
6,775
|
|
|
Inferred
|
62.1
|
1,795
|
4,392
|
593
|
1,558
|
|
|
Total
|
299.3
|
1,752
|
4,870
|
2,791
|
8,334
|
|
|
Difference
|
||||||
|
Measured
|
50.3
|
412.2
|
1,165.7
|
|||
|
Indicated
|
-113.6
|
-1,299.4
|
-3,038.0
|
|||
|
Sum M&I
|
-63.3
|
-887.3
|
-1,872.3
|
|||
|
Inferred
|
43.1
|
152.7
|
529.2
|
|||
|
Total
|
-20.2
|
-734.5
|
-1,343.1
|
|||
| 1. |
MT = one million metric tonnes.
|
|
Area
|
Group
|
Classification
|
Metric
|
Lithium
|
Boron
|
Contained Equivalent Grade2
|
Contained6
Equivalent2 Tonnes |
Recovered6
Equivalent2 Tonnes |
|||
|
Tonnes2
|
Grade7
|
Grade7
|
|||||||||
|
|
Li
|
B
|
Li2CO3
|
H3BO3
|
Li2CO3
|
H3BO3
|
Li2CO3
|
H3BO3
|
|||
|
(ktonnes)
|
(ppm)
|
(ppm)
|
(Wt. %)
|
(Wt. %)
|
(kt)
|
(kt)
|
(kt)
|
(kt)
|
|||
|
Stream 1
(>= 5,000 ppm B) |
Upper Zone
|
Proven
|
3,489
|
2,401
|
7,652
|
1.28
|
4.38
|
45
|
153
|
38
|
122
|
|
M5 Unit
|
Probable
|
3,410
|
2,262
|
7,430
|
1.20
|
4.25
|
41
|
145
|
35
|
116
|
|
|
|
Sub-total B5 Unit
|
6,899
|
2,332
|
7,542
|
1.24
|
4.31
|
86
|
298
|
73
|
239
|
|
|
Upper Zone
|
Proven
|
27,991
|
1,880
|
15,364
|
1.00
|
8.79
|
280
|
2,459
|
239
|
1,925
|
|
|
B5 Unit
|
Probable
|
31,456
|
1,742
|
14,169
|
0.93
|
8.10
|
292
|
2,549
|
248
|
1,995
|
|
|
|
Sub-total M5 Unit
|
59,447
|
1,807
|
14,732
|
0.96
|
8.42
|
572
|
5,008
|
487
|
3,921
|
|
|
Upper Zone
|
Proven
|
2,237
|
1,326
|
7,754
|
0.71
|
4.43
|
16
|
99
|
13
|
76
|
|
|
S5 Unit
|
Probable
|
3,355
|
1,166
|
7,533
|
0.62
|
4.31
|
21
|
145
|
17
|
111
|
|
|
|
Sub-total S5 Unit
|
5,592
|
1,230
|
7,621
|
0.65
|
4.36
|
37
|
244
|
30
|
187
|
|
|
Upper Zone
|
Proven
|
33,717
|
1,897
|
14,061
|
1.01
|
8.04
|
340
|
2,711
|
290
|
2,124
|
|
|
(B5, M5 & S5)
|
Probable
|
38,221
|
1,738
|
12,985
|
0.92
|
7.42
|
353
|
2,838
|
301
|
2,223
|
|
|
Sub-Total
|
Sub-total Upper Zone
|
71,938
|
1,813
|
13,489
|
0.96
|
7.71
|
694
|
5,549
|
591
|
4,347
|
|
|
Lower Zone
|
Proven
|
5,712
|
1,389
|
8,357
|
0.74
|
4.78
|
42
|
273
|
34
|
207
|
|
|
L6 Unit
|
Probable
|
13,592
|
1,334
|
7,856
|
0.71
|
4.49
|
96
|
611
|
77
|
463
|
|
|
|
Sub-total Lower Zone
|
19,303
|
1,350
|
8,004
|
0.72
|
4.58
|
139
|
883
|
110
|
670
|
|
|
Total Stream 1 (all zones)
|
Proven
|
39,428
|
1,824
|
13,235
|
0.97
|
7.57
|
383
|
2,984
|
323
|
2,331
|
|
|
Probable
|
51,813
|
1,632
|
11,640
|
0.87
|
6.66
|
450
|
3,448
|
377
|
2,686
|
||
|
Sub-total Stream 1
|
91,241
|
1,715
|
12,329
|
0.91
|
7.05
|
833
|
6,432
|
700
|
5,017
|
||
|
Stream 2
($11.13/tonne net value cut-off grade, Low Clay) |
Upper Zone
|
Proven
|
4,528
|
2,219
|
2,143
|
1.18
|
1.23
|
53
|
55
|
46
|
43
|
|
B5 Unit
|
Probable
|
4,384
|
2,118
|
2,415
|
1.13
|
1.38
|
49
|
61
|
42
|
47
|
|
|
|
Sub-total B5 Unit
|
8,912
|
2,169
|
2,277
|
1.15
|
1.30
|
103
|
116
|
88
|
91
|
|
|
Upper Zone
|
Proven
|
15,005
|
1,022
|
1,125
|
0.54
|
0.64
|
82
|
97
|
69
|
45
|
|
|
S5 Unit
|
Probable
|
27,495
|
825
|
866
|
0.44
|
0.50
|
121
|
136
|
102
|
64
|
|
|
|
Sub-total S5 Unit
|
42,500
|
895
|
957
|
0.48
|
0.55
|
202
|
233
|
172
|
109
|
|
|
Upper Zone
|
Proven
|
19,533
|
1,299
|
1,361
|
0.69
|
0.78
|
135
|
152
|
115
|
89
|
|
|
(B5 & S5)
|
Probable
|
31,880
|
1,003
|
1,079
|
0.53
|
0.62
|
170
|
197
|
144
|
111
|
|
|
Sub-Total
|
Sub-total Upper Zone
|
51,413
|
1,116
|
1,186
|
0.59
|
0.68
|
305
|
349
|
259
|
200
|
|
|
Lower Zone
|
Proven
|
24,936
|
1,254
|
1,279
|
0.67
|
0.73
|
166
|
182
|
131
|
60
|
|
|
L6 Unit
|
Probable
|
68,952
|
1,196
|
1,535
|
0.64
|
0.88
|
439
|
605
|
345
|
199
|
|
|
|
Sub-total Lower Zone
|
93,888
|
1,211
|
1,467
|
0.64
|
0.84
|
605
|
788
|
476
|
259
|
|
|
Total Stream 2 (all zones)
|
Proven
|
44,469
|
1,274
|
1,315
|
0.68
|
0.75
|
302
|
334
|
246
|
149
|
|
|
Probable
|
100,832
|
1,135
|
1,391
|
0.60
|
0.80
|
609
|
802
|
490
|
310
|
||
|
Sub-total Stream 2
|
145,301
|
1,177
|
1,368
|
0.63
|
0.78
|
911
|
1,136
|
736
|
459
|
||
|
Stream 3
($11.13/tonne net value cut-off grade, High Clay) |
Total Stream 3 (M5 zone)
|
Proven
|
5,621
|
2,199
|
1,702
|
1.17
|
0.97
|
66
|
55
|
51
|
36
|
|
Probable
|
18,178
|
2,082
|
1,145
|
1.11
|
0.65
|
201
|
119
|
157
|
77
|
||
|
Sub-total Stream 3
|
23,799
|
2,110
|
1,277
|
1.12
|
0.73
|
267
|
174
|
208
|
113
|
||
|
TOTAL of All Streams, All Seams, and All Proven & Probable
|
260,341
|
1,451
|
5,201
|
0.77
|
2.97
|
2,010
|
7,742
|
1,645
|
5,588
|
||
|
|
1. |
Kt – thousand metric tonnes, MT – million metric tonnes, ktonne = thousand metric tons; Li= lithium; B= boron’ ppm= parts per million; Li2CO3 = lithium carbonate; H3BO3 = boric acid; kst = thousand metric
tonnes.
|
|
|
2. |
Totals may differ due to rounding, mineral reserves reported on a dry in-situ basis. The Contained and Recovered Lithium Carbonate (Li2CO3) and Boric Acid (H3BO3) are reported in the table above in short
tons. Lithium is converted to Equivalent Contained Tonnes of Lithium Carbonate (Li2CO3) using a stochiometric conversion factor of 5.322, and boron is converted to Equivalent Contained Tonnes of Boric Acid (H3BO3) using a stochiometric
conversion factor of 5.718. Equivalent stochiometric conversion factors are derived from the molecular weights of the individual elements which make up Lithium Carbonate (Li2CO3) and Boric Acid (H3BO3). The Equivalent Recovered Tons of
Lithium Carbonate (Li2CO3) and Boric Acid (H3BO3) is the portion of the contained tonnage that can be recovered after processing.
|
|
|
3. |
The statement of estimates of mineral reserves has been compiled by Independent Mining Consultants, Inc. (IMC) and is independent of ioneer and its affiliates. IMC has sufficient experience that is relevant
to the style of mineralisation and type of deposit under consideration and to the activity being undertaken to qualify as a Competent Person as defined in Subpart 1300.
|
|
|
4. |
The mineral reserve estimate is the result of determining the measured and indicated resource that is economically minable allowing for the conversion to proven and probable. In making this determination,
constraints were applied to the geological model based upon a pit optimization analysis that defined a conceptual pit shell limit. The conceptual pit shell was based upon a net value per ton calculation including a 5,000ppm boron cut-off
grade for high boron – high lithium (HiB-Li) mineralization (Stream 1) and $11.13 Net value per tonne cut-off for low boron (LoB-Li) mineralization below 5,000ppm boron broke in to two material types low clay and high clay material
respectfully (Stream 2 and Stream 3). The conceptual pit shell was constrained by the measured and indicated resource that incorporates the potential mining, metallurgical and processing grade parameters identified by mining,
metallurgical and processing studies performed to date on the Project. The conceptual pit shell was used as a guide for an engineered pit design. Key inputs in developing the mineral reserve pit shell included a 5,000ppm boron cut-off
grade for HiB-Li mineralization, $11.13 Net Value per tonne cut-off for LoB-Li low clay mineralization and $11.13 Net value per tonne cut-off for LoB-Li high clay mineralization; base mining cost of US$1.69/tonne and incremental cost of
$0.055/tonne per bench below 6220ft elevation; plant feed processing and grade control costs which range between US$52.92/tonne and US$82.55/ton of plant feed for stream 1, US$18.87 and US$98.62 for streams 2&3; boron and lithium
recovery for Stream 1: M5= of 80.2% and 85.7%, B5=80.2% and 78.3%, S5=77.0% and 82.5%, L6=75.8% and 79.4%; Stream 2 and 3: M5 65% and 78%, B5 78.3% and 85.2%, S5 46.8% and 84.8%, L6 32.9% and 78.7%, respectively; boric acid sales price
of US$1,172.78/tonne; lithium carbonate sales price of $19,351.38/tonne.
|
|
|
5. |
Ore reserves are based on a block model that is 7.62m x 7.62m in plan and 9.14m high. The model block size used for the ore reserve estimate is based on selected mining equipment and approached used within
the mine plan. As a result, the dilution and ore loss are incorporated within the block model.
|
|
|
6. |
All ore reserve figures represent estimates as of August 2025. Ore reserve estimates are not precise calculations, being dependent on the interpretation of limited information on the location, shape and
continuity of the occurrence and on the available sampling results. The totals have been rounded to reflect the relative uncertainty of the estimate. Totals may not sum due to rounding.
|
|
|
7. |
Mineral reserves are reported in accordance with the US SEC Regulation S-K Subpart 1300. The mineral reserves in this report were estimated and reported using the regulation S-K §229.1304 of the United
States Securities and Exchange Commission (“SEC”). Mineral reserves are also reported in accordance with the Australasian Code for Reporting of Exploration Results, Mineral Resources and Ore Reserves (The Joint Ore Reserves Committee
Code – JORC 2012 Edition).
|
|
|
8. |
The mineral reserve is reported exclusive of mineral resources.
|
|
Group
|
Classification
|
Tonnes
(Mt)
|
Li
(ppm)
|
B
(ppm)
|
Li2CO3
(wt. %)
|
H3BO3
(wt. %)
|
Li2CO3
(kt)
|
H3BO3
(kt)
|
|
August 2025
Reserve
|
Proved
|
89.5
|
1,574
|
6,589
|
0.84
|
3.77
|
750
|
3,373
|
|
Probable
|
170.8
|
1,386
|
4,473
|
0.74
|
2.56
|
1,260
|
4,369
|
|
|
Total
|
260.3
|
1,451
|
5,201
|
0.77
|
2.97
|
2,010
|
7,742
|
|
|
October 2023
Reserve
|
Proved
|
29.0
|
1,900
|
16,250
|
1.00
|
9.30
|
290
|
2,700
|
|
Probable
|
31.5
|
1,700
|
14,650
|
0.90
|
8.40
|
280
|
2,620
|
|
|
Total
|
60.5
|
1,796
|
15,417
|
0.95
|
8.83
|
580
|
5,320
|
|
|
Variation
|
Proved
|
60.5
|
-326
|
-9,661
|
460
|
673
|
||
|
Probable
|
139.3
|
-314
|
-10,177
|
980
|
1,749
|
|||
|
Total
|
199.8
|
-345
|
-10,216
|
1,440
|
2,422
|
|
|
• |
Decrease in vat resident leach time;
|
|
|
• |
Optimization of acid consumption; and
|
|
|
• |
Inclusion of Stream 2 and Stream 3
|
| • |
the last day of the fiscal year during which we have total annual gross revenues of US$1,235,000,000 (as such amount is indexed for inflation every five years by the SEC) or more;
|
| • |
the last day of our fiscal year following the fifth anniversary of the completion of our first sale of common equity securities pursuant to an effective registration statement under the Securities Act,
which is currently expected to be June 30, 2028, unless we change our fiscal year to December 31, in which case such date will be December 31, 2027;
|
| • |
the date on which we have, during the previous three-year period, issued more than US$1,000,000,000 in non-convertible debt; or
|
| • |
the date on which we are deemed to be a “large accelerated filer”, as defined in Rule 12b-2 of the U.S. Securities Exchange Act of 1934, as amended, or the Exchange
Act, which would occur in future fiscal years if the market value of our ordinary shares and ADSs that are held by non-affiliates exceeds US$700,000,000 as of the last day of our most recently-completed second fiscal quarter.
|
| B. |
Business Overview
|
| • |
Binding lithium offtake supply agreement between the Company and EcoPro Innovation Co. Ltd, a three-year agreement for a total of 7,000 tpa of technical-grade lithium carbonate, upon commencement of
production.
|
| • |
Binding lithium offtake supply agreement between the Company and the Ford Motor Company, a five-year agreement for a total of 7,000 tpa of technical-grade lithium carbonate, upon commencement of production.
|
| • |
Binding lithium offtake supply agreement between the Company and PPES, a joint venture between Toyota Motor Corporation and Panasonic Corporation, a five-year agreement for a total of 4,000 tpa of
technical-grade lithium carbonate, upon commencement of production.
|
| • |
Binding lithium offtake supply agreement between the Company and Dragonfly Energy Holdings, a three-year agreement for a total of 250 tpa of technical-grade lithium carbonate, upon commencement of
production.
|
| • |
Binding boric acid offtake agreement between the Company and Dalian Jinma Boron Technology, a five-year agreement for 105,000 tpa of boric acid, upon commencement of production.
|
| • |
Three-year boric acid distribution and sales agreement with Kintamani Resources Pte Limited for certain minimum sales volume targets of boric acid, upon commencement of production.
|
| • |
Three-year boric acid distribution and sales agreement with Boron Bazar Limited for certain minimum sales volume targets of boric acid, upon commencement of production.
|
| • |
fluctuations in the market prices for lithium or boron;
|
| • |
fluctuating supplies of lithium or boron;
|
| • |
changes in the demand for, or market prices of, lithium or boron; and
|
| • |
mining activities of others.
|
| • |
require notice to stakeholders of proposed and ongoing operations;
|
| • |
require the installation of pollution control equipment;
|
| • |
restrict the types, quantities and concentration of various substances that can be released into the environment in connection with mining or drilling activities;
|
| • |
limit or prohibit mining or drilling activities on lands located within wetlands, areas inhabited by endangered species and other protected areas, or otherwise restrict or prohibit activities that could
impact the environment, including scarce water resources;
|
| • |
impose substantial liabilities for pollution resulting from current or former operations on or for any preexisting environmental impacts at the Project site; and
|
| • |
require preparation of an Environmental Assessment or an Environmental Impact Statement.
|
| • |
NEPA, which requires evaluation of the environmental impacts of mining operations that require federal approvals;
|
| • |
Clean Air Act, or CAA, and its amendments, which governs air emissions;
|
| • |
Clean Water Act, or CWA, which governs discharges to and excavations within the waters of the United States;
|
| • |
Safe Drinking Water Act, or SDWA, which governs the underground injection and disposal of wastewater;
|
| • |
FLPMA, which governs BLM’s management of the federal public lands;
|
| • |
Resource Conservation and Recovery Act, or RCRA, which governs the management of solid waste;
|
| • |
Comprehensive Environmental Response, Compensation, and Liability Act, or CERCLA, which imposes liability where hazardous substances have been released into the environment (commonly known as Superfund);
and
|
| • |
Federal Mine Safety and Health Act, which established the primary safety and health standards regarding working conditions of employees engaged in mining, related operations, and preparation and milling of
the minerals extracted, as well as the Occupational Safety and Health Act, which regulates the protection of the health and safety of workers to the extent such protection is not already addressed by the Federal Mine Safety and Health
Act.
|
| C. |
Organizational Structure
|
| D. |
Property, Plant and Equipment
|
| ITEM 4A |
UNRESOLVED STAFF COMMENTS
|
| ITEM 5. |
OPERATING AND FINANCIAL REVIEW AND PROSPECTS
|
| A. |
Operating Results
|
|
Consolidated Statement of Profit and Loss and Other
Comprehensive Income
(in thousands)
|
Fiscal
2025
|
Fiscal
2024
|
Fiscal
2023
|
|||||||||
|
|
US$’000
|
US$’000
|
US$’000
|
|||||||||
|
Exploration expenditure written off
|
(37
|
)
|
(31
|
)
|
(45
|
)
|
||||||
|
Other income
|
-
|
-
|
-
|
|||||||||
|
Employee benefits expensed
|
(6,372
|
)
|
(5,344
|
)
|
(5,967
|
)
|
||||||
|
Other expenses
|
(3,787
|
)
|
(3,850
|
)
|
(3,684
|
)
|
||||||
|
Loss from operating activities
|
(10,196
|
)
|
(9,225
|
)
|
(9,696
|
)
|
||||||
|
Finance income
|
653
|
1,411
|
3,321
|
|||||||||
|
Finance costs
|
(11
|
)
|
(11
|
)
|
(16
|
)
|
||||||
|
Net finance income / (costs)
|
642
|
1,400
|
3,305
|
|||||||||
|
Loss before tax
|
(9,554
|
)
|
(7,825
|
)
|
(6,391
|
)
|
||||||
|
Income tax expense
|
-
|
-
|
-
|
|||||||||
|
Loss for the year
|
(9,554
|
)
|
(7,825
|
)
|
(6,391
|
)
|
||||||
|
Loss attributable to equity holders of the company
|
(9,554
|
)
|
(7,825
|
)
|
(6,391
|
)
|
||||||
|
Consolidated Statement of Financial Position (in thousands)
|
Fiscal
2025
|
Fiscal
2024
|
||||||
|
|
US$’000
|
US$’000
|
||||||
|
Current assets
|
||||||||
|
Cash assets
|
25,059
|
35,715
|
||||||
|
Receivables
|
192
|
324
|
||||||
|
Prepayments
|
16
|
19
|
||||||
|
Total current assets
|
25,267
|
36,058
|
||||||
|
Non-current assets
|
||||||||
|
Receivables
|
289
|
276
|
||||||
|
Plant and equipment
|
289
|
406
|
||||||
|
Right of use asset
|
334
|
71
|
||||||
|
Exploration and evaluation expenditure
|
203,110
|
187,664
|
||||||
|
Other
|
4,252
|
-
|
||||||
|
Total non-current assets
|
208,274
|
188,417
|
||||||
|
Total assets
|
233,541
|
224,475
|
||||||
|
Current liabilities
|
||||||||
|
Payables
|
2,408
|
4,543
|
||||||
|
Lease liabilities
|
106
|
41
|
||||||
|
Provisions
|
462
|
428
|
||||||
|
Borrowings
|
-
|
1,200
|
||||||
|
Total current liabilities
|
2,976
|
6,212
|
||||||
|
Non-current liabilities
|
||||||||
|
Lease liabilities – non-current
|
267
|
42
|
||||||
|
Total non-current liabilities
|
267
|
42
|
||||||
|
Total liabilities
|
3,243
|
6,254
|
||||||
|
Net assets
|
230,298
|
218,221
|
||||||
|
Equity
|
||||||||
|
Contributed equity
|
302,651
|
281,671
|
||||||
|
Reserves
|
(2,447
|
)
|
(3,098
|
) | ||||
|
Accumulated losses
|
(69,906
|
)
|
(60,352
|
) | ||||
|
Total equity
|
230,298
|
218,221
|
||||||
|
Expenses incurred (in thousands)
|
Fiscal
2025
|
Fiscal
2024
|
Fiscal
2023
|
|||||||||
|
|
US$’000
|
US$’000
|
US$’000
|
|||||||||
|
Exploration expenditure written off
|
(37
|
)
|
(31
|
)
|
(45
|
)
|
||||||
|
Employee benefits expensed
|
(6,372
|
)
|
(5,344
|
)
|
(5,967
|
)
|
||||||
|
Other expenses
|
(3,787
|
)
|
(3,850
|
)
|
(3,684
|
)
|
||||||
|
Finance costs
|
(11
|
)
|
(11
|
)
|
(16
|
)
|
||||||
| • |
Employee benefits expense increased US$1,028,000;
|
| • |
Other expenses decreased US$63,000;
|
| • |
Finance income decreased US$758,000; and
|
| • |
Employee benefits expense decreased US$623,000;
|
| • |
Other expenses increased US$3,215,000;
|
| • |
Finance income decreased US$1,910,000; and
|
| • |
Finance costs decreased US$5,000.
|
|
Consolidated Statement of Cash Flows (in thousands)
|
Fiscal
2025
|
Fiscal
2024
|
Fiscal
2023
|
|||||||||
|
|
US$’000
|
US$’000
|
US$’000
|
|||||||||
|
Cash flows from operating activities
|
||||||||||||
|
Payment to suppliers and employees
|
(6,805
|
)
|
(7,198
|
)
|
(8,069
|
)
|
||||||
|
Interest and other finance costs paid
|
-
|
-
|
-
|
|||||||||
|
Net cash flows used in operating activities
|
(6,805
|
)
|
(7,198
|
)
|
(8,069
|
)
|
||||||
|
Cash flows from investing activities
|
||||||||||||
|
Expenditure on mining exploration
|
(14,510
|
)
|
(36,635
|
)
|
(33,333
|
)
|
||||||
|
Purchase of equipment
|
-
|
(2
|
)
|
(601
|
)
|
|||||||
|
Interest received
|
680
|
1,254
|
1,462
|
|||||||||
|
Net cash flows used in investing activities
|
(13,830
|
)
|
(35,383
|
)
|
(32,472
|
)
|
||||||
|
Cash flows from financing activities
|
||||||||||||
|
Proceeds from the issue of shares
|
16,412
|
25,141
|
-
|
|||||||||
|
Proceeds from borrowings
|
-
|
1,200
|
-
|
|||||||||
|
Repayments of borrowings
|
(1,200
|
)
|
-
|
-
|
||||||||
|
Proceeds from exercise of options
|
-
|
55
|
-
|
|||||||||
|
Equity raising expenses
|
(618
|
)
|
(780
|
)
|
(12
|
)
|
||||||
|
Payments of lease liability
|
(140
|
)
|
(130
|
)
|
(213
|
)
|
||||||
|
Payment for establishment of loan
|
(4,252
|
)
|
-
|
-
|
||||||||
|
Net cash flows received / (used in) financing activities
|
10,202
|
25,486
|
(225
|
)
|
||||||||
|
Net increase / (decrease) in cash held
|
(10,433
|
)
|
(17,095
|
)
|
(40,766
|
)
|
||||||
|
Cash at the beginning of the financial year
|
35,715
|
52,709
|
94,177
|
|||||||||
|
Effect of exchange rate fluctuations on balances of cash held in USD
|
(223
|
)
|
101
|
(702
|
)
|
|||||||
|
Closing cash carried forward
|
25,059
|
35,715
|
52,709
|
|||||||||
| B. |
Liquidity and Capital Resources
|
| C. |
Research and Development, Patents and Licenses
|
| D. |
Trend Information
|
| E. |
Critical Accounting Estimates
|
| A. |
Directors and Senior Management
|
|
Name
|
|
Age
|
|
Position
|
|
|
James D. Calaway
|
|
|
68
|
|
Executive Chairman
|
|
Bernard Rowe
|
|
|
58
|
|
Managing Director & Chief Executive Officer
|
|
Alan Davies
|
|
|
54
|
|
Independent Non-executive Director
|
|
Rose McKinney-James
|
|
|
73
|
|
Independent Non-executive Director
|
|
Margaret Walker
|
|
|
73
|
|
Independent Non-executive Director
|
|
Timothy Woodall
|
58
|
Independent Non-executive Director
|
|||
|
Ian Bucknell
|
|
|
55
|
|
Chief Financial Officer & Company Secretary
|
|
Ken Coon
|
|
|
65
|
|
Vice President of Human Resources
|
|
Yoshio Nagai
|
|
|
64
|
|
Vice President Commercial Sales & Marketing
|
|
Matt Weaver
|
|
|
59
|
|
Senior Vice President of Engineering & Operations
|
|
Chad Yeftich
|
|
|
50
|
|
Vice President Corporate Development & External Affairs
|
| B. |
Compensation
|
| • |
we are currently focused on undertaking exploration, appraisal and development activities;
|
| • |
risks associated with developing resource companies whilst exploring and developing projects; and
|
| • |
other than profit which may be generated from asset sales, we do not expect to be undertaking profitable operations until sometime after the commencement of commercial production on any of our projects.
|
| • |
Fixed: Annual base salary.
|
| • |
Variable short-term incentive: annual cash bonus.
|
| • |
Variable equity: performance rights granted under shareholder approved equity incentive plans
|
| • |
Post-employment benefits: superannuation contributions and similar retirement benefits savings for non-Australian executives.
|
| • |
Adequate financial incentives, commensurate with the market to attract and retain suitably qualified and experienced directors to replace existing non-executive directors;
|
| • |
Appropriate arrangements to be put in place to ensure a smooth transition on replacement of directors, including a period of overlap if required; and
|
| • |
Increases in non-executive directors in the future should it be considered appropriate.
|
|
Name
|
||||||||||||||||||||||||||||
|
(Position)
|
Year
|
Base Salary
|
Super-annuation
|
Health & Life Benefits
|
Non-
Monetary
Benefits1
|
STI
|
Long
Service
Leave
|
|
Share
Based
Payment
Options
& Rights2
|
|
Total
Statutory
Remuneration
|
% of performance- based rem
|
||||||||||||||||
|
Non-Executive Director
|
||||||||||||||||||||||||||||
|
Alan Davies
|
2025
|
65,000
|
-
|
-
|
-
|
-
|
- |
15,000
|
80,000
|
19
|
%
|
|||||||||||||||||
|
|
2024
|
65,000
|
-
|
-
|
-
|
-
|
-
|
35,807
|
100,807
|
36
|
%
|
|||||||||||||||||
|
Stephen Gardiner
|
2025
|
52,600
|
-
|
-
|
-
|
-
|
- |
46,681
|
99,281
|
47
|
%
|
|||||||||||||||||
|
|
2024
|
65,000
|
-
|
-
|
-
|
-
|
-
|
64,658
|
129,658
|
50
|
%
|
|||||||||||||||||
|
Rose McKinney-James
|
2025
|
65,000
|
-
|
-
|
-
|
-
|
- |
15,000
|
80,000
|
19
|
%
|
|||||||||||||||||
|
|
2024
|
65,000
|
-
|
-
|
-
|
-
|
-
|
48,609
|
113,049
|
43
|
%
|
|||||||||||||||||
|
Margaret R Walker
|
2025
|
65,000
|
-
|
-
|
-
|
-
|
- |
15,000
|
80,000
|
19
|
%
|
|||||||||||||||||
|
|
2024
|
65,000
|
-
|
-
|
-
|
-
|
-
|
48,049
|
113,609
|
43
|
%
|
|||||||||||||||||
|
Timothy Woodall
|
2025
|
12,400
|
-
|
-
|
-
|
-
|
- |
972
|
13,372
|
7
|
%
|
|||||||||||||||||
|
|
2024
|
- |
-
|
-
|
-
|
-
|
-
|
-
|
-
|
-
|
||||||||||||||||||
|
Executive Director
|
||||||||||||||||||||||||||||
|
James D Calaway
|
2025
|
462,500
|
-
|
-
|
-
|
82,180
|
-
|
340,591
|
885,271
|
48
|
%
|
|||||||||||||||||
|
|
2024
|
462,000
|
-
|
-
|
-
|
188,000
|
-
|
146,767
|
796,767
|
42
|
%
|
|||||||||||||||||
|
Bernard Rowe
|
2025
|
421,009
|
19,454
|
3,742
|
-
|
144,546
|
7,255
|
844,085
|
1,440,091
|
69
|
%
|
|||||||||||||||||
|
|
2024
|
386,361
|
18,032
|
-
|
-
|
313,000
|
15,114
|
240,071
|
972,578
|
57
|
%
|
|||||||||||||||||
|
Executives
|
|
|||||||||||||||||||||||||||
|
Ian Bucknell
|
2025
|
298,209
|
19,454
|
4,081
|
66,438
|
4,962
|
571,535
|
964,679
|
66
|
%
|
||||||||||||||||||
|
|
2024
|
294,749
|
18,032
|
-
|
-
|
141,000
|
40,269
|
335,562
|
829,612
|
57
|
%
|
|||||||||||||||||
|
Ken Coon3
|
2025
|
200,333
|
-
|
1,033
|
3,950
|
29,325
|
-
|
309,602
|
544,243
|
62
|
%
|
|||||||||||||||||
|
|
2024
|
258,167
|
-
|
1,027
|
46,289
|
85,000
|
- |
199,807
|
590,289
|
48
|
%
|
|||||||||||||||||
|
Yoshio Nagai3
|
2025
|
212,298
|
11,490
|
4,116
|
-
|
30,905
|
-
|
312,068
|
570,877
|
60
|
%
|
|||||||||||||||||
|
|
2024
|
274,717
|
12,400
|
4,116
|
-
|
103,000
|
- |
215,971
|
610,203
|
52
|
%
|
|||||||||||||||||
|
Chad Yeftich
|
2025
|
291,067
|
8,070
|
15,869
|
-
|
52,908
|
-
|
398,909
|
766,823
|
59
|
%
|
|||||||||||||||||
|
|
2024
|
275,580
|
31,455
|
14,493
|
-
|
112,000
|
- |
234,278
|
667,807
|
52
|
%
|
|||||||||||||||||
|
Matt Weaver
|
2025
|
331,683
|
16,584
|
14,145
|
-
|
72,528
|
-
|
669,894
|
1,104,834
|
67
|
%
|
|||||||||||||||||
|
|
2024
|
312,524
|
15,809
|
6,127
|
-
|
165,000
|
-
|
314,123
|
813,582
|
59
|
%
|
|||||||||||||||||
|
Total
|
2025
|
2,477,099
|
75,052
|
42,985
|
3,950
|
478,830
|
12,217
|
3,539,336
|
6,629,470
|
|||||||||||||||||||
|
|
2024
|
2,524,097
|
95,728
|
25,763
|
46,289
|
1,107,000
|
55,383
|
1,884,261
|
5,738,522
|
|
(1)
|
Share based payment expense for the year ended 30 June 2025.
|
|
(2)
|
Ken Coon and Yoshio Nagai transitioned from full-time to part-time employment, effective January 1, 2025.
|
|
(3)
|
Non-monetary benefits relate to leased accommodation provided to executives located in Reno, Nevada.
|
|
Ordinary shares
|
Performance rights
|
Options
|
||||||||||||||||||||||||||||||||||||||||||
|
Name
|
Balance at
30/06/24
|
Acquired1
|
Disposed2
|
Other
|
Balance at
30/06/25
|
Balance
at
30/06/24
|
Net
change
|
Balance at
30/06/25
|
Balance at 30/06/24
|
Net change
|
Balance
at
30/06/25
|
|||||||||||||||||||||||||||||||||
|
Non-Executive Directors
|
||||||||||||||||||||||||||||||||||||||||||||
|
Alan Davies
|
4,774,045
|
252,214
|
-
|
-
|
5,026,259
|
252,214
|
(120,024
|
)
|
132,190
|
653,120
|
(326,797
|
)
|
326,323
|
|||||||||||||||||||||||||||||||
|
Stephen Gardiner3
|
71,449
|
252,214
|
-
|
-
|
323,663
|
452,214
|
(188,860
|
)
|
263,354
|
-
|
-
|
-
|
||||||||||||||||||||||||||||||||
|
Rose McKinney-James
|
417,856
|
252,214
|
-
|
-
|
670,070
|
252,214
|
(120,024
|
)
|
132,190
|
-
|
-
|
-
|
||||||||||||||||||||||||||||||||
|
Margaret R Walker
|
497,856
|
252,214
|
-
|
-
|
750,070
|
252,214
|
(120,024
|
)
|
132,190
|
-
|
-
|
-
|
||||||||||||||||||||||||||||||||
|
Timothy Woodall
|
-
|
75,000
|
-
|
-
|
75,000
|
-
|
200,000
|
200,000
|
-
|
-
|
-
|
|||||||||||||||||||||||||||||||||
|
Executive Directors
|
||||||||||||||||||||||||||||||||||||||||||||
|
James D Calaway
|
56,790,814
|
2,204,296
|
-
|
-
|
58,995,110
|
4,290,111
|
1,649,431
|
5,939,542
|
653,120
|
(326,797
|
)
|
326,323
|
||||||||||||||||||||||||||||||||
|
Bernard Rowe
|
67,112,580
|
2,496,567
|
-
|
-
|
69,609,147
|
6,486,978
|
5,419,879
|
11,906,857
|
-
|
-
|
-
|
|||||||||||||||||||||||||||||||||
|
Executives
|
||||||||||||||||||||||||||||||||||||||||||||
|
Ian Bucknell
|
4,028,649
|
2,873,416
|
(601,299
|
)
|
-
|
6,300,766
|
3,358,723
|
4,345,274
|
7,703,997
|
-
|
-
|
-
|
||||||||||||||||||||||||||||||||
|
Ken Coon
|
1,778,064
|
1,953,116
|
(842,754
|
)
|
-
|
2,888,426
|
1,893,150
|
1,679,735
|
3,572,885
|
-
|
-
|
-
|
||||||||||||||||||||||||||||||||
|
Yoshio Nagai
|
2,327,213
|
2,070,866
|
-
|
-
|
4,398,079
|
2,008,389
|
1,934,483
|
3,942,872
|
-
|
-
|
-
|
|||||||||||||||||||||||||||||||||
|
Matt Weaver
|
5,110,227
|
3,715,884
|
(1,511,517
|
)
|
-
|
7,314,594
|
3,816,390
|
5,066,719
|
8,883,109
|
-
|
-
|
-
|
||||||||||||||||||||||||||||||||
|
Chad Yeftich
|
1,664,167
|
2,371,796
|
(1,274,078
|
)
|
-
|
2,761,885
|
2,278,367
|
2,356,624
|
4,634,991
|
-
|
-
|
-
|
||||||||||||||||||||||||||||||||
|
Total
|
144,572,920
|
18,769,797
|
(4,229,648
|
)
|
-
|
159,113,069
|
25,340,964
|
22,103,213
|
47,444,177
|
1,306,240
|
(653,594
|
)
|
652,646
|
|||||||||||||||||||||||||||||||
| (1) |
Timothy Woodall held 75,000 ordinary shares upon his appointment in May 2025. All other ordinary shares acquired during the period were the direct result of the vesting of KMP PRs.
|
| (2) |
All disposals were made by KMP in their capacity as shareholders. Shares were disposed of to cover taxes, a routine process for Ken Coon, Matt Weaver and Chad Yeftich.
|
|
(3)
|
Closing balance represents balance on the date of retirement, which was May 5, 2025. Movement post-retirement has not been disclosed.
|
|
Name
|
Grant
Date
|
Vesting
Date
|
Expiry
Date
|
Fair
value
at
grant
|
Exercise
Price
|
Balance
at
30/06/24
|
Options
Granted
|
Options
Exercised
|
Options
Lapsed
|
Balance at
30/06/25
|
Financial
year to vest
|
||||||||||||||||||||||||
|
James D Calaway
|
14/11/2019 |
14/11/2020
|
14/11/2024
|
0.138
|
0.243
|
326,797
|
-
|
-
|
(326,797
|
)
|
-
|
2021
|
|||||||||||||||||||||||
|
|
16/11/2020
|
16/11/2021
|
16/11/2025
|
0.138
|
0.185
|
326,323
|
-
|
-
|
-
|
326,323
|
2022
|
||||||||||||||||||||||||
|
Sub Total
|
653,120
|
-
|
-
|
(326,797
|
)
|
326,323
|
|||||||||||||||||||||||||||||
|
Alan Davies
|
14/11/2019 |
14/11/2020
|
14/11/2024
|
0.138
|
0.243
|
326,797
|
-
|
-
|
(326,797
|
)
|
-
|
2021
|
|||||||||||||||||||||||
|
|
16/11/2020
|
16/11/2021
|
16/11/2025
|
0.138
|
0.185
|
326,323
|
-
|
-
|
-
|
326,323
|
2022
|
||||||||||||||||||||||||
|
Sub Total
|
653,120
|
-
|
-
|
(357,710
|
)
|
326,323
|
|||||||||||||||||||||||||||||
|
Total
|
1,306,240
|
-
|
-
|
(653,594
|
)
|
652,646
|
|||||||||||||||||||||||||||||
|
Name
|
||||||||||||||||||||||||||||||||||
|
Plan
|
Grant
Date
|
Vesting
Date
|
Fair
value at
grant
|
Balance
at
30/06/24
|
Rights
Granted
|
Rights
Vested
|
Rights
Lapsed
|
Balance at
30/06/25
|
%
vested
|
Financial
year to
vest
|
||||||||||||||||||||||||
|
James D Calaway
|
||||||||||||||||||||||||||||||||||
|
2021 LTI - time based
|
1/07/2021
|
1/07/2024
|
0.790
|
505,096
|
-
|
(505,096
|
)
|
-
|
-
|
100
|
%
|
2025
|
||||||||||||||||||||||
|
2021 LTI - performance based
|
1/07/2021
|
1/07/2024
|
0.724
|
757,644
|
-
|
(189,411
|
)
|
(568,233
|
)
|
-
|
25
|
%
|
2025
|
|||||||||||||||||||||
|
2022 LTI - time based
|
4/11/2022
|
1/07/2025
|
0.570
|
272,878
|
-
|
-
|
-
|
272,878
|
-
|
2026
|
||||||||||||||||||||||||
|
2022 LTI - performance based
|
4/11/2022
|
1/07/2025
|
0.525
|
409,317
|
-
|
-
|
-
|
409,317
|
-
|
2026
|
||||||||||||||||||||||||
|
2023 STI – time based
|
3/11/2023
|
1/07/2024
|
0.175
|
1,156,690
|
-
|
(1,156,690
|
)
|
-
|
-
|
100
|
%
|
2025
|
||||||||||||||||||||||
|
In lieu of director fees
|
3/11/2023
|
3/11/2024
|
0.175
|
353,099
|
-
|
(353,099
|
)
|
-
|
-
|
100
|
%
|
2025
|
||||||||||||||||||||||
|
2023 LTI - time based
|
3/11/2023
|
1/07/2026
|
0.175
|
334,155
|
-
|
-
|
-
|
334,155
|
-
|
2027
|
||||||||||||||||||||||||
|
2023 LTI - performance based
|
3/11/2023
|
1/07/2026
|
0.162
|
501,232
|
-
|
-
|
-
|
501,232
|
-
|
2027
|
||||||||||||||||||||||||
|
2024 LTI - performance based
|
1/11/2024
|
1/07/2027
|
0.280
|
-
|
1,178,594
|
-
|
1,178,594
|
-
|
2028
|
|||||||||||||||||||||||||
|
2024 LTI – time based
|
1/11/2024
|
1/07/2027
|
0.280
|
-
|
785,729
|
-
|
785,729
|
-
|
2028
|
|||||||||||||||||||||||||
|
2024 STI – time based
|
1/11/2024
|
1/07/2025
|
0.280
|
-
|
2,272,571
|
-
|
2,272,571
|
-
|
2026
|
|||||||||||||||||||||||||
|
In lieu of director fees
|
1/11/2024
|
1/11/2025
|
0.280
|
- |
185,066
|
- |
185,066
|
- |
2026
|
|||||||||||||||||||||||||
|
Sub Total
|
4,290,111 | 4,421,960 | (2,204,296 | ) |
(568,233
|
) |
5,939,542 | |||||||||||||||||||||||||||
|
Alan Davies
|
||||||||||||||||||||||||||||||||||
|
In lieu of director fees
|
3/11/2023
|
3/11/2024
|
0.154
|
252,214
|
-
|
(252,214
|
)
|
-
|
-
|
100
|
%
|
2025
|
||||||||||||||||||||||
|
In lieu of director fees
|
1/11/2024
|
1/11/2025
|
0.280
|
-
|
132,190
|
-
|
-
|
132,190
|
- |
|
2026
|
|||||||||||||||||||||||
|
Sub Total
|
252,214
|
132,190
|
(252,214
|
)
|
-
|
132,190
|
||||||||||||||||||||||||||||
|
Stephen Gardiner1
|
||||||||||||||||||||||||||||||||||
|
Granted on appointment
|
25/08/2022
|
25/08/2025
|
0.660
|
200,000
|
-
|
-
|
(3,467
|
)
|
196,533
|
2026
|
||||||||||||||||||||||||
|
In lieu of director fees
|
3/11/2023
|
3/11/2024
|
0.154
|
252,214
|
-
|
(252,214
|
)
|
-
|
-
|
100
|
%
|
2025
|
||||||||||||||||||||||
|
In lieu of director fees
|
1/11/2024
|
1/11/2025
|
0.280
|
-
|
132,190
|
-
|
(65,369
|
)
|
66,821
|
- |
2026
|
|||||||||||||||||||||||
|
Sub Total
|
452,214
|
132,190
|
(252,214
|
)
|
(68,836
|
)
|
263,354
|
|||||||||||||||||||||||||||
|
Rose McKinney-James
|
||||||||||||||||||||||||||||||||||
|
In lieu of director fees
|
3/11/2023
|
3/11/2024
|
0.154
|
252,214
|
-
|
(252,214
|
)
|
-
|
-
|
100
|
%
|
2025
|
||||||||||||||||||||||
|
In lieu of director fees
|
1/11/2024
|
1/11/2025
|
0.280
|
132,190
|
-
|
-
|
132,190
|
- |
2026
|
|||||||||||||||||||||||||
| (1) |
Non-executive director Stephen Gardiner retired on 5 May 2025. The Board approved that his performance rights will be pro-rated over the performance period to his retirement date and will vest on the original date.
|
| Name | ||||||||||||||||||||||||||||||||||
|
Plan
|
Grant
Date
|
Vesting
Date
|
Fair
value at
grant
|
Balance
at
30/06/24
|
Rights
Granted
|
Rights
Vested
|
Rights
Lapsed
|
Balance at
30/06/25
|
%
vested
|
Financial
year to
vest
|
||||||||||||||||||||||||
| Sub Total |
252,214
|
132,190
|
(252,214
|
) | - |
132,190
|
||||||||||||||||||||||||||||
|
Margaret R Walker
|
||||||||||||||||||||||||||||||||||
|
In lieu of director fees
|
3/11/2023
|
3/11/2024
|
0.154
|
252,214
|
-
|
(252,214
|
)
|
-
|
-
|
100
|
%
|
2025
|
||||||||||||||||||||||
|
In lieu of director fees
|
3/11/2023
|
3/11/2024
|
0.240
|
-
|
132,190
|
-
|
-
|
132,190
|
-
|
2026
|
||||||||||||||||||||||||
|
Sub Total
|
252,214
|
132,190
|
(252,214
|
)
|
-
|
132,190
|
||||||||||||||||||||||||||||
|
Timothy Woodall
|
||||||||||||||||||||||||||||||||||
|
Granted on appointment2
|
5/05/2025
|
4/05/2028
|
0.135
|
-
|
200,000
|
-
|
-
|
200,000
|
-
|
2028
|
||||||||||||||||||||||||
|
Sub Total
|
-
|
200,000
|
-
|
-
|
200,000
|
|||||||||||||||||||||||||||||
|
Ian Bucknell
|
||||||||||||||||||||||||||||||||||
|
2021 LTI - time based
|
1/07/2021
|
1/07/2024
|
0.330
|
290,268
|
-
|
(290,268
|
)
|
-
|
-
|
100
|
%
|
2025
|
||||||||||||||||||||||
|
2021 LTI - performance based
|
1/07/2021
|
1/07/2024
|
0.371
|
435,402
|
-
|
(108,851
|
)
|
(326,551
|
)
|
-
|
25
|
%
|
2025
|
|||||||||||||||||||||
|
2022 LTI - time based
|
1/07/2022
|
1/07/2025
|
0.425
|
292,581
|
-
|
-
|
-
|
292,581
|
-
|
2026
|
||||||||||||||||||||||||
|
2022 LTI - performance based
|
1/07/2022
|
1/07/2025
|
0.453
|
438,871
|
-
|
-
|
-
|
438,871
|
-
|
2026
|
||||||||||||||||||||||||
|
2023 STI – time based
|
1/07/2023
|
1/07/2024
|
0.340
|
853,586
|
-
|
(853,586
|
)
|
-
|
-
|
100
|
%
|
2025
|
||||||||||||||||||||||
|
2023 LTI - time based
|
1/07/2023
|
1/07/2026
|
0.340
|
419,206
|
-
|
-
|
-
|
419,206
|
-
|
2027
|
||||||||||||||||||||||||
|
2023 LTI - performance based
|
1/07/2023
|
1/07/2026
|
0.599
|
628,809
|
-
|
-
|
-
|
628,809
|
-
|
2027
|
||||||||||||||||||||||||
|
2024 STI – time based
|
1/07/2024
|
1/07/2025
|
0.149
|
-
|
1,717,742
|
-
|
-
|
1,717,742
|
-
|
2026
|
||||||||||||||||||||||||
|
2024 LTI - time based
|
1/07/2024
|
1/07/2027
|
0.149
|
-
|
989,382
|
-
|
-
|
989,382
|
-
|
2028
|
||||||||||||||||||||||||
|
2024 LTI - performance based
|
1/07/2024
|
1/07/2027
|
0.149
|
-
|
1,484,073
|
-
|
-
|
1,484,073
|
-
|
2028
|
||||||||||||||||||||||||
|
ROD Bonus3
|
7/11/2024
|
8/11/2024
|
0.210
|
-
|
1,620,711
|
(1,620,711
|
)
|
-
|
-
|
100
|
%
|
2025
|
||||||||||||||||||||||
|
Supplemental 2024 LTI
|
1/03/2025
|
28/02/2029
|
0.145
|
-
|
866,666
|
-
|
-
|
866,666
|
-
|
2029
|
||||||||||||||||||||||||
|
Supplemental 2024 LTI
|
1/03/2025
|
28/02/2029
|
0.145
|
-
|
866,667
|
-
|
-
|
866,667
|
-
|
2029
|
||||||||||||||||||||||||
|
Sub Total
|
3,358,723
|
7,545,241
|
(2,873,416
|
)
|
(326,551
|
)
|
7,703,997
|
|||||||||||||||||||||||||||
|
Ken Coon
|
||||||||||||||||||||||||||||||||||
|
2021 LTI - time based
|
1/07/2021
|
1/07/2024
|
0.330
|
162,978
|
-
|
(162,978
|
)
|
-
|
-
|
100
|
%
|
2025
|
||||||||||||||||||||||
|
2021 LTI - performance based
|
1/07/2021
|
1/07/2024
|
0.371
|
244,466
|
-
|
(61,117
|
)
|
(183,349
|
)
|
-
|
25
|
%
|
2025
|
|||||||||||||||||||||
|
2022 LTI - time based
|
1/07/2022
|
1/07/2025
|
0.425
|
151,599
|
-
|
151,599
|
2026
|
|||||||||||||||||||||||||||
|
2022 LTI - performance based
|
1/07/2022
|
1/07/2025
|
0.453
|
227,398
|
-
|
227,398
|
2026
|
|||||||||||||||||||||||||||
|
2023 STI – time based
|
1/07/2023
|
1/07/2024
|
0.340
|
642,605
|
-
|
(642,605
|
)
|
-
|
642,605
|
100
|
%
|
2025
|
||||||||||||||||||||||
|
2023 LTI - time based
|
1/07/2023
|
1/07/2026
|
0.340
|
185,642
|
-
|
-
|
-
|
185,642
|
-
|
2027
|
||||||||||||||||||||||||
|
2023 LTI - performance based
|
1/07/2023
|
1/07/2026
|
0.599
|
278,462
|
-
|
-
|
-
|
278,462
|
-
|
2027
|
||||||||||||||||||||||||
|
2024 STI – time based
|
1/07/2024
|
1/07/2025
|
0.149
|
-
|
1,027,493
|
-
|
-
|
1,027,493
|
-
|
2026
|
||||||||||||||||||||||||
|
2024 LTI - time based
|
1/07/2024
|
1/07/2027
|
0.149
|
-
|
431,950
|
-
|
-
|
431,950
|
-
|
2028
|
||||||||||||||||||||||||
|
2024 LTI - performance based
|
1/07/2024
|
1/07/2027
|
0.149
|
-
|
647,925
|
-
|
-
|
647,925
|
-
|
2028
|
||||||||||||||||||||||||
|
ROD Bonus3
|
7/11/2024
|
8/11/2024
|
0.210
|
-
|
1,086,416
|
(1,086,416
|
)
|
-
|
-
|
100
|
%
|
2025
|
||||||||||||||||||||||
|
Supplemental 2024 LTI
|
1/03/2025
|
28/02/2029
|
0.145
|
-
|
311,208
|
-
|
-
|
311,208
|
-
|
2029
|
||||||||||||||||||||||||
|
Supplemental 2024 LTI
|
1/03/2025
|
28/02/2029
|
0.145
|
-
|
311,208
|
-
|
-
|
311,208
|
-
|
2029
|
||||||||||||||||||||||||
|
Sub Total
|
1,893,150
|
3,816,200 |
(1,953,116
|
)
|
(183,349
|
)
|
3,572,885
|
|||||||||||||||||||||||||||
| (2) |
Timothy Woodall was granted 200,000 performance rights on appointment and will be issued 200,000 fully paid ordinary shares on vesting, 3 years after date of appointment.
|
| Name |
||||||||||||||||||||||||||||||||||
|
Plan
|
Grant
Date
|
Vesting
Date
|
Fair
value at
grant
|
Balance
at
30/06/24
|
Rights
Granted
|
Rights
Vested
|
Rights
Lapsed
|
Balance at
30/06/25
|
%
vested
|
Financial
year to
vest
|
||||||||||||||||||||||||
|
Yoshio Nagai
|
||||||||||||||||||||||||||||||||||
|
2021 LTI - time based
|
1/07/2021
|
1/07/2024
|
0.330
|
173,416
|
-
|
(173,416
|
)
|
-
|
-
|
100
|
%
|
2025
|
||||||||||||||||||||||
|
2021 LTI - performance based
|
1/07/2021
|
1/07/2024
|
0.371
|
260,124
|
-
|
(65,031
|
)
|
(195,093
|
)
|
-
|
25
|
%
|
2025
|
|||||||||||||||||||||
|
2022 LTI - time based
|
1/07/2022
|
1/07/2025
|
0.425
|
160,695
|
-
|
-
|
160,695
|
2026
|
||||||||||||||||||||||||||
|
2022 LTI - performance based
|
1/07/2022
|
1/07/2025
|
0.453
|
241,042
|
-
|
-
|
241,042
|
2026
|
||||||||||||||||||||||||||
|
2023 STI – time based
|
1/07/2023
|
1/07/2024
|
0.340
|
681,162
|
-
|
(681,162
|
)
|
-
|
-
|
100
|
%
|
2025
|
||||||||||||||||||||||
|
2023 LTI - time based
|
31/08/2023
|
1/07/2026
|
0.240
|
196,780
|
-
|
-
|
-
|
196,780
|
-
|
2027
|
||||||||||||||||||||||||
|
2023 LTI - performance based
|
31/08/2023
|
1/07/2026
|
0.418
|
295,170
|
-
|
-
|
-
|
295,170
|
-
|
2027
|
||||||||||||||||||||||||
|
2024 STI – time based
|
1/07/2024
|
1/07/2025
|
0.149
|
-
|
1,025,079
|
-
|
-
|
1,025,079
|
-
|
2026
|
||||||||||||||||||||||||
|
2024 LTI - time based
|
1/07/2024
|
1/07/2027
|
0.149
|
-
|
457,738
|
-
|
-
|
457,738
|
-
|
2028
|
||||||||||||||||||||||||
|
2024 LTI - performance based
|
1/07/2024
|
1/07/2027
|
0.149
|
-
|
686,607
|
-
|
-
|
686,607
|
-
|
2028
|
||||||||||||||||||||||||
|
ROD Bonus3
|
7/11/2024
|
8/11/2024
|
0.210
|
-
|
1,151,277
|
(1,151,277
|
)
|
-
|
-
|
100
|
%
|
2025
|
||||||||||||||||||||||
|
Supplemental 2024 LTI
|
1/03/2025
|
28/02/2029
|
0.145
|
-
|
329,880
|
-
|
-
|
329,880
|
-
|
2029
|
||||||||||||||||||||||||
|
Supplemental 2024 LTI
|
1/03/2025
|
28/02/2029
|
0.145
|
-
|
329,881
|
-
|
-
|
329,881
|
-
|
2029
|
||||||||||||||||||||||||
|
Sub Total
|
2,008,389
|
3,980,462
|
(2,070,886
|
)
|
(195,093
|
)
|
3,722,872
|
|||||||||||||||||||||||||||
|
Bernard Rowe
|
||||||||||||||||||||||||||||||||||
|
2021 LTI - time based
|
5/11/2021
|
1/07/2024
|
0.790
|
540,220
|
-
|
(540,220
|
)
|
-
|
-
|
100
|
%
|
2025
|
||||||||||||||||||||||
|
2021 LTI - performance based
|
5/11/2021
|
1/07/2024
|
0.724
|
810,331
|
-
|
(202,583
|
)
|
(607,748
|
)
|
-
|
25
|
%
|
2025
|
|||||||||||||||||||||
|
2022 LTI - time based
|
1/07/2022
|
1/07/2025
|
0.570
|
560,084
|
-
|
-
|
-
|
560,084
|
2026
|
|||||||||||||||||||||||||
|
2022 LTI - performance based
|
1/07/2022
|
1/07/2025
|
0.525
|
840,125
|
-
|
-
|
-
|
840,125
|
2026
|
|||||||||||||||||||||||||
|
2023 STI – time based
|
3/11/2023
|
1/07/2024
|
0.175
|
1,753,764
|
-
|
(1,753,764
|
)
|
-
|
-
|
100
|
%
|
2025
|
||||||||||||||||||||||
|
2023 LTI - time based
|
3/11/2023
|
1/07/2026
|
0.175
|
792,982
|
-
|
-
|
-
|
792,982
|
-
|
2027
|
||||||||||||||||||||||||
|
2023 LTI - performance based
|
3/11/2023
|
1/07/2026
|
0.162
|
1,189,472
|
-
|
-
|
-
|
1,189,472
|
-
|
2027
|
||||||||||||||||||||||||
|
2024 STI – time based
|
1/07/2024
|
1/07/2025
|
0.149
|
-
|
3,806,452
|
-
|
-
|
3,806,452
|
-
|
2026
|
||||||||||||||||||||||||
|
2024 LTI - time based
|
1/07/2024
|
1/07/2027
|
0.149
|
-
|
1,887,097
|
-
|
-
|
1,887,097
|
-
|
2028
|
||||||||||||||||||||||||
|
2024 LTI - performance based
|
1/07/2024
|
1/07/2027
|
0.149
|
-
|
2,830,645
|
-
|
-
|
2,830,645
|
-
|
2028
|
||||||||||||||||||||||||
|
Sub Total
|
6,486,978
|
8,524,194
|
(2,496,567
|
)
|
(607,748
|
)
|
11,906,857
|
|||||||||||||||||||||||||||
|
Chad Yeftich
|
||||||||||||||||||||||||||||||||||
| Name | ||||||||||||||||||||||||||||||||||
| Plan |
Grant
Date
|
Vesting
Date
|
Fair
value at
grant
|
Balance
at
30/06/24
|
Rights
Granted
|
Rights
Vested
|
Rights
Lapsed
|
Balance at
30/06/25
|
%
vested
|
Financial
year to
vest
|
||||||||||||||||||||||||
|
2021 LTI - time based
|
5/11/2021
|
1/07/2024
|
0.510
|
223,084
|
-
|
(223,084
|
)
|
-
|
-
|
100
|
%
|
2025
|
||||||||||||||||||||||
|
2021 LTI - performance based
|
5/11/2021
|
1/07/2024
|
0.457
|
223,084
|
-
|
(55,771
|
)
|
(167,313
|
)
|
-
|
25
|
%
|
2025
|
|||||||||||||||||||||
|
2022 LTI - time based
|
1/07/2022
|
1/07/2025
|
0.615
|
204,658
|
-
|
-
|
-
|
204,658
|
-
|
2026
|
||||||||||||||||||||||||
|
2022 LTI - performance based
|
1/07/2022
|
1/07/2025
|
0.645
|
306,987
|
-
|
-
|
-
|
306,987
|
-
|
2026
|
||||||||||||||||||||||||
|
2023 STI – time based
|
1/07/2023
|
1/07/2024
|
0.340
|
694,014
|
-
|
(694,014
|
)
|
-
|
-
|
100
|
%
|
2025
|
||||||||||||||||||||||
|
2023 LTI - time based
|
31/08/2023
|
1/07/2026
|
0.240
|
250,616
|
-
|
-
|
-
|
250,616
|
-
|
2027
|
||||||||||||||||||||||||
|
2023 LTI - performance based
|
31/08/2023
|
1/07/2026
|
0.418
|
375,924
|
-
|
-
|
-
|
375,924
|
-
|
2027
|
||||||||||||||||||||||||
|
2024 STI – time based
|
1/07/2024
|
1/07/2025
|
0.149
|
-
|
1,353,872
|
-
|
-
|
1,353,872
|
-
|
2026
|
||||||||||||||||||||||||
|
2024 LTI - time based
|
1/07/2024
|
1/07/2027
|
0.149
|
-
|
588,290
|
-
|
-
|
588,290
|
-
|
2028
|
||||||||||||||||||||||||
|
2024 LTI - performance based
|
1/07/2024
|
1/07/2027
|
0.149
|
-
|
882,435
|
-
|
-
|
882,435
|
-
|
2028
|
||||||||||||||||||||||||
|
ROD Bonus3
|
7/11/2024
|
8/11/2024
|
0.210
|
-
|
1,398,927
|
(1,398,927
|
)
|
-
|
-
|
100
|
%
|
2025
|
||||||||||||||||||||||
|
Supplemental 2024 LTI
|
1/03/2025
|
28/02/2029
|
0.145
|
-
|
336,104
|
-
|
-
|
336,104
|
-
|
2029
|
||||||||||||||||||||||||
|
Supplemental 2024 LTI
|
1/03/2025
|
28/02/2029
|
0.145
|
-
|
336,105
|
-
|
-
|
336,105
|
-
|
2029
|
||||||||||||||||||||||||
|
Sub Total
|
2,278,367
|
4,895,733
|
(2,371,796
|
)
|
(167,313
|
)
|
4,634,991
|
|||||||||||||||||||||||||||
|
Matt Weaver
|
||||||||||||||||||||||||||||||||||
|
2021 LTI - time based
|
1/07/2021
|
1/07/2024
|
0.330
|
345,907
|
-
|
(345,907
|
)
|
-
|
-
|
100
|
%
|
2025
|
||||||||||||||||||||||
|
2021 LTI - performance based
|
1/07/2021
|
1/07/2024
|
0.371
|
518,860
|
-
|
(129,715
|
)
|
(389,145
|
)
|
-
|
25
|
%
|
2025
|
|||||||||||||||||||||
|
2022 LTI - time based
|
1/07/2022
|
1/07/2025
|
0.425
|
323,663
|
-
|
-
|
-
|
323,663
|
2026
|
|||||||||||||||||||||||||
|
2022 LTI - performance based
|
1/07/2022
|
1/07/2025
|
0.453
|
485,495
|
-
|
-
|
-
|
485,495
|
2026
|
|||||||||||||||||||||||||
|
2023 STI – time based
|
1/07/2023
|
1/07/2024
|
0.340
|
939,275
|
-
|
(939,275
|
)
|
-
|
-
|
100
|
%
|
2025
|
||||||||||||||||||||||
|
2023 LTI - time based
|
31/08/2023
|
1/07/2026
|
0.240
|
481,276
|
-
|
-
|
-
|
481,276
|
-
|
2027
|
||||||||||||||||||||||||
|
2023 LTI - performance based
|
31/08/2023
|
1/07/2026
|
0.418
|
721,914
|
-
|
-
|
-
|
721,914
|
-
|
2027
|
||||||||||||||||||||||||
|
2024 STI – time based
|
1/07/2024
|
1/07/2025
|
0.149
|
-
|
1,994,544
|
-
|
-
|
1,994,544
|
-
|
2026
|
||||||||||||||||||||||||
|
2024 LTI - time based
|
1/07/2024
|
1/07/2027
|
0.149
|
-
|
1,140,516
|
-
|
-
|
1,140,516
|
-
|
2028
|
||||||||||||||||||||||||
|
2024 LTI - performance based
|
1/07/2024
|
1/07/2027
|
0.149
|
-
|
1,710,775
|
-
|
-
|
1,710,775
|
-
|
2028
|
||||||||||||||||||||||||
|
ROD Bonus3
|
7/11/2024
|
8/11/2024
|
0.210
|
-
|
2,300,987
|
(2,300,987
|
)
|
-
|
-
|
100
|
%
|
2025
|
||||||||||||||||||||||
|
Supplemental 2024 LTI
|
1/03/2025
|
28/02/2029
|
0.145
|
-
|
1,012,463
|
-
|
-
|
1,012,463
|
-
|
2029
|
||||||||||||||||||||||||
|
Supplemental 2024 LTI
|
1/03/2025
|
28/02/2029
|
0.145
|
-
|
1,012,463
|
-
|
-
|
1,012,463
|
-
|
2029
|
||||||||||||||||||||||||
|
Sub Total
|
3,816,390
|
9,171,748
|
(3,715,884
|
)
|
(389,145
|
)
|
8,883,109
|
|||||||||||||||||||||||||||
|
Total
|
24,888,750
|
42,440,897
|
(18,279,625
|
)
|
(1,869,199
|
)
|
47,180,823
|
| (3) |
ROD bonuses are a one-off time-based grant issued to staff granted upon achievement of a positive Record of Decision, with a 1-day vesting period.
|
| C. |
Board Practices
|
| • |
Timothy Woodall (Chairman, independent, non-executive director);
|
| • |
Margaret R. Walker (independent, non-executive director); and
|
| • |
Alan Davies (independent, non-executive director).
|
| • |
Alan Davies (Chairman, independent, non-executive director);
|
| • |
Rose McKinney-James (independent, non-executive director); and
|
| • |
Timothy Woodall (independent, non-executive director.
|
| • |
Margaret R. Walker (Chairman, independent, non-executive director);
|
| • |
Alan Davies (independent, non-executive director); and
|
| • |
Bernard Rowe (managing director and CEO).
|
| • |
Rose McKinney-James (Chairman, independent, non-executive director);
|
| • |
James D. Calaway (executive director); and
|
| • |
Margaret R. Walker (independent, non-executive director).
|
| D. |
Employees
|
|
United
States
|
Australia
|
Canada
|
Netherlands
|
Singapore
|
||||||||||||||||
|
Employees
|
19
|
2
|
1
|
0
|
1
|
|||||||||||||||
|
Employee Contractors
|
4
|
1
|
0
|
1
|
2
|
|||||||||||||||
| E. |
Share Ownership
|
|
Ordinary Shares
Beneficially Owned(1)
|
||||||||
|
Shareholder
|
Number
|
Percent
|
||||||
|
Officers and Directors
|
||||||||
|
James D. Calaway(2)
|
62,125,625
|
2.329
|
%
|
|||||
|
Bernard Rowe(3)
|
74,426,906
|
2.790
|
%
|
|||||
|
Alan Davies(4)
|
5,784,772
|
0.217
|
%
|
|||||
|
Rose McKinney-James
|
802,260
|
0.030
|
%
|
|||||
|
Margaret R. Walker
|
1,155,380
|
0.043
|
%
|
|||||
|
Timothy Woodall(5)
|
375,000
|
0.014
|
%
|
|||||
|
Ian Bucknell
|
9,445,076
|
0.354
|
%
|
|||||
|
Ken Coon
|
4,010,738
|
0.150
|
%
|
|||||
|
Yoshio Nagai
|
5,847,241
|
0.219
|
%
|
|||||
|
Matt Weaver
|
9,882,323
|
0.370
|
%
|
|||||
|
Chad Yeftich
|
3,582,706
|
0.134
|
%
|
|||||
|
Officers and directors as a group (11 persons)
|
177,438,027
|
6.651
|
%
|
|||||
| (1) |
Beneficial ownership is determined according to the rules of the SEC and generally means that a person has beneficial ownership of a security if he, she or it possesses sole or shared voting or investment
power of that security, including options and performance rights that are currently exercisable or exercisable within 60 days of October 1, 2025. As of October 1, 2025, the number of options and performance rights beneficially owned by
each of our directors, our chief executive officer and other members of our senior management, currently exercisable or exercisable within 60 days of October 1, 2025 is 1,301,103.
|
| (2) |
56,268,106 ordinary shares are held of record by Lithium Investors Americas LLC, an entity controlled by Mr. Calaway. 5,346,130 ordinary shares are held of record in the name of Mr. Calaway. 326,323 options
(currently exercisable), and 185,066 Performance rights (vesting in the next 60 days) are held of record in the name of Mr. Calaway.
|
| (3) |
36,690,902 ordinary shares and 400,000 American Depositary Receipts are held of record by Mopti Pty Limited, an entity controlled by Mr. Rowe. 5,826,182 ordinary shares are held of record by Mopti
Management Pty Limited, an entity controlled by Mr. Rowe. 15,909,822 ordinary shares are held of record in the name of Mr. Rowe.
|
| (4) |
2,616,649 ordinary shares are held of record by Diversa Trustees Limited as trustee for HUB24 Super Fund, an entity controlled by Mr. Davies. 3,165,310 ordinary shares, 326,323 options (currently
exercisable), and 132,190 Performance rights (vesting in the next 60 days) are held of record in the name of Mr. Davies.
|
| (5) |
375,000 ordinary shares are held of record by Timothy Roy Woodall Superfund, an entity controlled by Mr. Davies.
|
| F. |
Disclosure of a registrant’s action to recover erroneously awarded compensation
|
| ITEM 7. |
MAJOR SHAREHOLDERS AND RELATED PARTY TRANSACTIONS
|
| A. |
Major Shareholders
|
|
Ordinary Shares
Beneficially Owned
|
||||||||
|
Shareholder
|
Number
|
Percent
|
||||||
|
Centaurus Capital LP(1)
|
428,342,433
|
16.1
|
%
|
|||||
|
Bank of New York Mellon Corporation(2)
|
196,113,790
|
7.4
|
%
|
|||||
| (1) |
John D. Arnold is the natural person with ultimate voting or investment control over Centaurus Capital LP and thus indirectly controls voting with regard to shares of ioneer owned by Centaurus Capital LP.
The address of Centaurus Capital LP is 1717 West Loop South, Suite 1800 Houston, TX 77027.
|
| (2) |
The Bank of New York Mellon, as depositary, registers and delivers American Depositary Shares, also referred to as ADSs. The depositary’s office at which the ADSs are administered and its principal
executive office are located at 240 Greenwich Street, New York, New York 10286.
|
| B. |
Related Party Transactions
|
| (a) |
enterprises that directly or indirectly through one or more intermediaries, control or are controlled by, or are under common control with us;
|
| (b) |
associates, meaning unconsolidated enterprises in which we have a significant influence or which have significant influence over us;
|
| (c) |
individuals owning, directly or indirectly, an interest in the voting power of us that gives them significant influence over our us, and close members of any such individual’s family;
|
| (d) |
key management personnel, that is, those persons having authority and responsibility for planning, directing and controlling the activities of ours, including directors and senior management of us and close
members of such individuals’ families; and
|
| (e) |
enterprises in which a substantial interest in the voting power is owned, directly or indirectly, by any person described in (c) or (d) above or over which such a person is able to exercise significant
influence, including enterprises owned by directors or major shareholders of us and enterprises that have a member of key management in common with us.
|
| C. |
Interests of Experts and Counsel
|
| ITEM 8. |
FINANCIAL INFORMATION.
|
| A. |
Consolidated Statements and Other Financial Information.
|
| B. |
Significant Changes
|
| ITEM 9. |
THE OFFER AND LISTING
|
| A. |
Offer and Listing Details
|
| B. |
Plan of Distribution
|
| C. |
Markets
|
| D. |
Selling Shareholders
|
| E. |
Dilution
|
| F. |
Expenses of the Issue
|
| ITEM 10. |
ADDITIONAL INFORMATION
|
| A. |
Share Capital
|
| B. |
Constitutional Documents
|
| • |
Dividend Rights. Under our Constitution, subject to the rights of persons (if any) entitled to shares with special rights to dividends, the directors may declare an
interim or final dividend be paid to the members in accordance with the Australian Corporations Act and may authorize the payment or crediting by us to the members of such a dividend. No dividend carries interest as against us. Under
the Australian Corporations Act, we must not pay a dividend unless: (a) our assets exceed our liabilities immediately before the dividend is declared and the excess is sufficient for the payment of the dividend; (b) the payment of the
dividend is fair and reasonable to our shareholders as a whole; and (c) the payment of the dividend does not materially prejudice our ability to pay our creditors. Unless the resolution for the payment of the dividend otherwise directs,
all dividends are to be apportioned and paid proportionately to the amounts paid, or credited as paid on the relevant shares.
|
| • |
Voting Rights. Holders of ordinary shares have one vote per person on a show of hands, or one vote for each fully paid ordinary share held (or for a partly paid share, a
fraction of a vote equal to the proportion which the amount paid up bears to the total issue price of the share) on all matters submitted to a vote of shareholders conducted by way of a poll.
|
| • |
the acquisition of a substantial interest if the Australian corporation is valued in excess of the applicable monetary threshold (see below);
|
| • |
any direct investment by a foreign government investor; and
|
| • |
the acquisition of shares in an Australian land corporation where applicable monetary thresholds are met.
|
| • |
a natural person not ordinarily resident in Australia;
|
| • |
a corporation in which a natural person not ordinarily resident in Australia, or a corporation incorporated outside of Australia, or a foreign government investor, holds a substantial interest (being a
direct or indirect, actual or potential, voting power of 20.0% or more);
|
| • |
a corporation in which two or more persons, each of whom is either a non-Australian resident, a non-Australian corporation or a foreign government investor, hold an aggregate substantial interest (being a
direct or indirect, actual or potential, voting power in aggregate of 40.0% or more);
|
| • |
a trustee of a trust or the general partner of a limited partnership in which a non-Australian resident, non-Australian corporation, or a foreign government investor, holds a substantial interest;
|
| • |
a trustee of a trust or the general partner of a limited partnership in which two or more persons, each of whom is either a non-Australian resident, a non-Australian corporation or a foreign government
investor, hold an aggregate substantial interest; or
|
| • |
a foreign government investor,
|
| • |
relatives (including spouse or de facto partner) of the person;
|
| • |
any person with whom the person is acting, or proposes to act, in concert in relation to an action;
|
| • |
any business partner of the person;
|
| • |
any entity of which the person is a senior officer;
|
| • |
any holding entity of the person or any senior officer of the person (where the person is a corporation);
|
| • |
any entity whose senior officers are accustomed or under an obligation, whether formal or informal, to act in accordance with the directions, instructions or wishes of the person or, where the person is an
entity, of the senior officers of the person;
|
| • |
any entity in accordance with the directions, instructions or wishes of which, or of the senior officers of which, the person is accustomed or under an obligation, whether formal or informal, to act;
|
| • |
any corporation in which the person holds a substantial interest;
|
| • |
where the person is a corporation—a person who holds a substantial interest in the corporation;
|
| • |
the trustee of a trust in which the person holds a substantial interest;
|
| • |
where the person is the trustee of a trust —a person who holds a substantial interest in the trust estate; and
|
| • |
where the person is a foreign government, a separate government entity or a foreign government investor in relation to a country other than Australia (or a part of that country):
|
| • |
is in a position to influence or participate in the central management and control of the entity or business (e.g. preferential, special or veto voting rights or the ability to appoint directors or asset
managers);
|
| • |
where the acquiring person has entered a legal arrangement relating to the businesses of that foreign person and the entity or business (e.g. contractual agreements including, but not restricted to,
agreements for loans, provision of services and off take agreements); or
|
| • |
is in a position to influence, participate in or determine the policy of the entity or business (e.g. building or maintaining a strategic or long-term relationship with a target entity).
|
| • |
a foreign government or separate government entity;
|
| • |
an entity in which a foreign government or separate government entity has a substantial interest of 20% or more; or
|
| • |
an entity in which foreign governments or separate government entities of more than one foreign country have an aggregate substantial interest of 40% or more (subject to certain exceptions).
|
| • |
Cash. The depositary will convert any cash dividend or other cash distribution we pay on the shares into U.S. dollars, if it can do so on a
reasonable basis and can transfer the U.S. dollars to the United States. If that is not possible or if any government approval is needed and cannot be obtained, the deposit agreement allows the depositary to distribute the foreign
currency only to those ADS holders to whom it is possible to do so. It will hold the foreign currency it cannot convert for the account of the ADS holders who have not been paid. It will not invest the foreign currency and it will not
be liable for any interest.
|
| • |
Shares. The depositary may distribute additional ADSs representing any shares we distribute as a dividend or free distribution. The depositary will
only distribute whole ADSs. It will sell shares which would require it to deliver a fraction of an ADS (or ADSs representing those shares) and distribute the net proceeds in the same way as it does with cash. If the depositary does not
distribute additional ADSs, the outstanding ADSs will also represent the new shares. The depositary may sell a portion of the distributed shares (or ADSs representing those shares) sufficient to pay its fees and expenses in connection
with that distribution.
|
| • |
Rights to purchase additional shares. If we offer holders of our securities any rights to subscribe for additional shares or any other rights, the
depositary may (i) exercise those rights on behalf of ADS holders, (ii) distribute those rights to ADS holders or (iii) sell those rights and distribute the net proceeds to ADS holders, in each case after deduction or upon payment of its
fees and expenses. To the extent the depositary does not do any of those things, it will allow the rights to lapse. In that case, you will receive no value for them. The depositary will
exercise or distribute rights only if we ask it to and provide satisfactory assurances to the depositary that it is legal to do so. If the depositary will exercise rights, it will purchase the securities to which the rights relate and
distribute those securities or, in the case of shares, new ADSs representing the new shares, to subscribing ADS holders, but only if ADS holders have paid the exercise price to the depositary. U.S. securities laws may restrict the
ability of the depositary to distribute rights or ADSs or other securities issued on exercise of rights to all or certain ADS holders, and the securities distributed may be subject to restrictions on transfer.
|
| • |
Other Distributions. The depositary will send to ADS holders anything else we distribute on deposited securities by any means it thinks is legal,
fair and practical. If it cannot make the distribution in that way, the depositary has a choice. It may decide to sell what we distributed and distribute the net proceeds, in the same way as it does with cash. Or, it may decide to hold
what we distributed, in which case ADSs will also represent the newly distributed property. However, the depositary is not required to distribute any securities (other than ADSs) to ADS holders unless it receives satisfactory evidence
from us that it is legal to make that distribution. The depositary may sell a portion of the distributed securities or property sufficient to pay its fees and expenses in connection with that distribution. U.S. securities laws may
restrict the ability of the depositary to distribute securities to all or certain ADS holders, and the securities distributed may be subject to restrictions on transfer.
|
| • |
60 days have passed since the depositary told us it wants to resign but a successor depositary has not been appointed and accepted its appointment;
|
| • |
we delist the ADSs from an exchange in the United States on which they were listed and do not list the ADSs on another exchange in the United States or make arrangements for trading of ADSs on the U.S.
over-the-counter market;
|
| • |
we delist our shares from an exchange on which they were listed and do not list the shares on another exchange;
|
| • |
the depositary has reason to believe the ADSs have become, or will become, ineligible for registration on Form F-6 under the Securities Act of 1933;
|
| • |
we appear to be insolvent or enter insolvency proceedings;
|
| • |
all or substantially all the value of the deposited securities has been distributed either in cash or in the form of securities;
|
| • |
there are no deposited securities underlying the ADSs or the underlying deposited securities have become apparently worthless; or
|
| • |
there has been a replacement of deposited securities.
|
| • |
are only obligated to take the actions specifically set forth in the deposit agreement without negligence or bad faith, and the depositary will not be a fiduciary or have any fiduciary duty to holders of
ADSs;
|
| • |
are not liable if we are or it is prevented or delayed by law or by events or circumstances beyond our or its ability to prevent or counteract with reasonable care or effort from performing our or its
obligations under the deposit agreement;
|
| • |
are not liable if we or it exercises discretion permitted under the deposit agreement;
|
| • |
are not liable for the inability of any holder of ADSs to benefit from any distribution on deposited securities that is not made available to holders of ADSs under the terms of the deposit agreement, or for
any special, consequential or punitive damages for any breach of the terms of the deposit agreement;
|
| • |
have no obligation to become involved in a lawsuit or other proceeding related to the ADSs or the deposit agreement on your behalf or on behalf of any other person;
|
| • |
are not liable for the acts or omissions of any securities depository, clearing agency or settlement system; and
|
| • |
the depositary has no duty to make any determination or provide any information as to our tax status, or any liability for any tax consequences that may be incurred by ADS holders as a result of owning or
holding ADSs or be liable for the inability or failure of an ADS holder to obtain the benefit of a foreign tax credit, reduced rate of withholding or refund of amounts withheld in respect of tax or any other tax benefit.
|
| • |
payment of stock transfer or other taxes or other governmental charges and transfer or registration fees charged by third parties for the transfer of any shares or other deposited securities;
|
| • |
satisfactory proof of the identity and genuineness of any signature or other information it deems necessary; and
|
| • |
compliance with regulations it may establish, from time to time, consistent with the deposit agreement, including presentation of transfer documents.
|
| • |
when temporary delays arise because: (i) the depositary has closed its transfer books or we have closed our transfer books; (ii) the transfer of shares is blocked to permit voting at a shareholders’
meeting; or (iii) we are paying a dividend on our ordinary shares;
|
| • |
when you owe money to pay fees, taxes and similar charges; or
|
| • |
when it is necessary to prohibit withdrawals in order to comply with any laws or governmental regulations that apply to ADSs or to the withdrawal of ordinary shares or other deposited securities.
|
| C. |
Material Contracts
|
| D. |
Exchange Controls
|
| E. |
Taxation
|
| • |
insurance companies;
|
| • |
banks or other financial institutions;
|
| • |
individual retirement and other tax-deferred accounts;
|
| • |
regulated investment companies;
|
| • |
real estate investment trusts;
|
| • |
individuals who are former U.S. citizens or former long-term U.S. residents;
|
| • |
brokers, dealers or traders in securities, commodities or currencies;
|
| • |
traders that elect to use a mark-to-market method of accounting;
|
| • |
persons holding the ADSs or ordinary shares through a partnership (including an entity or arrangement treated as a partnership for U.S. federal income tax purposes) or S corporation;
|
| • |
persons that received ADSs or ordinary shares as compensation for the performance of services;
|
| • |
grantor trusts;
|
| • |
tax-exempt entities;
|
| • |
persons that hold ADSs or ordinary shares as a position in a straddle or as part of a hedging, constructive sale, conversion or other integrated transaction for U.S. federal income tax purposes;
|
| • |
persons that have a functional currency other than the U.S. dollar;
|
| • |
persons that own (directly, indirectly or constructively) 10% or more of our equity (by vote or value); or
|
| • |
persons that are not U.S. Holders.
|
| • |
an individual who is a citizen or resident of the United States;
|
| • |
a corporation created or organized in or under the laws of the United States or any state thereof or the District of Columbia;
|
| • |
an estate the income of which is subject to U.S. federal income taxation regardless of its source; or
|
| • |
a trust (i) the administration of which is subject to the primary supervision of a court in the United States and for which one or more U.S. persons have the authority to control all substantial decisions
or (ii) that has an election in effect under applicable income tax regulations to be treated as a U.S. person for U.S. federal income tax purposes.
|
| • |
the excess distribution or gain will be allocated ratably over your holding period for the ADSs or ordinary shares;
|
| • |
the amount allocated to the current taxable year and any taxable year prior to the first taxable year in which we were classified as a PFIC in your holding period will be treated as ordinary income arising
in the current taxable year (and would not be subject to the interest charge discussed below); and
|
| • |
the amount allocated to each other taxable year during your holding period in which we were classified as a PFIC (i) will be subject to income tax at the highest rate in effect for that year and applicable
to you and (ii) will be subject to an interest charge generally applicable to underpayments of tax with respect to the resulting tax attributable to each such year.
|
| • |
the Company is not (directly or indirectly) a ‘landholder’ for the purposes of the duties legislations in each Australian State and Territory; and
|
| • |
all of our issued shares remain quoted on the ASX at all times, and no shareholder acquires or commences to hold (on an associate inclusive basis) 90% or more of all of our issued shares.
|
| F. |
Dividends and Paying Agents
|
| G. |
Statement by Experts
|
| H. |
Documents on Display
|
| I. |
Subsidiary Information.
|
| J. |
Annual Report to Security Holders.
|
| ITEM 11. |
QUANTITATIVE AND QUALITATIVE DISCLOSURES ABOUT MARKET RISK
|
| ITEM 12. |
DESCRIPTION OF SECURITIES OTHER THAN EQUITY SECURITIES
|
| A. |
Debt Securities.
|
| B. |
Warrants and rights.
|
| C. |
Other Securities.
|
| D. |
American Depositary Shares
|
|
Persons depositing or withdrawing ordinary shares or ADS holders must pay the depositary:
|
For:
|
||
|
US$5.00 (or less) per 100 ADSs (or portion of 100 ADSs)
|
•
•
|
Issuance of ADSs, including issuances resulting from a distribution of shares or rights or other property
Cancellation of ADSs for the purpose of withdrawal, including if the deposit agreement terminates
|
|
|
US$0.05 (or less) per ADS
|
•
|
Any cash distribution to ADS holders
|
|
|
A fee equivalent to the fee that would be payable if securities distributed to you had been shares and the shares had been deposited for issuance of ADSs
|
•
|
Distribution of securities distributed to holders of deposited securities (including rights) that are distributed by the depositary to ADS holders
|
|
|
US$0.05 (or less) per ADS per calendar year
|
•
|
Depositary services
|
|
|
Registration or transfer fees
Expenses of the depositary
|
•
|
Transfer and registration of shares on our share register to or from the name of the depositary or its agent when you deposit or withdraw shares
|
|
|
•
|
Cable (including SWIFT) and facsimile transmissions (when expressly provided in the deposit agreement)
|
||
|
•
|
Converting foreign currency to U.S. dollars
|
||
|
Taxes and other governmental charges the depositary or the custodian have to pay on any ADS or shares underlying ADSs, such as stock transfer taxes, stamp duty or withholding taxes
|
•
|
As necessary
|
|
|
Any charges incurred by the depositary or its agents for servicing the deposited securities
|
•
|
As necessary
|
| ITEM 13. |
DEFAULTS, DIVIDEND ARREARAGES AND DELINQUENCIES
|
| ITEM 14. |
MATERIAL MODIFICATIONS TO THE RIGHTS OF SECURITY HOLDERS AND USE OF PROCEEDS
|
| ITEM 16. |
[RESERVED]
|
|
Services Rendered
|
Fiscal 2025
|
Fiscal 2024
|
|
Audit Fees
|
US$261,040
|
US$211,400
|
|
Audit Related Fees
|
US$-
|
US$-
|
|
Tax Fees
|
US$-
|
US$-
|
|
All Other Fees
|
US$-
|
US$-
|
|
Total
|
US$261,040
|
US$211,400
|
| ITEM 16D. |
EXEMPTIONS FROM THE LISTING STANDARDS FOR AUDIT COMMITTEES
|
| ITEM 16E. |
PURCHASES OF EQUITY SECURITIES BY THE ISSUER AND AFFILIATED PURCHASERS
|
| ITEM 16F. |
CHANGE IN REGISTRANT’S CERTIFYING ACCOUNTANT
|
| ITEM 16G. |
CORPORATE GOVERNANCE
|
| • |
We rely on an exemption from the requirement that our independent directors meet regularly in executive sessions. The ASX Listing Rules and the Corporations Act do not require the independent directors of
an Australian company to have such executive sessions and, accordingly, we have claimed this exemption.
|
| • |
We rely on an exemption from the quorum requirements applicable to meetings of shareholders under Nasdaq. Our Constitution provides that five shareholders or shareholders representing at least 10% of the
voting shares present shall constitute a quorum for a general meeting. Nasdaq requires that an issuer provide for a quorum as specified in its bylaws for any meeting of the holders of ordinary shares, which quorum may not be less than 33
1/3% of the outstanding shares of an issuer’s voting ordinary shares. Accordingly, because applicable Australian law and rules governing quorums at shareholder meetings differ from Nasdaq’s quorum requirements, we have claimed this
exemption.
|
| • |
We rely on an exemption from the requirement that our nomination and remuneration committee be independent as defined by Nasdaq. We instead maintain the independence of such a committee in compliance with
the ASX Corporate Governance Principles and Recommendations.
|
| • |
We rely on an exemption from the requirement prescribed by Nasdaq that issuers obtain shareholder approval prior to the issuance of securities in connection with certain acquisitions, changes of controls or
private placements of securities, or the establishment or amendment of certain stock option, purchase or other compensation plans. Applicable Australian law and rules differ from Nasdaq requirements, with the ASX Listing Rules providing
generally for prior shareholder approval in numerous circumstances, including (i) issuance of equity securities exceeding 15% (or an additional 10% capacity to issue equity securities for the proceeding 12 month period if shareholder
approval by special resolution is sought at the Company’s annual general meeting) of our issued share capital in any 12 month period (but, in determining the available issue limit, securities issued under an exception to the rule or with
shareholder approval are not counted), (ii) issuance of equity securities to related parties, certain substantial shareholders and their respective associates (as defined in the ASX Listing Rules) and (iii) directors or their associates
acquiring securities under an employee incentive plan. Due to differences between Australian law and rules and Nasdaq shareholder approval requirements, we have claimed this exemption.
|
| • |
We rely on an exemption from the requirement that issuers must maintain a code of conduct in compliance with Nasdaq. Instead, we maintain a code of conduct consistent with the ASX Corporate Governance
Principles and Recommendations.
|
| ITEM 16H. |
MINE SAFETY DISCLOSURE
|
| ITEM 16I. |
DISCLOSURE REGARDING FOREIGN JURISDICTIONS THAT PREVENT INSPECTIONS
|
| ITEM 16J. |
INSIDER TRADING POLICIES
|
| ITEM 16.K |
CYBERSECURITY
|
|
TABLE OF CONTENTS
|
PAGE
|
|
REPORT OF INDEPENDENT REGISTERED PUBLIC ACCOUNTING FIRM (PCAOB #1435)
|
F-2
|
|
FINANCIAL STATEMENTS
|
|
|
|
|
|
F-3
|
|
|
F-4
|
|
|
F-5
|
|
|
F-6
|
|
|
F-7
|
|
2025
|
2024
|
2023
|
||||||||||||||
|
|
|
|||||||||||||||
|
Note
|
$'000
|
$'000
|
$'000
|
|||||||||||||
|
Exploration expenditure written off
|
2.2
|
(37
|
)
|
(31
|
)
|
(45
|
)
|
|||||||||
|
Employee benefits expensed
|
7.1
|
(6,372
|
)
|
(5,344
|
)
|
(5,967
|
)
|
|||||||||
|
Other expenses
|
2.3
|
(3,787
|
)
|
(3,850
|
)
|
(3,684
|
)
|
|||||||||
|
Loss from operating activities
|
(10,196
|
)
|
(9,225
|
)
|
(9,696
|
)
|
||||||||||
|
Finance income
|
2.4
|
653
|
1,411
|
3,321
|
||||||||||||
|
Finance costs
|
2.4
|
(11
|
)
|
(11
|
)
|
(16
|
)
|
|||||||||
|
Net finance income / (costs)
|
2.4
|
642
|
1,400
|
3,305
|
||||||||||||
|
Loss before tax
|
(9,554
|
)
|
(7,825
|
)
|
(6,391
|
)
|
||||||||||
|
Income tax expense
|
3.1
|
-
|
-
|
-
|
||||||||||||
|
Loss for the year
|
(9,554
|
)
|
(7,825
|
)
|
(6,391
|
)
|
||||||||||
|
Loss attributable to equity holders of the company
|
(9,554
|
)
|
(7,825
|
)
|
(6,391
|
)
|
||||||||||
|
Items that may be reclassified subsequently to profit and loss
|
||||||||||||||||
|
Foreign currency translation difference on foreign operations
|
(269
|
)
|
(45
|
)
|
(2,523
|
)
|
||||||||||
|
Other comprehensive income/(loss) (net of tax)
|
(269
|
)
|
(45
|
)
|
(2,523
|
)
|
||||||||||
|
Total comprehensive profit / (loss) for the year
|
(9,823
|
)
|
(7,870
|
)
|
(8,914
|
)
|
||||||||||
|
Total comprehensive income / (loss) attributable to the owners of the company
|
(9,823
|
)
|
(7,870
|
)
|
(8,914
|
)
|
||||||||||
|
2025
|
2024
|
2023
|
||||||||||||||
|
Earnings per share
|
Cents
|
Cents
|
Cents
|
|||||||||||||
|
Basic loss per ordinary share
|
2.5
|
(0.41
|
)
|
(0.36
|
)
|
(0.30
|
)
|
|||||||||
|
Diluted loss per ordinary share
|
2.5
|
(0.41
|
)
|
(0.36
|
)
|
(0.30
|
)
|
|||||||||
|
2025
|
2024 | |||||||||||
|
Note
|
$'000
|
$'000 | ||||||||||
|
Current assets
|
||||||||||||
|
Cash assets
|
4.1
|
25,059
|
35,715
|
|||||||||
|
Receivables
|
4.2
|
192
|
324
|
|||||||||
| Prepayments | 4.3 |
16 | 19 | |||||||||
|
Total current assets
|
25,267
|
36,058
|
||||||||||
|
Non-current assets
|
||||||||||||
|
Receivables
|
4.2
|
289
|
276
|
|||||||||
|
Plant and equipment
|
4.4
|
289
|
406
|
|||||||||
|
Right of use asset
|
4.5
|
334
|
71
|
|||||||||
|
Exploration and evaluation expenditure
|
4.6
|
203,110
|
187,664
|
|||||||||
| Other |
4.7 | 4,252 | - | |||||||||
|
Total non-current assets
|
208,274
|
188,417
|
||||||||||
|
Total assets
|
233,541
|
224,475
|
||||||||||
|
Current liabilities
|
||||||||||||
|
Payables
|
4.8
|
2,408
|
4,543
|
|||||||||
|
Lease liabilities
|
4.8
|
106
|
41
|
|||||||||
|
Provisions
|
4.10
|
462
|
428
|
|||||||||
| Borrowings |
4.9 |
- | 1,200 | |||||||||
|
Total current liabilities
|
2,976
|
6,212
|
||||||||||
|
Non-current liabilities
|
||||||||||||
|
Lease liabilities - non-current
|
4.8
|
267
|
42
|
|||||||||
|
Total Non-current liabilities
|
267
|
42
|
||||||||||
|
Total liabilities
|
3,243
|
6,254
|
||||||||||
|
Net assets
|
230,298
|
218,221
|
||||||||||
|
Equity
|
||||||||||||
|
Contributed equity
|
5.1
|
302,651
|
281,671
|
|||||||||
|
Reserves
|
5.2
|
(2,447
|
)
|
(3,098
|
)
|
|||||||
|
Accumulated losses
|
(69,906
|
)
|
(60,352
|
)
|
||||||||
|
Total equity
|
230,298 |
218,221
|
||||||||||
|
Issued
capital
|
Foreign
currency
translation
reserve
|
Equity compensation reserve
|
Accumulated losses
|
Total equity
|
||||||||||||||||||||
|
|
Note |
$'000
|
$'000
|
$'000
|
$'000
|
$'000
|
||||||||||||||||||
|
As at July 1 2024
|
281,671 | (12,761 | ) | 9,663 | (60,352 | ) | 218,221 | |||||||||||||||||
|
Loss for the year ended June 30 2025
|
- | - | - | (9,554 | ) | (9,554 | ) | |||||||||||||||||
|
Other comprehensive income
|
||||||||||||||||||||||||
|
Foreign currency translation differences on foreign operations
|
- | (269 | ) | - | - | (269 | ) | |||||||||||||||||
|
Total other comprehensive income
|
- | (269 | ) | - | - | (269 | ) | |||||||||||||||||
|
Total comprehensive income for the year
|
- | (269 | ) | - | (9,554 | ) | (9,823 | ) | ||||||||||||||||
|
Share-based payments
|
||||||||||||||||||||||||
|
Share-based payments expensed/capitalized
|
5.2
|
- | - | 6,106 | - | 6,106 | ||||||||||||||||||
|
Fair value of performance rights vested
|
5.2
|
5,186 | - | (5,186 | ) | - | - | |||||||||||||||||
|
Share issue costs
|
5.1
|
(618 | ) | - | - | - | (618 | ) | ||||||||||||||||
| Shares issued from capital raise |
5.1 | 16,412 | - | - | - | 16,412 | ||||||||||||||||||
| Options exercised |
5.2 | - | - | - | - | - | ||||||||||||||||||
|
As at June 30 2025
|
302,651 | (13,030 | ) | 10,583 | (69,906 | ) | 230,298 | |||||||||||||||||
|
As at July 1 2023
|
255,364 | (12,716 | ) | 7,278 | (52,527 | ) | 197,399 | |||||||||||||||||
|
Loss for the year ended June 30 2024
|
- | - | - | (7,825 | ) | (7,825 | ) | |||||||||||||||||
|
Other comprehensive income
|
||||||||||||||||||||||||
|
Foreign currency translation differences on foreign operations
|
- | (45 | ) | - | - | (45 | ) | |||||||||||||||||
|
Total other comprehensive income
|
- | (45 | ) | - | - | (45 | ) | |||||||||||||||||
|
Total comprehensive income for the year
|
- | (45 | ) | - | (7,825 | ) | (7,870 | ) | ||||||||||||||||
|
Share-based payments
|
||||||||||||||||||||||||
|
Share-based payments expensed/capitalized
|
5.2
|
- | - | 4,277 | - | 4,277 | ||||||||||||||||||
|
Fair value of performance rights vested
|
5.2
|
1,892 | - | (1,892 | ) | - | - | |||||||||||||||||
|
Share issue costs
|
5.1
|
(780 | ) | - | - | - | (780 | ) | ||||||||||||||||
| Shares issued from capital raise |
5.1 |
25,141 | - | - | - | 25,141 | ||||||||||||||||||
| Options exercised |
5.2 |
54 | - | - | - | 54 | ||||||||||||||||||
|
As at June 30 2024
|
281,671 | (12,761 | ) | 9,663 | (60,352 | ) | 218,221 | |||||||||||||||||
|
As at July 1 2022
|
254,273 | (10,193 | ) | 5,755 | (46,136 | ) | 203,699 | |||||||||||||||||
|
Loss for the year ended June 30 2023
|
- | - | - | (6,391 | ) | (6,391 | ) | |||||||||||||||||
|
Other comprehensive income
|
||||||||||||||||||||||||
|
Foreign currency translation differences on foreign operations
|
- | (2,523 | ) | - | - | (2,523 | ) | |||||||||||||||||
|
Total other comprehensive income
|
- | (2,523 | ) | - | - | (2,523 | ) | |||||||||||||||||
|
Total comprehensive income for the year
|
- | (2,523 | ) | - | (6,391 | ) | (8,914 | ) | ||||||||||||||||
|
Share-based payments
|
||||||||||||||||||||||||
|
Share-based payments expensed/capitalized
|
5.2
|
- | - | 2,626 | - | 2,626 | ||||||||||||||||||
|
Fair value of performance rights vested
|
5.2
|
1,103 | - | (1,103 | ) | - | - | |||||||||||||||||
|
Share issue costs
|
5.1
|
(12 | ) | - | - | - | (12 | ) | ||||||||||||||||
|
As at June 30 2023
|
255,364 | (12,716 | ) | 7,278 | (52,527 | ) | 197,399 | |||||||||||||||||
|
2025
|
2024
|
2023
|
||||||||||||||
|
|
Note |
$'000
|
$'000
|
$'000
|
||||||||||||
|
Cash flows from operating activities
|
||||||||||||||||
|
Payment to suppliers and employees
|
(6,805
|
)
|
(7,198
|
)
|
(8,069
|
)
|
||||||||||
|
Net cash flows used in operating activities (inclusive of GST)
|
4.1
|
(6,805
|
)
|
(7,198
|
)
|
(8,069
|
)
|
|||||||||
|
Cash flows from investing activities
|
||||||||||||||||
|
Expenditure on mining exploration and evaluation
|
(14,510
|
)
|
(36,635
|
)
|
(33,333
|
)
|
||||||||||
|
Purchase of equipment
|
4.4
|
-
|
(2
|
)
|
(601
|
)
|
||||||||||
|
Interest received
|
680
|
1,254
|
1,462
|
|||||||||||||
|
Net cash flows used in investing activities
|
(13,830
|
)
|
(35,383
|
)
|
(32,472
|
)
|
||||||||||
|
Cash flows from financing activities
|
||||||||||||||||
|
Proceeds from the issue of shares
|
5.1
|
16,412
|
25,141
|
-
|
||||||||||||
| Proceeds from exercise of options |
5.1 |
- | 55 | - | ||||||||||||
|
Equity raising expenses
|
5.1
|
(618
|
)
|
(780
|
)
|
(12
|
)
|
|||||||||
|
Payments of lease liability
|
(140
|
)
|
(130
|
)
|
(213
|
)
|
||||||||||
| Proceeds from borrowings |
4.9 | - | 1,200 | - | ||||||||||||
| Repayment of borrowings |
4.9 |
(1,200 | ) | - | - | |||||||||||
| Payment for establishment of loan |
(4,252 | ) | - | - | ||||||||||||
|
Net cash flows received / (used in) financing activities
|
10,202
|
25,486
|
(225
|
)
|
||||||||||||
|
Net increase / (decrease) in cash held
|
(10,433
|
)
|
(17,095
|
)
|
(40,766
|
)
|
||||||||||
|
Cash at the beginning of the financial year
|
35,715
|
52,709
|
94,177
|
|||||||||||||
|
Effect of exchange rate fluctuations on balances of cash
|
(223
|
)
|
101
|
(702
|
)
|
|||||||||||
|
Closing cash carried forward
|
4.1
|
25,059
|
35,715
|
52,709
|
||||||||||||
| Section 1. |
Basis of preparation
|
| 1.1. |
Reporting entity
|
| 1.2. |
Basis of preparation
|
|
|
• |
These financial statements comply with International Financial Reporting Standards (IFRS) as issued by the International Accounting Standards Board ('IASB'), including new or amended accounting standards effective for reporting periods
beginning July 1, 2022.
|
|
|
• |
Unless otherwise stated, the accounting policies disclosed have been consistently applied.
|
|
|
• |
The financial report has been prepared on a historical cost basis.
|
|
|
• |
The financial statements have been presented in US dollars which is the Groups presentation currency.
|
|
|
• |
The financial statements have been prepared on the going concern basis which assumes the company and consolidated entity will have sufficient cash to pay its debts as and when they become payable for a period of at least 12 months from
the date the financial report was authorized for issue.
|
| 1.3. |
New and amended accounting standards and interpretations
|
|
IAS 18 - Presentation and Disclosure in Financial Statements(IAS 1)
|
IAS 18 replaces IAS 1 as the standard describing the primary financial statements and sets out the requirements for the presentation and disclosure of
information in IFRS-compliant financial statements. Amongst other changes, it introduces the concept of 'management-defined performance measure' to financial statements and requires the classification of transactions presented within the
statement of profit or loss within one of five categories - operating, investing, financing, income taxes and discontinued operations. It also provides enhanced requirements for the aggregation and disaggregation of information
|
|
IAS 7 and IAS 39 – Financial Instruments
|
The amendments to IAS 7 and IAS 39 clarify that a financial liability is derecognized on settlement date, i.e. when the related obligation is discharged, cancelled, expires or the liability
otherwise disqualifies for recognition. It also clarifies how to assess contractual cash flow characteristics.
|
| 1.4. |
Basis of consolidation
|
| 1.5 |
Current versus non-current classification
|
|
-
|
Expected to be realized or intended to be sold or consumed in the normal operating cycle
|
|
-
|
Held primarily for the purpose of trading
|
|
-
|
Expected to be realized within twelve months after the reporting period
|
|
-
|
Cash or cash equivalent unless restricted from being exchanged or used to settle a liability for at least twelve months after the reporting period
|
|
-
|
It is expected to be settled in the normal operating cycle
|
|
-
|
It is held primarily for the purpose of trading
|
|
-
|
It is due to be settled within twelve months after reporting period
|
|
-
|
There is no unconditional right to defer the settlement of the liability for at least twelve months after the reporting period
|
| 1.6. |
Critical accounting estimates and judgements
|
| 1.7. |
Foreign Currency Transactions and Balances
|
| 1.8. | Going Concern |
| Section 2. |
Financial performance
|
| 2.1. |
Operating segments
|
|
North America
|
Represents activity in the US, primarily in relation to Rhyolite Ridge and the Reno office.
|
|
Australia
|
Represents head office expenditure, including ASX listing costs, employee benefits, exchange gains and losses and corporate assets (predominantly cash).
|
| Segment information | North America | Australia |
Total | |||||||||||||||||||||||||||||||||
|
2025
|
2024 |
2023
|
2025 |
2024
|
2023
|
2025 |
2024
|
2023
|
||||||||||||||||||||||||||||
|
$
|
’000
|
$
|
’000
|
$
|
’000
|
$
|
’000
|
$
|
’000
|
$
|
’000
|
$
|
’000
|
$
|
’000
|
$
|
’000
|
|||||||||||||||||||
|
Exploration expenditure - non core
|
(37
|
)
|
(31
|
)
|
(45
|
)
|
-
|
-
|
-
|
(37
|
)
|
(31
|
)
|
(45
|
)
|
|||||||||||||||||||||
|
Other expenses
|
(1,899
|
)
|
(2,383
|
)
|
(1,356
|
)
|
(1,888
|
)
|
(1,467
|
)
|
(2,328
|
)
|
(3,787
|
)
|
(3,850
|
)
|
(3,684
|
)
|
||||||||||||||||||
|
Reportable segment loss
|
(1,936
|
)
|
(2,414
|
)
|
(1,401
|
)
|
(1,888
|
)
|
(1,467
|
)
|
(2,328
|
)
|
(3,824
|
)
|
(3,881
|
)
|
(3,729
|
)
|
||||||||||||||||||
|
Employee benefits and other expenses
|
(2,680
|
)
|
(2,407
|
)
|
(2,043
|
)
|
(3,692
|
)
|
(2,937
|
)
|
(3,924
|
)
|
(6,372
|
)
|
(5,344
|
)
|
(5,967
|
)
|
||||||||||||||||||
|
Net financing income / (expense)
|
(3,173
|
)
|
(1,802
|
)
|
(25
|
)
|
3,815
|
3,202
|
3,330
|
642
|
1,400
|
3,305
|
||||||||||||||||||||||||
|
Net loss before income tax
|
(7,789
|
)
|
(6,623
|
)
|
(3,469
|
)
|
(1,765
|
)
|
(1,202
|
)
|
(2,922
|
)
|
(9,554
|
)
|
(7,825
|
)
|
(6,391
|
)
|
||||||||||||||||||
|
Segment assets
|
||||||||||||||||||||||||||||||||||||
|
Exploration assets
|
203,110
|
187,664
|
152,226
|
-
|
-
|
-
|
203,110
|
187,664
|
152,226
|
|||||||||||||||||||||||||||
|
Other assets
|
9,443
|
8,576
|
5,258
|
20,988
|
28,235
|
48,835
|
30,431
|
36,811
|
54,093
|
|||||||||||||||||||||||||||
|
Total assets
|
212,553
|
196,240
|
157,484
|
20,988
|
28,235
|
48,835
|
233,541
|
224,475
|
206,319
|
|||||||||||||||||||||||||||
|
Segment liabilities
|
||||||||||||||||||||||||||||||||||||
|
Payables
|
2,124
|
4,442
|
7,547
|
390
|
142
|
927
|
2,514
|
4,584
|
8,474
|
|||||||||||||||||||||||||||
|
Provisions
|
165
|
177
|
167
|
297
|
251
|
201
|
462
|
428
|
368
|
|||||||||||||||||||||||||||
| Borrowings |
- | 1,200 | - | - | - | - | - | 1,200 | - | |||||||||||||||||||||||||||
|
Total current liabilities
|
2,289
|
5,819
|
7,714
|
687
|
393
|
1,128
|
2,976
|
6,212
|
8,842
|
|||||||||||||||||||||||||||
|
Payables
|
267
|
(8
|
)
|
78
|
-
|
50
|
-
|
267
|
42
|
78
|
||||||||||||||||||||||||||
|
Total non-current liabilities
|
267
|
(8
|
)
|
78
|
-
|
50
|
-
|
267
|
42
|
78
|
||||||||||||||||||||||||||
|
Total liabilities
|
2,556
|
5,811
|
7,792
|
687
|
443
|
1,128
|
3,243
|
6,254
|
8,920
|
|||||||||||||||||||||||||||
|
Net assets
|
209,997
|
190,429
|
149,692
|
20,301
|
27,792
|
47,707
|
230,298
|
218,221
|
197,399
|
|||||||||||||||||||||||||||
|
|
|
|
2025 |
|
|
|
2024 |
|
|
|
2023 |
|
|
|
|
|
$’000 |
|
|
|
$’000 |
|
|
|
$’000 |
|
|
2.2.
|
Impairment write-off
|
|
Exploration expenditure written off
|
(37
|
)
|
(31
|
)
|
(45
|
)
|
||||||
|
Total impairment
|
(37
|
)
|
(31
|
)
|
(45
|
)
|
|
2.3.
|
Other expenses
|
|
General and administrative expenses
|
1,877
|
1,668
|
2,751
|
|||||||||
|
Consulting and professional costs
|
1,633
|
1,922
|
881
|
|||||||||
|
Depreciation and amortization
|
277
|
260
|
52
|
|||||||||
|
Total other expenses
|
3,787
|
3,850
|
3,684
|
|
2.4.
|
Net finance income / (costs)
|
|
Interest income from external providers
|
608
|
1,293
|
1,484
|
|||||||||
|
Other revenue
|
-
|
-
|
26
|
|||||||||
|
Net foreign exchange gain
|
45
|
118
|
1,811
|
|||||||||
|
Finance income
|
653
|
1,411
|
3,321
|
|||||||||
|
Bank charges
|
(9
|
)
|
(9
|
)
|
(6
|
)
|
||||||
|
Net foreign exchange loss
|
-
|
-
|
-
|
|||||||||
|
Lease interest
|
(2
|
)
|
(2
|
)
|
(10
|
)
|
||||||
|
Finance costs
|
(11
|
)
|
(11
|
)
|
(16
|
)
|
||||||
|
Net finance income / (costs)
|
642
|
1,400
|
3,305
|
|
2.5.
|
Earnings per share
|
|
2025
|
2024
|
2023
|
||||||||||
|
|
$’000
|
|
$’000 |
|
$’000 | |||||||
|
Earnings used in calculating earnings per share
|
||||||||||||
|
Basic and diluted loss
|
(9,554 | ) | (7,825 | ) | (6,391 | ) | ||||||
|
Weighted average number of ordinary shares used as the denominator
|
Number
|
Number
|
Number
|
|||||||||
|
Issued ordinary shares - opening balance
|
2,325,614,708
|
2,098,818,267
|
2,091,299,420
|
|||||||||
|
Effect of shares issued
|
31,960,803
|
46,244,015
|
6,894,635
|
|||||||||
|
Weighted average number of ordinary shares
|
2,357,575,511
|
2,145,062,282
|
2,098,194,055
|
|||||||||
|
Weighted average number of ordinary shares (diluted)
|
||||||||||||
|
Weighted average number of ordinary shares at 30 June for basic EPS
|
2,357,575,511
|
2,145,062,282
|
2,098,194,055
|
|||||||||
|
Effect of dilution from options and rights on issue
|
-
|
-
|
-
|
|||||||||
|
Weighted average number of ordinary shares adjusted for effect of dilution
|
2,357,575,511
|
2,145,062,282
|
2,098,194,055
|
|||||||||
|
Cents
|
Cents
|
Cents
|
||||||||||
|
Basic loss per share attributable to the ordinary equity holders of the company
|
(0.41
|
)
|
(0.36
|
)
|
(0.30
|
)
|
||||||
|
Diluted loss per share attributable to the ordinary equity holders of the company
|
(0.41
|
)
|
(0.36
|
)
|
(0.30
|
)
|
||||||
| Section 3. |
Taxation
|
| 3.1. |
Taxation
|
|
2025
|
2024
|
2023
|
||||||||||
|
|
$’000
|
|
$’000
|
|
$’000
|
1 | ||||||
|
Tax expense comprises:
|
||||||||||||
|
Income tax
|
||||||||||||
|
Current tax benefit / (expense)
|
-
|
-
|
-
|
|||||||||
|
Tax expense related to movements in deferred tax balances
|
-
|
-
|
-
|
|||||||||
|
Total tax (expense) / benefit
|
-
|
-
|
-
|
|||||||||
|
Numerical reconciliation between tax (expense) / benefit and pre-tax net result:
|
||||||||||||
|
Loss before tax
|
(9,554
|
)
|
(7,825
|
)
|
(6,391
|
)
|
||||||
|
Prima facie taxation benefit at 30%
|
(2,866
|
)
|
(2,348
|
)
|
(1,917
|
)
|
||||||
|
Decrease / (increase) in income tax benefit due to:
|
||||||||||||
|
Differences in tax rates
|
273 | 232 | 224 | |||||||||
|
Non-deductible expenses
|
1,162
|
746
|
1,113
|
|||||||||
|
Foreign exchange and other translation adjustments
|
(38
|
)
|
(130
|
)
|
(586
|
)
|
||||||
|
Additional tax deductible expenditure
|
(4
|
)
|
(7
|
)
|
(166
|
)
|
||||||
|
Unrecognized tax losses relating to current year
|
1,473
|
1,507
|
1,181
|
|||||||||
|
Adjustments for prior years
|
-
|
-
|
151
|
|||||||||
|
Income tax (expense) / benefit
|
-
|
-
|
-
|
|||||||||
|
2025
|
2024 |
|||||||
|
|
$’000
|
|
$’000 | |||||
|
Deferred tax relates to the following
|
||||||||
|
Foreign exchange gain/loss
|
(1,406
|
)
|
(1,368 | ) | ||||
|
Losses available for offsetting against future taxable income
|
1,406
|
1,368 | ||||||
|
Net deferred tax asset
|
-
|
- | ||||||
|
Jurisdiction June 30, 2025
|
||||||||||||
| Australia | USA | Canada | ||||||||||
|
$’000
|
$’000
|
$’000
|
||||||||||
|
Non-recognized tax losses - revenue
|
||||||||||||
|
Balance at the beginning of the period
|
12,391
|
23,087
|
188
|
|||||||||
|
Movement during the period
|
(684
|
)
|
5,959
|
139
|
||||||||
|
Balance at the end of the period
|
11,707
|
29,046
|
327
|
|||||||||
|
$’000
|
$’000
|
$’000
|
||||||||||
|
Non-recognized tax losses - capital
|
||||||||||||
|
Balance at the beginning of the period
|
4,792
|
-
|
-
|
|||||||||
|
Movement during the period
|
3
|
-
|
-
|
|||||||||
|
Balance at the end of the period
|
4,795
|
-
|
-
|
|||||||||
|
Total revenue and capital losses not recognized
|
16,502
|
29,046
|
327
|
|||||||||
|
|
• |
the Company and Controlled Entities derive future assessable income of a nature and of an amount sufficient to enable the benefit from the deductions for the losses to be recognized,
|
|
|
• |
the Company and Controlled Entities continue to comply with the conditions for deductibility imposed by the law,
|
|
|
• |
no changes in tax legislation adversely affect the Company and Controlled Entities in recognizing the benefit from the deductions for the losses,
|
|
|
• |
the accumulated tax losses in Australia may be carried forward and offset against taxable income in the future for an indefinite period, subject to meeting Australian tax rules around continuity of ownership or business
continuity test, and
|
|
|
• |
the accumulated tax losses in the USA can be carried forward and used to offset future taxable income for a period of 20 years from the year in which the losses were incurred and losses will start to expire from the year
2027 onwards.
|
| Section 4. |
Invested and working capital
|
| 4.1. |
Cash assets
|
|
2025
|
2024
|
|||||||
|
$
|
’000
|
$
|
’000
|
|||||
|
Cash at bank
|
21,001
|
19,205
|
||||||
|
Short term deposits
|
4,058
|
16,510
|
||||||
|
Total cash assets
|
25,059
|
35,715
|
||||||
|
Cash flow reconciliation
|
||||||||
|
Reconciliation of net cash outflow from operating activities to operating loss after tax
|
||||||||
|
Loss for the period
|
(9,554
|
)
|
(7,825
|
)
|
||||
|
Adjustments to reconcile profit to net cash flows:
|
||||||||
|
Depreciation
|
277
|
118
|
||||||
|
Exploration expenditure written-off
|
37
|
31
|
||||||
|
Share-based payments
|
3,164
|
1,633
|
||||||
|
Net foreign exchange differences - unrealized
|
(45
|
)
|
(96
|
)
|
||||
|
Interest income
|
(681
|
)
|
(1,293
|
)
|
||||
|
Interest expense
|
26
|
11
|
||||||
|
Change in assets and liabilities during the financial year:
|
||||||||
|
Decrease / (Increase) in trade and other receivables
|
127
|
(50
|
)
|
|||||
|
(Decrease) / increase in provisions and employee benefits
|
34 | (60 | ) | |||||
|
Increase in accounts payable
|
(173
|
)
|
344
|
|||||
| Interest paid |
(17 | ) | (11 | ) | ||||
|
Net cash used in operating activities
|
(6,805
|
)
|
(7,198
|
)
|
||||
| 4.2. |
Receivables
|
|
2025
|
2024
|
|||||||
|
|
$’000
|
|
$’000
|
|||||
|
Current
|
||||||||
|
Interest receivable
|
-
|
-
|
||||||
|
Other debtors
|
143
|
195
|
||||||
|
Prepayments
|
49
|
129
|
||||||
|
Total current trade and other receivables
|
192
|
324
|
||||||
|
Non-current
|
||||||||
|
Other debtors
|
289
|
276
|
||||||
|
Total non-current trade and other receivables
|
289
|
276
|
||||||
|
Total current and non-current trade and other receivables
|
481
|
600
|
||||||
| 4.3. |
Current assets - other
|
|
2025
|
2024
|
|||||||
|
|
$’000
|
|
$’000
|
|||||
|
Current
|
||||||||
|
Prepayments
|
16
|
19
|
||||||
|
Total current other assets
|
16
|
19
|
||||||
| 4.4. |
Plant and equipment
|
| 2025 | 2024 | |||||||
|
|
$’000 |
|
$’000 | |||||
|
Plant and equipment - at cost
|
606
|
606
|
||||||
|
Less accumulated depreciation
|
(317
|
)
|
(200
|
)
|
||||
|
Total plant and equipment
|
289
|
406
|
||||||
|
Reconciliation of the movement
|
||||||||
|
Opening balance
|
406
|
522
|
||||||
|
Additions
|
-
|
2
|
||||||
|
Disposals
|
- | - | ||||||
|
Depreciation expense
|
(117
|
)
|
(118
|
)
|
||||
|
Closing balance
|
289
|
406
|
||||||
| 4.5. |
Right of Use Asset
|
|
2025
|
2024
|
|||||||
|
|
$’000
|
|
$’000
|
|||||
|
Premises - at cost
|
755
|
368
|
||||||
|
Less accumulated amortization
|
(421
|
)
|
(297
|
)
|
||||
|
Total Right of Use Asset
|
334
|
71
|
||||||
|
Reconciliation of the movement
|
||||||||
|
Opening balance
|
71
|
202
|
||||||
|
Additions
|
423
|
11
|
||||||
|
Amortization expense
|
(160
|
)
|
(142
|
)
|
||||
|
Foreign exchange translation difference
|
-
|
-
|
||||||
|
Closing balance
|
334
|
71
|
||||||
| 4.6. |
Exploration and evaluation expenditure
|
|
|
• |
such costs are expected to be recouped through successful development and exploitation of the area, or alternatively through its sale; or
|
|
|
• |
exploration and/or evaluation activities in the area have not yet reached a stage which permits a reasonable assessment of the existence or otherwise of economically recoverable reserves.
|
|
2025
|
2024
|
|||||||
|
|
$’000
|
|
$’000
|
|||||
|
Exploration and evaluation expenditure
|
203,110
|
187,664
|
||||||
|
Reconciliation of movement
|
||||||||
|
Opening balance
|
187,664
|
152,226
|
||||||
|
Additions - Rhyolite Ridge
|
15,300
|
35,398
|
||||||
|
Exploration expenditure - non core
|
183
|
71
|
||||||
|
Exploration expenditure - written off
|
(37
|
)
|
(31
|
)
|
||||
|
Carrying amount at the end of the financial year
|
203,110
|
187,664
|
||||||
| 4.7. |
Non-current assets - other
|
|
2025
|
2024
|
|||||||
|
|
$’000
|
|
$’000
|
|||||
|
Unamortized loan fees
|
4,252
|
-
|
||||||
| 4.8. |
Payables
|
| 2025 | 2024 | |||||||
| $’000 | $’000 | |||||||
|
Current
|
||||||||
|
Trade creditors and other payables
|
2,066
|
4,056
|
||||||
|
Accrued expenses
|
342
|
487
|
||||||
|
Lease Liabilities
|
106
|
41
|
||||||
|
Total current payables
|
2,514
|
4,584
|
||||||
|
Non-current
|
||||||||
|
Lease Liabilities
|
267
|
42
|
||||||
|
Total non-current payables
|
267
|
42
|
||||||
|
Total current and non-current payables
|
2,781
|
4,626
|
||||||
| 4.9. |
Borrowings
|
| 2025 |
2024
|
|||||||
| $’000 |
|
$’000
|
||||||
|
Current
|
||||||||
|
Other current debt
|
-
|
1,200 | ||||||
|
Total borrowings
|
-
|
1,200 | ||||||
| 4.10. |
Provisions
|
|
2025
|
2024
|
|||||||
|
|
$’000
|
|
$’000
|
|||||
|
Current
|
||||||||
|
Provision for employee benefits
|
462
|
428
|
||||||
|
Total provisions
|
462
|
428
|
||||||
| Section 5. |
Capital structure
|
| 5.1. |
Share capital
|
|
2025
|
2024
|
|||||||
|
|
$’000
|
|
$’000
|
|||||
|
2,608,172,516 (2024: 2,325,614,708)
ordinary shares, fully paid
|
302,651
|
281,671
|
||||||
|
2025
|
2024
|
2025
|
2024
|
|||||||||||||
|
Number
|
Number
|
|
$’000
|
|
$’000
|
|||||||||||
|
Reconciliation of movement:
|
||||||||||||||||
|
Balance at the beginning of the financial year
|
2,325,614,708
|
2,098,818,267
|
281,671
|
255,364
|
||||||||||||
|
Ordinary shares
|
252,500,000
|
213,602,562
|
16,412
|
25,141
|
||||||||||||
|
Ordinary shares non-cash
|
-
|
-
|
-
|
-
|
||||||||||||
|
Exercise of unlisted options (1)
|
-
|
357,710
|
-
|
54
|
||||||||||||
|
Performance rights vested (2)
|
30,057,808
|
12,836,169
|
5,186
|
1,892
|
||||||||||||
|
Share issue costs
|
-
|
-
|
(618
|
)
|
(780
|
)
|
||||||||||
|
Balance at the end of the financial period
|
2,608,172,516
|
2,325,614,708
|
302,651
|
281,671
|
||||||||||||
|
|
(1) |
Value of unlisted options exercised equals the sum of the exercise price received plus the fair value transferred
from the equity compensation reserve
|
|
|
(2) |
Ordinary shares issued to employees upon vesting of performance rights
|
|
|
• |
30,057,808 shares as a consequence of Performance Rights vesting under the Equity Incentive Plan;
|
|
|
• |
252,500,000 shares as a consequence of a share placement in June 2025.
|
|
|
• |
12,836,169 shares as a consequence of Performance Rights vesting under the Equity Incentive Plan;
|
|
|
• |
357,710 shares as a consequence of Options exercised under the Share Options Plan;
|
|
|
• |
213,602,562 shares as a consequence of a share placement in May 2024.
|
|
|
• |
7,518,847 shares as a consequence of Performance Rights vesting under the Equity Incentive Plan.
|
|
|
• |
The Share Option Plan; and
|
|
|
• |
The Equity Incentive Plan.
|
| Movement in options on issue for the year ended June 30, 2025 | |||||||||||||||||||||||||||||||
| |
Grant
date
|
Vesting
date
|
Expiry
date
|
|
FV per
option at
grant
date
$
|
|
Exercise
price
$
|
|
Opening
balance
|
Issued | Exercised | Expired |
Closing
balance |
||||||||||||||||||
|
NEDs(1)
|
14-Nov-19
|
14-Nov-20
|
14-Nov-24
|
0.138
|
0.243
|
653,594
|
-
|
-
|
(653,594
|
)
|
-
|
||||||||||||||||||||
|
Ex-NEDs (2)
|
14-Nov-19
|
14-Nov-20
|
14-Nov-24
|
0.138
|
0.243
|
653,594
|
-
|
-
|
(653,594
|
)
|
-
|
||||||||||||||||||||
|
NEDs(1)
|
16-Nov-20
|
16-Nov-21
|
16-Nov-25
|
0.138
|
0.185
|
652,646
|
-
|
-
|
-
|
652,646
|
|||||||||||||||||||||
|
Ex-NEDs (2)
|
16-Nov-20
|
16-Nov-21
|
16-Nov-25
|
0.138
|
0.185
|
978,969
|
-
|
-
|
-
|
978,969
|
|||||||||||||||||||||
|
Movement for the year ended June 30, 2025
|
2,938,803
|
-
|
-
|
(1,307,188
|
)
|
1,631,615
|
|||||||||||||||||||||||||
| Movement in options on issue for the year ended June 30, 2024 | |||||||||||||||||||||||||||||||
|
|
Grant
date
|
Vesting
date
|
Expiry
date
|
FV per
option at
grant
date
$
|
Exercise
price
$
|
Opening
balance
|
Issued | Exercised | Expired |
Closing
balance
|
|||||||||||||||||||||
|
NEDs (1)
|
09-Nov-18
|
09-Nov-19
|
09-Nov-23
|
0.126
|
0.242
|
715,420
|
-
|
(357,710
|
)
|
(357,710
|
)
|
-
|
|||||||||||||||||||
|
Ex-NEDs (2)
|
09-Nov-18
|
09-Nov-19
|
09-Nov-23
|
0.126
|
0.242
|
715,420
|
-
|
-
|
(715,420
|
)
|
-
|
||||||||||||||||||||
|
NEDs(1)
|
14-Nov-19
|
14-Nov-20
|
14-Nov-24
|
0.138
|
0.243
|
653,594
|
-
|
-
|
-
|
653,594
|
|||||||||||||||||||||
|
Ex-NEDs (2)
|
14-Nov-19
|
14-Nov-20
|
14-Nov-24
|
0.138
|
0.243
|
653,594
|
-
|
-
|
-
|
653,594
|
|||||||||||||||||||||
|
NEDs(1)
|
16-Nov-20
|
16-Nov-21
|
16-Nov-25
|
0.138
|
0.185
|
652,646
|
-
|
-
|
-
|
652,646
|
|||||||||||||||||||||
|
Ex-NEDs (2)
|
16-Nov-20
|
16-Nov-21
|
16-Nov-25
|
0.138
|
0.185
|
978,969
|
-
|
-
|
-
|
978,969
|
|||||||||||||||||||||
|
Movement for the year ended June 30, 2024
|
4,369,643
|
-
|
(357,710
|
)
|
(1,073,130
|
)
|
2,938,803
|
||||||||||||||||||||||||
| (1) |
NEDs refers to Non-executive directors.
|
| (2) |
Ex-NEDs refers to former Non-executive directors.
|
| Movement in performance rights on issue for the year ended June 30, 2025 | ||||||||||||||||||||||||||
|
Grant
|
Vesting
|
Fair value
per
right
grant
date
|
Opening
balance
|
Issued |
Exercised |
Forfeited
|
Closing
balance
|
|||||||||||||||||||
| date | date |
|
$ |
Number
|
Number
|
Number
|
Number
|
Number
|
||||||||||||||||||
|
2021 LTI - performance based - KMP
|
01-Jul-21
|
01-Jul-24
|
0.3710
|
1,458,852
|
-
|
(364,714
|
)
|
(1,094,138
|
)
|
-
|
||||||||||||||||
|
2021 LTI - time based - KMP
|
01-Jul-21
|
01-Jul-24
|
0.3300
|
972,569
|
-
|
(972,569
|
)
|
-
|
-
|
|||||||||||||||||
|
Retention on employment- staff
|
01-Jul-21
|
01-Jul-24
|
0.3300
|
679,146
|
-
|
(679,146
|
)
|
-
|
-
|
|||||||||||||||||
|
2021 LTI - performance based - staff
|
26-Aug-21
|
01-Jul-24
|
0.4570
|
354,093
|
-
|
(88,525
|
)
|
(265,568
|
)
|
-
|
||||||||||||||||
|
2021 LTI - performance based - KMP
|
26-Aug-21
|
01-Jul-24
|
0.4570
|
223,084
|
-
|
(55,771
|
)
|
(167,313
|
)
|
-
|
||||||||||||||||
|
2021 LTI - time based - staff
|
26-Aug-21
|
01-Jul-24
|
0.5100
|
721,111
|
-
|
(721,111
|
)
|
-
|
-
|
|||||||||||||||||
|
2021 LTI - time based - KMP
|
26-Aug-21
|
01-Jul-24
|
0.5100
|
223,084
|
-
|
(223,084
|
)
|
-
|
-
|
|||||||||||||||||
|
2021 LTI - performance based - KMP
|
05-Nov-21
|
01-Jul-24
|
0.7240
|
1,567,975
|
-
|
(391,995
|
)
|
(1,175,980
|
)
|
-
|
||||||||||||||||
|
2021 LTI time based - KMP
|
05-Nov-21
|
01-Jul-24
|
0.7900
|
1,045,316
|
-
|
(1,045,316
|
)
|
-
|
-
|
|||||||||||||||||
|
Retention on employment- staff
|
16-Nov-21
|
16-Nov-24
|
0.7050
|
115,000
|
-
|
(115,000
|
)
|
-
|
-
|
|||||||||||||||||
|
2022 LTI – performance based - KMP
|
01-Jul-22
|
01-Jul-25
|
0.4528
|
1,392,806
|
-
|
-
|
-
|
1,392,806
|
||||||||||||||||||
|
2022 LTI – time based – KMP
|
01-Jul-22
|
01-Jul-25
|
0.4250
|
928,538
|
-
|
-
|
-
|
928,538
|
||||||||||||||||||
|
Retention on employment – staff
|
01-Jul-22
|
01-Jul-25
|
0.4250
|
35,000
|
-
|
-
|
-
|
35,000
|
||||||||||||||||||
|
2022 LTI – time based – staff
|
22-Aug-22
|
01-Jul-25
|
0.6800
|
200,000
|
-
|
-
|
(57,773
|
)
|
142,227
|
|||||||||||||||||
|
Retention on employment – directors
|
25-Aug-22
|
25-Aug-25
|
0.6600
|
200,000
|
-
|
-
|
(3,467
|
)
|
196,533
|
|||||||||||||||||
|
2022 LTI – performance based – staff
|
01-Sep-22
|
01-Jul-25
|
0.6128
|
59,905
|
-
|
-
|
(19,258
|
)
|
40,647
|
|||||||||||||||||
|
2022 LTI – time based – staff
|
01-Sep-22
|
01-Jul-25
|
0.6500
|
179,715
|
-
|
-
|
-
|
179,715
|
||||||||||||||||||
|
2022 LTI – performance based - staff
|
05-Sep-22
|
01-Jul-25
|
0.6448
|
306,987
|
-
|
-
|
-
|
306,987
|
||||||||||||||||||
|
2022 LTI – time based – staff
|
05-Sep-22
|
01-Jul-25
|
0.6150
|
204,658
|
-
|
-
|
-
|
204,658
|
||||||||||||||||||
|
2022 LTI – performance based – staff
|
05-Sep-22
|
01-Jul-25
|
0.5780
|
651,640
|
-
|
-
|
-
|
651,640
|
||||||||||||||||||
|
2022 LTI – time based – staff
|
05-Sep-22
|
01-Jul-25
|
0.6150
|
961,948
|
-
|
-
|
-
|
961,948
|
||||||||||||||||||
|
2022 LTI – performance based – KMP
|
04-Nov-22
|
01-Jul-25
|
0.5245
|
1,249,442
|
-
|
-
|
-
|
1,249,442
|
||||||||||||||||||
|
2022 LTI time based – KMP
|
04-Nov-22
|
01-Jul-25
|
0.5700
|
832,962
|
-
|
-
|
-
|
832,962
|
||||||||||||||||||
|
Retention on employment - staff
|
01-Jan-23
|
01-Jan-26
|
0.3700
|
200,000
|
-
|
-
|
(200,000
|
)
|
-
|
|||||||||||||||||
|
2023 STI time based - staff
|
01-Jul-23
|
01-Jul-24
|
0.3400
|
548,268
|
-
|
(548,268
|
)
|
-
|
-
|
|||||||||||||||||
|
2023 STI performance based – KMP
|
01-Jul-23
|
01-Jul-24
|
0.3400
|
3,810,642
|
-
|
(3,810,642
|
)
|
-
|
-
|
|||||||||||||||||
|
2023 LTI time based – staff
|
12-Sep-23
|
01-Jul-26
|
0.2250
|
2,249,082
|
-
|
-
|
(197,049
|
)
|
2,052,033
|
|||||||||||||||||
|
2023 LTI performance based – staff
|
12-Sep-23
|
01-Jul-26
|
0.2250
|
1,361,291
|
-
|
-
|
(149,891
|
)
|
1,211,400
|
|||||||||||||||||
|
2023 LTI time based - KMP
|
12-Sep-23
|
01-Jul-26
|
0.2250
|
1,533,520
|
-
|
-
|
-
|
1,533,520
|
||||||||||||||||||
|
2023 LTI performance based – KMP
|
12-Sep-23
|
01-Jul-26
|
0.2250
|
2,300,279
|
-
|
-
|
-
|
2,300,279
|
||||||||||||||||||
|
2023 LTI time based – KMP
|
12-Sep-23
|
01-Jul-26
|
0.2250
|
1,127,137
|
-
|
-
|
-
|
1,127,137
|
||||||||||||||||||
|
2023 LTI performance based – KMP
|
12-Sep-23
|
01-Jul-26
|
0.2250
|
1,690,704
|
-
|
-
|
-
|
1,690,704
|
||||||||||||||||||
|
Retention on employment – staff
|
1-Oct-23
|
30-Sep-26
|
0.2200
|
225,000
|
-
|
-
|
-
|
225,000
|
||||||||||||||||||
|
2023 STI time based – KMP
|
03-Nov-23
|
01-Jul-24
|
0.1750
|
2,910,454
|
-
|
(2,910,454
|
)
|
-
|
-
|
|||||||||||||||||
|
Retention on employment – directors
|
03-Nov-23
|
02-Nov-24
|
0.2400
|
1,361,955
|
-
|
(1,361,955
|
)
|
-
|
-
|
|||||||||||||||||
|
2024 STI – staff
|
01-Jul-24
|
01-Oct-24
|
0.1488
|
-
|
3,417,317
|
(722,266
|
)
|
-
|
2,695,051
|
|||||||||||||||||
|
2024 STI – KMP
|
01-Jul-24
|
01-Oct-24
|
0.1488
|
-
|
7,338,731
|
-
|
-
|
7,338,731
|
||||||||||||||||||
|
2024 LTI performance based – KMP
|
30-Sep-24
|
01-Jul-27
|
0.1488
|
-
|
5,411,818
|
-
|
-
|
5,411,818
|
||||||||||||||||||
|
2024 LTI time based – KMP
|
30-Sep-24
|
01-Jul-27
|
0.1488
|
-
|
3,607,876
|
-
|
-
|
3,607,876
|
||||||||||||||||||
|
2024 LTI performance based – staff
|
30-Sep-24
|
01-Jul-27
|
0.1488
|
-
|
2,815,486
|
-
|
(54,774
|
)
|
2,760,712
|
|||||||||||||||||
|
2024 LTI time based - staff
|
30-Sep-24
|
01-Jul-27
|
0.1488
|
-
|
4,494,646
|
-
|
(164,323
|
)
|
4,330,323
|
|||||||||||||||||
|
2024 LTI performance based - KMP
|
01-Nov-24
|
01-Jul-27
|
0.2800
|
-
|
4,009,239
|
-
|
-
|
4,009,239
|
||||||||||||||||||
|
2024 LTI time based – KMP
|
01-Nov-24
|
01-Jul-27
|
0.2800
|
-
|
2,672,826
|
-
|
-
|
2,672,826
|
||||||||||||||||||
|
2024 STI – KMP
|
01-Nov-24
|
01-Jul-25
|
0.2800
|
-
|
6,079,022
|
-
|
-
|
6,079,022
|
||||||||||||||||||
|
Retention on employment – directors
|
01-Nov-24
|
01-Nov-25
|
0.2800
|
-
|
713,826
|
-
|
(65,369
|
)
|
648,457
|
|||||||||||||||||
|
ROD bonus – KMP
|
07-Nov-24
|
08-Nov-24
|
0.2100
|
-
|
7,558,318
|
(7,558,318
|
)
|
-
|
-
|
|||||||||||||||||
|
ROD bonus – staff
|
07-Nov-24
|
08-Nov-24
|
0.2100
|
-
|
8,488,674
|
(8,488,674
|
)
|
-
|
-
|
|||||||||||||||||
|
2024 supplemental LTI -
|
01-Mar-25
|
28-Feb-29
|
0.1450
|
6,273,298
|
-
|
-
|
6,273,298
|
|||||||||||||||||||
|
Retention on employment – directors
|
05-May-25
|
04-May-28
|
0.1350
|
-
|
200,000
|
-
|
-
|
200,000
|
||||||||||||||||||
|
Movement for the year ended 30 June 2025
|
33,882,163
|
63,081,077
|
(30,057,808
|
)
|
(3,614,903
|
)
|
63,290,529
|
|||||||||||||||||||
|
Movement in performance rights on issue for the year ended June 30, 2024
|
||||||||||||||||||||||||||
|
Grant
|
Vesting
|
Fair value
per
right
grant
date
|
Opening
balance
|
Issued
|
Exercised
|
Forfeited
|
Closing
balance
|
|||||||||||||||||||
|
date
|
date
|
|
$ |
Number
|
Number
|
Number
|
Number
|
Number | ||||||||||||||||||
|
2020 LTI - performance based - KMP
|
06-Nov-20
|
01-Jul-23
|
0.1665
|
2,016,774
|
-
|
(705,871
|
)
|
(1,310,903
|
)
|
-
|
||||||||||||||||
|
2020 LTI - time based - KMP
|
06-Nov-20
|
01-Jul-23
|
0.1950
|
1,344,516
|
-
|
(1,344,516
|
)
|
-
|
-
|
|||||||||||||||||
|
2020 LTI - performance based - staff
|
01-Jul-20
|
01-Jul-23
|
0.1370
|
1,527,255
|
-
|
(534,541
|
)
|
(992,714
|
)
|
-
|
||||||||||||||||
|
2020 LTI - time based - staff
|
01-Jul-20
|
01-Jul-23
|
0.1250
|
2,170,190
|
-
|
(2,170,190
|
)
|
-
|
-
|
|||||||||||||||||
|
2020 LTI - performance based - KMP
|
01-Jul-20
|
01-Jul-23
|
0.1370
|
3,642,025
|
-
|
(1,274,711
|
)
|
(2,367,314
|
)
|
-
|
||||||||||||||||
|
2020 LTI time based - KMP
|
01-Jul-20
|
01-Jul-23
|
0.1250
|
2,428,016
|
-
|
(2,428,016
|
)
|
-
|
-
|
|||||||||||||||||
|
Retention on employment- staff
|
30-Sep-20
|
30-Sep-23
|
0.1200
|
226,129
|
-
|
(226,129
|
)
|
-
|
-
|
|||||||||||||||||
|
Retention on employment- directors
|
01-Feb-21
|
01-Feb-24
|
0.3300
|
600,000
|
-
|
(600,000
|
)
|
-
|
-
|
|||||||||||||||||
|
2021 LTI - performance based - KMP
|
01-Jul-21
|
01-Jul-24
|
0.3710
|
1,458,852
|
-
|
-
|
-
|
1,458,852
|
||||||||||||||||||
|
2021 LTI - time based - KMP
|
01-Jul-21
|
01-Jul-24
|
0.3300
|
972,569
|
-
|
-
|
-
|
972,569
|
||||||||||||||||||
|
Retention on employment- staff
|
01-Jul-21
|
01-Jul-24
|
0.3300
|
679,146
|
-
|
-
|
-
|
679,146
|
||||||||||||||||||
|
2021 LTI - performance based - staff
|
26-Aug-21
|
01-Jul-24
|
0.4570
|
605,125
|
-
|
-
|
(27,948
|
)
|
577,177
|
|||||||||||||||||
|
2021 LTI - time based - staff
|
26-Aug-21
|
01-Jul-24
|
0.5100
|
1,028,040
|
-
|
-
|
(83,845
|
)
|
944,195
|
|||||||||||||||||
|
2021 LTI - performance based - KMP
|
05-Nov-21
|
01-Jul-24
|
0.7240
|
1,567,975
|
-
|
-
|
-
|
1,567,975
|
||||||||||||||||||
|
2021 LTI time based - KMP
|
05-Nov-21
|
01-Jul-24
|
0.7900
|
1,045,316
|
-
|
-
|
-
|
1,045,316
|
||||||||||||||||||
|
Retention on employment- staff
|
16-Nov-21
|
16-Nov-24
|
0.7050
|
115,000
|
-
|
-
|
-
|
115,000
|
||||||||||||||||||
|
2022 LTI – performance based - KMP
|
01-Jul-22
|
01-Jul-25
|
0.4528
|
1,392,806
|
-
|
-
|
-
|
1,392,806
|
||||||||||||||||||
|
2022 LTI – time based – KMP
|
01-Jul-22
|
01-Jul-25
|
0.4250
|
928,538
|
-
|
-
|
-
|
928,538
|
||||||||||||||||||
|
Retention on employment – staff
|
01-Jul-22
|
01-Jul-25
|
0.4250
|
35,000
|
-
|
-
|
-
|
35,000
|
||||||||||||||||||
|
2022 Cash Bonus conversion – KMP
|
01-Jul-22
|
01-Jul-23
|
0.4250
|
1,207,370
|
-
|
(1,207,370
|
)
|
-
|
-
|
|||||||||||||||||
|
2022 Cash Bonus conversion– staff
|
01-Jul-22
|
01-Jul-23
|
0.4250
|
929,307
|
-
|
(929,307
|
)
|
-
|
-
|
|||||||||||||||||
|
2022 LTI – time based – staff
|
22-Aug-22
|
01-Jul-25
|
0.6800
|
200,000
|
-
|
-
|
-
|
200,000 | ||||||||||||||||||
|
Retention on employment – directors
|
25-Aug-22
|
25-Aug-25
|
0.6600
|
200,000
|
-
|
-
|
-
|
200,000 | ||||||||||||||||||
|
2022 LTI – performance based – staff
|
01-Sep-22
|
01-Jul-25
|
0.6128
|
59,905
|
-
|
-
|
-
|
59,905 | ||||||||||||||||||
|
2022 LTI – time based – staff
|
01-Sep-22
|
01-Jul-25
|
0.6500
|
179,715
|
-
|
-
|
-
|
179,715 | ||||||||||||||||||
|
2022 LTI – performance based - staff
|
05-Sep-22
|
01-Jul-25
|
0.6448
|
306,987
|
-
|
-
|
-
|
306,987 | ||||||||||||||||||
|
2022 LTI – time based – staff
|
05-Sep-22
|
01-Jul-25
|
0.6150
|
204,658
|
-
|
-
|
-
|
204,658 | ||||||||||||||||||
|
2022 LTI – performance based – staff
|
05-Sep-22
|
01-Jul-25
|
0.5780
|
681,095
|
-
|
-
|
(29,455
|
)
|
651,640 | |||||||||||||||||
|
2022 LTI – time based – staff
|
05-Sep-22
|
01-Jul-25
|
0.6150
|
1,050,312
|
-
|
-
|
(88,364
|
)
|
961,948 | |||||||||||||||||
|
2022 LTI – performance based – KMP
|
04-Nov-22
|
01-Jul-25
|
0.5245
|
1,249,442
|
-
|
-
|
-
|
1,249,442 | ||||||||||||||||||
|
2022 LTI time based – KMP
|
04-Nov-22
|
01-Jul-25
|
0.5700
|
832,962
|
-
|
-
|
-
|
832,962 | ||||||||||||||||||
|
PR’s in lieu of directors fees
|
04-Nov-22
|
04-Nov-23
|
0.5700
|
385,824
|
-
|
-
|
-
|
385,824 | ||||||||||||||||||
|
Retention on employment - staff
|
01-Jan-23
|
01-Jan-26
|
0.3700
|
200,000
|
-
|
-
|
-
|
200,000 | ||||||||||||||||||
|
2023 STI time based - staff
|
01-Jul-23
|
01-Jul-24
|
-
|
548,268
|
-
|
-
|
548,268 | |||||||||||||||||||
|
2023 STI performance based – KMP
|
01-Jul-23
|
01-Jul-24
|
-
|
3,810,642
|
- |
-
|
3,810,642 | |||||||||||||||||||
|
2023 STI time based – KMP
|
03-Nov-23
|
01-Jul-24
|
-
|
2,910,454
|
- |
-
|
2,910,454 | |||||||||||||||||||
|
Retention on employment – directors
|
03-Nov-23
|
02-Nov-24
|
-
|
1,361,955
|
- |
-
|
1,361,955 | |||||||||||||||||||
|
2023 LTI time based – staff
|
12-Sep-23
|
01-Jul-26
|
-
|
2,249,082
|
- |
-
|
2,249,082 | |||||||||||||||||||
|
2023 LTI performance based – staff
|
12-Sep-23
|
01-Jul-26
|
-
|
1,361,291
|
- |
-
|
1,361,291 | |||||||||||||||||||
|
2023 LTI time based - KMP
|
12-Sep-23
|
01-Jul-26
|
-
|
1,533,520
|
- |
-
|
1,533,520 | |||||||||||||||||||
|
2023 LTI performance based – KMP
|
12-Sep-23
|
01-Jul-26
|
-
|
2,300,279
|
- |
-
|
2,300,279 | |||||||||||||||||||
|
Retention on employment – staff
|
1-Oct-23
|
30-Sep-26
|
-
|
225,000
|
- | - | 225,000 | |||||||||||||||||||
|
2023 LTI time based – KMP
|
12-Sep-23
|
01-Jul-26
|
-
|
1,127,137
|
- | - | 1,127,137 | |||||||||||||||||||
|
2023 LTI performance based – KMP
|
12-Sep-23
|
01-Jul-26
|
-
|
1,690,704
|
- | - | 1,690,704 | |||||||||||||||||||
|
2023 MD Awards – KMP
|
01-Oct-23
|
03-Oct-23
|
-
|
280,000
|
(280,000
|
)
|
- |
-
|
||||||||||||||||||
|
2023 cash bonus conversion – staff
|
29-Sep-23
|
01-Oct-23
|
-
|
749,694
|
(749,694
|
)
|
- | - | ||||||||||||||||||
|
Movement for the year ended 30 June 2024
|
31,470,849
|
20,148,026
|
(12,836,169
|
)
|
(4,900,543
|
)
|
33,882,163 | |||||||||||||||||||
| 5.2. |
Reserves
|
|
2025
|
2024
|
|||||||
|
$
|
’000
|
$
|
’000
|
|||||
|
Equity compensation reserve
|
||||||||
|
Balance at the beginning of period
|
9,663
|
7,278
|
||||||
|
Share based payment expensed/capitalized
|
6,106
|
4,277
|
||||||
|
Fair value of unlisted options exercised
|
-
|
-
|
||||||
|
Fair value of performance rights vested
|
(5,186
|
)
|
(1,892
|
)
|
||||
|
Balance at the end of the financial period
|
10,583
|
9,663
|
||||||
|
Foreign currency translation reserve
|
||||||||
|
Balance at the beginning of period
|
(12,761
|
)
|
(12,716
|
)
|
||||
|
Foreign currency translation differences for foreign operations
|
(269
|
)
|
(45
|
)
|
||||
|
Balance at the end of the financial period
|
(13,030
|
)
|
(12,761
|
)
|
||||
|
Total reserves
|
(2,447
|
)
|
(3,098
|
)
|
||||
|
|
• |
The translation of the financial statements of foreign operations where the functional currency is different to the functional currency of the parent entity; and
|
|
|
• |
Exchange differences arise on the translation of monetary items which form part of the net investment in the foreign operation.
|
|
Section 6.
|
Financial instruments
|
| 6.1. |
Classification and measurement
|
| 6.2. |
Financial risk management
|
|
|
a) |
Credit risk
|
|
|
b) |
Liquidity risk
|
|
|
c) |
Capital management risk
|
|
|
d) |
Market risk related to commodity pricing, interest rates and currency fluctuations.
|
| a) |
Credit risk
|
| b) |
Liquidity risk
|
|
Less than 1
year
|
1-2 years
|
2-5 years
|
More than 5
years
|
Total
|
||||||||||||||||||||
|
Contractual cash flows
|
Note
|
|
$’000
|
|
$’000
|
|
$’000
|
|
$’000
|
|
$’000
|
|||||||||||||
|
Consolidated – 2025
|
||||||||||||||||||||||||
|
Payables
|
4.8
|
2,408
|
-
|
-
|
-
|
2,408
|
||||||||||||||||||
|
Lease Liabilities
|
4.8
|
118
|
168
|
108
|
-
|
394
|
||||||||||||||||||
|
Borrowings
|
4.9 | - | - | - | - | - | ||||||||||||||||||
|
Total
|
2,526
|
168
|
108
|
-
|
2,802
|
|||||||||||||||||||
|
Consolidated – 2024
|
||||||||||||||||||||||||
|
Payables
|
4.8
|
4,614
|
-
|
-
|
-
|
4,614
|
||||||||||||||||||
|
Lease Liabilities
|
4.8
|
41
|
29
|
13
|
-
|
83
|
||||||||||||||||||
| Borrowings |
4.9 |
1,200 | - | - | - | 1,200 | ||||||||||||||||||
|
Total
|
5,855
|
29
|
13
|
-
|
5,897
|
|||||||||||||||||||
| c) |
Capital management risk
|
| d) |
Market risk
|
|
Average rate for the
year ended June 30 |
Spot rate at the end of the
reporting period |
|||||||
|
Exchange rates applied during the year:
|
||||||||
|
AUD / USD
|
0.6465
|
0.6561
|
||||||
|
2025
|
2024
|
|||||||
|
Financial instruments denominated in United States dollars
|
|
US$’000 |
|
US$’000 | ||||
|
Financial assets
|
||||||||
|
Cash
|
16,398
|
11,513
|
||||||
|
Trade and other receivables
|
19
|
105
|
||||||
|
Financial liabilities
|
||||||||
|
Trade and other payables
|
(321
|
)
|
(120
|
)
|
||||
|
Provisions
|
- | - | ||||||
|
Lease liabilities
|
(296
|
)
|
(251
|
)
|
||||
|
|
• |
$1,639,839 increase in A$ cash balance (June 30, 2024: $1,151,000) with nil impact on current year loss because the impact is taken to foreign currency translation reserve.
|
|
|
• |
$1,858 increase in A$ receivables (June 30, 2024: $10,000) with nil impact on current year loss because the impact is taken to foreign currency translation reserve.
|
|
|
• |
$32,146 increase in payables (June 30, 2024: $12,000) with nil impact on current year loss because the impact is taken to foreign currency translation reserve.
|
|
|
• |
No change to lease liabilities (June 30, 2024: nil) with nil impact on current year loss because the impact is taken to foreign currency translation reserve.
|
|
|
• |
$29,650 increase in provisions (June 30, 2024: $25,000) with nil impact on current year loss because the impact is taken to foreign currency translation reserve.
|
|
|
• |
$1,639,839 decrease in A$ cash balance (June 30, 2024: $1,151,000) with nil impact on current year loss because the impact is taken to foreign currency translation reserve.
|
|
|
• |
$1,858 decrease in A$ receivables (June 30, 2024: $10,000) with nil impact on current year loss because the impact is taken to foreign currency translation reserve.
|
|
|
• |
$32,146 decrease in payables (June 30, 2024: $12,000) with nil impact on current year loss because the impact is taken to foreign currency translation reserve.
|
|
|
• |
No change to lease liabilities (June 30, 2024: nil) with nil impact on current year loss because the impact is taken to foreign currency translation reserve.
|
|
|
• |
$29,650 decrease in provisions (June 30, 2024: $25,000) with nil impact on current year loss because the impact is taken to foreign currency translation reserve.
|
|
Section 7.
|
Employee benefits and KMP disclosures
|
|
7.1.
|
Employee benefits expensed
|
|
2025
|
|
|
|
2024
|
|
|
|
2023 | ||||
|
$’000
|
|
|
|
$’000
|
|
|
|
$’000
|
||||
|
Non-Executive Director fees
|
410
|
410
|
401
|
|||||||||
|
Executive Director fees2
|
313
|
311
|
516
|
|||||||||
|
Employee benefits expense
|
2,485
|
2,990
|
3,674
|
|||||||||
|
Share-based payments
|
3,164
|
1,633
|
1,376
|
|||||||||
|
Total employee benefit expense
|
6,372
|
5,344
|
5,967
|
| 7.2. |
Key management personnel disclosure
|
|
2025
|
2024
|
2023
|
||||||||||
|
|
$’000
|
|
$’000
|
|
$’000
|
|
||||||
|
Salary and Short-term incentive
|
3,015
|
3,734
|
3,709
|
|||||||||
|
Post-employment benefits
|
75
|
121
|
101
|
|||||||||
|
Share-based payments
|
3,539
|
1,884
|
1,501
|
|||||||||
|
Total payments to KMP
|
6,629
|
5,739
|
5,311
|
|||||||||
| 7.3. |
Share-based payments
|
|
|
i. |
the extent to which the vesting period has expired, and
|
|
|
ii. |
the number of awards that, in the opinion of the directors of the Company, will ultimately vest.
|
|
Type
|
Key terms
|
Expiry Date
|
|
Options
|
||
|
Non-Executive
Directors
|
The options were issued at an exercise price equal to the VWAP for the Company’s shares over the 10 trading days immediately before the date of the AGM. The options vest after 12
months and expire 60 months from the date of issue.
|
Tranche 2: Nov 14, 2024
|
|
Performance rights – time-based
|
||
|
Retention on
Employment
|
• Agreements with early recruits included vesting in equal instalments after 12, 24 and 36 months. However, since mid-2019 a standard approach of vesting after 3 years has been implemented.
• Conditional on the achievement of continuing employment
|
N/A
|
|
Deferred STI
|
• 12 month
vesting period from July 1 the year following the relevant STI period
• Conditional on the achievement of continuing employment
|
N/A
|
|
LTI grants
|
• 36 month
vesting period from July 1 of relevant period
• Conditional on the achievement of continuing employment
|
N/A
|
|
Type
|
Key terms
|
Expiry Date
|
|
Performance rights – performance-based
|
||
|
LTI grants
|
• 36 month
vesting period from July 1 of relevant period
• The Board will employ discretion in assessing Project results and determining vesting of performance units; below, at or
above targets:
o HSE: Top quartile HSE & Community performance (compared to North American Mining Projects)
o Construction: Construction delivery compared to schedule at FID
o Ops Readiness: Operational and business readiness on track (recruiting, systems, training etc.)
o Cost Control: Project spend within margin established at FID
o Share price: INR shareholder return compared to competitors
• Unlike producing organizations with established operations that typically aim to deliver performance conditions tied to
anticipated revenues, production levels and growth objectives, ioneer has a single pre-production project with less certainty or control over key deliverables. Providing the Board with the discretion to assess the
extent of delivery, the importance/value of the various targets delivered (or not) allows the ability to balance shareholder expectations and KMP reward, motivation and retention.
• The Board will employ discretion in assessing Project results and determining the vesting of performance units; below, at or
above targets (up to 200%)
|
N/A
|
|
|
• |
The Board may at its discretion make invitations to or grant awards to eligible persons.
|
|
|
• |
Award means an option or a performance right to acquire a Share in the capital of the Company.
|
|
|
• |
Eligible Persons include executive directors or executive officers of the Group, employees, contractors or consultants of the group or any other person.
|
|
|
• |
A participant may not sell or assign awards.
|
|
|
• |
Within 30 days after the vesting date in respect of a vested performance right, the Company must
either allocate shares or procure payment to the participant of a cash amount equal to the market price of the shares which would have otherwise been allocated.
|
|
|
• |
At any time during the exercise period a participant may exercise any or all their vested options by paying the exercise price.
|
|
|
• |
Full or part time employees or consultants of the Group are eligible to participate.
|
|
|
• |
Options issued pursuant to the plan will be issued free of charge.
|
|
|
• |
Options are time based and there are no performance conditions.
|
|
|
• |
Options cannot be transferred and are not quoted on the ASX.
|
|
|
• |
Options expire if not exercised 90 days after a participant resigns from the Company.
|
|
|
• |
The exercise price of the options, at grant date, shall be as the directors in their absolute discretion determine, provided the exercise price shall not be less than the weighted average of the last sale price of
the Company’s shares on ASX at the close of business on each of the 5 business days immediately
preceding the date on which the directors resolve to grant the options.
|
|
|
• |
The directors may limit the total number of options which may be exercised under the plan in any year.
|
|
Section 8.
|
Group structure
|
|
8.1
|
Controlled entities
|
|
2025
|
2024
|
2023
|
|||||||
|
Controlled entities of ioneer Ltd
|
Note |
Country of
incorporation
|
ownership
interest |
ownership
interest
|
ownership
interest
|
||||
|
Ioneer USA Corporation
|
USA
|
100
|
100
|
100
|
|||||
|
Ioneer Minerals Corporation
|
USA
|
100
|
100
|
100
|
|||||
|
Ioneer Holdings USA Inc.
|
USA
|
100
|
100
|
100
|
|||||
|
Ioneer Holdings Nevada Inc.
|
USA
|
100
|
100
|
100
|
|||||
|
Gerlach Gold LLC
|
USA
|
100
|
100
|
100
|
|||||
|
Paradigm AZ LLC
|
USA
|
100
|
100
|
100
|
|||||
|
Ioneer Rhyolite Ridge Holdings LLC
|
USA
|
100
|
100
|
100
|
|||||
|
Ioneer Rhyolite Ridge Midco LLC
|
USA
|
100
|
100
|
100
|
|||||
|
Ioneer Rhyolite Ridge LLC
|
USA
|
100
|
100
|
100
|
|||||
|
Ioneer SLP LLC
|
USA
|
0
|
100
|
100
|
|||||
|
ioneer Canada ULC
|
Canada
|
100
|
100
|
100
|
|
Section 9.
|
Other disclosures
|
|
9.1
|
Capital and other commitments
|
|
2025
|
2024
|
|||||||
|
$’000
|
$’000
|
|||||||
|
Payable within one year
|
||||||||
|
Water rights
|
1,336
|
498
|
||||||
|
Non-cancellable lease commitments
|
261
|
267
|
||||||
|
Exploration and evaluation expenditure commitments
|
317
|
216
|
||||||
|
Sub total
|
1,913
|
981
|
||||||
|
Payable after one year but not later than five years
|
||||||||
|
Water rights
|
4,971
|
953
|
||||||
|
Non-cancellable lease commitments
|
288
|
54
|
||||||
|
Exploration and evaluation expenditure commitments
|
317
|
432
|
||||||
|
Sub total
|
5,576
|
1,439
|
||||||
|
Payable later than five years
|
||||||||
|
Water rights
|
9,116
|
-
|
||||||
|
Non-cancellable operating lease rental commitments
|
-
|
-
|
||||||
|
Exploration and evaluation expenditure commitments
|
-
|
-
|
||||||
|
Sub total
|
9,116
|
-
|
||||||
|
Total commitments
|
16,605
|
2,420
|
||||||
|
9.2
|
Contingent liabilities
|
|
|
• |
Pay Boundary Peak LLC US$3 million, or
|
|
|
• |
Issue shares (or a mix of both shares and cash) to Boundary Peak LLC, to the equivalent of US$3
million at a fixed exchange rate of USD $0.75 = AUD$1.00.
|
|
9.3
|
Related Party disclosures
|
|
9.4
|
Events after reporting date
|
| ITEM 19. | EXHIBITS |
|
Exhibit
Number
|
Description
|
|
|
Constitution of ioneer Ltd (incorporated by reference to Exhibit 1.1 to the Company’s Registration Statement on Form 20-F, filed on June 3, 2022)
|
||
|
Deposit Agreement among ioneer Ltd, The Bank of New York Mellon, and Owners and Holders of American Depositary Shares (incorporated by reference to Exhibit 2.1 to the Company’s Registration Statement on Form
20-F, filed on June 3, 2022)
|
||
|
Form of American Depositary Receipt evidencing American Depositary Shares (included in Exhibit 2.1)
|
||
|
Description of Share Capital (incorporated by reference to Exhibit 2.3 to the Company’s Annual Report on Form 20-F, filed on October 21, 2022)
|
||
|
4.1+ |
Loan Arrangement and Reimbursement Agreement, dated January 17, 2025, by and between ioneer Rhyolite Ridge LLC and United States Department of
Energy |
|
|
4.2+ |
Sponsor Support, Share Retention and Subordination Agreement, dated January 17, 2025, by and among ioneer Ltd, ioneer Rhyolite Ridge LLC, United States Department of Energy, Citibank,
N.A. and other parties thereto |
|
|
Mining Lease and Option to Purchase Agreement, dated June 3, 2016, by and among Boundary Peak Minerals LLC, Paradigm Minerals Arizona Corporation and the other parties thereto (incorporated by reference to
Exhibit 4.2 to the Company’s Registration Statement on Form 20-F, filed on June 15, 2022)+
|
||
|
Form of ioneer Ltd Employee and Consultant Share Option Plan (incorporated by reference to Exhibit 99.1 to the Company’s Registration Statement on Form S-8, filed on July 14, 2022).
|
||
|
Form of ioneer Ltd Incentive Plan (incorporated by reference to Exhibit 99.2 to the Company’s Registration Statement on Form S-8, filed on July 14, 2022).
|
||
|
List of Subsidiaries of ioneer Ltd (incorporated by reference to Exhibit 8.1 to the Company’s Registration Statement on Form 20-F, filed on June 3, 2022)
|
||
|
Trading Policy (incorporated by reference to Exhibit 11.1 to the Company’s Annual Report on Form 20-F, filed on October 22, 2024)
|
||
|
Section 302 Certification of Chief Executive Officer
|
||
|
Section 302 Certification of Chief Financial Officer
|
||
|
Section 906 Certification of Chief Executive Officer
|
||
|
Section 906 Certification of Chief Financial Officer
|
||
|
Consent of Ernst & Young
|
||
| 15.2 | Consent of Independent Mining Consultants, Inc. |
|
|
Technical Report Summary, dated September 30, 2025
|
||
|
Clawback Policy (incorporated by reference to Exhibit 11.1 to the Company’s Annual Report on Form 20-F, filed on October 22, 2024)
|
||
|
101.1
|
The following financial statements from the Company’s Annual Report on Form 20-F for the year ended June 30, 2025, formatted in Inline XBRL: (i) Consolidated Statements of Profit or Loss and Other
Comprehensive Income, (ii) Consolidated Statement of Financial Position, (iii) Consolidated Statements of Changes in Equity, (iv) Consolidated Statements of Cash Flows, and (v) Notes to Consolidated Financial Statements, tagged as
blocks of text and including detailed tags.
|
|
|
104
|
Cover Page Interactive Data File (formatted as Inline XBRL and contained in Exhibit 101).
|
| + |
Certain confidential information contained in this document, marked by ***, has been omitted because it is both (i) not material and (ii) would be competitively harmful if publicly disclosed.
|
|
IONEER LTD
|
|||
|
By:
|
/s/ Bernard Rowe
|
||
|
Bernard Rowe
|
|||
|
Managing Director and Chief Executive Officer
|
|||
|
Date: October 22, 2025
|
|||
|
ARTICLE I DEFINITIONS AND OTHER RULES OF CONSTRUCTION
|
2
|
||
|
Section 1.01
|
Terms Generally
|
2
|
|
|
Section 1.02
|
Other Rules of Construction
|
2
|
|
|
Section 1.03
|
Definitions in Other Written Communications
|
4
|
|
|
Section 1.04
|
Conflict with Funding Agreements
|
4
|
|
|
Section 1.05
|
Accounting Terms
|
4
|
|
|
ARTICLE II FUNDING
|
4
|
||
|
Section 2.01
|
Loan
|
4
|
|
|
Section 2.02
|
Availability and Reductions
|
4
|
|
|
Section 2.03
|
Mechanics for Requesting Advances
|
5
|
|
|
Section 2.04
|
Mechanics for Funding Advances
|
6
|
|
|
Section 2.05
|
Advance Requirements under the Funding Agreements
|
9
|
|
|
Section 2.06
|
No Approval of Work
|
9
|
|
|
Section 2.07
|
Determination of Advance Amounts
|
9
|
|
|
ARTICLE III PAYMENTS; PREPAYMENTS
|
10
|
||
|
Section 3.01
|
Place and Manner of Payments
|
10
|
|
|
Section 3.02
|
Maturity and Amortization
|
10
|
|
|
Section 3.03
|
Evidence of Debt
|
11
|
|
|
Section 3.04
|
Interest Provisions Relating to All Advances
|
11
|
|
|
Section 3.05
|
Prepayments
|
12
|
|
|
ARTICLE IV REIMBURSEMENT AND OTHER PAYMENT OBLIGATIONS
|
16
|
||
|
Section 4.01
|
Reimbursement and Other Payment Obligations
|
16
|
|
|
Section 4.02
|
Subrogation
|
18
|
|
|
Section 4.03
|
Obligations Absolute
|
18
|
|
|
Section 4.04
|
Evidence of Payment
|
21
|
|
|
Section 4.05
|
Payment of Financing Document Amounts
|
21
|
|
|
ARTICLE V CONDITIONS PRECEDENT
|
22
|
||
|
Section 5.01
|
Conditions Precedent to the Execution Date
|
22
|
|
|
Section 5.02
|
Conditions Precedent to FFB Purchase of the Note
|
27
|
|
|
Section 5.03
|
Conditions Precedent to the First Advance Date
|
28
|
|
|
Section 5.04
|
Advance Approval Conditions Precedent
|
38
|
|
|
Section 5.05
|
Conditions Precedent to FFB Advance
|
44
|
|
|
Section 5.06
|
Advance Deductions
|
44
|
|
|
Section 5.07
|
Satisfaction of Conditions Precedent
|
45
|
|
|
ARTICLE VI REPRESENTATIONS AND WARRANTIES
|
45
|
||
|
Section 6.01
|
Organization and Existence
|
45
|
|
|
Section 6.02
|
Authorization; No Conflict
|
46
|
|
|
Section 6.03
|
Capitalization
|
46
|
|
|
Section 6.04
|
Solvency
|
46
|
|
|
Section 6.05
|
Eligibility of Borrower; Project
|
47
|
|
|
Section 6.06
|
Transaction Documents
|
47
|
|
|
Section 6.07
|
Required Approvals
|
47
|
|
|
Section 6.09
|
Indebtedness
|
48
|
|
|
Section 6.10
|
Security Interests; Liens
|
48
|
|
|
Section 6.11
|
Taxes
|
49
|
|
|
Section 6.12
|
Financial Statements
|
49
|
|
|
Section 6.13
|
Business; Other Transactions
|
50
|
|
|
Section 6.14
|
Accounts
|
51
|
|
|
Section 6.15
|
Real Property
|
51
|
|
|
Section 6.16
|
Integrated Project Schedule and Construction Budget; Operating Forecasts and Base Case Financial Model
|
53
|
|
|
Section 6.17
|
Intellectual Property
|
53
|
|
|
Section 6.18
|
Infringement; No Adverse Proceedings
|
54
|
|
|
Section 6.19
|
No Amendments to Transaction Documents
|
55
|
|
|
Section 6.20
|
Compliance with Laws; Program Requirements
|
55
|
|
|
Section 6.21
|
Investment Company Act
|
55
|
|
|
Section 6.22
|
Margin Stock
|
55
|
|
|
Section 6.23
|
Anti-Corruption Laws
|
55
|
|
|
Section 6.24
|
Environmental Laws
|
56
|
|
|
Section 6.25
|
Employment and Labor Contracts
|
56
|
|
|
Section 6.26
|
Davis-Bacon Act
|
57
|
|
|
Section 6.27
|
ERISA
|
57
|
|
|
Section 6.28
|
Sanctions; Anti-Money Laundering Laws
|
58
|
|
|
Section 6.29
|
Cargo Preference Act
|
59
|
|
|
Section 6.30
|
Lobbying Restriction
|
59
|
|
|
Section 6.31
|
Federal Funding
|
59
|
|
|
Section 6.32
|
No Federal Debt Delinquency
|
59
|
|
|
Section 6.33
|
No Tax-Exempt Indebtedness
|
60
|
|
|
Section 6.34
|
Sufficient Funds
|
60
|
|
|
Section 6.35
|
Use of Proceeds
|
60
|
|
|
Section 6.36
|
No Immunity
|
60
|
|
|
Section 6.37
|
No Fraudulent Intent
|
60
|
|
|
Section 6.38
|
Disclosure
|
60
|
|
|
Section 6.39
|
Insurance
|
61
|
|
|
Section 6.40
|
Information Technology; Cyber Security
|
61
|
|
|
Section 6.41
|
PUHCA
|
62
|
|
|
Section 6.42
|
Certain Events
|
62
|
|
|
Section 6.43
|
No Material Adverse Effect
|
62
|
|
|
Section 6.44
|
Water Agreements
|
62
|
|
|
Section 6.45
|
Production Interests
|
62
|
|
|
ARTICLE VII AFFIRMATIVE COVENANTS
|
62
|
||
|
Section 7.01
|
Maintenance of Existence; Property; Etc
|
62
|
|
|
Section 7.02
|
Intellectual Property
|
63
|
|
|
Section 7.03
|
Insurance
|
65
|
|
|
Section 7.04
|
Event of Loss
|
66
|
|
|
Section 7.05
|
Further Assurances; Creation and Perfection of Security Interests
|
68
|
|
|
Section 7.06
|
Diligent Construction of Project; Approved Project Changes
|
68
|
|
|
Section 7.07
|
Contractual Remedies
|
68
|
|
|
Section 7.08
|
Taxes, Duties, Expenses and Liabilities
|
69
|
|
|
Section 7.09
|
Performance of Obligations
|
69
|
|
|
Section 7.10
|
Sales and Marketing Plan
|
70
|
|
|
Section 7.11
|
Use of Proceeds
|
70
|
|
|
Section 7.12
|
Books, Records and Inspections
|
70
|
|
|
Section 7.13
|
Compliance with Applicable Law
|
72
|
|
|
Section 7.14
|
Compliance with Program Requirements
|
72
|
|
|
Section 7.15
|
Accounts; Cash Deposits
|
72
|
|
|
Section 7.16
|
Offtake Agreements
|
73
|
|
|
Section 7.17
|
Know Your Customer Information
|
73
|
|
|
Section 7.18
|
Davis-Bacon Act
|
73
|
|
|
Section 7.19
|
Lobbying Restriction
|
74
|
|
|
Section 7.20
|
Cargo Preference Act
|
74
|
|
|
Section 7.21
|
SAM Registration
|
75
|
|
|
Section 7.22
|
ERISA
|
75
|
|
|
Section 7.23
|
Historical Ratio
|
75
|
|
|
Section 7.24
|
Public Announcements
|
75
|
|
|
Section 7.25
|
Bankruptcy Remoteness
|
75
|
|
|
Section 7.26
|
Prohibited Persons
|
76
|
|
|
Section 7.27
|
International Compliance Directives
|
76
|
|
|
Section 7.28
|
Operating Plan; Operations
|
77
|
|
|
Section 7.29
|
O&M Budget
|
78
|
|
|
Section 7.30
|
Acceptance and Start-up Testing
|
79
|
|
|
Section 7.31
|
Investment Earnings
|
79
|
|
|
Section 7.32
|
Water Agreements
|
80
|
|
|
ARTICLE VIII INFORMATION COVENANTS
|
80
|
||
|
Section 8.01
|
Financial Statements
|
80
|
|
|
Section 8.02
|
Reports
|
82
|
|
|
Section 8.03
|
Notices
|
85
|
|
|
Section 8.04
|
Other Information
|
88
|
|
|
Section 8.05
|
Adverse Proceedings; Defense of Claims
|
88
|
|
|
ARTICLE IX NEGATIVE COVENANTS
|
88
|
||
|
Section 9.01
|
Restrictions on Operations
|
89
|
|
|
Section 9.02
|
Liens
|
90
|
|
|
Section 9.03
|
Merger; Disposition; Transfer
|
91
|
|
|
Section 9.04
|
Restricted Payments
|
91
|
|
|
Section 9.05
|
Use of Proceeds
|
92
|
|
|
Section 9.06
|
Organizational Documents; Fiscal Year; Account Policies; Reporting Practices
|
92
|
|
|
Section 9.07
|
Amendment of and Notices under Transaction Documents
|
92
|
|
|
Section 9.08
|
Approved Project Changes; Integrated Project Schedule; Budgets
|
94
|
|
|
Section 9.09
|
Hedging Agreements
|
94
|
|
|
Section 9.10
|
Margin Regulations
|
94
|
|
|
Section 9.11
|
Environmental Laws
|
95
|
|
|
Section 9.12
|
ERISA
|
95
|
|
|
Section 9.13
|
Investment Company Act
|
95
|
|
|
Section 9.14
|
Sanctions
|
95
|
|
|
Section 9.15
|
Debarment Regulations
|
96
|
|
|
Section 9.16
|
Prohibited Person
|
96
|
|
|
Section 9.17
|
Restrictions on Indebtedness and Certain Capital Transactions
|
96
|
|
|
Section 9.18
|
No Other Federal Funding
|
97
|
|
|
Section 9.19
|
Intellectual Property
|
97
|
|
|
Section 9.20
|
Program Requirements
|
98
|
|
|
Section 9.21
|
North Basin
|
98
|
|
|
ARTICLE X EVENTS OF DEFAULT AND REMEDIES
|
98
|
||
|
Section 10.01
|
Events of Default
|
98
|
|
|
Section 10.02
|
Remedies; Waivers
|
105
|
|
|
Section 10.03
|
Accelerated Advances
|
107
|
|
|
ARTICLE XI MISCELLANEOUS
|
108
|
||
|
Section 11.01
|
Waiver and Amendment
|
108
|
|
|
Section 11.02
|
Right of Set-Off
|
108
|
|
|
Section 11.03
|
Survival of Representations and Warranties
|
108
|
|
|
Section 11.04
|
Notices
|
109
|
|
|
Section 11.05
|
Severability
|
109
|
|
|
Section 11.06
|
Judgment Currency
|
109
|
|
|
Section 11.07
|
Indemnification
|
110
|
|
|
Section 11.08
|
Limitation on Liability
|
112
|
|
|
Section 11.09
|
Successors and Assigns
|
112
|
|
|
Section 11.10
|
FFB Right to Sell Loan
|
113
|
|
|
Section 11.11
|
Further Assurances and Corrective Instruments
|
113
|
|
|
Section 11.12
|
Reinstatement
|
113
|
|
|
Section 11.13
|
Governing Law; Waiver of Jury Trial
|
113
|
|
|
Section 11.14
|
Submission to Jurisdiction; Etc
|
114
|
|
|
Section 11.15
|
Entire Agreement
|
115
|
|
|
Section 11.16
|
Benefits of Agreement
|
115
|
|
|
Section 11.17
|
Headings
|
115
|
|
|
Section 11.18
|
Counterparts; Electronic Signatures
|
115
|
|
|
Section 11.19
|
No Partnership; Etc
|
116
|
|
|
Section 11.20
|
Independence of Covenants
|
116
|
|
|
Section 11.21
|
Marshaling
|
116
|
|
|
Section 11.22
|
Release Date
|
116
|
|
|
Annex A
|
Definitions
|
|
Schedule 3.02(b)
|
Amortization Schedule
|
|
Schedule 5.01(i)
|
Required Approvals
|
|
Schedule 5.03(gg)
|
Employment Projections
|
|
Schedule 5.04(y)
|
Specified Proceedings
|
|
Schedule 6.13(e)
|
Affiliate Transactions
|
|
Schedule 6.15(a)
|
Project Site
|
|
Schedule 6.15(c)
|
Project Mining Claims
|
|
Schedule 6.15(d)
|
Restrictions on Surface and Access Rights
|
|
Schedule 6.26(b)
|
Davis-Bacon Act Covered Contracts
|
|
Schedule 7.03
|
Required Insurance
|
|
Schedule 7.28
|
O&M Parameters
|
|
Schedule 11.04
|
Notices
|
|
Exhibit A
|
Form of Advance Request
|
|
Exhibit B-1
|
Form of Borrower Entity Advance Date Certificate
|
|
Exhibit B-2
|
Form of Independent Engineer Advance Date Certificate
|
|
Exhibit C
|
Form of Drawstop Notice
|
|
Exhibit D
|
Form of Officer’s Certificate
|
|
Exhibit E
|
Form of Closing Certificate
|
|
Exhibit F
|
Form of Tax Certificate
|
|
Exhibit G
|
Construction Budget
|
|
Exhibit H
|
O&M Budget
|
|
Exhibit I
|
Davis-Bacon Act Contract Provisions
|
|
Exhibit J
|
Form of Justice40 Annual Report and Community Benefits Plan
|
|
Exhibit K-1
|
Form of Borrower Financial Model Certification
|
|
Exhibit K-2
|
Form of Financial Advisor Financial Model Confirmation
|
|
Exhibit L
|
Form of Bring Down Certificate
|
|
Exhibit M
|
Form of Event of Loss Certificate
|
|
Exhibit N
|
Form of Compliance Certificate
|
|
Exhibit O
|
Form of Annual Certificate
|
|
Exhibit P
|
Form of Quarterly Certificate
|
|
Exhibit Q
|
Form of Construction Workforce Report
|
|
Exhibit R
|
Form of Operations and Maintenance Workforce Report
|
|
Exhibit S
|
Form of Monthly Certificate
|
|
Exhibit T
|
Form of Restricted Payment Certificate
|
|
Exhibit U
|
Safety Report
|
|
Exhibit V
|
Monthly Construction Progress Report
|
|
Exhibit W
|
Form of Prepayment Election Notice
|
|
IONEER RHYOLITE RIDGE LLC,
|
||
|
a Delaware limited liability company,
|
||
|
as Borrower
|
||
|
|
|
|
|
By:
|
/s/ Chad Yeftich
|
|
|
Name:
|
Chad Yeftich
|
|
|
Title:
|
Vice President Corporate Development & External Affairs
|
|
|
U.S. DEPARTMENT OF ENERGY,
|
||
|
an agency of the federal government of the United
|
||
|
States of America
|
||
|
|
||
|
By:
|
/s/ Herman Cortes
|
|
|
Name
|
Herman Cortes
|
|
|
Title:
|
Directors
|
|
|
ARTICLE I DEFINITIONS
|
2
|
||
|
ARTICLE II EQUITY FUNDING
|
9
|
||
|
Section 2.01
|
Base Equity Contributions
|
9
|
|
|
Section 2.02
|
Funded Completion Support
|
9
|
|
|
Section 2.03
|
Method of Contribution
|
11
|
|
|
Section 2.04
|
No Limitation
|
11
|
|
|
ARTICLE III SPONSOR GUARANTEES
|
11
|
||
|
Section 3.01
|
Sponsor Guarantee
|
11
|
|
|
Section 3.02
|
Nature of Guaranty
|
11
|
|
|
Section 3.03
|
Unconditional Obligations
|
12
|
|
|
Section 3.04
|
Subrogation
|
14
|
|
|
Section 3.05
|
Waiver; Demand of Payment
|
14
|
|
|
Section 3.06
|
Waiver of Defenses
|
14
|
|
|
Section 3.07
|
Taxes; Applicable Law
|
16
|
|
|
Section 3.08
|
Release
|
16
|
|
|
Section 3.09
|
No Set-off
|
16
|
|
|
ARTICLE IV RETENTION OF EQUITY INTERESTS
|
17
|
||
|
Section 4.01
|
Prohibition on Transfers of Equity Interests
|
17
|
|
|
Section 4.02
|
Effect of Prohibited Transfers
|
17
|
|
|
Section 4.03
|
Issuance of Equity Interests
|
18
|
|
|
Section 4.04
|
Notification of Transfer Restrictions
|
18
|
|
|
Section 4.05
|
Sponsor Accession
|
18
|
|
|
Section 4.06
|
Intermediate Companies
|
19
|
|
|
ARTICLE V RESTRICTED PAYMENTS
|
19
|
||
|
ARTICLE VI REPRESENTATIONS AND WARRANTIES
|
20
|
||
|
Section 6.01
|
Organization and Existence
|
20
|
|
|
Section 6.02
|
Authorization; No Conflict
|
21
|
|
|
Section 6.03
|
Capitalization
|
22
|
|
|
Section 6.04
|
Solvency
|
22
|
|
|
Section 6.05
|
Transaction Documents
|
22
|
|
|
Section 6.06
|
Required Approvals
|
23
|
|
|
Section 6.07
|
Litigation
|
23
|
|
|
Section 6.08
|
Corporate Matters
|
23
|
|
|
Section 6.09
|
Tax
|
23
|
|
|
Section 6.10
|
Financial Statements
|
24
|
|
|
Section 6.11
|
Intellectual Property
|
24
|
|
|
Section 6.12
|
No Amendments to Transaction Documents
|
26
|
|
|
Section 6.13
|
Compliance with Applicable Law; Program Requirements
|
26
|
|
|
Section 6.14
|
Investment Company Act
|
26
|
|
|
Section 6.15
|
Anti-Corruption Laws
|
26
|
|
|
Section 6.16
|
Sanctions; Anti-Money Laundering
|
27
|
|
|
Section 6.17
|
Prohibited Person
|
28
|
|
|
Section 6.18
|
ERISA
|
28
|
|
|
Section 6.19
|
Lobbying Restriction
|
29
|
|
|
Section 6.20
|
Federal Funding
|
29
|
|
|
Section 6.21
|
No Federal Debt Delinquency
|
29
|
|
|
Section 6.22
|
Sufficient Funds
|
29
|
|
|
Section 6.23
|
No Immunity
|
29
|
|
|
Section 6.24
|
No Fraudulent Intent
|
30
|
|
|
Section 6.25
|
Disclosure
|
30
|
|
|
Section 6.26
|
Fees and Enforcement
|
30
|
|
|
Section 6.27
|
Operating Agreement
|
30
|
|
|
Section 6.28
|
PUHCA
|
31
|
|
|
Section 6.29
|
Certain Events
|
31
|
|
|
Section 6.30
|
No Material Adverse Effect
|
31
|
|
|
ARTICLE VII COVENANTS
|
31
|
||
|
Section 7.01
|
Financial Covenants
|
31
|
|
|
Section 7.02
|
Financial Statements
|
31
|
|
|
Section 7.03
|
Notices
|
33
|
|
|
Section 7.04
|
Other Information
|
34
|
|
|
Section 7.05
|
Existence; Conduct of Business
|
35
|
|
|
Section 7.06
|
Intellectual Property
|
35
|
|
|
Section 7.07
|
Further Assurances; Creation and Perfection of Security Interests
|
37
|
|
|
Section 7.08
|
Tax, Duties, Expenses and Liabilities
|
37
|
|
|
Section 7.09
|
Performance of Obligations
|
38
|
|
|
Section 7.10
|
Books, Records and Inspections
|
38
|
|
|
Section 7.11
|
Compliance with Applicable Law
|
40
|
|
|
Section 7.12
|
Compliance with Program Requirements
|
41
|
|
|
Section 7.13
|
Know Your Customer Information
|
41
|
|
|
Section 7.14
|
Compliance with Debarment Regulations
|
41
|
|
|
Section 7.15
|
Public Statements
|
41
|
|
|
Section 7.16
|
Lobbying Restriction
|
41
|
|
|
Section 7.17
|
Bankruptcy Remoteness
|
41
|
|
|
Section 7.18
|
Prohibited Persons
|
42
|
|
|
Section 7.19
|
International Compliance Directives
|
42
|
|
|
Section 7.20
|
Direct Parent’s Activities
|
43
|
|
|
Section 7.21
|
Proper Legal Form
|
44
|
|
|
Section 7.22
|
Audit Reports
|
44
|
|
|
Section 7.23
|
Adverse Proceedings; Defense of Claims
|
44
|
|
|
ARTICLE VIII NEGATIVE COVENANTS
|
44
|
||
|
Section 8.01
|
Restrictions on Transfer
|
44
|
|
|
Section 8.02
|
Liens
|
45
|
|
|
Section 8.03
|
Permitted Subordinated Loan
|
45
|
|
|
Section 8.04
|
Organizational Documents; Fiscal Year; Legal Form; Capital Structure; Manager
|
45
|
|
|
Section 8.05
|
Acquisitions
|
45
|
|
|
Section 8.06
|
Investment Company Act
|
46
|
|
|
Section 8.07
|
Classification for Tax Purposes
|
46
|
|
|
Section 8.08
|
Sanctions
|
46
|
|
|
Section 8.09
|
ERISA
|
46
|
|
|
Section 8.10
|
Intellectual Property
|
47
|
|
|
Section 8.11
|
North Basin
|
47
|
|
|
ARTICLE IX SUBORDINATION
|
48
|
||
|
Section 9.01
|
Subordination
|
48
|
|
|
Section 9.02
|
Permitted Subordinated Loans
|
48
|
|
|
Section 9.03
|
Interest and Fees
|
48
|
|
|
Section 9.04
|
Payments
|
49
|
|
|
Section 9.05
|
Deferral
|
49
|
|
|
Section 9.06
|
No Acceleration
|
49
|
|
|
Section 9.07
|
No Commencement of Any Proceeding
|
49
|
|
|
Section 9.08
|
No Set-Off
|
49
|
|
|
Section 9.09
|
Subordination in Bankruptcy
|
49
|
|
|
Section 9.10
|
Rights of Subrogation
|
50
|
|
|
Section 9.11
|
Lien Subordination
|
50
|
|
|
Section 9.12
|
No Other Assignment
|
50
|
|
|
Section 9.13
|
Governing Law
|
50
|
|
|
Section 9.14
|
No Amendment to Subordinated Debt
|
50
|
|
|
Section 9.15
|
Amounts Held in Trust
|
51
|
|
|
Section 9.16
|
Assignment and Grant of Security Interest by the Sponsor Entities
|
51
|
|
|
ARTICLE X MISCELLANEOUS
|
52
|
||
|
Section 10.01
|
Waiver and Amendment
|
52
|
|
|
Section 10.02
|
Right of Set-Off
|
53
|
|
|
Section 10.03
|
Survival of Representations and Warranties
|
53
|
|
|
Section 10.04
|
Notices
|
54
|
|
|
Section 10.05
|
Severability
|
54
|
|
|
Section 10.06
|
Judgment Currency
|
54
|
|
|
Section 10.07
|
Indemnification
|
54
|
|
|
Section 10.08
|
Limitation on Liability
|
57
|
|
|
Section 10.09
|
Successors and Assigns
|
57
|
|
|
Section 10.10
|
Further Assurances and Corrective Instruments
|
57
|
|
|
Section 10.11
|
Reinstatement
|
58
|
|
|
Section 10.12
|
Governing Law; Waiver of Jury Trial
|
58
|
|
|
Section 10.13
|
Submission to Jurisdiction; Etc
|
58
|
|
|
Section 10.14
|
Entire Agreement
|
59
|
|
|
Section 10.15
|
Benefits of Agreement
|
60
|
|
|
Section 10.16
|
Headings
|
60
|
|
|
Section 10.17
|
Counterparts; Electronic Signatures
|
60
|
|
|
Section 10.18
|
No Partnership; Etc
|
61
|
|
|
Section 10.19
|
Independence of Covenants
|
61
|
|
|
Section 10.20
|
Marshaling
|
61
|
|
|
Section 10.21
|
Release Date
|
61
|
|
|
Section 10.22
|
Rights and Immunities of Secured Parties
|
61
|
|
Exhibit A
|
Form of Compliance Certificate
|
|
Exhibit B
|
Form of Letter of Credit
|
|
Exhibit C
|
Sponsor Accession Agreement
|
|
Schedule A
|
Notices
|
|
Schedule B
|
Capitalization Table
|
|
Schedule C
|
Location of Books and Records
|
| A. |
DOE has been authorized to arrange for FFB to make loans to manufacturers of advanced technology vehicles and components pursuant to the ATVM Program, as set forth in Section 136.
|
| B. |
Borrower has undertaken the development, design, engineering, procurement, construction, startup and commissioning, testing, repair, management, maintenance and operation of: (a) a lithium and boron mine; and (b) a facility for
processing of lithium and boric acid in Esmeralda County, Nevada.
|
| C. |
As of the date of this Agreement, ioneer indirectly owns one hundred percent (100%) of the Equity Interests of the ioneer HoldCo, and the ioneer HoldCo directly owns one hundred percent (100%) of the Direct Parent, and the Direct Parent
directly owns one hundred percent (100%) of the Equity Interests of the Borrower. [***].
|
| D. |
To finance the construction of the Project, on or about the date hereof, the Borrower and DOE entered into the Loan Arrangement and Reimbursement Agreement (the “Loan Agreement”) pursuant to which
DOE agreed to arrange for FFB to purchase a Note from the Borrower and to make Advances from time to time thereunder, in each case, upon the terms and subject to the conditions of the Loan Agreement and other Financing Documents.
|
| E. |
In consideration for DOE entering into the Loan Agreement: (a) such Sponsor Entity has agreed to comply with the obligations and covenants set forth herein; and (b) such Sponsor has agreed to: (i) make each Equity Contribution as and
when required pursuant to the terms hereof; and (ii) unconditionally and irrevocably guarantee certain obligations of the Borrower Entities related to completion of the Project.
|
| F. |
The undertaking of this Agreement by the Sponsor Entities will provide substantial benefit, directly or indirectly, to the Sponsor Entities and the other Borrower Entities, and it is necessary or convenient to the conduct, promotion, or
attainment of the business of the Sponsor Entities.
|
| G. |
It is a condition precedent to the execution of the Loan Agreement and making of each Advance from time to time that the Sponsor Entities and the Borrower shall have executed and delivered this Agreement and that it otherwise remains in
full force and effect.
|
|
EXECUTED BY IONEER LTD (ACN 098
|
||
|
564 606),
|
||
|
an Australian company,
|
||
|
as Sponsor
|
||
|
in accordance with s 127 of the Corporations
|
||
|
Act 2001 (Cth):
|
||
|
Signature of director
|
Signature of director/secretary
|
|
|
/s/ Bernard Rowe
|
/s/ Ian Bucknell
|
|
|
Name: Bernard Rowe
|
Name: Ian Bucknell
|
|
|
Title: Managing Director & CEO
|
Title: CFO & Company Secretary
|
|
IONEER RHYOLITE RIDGE HOLDINGS LLC,
|
||
|
a Delaware limited liability company,
|
||
|
as Intermediate Company
|
||
|
By:
|
/s/ Chad Yeftich
|
|
|
Name:
|
Chad Yeftich
|
|
|
Title:
|
Vice President Corporate Development & External Affairs
|
|
|
IONEER RHYOLITE RIDGE MIDCO LLC,
|
||
|
a Delaware limited liability company,
|
||
|
as Direct Parent
|
||
|
By:
|
/s/ Chad Yeftich
|
|
|
Name:
|
Chad Yeftich
|
|
|
Title:
|
Vice President Corporate Development & External Affairs
|
|
|
IONEER RHYOLITE RIDGE LLC,
|
||
|
a Delaware limited liability company,
|
||
|
as Borrower
|
||
|
By:
|
/s/ Chad Yeftich
|
|
|
Name:
|
Chad Yeftich
|
|
|
Title:
|
Vice President Corporate Development & External Affairs
|
|
|
U.S. DEPARTMENT OF ENERGY,
|
||
|
an agency of the federal government of the United States of America
|
||
|
By:
|
/s/ Herman Cortes
|
|
|
Name:
|
Herman Cortes
|
|
|
Title:
|
Director
|
|
|
CITIBANK, N.A.,
|
||
|
acting through its Agency and Trust business, not in its individual capacity but solely as Collateral Agent
|
||
|
By:
|
/s/ Marion Zinowski
|
|
|
Name:
|
Marion Zinowski
|
|
|
Title:
|
Senior Trust Officer
|
|
|
Holder of Equity Interests
|
Equity Interests Held In
|
Percentage of Equity Interests
Held
|
|
Publicly Listed on ASX (INR) and Nasdaq (IONR)
|
ioneer Ltd
|
83.98%
|
|
Centaurus Capital LP
|
ioneer Ltd
|
16.02%
|
|
ioneer Ltd
|
ioneer Canada ULC
|
100%
|
|
ioneer Canada ULC
|
Ioneer Holdings USA Inc.
|
100%
|
|
Ioneer Holdings USA Inc.
|
Ioneer Holdings Nevada Inc.
|
38.42%
|
|
ioneer Ltd
|
Ioneer Holdings Nevada Inc.
|
61.58%
|
|
Ioneer Holdings Nevada Inc.
|
Ioneer Minerals Corporation
|
100%
|
|
Ioneer Holdings Nevada Inc.
|
Ioneer USA Corporation
|
100%
|
|
Ioneer Minerals Corporation
|
Ioneer Rhyolite Ridge Holdings LLC
|
50%
|
|
Ioneer USA Corporation
|
Ioneer Rhyolite Ridge Holdings LLC
|
50%
|
|
Ioneer Rhyolite Ridge Holdings LLC
|
Ioneer Rhyolite Ridge MidCo LLC
|
100%
|
|
Ioneer Rhyolite Ridge MidCo LLC
|
Ioneer Rhyolite Ridge LLC
|
100%
|
| 1. |
I have reviewed this annual report on Form 20-F of ioneer Ltd;
|
| 2. |
Based on my knowledge, this report does not contain any untrue statement of a material fact or omit to state a material fact necessary to make the statements made, in light of the circumstances under which such
statements were made, not misleading with respect to the period covered by this report;
|
| 3. |
Based on my knowledge, the financial statements, and other financial information included in this report, fairly present in all material respects the financial condition, results of operations and cash flows of
the company as of, and for, the periods presented in this report;
|
| 4. |
The company’s other certifying officers and I are responsible for establishing and maintaining disclosure controls and procedures (as defined in Exchange Act Rules 13a-15(e) and 15d-15(e)) and internal control
over financial reporting (as defined in Exchange Act Rules 13a-15(f) and 15(d)-15(f)) for the company and have:
|
| (a) |
Designed such disclosure controls and procedures, or caused such disclosure controls and procedures to be designed under our supervision, to ensure that material information relating to the company, including its
consolidated subsidiaries, is made known to us by others within those entities, particularly during the period in which this report is being prepared;
|
| (b) |
Designed such internal control over financial reporting, or caused such internal control over financial reporting to be designed under our supervision, to provide reasonable assurance regarding the reliability of
financial reporting and the preparation of financial statements for external purposes in accordance with generally accepted accounting principles;
|
| (c) |
Evaluated the effectiveness of the company’s disclosure controls and procedures and presented in this report our conclusions about the effectiveness of the disclosure controls and procedures, as of the end of the
period covered by this report based on such evaluation;
|
| (d) |
Disclosed in this report any change in the company’s internal control over financial reporting that occurred during the period covered by the annual report that has materially affected, or is reasonably likely to
materially affect, the company’s internal control over financial reporting; and
|
| 5. |
The company’s other certifying officer(s) and I have disclosed, based on our most recent evaluation of internal control over financial reporting, to the company’s auditors and the audit committee of the company’s
board of directors (or persons performing the equivalent functions):
|
| (a) |
All significant deficiencies and material weaknesses in the design or operation of internal control over financial reporting which are reasonably likely to adversely affect the company’s ability to record,
process, summarize and report financial information; and
|
| (b) |
Any fraud, whether or not material, that involves management or other employees who have a significant role in the company’s internal control over financial reporting.
|
|
Date:
|
October 22, 2025
|
|
|
By:
|
/s/ Bernard Rowe
|
|
|
Name:
|
Bernard Rowe
|
|
|
Title:
|
Managing Director and Chief Executive Officer
|
|
|
(principal executive officer)
|
||
| 1. |
I have reviewed this annual report on Form 20-F of ioneer Ltd;
|
| 2. |
Based on my knowledge, this report does not contain any untrue statement of a material fact or omit to state a material fact necessary to make the statements made, in light of the circumstances under which such
statements were made, not misleading with respect to the period covered by this report;
|
| 3. |
Based on my knowledge, the financial statements, and other financial information included in this report, fairly present in all material respects the financial condition, results of operations and cash flows of
the company as of, and for, the periods presented in this report;
|
| 4. |
The company’s other certifying officers and I are responsible for establishing and maintaining disclosure controls and procedures (as defined in Exchange Act Rules 13a-15(e) and 15d-15(e)) and internal control
over financial reporting (as defined in Exchange Act Rules 13a-15(f) and 15(d)-15(f)) for the company and have:
|
| (a) |
Designed such disclosure controls and procedures, or caused such disclosure controls and procedures to be designed under our supervision, to ensure that material information relating to the company, including its
consolidated subsidiaries, is made known to us by others within those entities, particularly during the period in which this report is being prepared;
|
| (b) |
Designed such internal control over financial reporting, or caused such internal control over financial reporting to be designed under our supervision, to provide reasonable assurance regarding the reliability of
financial reporting and the preparation of financial statements for external purposes in accordance with generally accepted accounting principles;
|
| (c) |
Evaluated the effectiveness of the company’s disclosure controls and procedures and presented in this report our conclusions about the effectiveness of the disclosure controls and procedures, as of the end of the
period covered by this report based on such evaluation;
|
| (d) |
Disclosed in this report any change in the company’s internal control over financial reporting that occurred during the period covered by the annual report that has materially affected, or is reasonably likely to
materially affect, the company’s internal control over financial reporting; and
|
| 5. |
The company’s other certifying officer(s) and I have disclosed, based on our most recent evaluation of internal control over financial reporting, to the company’s auditors and the audit committee of the company’s
board of directors (or persons performing the equivalent functions):
|
| (a) |
All significant deficiencies and material weaknesses in the design or operation of internal control over financial reporting which are reasonably likely to adversely affect the company’s ability to record,
process, summarize and report financial information; and
|
| (b) |
Any fraud, whether or not material, that involves management or other employees who have a significant role in the company’s internal control over financial reporting.
|
|
Date:
|
October 22, 2025
|
|
|
By:
|
/s/ Ian Bucknell
|
|
|
Name:
|
Ian Bucknell
|
|
|
Title:
|
Chief Financial Officer and Company Secretary
|
|
|
(principal financial officer)
|
||
| 1. |
the Annual Report fully complies with the requirements of Section 13(a) or 15(d) of the Exchange Act, as amended; and
|
| 2. |
the information contained in the Annual Report fairly presents, in all material respects, the financial condition and results of operations of ioneer Ltd.
|
|
Date:
|
October 22, 2025
|
|
|
By:
|
/s/ Bernard Rowe
|
|
|
Name:
|
Bernard Rowe
|
|
|
Title:
|
Managing Director and Chief Executive Officer
|
|
|
(principal executive officer)
|
||
| 1. |
the Annual Report fully complies with the requirements of Section 13(a) or 15(d) of the Exchange Act, as amended; and
|
| 2. |
the information contained in the Annual Report fairly presents, in all material respects, the financial condition and results of operations of ioneer Ltd.
|
|
Date:
|
October 22, 2025
|
|
|
By:
|
/s/ Ian Bucknell
|
|
|
Name:
|
Ian Bucknell
|
|
|
Title:
|
Chief Financial Officer and Company Secretary
|
|
|
(principal financial officer)
|
||
|
/s/ Ernst & Young
|
|
|
Sydney, Australia
|
|
|
October 22, 2025
|
|
|
• |
the filing and use of the technical report summary titled “Technical Report Summary of the Rhyolite Ridge Lithium-Boron Project” (as amended or supplemented, the “Technical Report
Summary”), as an exhibit to the Form 20-F;
|
|
|
• |
the use of and references to IMC’s name, including IMC’s status as an expert or “qualified person” (as defined in Subpart 1300 of Regulation S-K promulgated by the Securities and Exchange
Commission), in connection with the Form 20-F and the Technical Report Summary;
|
|
|
• |
any extracts from, or summaries of, the Technical Report Summary in the Form 20-F and the use of information derived, summarized, quoted or referenced from the Technical Report Summary,
or portions thereof, that was prepared by IMC, that IMC supervised the preparation of and/or that was reviewed and approved by IMC, that is included or incorporated by reference in the Form 20-F; and
|
|
|
• |
the incorporation by reference in the Registration Statement on Form S-8 (File No. 333-266137) of the above items as included in the Form 20-F.
|
|
By: /s/Herbert Welhener
|
|
Name: Herbert Welhener
|
|
Title: Vice President
|

|
Rhyolite Ridge Lithium-Boron Project
|
S-K 1300 Technical Report Summary
|
|
1.
|
Executive Summary
|
1-1
|
|
|
1.1.
|
Introduction
|
1-1
|
|
|
1.2.
|
Property Description and Ownership
|
1-1
|
|
|
1.3.
|
Geology and Mineralization
|
1-1
|
|
|
1.4.
|
History
|
1-2
|
|
|
1.5.
|
Exploration
|
1-2
|
|
|
1.5.1.
|
Exploration
|
1-2
|
|
|
1.5.2.
|
Drilling
|
1-3
|
|
|
1.5.3.
|
Quarry - Geotechnical
|
1-3
|
|
|
1.5.4.
|
Infrastructure - Geotechnical
|
1-3
|
|
|
1.6.
|
Sampling
|
1-4
|
|
|
1.7.
|
Data Verification
|
1-4
|
|
|
1.8.
|
Metallurgical Testwork
|
1-5
|
|
|
1.9.
|
Mineral Resource Estimate
|
1-6
|
|
|
1.9.1.
|
Estimation Methodology
|
1-6
|
|
|
1.9.2.
|
Mineral Resource Statement
|
1-8
|
|
|
1.10.
|
Mineral Reserve Estimate
|
1-11
|
|
|
1.11.
|
Mining Methods
|
1-14
|
|
|
1.12.
|
Recovery Methods
|
1-14
|
|
|
1.13.
|
Infrastructure
|
1-15
|
|
|
1.14.
|
Market Studies
|
1-17
|
|
|
1.14.1.
|
Markets
|
1-17
|
|
|
1.14.2.
|
Commodity Price Forecasts
|
1-17
|
|
|
1.14.3.
|
Contracts
|
1-18
|
|
|
1.15.
|
Environmental, Permitting, and Social Considerations
|
1-18
|
|
|
1.15.1.
|
Environmental Considerations
|
1-18
|
|
|
1.15.2.
|
Closure and Reclamation
|
1-18
|
|
|
1.15.3.
|
Permitting Considerations
|
1-18
|
|
|
1.15.4.
|
Social Considerations
|
1-18
|
|
|
1.16.
|
Capital Costs
|
1-19
|
|
|
1.17.
|
Operating Costs
|
1-20
|
|
|
1.18.
|
Economic Analysis
|
1-20
|
|
|
1.18.1.
|
Cashflow Analysis
|
1-20
|
|
|
1.18.2.
|
Sensitivity Analysis
|
1-21
|
|
|
1.19.
|
Risks and Opportunities
|
1-21
|
|
|
1.19.1.
|
Risks
|
1-21
|
|
|
Rhyolite Ridge Lithium-Boron Project
|
S-K 1300 Technical Report Summary
|
|
1.19.2.
|
Opportunities
|
1-22
|
|
|
1.20.
|
Conclusions
|
1-22
|
|
|
1.21.
|
Recommendations
|
1-22
|
|
|
2.
|
Introduction
|
2-1
|
|
|
2.1.
|
Introduction
|
2-1
|
|
|
2.2.
|
Terms of Reference
|
2-1
|
|
|
2.3.
|
Qualified Persons
|
2-1
|
|
|
2.4.
|
Scope of Personal Inspection
|
2-2
|
|
|
2.5.
|
Information Sources
|
2-3
|
|
|
2.6.
|
Report Date
|
2-3
|
|
|
2.7.
|
Previously Filed Technical Report Summaries
|
2-3
|
|
|
2.8.
|
Definitions
|
2-3
|
|
|
3.
|
Property Description
|
3-1
|
|
|
3.1.
|
Property Location
|
3-1
|
|
|
3.2.
|
Property Ownership
|
3-2
|
|
|
3.3.
|
Mineral Rights
|
3-2
|
|
|
3.3.1.
|
Name and Number of Mineral Rights
|
3-2
|
|
|
3.3.2.
|
Description on Acquisition of Mineral Rights
|
3-9
|
|
|
3.3.3.
|
Surface Rights
|
3-9
|
|
|
3.3.4.
|
Water Rights
|
3-9
|
|
|
3.4.
|
Permits
|
3-9
|
|
|
3.5.
|
Significant Encumbrances to the Property
|
3-10
|
|
|
3.6.
|
Species of Conservation Interest
|
3-10
|
|
|
3.7.
|
Royalty Payments
|
3-12
|
|
|
3.8.
|
QP Statement
|
3-12
|
|
|
4.
|
Accessibility, Climate, Local Resources, Infrastructure, and Physiography
|
4-1
|
|
|
4.1.
|
Topography and Land Description
|
4-1
|
|
|
4.2.
|
Access to the Property
|
4-2
|
|
|
4.3.
|
Climate Description
|
4-4
|
|
|
4.4.
|
Availability of Required Infrastructure
|
4-4
|
|
|
4.4.1.
|
Transportation
|
4-4
|
|
|
4.4.2.
|
Labor and Accommodation
|
4-4
|
|
|
4.4.3.
|
Power
|
4-5
|
|
|
4.4.4.
|
Water
|
4-5
|
|
| 5. |
History
|
5-1
|
|
|
6.
|
Geological Setting, Mineralization, and Deposit
|
6-1
|
|
|
Rhyolite Ridge Lithium-Boron Project
|
S-K 1300 Technical Report Summary
|
|
6.1.
|
Deposit Type
|
6-1
|
|
|
6.2.
|
Regional Geology
|
6-1
|
|
|
6.3.
|
Local and Property Geology
|
6-1
|
|
|
6.4.
|
Mineralization
|
6-6
|
|
|
7.
|
Exploration
|
7-1
|
|
|
7.1.
|
Exploration
|
7-1
|
|
|
7.1.1.
|
2010 Outcrop/Subcrop Trenching
|
7-1
|
|
|
7.1.2.
|
2017 Surface Gravity Geophysical Survey
|
7-1
|
|
|
7.1.3.
|
2019 Surface Reflection Seismic Geophysical Survey
|
7-3
|
|
|
7.1.4.
|
2019 Magnetic Drone Survey
|
7-3
|
|
|
7.1.5.
|
2019 Surficial Geological Mapping
|
7-3
|
|
|
7.1.6.
|
2018 Topographic Survey
|
7-6
|
|
|
7.2.
|
Geological Exploration Drilling
|
7-6
|
|
|
7.2.1.
|
Exploration Drilling Methods and Results
|
7-6
|
|
|
7.2.2.
|
Recovery
|
7-9
|
|
|
7.2.3.
|
Drill Hole Logging
|
7-10
|
|
|
7.2.4.
|
Collar Surveys
|
7-11
|
|
|
7.2.5.
|
Downhole Surveys
|
7-11
|
|
|
7.2.6.
|
Drill Hole Data Spacing and Distribution
|
7-11
|
|
|
7.2.7.
|
Relationship Between Mineralization Widths and Intercept Lengths
|
7-11
|
|
|
7.2.8.
|
QP Statement on Exploration Drilling
|
7-12
|
|
|
7.3.
|
Hydrogeological Drilling and Sampling
|
7-12
|
|
|
7.3.1.
|
Sampling Methods and Laboratory Determinations
|
7-12
|
|
|
7.3.2.
|
Data Verification
|
7-13
|
|
|
7.3.3.
|
Baseline Hydrogeology
|
7-14
|
|
|
7.3.4.
|
Groundwater Monitoring and Chemistry
|
7-14
|
|
|
7.3.5.
|
QP Statement on Hydrogeology
|
7-18
|
|
|
7.4.
|
Quarry Stability- Geotechnical Drilling and Sampling
|
7-18
|
|
|
7.4.1.
|
Field Investigation
|
7-18
|
|
|
7.4.2.
|
Data Verification
|
7-21
|
|
|
7.4.3.
|
Laboratory Testing and Cell Mapping
|
7-22
|
|
|
7.4.4.
|
Statement on Geotechnical
|
7-27
|
|
|
7.5.
|
Infrastructure - Geotechnical Drilling and Sampling
|
7-27
|
|
|
7.5.1.
|
Sampling Methods and Laboratory Determinations
|
7-27
|
|
|
7.5.2.
|
Data Verification
|
7-32
|
|
|
7.5.3.
|
Testwork In Support of Spent Ore Storage and Process Facility Locations
|
7-32
|
|
|
7.5.4.
|
QP Statement on Geotechnical
|
7-32
|
|
|
8.
|
Sample Preparation, Analyses, and Security
|
8-1
|
|
|
8.1.
|
Field Sampling Techniques
|
8-1
|
|
|
8.1.1.
|
RC Drilling
|
8-1
|
|
|
8.1.2.
|
Core Drilling
|
8-1
|
|
|
Rhyolite Ridge Lithium-Boron Project
|
S-K 1300 Technical Report Summary
|
|
8.2.
|
Sample Results
|
8-2
|
|
|
8.3.
|
Sample Audits and Reviews
|
8-3
|
|
|
8.4.
|
Analytical and Test Laboratories
|
8-3
|
|
|
8.5.
|
Sample Security
|
8-3
|
|
|
8.6.
|
Sample Preparation
|
8-4
|
|
|
8.7.
|
Analytical Method
|
8-4
|
|
|
8.8.
|
Quality Control and Quality Assurance Programs
|
8-4
|
|
|
8.9.
|
Verification of Sampling and Assaying
|
8-5
|
|
|
8.10.
|
QP’s Opinion Regarding Sample Preparation, Security, and Analytical Procedures
|
8-5
|
|
|
9.
|
Data Verification
|
9-1
|
|
|
9.1.
|
Exploration Data Compilation
|
9-1
|
|
|
9.2.
|
Data Verification by Qualified Person
|
9-1
|
|
|
9.2.1.
|
Drill Hole Collar Checks
|
9-2
|
|
|
9.2.2.
|
Comparison of Geologic Logging to Block Model Geology
|
9-2
|
|
|
9.2.3.
|
Certificate Checks
|
9-2
|
|
|
9.2.4.
|
Check of Standards, Blanks and Duplicates
|
9-3
|
|
|
9.2.5.
|
Density Data
|
9-8
|
|
|
9.3.
|
Qualified Person’s Opinion on Data Adequacy
|
9-8
|
|
|
10.
|
Mineral Processing and Metallurgical Testing
|
10-1
|
|
|
10.1.
|
Mineral Processing and Metallurgical Testing (Pre-2024)
|
10-1
|
|
|
10.1.1.
|
Stream 1
|
10-1
|
|
|
10.1.2.
|
Stream 2 & 3
|
10-20
|
|
|
10.2.
|
Laboratories Used for Metallurgical Testing (Pre-2024)
|
10-22
|
|
|
10.3.
|
Additional Metallurgical Testwork (Post-2024)
|
10-24
|
|
|
10.3.1.
|
Leaching System Optimization
|
10-24
|
|
|
10.3.2.
|
Low Boron Flowsheet Simulation
|
10-25
|
|
|
10.4.
|
Representativeness of Metallurgical Testing
|
10-25
|
|
|
10.4.1.
|
Metallurgical Testwork Samples
|
10-26
|
|
|
10.4.2.
|
Aqueous Phase Samples
|
10-30
|
|
|
10.5.
|
Recovery Estimates
|
10-30
|
|
|
10.5.1.
|
Boron Recovery
|
10-31
|
|
|
10.5.2.
|
Lithium Recovery
|
10-31
|
|
|
10.5.3.
|
Key Factors Influencing Boron and Lithium Recovery in Leaching Processes
|
10-32
|
|
|
10.6.
|
QP’s Opinion
|
10-32
|
|
|
10.6.1.
|
Adequacy of Testwork Data and Analytical Methods
|
10-32
|
|
|
10.6.2.
|
Boric Acid Flotation Testwork Observation
|
10-33
|
|
|
10.6.3.
|
PLS Impurity Removal (IR1)
|
10-33
|
|
|
11.
|
Mineral Resource Estimates
|
11-1
|
|
|
11.1.
|
Geological Modeling Methodology and Assumptions
|
11-1
|
|
|
Rhyolite Ridge Lithium-Boron Project
|
S-K 1300 Technical Report Summary
|
|
11.2.
|
Geological Modeling Database
|
11-1
|
|
|
11.3.
|
Exploratory Data Analysis
|
11-3
|
|
|
11.3.1.
|
Statistical Analysis
|
11-3
|
|
|
11.3.2.
|
Geostatistical Analysis
|
11-6
|
|
|
11.4.
|
Geological Modeling
|
11-10
|
|
|
11.4.1.
|
Topographic Model
|
11-11
|
|
|
11.4.2.
|
Stratigraphic Model
|
11-12
|
|
|
11.4.3.
|
Fault Block Model
|
11-16
|
|
|
11.4.4.
|
Grade Model
|
11-18
|
|
|
11.5.
|
Moisture Basis
|
11-22
|
|
|
11.6.
|
Density
|
11-22
|
|
|
11.7.
|
Resource Classification
|
11-24
|
|
|
11.8.
|
Reblocked Model
|
11-27
|
|
|
11.9.
|
Establish Prospect of Economic Extraction
|
11-28
|
|
|
11.9.1.
|
Assumptions for Establishing Prospects of Economic Extraction
|
11-28
|
|
|
11.9.2.
|
Inputs
|
11-30
|
|
|
11.9.3.
|
Acid Consumption and Cost
|
11-30
|
|
|
11.9.4.
|
Calculation of Net Value
|
11-32
|
|
|
11.10.
|
Mineral Resource Statement
|
11-32
|
|
|
11.10.1.
|
Mining Factors or Assumptions
|
11-38
|
|
|
11.11.
|
Mineral Resource Uncertainty Discussion
|
11-39
|
|
|
11.12.
|
Factors That are Likely to Influence the Prospect of Economic Extraction
|
11-40
|
|
| 12. |
Mineral Reserve Estimates
|
12-1
|
|
|
12.1.
|
Key Assumptions, Parameters, and Methods
|
12-1
|
|
|
12.1.1.
|
Mine Design Criteria
|
12-1
|
|
|
12.1.2.
|
Modifying Factors
|
12-2
|
|
|
12.1.3.
|
Pit Targeting Methodology and Pit Selection
|
12-7
|
|
|
12.1.4.
|
Final Quarry Design
|
12-8
|
|
|
12.2.
|
Mineral Reserve Estimate
|
12-19
|
|
|
12.3.
|
QP’s Opinion on Factors That Could Materially Affect the Mineral Reserve Estimates
|
12-21
|
|
| 13. |
Mining Methods
|
13-1
|
|
|
13.1.
|
Parameters Relative to the Quarry Design and Plans
|
13-1
|
|
|
13.1.1.
|
Geotechnical
|
13-1
|
|
|
13.1.2.
|
Hydrogeological
|
13-1
|
|
|
13.1.3.
|
Surface Water Controls
|
13-2
|
|
|
13.1.4.
|
Seismic Activity
|
13-3
|
|
|
13.2.
|
Mine Design Factors
|
13-4
|
|
|
13.2.1.
|
Quarry Design Objective and Constraints
|
13-4
|
|
|
13.2.2.
|
Production Rates
|
13-4
|
|
|
13.2.3.
|
Expected Mine Life
|
13-8
|
|
|
Rhyolite Ridge Lithium-Boron Project
|
S-K 1300 Technical Report Summary
|
|
13.2.4.
|
Mining Dilution and Recovery Factors
|
13-10
|
|
|
13.3.
|
Stripping and Backfilling Requirements
|
13-10
|
|
|
13.4.
|
Mining Fleet, Machinery, and Personnel Requirements
|
13-13
|
|
|
13.4.1.
|
Quarry Production Tasks
|
13-13
|
|
|
13.4.2.
|
Quarry Production and Support Equipment
|
13-14
|
|
|
13.4.3.
|
Equipment Performance Factors and Fleet Requirements
|
13-15
|
|
|
13.4.4.
|
Labor Requirements
|
13-20
|
|
|
14.
|
Processing and Recovery Methods
|
14-1
|
|
|
14.1.
|
Process Description
|
14-1
|
|
|
14.1.1.
|
Ore Storage, Handling, and Sizing
|
14-4
|
|
|
14.1.2.
|
Vat Leaching
|
14-4
|
|
|
14.1.3.
|
Boric Acid Crystallization (CRZ1)
|
14-5
|
|
|
14.1.4.
|
Boric Acid Production (CRZ3)
|
14-5
|
|
|
14.1.5.
|
Impurity Removal (IR1)
|
14-6
|
|
|
14.1.6.
|
Evaporation (EVP1)
|
14-6
|
|
|
14.1.7.
|
Crystallization (CRZ2)
|
14-7
|
|
|
14.1.8.
|
Lithium Circuit
|
14-7
|
|
|
14.2.
|
Process Development
|
14-8
|
|
|
14.2.1.
|
Process Development
|
14-10
|
|
|
14.2.2.
|
Process Development Improvements
|
14-10
|
|
|
14.3.
|
Additional Required Plant Infrastructure
|
14-13
|
|
|
14.4.
|
Processing Plant Throughput and Design, and Equipment Layout, Characteristics, and Specifications
|
14-13
|
|
|
14.4.1.
|
Design Basis and Criteria
|
14-13
|
|
|
14.4.2.
|
Operating Schedule and Availability
|
14-14
|
|
|
14.4.3.
|
Processing Equipment Characteristics and Specifications
|
14-14
|
|
|
14.4.4.
|
Processing Equipment Layout
|
14-16
|
|
|
14.5.
|
Projected Requirements for Energy, Water, Process Materials, and Personnel
|
14-18
|
|
|
14.5.1.
|
Energy
|
14-18
|
|
|
14.5.2.
|
Water
|
14-18
|
|
|
14.5.3.
|
Other Utilities
|
14-20
|
|
|
14.5.4.
|
Reagents
|
14-21
|
|
|
14.5.5.
|
Personnel
|
14-24
|
|
|
15.
|
Infrastructure
|
15-1
|
|
|
15.1.
|
Roads and Logistics
|
15-5
|
|
|
15.1.1.
|
Site Access
|
15-5
|
|
|
15.1.2.
|
Roads and Logistics
|
15-5
|
|
|
15.2.
|
Onsite Power Plant
|
15-6
|
|
|
15.3.
|
Sulfuric Acid Plant
|
15-7
|
|
|
15.4.
|
Water Usage
|
15-9
|
|
|
15.5.
|
Accommodation
|
15-10
|
|
|
Rhyolite Ridge Lithium-Boron Project
|
S-K 1300 Technical Report Summary
|
|
15.6.
|
Spent Ore Storage Facility
|
15-10
|
|
|
16.
|
Market Studies
|
16-1
|
|
|
16.1.
|
Lithium
|
16-1
|
|
|
16.1.1.
|
Lithium Carbonate Price Basis for the Project
|
16-1
|
|
|
16.1.2.
|
Lithium Supply and Demand
|
16-2
|
|
|
16.1.3.
|
Lithium Customers and Competitor Analysis
|
16-6
|
|
|
16.1.4.
|
Lithium Price and Volume Forecasts
|
16-7
|
|
|
16.2.
|
Boric Acid
|
16-11
|
|
|
16.2.1.
|
Boric Acid Price Basis for the Project
|
16-11
|
|
|
16.2.2.
|
Boron Supply and Demand
|
16-11
|
|
|
16.2.3.
|
Boron Customer and Competitor Analysis
|
16-14
|
|
|
16.2.4.
|
Boron Price Forecast
|
16-17
|
|
|
16.3.
|
Contracts
|
16-19
|
|
|
17.
|
Environmental Studies, Permitting, and Plans, Negotiations, or Agreements with Local Individuals or Groups
|
17-1
|
|
|
17.1.
|
Environmental Studies
|
17-1
|
|
|
17.1.1.
|
Baseline Studies
|
17-1
|
|
|
17.1.2.
|
Environmental and Social Impact Assessment
|
17-4
|
|
|
17.1.3.
|
Air Quality Impact Assessment
|
17-8
|
|
|
17.1.4.
|
Biology
|
17-8
|
|
|
17.1.5.
|
Archaeological and Paleontological Studies
|
17-10
|
|
|
17.1.6.
|
Geochemistry
|
17-11
|
|
|
17.1.7.
|
Socioeconomic Study
|
17-12
|
|
|
17.1.8.
|
Surface Water Resources
|
17-13
|
|
|
17.1.9.
|
Groundwater Resources
|
17-14
|
|
|
17.2.
|
Requirements and Plans for Waste and Tailings Disposal, Site Monitoring, and Water Management During Operations and After Mine Closure
|
17-15
|
|
|
17.2.1.
|
Effluents
|
17-15
|
|
|
17.2.2.
|
Waste Management
|
17-15
|
|
|
17.2.3.
|
Air Quality
|
17-15
|
|
|
17.2.4.
|
Stormwater Controls
|
17-16
|
|
|
17.2.5.
|
Tailings Management and Monitoring
|
17-16
|
|
|
17.2.6.
|
Tailings and Process Water Containment, Management, and Treatment
|
17-16
|
|
|
17.3.
|
Permitting Requirements
|
17-17
|
|
|
17.3.1.
|
Environmental Protection Measures
|
17-19
|
|
|
17.4.
|
Plans, Negotiations, or Agreements with Local Individuals or Groups
|
17-26
|
|
|
17.5.
|
Descriptions of any Commitments to Ensure Local Procurement and Hiring
|
17-26
|
|
|
17.6.
|
Mine Closure Plans
|
17-26
|
|
|
17.6.1.
|
Closure Costs
|
17-28
|
|
|
17.6.2.
|
Closure Schedule
|
17-29
|
|
|
Rhyolite Ridge Lithium-Boron Project
|
S-K 1300 Technical Report Summary
|
|
17.7.
|
QP’s Opinion on the Adequacy of Current Plans to Address Any Issues Related to Environmental Compliance, Permitting, and Local Individuals or Groups
|
17-29
|
|
|
18.
|
Capital and Operating Costs
|
18-1
|
|
|
18.1.
|
Capital Cost Estimate
|
18-1
|
|
|
18.1.1.
|
Basis of Capital Cost Estimate
|
18-1
|
|
|
18.1.2.
|
Summary of Capital Costs
|
18-3
|
|
|
18.2.
|
Sustaining Capital Cost Estimate
|
18-4
|
|
|
18.2.1.
|
Sustaining Capital Costs and Basis
|
18-4
|
|
|
18.3.
|
Operating Cost Estimate
|
18-5
|
|
|
18.3.1.
|
Basis of Operating Cost Estimate
|
18-5
|
|
|
18.3.2.
|
Summary of Operating Costs
|
18-8
|
|
|
19.
|
Economic Analysis
|
19-1
|
|
|
19.1.
|
Demonstration of Economic Viability
|
19-1
|
|
|
19.2.
|
Principal Assumptions
|
19-1
|
|
|
19.3.
|
Cashflow Forecast
|
19-3
|
|
|
19.3.1.
|
Results of Economic Analysis
|
19-3
|
|
|
19.3.2.
|
Taxes, Royalties, Other Government Levies, or Interests
|
19-17
|
|
|
19.4.
|
Sensitivity Analysis
|
19-18
|
|
|
20.
|
Adjacent Properties
|
20-1
|
|
|
21.
|
Other Relevant Data and Information
|
21-1
|
|
|
22.
|
Interpretation and Conclusions
|
22-1
|
|
|
22.1.
|
Mineral Tenure, Surface Rights, Water Rights, Royalties and Agreements
|
22-1
|
|
|
22.2.
|
Geology and Mineralization
|
22-1
|
|
|
22.3.
|
Exploration, Drilling and Sampling
|
22-1
|
|
|
22.3.1.
|
Exploration and Geological Drilling
|
22-1
|
|
|
22.3.2.
|
Hydrogeological Drilling
|
22-2
|
|
|
22.3.3.
|
Geotechnical Drilling
|
22-2
|
|
|
22.4.
|
Data Verification
|
22-2
|
|
|
22.5.
|
Metallurgical Testwork
|
22-3
|
|
|
22.6.
|
Mineral Resources
|
22-3
|
|
|
22.7.
|
Mineral Reserves
|
22-4
|
|
|
22.8.
|
Mining Methods
|
22-5
|
|
|
22.9.
|
Recovery Methods
|
22-5
|
|
|
22.10.
|
Infrastructure
|
22-6
|
|
|
22.10.1.
|
General Infrastructure
|
22-6
|
|
|
22.10.2.
|
Spent Ore Storage Facility
|
22-6
|
|
|
22.11.
|
Market Studies
|
22-7
|
|
|
22.12.
|
Environmental, Permitting and Social Considerations
|
22-7
|
|
|
Rhyolite Ridge Lithium-Boron Project
|
S-K 1300 Technical Report Summary
|
|
22.13.
|
Capital Cost Estimates
|
22-8
|
|
|
22.14.
|
Operating Cost Estimates
|
22-8
|
|
|
22.15.
|
Economic Analysis
|
22-8
|
|
|
22.16.
|
Risks and Opportunities
|
22-9
|
|
|
22.16.1.
|
Risks
|
22-9
|
|
|
22.16.2.
|
Opportunities
|
22-11
|
|
|
23.
|
Recommendations
|
23-1
|
|
|
24.
|
References
|
24-1
|
|
|
25.
|
Reliance on Information Provided by the Registrant
|
25-1
|
|
|
25.1.
|
Introduction
|
25-1
|
|
|
25.2.
|
Macroeconomic Trend
|
25-1
|
|
|
25.3.
|
Markets
|
25-1
|
|
|
25.4.
|
Legal Matters
|
25-1
|
|
|
25.5.
|
Environmental Matters
|
25-1
|
|
|
25.6.
|
Stakeholder Accommodation
|
25-2
|
|
|
25.7.
|
Governmental Factors
|
25-2
|
|
|
Rhyolite Ridge Lithium-Boron Project
|
S-K 1300 Technical Report Summary
|
|
Table 1-1 - Mean and Range of the Net Values by Seam and Process Stream for 2-Day Vat Leach Cycle
|
1-8
|
|
Table 1-2 – Mineral Resource Estimate - South Basin Rhyolite Ridge (August 2025)
|
1-9
|
|
Table 1-3 – Mineral Reserves as of August 2025
|
1-12
|
|
Table 1-4 - Summary of Initial Capital Cost Estimate Updated in 2024
|
1-19
|
|
Table 1-5 - Summary of Total Operating Costs – Mine vs Process Plant
|
1-20
|
|
Table 1-6 - Economic Summary
|
1-20
|
|
Table 2-1 Report Contributions by Entity
|
2-2
|
|
Table 2-2 - Acronym and Abbreviation Definitions
|
2-4
|
|
Table 3-1 - SLB, SLM, and RR Lode Mining Claims
|
3-4
|
|
Table 3-2 – RMS Mill Site Claims
|
3-7
|
|
Table 5-1 - Summary of Exploration Campaigns
|
5-1
|
|
Table 6‑1 - Stratigraphic Column – South Basin
|
6-2
|
|
Table 7‑1 – Exploration Drilling Summary – Geological
|
7-7
|
|
Table 7‑2 – Summary of Mean Core Recovery and RQD by Drilling Program and Target Zone
|
7-10
|
|
Table 7-3 - Water Quality Analysis Parameters
|
7-13
|
|
Table 7‑4 – Summary of Hydrogeological Wells and Monitoring Sites
|
7-16
|
|
Table 7-5 - Laboratory Tests Conducted by Engineering Rock Type
|
7-24
|
|
Table 7‑6 – Summary of Geotechnical Exploration Locations
|
7-28
|
|
Table 7-7 - Geotechnical Program Results
|
7-31
|
|
Table 8-1 - Sampling Summary by Drilling Program and Drill Type
|
8-2
|
|
Table 8-2 - Summary of QA/QC Samples by Drilling Program and Type
|
8-5
|
|
Table 9-1 - Certified Values and Assay Results for the Standards
|
9-3
|
|
Table 9-2 - Assay Results for Blanks by Seam
|
9-5
|
|
Table 9-3 - Original and Field Duplicate Assays by Seam
|
9-7
|
|
Table 10‑1 - Rhyolite Ridge Feasibility Study Testwork Summary
|
10-3
|
|
Table 10-2 - Post Feasibility Study Testwork Summary (Pre-2024)
|
10-17
|
|
Table 10-3 - Stream 2 & 3 Testwork Summary (Pre-2024)
|
10-21
|
|
Table 10-4 - Testing and Analytical Procedures for Stream 2 & 3 Testwork (Pre-2024)
|
10-22
|
|
Table 10-5 – Scope of Pre-2024 Testwork by Laboratory or Testing Facility
|
10-23
|
|
Table 10-6 – Scope of Post-2024 Testwork by Laboratory or Testing Facility
|
10-24
|
|
Table 10‑7 – Key Compositional Ratios in Advancing PLS
|
10-30
|
|
Table 11-1 - Summary of Drill Hole Database Intervals by Seam
|
11-2
|
|
Table 11-2 - Lengths of Assay Intervals
|
11-7
|
|
Table 11-3 - Comparison of Assay Database and Composite Database
|
11-7
|
|
Table 11-4 - Summary of Geological Units in 1.52 m Block Height Model
|
11-12
|
|
Table 11-5 - Comparison of Block Model Grades and Drill Hole Grades
|
11-20
|
|
Table 11-6 - Comparison of Block Model Grades and Drill Hole Grades for Seam B5
|
11-21
|
|
Table 11-7 - Summary of Density Data by Unit
|
11-23
|
|
Table 11-8 - Example of Reblocked 9.14 m (30 ft) Bench from Six 1.52 m (5 ft) Benches
|
11-28
|
|
Table 12-1 - Summary of Cut-off Grade Assumptions for Pit Optimizations
|
12-4
|
|
Table 12-2 - Summary of Process Recovery Seams
|
12-5
|
|
Table 12-3- Summary of Process Stream Estimates within Engineered Pit Design
|
12-6
|
|
Table 12-4 - Summary of Pit Optimization Results
|
12-8
|
|
Table 12-5 - Pit Design Tonnages, Grades, Contained and Recovered Metals
|
12-17
|
|
Table 12-6 - Mineral Reserves as of August 2025
|
12-20
|
|
Table 13-1 - Summary of Annual Material Movement
|
13-5
|
|
Rhyolite Ridge Lithium-Boron Project
|
S-K 1300 Technical Report Summary
|
|
Table 13-2 - Overburden Storage Facility Storage Capacities
|
13-11
|
|
Table 13-3 - Overburden Placement by Storage Facility Storage Facility (ktonne)
|
13-12
|
|
Table 13-4 – Description of Mining Equipment Types
|
13-14
|
|
Table 13-5 - Mechanical Availability and Utilization of Mining Equipment
|
13-16
|
|
Table 13-6 - Scheduled Operating Days and Shifts per Year
|
13-17
|
|
Table 13-7 - Manned Equipment Operating Time per Shift
|
13-17
|
|
Table 13-8 - Quarry Equipment Quantity by Period
|
13-18
|
|
Table 13-9 - Quarry Equipment Quantity by Period cont.
|
13-19
|
|
Table 13-10 - AHS Operating Time per ShiftT
|
13-20
|
|
Table 14‑1 – Vat Leaching Cycle
|
14-4
|
|
Table 14-2 - Summary of Process Design Criteria
|
14-14
|
|
Table 14‑3 - Specifications and Characteristics of Major Processing Equipment
|
14-15
|
|
Table 14‑4 - Reagent Consumption Data
|
14-21
|
|
Table 15-1 – Spent Ore Storage Facility Operational Parameters
|
15-12
|
|
Table 15-2 – Properties of Composite Materials
|
15-12
|
|
Table 15-3 - Properties Used in Stability Analysis
|
15-13
|
|
Table 15-4 - Summary of Seismic Criteria
|
15-13
|
|
Table 16-1 - ioneer Technical-Grade Lithium Carbonate and Battery Grade Lithium Hydroxide Specification
|
16-3
|
|
Table 16-2 - Summary of Price Forecasts (US$/t) / Real Terms
|
16-10
|
|
Table 16-3 - Major Borate Products
|
16-12
|
|
Table 16-4 - Targeted Boric Acid Specifications
|
16-12
|
|
Table 16-5 - Boric Acid Technical Specification by Major Supplier
|
16-12
|
|
Table 16-6 - Boric Acid Supply-Demand Balance
|
16-16
|
|
Table 16-7 – ioneer Boric Acid Price Assumptions
|
16-18
|
|
Table 16-8 – Contracts for Technical-Grade Lithium Carbonate and Boric Acid
|
16-20
|
|
Table 17‑1 - Summary of Baseline Studies
|
17-2
|
|
Table 17-2 - Rhyolite Ridge Project Phase 1 Permits Register
|
17-17
|
|
Table 17-3 - Closure Activities by Project Component
|
17-27
|
|
Table 18-1 - Engineering and Estimate Responsibilities Matrix for the Capital Costs Estimate
|
18-1
|
|
Table 18-2 – Summary of Initial Capital Cost Estimate Updated in 2024
|
18-3
|
|
Table 18-3 – Summary of Total Sustaining Capital Costs
|
18-4
|
|
Table 18-4 - Summary of Total Operating Costs – Mine vs Process Plant
|
18-8
|
|
Table 18-5 - Summary of Operating Costs over Life-of-Mine by Categories
|
18-8
|
|
Table 19-1 - Key Financial Modeling Assumptions
|
19-2
|
|
Table 19-2 - Total Project Cash Flow – Details
|
19-4
|
|
Table 19-3 - Project Economic Summary 1,2
|
19-5
|
|
Table 19-4 - Economic Analysis Results – Annual
|
19-6
|
|
Rhyolite Ridge Lithium-Boron Project
|
S-K 1300 Technical Report Summary
|
|
Figure 3-1 - Project Location Map
|
3-1
|
|
Figure 3-2 - Tenement Map
|
3-3
|
|
Figure 3-3 – Additional Mill Site Claims (RMS 1 – 347)
|
3-6
|
|
Figure 3-4 - Tiehm’s Buckwheat Populations and Critical Habitat Area in relation to the Proposed Mine Facilities
|
3-11
|
|
Figure 4-1 - Site Location
|
4-1
|
|
Figure 4-2 - Site Location and Highways for Site Access
|
4-3
|
|
Figure 6-1 - Geological Cross Section
|
6-3
|
|
Figure 6‑2 - Local Geological Map
|
6-4
|
|
Figure 7-1 - Gravity Station Locations
|
7-2
|
|
Figure 7-2 – Summary of ioneer Surficial Geology Mapping in the South Basin
|
7-5
|
|
Figure 7-3 – Exploration Drill Hole Locations – Geological
|
7-8
|
|
Figure 7-4 – Eastern Project Area Groundwater Monitoring Locations
|
7-15
|
|
Figure 7-5 - Phase 1-5 and LOM Quarries with Geotechnical Boreholes
|
7-20
|
|
Figure 7-6 - Phase 1-5 and LOM Quarries with All Boreholes
|
7-21
|
|
Figure 7-7 - Cell Mapping Locations
|
7-23
|
|
Figure 7-8 – Stereonet: Combined Cell Mapping Data
|
7-26
|
|
Figure 7-9 - Stereonet: Combined Televiewer Data
|
7-26
|
|
Figure 7-10 - Stereonet: Combined Televiewer Data, Dip >= 30 degrees
|
7-27
|
|
Figure 7-11 – Geotechnical Boring and Test Pit Locations for Plant Site and Spent Ore Storage Facility
|
7-29
|
|
Figure 7-12 – Geotechnical Boring for Overburden Storage Facility
|
7-30
|
|
Figure 8‑1- Example Diagram of Sampling Protocol
|
8-2
|
|
Figure 9-1 - Assayed Boron Standards Versus Certified Values
|
9-4
|
|
Figure 9-2 - Assayed Lithium Standards Versus Certified Values
|
9-4
|
|
Figure 9-3 - Assay Boron Blanks
|
9-5
|
|
Figure 9-4 - Assay Lithium Blanks
|
9-6
|
|
Figure 9-5 - Boron Field Duplicate Results
|
9-7
|
|
Figure 9-6 - Lithium Field Duplicate Results
|
9-8
|
|
Figure 10‑1 – Lithium, Boron and Gangue Metals Grade Ranges based on Testwork and Mine Plan
|
10-27
|
|
Figure 10‑2 – 2025 Mine Plan Lithium and Boron Grades
|
10-28
|
|
Figure 10-3 – Locations of Samples Used for Metallurgical Testwork
|
10-29
|
|
Figure 11-1 – Cumulative Frequency Plot for Boron
|
11-5
|
|
Figure 11-2 - Cumulative Frequency Plot for Lithium
|
11-6
|
|
Figure 11-3 - Example Variogram for B5 and L6 – Boron (left) and Lithium (right)
|
11-9
|
|
Figure 11-4 - Model Extents
|
11-11
|
|
Figure 11-5 - East - West Cross Sections
|
11-14
|
|
Figure 11-6 - North - South Cross Sections
|
11-15
|
|
Figure 11-7 - Fault Blocks at 5,600 ft (1,706 m) Elevation
|
11-17
|
|
Figure 11-8 – B5 Estimation Domains
|
11-19
|
|
Figure 11-9 - Resource Classification for B5 Seam
|
11-26
|
|
Figure 12-1 - Phase 1 Quarry Design
|
12-9
|
|
Figure 12-2 - Phase 2 Quarry Design
|
12-10
|
|
Figure 12-3 - Phase 3 Quarry Design
|
12-11
|
|
Figure 12-4 - Phase 4 Quarry Design
|
12-12
|
|
Figure 12-5 - Phase 5 Quarry Design
|
12-13
|
|
Figure 12-6 - Phase 6 Quarry Design
|
12-14
|
|
Figure 12-7 - Phase 7 Quarry Design
|
12-15
|
|
Rhyolite Ridge Lithium-Boron Project
|
S-K 1300 Technical Report Summary
|
|
Figure 12-8 - Phase 8 Quarry Design
|
12-16
|
|
Figure 12-9 – End of Mine Life Quarry and Overburden Storage Facility
|
12-18
|
|
Figure 13-1 - Summary of Annual Material Movement
|
13-7
|
|
Figure 13-2 - Summary of Annual Plant Feed from the Proven and Probable Reserve Classifications
|
13-8
|
|
Figure 13–3 - Project Site Layout
|
13-9
|
|
Figure 13–4 - Summary of Annual Quarry Labor Requirements
|
13-21
|
|
Figure 14‑1 – Block Flow Diagram of the Rhyolite Ridge Processing Facilities – Production of technical grade boric acid and technical grade lithium carbonate
|
14-3
|
|
Figure 14‑2 – Block Flow Diagram of the Rhyolite Ridge Processing Facilities – production of battery grade lithium hydroxide monohydrate
|
14-3
|
|
Figure 14‑3 - Rhyolite Ridge Process Flowsheet Sequence – Lithium Carbonate and Boric Acid plants (Design Case)
|
14-9
|
|
Figure 14‑4 - Rhyolite Ridge Process Flowsheet Sequence – Lithium Hydroxide Monohydrate Conversion Plant (Design Case)
|
14-10
|
|
Figure 14‑5 - Rhyolite Ridge Process Plant Layout
|
14-17
|
|
Figure 14‑6 - Rhyolite Ridge Acid Consumption Model Verification
|
14-24
|
|
Figure 15-1 - Overall proposed site plan
|
15-2
|
|
Figure 15-2 – Process Plant Area Schematic
|
15-3
|
|
Figure 15-3 – Mill Site Claims Boundary Map
|
15-4
|
|
Figure 15-4 Schematic View of Sulfuric Acid Plant
|
15-8
|
|
Figure 15-5 – Proposed Water Supply Pipeline from White Mountain Ranch to the Processing Facility
|
15-9
|
|
Figure 15-6 – Spent Ore Storage Facility Phases and Main Components
|
15-11
|
|
Figure 16-1 - Historic Spot Average Price of Lithium Carbonate and Lithium Hydroxide, CIF/Asia (US$/t)
|
16-1
|
|
Figure 16-2 - Lithium Chemical Supply by Final Product (Counted as LCE), kt
|
16-3
|
|
Figure 16-3 - Lithium Demand (LCE), Mt
|
16-5
|
|
Figure 16-4 - Lithium Chemical Balance, %
|
16-6
|
|
Figure 16-5 - Lithium Market Balance, kt LCE
|
16-8
|
|
Figure 16-6 - Lithium Carbonate Price Forecast, US$/st, CIF Asia (Real, Spot)
|
16-9
|
|
Figure 16-7 - Lithium Hydroxide Price Forecast, US$/st, CIF Asia
|
16-9
|
|
Figure 16-8 - Global Boric Acid Demand by Region
|
16-13
|
|
Figure 16-9 - Global Boric Acid Market Share by Suppliers
|
16-14
|
|
Figure 16-10 - Borate Application by Market Share
|
16-14
|
|
Figure 16-11 - Boric Acid Supply-Demand Balance
|
16-17
|
|
Figure 16-12 – Boric Acid Price – Historical and Forecast
|
16-19
|
|
Figure 17-1 - Rhyolite Ridge Project Area Map
|
17-3
|
|
Figure 19-1 – Annual Boric Acid and Lithium Carbonate Production Over Life of Mine
|
19-15
|
|
Figure 19-2 – Unlevered Post-tax Annual Cash Flow and Cumulative Cash Flow
|
19-16
|
|
Figure 19-3 - Project Post-tax NPV Sensitivity to Various Factors (millions of US$)
|
19-18
|
|
Figure 19-4 - Project Post-tax NPV Sensitivity to Discount Rate
|
19-19
|
|
Rhyolite Ridge Lithium-Boron Project
|
S-K 1300 Technical Report Summary
|
|
1.
|
EXECUTIVE SUMMARY
|
|
1.1.
|
Introduction
|
|
1.2.
|
Property Description and Ownership
|
|
1.3.
|
Geology and Mineralization
|
|
Rhyolite Ridge Lithium-Boron Project
|
S-K 1300 Technical Report Summary
|
|
1.4.
|
History
|
|
1.5.
|
Exploration
|
|
1.5.1.
|
Exploration
|
|
Rhyolite Ridge Lithium-Boron Project
|
S-K 1300 Technical Report Summary
|
|
1.5.2.
|
Drilling
|
|
1.5.3.
|
Quarry - Geotechnical
|
|
1.5.4.
|
Infrastructure - Geotechnical
|
|
Rhyolite Ridge Lithium-Boron Project
|
S-K 1300 Technical Report Summary
|
|
1.6.
|
Sampling
|
| ◾ |
Sample preparation (PREP-31y): crusher/rotary splitter combination; crush to 70% less than 2 mm, rotary split off 250 g, pulverize split to better than 85% passing 75 µm;
|
|
|
◾ |
Multi-element analysis (ME-MS41): evaluation by aqua regia with inductively coupled plasma mass spectrometry (ICP-MS) finish for 51 elements, including lithium and boron;
|
|
|
◾ |
Boron (B-ICP82a): high-grade boron samples (>10,000 ppm boron), were further analyzed by NaOH fusion/ICP high-grade analysis;
|
|
|
◾ |
Inorganic carbon (C-GAS05): 95% of the 2018-2019 samples were analyzed for inorganic carbon by HClO4 digestion and CO2 coulometer;
|
|
|
◾ |
Fluorine (F-ELE81a): 30% of the 2018-2019 and selected samples since 2022 were analyzed for fluorine by KOH fusion and ion selective electrode.
|
|
1.7.
|
Data Verification
|
|
Rhyolite Ridge Lithium-Boron Project
|
S-K 1300 Technical Report Summary
|
|
1.8.
|
Metallurgical Testwork
|
|
|
◾ |
HiB-Li (stream 1): occurs primarily within the B5 mineralized unit with additional occurrences in the M5, S5 and L6 units;
|
|
|
◾ |
LoB-Li (stream 2 & 3): occurs primarily within the L6 mineralized unit with additional occurrences in the B5, M5 and S5 units.
|
|
|
◾ |
Air classification and beneficiation;
|
|
|
◾ |
Bench-scale flowsheet simulation, evaporation and crystallization optimization, flotation optimization, impurity removal, and lithium circuit optimization;
|
|
|
◾ |
Sizer crushing tests;
|
|
|
◾ |
Mineralogy and geochemical characterization;
|
|
|
◾ |
Impurity removal filtration, bottle roll, bench and pilot-scale leaching (column, vat, agitated, pressure, roast water);
|
|
|
◾ |
Semi-integrated pilot plant;
|
|
|
◾ |
Pilot-scale evaporation and crystallization optimization and crystal/liquor centrifuge separation;
|
|
|
◾ |
Neutralization kinetic testwork;
|
|
|
◾ |
Leach and impurity removal area corrosion studies.
|
|
Rhyolite Ridge Lithium-Boron Project
|
S-K 1300 Technical Report Summary
|
|
1.9.
|
Mineral Resource Estimate
|
|
1.9.1.
|
Estimation Methodology
|
|
|
◾ |
Measured:
|
|
|
◾ |
G5, M5, B5, L6 and Lsi: 121.9 m (400 ft) spacing between points of observation, with sample interpolation from a minimum of four drill holes;
|
|
|
◾ |
S5 and G6: 106.7 m (350 ft) spacing between points of observation, with sample interpolation from a minimum of four drill holes.
|
|
|
◾ |
Indicated:
|
|
|
◾ |
M5 and B5: 243.8 meters (800-foot) spacing between points of observation, with sample interpolation from a minimum of two drill holes;
|
|
|
◾ |
G5, L6 and Lsi: 213.4 m (700 ft) spacing between points of observation, with sample interpolation from a minimum of two drill holes.
|
|
|
◾ |
S5 and G6: 167.6 m (550 ft) spacing between points of observation, with sample interpolation from a minimum of two drill holes.
|
|
Rhyolite Ridge Lithium-Boron Project
|
S-K 1300 Technical Report Summary
|
|
|
◾ |
Inferred: the full estimation distance (M5 and B5 – 533 m or 1,750 ft, S5 and G6 - 750 ft, G5, L6 and Lsi 305 m or 1,000 ft) between points of observation, with sample
interpolation from a minimum of one drill hole (two composites).
|
|
|
◾ |
The geological continuity of the mineralized zones and grade parameters demonstrated via the current geological and grade model for the South Basin of Rhyolite Ridge;
|
|
|
◾ |
The potential for selective extraction of the HiB-Li (Stream 1) mineralized intervals encountered in the B5, M5, S5, and L6 units using current conventional open pit mining
methods;
|
|
|
◾ |
The potential for selective extraction of the LoB-Li (Stream 2) mineralized intervals encountered in the B5, S5, and L6 units using current conventional open pit mining methods;
|
|
|
◾ |
The potential for selective extraction of the LoB-Li high clay (Stream 3) mineralized intervals encountered in the M5 using current conventional open pit mining methods. The
potential to produce boric acid and lithium carbonate products using current processing and recovery methods;
|
|
|
◾ |
The assumption that boric acid and lithium carbonate produced by the Project will be marketable and economic considering transportation costs and processing charges and that there
will be continued demand for boric acid and lithium carbonate;
|
|
|
◾ |
The assumption that the location of the Project in the southwest of the continental United States would be viewed favorably when marketing boric acid and lithium carbonate products
to potential domestic end users;
|
|
|
◾ |
The assumption that the production costs are reasonable estimates.
|
|
|
◾ |
Boric acid: US$1,172.78 per metric ton or US$1,063.94 per short ton;
|
|
|
◾ |
Lithium carbonate: US$19,351.38 per metric ton or US$17,555.46 per short ton.
|
|
|
◾ |
Gross value of a block minus the process costs for blocks above the cutoff grades;
|
|
|
◾ |
Gross value = sum of the recovered values of boric acid plus lithium carbonate;
|
|
|
◾ |
Process costs = sum of the cost of acid plus the process fixed costs (by seam and stream).
|
|
Rhyolite Ridge Lithium-Boron Project
|
S-K 1300 Technical Report Summary
|
|
Seam
|
Stream 1
|
Stream 2 or 3
|
||||||
|
# blocks
|
Net Value, US$ per short ton
|
# blocks
|
Net Value, US$ per short ton
|
|||||
|
Mean
|
Minimum
|
Maximum
|
Mean
|
Minimum
|
Maximum
|
|||
|
M5
|
10,703
|
167.85
|
44.64
|
224.26
|
71,785
|
95.12
|
11.16
|
179.98
|
|
B5
|
93,523
|
169.81
|
33.34
|
282.78
|
14,278
|
128.12
|
11.28
|
225.57
|
|
S5
|
10,392
|
100.81
|
25.69
|
272.07
|
77,797
|
50.67
|
11.13
|
245.87
|
|
L6
|
68,610
|
101.76
|
11.44
|
261.06
|
205.851
|
54.76
|
11.13
|
182.56
|
|
1.9.2.
|
Mineral Resource Statement
|
|
|
◾ |
Drill Hole Database: added 54 holes (5 RC, 49 core), total additional meters – 9,183 m (30,129 ft) and 1,547 additional assay samples
|
|
|
◾ |
Density: Use of 2010 density dataset was not used in the August 2025 resource as the values could not be validated leading to a lower density value and overall tonnage than
calculated in October 2023 resource
|
|
|
◾ |
Resource Block Model: new geologic framework and grade estimation: tabulation changed from a 1.52m (5 ft) model to 9.14 m (30 ft) reblock model from a 1.52 m (5 ft) model
|
|
|
◾ |
Recovery: changed from one recovery (Boron at 83.5%, Lithium at 81.1%) to recovery by seam and process stream
|
|
|
◾ |
Process Costs: changed from one total process cost to combination of fixed cost (by seam and stream) plus a cost of acid based on the acid consumption calculated for each block in
the resource model
|
|
|
◾ |
Resource Tabulation: changed from tabulating seams above 5,000 ppm Boron or above 1090 ppm Lithium to tabulating M5, B5, S5, L6 for process streams 1, 2, 3
|
|
Rhyolite Ridge Lithium-Boron Project
|
S-K 1300 Technical Report Summary
|
|
Stream
|
Group
|
Classification
|
Tonnage
kt
|
Li
ppm
|
B
ppm
|
Li2CO3
wt. %
|
H3BO3
wt. %
|
Contained
Li2CO3
kt
|
Contained
H3BO3
kt
|
|||
|
Stream 1 (>= 5,000 ppm B)
|
Upper
Zone
B5 Unit
|
Measured
|
10,414
|
1,921
|
15,063
|
1.02
|
8.61
|
106
|
897
|
|||
|
Indicated
|
7,214
|
1,749
|
13,240
|
0.93
|
7.57
|
67
|
546
|
|||||
|
Total (M&I)
|
17,628
|
1,850
|
14,317
|
0.98
|
8.19
|
174
|
1,443
|
|||||
|
Inferred
|
10,628
|
1,712
|
10,563
|
0.91
|
6.04
|
97
|
642
|
|||||
|
Total (MII)
|
28,255
|
1,798
|
12,905
|
0.96
|
7.38
|
270
|
2,085
|
|||||
|
Upper
Zone
M5 Unit
|
Measured
|
1,073
|
2,186
|
7,397
|
1.16
|
4.23
|
12
|
45
|
||||
|
Indicated
|
814
|
2,100
|
7,535
|
1.12
|
4.31
|
9
|
35
|
|||||
|
Total (M&I)
|
1,887
|
2,149
|
7,456
|
1.14
|
4.26
|
22
|
80
|
|||||
|
Inferred
|
763
|
2,197
|
6,515
|
1.17
|
3.73
|
9
|
28
|
|||||
|
Total (MII)
|
2,650
|
2,163
|
7,185
|
1.15
|
4.11
|
31
|
109
|
|||||
|
Upper
Zone
S5 Unit
|
Measured
|
1,456
|
1,561
|
7,467
|
0.83
|
4.27
|
12
|
62
|
||||
|
Indicated
|
1,393
|
1,571
|
7,132
|
0.84
|
4.08
|
12
|
57
|
|||||
|
Total (M&I)
|
2,849
|
1,566
|
7,303
|
0.83
|
4.18
|
24
|
119
|
|||||
|
Inferred
|
1,572
|
1,400
|
6,469
|
0.75
|
3.70
|
12
|
58
|
|||||
|
Total (MII)
|
4,421
|
1,507
|
7,006
|
0.80
|
4.01
|
35
|
177
|
|||||
|
Upper
Zone
Total
|
Measured
|
12,943
|
1,902
|
13,573
|
1.01
|
7.76
|
131
|
1,004
|
||||
|
Indicated
|
9,420
|
1,753
|
11,844
|
0.93
|
6.77
|
88
|
638
|
|||||
|
Total (M&I)
|
22,363
|
1,839
|
12,845
|
0.98
|
7.34
|
219
|
1,642
|
|||||
|
Inferred
|
12,963
|
1,703
|
9,828
|
0.91
|
5.62
|
117
|
728
|
|||||
|
Total (MII)
|
35,326
|
1,789
|
11,738
|
0.95
|
6.71
|
336
|
2,371
|
|||||
|
Lower
Zone
L6 Unit
|
Measured
|
12,014
|
1,355
|
9,838
|
0.72
|
5.63
|
87
|
676
|
||||
|
Indicated
|
26,139
|
1,319
|
10,365
|
0.70
|
5.93
|
183
|
1,549
|
|||||
|
Total (M&I)
|
38,153
|
1,330
|
10,199
|
0.71
|
5.83
|
270
|
2,225
|
|||||
|
Inferred
|
13,914
|
1,415
|
12,287
|
0.75
|
7.03
|
105
|
978
|
|||||
|
Total (MII)
|
52,067
|
1,353
|
10,757
|
0.72
|
6.15
|
375
|
3,203
|
|||||
|
Total
Stream
1 (all
zones)
|
Measured
|
24,957
|
1,639
|
11,775
|
0.87
|
6.73
|
218
|
1,680
|
||||
|
Indicated
|
35,559
|
1,434
|
10,757
|
0.76
|
6.15
|
271
|
2,187
|
|||||
|
Total (M&I)
|
60,516
|
1,518
|
11,177
|
0.81
|
6.39
|
489
|
3,867
|
|||||
|
Inferred
|
26,877
|
1,554
|
11,101
|
0.83
|
6.35
|
222
|
1,706
|
|||||
|
Total (MII)
|
87,393
|
1,529
|
11,153
|
0.81
|
6.38
|
711
|
5,573
|
|
Rhyolite Ridge Lithium-Boron Project
|
S-K 1300 Technical Report Summary
|
|
Stream
|
Group
|
Classification
|
Tonnage
kt
|
Li
ppm
|
B
ppm
|
Li2CO3
wt. %
|
H3BO3
wt. %
|
Contained
Li2CO3
kt
|
Contained
H3BO3
kt
|
|||
|
Stream 2 (>= 11.13/tonne net value, < 5,000 ppm B. Low Clay)
|
Upper
Zone
B5 Unit
|
Measured
|
438
|
2,321
|
2,925
|
1.24
|
1.67
|
5
|
7
|
|||
|
Indicated
|
362
|
2,092
|
3,674
|
1.11
|
2.10
|
4
|
8
|
|||||
|
Total (M&I)
|
800
|
2,217
|
3,264
|
1.18
|
1.87
|
9
|
15
|
|||||
|
Inferred
|
3,690
|
1,695
|
1,776
|
0.90
|
1.02
|
33
|
37
|
|||||
|
Total (MII)
|
4,491
|
1,788
|
2,041
|
0.95
|
1.17
|
43
|
52
|
|||||
|
Upper
Zone
S5 Unit
|
Measured
|
9,400
|
996
|
1,226
|
0.53
|
0.70
|
50
|
66
|
||||
|
Indicated
|
7,981
|
1,012
|
1,524
|
0.54
|
0.87
|
43
|
70
|
|||||
|
Total (M&I)
|
17,382
|
1,003
|
1,363
|
0.53
|
0.78
|
93
|
135
|
|||||
|
Inferred
|
15,491
|
889
|
1,014
|
0.47
|
0.58
|
73
|
90
|
|||||
|
Total (MII)
|
32,873
|
949
|
1,198
|
0.51
|
0.69
|
166
|
225
|
|||||
|
Upper
Zone
Total
|
Measured
|
9,839
|
1,055
|
1,302
|
0.56
|
0.74
|
55
|
73
|
||||
|
Indicated
|
8,343
|
1,059
|
1,617
|
0.56
|
0.92
|
47
|
77
|
|||||
|
Total (M&I)
|
18,182
|
1,057
|
1,447
|
0.56
|
0.83
|
102
|
150
|
|||||
|
Inferred
|
19,187
|
1,044
|
1,160
|
0.56
|
0.66
|
107
|
127
|
|||||
|
Total (MII)
|
37,369
|
1,050
|
1,300
|
0.56
|
0.74
|
209
|
278
|
|||||
|
Lower
Zone
L6 Unit
|
Measured
|
19,043
|
1,155
|
1,979
|
0.61
|
1.13
|
117
|
215
|
||||
|
Indicated
|
51,191
|
1,158
|
1,624
|
0.62
|
0.93
|
316
|
475
|
|||||
|
Total (M&I)
|
70,234
|
1,157
|
1,720
|
0.62
|
0.98
|
433
|
691
|
|||||
|
Inferred
|
47,474
|
1,244
|
790
|
0.66
|
0.45
|
314
|
214
|
|||||
|
Total (MII)
|
117,708
|
1,192
|
1,345
|
0.63
|
0.77
|
747
|
905
|
|||||
|
Total
Stream 2
(all zones)
|
Measured
|
28,881
|
1,121
|
1,748
|
0.60
|
1.00
|
172
|
289
|
||||
|
Indicated
|
59,535
|
1,144
|
1,623
|
0.61
|
0.93
|
363
|
553
|
|||||
|
Total (M&I)
|
88,416
|
1,137
|
1,664
|
0.60
|
0.95
|
535
|
841
|
|||||
|
Inferred
|
66,662
|
1,186
|
897
|
0.63
|
0.51
|
421
|
342
|
|||||
|
Total (MII)
|
155,078
|
1,158
|
1,334
|
0.62
|
0.76
|
956
|
1,183
|
|||||
|
Stream 3(>= 11.13/tonne net value, < 5,000 ppm B, High Clay)
|
Total
Stream 3
(M5 zone)
|
Measured
|
13,602
|
2,202
|
1,487
|
1.17
|
0.85
|
159
|
116
|
|||
|
Indicated
|
11,437
|
2,100
|
1,205
|
1.12
|
0.69
|
128
|
79
|
|||||
|
Total (M&I)
|
25,039
|
2,155
|
1,358
|
1.15
|
0.78
|
287
|
194
|
|||||
|
Inferred
|
11,608
|
1,654
|
601
|
0.88
|
0.34
|
102
|
40
|
|||||
|
Total (MII)
|
36,647
|
1,997
|
1,118
|
1.06
|
0.64
|
389
|
234
|
|||||
|
All
Streams
|
M&I
Resource
|
Measured
|
67,440
|
1,530
|
5,406
|
0.81
|
3.09
|
549
|
2,085
|
|||
|
Indicated
|
106,531
|
1,344
|
4,627
|
0.72
|
2.65
|
762
|
2,818
|
|||||
|
Total (M&I)
|
173,971
|
1,416
|
4,929
|
0.75
|
2.82
|
1,311
|
4,903
|
|||||
|
Inferred
Resource
|
Inferred
|
105,147
|
1,332
|
3,472
|
0.71
|
1.99
|
745
|
2,088
|
||||
|
Total (MII)
|
279,117
|
1,384
|
4,380
|
0.74
|
2.50
|
2,056
|
6,991
|
|
|
1. |
kt = thousand tonnes; Li= lithium; B= boron; ppm= parts per million; Li2CO3 = lithium carbonate; H3BO3 = boric acid
|
|
Rhyolite Ridge Lithium-Boron Project
|
S-K 1300 Technical Report Summary
|
|
|
2. |
Totals may differ due to rounding mineral resources reported on a dry in-situ basis. Lithium is converted to Equivalent Contained Tons of lithium carbonate using a stochiometric
conversion factor of 5.322, and boron is converted to Equivalent Contained Tons of boric acid using a stochiometric conversion factor of 5.718. Equivalent stochiometric conversion factors are derived from the molecular weights of
the individual elements which make up lithium carbonate and boric acid. Lithium carbonate and boric acid are reported in short tons.
|
|
|
3. |
The statement of estimates of mineral resources has been compiled by the QP, a full-time employee of Independent Mining Consultants, Inc. and is independent of ioneer and its
affiliates. The QP has sufficient experience that is relevant to the style of mineralisation and type of deposit under consideration and to the activity being undertaken to qualify as a Competent Person as defined in the 2012
Edition of the ‘Australasian Code for Reporting of Exploration Results, Mineral Resources and Ore Reserves’.
|
|
|
4. |
All mineral resource figures reported in the table above represent estimates at August 2025. Mineral resource estimates are not precise calculations, being dependent on the
interpretation of limited information on the location, shape and continuity of the occurrence and on the available sampling results. The totals contained in the above table have been rounded to reflect the relative uncertainty of
the estimate.
|
|
|
5. |
Mineral resources are reported in accordance with the US SEC Regulation S-K Subpart 1300. The mineral resources in this Report were estimated using the regulation S-K 229.1304 of
the United States Securities and Exchange Commission (“SEC”). Mineral resources are also reported in accordance with the 2012 Edition of the Australasian Code for Reporting of Exploration Results, Mineral Resources and Ore
Reserves.
|
|
|
6. |
The Mineral Resource estimate is the result of determining the mineralized material that has a reasonable prospect of economic extraction. In making this determination,
constraints were applied to the geological model based upon a pit optimization analysis that defined a conceptual pit shell limit. The conceptual pit shell was based upon a net value per tonne calculation including a 5,000ppm
boron cut-off grade for high boron – high lithium (HiB-Li) mineralization (Stream 1) and a $11.13/tonne net value cut-off grade for low boron (LoB-Li) mineralization below 5,000ppm boron broke into two material types, low clay and
high clay material respectfully (Stream 2 and Stream 3). The pit shell was constrained by a conceptual Mineral Resource optimized pit shell for the purpose of establishing reasonable prospects of eventual economic extraction based
on potential mining, metallurgical and processing grade parameters identified by mining, metallurgical and processing studies performed to date on the Project. Key inputs in developing the Mineral Resource pit shell included a
5,000 ppm boron cut-off grade for HiB-Li mineralization, $11.13/tonne net value cut-off grade for LoB-Li low clay mineralization and LoB-Li high clay mineralization; mining cost of US$1.69 /tonne; G&A cost of US$11.13 /process
tonne; plant feed processing and grade control costs which range between US$18.87/tonne and US$98.63/tonne of plant feed (based on the acid consumption per stream and the mineral resource average grades); boron and lithium
recovery (respectively) for Stream 1: M5 80.2% and 85.7%, B5 78.3% and 85.2%, S5 77.0% and 82.5%, L6 75.8% and 79.4%; Stream 2 and 3: M5 65% and 78%, B5 78.3% and 85.2%, S5 46.8% and 84.8%, L6 32.9% and 78.7%, respectively; boric
acid sales price of US$1,172.78/tonne; lithium carbonate sales price of US$19,351.38/tonne.
|
|
|
7. |
The mineral resource is reported exclusive of the mineral reserves.
|
|
|
◾ |
Potential significant changes in the assumptions regarding forecast product prices, process recoveries, or production costs;
|
|
|
◾ |
Potential changes in geometry and/or continuity of the geological units due to displacement from localized faulting and folding;
|
|
|
◾ |
Potential changes in grade based on additional drilling that would influence the tonnages that would be excluded with the cut-off grade;
|
|
|
◾ |
Potential for changes to the environmental requirements related to permit applications.
|
|
1.10.
|
Mineral Reserve Estimate
|
|
Rhyolite Ridge Lithium-Boron Project
|
S-K 1300 Technical Report Summary
|
|
Area
|
Group
|
Classification
|
Short
|
Lithium
|
Boron
|
Contained
Equivalent
Grade
|
Contained
Equivalent Tons
|
Recovered
Equivalent Tons
|
||||||
|
Tons
|
Grade
|
Grade
|
||||||||||||
|
Li
|
B
|
Li2CO3
|
H3BO3
|
Li2CO3
|
H3BO3
|
Li2CO3
|
H3BO3
|
|||||||
|
(kt)
|
(ppm)
|
(ppm)
|
(wt.%)
|
(wt.%)
|
(kt)
|
(kt)
|
(kt)
|
(kt)
|
||||||
|
Stream 1
(>= 5,000
ppm B)
|
Upper Zone
|
Proven
|
3,489
|
2,401
|
7,652
|
1.28
|
4.38
|
45
|
153
|
38
|
122
|
|||
|
M5 Unit
|
Probable
|
3,410
|
2,262
|
7,430
|
1.20
|
4.25
|
41
|
145
|
35
|
116
|
||||
|
Sub-total B5 Unit
|
6,899
|
2,332
|
7,542
|
1.24
|
4.31
|
86
|
298
|
73
|
239
|
|||||
|
Upper Zone
|
Proven
|
27,991
|
1,880
|
15,364
|
1.00
|
8.79
|
280
|
2,459
|
239
|
1,925
|
||||
|
B5 Unit
|
Probable
|
31,456
|
1,742
|
14,169
|
0.93
|
8.10
|
292
|
2,549
|
248
|
1,995
|
||||
|
Sub-total M5 Unit
|
59,447
|
1,807
|
14,732
|
0.96
|
8.42
|
572
|
5,008
|
487
|
3,921
|
|||||
|
Upper Zone
|
Proven
|
2,237
|
1,326
|
7,754
|
0.71
|
4.43
|
16
|
99
|
13
|
76
|
||||
|
S5 Unit
|
Probable
|
3,355
|
1,166
|
7,533
|
0.62
|
4.31
|
21
|
145
|
17
|
111
|
||||
|
Sub-total S5 Unit
|
5,592
|
1,230
|
7,621
|
0.65
|
4.36
|
37
|
244
|
30
|
187
|
|||||
|
Upper Zone
|
Proven
|
33,717
|
1,897
|
14,061
|
1.01
|
8.04
|
340
|
2,711
|
290
|
2,124
|
||||
|
(B5, M5 & S5)
|
Probable
|
38,221
|
1,738
|
12,985
|
0.92
|
7.42
|
353
|
2,838
|
301
|
2,223
|
||||
|
Sub-Total
|
Sub-total Upper Zone
|
71,938
|
1,813
|
13,489
|
0.96
|
7.71
|
694
|
5,549
|
591
|
4,347
|
||||
|
Lower Zone
|
Proven
|
5,712
|
1,389
|
8,357
|
0.74
|
4.78
|
42
|
273
|
34
|
207
|
||||
|
L6 Unit
|
Probable
|
13,592
|
1,334
|
7,856
|
0.71
|
4.49
|
96
|
611
|
77
|
463
|
||||
|
Sub-total Lower Zone
|
19,303
|
1,350
|
8,004
|
0.72
|
4.58
|
139
|
883
|
110
|
670
|
|||||
|
Total Stream 1 (all zones)
|
Proven
|
39,428
|
1,824
|
13,235
|
0.97
|
7.57
|
383
|
2,984
|
323
|
2,331
|
||||
|
Probable
|
51,813
|
1,632
|
11,640
|
0.87
|
6.66
|
450
|
3,448
|
377
|
2,686
|
|||||
|
Sub-total Stream 1
|
91,241
|
1,715
|
12,329
|
0.91
|
7.05
|
833
|
6,432
|
700
|
5,017
|
|||||
|
Stream 2
($16.54/t
net value
cut-off
grade. Low
Clay)
|
Upper Zone
|
Proven
|
4,528
|
2,219
|
2,143
|
1.18
|
1.23
|
53
|
55
|
46
|
43
|
|||
|
B5 Unit
|
Probable
|
4,384
|
2,118
|
2,415
|
1.13
|
1.38
|
49
|
61
|
42
|
47
|
||||
|
Sub-total B5 Unit
|
8,912
|
2,169
|
2,277
|
1.15
|
1.30
|
103
|
116
|
88
|
91
|
|||||
|
Upper Zone
|
Proven
|
15,005
|
1,022
|
1,125
|
0.54
|
0.64
|
82
|
97
|
69
|
45
|
||||
|
S5 Unit
|
Probable
|
27,495
|
825
|
866
|
0.44
|
0.50
|
121
|
136
|
102
|
64
|
||||
|
Sub-total S5 Unit
|
42,500
|
895
|
957
|
0.48
|
0.55
|
202
|
233
|
172
|
109
|
|||||
|
Upper Zone
|
Proven
|
19,533
|
1,299
|
1,361
|
0.69
|
0.78
|
135
|
152
|
115
|
89
|
||||
|
(B5 & S5)
|
Probable
|
31,880
|
1,003
|
1,079
|
0.53
|
0.62
|
170
|
197
|
144
|
111
|
||||
|
Sub-Total
|
Sub-total Upper Zone
|
51,413
|
1,116
|
1,186
|
0.59
|
0.68
|
305
|
349
|
259
|
200
|
||||
|
Lower Zone
|
Proven
|
24,936
|
1,254
|
1,279
|
0.67
|
0.73
|
166
|
182
|
131
|
60
|
||||
|
L6 Unit
|
Probable
|
68,952
|
1,196
|
1,535
|
0.64
|
0.88
|
439
|
605
|
345
|
199
|
||||
|
Rhyolite Ridge Lithium-Boron Project
|
S-K 1300 Technical Report Summary
|
|
Area
|
Group
|
Classification
|
Short
|
Lithium
|
Boron
|
Contained
Equivalent
Grade
|
Contained
Equivalent Tons
|
Recovered
Equivalent Tons |
||||||
|
Tons
|
Grade
|
Grade
|
||||||||||||
|
|
Li
|
B
|
Li2CO3
|
H3BO3
|
Li2CO3
|
H3BO3
|
Li2CO3
|
H3BO3
|
||||||
|
(kt)
|
(ppm)
|
(ppm)
|
(wt.%)
|
(wt.%)
|
(kt)
|
(kt)
|
(kt)
|
(kt)
|
||||||
|
Sub-total Lower Zone
|
93,888
|
1,211
|
1,467
|
0.64
|
0.84
|
605
|
788
|
476
|
259
|
|||||
|
Total
Stream 2
(all zones)
|
Proven
|
44,469
|
1,274
|
1,315
|
0.68
|
0.75
|
302
|
334
|
246
|
149
|
||||
|
Probable
|
100,832
|
1,135
|
1,391
|
0.60
|
0.80
|
609
|
802
|
490
|
310
|
|||||
|
Sub-total Stream 2
|
145,301
|
1,177
|
1,368
|
0.63
|
0.78
|
911
|
1,136
|
736
|
459
|
|||||
|
Stream 3
($16.54/t
net value
cut-off
grade, High
Clay)
|
Total
Stream 3
(M5 zone)
|
Proven
|
5,621
|
2,199
|
1,702
|
1.17
|
0.97
|
66
|
55
|
51
|
36
|
|||
|
Probable
|
18,178
|
2,082
|
1,145
|
1.11
|
0.65
|
201
|
119
|
157
|
77
|
|||||
|
Sub-total Stream 3
|
23,799
|
2,110
|
1,277
|
1.12
|
0.73
|
267
|
174
|
208
|
113
|
|||||
|
TOTAL of All Streams, All Seams, and All Proven & Probable
|
260,341
|
1,451
|
5,201
|
0.77
|
2.97
|
2,010
|
7,742
|
1,645
|
5,588
|
|||||
|
|
1. |
Li= lithium; B= boron’ ppm= parts per million; Li2CO3 = lithium carbonate; H3BO3
= boric acid; kt = thousand metric tonnes.
|
|
|
2. |
Totals may differ due to rounding, Mineral Reserves reported on a dry in-situ basis. The Contained and Recovered Lithium Carbonate (Li2CO3) and Boric Acid (H3BO3) are reported in the table above in short tons. Lithium is converted to Equivalent Contained Tonnes of Lithium Carbonate (Li2CO3) using a stochiometric conversion factor of 5.322, and boron is
converted to Equivalent Contained Tonnes of Boric Acid (H3BO3) using a
stochiometric conversion factor of 5.718. Equivalent stochiometric conversion factors are derived from the molecular weights of the individual elements which make up Lithium Carbonate (Li2CO3) and Boric Acid (H3BO3). The Equivalent Recovered Tons of Lithium Carbonate (Li2CO3) and Boric Acid (H3BO3) is the portion of the contained tonnage that can be recovered after processing.
|
|
|
3. |
The statement of estimates of Mineral Reserves has been compiled by Independent Mining Consultants, Inc. (IMC) and is independent of ioneer and its affiliates. IMC has
sufficient experience that is relevant to the style of mineralisation and type of deposit under consideration and to the activity being undertaken to qualify as a Competent Person as defined in the S-K §229.1304 of the United
States Securities and Exchange Commission (“SEC”).
|
|
|
4. |
All Mineral Reserve figures reported in the table above represent estimates at August 2025. Mineral Reserve estimates are not precise calculations, being dependent on the
interpretation of limited information on the location, shape and continuity of the occurrence and on the available sampling results. The totals contained in the above table have been rounded to reflect the relative uncertainty
of the estimate.
|
|
|
5. |
Mineral Reserves are reported in accordance with the US SEC Regulation S-K Subpart 1300. The Mineral Reserves in this report were estimated and reported using the regulation
S-K §229.1304 of the United States Securities and Exchange Commission (“SEC”). Mineral Reserves are also reported in accordance with the Australasian Code for Reporting of Exploration Results, Mineral Resources and Ore Reserves
(The Joint Ore Reserves Committee Code – JORC 2012 Edition).
|
|
|
6. |
The Mineral Reserve estimate is the result of determining the measured and indicated resource that is economically minable allowing for the conversion to proven and probable.
In making this determination, constraints were applied to the geological model based upon a pit optimization analysis that defined a conceptual pit shell limit. The conceptual pit shell was based upon a net value per ton
calculation including a 5,000 ppm boron cut-off grade for high boron – high lithium (HiB-Li) mineralization (Stream 1) and $11.13 net value per metric tonne cut-off for low boron (LoB-Li) mineralization below 5,000 ppm boron
broke in to two material types low clay and high clay material respectfully (Stream 2 and Stream 3). The conceptual pit shell was constrained by the measured and indicated resource that incorporates the potential mining,
metallurgical and processing grade parameters identified by mining, metallurgical and processing studies performed to date on the Project. The conceptual pit shell was used a guide for an engineered pit design. Key inputs in
developing the Mineral Reserve pit shell included a 5,000 ppm boron cut-off grade for HiB-Li mineralization, $11.13 net value per metric tonne cut-off for LoB-Li low clay mineralization and $11.13 Net value per metric tonne
cut-off for LoB-Li high clay mineralization; base mining cost of US$1.69/t and incremental cost of $0.055/t per bench below 1,896 m (6,220 ft) elevation; plant feed processing and grade control costs which range between
US$52.92/t and US$82.55/t of plant feed for stream 1, US$18.87 and US$98.62 for streams 2&3; boron and lithium recovery for Stream 1: M5= of 80.2% and 85.7%, B5=80.2% and 78.3%, S5=77.0% and 82.5%, L6=75.8% and 79.4%; Stream
2 and 3: M5 65% and 78%, B5 78.3% and 85.2%, S5 46.8% and 84.8%, L6 32.9% and 78.7%, respectively; boric acid sales price of US$1,172.78/t; lithium carbonate sales price of $19,351.38/t.
|
|
Rhyolite Ridge Lithium-Boron Project
|
S-K 1300 Technical Report Summary
|
|
|
7. |
The Mineral Reserve is reported exclusive of Mineral Resources.
|
|
|
8. |
Equivalent Lithium Carbonate (Li2CO3) and Boric Acid (H3BO3) grades have
been rounded to the nearest tenth of a percent.
|
|
1.11.
|
Mining Methods
|
|
1.12.
|
Recovery Methods
|
|
|
◾ |
Ore storage, handling and sizing:
|
|
|
◾ |
Run-of-mine ore will be stockpiled before entering a two-stage crushing circuit, where it will be reduced in size before being conveyed to the leaching vats;
|
|
|
◾ |
Vat leaching:
|
|
|
◾ |
Boron and lithium will be leached into solution by sulfuric acid, producing a pregnant leach solution (PLS);
|
|
|
◾ |
Boric acid circuit:
|
|
|
◾ |
Boric acid will be crystallized by cooling the PLS past its saturation limit and separating it;
|
|
Rhyolite Ridge Lithium-Boron Project
|
S-K 1300 Technical Report Summary
|
|
|
◾ |
Boric acid will be refined by redissolution and recrystallization, followed by dewatering via centrifugation prior to drying and packaging for sale to the market. The final
product will be technical grade boric acid;
|
|
|
◾ |
Evaporation and crystallization:
|
|
|
◾ |
The resultant solution from boric acid filtration will undergo impurity removal by chemical addition and precipitation;
|
|
|
◾ |
The purified solution will undergo several stages of evaporation and crystallization. Boric acid will be recovered via flotation and returned to the boric acid
crystallization circuit. The flotation tails (primarily salts of magnesium, potassium and sodium sulfate) will be dewatered via centrifugation and sent to a spent ore storage facility;
|
|
|
◾ |
Lithium carbonate circuit:
|
|
|
◾ |
The remaining solution will undergo further impurity removal, followed by the precipitation of technical grade lithium carbonate by chemical addition. The lithium carbonate
will be filtered from solution prior to product drying and packaging. The final product will be technical grade lithium carbonate.
|
|
|
◾ |
Lithium hydroxide circuit:
|
|
|
◾ |
Lithium carbonate will undergo further processing to convert to lithium hydroxide monohydrate (LHM). The installation of the LHM conversion plant will occur post startup.
The selected conversion route is the liming route.
|
|
|
◾ |
Technical grade lithium carbonate is combined with lime to produce lithium hydroxide and calcium carbonate. The lithium hydroxide slurry is filtered and the resulting
calcium carbonate byproduct is recycled to lithium carbonate plant to offset new lime consumption.
|
|
|
◾ |
The clarified lithium hydroxide solution is subject to ion exchange.
|
|
|
◾ |
The refined lithium hydroxide solution is concentrated through multiple stages of evaporation. Lithium hydroxide monohydrate is crystallized and dewatered using
centrifuges. The LHM solids are redissolved in clean process condensate and filtered to remove insoluble impurities. And subject to a final stage of crystallization to produce battery grade LHM. The solids are dewatered and
washed using centrifuges.
|
|
|
◾ |
The wet LHM solids are direct to dryers and packaging systems.
|
|
1.13.
|
Infrastructure
|
|
|
◾ |
Process plant;
|
|
Rhyolite Ridge Lithium-Boron Project
|
S-K 1300 Technical Report Summary
|
|
|
◾ |
Assay and metallurgical lab;
|
|
|
◾ |
Access through paved state and local county roads;
|
|
|
◾ |
Haul roads;
|
|
|
◾ |
Pit dewatering and monitoring wells;
|
|
|
◾ |
First aid and communications building;
|
|
|
◾ |
Explosives storage area;
|
|
|
◾ |
Steam turbine generator power plant;
|
|
|
◾ |
Spent ore storage facility;
|
|
|
◾ |
Switchgear and electrical distribution system;
|
|
|
◾ |
Emergency facilities;
|
|
|
◾ |
Water systems;
|
|
|
◾ |
Sedimentation and contact water ponds;
|
|
|
◾ |
Truck shop;
|
|
|
◾ |
Fueling station;
|
|
|
◾ |
Lunch facility building;
|
|
|
◾ |
Administrative building.
|
|
Rhyolite Ridge Lithium-Boron Project
|
S-K 1300 Technical Report Summary
|
|
1.14.
|
Market Studies
|
|
1.14.1.
|
Markets
|
|
1.14.2.
|
Commodity Price Forecasts
|
|
Rhyolite Ridge Lithium-Boron Project
|
S-K 1300 Technical Report Summary
|
|
1.14.3.
|
Contracts
|
|
1.15.
|
Environmental, Permitting, and Social Considerations
|
|
1.15.1.
|
Environmental Considerations
|
|
1.15.2.
|
Closure and Reclamation
|
|
1.15.3.
|
Permitting Considerations
|
|
1.15.4.
|
Social Considerations
|
|
Rhyolite Ridge Lithium-Boron Project
|
S-K 1300 Technical Report Summary
|
|
1.16.
|
Capital Costs
|
|
Discipline
|
Total Cost
(US$ Million)
|
|
|
Direct field costs
|
|
00
|
Earthwork & civil
|
52.2
|
||
|
10
|
Concrete
|
64.9
|
||
|
20
|
Structural steel
|
55.7
|
||
|
30
|
Architectural and buildings
|
5.2
|
||
|
40
|
Machinery and equipment
|
437.3
|
||
|
50
|
Piping
|
121.2
|
||
|
60
|
Electrical
|
120.0
|
||
|
70
|
Control systems
|
38.8
|
||
|
75
|
Communications and security
|
4.7
|
||
|
81
|
Painting and coatings
|
31.7
|
||
|
82
|
Insulation & refractory
|
21.7
|
||
|
83
|
Modularization
|
5.2
|
||
|
87
|
Scaffolding
|
8.3
|
|
Sub-total direct cost
|
966.9
|
|
|
Sub-total direct distributable
|
282.2
|
|
|
Sub-total indirect cost
|
82.1
|
|
|
Other Cost
|
|
9800000
|
Escalation
|
65.8
|
||
|
9900000
|
Contingency (project @ risk)
|
107.3
|
||
|
9900000
|
Contingency (schedule risk analysis)
|
40.2
|
|
Sub-total other cost
|
213.3
|
|
|
Owner’s managed cost
|
|
8500000
|
Owner’s project cost
|
91.5
|
|
Sub-total owner’s cost
|
91.5
|
|
|
Indicative total cost
|
1,636.0
|
|
|
Late Additions (order of magnitude)
|
31.90
|
|
|
Indicative total cost with late additions
|
1,667.9
|
|
Rhyolite Ridge Lithium-Boron Project
|
S-K 1300 Technical Report Summary
|
|
1.17.
|
Operating Costs
|
|
Description
|
Total Cost
(US$ Million)
|
Average Cost
per Ton RoM1
(US$/t RoM)
|
Percentage
(%)
|
|
|
Mine (excluding deferred stripping)
|
1,830.00
|
7.0
|
11.3
|
|
|
Process plant (excluding sales tax)
|
13,878.80
|
54.9
|
88.7
|
|
|
Total operating costs excluding sales tax
|
15,708.80
|
60.3
|
100.0
|
|
|
1. |
RoM = run-of-mine plant feed ton
|
|
1.18.
|
Economic Analysis
|
|
1.18.1.
|
Cashflow Analysis
|
|
Item
|
Unit
|
Description
|
|
|
Revenue
|
US$ million
|
47,179
|
|
|
Pre-tax cash flow
|
US$ million
|
26,701
|
|
|
Post-tax cash flow
|
US$ million
|
23,773
|
|
|
Unlevered post-tax net present value
|
US$ million
|
1,888
|
|
|
Unlevered post-tax internal rate of return
|
%
|
16.8
|
|
|
Payback period
|
Years
|
10
|
|
|
Mine life
|
Years
|
82
|
|
Rhyolite Ridge Lithium-Boron Project
|
S-K 1300 Technical Report Summary
|
|
|
1. |
The Rhyolite Ridge Project has closed a loan with the U.S. Department of Energy Loan Programs Office for US$996 million. The conditions for the first draw have not yet been
met. If the conditions are met, the levered post-tax internal rate of return of the Project would be 20.9%.
|
|
|
1. |
As further described in Section 19.3.3, production tax credit and net operating loss carry forwards are used to offset federal income tax to compute post-tax economic metrics.
|
|
1.18.2.
|
Sensitivity Analysis
|
|
1.19.
|
Risks and Opportunities
|
|
1.19.1.
|
Risks
|
|
|
◾ |
The mineral resource estimates could change significantly if there are major changes in forecasted product prices, mining recoveries, or production costs. If
prices decrease or costs increase significantly, the cut-off grade would need to rise, which could have a major impact on the mineral resource estimates and would need to be re-evaluated;
|
|
|
◾ |
The mineral reserve estimates could change positively or negatively with further exploration that updates the geological data and models for lithium-boron
mineralization. They could also be significantly affected by changes in assumptions about slope stability (such as new hydrogeologic or geological data), product prices, mining recoveries, or production costs. If
prices drop or production costs rise significantly, the cut-off grade would need to be increased, which could have a material impact on the mineral reserve estimates and would require re-evaluation;
|
|
|
◾ |
Marketing risks include customers not honoring contracts and memorandum of understanding’s resulting in lower sales levels, commercial team unable to secure
contracts to meet production levels, lowered prices due to oversupply or lower demand, and a slow market resulting in less sales volume;
|
|
|
◾ |
Project economic could be impacted by factors such as skilled labor availability, and volatility in raw materials and transportation costs;
|
|
|
◾ |
Blending with LoB-Li high clay mineralization (M5 unit) should be limited to 10% to avoid adverse permeability issues in the vats caused by its high clay
content. The large volume of M5 unit ore will result in the great portion of this ore type being unsuited for vat leaching through prior blending with low clay ores. Additionally, blending with other LoB-Li low
clay mineralization types in stream 2 (L6 & S5 units) will result in lower boric acid production.
|
|
Rhyolite Ridge Lithium-Boron Project
|
S-K 1300 Technical Report Summary
|
|
1.19.2.
|
Opportunities
|
|
|
◾ |
Converting the remainder of LoB-Li high clay mineralization in the M5 unit from current classification of mineral resources to mineral reserves, following
appropriate supporting studies and tests.
|
|
1.20.
|
Conclusions
|
|
1.21.
|
Recommendations
|
|
Rhyolite Ridge Lithium-Boron Project
|
S-K 1300 Technical Report Summary
|
|
2.
|
INTRODUCTION
|
|
2.1.
|
Introduction
|
|
2.2.
|
Terms of Reference
|
|
|
◾ |
United States (US) English;
|
|
|
◾ |
Metric measurement units;
|
|
|
◾ |
Grades are presented in parts per million (ppm), or weight percent (wt. %);
|
|
|
◾ |
The coordinate system is presented using the Nevada State Plane Coordinate System of 1983, West Zone (NVSPW 1983) projection, and the North American Vertical
Datum of 1988 (NAVD 88);
|
|
|
◾ |
Constant US dollars (US$) as of the Report date;
|
|
|
◾ |
Mineral resources and mineral reserves are reported using the definitions in Subpart 229.1300 – Disclosure by Registrants Engaged in Mining Operations in
Regulation S–K 1300 (SK1300).
|
|
2.3.
|
Qualified Persons
|
|
Rhyolite Ridge Lithium-Boron Project
|
S-K 1300 Technical Report Summary
|
|
Qualified Person
|
Report Sections
|
Report Responsibilities
|
||||
|
AtkinsRéalis
|
1.1, 1.2, 1.4, 1.8, 1.12, 1.13, 1.16, 1.17, 1.19.1, 2-5, 10, 14, 15.1-15.5, 18, 21, 22.1, 22.5, 22.9, 22.10.1, 22.13, 22.14, 22.16.1.1, 22.16.1.6, 24, 25
|
Introduction, property description, resources and physiography, history, metallurgy and mineral processing, recovery methods, infrastructure, capital and operating costs
|
||||
|
IMC
|
1.3, 1.5.1, 1.5.2, 1.6, 1.7, 1.9-1.11, 1.19.1, 1.19.2, 1.20, 1.21, 6, 7.1, 7.2, 8, 9, 11, 12, 13.2-13.4, 20, 22.2, 22.3.1, 22.4, 22.6-22.8, 22.16.1.2, 22.16.1.3
|
Geology and mineralization, exploration and drilling, data verification, mineral resources, mineral reserves, mine design, mining methods
|
||||
|
Westland
|
1.15, 17.1, 17.3-17.7, 22.12, 22.16.1.5
|
Environmental studies, permitting, mine closure plans
|
||||
|
Mr. Yoshio Nagai
|
1.14, 1.19.1, 16, 22.11, 22.16.1.4
|
Marketing, market studies
|
||||
|
LRE Water
|
7.3.1, 7.3.2, 7.3.4, 7.3.5, 22.3.2, 23
|
Hydrogeology
|
||||
|
NewFields
|
1.5.4, 7.5, 13.1.3, 13.1.4, 15.6, 17.2, 17.7, 22.3.3, 22.10.2
|
Geotechnical exploration and analysis, spent ore storage, site monitoring
|
||||
|
Geo-Logic Associates, Inc.
|
1.5.3, 7.4, 13.1.1, 13.1.4
|
Geotechnical quarry slope stability
|
||||
|
Mr. Chad Yeftich
|
1.18, 17.1.7, 19, 22.15, 22.16.1.6
|
Economic analysis
|
||||
|
Piteau Associates
|
7.3.3, 13.1.2
|
Hydrogeology
|
|
2.4.
|
Scope of Personal Inspection
|
|
Rhyolite Ridge Lithium-Boron Project
|
S-K 1300 Technical Report Summary
|
|
2.5.
|
Information Sources
|
|
2.6.
|
Report Date
|
|
2.7.
|
Previously Filed Technical Report Summaries
|
|
|
◾ |
Golder Associates Inc., 2021: Technical Report Summary of the Rhyolite Ridge Lithium-Boron Project: report prepared for ioneer Ltd., current as of September 30, 2021.
|
|
|
◾ |
Golder Associates USA Inc., 2022: Technical Report Summary of the Rhyolite Ridge Lithium-Boron Project: report prepared for ioneer Ltd., current as of February 28, 2022.
|
|
|
◾ |
WSP USA Inc., 2023: Technical Report Summary of the Rhyolite Ridge Lithium-Boron Project: report prepared for ioneer Ltd., current as of October 25, 2023.
|
|
2.8.
|
Definitions
|
|
Rhyolite Ridge Lithium-Boron Project
|
S-K 1300 Technical Report Summary
|
|
Acronym/Abbreviation
|
Definitions
|
||
|
°C
|
degrees Celsius
|
||
|
3D
|
three-dimensional
|
||
|
AAL
|
American Assay Laboratories
|
||
|
ABA
|
acid-base accounting
|
||
|
AFW
|
Amec Foster Wheeler
|
||
|
AHT
|
autonomous haul truck
|
||
|
ALM
|
American Lithium Minerals
|
||
|
amsl
|
above mean sea level
|
||
|
ANP
|
acid neutralization potential
|
||
|
APE
|
area of potential effect
|
||
|
APEGA
|
Association of Professional Engineers and Geoscientists of Alberta
|
||
|
arb
|
as-received basis
|
||
|
ARD
|
acid-rock drainage
|
||
|
asl
|
above sea level
|
||
|
ATV
|
all-terrain vehicle
|
||
|
B
|
boron
|
||
|
bgs
|
below ground surface
|
||
|
BH
|
Borate Hills
|
||
|
BIA
|
Bureau of Indian Affairs
|
||
|
BLM
|
U.S. Department of Interior’s Bureau of Land Management
|
||
|
BMRR
|
Bureau of Mining Regulation and Reclamation
|
||
|
CaCO3
|
calcium carbonate / limestone
|
||
|
capex
|
capital cost expenditure
|
||
|
CAT
|
Caterpillar
|
||
|
cm
|
centimeter
|
||
|
CO2
|
carbon dioxide
|
||
|
CPE
|
chlorinated polyethylene
|
||
|
CRM
|
certified reference material
|
||
|
CRZ1
|
boric acid crystallization
|
||
|
CRZ2
|
sulfate acid crystallization
|
||
|
CRZ3
|
boric acid crystallization
|
||
|
Cs
|
cesium
|
||
|
CWP
|
contact water pond
|
||
|
CY
|
cubic yard
|
||
|
DGPS
|
differential global positioning system
|
|
Rhyolite Ridge Lithium-Boron Project
|
S-K 1300 Technical Report Summary
|
|
EA
|
Environmental Assessment
|
||
|
EBITDA
|
earnings before interest, taxes, depreciation, and amortization
|
||
|
EDA
|
exploratory data analysis
|
||
|
EIS
|
Environmental Impact Statement
|
||
|
EMS
|
EM Strategies, a WestLand Resources Inc. company
|
||
|
EnviroMINE
|
EnviroMine Inc.
|
||
|
EPCM
|
engineering, procurement, and construction management
|
||
|
ET
|
evapotranspiration
|
||
|
EU
|
effective utilization
|
||
|
EV
|
electric vehicle
|
||
|
EVP1
|
downstream PLS evaporation
|
||
|
EVP2
|
lithium brine evaporation
|
||
|
F
|
fluorine
|
||
|
FS
|
feasibility study
|
||
|
FCC
|
Federal Communications Commission
|
||
|
FEL
|
front-end loader
|
||
|
FEM
|
finite element
|
||
|
Fluor
|
Fluor Enterprises, Inc.
|
||
|
FMS
|
fleet management system
|
||
|
FPC
|
fleet production and cost analysis software
|
||
|
FPPC
|
Final Plan for Permanent Closure
|
||
|
ft
|
feet
|
||
|
ft/d
|
feet per day
|
||
|
GLA
|
Geo-Logic Associates, Inc.
|
||
|
Golder
|
Golder Associates USA Inc., member of WSP
|
||
|
gpm
|
gallons per minute
|
||
|
GPS
|
global positioning system
|
||
|
H3BO3
|
boric acid
|
||
|
HCM
|
hydrogeological conceptual model
|
||
|
HCT
|
humidity cell testing
|
||
|
HDPE
|
high-density polyethylene
|
||
|
HGL
|
HydroGeoLogica, Inc.
|
||
|
HGU
|
hydrogeological unit
|
||
|
hr
|
hour
|
||
|
Hwy
|
highway
|
||
|
ICE
|
internal combustion engine
|
||
|
ICP-MS
|
Inductively coupled plasma mass spectrometry
|
|
Rhyolite Ridge Lithium-Boron Project
|
S-K 1300 Technical Report Summary
|
|
ID2
|
inverse distance interpolation weighted to the second power
|
||
|
ID3
|
Inverse distance interpolation weighted to the third power
|
||
|
IOB
|
in-pit overburden backfill
|
||
|
ioneer
|
ioneer Ltd. or ioneer USA Corporation
|
||
|
IR1
|
impurity removal 1
|
||
|
IR2
|
lithium brine impurity removal
|
||
|
IRR
|
internal rate of return
|
||
|
IRS
|
Internal Revenue Service
|
||
|
JOGMEC
|
Japan Oil, Gas and Metals National Corporation
|
||
|
KCA
|
Kappes Cassiday Associates
|
||
|
KNA
|
kriging neighborhood analysis
|
||
|
kst
|
thousand short tons
|
||
|
kstpy
|
thousand short tons per year
|
||
|
kt
|
thousand metric tons
|
||
|
kV
|
kilovolt
|
||
|
lb
|
pound
|
||
|
LCE
|
lithium carbonate equivalent
|
||
|
LDS
|
leak detection system
|
||
|
LG
|
Lerchs-Grossmann
|
||
|
Li
|
lithium
|
||
|
Li2CO3
|
lithium carbonate
|
||
|
LiOH
|
lithium hydroxide
|
||
|
LOM
|
life-of-mine
|
||
|
LOMP
|
life-of-mine plan
|
||
|
LOQ
|
life-of-quarry
|
||
|
LS
|
lacustrine sediments of the Cave Springs Formation
|
||
|
m
|
meter
|
||
|
m2
|
square meter
|
||
|
MA
|
mechanical availability
|
||
|
MACRS
|
modified accelerated cost recovery system
|
||
|
MCY
|
million cubic yard
|
||
|
MEG
|
Minerals Exploration & Environmental Geochemistry Inc.
|
||
|
mg/L
|
milligram per liter
|
||
|
ML
|
metals leaching
|
||
|
mm
|
millimeter
|
||
|
Mo
|
molybdenum
|
||
|
Mph
|
miles per hour
|
|
Rhyolite Ridge Lithium-Boron Project
|
S-K 1300 Technical Report Summary
|
|
MPO
|
mine plan of operations
|
||
|
MQC
|
manufacturer quality control
|
||
|
MS
|
Microsoft
|
||
|
MSHA
|
Mine Safety and Health Administration
|
||
|
Mst
|
million short tons
|
||
|
Mstpy
|
million short tons per year
|
||
|
Mt
|
million metric tons
|
||
|
MTO
|
material take-off
|
||
|
MW
|
megawatt
|
||
|
Na2CO3
|
soda ash
|
||
|
NaBSi2O5(OH)2
|
sodium borosilicate
|
||
|
NAC
|
Nevada Administrative Code
|
||
|
NaCaB5O6(OH)6•5H2O
|
sodium calcium borate hydroxide
|
||
|
NAICS
|
North American Industry Classification System
|
||
|
NDEP
|
Nevada Division of Environmental Protection
|
||
|
NEPA
|
National Environmental Policy Act
|
||
|
Newfields
|
NewFields Companies, LLC
|
||
|
NLB
|
north lithium basin
|
||
|
NOL
|
net operating loss
|
||
|
NPS
|
National Park Services
|
||
|
NPV
|
net present value
|
||
|
NRHP
|
National Register of Historic Places
|
||
|
OEM
|
original equipment manufacturer
|
||
|
OHWM
|
ordinary high water mark
|
||
|
Opex
|
operating cost estimate
|
||
|
OSF
|
overburden storage facility
|
||
|
OU
|
operational usage
|
||
|
P.E.
|
Professional Engineer
|
||
|
P.Geo.
|
Professional Geologist
|
||
|
pcf
|
pounds per cubic foot
|
||
|
PFS
|
prefeasibility study
|
||
|
PLS
|
pregnant leach solution
|
||
|
ppm
|
parts per million
|
||
|
psi
|
pounds per square inch
|
||
|
QA/QC
|
quality assurance and quality control
|
||
|
QAL
|
Quaternary alluvium
|
||
|
QP
|
Qualified Person
|
|
Rhyolite Ridge Lithium-Boron Project
|
S-K 1300 Technical Report Summary
|
|
RAM
|
reliability, availability, and maintenance
|
||
|
Rb
|
rubidium
|
||
|
RC
|
reverse circulation
|
||
|
Rhyolite Ridge Project or
the Project
|
Rhyolite Ridge Lithium-Boron Project
|
||
|
ROM
|
run-of-mine
|
||
|
ROW
|
right-of-way
|
||
|
RQD
|
rock quality designation
|
||
|
s
|
seconds
|
||
|
SAP
|
sulfuric acid plant
|
||
|
SD
|
standard deviation
|
||
|
S-K 1300
|
United States Security and Exchange Commission’s Regulation Subpart S‑K 1300
|
||
|
SLB
|
south lithium basin
|
||
|
SLM
|
solid leasable minerals
|
||
|
SME
|
Society for Mining, Metallurgy, & Exploration
|
||
|
SMU
|
service meter units
|
||
|
SOP
|
standard operating procedure
|
||
|
SOSF
|
spent ore storage facility
|
||
|
stpy
|
short tons per year
|
||
|
SQM
|
Sociedad Química y Minera de Chile
|
||
|
Sr
|
strontium
|
||
|
SRM
|
standard reference material
|
||
|
Stantec
|
Stantec Consulting Services, Inc.
|
||
|
STG
|
steam turbine generator
|
||
|
stpd
|
short tons per day
|
||
|
SWBM
|
site-wide, operational water balance model
|
||
|
Tbx
|
Rhyolite Ridge Tuff and volcanic breccia
|
||
|
TDS
|
total dissolved solids
|
||
|
Trinity
|
Trinity Consultants
|
||
|
TRS
|
technical report summary
|
||
|
TS
|
Tertiary sedimentary unit
|
||
|
TW
|
testing well
|
||
|
UNR
|
University of Nevada, Reno
|
||
|
US$
|
United States dollar
|
||
|
USACE
|
U.S. Army Corps of Engineers
|
||
|
USFS
|
U.S. Forest Service
|
||
|
USFWS
|
U.S. Fish and Wildlife Service
|
|
Rhyolite Ridge Lithium-Boron Project
|
S-K 1300 Technical Report Summary
|
|
VWP
|
vibrating-wire piezometers
|
||
|
WBS
|
work breakdown structure
|
||
|
WOTUS
|
waters of the United States
|
||
|
WPCP
|
Water Pollution Control Permit
|
||
|
WSP
|
WSP USA Inc.
|
||
|
Ω-cm
|
ohm-centimeters
|
|
Rhyolite Ridge Lithium-Boron Project
|
S-K 1300 Technical Report Summary
|
|
3.
|
PROPERTY DESCRIPTION
|
|
3.1.
|
Property Location
|
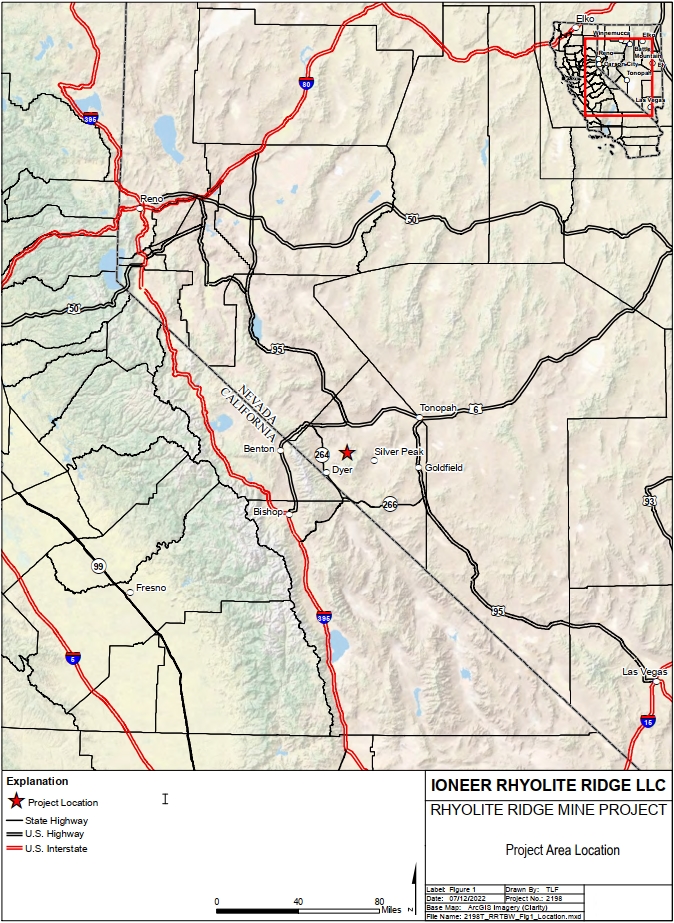
 |
3-1 |
30 SEPTEMBER 2025
|
|
Rhyolite Ridge Lithium-Boron Project
|
S-K 1300 Technical Report Summary
|
|
3.2.
|
Property Ownership
|
|
3.3.
|
Mineral Rights
|
|
3.3.1.
|
Name and Number of Mineral Rights
|
|
|
3-2 |
30 SEPTEMBER 2025
|
|
Rhyolite Ridge Lithium-Boron Project
|
S-K 1300 Technical Report Summary
|
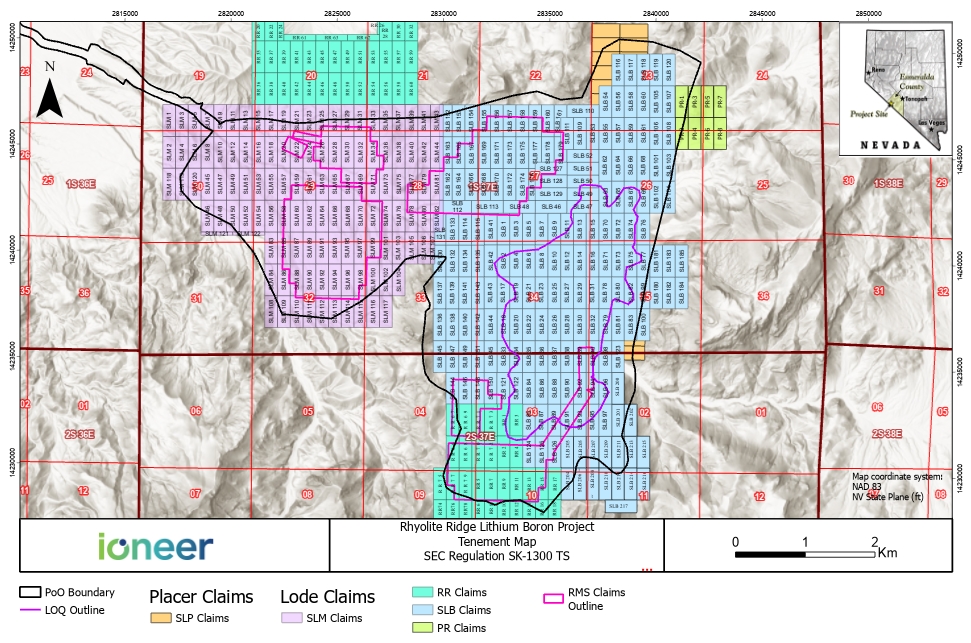
|
|
3-3 |
30 SEPTEMBER 2025
|
|
Rhyolite Ridge Lithium-Boron Project
|
S-K 1300 Technical Report Summary
|
|
Serial Number
|
Claim
Name
|
Acres
|
Date Of
Location
|
Claim
Group
|
Serial Number
|
Claim
Name
|
Acres
|
Date Of
Location
|
Claim
Group
|
Serial Number
|
Claim
Name
|
Acres
|
Date Of
Location
|
Claim
Group
|
Serial Number
|
Claim
Name
|
Acres
|
Date Of
Location
|
Claim
Group
|
|||
|
NV101868927
|
RR 1
|
20.66
|
9/2/2018
|
RR
|
NV101716114
|
RR 53
|
20.66
|
8/25/2018
|
RR
|
NV101741360
|
SLB 26
|
20.66
|
12/2/2015
|
SLB
|
NV101784834
|
SLB 78
|
20.66
|
4/28/2016
|
SLB
|
|||
|
NV101868928
|
RR 2
|
20.66
|
9/2/2018
|
RR
|
NV101716115
|
RR 54
|
20.66
|
8/25/2018
|
RR
|
NV101741361
|
SLB 27
|
20.66
|
12/2/2015
|
SLB
|
NV101784835
|
SLB 79
|
20.66
|
4/28/2016
|
SLB
|
|||
|
NV101868929
|
RR 3
|
20.66
|
9/2/2018
|
RR
|
NV101716116
|
RR 55
|
20.66
|
8/25/2018
|
RR
|
NV101741362
|
SLB 28
|
20.66
|
12/2/2015
|
SLB
|
NV101784836
|
SLB 80
|
20.66
|
4/28/2016
|
SLB
|
|||
|
NV101868930
|
RR 4
|
20.66
|
9/2/2018
|
RR
|
NV101868917
|
RR 56
|
20.66
|
8/25/2018
|
RR
|
NV101741363
|
SLB 29
|
20.66
|
12/2/2015
|
SLB
|
NV101784837
|
SLB 81
|
20.66
|
4/28/2016
|
SLB
|
|||
|
NV101868931
|
RR 5
|
20.66
|
9/2/2018
|
RR
|
NV101868918
|
RR 57
|
20.66
|
8/25/2018
|
RR
|
NV101741364
|
SLB 30
|
20.66
|
12/2/2015
|
SLB
|
NV101784838
|
SLB 82
|
20.66
|
4/28/2016
|
SLB
|
|||
|
NV101868932
|
RR 6
|
20.66
|
9/2/2018
|
RR
|
NV101868919
|
RR 58
|
20.66
|
8/25/2018
|
RR
|
NV101741365
|
SLB 31
|
20.66
|
12/2/2015
|
SLB
|
NV101784839
|
SLB 83
|
20.66
|
4/28/2016
|
SLB
|
|||
|
NV101868933
|
RR 7
|
20.66
|
9/2/2018
|
RR
|
NV101868920
|
RR 59
|
20.66
|
8/25/2018
|
RR
|
NV101741366
|
SLB 32
|
20.66
|
12/2/2015
|
SLB
|
NV101784840
|
SLB 84
|
20.66
|
4/28/2016
|
SLB
|
|||
|
NV101868934
|
RR 8
|
20.66
|
9/2/2018
|
RR
|
NV101868921
|
RR 60
|
20.66
|
8/25/2018
|
RR
|
NV101741367
|
SLB 33
|
20.66
|
12/3/2015
|
SLB
|
NV101784841
|
SLB 85
|
20.66
|
4/28/2016
|
SLB
|
|||
|
NV101868935
|
RR 9
|
20.66
|
9/2/2018
|
RR
|
NV101868922
|
RR 61
|
10.33
|
8/25/2018
|
RR
|
NV101741368
|
SLB 34
|
20.66
|
12/3/2015
|
SLB
|
NV101784842
|
SLB 86
|
20.66
|
4/28/2016
|
SLB
|
|||
|
NV101868936
|
RR 10
|
20.66
|
9/2/2018
|
RR
|
NV101868923
|
RR 62
|
10.33
|
8/25/2018
|
RR
|
NV101741369
|
SLB 35
|
20.66
|
12/3/2015
|
SLB
|
NV101784843
|
SLB 87
|
20.66
|
4/28/2016
|
SLB
|
|||
|
NV101868937
|
RR 11
|
20.66
|
9/2/2018
|
RR
|
NV101868924
|
RR 63
|
10.33
|
8/25/2018
|
RR
|
NV101741370
|
SLB 36
|
20.66
|
12/3/2015
|
SLB
|
NV101784844
|
SLB 88
|
20.66
|
4/28/2016
|
SLB
|
|||
|
NV101870117
|
RR 12
|
20.66
|
9/2/2018
|
RR
|
NV101868925
|
RR 64
|
10.33
|
8/25/2018
|
RR
|
NV101741371
|
SLB 37
|
20.66
|
12/3/2015
|
SLB
|
NV101784845
|
SLB 89
|
20.66
|
4/28/2016
|
SLB
|
|||
|
NV101870118
|
RR 13
|
20.66
|
9/2/2018
|
RR
|
NV101868926
|
RR 65
|
10.33
|
8/25/2018
|
RR
|
NV101741372
|
SLB 38
|
20.66
|
12/3/2015
|
SLB
|
NV101786020
|
SLB 90
|
20.66
|
4/28/2016
|
SLB
|
|||
|
NV101870119
|
RR 14
|
20.66
|
9/2/2018
|
RR
|
NV105810398
|
RR 66
|
20.66
|
11/03/2022
|
RR
|
NV101741373
|
SLB 39
|
20.66
|
12/3/2015
|
SLB
|
NV101786021
|
SLB 91
|
20.66
|
4/28/2016
|
SLB
|
|||
|
NV101870120
|
RR 15
|
20.66
|
9/2/2018
|
RR
|
NV105810399
|
RR 67
|
20.66
|
11/03/2022
|
RR
|
NV101741690
|
SLB 40
|
20.66
|
12/3/2015
|
SLB
|
NV101786022
|
SLB 92
|
20.66
|
4/28/2016
|
SLB
|
|||
|
NV101870121
|
RR 16
|
20.66
|
9/2/2018
|
RR
|
NV105810400
|
RR 68
|
20.66
|
11/03/2022
|
RR
|
NV101741691
|
SLB 41
|
20.66
|
12/2/2015
|
SLB
|
NV101786023
|
SLB 93
|
20.66
|
4/28/2016
|
SLB
|
|||
|
NV101870122
|
RR 17
|
20.66
|
9/2/2018
|
RR
|
NV105810401
|
RR 69
|
20.66
|
11/03/2022
|
RR
|
NV101741692
|
SLB 42
|
20.66
|
12/2/2015
|
SLB
|
NV101786024
|
SLB 94
|
20.66
|
4/28/2016
|
SLB
|
|||
|
NV101870123
|
RR 18
|
20.66
|
9/2/2018
|
RR
|
NV105810402
|
RR 70
|
20.66
|
11/03/2022
|
RR
|
NV101741693
|
SLB 43
|
20.66
|
12/3/2015
|
SLB
|
NV101786025
|
SLB 95
|
20.66
|
4/28/2016
|
SLB
|
|||
|
NV101714938
|
RR 19
|
20.66
|
8/26/2018
|
RR
|
NV105810403
|
RR 71
|
20.66
|
11/03/2022
|
RR
|
NV101741694
|
SLB 44
|
20.66
|
12/3/2015
|
SLB
|
NV101786026
|
SLB 96
|
20.66
|
4/28/2016
|
SLB
|
|||
|
NV101714939
|
RR 20
|
20.66
|
8/26/2018
|
RR
|
NV105810404
|
RR 72
|
20.66
|
11/03/2022
|
RR
|
NV101741695
|
SLB 45
|
20.66
|
12/3/2015
|
SLB
|
NV101786027
|
SLB 97
|
20.66
|
4/28/2016
|
SLB
|
|||
|
NV101714940
|
RR 21
|
20.66
|
8/26/2018
|
RR
|
NV105810405
|
RR 73
|
20.66
|
11/03/2022
|
RR
|
NV101741696
|
SLB 46
|
20.66
|
12/3/2015
|
SLB
|
NV101786028
|
SLB-98
|
20.66
|
4/28/2016
|
SLB
|
|||
|
NV101714941
|
RR 22
|
20.66
|
8/26/2018
|
RR
|
NV105810406
|
RR 74
|
20.66
|
11/04/2022
|
RR
|
NV101741697
|
SLB 47
|
20.66
|
12/3/2015
|
SLB
|
NV101786029
|
SLB 99
|
20.66
|
4/28/2016
|
SLB
|
|||
|
NV101714942
|
RR 23
|
10.33
|
8/26/2018
|
RR
|
NV105810407
|
RR 75
|
20.66
|
11/03/2022
|
RR
|
NV101741698
|
SLB 48
|
20.66
|
12/3/2015
|
SLB
|
NV101786030
|
SLB 100
|
20.66
|
4/28/2016
|
SLB
|
|||
|
NV101714943
|
RR 25b
|
10.33
|
8/26/2018
|
RR
|
NV105810408
|
RR 76
|
20.66
|
11/04/2022
|
RR
|
NV101783654
|
SLB-49
|
20.66
|
4/28/2016
|
SLB
|
NV101786031
|
SLB 101
|
20.66
|
4/28/2016
|
SLB
|
|||
|
NV101714944
|
RR 25
|
3.44
|
8/25/2018
|
RR
|
NV105810409
|
RR 77
|
20.66
|
11/04/2022
|
RR
|
NV101783655
|
SLB-50
|
20.66
|
4/28/2016
|
SLB
|
NV101786032
|
SLB 102
|
20.66
|
4/28/2016
|
SLB
|
|||
|
NV101714945
|
RR 26
|
3.44
|
8/25/2018
|
RR
|
NV105810410
|
RR 78
|
20.66
|
11/04/2022
|
RR
|
NV101783656
|
SLB-51
|
20.66
|
4/28/2016
|
SLB
|
NV101786033
|
SLB 103
|
20.66
|
4/28/2016
|
SLB
|
|||
|
NV101714946
|
RR 27
|
20.66
|
8/25/2018
|
RR
|
NV105810411
|
RR 79
|
20.66
|
11/03/2022
|
RR
|
NV101783657
|
SLB-52
|
20.66
|
4/28/2016
|
SLB
|
NV101786034
|
SLB 104
|
20.66
|
4/28/2016
|
SLB
|
|||
|
NV101714947
|
RR 28
|
20.66
|
8/25/2018
|
RR
|
NV101740707
|
SLB 1
|
20.66
|
12/2/2015
|
SLB
|
NV101783658
|
SLB 53
|
20.66
|
4/28/2016
|
SLB
|
NV101786035
|
SLB 105
|
20.66
|
4/28/2016
|
SLB
|
|||
|
NV101714948
|
RR 29
|
20.66
|
8/25/2018
|
RR
|
NV101740708
|
SLB 2
|
20.66
|
12/2/2015
|
SLB
|
NV101783659
|
SLB 54
|
20.66
|
4/28/2016
|
SLB
|
NV101786036
|
SLB 106
|
20.66
|
4/28/2016
|
SLB
|
|||
|
NV101714949
|
RR 30
|
20.66
|
8/25/2018
|
RR
|
NV101740709
|
SLB 3
|
20.66
|
12/2/2015
|
SLB
|
NV101783660
|
SLB 55
|
20.66
|
4/28/2016
|
SLB
|
NV101786037
|
SLB 107
|
20.66
|
4/28/2016
|
SLB
|
|||
|
NV101714950
|
RR 31
|
20.66
|
8/25/2018
|
RR
|
NV101740710
|
SLB 4
|
20.66
|
12/2/2015
|
SLB
|
NV101783661
|
SLB 56
|
20.66
|
4/28/2016
|
SLB
|
NV101786038
|
SLB 108
|
20.66
|
4/28/2016
|
SLB
|
|||
|
NV101714951
|
RR 32
|
20.66
|
8/25/2018
|
RR
|
NV101740711
|
SLB 5
|
20.66
|
12/2/2015
|
SLB
|
NV101783662
|
SLB 57
|
20.66
|
4/28/2016
|
SLB
|
NV101786039
|
SLB 109
|
20.66
|
4/28/2016
|
SLB
|
|||
|
NV101714952
|
RR 33
|
20.66
|
8/26/2018
|
RR
|
NV101740712
|
SLB 6
|
20.66
|
12/2/2015
|
SLB
|
NV101783663
|
SLB 58
|
20.66
|
4/28/2016
|
SLB
|
NV101737172
|
SLB 110
|
20.66
|
5/26/2017
|
SLB
|
|||
|
NV101714953
|
RR 34
|
20.66
|
8/26/2018
|
RR
|
NV101740713
|
SLB 7
|
20.66
|
12/2/2015
|
SLB
|
NV101783664
|
SLB 59
|
20.66
|
4/28/2016
|
SLB
|
NV101737173
|
SLB 111
|
20.66
|
5/26/2017
|
SLB
|
|||
|
NV101716096
|
RR 35
|
20.66
|
8/25/2018
|
RR
|
NV101740714
|
SLB 8
|
20.66
|
12/2/2015
|
SLB
|
NV101783665
|
SLB 60
|
20.66
|
4/28/2016
|
SLB
|
NV101737174
|
SLB 112
|
20.66
|
5/26/2017
|
SLB
|
|||
|
NV101716097
|
RR 36
|
20.66
|
8/25/2018
|
RR
|
NV101740715
|
SLB 9
|
20.66
|
12/2/2015
|
SLB
|
NV101783666
|
SLB 61
|
20.66
|
4/28/2016
|
SLB
|
NV101737175
|
SLB 113
|
20.66
|
5/26/2017
|
SLB
|
|||
|
NV101716098
|
RR 37
|
20.66
|
8/25/2018
|
RR
|
NV101740716
|
SLB 10
|
20.66
|
12/2/2015
|
SLB
|
NV101783667
|
SLB 62
|
20.66
|
4/28/2016
|
SLB
|
NV101737176
|
SLB 114
|
20.66
|
5/26/2017
|
SLB
|
|||
|
NV101716099
|
RR 38
|
20.66
|
8/25/2018
|
RR
|
NV101740717
|
SLB 11
|
20.66
|
12/2/2015
|
SLB
|
NV101783668
|
SLB 63
|
20.66
|
4/28/2016
|
SLB
|
NV101737177
|
SLB 115
|
20.66
|
5/26/2017
|
SLB
|
|||
|
NV101716100
|
RR 39
|
20.66
|
8/25/2018
|
RR
|
NV101740718
|
SLB 12
|
20.66
|
12/2/2015
|
SLB
|
NV101783669
|
SLB 64
|
20.66
|
4/28/2016
|
SLB
|
NV101737178
|
SLB 116
|
20.66
|
5/26/2017
|
SLB
|
|||
|
NV101716101
|
RR 40
|
20.66
|
8/25/2018
|
RR
|
NV101740719
|
SLB 13
|
20.66
|
12/2/2015
|
SLB
|
NV101783670
|
SLB 65
|
20.66
|
4/28/2016
|
SLB
|
NV101737179
|
SLB 117
|
20.66
|
5/26/2017
|
SLB
|
|||
|
NV101716102
|
RR 41
|
20.66
|
8/25/2018
|
RR
|
NV101740720
|
SLB 14
|
20.66
|
12/2/2015
|
SLB
|
NV101783671
|
SLB 66
|
20.66
|
4/28/2016
|
SLB
|
NV101738169
|
SLB 118
|
20.66
|
5/26/2017
|
SLB
|
|||
|
NV101716103
|
RR 42
|
20.66
|
8/25/2018
|
RR
|
NV101740721
|
SLB 15
|
20.66
|
12/2/2015
|
SLB
|
NV101783672
|
SLB 67
|
20.66
|
4/28/2016
|
SLB
|
NV101738170
|
SLB 119
|
20.66
|
5/26/2017
|
SLB
|
|||
|
NV101716104
|
RR 43
|
20.66
|
8/25/2018
|
RR
|
NV101740722
|
SLB 16
|
20.66
|
12/2/2015
|
SLB
|
NV101783673
|
SLB 68
|
20.66
|
4/28/2016
|
SLB
|
NV101738171
|
SLB 120
|
20.66
|
5/26/2017
|
SLB
|
|||
|
NV101716105
|
RR 44
|
20.66
|
8/25/2018
|
RR
|
NV101740723
|
SLB 17
|
20.66
|
12/2/2015
|
SLB
|
NV101784825
|
SLB 69
|
20.66
|
4/28/2016
|
SLB
|
NV101738172
|
SLB 121
|
20.66
|
5/25/2017
|
SLB
|
|||
|
NV101716106
|
RR 45
|
20.66
|
8/25/2018
|
RR
|
NV101740724
|
SLB 18
|
20.66
|
12/2/2015
|
SLB
|
NV101784826
|
SLB 70
|
20.66
|
4/28/2016
|
SLB
|
NV101738175
|
SLB 124
|
20.66
|
5/25/2017
|
SLB
|
|||
|
NV101716107
|
RR 46
|
20.66
|
8/25/2018
|
RR
|
NV101741353
|
SLB 19
|
20.66
|
12/2/2015
|
SLB
|
NV101784827
|
SLB 71
|
20.66
|
4/28/2016
|
SLB
|
NV101738176
|
SLB 125
|
20.66
|
5/25/2017
|
SLB
|
|||
|
NV101716108
|
RR 47
|
20.66
|
8/25/2018
|
RR
|
NV101741354
|
SLB 20
|
20.66
|
12/2/2015
|
SLB
|
NV101784828
|
SLB 72
|
20.66
|
4/28/2016
|
SLB
|
NV101738177
|
SLB 126
|
20.66
|
5/25/2017
|
SLB
|
|||
|
NV101716109
|
RR 48
|
20.66
|
8/25/2018
|
RR
|
NV101741355
|
SLB 21
|
20.66
|
12/2/2015
|
SLB
|
NV101784829
|
SLB 73
|
20.66
|
4/28/2016
|
SLB
|
NV101738178
|
SLB 127
|
20.66
|
5/26/2017
|
SLB
|
|||
|
NV101716110
|
RR 49
|
20.66
|
8/25/2018
|
RR
|
NV101741356
|
SLB 22
|
20.66
|
12/2/2015
|
SLB
|
NV101784830
|
SLB 74
|
20.66
|
4/28/2016
|
SLB
|
NV101738179
|
SLB 128
|
20.66
|
5/26/2017
|
SLB
|
|||
|
NV101716111
|
RR 50
|
20.66
|
8/25/2018
|
RR
|
NV101741357
|
SLB 23
|
20.66
|
12/2/2015
|
SLB
|
NV101784831
|
SLB 75
|
20.66
|
4/28/2016
|
SLB
|
NV101738180
|
SLB 129
|
20.66
|
5/26/2017
|
SLB
|
|||
|
NV101716112
|
RR 51
|
20.66
|
8/25/2018
|
RR
|
NV101741358
|
SLB 24
|
20.66
|
12/2/2015
|
SLB
|
NV101784832
|
SLB 76
|
20.66
|
4/28/2016
|
SLB
|
NV101570767
|
SLB 130
|
20.66
|
11/3/2017
|
SLB
|
|||
|
NV101716113
|
RR 52
|
20.66
|
8/25/2018
|
RR
|
NV101741359
|
SLB 25
|
20.66
|
12/2/2015
|
SLB
|
NV101784833
|
SLB 77
|
20.66
|
4/28/2016
|
SLB
|
NV101570768
|
SLB 131
|
20.66
|
11/3/2017
|
SLB
|
|
|
3-4 |
30 SEPTEMBER 2025
|
|
Rhyolite Ridge Lithium-Boron Project
|
S-K 1300 Technical Report Summary
|
|
Serial Number
|
Claim
Nam
|
Acres
|
Date Of
Location
|
Claim
Group
|
Serial Number
|
Claim
Name
|
Acres
|
Date Of
Location
|
Claim
Group
|
Serial Number
|
Claim
Name
|
Acres
|
Date Of
Location
|
Claim
Group
|
Serial Number
|
Claim
Name
|
Acres
|
Date Of
Location
|
Claim
Group
|
|||
|
NV101570769
|
SLB 132
|
20.66
|
11/3/2017
|
SLB
|
NV101784962
|
SLB 188
|
20.66
|
11/5/2017
|
SLB
|
NV101834311
|
SLM 24
|
20.66
|
4/9/2018
|
SLM
|
NV101835560
|
SLM 78
|
20.66
|
4/9/2018
|
SLM
|
|||
|
NV101570770
|
SLB 133
|
20.66
|
11/3/2017
|
SLB
|
NV101784963
|
SLB 189
|
20.66
|
11/5/2017
|
SLB
|
NV101834312
|
SLM 25
|
20.66
|
4/9/2018
|
SLM
|
NV101835561
|
SLM 79
|
20.66
|
4/9/2018
|
SLM
|
|||
|
NV101570771
|
SLB 134
|
20.66
|
11/3/2017
|
SLB
|
NV101784964
|
SLB 190
|
20.66
|
11/5/2017
|
SLB
|
NV101834313
|
SLM 26
|
20.66
|
4/9/2018
|
SLM
|
NV101835562
|
SLM 80
|
20.66
|
4/9/2018
|
SLM
|
|||
|
NV101570772
|
SLB 135
|
20.66
|
11/3/2017
|
SLB
|
NV101784965
|
SLB 191
|
20.66
|
11/5/2017
|
SLB
|
NV101834401
|
SLM 27
|
20.66
|
4/9/2018
|
SLM
|
NV101835563
|
SLM 81
|
20.66
|
4/9/2018
|
SLM
|
|||
|
NV101570773
|
SLB 136
|
20.66
|
11/3/2017
|
SLB
|
NV101784966
|
SLB 192
|
20.66
|
11/5/2017
|
SLB
|
NV101834402
|
SLM 28
|
20.66
|
4/9/2018
|
SLM
|
NV101836148
|
SLM 82
|
20.66
|
4/9/2018
|
SLM
|
|||
|
NV101570774
|
SLB 137
|
20.66
|
11/3/2017
|
SLB
|
NV101784967
|
SLB 193
|
20.66
|
11/5/2017
|
SLB
|
NV101834403
|
SLM 29
|
20.66
|
4/9/2018
|
SLM
|
NV101836149
|
SLM 83
|
20.66
|
4/10/2018
|
SLM
|
|||
|
NV101570775
|
SLB 138
|
20.66
|
11/3/2017
|
SLB
|
NV101784968
|
SLB 194
|
20.66
|
11/5/2017
|
SLB
|
NV101834404
|
SLM 30
|
20.66
|
4/9/2018
|
SLM
|
NV101836150
|
SLM 84
|
20.66
|
4/10/2018
|
SLM
|
|||
|
NV101570776
|
SLB 139
|
20.66
|
11/3/2017
|
SLB
|
NV101784969
|
SLB 195
|
20.66
|
11/5/2017
|
SLB
|
NV101834405
|
SLM 31
|
20.66
|
4/9/2018
|
SLM
|
NV101836151
|
SLM 85
|
20.66
|
4/10/2018
|
SLM
|
|||
|
NV101570777
|
SLB 140
|
20.66
|
11/3/2017
|
SLB
|
NV101784970
|
SLB 196
|
20.66
|
11/5/2017
|
SLB
|
NV101834406
|
SLM 32
|
20.66
|
4/9/2018
|
SLM
|
NV101836152
|
SLM 86
|
20.66
|
4/10/2018
|
SLM
|
|||
|
NV101570778
|
SLB 141
|
20.66
|
11/3/2017
|
SLB
|
NV101784971
|
SLB 197
|
20.66
|
11/5/2017
|
SLB
|
NV101834407
|
SLM 33
|
20.66
|
4/9/2018
|
SLM
|
NV101836153
|
SLM 87
|
20.66
|
4/10/2018
|
SLM
|
|||
|
NV101570779
|
SLB 142
|
20.66
|
11/3/2017
|
SLB
|
NV101784972
|
SLB 198
|
20.66
|
11/5/2017
|
SLB
|
NV101834408
|
SLM 34
|
20.66
|
4/9/2018
|
SLM
|
NV101836154
|
SLM 88
|
20.66
|
4/10/2018
|
SLM
|
|||
|
NV101782359
|
SLB 143
|
20.66
|
11/3/2017
|
SLB
|
NV101784973
|
SLB 199
|
20.66
|
11/5/2017
|
SLB
|
NV101834409
|
SLM 35
|
20.66
|
4/9/2018
|
SLM
|
NV101836155
|
SLM 89
|
20.66
|
4/10/2018
|
SLM
|
|||
|
NV101782360
|
SLB 144
|
20.66
|
11/4/2017
|
SLB
|
NV105809159
|
SLB 200
|
20.66
|
11/3/2022
|
SLB
|
NV101834410
|
SLM 36
|
20.66
|
4/9/2018
|
SLM
|
NV101836156
|
SLM 90
|
20.66
|
4/10/2018
|
SLM
|
|||
|
NV101782361
|
SLB 145
|
20.66
|
11/4/2017
|
SLB
|
NV105809160
|
SLB 201
|
20.66
|
11/3/2022
|
SLB
|
NV101834411
|
SLM 37
|
20.66
|
4/9/2018
|
SLM
|
NV101836157
|
SLM 91
|
20.66
|
4/10/2018
|
SLM
|
|||
|
NV101782362
|
SLB 146
|
20.66
|
11/4/2017
|
SLB
|
NV105809161
|
SLB 202
|
20.66
|
11/3/2022
|
SLB
|
NV101834412
|
SLM 38
|
20.66
|
4/9/2018
|
SLM
|
NV101836158
|
SLM 92
|
20.66
|
4/10/2018
|
SLM
|
|||
|
NV101782363
|
SLB 147
|
20.66
|
11/4/2017
|
SLB
|
NV105809162
|
SLB 203
|
20.66
|
11/4/2022
|
SLB
|
NV101834413
|
SLM 39
|
20.66
|
4/9/2018
|
SLM
|
NV101836159
|
SLM 93
|
20.66
|
4/10/2018
|
SLM
|
|||
|
NV101782364
|
SLB 148
|
20.66
|
11/3/2017
|
SLB
|
NV105809163
|
SLB 204
|
20.66
|
11/4/2022
|
SLB
|
NV101834907
|
SLM 40
|
20.66
|
4/9/2018
|
SLM
|
NV101836160
|
SLM 94
|
20.66
|
4/10/2018
|
SLM
|
|||
|
NV101782365
|
SLB 149
|
20.66
|
11/4/2017
|
SLB
|
NV105809164
|
SLB 205
|
20.66
|
11/5/2022
|
SLB
|
NV101834908
|
SLM 41
|
20.66
|
4/9/2018
|
SLM
|
NV101836161
|
SLM 95
|
20.66
|
4/10/2018
|
SLM
|
|||
|
NV101782366
|
SLB 150
|
20.66
|
11/3/2017
|
SLB
|
NV105809165
|
SLB 206
|
20.66
|
11/4/2022
|
SLB
|
NV101834909
|
SLM 42
|
20.66
|
4/9/2018
|
SLM
|
NV101836162
|
SLM 96
|
20.66
|
4/10/2018
|
SLM
|
|||
|
NV101782367
|
SLB 151
|
20.66
|
11/3/2017
|
SLB
|
NV105809166
|
SLB 207
|
20.66
|
11/5/2022
|
SLB
|
NV101834910
|
SLM 43
|
20.66
|
4/9/2018
|
SLM
|
NV101836163
|
SLM 97
|
20.66
|
4/10/2018
|
SLM
|
|||
|
NV101782368
|
SLB 152
|
20.66
|
11/2/2017
|
SLB
|
NV105809167
|
SLB 208
|
20.66
|
11/4/2022
|
SLB
|
NV101834911
|
SLM 44
|
20.66
|
4/9/2018
|
SLM
|
NV101836164
|
SLM 98
|
20.66
|
4/10/2018
|
SLM
|
|||
|
NV101782369
|
SLB 153
|
20.66
|
11/2/2017
|
SLB
|
NV105809168
|
SLB 209
|
20.66
|
11/5/2022
|
SLB
|
NV101834912
|
SLM 45
|
20.66
|
4/11/2018
|
SLM
|
NV101836165
|
SLM 99
|
20.66
|
4/10/2018
|
SLM
|
|||
|
NV101782370
|
SLB 154
|
20.66
|
11/2/2017
|
SLB
|
NV105809169
|
SLB 210
|
20.66
|
11/5/2022
|
SLB
|
NV101834913
|
SLM 46
|
20.66
|
4/11/2018
|
SLM
|
NV101836749
|
SLM 100
|
20.66
|
4/10/2018
|
SLM
|
|||
|
NV101782371
|
SLB 155
|
20.66
|
11/2/2017
|
SLB
|
NV105809170
|
SLB 211
|
20.66
|
11/5/2022
|
SLB
|
NV101834914
|
SLM 47
|
20.66
|
4/11/2018
|
SLM
|
NV101836750
|
SLM 101
|
20.66
|
4/10/2018
|
SLM
|
|||
|
NV101782372
|
SLB 156
|
20.66
|
11/2/2017
|
SLB
|
NV105809171
|
SLB 212
|
20.66
|
11/4/2022
|
SLB
|
NV101834915
|
SLM 48
|
20.66
|
4/11/2018
|
SLM
|
NV101836751
|
SLM 102
|
20.66
|
4/10/2018
|
SLM
|
|||
|
NV101782373
|
SLB 157
|
20.66
|
11/2/2017
|
SLB
|
NV105809172
|
SLB 213
|
20.66
|
11/5/2022
|
SLB
|
NV101834916
|
SLM 49
|
20.66
|
4/11/2018
|
SLM
|
NV101836752
|
SLM 103
|
20.66
|
4/10/2018
|
SLM
|
|||
|
NV101782374
|
SLB 158
|
20.66
|
11/2/2017
|
SLB
|
NV105809173
|
SLB 214
|
20.66
|
11/4/2022
|
SLB
|
NV101834917
|
SLM 50
|
20.66
|
4/11/2018
|
SLM
|
NV101836753
|
SLM 104
|
20.66
|
4/10/2018
|
SLM
|
|||
|
NV101782375
|
SLB 159
|
20.66
|
11/2/2017
|
SLB
|
NV105809174
|
SLB 215
|
20.66
|
11/5/2022
|
SLB
|
NV101834918
|
SLM 51
|
20.66
|
4/9/2018
|
SLM
|
NV101836754
|
SLM 105
|
20.66
|
4/10/2018
|
SLM
|
|||
|
NV101782376
|
SLB 160
|
20.66
|
11/2/2017
|
SLB
|
NV105809175
|
SLB 216
|
20.66
|
11/3/2022
|
SLB
|
NV101834919
|
SLM 52
|
20.66
|
4/9/2018
|
SLM
|
NV101836755
|
SLM 106
|
20.66
|
4/10/2018
|
SLM
|
|||
|
NV101782377
|
SLB 161
|
20.66
|
11/6/2017
|
SLB
|
NV105809176
|
SLB 217
|
20.66
|
11/4/2022
|
SLB
|
NV101834920
|
SLM 53
|
20.66
|
4/9/2018
|
SLM
|
NV101836756
|
SLM 107
|
6.89
|
4/10/2018
|
SLM
|
|||
|
NV101782378
|
SLB 162
|
20.66
|
11/2/2017
|
SLB
|
NV101833819
|
SLM 1
|
20.66
|
4/9/2018
|
SLM
|
NV101834921
|
SLM 54
|
20.66
|
4/9/2018
|
SLM
|
NV101836757
|
SLM 108
|
20.66
|
4/10/2018
|
SLM
|
|||
|
NV101782379
|
SLB 163
|
20.66
|
11/2/2017
|
SLB
|
NV101833820
|
SLM 2
|
20.66
|
4/9/2018
|
SLM
|
NV101834922
|
SLM 55
|
20.66
|
4/9/2018
|
SLM
|
NV101836758
|
SLM 109
|
20.66
|
4/10/2018
|
SLM
|
|||
|
NV101783581
|
SLB 164
|
20.66
|
11/2/2017
|
SLB
|
NV101833821
|
SLM 3
|
20.66
|
4/9/2018
|
SLM
|
NV101834923
|
SLM 56
|
20.66
|
4/9/2018
|
SLM
|
NV101836759
|
SLM 110
|
20.66
|
4/10/2018
|
SLM
|
|||
|
NV101783582
|
SLB 165
|
20.66
|
11/2/2017
|
SLB
|
NV101833822
|
SLM 4
|
20.66
|
4/9/2018
|
SLM
|
NV101834924
|
SLM 57
|
20.66
|
4/9/2018
|
SLM
|
NV101836760
|
SLM 111
|
20.66
|
4/10/2018
|
SLM
|
|||
|
NV101783583
|
SLB 166
|
20.66
|
11/2/2017
|
SLB
|
NV101833823
|
SLM 5
|
20.66
|
4/9/2018
|
SLM
|
NV101834925
|
SLM 58
|
20.66
|
4/9/2018
|
SLM
|
NV101836761
|
SLM 112
|
20.66
|
4/10/2018
|
SLM
|
|||
|
NV101783584
|
SLB 167
|
20.66
|
11/2/2017
|
SLB
|
NV101833824
|
SLM 6
|
20.66
|
4/9/2018
|
SLM
|
NV101834926
|
SLM 59
|
20.66
|
4/9/2018
|
SLM
|
NV101836762
|
SLM 113
|
20.66
|
4/10/2018
|
SLM
|
|||
|
NV101783585
|
SLB 168
|
20.66
|
11/2/2017
|
SLB
|
NV101833825
|
SLM 7
|
20.66
|
4/9/2018
|
SLM
|
NV101834927
|
SLM 60
|
20.66
|
4/9/2018
|
SLM
|
NV101836763
|
SLM 114
|
20.66
|
4/10/2018
|
SLM
|
|||
|
NV101783586
|
SLB 169
|
20.66
|
11/2/2017
|
SLB
|
NV101833826
|
SLM 8
|
20.66
|
4/9/2018
|
SLM
|
NV101835543
|
SLM 61
|
20.66
|
4/9/2018
|
SLM
|
NV101836764
|
SLM 115
|
20.66
|
4/10/2018
|
SLM
|
|||
|
NV101783587
|
SLB 170
|
20.66
|
11/2/2017
|
SLB
|
NV101833827
|
SLM 9
|
20.66
|
4/9/2018
|
SLM
|
NV101835544
|
SLM 62
|
20.66
|
4/9/2018
|
SLM
|
NV101836765
|
SLM 116
|
20.66
|
4/10/2018
|
SLM
|
|||
|
NV101783588
|
SLB 171
|
20.66
|
11/2/2017
|
SLB
|
NV101833828
|
SLM 10
|
20.66
|
4/9/2018
|
SLM
|
NV101835545
|
SLM 63
|
20.66
|
4/9/2018
|
SLM
|
NV101836766
|
SLM 117
|
20.66
|
4/10/2018
|
SLM
|
|||
|
NV101783591
|
SLB 174
|
20.66
|
11/2/2017
|
SLB
|
NV101833829
|
SLM 11
|
20.66
|
4/9/2018
|
SLM
|
NV101835546
|
SLM 64
|
20.66
|
4/9/2018
|
SLM
|
NV101836767
|
SLM 118
|
20.66
|
4/11/2018
|
SLM
|
|||
|
NV101783592
|
SLB 175
|
20.66
|
11/2/2017
|
SLB
|
NV101833829
|
SLM 11
|
20.66
|
4/9/2018
|
SLM
|
NV101835547
|
SLM 65
|
20.66
|
4/9/2018
|
SLM
|
NV101836768
|
SLM 119
|
20.66
|
4/11/2018
|
SLM
|
|||
|
NV101783593
|
SLB 176
|
13.77
|
11/2/2017
|
SLB
|
NV101833830
|
SLM 12
|
20.66
|
4/9/2018
|
SLM
|
NV101835548
|
SLM 66
|
20.66
|
4/9/2018
|
SLM
|
NV101836769
|
SLM 120
|
20.66
|
4/11/2018
|
SLM
|
|||
|
NV101783594
|
SLB 177
|
20.66
|
11/2/2017
|
SLB
|
NV101833831
|
SLM 13
|
20.66
|
4/9/2018
|
SLM
|
NV101835549
|
SLM 67
|
20.66
|
4/9/2018
|
SLM
|
NV101837342
|
SLM 121
|
5.165
|
4/11/2018
|
SLM
|
|||
|
NV101783595
|
SLB 178
|
20.66
|
11/2/2017
|
SLB
|
NV101833832
|
SLM 14
|
20.66
|
4/9/2018
|
SLM
|
NV101835550
|
SLM 68
|
20.66
|
4/9/2018
|
SLM
|
NV101837343
|
SLM 122
|
5.165
|
4/11/2018
|
SLM
|
|||
|
NV101783596
|
SLB 179
|
20.66
|
11/2/2017
|
SLB
|
NV101833833
|
SLM 15
|
20.66
|
4/9/2018
|
SLM
|
NV101835551
|
SLM 69
|
20.66
|
4/9/2018
|
SLM
|
||||||||
|
NV101783597
|
SLB 180
|
20.66
|
11/6/2017
|
SLB
|
NV101833834
|
SLM 16
|
20.66
|
4/9/2018
|
SLM
|
NV101835552
|
SLM 70
|
20.66
|
4/9/2018
|
SLM
|
||||||||
|
NV101783598
|
SLB 181
|
20.66
|
11/6/2017
|
SLB
|
NV101833835
|
SLM 17
|
20.66
|
4/9/2018
|
SLM
|
NV101835553
|
SLM 71
|
20.66
|
4/9/2018
|
SLM
|
||||||||
|
NV101783599
|
SLB 182
|
20.66
|
11/6/2017
|
SLB
|
NV101833836
|
SLM 18
|
20.66
|
4/9/2018
|
SLM
|
NV101835554
|
SLM 72
|
20.66
|
4/9/2018
|
SLM
|
||||||||
|
NV101783600
|
SLB 183
|
20.66
|
11/6/2017
|
SLB
|
NV101834306
|
SLM 19
|
20.66
|
4/9/2018
|
SLM
|
NV101835555
|
SLM 73
|
20.66
|
4/9/2018
|
SLM
|
||||||||
|
NV101783779
|
SLB 184
|
20.66
|
11/6/2017
|
SLB
|
NV101834307
|
SLM 20
|
20.66
|
4/9/2018
|
SLM
|
NV101835556
|
SLM 74
|
20.66
|
4/9/2018
|
SLM
|
||||||||
|
NV101784959
|
SLB 185
|
20.66
|
11/6/2017
|
SLB
|
NV101834308
|
SLM 21
|
20.66
|
4/9/2018
|
SLM
|
NV101835557
|
SLM 75
|
20.66
|
4/9/2018
|
SLM
|
||||||||
|
NV101784960
|
SLB 186
|
20.66
|
11/5/2017
|
SLB
|
NV101834309
|
SLM 22
|
20.66
|
4/9/2018
|
SLM
|
NV101835558
|
SLM 76
|
20.66
|
4/9/2018
|
SLM
|
||||||||
|
NV101784961
|
SLB 187
|
20.66
|
11/5/2017
|
SLB
|
NV101834310
|
SLM 23
|
20.66
|
4/9/2018
|
SLM
|
NV101835559
|
SLM 77
|
20.66
|
4/9/2018
|
SLM
|
|
|
3-5 |
30 SEPTEMBER 2025
|
|
Rhyolite Ridge Lithium-Boron Project
|
S-K 1300 Technical Report Summary
|
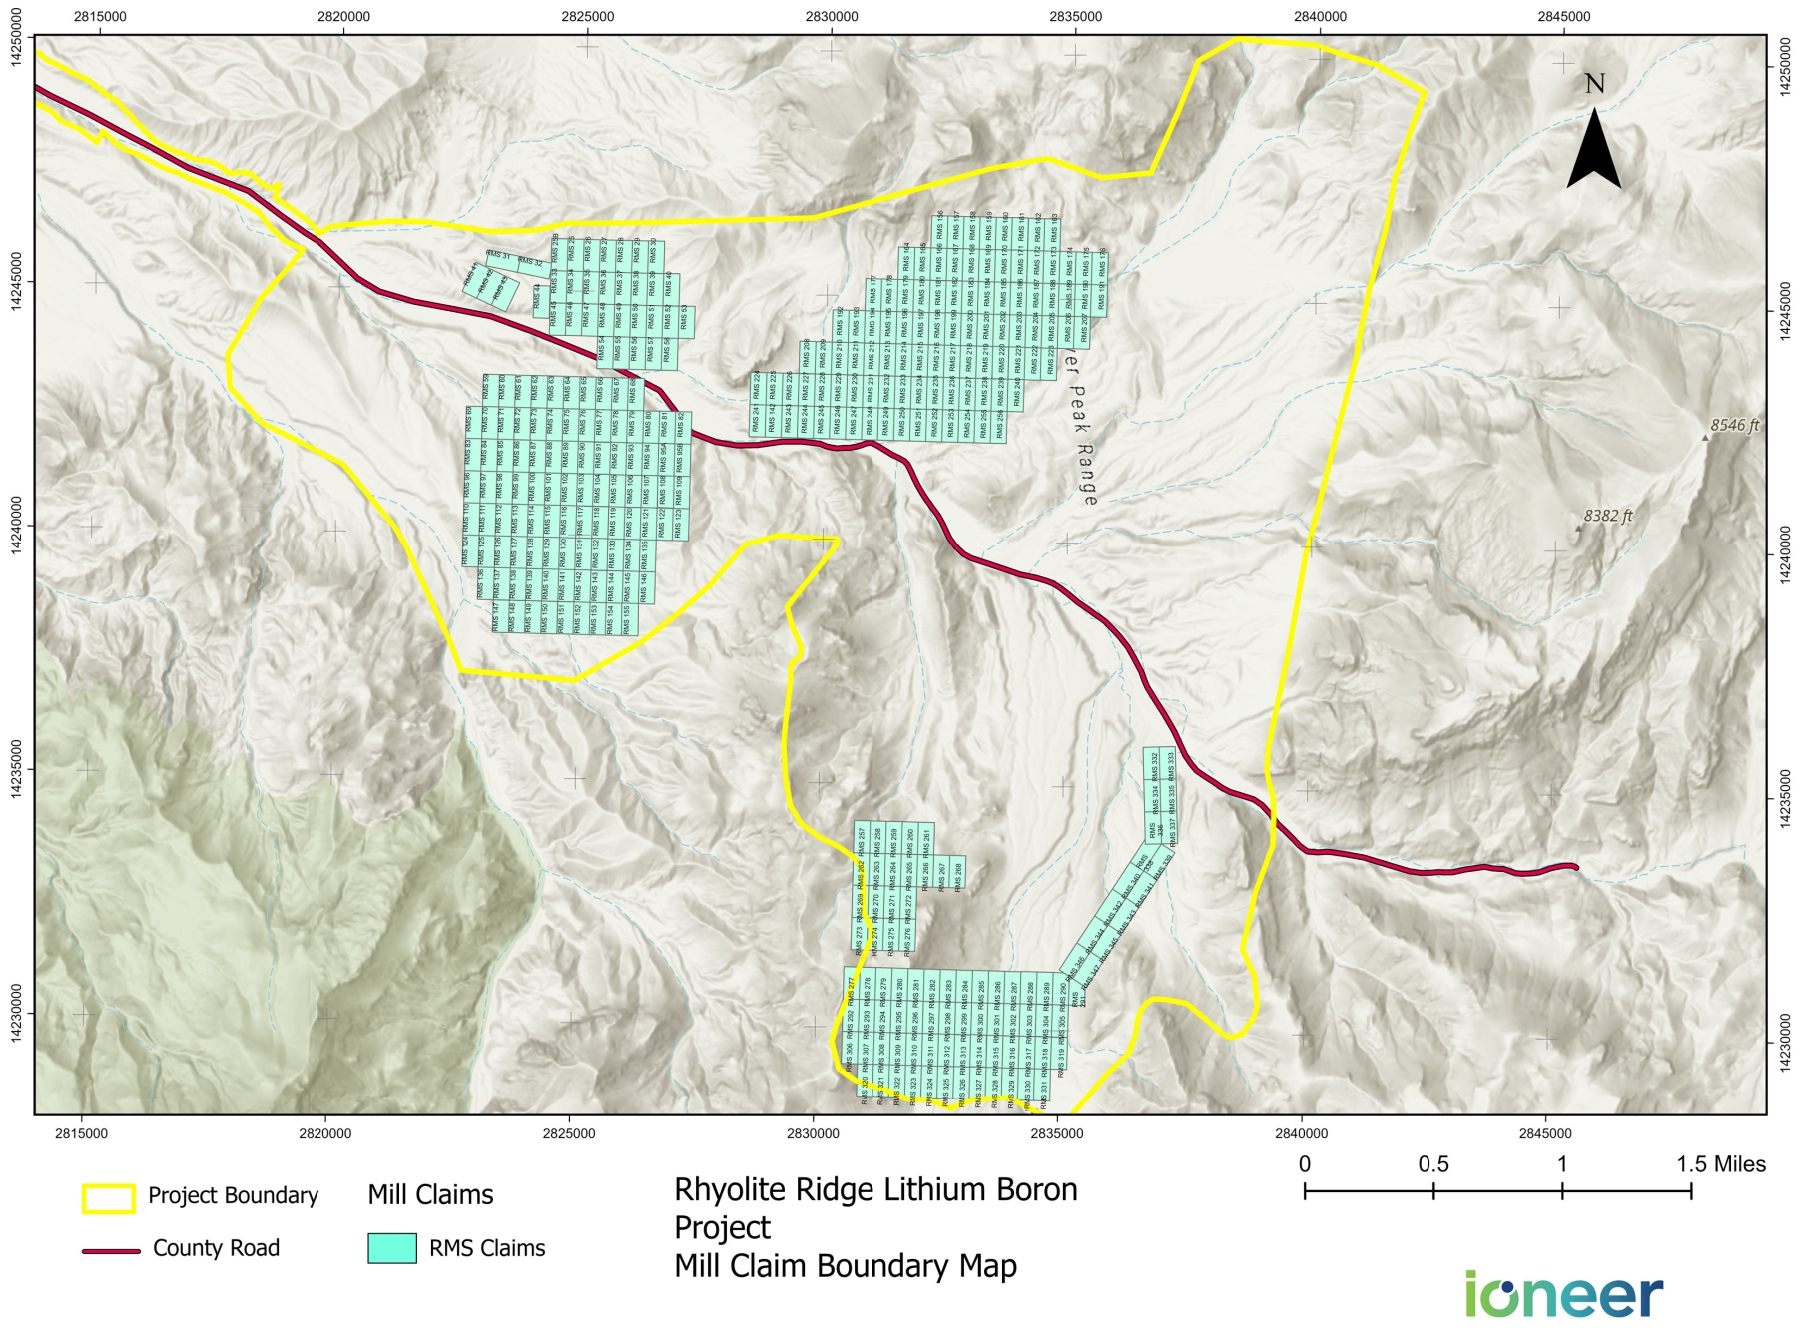
|
|
3-6 |
30 SEPTEMBER 2025
|
|
Rhyolite Ridge Lithium-Boron Project
|
S-K 1300 Technical Report Summary
|
|
Serial Number
|
Claim Name
|
Acres
|
Date Of
Location
|
Serial Number
|
Claim
Name
|
Acres
|
Date Of
Location
|
Serial Number
|
Claim
Name
|
Acres
|
Date Of
Location
|
Serial Number
|
Claim
Name
|
Acres
|
Date Of
Location
|
|||
|
NV105272779
|
RMS 1
|
5
|
10/3/2021
|
NV106354242
|
RMS 50
|
5
|
12/27/2023
|
NV106354290
|
RMS 98
|
5
|
12/28/2023
|
NV106354340
|
RMS 147
|
5
|
12/28/2023
|
|||
|
NV105272780
|
RMS 2
|
5
|
10/3/2021
|
NV106354243
|
RMS 51
|
5
|
12/27/2023
|
NV106354291
|
RMS 99
|
5
|
12/28/2023
|
NV106354341
|
RMS 148
|
5
|
12/28/2023
|
|||
|
NV105272781
|
RMS 3
|
5
|
10/3/2021
|
NV106354244
|
RMS 52
|
5
|
12/27/2023
|
NV106354292
|
RMS 100
|
5
|
12/28/2023
|
NV106354342
|
RMS 149
|
5
|
12/28/2023
|
|||
|
NV105272782
|
RMS 4
|
5
|
10/3/2021
|
NV106354245
|
RMS 53
|
5
|
12/27/2023
|
NV106354293
|
RMS 101
|
5
|
12/28/2023
|
NV106354343
|
RMS 150
|
5
|
12/28/2023
|
|||
|
NV105272783
|
RMS 5
|
5
|
10/3/2021
|
NV106354246
|
RMS 54
|
5
|
12/27/2023
|
NV106354294
|
RMS 102
|
5
|
12/28/2023
|
NV106354344
|
RMS 151
|
5
|
12/28/2023
|
|||
|
NV105272784
|
RMS 6
|
5
|
10/3/2021
|
NV106354247
|
RMS 55
|
5
|
12/27/2023
|
NV106354295
|
RMS 103
|
5
|
12/28/2023
|
NV106354345
|
RMS 152
|
5
|
12/28/2023
|
|||
|
NV105272785
|
RMS 7
|
5
|
10/3/2021
|
NV106354248
|
RMS 56
|
5
|
12/27/2023
|
NV106354296
|
RMS 104
|
5
|
12/28/2023
|
NV106354346
|
RMS 153
|
5
|
12/28/2023
|
|||
|
NV105272786
|
RMS 8
|
5
|
10/3/2021
|
NV106354249
|
RMS 57
|
5
|
12/27/2023
|
NV106354297
|
RMS 105
|
5
|
12/28/2023
|
NV106354347
|
RMS 154
|
5
|
12/28/2023
|
|||
|
NV105272787
|
RMS 9
|
5
|
10/3/2021
|
NV106354250
|
RMS 58
|
5
|
12/27/2023
|
NV106354298
|
RMS 106
|
5
|
12/28/2023
|
NV106354348
|
RMS 155
|
5
|
12/28/2023
|
|||
|
NV105272788
|
RMS 10
|
5
|
10/3/2021
|
NV106354251
|
RMS 59
|
5
|
12/27/2023
|
NV106354300
|
RMS 107
|
5
|
12/28/2023
|
NV106354349
|
RMS 156
|
5
|
12/28/2023
|
|||
|
NV105272789
|
RMS 11
|
5
|
10/3/2021
|
NV106354252
|
RMS 60
|
5
|
12/27/2023
|
NV106354301
|
RMS 108
|
5
|
12/28/2023
|
NV106354350
|
RMS 157
|
5
|
12/28/2023
|
|||
|
NV105272790
|
RMS 12
|
5
|
10/3/2021
|
NV106354253
|
RMS 61
|
5
|
12/27/2023
|
NV106354302
|
RMS 109
|
5
|
12/28/2023
|
NV106354351
|
RMS 158
|
5
|
12/28/2023
|
|||
|
NV105272791
|
RMS 13
|
5
|
10/3/2021
|
NV106354254
|
RMS 62
|
5
|
12/27/2023
|
NV106354303
|
RMS 110
|
5
|
12/28/2023
|
NV106354352
|
RMS 159
|
5
|
12/28/2023
|
|||
|
NV105272792
|
RMS 14
|
5
|
10/3/2021
|
NV106354255
|
RMS 63
|
5
|
12/27/2023
|
NV106354304
|
RMS 111
|
5
|
12/28/2023
|
NV106354353
|
RMS 160
|
5
|
12/28/2023
|
|||
|
NV105272793
|
RMS 15
|
5
|
10/3/2021
|
NV106354256
|
RMS 64
|
5
|
12/27/2023
|
NV106354305
|
RMS 112
|
5
|
12/28/2023
|
NV106354354
|
RMS 161
|
5
|
12/28/2023
|
|||
|
NV105272794
|
RMS 16
|
5
|
10/3/2021
|
NV106354257
|
RMS 65
|
5
|
12/27/2023
|
NV106354306
|
RMS 113
|
5
|
12/28/2023
|
NV106354355
|
RMS 162
|
5
|
12/28/2023
|
|||
|
NV105272795
|
RMS 17
|
5
|
10/3/2021
|
NV106354258
|
RMS 66
|
5
|
12/27/2023
|
NV106354307
|
RMS 114
|
5
|
12/28/2023
|
NV106354356
|
RMS 163
|
5
|
12/28/2023
|
|||
|
NV105272796
|
RMS 18
|
5
|
10/3/2021
|
NV106354259
|
RMS 67
|
5
|
12/28/2023
|
NV106354308
|
RMS 115
|
5
|
12/28/2023
|
NV106354357
|
RMS 164
|
5
|
12/28/2023
|
|||
|
NV105272797
|
RMS 19
|
5
|
10/3/2021
|
NV106354260
|
RMS 68
|
5
|
12/28/2023
|
NV106354309
|
RMS 116
|
5
|
12/28/2023
|
NV106354358
|
RMS 165
|
5
|
12/28/2023
|
|||
|
NV105272798
|
RMS 20
|
5
|
10/3/2021
|
NV106354261
|
RMS 69
|
5
|
12/28/2023
|
NV106354310
|
RMS 117
|
5
|
12/28/2023
|
NV106354359
|
RMS 166
|
5
|
12/28/2023
|
|||
|
NV105272799
|
RMS 21
|
5
|
10/3/2021
|
NV106354262
|
RMS 70
|
5
|
12/28/2023
|
NV106354311
|
RMS 118
|
5
|
12/28/2023
|
NV106354360
|
RMS 167
|
5
|
12/28/2023
|
|||
|
NV105272800
|
RMS 22
|
5
|
10/3/2021
|
NV106354263
|
RMS 71
|
5
|
12/28/2023
|
NV106354312
|
RMS 119
|
5
|
12/28/2023
|
NV106354361
|
RMS 168
|
5
|
12/28/2023
|
|||
|
NV105272801
|
RMS 23
|
5
|
10/3/2021
|
NV106354264
|
RMS 72
|
5
|
12/28/2023
|
NV106354313
|
RMS 120
|
5
|
12/28/2023
|
NV106354362
|
RMS 169
|
5
|
12/28/2023
|
|||
|
NV106354216
|
RMS 25B
|
5
|
12/21/2023
|
NV106354265
|
RMS 73
|
5
|
12/28/2023
|
NV106354314
|
RMS 121
|
5
|
12/28/2023
|
NV106354363
|
RMS 170
|
5
|
12/28/2023
|
|||
|
NV106354217
|
RMS 25
|
5
|
12/21/2023
|
NV106354266
|
RMS 74
|
5
|
12/28/2023
|
NV106354315
|
RMS 122
|
5
|
12/28/2023
|
NV106354364
|
RMS 171
|
5
|
12/28/2023
|
|||
|
NV106354218
|
RMS 26
|
5
|
12/21/2023
|
NV106354267
|
RMS 75
|
5
|
12/28/2023
|
NV106354316
|
RMS 123
|
5
|
12/28/2023
|
NV106354365
|
RMS 172
|
5
|
12/28/2023
|
|||
|
NV106354219
|
RMS 27
|
5
|
12/21/2023
|
NV106354268
|
RMS 76
|
5
|
12/28/2023
|
NV106354317
|
RMS 124
|
5
|
12/28/2023
|
NV106354366
|
RMS 173
|
5
|
12/28/2023
|
|||
|
NV106354220
|
RMS 28
|
5
|
12/21/2023
|
NV106354269
|
RMS 77
|
5
|
12/28/2023
|
NV106354318
|
RMS 125
|
5
|
12/28/2023
|
NV106354367
|
RMS 174
|
5
|
12/28/2023
|
|||
|
NV106354221
|
RMS 29
|
5
|
12/21/2023
|
NV106354270
|
RMS 78
|
5
|
12/28/2023
|
NV106354319
|
RMS 126
|
5
|
12/28/2023
|
NV106354368
|
RMS 175
|
5
|
12/28/2023
|
|||
|
NV106354222
|
RMS 30
|
5
|
12/21/2023
|
NV106354271
|
RMS 79
|
5
|
12/28/2023
|
NV106354320
|
RMS 127
|
5
|
12/28/2023
|
NV106354369
|
RMS 176
|
5
|
12/28/2023
|
|||
|
NV106354223
|
RMS 31
|
5
|
12/21/2023
|
NV106354272
|
RMS 80
|
5
|
12/28/2023
|
NV106354321
|
RMS 128
|
5
|
12/28/2023
|
NV106354370
|
RMS 177
|
5
|
12/28/2023
|
|||
|
NV106354224
|
RMS 32
|
5
|
12/21/2023
|
NV106354273
|
RMS 81
|
5
|
12/28/2023
|
NV106354322
|
RMS 129
|
5
|
12/28/2023
|
NV106354371
|
RMS 178
|
5
|
12/28/2023
|
|||
|
NV106354225
|
RMS 33
|
5
|
12/27/2023
|
NV106354274
|
RMS 82
|
5
|
12/28/2023
|
NV106354323
|
RMS 130
|
5
|
12/28/2023
|
NV106354372
|
RMS 179
|
5
|
12/28/2023
|
|||
|
NV106354226
|
RMS 34
|
5
|
12/27/2023
|
NV106354275
|
RMS 83
|
5
|
12/28/2023
|
NV106354324
|
RMS 131
|
5
|
12/28/2023
|
NV106354373
|
RMS 180
|
5
|
12/28/2023
|
|||
|
NV106354227
|
RMS 35
|
5
|
12/27/2023
|
NV106354276
|
RMS 84
|
5
|
12/28/2023
|
NV106354325
|
RMS 132
|
5
|
12/28/2023
|
NV106354374
|
RMS 181
|
5
|
12/28/2023
|
|||
|
NV106354228
|
RMS 36
|
5
|
12/27/2023
|
NV106354277
|
RMS 85
|
5
|
12/28/2023
|
NV106354326
|
RMS 133
|
5
|
12/28/2023
|
NV106354375
|
RMS 182
|
5
|
12/28/2023
|
|||
|
NV106354229
|
RMS 37
|
5
|
12/27/2023
|
NV106354278
|
RMS 86
|
5
|
12/28/2023
|
NV106354327
|
RMS 134
|
5
|
12/28/2023
|
NV106354376
|
RMS 183
|
5
|
12/28/2023
|
|||
|
NV106354230
|
RMS 38
|
5
|
12/27/2023
|
NV106354279
|
RMS 87
|
5
|
12/28/2023
|
NV106354328
|
RMS 135
|
5
|
12/28/2023
|
NV106354377
|
RMS 184
|
5
|
12/28/2023
|
|||
|
NV106354231
|
RMS 39
|
5
|
12/27/2023
|
NV106354280
|
RMS 88
|
5
|
12/28/2023
|
NV106354329
|
RMS 136
|
5
|
12/28/2023
|
NV106354378
|
RMS 185
|
5
|
12/28/2023
|
|||
|
NV106354232
|
RMS 40
|
5
|
12/27/2023
|
NV106354281
|
RMS 89
|
5
|
12/28/2023
|
NV106354330
|
RMS 137
|
5
|
12/28/2023
|
NV106354379
|
RMS 186
|
5
|
12/28/2023
|
|||
|
NV106354233
|
RMS 41
|
5
|
12/28/2023
|
NV106354282
|
RMS 90
|
5
|
12/28/2023
|
NV106354331
|
RMS 138
|
5
|
12/28/2023
|
NV106354380
|
RMS 187
|
5
|
12/28/2023
|
|||
|
NV106354234
|
RMS 42
|
5
|
12/21/2023
|
NV106354283
|
RMS 91
|
5
|
12/28/2023
|
NV106354332
|
RMS 139
|
5
|
12/28/2023
|
NV106354381
|
RMS 188
|
5
|
12/28/2023
|
|||
|
NV106354235
|
RMS 43
|
5
|
12/21/2023
|
NV106354284
|
RMS 92
|
5
|
12/28/2023
|
NV106354333
|
RMS 140
|
5
|
12/28/2023
|
NV106354382
|
RMS 189
|
5
|
12/28/2023
|
|||
|
NV106354236
|
RMS 44
|
5
|
12/21/2023
|
NV106354285
|
RMS 93
|
5
|
12/28/2023
|
NV106354334
|
RMS 141
|
5
|
12/28/2023
|
NV106354383
|
RMS 190
|
5
|
12/28/2023
|
|||
|
NV106354237
|
RMS 45
|
5
|
12/21/2023
|
NV106354286
|
RMS 94
|
5
|
12/28/2023
|
NV106354335
|
RMS 142
|
5
|
12/28/2023
|
NV106354384
|
RMS 191
|
5
|
12/28/2023
|
|||
|
NV106354238
|
RMS 46
|
5
|
12/27/2023
|
NV106354287
|
RMS 95A
|
5
|
12/28/2023
|
NV106354336
|
RMS 143
|
5
|
12/28/2023
|
NV106354385
|
RMS 192
|
5
|
12/28/2023
|
|||
|
NV106354239
|
RMS 47
|
5
|
12/27/2023
|
NV106354288
|
RMS 95B
|
5
|
12/28/2023
|
NV106354337
|
RMS 144
|
5
|
12/28/2023
|
NV106354386
|
RMS 193
|
5
|
12/28/2023
|
|||
|
NV106354240
|
RMS 48
|
5
|
12/27/2023
|
NV106354289
|
RMS 96
|
5
|
12/28/2023
|
NV106354338
|
RMS 145
|
5
|
12/28/2023
|
NV106354387
|
RMS 194
|
5
|
12/28/2023
|
|||
|
NV106354241
|
RMS 49
|
5
|
12/27/2023
|
NV106354289
|
RMS 97
|
5
|
12/28/2023
|
NV106354339
|
RMS 146
|
5
|
12/28/2023
|
NV106354388
|
RMS 195
|
5
|
12/28/2023
|
|||
|
Serial Number
|
Claim Name
|
Acres
|
Date Of Location
|
Serial Number
|
Claim Name
|
Acres
|
Date Of Location
|
Serial Number
|
Claim Name
|
Acres
|
Date Of Location
|
Serial Number
|
Claim Name
|
Acres
|
Date Of Location
|
|
|
3-7 |
30 SEPTEMBER 2025
|
|
Rhyolite Ridge Lithium-Boron Project
|
S-K 1300 Technical Report Summary
|
|
Serial Number
|
Claim
Name
|
Acres |
Date Of
Location
|
Serial Number
|
Claim
Name
|
Acres
|
Date Of
Location
|
Serial Number
|
Claim
Name
|
Acres |
Date Of
Location
|
Serial Number
|
Claim
Name
|
Acres |
Date Of
Location
|
|||
|
NV106354389
|
RMS 196
|
5
|
12/28/2023
|
NV106354438
|
RMS 245
|
5
|
12/28/2023
|
NV106354487
|
RMS 294
|
5
|
12/28/2023
|
NV106354536
|
RMS 343
|
5
|
12/28/2023
|
|||
|
NV106354390
|
RMS 197
|
5
|
12/28/2023
|
NV106354439
|
RMS 246
|
5
|
12/28/2023
|
NV106354488
|
RMS 295
|
5
|
12/28/2023
|
NV106354537
|
RMS 344
|
5
|
12/28/2023
|
|||
|
NV106354391
|
RMS 198
|
5
|
12/28/2023
|
NV106354440
|
RMS 247
|
5
|
12/28/2023
|
NV106354489
|
RMS 296
|
5
|
12/28/2023
|
NV106354538
|
RMS 345
|
5
|
12/28/2023
|
|||
|
NV106354392
|
RMS 199
|
5
|
12/28/2023
|
NV106354441
|
RMS 248
|
5
|
12/28/2023
|
NV106354490
|
RMS 297
|
5
|
12/28/2023
|
NV106354539
|
RMS 346
|
5
|
12/28/2023
|
|||
|
NV106354393
|
RMS 200
|
5
|
12/28/2023
|
NV106354442
|
RMS 249
|
5
|
12/28/2023
|
NV106354491
|
RMS 298
|
5
|
12/28/2023
|
NV106354540
|
RMS 347
|
5
|
12/28/2023
|
|||
|
NV106354394
|
RMS 201
|
5
|
12/28/2023
|
NV106354443
|
RMS 250
|
5
|
12/28/2023
|
NV106354492
|
RMS 299
|
5
|
12/28/2023
|
|||||||
|
NV106354395
|
RMS 202
|
5
|
12/28/2023
|
NV106354444
|
RMS 251
|
5
|
12/28/2023
|
NV106354493
|
RMS 300
|
5
|
12/28/2023
|
|||||||
|
NV106354396
|
RMS 203
|
5
|
12/28/2023
|
NV106354445
|
RMS 252
|
5
|
12/28/2023
|
NV106354494
|
RMS 301
|
5
|
12/28/2023
|
|||||||
|
NV106354397
|
RMS 204
|
5
|
12/28/2023
|
NV106354446
|
RMS 253
|
5
|
12/28/2023
|
NV106354495
|
RMS 302
|
5
|
12/28/2023
|
|||||||
|
NV106354398
|
RMS 205
|
5
|
12/28/2023
|
NV106354447
|
RMS 254
|
5
|
12/28/2023
|
NV106354496
|
RMS 303
|
5
|
12/28/2023
|
|||||||
|
NV106354399
|
RMS 206
|
5
|
12/28/2023
|
NV106354448
|
RMS 255
|
5
|
12/28/2023
|
NV106354497
|
RMS 304
|
5
|
12/28/2023
|
|||||||
|
NV106354400
|
RMS 207
|
5
|
12/28/2023
|
NV106354449
|
RMS 256
|
5
|
12/28/2023
|
NV106354498
|
RMS 305
|
5
|
12/28/2023
|
|||||||
|
NV106354401
|
RMS 208
|
5
|
12/28/2023
|
NV106354450
|
RMS 257
|
5
|
12/28/2023
|
NV106354499
|
RMS 306
|
5
|
12/28/2023
|
|||||||
|
NV106354402
|
RMS 209
|
5
|
12/28/2023
|
NV106354451
|
RMS 258
|
5
|
12/28/2023
|
NV106354500
|
RMS 307
|
5
|
12/28/2023
|
|||||||
|
NV106354403
|
RMS 210
|
5
|
12/28/2023
|
NV106354452
|
RMS 259
|
5
|
12/28/2023
|
NV106354501
|
RMS 308
|
5
|
12/28/2023
|
|||||||
|
NV106354404
|
RMS 211
|
5
|
12/28/2023
|
NV106354453
|
RMS 260
|
5
|
12/28/2023
|
NV106354502
|
RMS 309
|
5
|
12/28/2023
|
|||||||
|
NV106354405
|
RMS 212
|
5
|
12/28/2023
|
NV106354454
|
RMS 261
|
5
|
12/28/2023
|
NV106354503
|
RMS 310
|
5
|
12/28/2023
|
|||||||
|
NV106354406
|
RMS 213
|
5
|
12/28/2023
|
NV106354455
|
RMS 262
|
5
|
12/28/2023
|
NV106354504
|
RMS 311
|
5
|
12/28/2023
|
|||||||
|
NV106354407
|
RMS 214
|
5
|
12/28/2023
|
NV106354456
|
RMS 263
|
5
|
12/28/2023
|
NV106354505
|
RMS 312
|
5
|
12/28/2023
|
|||||||
|
NV106354408
|
RMS 215
|
5
|
12/28/2023
|
NV106354457
|
RMS 264
|
5
|
12/28/2023
|
NV106354506
|
RMS 313
|
5
|
12/28/2023
|
|||||||
|
NV106354409
|
RMS 216
|
5
|
12/28/2023
|
NV106354458
|
RMS 265
|
5
|
12/28/2023
|
NV106354507
|
RMS 314
|
5
|
12/28/2023
|
|||||||
|
NV106354410
|
RMS 217
|
5
|
12/28/2023
|
NV106354459
|
RMS 266
|
5
|
12/28/2023
|
NV106354508
|
RMS 315
|
5
|
12/28/2023
|
|||||||
|
NV106354411
|
RMS 218
|
5
|
12/28/2023
|
NV106354460
|
RMS 267
|
5
|
12/28/2023
|
NV106354509
|
RMS 316
|
5
|
12/28/2023
|
|||||||
|
NV106354412
|
RMS 219
|
5
|
12/28/2023
|
NV106354461
|
RMS 268
|
5
|
12/28/2023
|
NV106354510
|
RMS 317
|
5
|
12/28/2023
|
|||||||
|
NV106354413
|
RMS 220
|
5
|
12/28/2023
|
NV106354462
|
RMS 269
|
5
|
12/28/2023
|
NV106354511
|
RMS 318
|
5
|
12/28/2023
|
|||||||
|
NV106354414
|
RMS 221
|
5
|
12/28/2023
|
NV106354463
|
RMS 270
|
5
|
12/28/2023
|
NV106354512
|
RMS 319
|
5
|
12/28/2023
|
|||||||
|
NV106354415
|
RMS 222
|
5
|
12/28/2023
|
NV106354464
|
RMS 271
|
5
|
12/28/2023
|
NV106354513
|
RMS 320
|
5
|
12/28/2023
|
|||||||
|
NV106354416
|
RMS 223
|
5
|
12/28/2023
|
NV106354465
|
RMS 272
|
5
|
12/28/2023
|
NV106354514
|
RMS 321
|
5
|
12/28/2023
|
|||||||
|
NV106354417
|
RMS 224
|
5
|
12/28/2023
|
NV106354466
|
RMS 273
|
5
|
12/28/2023
|
NV106354515
|
RMS 322
|
5
|
12/28/2023
|
|||||||
|
NV106354418
|
RMS 225
|
5
|
12/28/2023
|
NV106354467
|
RMS 274
|
5
|
12/28/2023
|
NV106354516
|
RMS 323
|
5
|
12/28/2023
|
|||||||
|
NV106354419
|
RMS 226
|
5
|
12/28/2023
|
NV106354468
|
RMS 275
|
5
|
12/28/2023
|
NV106354517
|
RMS 324
|
5
|
12/28/2023
|
|||||||
|
NV106354420
|
RMS 227
|
5
|
12/28/2023
|
NV106354469
|
RMS 276
|
5
|
12/28/2023
|
NV106354518
|
RMS 325
|
5
|
12/28/2023
|
|||||||
|
NV106354421
|
RMS 228
|
5
|
12/28/2023
|
NV106354470
|
RMS 277
|
5
|
12/28/2023
|
NV106354519
|
RMS 326
|
5
|
12/28/2023
|
|||||||
|
NV106354422
|
RMS 229
|
5
|
12/28/2023
|
NV106354471
|
RMS 278
|
5
|
12/28/2023
|
NV106354520
|
RMS 327
|
5
|
12/28/2023
|
|||||||
|
NV106354423
|
RMS 230
|
5
|
12/28/2023
|
NV106354472
|
RMS 279
|
5
|
12/28/2023
|
NV106354521
|
RMS 328
|
5
|
12/28/2023
|
|||||||
|
NV106354424
|
RMS 231
|
5
|
12/28/2023
|
NV106354473
|
RMS 280
|
5
|
12/28/2023
|
NV106354522
|
RMS 329
|
5
|
12/28/2023
|
|||||||
|
NV106354425
|
RMS 232
|
5
|
12/28/2023
|
NV106354474
|
RMS 281
|
5
|
12/28/2023
|
NV106354523
|
RMS 330
|
5
|
12/28/2023
|
|||||||
|
NV106354426
|
RMS 233
|
5
|
12/28/2023
|
NV106354475
|
RMS 282
|
5
|
12/28/2023
|
NV106354524
|
RMS 331
|
5
|
12/28/2023
|
|||||||
|
NV106354427
|
RMS 234
|
5
|
12/28/2023
|
NV106354476
|
RMS 283
|
5
|
12/28/2023
|
NV106354525
|
RMS 332
|
5
|
12/28/2023
|
|||||||
|
NV106354428
|
RMS 235
|
5
|
12/28/2023
|
NV106354477
|
RMS 284
|
5
|
12/28/2023
|
NV106354526
|
RMS 333
|
5
|
12/28/2023
|
|||||||
|
NV106354429
|
RMS 236
|
5
|
12/28/2023
|
NV106354478
|
RMS 285
|
5
|
12/28/2023
|
NV106354527
|
RMS 334
|
5
|
12/28/2023
|
|||||||
|
NV106354430
|
RMS 237
|
5
|
12/28/2023
|
NV106354479
|
RMS 286
|
5
|
12/28/2023
|
NV106354528
|
RMS 335
|
5
|
12/28/2023
|
|||||||
|
NV106354431
|
RMS 238
|
5
|
12/28/2023
|
NV106354480
|
RMS 287
|
5
|
12/28/2023
|
NV106354529
|
RMS 336
|
5
|
12/28/2023
|
|||||||
|
NV106354432
|
RMS 239
|
5
|
12/28/2023
|
NV106354481
|
RMS 288
|
5
|
12/28/2023
|
NV106354530
|
RMS 337
|
5
|
12/28/2023
|
|||||||
|
NV106354433
|
RMS 240
|
5
|
12/28/2023
|
NV106354482
|
RMS 289
|
5
|
12/28/2023
|
NV106354531
|
RMS 338
|
5
|
12/28/2023
|
|||||||
|
NV106354434
|
RMS 241
|
5
|
12/28/2023
|
NV106354483
|
RMS 290
|
5
|
12/28/2023
|
NV106354532
|
RMS 339
|
5
|
12/28/2023
|
|||||||
|
NV106354435
|
RMS 242
|
5
|
12/28/2023
|
NV106354484
|
RMS 291
|
5
|
12/28/2023
|
NV106354533
|
RMS 340
|
5
|
12/28/2023
|
|||||||
|
NV106354436
|
RMS 243
|
5
|
12/28/2023
|
NV106354485
|
RMS 292
|
5
|
12/28/2023
|
NV106354534
|
RMS 341
|
5
|
12/28/2023
|
|||||||
|
NV106354437
|
RMS 244
|
5
|
12/28/2023
|
NV106354486
|
RMS 293
|
5
|
12/28/2023
|
NV106354535
|
RMS 342
|
5
|
12/28/2023
|
|
|
3-8 |
30 SEPTEMBER 2025
|
|
Rhyolite Ridge Lithium-Boron Project
|
S-K 1300 Technical Report Summary
|
|
3.3.2.
|
Description on Acquisition of Mineral Rights
|
|
3.3.3.
|
Surface Rights
|
|
3.3.4.
|
Water Rights
|
|
3.4.
|
Permits
|
|
|
3-9 |
30 SEPTEMBER 2025
|
|
Rhyolite Ridge Lithium-Boron Project
|
S-K 1300 Technical Report Summary
|
|
3.5.
|
Significant Encumbrances to the Property
|
|
3.6.
|
Species of Conservation Interest
|
|
|
3-10 |
30 SEPTEMBER 2025
|
|
Rhyolite Ridge Lithium-Boron Project
|
S-K 1300 Technical Report Summary
|
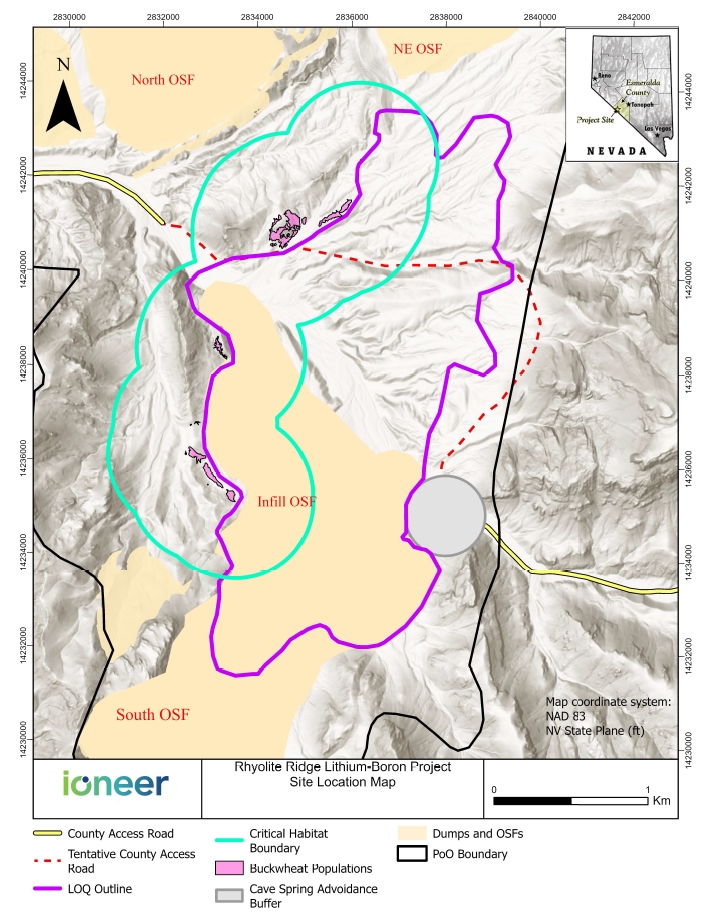
|
|
3-11 |
30 SEPTEMBER 2025
|
|
Rhyolite Ridge Lithium-Boron Project
|
S-K 1300 Technical Report Summary
|
|
3.7.
|
Royalty Payments
|
|
3.8.
|
QP Statement
|
|
|
3-12 |
30 SEPTEMBER 2025
|
|
Rhyolite Ridge Lithium-Boron Project
|
S-K 1300 Technical Report Summary
|
|
4.
|
ACCESSIBILITY, CLIMATE, LOCAL RESOURCES, INFRASTRUCTURE, AND PHYSIOGRAPHY
|
|
4.1.
|
Topography and Land Description
|
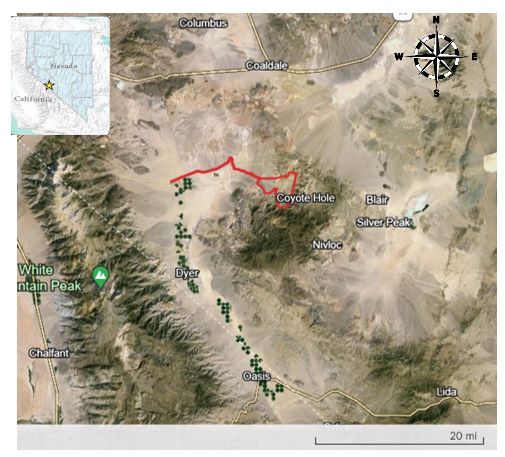
|
|
4-1 |
30 SEPTEMBER 2025
|
|
Rhyolite Ridge Lithium-Boron Project
|
S-K 1300 Technical Report Summary
|
|
4.2.
|
Access to the Property
|
|
|
4-2 |
30 SEPTEMBER 2025
|
|
Rhyolite Ridge Lithium-Boron Project
|
S-K 1300 Technical Report Summary
|
|
|
4-3 |
30 SEPTEMBER 2025
|
|
Rhyolite Ridge Lithium-Boron Project
|
S-K 1300 Technical Report Summary
|
|
4.3.
|
Climate Description
|
|
4.4.
|
Availability of Required Infrastructure
|
|
4.4.1.
|
Transportation
|
|
4.4.2.
|
Labor and Accommodation
|
|
|
4-4 |
30 SEPTEMBER 2025
|
|
Rhyolite Ridge Lithium-Boron Project
|
S-K 1300 Technical Report Summary
|
|
4.4.3.
|
Power
|
|
4.4.4.
|
Water
|
|
|
4-5 |
30 SEPTEMBER 2025
|
|
Rhyolite Ridge Lithium-Boron Project
|
S-K 1300 Technical Report Summary
|
|
5.
|
HISTORY
|
|
Year
|
Operator
|
Type of Exploration Work
|
|
1980s
|
US Borax
|
Exploration drilling
|
|
2010
|
ALM
|
Surface trenching
|
|
2010-2012
|
Exploration drilling (RC and core)
|
|
|
2016
|
Global Geoscience
|
Surface gravity geophysical survey
|
|
2016-2017
|
Exploration drilling (RC and core)
|
|
|
2018
|
ioneer
|
Topographic survey
|
|
2019
|
Surface reflection seismic geophysical survey
|
|
|
2019
|
Surficial geological mapping
|
|
|
2018-2023
|
Exploration drilling (RC and core)
|
|
|
Hydrogeological baseline studies (piezometers, monitoring &
test wells, surface spring sampling)
|
||
|
Geotechnical drilling & test pits
|
|
|
5-1 |
30 SEPTEMBER 2025
|
|
Rhyolite Ridge Lithium-Boron Project
|
S-K 1300 Technical Report Summary
|
|
6.
|
GEOLOGICAL SETTING, MINERALIZATION, AND DEPOSIT
|
|
6.1.
|
Deposit Type
|
|
6.2.
|
Regional Geology
|
|
6.3.
|
Local and Property Geology
|
|
|
6-1 |
30 SEPTEMBER 2025
|
|
Rhyolite Ridge Lithium-Boron Project
|
S-K 1300 Technical Report Summary
|
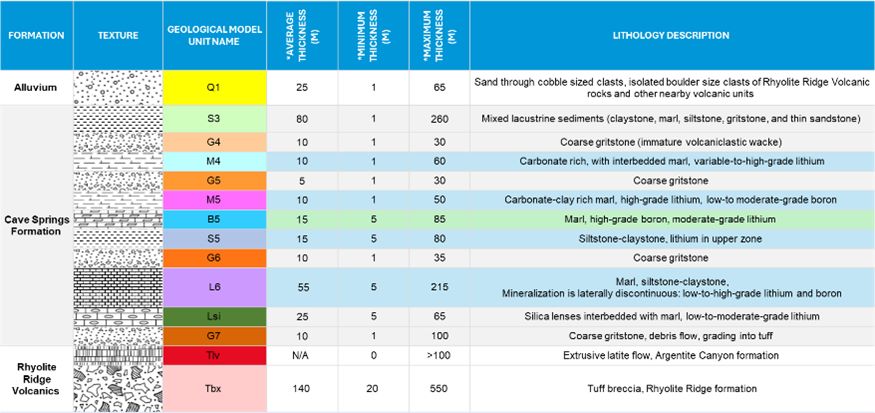
|
|
6-2 |
30 SEPTEMBER 2025
|
|
Rhyolite Ridge Lithium-Boron Project
|
S-K 1300 Technical Report Summary
|
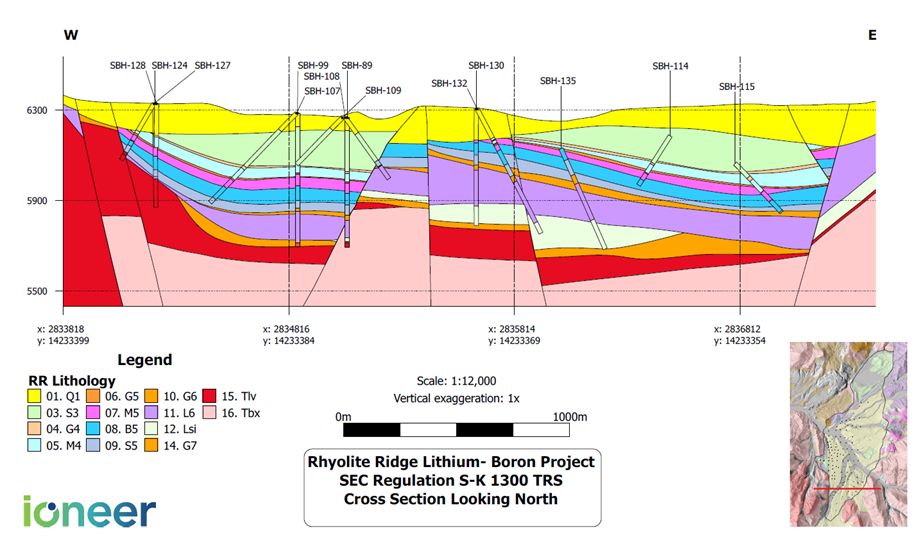
|
|
6-3 |
30 SEPTEMBER 2025
|
|
Rhyolite Ridge Lithium-Boron Project
|
S-K 1300 Technical Report Summary
|
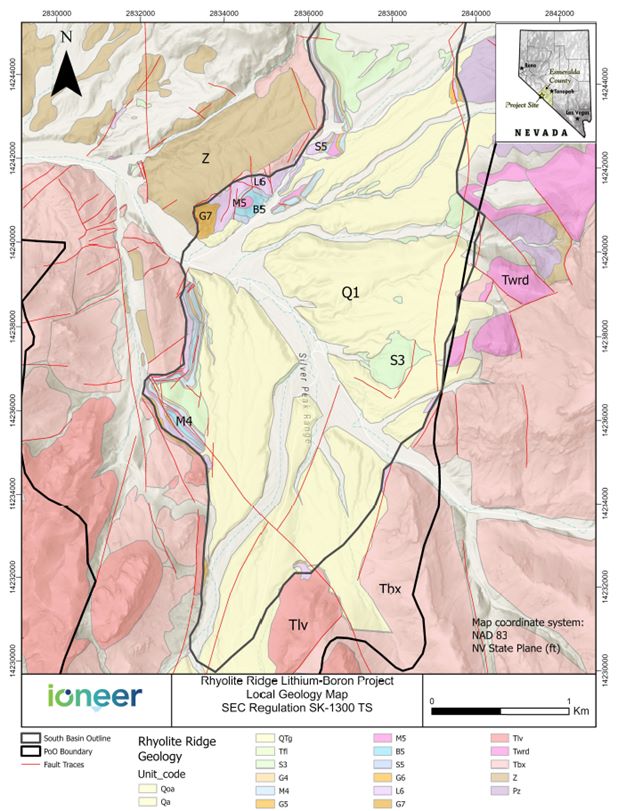
|
|
6-4 |
30 SEPTEMBER 2025
|
|
Rhyolite Ridge Lithium-Boron Project
|
S-K 1300 Technical Report Summary
|
|
|
- |
M5 (high-grade lithium, low- to moderate-grade boron bearing carbonate-clay rich marl);
|
|
|
- |
B5 (high-grade boron, moderate-grade lithium marl);
|
|
|
- |
S5 (moderate-grade lithium, low-grade boron, occurring near the top of this siltstone-claystone unit, transitional from the overlying B5
mineralization);
|
|
|
- |
L6 (broad zone of laterally discontinuous low- to high-grade lithium and boron mineralized horizons as well as LoB-Li mineralization horizons
within a larger low-grade to barren sequence of siltstone-claystone).
|
|
|
6-5 |
30 SEPTEMBER 2025
|
|
Rhyolite Ridge Lithium-Boron Project
|
S-K 1300 Technical Report Summary
|
|
6.4.
|
Mineralization
|
|
|
6-6 |
30 SEPTEMBER 2025
|
|
Rhyolite Ridge Lithium-Boron Project
|
S-K 1300 Technical Report Summary
|
|
7.
|
EXPLORATION
|
|
7.1.
|
Exploration
|
|
7.1.1.
|
2010 Outcrop/Subcrop Trenching
|
|
7.1.2.
|
2017 Surface Gravity Geophysical Survey
|
|
|
7-1 |
30 SEPTEMBER 2025
|
|
Rhyolite Ridge Lithium-Boron Project
|
S-K 1300 Technical Report Summary
|
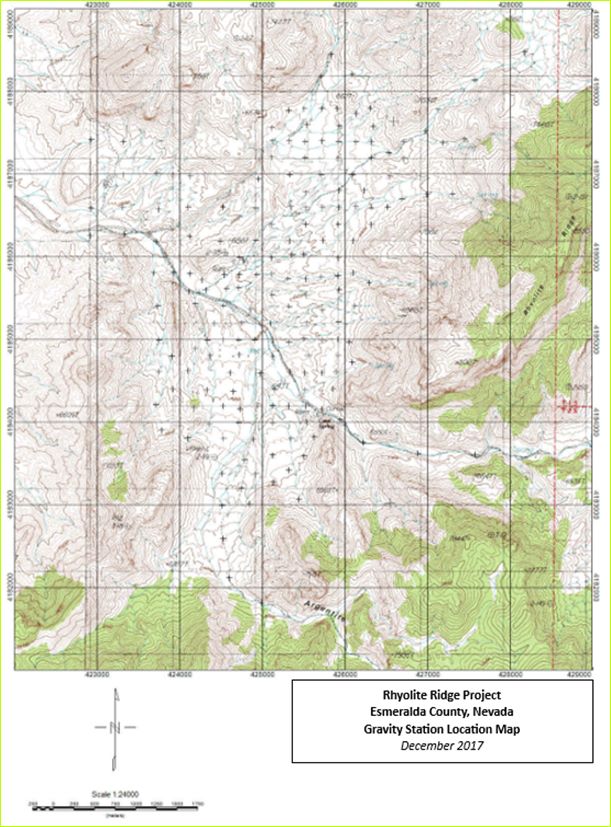
|
|
7-2 |
30 SEPTEMBER 2025
|
|
Rhyolite Ridge Lithium-Boron Project
|
S-K 1300 Technical Report Summary
|
|
7.1.3.
|
2019 Surface Reflection Seismic Geophysical Survey
|
|
7.1.4.
|
2019 Magnetic Drone Survey
|
|
7.1.5.
|
2019 Surficial Geological Mapping
|
|
|
- |
Photogeology, which involved interpreting aerial satellite photographs, to help identify geologic features and stratigraphic outcropping
throughout the basin;
|
|
|
- |
Foundational techniques, which involved direct observation and in-field measurements;
|
|
|
- |
Brunton compass mapping, to measure the orientation of bedding planes, faults, and other structures, and plot these measurements on a
geologic map;
|
|
|
- |
Hand lenses, to help in close examination of minerals and textures, and rock hammers, to break off fresh samples for analysis;
|
|
|
- |
GPS and field notebooks, which were crucial for recording observations, measurements, and sketches systematically;
|
|
|
- |
Measuring of stratigraphic sections, which involved documenting the thickness and characteristics of rock layers in outcrops and
historical excavation;
|
|
|
- |
Field photography, which involved capturing images of outcrops with scales for reference;
|
|
|
- |
Sample collection, which involved gathering representative rock and soil samples for further geochemical analysis.
|
|
|
7-3 |
30 SEPTEMBER 2025
|
|
Rhyolite Ridge Lithium-Boron Project
|
S-K 1300 Technical Report Summary
|
|
|
7-4 |
30 SEPTEMBER 2025
|
|
Rhyolite Ridge Lithium-Boron Project
|
S-K 1300 Technical Report Summary
|
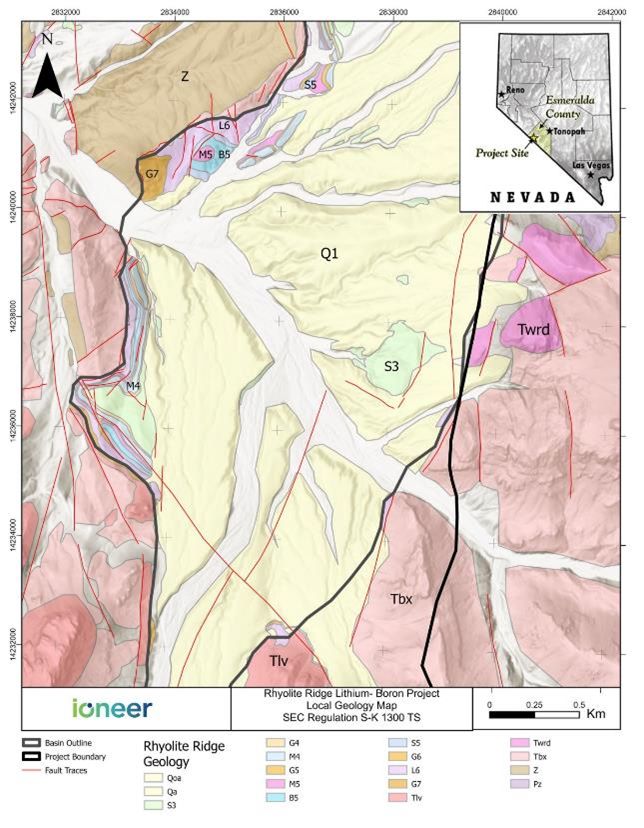
|
|
7-5 |
30 SEPTEMBER 2025
|
|
Rhyolite Ridge Lithium-Boron Project
|
S-K 1300 Technical Report Summary
|
|
7.1.6.
|
2018 Topographic Survey
|
|
7.2.
|
Geological Exploration Drilling
|
|
7.2.1.
|
Exploration Drilling Methods and Results
|
|
|
7-6 |
30 SEPTEMBER 2025
|
|
Rhyolite Ridge Lithium-Boron Project
|
S-K 1300 Technical Report Summary
|
|
Drill Type
|
Year
|
Inclined Drill Holes
|
Vertical Drill Holes
|
Total
Drill
Holes
|
Total Depth (m)
|
|||
|
Count
|
Total Depth
(m)
|
Count
|
Total Depth
(m)
|
|||||
|
RC Drill Holes
|
2010-2012
|
6
|
1,353
|
9
|
2,310
|
15
|
3,664
|
|
|
2016-2017
|
2
|
707
|
25
|
4,663
|
27
|
5,370
|
||
|
2018-2019
|
2
|
549
|
2
|
549
|
||||
|
2023 (Phase 2)
|
7
|
1,266
|
7
|
1,266
|
||||
|
Core Drill Holes
|
2010-2012
|
2
|
530
|
19
|
4,605
|
21
|
5,135
|
|
|
2016-2017
|
3
|
853
|
3
|
853
|
||||
|
2018-2019
|
29
|
6,504
|
14
|
2,817
|
43
|
9,321
|
||
|
2022 (Phase 1)
|
9
|
1,243
|
9
|
1,243
|
||||
|
2023 (Phase 2)
|
17
|
2,918
|
17
|
2,918
|
||||
|
2023-2024
(Phase 3)
|
13
|
1,876
|
9
|
1,325
|
22
|
3,201
|
||
|
Total
|
69
|
13,559
|
97
|
19,960
|
166
|
33,519
|
||
|
Drill Type
|
Year
|
Inclined Drill Holes
|
Vertical Drill Holes
|
Total
Drill
Holes
|
Total Depth (ft)
|
|||
|
Count
|
Total Depth
(ft)
|
Count
|
Total Depth
(ft)
|
|||||
|
RC Drill Holes
|
2010-2012
|
6
|
4,440
|
9
|
7,580
|
15
|
12,020
|
|
|
2016-2017
|
2
|
2,320
|
25
|
15,297
|
27
|
17,617
|
||
|
2018-2019
|
2
|
1,800
|
2
|
1,800
|
||||
|
2023 (Phase 2)
|
7
|
4,155
|
7
|
4,155
|
||||
|
Core Drill Holes
|
2010-2012
|
2
|
1,739
|
19
|
15,108
|
21
|
16,847
|
|
|
2016-2017
|
3
|
2,797
|
3
|
2,797
|
||||
|
2018-2019
|
29
|
21,340
|
14
|
9,242
|
43
|
30,582
|
||
|
2022 (Phase 1)
|
9
|
4,077
|
9
|
4,077
|
||||
|
2023 (Phase 2)
|
17
|
9,572
|
17
|
9,572
|
||||
|
2023-2024
(Phase 3)
|
13
|
6,155
|
9
|
4,347
|
22
|
10,502
|
||
|
Total
|
69
|
45,566
|
97
|
64,403
|
166
|
109,969
|
||
|
|
7-7 |
30 SEPTEMBER 2025
|
|
Rhyolite Ridge Lithium-Boron Project
|
S-K 1300 Technical Report Summary
|
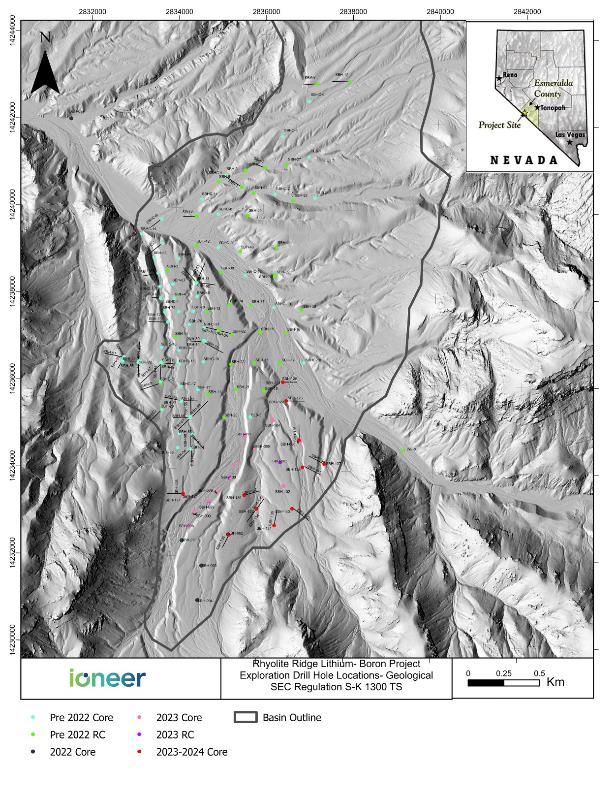
|
|
7-8 |
30 SEPTEMBER 2025
|
|
Rhyolite Ridge Lithium-Boron Project
|
S-K 1300 Technical Report Summary
|
|
7.2.2.
|
Recovery
|
|
|
7-9 |
30 SEPTEMBER 2025
|
|
Rhyolite Ridge Lithium-Boron Project
|
S-K 1300 Technical Report Summary
|
|
Model Unit
|
Mean Core Recovery (%)
|
Mean RQD (%)
|
|
Q1
|
31
|
4
|
|
S3
|
90
|
47
|
|
G4
|
94
|
68
|
|
M4
|
90
|
71
|
|
G5
|
87
|
71
|
|
M5
|
92
|
70
|
|
B5
|
94
|
64
|
|
S5
|
94
|
61
|
|
G6
|
95
|
80
|
|
L6
|
94
|
71
|
|
Lsi
|
94
|
68
|
|
G7
|
94
|
80
|
|
Tlv
|
95
|
78
|
|
Tbx
|
93
|
89
|
|
Mean
|
93
|
61
|
|
7.2.3.
|
Drill Hole Logging
|
|
|
7-10 |
30 SEPTEMBER 2025
|
|
Rhyolite Ridge Lithium-Boron Project
|
S-K 1300 Technical Report Summary
|
|
7.2.4.
|
Collar Surveys
|
|
7.2.5.
|
Downhole Surveys
|
|
7.2.6.
|
Drill Hole Data Spacing and Distribution
|
|
7.2.7.
|
Relationship Between Mineralization Widths and Intercept Lengths
|
|
|
7-11 |
30 SEPTEMBER 2025
|
|
Rhyolite Ridge Lithium-Boron Project
|
S-K 1300 Technical Report Summary
|
|
7.2.8.
|
QP Statement on Exploration Drilling
|
|
7.3.
|
Hydrogeological Drilling and Sampling
|
|
7.3.1.
|
Sampling Methods and Laboratory Determinations
|
|
|
7-12 |
30 SEPTEMBER 2025
|
|
Rhyolite Ridge Lithium-Boron Project
|
S-K 1300 Technical Report Summary
|
|
Analyte
|
Unit
|
Nevada Profile I
Reference Value
|
Analyte
|
Unit
|
Nevada profile I
Reference Value
|
|
pH
|
pH units
|
6.5-8.5
|
Iron
|
mg/L
|
0.6
|
|
Total alkalinity
|
mg/L as CaCO3
|
--
|
Lead
|
mg/L
|
0.015
|
|
Chloride
|
mg/L
|
400
|
Lithium
|
mg/L
|
--
|
|
Fluoride
|
mg/L
|
4
|
Magnesium
|
mg/L
|
150
|
|
Sulfate
|
mg/L
|
500
|
Manganese
|
mg/L
|
0.1
|
|
Total nitrogen
|
mg/L as N
|
10
|
Mercury
|
mg/L
|
0.002
|
|
Total dissolved solids
|
mg/L
|
1,000
|
Molybdenum
|
mg/L
|
--
|
|
Aluminum
|
mg/L
|
0.2
|
Nickel
|
mg/L
|
--
|
|
Antimony
|
mg/L
|
0.006
|
Phosphorus
|
mg/L
|
--
|
|
Arsenic
|
mg/L
|
0.01
|
Potassium
|
mg/L
|
--
|
|
Barium
|
mg/L
|
2
|
Scandium
|
mg/L
|
--
|
|
Beryllium
|
mg/L
|
0.004
|
Selenium
|
mg/L
|
0.05
|
|
Bismuth
|
mg/L
|
--
|
Silver
|
mg/L
|
0.1
|
|
Boron
|
mg/L
|
--
|
Sodium
|
mg/L
|
--
|
|
Cadmium
|
mg/L
|
0.005
|
Strontium
|
mg/L
|
--
|
|
Calcium
|
mg/L
|
--
|
Thallium
|
mg/L
|
0.002
|
|
Chromium
|
mg/L
|
0.1
|
Tin
|
mg/L
|
--
|
|
Cobalt
|
mg/L
|
--
|
Titanium
|
mg/L
|
--
|
|
Copper
|
mg/L
|
1
|
Vanadium
|
mg/L
|
--
|
|
Gallium
|
mg/L
|
--
|
Zinc
|
mg/L
|
5
|
|
7.3.2.
|
Data Verification
|
|
|
7-13 |
30 SEPTEMBER 2025
|
|
Rhyolite Ridge Lithium-Boron Project
|
S-K 1300 Technical Report Summary
|
|
7.3.3.
|
Baseline Hydrogeology
|
|
|
- |
The regional groundwater system is recharged at higher elevation mountain areas; bases of mountain
drainages; and mountain-front alluvial fans and then discharges to lower basin areas as evapotranspiration (i.e., in playas) or water
supply discharge.
|
|
|
- |
Groundwater flow is compartmentalized and limited predominantly by north-south trending,
listric-style faulting. This compartmentalization results in limited east-to-west groundwater flow and stair-stepping water levels.
|
|
|
- |
Higher hydraulic conductivities were observed in the basin fill alluvium and along some fracture
zones.
|
|
|
- |
Groundwater flow through the quarry area is strongly affected (attenuated) due to the presence, and
layered nature of the clay-rich ash-fall and lacustrine units of the Cave Spring Formation.
|
|
7.3.4.
|
Groundwater Monitoring and Chemistry
|
|
|
7-14 |
30 SEPTEMBER 2025
|
|
Rhyolite Ridge Lithium-Boron Project
|
S-K 1300 Technical Report Summary
|
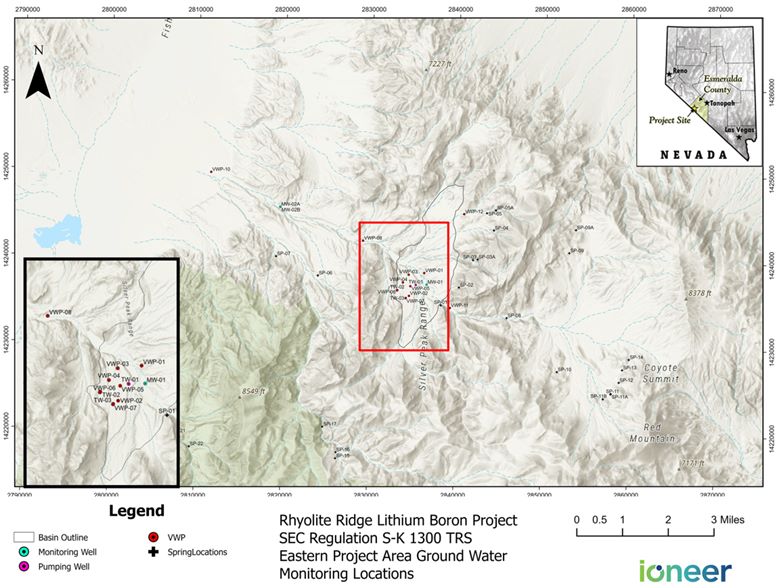
|
|
7-15 |
30 SEPTEMBER 2025
|
|
Rhyolite Ridge Lithium-Boron Project
|
S-K 1300 Technical Report Summary
|
|
Hydrogeological
Monitoring Site
|
Count
|
Groundwater Elevation (m asl)
|
Spring Discharge (lpm)
|
||||
|
Mean
|
Minimum
|
Maximum
|
Mean
|
Minimum
|
Maximum
|
||
|
Vibrating wire
piezometers
|
35
|
1,808
|
1,431
|
1,955
|
-
|
-
|
-
|
|
Monitoring well
|
3
|
1,663
|
1,593
|
1,800
|
-
|
-
|
-
|
|
Testing well
|
3
|
1,812
|
1,809
|
1,817
|
-
|
-
|
-
|
|
Spring
|
27
|
2,051
|
1,651
|
2,355
|
5.41
|
0.00
|
37.1
|
|
Total
|
68
|
1,898
|
1,431
|
2,355
|
5.41
|
0.00
|
37.1
|
|
Hydrogeological
Monitoring Site
|
Count
|
Groundwater Elevation (ft asl)
|
Spring Discharge (gpm)
|
||||
|
Mean
|
Minimum
|
Maximum
|
Mean
|
Minimum
|
Maximum
|
||
|
Vibrating wire
piezometers
|
35
|
5,932
|
4,694
|
6,413
|
-
|
-
|
-
|
|
Monitoring well
|
3
|
5,455
|
5,228
|
5,907
|
-
|
-
|
-
|
|
Testing well
|
3
|
5,944
|
5,934
|
5,961
|
-
|
-
|
-
|
|
Spring
|
27
|
6,728
|
5,418
|
7,726
|
1.43
|
0.00
|
9.80
|
|
Total
|
68
|
6,228
|
4,694
|
7,726
|
1.43
|
0.00
|
9.80
|
|
|
7-16 |
30 SEPTEMBER 2025
|
|
Rhyolite Ridge Lithium-Boron Project
|
S-K 1300 Technical Report Summary
|
|
|
7-17 |
30 SEPTEMBER 2025
|
|
Rhyolite Ridge Lithium-Boron Project
|
S-K 1300 Technical Report Summary
|
|
7.3.5.
|
QP Statement on Hydrogeology
|
|
7.4.
|
Quarry Stability- Geotechnical Drilling and Sampling
|
|
7.4.1.
|
Field Investigation
|
|
|
• |
Collection of geotechnical drilling data and samples from ioneer’s drilling program;
|
|
|
• |
Planning and execution of a geotechnical laboratory testing program;
|
|
|
• |
Evaluation of geotechnical laboratory test results;
|
|
|
• |
Compilation of both GLA collected geotechnical drilling data and previously collected cell mapping data and oriented borehole data into stereonets.
|
|
7.4.1.1.
|
Sample Collection
|
 |
7-18 |
30 SEPTEMBER 2025
|
|
Rhyolite Ridge Lithium-Boron Project
|
S-K 1300 Technical Report Summary
|
|
7.4.1.2.
|
2018-2019 Drilling Program
|
|
7.4.1.3.
|
2022-2024 Drilling Program
|
|
|
7-19 |
30 SEPTEMBER 2025
|
|
Rhyolite Ridge Lithium-Boron Project
|
S-K 1300 Technical Report Summary
|
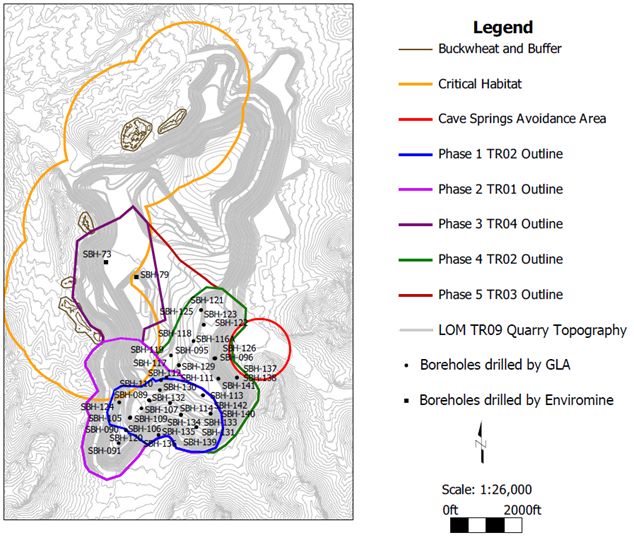
|
|
7-20 |
30 SEPTEMBER 2025
|
|
Rhyolite Ridge Lithium-Boron Project
|
S-K 1300 Technical Report Summary
|
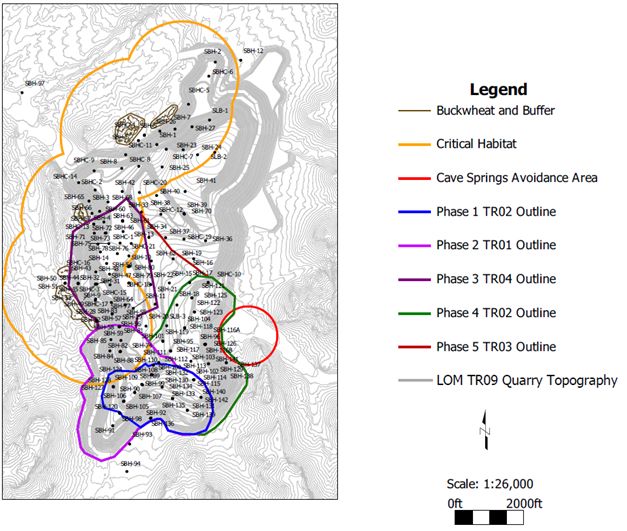
|
7.4.2.
|
Data Verification
|
|
|
7-21 |
30 SEPTEMBER 2025
|
|
Rhyolite Ridge Lithium-Boron Project
|
S-K 1300 Technical Report Summary
|
|
7.4.3.
|
Laboratory Testing and Cell Mapping
|
|
7.4.3.1.
|
2018-2019
|
|
|
7-22 |
30 SEPTEMBER 2025
|
|
Rhyolite Ridge Lithium-Boron Project
|
S-K 1300 Technical Report Summary
|
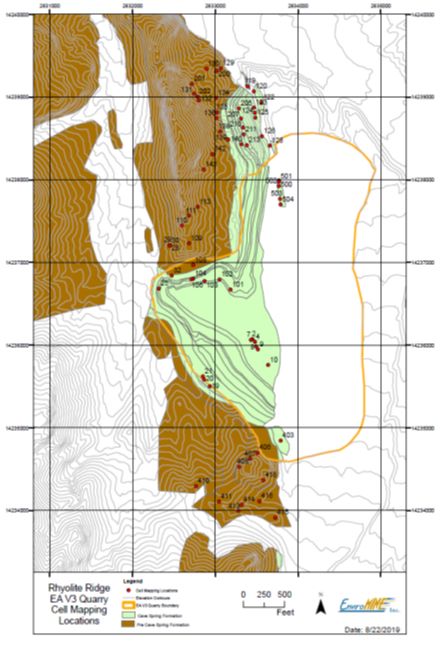
|
|
7-23 |
30 SEPTEMBER 2025
|
|
Rhyolite Ridge Lithium-Boron Project
|
S-K 1300 Technical Report Summary
|
|
Number of Each Test Listed
|
||||||
|
Rock
Type
|
Bulk
Density
|
Uniaxial
Compression
|
Young’s
modulus/
Poisson’s
Ratio
|
Triaxial
Compression
|
Indirect
Tensile |
Direct
Sheer
|
|
Q1
|
0
|
0
|
0
|
0
|
0
|
0
|
|
SW
|
6
|
2
|
2
|
1
|
3
|
5-BD
|
|
S3
|
14
|
2
|
1
|
1
|
11
|
5-BD
|
|
G4
|
12
|
3
|
1
|
3
|
6
|
0
|
|
M4
|
1
|
0
|
0
|
1
|
0
|
1
|
|
G5
|
3
|
0
|
0
|
2
|
1
|
0
|
|
M5a
|
0
|
0
|
0
|
0
|
0
|
4-BD
|
|
M5
|
3
|
0
|
0
|
3
|
0
|
0
|
|
B5
|
11
|
1
|
1
|
3
|
7
|
2-BD
|
|
S5
|
10
|
3
|
1
|
2
|
5
|
4-BD
2-JT
|
|
G6
|
8
|
3
|
1
|
1
|
4
|
0
|
|
L6
|
0
|
0
|
0
|
0
|
2
|
5-BD
|
|
LSI
|
0
|
0
|
0
|
0
|
0
|
0
|
|
G7
|
13
|
4
|
1
|
3
|
6
|
0
|
|
TBX
|
11
|
1
|
1
|
3
|
7
|
1-JT
|
|
WT
|
0
|
0
|
0
|
0
|
0
|
0
|
|
Z
|
19
|
4
|
2
|
3
|
12
|
1-JT
|
|
F
|
0
|
0
|
0
|
0
|
0
|
0
|
|
Totals
|
111
|
23
|
11
|
26
|
64
|
30
|
|
|
• |
23 Unconfined Compressive Strength (UCS) tests were performed, In accordance with ASTM D7012-10.
|
|
|
• |
26 triaxial compression tests (TCS) were performed, in accordance with ASTM D2664-95.
|
|
|
• |
64 indirect Brazilian disk (tension) tests were performed in accordance with ASTM D3967-05.
|
|
7.4.3.2.
|
2022-2024
|
|
|
• |
Seventy-Eight (78) direct shear tests were performed. Soil-like samples were tested based on ASTM D3080 and rock samples (discontinuity
shear tests) were tested based on ASTM D 5607;
|
|
|
• |
Sixty-Seven (67) Consolidated Undrained (CU) Triaxial tests were performed (ASTM D4767);
|
|
|
• |
Twenty-One (21) Unconfined Compression Strength (UCS) tests were performed (ASTM D7012) with twenty-three (23) results incorporated from
EnviroMine equaling forty-four (44) total UCS test results;
|
|
|
7-24 |
30 SEPTEMBER 2025
|
|
Rhyolite Ridge Lithium-Boron Project
|
S-K 1300 Technical Report Summary
|
|
|
• |
Six (6) slake durability tests (ASTM D4644);
|
|
|
• |
Nine (9) fine specific gravity (ASTM D854);
|
|
|
• |
Seven (7) particle size analysis (ASTM D6913).
|
|
|
7-25 |
30 SEPTEMBER 2025
|
|
Rhyolite Ridge Lithium-Boron Project
|
S-K 1300 Technical Report Summary
|
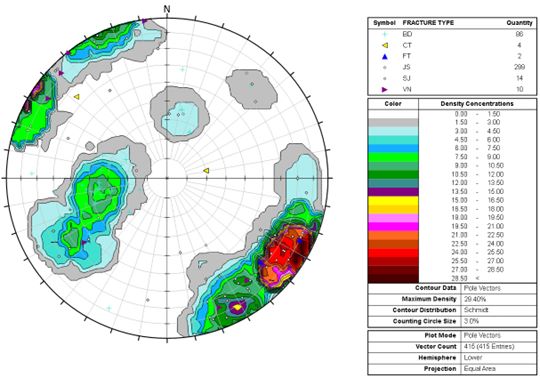
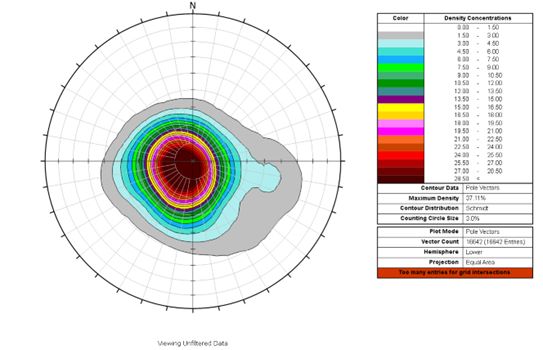
|
|
7-26 |
30 SEPTEMBER 2025
|
|
Rhyolite Ridge Lithium-Boron Project
|
S-K 1300 Technical Report Summary
|
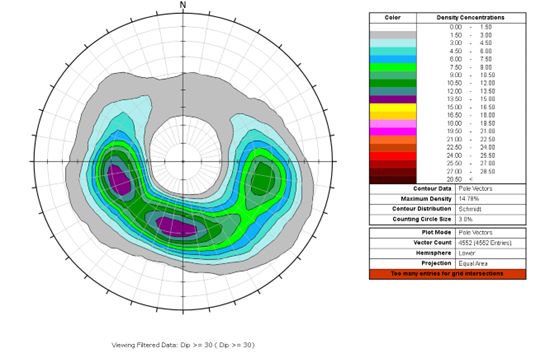
|
7.4.4.
|
Statement on Geotechnical
|
|
7.5.
|
Infrastructure - Geotechnical Drilling and Sampling
|
|
7.5.1.
|
Sampling Methods and Laboratory Determinations
|
|
|
- |
Characterizing soil, rock, and near surface groundwater conditions;
|
|
|
7-27 |
30 SEPTEMBER 2025
|
|
Rhyolite Ridge Lithium-Boron Project
|
S-K 1300 Technical Report Summary
|
|
|
- |
Identifying subsurface hazards that may influence site development of the spent ore storage facility and process facilities areas;
|
|
|
- |
Identifying potential borrow sources for construction materials.
|
|
Facility Area
|
Type
|
Total
|
Linear Footage (m)
|
|
Process
|
Drill hole
|
6
|
89.6
|
|
Spent ore storage
facility
|
Drill hole
|
5
|
98.3
|
|
South OSF
|
Drill Hole
|
2
|
61.6
|
|
North OSF
|
Drill Hole
|
2
|
27.4
|
|
Total
|
15
|
276.9
|
|
|
Facility Area
|
Type
|
Total
|
Mean Depth (m)
|
|
Process
|
Test pit
|
8
|
5.5
|
|
Process access road
|
Test pit
|
3
|
4.7
|
|
Spent ore storage
facility
|
Test pit
|
11
|
4.6
|
|
Spent ore storage
facility access road
|
Test pit
|
2
|
3.8
|
|
Test Pit Total
|
24
|
4.8
|
|
|
Facility Area
|
Type
|
Total
|
Linear Footage (ft)
|
|
Process
|
Drill hole
|
6
|
294.0
|
|
Spent ore storage
facility
|
Drill hole
|
5
|
322.5
|
|
South OSF
|
Drill Hole
|
2
|
202
|
|
North OSF
|
Drill Hole
|
2
|
90
|
|
Total
|
15
|
908.5
|
|
|
Facility Area
|
Type
|
Total
|
Mean Depth (ft)
|
|
Process
|
Test pit
|
8
|
18.2
|
|
Process access road
|
Test pit
|
3
|
15.5
|
|
Spent ore storage
facility
|
Test pit
|
11
|
15.0
|
|
Spent ore storage
facility access road
|
Test pit
|
2
|
12.5
|
|
Test Pit Total
|
24
|
15.9
|
|
|
|
7-28 |
30 SEPTEMBER 2025
|
|
Rhyolite Ridge Lithium-Boron Project
|
S-K 1300 Technical Report Summary
|
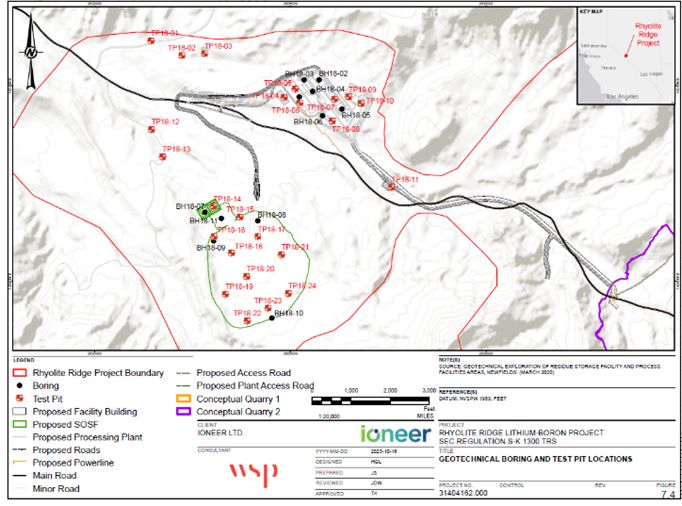
|
|
7-29 |
30 SEPTEMBER 2025
|
|
Rhyolite Ridge Lithium-Boron Project
|
S-K 1300 Technical Report Summary
|
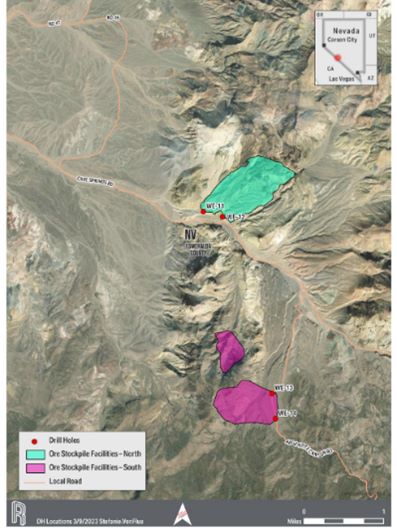
|
|
7-30 |
30 SEPTEMBER 2025
|
|
Rhyolite Ridge Lithium-Boron Project
|
S-K 1300 Technical Report Summary
|
|
Parameter
|
Area
|
Notes and Findings
|
|||||
|
Subsurface condition
|
Proposed process facility area
|
Subsurface is poorly stratified and consist of intermixed alluvium deposits of sand and gravel with trace to some silt.
Granular surface soils are loose to a depth of 1 to 2 ft; medium dense to dense from 2 to 12 ft bgs; and becoming very dense
with depth.
No bedrock encountered.
|
|||||
|
Planned spent ore storage facility area
|
Subsurface is sorted to poorly sorted and moderately stratified. Deposits consist of sand and gravel with trace to some
silt.
Granular surface soils are loose to a depth of 1 to 2 ft; dense to very dense from 2 to 6 ft bgs; becoming very dense with
depth.
No bedrock encountered.
|
||||||
|
Groundwater
|
Proposed process facility and planned spent ore storage facility areas
|
Free water or indications of past groundwater conditions were not encountered. Groundwater is not anticipated to influence
construction activities or operation of the facilities.
|
|||||
|
Resistivity testing
|
Subgrade soils have a severe corrosion potential when in contact with metallic objects and varied between 200 to 1,530
ohm-centimeters (Ω-cm)
|
||||||
|
Chemical testing
|
The soluble sulphate content of seven soils samples ranged from 19.3 ppm to 918.2 ppm. One soil sample has a Class 0
severity of potential exposure or a negligible exposure potential; the other six samples are classified as Class I severity of potential exposure.
|
||||||
|
Proposed process facility area
|
Soil conditions are potentially corrosive (i.e., soil might contain chemical components that can react with construction
materials, such as concrete and metals, that may damage foundations and buried pipelines)
|
|
|
7-31 |
30 SEPTEMBER 2025
|
|
Rhyolite Ridge Lithium-Boron Project
|
S-K 1300 Technical Report Summary
|
|
7.5.2.
|
Data Verification
|
|
7.5.3.
|
Testwork In Support of Spent Ore Storage and Process Facility Locations
|
|
7.5.4.
|
QP Statement on Geotechnical
|
|
|
7-32 |
30 SEPTEMBER 2025
|
|
Rhyolite Ridge Lithium-Boron Project
|
S-K 1300 Technical Report Summary
|
|
8.
|
SAMPLE PREPARATION, ANALYSES, AND SECURITY
|
|
8.1.
|
Field Sampling Techniques
|
|
8.1.1.
|
RC Drilling
|
|
8.1.2.
|
Core Drilling
|
|
|
8-1 |
30 SEPTEMBER 2025
|
|
Rhyolite Ridge Lithium-Boron Project
|
S-K 1300 Technical Report Summary
|
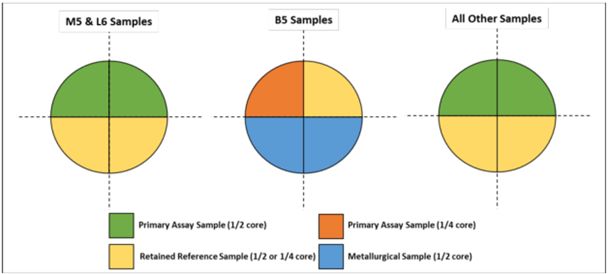
|
8.2.
|
Sample Results
|
|
Drill Type
|
Year
|
Sample Count
|
Mean Sample
Length (m)
|
Min. Sample
Length (m)
|
Max.
Sample
Length
(m)
|
|
RC Drill Holes
|
2010-2012
|
2,399
|
1.52
|
1.52
|
1.52
|
|
2016-2017
|
3,465
|
1.52
|
1.52
|
1.52
|
|
|
2018-2019
|
26
|
1.52
|
1.52
|
1.52
|
|
|
2023 (Phase 2)
|
730
|
1.52
|
1.52
|
3.05
|
|
|
Core Drill Holes
|
2010-2012
|
3,053
|
1.58
|
0.30
|
3.05
|
|
2016-2017
|
437
|
1.95
|
0.43
|
3.05
|
|
|
2018-2019
|
1,633
|
1.46
|
0.24
|
1.83
|
|
|
2022 (Phase 1)
|
423
|
1.46
|
0.61
|
2.13
|
|
|
2023 (Phase 2)
|
587
|
1.46
|
0.46
|
2.65
|
|
|
2023-2024 (Phase 3)
|
728
|
1.43
|
0.46
|
3.35
|
|
|
Total:
|
13,481
|
1.52
|
0.79
|
2.43
|
|
|
|
8-2 |
30 SEPTEMBER 2025
|
|
Rhyolite Ridge Lithium-Boron Project
|
S-K 1300 Technical Report Summary
|
|
Drill Type
|
Year
|
Sample Count
|
Mean Sample
Length (ft)
|
Min. Sample
Length (ft)
|
Max.
Sample
Length
(ft)
|
|
RC Drill Holes
|
2010-2012
|
2,399
|
5.0
|
5.0
|
5.0
|
|
2016-2017
|
3,465
|
5.0
|
5.0
|
5.0
|
|
|
2018-2019
|
26
|
5.0
|
5.0
|
5.0
|
|
|
2023 (Phase 2)
|
730
|
5.0
|
5.0
|
10.0
|
|
|
Core Drill Holes
|
2010-2012
|
3,053
|
5.2
|
1.0
|
10.0
|
|
2016-2017
|
437
|
6.4
|
1.4
|
10.0
|
|
|
2018-2019
|
1,633
|
4.8
|
0.8
|
6.0
|
|
|
2022 (Phase 1)
|
423
|
4.8
|
2.0
|
7.0
|
|
|
2023 (Phase 2)
|
587
|
4.8
|
1.5
|
8.7
|
|
|
2023-2024 (Phase 3)
|
728
|
4.7
|
1.5
|
11.0
|
|
|
Total:
|
13,481
|
5.0
|
2.6
|
8.0
|
|
|
8.3.
|
Sample Audits and Reviews
|
|
8.4.
|
Analytical and Test Laboratories
|
|
8.5.
|
Sample Security
|
|
|
8-3 |
30 SEPTEMBER 2025
|
|
Rhyolite Ridge Lithium-Boron Project
|
S-K 1300 Technical Report Summary
|
|
8.6.
|
Sample Preparation
|
|
8.7.
|
Analytical Method
|
|
|
- |
Sample preparation (PREP-31y): crusher/rotary splitter combination; crush to 70% less than 2 mm, rotary split off 250 g, pulverize split
to better than 85% passing 75 µm.
|
|
|
- |
Multi-element analysis (ME-MS41): evaluation by aqua regia with inductively coupled plasma mass spectrometry (ICP-MS) finish for 51 elements, including
lithium and boron.
|
|
|
- |
Boron (B-ICP82a): high-grade boron samples (>10,000 ppm boron), were further analyzed by NaOH fusion/ICP high-grade analysis.
|
|
|
- |
Inorganic carbon (C-GAS05): 95% of the 2018-2019 samples were analyzed for inorganic carbon by HClO4 digestion and CO2 coulometer.
|
|
|
- |
Fluorine (F-ELE81a): 30% of the 2018-2019 and selective samples since 2022 were analyzed for fluorine by KOH fusion and ion selective electrode.
|
|
8.8.
|
Quality Control and Quality Assurance Programs
|
|
|
- |
2010-2011 program: one of five different standard reference material (SRM) samples and a small number of field blanks were inserted
regularly into the sample sequence.
|
|
|
- |
2016-2017 program: a duplicate sample was collected every 20th
primary sample. Field blanks and SRMs were also inserted approximately every 25 samples to assess QA/QC.
|
|
|
- |
2018-2019 program: QA/QC samples comprising 1 field blank and 1 SRM were inserted into each sample batch every 25 samples. Submission of
field duplicates, laboratory coarse/pulp replicates and umpire assays were submitted in later stages of the 2018-2019 drilling program.
|
|
|
- |
2022-2024 program: QA/QC samples comprising of 1 SRM and 1 field blank were inserted into each sample batch approximately every 25
samples. Submission of field duplicates were taken either at time of original split or later on in the sampling process. Check assays for 2022-2024 were submitted post drilling.
|
|
|
8-4 |
30 SEPTEMBER 2025
|
|
Rhyolite Ridge Lithium-Boron Project
|
S-K 1300 Technical Report Summary
|
|
Drill Program
|
Total Assay Samples
|
QA/QC Samples
|
||||
|
SRM
|
Blank
|
Duplicate
|
Total QA/QC Samples
|
Percentage of Total Samples
|
||
|
2010-2012
|
6,071
|
556
|
44
|
-
|
600
|
10%
|
|
2016-2017
|
4,388
|
221
|
161
|
161
|
543
|
12%
|
|
2018-2019
|
1,475
|
67
|
70
|
70
|
207
|
14%
|
|
2022- 2024
|
1,547
|
132
|
95
|
103
|
330
|
21%
|
|
Total:
|
13,481
|
976
|
370
|
334
|
1,680
|
12%
|
|
8.9.
|
Verification of Sampling and Assaying
|
| 8.10. |
QP’s Opinion Regarding Sample Preparation, Security, and Analytical Procedures
|
|
|
- |
QA/QC protocol has recently been revised to include field duplicates, laboratory replicates (coarse and pulp replicates) and check
assay analyses at a second independent commercial laboratory, assure this practice is followed for future programs.
|
|
|
- |
Discontinue use of Standard 10.14 and Standard 10.12. Implement use of new mid-range standards to compliment grade coverage of
remaining standards 10.11, 10.13 and 10.15. This will be in place for the next round of drilling.
|
|
|
- |
Complete the fusion assay for boron over limits on QA/QC assays.
|
|
|
- |
Compile all the QA/QC data for the project into one set of files.
|
|
|
8-5 |
30 SEPTEMBER 2025
|
|
Rhyolite Ridge Lithium-Boron Project
|
S-K 1300 Technical Report Summary
|
|
9.
|
DATA VERIFICATION
|
|
9.1.
|
Exploration Data Compilation
|
|
9.2.
|
Data Verification by Qualified Person
|
|
|
9-1 |
30 SEPTEMBER 2025
|
|
Rhyolite Ridge Lithium-Boron Project
|
S-K 1300 Technical Report Summary
|
|
•
|
Drill hole collar elevations versus topography;
|
|
•
|
Comparison of the drill hole geologic logging with the block model geology;
|
|
•
|
Checks of database assays with original lab certificates;
|
|
•
|
Review of the QA/QC data including assays of standards, duplicates and blanks;
|
|
•
|
Review of the density data.
|
|
9.2.1.
|
Drill Hole Collar Checks
|
|
9.2.2.
|
Comparison of Geologic Logging to Block Model Geology
|
|
9.2.3.
|
Certificate Checks
|
|
|
9-2 |
30 SEPTEMBER 2025
|
|
Rhyolite Ridge Lithium-Boron Project
|
S-K 1300 Technical Report Summary
|
|
9.2.4.
|
Check of Standards, Blanks and Duplicates
|
|
9.2.4.1.
|
Standards
|
|
Standard
|
Number
|
Standard
Li, ppm
|
Avg. Value
Li, ppm
|
Standard
B, ppm
|
Number
Assayed for
over limit
|
Avg. Value for over limit, B,
ppm
|
|
11
|
40
|
723.1
|
761
|
15,000
|
20
|
15279
|
|
12
|
42
|
1171.8
|
1273
|
14,090
|
21
|
17224
|
|
13
|
41
|
1180.0
|
1287
|
17,390
|
20
|
17432
|
|
14
|
57
|
814.0
|
774
|
1,740
|
||
|
15
|
37
|
1606.4
|
1716
|
16,000
|
20
|
16320
|
|
|
9-3 |
30 SEPTEMBER 2025
|
|
Rhyolite Ridge Lithium-Boron Project
|
S-K 1300 Technical Report Summary
|
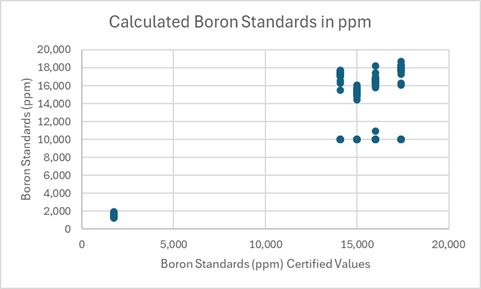
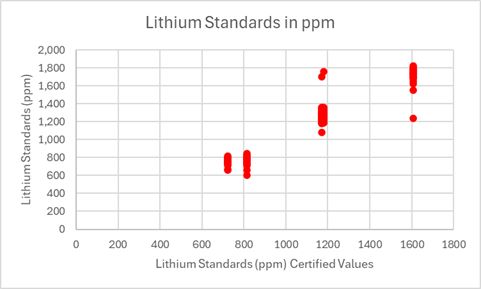
|
|
9-4 |
30 SEPTEMBER 2025
|
|
Rhyolite Ridge Lithium-Boron Project
|
S-K 1300 Technical Report Summary
|
|
9.2.4.2.
|
Blanks
|
|
Seam
|
# of Blanks
|
Boron
|
Lithium
|
||||
|
Average, ppm
|
Minimum, ppm
|
Maximum, ppm
|
Average, ppm
|
Minimum, ppm
|
Maximum, ppm
|
||
|
Q1
|
5
|
10.0
|
10.0
|
10.0
|
5.1
|
0.6
|
9.5
|
|
S3
|
47
|
22.8
|
10.0
|
350.0
|
11.8
|
0.8
|
269.0
|
|
G4
|
7
|
11.4
|
10.0
|
20.0
|
5.2
|
0.8
|
11.3
|
|
M4
|
14
|
11.3
|
10.0
|
30.0
|
8.3
|
2.6
|
24.3
|
|
G5
|
2
|
10.0
|
10.0
|
10.0
|
9.0
|
3.8
|
14.2
|
|
M5
|
55
|
47.8
|
10.0
|
170.0
|
21.7
|
3.7
|
185.0
|
|
B5
|
55
|
137.8
|
10.0
|
1030.0
|
18.1
|
3.9
|
77.9
|
|
S5
|
26
|
30.7
|
10.0
|
250.0
|
9.3
|
1.6
|
19.8
|
|
G6
|
8
|
16.3
|
10.0
|
30.0
|
7.3
|
1.3
|
11.3
|
|
L6
|
44
|
40.7
|
10.0
|
330.0
|
10.7
|
2.3
|
56.5
|
|
Lsi
|
5
|
30.0
|
10.0
|
80.0
|
4.4
|
3.0
|
5.9
|
|
G7
|
6
|
13.3
|
10.0
|
20.0
|
9.4
|
0.9
|
34.4
|
|
Tlv
|
2
|
10.0
|
10.0
|
10.0
|
1.1
|
1.1
|
1.2
|
|
Tbx
|
5
|
10.0
|
10.0
|
10.0
|
2.7
|
0.9
|
6.8
|
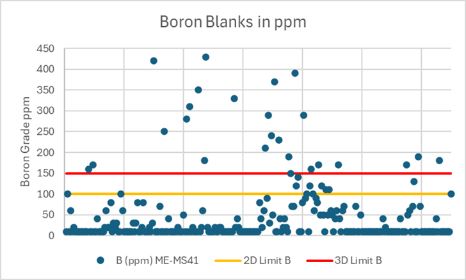
|
|
9-5 |
30 SEPTEMBER 2025
|
|
Rhyolite Ridge Lithium-Boron Project
|
S-K 1300 Technical Report Summary
|
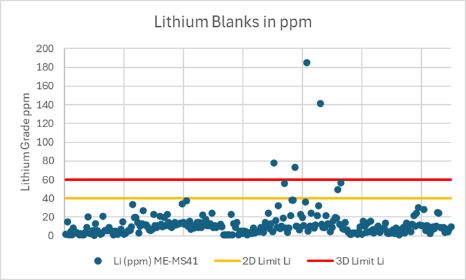
|
9.2.4.3.
|
Field Duplicates
|
|
|
9-6 |
30 SEPTEMBER 2025
|
|
Rhyolite Ridge Lithium-Boron Project
|
S-K 1300 Technical Report Summary
|
|
Seam
|
# of
Duplicates
|
Boron
|
Lithium
|
||||
|
Original
Assay,
Average
ppm
|
Duplicate
Assay,
Average
ppm
|
R2 value
|
Original
Assay,
Average
ppm
|
Duplicate
Assay,
Average
ppm
|
R2 value
|
||
|
Q1
|
1
|
25
|
20
|
41
|
46
|
||
|
S3
|
67
|
97
|
96
|
0.9828
|
286
|
296
|
0.9939
|
|
G4
|
8
|
72
|
70
|
0.9842
|
215
|
210
|
0.9830
|
|
M4
|
23
|
64
|
61
|
0.9364
|
1194
|
1163
|
0.9938
|
|
G5
|
6
|
95
|
102
|
0.9442
|
1056
|
1075
|
0.9923
|
|
M5
|
45
|
1695
|
1654
|
0.9913
|
2504
|
2503
|
0.9993
|
|
B5
|
48
|
14474
|
14379
|
0.9970
|
1961
|
1955
|
0.9966
|
|
S5
|
45
|
1317
|
1159
|
0.9373
|
1151
|
1090
|
0.9837
|
|
G6
|
13
|
103
|
105
|
0.9831
|
254
|
254
|
0.9992
|
|
L6
|
43
|
3684
|
3665
|
0.9989
|
1141
|
1129
|
0.9958
|
|
Lsi
|
5
|
617
|
596
|
0.9977
|
769
|
773
|
0.9995
|
|
G7
|
5
|
86
|
86
|
0.9991
|
85
|
89
|
0.9911
|
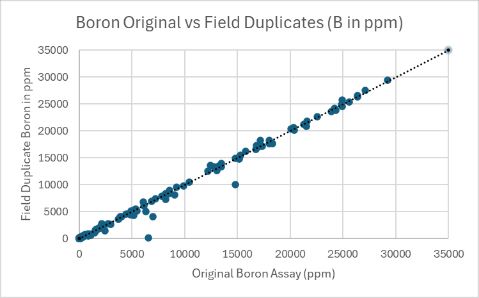
|
|
9-7 |
30 SEPTEMBER 2025
|
|
Rhyolite Ridge Lithium-Boron Project
|
S-K 1300 Technical Report Summary
|
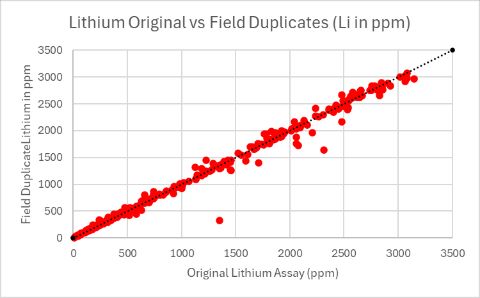
|
9.2.5.
|
Density Data
|
|
9.3.
|
Qualified Person’s Opinion on Data Adequacy
|
|
|
9-8 |
30 SEPTEMBER 2025
|
|
Rhyolite Ridge Lithium-Boron Project
|
S-K 1300 Technical Report Summary
|
|
10.
|
MINERAL PROCESSING AND METALLURGICAL TESTING
|
|
◾
|
HiB-Li (stream 1): occurs primarily within the B5 mineralized unit, with additional occurrences in the M5,
S5 and L6 units;
|
|
◾
|
LoB-Li (stream 2 & 3): occurs primarily within the L6 mineralized unit, with additional occurrences in
the B5, M5 and S5 units.
|
|
◾
|
M5: high-grade lithium, low- to moderate-grade boron bearing carbonate-clay rich marl;
|
|
◾
|
B5: high-grade boron, moderate-grade lithium marl;
|
|
◾
|
S5: moderate-grade lithium, low-grade boron;
|
|
◾
|
L6: low- to high-grade lithium and boron.
|
|
10.1.
|
Mineral Processing and Metallurgical Testing (Pre-2024)
|
|
10.1.1.
|
Stream 1
|
|
10.1.1.1.
|
Feasibility Study Testwork
|
|
◾
|
Difficult crystal/liquor separation characteristics of crystal slurries generated in PLS evaporation and
sulfate crystallization;
|
|
◾
|
Excessive losses of lithium due to high liquor entrainment in sulfate salts due to crystal fines;
|
|
|
10-1 |
30 SEPTEMBER 2025
|
|
Rhyolite Ridge Lithium-Boron Project
|
S-K 1300 Technical Report Summary
|
|
◾
|
Formation of undesirable lithium double salts;
|
|
◾
|
Unrepresentative boric acid flotation behavior resulting from fine-grained crystals generated in PLS
evaporation and sulfate crystallization.
|
|
|
10-2 |
30 SEPTEMBER 2025
|
|
Rhyolite Ridge Lithium-Boron Project
|
S-K 1300 Technical Report Summary
|
|
Report Date
|
Test Program
|
Purpose
|
Results
|
Analytical Methods
|
Unit
Operations
|
Lab/Testing Facility
|
|||||
|
2017
|
Exploratory
metallurgical
testing of lithium-
boron ores
|
Exploratory leach extraction to confirm impact of pH, temperature and time
|
- Confirmed necessary
pH condition to recover lithium (≤ pH 0) and boron (≤ pH 3);
- Showed limited
influence by temperature;
- Confirmed leaching
time for lithium and boron extraction is fast (< 90 mins) for a near complete extraction when processing 6 mesh material;
- Confirmed gangue
extraction and acid consumption.
|
- Head samples
analyzed by XRF whole rock analysis;
- Aqueous cations by
ICP (method not specified).
|
Leach
|
SGS Lakefield
|
|||||
|
2018
|
Brine
evaporation
testwork
|
Exploratory brine evaporation to confirm lithium recovery
|
- Measured
solubilities of key cations and anions;
- Measured
crystallization products and speciation;
- Determined maximum
lithium concentration through evaporation;
- Determined cation
deportment through salt crystallization.
|
- Metal analysis by
Atomic Absorption spectrometry (AAS);
- Cl- by the
argentometric method;
- SO4 by gravimetry
with residue drying;
- Boron by acid-base
titration;
- Fluorine by
ion-selective electrode (ISE);
- Sold salt speciation
determined through XRD and mass balance;
- Solution activity by
Novasina water activity (AW) device;
- Density measured
using DMA densitometer.
|
CRZ1
EVP1
CRZ2
|
Centro de Investigación Científico Tecnológico para la Minería (CICTEM)
Chile
(Scientific and Technological Research Center for Mining)
|
|
|
10-3 |
30 SEPTEMBER 2025
|
|
Rhyolite Ridge Lithium-Boron Project
|
S-K 1300 Technical Report Summary
|
|
|
Report Date |
|
Test Program |
|
Purpose |
|
Results |
|
Analytical Methods |
Unit
Operations
|
Lab/Testing Facility |
|
2018
|
Lithium boron
ore leaching
|
Sulfuric acid leach tests
|
- Further developed
sulfuric acid leaching flowsheet;
- Tested column
leaching arrangement
- Tested counter
current arrangement;
- Tested counter
current batch cycle arrangement;
- Refine acid addition
requirements;
- Confirmed extraction
and kinetics;
- Confirmed PLS grade;
- Measured dewatering
properties.
|
- Metals by atomic
adsorption spectrometry (AAS);
- Boron by modified
mannitol acid-base titration;
- Boron solids by
fusion-inductively coupled plasma (ICP);
- Free acid by
titration;
- Fluoride by sodium
peroxide fusion and ion selective electrode (ISE);
- Total sulfur by LECO
combustion method.
|
Leach
|
Hazen, Denver
|
|||||
|
2018
|
Mineralization
|
Identify mineral species through speciation by size fraction
|
- Identified major and
minor mineral species in ores.
|
- Mineral analysis by
x-ray diffraction (XRD) and electron microprobe analyses (EMP).
|
-
|
Hazen, Denver
|
|||||
|
2018
|
Brine purification
through
neutralization
|
Scoping test for brine cleaning by reagent addition and pH change.
|
- Confirmed metal
deportment vs pH;
- Confirmed residence
time required for metal deportment.
|
- Metals by atomic
adsorption spectrometry (AAS);
- Boron by modified
mannitol acid-base titration, boron solids by fusion-inductively coupled plasma (ICP);
- Free acid by
titration;
- Fluoride by sodium
peroxide fusion and ion selective electrode (ISE);
- Total sulfur by LECO
combustion method.
|
Leach
|
Hazen, Denver
|
|||||
|
2018
|
Processing and
evaporation of
lithium
containing brines
|
Measure metal deportment by oxidation and neutralization
Confirm boric acid recovery
Confirm brine evaporation, metal deportment by crystallization, lithium concentration by evaporative and cooling
crystallization
|
- Confirmed metal
deportment in neutralization stage;
- Confirmed boric acid
solubility and recovery;
- Confirmed
solubilities in evaporation system;
- Confirmed solids
deportment and solids speciation in evaporation system;
- Confirmed lithium
concentrating potential, and final brine composition.
|
- Methods not
reported.
|
CRZ1
EVP1
CRZ2
|
IBZ, Germany
|
|
|
10-4 |
30 SEPTEMBER 2025
|
|
Rhyolite Ridge Lithium-Boron Project
|
S-K 1300 Technical Report Summary
|
|
|
Report Date |
|
Test Program |
|
Purpose |
|
Results |
|
Analytical Methods |
Unit
Operations
|
Lab/Testing Facility |
|
2018
|
Ore CERCHAR
abrasivity testing
|
Confirm ore abrasivity properties
|
- Measured CERCHAR
index for different ore types from different strata.
|
- ASTM D7625.
|
Crushing
|
KCA
|
|||||
|
2018
|
Column leach
(BH-01)
|
Scoping heap leaching test (gravity) to determine leach duration and acid strength
|
- Performed size /
sieve analysis of head and tails;
- Performed extraction
by fraction;
- Measured pay and
gangue metal extraction;
- Measured acid
consumption;
- Measured wash
recovery.
|
- Size analysis by
physical screens;
- Solids digestion by
4 acid;
- Metals analysis by
ICP-OES;
- Whole rock analysis
by lithium metaborate fusion followed by ICAPOES analysis;
- Solution analysis by
flame atomic absorption spectrophotometric (FAAS) or ICP methods;
- Carbon analyses by
LECO.
|
Leaching
|
KCA
|
|||||
|
2018
|
Column leach
(BH-02)
|
Simulate heap leaching method (gravity) over 85 days on 150mm material
|
- Performed size /
sieve analysis of head and tails;
- Performed extraction
by fraction;
- Measured pay and
gangue metal extraction;
- Measured acid
consumption;
- Measured wash
recovery.
|
- Size analysis by
physical screens;
- Solids digestion by
4 acid;
- Metals analysis by
ICP-OES;
- Whole rock analysis
by lithium metaborate fusion followed by ICAPOES analysis;
- Solution analysis by
flame atomic absorption spectrophotometric (FAAS) or ICP methods;
- Carbon analyses by
LECO.
|
Leaching
|
KCA
|
|
|
10-5 |
30 SEPTEMBER 2025
|
|
Rhyolite Ridge Lithium-Boron Project
|
S-K 1300 Technical Report Summary
|
|
|
Report Date |
|
Test Program |
|
Purpose |
|
Results |
|
Analytical Methods |
Unit
Operations
|
Lab/Testing Facility |
|
2018
|
Vat leach
(BH-03)
|
Simulate vat leaching method
|
- Performed size /
sieve analysis of head and tails;
- Performed extraction
by fraction;
- Measured pay and
gangue metal extraction;
- Measured acid
consumption;
- Measured wash
recovery.
|
- Size analysis by
physical screens;
- Solids digestion by
4 acid;
- Metals analysis by
ICP-OES;
- Whole rock analysis
by lithium metaborate fusion followed by ICAPOES analysis;
- Solution analysis by
flame atomic absorption spectrophotometric (FAAS) or ICP methods;
- Carbon analyses by
LECO.
|
Leaching
|
KCA
|
|||||
|
2018
|
Column leach
(BH-04)
|
Simulate heap leach condition with different ore types, different crush size and residence time
|
- Performed size /
sieve analysis of head and tails;
- Performed extraction
by fraction;
- Measured pay and
gangue metal extraction;
- Measured acid
consumption;
- Measured wash
recovery.
|
- Size analysis by
physical screens;
- Solids digestion by
4 acid;
- Metals analysis by
ICP-OES;
- Whole rock analysis
by lithium metaborate fusion followed by ICAPOES analysis;
- Solution analysis by
flame atomic absorption spectrophotometric (FAAS) or ICP methods;
- Carbon analyses by
LECO.
|
Leaching
|
KCA
|
|||||
|
2018
|
Leachate
processing
|
Simulate lithium and boron recovery from leach solution
|
- Measured boric acid
solubility and yield;
- Measured
solubilities in evaporation and crystallization circuits;
- Measured
concentrated lithium brine composition;
- Completed brine
cleaning unit operation;
- Completed lithium
carbonate precipitation;
|
- Methods not
described.
|
CRZ1
EVP1
CRZ2
IR2
Lithium precipitation
|
Suez
|
|
|
10-6 |
30 SEPTEMBER 2025
|
|
Rhyolite Ridge Lithium-Boron Project
|
S-K 1300 Technical Report Summary
|
|
|
Report Date |
|
Test Program |
|
Purpose |
|
Results |
|
Analytical Methods |
Unit
Operations
|
Lab/Testing Facility |
|
2019
|
Vat leach
(BH-05)
|
Simulate counter current vat leach circuit including neutralization
|
- Performed size /
sieve analysis of head and tails;
- Performed extraction
by fraction;
- Measured pay and
gangue metal extraction;
- Measured acid
consumption;
- Measured wash
recovery;
- Measure permeability
and percolation rates.
|
- Size analysis by
physical screens;
- Solids digestion by
4 acid;
- Metals analysis by
ICP-OES;
- Whole rock analysis
by lithium metaborate fusion followed by ICAPOES analysis;
- Solution analysis by
flame atomic absorption spectrophotometric (FAAS) or ICP methods;
- Carbon analyses by
LECO.
|
Leaching
|
KCA
|
|||||
|
2019
|
Boric acid
recovery and
evaporation
simulation
|
Simulate boric acid recovery and evaporation with revised PLS composition
|
- Measured boric acid
solubility and yield;
- Measured
solubilities in evaporation and crystallization circuits;
- Measured
concentrated lithium brine composition;
- Completed brine
cleaning unit operation;
- Completed lithium
carbonate precipitation.
|
- Metals analysis by
analyzed by ICP;
- Cl- by colorimetric
method;
- SO4 by gravimetric
methods,
- Fluoride by IC and
ion specific electrode (ISE);
- Crystalline solids
by XRD.
|
CRZ1
EVP1
CRZ2
IR2
Lithium precipitation
|
Kemetco
|
|||||
|
Q1 2019
|
Bench scale
flowsheet
simulation |
Confirm solubility and physical properties throughout the planned flowsheet
|
- Confirmed solubility
data for all unit operations and validated process design parameters;
- Collected
engineering and physical property data for all unit operations.
|
- Metals analysed by
inductively coupled plasma optical emission spectroscopy (ICP-OES) or atomic absorption spectroscopy (AAS);
- pH measured by glass
combination electrode;
- Density determined
by digital balance and volumetric flask;
- Viscosity determined
by Brookfield viscometer;
- Chloride content
determined by titration with silver nitrate;
- Crystal morphology
photos were taken by polarized light microscope.
|
CRZ1,
CRZ3,
EVP1,
CRZ2,
EVP2
|
Veolia
|
|
|
10-7 |
30 SEPTEMBER 2025
|
|
Rhyolite Ridge Lithium-Boron Project
|
S-K 1300 Technical Report Summary
|
|
|
Report Date |
|
Test Program |
|
Purpose |
|
Results |
|
Analytical Methods |
Unit
Operations
|
Lab/Testing Facility |
|
Q1 2019
|
Physical
characterization
ore, byproducts
and products
|
Comminution and physical properties characterization for crushers, chutes and material handling design
|
- Confirmed physical
and mechanical properties of ore, spent ore, byproduct salts, and final lithium and boron products for engineering and equipment design. Comminution, chute
design, stockpile design and material handling unit operations.
|
Material flowability testing, including:
- Particle breakage
tests by manual hammering;
- Particle size
analysis by dry sieving method and laser diffraction method using a Malvern Mastersizer 2000 with a Scirocco dry dispersion feed unit;
- Cohesive strength
tests;
- Density tests by
liquid displacement method in water;
- Permeability
tests;
- Chute angle tests;
- Wall friction
tests;
- Angle of repose
and drawdown angle test;
- Belt surcharge
angle test;
- Maximum belt
inclination angle test.
|
Crushing and Leaching
|
Jenike and Johansen
|
|||||
|
Q2 2019
|
Bench-scale
lithium circuit
optimization
|
Optimize lithium brine cleaning
|
- Removal of magnesium from lithium brine (CRZ2
product liquor) using lime precipitation was successful;
- Removal of calcium
ahead of lithium precipitation by addition of sodium carbonate was successful.
|
- Metal analysis was
done using ICP-OES;
- Fluoride analysis
was done potentiometrically using an ion-selective electrode (ISE) with a buffer to reduce interference.
|
IR2
|
Kemetco
|
|
|
10-8 |
30 SEPTEMBER 2025
|
|
Rhyolite Ridge Lithium-Boron Project
|
S-K 1300 Technical Report Summary
|
|
|
Report Date |
|
Test Program |
|
Purpose |
|
Results |
|
Analytical Methods |
Unit
Operations
|
Lab/Testing Facility |
|
Q3 2019, Q1 2020
|
Sizer crushing
tests
|
Confirm that size reduction requirements could be met in two stages of crushing
|
- Crusher index
and unconfined compressive strength (UCS) confirmed;
- Closing gap
between sizer teeth in secondary sizers provided desired outcome.
|
- A combination
of vibratory and hand screening was used to separate crushed material into different size fractions, creating particle size distribution (PSD) profiles;
- X-ray
fluorescence (XRF) was used to determine the sample chemistry.
|
Crushing
|
FLSmidth
|
|||||
|
Q2 2019
|
Mineralogy and
geochemical
characterization
|
Characterization of clay minerals in steam 1 and stream 3 zones
|
- Successful
characterization of the mineralogy of the stream 1 (B5) and stream 3 (M5 zones);
- Successful
characterization of the mineralization in the small fraction <2 µm, including clay type.
|
- Metals analysis
by ICP-OES and ICP-MS;
- Mineral
analysis by X-ray powder diffraction (XRPD), SEM-EDS and electron microscopy.
|
Mineralization characterization
|
Hutton Institute
|
|||||
|
Q2-Q3 2019
|
Semi-integrated
pilot plant
|
Integrate the unit operations, identifying any differing results from when the unit operations were individually tested
|
- Lithium
carbonate and boric acid were successfully produced;
- Composition of
PLS produced from vat leach differed from what is expected during commercial operations (addressed in bench-scale evaporation optimization testing);
- Boric acid
flotation from EVP1 and CRZ2 salts was proven to be readily achieved;
- Phase chemistry
of lithium sodium, potassium, and magnesium overlaid with test results identified desirable operational parameters;
- Root cause
analysis performed to identify reasons for poor crystal/liquor separation – these were resolved in ensuing bench-scale evaporation optimization testing
and were as follows:
- Crystals from PLS evaporation and
sulfate crystallization had poor crystal/liquor separation characteristics, resulting in high moisture levels and lithium losses;
- Lithium saturation occurred at below
target concentrations, resulting in lithium salt formation and high lithium losses;
- Lithium brine cleaning using a lime
and soda ash carbonate precipitation system was successfully implemented on the CRZ2 mother liquor ahead of the lithium carbonate precipitation.
|
- Metal analysis
was done using ICP-OES;
- Lithium samples
were assayed with AAS when results were needed quickly for process control and were submitted for ICP analysis to confirm the results and to obtain full
metal scans;
- Fluoride
analysis was done potentiometrically using an ISE with a buffer to reduce interference;
- Chloride
analysis was completed using a colorimetric method;
- Sulfate analysis
was completed using a turbidimetric method;
- Free acid was
determined using two validated titrimetric methods;
- Water insoluble
matter was measured by dissolving sample in a known volume, filtering it, then washing, drying, and weighing the residual solids;
- Moisture content
was only determined for the crude boric acid and high purity wet boric acid. Drying the boric acid led to an overestimation of moisture content since it
can dehydrate to metaboric acid (HBO2);
- Boric acid
assays were completed using a titrimetric method as described in the Analar® Standards for Laboratory Chemicals.
|
Vat leach,
CRZ1,
IR1,
EVP1,
CRZ2,
Boric acid flotation,
CRZ3,
IR2,
Lithium precipitation,
EVP2
|
Kemetco
|
|
|
10-9 |
30 SEPTEMBER 2025
|
|
Rhyolite Ridge Lithium-Boron Project
|
S-K 1300 Technical Report Summary
|
|
|
Report Date |
|
Test Program |
|
Purpose |
|
Results |
|
Analytical Methods |
Unit
Operations
|
Lab/Testing Facility |
|
Q3-Q4 2019
|
|
Leaching (pilot-
and bench-
scale)
|
|
Evaluate the leach response to deposit variability and full vat height
|
|
- Lithium and boron extraction was consistently high with varying head grades;
- Acid concentration must be controlled to avoid permeability issues caused by fines;
- Acid addition at the beginning of the leach cycle is critical to maintain good leach conditions and lithium and boric acid recovery;
- Optimized leaching period to be three days, with a total cycle duration of seven days including loading, neutralization, washing and
unloading.
|
|
Head sampling:
- A LECO CS 230 unit was used for carbon analyses;
- Metals analysis was completed by ICP-OES, using two- or four-acid digestion and peroxide fusion methods for solids;
- Duplicate samples were sent to ALS for lithium, boron and sometimes fluoride content validation.
Solutions sampling:
- Continuous monitoring for pH, oxidation reduction potential (ORP), specific gravity, free acid;
- Sampled periodically for a multi-element suite (ICP-OES).
Vat tailings:
- Weighed before and after drying for moisture content;
- PSD was determined by screening and weighing each fraction;
- Assays were done on the size fractions and combined composite;
- Duplicate samples were sent to ALS for lithium, boron and sometimes fluoride content validation.
|
Vat leach
|
Kappes, Cassiday
& Associates (KCA)
|
|
|
10-10 |
30 SEPTEMBER 2025
|
|
Rhyolite Ridge Lithium-Boron Project
|
S-K 1300 Technical Report Summary
|
|
|
Report Date |
|
Test Program |
|
Purpose |
|
Results |
|
Analytical Methods |
Unit
Operations
|
Lab/Testing Facility |
|
Q4 2019
|
|
Bench-scale
evaporation
optimization
|
|
Optimize PLS evaporation and sulfate salt crystallization at bench scale
|
|
- Feed liquor adjusted to represent expected composition during commercial operations;
- Crystals from both EVP1 & CRZ2 exhibited good crystal/liquor separation with low residual moisture, lending to low lithium losses;
- Defined optimum target lithium end concentrations for both EVP1 & CRZ2;
- Lithium double salt formation avoided by operating in the correct area of the phase diagram in EVP1, and by the removal of aluminum,
iron, and fluoride by lime precipitation ahead of bench scale evaporation/crystallization:
- Optimal boil down conditions for evaporation achieved in EVP1;
- Two stages of cooling implemented in CRZ2;
- Optimized conditions for EVP1 & CRZ2 established for implementation at pilot-scale;
- Evaporation optimization program was successful.
|
|
-
Metals analyzed by ICP-OES;
-
pH measured by glass combination electrode;
- Density determined by digital balance and volumetric flask;
- Viscosity determined by Brookfield viscometer;
- Chloride content determined by titration with silver nitrate;
- Total organic carbon (TOC) determined by combustion followed by infrared detection;
- Crystal habit photos were taken by polarized light microscope and/or stereo microscope.
|
IR1,
EVP1,
CRZ2
|
Kemetco,
Veolia
|
|
|
10-11 |
30 SEPTEMBER 2025
|
|
Rhyolite Ridge Lithium-Boron Project
|
S-K 1300 Technical Report Summary
|
|
|
Report
Date
|
|
Test Program |
|
Purpose |
|
Results |
|
Analytical Methods |
Unit
Operations
|
Lab/Testing
Facility
|
|
Q4 2019-Q2 2020
|
|
Bench-scale
PLS impurity
removal |
|
Proof of concept and optimization testing of PLS impurity removal at bench scale
|
|
- Removal of aluminum and fluorine by an alternate process to form a crystalline sulfate of aluminum and potassium was tested. The process was
successful, achieving:
- High levels of aluminum and fluorine removal to produce a feed suitable for the EVP1 and CRZ2 circuits;
- Low lithium and boron losses;
- Good filtration & washing characteristics.
|
|
- Multi-elemental analysis by two- and four-acid digestion and peroxide fusion methods, followed by ICP-OES using certified standards;
- Solutions were diluted as required and analyzed by flame atomic absorption spectrophotometry (FAAS) or ICP. ISE was used to determine
fluoride and chloride content;
- Free acid was determined through titration to pH 3 of a solution sample. Titrations were conducted in a methanol solution with sodium
hydroxide. The methanol solution contained 0.5 molar MgCl2 to reduce the effects of hydrolysable cations such as Fe3+, Al3+ and Cu2+;
- Solutions and dried solids were also submitted to ALS to perform check assays.
|
IR1
|
KCA,
Kemetco
|
|
|
10-12 |
30 SEPTEMBER 2025
|
|
Rhyolite Ridge Lithium-Boron Project
|
S-K 1300 Technical Report Summary
|
|
|
Report Date |
|
Test Program |
|
Purpose |
|
Results |
|
Analytical Methods |
Unit
Operations
|
Lab/Testing Facility |
|
Q1 2020
|
|
Blend series
leach testing
|
|
Vat leach testing purpose was to
determine fines generation, acid consumption, metal extraction, and solution permeability as a function of leach conditions and sample blend
|
|
- Lithium extractions ranged from 80% to 94% during leaching and 76% to 89% after washing;
- Boron extractions ranged from 80% to 97% during leaching and 56% to 83% after washing.
|
|
- Acid digestion and / or peroxide fusion methods were used. The resulting solution was then assayed semi-quantitatively by means of a Perkin-Elmer 2000 DV ICAP-OES. Certified standards were utilized for the analyses;
- Solution samples were analyzed through flame atomic absorption spectrophotometric (FAAS) or ICP methods;
- Free acid was determined through titration to pH 3 of a solution sample.
|
Vat leach
|
KCA
|
|
|
Q1 2020
|
|
Pilot-scale
evaporation and
crystallization
optimization
|
|
Optimize pilot PLS evaporation and sulfate salt crystallization in the pilot plant operations
|
|
- Bulk impurity removal of
aluminum, iron, and fluoride by lime precipitation before pilot-scale evaporation/ crystallization (Li/B losses unacceptably high, resolved in bench scale impurity removal as explained above);
- Implementation of
bench-scale evaporation & optimization parameters;
- Crystals produced
from EVP1 & CRZ2 exhibited good crystal/liquor separation and low residual moisture contents;
- Achieved target
lithium concentrations in EVP1 & CRZ2;
-
Low lithium losses achieved in EVP1 & CRZ2;
- Results achieved were in alignment with phase diagram expectations.
|
|
- After coning and quartering the
resulting cakes, a small portion of the sample was re-dissolved in water for submission to metals analysis by ICP-OES. Some samples were also submitted for anion analysis;
- Lithium analysis was
conducted by AAS when quick assay result turnaround was required for process control;
- Fluoride analysis
was conducted potentiometrically using an ISE;
- Chloride analysis was conducted using a colorimetric method. In addition to blanks and standards, at least one sample per day was also spiked with chlorine and
the spike recovery was calculated.
|
IR1,
EPV1,
CRZ2
|
Kemetco,
Veolia
|
|
|
10-13 |
30 SEPTEMBER 2025
|
|
Rhyolite Ridge Lithium-Boron Project
|
S-K 1300 Technical Report Summary
|
|
|
Report Date |
|
Test Program |
|
Purpose |
|
Results |
|
Analytical Methods |
Unit
Operations
|
Lab/Testing Facility |
|
Q1 2020
|
|
Bench scale
EVP1 and CRZ2
optimization
|
|
Confirmation of solubility and physical properties
|
|
- Confirmed solubility data for all unit operations and validated process design parameters;
- Collected engineering and physical property data for all unit operations.
|
|
- Metals analyzed by ICP-OES or AAS;
- pH measured by glass combination electrode;
- Density determined by digital balance and volumetric flask;
- Viscosity determined by Brookfield viscometer;
- Chloride content determined by titration with silver nitrate;
- Crystal morphology photos were taken by polarized light microscope.
|
CRZ1,
CRZ3,
EVP1,
CRZ2,
EVP2
|
Veolia
|
|
|
Q1 2020
|
|
Pilot-scale
crystal/liquor
centrifuge
separation
|
|
Vendor bench-scale centrifuge tests for de-brining of sulfate crystals, such that scale-up to industrial sizing can be achieved
|
|
- Operated simultaneously as part of pilot-scale evaporation optimization work;
- Vendor centrifuges used for industrial sizing of equipment in crystal/liquor separation & wash tests;
- Centrifuges achieved high levels of separation, low-liquor contents, and reasonable wash efficiencies;
- Overall lithium losses were minimized.
|
|
- The centrifuge feed was assayed using the same methods mentioned above in the pilot-scale evaporation and crystallization optimization section;
- Pulp density and specific gravity were measured for the feed slurry.
|
EVP1,
CRZ2
|
Kemetco,
Veolia,
TEMA,
Ferrum
|
|
|
10-14 |
30 SEPTEMBER 2025
|
|
Rhyolite Ridge Lithium-Boron Project
|
S-K 1300 Technical Report Summary
|
|
|
Report Date |
|
Test Program |
|
Purpose |
|
Results |
|
Analytical Methods |
Unit
Operations
|
Lab/Testing Facility |
|
Q1 2020
|
|
Bench-scale
flotation
optimization
|
|
Optimize boric acid flotation at bench scale
|
|
- Bench-scale flotation of boric acid from pilot-scale evaporation optimization achieved:
- Good recovery but low grade of boric acid from EVP1 (3rd and 4th effect evaporators);
- Good recovery but low grade of boric acid from CRZ2 (2nd and 4th stage crystallizer);
- Bench scale vacuum dewatering testwork completed to gather engineering data.
|
|
- All samples (head, concentrate, and tails) were assayed by ICP only, which included a full suite of metals and other cations as well as sulfur;
- Crystal morphology and habit was determined by microscopy;
- Moisture content calculated using ICP-OES;
- Density determined by digital balance and volumetric flask.
|
EVP1,
CRZ2
|
Kemetco
|
|
|
10-15 |
30 SEPTEMBER 2025
|
|
Rhyolite Ridge Lithium-Boron Project
|
S-K 1300 Technical Report Summary
|
|
10.1.1.2.
|
Post-Feasibility Study Testwork (Pre-2024)
|
|
|
10-16 |
30 SEPTEMBER 2025
|
|
Rhyolite Ridge Lithium-Boron Project
|
S-K 1300 Technical Report Summary
|
|
|
Report Date |
|
Test Program |
|
Purpose |
|
Results |
|
Analytical Methods |
Unit
Operations
|
Lab/Testing
Facility
|
|
Q1 2021
|
|
Neutralization
kinetics
|
|
Understand the rate and extent of acid consumption occurring during the neutralization stage.
|
|
- Acid consumption and free acid profiles were generated for feeds with varying acidity.
|
|
- Free acid was determined through titration to pH 3 of a solution sample. Titrations were conducted in a methanol solution with sodium hydroxide. The methanol
solution contained 0.5 molar MgCl2 to reduce the effects of hydrolysable cations such as Fe3+, Al3+ and Cu2+.
|
Leaching
|
KCA
|
|
|
Q1-Q2 2021
|
|
Bench-scale
flotation circuit
optimization
|
|
Confirm achievable boric acid recovery and grade. Update flotation process parameters, flowsheet requirements and technical readiness.
|
|
- Rougher-scavenger circuit arrangement confirmed based on the best results toward achieving target boric acid grade and recovery;
- Flowsheet modified to incorporate the direct flotation of fresh boric acid crystals in native brine to prevent excessive co-precipitation
and boric acid grade reduction.
|
|
- Metal analysis completed using ICP-OES;
- Lithium analysis completed by AAS when results were needed quickly for process control and were submitted for ICP analysis to confirm the
results and to obtain full metal scans;
- Chloride was added to the feed solution to provide a second tracer for lithium saturation during evaporation. Chloride analysis
was then completed by a colorimetric method using thiocyanate;
- All samples were high in sulfate so total S results from ICP-OES were converted to sulfate for expedience.
|
Boric acid
flotation
|
Woodgrove,
Kemetco
|
|
|
Q1 2021
|
|
IR1 filtration
testing
|
|
Determine filtration and washing characteristics to inform equipment selection and the design criteria for the circuit.
|
|
- Process parameters updated;
- Reagent selection validated;
- Flowsheet confirmed;
- Data required to inform equipment selection obtained.
|
|
- PSD determined using laser diffraction particle size analyzer and mechanical sieving;
- Metal analysis completed using ICP-OES;
- Lithium analysis completed by AAS when results were needed quickly for process control and were submitted for ICP analysis to
confirm the results and to obtain full metal scans.
|
IR1
|
RMS,
Kemetco
|
|
|
10-17 |
30 SEPTEMBER 2025
|
|
Rhyolite Ridge Lithium-Boron Project
|
S-K 1300 Technical Report Summary
|
|
|
Report Date |
|
Test Program |
|
Purpose |
|
Results |
|
Analytical Methods |
Unit
Operations
|
Lab/Testing Facility |
|
Q1 2021
|
|
IR1, EVP1 and
CRZ2 circuit
optimizations |
|
Reduce lithium losses in evaporation and crystallization circuits, improve understanding of the EVP1 and CRZ2 crystal species, and obtain preliminary crystal dewatering characteristics.
|
|
- Improved performance in EVP1 and CRZ2 with IR1 optimizations;
- Evaporation and crystallization conditions optimized to reduce lithium co-crystallization;
- Determined the impact of impurities on process and dewatering efficiencies.
|
|
- Metal analysis completed using ICP-OES (with digestion prior for solids);
- Lithium analysis completed by AAS when results were needed quickly for process control and were submitted for ICP analysis to confirm the
results and to obtain full metal scans.
|
EVP1,
CRZ2
|
Kemetco
|
|
|
Q2 2021
|
|
Materials of
construction -
leach and IR1
area corrosion
study
|
|
Determine the corrosivity risks associated with the vat leaching and impurity removal process conditions.
|
|
- The vat leaching conditions were shown to be very corrosive on the tested materials;
- The impurity removal conditions did not result in any significant corrosion.
|
|
- U-bend corrosion coupons were weighed before and after trials (after being washed and dried) to determine the mass loss;
- Microscope imaging was used for a qualitative assessment of the corrosion.
|
Leaching,
IR1
|
Acuren
|
|
|
Q3 2023
|
|
B5 leaching
characteristics
– mine plan
(2024)
Small-sized
column testing
|
|
Determined the ore in the southern part of the South Basin, now where mining will start according to the updated mine plan, has similar leaching characteristics to ore in the northern and
western parts of the Basin, which most of the DFS testwork was conducted upon.
|
|
- High lithium extractions achieved;
- High boron extractions achieved;
- Acid consumption was comparable;
- Greater presence of fines, resulting in a turbid PLS;
- More swelling observed than in previous testwork.
|
|
- Carbon and sulfur analyses were completed using a LECO CS 230 unit:
- No pretreatment for total carbon/sulfur;
- Acid or roast pretreatment for carbon/sulfur speciation;
- Digestion by nitric acid, 2-acid, 4-acid, peroxide fusion, or lithium metaborate fusion (whole rock analyses) methods completed for a
series of individual elements;
- Solution analyses by ICAP-OES, FAAS or ISE;
- Free acid determined through titration to pH 3 of a solution sample, in a methanol solution with sodium hydroxide. The methanol contained 0.5 molar
magnesium chloride to reduce the effects of hydrolysable cations such as Fe3+, Al3+ and Cu2+.
|
Leaching
|
KCA
|
|
|
10-18 |
30 SEPTEMBER 2025
|
|
Rhyolite Ridge Lithium-Boron Project
|
S-K 1300 Technical Report Summary
|
|
|
Report Date |
|
Test Program |
|
Purpose |
|
Results |
|
Analytical Methods |
Unit
Operations
|
Lab/Testing Facility |
|
Q4 2023
|
|
B5 leaching
characteristics
– mine plan
(2024)
Medium-sized
column testing
|
|
Determined that the ore in the
southern part of the South Basin, now where mining will start according to the updated mine plan, has similar leaching characteristics to ore in the northern and western parts of the Basin, which
most of the DFS testwork was conducted upon
Completed leach testing in
medium-sized columns to determine permeability and swelling characteristics
|
|
- High lithium extractions achieved;
- High boron extractions achieved;
- Acid consumption was comparable;
- Greater presence of fines, resulting in a turbid PLS;
- Permeability characteristics comparable to previous testwork.
|
|
- Carbon and sulfur analyses were completed using a LECO CS 230 unit:
- No pretreatment for total carbon/sulfur;
- Acid or roast pretreatment for carbon/sulfur speciation;
- Digestion by nitric acid, 2-acid, 4-acid, peroxide fusion, or lithium metaborate fusion (whole rock analyses) methods for a series of
individual elements;
- Solution analyses by ICAP-OES, FAAS or ISE;
- Free acid determined through titration to pH 3 of a solution sample, in a methanol solution with sodium hydroxide. The
methanol contained 0.5 molar magnesium chloride to reduce the effects of hydrolysable cations such as Fe3+, Al3+ and Cu2+.
|
Leaching
|
KCA
|
|
|
Q4 2023
|
|
Thesis –
Mineralization
and
geochemical
characteriza-
tion
|
|
Mineralogy and Geochemistry of a Lithium and Boron Enriched Stratiform Ore Zone in the Cave Spring Formation
|
|
- Geochemical and mineralogical characterization of the lithium bearing clays and boron bearing mineral;
- Investigation into the basin formation and digenic alternation.
|
|
- Metals analysis by ICP-MS and ICP-OES;
- Mineral analysis by XRD, petrographic microscopy and scanning electron microscope (electron dispersive xray spectroscopy).
|
Resource
Characteri-
zation
|
UNR
USGS
|
|
|
10-19 |
30 SEPTEMBER 2025
|
|
Rhyolite Ridge Lithium-Boron Project
|
S-K 1300 Technical Report Summary
|
|
10.1.2.
|
Stream 2 & 3 |
|
Rhyolite Ridge Lithium-Boron Project
|
S-K 1300 Technical Report Summary
|
|
|
Ore
Type
|
Testwork Scope
|
Results
|
Lab/Testing
Facility |
|||
|
|
M5
|
Mineralogy and
geochemical
characterization
|
- Mineralogy and geochemical characterization of M5 mineralized zone.
|
Hazen and
SGS
|
|||
|
Mineralogy and
geochemical
characterization
|
-
Successful characterization of the mineralogy of the stream 1 (B5) and
stream 3 (M5);
-
Successful characterization of the mineralization in the small
fraction <2 µm, including clay type.
|
Hutton
Institute
|
|||||
|
Air
classification/
beneficiation
|
-
Material separated well but no lithium enrichment or carbonate
rejection was observed, indicating that air beneficiation was ineffective for gangue rejection.
|
Prater
|
|||||
|
Agitated leaching
|
-
Particle size had minimal impact on the leaching efficiency;
-
Acid concentration had a greater impact on leaching efficiency but
only to an extent, after which it plateaued;
-
Gangue extraction was high, impacting acid consumption;
-
Two stages of washing with excessive volumes of wash water were
required to recover the PLS, and the filter cakes had high residual moisture.
|
Kemetco
and SGS
|
|||||
|
Roast-water
leaching
|
- Lithium extraction was higher with a gypsum-sodium sulfate mix
than sodium sulfate alone;
-
Boron extractions were very low;
-
Sodium and potassium were the highest extracted impurities.
|
KCA and
SGS
|
|||||
|
Pressure leaching
|
-
Sodium sulfate and sodium hydroxide were tested as lixiviants. Lithium
extractions were low for both, and boron extractions were moderate;
-
Higher extractions were seen of select gangue minerals;
-
Sodium carbonate was also tested as a lixiviant, but no lithium was
extracted so further testing was not pursued.
|
KCA and
Kemetco
|
|||||
|
|
S5/L6
|
Bottle roll leaching
|
-
Demonstrated leachability qualitatively, translating to compatibility
with heap or vat leaching.
|
KCA
|
|||
|
Column leaching
|
-
High lithium extractions were observed but lower boron extractions,
which could potentially be explained by the lower relative head grade or the presence of refractory boron
material;
-
Though gangue extraction was high, the lower gangue head grades and
less aggressive leaching conditions resulted in relatively low acid consumption compared to the B5 base
case;
-
Residual tails moisture was moderate, and some minor swelling was
observed;
-
Results demonstrated that both ores could be amenable to heap
leaching.
|
KCA
|
|||||
|
Vat leaching
|
-
Results were similar to column leaching;
-
Acid consumption was higher than column leaching due to higher gangue
head grades;
-
Significant swelling was observed for S5 and moderate for L6, but
there was no apparent impact on lithium extraction;
-
Results demonstrated that both mineralization types could be amenable
to vat leaching;
|
KCA
|
|||||
|
- Collection of kinetic data to determine impact of reduced leaching time.
|
|||||||
| Agitated leaching |
- Lithium and boron extractions were high for S5. Boron extraction was lower for L6;
-
Gangue head grades and extractions were high, making up the majority
of acid consumption;
-
Results demonstrated that both mineralization types could be amenable
to agitated leaching.
|
Kemetco |
|
Rhyolite Ridge Lithium-Boron Project
|
S-K 1300 Technical Report Summary
|
|
Test Program
|
Analytical Procedures
|
|||
|
Mineral and
geochemical
characterization
|
- Metals analysis by ICP-MS;
- Mineral analysis by QEMSCAN, XRD.
|
|||
|
Mineral and
geochemical
characterization
|
- Metals analysis by ICP-OES and ICP-MS;
- Mineral analysis by XRPD, SEM-EDS and electron microscopy.
|
|||
|
Agitated leaching
(and pressure
leaching for M5)
|
- Aqua regia digestion was used for solids;
- ICP-OES was used for metals analysis;
- X-ray diffraction (XRD) was used for the determination of mineralogical speciation;
- Whole rock analysis was conducted;
- ISE was used for fluoride content determination.
|
|||
|
Bottle roll,
column, and vat
leaching
|
-
Carbon and sulfur analyses were completed using a LECO CS 230 unit:
-
No pretreatment was used for total carbon/sulfur content determination;
-
Acid or roast pretreatments were used for carbon/sulfur speciation
determination;
-
Solids digestion by nitric acid, 2-acid, 4-acid, peroxide fusion, or
lithium metaborate fusion (whole rock analyses) methods were used, followed by ICP analysis for a series of
individual elements;
-
Solutions were analyzed by ICAP-OES, FAAS and/or ISE;
-
Free acid content was determined through titration to pH 3 of a solution
sample, in a methanol solution with sodium hydroxide. The methanol contained 0.5 molar magnesium chloride to
reduce the effects of hydrolysable cations such as Fe3+,
Al3+ and Cu2+.
|
|||
|
Roast-water
leaching
|
-
Same as bottle, column and vat leaching;
-
Quantitative X-ray diffraction (QXRD) was used for specification
determination (by FLSmidth).
|
|
10.2.
|
Laboratories Used for Metallurgical Testing (Pre-2024) |
|
Rhyolite Ridge Lithium-Boron Project
|
S-K 1300 Technical Report Summary
|
|
|
Laboratory or
Testing
Facility
|
Location
|
Scope
|
Certifications
|
Relationship to
ioneer
|
||||
|
|
SGS
|
Lakefield, CA
|
Mineralogy and geochemical characterization, leaching, benefaction,
flotation and roasting.
|
ISO 17025
|
Independent
|
||||
|
|
Hazen
|
Golden, CO
|
Mineralogy and geochemical characterization, leaching, benefaction and
flotation.
|
ISO 17025
|
Independent
|
||||
|
|
Hutton
Institute
|
Craigiebuckler, Aberdeen,
Scotland
|
Mineralogy and characterization.
|
ISO 17025
UKAS 7541
|
Independent
|
||||
|
|
Jenike and
Johansen
|
San Luis Obispo,
CA
|
Characterization of physical properties and measurement of engineering
parameters required for equipment design. Example, density, angle of repose etc. of feed ore, spent ore,
lithium and boron products, and process byproducts.
|
Independent
|
|||||
|
|
Kemetco
|
Richmond, BC,
Canada
|
Hosted and operated the semi-integrated pilot plant. Oversaw and
conducted metallurgical testwork relating to bench-scale lithium circuit optimization, PLS evaporation and
crystallization, PLS impurity removal, boric acid flotation, IR1 filtration, and stream 2 leaching.
|
ISO 17025
|
Independent
|
||||
|
|
Bureau
Veritas
|
Vancouver, BC,
Canada
|
Analytical laboratory used to verify results during testing campaigns.
|
ISO 17025
|
Independent
|
||||
|
|
ALS
|
Reno, NV,
Burnaby, CA
|
Analytical laboratory used to verify results during testing campaigns.
|
ISO 17025
|
Independent
|
||||
|
|
KCA
|
Reno, NV
|
Conducted leaching testwork at bench- and pilot-scale, and testwork
relating to neutralization kinetics, bench-scale PLS impurity removal, and stream 2 leaching.
|
ISO 17025
|
Independent
|
||||
|
|
Veolia
|
Plainfield, IL
|
Conducted bench- and pilot-scale PLS evaporation and crystallization
testwork.
|
ISO 9001
|
Intended vendor
|
||||
|
|
FLSmidth
|
Bethlehem, PA
|
Conducted testwork on the comminution circuit.
|
ISO 9001
|
Intended vendor
|
||||
|
|
Acuren
|
Richmond, BC,
Canada
|
Conducted leaching and IR1 corrosion analysis. Material of construction
recommendations
|
ISO 17025
ISO 9001
|
Independent
|
||||
|
|
Prater
|
Bolingbrook, IL
|
Conducted air classification/beneficiation testwork on M5 mineralization.
|
1
|
Independent
|
||||
|
|
Woodgrove
|
At Kemetco Facility
Richmond, BC,
Canada
|
Conducted boric acid flotation testwork.
|
1
|
Independent
|
||||
|
RMS
|
At Kemetco Facility
Richmond, BC,
Canada
|
Conducted IR1 filtration testwork. Gathered engineering parameters to
allow sizing and process guarantees for filter press’.
|
1
|
Independent
|
|
|
1. |
Analytical service provided by certified lab – Kemetco, ALS or KCA.
Equipment supplier provided test equipment and expertise specific to equipment setup, testing methods and
results interpretation.
|
|
Rhyolite Ridge Lithium-Boron Project
|
S-K 1300 Technical Report Summary
|
|
10.3.
|
Additional
Metallurgical Testwork (Post-2024)
|
|
|
Laboratory or
Testing
Facility
|
Location
|
Scope
|
Certifications
|
Relationship to
ioneer
|
||||
|
|
Kemetco
|
Richmond, BC, Canada
|
Oversaw and conducted lab scale metallurgical test work relating to
boric acid crystallization, PLS impurity removal and filtration, PLS evaporation and crystallization.
Representative of stream 1,2 and 3 blended scenarios.
|
ISO 17025
|
Independent
|
||||
|
|
KCA
|
Reno, NV
|
Conducted leaching testwork at bench- relating to stream 1, 2 and 3
leaching, leach kinetics and dewatering.
|
ISO 17025
|
Independent
|
||||
|
|
FLS
|
Salt Lake City, UT
|
Comminution test work – Stream 2 L6
|
ISO 9001
|
Intended vendor
|
|
10.3.1.
|
Leaching System Optimization
|
|
Rhyolite Ridge Lithium-Boron Project
|
S-K 1300 Technical Report Summary
|
|
|
◾ |
Multi element analysis with ICAP-OES using a
combinations of two-acid and four-acid digestions;
|
|
|
◾ |
Carbon and sulfur analyses by LECO analyzer;
|
|
|
◾ |
Boron analyses using peroxide fusion with an ICP finish;
|
|
|
◾ |
Whole rock analysis using lithium metaborate fusion
followed by ICAP.
|
|
10.3.2.
|
Low Boron Flowsheet
Simulation
|
|
|
◾ |
Multi element analysis with ICP-OES;
|
|
|
◾ |
Chloride analysis by colorimetric method;
|
|
|
◾ |
Fluoride analysis with ISE;
|
|
|
◾ |
Free acid analysis by titration;
|
|
|
◾ |
Cesium and Rubidium analyses with AA.
|
|
10.4.
|
Representativeness
of Metallurgical Testing
|
|
Rhyolite Ridge Lithium-Boron Project
|
S-K 1300 Technical Report Summary
|
|
10.4.1.
|
Metallurgical Testwork
Samples
|
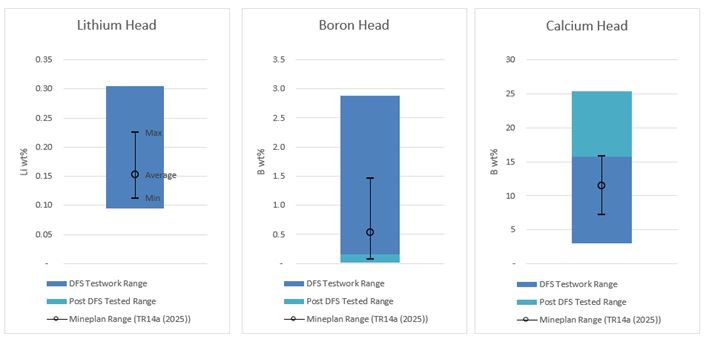
|
Rhyolite Ridge Lithium-Boron Project
|
S-K 1300 Technical Report Summary
|
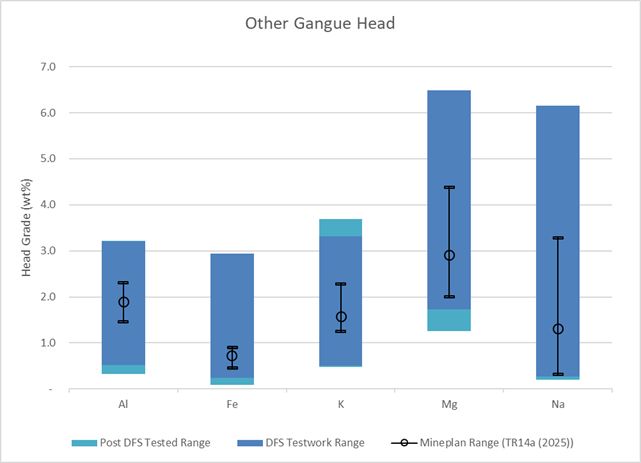
|
Rhyolite Ridge Lithium-Boron Project
|
S-K 1300 Technical Report Summary
|
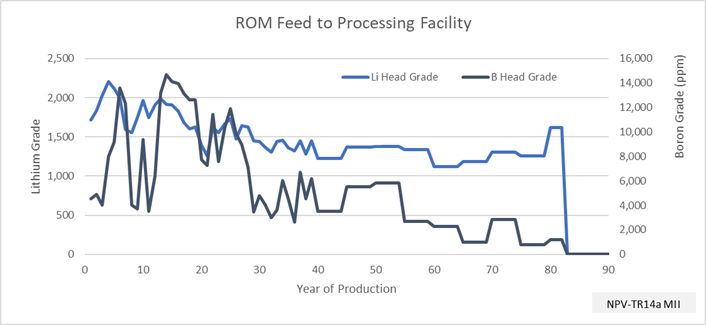
|
Rhyolite Ridge Lithium-Boron Project
|
S-K 1300 Technical Report Summary
|
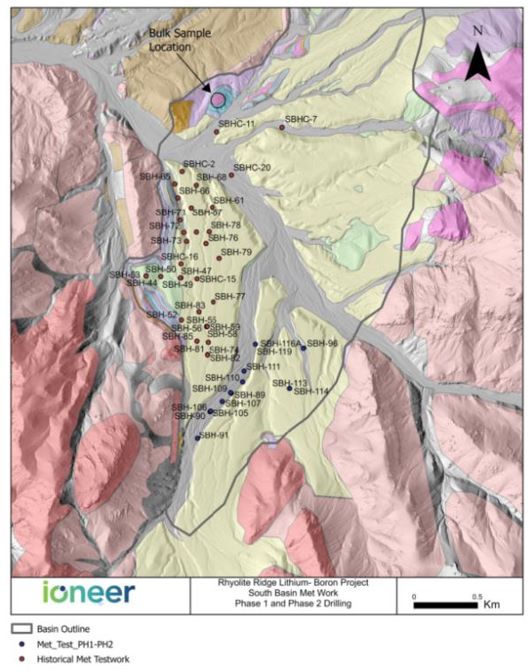
|
Rhyolite Ridge Lithium-Boron Project
|
S-K 1300 Technical Report Summary
|
|
10.4.2.
|
Aqueous Phase Samples
|
|
|
◾ |
PFS & Early FS testwork: Feed solutions were taken as
is from leaching test work to ascertain baseline phase chemistry and solubility data;
|
|
|
◾ |
FS testwork and Pilot Plant: Feed solutions were adjusted
with various synthetic salts to approximate the expected five-year average composition of the 2020 FS mine
plan. This data forms the basis of engineering design;
|
|
|
◾ |
Post FS testwork: Feed solutions from stream 1 and 2
blends, and stream 2 leach testwork, was subject to the design operating conditions to ascertain differences
in solubility and other key parameters with varying ROM compositional blends. This program confirmed the
operating envelope of the processing facility.
|
|
Element
|
Unit
|
Mine Plan (14a)
Average
(Year 1-25)
|
Design
(Based on KCA and
Kemetco Pilot programs)
|
2025 Phase Chemistry
Program
(Supports larger operating
envelope
|
|
Li
|
ppm
|
1,750
|
2,100
|
1,690 - 2,165
|
|
B
|
ppm
|
9,400
|
14,600
|
4,400 – 11,400
|
|
Mg:Li
|
% w/w
|
19.5
|
18.0
|
18.6 – 21.8
|
|
Mg:Na
|
% w/w
|
2.5
|
1.3
|
1.4 – 5.9
|
|
Mg:K
|
% w/w
|
3.7
|
3.7
|
5.0 – 6.3
|
|
Al:K
|
% w/w
|
0.9
|
1.0
|
0.6 - 0.8
|
|
Al:F
|
% w/w
|
1.0
|
1.3
|
0.6 – 1.0
|
|
10.5.
|
Recovery Estimates
|
|
Rhyolite Ridge Lithium-Boron Project
|
S-K 1300 Technical Report Summary
|
|
10.5.1.
|
Boron Recovery
|
|
10.5.2.
|
Lithium Recovery
|
|
Rhyolite Ridge Lithium-Boron Project
|
S-K 1300 Technical Report Summary
|
|
10.5.3.
|
Key Factors Influencing Boron
and Lithium Recovery in Leaching Processes
|
|
10.6.
|
QP’s Opinion
|
|
10.6.1.
|
Adequacy of Testwork Data and
Analytical Methods
|
|
Rhyolite Ridge Lithium-Boron Project
|
S-K 1300 Technical Report Summary
|
|
10.6.2.
|
Boric Acid Flotation Testwork
Observation
|
|
10.6.3.
|
PLS Impurity Removal (IR1)
|
|
|
10-33 |
30 SEPTEMBER 2025
|
|
Rhyolite Ridge Lithium-Boron Project
|
S-K 1300 Technical Report Summary
|
|
11.
|
MINERAL RESOURCE ESTIMATES
|
|
11.1.
|
Geological Modeling Methodology and Assumptions
|
|
11.2.
|
Geological Modeling Database
|
|
|
11-1 |
30 SEPTEMBER 2025
|
|
Rhyolite Ridge Lithium-Boron Project
|
S-K 1300 Technical Report Summary
|
|
Seam Code
|
Seam Name
|
Drill Database Intervals
|
Database Intervals Assayed
|
||||
|
Number
|
Length
(m)
|
Number
|
Drilled
Length
(m)
|
Avg. Length
(m)
|
% of length
assayed
|
||
|
1
|
Qal
|
775
|
4,376.56
|
648
|
1,391.6
|
2.15
|
31.80%
|
|
3
|
S3
|
2,9
|
8,442.17
|
2,849
|
4,490.2
|
1.58
|
53.22%
|
|
4
|
G4
|
397
|
899.10
|
328
|
3,550.7
|
1.53
|
56.08%
|
|
5
|
M4
|
749
|
1,594.8
|
660
|
987.1
|
1.50
|
61.87%
|
|
6
|
G5
|
231
|
382.31
|
164
|
245.3
|
1.50
|
64.17%
|
|
7
|
M5
|
1,421
|
2,032.25
|
1326
|
1,957.4
|
1.48
|
96.69%
|
|
8
|
B5
|
2,098
|
3,046.23
|
1980
|
2,966.8
|
1.50
|
97.19%
|
|
9
|
S5
|
1,375
|
2,603.45
|
1256
|
1,893.6
|
1.51
|
72.62%
|
|
10
|
G6
|
570
|
1,218.19
|
509
|
747.2
|
1.52
|
64.07%
|
|
11
|
L6
|
2,348
|
4,194.93
|
2220
|
3,317.0
|
1.49
|
78.93%
|
|
12
|
Lsi
|
679
|
1,407.75
|
641
|
972.3
|
1.52
|
69.07%
|
|
14
|
G7
|
445
|
791.27
|
414
|
625.3
|
1.43
|
79.02%
|
|
15
|
Tlv
|
89
|
918.48
|
51
|
77.0
|
1.51
|
8.33%
|
|
16
|
Tbx
|
428
|
966.08
|
396
|
609.4
|
1.54
|
63.08%
|
|
18
|
Z
|
44
|
181.97
|
41
|
61.6
|
1.50
|
33.84
|
|
|
11-2 |
30 SEPTEMBER 2025
|
|
Rhyolite Ridge Lithium-Boron Project
|
S-K 1300 Technical Report Summary
|
|
Seam Code
|
Seam Name
|
Drill Database Intervals
|
Database Intervals Assayed
|
||||
|
Number
|
Length
(ft)
|
Number
|
Drilled
Length
(ft)
|
Avg. Length
(ft)
|
% of footage
assayed
|
||
|
1
|
Qal
|
775
|
14,358.8
|
648
|
4,565.6
|
7.05
|
31.80%
|
|
3
|
S3
|
2,9
|
27,697.4
|
2,849
|
14,731.7
|
5.17
|
53.22%
|
|
4
|
G4
|
397
|
2,949.80
|
328
|
11,649.2
|
5.03
|
56.08%
|
|
5
|
M4
|
749
|
5,232.30
|
660
|
3,238.6
|
4.91
|
61.87%
|
|
6
|
G5
|
231
|
1,254.30
|
164
|
804.9
|
4.91
|
64.17%
|
|
7
|
M5
|
1,421
|
6,667.50
|
1326
|
6,422
|
4.84
|
96.69%
|
|
8
|
B5
|
2,098
|
9,994.20
|
1980
|
9,733.5
|
4.91
|
97.19%
|
|
9
|
S5
|
1,375
|
8,541.50
|
1256
|
6,212.5
|
4.95
|
72.62%
|
|
10
|
G6
|
570
|
3,966.70
|
509
|
2541.5
|
4.99
|
64.07%
|
|
11
|
L6
|
2,348
|
13,762.90
|
2220
|
10882.7
|
4.9
|
78.93%
|
|
12
|
Lsi
|
679
|
4,618.60
|
641
|
3190.10
|
4.98
|
69.07%
|
|
14
|
G7
|
445
|
2,596.03
|
414
|
2051.5
|
4.96
|
79.02%
|
|
15
|
Tlv
|
89
|
3,013.40
|
51
|
252.5
|
4.95
|
8.33%
|
|
16
|
Tbx
|
428
|
3,169.54
|
396
|
1999.5
|
5.05
|
63.08%
|
|
18
|
Z
|
44
|
597.01
|
41
|
202.00
|
4.93
|
33.84
|
|
11.3.
|
Exploratory Data Analysis
|
|
11.3.1.
|
Statistical Analysis
|
|
|
- |
Lithium and boron grade values are highly variable in units other than the targeted mineralized units (B5, M5, S5,
and L6) particularly in S3.
|
|
|
- |
All units other than B5, M5, and L6 show very low boron grades except for isolated high
outliers. The impact of high outlier sample values for boron is particularly pronounced in the S3 and S5 siltstone-claystone units that occur above
and below the mineralized sequence, respectively. All units show wider lithium grade ranges; as expected B5, M5, and L6 show the highest-grade
populations; however, there is more pronounced overlap with ranges for many of the other units as compared to the boron values. This is attributed
to the presence of isolated horizons of LoB-Li mineralization in some of the other units.
|
|
|
11-3 |
30 SEPTEMBER 2025
|
|
Rhyolite Ridge Lithium-Boron Project
|
S-K 1300 Technical Report Summary
|
|
|
- |
The B5 unit shows near normal distributions for both lithium and boron, with minimal outlier values. This tighter
distribution of values is expected based on the high boron cut-off grade of 5,000 ppm that is used as one of the defining parameters for the unit by
segregating only the HiB-Li mineralization (excluding the LoB-Li mineralization where possible).
|
|
|
- |
The B5 probability plots show a small population of very low-grade lithium and boron samples, with less than 18% of
the samples below 5,000 ppm boron and 3% below 1,000 ppm lithium.
|
|
|
- |
The M5 unit shows a different distribution, with the boron population skewed strongly
towards the low values (90% < 5,000 ppm) and the lithium population skewed towards the higher values (97% > 1,000 ppm). The high outlier boron
values and low outlier lithium values observed are a result of the presence of the transitional zone near the base of the M5 unit, where the
mineralization transitions from LoB-Li mineralization to HiB-Li mineralization in the underlying B5 unit.
|
|
|
- |
Both lithium and boron probability plots show the presence of more than one population of values, indicated by
changes in slope in the probability plots.
|
|
|
- |
The S5 unit has a large percentage of lower values for both boron and lithium with 95% of the boron assays are less
than 5,000 ppm and 67% of the lithium assays less than 1,000 ppm. The L6 unit shows similar distributions to M5 with the boron population having 25%
of the assays greater than 5,000 ppm and the lithium population having 60% of the assays greater than 1,000 ppm. The patterns are attributed to the
likely presence of both LoB-Li and HiB-Li mineralization throughout the unit.
|
|
|
- |
The G6 unit is shown on the accompanying cumulative frequency plots to present the distribution of the central
seams from M5 to L6. G6 is low grade with less than 1% of the boron assays greater than 5,000 ppm and only 5% of the lithium grades greater than
1,000 ppm. G6 is not part of the mineral resource and thus grades are not estimated into this seam.
|
|
|
- |
Figure 11-1 shows the cumulative frequence of boron assays in the central seams and Figure
11-2 shows the cumulative frequence of the lithium assays. The central seams from top down are G5 (dark blue), M5 (light blue), B5 (red), S5
(orange), G6 (black), L6 (green) and Lsi (brown). The seven central seams received grade estimates.
|
|
|
11-4 |
30 SEPTEMBER 2025
|
|
Rhyolite Ridge Lithium-Boron Project
|
S-K 1300 Technical Report Summary
|
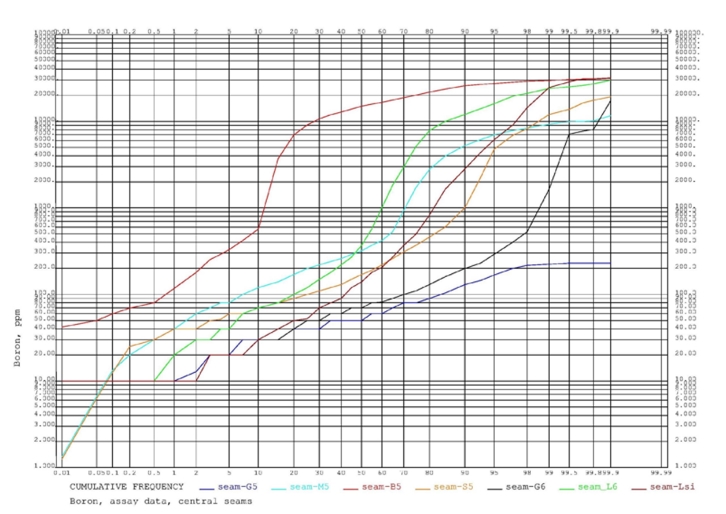
|
|
11-5 |
30 SEPTEMBER 2025
|
|
Rhyolite Ridge Lithium-Boron Project
|
S-K 1300 Technical Report Summary
|
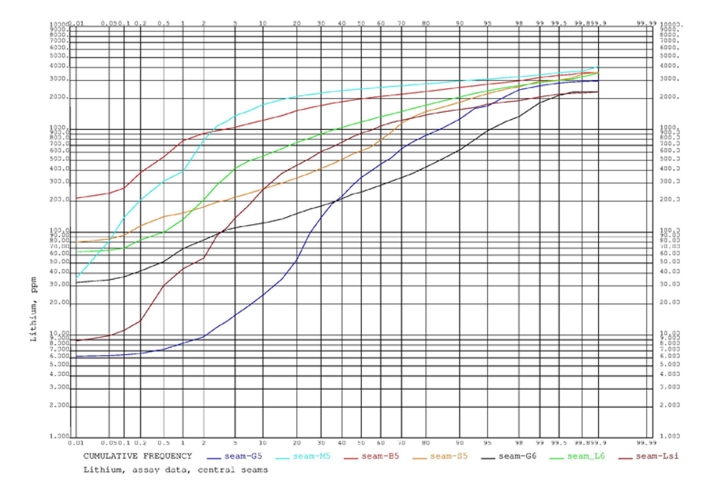
|
11.3.2.
|
Geostatistical Analysis
|
|
|
11-6 |
30 SEPTEMBER 2025
|
|
Rhyolite Ridge Lithium-Boron Project
|
S-K 1300 Technical Report Summary
|
|
Length (m)
|
Length (ft)
|
Number of
Sample
Lengths
|
Average
Boron
Grade,
ppm
|
Average
Lithium
Grade, ppm
|
Average
Length,
meters
|
Total
Length,
meters
|
% of
Sample
Length
|
|
0.00 - 0.762
|
0.00 - 2.50
|
83
|
3,767
|
1,503
|
0.582
|
48.25
|
0.23%
|
|
0.765 - 1.521
|
2.51 - 4.99
|
792
|
2,344
|
1,603
|
1.192
|
944.37
|
4.53%
|
|
= 1.524
|
5.00
|
12,114
|
3,161
|
971
|
1.524
|
18,461.96
|
88.47%
|
|
1.527 - 2.283
|
5.01 - 7.49
|
256
|
1,669
|
1,515
|
1.725
|
441.87
|
2.12%
|
|
2.286 - 3.045
|
7.50 - 9.99
|
63
|
283
|
561
|
2.765
|
174.07
|
0.83%
|
|
>= 3.048
|
>= 10.00
|
173
|
423
|
291
|
4.612
|
798.07
|
3.82%
|
|
Total
|
13,481
|
3,040
|
1,011
|
20,868.59
|
|||
|
Seam
|
Assay Database
|
1.52 m (5 ft) Composites, Respecting Seams
|
|||||
|
Number
|
Average
Boron, ppm
|
Average
Lithium, ppm
|
Number
|
Average
Boron, ppm
|
Average
Lithium, ppm
|
||
|
1
|
Qal
|
648
|
35
|
40
|
918
|
31
|
34
|
|
3
|
S3
|
2,849
|
235
|
310
|
2,952
|
251
|
316
|
|
4
|
G4
|
329
|
58
|
162
|
333
|
58
|
163
|
|
5
|
M4
|
660
|
65
|
1,111
|
660
|
64
|
1,111
|
|
6
|
G5
|
164
|
68
|
530
|
162
|
69
|
537
|
|
7
|
M5
|
1,331
|
1,486
|
2,391
|
1,310
|
1,500
|
2,389
|
|
8
|
B5
|
1,977
|
14,349
|
1,940
|
1,968
|
14,346
|
1,940
|
|
9
|
S5
|
1,254
|
770
|
882
|
1,250
|
763
|
878
|
|
10
|
G6
|
509
|
202
|
341
|
509
|
202
|
341
|
|
11
|
L6
|
2,217
|
3,578
|
1,251
|
2,192
|
3,615
|
1,253
|
|
12
|
Lsi
|
641
|
1,280
|
926
|
640
|
1,277
|
925
|
|
14
|
G7
|
414
|
45
|
295
|
412
|
45
|
294
|
|
15
|
Tlv
|
51
|
26
|
269
|
51
|
26
|
268
|
|
16
|
Tbx
|
396
|
60
|
108
|
401
|
60
|
107
|
|
18
|
Z
|
41
|
31
|
85
|
41
|
30
|
85
|
|
Total
|
13,481
|
3,040
|
1,011
|
13,799
|
2,963
|
984
|
|
|
|
11-7 |
30 SEPTEMBER 2025
|
|
Rhyolite Ridge Lithium-Boron Project
|
S-K 1300 Technical Report Summary
|
|
|
11-8 |
30 SEPTEMBER 2025
|
|
Rhyolite Ridge Lithium-Boron Project
|
S-K 1300 Technical Report Summary
|
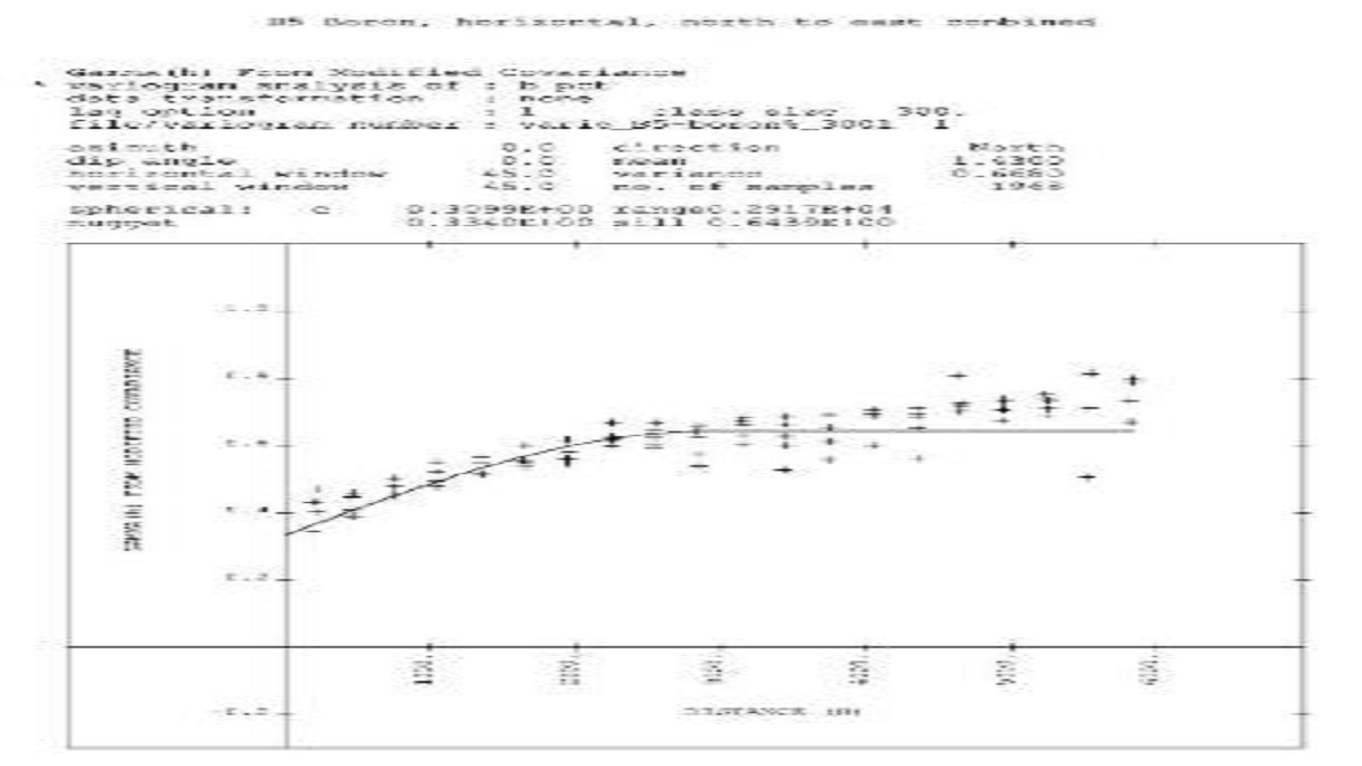
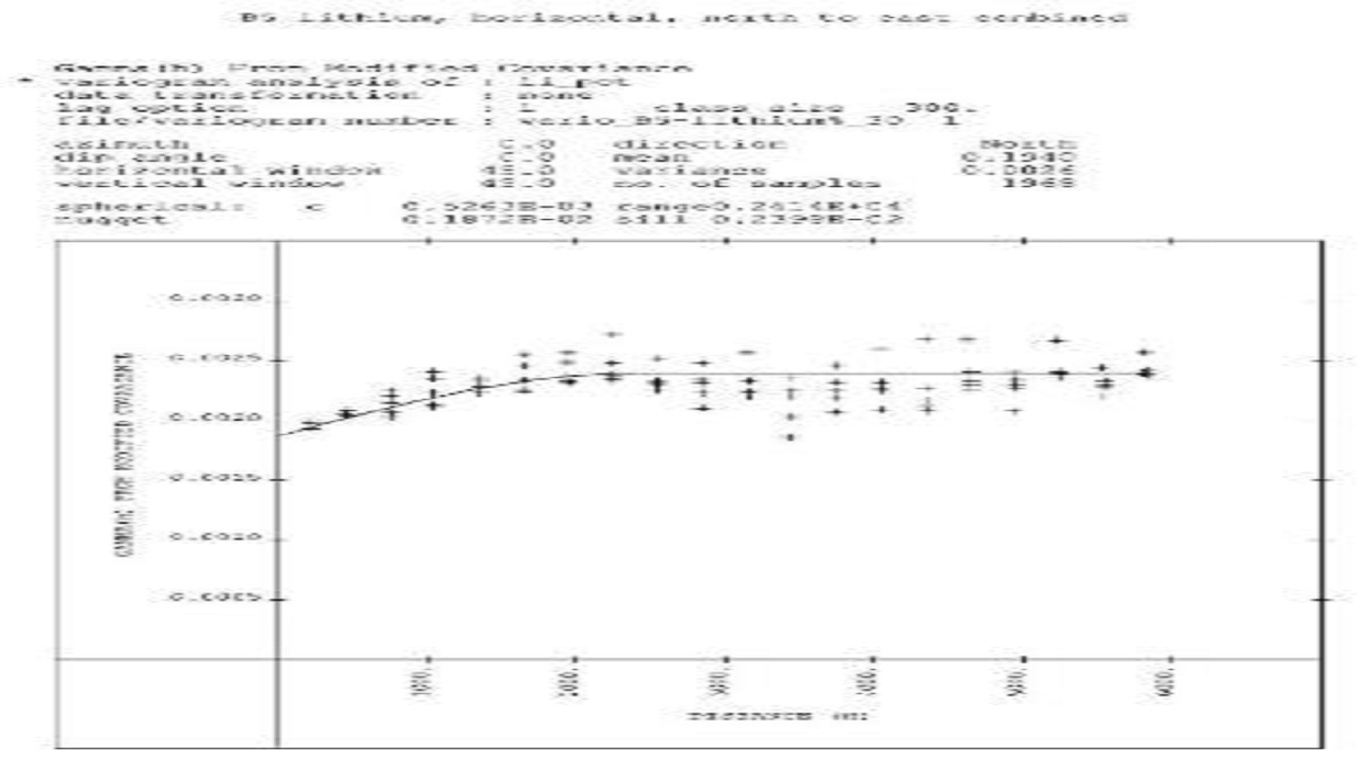
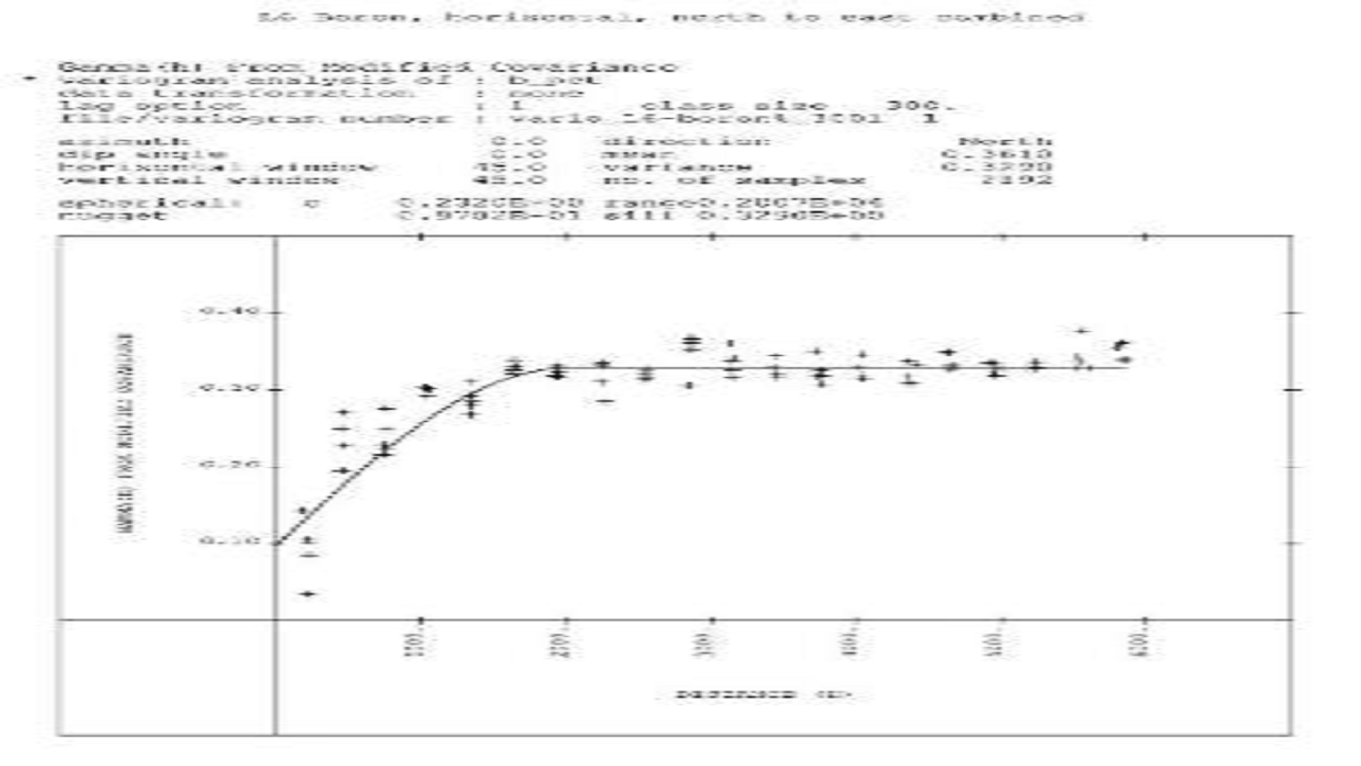
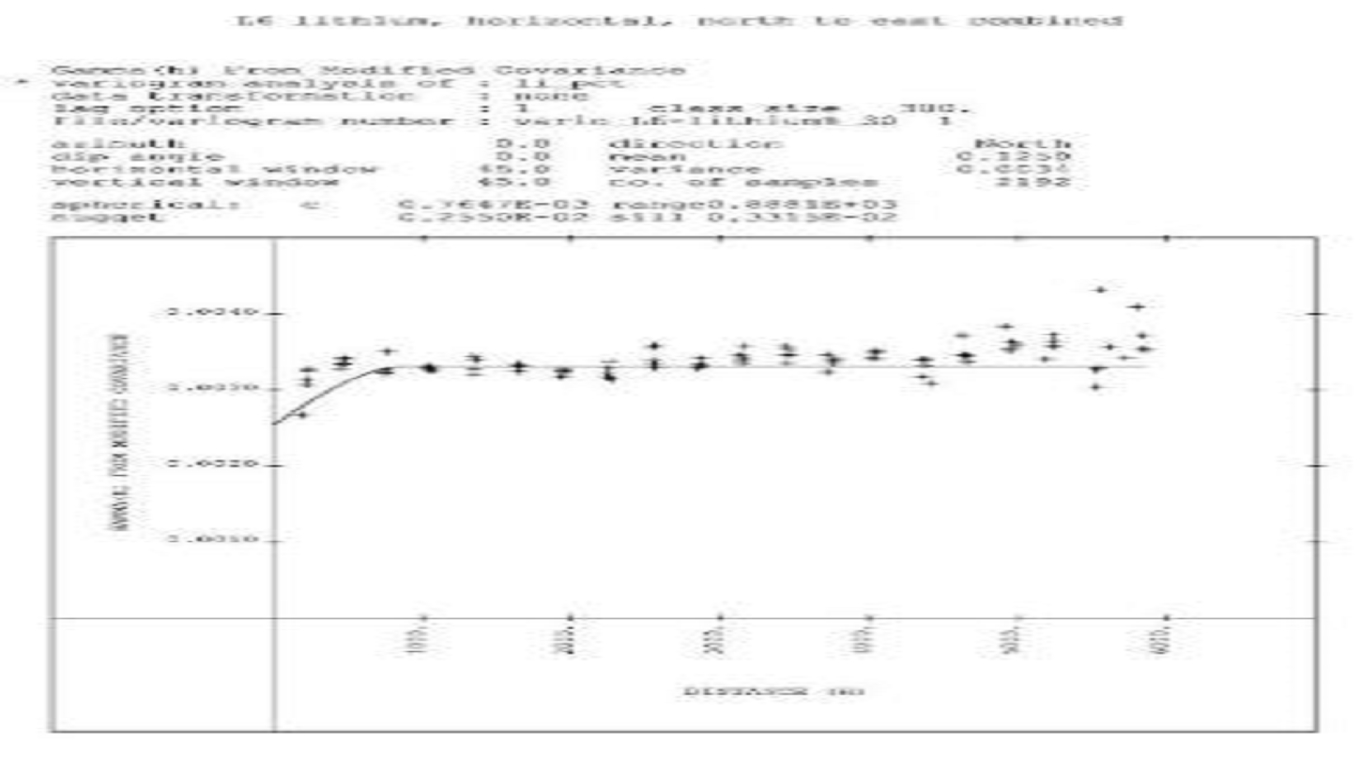
|
|
11-9 |
30 SEPTEMBER 2025
|
|
Rhyolite Ridge Lithium-Boron Project
|
S-K 1300 Technical Report Summary
|
|
11.4.
|
Geological Modeling
|
|
|
11-10 |
30 SEPTEMBER 2025
|
|
Rhyolite Ridge Lithium-Boron Project
|
S-K 1300 Technical Report Summary
|
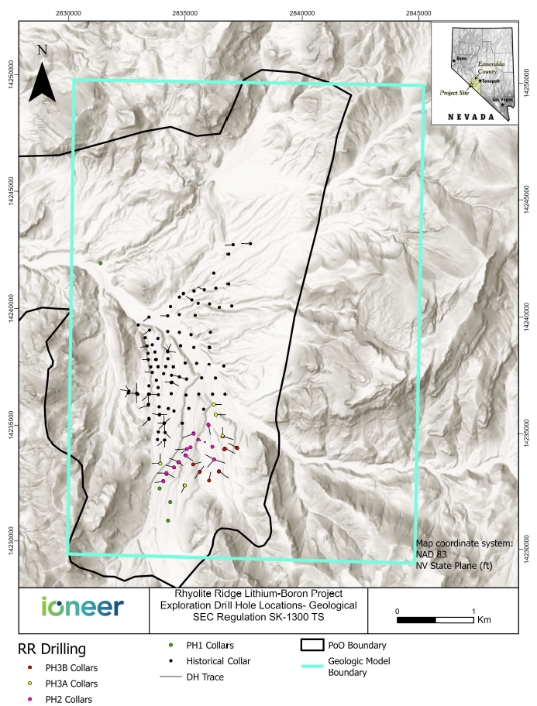
|
11.4.1.
|
Topographic Model
|
|
|
11-11 |
30 SEPTEMBER 2025
|
|
Rhyolite Ridge Lithium-Boron Project
|
S-K 1300 Technical Report Summary
|
|
11.4.2.
|
Stratigraphic Model
|
|
Seam Unit &
Model Code
|
Mean Thickness
(m)
|
Minimum
Thickness (m)
|
Maximum
Thickness (m)
|
Minimum
Elevation (m)
|
Maximum
Elevation (m)
|
|
Q1 (1)
|
26.2
|
1.5
|
68.6
|
1762
|
2118
|
|
S3 (3)
|
82.6
|
1.5
|
260.6
|
1617
|
2068
|
|
G4 (4)
|
9.8
|
1.5
|
33.5
|
1606
|
2047
|
|
M4 (5)
|
11.0
|
1.5
|
61.0
|
1596
|
1951
|
|
G5 (6)
|
5.8
|
1.5
|
32.0
|
1594
|
1948
|
|
M5 (7)
|
13.4
|
1.5
|
51.8
|
1582
|
1966
|
|
B5 (8)
|
16.2
|
1.5
|
86.9
|
1561
|
1954
|
|
S5 (9)
|
16.2
|
1.5
|
80.8
|
1543
|
1932
|
|
G6 (10)
|
10.7
|
1.5
|
36.6
|
1521
|
1943
|
|
L6 (11)
|
56.7
|
1.5
|
217.9
|
1471
|
2057
|
|
Lsi (12)
|
27.7
|
1.5
|
65.5
|
1446
|
1881
|
|
G7 (14)
|
11.9
|
1.5
|
100.6
|
1430
|
2076
|
|
|
11-12 |
30 SEPTEMBER 2025
|
|
Rhyolite Ridge Lithium-Boron Project
|
S-K 1300 Technical Report Summary
|
|
Seam Unit &
Model Code
|
Mean Thickness
(ft)
|
Minimum
Thickness (ft)
|
Maximum
Thickness (ft)
|
Minimum
Elevation (ft)
|
Maximum
Elevation (ft)
|
|
Q1 (1)
|
86
|
5
|
225
|
5785
|
6960
|
|
S3 (3)
|
271
|
5
|
855
|
5295
|
6775
|
|
G4 (4)
|
32
|
5
|
110
|
5275
|
6690
|
|
M4 (5)
|
36
|
5
|
200
|
5235
|
6480
|
|
G5 (6)
|
19
|
5
|
105
|
5230
|
6480
|
|
M5 (7)
|
44
|
5
|
170
|
5190
|
6495
|
|
B5 (8)
|
53
|
5
|
285
|
5125
|
6500
|
|
S5 (9)
|
53
|
5
|
265
|
5060
|
6530
|
|
G6 (10)
|
35
|
5
|
120
|
4985
|
6585
|
|
L6 (11)
|
186
|
5
|
715
|
4830
|
6685
|
|
Lsi (12)
|
91
|
5
|
215
|
4735
|
6115
|
|
G7 (14)
|
39
|
5
|
330
|
4685
|
6635
|
|
|
11-13 |
30 SEPTEMBER 2025
|
|
Rhyolite Ridge Lithium-Boron Project
|
S-K 1300 Technical Report Summary
|
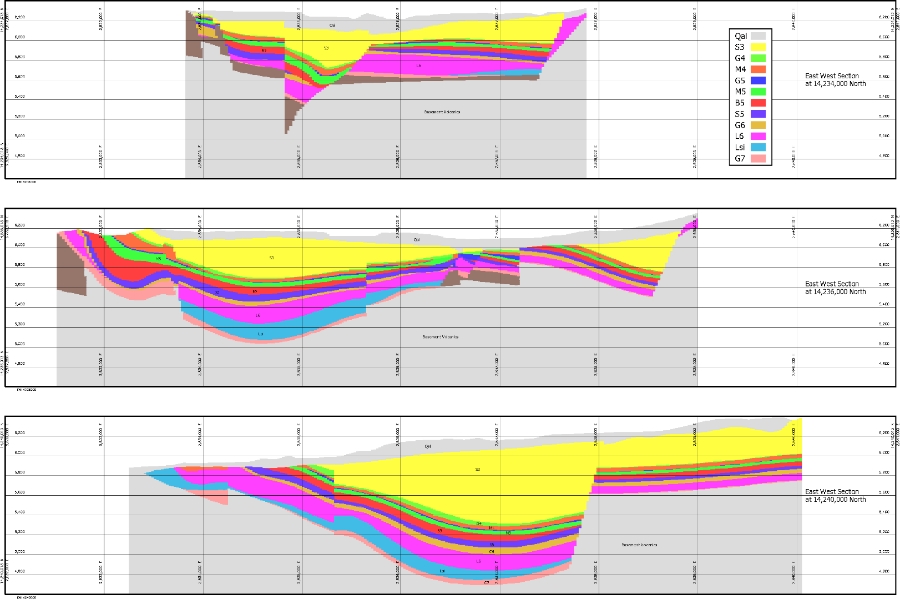
|
|
11-14 |
30 SEPTEMBER 2025
|
|
Rhyolite Ridge Lithium-Boron Project
|
S-K 1300 Technical Report Summary
|
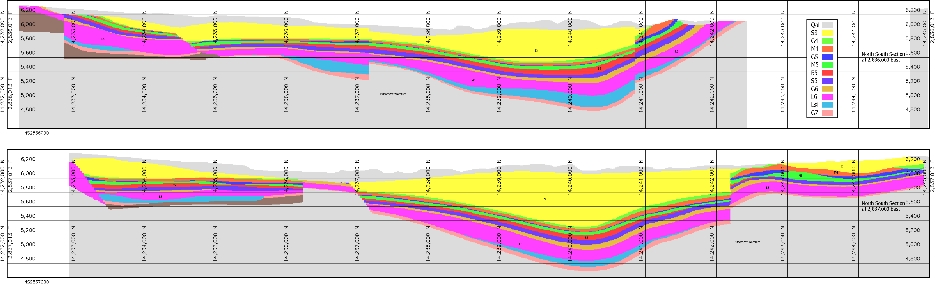
|
|
11-15 |
30 SEPTEMBER 2025
|
|
Rhyolite Ridge Lithium-Boron Project
|
S-K 1300 Technical Report Summary
|
|
11.4.3.
|
Fault Block Model
|
|
|
11-16 |
30 SEPTEMBER 2025
|
|
Rhyolite Ridge Lithium-Boron Project
|
S-K 1300 Technical Report Summary
|
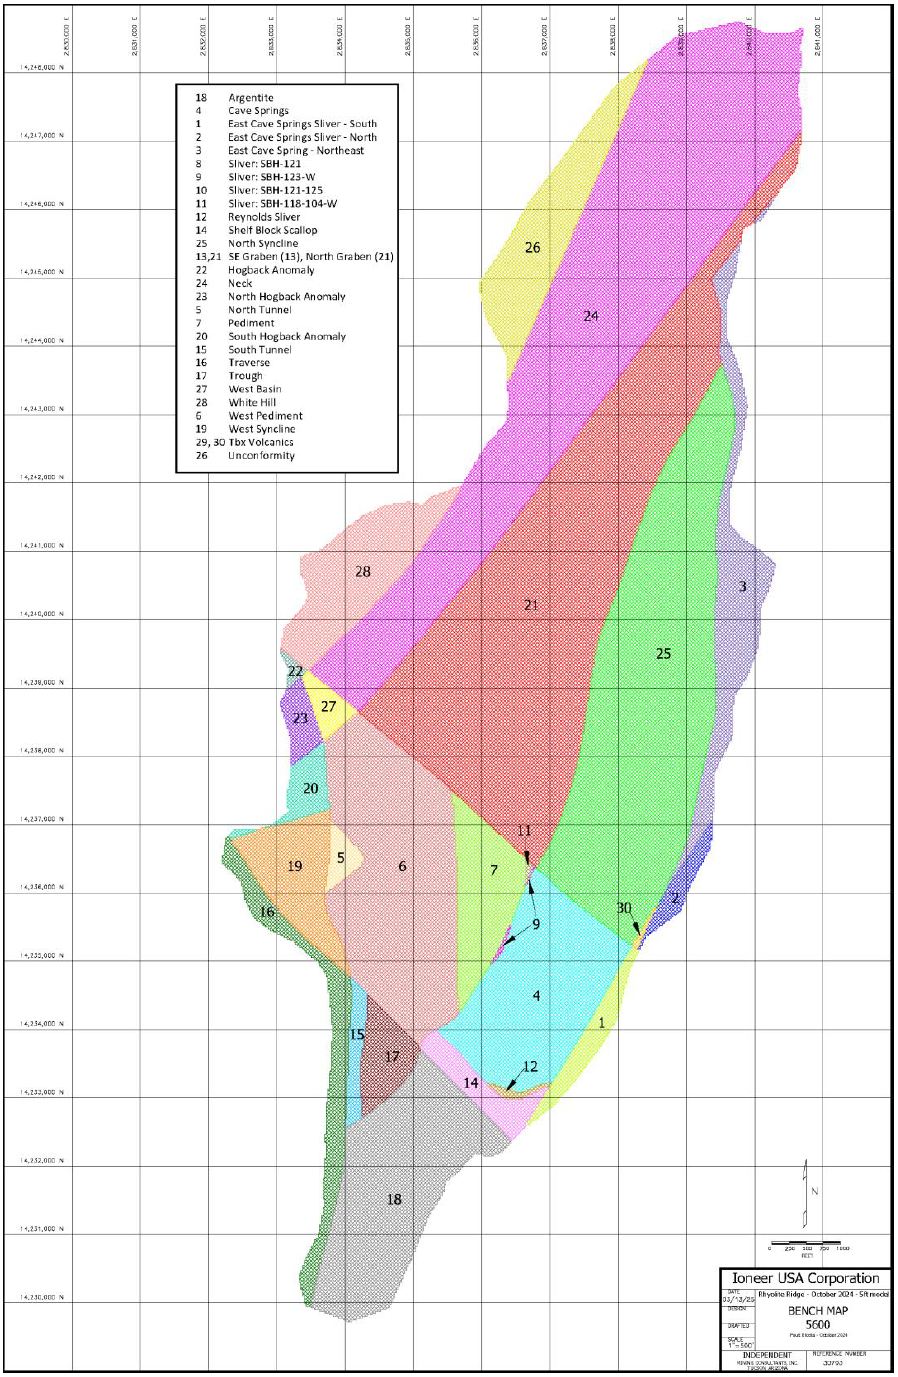
|
|
11-17 |
30 SEPTEMBER 2025
|
|
Rhyolite Ridge Lithium-Boron Project
|
S-K 1300 Technical Report Summary
|
|
11.4.4.
|
Grade Model
|
|
11.4.4.1.
|
Estimation Approach
|
| - |
G5: 305 x 305 m (1,000 x 1,000 ft);
|
|
|
- |
M5: 533.4 x 533.4 m (1,750 x 1,750 ft);
|
|
|
- |
B5: 533.4 x 533.4 m (1,750 x 1,750 ft);
|
|
|
- |
S5: 228.6 x 228.6 m (750 x 750 ft);
|
|
|
- |
G6: 228.6 x 228.6 m (750 x 750 ft);
|
|
|
- |
L6: 305 x 305 m (1,000 x 1,000 ft);
|
|
|
- |
Lsi: 305 x 305 m (1,000 x 1,000 ft).
|
 |
11-18 |
30 SEPTEMBER 2025
|
|
Rhyolite Ridge Lithium-Boron Project
|
S-K 1300 Technical Report Summary
|
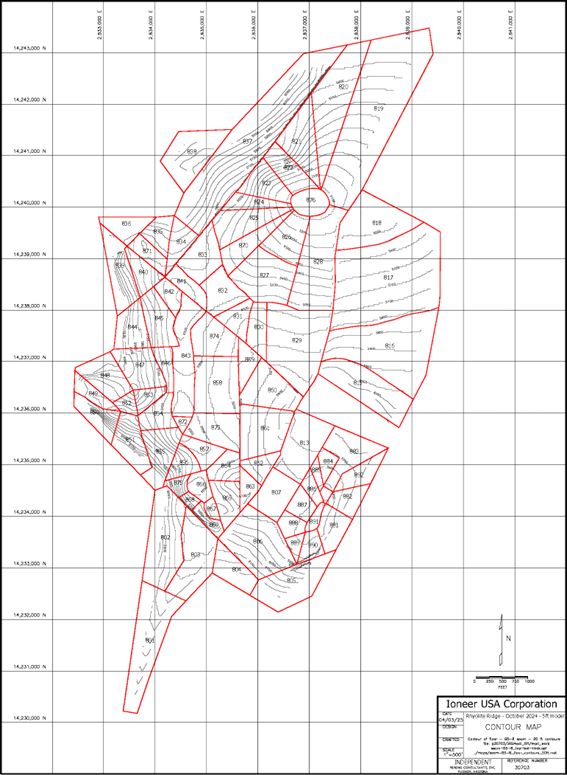
|
|
11-19 |
30 SEPTEMBER 2025
|
|
Rhyolite Ridge Lithium-Boron Project
|
S-K 1300 Technical Report Summary
|
|
11.4.4.2.
|
Estimation Results and Mineralization
|
|
Seam
|
Block Model
|
Drill Hole Data
|
||||||
|
# blocks
|
# blocks
estimated
|
%
estimated
|
Average
Boron,
ppm
|
Average
Lithium,
ppm
|
# Assays
|
Average,
Boron,
ppm
|
Average
Lithium,
ppm
|
|
|
G5
|
323,255
|
145,230
|
44.93%
|
64
|
473
|
167
|
79
|
790
|
|
M5
|
769,042
|
509,156
|
66.21%
|
1,166
|
2,219
|
1,196
|
1,601
|
2,377
|
|
B5
|
713,322
|
641,938
|
89.99%
|
14,037
|
1,873
|
1,789
|
14,249
|
1,927
|
|
S5
|
944,061
|
611,280
|
64.75%
|
800
|
867
|
1,197
|
803
|
860
|
|
G6
|
628,537
|
367,690
|
58.50%
|
183
|
337
|
501
|
236
|
369
|
|
L6
|
4,194,225
|
1,759,933
|
41.96%
|
3,426
|
1,216
|
2,113
|
3,647
|
1,250
|
|
Lsi
|
795,574
|
633,451
|
79.62%
|
910
|
952
|
618
|
1,296
|
928
|
|
|
11-20 |
30 SEPTEMBER 2025
|
|
Rhyolite Ridge Lithium-Boron Project
|
S-K 1300 Technical Report Summary
|
|
Fault Block
|
Block Model
|
Drill Hole Data
|
||||||
|
# blocks
|
# blocks estimated
|
Average
Boron,
ppm
|
Average
Lithium,
ppm
|
#
Composites
|
Average,
Boron,
ppm
|
Average
Lithium,
ppm
|
||
|
1
|
East Cave Springs Sliver – South
|
12
|
12
|
6,795
|
2,390
|
|||
|
2
|
East Cave Springs Sliver - North
|
0
|
|
|
|
|||
|
3
|
East Cave Spring – Northeast
|
28
|
0
|
|
|
|||
|
4
|
Cave Springs
|
63,259
|
63,259
|
9,741
|
2,114
|
157
|
10,392
|
2,116
|
|
5
|
North Tunnel
|
9,055
|
9,055
|
16,524
|
2,021
|
74
|
16,655
|
1,990
|
|
6
|
West Pediment
|
148,167
|
148,167
|
18,228
|
1,816
|
639
|
19,101
|
1,837
|
|
7
|
Pediment
|
22,290
|
22,290
|
6,719
|
2,203
|
58
|
4,696
|
2,136
|
|
8
|
Sliver: SBH-121
|
231
|
231
|
355
|
2,378
|
|
|
|
|
9
|
Sliver: SBH-123-W
|
595
|
595
|
992
|
2,516
|
11
|
371
|
2,707
|
|
10
|
Sliver: SBH-121-125
|
246
|
246
|
808
|
2,433
|
|
|
|
|
11
|
Sliver: SBH-118-104-W
|
715
|
715
|
1,696
|
2,291
|
|
|
|
|
12
|
Reynolds Sliver
|
1,148
|
1,148
|
6,406
|
2,061
|
22
|
6,604
|
2,080
|
|
13
|
SE Graben
|
1,406
|
1,406
|
1,207
|
2,037
|
13
|
1,717
|
2,069
|
|
14
|
Shelf Block Scallop
|
7,984
|
7,984
|
5,654
|
2,020
|
72
|
4,434
|
2,149
|
|
15
|
South Tunnel
|
5
|
5
|
7,863
|
2,338
|
|
|
|
|
16
|
Traverse
|
31
|
31
|
13,477
|
2,597
|
|
|
|
|
17
|
Trough
|
36,523
|
36,378
|
6,274
|
2,434
|
185
|
6,570
|
2,402
|
|
18
|
Argentite
|
2,281
|
2,281
|
8,223
|
2,046
|
|
|
|
|
19
|
West Syncline
|
35,555
|
35,555
|
15,630
|
2,137
|
219
|
15,071
|
2,090
|
|
20
|
South Hogback Anomaly
|
6,269
|
6,269
|
13,394
|
2,131
|
26
|
12,481
|
2,083
|
|
21
|
North Graben
|
229,665
|
223,932
|
14,411
|
1,723
|
255
|
16,710
|
1,749
|
|
22
|
Hogback Anomaly
|
1,781
|
1,781
|
14,886
|
1,818
|
12
|
15,026
|
1,759
|
|
23
|
North Hogback Anomaly
|
4,884
|
4,884
|
15,082
|
1,890
|
12
|
14,298
|
1,969
|
|
24
|
Neck
|
53,192
|
53,192
|
15,510
|
1,586
|
161
|
13,219
|
1,490
|
|
25
|
North Syncline
|
74,878
|
9,400
|
6,624
|
2,333
|
|
|
|
|
26
|
Unconformity
|
0
|
|
|
|
|
|
|
|
27
|
West Basin
|
7,936
|
7,936
|
17,463
|
1,783
|
42
|
17,027
|
1,787
|
|
28
|
White Hill
|
5,186
|
5,186
|
14,281
|
1,318
|
|||
|
29, 30
|
Tbx Volcanics
|
|||||||
|
|
11-21 |
30 SEPTEMBER 2025
|
|
Rhyolite Ridge Lithium-Boron Project
|
S-K 1300 Technical Report Summary
|
|
11.5.
|
Moisture Basis
|
|
11.6.
|
Density
|
|
|
11-22 |
30 SEPTEMBER 2025
|
|
Rhyolite Ridge Lithium-Boron Project
|
S-K 1300 Technical Report Summary
|
|
Grade Model
Density Parameters
|
Sample Count
|
Mean of Density
(kg/m3)
|
Min Density
(kg/m3)
|
Max Density (kg/m3)
|
|
|
Q1
|
Overburden
|
-
|
1800.5
|
||
|
S3
|
17
|
1500.9
|
985.1
|
1,859.7
|
|
|
G4
|
2
|
1617.9
|
1529.8
|
1,704.4
|
|
|
M4
|
13
|
1862.9
|
1675.5
|
2,474.9
|
|
|
G5
|
5
|
1646.7
|
1,068.4
|
1,875.8
|
|
|
M5
|
Mineralized
|
21
|
1638.7
|
938.7
|
2,202.5
|
|
B5
|
34
|
1781.3
|
1,374.4
|
2,619.0
|
|
|
S5
|
Mineralized / Interburden
|
9
|
1842.1
|
1,616.3
|
2,148.1
|
|
G6
|
Interburden
|
4
|
1848.5
|
1,694.8
|
2,205.7
|
|
L6
|
Mineralized
|
11
|
1976.7
|
1,691.6
|
2,647.9
|
|
Lsi
|
Underburden
|
-
|
1976.7
|
||
|
G7
|
-
|
1856.5
|
|||
|
Tbx
|
8
|
1856.5
|
1,401.6
|
2,620.6
|
|
|
Mean / Totals
|
124
|
1798.7
|
938.7
|
2647.9
|
|
|
Grade Model
Density Parameters
|
Sample Count
|
Mean of Density
(lb/ft3)
|
Min Density (lb/ft3)
|
Max Density (lb/ft3)
|
|
|
Q1
|
Overburden
|
-
|
112.4
|
||
|
S3
|
17
|
93.7
|
61.5
|
116.1
|
|
|
G4
|
2
|
101.0
|
95.5
|
106.4
|
|
|
M4
|
13
|
116.3
|
104.6
|
154.5
|
|
|
G5
|
5
|
102.8
|
66.7
|
117.1
|
|
|
M5
|
Mineralized
|
21
|
102.3
|
58.6
|
137.5
|
|
B5
|
34
|
111.2
|
85.8
|
163.5
|
|
|
S5
|
Mineralized / Interburden
|
9
|
115.0
|
100.9
|
134.1
|
|
G6
|
Interburden
|
4
|
115.4
|
105.8
|
137.7
|
|
L6
|
Mineralized
|
11
|
123.4
|
105.6
|
165.3
|
|
Lsi
|
Underburden
|
-
|
123.4
|
||
|
G7
|
-
|
115.9
|
|||
|
Tbx
|
8
|
115.9
|
87.5
|
163.6
|
|
|
Mean / Totals
|
124
|
111.6
|
58.6
|
165.3
|
|
|
|
11-23 |
30 SEPTEMBER 2025
|
|
Rhyolite Ridge Lithium-Boron Project
|
S-K 1300 Technical Report Summary
|
|
11.7.
|
Resource Classification
|
|
|
- |
“Inferred Mineral Resource is that part of a mineral resource for which quantity and grade or quality are
estimated on the basis of limited geological evidence and sampling. The level of geological uncertainty associated with an inferred mineral
resource is too high to apply relevant technical and economic factors likely to influence the prospects of economic extraction in a manner
useful for evaluation of economic viability. Because an inferred mineral resource has the lowest level of geological confidence of all
mineral resources, which prevents the application of the modifying factors in a manner useful for evaluation of economic viability, an
inferred mineral resource may not be considered when assessing the economic viability of a mining project and may not be converted to a
mineral reserve.”
|
|
|
- |
“Indicated Mineral Resource is that part of a mineral resource for which quantity and grade or quality
are estimated on the basis of adequate geological evidence and sampling. The level of geological certainty associated with an indicated
mineral resource is sufficient to allow a QP to apply modifying factors in sufficient detail to support mine planning and evaluation of the
economic viability of the deposit. Because an indicated mineral resource has a lower level of confidence than the level of confidence of a
measured mineral resource, an indicated mineral resource may only be converted to a probable mineral reserve.”
|
|
|
- |
“Measured Mineral Resource is that part of a mineral resource for which quantity and grade or quality are
estimated on the basis of conclusive geological evidence and sampling. The level of geological certainty associated with a measured mineral
resource is sufficient to allow a QP to apply modifying factors, as defined in this section, in sufficient detail to support detailed mine
planning and final evaluation of the economic viability of the deposit. Because a measured mineral resource has a higher level of confidence
than the level of confidence of either an indicated mineral resource or an inferred mineral resource, a measured mineral resource may be
converted to a proven mineral reserve or to a probable mineral reserve.”
|
|
|
- |
Measured:
|
|
|
- |
G5, M5, B5, L6 and Lsi: 121.9 m (400 ft) spacing between points of observation, with sample interpolation
from a minimum of four drill holes;
|
|
|
11-24 |
30 SEPTEMBER 2025
|
|
Rhyolite Ridge Lithium-Boron Project
|
S-K 1300 Technical Report Summary
|
|
|
- |
S5 and G6: 106.7 m (350 ft) spacing between points of observation, with sample interpolation from a
minimum of four drill holes.
|
|
|
- |
Indicated:
|
|
|
- |
M5 and B5: 243.8 m (800 ft) spacing between points of observation, with sample interpolation from a
minimum of two drill holes;
|
|
|
- |
G5, L6 and Lsi: 213.4 m (700 ft) spacing between points of observation, with sample interpolation from a
minimum of two drill holes;
|
|
|
- |
S5 and G6: 167.6 m (550 ft) spacing between points of observation, with sample interpolation from a
minimum of two drill holes.
|
|
|
- |
Inferred: the full estimation distance (M5 and B5 – 533 m [1,750 ft], S5 and G6 –
229 m [750 ft], G5, L6 and Lsi - 304 m [1,000 ft]) between points of observation, with sample interpolation from a minimum of one drill
hole (two composites).
|
|
|
11-25 |
30 SEPTEMBER 2025
|
|
Rhyolite Ridge Lithium-Boron Project
|
S-K 1300 Technical Report Summary
|
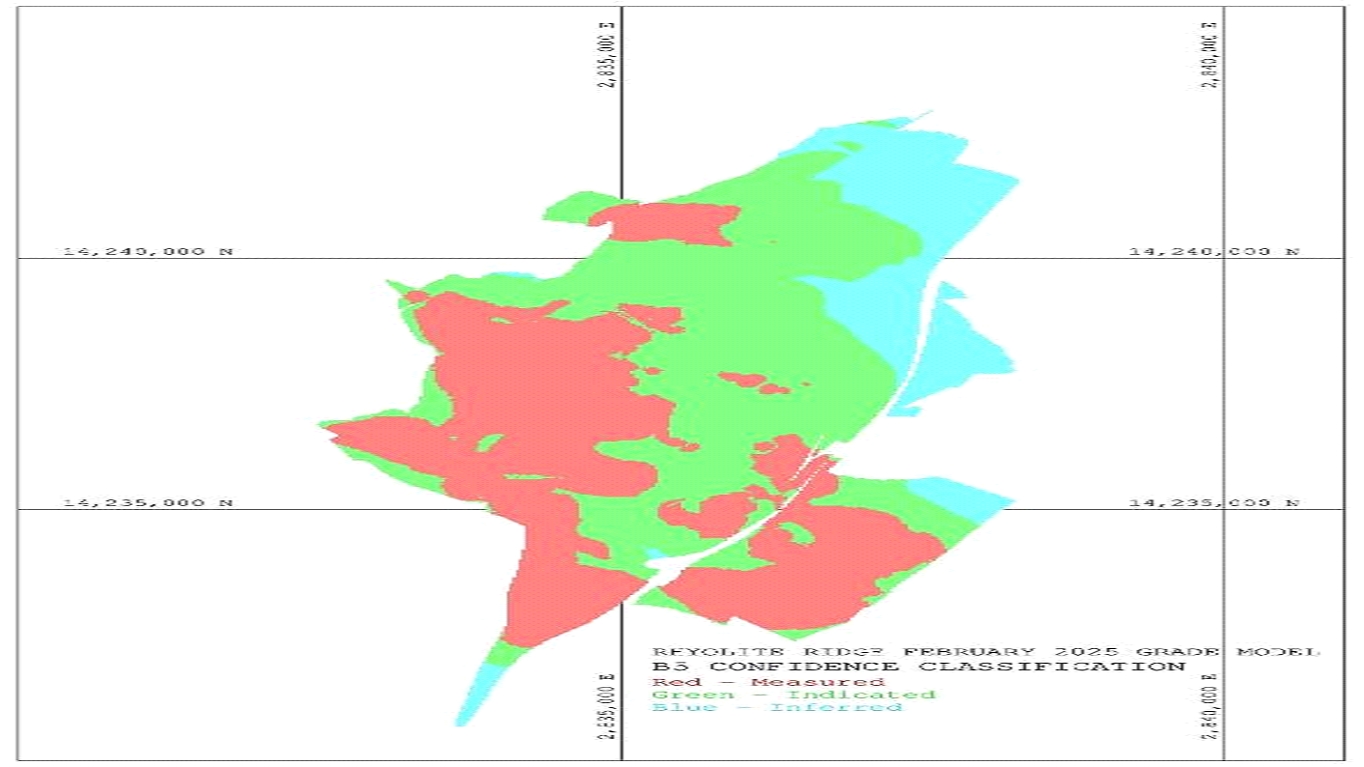
|
|
11-26 |
30 SEPTEMBER 2025
|
|
Rhyolite Ridge Lithium-Boron Project
|
S-K 1300 Technical Report Summary
|
|
11.8.
|
Reblocked Model
|
|
|
- |
The 9.14 m (30 ft) model has the same horizontal block dimensions of 7.62 x 7.62 m (25 x 25 ft) and the
same North-South and East-West extents as the 1.52 m (5 ft) model;
|
|
|
- |
Six benches from the 1.52 m (5 ft) model are combined to create the attributes of the 9.14 m (30 ft)
model;
|
|
|
- |
The seams and fault blocks for the 9.14 m (30 ft) model are assigned from the original solids and surface
contacts between seams files (on a majority basis) that were used to develop the seams and fault blocks in the 1.52 m (5 ft) model;
|
|
|
- |
The kt, grades and class values were extracted from the 1.52 m (5 ft) model and allowed to cross seams in
the 1.52 m (5 ft) model to generate the 9.14 m (30 ft) combination from the 1.52 m (5 ft) model;
|
|
|
- |
The kt per block were added together from the six 1.52 m (5 ft) model blocks;
|
|
|
- |
The grades were averaged, weighted by ktons from the 1.52 m (5 ft) model;
|
|
|
- |
Confidence classification was assigned by majority from the 1.52 m (5 ft) model with the following
modifications:
|
|
|
• |
If there were equal number of blocks (3 and 3), the classification used the lower class: measured moved
to indicated or indicated moved to inferred;
|
|
|
• |
In fault block domains with few or no composites, the following edits were done:
|
|
|
• |
Measured set to inferred if there are no composites in fault block;
|
|
|
• |
Measured set to inferred if less than four (< 4) composites in fault block;
|
|
|
• |
Measured set to indicated if four to nine (4 – 9) composites in fault block;
|
|
|
• |
Indicated set to inferred if less than four (< 4) composites in fault block.
|
|
|
11-27 |
30 SEPTEMBER 2025
|
|
Rhyolite Ridge Lithium-Boron Project
|
S-K 1300 Technical Report Summary
|
|
Block #
|
9.14 m (30 ft)
Model
|
1.52 m (5 ft) Model Compiled
|
5 ft Model Individual Blocks
|
|||||||||
|
Seam
|
ktons
|
B
ppm
|
Li
ppm
|
Bench
m
|
Bench
ft
|
|||||||
|
6100 ft- Blk 1
|
Seam
|
8
|
8
|
8
|
0.1738
|
8890
|
2000
|
1867
|
6125
|
|||
|
ktons
|
1.043
|
1.0428
|
8
|
0.1738
|
8888
|
2010
|
1865
|
6120
|
||||
|
B (ppm)
|
8860
|
8860
|
8
|
0.1738
|
8902
|
2019
|
1864
|
6115
|
||||
|
Li (ppm)
|
2025
|
2025
|
8
|
0.1738
|
8923
|
2027
|
1862
|
6110
|
||||
|
|
8
|
0.1738
|
8949
|
2033
|
1861
|
6105
|
||||||
|
8
|
0.1738
|
8610
|
2060
|
1859
|
6100
|
|||||||
|
6100 ft- Blk 2
|
Seam
|
10
|
10
|
9
|
0.1797
|
579
|
628
|
1867
|
6125
|
|||
|
ktons
|
1.081
|
1.0812
|
10
|
0.1803
|
0
|
0
|
1865
|
6120
|
||||
|
B (ppm)
|
96
|
96
|
10
|
0.1803
|
0
|
0
|
1864
|
6115
|
||||
|
Li (ppm)
|
104
|
104
|
10
|
0.1803
|
0
|
0
|
1862
|
6110
|
||||
|
|
10
|
0.1803
|
0
|
0
|
1861
|
6105
|
||||||
|
10
|
0.1803
|
0
|
0
|
1859
|
6100
|
|||||||
|
6100 ft- Blk 3
|
Seam
|
9
|
9
|
9
|
0.1797
|
1092
|
655
|
1867
|
6125
|
|||
|
ktons
|
1.08
|
1.08
|
9
|
0.1797
|
533
|
618
|
1865
|
6120
|
||||
|
B (ppm)
|
289
|
289
|
9
|
0.1797
|
92
|
659
|
1864
|
6115
|
||||
|
Li (ppm)
|
321
|
321
|
10
|
0.1803
|
0
|
0
|
1862
|
6110
|
||||
| |
10
|
0.1803
|
0
|
0
|
1861
|
6105
|
||||||
|
10
|
0.1803
|
0
|
0
|
1859
|
6100
|
|||||||
|
6100 ft- Blk 4
|
Seam
|
9
|
9
|
9
|
0.1797
|
1075
|
844
|
1867
|
6125
|
|||
|
ktons
|
1.079
|
1.0788
|
9
|
0.1797
|
535
|
595
|
1865
|
6120
|
||||
|
B (ppm)
|
314
|
314
|
9
|
0.1797
|
97
|
553
|
1864
|
6115
|
||||
|
Li (ppm)
|
559
|
559
|
9
|
0.1797
|
91
|
647
|
1862
|
6110
|
||||
| |
9
|
0.1797
|
87
|
715
|
1861
|
6105
|
||||||
|
10
|
0.1803
|
0
|
0
|
1859
|
6100
|
|||||||
|
11.9.
|
Establish Prospect of Economic Extraction
|
|
11.9.1.
|
Assumptions for Establishing Prospects of Economic
Extraction
|
|
|
- |
The geological continuity of the mineralized zones and grade parameters
demonstrated via the current geological and grade model for the South Basin of Rhyolite Ridge.
|
|
|
- |
The potential for extraction of the HiB-Li (Stream 1) mineralized intervals
encountered in the B5, M5, S5, and L6 units using current conventional open pit mining methods.
|
|
|
- |
The potential for extraction of the LoB-Li (Stream 2) mineralized intervals
encountered in the B5, S5, and L6 units using current conventional open pit mining methods.
|
|
|
11-28 |
30 SEPTEMBER 2025
|
|
Rhyolite Ridge Lithium-Boron Project
|
S-K 1300 Technical Report Summary
|
|
|
- |
The potential for extraction of the LoB-Li Clay (Stream 3) mineralized intervals
encountered in the M5 using current conventional open pit mining methods. The potential to produce boric acid and lithium carbonate
products using current processing and recovery methods.
|
|
|
- |
The assumption that boric acid and lithium carbonate produced by the Project
will be marketable and economic considering transportation costs and processing charges and that there will be continued demand for
boric acid and lithium carbonate.
|
|
|
- |
The assumption that the location of the Project in the southwest of the
continental United States would be viewed favorably when marketing boric acid and lithium carbonate products to potential domestic
end users.
|
|
|
- |
The assumption that the production costs are reasonable estimates.
|
|
|
- |
The gross value of a block based on the grades of boron and lithium, their
process recovery and the product prices for boric acid and lithium carbonate;
|
|
|
- |
The cost of producing the two products (boric acid and lithium carbonate) using
the three process streams which include two associated costs:
|
|
|
- |
A fixed process cost per short ton, including the estimate of the associated
G&A costs;
|
|
|
- |
The cost of acid consumed during the process (acid consumption times the cost of
acid).
|
|
Stream
|
Seams Included
|
Boron Grade Range
|
Lithium Grade Range
|
Net Value Cutoff
|
|
1
|
M5, B5, S5, L6
|
>= 5000 ppm
|
No limits
|
Net Value > $11.13/tonne ($10.10/st)
|
|
2
|
B5, S5, L6
|
< 5000 ppm
|
No limits
|
Net Value > $11.13/tonne ($10.10/st)
|
|
3
|
M5
|
< 5000 ppm
|
No limits
|
Net Value > $11.13/tonne ($10.10/st)
|
|
|
11-29 |
30 SEPTEMBER 2025
|
|
Rhyolite Ridge Lithium-Boron Project
|
S-K 1300 Technical Report Summary
|
|
11.9.2.
|
Inputs
|
|
|
- |
Boric acid, $1,172.78 per metric ton or $1,063.94 per short ton
|
|
|
- |
Lithium carbonate, $19,351.38 per metric ton or $17,555.46 per short ton
|
|
Seam
|
Boron to Boric Acid
|
Lithium to Lithium Carbonate
|
||
|
Stream 1
|
Streams 2 & 3
|
Stream 1
|
Streams 2 & 3
|
|
|
M5
|
80.2%
|
65.0%
|
85.7%
|
78.0%
|
|
B5
|
78.3%
|
78.3%
|
85.2%
|
85.2%
|
|
S5
|
77.0%
|
46.8%
|
82.5%
|
84.8%
|
|
L6
|
75.8%
|
32.9%
|
79.4%
|
78.7%
|
|
Seam
|
Process Fixed Cost / tonne
|
|
|
Stream 1
|
Streams 2 & 3
|
|
|
M5
|
$30.50
|
$30.80
|
|
B5
|
$30.50
|
$30.50
|
|
S5
|
$30.50
|
$15.19
|
|
L6
|
$30.50
|
$17.53
|
|
11.9.3.
|
Acid Consumption and Cost
|
|
|
11-30 |
30 SEPTEMBER 2025
|
|
Rhyolite Ridge Lithium-Boron Project
|
S-K 1300 Technical Report Summary
|
|
Li, ppm
|
Ca, %
|
Mg, %
|
Na, %
|
K, %
|
Al, %
|
Fe, %
|
Sr, ppm
|
Mn, ppm
|
|
|
Block Model values
|
2152.70
|
9.13
|
4.21
|
2.64
|
0.99
|
0.83
|
0.65
|
8698.30
|
403.35
|
|
Factor1
|
1.00
|
1.00
|
1.00
|
1.00
|
2.10
|
2.35
|
1.00
|
1.00
|
1.00
|
|
Weight %
|
0.22
|
9.13
|
4.21
|
2.64
|
0.99
|
0.83
|
0.65
|
0.87
|
0.04
|
|
Extraction
|
94.1%
|
100.0%
|
93.5%
|
90.8%
|
52.7%
|
47.6%
|
45.1%
|
95.0%
|
91.0%
|
|
Factor2
|
0.50
|
1.00
|
1.00
|
0.50
|
0.50
|
1.50
|
1.00
|
1.00
|
1.00
|
|
Weight3
|
6.941
|
40.079
|
24.305
|
22.990
|
39.098
|
26.982
|
55.847
|
87.620
|
54.938
|
|
Acid4
|
0.01432
|
0.22348
|
0.15888
|
0.05114
|
0.01375
|
0.05063
|
0.00515
|
0.00925
|
0.00065
|
|
% of Acid
|
2.68%
|
41.91%
|
29.79%
|
9.59%
|
2.58%
|
9.50%
|
0.97%
|
1.73%
|
0.12%
|
|
Percent Extraction by Element (3 Day Vat Leach Cycle)
|
2 Day
Factor
|
|||||||||
|
Seam
|
Li
|
Ca
|
Mg
|
Na
|
K
|
Al
|
Fe
|
Sr
|
Mn
|
Factor*
|
|
M5
|
94.1
|
100.0
|
93.5
|
90.8
|
52.7
|
47.6
|
45.1
|
95.0
|
91.0
|
83.3%
|
|
B5
|
94.1
|
100.0
|
93.5
|
90.8
|
52.7
|
47.6
|
45.1
|
95.0
|
91.0
|
79.8%
|
|
S5
|
94.1
|
80.0
|
93.5
|
90.8
|
52.7
|
47.6
|
45.1
|
95.0
|
91.0
|
69.9%
|
|
L6
|
94.1
|
86.0 (Ca <= 15%)
63.0 (Ca > 15%)
|
93.5
|
90.8
|
52.7
|
47.6
|
45.1
|
95.0
|
91.0
|
79.4%
|
|
|
11-31 |
30 SEPTEMBER 2025
|
|
Rhyolite Ridge Lithium-Boron Project
|
S-K 1300 Technical Report Summary
|
|
Seam
|
Stream 1
|
Stream 2 or 3
|
||||||
|
# blocks
|
Acid Consumption (metric ton acid/metric ton processed
|
# blocks
|
Acid Consumption (metric ton acid/metric ton processed
|
|||||
|
Mean
|
Minimum
|
Maximum
|
Mean
|
Minimum
|
Maximum
|
|||
|
M5
|
10,703
|
0.5193
|
0.1545
|
0.6220
|
71,785
|
0.4882
|
0.1515
|
0.6768
|
|
B5
|
93,523
|
0.3868
|
0.1106
|
0.5796
|
14,278
|
0.3842
|
0.1170
|
0.5374
|
|
S5
|
10,392
|
0.2585
|
0.0960
|
0.4226
|
77,797
|
0.2120
|
0.0425
|
0.4360
|
|
L6
|
68,610
|
0.3520
|
0.1087
|
0.4496
|
205,851
|
0.3297
|
0.0668
|
0.4755
|
|
11.9.4.
|
Calculation of Net Value
|
|
|
- |
Gross value of a block minus the process costs for blocks above the cutoff
grades
|
|
|
- |
Gross value = sum of the recovered values of boric acid plus lithium carbonate
|
|
|
- |
Process costs = sum of the cost of acid plus the process fixed costs (by seam
and stream)
|
|
Seam
|
Stream 1
|
Stream 2 or 3
|
||||||
|
# blocks
|
Net Value, $ per tonne
|
# blocks
|
Net Value, $ per tonne
|
|||||
|
Mean
|
Minimum
|
Maximum
|
Mean
|
Minimum
|
Maximum
|
|||
|
M5
|
10,703
|
167.85
|
44.64
|
224.26
|
71,785
|
95.12
|
11.16
|
179.98
|
|
B5
|
93,523
|
169.81
|
33.34
|
282.78
|
14,278
|
128.12
|
11.28
|
225.57
|
|
S5
|
10,392
|
100.81
|
25.69
|
272.07
|
77,797
|
50.67
|
11.13
|
245.87
|
|
L6
|
68,610
|
101.76
|
11.44
|
261.06
|
205.851
|
54.76
|
11.13
|
182.56
|
|
11.10.
|
Mineral Resource Statement
|
|
|
11-32 |
30 SEPTEMBER 2025
|
|
Rhyolite Ridge Lithium-Boron Project
|
S-K 1300 Technical Report Summary
|
|
|
- |
Run the resource pit shell and tabulate the measured, indicated and inferred
tonnage and grades for the three process streams within the four seams (M5, B5, S5, L6);
|
|
|
- |
For process streams 1, 2 and 3: subtract the proven tonnage and grade within
the LOM schedule from the measured tonnage and grade within the mineral resource pit shell;
|
|
|
- |
For process streams 1, 2 and 3: subtract the probable tonnage and grade within
the LOM schedule from the indicated tonnage and grade within the mineral resource pit shell;
|
|
|
- |
All inferred tonnage and grade within the resource pit shell is included in
the mineral resource.
|
|
|
- |
Drill Hole Database: added 54 holes (5 RC, 49 core), total additional meters –
9,183 m (30,129 ft) and 1,547 additional assay samples;
|
|
|
- |
Density: Use of 2010 density dataset was not used in the August 2025 resource
as the values could not be validated leading to a lower density value and overall tonnage than calculated in March 2023 resource;
|
|
|
- |
Resource Block Model: new geologic framework and grade estimation: tabulation
changed from a 1.52m (5 ft) model to 9.14 m (30 ft) reblock model from a 1.52 m (5 ft) model;
|
|
|
- |
Recovery: changed from one recovery (Boron at 83.5%, Lithium at 81.1%) to
recovery by seam and process stream (Table 11-10);
|
|
|
- |
Process Costs: changed from one total process cost to
combination of fixed cost (by seam and stream) plus a cost of acid based on the acid consumption calculated for each block in
the resource model (Tables 11-13, 11-14 and 11-15);
|
|
|
- |
Resource Tabulation: changed from tabulating seams above 5,000
ppm Boron or above 1090 ppm Lithium to tabulating M5, B5, S5, L6 for process streams 1, 2, 3 (Table 11-9).
|
|
|
11-33 |
30 SEPTEMBER 2025
|
|
Rhyolite Ridge Lithium-Boron Project
|
S-K 1300 Technical Report Summary
|
|
Stream
|
Group
|
Classification
|
Tonnage
kt
|
Li
ppm
|
B
ppm
|
Li2CO3
wt. %
|
H3BO3
wt. %
|
Contained
Li2CO3 kt
|
Contained
H3BO3 kt
|
||
|
Stream 1 (>= 5,000 ppm B)
|
Upper Zone
B5 Unit |
Measured
|
10,414
|
1,921
|
15,063
|
1.02
|
8.61
|
106
|
897
|
||
|
Indicated
|
7,214
|
1,749
|
13,240
|
0.93
|
7.57
|
67
|
546
|
||||
|
Total (M&I)
|
17,628
|
1,850
|
14,317
|
0.98
|
8.19
|
174
|
1,443
|
||||
|
Inferred
|
10,628
|
1,712
|
10,563
|
0.91
|
6.04
|
97
|
642
|
||||
|
Total (MII)
|
28,255
|
1,798
|
12,905
|
0.96
|
7.38
|
270
|
2,085
|
||||
|
Upper Zone
M5 Unit |
Measured
|
1,073
|
2,186
|
7,397
|
1.16
|
4.23
|
12
|
45
|
|||
|
Indicated
|
814
|
2,100
|
7,535
|
1.12
|
4.31
|
9
|
35
|
||||
|
Total (M&I)
|
1,887
|
2,149
|
7,456
|
1.14
|
4.26
|
22
|
80
|
||||
|
Inferred
|
763
|
2,197
|
6,515
|
1.17
|
3.73
|
9
|
28
|
||||
|
Total (MII)
|
2,650
|
2,163
|
7,185
|
1.15
|
4.11
|
31
|
109
|
||||
|
Upper Zone
S5 Unit |
Measured
|
1,456
|
1,561
|
7,467
|
0.83
|
4.27
|
12
|
62
|
|||
|
Indicated
|
1,393
|
1,571
|
7,132
|
0.84
|
4.08
|
12
|
57
|
||||
|
Total (M&I)
|
2,849
|
1,566
|
7,303
|
0.83
|
4.18
|
24
|
119
|
||||
|
Inferred
|
1,572
|
1,400
|
6,469
|
0.75
|
3.70
|
12
|
58
|
||||
|
Total (MII)
|
4,421
|
1,507
|
7,006
|
0.80
|
4.01
|
35
|
177
|
||||
|
Upper Zone Total
|
Measured
|
12,943
|
1,902
|
13,573
|
1.01
|
7.76
|
131
|
1,004
|
|||
|
Indicated
|
9,420
|
1,753
|
11,844
|
0.93
|
6.77
|
88
|
638
|
||||
|
Total (M&I)
|
22,363
|
1,839
|
12,845
|
0.98
|
7.34
|
219
|
1,642
|
||||
|
Inferred
|
12,963
|
1,703
|
9,828
|
0.91
|
5.62
|
117
|
728
|
||||
|
Total (MII)
|
35,326
|
1,789
|
11,738
|
0.95
|
6.71
|
336
|
2,371
|
||||
|
Lower Zone
L6 Unit |
Measured
|
12,014
|
1,355
|
9,838
|
0.72
|
5.63
|
87
|
676
|
|||
|
Indicated
|
26,139
|
1,319
|
10,365
|
0.70
|
5.93
|
183
|
1,549
|
||||
|
Total (M&I)
|
38,153
|
1,330
|
10,199
|
0.71
|
5.83
|
270
|
2,225
|
||||
|
Inferred
|
13,914
|
1,415
|
12,287
|
0.75
|
7.03
|
105
|
978
|
||||
|
Total (MII)
|
52,067
|
1,353
|
10,757
|
0.72
|
6.15
|
375
|
3,203
|
||||
|
Total Stream 1 (all zones)
|
Measured
|
24,957
|
1,639
|
11,775
|
0.87
|
6.73
|
218
|
1,680
|
|||
|
Indicated
|
35,559
|
1,434
|
10,757
|
0.76
|
6.15
|
271
|
2,187
|
||||
|
Total (M&I)
|
60,516
|
1,518
|
11,177
|
0.81
|
6.39
|
489
|
3,867
|
||||
|
Inferred
|
26,877
|
1,554
|
11,101
|
0.83
|
6.35
|
222
|
1,706
|
||||
|
Total (MII)
|
87,393
|
1,529
|
11,153
|
0.81
|
6.38
|
711
|
5,573
|
|
|
11-34 |
30 SEPTEMBER 2025
|
|
Rhyolite Ridge Lithium-Boron Project
|
S-K 1300 Technical Report Summary
|
| Stream |
Group
|
Classification
|
Tonnage
kt
|
Li
ppm
|
B
ppm
|
Li2CO3
wt. %
|
H3BO3
wt. %
|
Contained
Li2CO3 kt
|
Contained
H3BO3 kt
|
||
|
Stream 2 (>= 11.13/tonne net value, <
5,000 ppm B. Low Clay)
|
Upper Zone
B5 Unit |
Measured
|
438
|
2,321
|
2,925
|
1.24
|
1.67
|
5
|
7
|
||
|
Indicated
|
362
|
2,092
|
3,674
|
1.11
|
2.10
|
4
|
8
|
||||
|
Total (M&I)
|
800
|
2,217
|
3,264
|
1.18
|
1.87
|
9
|
15
|
||||
|
Inferred
|
3,690
|
1,695
|
1,776
|
0.90
|
1.02
|
33
|
37
|
||||
|
Total (MII)
|
4,491
|
1,788
|
2,041
|
0.95
|
1.17
|
43
|
52
|
||||
|
Upper Zone
S5 Unit |
Measured
|
9,400
|
996
|
1,226
|
0.53
|
0.70
|
50
|
66
|
|||
|
Indicated
|
7,981
|
1,012
|
1,524
|
0.54
|
0.87
|
43
|
70
|
||||
|
Total (M&I)
|
17,382
|
1,003
|
1,363
|
0.53
|
0.78
|
93
|
135
|
||||
|
Inferred
|
15,491
|
889
|
1,014
|
0.47
|
0.58
|
73
|
90
|
||||
|
Total (MII)
|
32,873
|
949
|
1,198
|
0.51
|
0.69
|
166
|
225
|
||||
|
Upper Zone Total
|
Measured
|
9,839
|
1,055
|
1,302
|
0.56
|
0.74
|
55
|
73
|
|||
|
Indicated
|
8,343
|
1,059
|
1,617
|
0.56
|
0.92
|
47
|
77
|
||||
|
Total (M&I)
|
18,182
|
1,057
|
1,447
|
0.56
|
0.83
|
102
|
150
|
||||
|
Inferred
|
19,187
|
1,044
|
1,160
|
0.56
|
0.66
|
107
|
127
|
||||
|
Total (MII)
|
37,369
|
1,050
|
1,300
|
0.56
|
0.74
|
209
|
278
|
||||
|
Lower Zone
L6 Unit |
Measured
|
19,043
|
1,155
|
1,979
|
0.61
|
1.13
|
117
|
215
|
|||
|
Indicated
|
51,191
|
1,158
|
1,624
|
0.62
|
0.93
|
316
|
475
|
||||
|
Total (M&I)
|
70,234
|
1,157
|
1,720
|
0.62
|
0.98
|
433
|
691
|
||||
|
Inferred
|
47,474
|
1,244
|
790
|
0.66
|
0.45
|
314
|
214
|
||||
|
Total (MII)
|
117,708
|
1,192
|
1,345
|
0.63
|
0.77
|
747
|
905
|
||||
|
Total Stream 2 (all zones)
|
Measured
|
28,881
|
1,121
|
1,748
|
0.60
|
1.00
|
172
|
289
|
|||
|
Indicated
|
59,535
|
1,144
|
1,623
|
0.61
|
0.93
|
363
|
553
|
||||
|
Total (M&I)
|
88,416
|
1,137
|
1,664
|
0.60
|
0.95
|
535
|
841
|
||||
|
Inferred
|
66,662
|
1,186
|
897
|
0.63
|
0.51
|
421
|
342
|
||||
|
Total (MII)
|
155,078
|
1,158
|
1,334
|
0.62
|
0.76
|
956
|
1,183
|
||||
|
Stream 3(>= 11.13/tonne net value, <
5,000 ppm B, High Clay)
|
Total Stream 3 (M5 zone)
|
Measured
|
13,602
|
2,202
|
1,487
|
1.17
|
0.85
|
159
|
116
|
||
|
Indicated
|
11,437
|
2,100
|
1,205
|
1.12
|
0.69
|
128
|
79
|
||||
|
Total (M&I)
|
25,039
|
2,155
|
1,358
|
1.15
|
0.78
|
287
|
194
|
||||
|
Inferred
|
11,608
|
1,654
|
601
|
0.88
|
0.34
|
102
|
40
|
||||
|
Total (MII)
|
36,647
|
1,997
|
1,118
|
1.06
|
0.64
|
389
|
234
|
||||
|
All Streams
|
M&I Resource
|
Measured
|
67,440
|
1,530
|
5,406
|
0.81
|
3.09
|
549
|
2,085
|
||
|
Indicated
|
106,531
|
1,344
|
4,627
|
0.72
|
2.65
|
762
|
2,818
|
||||
|
Total (M&I)
|
173,971
|
1,416
|
4,929
|
0.75
|
2.82
|
1,311
|
4,903
|
||||
|
Inferred Resource
|
Inferred
|
105,147
|
1,332
|
3,472
|
0.71
|
1.99
|
745
|
2,088
|
|||
|
Total (MII)
|
279,117
|
1,384
|
4,380
|
0.74
|
2.50
|
2,056
|
6,991
|
|
|
1. |
kt = thousand tonnes; Li= lithium; B= boron; ppm= parts per million; Li2CO3 = lithium carbonate; H3BO3 = boric
acid
|
|
|
2. |
Totals may differ due to rounding mineral resources reported on a dry in-situ basis.
Lithium is converted to Equivalent Contained Tons of lithium carbonate using a stochiometric conversion factor of 5.322,
and boron is converted to Equivalent Contained Tons of boric acid using a stochiometric conversion factor of 5.718.
Equivalent stochiometric conversion factors are derived from the molecular weights of the individual elements which make
up lithium carbonate and boric acid. Lithium carbonate and boric acid are reported in metric tons.
|
|
|
3. |
The statement of estimates of mineral resources has been compiled by the QP, a
full-time employee of Independent Mining Consultants, Inc. and is independent of ioneer and its affiliates. The QP has
sufficient experience that is relevant to the style of mineralisation and type of deposit under consideration and to the
activity being undertaken to qualify as a Competent Person as defined in the 2012 Edition of the ‘Australasian Code for
Reporting of Exploration Results, Mineral Resources and Ore Reserves’.
|
|
|
4. |
All mineral resource figures reported in the table above represent estimates at
August 2025. Mineral resource estimates are not precise calculations, being dependent on the interpretation of limited
information on the location, shape and continuity of the occurrence and on the available sampling results. The totals
contained in the above table have been rounded to reflect the relative uncertainty of the estimate.
|
|
|
5. |
Mineral resources are reported in accordance with the US SEC Regulation S-K Subpart
1300. The mineral resources in this Report were estimated using the regulation S-K 229.1304 of the United States
Securities and Exchange Commission (“SEC”). Mineral resources are also reported in accordance with the 2012 Edition of
the Australasian Code for Reporting of Exploration Results, Mineral Resources and Ore Reserves.
|
|
|
6. |
The Mineral Resource estimate is the result of determining the mineralized material
that has a reasonable prospect of economic extraction. In making this determination, constraints were applied to the
geological model based upon a pit optimization analysis that defined a conceptual pit shell limit. The conceptual pit
shell was based upon a net value per tonne calculation including a 5,000ppm boron cut-off grade for high boron – high
lithium (HiB-Li) mineralization (Stream 1) and a $11.13/tonne net value cut-off grade for low boron (LoB-Li)
mineralization below 5,000ppm boron broke into two material types, low clay and high clay material respectfully (Stream
2 and Stream 3). The pit shell was constrained by a conceptual Mineral Resource optimized pit shell for the purpose of
establishing reasonable prospects of eventual economic extraction based on potential mining, metallurgical and
processing grade parameters identified by mining, metallurgical and processing studies performed to date on the Project.
Key inputs in developing the Mineral Resource pit shell included a 5,000 ppm boron cut-off grade for HiB-Li
mineralization, $11.13/tonne net value cut-off grade for LoB-Li low clay mineralization and LoB-Li high clay
mineralization; mining cost of US$1.69 /tonne; G&A cost of US$11.13 /process tonne; plant feed processing and grade
control costs which range between US$18.87/tonne and US$98.63/tonne of plant feed (based on the acid consumption per
stream and the mineral resource average grades); boron and lithium recovery (respectively) for Stream 1: M5 80.2% and
85.7%, B5 78.3% and 85.2%, S5 77.0% and 82.5%, L6 75.8% and 79.4%; Stream 2 and 3: M5 65% and 78%, B5 78.3% and 85.2%,
S5 46.8% and 84.8%, L6 32.9% and 78.7%, respectively; boric acid sales price of US$1,172.78/tonne; lithium carbonate
sales price of US$19,351.38/tonne.
|
|
|
7. |
The mineral resource is reported exclusive of the mineral reserves.
|
|
|
11-35 |
30 SEPTEMBER 2025
|
|
Rhyolite Ridge Lithium-Boron Project
|
S-K 1300 Technical Report Summary
|
|
Category
|
Tonnage
(Mt)1
|
Li, ppm
|
B,ppm
|
Li2CO3 ktonnes
|
H3BO3 ktonnes
|
|
|
August 2025
|
||||||
|
Measured
|
67.4
|
1,530
|
5,406
|
549
|
2,085
|
|
|
Indicated
|
106.5
|
1,344
|
4,627
|
762
|
2,818
|
|
|
Sum M&I
|
174.0
|
1,416
|
4,929
|
1,311
|
4,903
|
|
|
Inferred
|
105.1
|
1,332
|
3,472
|
745
|
2,088
|
|
|
Total
|
279.1
|
1,384
|
4,380
|
2,056
|
6,991
|
|
|
October 2023
|
||||||
|
Measured
|
17.1
|
1,503
|
9,374
|
137
|
919
|
|
|
Indicated
|
220.1
|
1,760
|
4,654
|
2,061
|
5,856
|
|
|
Sum M&I
|
237.2
|
1,741
|
4,995
|
2,198
|
6,775
|
|
|
Inferred
|
62.1
|
1,795
|
4,392
|
593
|
1,558
|
|
|
Total
|
299.3
|
1,752
|
4,870
|
2,791
|
8,334
|
|
|
Difference
|
||||||
|
Measured
|
50.3
|
412.2
|
1,165.7
|
|||
|
Indicated
|
-113.6
|
-1,299.4
|
-3,038.0
|
|||
|
Sum M&I
|
-63.3
|
-887.3
|
-1,872.3
|
|||
|
Inferred
|
43.1
|
152.7
|
529.2
|
|||
|
Total
|
-20.2
|
-734.5
|
-1,343.1
|
|||
|
|
11-36 |
30 SEPTEMBER 2025
|
|
Rhyolite Ridge Lithium-Boron Project
|
S-K 1300 Technical Report Summary
|
|
11.10.1.
|
Mining Factors or Assumptions
|
|
11.10.1.1.
|
Metallurgical Factors or Assumptions
|
|
11.10.1.2.
|
Environmental Factors or Assumptions
|
|
|
11-37 |
30 SEPTEMBER 2025
|
|
Rhyolite Ridge Lithium-Boron Project
|
S-K 1300 Technical Report Summary
|
|
11.11.
|
Mineral Resource Uncertainty Discussion
|
|
|
- |
Sampling and drilling methods – Section 7.2 and 8.0
|
|
|
- |
Data processing and handling – Section 11.2 and 11.3
|
|
|
- |
Geological modeling – Section 11.4
|
|
|
- |
Tonnage estimation – Section 11.6
|
|
|
- |
Process recovery and costs – Section 10 and 11.8
|
|
|
11-38 |
30 SEPTEMBER 2025
|
|
Rhyolite Ridge Lithium-Boron Project
|
S-K 1300 Technical Report Summary
|
|
|
- |
Potential significant changes in the assumptions regarding forecast product prices,
process recoveries, or production costs;
|
|
|
- |
Potential changes in geometry and/or continuity of the geological units due to
displacement from localized faulting and folding;
|
|
|
- |
Potential changes in grade based on additional drilling that would influence the
tonnages that would be excluded with the cut-off grade;
|
|
|
- |
Potential for changes to the environmental requirements related to permit
applications;
|
|
|
- |
In summary, given all the considerations in this Report, the uncertainty in the
tonnage estimate for the Measured Mineral Resources, is low, Indicated Mineral Resources estimates is low to moderate,
and Inferred Mineral Resources is moderate, as shown in Table 11-18.
|
|
Uncertainty Item
|
Measured
Uncertainty
|
Indicated
Uncertainty
|
Inferred Uncertainty
|
|
|
Sampling and Drilling Methods
|
Low
|
Low
|
Low
|
|
|
Data Processing and Handling
|
Low
|
Low
|
Low
|
|
|
Geological Modeling – Globally/Locally
|
Low/Low
|
Low/Low-Moderate
|
Low-Moderate/Moderate
|
|
|
Geological Domaining
|
Low
|
Low
|
Low
|
|
|
Geostatistical Analysis
|
Low
|
Low
|
Moderate
|
|
|
Block Modeling – Globally /Locally
|
Low/Low
|
Low/Low-Moderate
|
Low-Moderate/Moderate
|
|
|
Tonnage Estimate
|
Low
|
Low-Moderate
|
Moderate
|
|
11.12.
|
Factors That are Likely to Influence the
Prospect of Economic Extraction
|
|
|
11-39 |
30 SEPTEMBER 2025
|
|
Rhyolite Ridge Lithium-Boron Project
|
S-K 1300 Technical Report Summary
|
|
|
- |
Geological uncertainty relating to local structural control relating to geometry,
location, and displacement of faults.
|
|
|
- |
Geological uncertainty and opportunity regarding the continuity and geometry of
stratigraphy and mineralization in the eastern and northern extents of the basin, outside of the current mineral
resource footprint.
|
|
|
- |
Opportunity to recover lithium from the LoB-Li mineralization encountered on the
Project by way of additional LoB-Li mineralization metallurgical studies.
|
|
|
- |
Potential impacts to the mineral resource footprint related to potential changes in
the Project footprint relating to avoidance and mitigation measures relating to the Tiehm’s buckwheat and designated
critical habitat areas.
|
|
|
11-40 |
30 SEPTEMBER 2025
|
|
Rhyolite Ridge Lithium-Boron Project
|
S-K 1300 Technical Report Summary
|
|
12.
|
MINERAL RESERVE ESTIMATES
|
|
12.1.
|
Key Assumptions, Parameters, and Methods
|
|
12.1.1.
|
Mine Design Criteria
|
|
12.1.1.1.
|
Buckwheat Constraint
|
|
12.1.1.2.
|
Geotechnical Constraint
|
|
|
12-1 |
30 SEPTEMBER 2025
|
|
Rhyolite Ridge Lithium-Boron Project
|
S-K 1300 Technical Report Summary
|
|
12.1.1.3.
|
Phase Sequencing of Quarry Development
|
|
12.1.2.
|
Modifying Factors
|
|
12.1.2.1.
|
Dilution, Loss, and Mining Recovery
|
|
12.1.2.2.
|
Project Limits
|
|
12.1.2.3.
|
Project Limits
|
|
|
12-2 |
30 SEPTEMBER 2025
|
|
Rhyolite Ridge Lithium-Boron Project
|
S-K 1300 Technical Report Summary
|
|
12.1.2.4.
|
Conversion from Elemental Grades to
Equivalent Grades
|
|
|
- |
Boric acid grade (ppm) = boron grade (ppm) x 5.718;
|
|
|
- |
Lithium carbonate grade (ppm) = lithium grade (ppm) x 5.322.
|
|
12.1.2.5.
|
Cut-Off Grade
|
|
12.1.2.5.1.
|
Grade–Tonnage Analysis
|
|
12.1.2.5.2.
|
Economic Evaluation
|
|
|
12-3 |
30 SEPTEMBER 2025
|
|
Rhyolite Ridge Lithium-Boron Project
|
S-K 1300 Technical Report Summary
|
|
Input
|
Units
|
Value
|
|
Mining cost
|
||
|
Fixed cost
|
US$/metric ton mined
|
1.69
|
|
Average mining cost1
|
US$/metric ton mined
|
2.44
|
|
Average mining cost1
|
US$/metric ton processed
|
9.49
|
|
Processing cost (fixed)2
|
US$/metric ton
|
22.08
|
|
Processing cost (variable)3
|
US$/metric ton
|
40.96
|
|
Sulfuric acid cost
|
US$/metric ton-sulfuric acid
|
75.74
|
|
Net of processing4
|
US$/metric ton
|
61.38
|
|
Process feed cut-off grade
|
||
|
Boron (stream 1)
|
ppm
|
5,000
|
|
Lithium (streams 2 & 3)
|
US$ net value/metric ton
|
11.13
|
|
Boric acid recovery5
|
||
|
Stream 1 (B5)
|
%
|
78.3
|
|
Stream 1 (M5)
|
%
|
80.2
|
|
Stream 1 (S5)
|
%
|
77.0
|
|
Stream 1 (L6)
|
%
|
75.8
|
|
Stream 2 (B5)
|
%
|
78.3
|
|
Stream 2 (S5)
|
%
|
46.8
|
|
Stream 2 (L6)
|
%
|
32.9
|
|
Stream 3 (M5)
|
%
|
65.0
|
|
Lithium carbonate recovery5
|
||
|
Stream 1 (B5)
|
%
|
85.2
|
|
Stream 1 (M5)
|
%
|
85.7
|
|
Stream 1 (S5)
|
%
|
82.5
|
|
Stream 1 (L6)
|
%
|
79.4
|
|
Stream 2 (B5)
|
%
|
85.2
|
|
Stream 2 (S5)
|
%
|
84.8
|
|
Stream 2 (L6)
|
%
|
78.7
|
|
Stream 3 (M5)
|
%
|
78.0
|
|
Stochiometric conversion factors5
|
||
|
Boric acid
|
factor
|
5.718
|
|
Lithium carbonate
|
factor
|
5.322
|
|
Selling price
|
||
|
Boric acid
|
US$/metric ton
|
1,172.78
|
|
Lithium carbonate
|
US$/metric ton
|
19,351.38
|
|
Pit slope angles6
|
||
|
TBX inter-ramp pit wall angle
|
degrees
|
42
|
|
Q1 inter-ramp pit wall angle
|
degrees
|
35
|
|
All other rock units in low-wall inter-ramp
|
degrees
|
42
|
|
All other rock units in highwall inter-ramp
|
degrees
|
42
|
|
|
12-4 |
30 SEPTEMBER 2025
|
|
Rhyolite Ridge Lithium-Boron Project
|
S-K 1300 Technical Report Summary
|
|
|
1. |
A variable mining cost of $0.00180/tonne per vertical foot from reference elevation
1,893 m (6,210 ft) amsl was applied to the quarry optimization to simulate increased mining costs resulting from longer
haulage distances from deeper haul profiles. Estimate provided by IMC.
|
|
|
2. |
Fixed Process Cost: LOM weighted average cost based on a fixed process cost; where,
Stream 01: M5=$30.5/t, B5=$30.5/t, S5=$30.5/t, L6=$30.5/t; Stream 02: B5=$30.5/t, S5=$15.19/t, and L6=$17.53/t; Stream
03: M5=$30.80/t, Process cost estimates provided by ioneer project team.
|
|
|
3. |
Acid Consumption Process Cost: The acid consumption is calculated within the block
model based on the elemental acid consumption (Lithium, Aluminum, Calcium, Iron, Potassium, Magnesium, Sodium, Strontium
and Manganese) formula provided by the ioneer project team. The LOM weighted average acid consumption cost where Stream
1: B5 = $32.56/t, S5=$21.04/t, L6=$33.06/t, M5=$42.08/t; for Stream 2: B5= $30.39/t, S5=$16.20/t, L6=$30.38/t and Stream
3: M5 = 39.91$/t.
|
|
|
4. |
Net of Processing is the value added per ton processed after the fixed and variable
processing costs have been deduced, but it does not include mining or G&A costs.
|
|
|
5. |
Recovery and conversion factors provided by ioneer project team.
|
|
|
6. |
Geotechnical slope design recommendations based on QP recommendations provided in
Section 13.1.1.
|
|
Summary of Process Recovery Seams
|
Boron
|
Lithium
|
||
|
Stream 1
|
Stream 2 & 3
|
Stream 1
|
Stream 2 & 3
|
|
|
M5
|
80.2%
|
65.0%
|
85.7%
|
78.0%
|
|
B5
|
78.3%
|
78.3%
|
85.2%
|
85.2%
|
|
S5
|
77.0%
|
46.8%
|
82.5%
|
84.8%
|
|
L6
|
75.8%
|
32.9%
|
79.4%
|
78.7%
|
|
|
12-5 |
30 SEPTEMBER 2025
|
|
Rhyolite Ridge Lithium-Boron Project
|
S-K 1300 Technical Report Summary
|
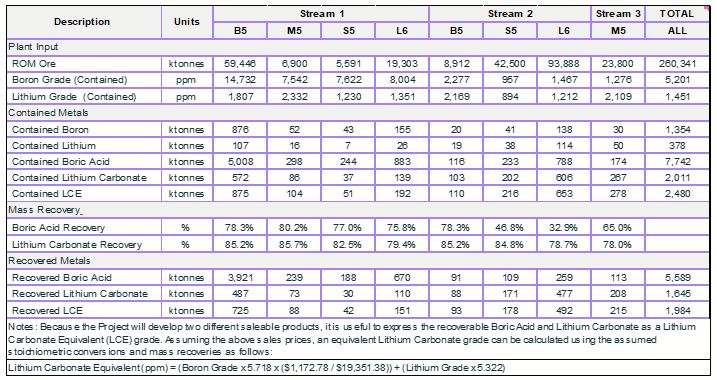
|
|
1. |
Since there will be two different saleable products, it is useful to express the
recoverable boric acid and lithium carbonate as a lithium carbonate equivalent (LCE) grade. Assuming the above sales
prices, an LCE grade can be calculated using the assumed stoichiometric conversions and mass recoveries as follows:
|
|
|
- |
All of the measured and indicated mineral resource classifications has a boron grade
>5,000 ppm. The inferred resource classification was not included in within process stream estimates summarized in
Figure 12-3;
|
|
|
- |
The majority of the stream 1 feed is contained within the B5 material. The
approximate 59.4 Mt of in-situ B5 material, accounts for nearly 65% of the stream 1 process feed;
|
|
|
- |
The second largest contribution of stream 1 feed is contained within the L6
material. Approximately 19.3 Mt of in-situ L6 within the stream 1 process feed.
|
|
|
- |
Only 6.9 Mt of in-situ M5 is within the stream 1 feed. Up to half of the M5 unit
consists of the M5a unit, a swelling clay which presents problems for the proposed processing plant design. Only a small
portion of the M5 unit can therefore be processed based on the cut-off grade analysis.
|
|
|
12-6 |
30 SEPTEMBER 2025
|
|
Rhyolite Ridge Lithium-Boron Project
|
S-K 1300 Technical Report Summary
|
|
|
- |
All of the measured and indicated mineral resource classifications has a net value
grade of at least $11.13/t. The inferred resource classification was not included in within process stream estimates
summarized in Figure 12-3;
|
|
|
- |
The majority of the stream 2 material is within the L6 seam. A total of 93.9 Mt of
in-situ L6 within the measured and indicated mineral resource classifications has a Net Value grade of at least
$11.13/t;
|
|
|
- |
There is only 8.9 Mt of in-situ B5 material, or nearly 6% of stream 2 feed.
|
|
|
- |
All of the measured and indicated mineral resource classifications has a net value
grade of at least $11.13/t. The inferred resource classification was not included in within process stream estimates
summarized in Figure 12-3;
|
|
|
- |
There is only 41.9 Mt of in-situ M5 within the stream 3 feed. The majority of the M5
seam would be treated as process stream 3. The stream 3 material must be blended with other process streams, therefore
only a portion of the M5 material can be included within the mine production schedule.
|
|
12.1.3.
|
Pit Targeting Methodology and Pit
Selection
|
|
|
- |
Modifying factors;
|
|
|
- |
Unit costs, including mining, processing, and sales costs;
|
|
|
- |
Metallurgical recovery;
|
|
|
- |
Sales prices;
|
|
|
- |
Cut-off grades;
|
|
|
- |
Geotechnical criteria, including overall quarry slopes;
|
|
|
- |
Other external constraints such as the locations of buckwheat, permit boundaries,
public utilities and infrastructure.
|
|
|
12-7 |
30 SEPTEMBER 2025
|
|
Rhyolite Ridge Lithium-Boron Project
|
S-K 1300 Technical Report Summary
|
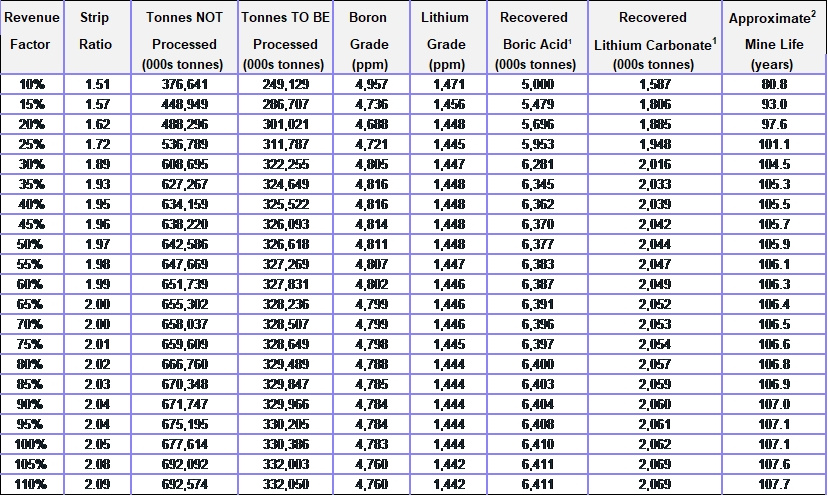
|
12.1.4.
|
Final Quarry Design
|
 |
12-8 |
30 SEPTEMBER 2025
|
|
Rhyolite Ridge Lithium-Boron Project
|
S-K 1300 Technical Report Summary
|
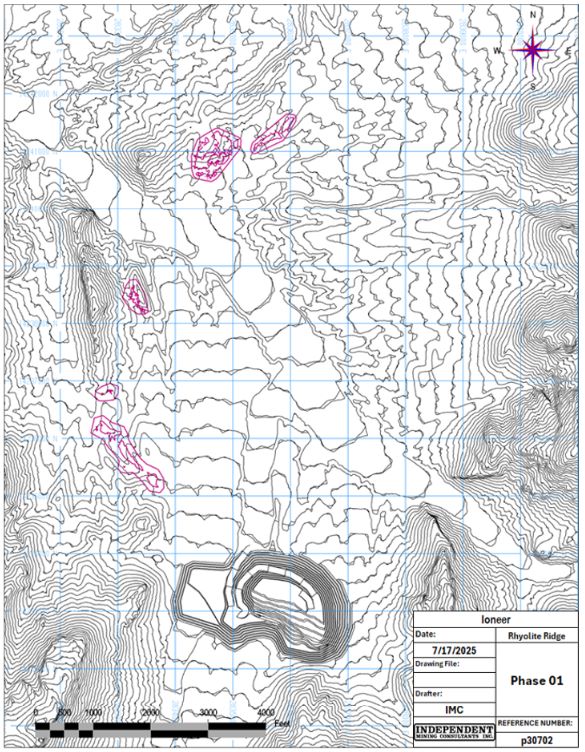
|
|
12-9 |
30 SEPTEMBER 2025
|
|
Rhyolite Ridge Lithium-Boron Project
|
S-K 1300 Technical Report Summary
|
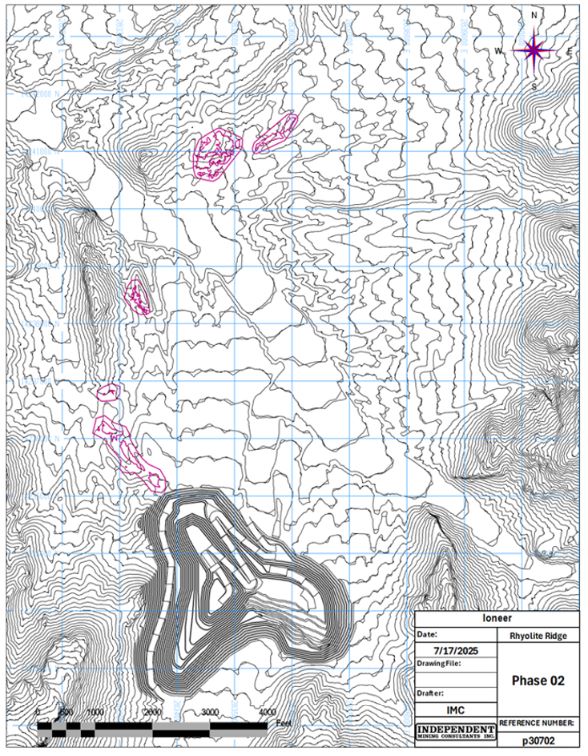
|
|
12-10 |
30 SEPTEMBER 2025
|
|
Rhyolite Ridge Lithium-Boron Project
|
S-K 1300 Technical Report Summary
|
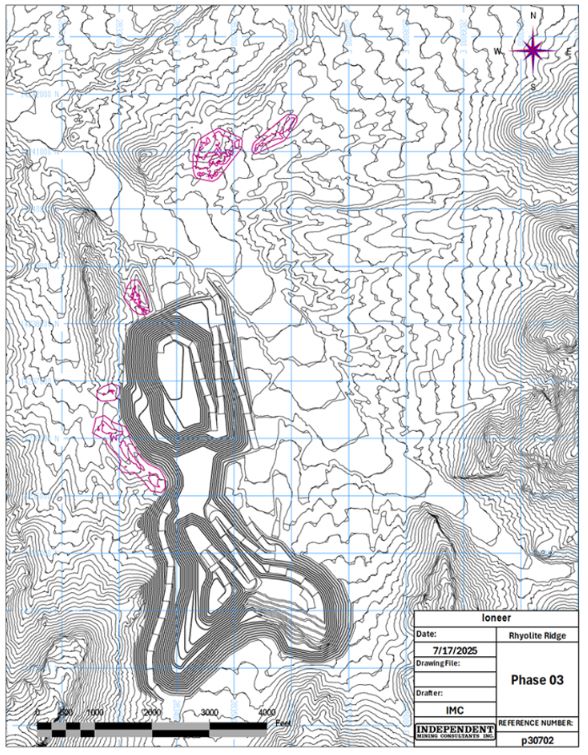
|
|
12-11 |
30 SEPTEMBER 2025
|
|
Rhyolite Ridge Lithium-Boron Project
|
S-K 1300 Technical Report Summary
|
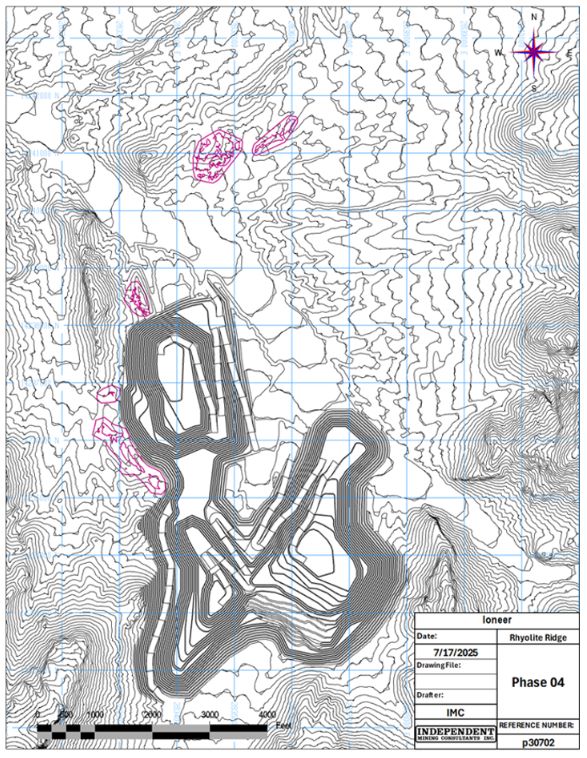
|
|
12-12 |
30 SEPTEMBER 2025
|
|
Rhyolite Ridge Lithium-Boron Project
|
S-K 1300 Technical Report Summary
|
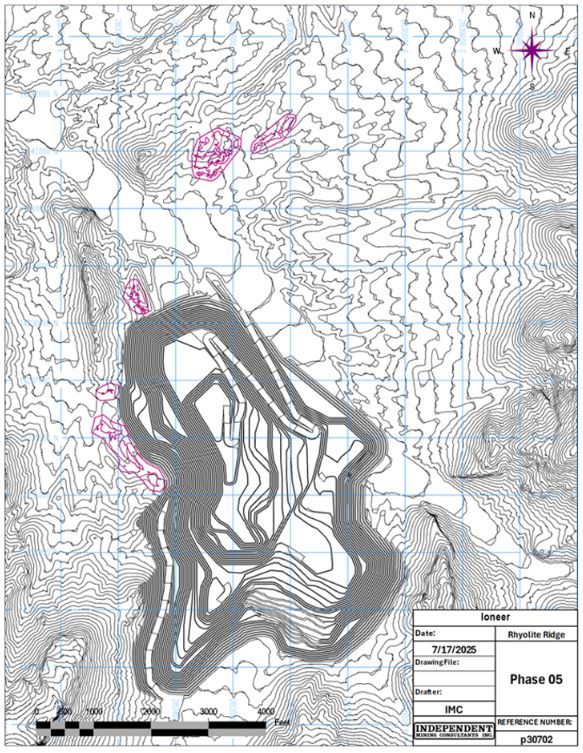
|
|
12-13 |
30 SEPTEMBER 2025
|
|
Rhyolite Ridge Lithium-Boron Project
|
S-K 1300 Technical Report Summary
|
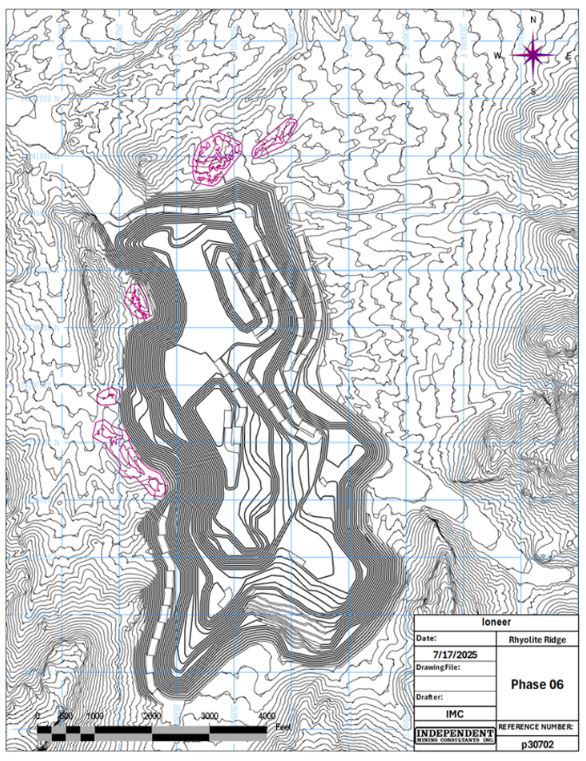
|
|
12-14 |
30 SEPTEMBER 2025
|
|
Rhyolite Ridge Lithium-Boron Project
|
S-K 1300 Technical Report Summary
|
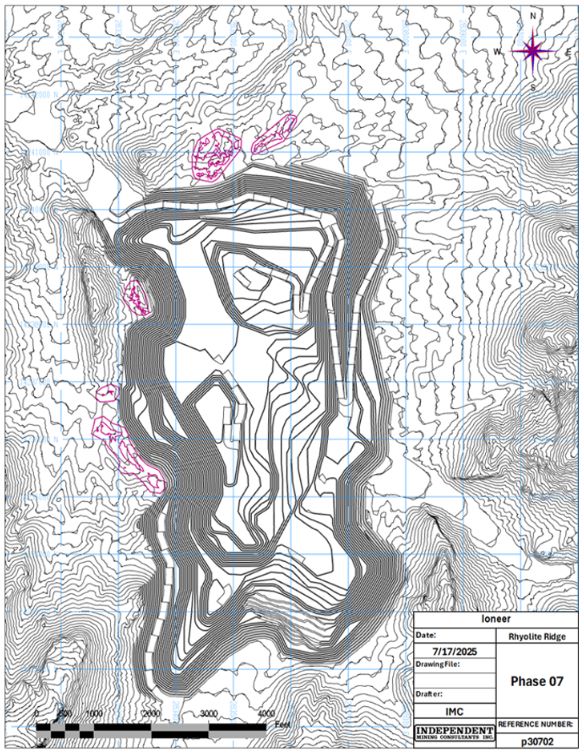
|
|
12-15 |
30 SEPTEMBER 2025
|
|
Rhyolite Ridge Lithium-Boron Project
|
S-K 1300 Technical Report Summary
|
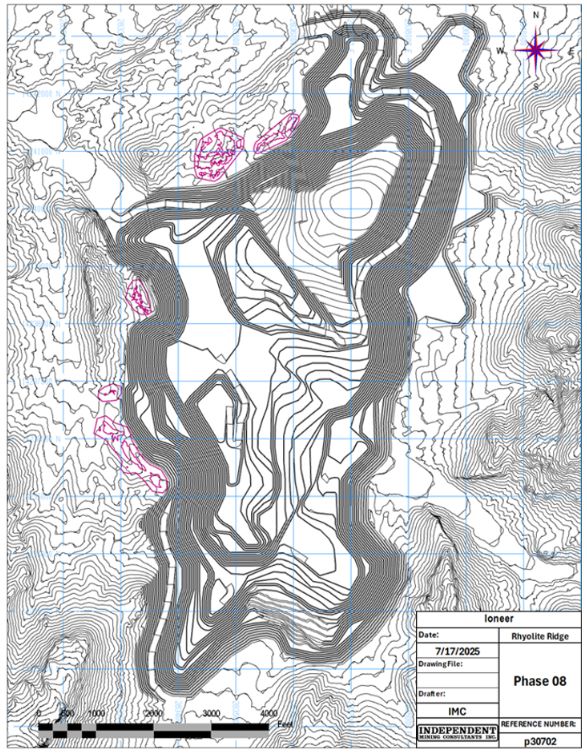
|
|
12-16 |
30 SEPTEMBER 2025
|
|
Rhyolite Ridge Lithium-Boron Project
|
S-K 1300 Technical Report Summary
|
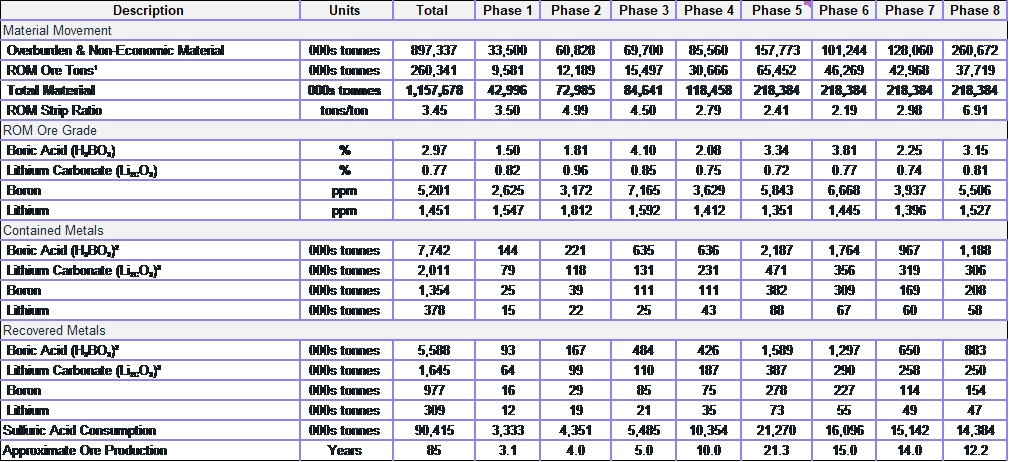
|
|
1. |
Ore includes dilution and losses.
|
|
|
2. |
Totals may differ due to rounding, Mineral Reserves reported on a
dry in-situ basis.
|
|
|
3. |
A stochiometric conversion factor of 5.718 was applied to convert
the boron grade to an equivalent boric acid grade.
|
|
|
4. |
A stochiometric conversion factor of 5.322 was applied to convert
the lithium grade to an equivalent lithium carbonate grade.
|
|
|
12-17 |
30 SEPTEMBER 2025
|
|
Rhyolite Ridge Lithium-Boron Project
|
S-K 1300 Technical Report Summary
|
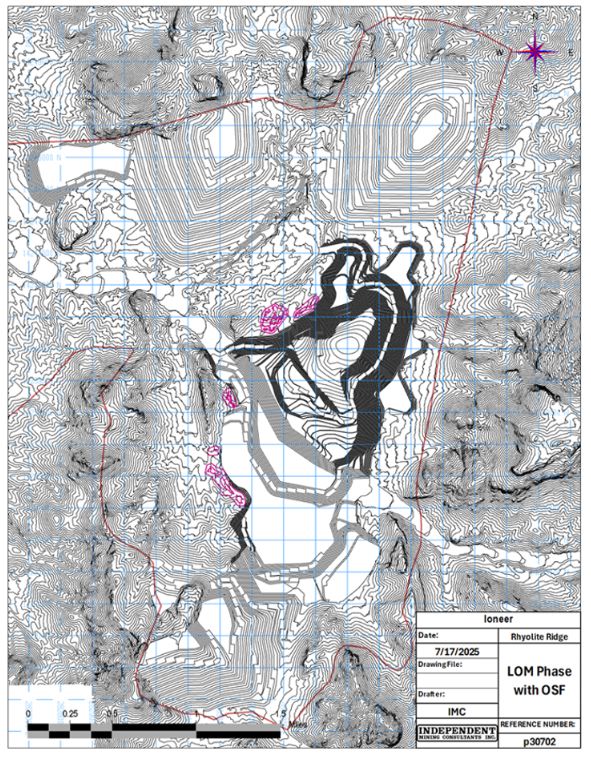
|
|
12-18 |
30 SEPTEMBER 2025
|
|
Rhyolite Ridge Lithium-Boron Project
|
S-K 1300 Technical Report Summary
|
|
12.2.
|
Mineral Reserve Estimate
|
|
|
12-19 |
30 SEPTEMBER 2025
|
|
Rhyolite Ridge Lithium-Boron Project
|
S-K 1300 Technical Report Summary
|
|
Area
|
Group
|
Classification
|
Short
|
Lithium
|
Boron
|
Contained
Equivalent
Grade
|
Contained
Equivalent Tons
|
Recovered
Equivalent Tons
|
||||||
|
Tons
|
Grade
|
Grade
|
||||||||||||
|
Li
|
B
|
Li2CO3
|
H3BO3
|
Li2CO3
|
H3BO3
|
Li2CO3
|
H3BO3
|
|||||||
|
(kt)
|
(ppm)
|
(ppm)
|
(wt.%)
|
(wt.%)
|
(kt)
|
(kt)
|
(kt)
|
(kt)
|
||||||
|
Stream 1
(>= 5,000
ppm B)
|
Upper
Zone
|
Proven
|
3,489
|
2,401
|
7,652
|
1.28
|
4.38
|
45
|
153
|
38
|
122
|
|||
|
M5 Unit
|
Probable
|
3,410
|
2,262
|
7,430
|
1.20
|
4.25
|
41
|
145
|
35
|
116
|
||||
|
Sub-total B5 Unit
|
6,899
|
2,332
|
7,542
|
1.24
|
4.31
|
86
|
298
|
73
|
239
|
|||||
|
Upper
Zone
|
Proven
|
27,991
|
1,880
|
15,364
|
1.00
|
8.79
|
280
|
2,459
|
239
|
1,925
|
||||
|
B5 Unit
|
Probable
|
31,456
|
1,742
|
14,169
|
0.93
|
8.10
|
292
|
2,549
|
248
|
1,995
|
||||
|
Sub-total M5 Unit
|
59,447
|
1,807
|
14,732
|
0.96
|
8.42
|
572
|
5,008
|
487
|
3,921
|
|||||
|
Upper
Zone
|
Proven
|
2,237
|
1,326
|
7,754
|
0.71
|
4.43
|
16
|
99
|
13
|
76
|
||||
|
S5 Unit
|
Probable
|
3,355
|
1,166
|
7,533
|
0.62
|
4.31
|
21
|
145
|
17
|
111
|
||||
|
Sub-total S5 Unit
|
5,592
|
1,230
|
7,621
|
0.65
|
4.36
|
37
|
244
|
30
|
187
|
|||||
|
Upper
Zone
|
Proven
|
33,717
|
1,897
|
14,061
|
1.01
|
8.04
|
340
|
2,711
|
290
|
2,124
|
||||
|
(B5, M5 &
S5)
|
Probable
|
38,221
|
1,738
|
12,985
|
0.92
|
7.42
|
353
|
2,838
|
301
|
2,223
|
||||
|
Sub-Total
|
Sub-total Upper
Zone
|
71,938
|
1,813
|
13,489
|
0.96
|
7.71
|
694
|
5,549
|
591
|
4,347
|
||||
|
Lower
Zone
|
Proven
|
5,712
|
1,389
|
8,357
|
0.74
|
4.78
|
42
|
273
|
34
|
207
|
||||
|
L6 Unit
|
Probable
|
13,592
|
1,334
|
7,856
|
0.71
|
4.49
|
96
|
611
|
77
|
463
|
||||
|
Sub-total Lower
Zone
|
19,303
|
1,350
|
8,004
|
0.72
|
4.58
|
139
|
883
|
110
|
670
|
|||||
|
Total
Stream 1
(all zones)
|
Proven
|
39,428
|
1,824
|
13,235
|
0.97
|
7.57
|
383
|
2,984
|
323
|
2,331
|
||||
|
Probable
|
51,813
|
1,632
|
11,640
|
0.87
|
6.66
|
450
|
3,448
|
377
|
2,686
|
|||||
|
Sub-total Stream 1
|
91,241
|
1,715
|
12,329
|
0.91
|
7.05
|
833
|
6,432
|
700
|
5,017
|
|||||
|
Stream 2
($16.54/t
net value
cut-off
grade. Low
Clay)
|
Upper
Zone
|
Proven
|
4,528
|
2,219
|
2,143
|
1.18
|
1.23
|
53
|
55
|
46
|
43
|
|||
|
B5 Unit
|
Probable
|
4,384
|
2,118
|
2,415
|
1.13
|
1.38
|
49
|
61
|
42
|
47
|
||||
|
Sub-total B5 Unit
|
8,912
|
2,169
|
2,277
|
1.15
|
1.30
|
103
|
116
|
88
|
91
|
|||||
|
Upper
Zone
|
Proven
|
15,005
|
1,022
|
1,125
|
0.54
|
0.64
|
82
|
97
|
69
|
45
|
||||
|
S5 Unit
|
Probable
|
27,495
|
825
|
866
|
0.44
|
0.50
|
121
|
136
|
102
|
64
|
||||
|
Sub-total S5 Unit
|
42,500
|
895
|
957
|
0.48
|
0.55
|
202
|
233
|
172
|
109
|
|||||
|
Upper
Zone
|
Proven
|
19,533
|
1,299
|
1,361
|
0.69
|
0.78
|
135
|
152
|
115
|
89
|
||||
|
(B5 & S5)
|
Probable
|
31,880
|
1,003
|
1,079
|
0.53
|
0.62
|
170
|
197
|
144
|
111
|
||||
|
Sub-Total
|
Sub-total Upper
Zone
|
51,413
|
1,116
|
1,186
|
0.59
|
0.68
|
305
|
349
|
259
|
200
|
||||
|
Lower
Zone
|
Proven
|
24,936
|
1,254
|
1,279
|
0.67
|
0.73
|
166
|
182
|
131
|
60
|
||||
|
L6 Unit
|
Probable
|
68,952
|
1,196
|
1,535
|
0.64
|
0.88
|
439
|
605
|
345
|
199
|
||||
|
|
Sub-total Lower
Zone
|
93,888
|
1,211
|
1,467
|
0.64
|
0.84
|
605
|
788
|
476
|
259
|
||||
|
Total
Stream 2
(all zones)
|
Proven
|
44,469
|
1,274
|
1,315
|
0.68
|
0.75
|
302
|
334
|
246
|
149
|
||||
|
Probable
|
100,832
|
1,135
|
1,391
|
0.60
|
0.80
|
609
|
802
|
490
|
310
|
|||||
|
Sub-total Stream 2
|
145,301
|
1,177
|
1,368
|
0.63
|
0.78
|
911
|
1,136
|
736
|
459
|
|||||
|
Stream 3
($16.54/t
net value
cut-off
grade, High
Clay)
|
Total
Stream 3
(M5 zone)
|
Proven
|
5,621
|
2,199
|
1,702
|
1.17
|
0.97
|
66
|
55
|
51
|
36
|
|||
|
Probable
|
18,178
|
2,082
|
1,145
|
1.11
|
0.65
|
201
|
119
|
157
|
77
|
|||||
|
Sub-total
Stream 3
|
23,799
|
2,110
|
1,277
|
1.12
|
0.73
|
267
|
174
|
208
|
113
|
|||||
|
TOTAL of All Streams, All Seams, and All
Proven & Probable
|
260,341
|
1,451
|
5,201
|
0.77
|
2.97
|
2,010
|
7,742
|
1,645
|
5,588
|
|||||
|
|
12-20 |
30 SEPTEMBER 2025
|
|
Rhyolite Ridge Lithium-Boron Project
|
S-K 1300 Technical Report Summary
|
|
|
1. |
Li= lithium; B= boron’ ppm= parts per million; Li2CO3 = lithium carbonate; H3BO3 = boric acid; kt = thousand metric tonnes.
|
|
|
2. |
Totals may differ due to rounding, Mineral Reserves reported
on a dry in-situ basis. The Contained and Recovered Lithium Carbonate (Li2CO3) and Boric Acid (H3BO3) are reported in the table above
in short tons. Lithium is converted to Equivalent Contained Tonnes of Lithium Carbonate (Li2CO3) using a stochiometric conversion factor of 5.322, and
boron is converted to Equivalent Contained Tonnes of Boric Acid (H3BO3) using a stochiometric conversion factor of 5.718. Equivalent stochiometric conversion
factors are derived from the molecular weights of the individual elements which make up Lithium Carbonate (Li2CO3) and Boric Acid (H3BO3). The Equivalent Recovered Tons of Lithium Carbonate (Li2CO3) and Boric Acid (H3BO3) is the portion of the contained
tonnage that can be recovered after processing.
|
|
|
3. |
The statement of estimates of Mineral Reserves has been
compiled by Independent Mining Consultants, Inc. (IMC) and is independent of ioneer and its affiliates. IMC has
sufficient experience that is relevant to the style of mineralisation and type of deposit under consideration
and to the activity being undertaken to qualify as a Competent Person as defined in the S-K §229.1304 of the
United States Securities and Exchange Commission (“SEC”).
|
|
|
4. |
All Mineral Reserve figures reported in the table above
represent estimates at August 2025. Mineral Reserve estimates are not precise calculations, being dependent on
the interpretation of limited information on the location, shape and continuity of the occurrence and on the
available sampling results. The totals contained in the above table have been rounded to reflect the relative
uncertainty of the estimate.
|
|
|
5. |
Mineral Reserves are reported in accordance with the US SEC
Regulation S-K Subpart 1300. The Mineral Reserves in this report were estimated and reported using the
regulation S-K §229.1304 of the United States Securities and Exchange Commission (“SEC”). Mineral Reserves are
also reported in accordance with the Australasian Code for Reporting of Exploration Results, Mineral Resources
and Ore Reserves (The Joint Ore Reserves Committee Code – JORC 2012 Edition).
|
|
|
6. |
The Mineral Reserve estimate is the result of determining the
measured and indicated resource that is economically minable allowing for the conversion to proven and
probable. In making this determination, constraints were applied to the geological model based upon a pit
optimization analysis that defined a conceptual pit shell limit. The conceptual pit shell was based upon a net
value per ton calculation including a 5,000 ppm boron cut-off grade for high boron – high lithium (HiB-Li)
mineralization (Stream 1) and $11.13 net value per metric tonne cut-off for low boron (LoB-Li) mineralization
below 5,000 ppm boron broke in to two material types low clay and high clay material respectfully (Stream 2 and
Stream 3). The conceptual pit shell was constrained by the measured and indicated resource that incorporates
the potential mining, metallurgical and processing grade parameters identified by mining, metallurgical and
processing studies performed to date on the Project. The conceptual pit shell was used a guide for an engineered
pit design. Key inputs in developing the Mineral Reserve pit shell included a 5,000 ppm boron cut-off grade for
HiB-Li mineralization, $11.13 net value per metric tonne cut-off for LoB-Li low clay mineralization and $11.13
Net value per metric tonne cut-off for LoB-Li high clay mineralization; base mining cost of US$1.69/t and
incremental cost of $0.055/t per bench below 1,896 m (6,220 ft) elevation; plant feed processing and grade
control costs which range between US$52.92/t and US$82.55/t of plant feed for stream 1, US$18.87 and US$98.62
for streams 2&3; boron and lithium recovery for Stream 1: M5= of 80.2% and 85.7%, B5=80.2% and 78.3%,
S5=77.0% and 82.5%, L6=75.8% and 79.4%; Stream 2 and 3: M5 65% and 78%, B5 78.3% and 85.2%, S5 46.8% and 84.8%,
L6 32.9% and 78.7%, respectively; boric acid sales price of US$1,172.78/t; lithium carbonate sales price of
$19,351.38/t.
|
|
|
7. |
The Mineral Reserve is reported exclusive of Mineral
Resources.
|
|
|
8. |
Equivalent Lithium Carbonate (Li2CO3) and Boric Acid (H3BO3) grades
have been rounded to the nearest tenth of a percent.
|
| 12.3. |
QP’s Opinion on Factors That Could
Materially Affect the Mineral Reserve Estimates
|
|
|
12-21 |
30 SEPTEMBER 2025
|
|
Rhyolite Ridge Lithium-Boron Project
|
S-K 1300 Technical Report Summary
|
|
|
12-22 |
30 SEPTEMBER 2025
|
|
Rhyolite Ridge Lithium-Boron Project
|
S-K 1300 Technical Report Summary
|
|
13.
|
MINING METHODS
|
| 13.1. |
Parameters Relative to the Quarry Design and
Plans
|
|
13.1.1.
|
Geotechnical
|
|
13.1.2.
|
Hydrogeological
|
|
|
13-1 |
30 SEPTEMBER 2025
|
|
Rhyolite Ridge Lithium-Boron Project
|
S-K 1300 Technical Report Summary
|
|
|
- |
The Rhyolite Ridge mine will be excavated to its lowest
elevation of 1,670 m (5,480 ft) amsl. Dewatering or sump pumping is anticipated to stabilize slopes and manage
quarry wall seepage.
|
|
|
- |
The North, South and quarry backfill overburden storage
facilities will be established as mining continues. The southern portion of the Rhyolite Ridge mine will be
backfilled with non-potentially acid generating overburden rock.
|
|
|
- |
Dewatering rates are expected to range from ~227 lpm (60 gpm) to
a maximum annual average of 2,461 lpm (650 gpm) occurring in 2033. The average dewatering rates through the LOM is
expected to be about 1,041 lpm (275 gpm).
|
|
|
- |
At the end of quarry mining (2040), simulated heads show changes
in piezometric levels of more than 122 m (400 ft) in the Project area due to quarry dewatering.
|
|
|
- |
Two water supply wells pumping at 4,933,927 m3 (4,000 acre-feet) per year will be
installed in the agricultural area north of Dyer. A small area of drawdown forms below the new wells but is to a
limited extent. The maximum differential drawdown will be less than 6 m (20 ft).
|
|
13.1.3.
|
Surface Water Controls
|
|
|
- |
The non-contact water channels have been designed to withstand
the discharge of the peak flow from a 100-year, 24-hour storm event and convey the 500-year, 24-hour storm event
within the channel freeboard.
|
|
|
- |
Non-contact water channels were hydraulically designed to
accommodate the 500-year storm event in accordance with Nevada Administrative Code (NAC) 519A and 445A.433
requirements for permanent channels, and temporary contact water channels were designed to accommodate the 100-year
storm event.
|
|
|
- |
Contact water will be managed by a contact water system that
includes berms, channels, an underdrain system and a contact water pond. The system was designed to manage runoff
from the 100-year, 24-hour storm event.
|
|
|
13-2 |
30 SEPTEMBER 2025
|
|
Rhyolite Ridge Lithium-Boron Project
|
S-K 1300 Technical Report Summary
|
|
|
- |
Contact water is designed to be collected in a contact water
pond that will be constructed at the southern end of the quarry. An underdrain collection system will be implemented
beneath the South overburden storage facility that will direct water that infiltrates the South overburden storage
facility to that contact water pond. This pond will minimize the amount of contact water that reports to the quarry.
|
|
|
- |
Permanent and temporary non-contact surface and contact water
diversion channels will be constructed upgradient of the overburden storage facilities and the quarry to manage
runoff from the overburden storage facilities and run-on to the quarry. As concurrent reclamation progresses,
contact water channels will be diverted or converted to non-contact surface water channels to reduce the volume of
water requiring management of contact water.
|
|
|
- |
The contact water pond was designed to accommodate, with a 0.3 m
(1 ft) freeboard, the runoff from a 100-year, 24-hour storm; the overall pond capacity is 41,938 m3 (34 acre-feet) at freeboard and
45,639 m3 (37 acre-feet) at crest.
|
|
13.1.4.
|
Seismic Activity
|
|
|
13-3 |
30 SEPTEMBER 2025
|
|
Rhyolite Ridge Lithium-Boron Project
|
S-K 1300 Technical Report Summary
|
|
13.2.
|
Mine Design Factors
|
|
13.2.1.
|
Quarry Design Objective and
Constraints
|
|
13.2.2.
|
Production Rates
|
|
|
13-4 |
30 SEPTEMBER 2025
|
|
Rhyolite Ridge Lithium-Boron Project
|
S-K 1300 Technical Report Summary
|
|
Periods
|
Plant Feed
|
Waste
|
Grand Total2
|
|||||||||
|
Contained Grades
|
Product
|
|||||||||||
|
Plant
Feed1
|
Net of
Process
|
Boron
|
Lithium
|
H3BO3
|
Li2CO3
|
Boric Acid
(H3BO3)
|
Lithium
Carbonate
(Li2CO3)
|
|||||
|
(kt)
|
($/t)
|
(ppm)
|
(ppm)
|
(%)
|
(%)
|
Cont.
kt
|
Rec.
kt
|
Cont.
kt
|
Rec.
kt
|
(kt)
|
(kt)
|
|
|
PP -1– Q1
|
3,133
|
3,138
|
||||||||||
|
PP -1– Q2
|
2,047
|
2,109
|
||||||||||
|
PP -1– Q3
|
4,279
|
4,279
|
||||||||||
|
PP -1– Q4
|
4,130
|
4,279
|
||||||||||
|
Year 1 -
Q1
|
404
|
75
|
2,182
|
1,533
|
1.2
|
0.8
|
5.0
|
2.8
|
3.3
|
2.6
|
6,443
|
7,484
|
|
Year 1 -
Q2
|
472
|
100
|
3,161
|
1,807
|
1.8
|
1.0
|
8.5
|
6.1
|
4.5
|
3.7
|
5,443
|
6,644
|
|
Year 1 -
Q3
|
612
|
110
|
5,662
|
1,765
|
3.2
|
0.9
|
19.8
|
15.2
|
5.8
|
4.8
|
6,268
|
7,196
|
|
Year 1 -
Q4
|
626
|
110
|
6,048
|
1,726
|
3.5
|
0.9
|
21.6
|
16.8
|
5.8
|
4.8
|
4,581
|
7,195
|
|
Year 2- Q1
|
707
|
118
|
5,425
|
1,912
|
3.1
|
1.0
|
21.9
|
16.3
|
7.2
|
5.9
|
7,003
|
8,306
|
|
Year 2- Q2
|
706
|
114
|
5,340
|
1,873
|
3.1
|
1.0
|
21.5
|
15.6
|
7.0
|
5.7
|
6,969
|
8,400
|
|
Year 2- Q3
|
700
|
111
|
5,071
|
1,852
|
2.9
|
1.0
|
20.3
|
14.6
|
6.9
|
5.6
|
6,914
|
8,493
|
|
Year 2- Q4
|
706
|
93
|
3,839
|
1,705
|
2.2
|
0.9
|
15.5
|
9.9
|
6.4
|
5.2
|
7,420
|
8,493
|
|
Year 3- Q1
|
708
|
120
|
6,458
|
1,870
|
3.7
|
1.0
|
26.1
|
19.7
|
7.0
|
5.9
|
6,646
|
8,306
|
|
Year 3- Q2
|
715
|
120
|
4,480
|
1,981
|
2.6
|
1.1
|
18.3
|
12.9
|
7.5
|
6.3
|
7,067
|
8,399
|
|
Year 3- Q3
|
719
|
120
|
2,767
|
2,069
|
1.6
|
1.1
|
11.4
|
8.5
|
7.9
|
6.6
|
6,747
|
8,491
|
|
Year 3- Q4
|
679
|
125
|
2,343
|
2,190
|
1.3
|
1.2
|
9.1
|
6.9
|
7.9
|
6.6
|
6,534
|
8,495
|
|
Year 4- Q1
|
674
|
146
|
7,144
|
2,142
|
4.1
|
1.1
|
27.5
|
21.4
|
7.7
|
6.5
|
5,968
|
8,309
|
|
Year 4- Q2
|
648
|
155
|
7,889
|
2,249
|
4.5
|
1.2
|
29.3
|
22.8
|
7.8
|
6.6
|
6,335
|
8,405
|
|
Year 4- Q3
|
657
|
155
|
8,127
|
2,235
|
4.6
|
1.2
|
30.5
|
23.9
|
7.8
|
6.6
|
6,526
|
8,497
|
|
Year 4- Q4
|
670
|
156
|
8,911
|
2,201
|
5.1
|
1.2
|
34.2
|
26.6
|
7.9
|
6.6
|
7,123
|
8,496
|
|
Year 5
|
2,771
|
152
|
9,178
|
2,118
|
5.2
|
1.1
|
145.4
|
113.5
|
31.2
|
26.3
|
26,598
|
33,309
|
|
Year 6
|
2,733
|
165
|
13,599
|
2,001
|
7.8
|
1.1
|
212.5
|
166.6
|
29.1
|
24.8
|
24,977
|
33,675
|
|
Year 7
|
3,210
|
132
|
12,292
|
1,595
|
7.0
|
0.8
|
225.6
|
175.4
|
27.2
|
23.0
|
24,169
|
29,923
|
|
Year 8
|
3,266
|
91
|
4,012
|
1,556
|
2.3
|
0.8
|
74.9
|
54.8
|
27.1
|
22.5
|
21,148
|
27,977
|
|
Year 9
|
3,266
|
103
|
3,695
|
1,748
|
2.1
|
0.9
|
69.0
|
52.2
|
30.4
|
25.2
|
24,475
|
29,355
|
|
Year 10
|
2,797
|
142
|
9,390
|
1,965
|
5.4
|
1.0
|
150.2
|
117.0
|
29.3
|
24.6
|
17,638
|
27,737
|
|
Year 11
|
2,928
|
94
|
3,539
|
1,745
|
2.0
|
0.9
|
59.3
|
38.4
|
27.2
|
22.0
|
22,455
|
27,080
|
|
|
13-5 |
30 SEPTEMBER 2025
|
|
Rhyolite Ridge Lithium-Boron Project
|
S-K 1300 Technical Report Summary
|
|
Year 12
|
2,732
|
119
|
6,412
|
1,912
|
3.7
|
1.0
|
100.2
|
77.0
|
27.8
|
23.0
|
15,715
|
31,898
|
|
Year 13
|
2,835
|
163
|
13,195
|
1,991
|
7.5
|
1.1
|
213.9
|
167.8
|
30.0
|
25.6
|
21,199
|
32,033
|
|
Year 14
|
2,782
|
164
|
14,679
|
1,920
|
8.4
|
1.0
|
233.5
|
183.3
|
28.4
|
24.2
|
24,807
|
32,038
|
|
Year 15
|
2,901
|
162
|
14,098
|
1,910
|
8.1
|
1.0
|
233.9
|
183.3
|
29.5
|
25.1
|
18,214
|
24,468
|
|
Year 16
|
2,927
|
156
|
13,980
|
1,831
|
8.0
|
1.0
|
234.0
|
183.3
|
28.5
|
24.3
|
18,305
|
24,465
|
|
Year 17
|
3,137
|
140
|
13,158
|
1,683
|
7.5
|
0.9
|
236.0
|
183.3
|
28.1
|
23.6
|
20,424
|
24,446
|
|
Year 18
|
3,266
|
133
|
12,641
|
1,602
|
7.2
|
0.9
|
236.1
|
183.3
|
27.8
|
23.4
|
19,310
|
24,806
|
|
Year 19
|
3,266
|
134
|
12,603
|
1,626
|
7.2
|
0.9
|
235.4
|
183.3
|
28.3
|
23.9
|
14,755
|
24,434
|
|
Year 20
|
3,266
|
88
|
7,736
|
1,391
|
4.4
|
0.7
|
144.5
|
107.2
|
24.2
|
19.4
|
9,772
|
23,970
|
|
Year 21
|
3,266
|
74
|
7,246
|
1,255
|
4.1
|
0.7
|
135.3
|
100.8
|
21.8
|
17.4
|
6,112
|
17,841
|
|
Year 22
|
3,056
|
125
|
11,458
|
1,617
|
6.6
|
0.9
|
200.3
|
155.4
|
26.3
|
21.9
|
16,575
|
21,343
|
|
Year 23
|
3,266
|
102
|
7,584
|
1,557
|
4.3
|
0.8
|
141.6
|
104.1
|
27.1
|
22.2
|
13,161
|
17,841
|
|
Year 24
|
3,021
|
127
|
10,369
|
1,667
|
5.9
|
0.9
|
179.1
|
139.3
|
26.8
|
22.7
|
17,609
|
22,909
|
|
Year 25
|
2,986
|
137
|
11,916
|
1,735
|
6.8
|
0.9
|
203.5
|
158.4
|
27.6
|
23.1
|
18,311
|
21,767
|
|
Year 26
|
3,266
|
110
|
9,870
|
1,476
|
5.6
|
0.8
|
184.3
|
140.1
|
25.7
|
21.2
|
17,737
|
21,742
|
|
Year 27
|
3,266
|
118
|
8,993
|
1,641
|
5.1
|
0.9
|
167.9
|
129.1
|
28.5
|
23.7
|
18,210
|
21,742
|
|
Year 28
|
3,266
|
111
|
7,126
|
1,630
|
4.1
|
0.9
|
133.1
|
102.3
|
28.3
|
23.7
|
13,908
|
17,841
|
|
Year 29
|
3,266
|
78
|
3,439
|
1,453
|
2.0
|
0.8
|
64.2
|
44.3
|
25.2
|
20.7
|
12,296
|
16,844
|
|
Year 30
|
3,266
|
82
|
4,789
|
1,441
|
2.7
|
0.8
|
89.4
|
63.7
|
25.1
|
20.3
|
13,131
|
16,933
|
|
Year 31
|
3,266
|
74
|
4,094
|
1,368
|
2.3
|
0.7
|
76.4
|
55.8
|
23.8
|
19.3
|
13,223
|
16,850
|
|
Year 32
|
3,266
|
65
|
2,997
|
1,303
|
1.7
|
0.7
|
56.0
|
37.5
|
22.6
|
18.2
|
13,244
|
16,933
|
|
Year 33
|
3,250
|
77
|
3,639
|
1,441
|
2.1
|
0.8
|
67.6
|
45.4
|
24.9
|
20.2
|
15,804
|
18,752
|
|
Year 34
|
3,266
|
88
|
6,048
|
1,461
|
3.5
|
0.8
|
112.9
|
79.8
|
25.4
|
20.6
|
13,410
|
16,933
|
|
Year 35
|
3,266
|
76
|
4,547
|
1,361
|
2.6
|
0.7
|
84.9
|
59.7
|
23.7
|
19.3
|
8,330
|
12,397
|
|
Year 36
|
3,266
|
63
|
2,653
|
1,322
|
1.5
|
0.7
|
49.5
|
27.1
|
23.0
|
18.4
|
8,693
|
12,397
|
|
Year 37
|
3,266
|
93
|
6,699
|
1,449
|
3.8
|
0.8
|
125.1
|
95.6
|
25.2
|
20.7
|
9,393
|
12,623
|
|
Year 38
|
3,266
|
71
|
4,545
|
1,281
|
2.6
|
0.7
|
84.9
|
62.5
|
22.3
|
18.1
|
6,664
|
10,678
|
|
Year 39
|
3,266
|
91
|
6,176
|
1,453
|
3.5
|
0.8
|
115.3
|
85.7
|
25.3
|
20.7
|
5,702
|
9,187
|
|
Year 40-44
|
16,329
|
62
|
3,492
|
1,224
|
2.0
|
0.7
|
326.1
|
204.6
|
106.4
|
85.2
|
21,501
|
50,626
|
|
Year 45-49
|
16,329
|
80
|
5,516
|
1,373
|
3.2
|
0.7
|
515.0
|
364.3
|
119.3
|
96.7
|
17,475
|
43,844
|
|
Year 50-54
|
16,329
|
83
|
5,830
|
1,379
|
3.3
|
0.7
|
544.3
|
388.6
|
119.8
|
97.9
|
11,782
|
36,960
|
|
Year 55-59
|
16,329
|
64
|
2,687
|
1,335
|
1.5
|
0.7
|
250.9
|
139.4
|
116.0
|
92.4
|
289
|
15,250
|
|
Year 60-64
|
16,329
|
51
|
2,257
|
1,123
|
1.3
|
0.6
|
210.8
|
117.8
|
97.6
|
78.1
|
0
|
14,814
|
|
Year 65-69
|
16,329
|
51
|
1,006
|
1,182
|
0.6
|
0.6
|
93.9
|
48.6
|
102.7
|
82.3
|
0
|
14,814
|
|
Year 70-74
|
16,329
|
62
|
2,821
|
1,307
|
1.6
|
0.7
|
263.4
|
154.7
|
113.5
|
90.1
|
0
|
14,814
|
|
Year 75-79
|
16,329
|
58
|
776
|
1,253
|
0.4
|
0.7
|
72.4
|
35.1
|
108.9
|
88.7
|
0
|
14,814
|
|
Year 80-84
|
9,916
|
83
|
1,210
|
1,616
|
0.7
|
0.9
|
68.6
|
39.4
|
85.3
|
69.9
|
0
|
8,995
|
|
Grand
Total
|
260,341
|
86
|
5,201
|
1,451
|
3.0
|
0.8
|
7,742
|
5,588
|
2,011
|
1,645
|
734,099
|
1,133,513
|
|
|
13-6 |
30 SEPTEMBER 2025
|
|
Rhyolite Ridge Lithium-Boron Project
|
S-K 1300 Technical Report Summary
|
|
|
1. |
Plant Feed includes stream 1: 5,000 ppm boron, stream 02: Net
Value of $11.13/mt and < 5,000 ppm boron, and stream 3 is allowed to feed the plant up to 10% of total feed.
|
|
|
2. |
Grand Total does not include reclaimed material.
|
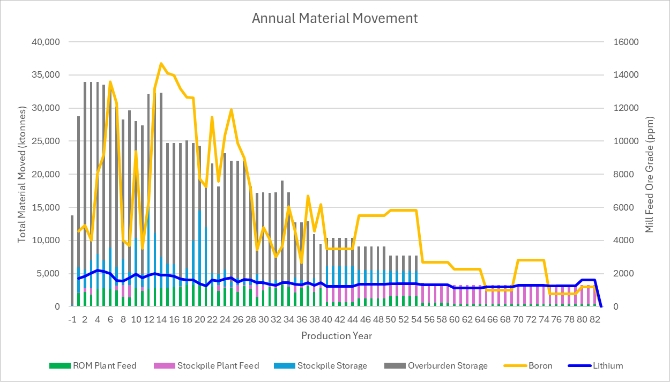
|
|
13-7 |
30 SEPTEMBER 2025
|
|
Rhyolite Ridge Lithium-Boron Project
|
S-K 1300 Technical Report Summary
|
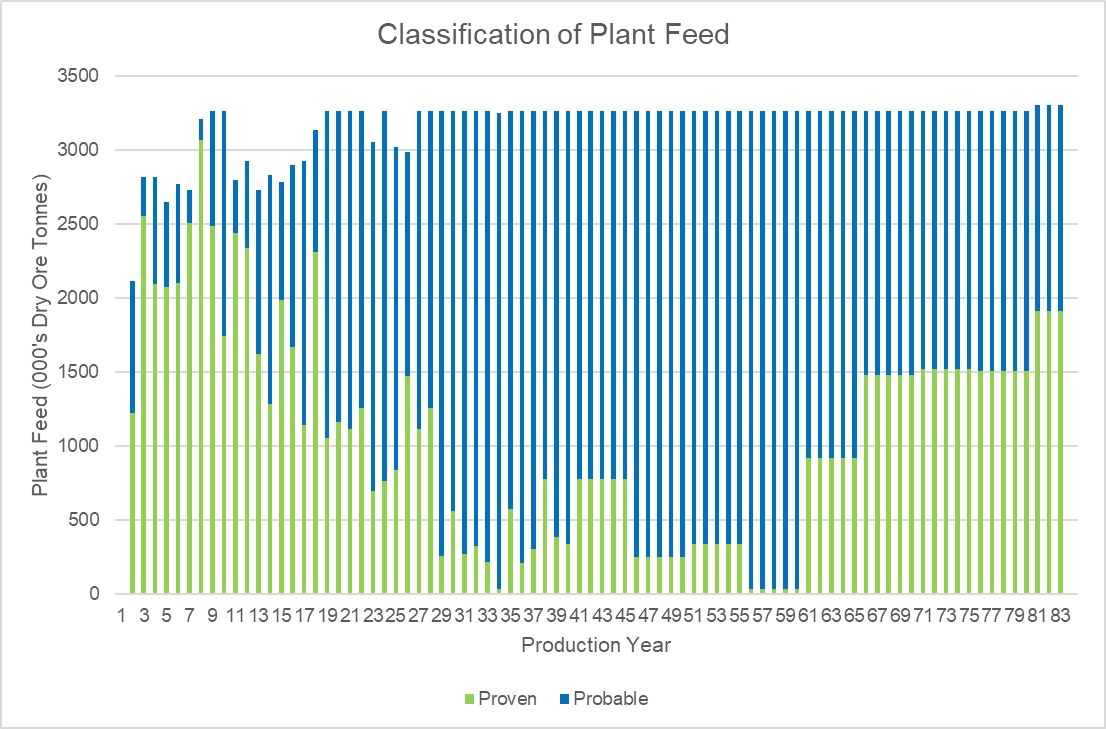
|
13.2.3.
|
Expected Mine Life
|
|
|
13-8 |
30 SEPTEMBER 2025
|
|
Rhyolite Ridge Lithium-Boron Project
|
S-K 1300 Technical Report Summary
|
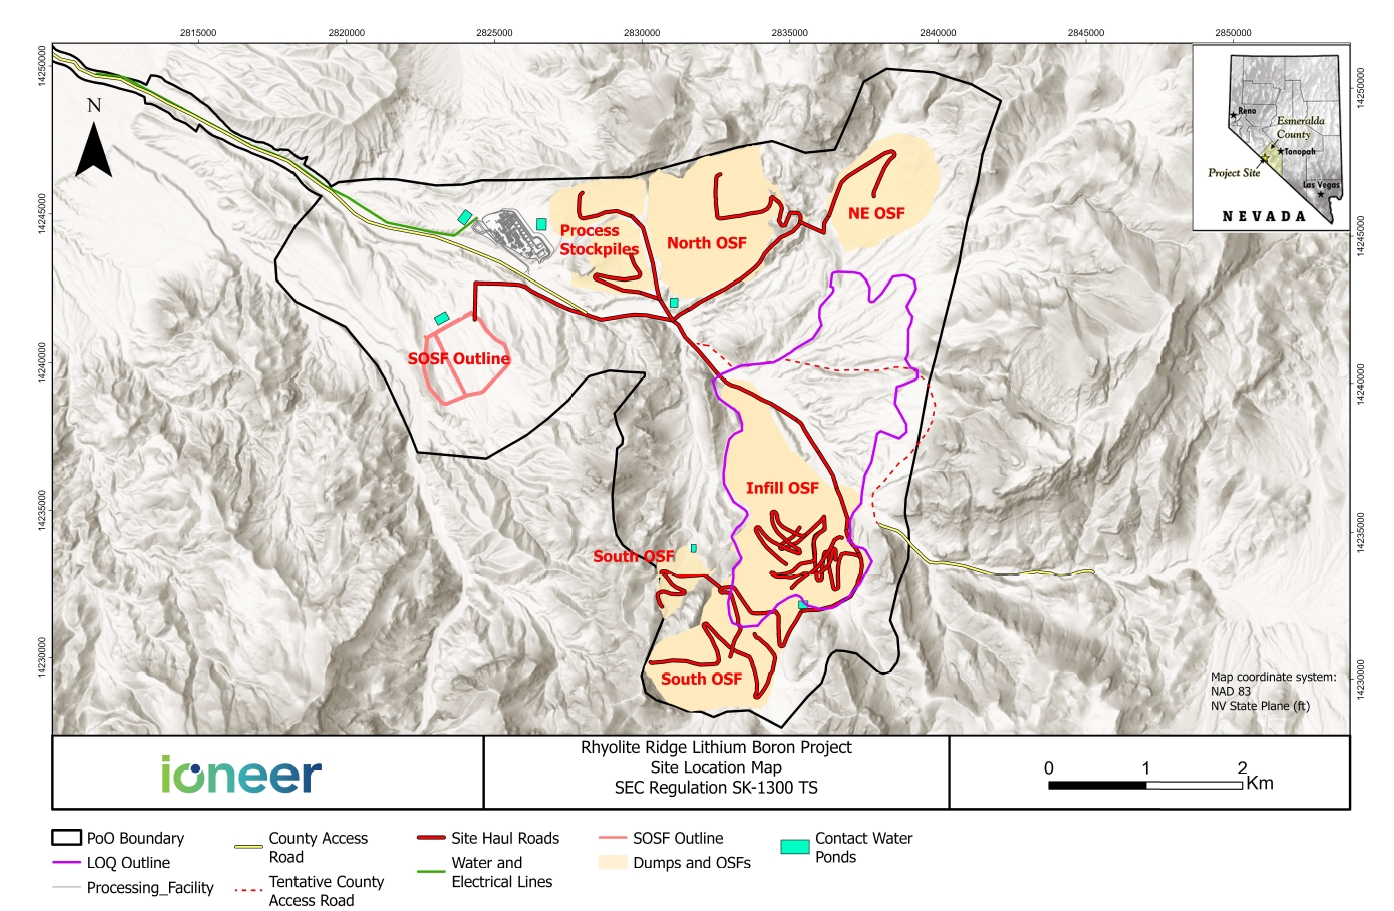
|
|
13-9 |
30 SEPTEMBER 2025
|
|
Rhyolite Ridge Lithium-Boron Project
|
S-K 1300 Technical Report Summary
|
|
13.2.4.
|
Mining Dilution and Recovery
Factors
|
|
13.3.
|
Stripping and Backfilling
Requirements
|
|
|
- |
Inter-bench slopes of 2.4H:1V;
|
|
|
- |
Overall slope of 3H:1V;
|
|
|
- |
North overburden storage facility and Northeast overburden storage facility
will be constructed on 15.24 m (50-ft) lifts, with a 7.6 m (57.8-ft) wide catch bench established every 30.48 m
(100-ft) of vertical elevation gain;
|
|
|
- |
West overburden storage facility and South overburden storage facility will be
constructed on 9.14 m (30-ft) lifts, with a 15.8 m (52-ft) wide catch bench established every 27.4 m (90-ft) of
vertical elevation gain;
|
|
|
- |
Backfill within the quarry will be constructed on 9.14 m (30-ft) lifts and
placed at a 37º angle of repose where multiple access ramps along the face serve as catch benches;
|
|
|
- |
Access road will maintain a grade of no greater than 10%;
|
|
|
- |
A specific stacking plan was developed to incorporate the placement of material
with structural limitations (the M5 geologic unit);
|
|
|
- |
It is assumed that a 0.6 m thick (24-in) layer of alluvial (Q1) material will
be placed on all final out-slope and top surfaces of the overburden storage facilities to facilitate concurrent
reclamation.
|
|
|
13-10 |
30 SEPTEMBER 2025
|
|
Rhyolite Ridge Lithium-Boron Project
|
S-K 1300 Technical Report Summary
|
|
|
- |
M5 material cannot be stacked below a set minimum elevation above sea level,
specific to each individual overburden storage facility design;
|
|
|
- |
M5 material must reside in the overburden storage facilities internally, offset
from the final overburden storage facility design surface by 76.2 m (250 ft);
|
|
|
- |
No M5 material be placed in locations with less than 30.48 vertical meters (100
vertical fieet) of subsequent non-M5 material cover;
|
|
|
- |
M5 material is assumed to be stacked in a dry condition.
|
|
Overburden Storage Facility
|
Design Storage
Capacity
(million m3)
|
|
|
West Overburden Storage Facility
|
6.87
|
|
|
South Overburden Storage Facility
|
109.65
|
|
|
North Overburden Storage Facility
|
117.07
|
|
|
Northeast Overburden Storage Facility
|
153.81
|
|
|
Backfill
|
180.24
|
|
|
Total
|
567.64
|
|
|
13-11 |
30 SEPTEMBER 2025
|
|
Rhyolite Ridge Lithium-Boron Project
|
S-K 1300 Technical Report Summary
|
|
Period
|
South
Overburden
Storage
Facility
|
West
Overburden
Storage
Facility
|
North
Overburden
Storage
Facility
|
Northeast
Overburden
Storage
Facility
|
Backfill
|
Total
|
|
(ktonne)
|
(ktonne)
|
(ktonne)
|
(ktonne)
|
(ktonne)
|
(ktonne)
|
|
|
1
|
4,693
|
8,896
|
0
|
0
|
0
|
13,590
|
|
2
|
22,736
|
0
|
0
|
0
|
0
|
22,736
|
|
3
|
28,306
|
0
|
0
|
0
|
0
|
28,306
|
|
4
|
21,264
|
0
|
5,730
|
0
|
0
|
26,994
|
|
5
|
0
|
0
|
24,806
|
1,146
|
0
|
25,953
|
|
6
|
0
|
0
|
22,905
|
3,693
|
0
|
26,598
|
|
7
|
0
|
0
|
20,387
|
773
|
3,817
|
24,977
|
|
8
|
0
|
0
|
22,654
|
1,515
|
0
|
24,169
|
|
9
|
0
|
0
|
12,508
|
8,641
|
0
|
21,148
|
|
10
|
0
|
0
|
13,500
|
10,975
|
0
|
24,475
|
|
11
|
0
|
0
|
7,642
|
9,996
|
0
|
17,638
|
|
12
|
165
|
0
|
7,239
|
15,051
|
0
|
22,455
|
|
13
|
813
|
0
|
0
|
0
|
14,902
|
15,715
|
|
14
|
0
|
0
|
0
|
0
|
21,199
|
21,199
|
|
15
|
0
|
0
|
5,234
|
696
|
18,877
|
24,807
|
|
16
|
6,531
|
0
|
0
|
0
|
11,683
|
18,214
|
|
17
|
0
|
0
|
0
|
1,261
|
17,043
|
18,305
|
|
18
|
0
|
0
|
442
|
3,242
|
16,740
|
20,424
|
|
19
|
0
|
0
|
4,553
|
8,002
|
6,754
|
19,310
|
|
20
|
0
|
0
|
3,995
|
10,760
|
0
|
14,755
|
|
21
|
0
|
0
|
0
|
9,772
|
0
|
9,772
|
|
22
|
0
|
0
|
0
|
3,490
|
2,623
|
6,112
|
|
23
|
0
|
0
|
0
|
14,353
|
2,222
|
16,575
|
|
24
|
0
|
0
|
0
|
11,422
|
1,739
|
13,161
|
|
25
|
0
|
0
|
0
|
0
|
17,609
|
17,609
|
|
26
|
0
|
0
|
0
|
0
|
18,311
|
18,311
|
|
27
|
0
|
0
|
0
|
0
|
17,737
|
17,737
|
|
28
|
0
|
0
|
0
|
0
|
18,210
|
18,210
|
|
29
|
0
|
0
|
0
|
0
|
13,908
|
13,908
|
|
30
|
0
|
0
|
0
|
0
|
12,296
|
12,296
|
|
31
|
0
|
0
|
0
|
0
|
13,131
|
13,131
|
|
32
|
0
|
0
|
0
|
0
|
13,223
|
13,223
|
|
33
|
0
|
0
|
0
|
0
|
13,244
|
13,244
|
|
34
|
0
|
0
|
0
|
0
|
15,804
|
15,804
|
|
35
|
0
|
0
|
0
|
0
|
13,410
|
13,410
|
|
36
|
0
|
0
|
0
|
0
|
8,330
|
8,330
|
|
37
|
0
|
0
|
0
|
0
|
8,693
|
8,693
|
|
38
|
0
|
0
|
0
|
0
|
9,393
|
9,393
|
|
39
|
0
|
0
|
0
|
0
|
6,664
|
6,664
|
|
40
|
0
|
0
|
0
|
0
|
5,702
|
5,702
|
|
41-45
|
0
|
0
|
0
|
0
|
21,501
|
21,501
|
|
46-65
|
0
|
0
|
0
|
0
|
17,475
|
17,475
|
|
51-55
|
0
|
0
|
0
|
0
|
11,782
|
11,782
|
|
56-60
|
0
|
0
|
0
|
0
|
289
|
289
|
|
Total
|
84,508
|
8,896
|
151,595
|
114,788
|
374,311
|
734,100
|
|
|
13-12 |
30 SEPTEMBER 2025
|
|
Rhyolite Ridge Lithium-Boron Project
|
S-K 1300 Technical Report Summary
|
| 13.4. |
Mining Fleet, Machinery, and Personnel Requirements
|
|
13.4.1.
|
Quarry Production Tasks
|
|
|
- |
Clearing and Grubbing: Includes equipment and labor required
to clear vegetation from disturbance areas within the quarry. Any labor or equipment required to relocate any
native species affected by mining, such as Tiehm’s buckwheat, are excluded from this function.
|
|
|
- |
Drilling and Blasting: Includes equipment and labor required
for pre-split drilling, production drilling, and associated drilling support. A contractor is assumed to perform
all blasting functions.
|
|
|
- |
Overburden/Interburden Removal: Includes the equipment and
labor costs necessary to remove all overburden and interburden material from the quarry and haul the material to
an ex-pit overburden storage facility or backfill. Note that non-ore grade M5 material is included in this
category, along with equipment allocations for dozers to maintain working levels at the overburden storage
facility and regrade the final slopes of the overburden storage facility as lifts are completed.
|
|
|
13-13 |
30 SEPTEMBER 2025
|
|
Rhyolite Ridge Lithium-Boron Project
|
S-K 1300 Technical Report Summary
|
|
|
- |
Ore Mining: Includes the equipment and labor necessary to
extract ore and deliver it to the ROM ore stockpile at the process plant. Equipment and labor hours associated
with rehandling material from the process stockpile were excluded from this task as this is assumed to be part of
the process plant’s function.
|
|
|
- |
Stormwater Controls: Includes the equipment required to
maintain sedimentation ponds, water collection/diversion ditches, and culverts for property surface water
management.
|
|
|
- |
General Quarry Support: Includes the equipment and labor
required to maintain haul roads and perform other miscellaneous support tasks.
|
|
13.4.2.
|
Quarry Production and Support
Equipment
|
|
Equipment Make and
Model
|
Equipment Type
|
Shared with
Plant or SOSF
|
Primary Class Size
|
||
|
Production Equipment
|
|||||
|
Caterpillar 995
|
Front End Loader (FEL)
|
No
|
26 m3 (34 yd3)
|
||
|
Caterpillar 992
|
Front End Loader (FEL)
|
Yes
|
14.5 m3 (19 yd3)
|
||
|
Caterpillar 785
|
Autonomous Haul Truck (AHT)
|
Yes
|
150 tons
|
||
|
Caterpillar MD6200
|
Down-the Hole Hammer Platform Drill (DTH)
|
No
|
14-20 cm (5.5”-7.87”) bit
|
||
|
Support Equipment
|
|||||
|
Caterpillar 740
|
Water Truck (WT)
|
Yes
|
30,283 liters (8,000 gal)
|
||
|
Caterpillar 777
|
Water Truck (WT)
|
No
|
75,708 liters (20,000 gal)
|
||
|
Weiler D560
|
Top Hammer Pre-Split Drill (PSD)
|
No
|
8.9-15 cm (3.5” - 6”) bit
|
||
|
Caterpillar D10
|
Track Dozer (TD)
|
No
|
600 hp
|
||
|
Caterpillar D9
|
Track Dozer (TD)
|
No
|
450 hp
|
||
|
Caterpillar 18
|
Motor Grader (MG)
|
No
|
5.5 m (18 ft) blade
|
||
|
Caterpillar 16
|
Motor Grader (MG)
|
Yes
|
4.9 m (16 ft) blade
|
||
|
Caterpillar 834
|
Rubber Tire Dozer (RTD)
|
No
|
562 hp
|
||
|
Caterpillar 430
|
Bachoe Loader (BL)
|
Yes
|
100 hp
|
||
|
Caterpillar 374
|
Excavator (EX)
|
Yes
|
3.30 m (4.32 yd3)
|
||
|
Service Equipment
|
|||||
|
Fuel/Lube Truck
|
Service Truck (ST)
|
Yes
|
7,571 liters (2,000 gal)
|
||
|
Pickup
|
Transport/Support Vehicle (TSV)
|
Yes
|
4,536 kg (10,000 lb) gwr
truck
|
||
|
|
13-14 |
30 SEPTEMBER 2025
|
|
Rhyolite Ridge Lithium-Boron Project
|
S-K 1300 Technical Report Summary
|
|
13.4.3.
|
Equipment Performance
Factors and Fleet Requirements
|
|
|
- |
Mechanical availability = 90.0%;
|
|
|
- |
Utilization of available time = 92.0%;
|
|
|
- |
Effective utilization = 82.8%.
|
|
|
13-15 |
30 SEPTEMBER 2025
|
|
Rhyolite Ridge Lithium-Boron Project
|
S-K 1300 Technical Report Summary
|
|
Machine Make &
Model
|
Equipment
Type
|
Machine
Life
(years)
|
Mechanical Availability
(MA)
|
Utilization of
Availability (UofA)
|
Utilization
(U)
|
|
|
Caterpillar 995
|
FEL
|
25
|
90%
|
85%
|
77%
|
|
|
Caterpillar 785
|
AHT
|
25
|
90%
|
92%
|
83%
|
|
|
Caterpillar MD6200
|
DTH
|
30
|
85%
|
75%
|
64%
|
|
|
Caterpillar 740
|
WT
|
20
|
88%
|
76%
|
67%
|
|
|
Caterpillar 777
|
WT
|
20
|
90%
|
85%
|
77%
|
|
|
Weiler D560
|
PSD
|
30
|
85%
|
70%
|
60%
|
|
|
Caterpillar D10
|
TD
|
20
|
88%
|
76%
|
67%
|
|
|
Caterpillar D9
|
TD
|
20
|
88%
|
76%
|
67%
|
|
|
Caterpillar 18
|
MG
|
20
|
88%
|
77%
|
68%
|
|
|
Caterpillar 16
|
MG
|
20
|
88%
|
77%
|
68%
|
|
|
Caterpillar 834
|
RTD
|
25
|
88%
|
76%
|
68%
|
|
|
Caterpillar 430
|
BL
|
25
|
88%
|
71%
|
63%
|
|
|
Caterpillar 374
|
EX
|
30
|
88%
|
75%
|
66%
|
|
|
Fuel/Lube Truck
|
ST
|
20
|
88%
|
77%
|
68%
|
|
|
Pickup
|
TSV
|
5
|
90%
|
90%
|
81%
|
|
|
13-16 |
30 SEPTEMBER 2025
|
|
Rhyolite Ridge Lithium-Boron Project
|
S-K 1300 Technical Report Summary
|
|
Scheduled Days
|
Shifts/
Day
|
Scheduled Shifts
|
Lost
Shifts
|
Available Shifts
|
No. of
Crews
|
||
|
YR-01 - Quarter 01
|
91
|
2
|
182.5
|
2.5
|
180
|
4
|
|
|
YR-01 - Quarter 02
|
91
|
2
|
182.5
|
2.5
|
180
|
4
|
|
|
YR-01 - Quarter 03
|
91
|
2
|
182.5
|
2.5
|
180
|
4
|
|
|
YR-01 - Quarter 04
|
91
|
2
|
182.5
|
2.5
|
180
|
4
|
|
|
YR01 - Quarter 01
|
91
|
2
|
182.5
|
2.5
|
180
|
4
|
|
|
YR01 - Quarter 02
|
91
|
2
|
182.5
|
2.5
|
180
|
4
|
|
|
YR01 - Quarter 03
|
91
|
2
|
182.5
|
2.5
|
180
|
4
|
|
|
YR01 - Quarter 04
|
91
|
2
|
182.5
|
2.5
|
180
|
4
|
|
|
YR02 - Quarter 01
|
91
|
2
|
182.5
|
2.5
|
180
|
4
|
|
|
YR02 - Quarter 02
|
91
|
2
|
182.5
|
2.5
|
180
|
4
|
|
|
YR02 - Quarter 03
|
91
|
2
|
182.5
|
2.5
|
180
|
4
|
|
|
YR02 - Quarter 04
|
91
|
2
|
182.5
|
2.5
|
180
|
4
|
|
|
YR 03-20
|
365
|
2
|
730
|
10
|
720
|
4
|
|
|
YR 21-27
|
313
|
2
|
626
|
10
|
616
|
3
|
|
|
YR 28-43
|
240
|
2
|
480
|
10
|
470
|
2
|
|
|
YR 44-53
|
192
|
2
|
384
|
10
|
374
|
2
|
|
|
YR 54-82
|
192
|
1
|
192
|
10
|
182
|
1
|
|
Schedule Time Per Shift
|
(min)
|
720
|
|||
|
Less Scheduled Non-Productive Time
|
|||||
|
Travel Time/Shift Change/Blasting
|
(min)
|
10
|
|||
|
Equipment Inspection
|
(min)
|
10
|
|||
|
Lunch/Breaks
|
(min)
|
30
|
|||
|
Fueling, Lube, Inspection and Service
|
(min)
|
10
|
|||
|
Net Scheduled Productive Time (Metered
Operating Time)
|
(min)
|
660
|
|||
|
Job Efficiency (50 Minutes Productive Time
per Metered Hour)
|
83.3%
|
||||
|
Net Productive Operating Time Per Shift
|
(min)
|
550
|
|
|
13-17 |
30 SEPTEMBER 2025
|
|
Rhyolite Ridge Lithium-Boron Project
|
S-K 1300 Technical Report Summary
|
|
Machine
Make &
Model
|
Equipment Type
|
YR -1 - Q1
|
YR -1 - Q2
|
YR -1 - Q3
|
YR -1 - Q4
|
YR 1 - Q1
|
YR 1 - Q2
|
YR 1 - Q3
|
YR 1 - Q4
|
YR 2 - Q1
|
YR2 -
Q 2-4
|
YR
03
|
YR 04
|
YR 05-
11
|
YR 12-18
|
YR
19
|
YR 20-23
|
|
|
Caterpillar 995
|
FEL
|
1
|
1
|
1
|
1
|
2
|
2
|
2
|
2
|
2
|
2
|
2
|
2
|
2
|
2
|
2
|
2
|
|
|
Caterpillar 785
|
AHT
|
4
|
4
|
7
|
5
|
12
|
10
|
10
|
12
|
15
|
16
|
15
|
16
|
16
|
15
|
16
|
13
|
|
|
Caterpillar MD6200
|
DTH
|
1
|
0
|
1
|
1
|
1
|
1
|
1
|
1
|
1
|
1
|
1
|
1
|
1
|
1
|
1
|
1
|
|
|
Caterpillar 740
|
WT
|
2
|
2
|
2
|
2
|
2
|
2
|
2
|
2
|
2
|
2
|
2
|
2
|
2
|
2
|
1
|
1
|
|
|
Caterpillar 777
|
WT
|
1
|
1
|
1
|
1
|
1
|
1
|
1
|
1
|
1
|
1
|
1
|
1
|
1
|
1
|
1
|
1
|
|
|
Weiler D560
|
PSD
|
1
|
1
|
1
|
1
|
1
|
1
|
1
|
1
|
1
|
1
|
1
|
1
|
1
|
1
|
1
|
1
|
|
|
Caterpillar D10
|
TD
|
2
|
2
|
2
|
3
|
3
|
3
|
3
|
3
|
3
|
3
|
3
|
3
|
3
|
3
|
3
|
3
|
|
|
Caterpillar D9
|
TD
|
1
|
1
|
1
|
1
|
1
|
1
|
1
|
1
|
1
|
1
|
1
|
1
|
1
|
1
|
1
|
1
|
|
|
Caterpillar 18
|
MG
|
1
|
1
|
1
|
1
|
1
|
1
|
1
|
1
|
1
|
1
|
1
|
1
|
1
|
1
|
1
|
1
|
|
|
Caterpillar 16
|
MG
|
1
|
1
|
1
|
1
|
1
|
1
|
1
|
1
|
1
|
1
|
1
|
1
|
1
|
1
|
1
|
1
|
|
|
Caterpillar 834
|
RTD
|
1
|
1
|
1
|
1
|
1
|
1
|
1
|
1
|
1
|
1
|
1
|
1
|
1
|
1
|
1
|
1
|
|
|
Caterpillar 430
|
BL
|
1
|
1
|
1
|
1
|
1
|
1
|
1
|
1
|
1
|
1
|
1
|
1
|
1
|
1
|
1
|
1
|
|
|
Caterpillar 374
|
EX
|
1
|
1
|
1
|
1
|
1
|
1
|
1
|
1
|
1
|
1
|
1
|
1
|
1
|
1
|
1
|
1
|
|
|
Fuel/Lube Truck
|
ST
|
1
|
1
|
1
|
1
|
1
|
1
|
1
|
1
|
1
|
1
|
1
|
1
|
1
|
1
|
1
|
1
|
|
|
Pickup
|
TSV
|
5
|
5
|
5
|
5
|
5
|
5
|
5
|
5
|
5
|
5
|
5
|
5
|
5
|
5
|
5
|
5
|
|
|
13-18 |
30 SEPTEMBER 2025
|
|
Rhyolite Ridge Lithium-Boron Project
|
S-K 1300 Technical Report Summary
|
|
Machine
Make & Model
|
Equipment
Type
|
YR
24
|
YR 25-
26
|
YR 27
|
YR
28
|
YR 29-
32
|
YR
33
|
YR 34-
36
|
YR
37
|
YR
38
|
YR 39-
48
|
YR 49-
53
|
YR
54
|
YR 55-
82
|
YR 61-
84
|
|
|
Caterpillar 995
|
FEL
|
2
|
2
|
2
|
1
|
1
|
1
|
1
|
1
|
1
|
1
|
1
|
1
|
1
|
1
|
|
|
Caterpillar 785
|
AHT
|
14
|
15
|
13
|
13
|
12
|
11
|
10
|
8
|
7
|
6
|
5
|
4
|
4
|
4
|
|
|
Caterpillar MD6200
|
DTH
|
1
|
1
|
1
|
1
|
1
|
1
|
1
|
1
|
1
|
1
|
1
|
1
|
0
|
0
|
|
|
Caterpillar 740
|
WT
|
1
|
1
|
1
|
1
|
1
|
1
|
1
|
1
|
1
|
1
|
1
|
1
|
0
|
0
|
|
|
Caterpillar 777
|
WT
|
1
|
1
|
1
|
1
|
1
|
1
|
1
|
1
|
1
|
1
|
1
|
1
|
1
|
1
|
|
|
Weiler D560
|
PSD
|
1
|
1
|
1
|
1
|
1
|
1
|
1
|
1
|
1
|
1
|
1
|
1
|
0
|
0
|
|
|
Caterpillar D10
|
TD
|
3
|
3
|
3
|
2
|
2
|
2
|
2
|
2
|
2
|
2
|
2
|
2
|
0
|
0
|
|
|
Caterpillar D9
|
TD
|
1
|
1
|
1
|
1
|
1
|
1
|
1
|
1
|
1
|
1
|
1
|
1
|
1
|
1
|
|
|
Caterpillar 18
|
MG
|
1
|
1
|
1
|
1
|
1
|
1
|
1
|
1
|
1
|
1
|
1
|
1
|
1
|
0
|
|
|
Caterpillar 16
|
MG
|
1
|
1
|
1
|
1
|
1
|
1
|
1
|
1
|
1
|
1
|
1
|
1
|
1
|
1
|
|
|
Caterpillar 834
|
RTD
|
1
|
1
|
1
|
1
|
1
|
1
|
1
|
1
|
1
|
1
|
1
|
1
|
1
|
1
|
|
|
Caterpillar 430
|
BL
|
1
|
1
|
1
|
1
|
1
|
1
|
1
|
1
|
1
|
1
|
1
|
1
|
1
|
1
|
|
|
Caterpillar 374
|
EX
|
1
|
1
|
1
|
1
|
1
|
1
|
1
|
1
|
1
|
1
|
1
|
1
|
1
|
1
|
|
|
Fuel/Lube Truck
|
ST
|
1
|
1
|
1
|
1
|
1
|
1
|
1
|
1
|
1
|
1
|
1
|
1
|
1
|
1
|
|
|
Pickup
|
TSV
|
5
|
5
|
5
|
5
|
5
|
5
|
5
|
5
|
5
|
5
|
5
|
5
|
5
|
3
|
|
|
13-19 |
30 SEPTEMBER 2025
|
|
Rhyolite Ridge Lithium-Boron Project
|
S-K 1300 Technical Report Summary
|
|
Schedule Time Per Shift
|
(min)
|
720
|
|||
|
Less Scheduled Non-Productive Time
|
|||||
|
Travel Time/Shift Change/Blasting
|
(min)
|
10
|
|||
|
Equipment Inspection
|
(min)
|
10
|
|||
|
Lunch/Breaks
|
(min)
|
0
|
|||
|
Fueling, Lube, Inspection and Service
|
(min)
|
10
|
|||
|
Net Scheduled Productive Time (Metered Operating Time)
|
(min)
|
690
|
|||
|
Job Efficiency (55 Minutes Productive Time per Metered Hour)
|
92%
|
||||
|
Net Productive Operating Time Per Shift
|
(min)
|
633
|
|
13.4.4.
|
Labor Requirements
|
|
|
- |
Autonomous haul trucks are unmanned and therefore do not require haul truck
drivers to operate;
|
|
|
- |
A trained and specialized team of personnel are required to remotely monitor
the vehicles and make sure that they are performing to specifications;
|
|
|
- |
Maintenance will be provided by Empire Equipment as contractors, as such they
were not included in the total mine operations personnel count.
|
|
|
13-20 |
30 SEPTEMBER 2025
|
|
Rhyolite Ridge Lithium-Boron Project
|
S-K 1300 Technical Report Summary
|
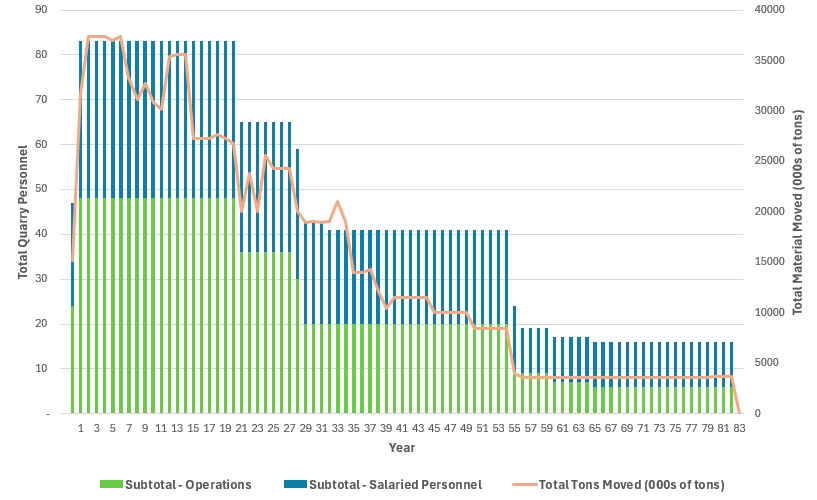
|
|
13-21 |
30 SEPTEMBER 2025
|
|
Rhyolite Ridge Lithium-Boron Project
|
S-K 1300 Technical Report Summary
|
|
14.
|
PROCESSING AND RECOVERY METHODS
|
|
|
◾ |
M5 (Carbonate-clay rich marl, high-grade lithium, low-to moderate-grade boron);
|
|
|
◾ |
S5 (Siltstone-claystone, low to high grade lithium and low-grade boron);
|
|
|
◾ |
L6 (Siltstone-claystone, laterally discontinuous low-to high-grade lithium and
boron mineralized horizons within a larger low-grade to barren sequence).
|
|
14.1.
|
Process Description
|
|
|
◾ |
Ore storage, handling and sizing:
|
|
|
☐
|
Run-of-quarry ore will be stockpiled before entering a two-stage crushing
circuit, where it will be reduced in size to approximately 1.9 cm (0.75 inches) before being conveyed to the
leaching vats;
|
|
|
◾ |
Vat leaching:
|
|
|
☐ |
Boron and lithium will be leached into solution by sulfuric acid, producing a
pregnant leach solution (PLS);
|
|
|
14-1 |
30 SEPTEMBER 2025
|
|
Rhyolite Ridge Lithium-Boron Project
|
S-K 1300 Technical Report Summary
|
|
|
◾ |
Boric acid circuit:
|
|
|
☐ |
Boric acid will be crystallized by cooling the PLS past its saturation limit
and filtering it;
|
|
|
☐ |
Boric acid will be refined by redissolution and recrystallization, followed by
dewatering via centrifugation prior to drying and packaging for sale to the market. The final product will be
technical grade boric acid;
|
|
|
◾ |
Evaporation and crystallization:
|
|
|
☐ |
The resultant solution from boric acid filtration will undergo impurity removal
by chemical addition and precipitation;
|
|
|
☐ |
The purified solution will undergo several stages of evaporation and
crystallization. Boric acid will be recovered via flotation and returned to the boric acid crystallization
circuit. The flotation tails (primarily salts of magnesium, potassium and sodium sulfate) will be dewatered via
centrifugation and sent to a spent ore storage facility;
|
|
|
◾ |
Lithium carbonate circuit:
|
|
|
☐ |
The remaining solution will undergo further impurity removal, followed by the
precipitation of technical grade lithium carbonate by chemical addition. The lithium carbonate will be filtered
from solution prior to product drying and packaging. The final product will be technical grade lithium carbonate.
|
|
|
◾ |
Lithium hydroxide circuit:
|
|
|
☐ |
Lithium carbonate will undergo further processing to convert to lithium
hydroxide monohydrate (LHM). The installation of the LHM conversion plant will occur post startup. The selected
conversion route is the liming route.
|
|
|
☐ |
Technical grade lithium carbonate is combined with lime to produce lithium
hydroxide and calcium carbonate. The lithium hydroxide slurry is filtered and the resulting calcium carbonate
byproduct is recycled to lithium carbonate plant to offset new lime consumption.
|
|
|
☐ |
The clarified lithium hydroxide solution is subject to ion exchange.
|
|
|
☐ |
The refined lithium hydroxide solution is concentrated through multiple stages
of evaporation. Lithium hydroxide monohydrate is crystallized and dewatered using centrifuges. The LHM solids are
redissolved in clean process condensate and filtered to remove insoluble impurities. And subject to a final stage
of crystallization to produce battery grade LHM. The solids are dewatered and washed using centrifuges.
|
|
|
☐ |
The wet LHM solids are direct to dryers and packaging systems.
|
|
|
14-2 |
30 SEPTEMBER 2025
|
|
Rhyolite Ridge Lithium-Boron Project
|
S-K 1300 Technical Report Summary
|
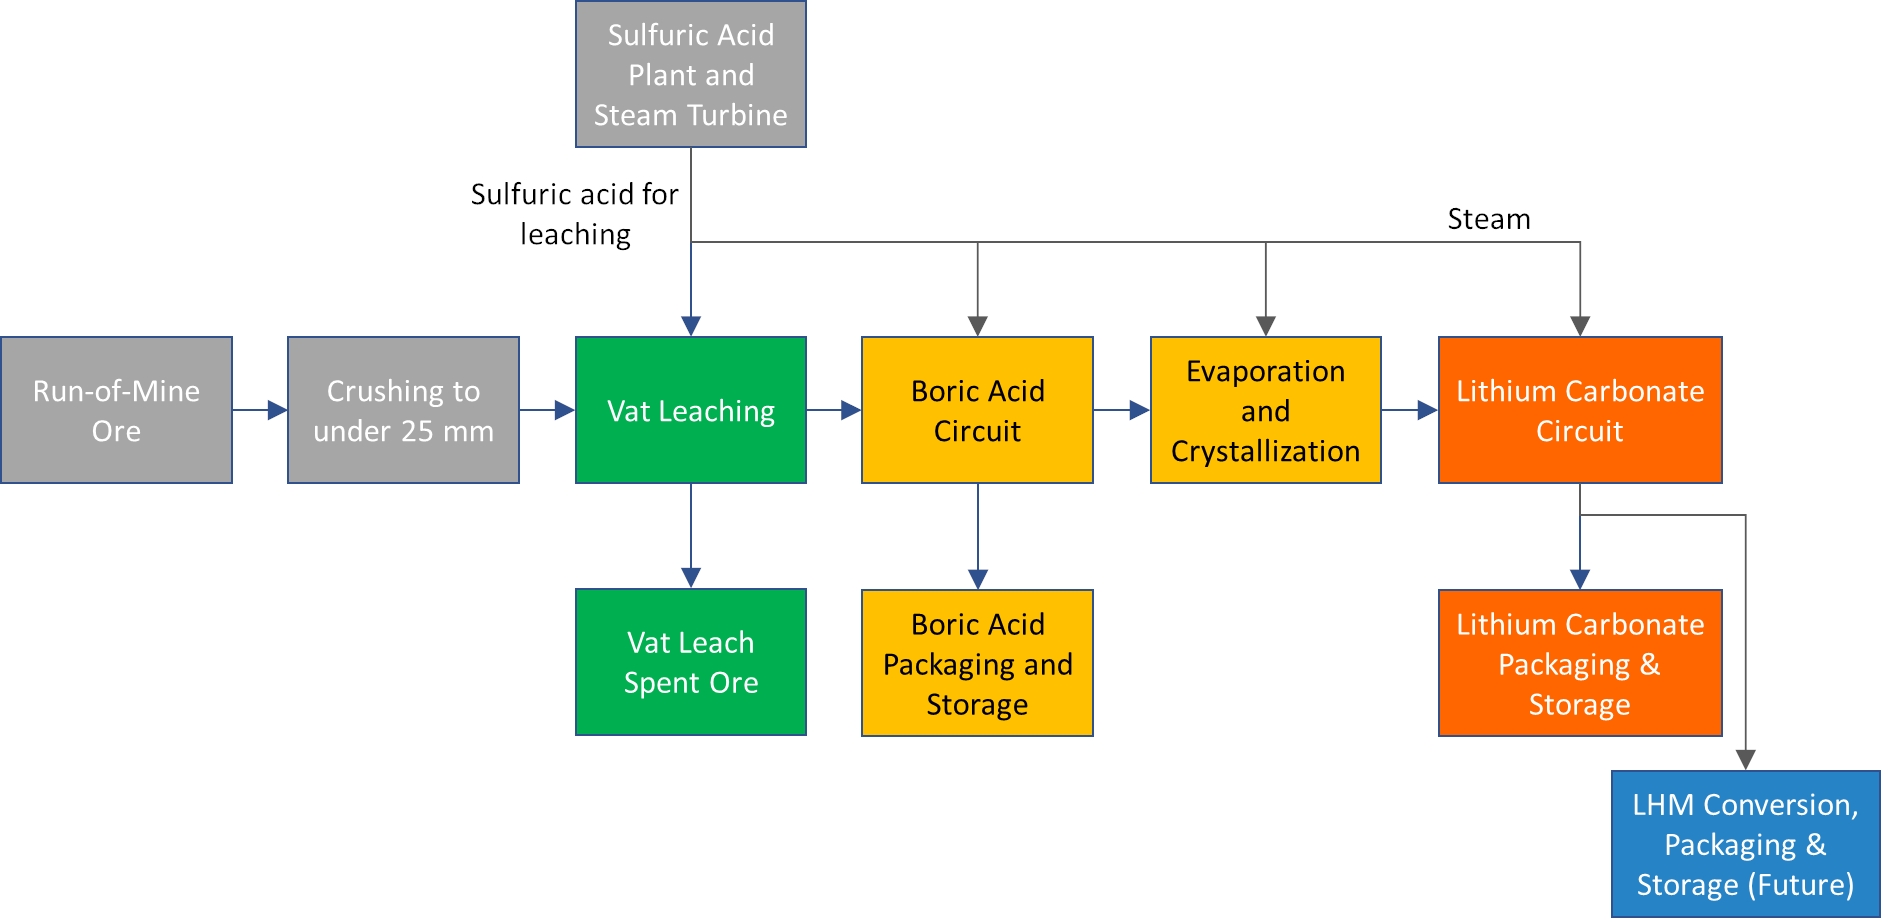
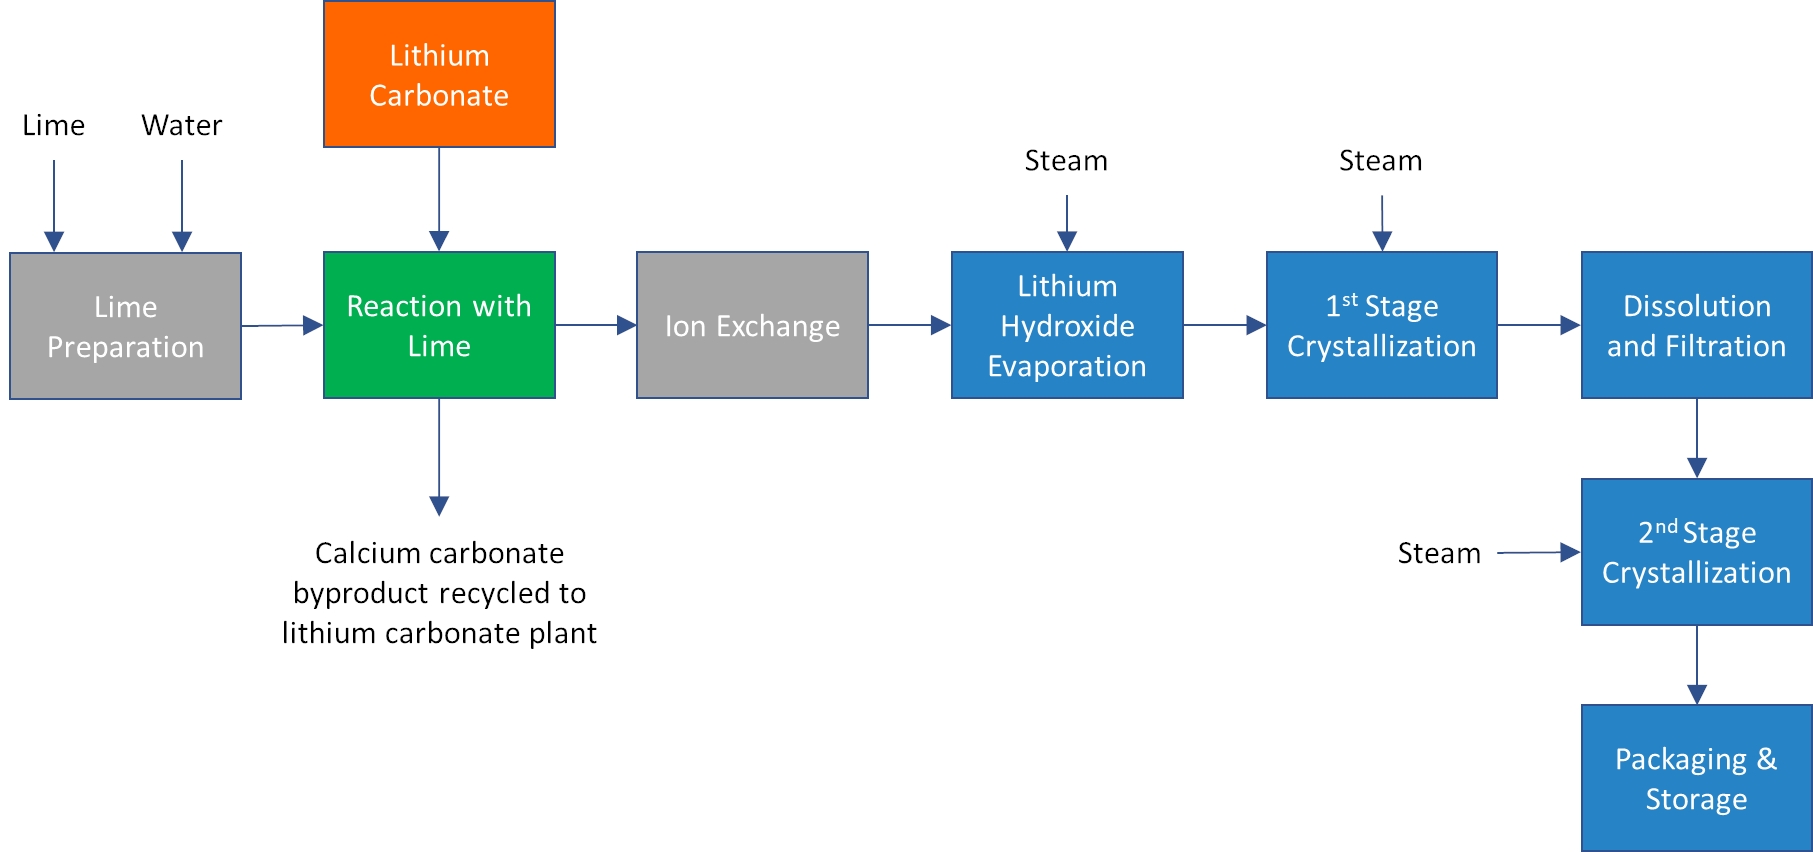
|
|
14-3 |
30 SEPTEMBER 2025
|
|
Rhyolite Ridge Lithium-Boron Project
|
S-K 1300 Technical Report Summary
|
|
14.1.1.
|
Ore Storage, Handling, and Sizing
|
|
14.1.2.
|
Vat Leaching
|
|
Activity
|
Activity Duration
(days)
|
|
|
Ore loading and solution flooding/recirculation
|
1
|
|
|
Neutralization
|
1
|
|
|
Leaching
|
2
|
|
|
Washing
|
1
|
|
|
Draining/unloading / inspection
|
1
|
|
|
14-4 |
30 SEPTEMBER 2025
|
|
Rhyolite Ridge Lithium-Boron Project
|
S-K 1300 Technical Report Summary
|
|
14.1.3.
|
Boric Acid Crystallization
(CRZ1)
|
|
14.1.4.
|
Boric Acid Production (CRZ3)
|
|
|
14-5 |
30 SEPTEMBER 2025
|
|
Rhyolite Ridge Lithium-Boron Project
|
S-K 1300 Technical Report Summary
|
|
14.1.5.
|
Impurity Removal (IR1)
|
|
14.1.6.
|
Evaporation (EVP1)
|
|
|
14-6 |
30 SEPTEMBER 2025
|
|
Rhyolite Ridge Lithium-Boron Project
|
S-K 1300 Technical Report Summary
|
|
14.1.7.
|
Crystallization (CRZ2)
|
|
14.1.8.
|
Lithium Circuit
|
|
14.1.8.1.
|
Brine Cleaning – Impurity (IR2)
and Calcium Removal
|
|
|
14-7 |
30 SEPTEMBER 2025
|
|
Rhyolite Ridge Lithium-Boron Project
|
S-K 1300 Technical Report Summary
|
|
14.1.8.2.
|
Lithium Carbonate Precipitation
|
|
14.1.8.3.
|
Lithium Brine Evaporation
(EVP2)
|
|
14.2.
|
Process Development
|
|
|
14-8 |
30 SEPTEMBER 2025
|
|
Rhyolite Ridge Lithium-Boron Project
|
S-K 1300 Technical Report Summary
|
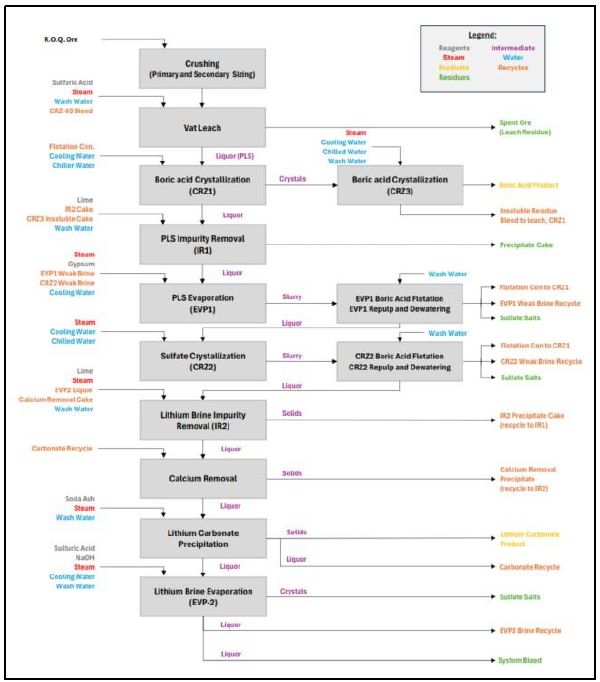
|
|
14-9 |
30 SEPTEMBER 2025
|
|
Rhyolite Ridge Lithium-Boron Project
|
S-K 1300 Technical Report Summary
|
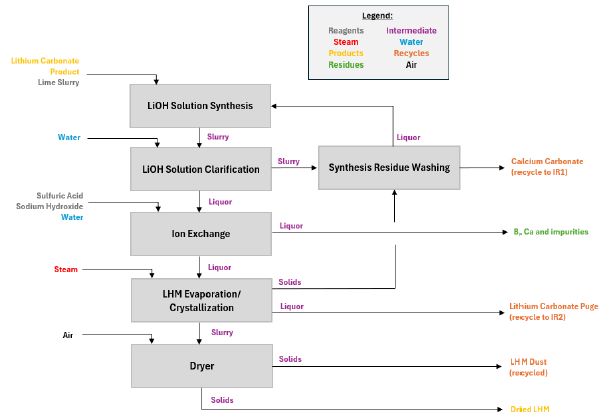
|
14.2.1.
|
Process Development
|
|
14.2.2.
|
Process Development
Improvements
|
|
14.2.2.1.
|
Optimized Leach Cycle and Acid
Utilization
|
|
|
14-10 |
30 SEPTEMBER 2025
|
|
Rhyolite Ridge Lithium-Boron Project
|
S-K 1300 Technical Report Summary
|
|
14.2.2.2.
|
Rhyolite Ridge Flowsheet
testing with low boron feedstock
|
|
14.2.2.3.
|
Energy Balance Optimization
|
|
|
◾ |
Inclusion of hot water system to increase overall system
thermal efficiency. Heat recovery and transfer from the sulfuric acid plant to the process unit is increased
and used in duties requiring low quality heat.
|
|
14.2.2.4.
|
Pilot Plant Learnings
|
|
|
◾ |
Difficult crystal/liquor separation characteristics of
crystal slurries generated in PLS evaporation and sulfate crystallization;
|
|
|
◾ |
High losses of lithium in the sulfate salts due to liquor
entrainment in the fine-grained crystals;
|
|
|
◾ |
Formation of undesirable lithium double salts;
|
|
|
◾ |
Unrepresentative boric acid flotation
operation resulting from fine-grained crystals generated in PLS evaporation and sulfate crystallization.
|
|
|
14-11 |
30 SEPTEMBER 2025
|
|
Rhyolite Ridge Lithium-Boron Project
|
S-K 1300 Technical Report Summary
|
|
|
◾ |
The PLS impurity removal circuit (IR1) was optimized to
improve crystal-liquor separations in the downstream evaporation and sulfate crystallization circuits
(EVP1/CRZ2) unit operations, resulting in improved lithium recovery. This would allow the lithium brine
impurity removal (IR2) filter cake to be recycled to IR1, reducing lime consumption and lithium losses;
|
|
|
◾ |
EVP1 and CRZ2 boric acid flotation circuits were
segregated to improve crystal-liquor separations and improve lithium recovery;
|
|
|
◾ |
EVP1 and CRZ2 boric acid flotation circuits were located
upstream of sulfate salt dewatering to improve boric acid recover and improve crystal-liquor separations and
improve lithium recovery;
|
|
|
◾ |
The boric acid flotation concentrate was recycled to CRZ1
instead of CRZ3 to reduce impurity transfer to boric acid recrystallization (CRZ3);
|
|
|
◾ |
The sequence of the lithium brine evaporation (EVP2) and
lithium carbonate precipitation unit operations were optimized, reducing the risk of lithium saturation in
lithium brine evaporation;
|
|
|
◾ |
Optimization of the vat leach conditions. Leach residence
time was reduced from four to three days, requiring a leach feed crush size of 100% passing 1.9 cm (0.75
inches) to optimize lithium and boron leach extraction. This resulted in a reduction of one vat to seven vats;
|
|
|
◾ |
The target PLS boric acid concentration was reduced from
7.5% to 6.4% to reduce the risk of boric acid crystallization in leach;
|
|
|
◾ |
The CRZ2 crystallization temperature was reduced from 5°C
to -5°C (41°F to 23°F) to minimize the magnesium transferred to the lithium circuit, lowering the unit cost of
production (lime consumption) in the lithium circuit.
|
|
14.2.2.5.
|
Boron and Lithium Recovery
|
|
|
14-12 |
30 SEPTEMBER 2025
|
|
Rhyolite Ridge Lithium-Boron Project
|
S-K 1300 Technical Report Summary
|
|
|
◾ |
As vat leaching will be performed on the whole
(un-beneficiated) ore, any losses associated with upgrading to a concentrate are avoided;
|
|
|
◾ |
The sulfate salts that will be formed in the evaporation
and sulfate crystallization circuits (EVP1/CRZ2) will be subjected to two stages of crystal washing to recover
entrained lithium from the brine;
|
|
|
◾ |
The concentrating unit operations designed to remove water
and crystallize gangue salts are performed in enclosed / contained systems in specialized evaporators and
crystallizers. Thus no losses due to leakage through liners, evaporative and wind losses, and encapsulation in
the bottom of brine ponds are expected.
|
|
|
◾ |
Recycling of the lithium carbonate rich liquor within the
lithium section of the plant will prevent lithium losses. This will increase the lithium recovery compared to
lithium brine operations that recycle brine back to the brine ponds;
|
|
|
◾ |
In IR1, the solid impurities will be precipitated and
removed prior to the concentration of lithium by evaporation. The recycling of the brine-cleaning filter cake
back to IR1 will enable the lithium content to be recovered and will improve the total lithium recovery.
|
| 14.3. |
Additional Required Plant
Infrastructure
|
| 14.4. |
Processing Plant Throughput and Design, and Equipment Layout, Characteristics, and Specifications
|
|
|
◾ |
Process summary – overall capacities, throughputs, and
product recoveries;
|
|
|
◾ |
Operating schedule – results of the reliability,
availability, and maintenance (RAM) study, which determine the availability and utilization of the process
units. The results of the RAM study were used to size equipment and determine throughput requirements in
alignment with the capacity of the sulfuric acid plant;
|
|
|
◾ |
Unit process design criteria – reflects the unit process
design parameters utilized as the basis for the process design.
|
|
14.4.1.
|
Design Basis and Criteria
|
|
|
14-13 |
30 SEPTEMBER 2025
|
|
Rhyolite Ridge Lithium-Boron Project
|
S-K 1300 Technical Report Summary
|
|
Parameter
|
Units
|
Value
|
Comments
|
|||
|
Design philosophy
|
–
|
–
|
Constant acid production, variable ore throughput
|
|||
|
Operating days per year
|
d/a
|
345 (based on average utilization)
|
Excludes acid plant catalyst change out events. Plant
capacity reduced during these events; boiler inspections will result in plant downtime.
|
|||
|
Overall utilized capacity
|
%
|
91.5
|
Based on RAM analysis (year A/B average)
|
|||
|
Plant operating hours
|
h/a
|
8,287
|
Based on RAM analysis
|
|||
|
Sulfuric acid plant capacity
|
tpd (stpd)
|
3,500 (3,858)
|
At 100% H2SO4
|
|||
|
Process plant capacity
|
tpa (stpa)
|
3,265,900 (3,600,000)
|
Quantity of ore processed on a dry basis
|
|||
|
Process plant capacity
|
tpd (stpd)
|
9,707 (10,700)
|
Dry basis
|
|||
|
Boron feed grade - design
|
%
|
1.46
|
Concentration in ore
|
|||
|
Lithium feed grade - design
|
%
|
0.21
|
Concentration in ore
|
|||
|
Boron recovery - design
|
%
|
72%
|
||||
|
Boron recovery – MPO 14a
|
%
|
66%
|
||||
|
Lithium recovery - design
|
%
|
81.8%
|
||||
|
Lithium recovery – MPO 14a
|
%
|
78%
|
||||
|
Technical-grade lithium carbonate design production
|
tpa (stpa)
|
25,955 (28,610)
|
>98.5% purity
|
|||
|
Battery Grade Lithium Hydroxide Production
|
tpa (stpa)
|
26,671 (29,400)
|
> 99.5wt% purity
|
|||
|
Boric acid design production
|
tpa (stpa)
|
183,251 (202,000)
|
99.9-100.9% H3BO3 eq purity
|
|
14.4.2.
|
Operating Schedule and
Availability
|
|
14.4.3.
|
Processing Equipment
Characteristics and Specifications
|
|
|
14-14 |
30 SEPTEMBER 2025
|
|
Rhyolite Ridge Lithium-Boron Project
|
S-K 1300 Technical Report Summary
|
|
Item
|
Measurement Type
|
Description
|
|
Ore Handling and
Sizing
|
||
|
ROQ ore feeder
|
Capacity (input size)
|
732 t/h (807 st/h) (ROQ ore <10”)
|
|
Primary sizer
|
Total capacity (discharge size)
|
732 t/h (807 st/h) (P80 of 2.63”)
|
|
Primary sizer discharge conveyor
|
Capacity (length)
|
732 t/h (807 st/h) (1 segment totaling 0.05 miles)
|
|
Secondary sizer
|
Total capacity (discharge size)
|
2 x 367 t/h (404 st/h) (P80 of 0.916” inches)
|
|
Vat Leach Plant
|
||
|
Vat
|
Quantity (dimensions)
|
7 (41 m D x 7.6m) (135’ D x 25’ H)
|
|
Vat unloading bridge crane
|
Capacity (dimensions)
|
36 t (40 st) (48.8 m L x 6.1 m W x 21.3 m H) (160’ L x
20’ W x 70’ H)
|
|
Vat loading and unloading conveyors
|
Capacity (length)
|
730-798 t/h (805-880 st/h) (5 segments totaling 0.63 km
[0.39 miles])
|
|
Boric Acid Circuit
(includes evaporation and crystallization)
|
||
|
CRZ1 crystallizers
|
Type (# of stages)
|
Flash cooled forced circulation (2)
|
|
CRZ1 dewatering
|
Type (quantity)
|
Vacuum belt filter (1)
|
|
CRZ3 crystallizers
|
Type (# of stages)
|
Draft tube flash cooled (2)
|
|
CRZ3 dewatering
|
Type (quantity)
|
Screen scroll centrifuge (2)
|
|
Boric acid dryer
|
Type (capacity)
|
Rotary drum steam/electric (27 t/h) (30 st/h)
|
|
IR1 reactor tanks
|
Quantity
|
5
|
|
IR1 dewatering
|
Type (quantity)
|
Filter press (2)
|
|
EVP1 evaporators
|
Type (# of effects)
|
Forced circulation (4)
|
|
EVP1 centrifuges
|
Type (quantity)
|
Screen scroll (16)
|
|
CRZ2 crystallizers
|
Type (# of stages)
|
Force circulation (2 flash cooled, 2 surface cooled)
|
|
CRZ2 centrifuges
|
Type (quantity)
|
Screen scroll (14)
|
|
EVP1 flotation tanks
|
Type (# of units)
|
Rougher flotation cell (5)
|
|
CRZ2 flotation tanks
|
Type (# of units)
|
Rougher flotation cell (10)
|
|
Lithium Carbonate
Circuit
|
||
|
IR2 reactor tanks
|
Quantity
|
3
|
|
IR2 dewatering
|
Type (quantity)
|
Filter press (1)
|
|
Carbonate removal tanks
|
Quantity
|
3
|
|
Carbonate removal dewatering
|
Type (quantity)
|
Clarifier (1)
|
|
Lithium reactor tanks
|
Quantity
|
3
|
|
Lithium filter
|
Type
|
Belt filter
|
|
Lithium carbonate dryer
|
Type (capacity)
|
Rotary drum steam/electric (3.3 st/h)
|
|
EVP2 evaporators
|
Type (# of effects)
|
Force circulation (3)
|
|
EVP2 dewatering
|
Type (quantity)
|
Screen scroll (2)
|
|
|
14-15 |
30 SEPTEMBER 2025
|
|
Rhyolite Ridge Lithium-Boron Project
|
S-K 1300 Technical Report Summary
|
|
14.4.4.
|
Processing Equipment Layout
|
|
|
14-16 |
30 SEPTEMBER 2025
|
|
Rhyolite Ridge Lithium-Boron Project
|
S-K 1300 Technical Report Summary
|
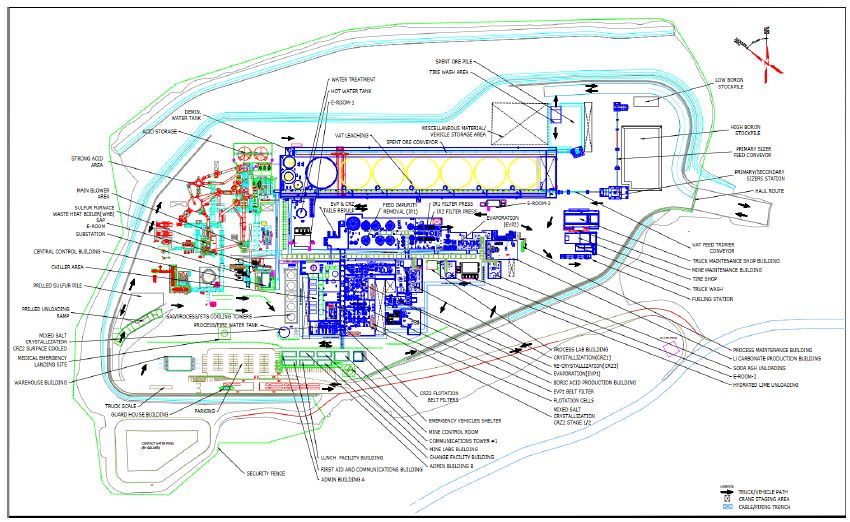
|
|
14-17 |
30 SEPTEMBER 2025
|
|
Rhyolite Ridge Lithium-Boron Project
|
S-K 1300 Technical Report Summary
|
|
|
◾ |
Site truck unloading and loading traffic;
|
|
|
◾ |
Mine and spent ore heavy haul truck access and separation
considerations;
|
|
|
◾ |
Construction and maintenance activities’ space
requirements;
|
|
|
◾ |
Process and utility equipment positioning to reduce bulk
quantities (i.e., piping, electrical);
|
|
|
◾ |
Operating and office personnel physical access;
|
|
|
◾ |
Earthworks minimization;
|
|
|
◾ |
Environmental guidelines, objectives, and criteria
compliance;
|
|
|
◾ |
Future space consideration for sulfur delivery.
|
| 14.5. |
Projected Requirements for Energy,
Water, Process Materials, and Personnel
|
|
14.5.1.
|
Energy
|
|
14.5.2.
|
Water
|
|
|
14-18 |
30 SEPTEMBER 2025
|
|
Rhyolite Ridge Lithium-Boron Project
|
S-K 1300 Technical Report Summary
|
|
14.5.2.1.
|
Firewater and Process Water
|
|
14.5.2.2.
|
Process Condensate
|
|
14.5.2.3.
|
Steam Condensate
|
|
14.5.2.4.
|
Cooling Water
|
|
|
14-19 |
30 SEPTEMBER 2025
|
|
Rhyolite Ridge Lithium-Boron Project
|
S-K 1300 Technical Report Summary
|
|
14.5.2.5.
|
Process Chilled Water
|
|
14.5.2.6.
|
Demineralized Water
|
|
14.5.2.7.
|
Potable Water
|
|
14.5.2.8.
|
Hot Water System
|
|
14.5.3.
|
Other Utilities
|
|
14.5.3.1.
|
Steam
|
|
|
14-20 |
30 SEPTEMBER 2025
|
|
Rhyolite Ridge Lithium-Boron Project
|
S-K 1300 Technical Report Summary
|
|
14.5.3.2.
|
Compressed Air
|
|
14.5.3.3.
|
Fuels
|
|
14.5.4.
|
Reagents
|
|
Reagent
|
Design Annual
Consumption
tpa (stpa)
|
Average Annual Consumption
over Life of Mine
tpa (stpa)
|
|
Sulfur (prill)
|
412,769 (455,000)
|
367,410 (405,000)
|
|
Hydrated lime
|
72,303 (79,700)
|
70,760 (78,000)
|
|
Soda ash
|
63,684 (70,200)
|
54,431 (60,000)
|
|
Caustic soda (50% NaOH)
|
29 (32)
|
29 (32)
|
|
Gypsum
|
11,703 (12,900)
|
10,886 (12,000)
|
|
14.5.4.1.
|
Hydrated Lime
|
|
|
14-21 |
30 SEPTEMBER 2025
|
|
Rhyolite Ridge Lithium-Boron Project
|
S-K 1300 Technical Report Summary
|
|
14.5.4.2.
|
Soda Ash
|
|
14.5.4.3.
|
Gypsum
|
|
14.5.4.4.
|
Caustic Soda
|
|
14.5.4.5.
|
Sulfuric Acid
|
|
|
14-22 |
30 SEPTEMBER 2025
|
|
Rhyolite Ridge Lithium-Boron Project
|
S-K 1300 Technical Report Summary
|
|
14.5.4.6.
|
Cooling Tower Chemicals
|
|
|
◾ |
Corrosion inhibitor;
|
|
|
◾ |
Biocide;
|
|
|
◾ |
Anti-scalant.
|
|
14.5.4.7.
|
Boiler Chemicals
|
|
|
◾ |
Corrosion inhibitor;
|
|
|
◾ |
Liquid phosphate;
|
|
|
◾ |
Oxygen scavenger.
|
|
14.5.4.8.
|
Elemental Sulfur
|
|
|
14-23 |
30 SEPTEMBER 2025
|
|
Rhyolite Ridge Lithium-Boron Project
|
S-K 1300 Technical Report Summary
|
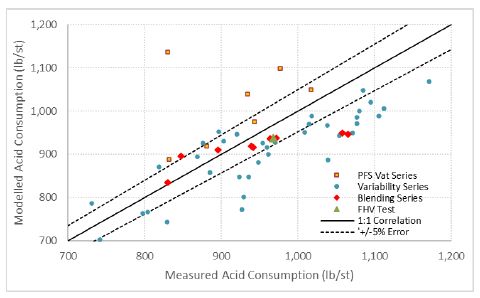
|
14.5.4.9.
|
Laboratory Chemicals
|
|
|
◾ |
Hydrochloric acid;
|
|
|
◾ |
Hydrogen peroxide;
|
|
|
◾ |
Nitric acid;
|
|
|
◾ |
Sodium peroxide;
|
|
|
◾ |
Soda ash.
|
|
14.5.5.
|
Personnel
|
|
|
14-24 |
30 SEPTEMBER 2025
|
|
Rhyolite Ridge Lithium-Boron Project
|
S-K 1300 Technical Report Summary
|
|
15.
|
INFRASTRUCTURE
|
|
|
◾ |
Process plant;
|
|
|
◾ |
Assay and metallurgical lab;
|
|
|
◾ |
Access through paved state and local county roads;
|
|
|
◾ |
Haul roads;
|
|
|
◾ |
Pit dewatering and monitoring wells;
|
|
|
◾ |
First aid and communications building;
|
|
|
◾ |
Explosives storage area;
|
|
|
◾ |
Steam turbine generator power plant;
|
|
|
◾ |
Spent ore storage facility;
|
|
|
◾ |
Switchgear and electrical distribution system;
|
|
|
◾ |
Emergency facilities;
|
|
|
◾ |
Water systems;
|
|
|
◾ |
Sedimentation and contact water ponds;
|
|
|
◾ |
Truck shop;
|
|
|
◾ |
Fueling station;
|
|
|
◾ |
Lunch facility building;
|
|
|
◾ |
Administrative building.
|
|
|
15-1 |
30 SEPTEMBER 2025
|
|
Rhyolite Ridge Lithium-Boron Project
|
S-K 1300 Technical Report Summary
|
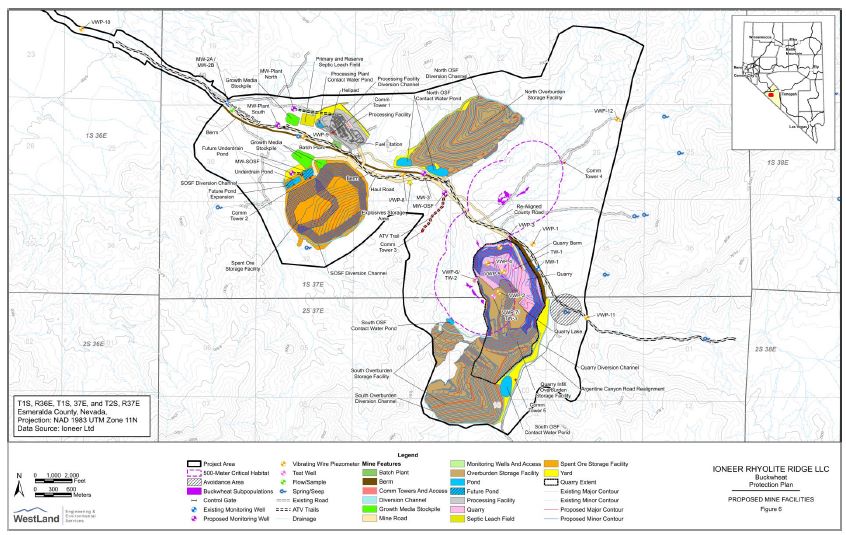
|
|
15-2 |
30 SEPTEMBER 2025
|
|
Rhyolite Ridge Lithium-Boron Project
|
S-K 1300 Technical Report Summary
|
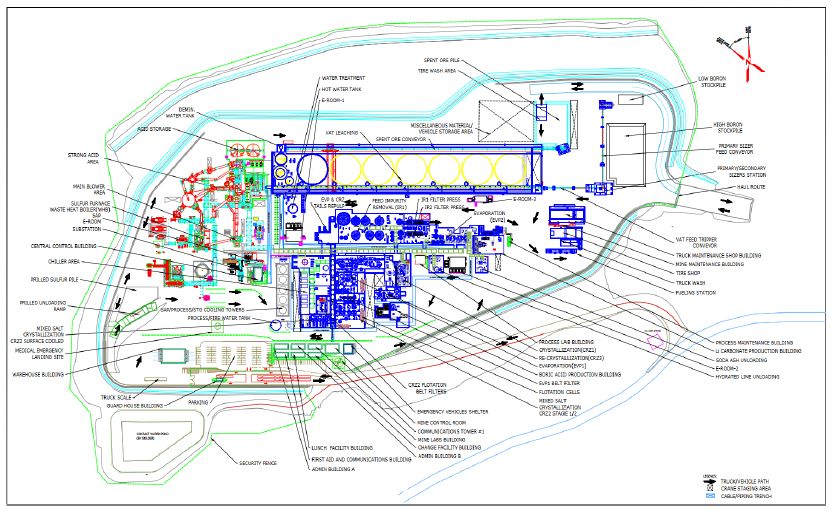
|
|
15-3 |
30 SEPTEMBER 2025
|
|
Rhyolite Ridge Lithium-Boron Project
|
S-K 1300 Technical Report Summary
|
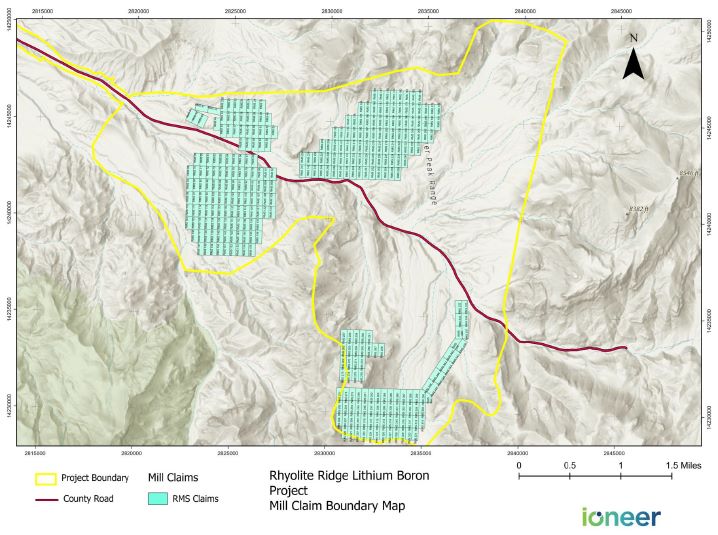
|
|
15-4 |
30 SEPTEMBER 2025
|
|
Rhyolite Ridge Lithium-Boron Project
|
S-K 1300 Technical Report Summary
|
|
15.1.
|
Roads and
Logistics
|
|
15.1.1.
|
Site Access
|
|
15.1.2.
|
Roads and Logistics
|
|
|
15-5 |
30 SEPTEMBER 2025
|
|
Rhyolite Ridge Lithium-Boron Project
|
S-K 1300 Technical Report Summary
|
|
15.2.
|
Onsite Power Plant
|
|
|
15-6 |
30 SEPTEMBER 2025
|
|
Rhyolite Ridge Lithium-Boron Project
|
S-K 1300 Technical Report Summary
|
|
15.3.
|
Sulfuric Acid
Plant
|
|
|
15-7 |
30 SEPTEMBER 2025
|
|
Rhyolite Ridge Lithium-Boron Project
|
S-K 1300 Technical Report Summary
|
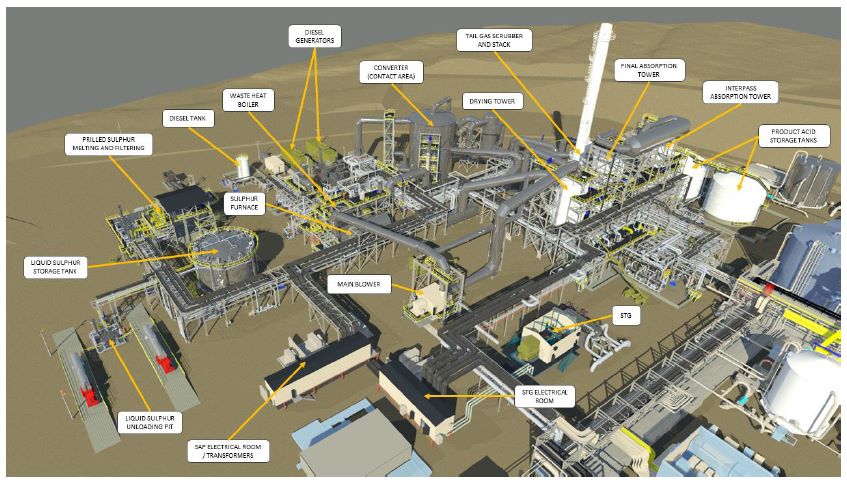
|
Rhyolite Ridge Lithium-Boron Project
|
S-K 1300 Technical Report Summary
|
|
15.4.
|
Water Usage
|
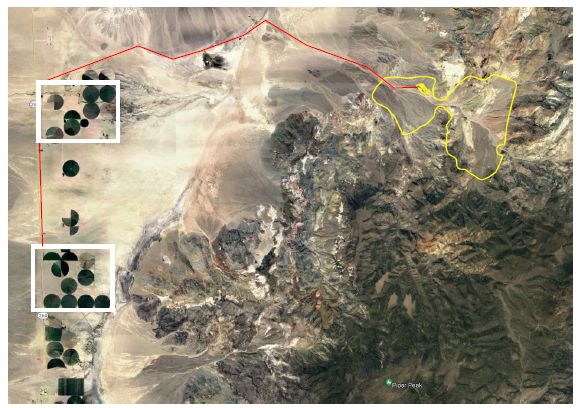
|
Rhyolite Ridge Lithium-Boron Project
|
S-K 1300 Technical Report Summary
|
|
15.5.
|
Accommodation
|
|
15.6.
|
Spent Ore Storage
Facility
|
|
Rhyolite Ridge Lithium-Boron Project
|
S-K 1300 Technical Report Summary
|
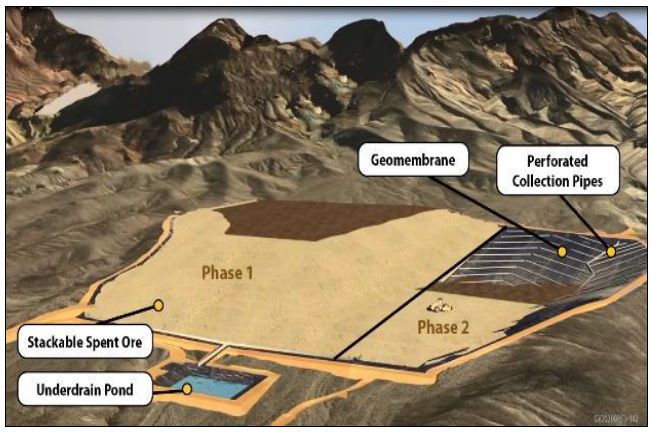
|
|
◾ |
Grading the base of the spent ore storage facility to
provide a stable surface on which to stack spent ore and composite materials to a height of 76 m (250 ft)
above the geomembrane lining system and promote collection of drain down solution;
|
|
|
◾ |
Lining the base of the spent ore storage facility with
HDPE geomembrane;
|
|
|
◾ |
Installing a solution collection system over the
geomembrane involving an overliner (comprising of a sand and gravel mixture developed from local borrow)
with an integrated network of drainage pipe to enhance solution flow and route flow to the underdrain
pond. The drainage system is intended to provide hydraulic relief to reduce the hydrostatic head on the
geomembrane liner;
|
|
|
◾ |
Installing an underdrain pond to store runoff from the
design storm event and drain down fluids from the spent ore storage facility;
|
|
Rhyolite Ridge Lithium-Boron Project
|
S-K 1300 Technical Report Summary
|
|
Description
|
Configuration
|
Comment
|
|
Yearly Waste Production Rate (Amount of dry material delivered to spent ore storage facility annually)
|
4.1 million short tons
|
|
|
Composite Materials Ratios (dry)
|
12.8 : 6.4 : 1
|
Spent ore : sulfate salt : precip. filter cake
|
|
Composite Materials Dry Unit Weight (for sizing facility)
|
65 lb/ft3
|
Value is estimated from existing laboratory data; moist unit weight = 85 lb/ft3
|
|
Loading method for Structural Zone
|
Truck end dumped, spread by dozer, compacted
|
Structural zone to be compacted based on technical specifications
|
|
Loading method for Non-Structural Zone
|
Truck end dumped, spread by dozer, compacted
|
Compaction not required for stability; some compaction may be required for trafficability
|
|
Description
|
Configuration
|
Comment
|
|
Spent Ore Properties
|
||
|
Specific Gravity of Solids
|
2.33 – 2.55
|
Measured for B5 Stream 1 & 2, S5, L6, and M5
|
|
Compacted Dry Unit Weight
|
75 lb/ft3
|
Compacted spent ore for structural zone
|
|
Permeability
|
1.0 x 10⁻⁶ cm/s
|
|
|
Draindown
|
0.1 L/h/m2
|
Kappes Cassiday Associates draindown results
|
|
Optimum Moisture content for compaction
|
38%
|
Moisture content sensitive to drying temperature
|
|
Spent Ore Moisture Content
|
26 – 43% (process definition)
|
|
|
35 – 75% (geotech definition)
|
||
|
Temperature when placed on spent ore storage facility
|
60°C
|
Maximum
|
|
Sulfate Salts Properties
|
||
|
Specific Gravity of Solids
|
Not measured
|
|
|
Bulk Unit Weight
|
48 – 74 lb/ft3 @ 32% moisture
|
Jenike & Johanson
|
|
Moisture Content
|
32%
|
Jenike & Johanson
|
|
Precipitate Filter Cake Properties
|
||
|
Specific Gravity of Solids
|
2.42 – 2.65
|
EB6 and IR1 samples
|
|
Bulk Unit Weight
|
Not measured
|
|
|
Moisture Content
|
56 – 67% (process)
|
|
|
Rhyolite Ridge Lithium-Boron Project
|
S-K 1300 Technical Report Summary
|
|
Material
|
Unit Weight (lb/ft3)
|
Friction Angle (°)
|
Cohesion (lb/ft3)
|
|
Spent Ore Storage Facility Structural Zone (compacted spent ore)
|
100
|
40 1
|
0
|
|
Spent Ore Storage Facility Non-Structural Zone (Uncompacted Composite Material)
|
85
|
25 1
|
0
|
|
Geomembrane Liner Interface
|
100
|
Nonlinear strength envelope 2
|
|
|
Common Fill
|
120
|
34
|
0
|
|
Foundation (Alluvium)
|
120
|
40
|
0
|
|
|
2. |
Shear strength reduced by 20% for pseudostatic evaluation.
|
|
|
3. |
Nonlinear strength envelope is the power curve fit from the alluvium versus
geomembrane interface shear test.
|
|
Description
|
Configuration
|
Comment
|
|
Seismic Site Class
|
C
|
NewFields Geotechnical Data Report
|
|
Operational Basis Earthquake (OBE)
|
475 Year Recurrence Interval
|
10% Probability in 50 years
|
|
Peak Horizontal Ground Acceleration
|
0.31 g
|
USGS Unified Hazard Tool
|
|
Maximum Design Earthquake (MDE)
|
2,475 Year Recurrence Interval
|
2% Probability in 50 years
|
|
Peak Horizontal Ground Acceleration
|
0.63 g
|
USGS Unified Hazard Tool
|
|
Mean Magnitude Earthquake
|
6.48
|
|
|
Mean Earthquake Distance
|
7.9 miles (12.6 kilometers)
|
|
Rhyolite Ridge Lithium-Boron Project
|
S-K 1300 Technical Report Summary
|
|
16.
|
MARKET STUDIES
|
|
16.1.
|
Lithium
|
|
16.1.1.
|
Lithium Carbonate Price Basis for
the Project
|
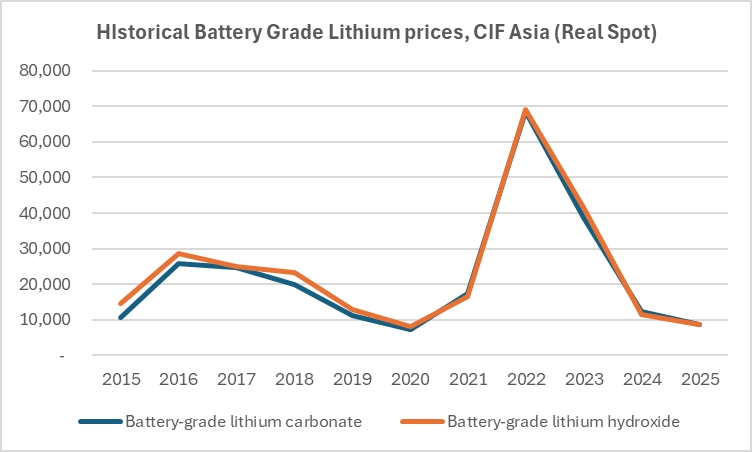
|
Rhyolite Ridge Lithium-Boron Project
|
S-K 1300 Technical Report Summary
|
|
16.1.2.
|
Lithium Supply and Demand
|
|
16.1.2.1.
|
General Market
|
|
Rhyolite Ridge Lithium-Boron Project
|
S-K 1300 Technical Report Summary
|
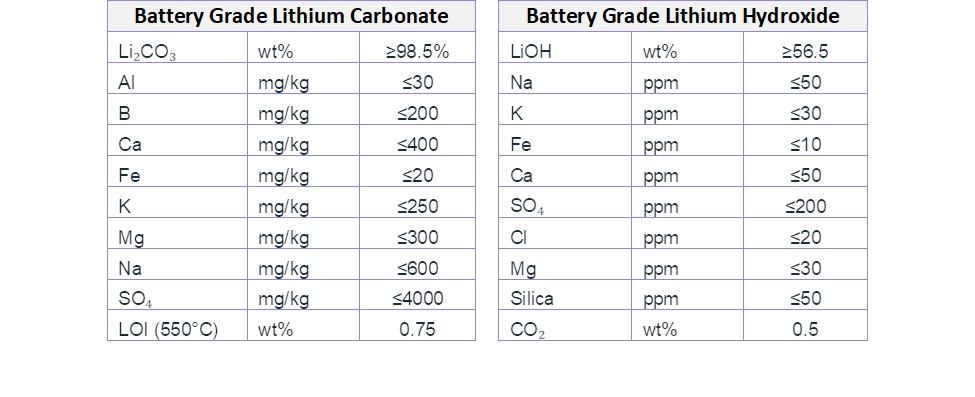
|
16.1.2.2.
|
Lithium Supply
|
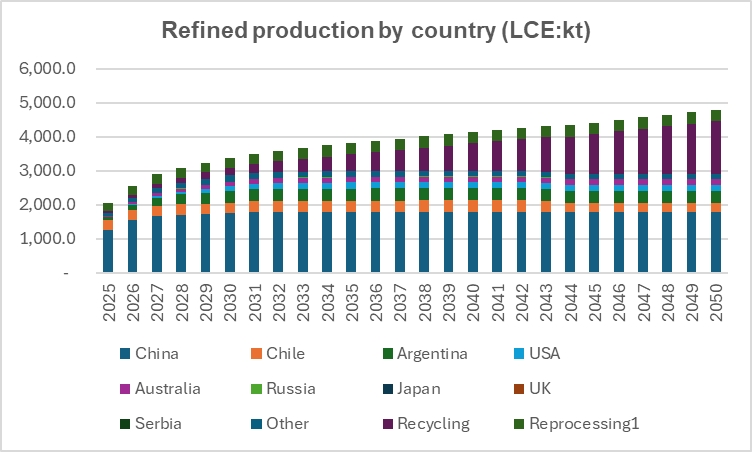
|
|
1. |
x-axis in kt = thousand metric tons
|
|
|
2. |
Supply means production
|
|
|
3. |
1 = carbonate, chloride, and sulfate reprocessing
|
|
Rhyolite Ridge Lithium-Boron Project
|
S-K 1300 Technical Report Summary
|
|
16.1.2.3.
|
Lithium Demand
|
|
Rhyolite Ridge Lithium-Boron Project
|
S-K 1300 Technical Report Summary
|
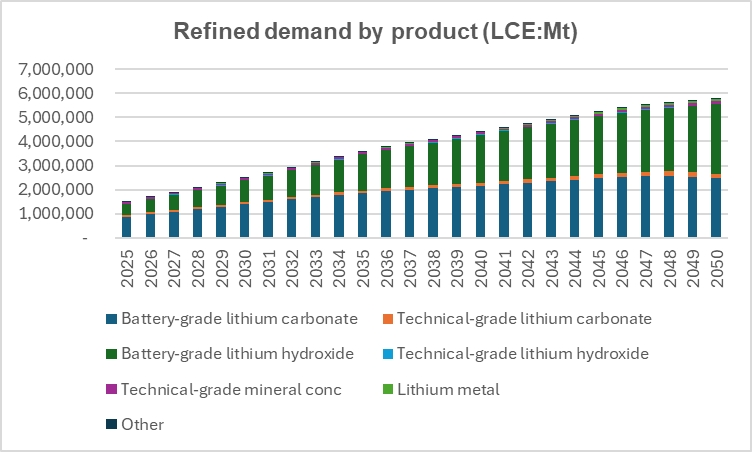
|
|
◾ |
Large financial losses;
|
|
|
◾ |
Poor sales performance due to higher EV prices compared to
internal combustion engine vehicles; and
|
|
|
◾ |
Insufficient charging infrastructure.
|
|
Rhyolite Ridge Lithium-Boron Project
|
S-K 1300 Technical Report Summary
|
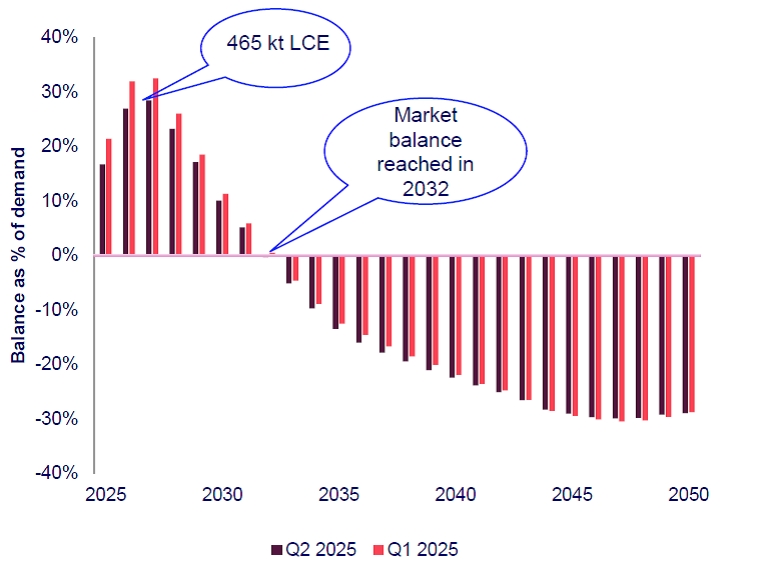
|
|
1. |
X-axis is shown in % of lithium chemical balance
|
|
|
2. |
Refine lithium means chemical lithium
|
|
16.1.3.
|
Lithium Customers and Competitor
Analysis
|
|
Rhyolite Ridge Lithium-Boron Project
|
S-K 1300 Technical Report Summary
|
|
16.1.4.
|
Lithium Price and Volume
Forecasts
|
|
Rhyolite Ridge Lithium-Boron Project
|
S-K 1300 Technical Report Summary
|
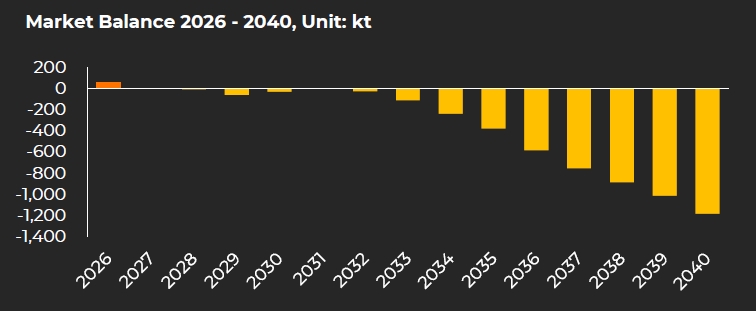
|
Rhyolite Ridge Lithium-Boron Project
|
S-K 1300 Technical Report Summary
|
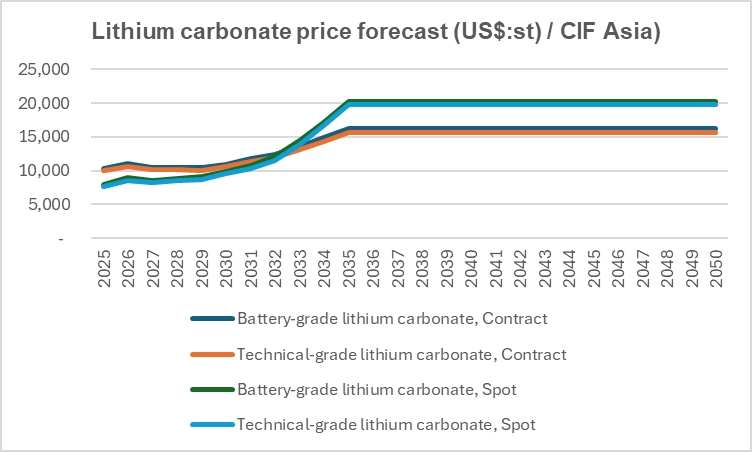
|
|
1. |
x-axis in US$/st = short tons
|
|
|
2. |
Real: Spot price
|
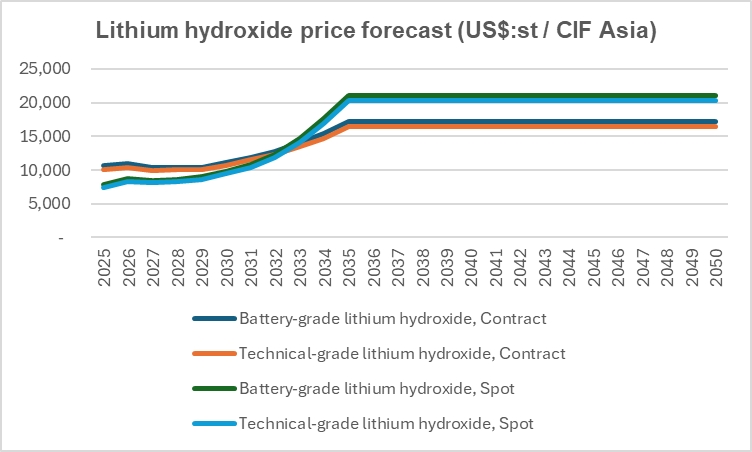
|
|
1. |
X-axis in US$/st = short tons
|
|
|
2. |
Real: Spot price
|
|
Rhyolite Ridge Lithium-Boron Project
|
S-K 1300 Technical Report Summary
|
|
Calendar Year
|
Production
Year
|
Product
|
ioneer Sales
Forecast1-3
|
Benchmark Minerals
Forecast4
|
Wood
Mackenzie Battery
Grade
forecast5
|
Wood
Mackenzie Technical
Grade
forecast6
|
|||
|
2028
|
1
|
TG Lithium Carbonate
|
$16,591
|
$19,051
|
$8,479
|
$8,756
|
|||
|
2029
|
2
|
TG Lithium Carbonate
|
$18,116
|
$20,865
|
$8,733
|
$9,109
|
|||
|
2030
|
3
|
BG Lithium Hydroxide
|
$21,270
|
$19,958
|
$9,506
|
$9,875
|
|||
|
2031
|
4
|
BG Lithium Hydroxide
|
$20,673
|
$19,051
|
$10,354
|
$10,715
|
|||
|
2032
|
5
|
BG Lithium Hydroxide
|
$20,673
|
$19,051
|
$11,540
|
$12,076
|
|||
|
2033
|
6
|
BG Lithium Hydroxide
|
$21,624
|
$19,051
|
$13,881
|
$14,407
|
|||
|
2034
|
7
|
BG Lithium Hydroxide
|
$21,606
|
$19,051
|
$16,620
|
$17,135
|
|||
|
2035
|
8
|
BG Lithium Hydroxide
|
$21,862
|
$19,051
|
$19,785
|
$20,291
|
|||
|
2036
|
9
|
BG Lithium Hydroxide
|
$22,132
|
$19,051
|
$19,785
|
$20,291
|
|||
|
2037
|
10
|
BG Lithium Hydroxide
|
$22,136
|
$19,051
|
$19,785
|
$20,291
|
|||
|
2038
|
11
|
BG Lithium Hydroxide
|
$22,241
|
$19,051
|
$19,785
|
$20,291
|
|||
|
2039
|
12
|
BG Lithium Hydroxide
|
$22,244
|
$19,051
|
$19,785
|
$20,291
|
|||
|
2040
|
13
|
BG Lithium Hydroxide
|
$22,316
|
$19,051
|
$19,785
|
$20,291
|
|||
|
2041
|
14
|
BG Lithium Hydroxide
|
$22,317
|
N/A
|
$19,785
|
$20,291
|
|||
|
2042
|
15
|
BG Lithium Hydroxide
|
$22,316
|
N/A
|
$19,785
|
$20,291
|
|||
|
2043
|
16
|
BG Lithium Hydroxide
|
$22,317
|
N/A
|
$19,785
|
$20,291
|
|||
|
2044
|
17
|
BG Lithium Hydroxide
|
$22,317
|
N/A
|
$19,785
|
$20,291
|
|||
|
2045
|
18
|
BG Lithium Hydroxide
|
$22,317
|
N/A
|
$19,785
|
$20,291
|
|||
|
2046
|
19
|
BG Lithium Hydroxide
|
$22,317
|
N/A
|
$19,785
|
$20,291
|
|||
|
2047
|
20
|
BG Lithium Hydroxide
|
$22,318
|
N/A
|
$19,785
|
$20,291
|
|||
|
2048
|
21
|
BG Lithium Hydroxide
|
$22,319
|
N/A
|
$19,785
|
$20,291
|
|||
|
2049
|
22
|
BG Lithium Hydroxide
|
$22,317
|
N/A
|
$19,785
|
$20,291
|
|||
|
2050
|
23
|
BG Lithium Hydroxide
|
$22,317
|
N/A
|
$19,785
|
$20,291
|
| 1. |
ioneer Sales Forecast = Offtake price formula based on Benchmark Minerals
battery-grade lithium hydroxide Q1 2025 spot price (in real terms) forecast average for Years 1 and 2.
|
| 2. |
Benchmark Minerals spot (in real terms) battery-grade lithium hydroxide with
management assumptions for offtake discount (or premium) for Years 3 onwards and for uncontracted volumes.
|
| 3. |
ioneer Sales Forecast based on the Mine Plan supported by the August 2025
Mineral Resource (Chapter 11) and Mineral Reserve (Chapter 12).
|
| 4. |
Benchmark Minerals battery-grade lithium hydroxide Q1 2025 price (in real
terms) forecast.
|
| 5. |
Wood Mackenzie battery-grade lithium hydroxide Q2 2025 price (in real terms)
forecast.
|
| 6. |
Wood Mackenzie technical-grade lithium hydroxide Q2 2025 price (in real
terms) forecast.
|
| 7. |
All prices in metric tons.
|
|
Rhyolite Ridge Lithium-Boron Project
|
S-K 1300 Technical Report Summary
|
|
|
◾ |
Benchmark Minerals and Wood Mackenzie are internationally
recognized research organizations that focus on lithium supply and demand studies. Suppliers and customers use
their information/data sets to make pricing decisions; and
|
|
|
◾ |
Benchmark Minerals and Wood Mackenzie periodically update
their short-term and long-term forecasts. The latest available datasets, for Benchmark Q1 2025 and Wood
Mackenzie Q2 2025, are referenced.
|
|
16.2.
|
Boric Acid
|
|
16.2.1.
|
Boric Acid Price Basis for the
Project
|
|
16.2.2.
|
Boron Supply and Demand
|
|
|
◾ |
Sodium borate compounds or other minerals that may be
refined (i.e., sodium borate and non-sodium-boric acid) or calcine (anhydrous sodium borate and boric acid);
|
|
|
◾ |
Other downstream specialty forms, including high-purity
boric acid such as nuclear grade and pharmaceutical grade, borate-derived compounds such as zinc borate, etc.
|
|
Rhyolite Ridge Lithium-Boron Project
|
S-K 1300 Technical Report Summary
|
|
Material
|
Formula
|
B2O3 (%)
|
||||
|
Refined chemicals
|
||||||
|
Sodium borates
|
Borax pentahydrate
|
Na2O•2B2O3•5H2O
|
49
|
|||
|
Borax decahydrate
|
Na2O•2B2O3•10H2O
|
37
|
||||
|
Non-sodium borates
|
Boric acid
|
B(OH)3
|
56
|
|||
|
Anhydrous, fused
|
Anhydrous borax
|
Na2O•2B2O3
|
69
|
|||
|
Boric oxide
|
B2O3
|
99.9
|
||||
|
Mineral products
|
||||||
|
Sodium borates
|
Ulexite
|
Na2O•2CaO•5B2O3•16H2O
|
36-38
|
|||
|
Calcium borates
|
Colemanite
|
2CaO•3B2O3•5H2O
|
33-42
|
|||
|
Analysis and Unit of Measure
|
Expected Specification
|
|
Boric oxide (B2O3), %
|
56.25-56.80
|
|
Boric acid (H3BO3), %
|
99.9-100
|
|
SO4, ppm
|
≤240
|
|
Chloride, ppm
|
<8
|
|
Iron, ppm
|
<5
|
|
Specification
|
ioneer
|
Rio Tinto
|
QuiBorax
|
Eti Maden
|
BOR
|
|
Boric oxide (B2O3), %
|
56.25 – 56.80
|
56.25-56.80
|
≥56.25
|
≥56.25
|
≥56.25
|
|
Boric acid (H3BO3), %
|
99.9 - 100.9
|
99.9-100.9
|
≥99.9
|
>99.9
|
≥99.9
|
|
SO4, ppm
|
≤ 240
|
≤250
|
≤300
|
≤500
|
≤80
|
|
Cl, ppm
|
≤ 8
|
≤10
|
≤200
|
≤10
|
≤10
|
|
Fe, ppm
|
≤ 5
|
≤4
|
≤4
|
≤7
|
≤5
|
|
Rhyolite Ridge Lithium-Boron Project
|
S-K 1300 Technical Report Summary
|
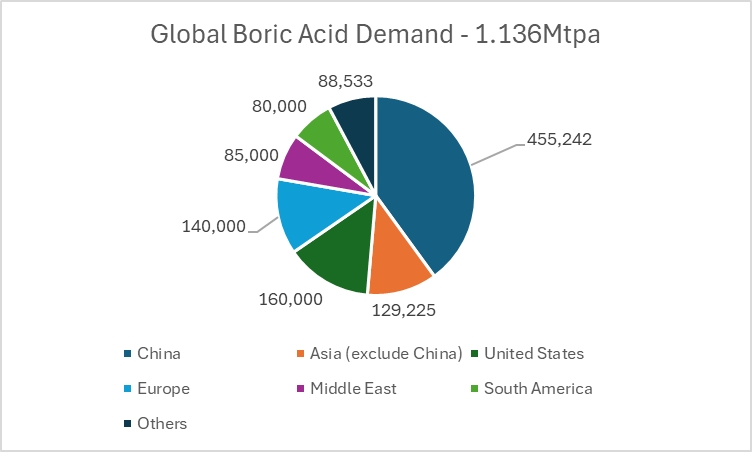
|
Rhyolite Ridge Lithium-Boron Project
|
S-K 1300 Technical Report Summary
|

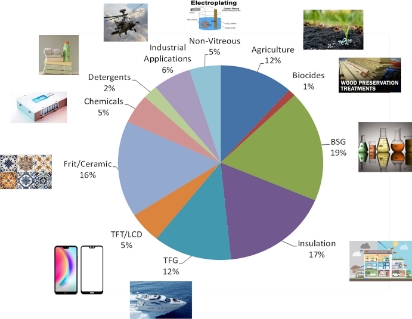
|
Rhyolite Ridge Lithium-Boron Project
|
S-K 1300 Technical Report Summary
|
|
16.2.3.
|
Boron Customer and Competitor
Analysis
|
|
|
◾ |
Turkey: Kirka, Balıkesir, and Kestelek;
|
|
|
◾ |
The southwestern region of the US;
|
|
|
◾ |
The Andes belt of South America;
|
|
|
◾ |
China: Liaoning and Qinghai; and
|
|
|
◾ |
The eastern region of Russia.
|
|
Rhyolite Ridge Lithium-Boron Project
|
S-K 1300 Technical Report Summary
|
|
|
2018
|
2019
|
2020
|
2021
|
2022
|
2023
|
2024
|
2025
|
2026
|
2027
|
2028
|
2029
|
|
|
Supply + ioneer + Fort Cady, kt
|
1,415
|
1,415
|
1,415
|
1,415
|
1,415
|
1,415
|
1,455
|
1,455
|
1,455
|
1,455
|
1,525
|
1,584
|
|
|
Supply + ioneer + Fort Cady @85% utilization, kt
|
1,203
|
1,203
|
1,203
|
1,203
|
1,203
|
1,203
|
1,237
|
1,237
|
1,237
|
1,237
|
1,296
|
1,347
|
|
|
Additional expansion (Etimine, Rio, ioneer), kt
|
0
|
0
|
0
|
0
|
0
|
0
|
40
|
0
|
0
|
0
|
70
|
129
|
|
|
Demand, kt
|
1,108
|
1,158
|
1,050
|
1,050
|
1,130
|
1,162
|
1,138
|
1,115
|
1,149
|
1,183
|
1,219
|
1,255
|
|
|
Market balance in % based on 85% utilization
|
92%
|
96%
|
87%
|
87%
|
94%
|
97%
|
92%
|
90%
|
93%
|
96%
|
94%
|
93%
|
|
|
Market balance in % based on 100% utilization
|
78%
|
82%
|
74%
|
74%
|
80%
|
82%
|
78%
|
77%
|
79%
|
81%
|
80%
|
79%
|
|
|
Market balance in kt based on 85% utilization, kt
|
95
|
45
|
153
|
153
|
73
|
41
|
99
|
122
|
88
|
54
|
77
|
92
|
|
|
Market balance in kt based on 100% utilization, kt
|
307
|
257
|
365
|
365
|
285
|
253
|
317
|
340
|
306
|
272
|
306
|
329
|
|
|
2030
|
2031
|
2032
|
2033
|
2034
|
2035
|
2036
|
2037
|
2038
|
2039
|
2040
|
|||
|
Supply + ioneer + Fort Cady, kt
|
1,615
|
1,598
|
1,638
|
1,635
|
1,617
|
1,639
|
1,666
|
1,588
|
1,638
|
1,643
|
1,658
|
|
|
|
Supply + ioneer + Fort Cady @85% utilization, kt
|
1,373
|
1,358
|
1,392
|
1,390
|
1,374
|
1,393
|
1,416
|
1,350
|
1,392
|
1,396
|
1,409
|
|
|
|
Additional expansion (Etimine, Rio, ioneer), kt
|
160
|
143
|
183
|
180
|
162
|
184
|
211
|
133
|
183
|
188
|
203
|
|
|
|
Demand, kt
|
1,293
|
1,332
|
1,372
|
1,413
|
1,455
|
1,499
|
1,544
|
1,590
|
1,638
|
1,687
|
1,738
|
|
|
|
Market balance in % based on 85% utilization
|
94%
|
98%
|
99%
|
102%
|
106%
|
108%
|
109%
|
118%
|
118%
|
121%
|
123%
|
|
|
|
Market balance in % based on 100% utilization
|
80%
|
83%
|
84%
|
86%
|
90%
|
91%
|
93%
|
100%
|
100%
|
103%
|
105%
|
|
|
|
Market balance in kt based on 85% utilization, kt
|
80
|
26
|
21
|
-23
|
-81
|
-105
|
-128
|
-240
|
-245
|
-290
|
-328
|
|
|
|
Market balance in kt based on 100% utilization, kt
|
322
|
266
|
266
|
222
|
162
|
140
|
122
|
-2
|
0
|
-44
|
-80
|
|
|
Rhyolite Ridge Lithium-Boron Project
|
S-K 1300 Technical Report Summary
|
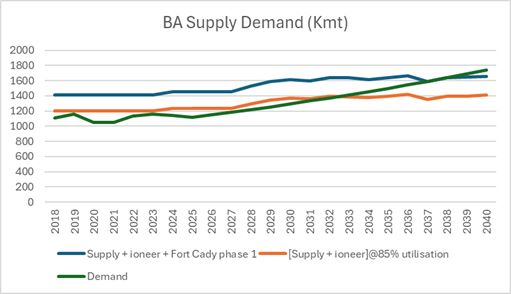
|
1.
|
The average annual production of boric acid for the Rhyolite Ridge Project is 101,975 short tons per annum (92,510 metric tons) between 2028 and 2040,
and 74,992 short tons per annum (68,031 metric tons) over the life of the mine.
|
|
2.
|
Fort Cady to commence phase 1 production with 49,604 short tons per annum (45,000 metric tons) in 2028 and 90,389 short tons per annum (82,000 metric
tons) onwards. ioneer does not expect Fort Cady to implement phase 2 onwards. This assumption is based on the fact that the borate market is opaque and challenging to enter
successfully without robust market intelligence and expertise. Fort Cady initiated pilot production in H2 2024, utilizing unproven commercial technology and achieving outstanding milestones from the
prefeasibility study, including funding and customer offtake agreements. The challenge is to finance their commercial plant, as it is extremely rare and difficult to obtain a bankable offtake agreement to
support the financing.
|
|
3.
|
Rio Tinto Jadar project boric acid production was excluded as the project does have the permit, with challenges to persuade the local stakeholders of
the environmental impact, which stalled the project in the past.
|
|
4.
|
The assumption is that additional volume equal to the deficit volume is added from 2035 onwards, potentially by ioneer, Eti Maden, or Rio Tinto.
|
|
5.
|
For demand, the compound annual growth rate (CAGR) from 2024 onwards will be 3% (historically, borate demand growth is relative to long-term global
GDP and typically higher than 3%). A conservative CAGR rate was applied for the demand forecast, as there were anomalies in the historical growth rate due to technology and economic disruptions.
|
|
6.
|
Volume is in metric tons, and kt in this figure means 1000 metric tons.
|
|
16.2.4.
|
Boron Price Forecast
|
|
◾
|
The increase in operating costs caused by the increased price of the European Union’s natural gas (as a result of the conflict in Ukraine);
|
|
Rhyolite Ridge Lithium-Boron Project
|
S-K 1300 Technical Report Summary
|
|
◾
|
Increased freight rates due to the reduced capacity of the Panama Canal and longer shipping routes to avoid the Red Sea;
|
|
◾
|
Eti Maden is entering higher-profitability downstream applications, such as boron carbide production;
|
|
◾
|
US import tariff global impact, affecting exports to the US and from the US to China.
|
|
|
Units
|
2006
|
2007
|
2008
|
2009
|
2010
|
2011
|
2012
|
2013
|
2014
|
2015
|
2016
|
2017
|
|
Historical
|
US$/st
|
517
|
454
|
496
|
578
|
585
|
640
|
744
|
825
|
739
|
694
|
627
|
638
|
|
US$/t
|
570
|
500
|
547
|
637
|
645
|
705
|
820
|
909
|
815
|
765
|
691
|
703
|
|
|
Forecast
|
US$/st
|
|
|
|
|
|
|
|
|
|
|
|
|
|
US$/t
|
|
|
|
|
|
|
|
|
|
|
|
|
|
|
|
Units
|
2018
|
2019
|
2020
|
2021
|
2022
|
2023
|
2024
|
2025
|
2026
|
2027
|
2028
|
2029
|
|
Historical
|
US$/st
|
635
|
652
|
590
|
553
|
829
|
807
|
769
|
|
|
|
|
|
|
US$/t
|
700
|
719
|
650
|
610
|
914
|
890
|
848
|
|
|
|
|
|
|
|
Forecast
|
US$/st
|
|
|
|
|
|
|
769
|
753
|
771
|
816
|
839
|
885
|
|
US$/t
|
|
|
|
|
|
|
848
|
830
|
850
|
899
|
925
|
976
|
|
|
|
Units
|
2030
|
2031
|
2032
|
2033
|
2034
|
2035
|
2036
|
2037
|
2038
|
2039
|
2040
|
|
|
Historical
|
US$/st
|
|
|
|
|
|
|
|
|
|
|
|
|
|
US$/t
|
|
|
|
|
|
|
|
|
|
|
|
||
|
Forecast
|
US$/st
|
885
|
975
|
975
|
1,043
|
1,134
|
1,157
|
1,179
|
1,270
|
1,270
|
1,270
|
1,270
|
|
|
US$/t
|
976
|
1,075
|
1,075
|
1,150
|
1,250
|
1,275
|
1,300
|
1,400
|
1,400
|
1,400
|
1,400
|
||
|
Rhyolite Ridge Lithium-Boron Project
|
S-K 1300 Technical Report Summary
|
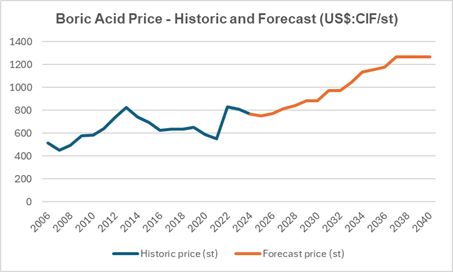
|
1.
|
ioneer price forecast (2024 to 2040) was based on supply and demand assumptions and shown as average prices.
|
|
2.
|
Regardless of supply shortages, price forecasts beyond 2037 are capped at US$1,270/st (US$1,400/t) and will not be revised upwards as
ioneer cannot predict unannounced expansions from existing and new suppliers that impact prices.
|
|
3.
|
x-axis in US$/st = short tons
|
|
◾
|
Datamyne data (global trade statistics) for prices and volumes;
|
|
◾
|
Country-specific import trade statistics (China, Korea, Japan, and Southeast Asia) for prices and volumes;
|
|
◾
|
Customer and distributor visits and surveys; and
|
|
◾
|
China Boron Association data.
|
|
16.3.
|
Contracts
|
|
Rhyolite Ridge Lithium-Boron Project
|
S-K 1300 Technical Report Summary
|
|
Company
|
Product
|
Duration
|
Volume (st)/year
|
|||||
|
(years)
|
Y1
|
Y2
|
Y3
|
Y4
|
Y5
|
|||
|
Ford Motors
|
TG Li-
carbonate
|
5
|
8,819
|
8,819
|
8,819
|
8,819
|
8,819
|
|
|
PPES
|
TG Li-
carbonate
|
5
|
4,409
|
4,409
|
4,409
|
4,409
|
4,409
|
|
|
EcoPro Innovation
|
TG Li-
carbonate
|
3
|
8,819
|
8,819
|
8,819
|
|
|
|
|
Dragonfly Energy
|
TG Li-
carbonate
|
3
|
276
|
276
|
276
|
|
|
|
|
Total contracted volume
|
TG Li-
carbonate
|
|
22,322
|
22,322
|
22,322
|
13,228
|
13,228
|
|
|
Dalian Jinma Boron
Technology
|
Boric acid
|
5
|
11,574
|
11,574
|
11,574
|
11,574
|
11,574
|
|
|
Kintamani Resources
|
Boric acid
|
3
|
10,031
|
14,551
|
19,731
|
|
|
|
|
Boron Bazar
|
Boric acid
|
3
|
3,307
|
3,996
|
4,519
|
|
|
|
|
Iwatani Corporation
|
Boric acid
|
3
|
5,842
|
12,787
|
20,944
|
|
|
|
|
Total contracted volume
|
Boric acid
|
|
30,755
|
42,908
|
56,769
|
11,574
|
11,574
|
|
|
◾
|
Lithium agreements:
|
| ☐ |
EcoPro Innovation Co. Ltd.’s offtake agreement dated June 30th, 2021, and volume amendment agreement dated February 14, 2022;
|
| ☐ |
Ford Motor Company offtake agreement dated July 21, 2022;
|
| ☐ |
Prime Planet Energy & Solutions, Inc. offtake agreement dated August 1, 2022; and
|
| ☐ |
Dragonfly Energy Corporation offtake agreement dated May 9, 2023.
|
|
◾
|
Boric acid agreements:
|
| ☐ |
Dalian Jinma Boron Technology Group Co., Ltd offtake agreement dated December 16, 2019;
|
| ☐ |
Iwatani Corporation sales/distributor agreement dated July 15, 2020, and Korean territory addition amendment in September 2024;
|
| ☐ |
Kintamani Resources Pte Ltd sales/distributor agreement dated April 20, 2020; and
|
| ☐ |
Boron Bazar Ltd sales/distributor agreement dated April 20, 2020.
|
|
Rhyolite Ridge Lithium-Boron Project
|
S-K 1300 Technical Report Summary
|
|
17.
|
ENVIRONMENTAL STUDIES, PERMITTING, AND PLANS, NEGOTIATIONS, OR AGREEMENTS WITH LOCAL INDIVIDUALS OR GROUPS
|
|
17.1.
|
Environmental Studies
|
|
17.1.1.
|
Baseline Studies
|
|
-
|
Air quality impact assessment;
|
|
-
|
Aquatic resources;
|
|
-
|
Biological resources;
|
|
-
|
Cultural resources;
|
|
-
|
Geochemistry;
|
|
-
|
Geology and mineral resources;
|
|
-
|
Groundwater;
|
|
-
|
Land use, transportation, and access;
|
|
-
|
Paleontology;
|
|
-
|
Recreation;
|
|
-
|
Socioeconomics;
|
|
-
|
Soils and rangeland;
|
|
-
|
Surface water resources;
|
|
-
|
Visual resources.
|
|
|
17-1 |
30 SEPTEMBER 2025
|
|
Rhyolite Ridge Lithium-Boron Project
|
S-K 1300 Technical Report Summary
|
|
Baseline Report
|
Prepared
By
|
Study Area
|
||
|
Air quality impacts assessment
|
Trinity
|
Project area and adjacent airsheds potentially impacted by emissions associated with Project construction and operation
|
||
|
Aquatic resources delineation
|
Stantec
|
Land in the northern portion of the Fish Lake Valley, heading southeast into the Silver Peak Range, bounded along its eastern edge
by Rhyolite Ridge and including land within the Project area
|
||
|
Biology
|
WestLand and EMS
|
Land encompassing and within various distances from the Project area including: Botanical (Project area), General wildlife
(0.25-mile radius), Nesting raptor (1-mile radius), Nesting golden eagle (10-mile radius). Land along the access road
|
||
|
Cultural resources
|
WestLand and EMS
|
Land encompassing and immediately surrounding the Project area, including land along the access road
|
||
|
Geochemistry
|
Piteau
|
Land encompassing and immediately surrounding the Project area
|
||
|
Geology and mineral resource
|
NewFields
|
Land encompassing and immediately surrounding the Project area
|
||
|
Groundwater
|
Piteau
|
Land encompassing and immediately surrounding the Project area
|
||
|
Land use, transportation, and access
|
NewFields
|
Land encompassing and immediately surrounding the Project area, including the main access points to the Project area
|
||
|
Paleontological resource
|
Noble, P. (submitted to EMS)
|
Land encompassing immediately surrounding the Project area including: formerly proposed powerline route extending west from the
town of Silver Peak to Cave Spring, and a 7-square mile area on the West side of Rhyolite Ridge
|
||
|
Recreation
|
NewFields
|
Land encompassing immediately surrounding the Project area including: Silver Peak wilderness study area, lands with wilderness
characteristics, and two recreational management areas
|
||
|
Socioeconomic
|
NewFields
|
Esmeralda, Mineral, and Nye counties in Nevada and Inyo County in California
|
||
|
Soils and rangeland
|
NewFields
|
Land encompassing immediately surrounding the Project area including land along the access road
|
||
|
Surface water resources
|
NewFields
|
Land encompassing immediately adjacent to and downstream of the Project area, as well as land within a 5-mile radius of the
Project area and land along the access road
|
||
|
Visual resources
|
NewFields
|
Land encompassing immediately surrounding the Project area
|
|
|
17-2 |
30 SEPTEMBER 2025
|
|
Rhyolite Ridge Lithium-Boron Project
|
S-K 1300 Technical Report Summary
|
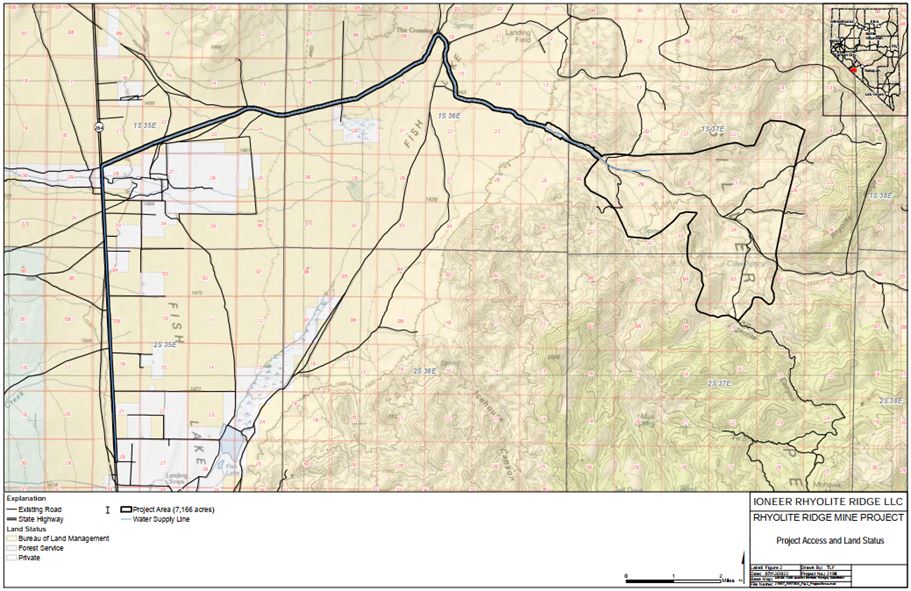
|
|
17-3 |
30 SEPTEMBER 2025
|
|
Rhyolite Ridge Lithium-Boron Project
|
S-K 1300 Technical Report Summary
|
|
17.1.2.
|
Environmental and Social Impact Assessment
|
|
17.1.2.1.
|
Air Quality and Climate Change
|
|
17.1.2.2.
|
Cultural Resources
|
|
17.1.2.3.
|
Environmental Justice
|
|
17.1.2.4.
|
Geology and Minerals
|
|
17.1.2.5.
|
Hazardous Materials and Solid Waste
|
|
|
17-4 |
30 SEPTEMBER 2025
|
|
Rhyolite Ridge Lithium-Boron Project
|
S-K 1300 Technical Report Summary
|
|
17.1.2.6.
|
Land Use and Realty
|
|
17.1.2.7.
|
Livestock Grazing
|
|
17.1.2.8.
|
Native American Traditional Values
|
|
17.1.2.9.
|
Recreation
|
|
|
17-5 |
30 SEPTEMBER 2025
|
|
Rhyolite Ridge Lithium-Boron Project
|
S-K 1300 Technical Report Summary
|
|
17.1.2.10.
|
Social and Economic Values
|
|
17.1.2.11.
|
Soil Resources
|
|
17.1.2.12.
|
Threatened and Endangered Species
|
|
17.1.2.13.
|
Transportation and Access
|
|
|
17-6 |
30 SEPTEMBER 2025
|
|
Rhyolite Ridge Lithium-Boron Project
|
S-K 1300 Technical Report Summary
|
|
17.1.2.14.
|
Vegetation Resources
|
|
17.1.2.15.
|
Visual Resources
|
|
17.1.21.16.
|
Water Resources
|
|
17.1.2.17.
|
Wetland and Riparian Resources
|
|
|
17-7 |
30 SEPTEMBER 2025
|
|
Rhyolite Ridge Lithium-Boron Project
|
S-K 1300 Technical Report Summary
|
|
17.1.2.18.
|
Wildlife Resources
|
|
17.1.2.19.
|
Wild Horses and Burros
|
|
17.1.3.
|
Air Quality Impact Assessment
|
|
17.1.4.
|
Biology
|
|
|
17-8 |
30 SEPTEMBER 2025
|
|
Rhyolite Ridge Lithium-Boron Project
|
S-K 1300 Technical Report Summary
|
|
-
|
The U.S. Geological Survey National Southwest Regional Gap Analysis Project vegetation communities within the
botanical survey areas were field verified and reclassified as five vegetation communities comprising 96 percent of the surveyed areas: Inter-Mountain Basins Mixed Salt
Desert Scrub; Great Basin Pinyon-Juniper Woodland, Great Basin Xeric Mixed Sagebrush Shrubland; Inter-Mountain Basins Cliff and Canyon, and agriculture.
|
|
-
|
Five dominant ecological sites were field verified within the Project areas: Cobbly Loam 5-8” P.Z.; R029XY036NV;
Shallow Calcareous Loam 8-12” P.Z.; R029XY008NV; Loamy 5-8” P.Z.; R029XY017NV; Loamy Slope 3-5” P.Z.; R029XY033NV; and Shallow Calcareous Slope 8- 12” P.Z.; R029XY014NV.
|
|
-
|
Eight subpopulations of Tiehm’s buckwheat were mapped within the Project area. Subpopulation 8 consists of four
individuals (WestLand, 2023). There was an herbivory event in 2020 that impacted individual plants in all subpopulations. The total number of plants was estimated to be
24,916, during the 2023 field investigation. Collectively, the subpopulations occupy approximately 10 acres. The distribution of plant size classes indicates a stable
demographic structure across all subpopulations. The viability of the seeds obtained during seed collection was 16 percent. Genetic analysis indicated a small degree of
genetic distinction between Tiehm’s buckwheat, and the three other buckwheat species sampled. No other BLM sensitive species or USFWS endangered species plants were
observed within the Project area.
|
|
-
|
No pygmy rabbits or pygmy rabbit signs (i.e., burrows, scat, tracks, dust baths, runways) were found in the
Project area. No potential pygmy rabbit habitat is present within the Project area.
|
|
-
|
No burrowing owls responded to the broadcast calls. No burrowing owls or their signs (i.e., pellets, feathers,
whitewash, scat, and tracks) were observed in the Project area. Potentially suitable nesting habitat is present in the lower elevations of the westernmost portion of the
Project area, primarily below 1,829 m (6,000 ft) in elevation.
|
|
-
|
No springsnails, a Nevada Natural Heritage Program at-risk species, were present in the springs within the Project
area.
|
|
-
|
A total of 11 BLM sensitive species were observed during the general wildlife surveys: Brewer’s sparrow;
loggerhead shrike; greater sage-grouse; pinyon jay; Merriam’s kangaroo rat; pale kangaroo mouse; juniper titmouse; long-nosed leopard lizard; desert horned lizard; Great
Basin collared lizard; and bighorn sheep. Golden eagles were observed during the aerial raptor surveys.
|
|
-
|
Nine species of bats were recorded within the Project area, all of which are BLM sensitive species. The Project
area provides both foraging and day-roosting habitat for bats. The springs and associated riparian vegetation within 0.4 km (0.25 mile) of the Project area provide
sources of water and concentrated foraging.
|
|
-
|
One active golden eagle nest and 21 unoccupied nests were recorded within the 16 km (10 mile) buffer surrounding
the Project area. No other raptor nests were active within 1.6 km (1 mile) of the Project area.
|
|
-
|
No species or habitat protected under the Endangered Species Act (ESA) were present within the Project area at the time of the field investigations. However, in December 2022 the USFWS listed Tiehm’s buckwheat as an endangered species and designated critical habitat for the species, which is within the Project area. Areas occupied by Tiehm’s buckwheat, and the area proposed for critical habitat designation, are a relatively small portion of the currently delineated area of mineralization. |
|
|
17-9 |
30 SEPTEMBER 2025
|
|
Rhyolite Ridge Lithium-Boron Project
|
S-K 1300 Technical Report Summary
|
|
-
|
Two occurrences of sagebrush cholla, a BLM sensitive species plant, were recorded: 1) in the southern portion of
the OPA; and 2) in the access road and infrastructure corridor.
|
|
-
|
One noxious weed species was recorded in the access road and infrastructure corridor: Saltcedar.
|
|
17.1.5.
|
Archaeological and Paleontological Studies
|
|
-
|
One-hundred and eighty-four sites are recommended as not eligible for listing on the National Register of
Historic Places.
|
|
-
|
One site is determined as eligible for listing on the NRHP under Criteria A, C, and D.
|
|
-
|
Twenty-four sites are determined as eligible for listing on the NRHP under Criterion D.
|
|
-
|
Thirteen sites are recommended as unevaluated for listing on the National Register of Historic Places pending
subsurface testing.
|
|
-
|
Six fossiliferous units that had potential paleontological significance were identified within the study area
including: Wyman Formation; Campito Formation; Poleta Formation; Harkless Formation; Mule Spring Limestone; and Esmeralda Formation and equivalents, which contains
Tertiary Sedimentary (TS) units 3-6.
|
|
-
|
One fossil locality of significance was located along what was the Project’s formerly proposed power line route,
which occurs in outcrops on the south side of Coyote Road, just outside Silver Peak.
|
|
-
|
Several small pieces of petrified wood were observed during the study area transects, but the occurrence is of
fairly low density; no large concentrations were observed that may be indicative of a larger log weathering out.
|
|
-
|
No vertebrate fragments were found in the Project activities area during the field survey on any of the
transects through the surveyed localities.
|
|
-
|
Several possible fossil imprints were observed in a pebbly sandstone, but it was not clear if these were the
molds of mollusks, or if they were weathered out mud rip-up clasts.
|
|
-
|
No beds were observed that were facies equivalent to the coal-bearing lithology found in the Coaldale area,
which contain abundant fossil floras.
|
|
|
17-10 |
30 SEPTEMBER 2025
|
|
Rhyolite Ridge Lithium-Boron Project
|
S-K 1300 Technical Report Summary
|
|
-
|
No high density fossil localities were encountered in the Project activities area during the various
transects through the Esmeralda equivalent units at surveyed localities.
|
|
-
|
The Cambrian locality has some beds of limestone with well-preserved marine invertebrates, including
archaeocyathids; however, there are better exposures of these same units, just north of the Project area, from which a high density of fossils has been reported.
|
|
17.1.6.
|
Geochemistry
|
|
-
|
Testing was completed for 14 different overburden samples and one ore sample.
|
|
-
|
The overburden and ore samples had a range of acid-base accounting and metals leaching characteristics.
|
|
-
|
The clay and carbonate marl units generally have significant acid neutralization potential.
|
|
-
|
Other units have some acid generating potential, such as the tertiary breccia, while several units have
variable acid-base accounting characteristics, such as the gritstones and mixed lacustrine units.
|
|
-
|
Materials predicted to be acid generating by static acid-base accounting (ABA) testing developed acidic
conditions relatively quickly in the humidity cell testing program.
|
|
-
|
Most materials have the potential for leaching elevated total dissolved solids and metals that are mobile at
alkaline pH values, particularly arsenic and antimony.
|
|
-
|
Process materials tested included samples of spent ore, sulphate salt residues, and neutralization filter
cake.
|
|
-
|
The spent ore sample contained residual acidity, with associated metal leaching, through the acidity and
metal leaching flushed from the sample over the long-term in the humidity cell test (HCT).
|
|
-
|
The sulphate salt residue sample was acidic, releasing elevated concentrations of total dissolved solids and
metals.
|
|
-
|
The neutralization filter cake material sample was classified as non-potentially acid generating and
contained some acid neutralization potential, though it also had potential to leach elevated concentrations of total dissolved solids, aluminum, boron, and lithium.
|
|
|
17-11 |
30 SEPTEMBER 2025
|
|
Rhyolite Ridge Lithium-Boron Project
|
S-K 1300 Technical Report Summary
|
|
-
|
A sample population was developed to include 125 overburden and 12 ore samples from 21 drillholes. Four
process material test work samples were included in the test work program.
|
|
-
|
The ore and overburden sample population was developed to represent the spatial distribution of materials
present in the approved quarry design, with samples collected from within 500 m (1640 ft) of the quarry perimeter.
|
|
-
|
The sample population structure broadly represented the distribution of lithological units contained in
overburden.
|
|
-
|
An additional 126 ore and waste rock samples were collected from 34 drill holes across the Phase 1 quarry
shell. Sampling was skewed towards materials located to the south and east of the existing HGL, Pre-2022 sample population.
|
|
-
|
The static test work was completed for all samples and included ABA by the Nevada Modified Sobek
Procedure, Net Acid Generation (NAG) testing, bulk elemental content, and carbon speciation.
|
|
-
|
Sample selection for short term meteoric water mobilization procedure (MWMP) leach testing and longer term
HCT testing was guided by static test work results, with emphasis given to samples with marginal Potential Acid Generation (PAG) characteristics and/or elevated
levels of As, Li, Mo, S, and/or Sb.
|
|
-
|
Samples selected for leachate testing relate to 23 additional exploration drill holes in previously
uncharacterized sectors of the future quarry, with samples representing major lithological units.
|
|
|
17-12 |
30 SEPTEMBER 2025
|
|
Rhyolite Ridge Lithium-Boron Project
|
S-K 1300 Technical Report Summary
|
|
17.1.7.
|
Socioeconomic Study
|
|
17.1.8.
|
Surface Water Resources
|
|
-
|
Land within the Project area and immediately adjacent to and downstream of Project components.
|
|
-
|
Land within a 8 km (5 mile) radius of the Project area.
|
|
-
|
Determining whether drainage features meet the requirements to be considered waters of the United States.
|
|
|
17-13 |
30 SEPTEMBER 2025
|
|
Rhyolite Ridge Lithium-Boron Project
|
S-K 1300 Technical Report Summary
|
|
-
|
Determining the ordinary high water mark of drainages within the survey areas.
|
|
-
|
Determining wetland occurrence in the survey area.
|
|
-
|
Mapping aquatic features to the U.S. Army Corps of Engineers current mapping standard.
|
|
-
|
The wetlands and drainages in the study area are all isolated waters or tributaries to the Fish Lake
Valley, which itself is an isolated basin.
|
|
-
|
No wetlands and/or drainages identified are anticipated to be jurisdictional by the United States Army
Corps of Engineers. and subject to Section 404 Clean Water Act permitting.
|
|
-
|
The delineation found no apparent interstate or foreign commerce connection with the aquatic resources
and no jurisdictional waters with a significant nexus to a traditional navigable water within the study area.
|
|
17.1.9.
|
Groundwater Resources
|
|
-
|
Under Phase 1 of the Project, the Quarry will be excavated to its lowest elevation of 5,490 ft amsl.
Dewatering or sump pumping is anticipated to stabilize slopes and manage quarry wall seepage.
|
|
-
|
Under Phase 1 of the Project, the North, South, and Quarry backfill OSFs will be established as
resource development continues. The southern portion of the Rhyolite Ridge mine will be backfilled with non-potentially acid generating overburden rock.
|
|
-
|
Dewatering rates associated with the Project are expected to range from ~227 lpm (~60 gpm) to a
maximum annual average of 2,460 lpm (650 gpm) occurring in 2033. The average dewatering flow through the life of the mine is expected to be about 1,041 km
(275 gpm).
|
|
|
17-14 |
30 SEPTEMBER 2025
|
|
Rhyolite Ridge Lithium-Boron Project
|
S-K 1300 Technical Report Summary
|
|
-
|
At the end of quarry mining (2040), simulated heads show changes in piezometric levels of more
than 122 m (400 ft) in the Project area due to quarry dewatering. In addition, there is a limited area of drawdown below the location of the modeled
production wells.
|
|
-
|
The Project has two water supply wells pumping at 4,000 acre-feet per year in the agricultural
area north of Dyer. A small area of drawdown forms below the new wells but is of limited extent. The maximum differential drawdown is less than 6 m (20
ft).
|
|
-
|
A quarry lake will form as a terminal sink upon closure of the mine. Lake levels are expected to
recover to approximately 1,721 m (5,646 ft) amsl elevation during the first 60 years post closure.
|
|
17.2.
|
Requirements and Plans for Waste and Tailings Disposal, Site
Monitoring, and Water Management During Operations and After Mine Closure
|
|
17.2.1.
|
Effluents
|
|
17.2.2.
|
Waste Management
|
|
17.2.3.
|
Air Quality
|
|
|
17-15 |
30 SEPTEMBER 2025
|
|
Rhyolite Ridge Lithium-Boron Project
|
S-K 1300 Technical Report Summary
|
|
17.2.4.
|
Stormwater Controls
|
|
-
|
Divert non-contact water (i.e., water that has not come in contact with disturbed ground or
composite materials) around the facilities and discharge to downstream water courses.
|
|
-
|
Convey sediment-laden runoff, as necessary, to sediment collection basins prior to discharging
to downstream water courses. It is anticipated that the flows from the South Diversion Channel of the SOSF could result in minor erosion to the
overburden on the native slopes at this outlet. A Sediment Basin has been designed to capture all runoff from the South Diversion Channel and slowly
release it to the natural drainage through perforated riser pipe.
|
|
-
|
Contain precipitation from a design storm event that has come in contact with composite
materials. During operations, runoff from the SOSF will be contained within the lined SOSF area. Flow will be directed to the underdrain system and
toward the outlet of the SOSF. Under normal operations, stormwater will be routed to the Underdrain Pond. If a storm produces more runoff than the
underdrain collection piping can handle, contact stormwater will overflow the SOSF outlet berm into the lined underdrain collection outlet channel,
where it will be directed to the Underdrain Pond.
|
|
17.2.5.
|
Tailings Management and Monitoring
|
|
17.2.6.
|
Tailings and Process Water Containment, Management, and Treatment
|
|
|
17-16 |
30 SEPTEMBER 2025
|
|
Rhyolite Ridge Lithium-Boron Project
|
S-K 1300 Technical Report Summary
|
|
17.3.
|
Permitting Requirements
|
|
Permit
|
Regulatory Agency
|
Permit Status
|
|||
|
Above Ground Storage Tanks Permit
|
State Fire Marshall
|
Pending Construction
|
|||
|
Air Quality Permit to Construct and Operate
|
NDEP, Bureau of Air Pollution Control
|
Issued
|
|||
|
Boiler and High-Pressure Vessels Operating Permit
|
Nevada Department of Business and Industry, Division of Industrial Relations, Mechanical Compliance Section
|
Pending Construction
|
|||
|
Certificate of Public Convenience and Necessity for Power Generation
|
Public Utilities Commission of Nevada
|
Issued
|
|||
|
Dam Safety Permit
|
Nevada Division of Water Resources (NDWR)
|
Issued
|
|||
|
Explosives Permit
|
US Department of Treasury, Bureau of Alcohol, Tobacco, Firearms, and Explosives
|
Pending Construction
|
|||
|
Fire and Life Safety
|
State Fire Marshall
|
Pending Construction
|
|||
|
Hazardous Materials Permit
|
State Fire Marshall
|
Pending Construction
|
|||
|
Hazardous Materials Storage Permit
|
Nevada Department of Public Safety, State Fire Marshall, and State Emergency Response Commission
|
Pending Construction
|
|
|
17-17 |
30 SEPTEMBER 2025
|
|
Rhyolite Ridge Lithium-Boron Project
|
S-K 1300 Technical Report Summary
|
|
|
Permit |
|
Regulatory Agency |
|
Permit Status |
|
Hazardous Waste Identification Number
|
US Environmental Protection Agency and NDEP, Bureau of Sustainable Materials Management
|
Issued
|
|||
|
Industrial Artificial Pond Permit
|
Nevada Department of Wildlife, Habitat Division
|
Pending Construction
|
|||
|
Mine Identification Number Request
|
Mine Safety and Health Administration
|
Issued
|
|||
|
Notice of Commencement of Mine Operations
|
Mine Safety and Health Administration
|
Pending Construction
|
|||
|
Notice of Commencement of Mine Operations
|
Nevada Department of Business Industry, Division of Industrial Relations, Mine Safety and Training Section
|
Pending Construction
|
|||
|
Mine Plan of Operations and Record of Decision,
including the NEPA analysis document and the
ESA Section 7 consultation with the USFWS
|
BLM
|
Issued. Under appeal2
|
|||
|
Mine Registry
|
Nevada Division of Minerals
|
Pending Construction
|
|||
|
Notice of Dam Construction
|
Nevada Division of Water Resources
|
Issued
|
|||
|
Permit to Appropriate Water
|
Nevada Division of Water Resources
|
See Note 3
|
|||
|
Permit for Package Wastewater Treatment Plant1
|
NDEP, Bureau of Water Pollution Control
|
Project likely to utilize a Septic System. This permit will be obtained if septic system not possible.
|
|||
|
Public Water System Permit
|
NDEP, Bureau of Safe Drinking Water
|
Pending Construction
|
|||
|
Project Notification
|
Esmeralda County
|
Completed
|
|||
|
Radio Communication Authorization
|
Federal Communications Commission
|
Should be obtained in 2025
|
|||
|
Reclamation Permit
|
NDEP, BMRR
|
Issued
|
|||
|
Road Maintenance Agreement
|
Esmeralda County Road Department
|
Completed
|
|||
|
Septic System Permit1
|
Nevada Division of Public Health (Fallon)
|
Pending Construction
|
|||
|
Water Pollution Control Permit
|
NDEP, BMRR
|
Issued
|
|
1.
|
Permit may not be required depending upon final project design
|
|
2.
|
The BLM issued the Record of Decision and approved the Mine Plan of
Operations. Subsequent to these actions, the Center for Biological Diversity, the Great Basin Resource Watch and the Western Shoshone Defense
Project filed three appeals. The first against the BLM concerning the adequacy of the analysis in the EIS, the second against the BLM regarding
the approval of the Mine Plan of Operations, stating that the Project violates the requirements under 43 Code of Federal Regulations (CFR) 3809,
and third against the USFWS regarding the adequacy of the Biological Opinion that was used by the USFWS to complete the Section 7 consultation
under the ESA.
|
|
3.
|
ioneer has acquired all the necessary water rights for the Project
through private-party contracts of existing water rights. Changes to the points of diversion and place and manner of use need to be obtained
through permit changes from the NDWR. Permits to Appropriate Water State of Nevada Permit No 92731 and Permit No 92732 were granted December 15,
2023, totaling 484 acre-feet per year which is sufficient to support construction activities. Application to Appropriate Water for Dewatering
around the Quarry prepared submitted on October 22, 2024. On February 12, 2025, NDWR notified White Mountain Ranch, LLC (WMR; applicant) of
protests filed by Esmeralda County, Center for Biological Diversity, Central Nevada Regional Water Authority, and Dan J. Peterson against the
granting of Applications 93949, 93950, and 93951. ioneer responded to protests on behalf of WMR and submitted responses on March 26, 2025. The
applications are currently pending a “ready for action” determination from the State Engineers office at which time further information may be
requested. The ready for action determination has been delayed and is expected in Q3 2025.
|
|
|
17-18 |
30 SEPTEMBER 2025
|
|
Rhyolite Ridge Lithium-Boron Project
|
S-K 1300 Technical Report Summary
|
|
17.3.1.
|
Environmental Protection Measures
|
|
|
17-19 |
30 SEPTEMBER 2025
|
|
Rhyolite Ridge Lithium-Boron Project
|
S-K 1300 Technical Report Summary
|
|
17.3.1.1.
|
Tiehm’s Buckwheat
|
|
17.3.1.2.
|
Air Quality
|
|
|
17-20 |
30 SEPTEMBER 2025
|
|
Rhyolite Ridge Lithium-Boron Project
|
S-K 1300 Technical Report Summary
|
|
17.3.1.3.
|
Cultural Resources
|
|
17.3.1.4.
|
Vibration Monitoring at Cultural Sites
|
|
17.3.1.5.
|
Paleontological Resources
|
|
17.3.1.6.
|
Erosion and Sediment Control
|
|
|
17-21 |
30 SEPTEMBER 2025
|
|
Rhyolite Ridge Lithium-Boron Project
|
S-K 1300 Technical Report Summary
|
|
17.3.1.7.
|
Water Resources
|
|
17.3.1.8.
|
Geology and Minerals
|
|
17.3.1.9.
|
Materials and Waste Management
|
|
17.3.1.10.
|
Hazardous Materials
|
|
|
17-22 |
30 SEPTEMBER 2025
|
|
Rhyolite Ridge Lithium-Boron Project
|
S-K 1300 Technical Report Summary
|
|
17.3.1.11.
|
Sanitary and Solid Waste Disposal
|
|
17.3.1.12.
|
Petroleum-Contaminated Soils
|
|
17.3.1.13.
|
Growth Media and Soil Salvage
|
|
17.3.1.14.
|
Monitoring Plan and Other Plans
|
|
17.3.1.15.
|
Wildlife and Avian Protection
|
|
|
- |
The open adit adjacent to the Project haul road may be closed in coordination with the Nevada Department of Wildlife and BLM.
|
|
|
- |
Operators would be trained to monitor the Project area for the presence of larger wildlife such as deer, antelope, and sheep. Mortality information would be collected and
reported, as necessary.
|
|
|
- |
ioneer would establish wildlife protection policies that prohibit feeding or harassment of wildlife within the Project area boundary.
|
|
|
17-23
|
30 SEPTEMBER 2025
|
|
Rhyolite Ridge Lithium-Boron Project
|
S-K 1300 Technical Report Summary
|
|
|
- |
Following Project construction, areas of disturbed land no longer required for operations would be reclaimed as required by the BLM to promote the reestablishment of native plant
and wildlife habitat.
|
|
|
- |
Land clearing or other surface disturbance associated with the Project would be conducted outside of the avian breeding season, whenever feasible, to avoid potential destruction
of active nests or young birds in the area. When surface disturbance must occur during the avian breeding season (March 1 through July 31), a BLM-qualified biologist would survey the area prior to land clearing
activities in accordance with current BLM protocols. Survey results would be submitted to the BLM before surface disturbance occurs.
|
|
|
- |
Primary pond liners would consist of 80-mm high-density polyethylene single-sided textured geomembrane with the textured side up to facilitate wildlife egress.
|
|
|
- |
Avian exclusion measures (e.g., bird balls, netting, BirdXPellers) would be used where required. ioneer employees would check the avian exclusion measures and the fencing around
all ponds at least once per 12-hour shift or as specified in the permit. Ponds would be monitored and reclaimed at closure.
|
|
|
- |
The interior side slopes of the processing facility contact water pond are designed at 3H:1V with the exterior cut fill slopes designed at 2H:1V to ensure that there are no
shallow ‘mud-flat’ areas that could allow birds to wade, forage, and rest along the shore.
|
|
|
- |
ioneer would maintain a record of all mortalities (birds and bats) associated with permitted facilities.
|
|
|
- |
During all phases of the Project, all food, waste, and other trash would be placed in containers with lids or covers that can be closed to discourage scavenging by wildlife.
|
|
|
- |
Speed limits would be posted at 35 miles per hour (mph) on haul roads, 45 mph on access roads, and 25 mph on all other roads in the Project area.
|
|
|
- |
Powerlines would be designed to provide sufficient separation between phases and grounds to reduce the risk of electrocution for raptors, birds, and bats.
|
|
|
- |
The processing facility, mine, explosive storage area, and contact water ponds would be fenced to specifications outlined in the BLM Handbook
1741-1, as applicable. All fences would include double swing gates to allow for human access. ioneer would also coordinate with Nevada Department of Wildlife on fencing specifications. Avian and wildlife
protection measures would be in compliance with Industrial Artificial Pond Permit measures.
|
|
|
- |
Blasting would be performed during daylight hours.
|
|
17.3.1.16.
|
Noxious Weeds and Invasive Non-native Species
|
|
|
17-24
|
30 SEPTEMBER 2025
|
|
Rhyolite Ridge Lithium-Boron Project
|
S-K 1300 Technical Report Summary
|
|
17.3.1.17.
|
Public Safety and Accessibility
|
|
17.3.1.18.
|
Transportation and Access
|
|
17.3.1.19.
|
Visual Resources and Night Skies
|
|
17.3.1.20.
|
Fire Protection and Emergency Response
|
|
|
17-25
|
30 SEPTEMBER 2025
|
|
Rhyolite Ridge Lithium-Boron Project
|
S-K 1300 Technical Report Summary
|
| 17.4. |
Plans, Negotiations, or Agreements with Local Individuals or Groups
|
| 17.5. |
Descriptions of any Commitments to Ensure Local Procurement and Hiring
|
|
17.6.
|
Mine Closure Plans
|
|
|
17-26
|
30 SEPTEMBER 2025
|
|
Rhyolite Ridge Lithium-Boron Project
|
S-K 1300 Technical Report Summary
|
|
Project Facility
|
Closure Summary
|
|||
|
Quarry
|
A berm to prevent access to the quarry and warning signs will be constructed prior to decommissioning of the quarry fence. An all-terrain vehicle trail from
the country road to the quarry will remain accessible for quarry lake monitoring by project personnel. The northwestern portion of the quarry will be buttressed with backfill to ensure long-term slope stability
adjacent to the populations of Tiehm’s buckwheat. Diversion features will continue to redirect run-on from upgradient of the quarry into natural drainages, to the extent practical.
|
|||
|
Processing Plant
|
The processing plant and all associated infrastructure will be decommissioned and removed from the site. This area will be regraded to ensure appropriate
drainage, covered with a growth medium, and revegetated by seeding with native species. The area will be similar to pre-existing conditions.
|
|||
|
Spent Ore Storage Facility
|
The SOSF side slopes will be recontoured to remove the bench configuration. In general, the re-grading efforts will be completed to create a variable slope
angle with steeper gradients near the crest and flatter gradients near the toe. Some variability will be incorporated in order to add naturally appearing features, provide drainage courses, and create wildlife
habitat areas. The top surface will be sloped to promote runoff and prevent ponding of meteoric water. Surface runoff will be shed to the natural topography. Non-contact run-on surface flow upgradient of the
facility will continue to be directed around the perimeter by a diversion channel and will be released to natural drainages. The re-graded surface will be capped with an evapotranspiration cover system, composed of
a mixture of onsite alluvium and low-permeability clay materials excavated from the quarry, that will minimize percolation of meteoric water through the cover to negligible levels. The slopes will be vegetated to
further reduce the amount of recharge due to meteoric infiltration and to stabilize the cover system.
When chemical constituents of the water from the underdrain fall below regulatory limits, the underdrain pond liner system will be demolished; the pond will
be backfilled and/or graded to drain; and the underdrain collection system will be capped and covered. Long-term drainage of meteoric water will then report directly to the natural drainage.
|
|
|
17-27
|
30 SEPTEMBER 2025
|
|
Rhyolite Ridge Lithium-Boron Project
|
S-K 1300 Technical Report Summary
|
|
Project Facility
|
Closure Summary
|
|||
|
Overburden Storage Facilities
|
They will be reclaimed concurrently with active development. The cover will be vegetated with native plant species to reduce meteoric water infiltration and
to stabilize cover material. Diversion channels constructed around the facility will remain in place and continue to be used to convey run-on into the natural drainage course located downslope. Once the reclamation
is complete and no additional contact water is produced from the surfaces, the contact water diversion channels will be modified, and the contact water ponds will be reclaimed. The contact water ponds liner system
will be removed or perforated, and the pond will be backfilled, graded to drain to the north, and covered with growth media. The underdrain system will be capped and covered.
|
|||
|
Ancillary Facilities/Infrastructure
|
All applicable roads will be reclaimed at closure by ripping the surface to loosen the compacted soil, regraded, then seeded with an approved seed mix. Water
supply wells will be plugged and abandoned, and surface infrastructure and pipelines will be dismantled and removed from the site. All wells will be plugged. Tanks used for storage of potable and fire water will be
dismantled and removed from the site. Buried water lines will be capped, buried, and left in place. The premanufactured treatment facilities used to treat wastewater will be completely removed from the site at
closure. In the case where hazardous substances are identified in soils the contaminated areas will be remediated in accordance with applicable rules. The geomembrane lining will be buried in place with a minimum
cover of three feet. Any concrete foundations and/or pedestals will be broken, and the rubble buried with a minimum of three feet of cover. Power lines and associated infrastructure will be removed and recycled as
appropriate. Growth media stockpiles will be completely consumed by the reclamation process. The footprint of these areas will be reseeded once they are no longer in place.
|
|||
|
Other Closure Considerations
|
Ensure all chemicals (hazardous, toxic, flammable, etc.) are completely removed from the site and safely disposed. Mineral exploration and development drill
holes and wells will be abandoned. Retain access to long-term monitoring stations and project elements that will remain following closure. Assure that accumulations of precipitation received following closure are
accommodated in the fluid management system. All erosion protection will remain in place until deemed reclaimed and permanently stable from mine related activities. Regrade and contour all areas no longer needed
for long-term monitoring and access. Remove all building materials, fencing, signage, and stormwater features no longer needed.
|
|
17.6.1.
|
Closure Costs
|
|
|
17-28
|
30 SEPTEMBER 2025
|
|
Rhyolite Ridge Lithium-Boron Project
|
S-K 1300 Technical Report Summary
|
|
17.6.2.
|
Closure Schedule
|
|
|
- |
Appropriate procedures are in place to assure that all areas associated with the Project do not release contaminants that have the potential to degrade the waters of Nevada, and
the quarry is left in a manner that minimizes the impoundment of surface drainage (Nevada Revised Statute 445A.429).
|
|
|
- |
Spent ore effluent has been demonstrated to be non-acid generating and will not result in degradation of waters of the state (Nevada Revised Statute 445A.430)
|
| 17.7. |
QP’s Opinion on the Adequacy of Current Plans to Address Any Issues Related to Environmental Compliance, Permitting, and Local Individuals or
Groups
|
|
|
17-29
|
30 SEPTEMBER 2025
|
|
Rhyolite Ridge Lithium-Boron Project
|
S-K 1300 Technical Report Summary
|
|
18.
|
CAPITAL AND OPERATING COSTS
|
|
18.1.
|
Capital Cost Estimate
|
|
18.1.1.
|
Basis of Capital Cost Estimate
|
|
Area
|
Engineering
Responsibility
|
Equipment Sizing and
Pricing Responsibility
|
Bulk Material Take-off
Responsibility
|
Estimate
Development
or Compilation
|
|
|
Mine
|
Golder
|
Golder/Fluor Estimating
|
Golder
|
Fluor
|
|
|
Spent ore facility
|
NewFields
|
NewFields/Fluor Estimating
|
NewFields
|
Fluor
|
|
|
Processing facilities
|
Fluor
|
Fluor
|
Fluor
|
Fluor
|
|
|
Lithium hydroxide facility
|
AtkinsRéalis
|
AtkinsRéalis
|
AtkinsRéalis
|
AtkinsRéalis
|
|
|
Sulfuric acid plant
|
AtkinsRéalis
|
AtkinsRéalis
|
AtkinsRéalis
|
Fluor
|
|
|
Power plant
|
AtkinsRéalis
|
AtkinsRéalis
|
AtkinsRéalis
|
Fluor
|
|
|
Balance of plant/common
|
Fluor/Golder
|
Fluor
|
Fluor/Golder/NewFields
|
Fluor
|
|
|
◾ |
Project scope of facilities;
|
|
|
◾ |
Project scope of services;
|
|
|
◾ |
Project work breakdown structure;
|
|
|
◾ |
Project schedule;
|
|
|
◾ |
Project execution plan;
|
|
|
◾ |
Schedule risk analysis report;
|
|
|
◾ |
Key design documents as of April 2024 including:
|
|
|
18-1
|
30 SEPTEMBER 2025
|
|
Rhyolite Ridge Lithium-Boron Project
|
S-K 1300 Technical Report Summary
|
|
|
◾ |
Design criteria (multiple engineering disciplines);
|
|
|
◾ |
Project block flow diagrams and process flow diagrams;
|
|
|
◾ |
Piping and instrumentation diagrams;
|
|
|
◾ |
3D model;
|
|
|
◾ |
Overall plot plan for processing facilities and sulfuric acid plant;
|
|
|
◾ |
Mechanical equipment list and general arrangement drawings;
|
|
|
◾ |
Supplemental sketches;
|
|
|
◾ |
Electrical single-line diagrams;
|
|
|
◾ |
Electrical equipment list;
|
|
|
◾ |
Instrumentation and valves tag items list;
|
|
|
◾ |
Detail engineering bulk material take-offs;
|
|
|
◾ |
NewFields surface water management report;
|
|
|
◾ |
Supply pricing for equipment and materials based upon best and latest available information (committed purchase order/contracts, firm quotations, budgetary quotations, or
historical/reference pricing);
|
|
|
◾ |
Engineering and procurement services effort hours and pricing based upon commercial contract(s) for the remaining engineering work from October 2024 onwards;
|
|
|
◾ |
Commissioning execution plan.
|
|
|
18-2
|
30 SEPTEMBER 2025
|
|
Rhyolite Ridge Lithium-Boron Project
|
S-K 1300 Technical Report Summary
|
|
18.1.2.
|
Summary of Capital Costs
|
|
Discipline
|
Total Cost
(US$ Million)
|
||
|
Direct field costs
|
|||
|
00
|
Earthwork & civil
|
52.2
|
|
|
10
|
Concrete
|
64.9
|
|
|
20
|
Structural steel
|
55.7
|
|
|
30
|
Architectural and buildings
|
5.2
|
|
|
40
|
Machinery and equipment
|
437.3
|
|
|
50
|
Piping
|
121.2
|
|
|
60
|
Electrical
|
120.0
|
|
|
70
|
Control systems
|
38.8
|
|
|
75
|
Communications and security
|
4.7
|
|
|
81
|
Painting and coatings
|
31.7
|
|
|
82
|
Insulation & refractory
|
21.7
|
|
|
83
|
Modularization
|
5.2
|
|
|
87
|
Scaffolding
|
8.3
|
|
|
Sub-total direct cost
|
966.9
|
||
|
Sub-total direct distributable
|
282.2
|
||
|
Sub-total indirect cost
|
82.1
|
||
|
Other Cost
|
|||
|
9800000
|
Escalation
|
65.8
|
|
|
9900000
|
Contingency (project @ risk)
|
107.3
|
|
|
9900000
|
Contingency (schedule risk analysis)
|
40.2
|
|
|
Sub-total other cost
|
213.3
|
||
|
Owner’s managed cost
|
|||
|
8500000
|
Owner’s project cost
|
91.5
|
|
|
Sub-total owner’s cost
|
91.5
|
||
|
Indicative total cost
|
1,636.0
|
||
|
Late Additions (order of magnitude)
|
31.9
|
||
|
Indicative total cost with late additions
|
1,667.9
|
||
|
|
18-3
|
30 SEPTEMBER 2025
|
|
Rhyolite Ridge Lithium-Boron Project
|
S-K 1300 Technical Report Summary
|
|
18.2.
|
Sustaining Capital Cost Estimate
|
|
18.2.1.
|
Sustaining Capital Costs and Basis
|
|
Category
|
Total Cost
(US$ Millions)
|
|
|
Process mobile equipment replacement cost
|
168.6
|
|
|
Mining mobile equipment replacement cost
|
252.2
|
|
|
Ground anchors and mine capital improvements
|
1,445.9
|
|
|
Spent ore capital improvements / updates
|
47.8
|
|
|
Machinery & equipment (sulfuric acid plant) capital improvements / updates
|
67.6
|
|
|
Machinery & equipment (power plant) capital improvements / updates
|
4.0
|
|
|
Leach optimization expansion
|
30.0
|
|
|
Lithium hydroxide plant
|
161.9
|
|
|
Vat leach/DCS replacement
|
40.0
|
|
|
Ranch Purchase
|
24.0
|
|
|
Total sustaining capital costs (excluding deferred stripping costs)
|
2,241.9
|
|
|
Deferred stripping costs during operation
|
798.3
|
|
|
Total sustaining capital costs (including deferred stripping costs)
|
3,040.2
|
|
|
18-4
|
30 SEPTEMBER 2025
|
|
Rhyolite Ridge Lithium-Boron Project
|
S-K 1300 Technical Report Summary
|
|
|
◾ |
Stripping costs during operation (stripping costs prior to operation are captured in capital cost estimate);
|
|
|
◾ |
Mining mobile equipment replacement cost;
|
|
|
◾ |
Ground anchors and quarry capital improvements;
|
|
|
◾ |
The steam turbine generator (STG) refurbishment every ten years;
|
|
|
◾ |
Processing mobile equipment replacement cost;
|
|
|
◾ |
Sulfuric acid plant machinery and equipment capital improvements/updates, which include allowance for sulfuric acid plant total bed catalyst replacement;
|
|
|
◾ |
Power plant capital improvements and updates;
|
|
|
◾ |
Highwall monitoring system modifications and expansion;
|
|
|
◾ |
Provision for the Stage II (Year 3) and Stage III (Year 9) expansion of the SOSF, including capacity increase allowance for subsequent expansions every six years thereafter;
|
|
|
◾ |
Dewatering infrastructure expansion as pit becomes deeper;
|
|
|
◾ |
The north overburden storage facility foundation and associated stormwater controls will be constructed in Production Year 3;
|
|
|
◾ |
Haul roads expansion;
|
|
|
◾ |
Leach Optimization Expansion;
|
|
|
◾ |
Vat leach Cranes Replacement;
|
|
|
◾ |
DCS Replacement;
|
|
|
◾ |
LiOH Plant expansion;
|
|
|
◾ |
Ranch Purchase.
|
|
18.3.
|
Operating Cost Estimate
|
|
18.3.1.
|
Basis of Operating Cost Estimate
|
|
|
◾ |
Personnel, which includes labour and outsourced services;
|
|
|
◾ |
Reagents, such as sulfur, lime, soda ash and gypsum;
|
|
|
◾ |
Fuels, which include diesel, gasoline and mine site lube and filters;
|
|
|
18-5
|
30 SEPTEMBER 2025
|
|
Rhyolite Ridge Lithium-Boron Project
|
S-K 1300 Technical Report Summary
|
|
|
◾ |
Miscellaneous operating supplies, which include operation supplies, packaging material and shipping;
|
|
|
◾ |
Maintenance materials and services;
|
|
|
◾ |
Other, which includes, sales taxes, insurance, software, and general administration.
|
|
18.3.1.1.
|
General
|
|
18.3.1.2.
|
Personnel Cost Estimate Basis
|
|
|
◾ |
Management and corporate staff - inputs by ioneer;
|
|
|
◾ |
Mine operations - inputs by ioneer, Caterpillar, Empire Southwest, and IMC;
|
|
|
◾ |
Processing facilities – inputs by ioneer, Fluor, and specifically for sulfuric acid plant by Elessent and AtkinsRéalis;
|
|
|
◾ |
Logistics and support operations – inputs by ioneer and respective contractors/suppliers;
|
|
|
◾ |
Sales and marketing – inputs by ioneer and consultants.
|
|
18.3.1.3.
|
Reagents
|
|
|
18-6
|
30 SEPTEMBER 2025
|
|
Rhyolite Ridge Lithium-Boron Project
|
S-K 1300 Technical Report Summary
|
|
18.3.1.4.
|
Fuel and Lubes
|
|
18.3.1.5.
|
Miscellaneous Operating Supplies and Product Transport
|
|
18.3.1.6.
|
Maintenance Materials and Services
|
|
18.3.1.7.
|
Other Costs
|
|
|
18-7
|
30 SEPTEMBER 2025
|
|
Rhyolite Ridge Lithium-Boron Project
|
S-K 1300 Technical Report Summary
|
|
18.3.2.
|
Summary of Operating Costs
|
|
Description
|
Total Cost
(US$ Million)
|
Average Cost per
Tonne RoM 1
(US$/MT RoM)
|
Percentage
(%)
|
|
|
Mine (excluding deferred stripping 2)
|
1,830.0
|
7.0
|
11.3
|
|
|
Process plant (excluding sales tax)
|
13,878.8
|
54.9
|
88.7
|
|
|
Total operating costs excluding sales tax
|
15,708.8
|
60.3
|
100.0
|
|
|
1. |
RoM = run-of-mine
|
|
|
2. |
Deferred stripping costs during operation are included in the sustaining capital costs as indicated in Table 18-3.
|
|
Description
|
Total Cost
(US$ Million)
|
Average Cost
per Tonne RoM 1
(US$/MT RoM)
|
Percentage
(%)
|
|
|
Personnel
|
2,210.6
|
8.5
|
14.1
|
|
|
Reagents (with freight)
|
8,404.7
|
32.3
|
53.5
|
|
|
Fuels
|
1,870.2
|
7.2
|
11.9
|
|
|
Misc operating supplies
|
1,132.8
|
4.4
|
7.2
|
|
|
Maintenance materials and services
|
2,189.4
|
8.4
|
13.9
|
|
|
Other costs
|
1,114.2
|
4.3
|
7.1
|
|
|
Deferred stripping costs2
|
(798.3)
|
(3.1)
|
(5.1)
|
|
|
Total operating costs including sales tax
|
16,123.5
|
61.9
|
||
|
Sales tax
|
(414.7)
|
(1.6)
|
(2.6)
|
|
|
Total operating costs excluding sales tax
|
15,708.8
|
60.3
|
100.0
|
|
|
1. |
RoM = run-of-mine
|
|
|
2. |
Deferred stripping costs during operation are included in the sustaining capital costs as indicated in Table 18-3.
|
|
|
18-8
|
30 SEPTEMBER 2025
|
|
Rhyolite Ridge Lithium-Boron Project
|
S-K 1300 Technical Report Summary
|
|
19.
|
ECONOMIC ANALYSIS
|
|
19.1.
|
Demonstration of Economic Viability
|
|
19.2.
|
Principal Assumptions
|
|
|
19-1
|
30 SEPTEMBER 2025
|
|
Rhyolite Ridge Lithium-Boron Project
|
S-K 1300 Technical Report Summary
|
|
Item
|
Unit
|
Parameter
|
||
|
General
|
||||
|
Metric Tons
(t)
|
Short Tons
(st)
|
|||
|
Ore mining rate
|
Million tons, average annual
|
3.2
|
3.5
|
|
|
Lithium carbonate equivalent (LCE) production rate
|
tons, average annual
|
19,276
|
21,248
|
|
|
Lithium carbonate production rate (Years 1-2)
|
tons, average annual
|
19,185
|
21,147
|
|
|
Lithium hydroxide production rate (Years 3+)
|
tons, average annual
|
21,897
|
24,137
|
|
|
Boric acid production rate
|
tons, average annual
|
68,031
|
74,992
|
|
|
Lithium reference price (carbonate and hydroxide)
|
US$ per tons, average annual
|
23,012
|
20,876
|
|
|
Boric acid reference price
|
US$ per tons, average annual
|
1,368
|
1,241
|
|
|
Life of mine
|
Years
|
82
|
||
|
Construction period
|
Months
|
38
|
||
|
Working Capital Assumptions
|
||||
|
Accounts receivable lithium carbonate
|
Days
|
50
|
||
|
Accounts receivable boric acid
|
Days
|
77
|
||
|
Accounts payable
|
Days
|
60
|
||
|
Tax Rates Assumed
|
||||
|
Federal corporate tax
|
%
|
21.00
|
||
|
Inflation reduction act 45(x) production tax credit
|
%
|
10.00
|
||
|
Nevada minerals tax
|
%
|
5.00
|
||
|
Depletion allowance
|
%
|
22.00
|
||
|
Nevada commerce tax
|
%
|
0.05
|
||
|
Nevada property tax rate
|
%
|
3.02
|
||
|
Assessed book value for property tax
|
%
|
35.00
|
||
|
Nevada modified business tax
|
%
|
2.00
|
||
|
Nevada sales tax
|
%
|
6.85
|
||
|
Other
|
||||
|
Inflation rate
|
%
|
None
|
||
|
Discount rate
|
%
|
8.0
|
||
|
Currency
|
US$
|
U.S. dollars
|
||
|
|
19-2
|
30 SEPTEMBER 2025
|
|
Rhyolite Ridge Lithium-Boron Project
|
S-K 1300 Technical Report Summary
|
|
19.3.
|
Cashflow Forecast
|
|
19.3.1.
|
Results of Economic Analysis
|
|
|
19-3
|
30 SEPTEMBER 2025
|
|
Rhyolite Ridge Lithium-Boron Project
|
S-K 1300 Technical Report Summary
|
|
Unit
(US$)
|
Total – Life of Quarry
|
|||
|
Revenue
|
||||
|
Lithium carbonate (ex-plant)
|
$000s
|
670,829
|
||
|
Lithium hydroxide
|
$000s
|
38,909,886
|
||
|
Boric acid (ex-plant)
|
$000s
|
7,598,497
|
||
|
Total revenue
|
$000s
|
47,179,212
|
||
|
Operating Costs
|
||||
|
Mine 1
|
$000s
|
1,829,976
|
||
|
Plant 1
|
$000s
|
13,878,833
|
||
|
Total operating cost
|
$000s
|
15,708,809
|
||
|
Non-Operating Costs
|
||||
|
Initial capital
|
$000s
|
1,667,860
|
||
|
Sustaining capital
|
$000s
|
2,241,965
|
||
|
Working capital
|
$000s
|
-
|
||
|
Closure costs
|
$000s
|
61,087
|
||
|
Capitalized deferred stripping
|
$000s
|
798,290
|
||
|
Total non-operating cost
|
$000s
|
4,769,202
|
||
|
Pre-tax cash flow
|
$000s
|
26,701,201
|
||
|
State and Federal Taxes
|
||||
|
Nevada minerals tax
|
$000s
|
1,340,181
|
||
|
Nevada sales tax
|
$000s
|
438,587
|
||
|
Nevada modified business tax
|
$000s
|
39,652
|
||
|
Nevada commerce tax
|
$000s
|
21,410
|
||
|
Nevada property tax
|
$000s
|
411,822
|
||
|
Total Nevada state tax
|
$000s
|
2,251,651
|
||
|
Federal income tax
|
$000s
|
844,388
|
||
|
Federal 45 (x) production tax credit
|
$000s
|
(167,503)
|
||
|
Total tax cost
|
$000s
|
2,928,536
|
||
|
Post-tax cash flow
|
$000s
|
23,772,665
|
||
|
|
1. |
General and administrative costs are included within “Mine” and “Plant” cost items.
|
|
|
19-4
|
30 SEPTEMBER 2025
|
|
Rhyolite Ridge Lithium-Boron Project
|
S-K 1300 Technical Report Summary
|
|
Item
|
Unit
|
Description
|
|
|
Revenue
|
US$ million
|
47,179
|
|
|
Pre-tax cash flow
|
US$ million
|
26,701
|
|
|
Post-tax cash flow
|
US$ million
|
23,773
|
|
|
Unlevered post-tax net present value
|
US$ million
|
1,888
|
|
|
Unlevered post-tax internal rate of return
|
%
|
16.8
|
|
|
Payback period
|
Years
|
10
|
|
|
Mine life
|
Years
|
82
|
|
|
7. |
The Rhyolite Ridge Project has closed a loan with the U.S. Department of Energy Loan Programs Office for US$996 million. The conditions for the first draw have not yet been
met. If the conditions are met, the levered post-tax internal rate of return of the Project would be 20.9%.
|
|
|
4. |
As further described in Section 19.3.3, production tax credit and net operating loss carry forwards are used to offset federal income tax to compute post-tax economic metrics.
|
|
|
19-5
|
30 SEPTEMBER 2025
|
|
Rhyolite Ridge Lithium-Boron Project
|
S-K 1300 Technical Report Summary
|
|
Description
|
Units
|
LoM Total
|
-3
|
-2
|
-1
|
1
|
2
|
3
|
4
|
5
|
6
|
7
|
||||||||||
|
Lithium Carbonate Production 1
|
['000 Mt]
|
38
|
16
|
22
|
-
|
|||||||||||||||||
|
|
['000 St]
|
42
|
18
|
25
|
-
|
|||||||||||||||||
|
Lithium Hydroxide Production 1
|
['000 Mt]
|
1,752
|
-
|
-
|
28
|
29
|
29
|
27
|
25
|
|||||||||||||
|
|
['000 St]
|
1,931
|
-
|
-
|
31
|
32
|
32
|
30
|
28
|
|||||||||||||
|
Boric Acid Production 1
|
['000 Mt]
|
5,579
|
41
|
56
|
48
|
95
|
114
|
167
|
175
|
|||||||||||||
|
['000 St]
|
6,149
|
45
|
62
|
53
|
104
|
125
|
184
|
193
|
||||||||||||||
|
Total Revenue 2
|
[US$ 000s]
|
47,179,212
|
301,720
|
461,919
|
635,418
|
694,856
|
715,065
|
775,279
|
760,858
|
|||||||||||||
|
Operating Costs - Mine
|
[US$ 000s]
|
1,829,976
|
26,606
|
27,104
|
73,949
|
62,928
|
36,937
|
67,752
|
54,465
|
|||||||||||||
|
Operating Costs - Plant
|
[US$ 000s]
|
13,878,833
|
134,434
|
162,741
|
179,418
|
189,648
|
191,298
|
193,081
|
194,869
|
|||||||||||||
|
Total Operating Costs
|
[US$ 000s]
|
15,708,809
|
161,039
|
189,845
|
253,368
|
252,576
|
228,235
|
260,833
|
249,333
|
|||||||||||||
|
Operating Cash Flow
|
[US$ 000s]
|
31,470,403
|
140,681
|
272,074
|
382,051
|
442,280
|
486,830
|
514,446
|
511,524
|
|||||||||||||
|
Initial Capital Expense
|
[US$ 000s]
|
1,667,860
|
36,177
|
332,135
|
658,096
|
641,452
|
||||||||||||||||
|
Sustaining Capital Expense
|
[US$ 000s]
|
2,241,965
|
82,556
|
131,926
|
102,249
|
35,640
|
18,650
|
55,007
|
59,144
|
|||||||||||||
|
Working Capital
|
[US$ 000s]
|
(0)
|
8,715
|
(6,747)
|
40,128
|
13,097
|
299
|
12,963
|
848
|
|||||||||||||
|
Capitalized Deferred Stripping
|
[US$ 000s]
|
798,290
|
42,588
|
54,475
|
11,978
|
22,751
|
36,421
|
6,806
|
||||||||||||||
|
Reclamation Expenditure
|
[US$ 000s]
|
61,087
|
||||||||||||||||||||
|
Total Non-Operating Costs
|
[US$ 000s]
|
4,769,202
|
36,177
|
332,135
|
658,096
|
775,312
|
179,654
|
154,354
|
71,488
|
55,369
|
67,971
|
66,798
|
||||||||||
|
Pre-Tax Cash Flow 3
|
[US$ 000s]
|
26,701,201
|
(36,177)
|
(332,135)
|
(658,096)
|
(634,631)
|
92,421
|
227,696
|
370,792
|
431,461
|
446,475
|
444,726
|
||||||||||
|
Nevada State Tax 4
|
[US$ 000s]
|
2,251,651
|
2,695
|
22,739
|
34,111
|
41,086
|
41,563
|
41,732
|
45,186
|
44,232
|
||||||||||||
|
Federal Income Tax 5
|
[US$ 000s]
|
676,885
|
(24,295)
|
(32,339)
|
(33,237)
|
(33,373)
|
(30,468)
|
18,127
|
||||||||||||||
|
Total Unlevered Cash Flow
|
[US$ 000s]
|
23,772,665
|
(36,177)
|
(332,135)
|
(660,791)
|
(657,370)
|
82,605
|
218,949
|
362,466
|
423,102
|
431,758
|
382,367
|
|
|
19-6
|
30 SEPTEMBER 2025
|
|
Rhyolite Ridge Lithium-Boron Project
|
S-K 1300 Technical Report Summary
|
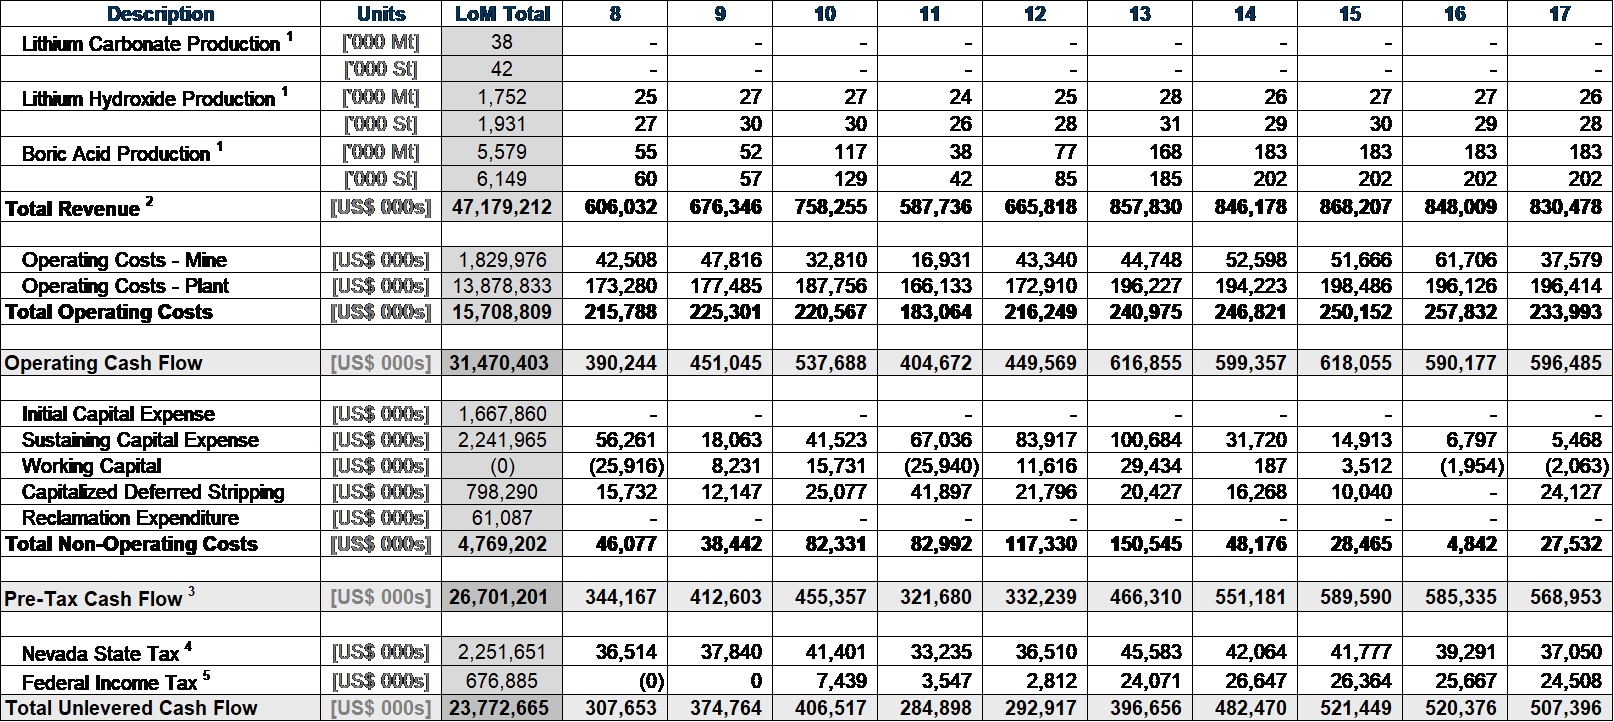
|
|
19-7
|
30 SEPTEMBER 2025
|
|
Rhyolite Ridge Lithium-Boron Project
|
S-K 1300 Technical Report Summary
|
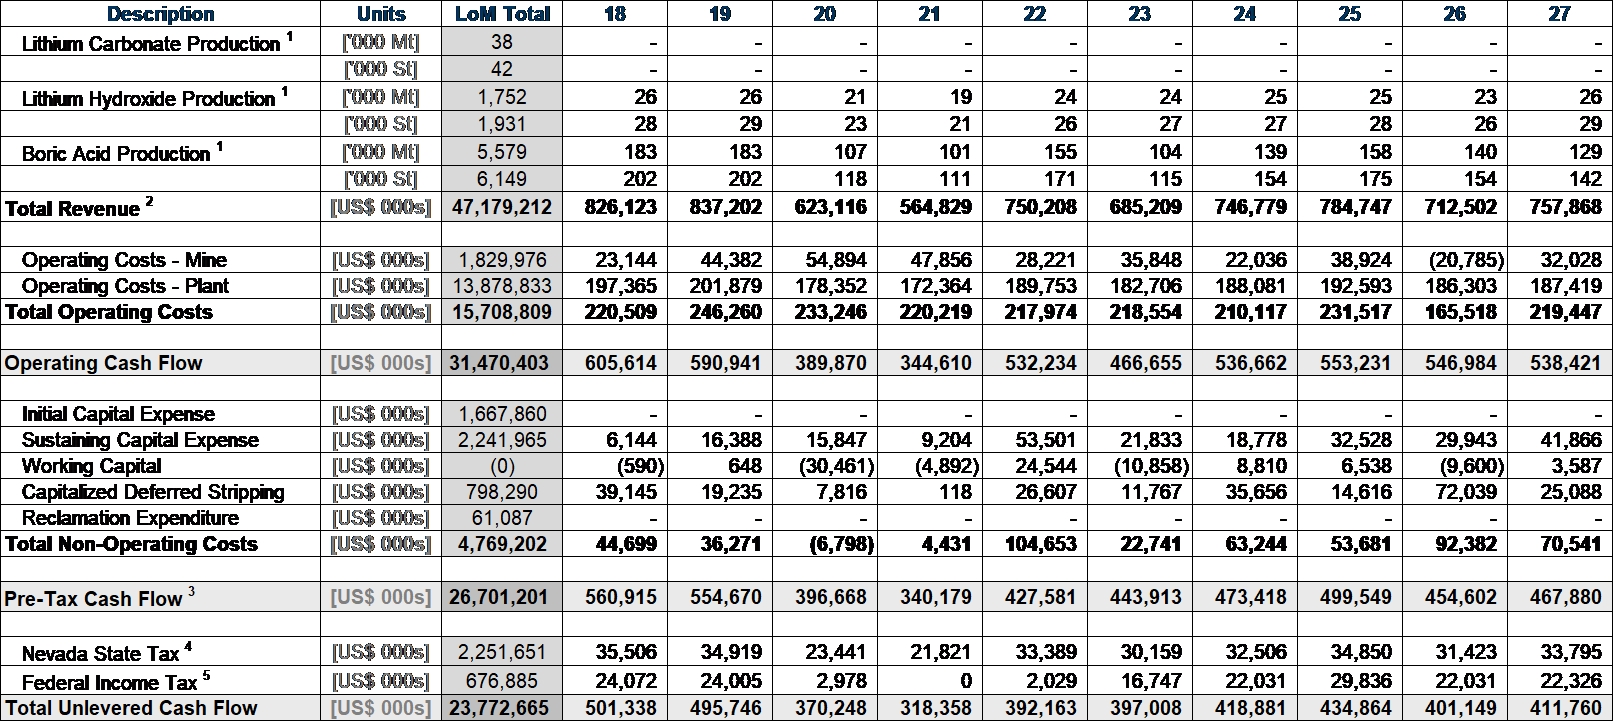
|
|
19-8
|
30 SEPTEMBER 2025
|
|
Rhyolite Ridge Lithium-Boron Project
|
S-K 1300 Technical Report Summary
|
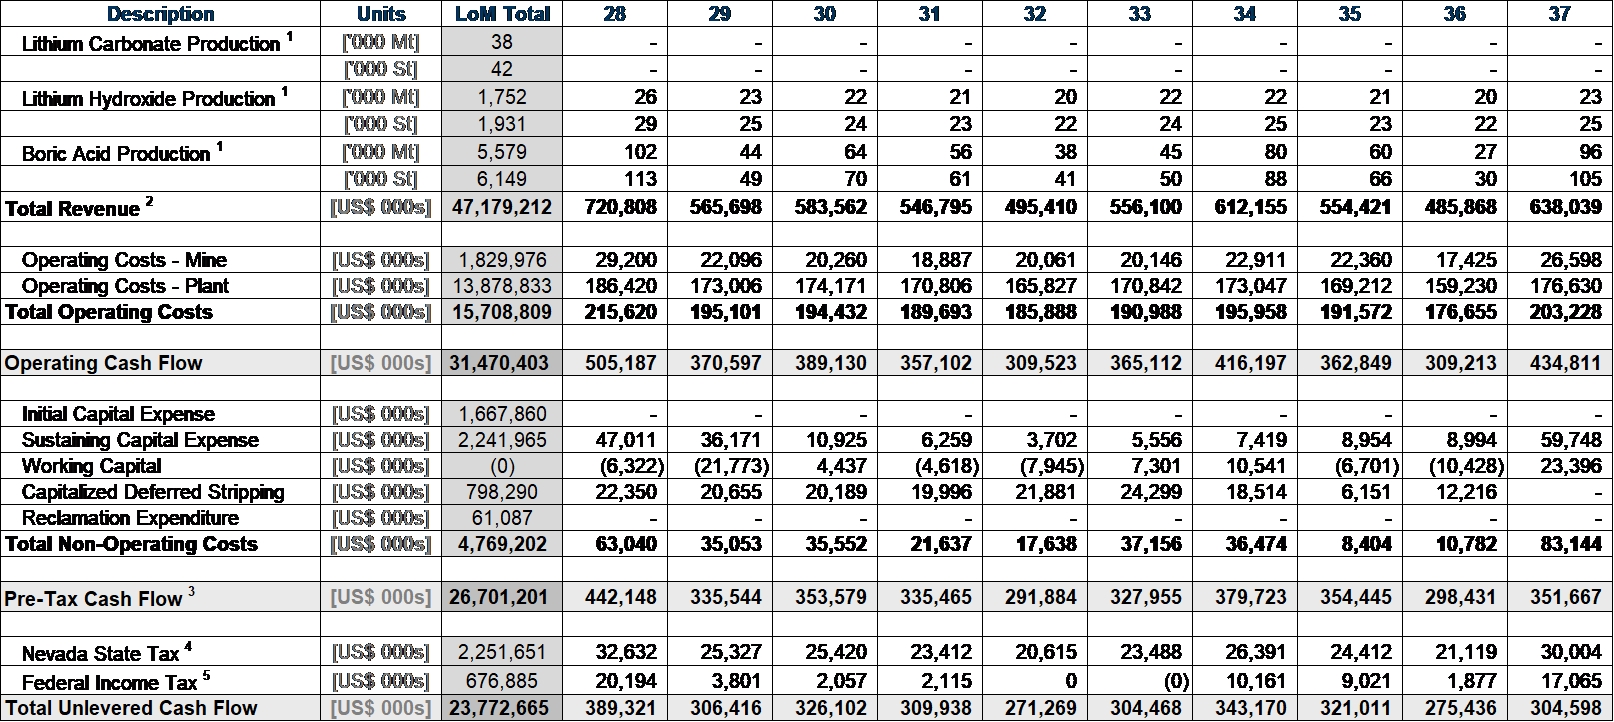
|
|
19-9
|
30 SEPTEMBER 2025
|
|
Rhyolite Ridge Lithium-Boron Project
|
S-K 1300 Technical Report Summary
|
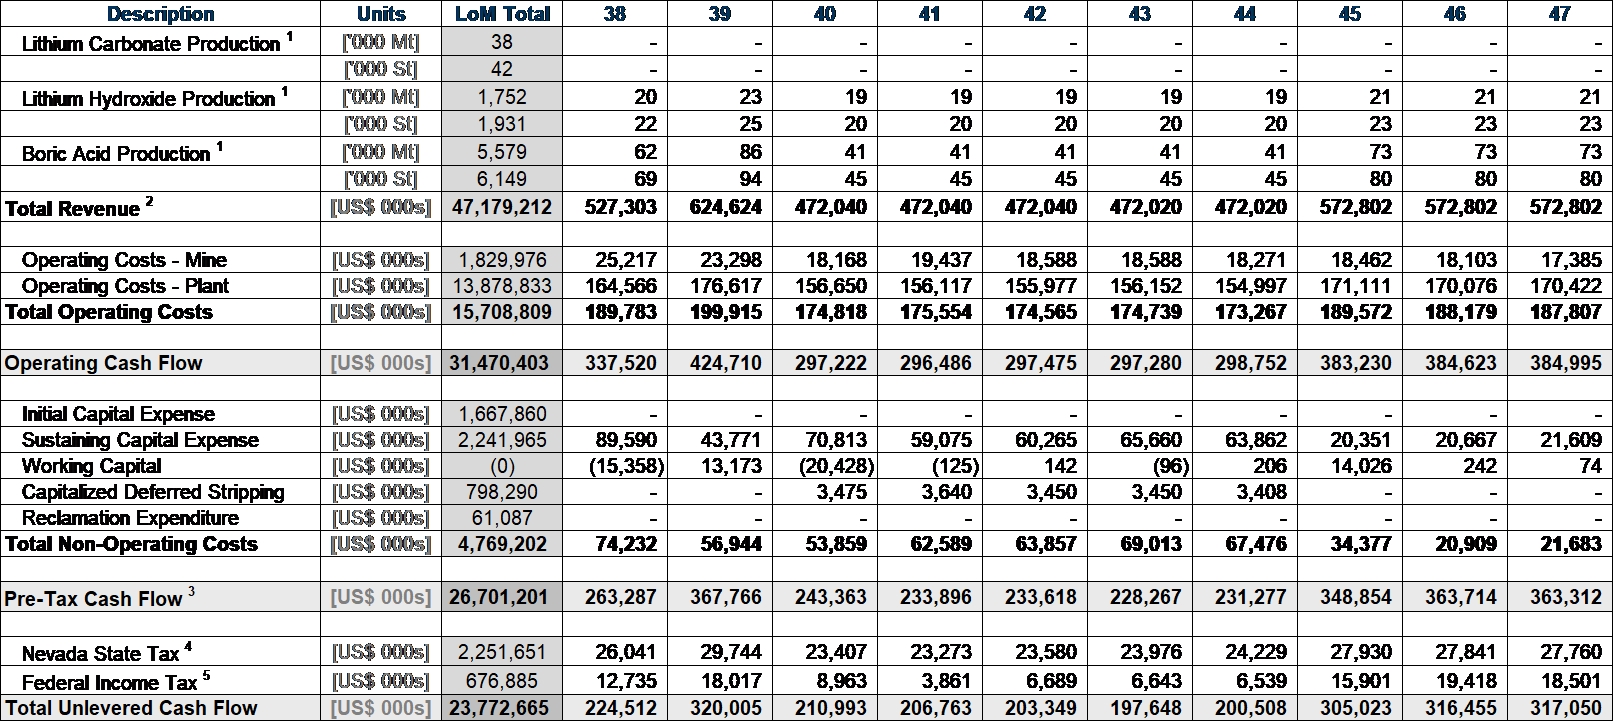
|
|
19-10
|
30 SEPTEMBER 2025
|
|
Rhyolite Ridge Lithium-Boron Project
|
S-K 1300 Technical Report Summary
|
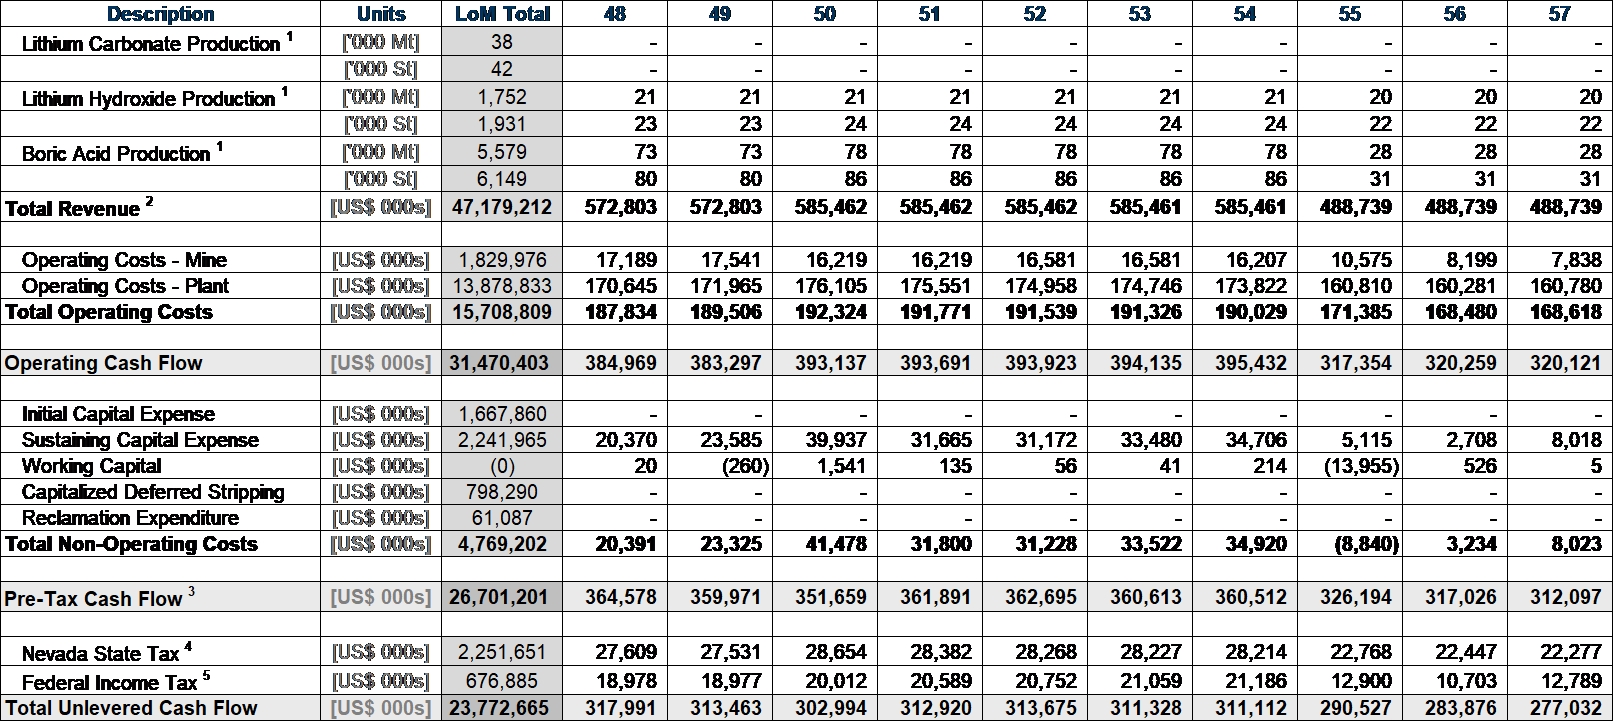
|
|
19-11
|
30 SEPTEMBER 2025
|
|
Rhyolite Ridge Lithium-Boron Project
|
S-K 1300 Technical Report Summary
|
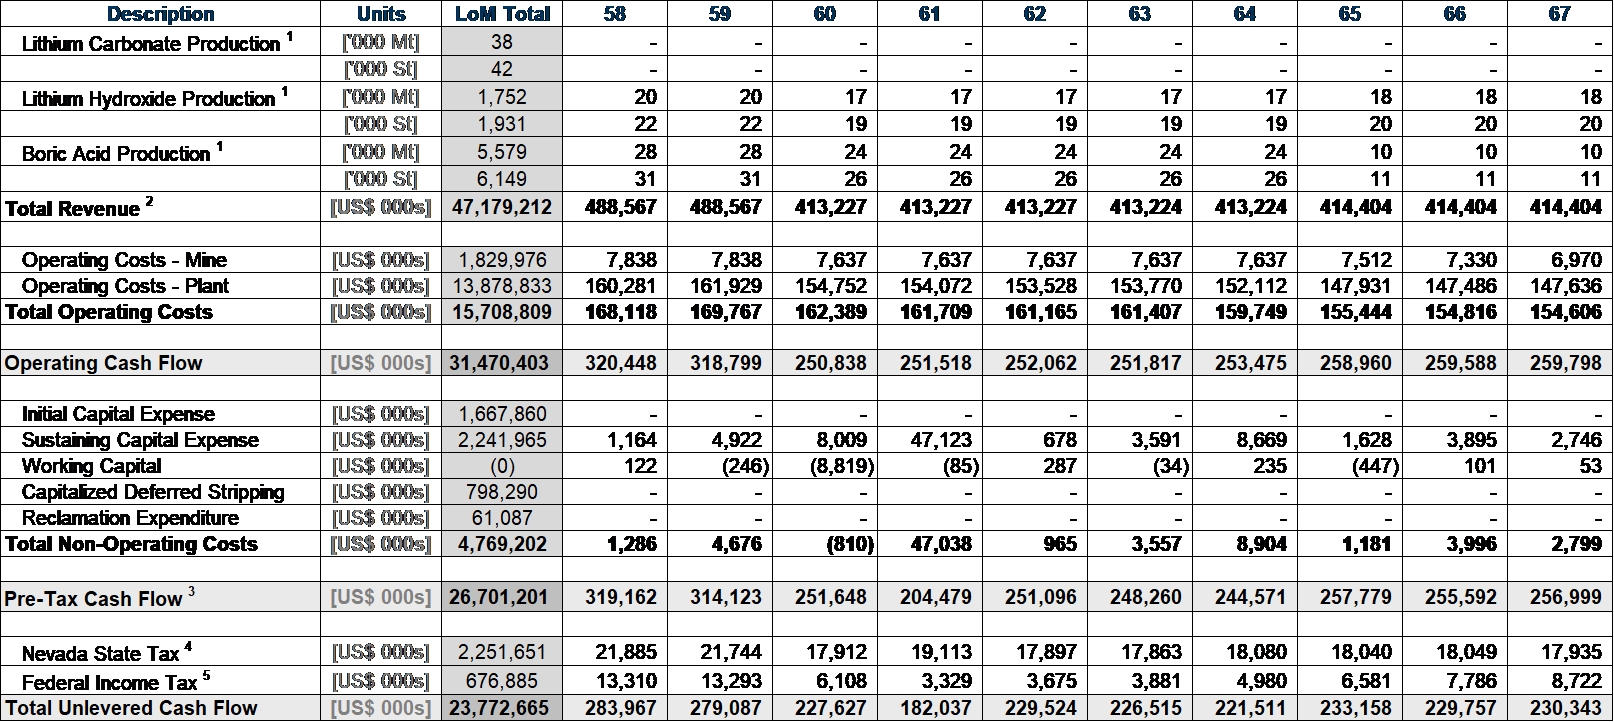
|
|
19-12
|
30 SEPTEMBER 2025
|
|
Rhyolite Ridge Lithium-Boron Project
|
S-K 1300 Technical Report Summary
|
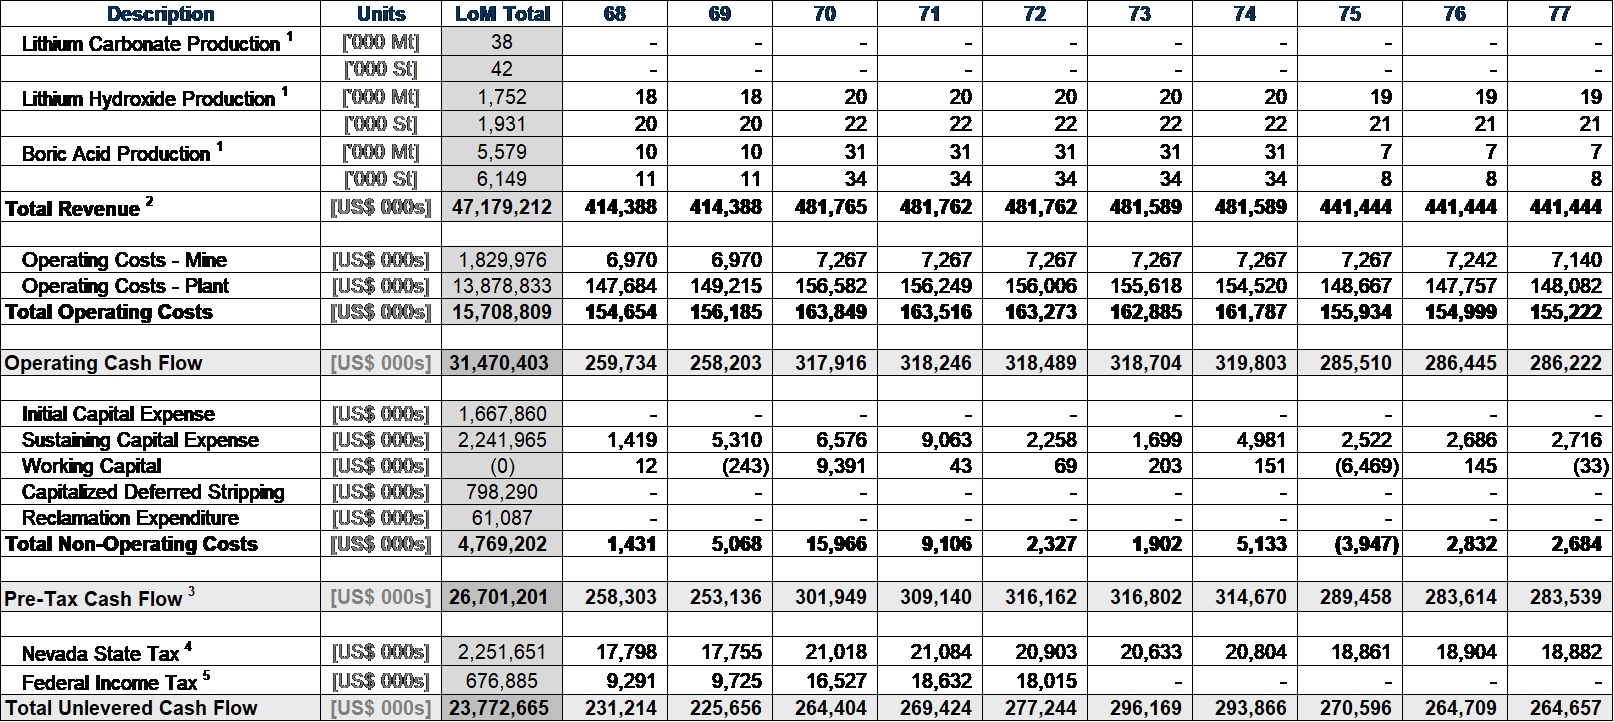
|
|
19-13
|
30 SEPTEMBER 2025
|
|
Rhyolite Ridge Lithium-Boron Project
|
S-K 1300 Technical Report Summary
|
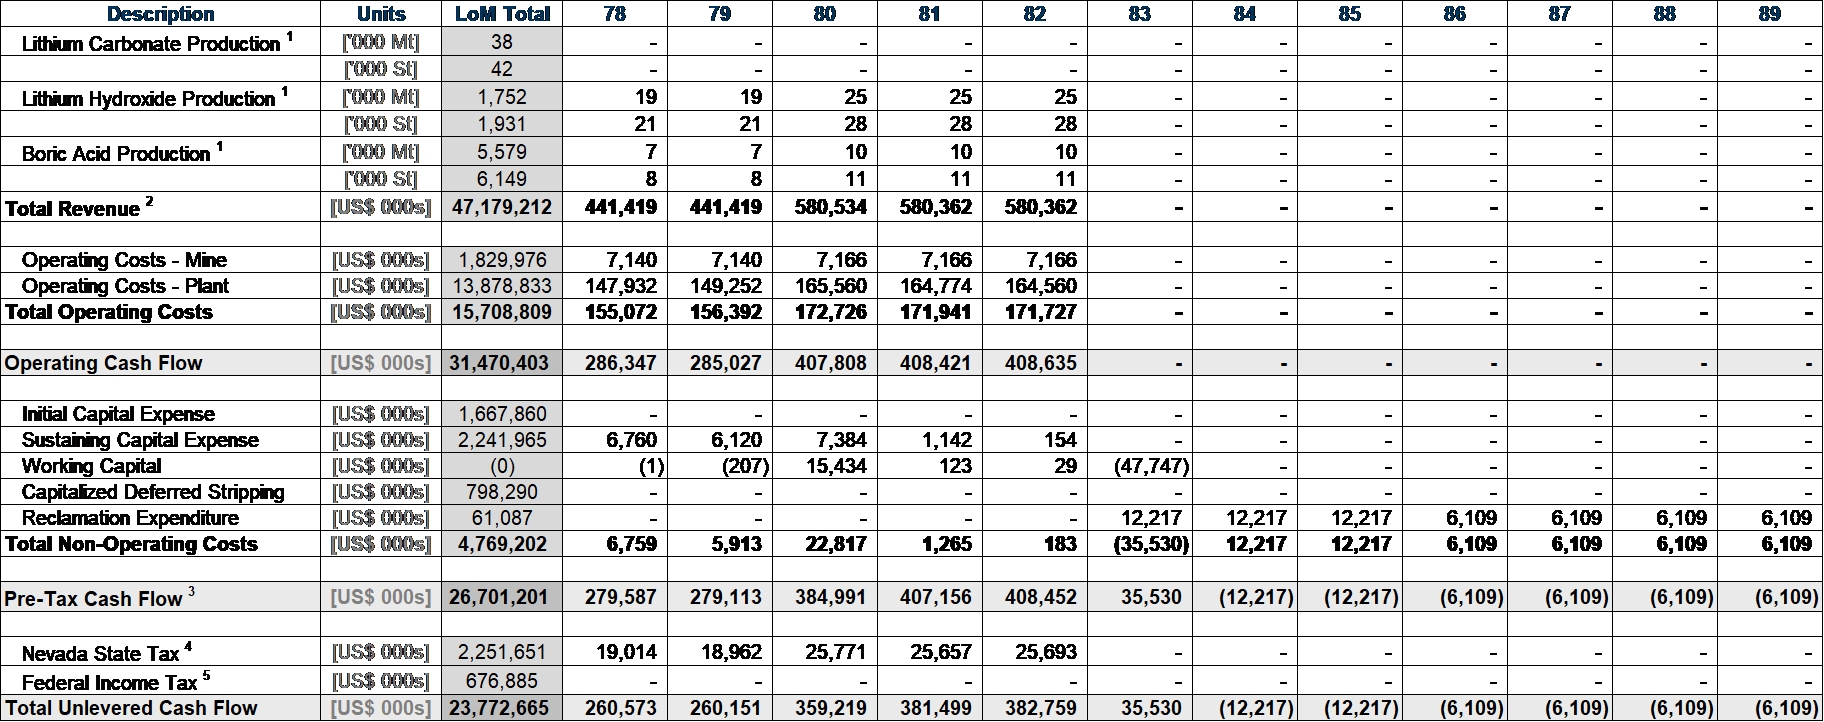
|
|
1. |
Annual ROM ore and waste quantities are provided in Table 13-1 (variations due to rounding).
|
|
|
2. |
Annual price assumptions are detailed in Section 16.
|
|
|
3. |
Project cash flow includes Reclamation Expenditure after Production Year 82.
|
|
|
4. |
State taxes include Nevada minerals tax, Nevada modified business tax, Nevada sales tax, Nevada commerce tax, and Nevada property tax.
|
|
|
5. |
Includes federal income tax and Inflation Reduction Act (45x) production tax credit. Over the life-of-mine, the expected total production tax credit to be
approximately US$1,676 million.
|
|
|
19-14
|
30 SEPTEMBER 2025
|
|
Rhyolite Ridge Lithium-Boron Project
|
S-K 1300 Technical Report Summary
|
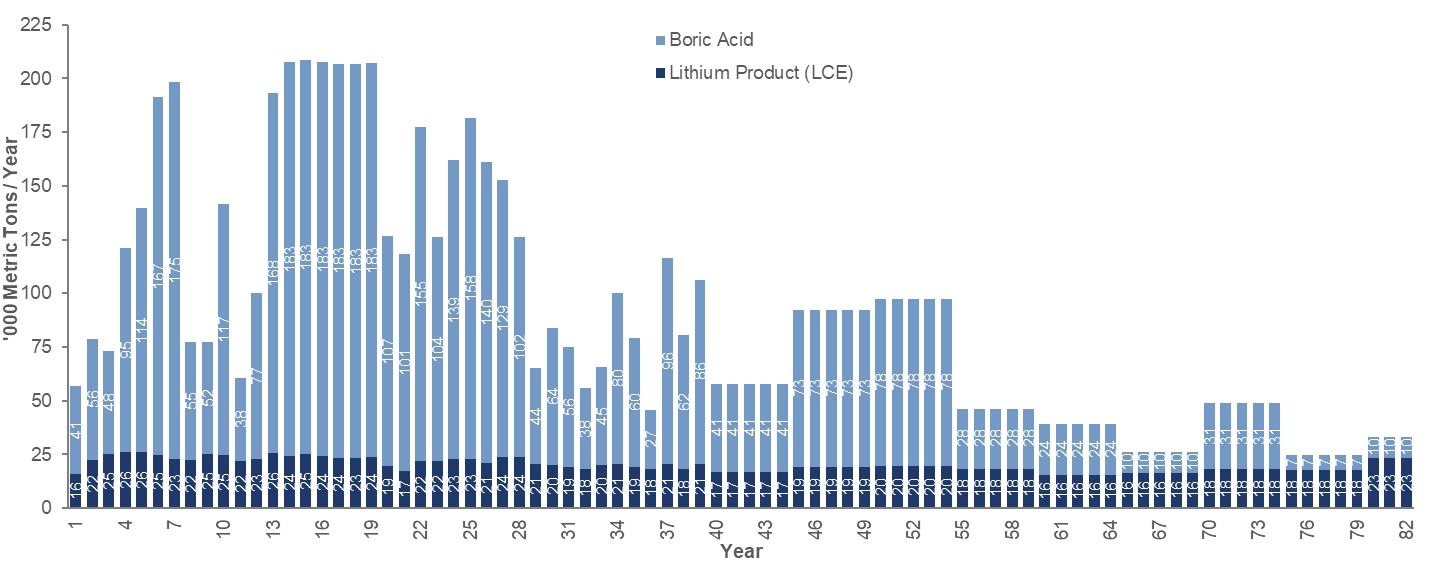
|
|
19-15
|
30 SEPTEMBER 2025
|
|
Rhyolite Ridge Lithium-Boron Project
|
S-K 1300 Technical Report Summary
|
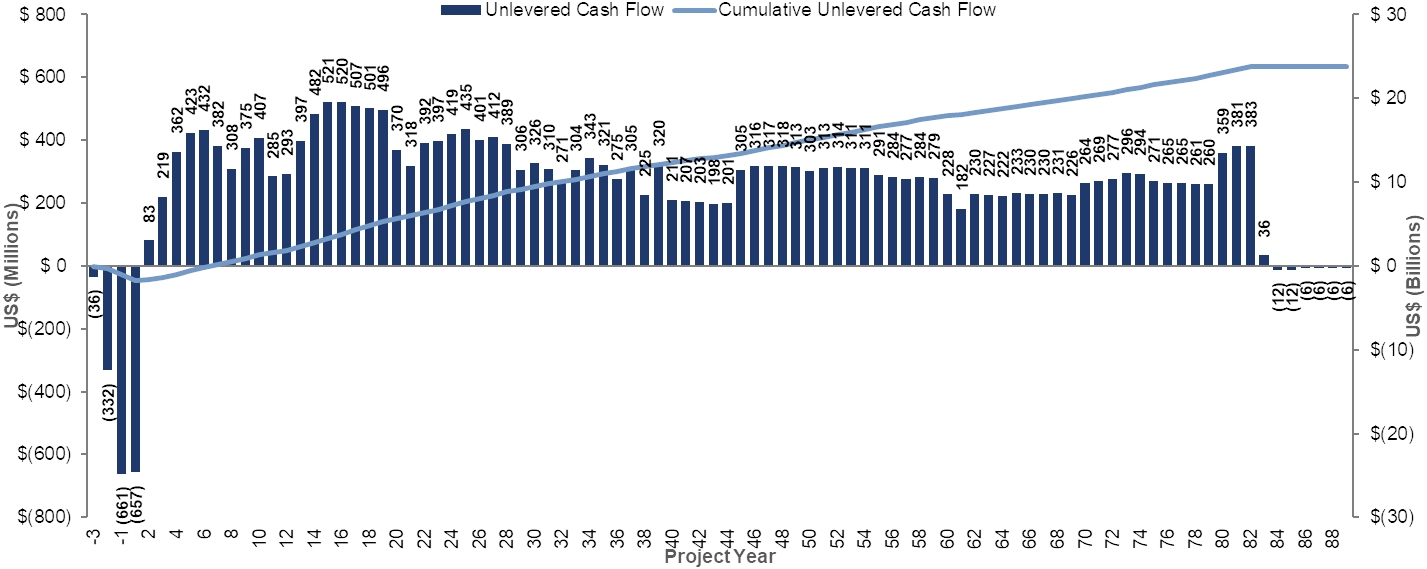
|
|
19-16
|
30 SEPTEMBER 2025
|
|
Rhyolite Ridge Lithium-Boron Project
|
S-K 1300 Technical Report Summary
|
|
19.3.2.
|
Taxes, Royalties, Other Government Levies, or Interests
|
|
|
◾ |
Nevada property and local tax: Real and personal properties are taxed at 35% of actual value to arrive at the assessed value. For the purposes of the financial model, the property
tax rate was reported by KPMG as 3.02%. The Nevada property tax is calculated by applying the tax rate to 35% of the book value, given as the non-depreciated portion of the capital and sustaining capital costs are
estimated using straight-line depreciation methods;
|
|
|
◾ |
Nevada minerals tax: Nevada charges an annual minerals tax on net proceeds from minerals mined or produced in Nevada when they are sold or removed from the state. The tax is based
on the actual production of minerals from all operating mines. It is a graduated tax with a top rate of 5%. The estimates of the Nevada minerals tax start with gross proceeds from the sale of the minerals and then
certain deductions are taken from the gross proceeds to arrive at net proceeds. These allowable deductions are listed under Nevada Revised Statutes Chapter 362.120 and include certain costs of production, processing,
transportation, marketing, royalties, and depreciation;
|
|
|
◾ |
Nevada sales tax: Sales tax considerations were included in the current model as applicable. Machinery, equipment, commodities, materials, and supplies purchased for the Project are
tangible personal property that are subject to sales and use taxes, unless an exemption applies. The sales tax rate is applicable to the rate at the point of delivery in the state of Nevada, in this case Esmeralda
County. The current rate in Esmeralda County is 6.85% (August 2025);
|
|
|
◾ |
Nevada taxes the sale, purchase, or lease of tangible personal property. Ordinarily, services provided in Nevada are generally not subject to sales and use taxes. Items such as
chemicals and catalysts used for processing the materials are taxable to the processor;
|
|
|
◾ |
Nevada modified business tax: The Nevada modified business tax is applied at the rate of 2% on taxable wages;
|
|
|
◾ |
Commerce tax: The commerce tax is payable on annual gross revenue in excess of US$4 million. The commerce tax rate is based on ioneer’s North American Industry Classification System
category of mining code, which is 0.051%. The commerce tax is an entity-level tax based on gross receipts;
|
|
|
◾ |
Federal corporate tax: The calculation of U.S. federal corporate tax begins with gross revenues. Cash cost of operations are deducted from the revenues, as are allowances for
depreciation (Modified Accelerated Cost Recovery System), depletion, and amortization to calculate taxable income before net operating loss consideration;
|
|
|
◾ |
Production tax credit (45x): U.S. tax code includes a 10% tax credit for production of refined lithium, applied to the operating costs of production. The duration of the credit
has changed with different federal administrations and within the current financial model the credit is assumed to exist over the mine life.
|
|
|
19-16
|
30 SEPTEMBER 2025
|
|
Rhyolite Ridge Lithium-Boron Project
|
S-K 1300 Technical Report Summary
|
|
19.4.
|
Sensitivity Analysis
|
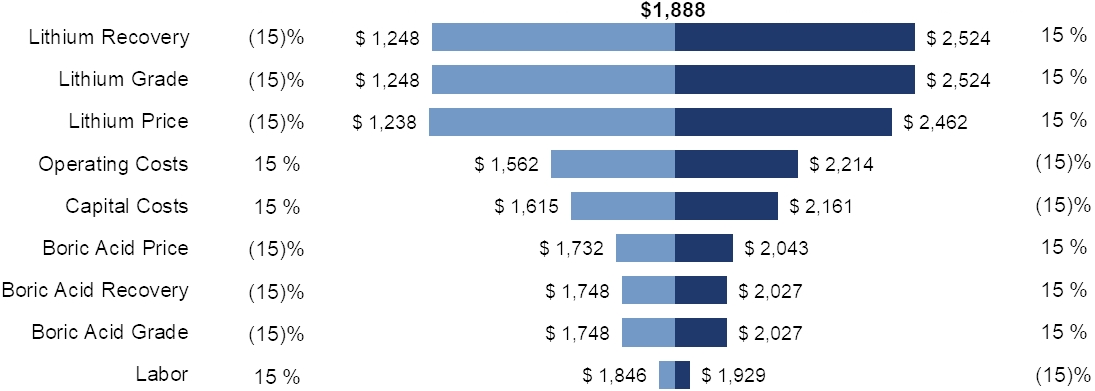
|
|
19-17
|
30 SEPTEMBER 2025
|
|
Rhyolite Ridge Lithium-Boron Project
|
S-K 1300 Technical Report Summary
|

|
|
19-18
|
30 SEPTEMBER 2025
|
|
Rhyolite Ridge Lithium-Boron Project
|
S-K 1300 Technical Report Summary
|
|
20.
|
ADJACENT PROPERTIES
|
|
|
20-1
|
30 SEPTEMBER 2025
|
|
Rhyolite Ridge Lithium-Boron Project
|
S-K 1300 Technical Report Summary
|
|
21.
|
OTHER RELEVANT DATA AND INFORMATION
|
|
|
21-1
|
30 SEPTEMBER 2025
|
|
Rhyolite Ridge Lithium-Boron Project
|
S-K 1300 Technical Report Summary
|
|
22.
|
INTERPRETATION AND CONCLUSIONS
|
|
22.1.
|
Mineral Tenure, Surface Rights, Water Rights, Royalties and Agreements
|
|
22.2.
|
Geology and Mineralization
|
|
22.3.
|
Exploration, Drilling and Sampling
|
|
22.3.1.
|
Exploration and Geological Drilling
|
|
|
22-1
|
30 SEPTEMBER 2025
|
|
Rhyolite Ridge Lithium-Boron Project
|
S-K 1300 Technical Report Summary
|
|
22.3.2.
|
Hydrogeological Drilling
|
|
22.3.3.
|
Geotechnical Drilling
|
|
|
22-2
|
30 SEPTEMBER 2025
|
|
Rhyolite Ridge Lithium-Boron Project
|
S-K 1300 Technical Report Summary
|
|
22.4.
|
Data Verification
|
|
22.5.
|
Metallurgical Testwork
|
|
22.6.
|
Mineral Resources
|
|
|
22-3
|
30 SEPTEMBER 2025
|
|
Rhyolite Ridge Lithium-Boron Project
|
S-K 1300 Technical Report Summary
|
|
|
◾ |
Continue to further the evaluation of faulting identified in drill holes and on surface mapping and update the geological model, as necessary;
|
|
|
◾ |
Evaluate findings of seismic study and continued incorporation into structural and stratigraphic interpretation of seismic profiles into the geological model, as necessary;
|
|
|
◾ |
Based on the results of the fault evaluation and seismic study, evaluate the need for targeted infill drilling to better define the geometry and displacement of any faults deemed
to be poorly defined in the current data and modeling;
|
|
|
◾ |
Evaluate potential additional exploration planning in the southeastern portions of the South Basin, additional core drilling with the aim of identifying additional tons at higher
Lithium-Boron grades based on observed grade trends in the current model and limits of the basin;
|
|
|
◾ |
Any additional exploration or infill drilling performed on the Project should assure the implementation of the revised QA/QC protocol presented in this Report.
|
|
22.7.
|
Mineral Reserves
|
|
|
22-4
|
30 SEPTEMBER 2025
|
|
Rhyolite Ridge Lithium-Boron Project
|
S-K 1300 Technical Report Summary
|
|
|
◾ |
Perform additional drilling outside of the final LOM quarry extents to increase mine reserve to the northeast, better define dip and orientation of the sedimentary layers and
understanding of faulting structure;
|
|
|
◾ |
Perform updated geotechnical assessment using revised geologic model with hydrogeological data incorporated;
|
|
|
◾ |
Continued updating of marketing intelligence and sales plans to mitigate risks.
|
|
22.8.
|
Mining Methods
|
|
22.9.
|
Recovery Methods
|
|
|
22-5
|
30 SEPTEMBER 2025
|
|
Rhyolite Ridge Lithium-Boron Project
|
S-K 1300 Technical Report Summary
|
|
22.10.
|
Infrastructure
|
|
22.10.1.
|
General Infrastructure
|
|
22.10.2.
|
Spent Ore Storage Facility
|
|
|
22-6 |
30 SEPTEMBER 2025
|
|
Rhyolite Ridge Lithium-Boron Project
|
S-K 1300 Technical Report Summary
|
| 22.11. |
Market Studies
|
| 22.12. |
Environmental, Permitting and Social Considerations
|
|
|
◾ |
Above Ground Storage Tanks Permit;
|
|
|
◾ |
Boiler and High-Pressure Vessels Operating Permit;
|
|
|
◾ |
Explosives Permit;
|
|
|
◾ |
Fire and Life Safety;
|
|
|
◾ |
Hazardous Materials Permit;
|
|
|
◾ |
Hazardous Materials Storage Permit;
|
|
|
◾ |
Industrial Artificial Pond Permit;
|
|
|
22-7 |
30 SEPTEMBER 2025
|
|
Rhyolite Ridge Lithium-Boron Project
|
S-K 1300 Technical Report Summary
|
|
|
◾ |
Notice of Commencement of Mine Operations;
|
|
|
◾ |
Notice of Commencement of Mine Operations.
|
|
22.13.
|
Capital Cost Estimates
|
|
22.14.
|
Operating Cost Estimates
|
|
22.15.
|
Economic Analysis
|
|
|
22-8 |
30 SEPTEMBER 2025
|
|
Rhyolite Ridge Lithium-Boron Project
|
S-K 1300 Technical Report Summary
|
|
22.16.
|
Risks and Opportunities
|
|
22.16.1.
|
Risks
|
|
22.16.1.1.
|
Metallurgy and Processing
|
|
|
◾ |
Blending with LoB-Li high clay mineralization (M5 unit) should be limited to 10% to avoid adverse permeability issues in the
vats caused by its high clay content. The large volume of M5 unit ore will result in the great portion of this ore type being unsuited for vat leaching through prior blending with low clay ores.
|
|
|
◾ |
Blending with other LoB-Li low clay mineralization types in stream 2 (L6 & S5 units) will result in lower boric acid
production.
|
|
22.16.1.2.
|
Mineral Resource Estimates
|
|
|
◾ |
Geological uncertainty relating to local structural control relating to geometry, location, and displacement of faults;
|
|
|
◾ |
Geological uncertainty and opportunity regarding the continuity and geometry of stratigraphy and mineralization in the eastern
and northern extents of the basin, outside of the current Mineral Resource footprint;
|
|
|
◾ |
Potential impacts to the mineral resource footprint related to potential changes in the Project footprint relating to avoidance
and mitigation measures relating to the Tiehm’s buckwheat and designated critical habitat areas;
|
|
|
◾ |
The use of assigned density with no density samples, as is the case with one waste unit (the Q1 alluvium unit), is a factor that
represents a low risk to the mineral resource estimate confidence.
|
|
|
22-9 |
30 SEPTEMBER 2025
|
|
Rhyolite Ridge Lithium-Boron Project
|
S-K 1300 Technical Report Summary
|
|
|
◾ |
An evaluation of the unsampled drill core which could lead to an update to the assay database and eventual update to the mineral
resource estimate;
|
|
|
◾ |
Evaluate the inclusion of additional lithium and boron bearing seams such as S3 and M4 into the mineral resource;
|
|
|
◾ |
Continue to expand process test work and expand data set, which may lead to further reduction in Acid consumption or increased
recovery variables.
|
|
22.16.1.3.
|
Mineral Reserve Estimates and Mine Plan
|
|
22.16.1.4.
|
Markets and Contracts
|
|
|
◾ |
Losing existing offtake agreements due to significant commissioning delays;
|
|
|
◾ |
US-China tariff conflict escalation, resulting in lower boric acid prices and volume;
|
|
|
◾ |
Customers do not honor contracts and memoranda of understanding, resulting in lower sales levels;
|
|
|
◾ |
Prices are less than expected due to oversupply or lower demand; and
|
|
|
◾ |
The market has not grown as predicted, and sales volume is less than expected.
|
|
22.16.1.5.
|
Environmental, Permitting, and Social Considerations
|
|
|
22-10 |
30 SEPTEMBER 2025
|
|
Rhyolite Ridge Lithium-Boron Project
|
S-K 1300 Technical Report Summary
|
|
22.16.1.6.
|
Cost Estimation
|
|
|
◾ |
Skilled labor availability in the region;
|
|
|
◾ |
Accommodation availability due to unexpected competing projects;
|
|
|
◾ |
Volatile raw material and transportation costs;
|
|
|
◾ |
Late changes.
|
|
22.16.2.
|
Opportunities
|
|
|
◾ |
Potential opportunity to convert additional high clay mineralization in M5 unit from current classification of mineral resources to mineral reserves following
appropriate supporting studies and tests.
|
|
|
22-11 |
30 SEPTEMBER 2025
|
|
Rhyolite Ridge Lithium-Boron Project
|
S-K 1300 Technical Report Summary
|
|
23.
|
RECOMMENDATIONS
|
|
|
23-1
|
30 SEPTEMBER 2025
|
|
Rhyolite Ridge Lithium-Boron Project
|
S-K 1300 Technical Report Summary
|
|
24.
|
REFERENCES
|
|
|
24-1
|
30 SEPTEMBER 2025
|
|
Rhyolite Ridge Lithium-Boron Project
|
S-K 1300 Technical Report Summary
|
|
|
24-2
|
30 SEPTEMBER 2025
|
|
Rhyolite Ridge Lithium-Boron Project
|
S-K 1300 Technical Report Summary
|
|
25.
|
RELIANCE ON INFORMATION PROVIDED BY THE REGISTRANT
|
|
25.1.
|
Introduction
|
|
|
- |
The registrant has employed or retained industry professionals with expertise in the areas listed in the following sub-sections;
|
|
|
- |
The registrant has the oversight and governance over these activities, including direct involvement, peer review and approval;
|
|
|
- |
The registrant has experience and, in some cases, knows the history of these areas.
|
|
25.2.
|
Macroeconomic Trend
|
|
25.3.
|
Markets
|
|
25.4.
|
Legal Matters
|
|
25.5.
|
Environmental Matters
|
|
|
25-1
|
30 SEPTEMBER 2025
|
|
Rhyolite Ridge Lithium-Boron Project
|
S-K 1300 Technical Report Summary
|
|
25.6.
|
Stakeholder Accommodation
|
|
25.7.
|
Governmental Factors
|
|
|
25-2
|
30 SEPTEMBER 2025
|