|
Form 20-F
|
☒ |
Form 40-F
|
|
Exhibit No.
|
Description
|
|
Press Release dated May 14, 2025
|
|
|
Presentation dated May 14, 2025
|
|
Carbon Revolution Public Limited Company
|
||
|
Date: May 14, 2025
|
||
|
By:
|
/s/ David Nock
|
|
|
Name:
|
David Nock
|
|
|
Title:
|
General Counsel
|
|

|
|
- |
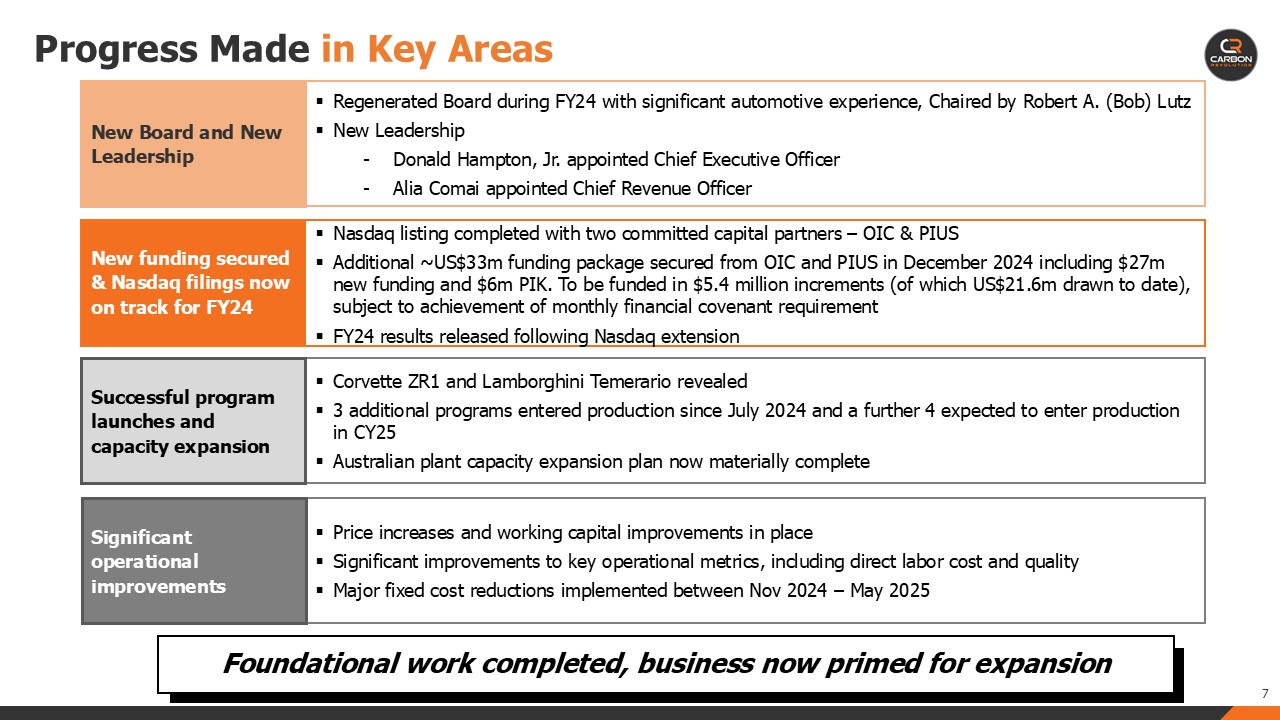
Appointed Robert A. (Bob) Lutz as Chair of the Board of Directors
|
|
|
- |
Strengthened leadership with appointments of Donald Hampton, Jr. as CEO and Alia Comai as Chief Revenue Officer
|
|
|
- |
Key customer vehicle launches, including Chevrolet Corvette ZR1 and Lamborghini Temerario
|
|
|
- |
Completed initial Mega-line commissioning, driving operational efficiencies
|
|
|
- |
Achieved industry recognition at the prestigious 2024 PACE Automotive News awards with dual awards
|
|
Metrics(1)
(US$ unless otherwise specified)
|
FY24
|
FY23
|
Change %
|
|||||||||
|
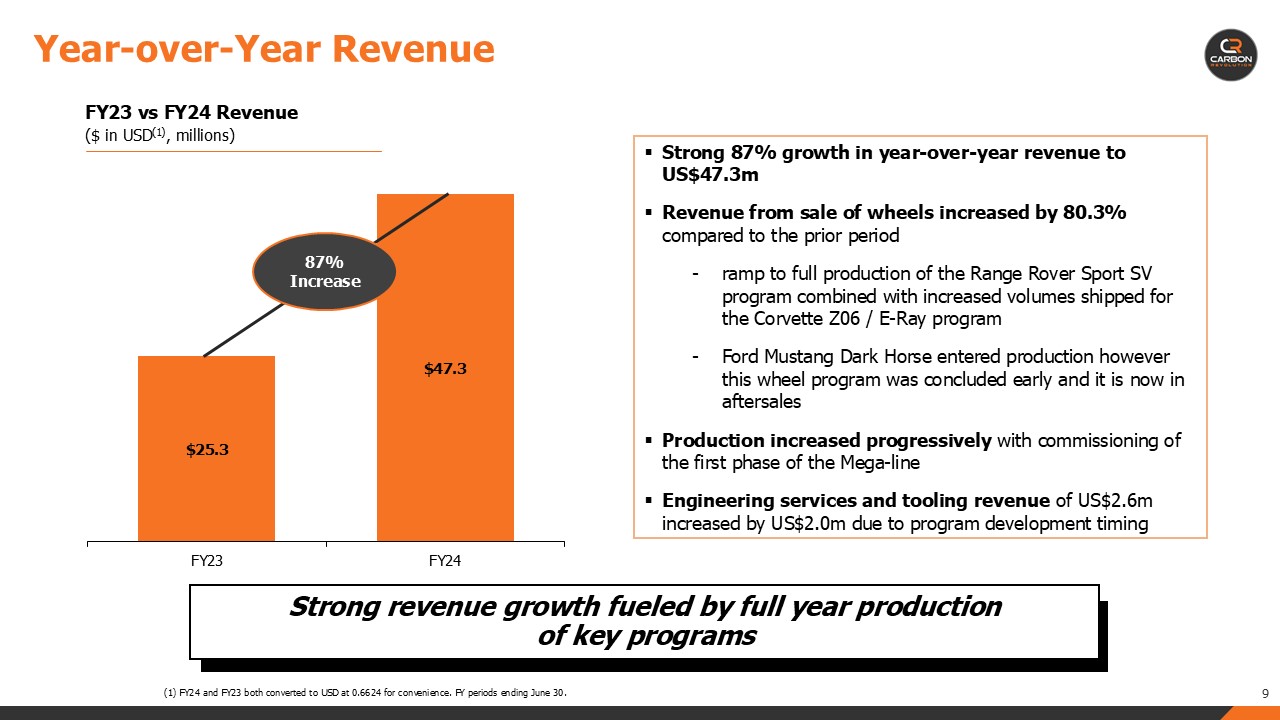
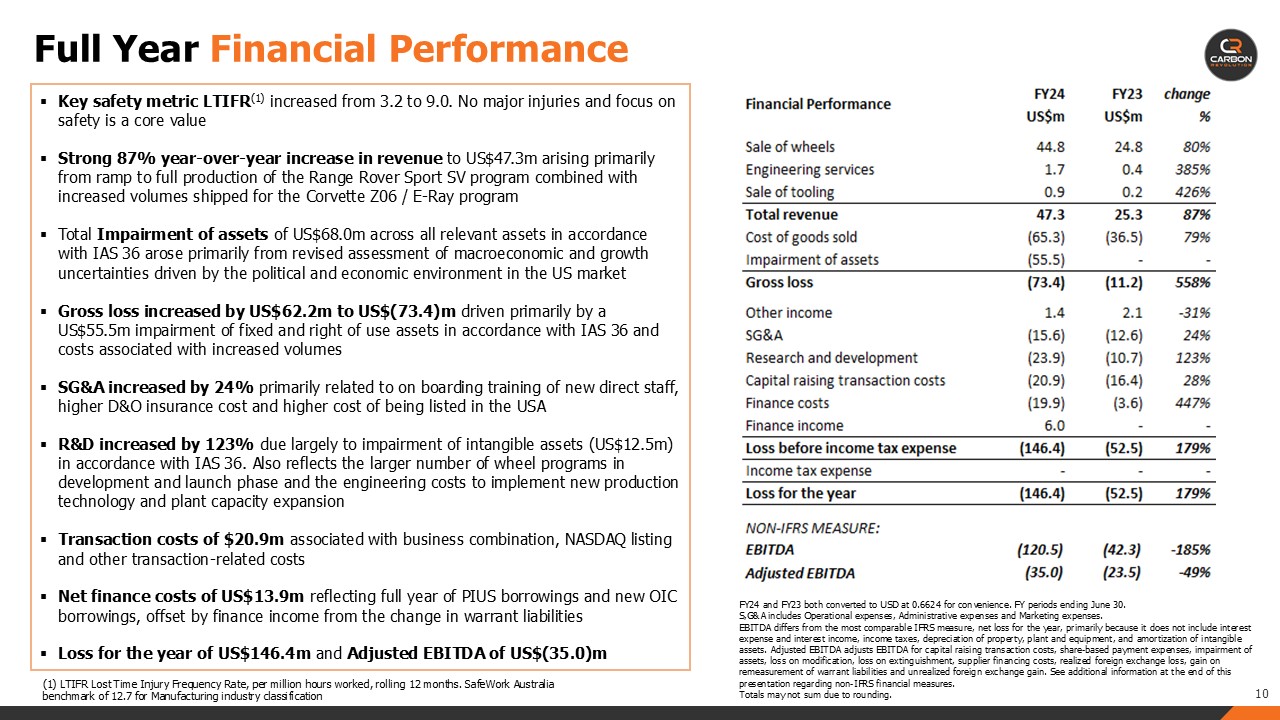
Revenue (US$m)
|
47.3
|
25.3
|
87
|
%
|
||||||||
|
Loss for the year (US$m)
|
(146.4
|
)
|
(52.5
|
)
|
(179
|
)%
|
||||||
|
EBITDA (2) (US$m)
|
(120.5
|
)
|
(42.3
|
)
|
(185
|
)%
|
||||||
|
Adjusted EBITDA (3) (US$m)
|
(35.0
|
)
|
(23.5
|
)
|
(49
|
)%
|
||||||
|
Unrestricted cash at April 30 2025(4) (US$m)
|
1.0
|
|||||||||||
| (1) |
All USD figures converted to USD at a rate of 0.6624:1 (USD:AUD) for convenience. Financial years ending June 30.
|
|
|
(2) |
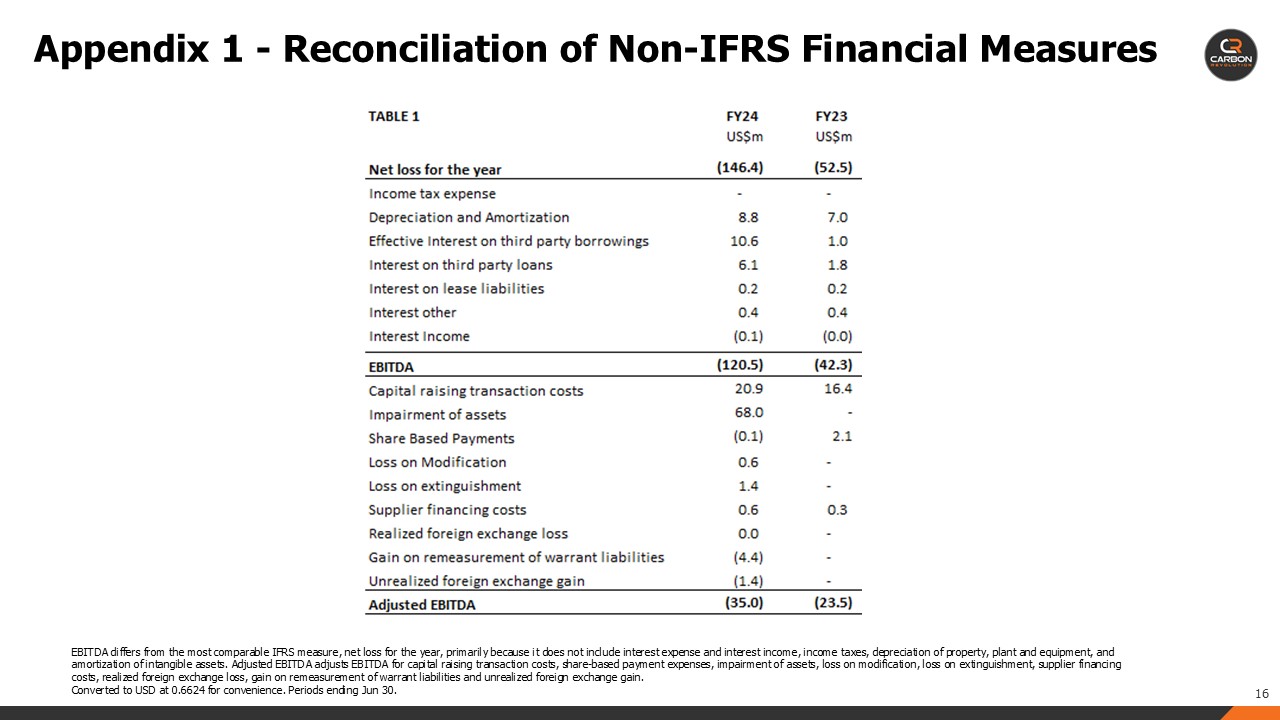
EBITDA differs from the most comparable IFRS measure, net loss for the year, primarily because it does not include interest expense and interest income, income taxes, depreciation of property, plant and equipment, and amortization of
intangible assets.
|
|
|
(3) |
Adjusted EBITDA adjusts EBITDA for capital raising transaction costs, share-based payment expenses, impairment of assets, loss on modification, loss on extinguishment, supplier financing costs, realized foreign exchange loss, gain on
remeasurement of warrant liabilities and unrealized foreign exchange gain. See additional information at the end of this release regarding non-IFRS financial measures.
|
|
|
(4) |
The Company expects to draw down the remaining US$5m from OIC funds in CY2025. As of April 30, 2025 the Company has US$1.0m of available cash on the balance sheet and US$3.6m in restricted Trust fund in relation to the PIUS agreement.
|
|
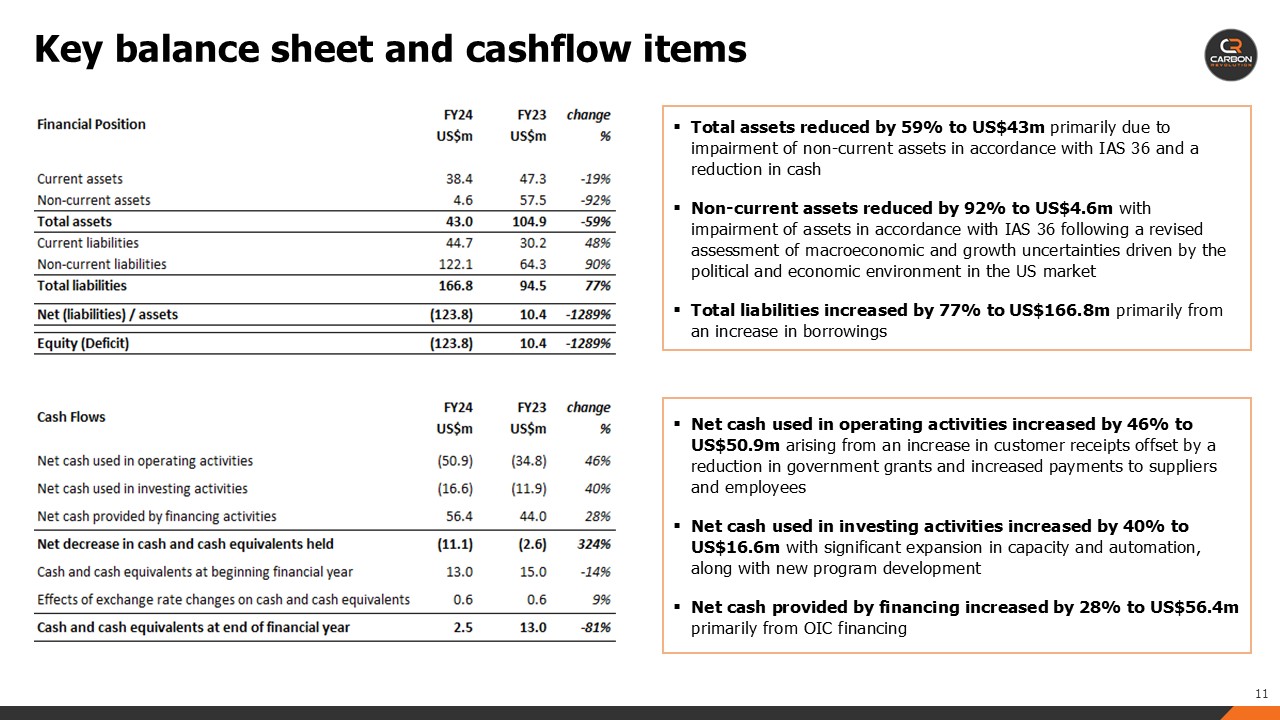
June 30, 2024
US $’000
|
June 30, 2024
AU $’000
|
June 30, 2023
AU $’000
|
||||||||||
|
Current assets
|
||||||||||||
|
Cash and cash equivalents
|
2,454
|
3,705
|
19,582
|
|||||||||
|
Restricted trust fund
|
446
|
674
|
14,677
|
|||||||||
|
Receivables
|
5,656
|
8,538
|
6,430
|
|||||||||
|
Contract assets
|
9,242
|
13,952
|
8,239
|
|||||||||
|
Inventories
|
19,101
|
28,836
|
22,173
|
|||||||||
|
Other current assets
|
1,453
|
2,193
|
378
|
|||||||||
|
Total current assets
|
38,352
|
57,898
|
71,479
|
|||||||||
|
Non-current assets
|
||||||||||||
|
Restricted trust fund
|
4,637
|
7,001
|
-
|
|||||||||
|
Property, plant and equipment
|
-
|
-
|
62,638
|
|||||||||
|
Right-of-use assets
|
-
|
-
|
7,446
|
|||||||||
|
Intangible assets
|
-
|
-
|
16,774
|
|||||||||
|
Total non-current assets
|
4,637
|
7,001
|
86,858
|
|||||||||
|
Total assets
|
42,989
|
64,899
|
158,337
|
|||||||||
|
Current liabilities
|
||||||||||||
|
Payables
|
29,973
|
45,247
|
15,474
|
|||||||||
|
Borrowings
|
9,282
|
14,013
|
13,829
|
|||||||||
|
Lease liability
|
467
|
705
|
645
|
|||||||||
|
Contract liability
|
730
|
1,102
|
748
|
|||||||||
|
Deferred income
|
1,400
|
2,114
|
1,919
|
|||||||||
|
Provisions
|
2,887
|
4,359
|
12,957
|
|||||||||
|
Total current liabilities
|
44,739
|
67,540
|
45,572
|
|||||||||
|
Non-current liabilities
|
||||||||||||
|
Borrowings
|
93,301
|
140,853
|
70,833
|
|||||||||
|
Payables
|
10,064
|
15,193
|
-
|
|||||||||
|
Derivative liability
|
352
|
531
|
-
|
|||||||||
|
Lease liability
|
4,677
|
7,061
|
7,368
|
|||||||||
|
Contract liability
|
2,999
|
4,527
|
1,755
|
|||||||||
|
Deferred income
|
8,825
|
13,323
|
15,235
|
|||||||||
|
Provisions
|
1,877
|
2,834
|
1,843
|
|||||||||
|
Total non-current liabilities
|
122,095
|
184,322
|
97,034
|
|||||||||
|
Total liabilities
|
166,834
|
251,862
|
142,606
|
|||||||||
|
Net (liabilities) / assets
|
(123,845
|
)
|
(186,963
|
)
|
15,731
|
|||||||
|
Equity (Deficit)
|
||||||||||||
|
Contributed equity
|
-
|
-
|
-
|
|||||||||
|
Warrants
|
4,971
|
7,504
|
-
|
|||||||||
|
Reserves
|
1,317
|
1,990
|
7,166
|
|||||||||
|
Accumulated losses
|
(130,133
|
)
|
(196,457
|
)
|
8,565
|
|||||||
|
Total equity (deficit)
|
(123,845
|
)
|
(186,963
|
)
|
15,731
|
|||||||
|
2024
|
2024
|
2023
|
2022
|
|||||||||||||
|
US $’000
|
AU $’000
|
AU $’000
|
AU $’000
|
|||||||||||||
|
Sale of wheels
|
44,752
|
67,560
|
37,477
|
38,276
|
||||||||||||
|
Engineering services
|
1,702
|
2,569
|
530
|
464
|
||||||||||||
|
Sale of tooling
|
881
|
1,330
|
253
|
1,596
|
||||||||||||
|
Revenue
|
47,335
|
71,459
|
38,260
|
40,336
|
||||||||||||
|
Cost of goods sold
|
(65,262
|
)
|
(98,523
|
)
|
(55,094
|
)
|
(57,445
|
)
|
||||||||
|
Impairment of assets
|
(55,472
|
)
|
(83,745
|
)
|
-
|
-
|
||||||||||
|
Gross loss
|
(73,399
|
)
|
(110,809
|
)
|
(16,834
|
)
|
(17,109
|
)
|
||||||||
|
|
||||||||||||||||
|
Other income
|
1,423
|
2,148
|
3,096
|
4,320
|
||||||||||||
|
Operational expenses
|
(2,505
|
)
|
(3,782
|
)
|
(2,997
|
)
|
(2,013
|
)
|
||||||||
|
Research and development expenses
|
(23,914
|
)
|
(36,102
|
)
|
(16,180
|
)
|
(16,933
|
)
|
||||||||
|
Administrative expenses
|
(11,979
|
)
|
(18,084
|
)
|
(14,566
|
)
|
(13,146
|
)
|
||||||||
|
Marketing expenses
|
(1,166
|
)
|
(1,760
|
)
|
(1,494
|
)
|
(1,550
|
)
|
||||||||
|
Capital raising transaction costs
|
(20,921
|
)
|
(31,584
|
)
|
(24,746
|
)
|
-
|
|||||||||
|
Finance costs
|
(19,937
|
)
|
(30,100
|
)
|
(5,502
|
)
|
(1,390
|
)
|
||||||||
|
Finance income
|
5,955
|
8,990
|
-
|
-
|
||||||||||||
|
Loss before income tax expense
|
(146,443
|
)
|
(221,083
|
)
|
(79,223
|
)
|
(47,821
|
)
|
||||||||
|
Income tax expense
|
-
|
-
|
-
|
-
|
||||||||||||
|
Loss for the year
|
(146,443
|
)
|
(221,083
|
)
|
(79,223
|
)
|
(47,821
|
)
|
||||||||
|
|
||||||||||||||||
|
Other comprehensive income / (loss)
|
||||||||||||||||
|
Items that may be reclassified subsequently to profit or loss:
|
||||||||||||||||
|
Foreign currency translation differences – foreign operations
|
201
|
303
|
(62
|
)
|
(147
|
)
|
||||||||||
|
Other comprehensive income / (loss)
|
201
|
303
|
(62
|
)
|
(147
|
)
|
||||||||||
|
|
||||||||||||||||
|
Total comprehensive loss for the year
|
(146,242
|
)
|
(220,780
|
)
|
(79,285
|
)
|
(47,968
|
)
|
||||||||
|
|
||||||||||||||||
|
Earnings per share
|
US $
|
AU $
|
AU $
|
AU $
|
||||||||||||
|
Basic
|
(77.90
|
)
|
(117.61
|
)
|
(59.20
|
)
|
$
|
(36.17
|
)
|
|||||||
|
Diluted
|
(77.90
|
)
|
(117.61
|
)
|
(59.20
|
)
|
$
|
(36.17
|
)
|
|||||||
|
Share Capital*
|
Share Premium*
|
Warrants
|
Share buyback reserve
|
Share based
payment
reserve
|
Accumulated losses
|
Foreign currency translation reserve
|
Total equity
(deficit)
|
|||||||||||||||||||||||||
|
AU $’000
|
AU $’000
|
AU $’000
|
AU $’000
|
AU $’000
|
AU $’000
|
AU $’000
|
AU $’000
|
|||||||||||||||||||||||||
|
Balance as of July 1, 2021
|
-
|
-
|
-
|
(311
|
)
|
5,979
|
(131,067
|
)
|
(9
|
)
|
136,726
|
|||||||||||||||||||||
|
Loss after tax for the year
|
-
|
-
|
-
|
-
|
-
|
(47,821
|
)
|
-
|
(47,821
|
)
|
||||||||||||||||||||||
|
Other comprehensive loss for the year
|
-
|
-
|
-
|
-
|
-
|
-
|
(147
|
)
|
(147
|
)
|
||||||||||||||||||||||
|
Total comprehensive loss for the year
|
-
|
-
|
-
|
-
|
-
|
(47,821
|
)
|
(147
|
)
|
(47,968
|
)
|
|||||||||||||||||||||
|
Transactions with owners in their capacity as owners
|
||||||||||||||||||||||||||||||||
|
Share options exercised
|
-
|
-
|
-
|
-
|
1,235
|
1,932
|
-
|
3,167
|
||||||||||||||||||||||||
|
Total transactions with owners in their capacity as owners
|
-
|
-
|
-
|
-
|
1,235
|
1,932
|
-
|
3,167
|
||||||||||||||||||||||||
|
Balance as of June 30, 2022
|
-
|
-
|
-
|
(311
|
)
|
7,214
|
85,178
|
(156
|
)
|
91,925
|
||||||||||||||||||||||
|
Balance as of July 1, 2022
|
-
|
-
|
-
|
(311
|
)
|
7,214
|
85,178
|
(156
|
)
|
91,925
|
||||||||||||||||||||||
|
Loss after tax for the year
|
-
|
-
|
-
|
-
|
-
|
(79,223
|
)
|
-
|
(79,223
|
)
|
||||||||||||||||||||||
|
Other comprehensive loss for the year
|
-
|
-
|
-
|
-
|
-
|
-
|
(62
|
)
|
(62
|
)
|
||||||||||||||||||||||
|
Total comprehensive loss for the year
|
-
|
-
|
-
|
-
|
-
|
(79,223
|
)
|
(62
|
)
|
(79,285
|
)
|
|||||||||||||||||||||
|
Transactions with owners in their capacity as owners
|
||||||||||||||||||||||||||||||||
|
Share options exercised
|
-
|
-
|
-
|
-
|
481
|
2,610
|
-
|
3,091
|
||||||||||||||||||||||||
|
Total transactions with owners in their capacity as owners
|
-
|
-
|
-
|
-
|
481
|
2,610
|
-
|
3,091
|
||||||||||||||||||||||||
|
Balance as of June 30, 2023
|
-
|
-
|
-
|
(311
|
)
|
7,695
|
8,565
|
(218
|
)
|
15,731
|
||||||||||||||||||||||
|
|
||||||||||||||||||||||||||||||||
|
Balance as of July 1, 2023
|
-
|
-
|
-
|
(311
|
)
|
7,695
|
8,565
|
(218
|
)
|
15,731
|
||||||||||||||||||||||
|
Loss after tax for the year
|
-
|
-
|
-
|
-
|
-
|
(221,083
|
)
|
-
|
(221,083
|
)
|
||||||||||||||||||||||
|
Other comprehensive income for the year
|
-
|
-
|
-
|
-
|
-
|
-
|
303
|
303
|
||||||||||||||||||||||||
|
Total comprehensive income / (loss) for the year
|
-
|
-
|
-
|
-
|
-
|
(221,083
|
)
|
303
|
(220,780
|
)
|
||||||||||||||||||||||
|
Transactions with owners in their capacity as owners
|
||||||||||||||||||||||||||||||||
|
Share options exercised
|
-
|
-
|
-
|
-
|
(886
|
)
|
886
|
-
|
-
|
|||||||||||||||||||||||
|
Equity-settled share-based payment
|
-
|
-
|
-
|
-
|
(410
|
)
|
-
|
-
|
(410
|
)
|
||||||||||||||||||||||
|
Cancellation of share-based payment plans
|
-
|
-
|
-
|
311
|
(4,802
|
)
|
4,491
|
-
|
-
|
|||||||||||||||||||||||
|
Settlement of share-based payment with cash alternative
|
-
|
-
|
-
|
-
|
(1,597
|
)
|
-
|
-
|
(1,597
|
)
|
||||||||||||||||||||||
|
Equity-settled share-based payment to non-employee
|
-
|
-
|
-
|
-
|
1,905
|
-
|
-
|
1,905
|
||||||||||||||||||||||||
|
Acquisition transaction
|
-
|
10,684
|
-
|
-
|
-
|
-
|
-
|
10,684
|
||||||||||||||||||||||||
|
Capital reduction
|
-
|
(10,684)
|
-
|
-
|
-
|
10,684
|
-
|
-
|
||||||||||||||||||||||||
|
Issue of warrants
|
-
|
-
|
7,504
|
-
|
-
|
-
|
-
|
7,504
|
||||||||||||||||||||||||
|
Total transactions with owners in their capacity as owners
|
-
|
-
|
7,504
|
311
|
(5,790
|
)
|
16,061
|
-
|
18,086
|
|||||||||||||||||||||||
|
Balance as of June 30, 2024
|
-
|
-
|
7,504
|
-
|
1,905
|
(196,457
|
)
|
85
|
(186,963
|
)
|
||||||||||||||||||||||
|
2024
US $’000
|
2024
AU $’000
|
2023
AU $’000
|
2022
AU $’000
|
|||||||||||||
|
Cash flow from operating activities
|
||||||||||||||||
|
Receipts from customers
|
44,198
|
66,724
|
45,742
|
33,643
|
||||||||||||
|
Receipt of grants and research and development incentives
|
134
|
202
|
15,446
|
3,767
|
||||||||||||
|
Payments to suppliers and employees
|
(75,545
|
)
|
(114,049
|
)
|
(80,215
|
)
|
(81,005
|
)
|
||||||||
|
Interest received
|
134
|
202
|
61
|
94
|
||||||||||||
|
Capital raising transaction costs
|
(7,758
|
)
|
(11,712
|
)
|
(9,030
|
)
|
-
|
|||||||||
|
Borrowing costs
|
(5,978
|
)
|
(9,025
|
)
|
(20,676
|
)
|
-
|
|||||||||
|
Finance costs
|
(6,087
|
)
|
(9,187
|
)
|
(3,810
|
)
|
(2,475
|
)
|
||||||||
|
Net cash used in operating activities
|
(50,902
|
)
|
(76,845
|
)
|
(52,482
|
)
|
(45,976
|
)
|
||||||||
|
|
||||||||||||||||
|
Cash flow from investing activities
|
||||||||||||||||
|
Payments for property, plant and equipment
|
(13,004
|
)
|
(19,632
|
)
|
(13,082
|
)
|
(15,634
|
)
|
||||||||
|
Payments for intangible assets
|
(3,607
|
)
|
(5,446
|
)
|
(4,874
|
)
|
(6,007
|
)
|
||||||||
|
Sale proceeds from sale of property, plant and equipment
|
1
|
2
|
3
|
-
|
||||||||||||
|
Net cash used in investing activities
|
(16,610
|
)
|
(25,076
|
)
|
(17,953
|
)
|
(21,641
|
)
|
||||||||
|
|
||||||||||||||||
|
Cash flow from financing activities
|
||||||||||||||||
|
Proceeds from third-party borrowings
|
71,508
|
107,953
|
124,963
|
33,657
|
||||||||||||
|
Repayment of third-party borrowings
|
(20,211
|
)
|
(30,512
|
)
|
(43,212
|
)
|
(29,370
|
)
|
||||||||
|
Reclassification (to)/from restricted trust fund
|
4,638
|
7,002
|
(14,677
|
)
|
-
|
|||||||||||
|
Capital raising transaction costs
|
-
|
-
|
-
|
(422
|
)
|
|||||||||||
|
Proceeds from capital reorganization
|
719
|
1,085
|
-
|
-
|
||||||||||||
|
Repayment of lease liability
|
(277
|
)
|
(418
|
)
|
(604
|
)
|
(596
|
)
|
||||||||
|
Net cash provided by financing activities
|
56,377
|
85,110
|
66,470
|
3,269
|
||||||||||||
|
Net (decrease) / increase in cash and cash equivalents held
|
(11,135
|
)
|
(16,811
|
)
|
(3,965
|
)
|
(64,348
|
)
|
||||||||
|
Cash and cash equivalents at beginning of financial year
|
12,971
|
19,582
|
22,693
|
87,257
|
||||||||||||
|
Effects of exchange rate changes on cash and cash equivalents
|
618
|
934
|
854
|
(216
|
)
|
|||||||||||
|
Cash and cash equivalents at end of financial year
|
2,454
|
3,705
|
19,582
|
22,693
|
||||||||||||
|
|
|
2024
US $m4
|
|
2023
US $m
|
2024
AU $m
|
2023
AU $m
|
||||||||||
|
Net loss for the year
|
(146.4
|
)
|
(52.5
|
)
|
(221.1
|
)
|
(79.2
|
)
|
||||||||
|
Income tax expense
|
-
|
-
|
-
|
-
|
||||||||||||
|
Depreciation & Amortization
|
8.8
|
7.0
|
13.2
|
10.5
|
||||||||||||
|
Effective interest on third party borrowings
|
10.6
|
1.0
|
16.0
|
1.4
|
||||||||||||
|
Cash Interest on third party borrowings
|
6.1
|
1.8
|
9.2
|
2.7
|
||||||||||||
|
Interest on lease liabilities
|
0.2
|
0.2
|
0.3
|
0.3
|
||||||||||||
|
Interest other
|
0.4
|
0.4
|
0.6
|
0.6
|
||||||||||||
|
Interest income
|
(0.1
|
)
|
(0.0
|
)
|
(0.2
|
)
|
(0.1
|
)
|
||||||||
|
Earnings before Interest, Tax, Depreciation & Amortization (EBITDA)
|
(120.5
|
)
|
(42.3
|
)
|
(182.0
|
)
|
(63.8
|
)
|
||||||||
|
Capital raising transaction costs
|
20.9
|
16.4
|
31.6
|
24.7
|
||||||||||||
|
Share based payment expenses
|
(0.1
|
)
|
2.1
|
(0.2
|
)
|
3.1
|
||||||||||
|
Impairment of assets
|
68.0
|
-
|
102.6
|
-
|
||||||||||||
|
Loss on modification
|
0.6
|
-
|
0.9
|
-
|
||||||||||||
|
Loss on extinguishment
|
1.4
|
-
|
2.1
|
-
|
||||||||||||
|
Supplier financing costs
|
0.6
|
0.3
|
1.0
|
0.4
|
||||||||||||
|
Realized foreign exchange loss
|
0.0
|
-
|
0.1
|
-
|
||||||||||||
|
Gain on remeasurement of warrant liabilities
|
(4.4
|
)
|
-
|
(6.7
|
)
|
-
|
||||||||||
|
Unrealized foreign exchange gain
|
(1.4
|
)
|
-
|
(2.1
|
)
|
-
|
||||||||||
|
Adjusted EBITDA
|
(35.0
|
)
|
(23.5
|
)
|
(52.7
|
)
|
(35.6
|
)
|
||||||||