|
Maryland (Essex Property Trust, Inc.)
|
77-0369576 (Essex Property Trust,
Inc.)
|
|
|
California (Essex Portfolio, L.P.)
|
77-0369575 (Essex Portfolio, L.P.)
|
|
|
(State or Other Jurisdiction of Incorporation)
|
(I.R.S. Employer Identification No.)
|
| ☐ |
Written communications pursuant to Rule 425 under the Securities Act (17 CFR 230.425)
|
| ☐ |
Soliciting material pursuant to Rule 14a-12 under the Exchange Act (17 CFR 240.14a-12)
|
| ☐ |
Pre-commencement communications pursuant to Rule 14d-2(b) under the Exchange Act (17 CFR 240.14d-2(b))
|
| ☐ |
Pre-commencement communications pursuant to Rule 13e-4(c) under the Exchange Act (17 CFR 240.13e-4(c))
|
|
Title of each class
|
Trading
Symbol(s)
|
Name of each exchange on which registered
|
||
|
Common Stock, $.0001 par value (Essex Property Trust, Inc.)
|
ESS |
New York Stock Exchange
|
|
Essex Property Trust, Inc.
|
Emerging growth company
|
☐ |
|
Essex Portfolio, L.P.
|
Emerging growth company
|
☐ |
| Item 2.02. |
Results of Operations and Financial Condition.
|
| Item 9.01. |
Financial Statements and Exhibits.
|
|
Exhibit No.
|
Description
|
|
|
Press Release and Supplemental Information for the three months ended March 31, 2025.
|
||
|
104
|
Cover Page Interactive Data File - the cover page XBRL tags are embedded within the Inline XBRL document.
|
|
|
Date: April
29, 2025
|
ESSEX PROPERTY TRUST, INC.
|
|
|
/s/ Barbara Pak
|
||
|
Name:
|
Barbara Pak
|
|
|
Title:
|
Executive Vice President and Chief Financial Officer
|
|
|
ESSEX PORTFOLIO, L.P.
|
||
|
By:
|
Essex Property Trust, Inc.
|
|
|
Its:
|
General Partner
|
|
|
/s/ Barbara Pak
|
||
|
Name:
|
Barbara Pak
|
|
|
Title:
|
Executive Vice President and Chief Financial Officer
|
|

|
Table of Contents
|
|
|
Pages 1 - 9
|
|
|
S-1 & S-2
|
|
|
S-3
|
|
|
|
|
|
S-4
|
|
|
S-5
|
|
|
S-6
|
|
|
S-7
|
|
|
S-8
|
|
|
S-9
|
|
|
S-10
|
|
| Development Pipeline |
S-11 |
|
S-12
|
|
|
S-13
|
|
|
S-14
|
|
|
S-15
|
|
|
S-15.1
|
|
|
MSA Level Supply Forecast: 2024A - 2025E |
S-16 |
|
S-17.1 – S-17.4
|
|
Three Months Ended
March 31,
|
%
|
||||||||
|
2025
|
2024
|
Change
|
|||||||
|
Per Diluted Share
|
|||||||||
|
Net Income
|
$3.16
|
$4.25
|
-25.6%
|
|
|||||
|
Total FFO
|
$3.97
|
$4.60
|
-13.7%
|
|
|||||
|
Core FFO
|
$3.97
|
$3.83
|
3.7%
|
|
|||||
|
|
• |
Reported Net Income per diluted share for the first quarter of 2025 of $3.16, compared to $4.25 in the first quarter of 2024. The decrease is largely attributable to gains on
remeasurement of co-investments and gains on legal settlements recognized in the first quarter of 2024.
|
|
|
• |
Grew Core FFO per diluted share by 3.7% compared to the first quarter of 2024, exceeding the midpoint of the Company’s guidance range by $0.05. The outperformance was primarily
driven by favorable same-property revenue growth, co-investment income, and interest expense.
|
|
|
• |
Achieved same-property revenue and net operating income (“NOI”) growth of 3.4% and 3.3%, respectively, compared to the first quarter of 2024. On a sequential basis, same-property
revenues and NOI improved 1.6% and 0.9%, respectively.
|
|
|
• |
Acquired three apartment home communities located in Northern California for a total contract price of $345.4 million.
|
|
|
• |
Disposed of a 53-year-old apartment home community located in Southern California for a contract price of $127.0 million.
|
|
|
• |
Issued $400.0 million of 10-year senior unsecured notes due in April 2035 bearing an interest rate of 5.375% per annum and an effective yield of 5.48%.
|
|
|
• |
Increased the dividend by 4.9% to an annual distribution of $10.28 per common share, the Company’s 31st consecutive annual increase.
|
|
|
• |
Reaffirmed the full-year guidance ranges for Core FFO per diluted share, same-property revenues, expenses, and NOI.
|
|
Revenue Change
|
|
|||||||||||
|
Q1 2025
vs. Q1 2024
|
Q1 2025
vs. Q4 2024
|
% of Total Q1
2025 Revenues
|
||||||||||
|
Southern California
|
|
|||||||||||
|
Los Angeles County
|
4.1%
|
|
2.6%
|
|
18.5%
|
|
||||||
|
Orange County
|
3.6%
|
|
1.5%
|
|
9.1%
|
|
||||||
|
San Diego County
|
2.8%
|
|
0.0%
|
|
9.2%
|
|
||||||
|
Ventura County
|
5.2%
|
|
1.7%
|
|
4.4%
|
|
||||||
|
Total Southern California
|
3.8%
|
|
1.7%
|
|
41.2%
|
|
||||||
|
Northern California
|
|
|
|
|||||||||
|
Santa Clara County
|
3.3%
|
|
1.8%
|
|
19.9%
|
|
||||||
|
Alameda County
|
2.4%
|
|
0.8%
|
|
7.8%
|
|
||||||
|
San Mateo County
|
5.2%
|
|
2.7%
|
|
4.6%
|
|
||||||
|
Contra Costa County
|
3.1%
|
|
1.6%
|
|
5.5%
|
|
||||||
|
San Francisco
|
6.6%
|
|
1.8%
|
|
3.1%
|
|
||||||
|
Total Northern California
|
3.6%
|
|
1.7%
|
|
40.9%
|
|
||||||
|
Seattle Metro
|
2.3%
|
|
1.0%
|
|
17.9%
|
|
||||||
|
Same-Property Portfolio
|
3.4%
|
|
1.6%
|
|
100.0%
|
|
||||||
|
Same-Property Revenue Components
|
Q1 2025
vs. Q1 2024
|
Q1 2025
vs. Q4 2024
|
||||||
|
Scheduled Rents
|
2.1%
|
|
0.3%
|
|
||||
|
Delinquency(1)
|
0.7%
|
|
0.7%
|
|
||||
|
Cash Concessions
|
0.2%
|
|
0.3%
|
|
||||
|
Vacancy
|
-0.1%
|
|
0.4%
|
|
||||
|
Other Income
|
0.5%
|
|
-0.1%
|
|
||||
|
Q1 2025 Same-Property Revenue Growth
|
3.4%
|
|
1.6%
|
|
||||
| (1) |
Same-Property delinquency as a percentage of scheduled rent was 0.5% in the first quarter of 2025 as compared to 1.3% in both the first and fourth quarters
of 2024.
|
|
Year-Over-Year Change
|
||||||||||||
|
Q1 2025 compared to Q1 2024
|
||||||||||||
|
Revenues
|
Operating
Expenses
|
NOI
|
||||||||||
|
Southern California
|
3.8%
|
|
4.1%
|
|
3.7%
|
|
||||||
|
Northern California
|
3.6%
|
|
1.9%
|
|
4.3%
|
|
||||||
|
Seattle Metro
|
2.3%
|
|
7.7%
|
|
0.0%
|
|
||||||
|
Same-Property Portfolio
|
3.4%
|
|
3.8%
|
|
3.3%
|
|
||||||
|
Sequential Change
|
||||||||||||
|
Q1 2025 compared to Q4 2024
|
||||||||||||
|
Revenues
|
Operating
Expenses
|
NOI
|
||||||||||
|
Southern California
|
1.7%
|
|
2.3%
|
|
1.4%
|
|
||||||
|
Northern California
|
1.7%
|
|
2.3%
|
|
1.5%
|
|
||||||
|
Seattle Metro
|
1.0%
|
|
6.7%
|
|
-1.4%
|
|
||||||
|
Same-Property Portfolio
|
1.6%
|
|
3.1%
|
|
0.9%
|
|
||||||
|
Financial Occupancies
|
||||||||||||
|
Quarter Ended
|
||||||||||||
|
3/31/2025
|
12/31/2024
|
3/31/2024
|
||||||||||
|
Southern California
|
95.8%
|
|
95.6%
|
|
96.1%
|
|
||||||
|
Northern California
|
96.8%
|
|
96.2%
|
|
96.2%
|
|
||||||
|
Seattle Metro
|
96.3%
|
|
96.2%
|
|
97.0%
|
|
||||||
|
Same-Property Portfolio
|
96.3%
|
|
95.9%
|
|
96.3%
|
|
||||||
|
Per Diluted
Share
|
||||
|
Guidance midpoint of Core FFO per diluted share for Q1 2025
|
$
|
3.92
|
||
|
NOI from Consolidated Communities
|
0.01
|
|||
|
FFO from Co-Investments
|
0.02
|
|||
|
Interest Expense and Other
|
0.02
|
|||
|
Core FFO per diluted share for Q1 2025 reported
|
$
|
3.97
|
||
|
Per Diluted Share
|
Previous
Range
|
Current
Range
|
||||||
|
Net Income
|
|
$5.79 - $6.29
|
|
$9.19 - $9.69
|
||||
|
Total FFO
|
|
$15.56 - $16.06
|
|
$15.56 - $16.06
|
||||
|
Core FFO
|
|
$15.56 - $16.06
|
|
$15.56 - $16.06
|
||||
|
Q2 2025 Core FFO
|
N/A
|
|
$3.90 - $4.02
|
|||||
|
Same-Property Portfolio Growth(1)
|
|
|||||||
|
Based on 49,446 Apartment Homes
|
|
|
||||||
|
Revenues
|
2.25% to 3.75%
|
2.25% to 3.75%
|
||||||
|
Operating Expenses
|
3.25% to 4.25%
|
3.25% to 4.25%
|
||||||
|
Net Operating Income
|
1.40% to 4.00%
|
1.40% to 4.00%
|
||||||
|
Q2 2025 Blended Net Effective Rate Growth
|
N/A
|
2.50% to 3.50%
|
||||||
|
Investment Assumptions
|
|
|
|
|||||
|
Acquisitions
|
$500.0M to $1.5B
|
$500.0M to $1.5B
|
||||||
|
Dispositions
|
$250.0M to $750.0M
|
$250.0M to $750.0M
|
||||||
|
Structured Finance Redemptions
|
$100.0M to $200.0M
|
$100.0M to $200.0M
|
||||||
|
Development Spending at Pro Rata Share
|
|
$75.0M
|
|
|
$75.0M
|
|
||
|
Revenue-Generating Capital Expenditures
|
|
$60.0M
|
|
|
$60.0M
|
|
||
| (1) |
Reflects guidance on a cash basis. On a GAAP basis, the midpoints of the Company’s same-property revenues and NOI guidance are 3.00% and 2.70%, respectively.
|
|
|
|
Three Months Ended
March 31,
|
|
|||||
|
2025
|
2024
|
|||||||
|
|
||||||||
|
Net income available to common stockholders
|
$
|
203,110
|
$
|
272,731
|
||||
|
Adjustments:
|
||||||||
|
Depreciation and amortization
|
151,287
|
139,733
|
||||||
|
Gains not included in FFO
|
(111,360
|
)
|
(138,326
|
)
|
||||
|
Impairment loss from unconsolidated co-investments
|
-
|
3,726
|
||||||
|
Depreciation and amortization from unconsolidated co-investments
|
14,378
|
18,470
|
||||||
|
Noncontrolling interest related to Operating Partnership units
|
7,279
|
9,599
|
||||||
|
Depreciation attributable to third party ownership and other
|
(46
|
)
|
(389
|
)
|
||||
|
Funds from operations attributable to common stockholders and unitholders
|
$
|
264,648
|
$
|
305,544
|
||||
|
FFO per share-diluted
|
$
|
3.97
|
$
|
4.60
|
||||
|
Expensed acquisition and investment related costs
|
$
|
-
|
$
|
68
|
||||
|
Tax (benefit) expense on unconsolidated co-investments (1)
|
(163
|
)
|
49
|
|||||
|
Realized and unrealized losses (gains) on marketable securities, net
|
91
|
(3,351
|
)
|
|||||
|
Provision for credit losses
|
(3
|
)
|
47
|
|||||
|
Equity income from non-core co-investments (2)
|
(1,716
|
)
|
(5,870
|
)
|
||||
|
Loss on early retirement of debt
|
762
|
-
|
||||||
|
Co-investment promote income
|
-
|
(1,531
|
)
|
|||||
|
General and administrative and other, net (3)
|
1,276
|
2,541
|
||||||
|
Insurance reimbursements, legal settlements, and other, net (4)
|
(361
|
)
|
(42,814
|
)
|
||||
|
Core funds from operations attributable to common stockholders and unitholders
|
$
|
264,534
|
$
|
254,683
|
||||
|
Core FFO per share-diluted
|
$
|
3.97
|
$
|
3.83
|
||||
|
Weighted average number of shares outstanding diluted (5)
|
66,656,852
|
66,470,819
|
||||||
|
|
(1) |
Represents tax related to net unrealized gains or losses on technology co-investments.
|
|
|
(2) |
Represents the Company’s share of co-investment income or loss from technology co-investments.
|
|
|
(3) |
Includes political advocacy costs of $0.1 million and $1.9 million for the three months ended March 31, 2025 and 2024, respectively.
|
|
|
(4) |
During the three months ended March 31, 2024, the Company settled two lawsuits related to construction defects at two communities and received cash recoveries of $42.5 million. The Company determined that all
uncertainties were resolved upon receipt of cash and recorded a gain which was excluded from Core FFO. There were no material gains from legal settlements during the three months ended March 31, 2025.
|
|
|
(5) |
Assumes conversion of all outstanding limited partnership units in Essex Portfolio, L.P. (the “Operating Partnership”) into shares of the Company’s common stock and excludes DownREIT
limited partnership units.
|
|
Three Months Ended
March 31, |
||||||||
|
|
2025
|
2024
|
||||||
|
Earnings from operations
|
$
|
257,081
|
$
|
132,359
|
||||
|
Adjustments:
|
||||||||
|
Corporate-level property management expenses
|
12,332
|
11,099
|
||||||
|
Depreciation and amortization
|
151,287
|
139,733
|
||||||
|
Management and other fees from affiliates
|
(2,494
|
)
|
(2,713
|
)
|
||||
|
General and administrative
|
16,292
|
17,171
|
||||||
|
Expensed acquisition and investment related costs
|
-
|
68
|
||||||
|
Gain on sale of real estate and land
|
(111,030
|
)
|
-
|
|||||
|
NOI
|
323,468
|
297,717
|
||||||
|
Less: Non-same property NOI
|
(38,575
|
)
|
(21,879
|
)
|
||||
|
Same-Property NOI
|
$
|
284,893
|
$
|
275,838
|
||||
|
|
|
Three Months Ended
March 31,
|
|
|||||
|
|
2025 | 2024 | ||||||
|
Revenues:
|
||||||||
|
Rental and other property
|
$
|
462,089
|
$
|
424,215
|
||||
|
Management and other fees from affiliates
|
2,494
|
2,713
|
||||||
|
464,583
|
426,928
|
|||||||
|
Expenses:
|
||||||||
|
Property operating
|
138,621
|
126,498
|
||||||
|
Corporate-level property management expenses
|
12,332
|
11,099
|
||||||
|
Depreciation and amortization
|
151,287
|
139,733
|
||||||
|
General and administrative
|
16,292
|
17,171
|
||||||
|
Expensed acquisition and investment related costs
|
-
|
68
|
||||||
|
318,532
|
294,569
|
|||||||
|
Gain on sale of real estate and land
|
111,030
|
-
|
||||||
|
Earnings from operations
|
257,081
|
132,359
|
||||||
|
Interest expense, net (1)
|
(61,532
|
)
|
(55,137
|
)
|
||||
|
Interest and other income
|
4,289
|
57,275
|
||||||
|
Equity income from co-investments
|
13,209
|
12,366
|
||||||
|
Tax benefit (expense) on unconsolidated co-investments
|
163
|
(49
|
)
|
|||||
|
Loss on early retirement of debt
|
(762
|
)
|
-
|
|||||
|
Gain on remeasurement of co-investment
|
330
|
138,326
|
||||||
|
Net income
|
212,778
|
285,140
|
||||||
|
Net income attributable to noncontrolling interest
|
(9,668
|
)
|
(12,409
|
)
|
||||
|
Net income available to common stockholders
|
$
|
203,110
|
$
|
272,731
|
||||
|
Net income per share - basic
|
$
|
3.16
|
$
|
4.25
|
||||
|
Shares used in income per share - basic
|
64,314,899
|
64,205,086
|
||||||
|
Net income per share - diluted
|
$
|
3.16
|
$
|
4.25
|
||||
|
Shares used in income per share - diluted
|
64,349,899
|
64,212,006
|
||||||
| (1) |
Refer to page S-17.2, the section titled "Interest Expense, Net" for additional information.
|
|
|
|
Three Months Ended
March 31,
|
|
|||||
|
|
2025
|
2024 | ||||||
|
Rental and other property
|
||||||||
|
Rental income
|
$
|
455,860
|
$
|
417,236
|
||||
|
Other property
|
6,229
|
6,979
|
||||||
|
Rental and other property
|
$
|
462,089
|
$
|
424,215
|
||||
|
Property operating expenses
|
||||||||
|
Real estate taxes
|
$
|
52,594
|
$
|
46,920
|
||||
|
Administrative
|
15,260
|
13,809
|
||||||
|
Maintenance and repairs
|
14,742
|
14,850
|
||||||
|
Personnel costs
|
26,251
|
24,424
|
||||||
|
Utilities
|
29,774
|
26,495
|
||||||
|
Property operating expenses
|
$
|
138,621
|
$
|
126,498
|
||||
|
Interest and other income
|
||||||||
|
Marketable securities and other income
|
$
|
4,016
|
$
|
11,175
|
||||
|
Realized and unrealized (losses) gains on marketable securities, net
|
(91
|
)
|
3,351
|
|||||
|
Provision for credit losses
|
3
|
(47
|
)
|
|||||
|
Insurance reimbursements, legal settlements, and other, net
|
361
|
42,796
|
||||||
|
Interest and other income
|
$
|
4,289
|
$
|
57,275
|
||||
|
Equity income from co-investments
|
||||||||
|
Equity loss from co-investments
|
$
|
(302
|
)
|
$
|
(3,552
|
)
|
||
|
Income from preferred equity investments
|
11,795
|
12,225
|
||||||
|
Equity income from non-core co-investments
|
1,716
|
5,870
|
||||||
|
Insurance reimbursements, legal settlements, and other, net
|
-
|
18
|
||||||
|
Impairment loss from unconsolidated co-investment
|
-
|
(3,726
|
)
|
|||||
|
Co-investment promote income
|
-
|
1,531
|
||||||
|
Equity income from co-investments
|
$
|
13,209
|
$
|
12,366
|
||||
|
Noncontrolling interest
|
||||||||
|
Limited partners of Essex Portfolio, L.P.
|
$
|
7,279
|
$
|
9,599
|
||||
|
DownREIT limited partners' distributions
|
2,339
|
2,292
|
||||||
|
Third-party ownership interest
|
50
|
518
|
||||||
|
Noncontrolling interest
|
$
|
9,668
|
$
|
12,409
|
||||
|
|
Three Months Ended
March 31,
|
|
|
|
|
|||||||
|
|
2025 | 2024 |
|
% Change
|
||||||||
|
Funds from operations attributable to common stockholders and unitholders (FFO)
|
||||||||||||
|
Net income available to common stockholders
|
$
|
203,110
|
$
|
272,731
|
||||||||
|
Adjustments:
|
||||||||||||
|
Depreciation and amortization
|
151,287
|
139,733
|
||||||||||
|
Gains not included in FFO
|
(111,360
|
)
|
(138,326
|
)
|
||||||||
|
Impairment loss from unconsolidated co-investments
|
-
|
3,726
|
||||||||||
|
Depreciation and amortization from unconsolidated co-investments
|
14,378
|
18,470
|
||||||||||
|
Noncontrolling interest related to Operating Partnership units
|
7,279
|
9,599
|
||||||||||
|
Depreciation attributable to third party ownership and other (2)
|
(46
|
)
|
(389
|
)
|
||||||||
|
Funds from operations attributable to common stockholders and unitholders
|
$
|
264,648
|
$
|
305,544
|
||||||||
|
FFO per share-diluted
|
$
|
3.97
|
$
|
4.60
|
-13.7%
|
|
||||||
|
Components of the change in FFO
|
||||||||||||
|
Non-core items:
|
||||||||||||
|
Expensed acquisition and investment related costs
|
$
|
-
|
$
|
68
|
||||||||
|
Tax (benefit) expense on unconsolidated co-investments (3)
|
(163
|
)
|
49
|
|||||||||
|
Realized and unrealized losses (gains) on marketable securities, net
|
91
|
(3,351
|
)
|
|||||||||
|
Provision for credit losses
|
(3
|
)
|
47
|
|||||||||
|
Equity income from non-core co-investments (4)
|
(1,716
|
)
|
(5,870
|
)
|
||||||||
|
Loss on early retirement of debt
|
762
|
-
|
||||||||||
|
Co-investment promote income
|
-
|
(1,531
|
)
|
|||||||||
|
General and administrative and other, net (5)
|
1,276
|
2,541
|
||||||||||
|
Insurance reimbursements, legal settlements, and other, net (6)
|
(361
|
)
|
(42,814
|
)
|
||||||||
|
Core funds from operations attributable to common stockholders and unitholders
|
$
|
264,534
|
$
|
254,683
|
||||||||
|
Core FFO per share-diluted
|
$
|
3.97
|
$
|
3.83
|
3.7%
|
|
||||||
|
Weighted average number of shares outstanding diluted (7)
|
66,656,852
|
66,470,819
|
||||||||||
| (1) |
Refer to page S-17.2, the section titled "Funds from Operations ("FFO") and Core FFO" for additional information on the Company's definition and use of FFO and Core FFO.
|
| (2) |
The Company consolidates certain co-investments. The noncontrolling interest's share of net operating income in these investments for the three months ended March 31,
2025 was $0.1 million.
|
| (3) |
Represents tax related to net unrealized gains or losses on technology co-investments.
|
| (4) |
Represents the Company’s share of co-investment income or loss from technology co-investments.
|
| (5) |
Includes political advocacy costs of $0.1 million and $1.9 million for the three months ended March 31, 2025 and 2024, respectively.
|
| (6) |
During the three months ended March 31, 2024, the Company settled two lawsuits related to construction defects at two communities and received cash recoveries of $42.5 million. The Company determined that all
uncertainties were resolved upon receipt of cash and recorded a gain which was excluded from Core FFO. There were no material gains from legal settlements during the three months ended March 31, 2025.
|
| (7) |
Assumes conversion of all outstanding limited partnership units in Essex Portfolio, L.P. (the “Operating Partnership”) into shares of the Company’s common stock and excludes DownREIT
limited partnership units.
|
|
March 31, 2025
|
December 31, 2024
|
|||||||
|
Real estate investments:
|
||||||||
|
Land and land improvements
|
$
|
3,271,624
|
$
|
3,246,789
|
||||
|
Buildings and improvements
|
14,505,983
|
14,342,729
|
||||||
|
17,777,607
|
17,589,518
|
|||||||
|
Less: accumulated depreciation
|
(6,171,689
|
)
|
(6,150,618
|
)
|
||||
|
11,605,918
|
11,438,900
|
|||||||
|
Real estate under development
|
96,268
|
52,682
|
||||||
|
Co-investments
|
906,686
|
935,014
|
||||||
|
Real estate held for sale
|
112,173
|
-
|
||||||
|
12,721,045
|
12,426,596
|
|||||||
|
Cash and cash equivalents, including restricted cash
|
107,862
|
75,846
|
||||||
|
Marketable securities
|
76,013
|
69,794
|
||||||
|
Notes and other receivables
|
133,724
|
206,706
|
||||||
|
Operating lease right-of-use assets
|
53,351
|
51,556
|
||||||
|
Prepaid expenses and other assets
|
94,263
|
96,861
|
||||||
|
Total assets
|
$
|
13,186,258
|
$
|
12,927,359
|
||||
|
Unsecured debt, net
|
$
|
5,870,662
|
$
|
5,473,788
|
||||
|
Mortgage notes payable, net
|
919,590
|
989,884
|
||||||
|
Lines of credit
|
-
|
137,945
|
||||||
|
Distributions in excess of investments in co-investments
|
84,295
|
79,273
|
||||||
|
Operating lease liabilities
|
54,149
|
52,473
|
||||||
|
Other liabilities
|
477,611
|
442,757
|
||||||
|
Total liabilities
|
7,406,307
|
7,176,120
|
||||||
|
Redeemable noncontrolling interest
|
34,376
|
30,849
|
||||||
|
Equity:
|
||||||||
|
Common stock
|
6
|
6
|
||||||
|
Additional paid-in capital
|
6,672,346
|
6,668,047
|
||||||
|
Distributions in excess of accumulated earnings
|
(1,117,971
|
)
|
(1,155,662
|
)
|
||||
|
Accumulated other comprehensive income, net
|
15,620
|
24,655
|
||||||
|
Total stockholders' equity
|
5,570,001
|
5,537,046
|
||||||
|
Noncontrolling interest
|
175,574
|
183,344
|
||||||
|
Total equity
|
5,745,575
|
5,720,390
|
||||||
|
Total liabilities and equity
|
$
|
13,186,258
|
$
|
12,927,359
|
||||
| |
Scheduled principal payments, unamortized premiums (discounts) and (debt issuance costs) are as follows - excludes lines of credit:
|
||||||||||||||||||||||||||||||||
|
Unsecured
|
Secured
|
Total
|
Weighted
Average
Interest
Rate
|
Percentage
of Total
Debt
|
|||||||||||||||||||||||||||||
|
Weighted Average
|
|||||||||||||||||||||||||||||||||
|
Balance
Outstanding
|
Interest
Rate
|
Maturity
in Years
|
|||||||||||||||||||||||||||||||
|
Unsecured Debt, net
|
|||||||||||||||||||||||||||||||||
|
Bonds public - fixed rate
|
$
|
5,600,000
|
3.6
|
%
|
6.9
|
2025 (1)
|
$
|
500,000
|
$
|
143,249
|
$
|
643,249
|
3.5
|
%
|
9.4
|
%
|
|||||||||||||||||
|
Term loan (2)
|
300,000
|
4.2
|
%
|
2.5
|
2026
|
450,000
|
194,405
|
644,405 |
3.6
|
%
|
9.4
|
%
|
|||||||||||||||||||||
|
Unamortized discounts and debt
|
2027 (2)
|
650,000
|
84,397 |
734,397 |
3.9
|
%
|
10.8
|
%
|
|||||||||||||||||||||||||
|
issuance costs, net
|
(29,338
|
) |
-
|
-
|
2028
|
450,000
|
68,332
|
518,332
|
2.2
|
%
|
7.6 |
%
|
|||||||||||||||||||||
|
Total unsecured debt, net
|
5,870,662
|
3.6
|
%
|
6.7
|
2029
|
500,000
|
1,456
|
501,456
|
4.1
|
%
|
7.4
|
%
|
|||||||||||||||||||||
|
Mortgage Notes Payable, net
|
2030
|
550,000
|
1,592
|
551,592
|
3.1
|
%
|
8.1
|
%
|
|||||||||||||||||||||||||
|
Fixed rate - secured
|
605,768
|
4.3
|
%
|
4.8
|
2031
|
600,000
|
1,740
|
601,740
|
2.3
|
%
|
8.8
|
%
|
|||||||||||||||||||||
|
Variable rate - secured (3)
|
316,552
|
3.7
|
%
|
9.2
|
2032
|
650,000
|
1,903
|
651,903
|
2.6
|
%
|
9.6
|
%
|
|||||||||||||||||||||
|
Unamortized premiums and debt
|
2033
|
-
|
330,126
|
330,126
|
4.9
|
%
|
4.8
|
%
|
|||||||||||||||||||||||||
|
issuance costs, net
|
(2,730
|
) |
-
|
-
|
2034
|
550,000
|
2,275
|
552,275
|
5.5
|
%
|
8.1
|
%
|
|||||||||||||||||||||
|
Total mortgage notes payable, net
|
919,590
|
4.1
|
%
|
6.3
|
2035
|
400,000 |
2,487
|
402,487
|
5.5
|
%
|
5.9
|
%
|
|||||||||||||||||||||
|
Unsecured Lines of Credit
|
Thereafter
|
600,000
|
90,358
|
690,358
|
3.6
|
%
|
10.1
|
%
|
|||||||||||||||||||||||||
|
Line of credit (4)
|
-
|
5.3
|
%
|
N/A
|
Subtotal
|
5,900,000
|
922,320
|
6,822,320
|
3.7
|
%
|
100.0
|
%
|
|||||||||||||||||||||
|
Line of credit (5)
|
-
|
5.3
|
%
|
N/A
|
Debt Issuance Costs
|
(28,138
|
)
|
(2,407
|
)
|
(30,545
|
)
|
-
|
-
|
||||||||||||||||||||
|
Total lines of credit
|
-
|
5.3
|
%
|
N/A
|
(Discounts)/Premiums
|
(1,200)
|
(323
|
)
|
(1,523
|
)
|
-
|
-
|
|||||||||||||||||||||
|
Total debt, net
|
$
|
6,790,252
|
3.7
|
%
|
6.7
|
Total
|
$
|
5,870,662
|
$
|
919,590
|
$
|
6,790,252
|
3.7
|
%
|
100.0
|
%
|
|||||||||||||||||
| (1) | In April 2025, the Company repaid its $500.0 million unsecured notes at maturity. |
| (2) | The unsecured term loan has a variable interest rate of Adjusted SOFR plus 0.85% and matures in October 2025 with two remaining 12-month extension options, exercisable at the Company’s option. This loan has been swapped to an all-in fixed rate of 4.2% and the swap has a termination date of October 2026. |
| (3) | $220.6 million of variable rate debt is tax exempt to the note holders. $47.5 million of SOFR-based variable rate debt is swapped at a fixed rate of 2.83% through March 2026. |
| (4) | This unsecured line of credit facility has a capacity of $1.2 billion, a scheduled maturity date in January 2029 and two 6-month extension options, exercisable at the Company’s option. The underlying interest rate on this line is Adjusted SOFR plus 0.765%, which is based on a tiered rate structure tied to the Company's corporate ratings and further adjusted by the facility's Sustainability Metric Adjustment feature. |
| (5) | The unsecured line of credit facility has a capacity of $75 million and a scheduled maturity date in July 2026. The underlying interest rate on this line is Adjusted SOFR plus 0.765%, which is based on a tiered rate structure tied to the Company's corporate ratings and further adjusted by the facility's Sustainability Metric Adjustment feature. |
|
Capitalization Data
|
Public Bond Covenants (1)
|
Actual
|
Requirement
|
|||||||||
|
Total debt, net
|
$
|
6,790,252
|
|
|||||||||
|
Common stock and potentially dilutive securities
|
Debt to Total Assets:
|
35%
|
|
< 65%
|
||||||||
|
Common stock outstanding
|
64,358
|
|||||||||||
|
Limited partnership units (1)
|
2,283
|
Secured Debt to Total Assets:
|
5%
|
|
< 40%
|
|||||||
|
Options-treasury method
|
39
|
|||||||||||
|
Total shares of common stock and potentially dilutive securities
|
66,680
|
Interest Coverage:
|
532%
|
|
> 150%
|
|||||||
|
|
||||||||||||
|
Common stock price per share as of March 31, 2025
|
$
|
306.57
|
Unsecured Debt Ratio (2):
|
286%
|
|
> 150%
|
||||||
|
|
||||||||||||
|
Total equity capitalization
|
$
|
20,442,088
|
Selected Credit Ratios (3)
|
Actual
|
||||||||
|
|
||||||||||||
|
Total market capitalization
|
$
|
27,232,340
|
Net Indebtedness Divided by Adjusted EBITDAre, normalized and annualized:
|
5.6 |
||||||||
|
Ratio of debt to total market capitalization
|
24.9
|
% | |
Unencumbered NOI to Adjusted Total NOI:
|
92% |
|||||||
|
|
||||||||||||
|
Credit Ratings
|
|
|
|
|||||||||
|
Rating Agency
|
Rating | Outlook | ||||||||||
|
Moody's
|
Baa1 | Stable |
(1)
Refer to page S-17.4 for additional information on the Company's Public Bond Covenants.
|
|||||||||
|
Standard & Poor's
|
BBB+ | Stable |
(2)
Unsecured Debt Ratio is unsecured assets (excluding investments in co-investments) divided by unsecured indebtedness.
|
|||||||||
|
(1)
Assumes conversion of all outstanding limited partnership units in the Operating Partnership into shares of the Company's common stock.
|
(3)
Refer to pages S-17.1 to S-17.4, the section titled "Reconciliations of Non-GAAP Financial Measures and Other Terms" for additional information on the Company's Selected Credit Ratios.
|
|||||||||||
|
Apartment Homes
|
Average Monthly Rental Rate (1)
|
Percent of NOI (2)
|
||||||||||||||||||||||||||||||||||||||
|
Region - County
|
Consolidated
|
Unconsolidated
Co-investments
|
Apartment
Homes in
Development (3)
|
Total
|
Consolidated
|
Unconsolidated
Co-investments (4)
|
Total (4)
|
Consolidated
|
Unconsolidated
Co-investments (4)
|
Total (4)
|
||||||||||||||||||||||||||||||
|
Southern California
|
||||||||||||||||||||||||||||||||||||||||
|
Los Angeles County
|
9,288
|
1,586
|
-
|
10,874
|
$
|
2,673
|
$
|
2,561
|
$
|
2,663
|
15.8
|
%
|
20.0
|
%
|
16.1
|
%
|
||||||||||||||||||||||||
|
Orange County
|
6,084
|
265
|
-
|
6,349
|
2,808
|
2,474
|
2,801
|
11.8
|
%
|
3.4
|
%
|
11.3
|
%
|
|||||||||||||||||||||||||||
|
San Diego County
|
5,444
|
443
|
-
|
5,887
|
2,668
|
3,062
|
2,684
|
10.3
|
%
|
6.3
|
%
|
10.1
|
%
|
|||||||||||||||||||||||||||
|
Ventura County and Other
|
2,756
|
373
|
-
|
3,129
|
2,487
|
3,166
|
2,536
|
5.2
|
%
|
6.9
|
%
|
5.3
|
%
|
|||||||||||||||||||||||||||
|
Total Southern California
|
23,572
|
2,667
|
-
|
26,239
|
2,685
|
2,716
|
2,687
|
43.1
|
%
|
36.6
|
%
|
42.8
|
%
|
|||||||||||||||||||||||||||
|
Northern California
|
||||||||||||||||||||||||||||||||||||||||
|
Santa Clara County (5)
|
9,765
|
997
|
-
|
10,762
|
3,072
|
3,030
|
3,069
|
20.9
|
%
|
13.9
|
%
|
20.5
|
%
|
|||||||||||||||||||||||||||
|
Alameda County
|
4,384
|
1,328
|
-
|
5,712
|
2,592
|
2,591
|
2,592
|
7.1
|
%
|
16.7
|
%
|
7.6
|
%
|
|||||||||||||||||||||||||||
|
San Mateo County
|
2,483
|
195
|
543
|
3,221
|
3,314
|
3,790
|
3,332
|
4.6
|
%
|
3.0
|
%
|
4.5
|
%
|
|||||||||||||||||||||||||||
|
Contra Costa County
|
2,619
|
-
|
-
|
2,619
|
2,743
|
-
|
2,743
|
5.0
|
%
|
0.0
|
%
|
4.7
|
%
|
|||||||||||||||||||||||||||
|
San Francisco
|
1,356
|
537
|
-
|
1,893
|
2,905
|
3,311
|
2,972
|
2.4
|
%
|
7.6
|
%
|
2.7
|
%
|
|||||||||||||||||||||||||||
|
Total Northern California
|
20,607
|
3,057
|
543
|
24,207
|
2,946
|
2,919
|
2,944
|
40.0
|
%
|
41.2
|
%
|
40.0
|
%
|
|||||||||||||||||||||||||||
|
Seattle Metro
|
10,899
|
1,970
|
-
|
12,869
|
2,233
|
2,161
|
2,226
|
16.9
|
%
|
22.2
|
%
|
17.2
|
%
|
|||||||||||||||||||||||||||
|
Total
|
55,078
|
7,694
|
543
|
63,315
|
$
|
2,693
|
$
|
2,657
|
$
|
2,691
|
100.0
|
%
|
100.0
|
%
|
100.0
|
%
|
||||||||||||||||||||||||
| (1) |
Average monthly rental rate is defined as the total scheduled monthly rental income (actual rent for occupied apartment homes plus market rent for vacant apartment homes) for the
quarter ended March 31, 2025, divided by the number of apartment homes as of March 31, 2025.
|
| (2) |
Represents the percentage of actual NOI for the quarter ended March 31, 2025. See section titled "Net Operating Income ("NOI") and Same-Property NOI Reconciliations" on page
S-17.3.
|
| (3) |
Includes development communities with no rental income.
|
| (4) |
At Company's pro rata share.
|
| (5) |
Includes all communities in Santa Clara County and one community in Santa Cruz County.
|
|
Apartment
Homes
|
Q1 '25
|
Q4 '24
|
Q3 '24
|
Q2 '24
|
Q1 '24
|
|||||||||||||||||||
|
Rental and other property revenues:
|
||||||||||||||||||||||||
|
Same-property
|
49,446
|
$
|
409,147
|
$
|
402,869
|
$
|
405,085
|
$
|
400,433
|
$
|
395,584
|
|||||||||||||
|
Acquisitions
(2)
|
4,510
|
34,770
|
26,772
|
16,964
|
12,824
|
1,598
|
||||||||||||||||||
|
Non-residential/other, net (3)
|
1,122
|
18,560
|
21,632
|
26,313
|
27,036
|
27,096
|
||||||||||||||||||
|
Straight-line rent concessions (4)
|
-
|
(388
|
)
|
780
|
(227
|
)
|
(511
|
)
|
(63
|
)
|
||||||||||||||
|
Total rental and other property revenues
|
55,078
|
462,089
|
452,053
|
448,135
|
439,782
|
424,215
|
||||||||||||||||||
|
Property operating expenses:
|
||||||||||||||||||||||||
|
Same-property
|
124,254
|
120,554
|
124,051
|
117,645
|
119,746
|
|||||||||||||||||||
|
Acquisitions
(2)
|
10,393
|
7,848
|
4,870
|
3,585
|
479
|
|||||||||||||||||||
|
Non-residential/other, net (3) (5)
|
3,974
|
5,310
|
5,871
|
5,304
|
6,273
|
|||||||||||||||||||
|
Total property operating expenses
|
138,621
|
133,712
|
134,792
|
126,534
|
126,498
|
|||||||||||||||||||
|
Net operating income (NOI):
|
||||||||||||||||||||||||
|
Same-property
|
284,893
|
282,315
|
281,034
|
282,788
|
275,838
|
|||||||||||||||||||
|
Acquisitions
(2)
|
24,377
|
18,924
|
12,094
|
9,239
|
1,119
|
|||||||||||||||||||
|
Non-residential/other, net (3)
|
14,586
|
16,322
|
20,442
|
21,732
|
20,823
|
|||||||||||||||||||
|
Straight-line rent concessions (4)
|
(388
|
)
|
780
|
(227
|
)
|
(511
|
)
|
(63
|
)
|
|||||||||||||||
|
Total NOI
|
$
|
323,468
|
$
|
318,341
|
$
|
313,343
|
$
|
313,248
|
$
|
297,717
|
||||||||||||||
|
Same-property metrics
|
||||||||||||||||||||||||
|
Operating margin
|
70
|
%
|
70
|
%
|
69
|
%
|
71
|
%
|
70
|
%
|
||||||||||||||
|
Annualized turnover
|
35
|
%
|
37
|
%
|
45
|
%
|
41
|
%
|
37
|
%
|
||||||||||||||
|
Financial occupancy
|
96.3
|
%
|
95.9
|
%
|
96.2
|
%
|
96.2
|
%
|
96.3
|
%
|
||||||||||||||
|
Delinquency as a % of scheduled rent (6)
|
0.5
|
%
|
1.3
|
%
|
0.7
|
%
|
1.0
|
%
|
1.3
|
%
|
||||||||||||||
|
New lease net effective rate growth
|
1.0
|
%
|
-1.9
|
%
|
0.6
|
%
|
1.6
|
%
|
0.1
|
%
|
||||||||||||||
|
Renewal net effective rate growth
|
3.7
|
%
|
3.8
|
%
|
3.8
|
%
|
4.6
|
%
|
3.9
|
%
|
||||||||||||||
|
Blended net effective rate growth
|
2.8
|
%
|
1.6
|
%
|
2.5
|
%
|
3.4
|
%
|
2.2
|
%
|
||||||||||||||
| (1) |
Includes consolidated communities only.
|
| (2) |
Acquisitions include properties acquired which did not have comparable stabilized results as of January 1, 2024.
|
| (3) |
Non-residential/other, net consists of revenues generated from retail space, commercial properties, held for sale properties, disposition properties, properties undergoing
significant construction activities that do not meet our redevelopment criteria and two communities located in the California counties of Santa Barbara and Santa Cruz, which the Company does not consider its core markets.
|
| (4) |
Represents straight-line concessions for residential operating communities. Same-property revenues reflect concessions on a cash basis. Total Rental and Other Property Revenues
reflect concessions on a straight-line basis in accordance with U.S. GAAP.
|
| (5) |
Includes other expenses and intercompany eliminations pertaining to self-insurance.
|
| (6) |
In the fourth quarter of 2024, the Company recorded a non-cash charge to fully eliminate its remaining $2.8 million residential accounts receivable balance. Excluding this
adjustment, reported delinquency would have been 0.6% for the fourth quarter of 2024. There were no non-cash charges recorded for all other periods, accordingly, the delinquency in those periods are reported on a cash basis.
|
|
|
Average Monthly Rental Rate
|
Financial Occupancy
|
Gross Revenues
|
Sequential Gross
Revenues
|
||||||||||||||||||||||||||||||||||||||||||||||||
|
Region - County
|
Apartment
Homes
|
Q1 '25
% of
Actual NOI
|
Q1 '25
|
Q1 '24
|
%
Change
|
Q1 '25
|
Q1 '24
|
%
Change
|
Q1 '25
|
Q1 '24
|
%
Change
|
Q4 '24
|
%
Change
|
|||||||||||||||||||||||||||||||||||||||
|
Southern California
|
||||||||||||||||||||||||||||||||||||||||||||||||||||
|
Los Angeles County
|
9,288
|
17.6
|
%
|
$
|
2,673
|
$
|
2,658
|
0.6
|
%
|
95.3
|
%
|
95.5
|
%
|
-0.2
|
%
|
$
|
75,770
|
$
|
72,769
|
4.1
|
%
|
$
|
73,872
|
2.6
|
%
|
|||||||||||||||||||||||||||
|
Orange County
|
4,523
|
9.7
|
%
|
2,704
|
2,610
|
3.6
|
%
|
96.1
|
%
|
96.6
|
%
|
-0.5
|
%
|
37,340
|
36,043
|
3.6
|
%
|
36,788
|
1.5
|
%
|
||||||||||||||||||||||||||||||||
|
San Diego County
|
4,588
|
9.7
|
%
|
2,692
|
2,606
|
3.3
|
%
|
95.8
|
%
|
96.6
|
%
|
-0.8
|
%
|
37,743
|
36,713
|
2.8
|
%
|
37,734
|
0.0
|
%
|
||||||||||||||||||||||||||||||||
|
Ventura County
|
2,255
|
4.7
|
%
|
2,465
|
2,366
|
4.2
|
%
|
97.1
|
%
|
96.7
|
%
|
0.4
|
%
|
17,570
|
16,703
|
5.2
|
%
|
17,272
|
1.7
|
%
|
||||||||||||||||||||||||||||||||
|
Total Southern California
|
20,654
|
41.7
|
%
|
2,661
|
2,604
|
2.2
|
%
|
95.8
|
%
|
96.1
|
%
|
-0.3
|
%
|
168,423
|
162,228
|
3.8
|
%
|
165,666
|
1.7
|
%
|
||||||||||||||||||||||||||||||||
|
Northern California
|
||||||||||||||||||||||||||||||||||||||||||||||||||||
|
Santa Clara County
|
8,653
|
20.6
|
%
|
3,053
|
2,977
|
2.6
|
%
|
96.7
|
%
|
96.7
|
%
|
0.0
|
%
|
81,480
|
78,893
|
3.3
|
%
|
80,007
|
1.8
|
%
|
||||||||||||||||||||||||||||||||
|
Alameda County
|
3,959
|
7.3
|
%
|
2,578
|
2,590
|
-0.5
|
%
|
96.5
|
%
|
95.4
|
%
|
1.2
|
%
|
31,918
|
31,161
|
2.4
|
%
|
31,666
|
0.8
|
%
|
||||||||||||||||||||||||||||||||
|
San Mateo County
|
1,864
|
4.4
|
%
|
3,235
|
3,178
|
1.8
|
%
|
97.4
|
%
|
95.8
|
%
|
1.7
|
%
|
18,947
|
18,004
|
5.2
|
%
|
18,455
|
2.7
|
%
|
||||||||||||||||||||||||||||||||
|
Contra Costa County
|
2,619
|
5.6
|
%
|
2,743
|
2,701
|
1.6
|
%
|
96.8
|
%
|
96.3
|
%
|
0.5
|
%
|
22,408
|
21,735
|
3.1
|
%
|
22,048
|
1.6
|
%
|
||||||||||||||||||||||||||||||||
|
San Francisco
|
1,356
|
2.6
|
%
|
2,905
|
2,867
|
1.3
|
%
|
96.9
|
%
|
95.2
|
%
|
1.8
|
%
|
12,561
|
11,779
|
6.6
|
%
|
12,335
|
1.8
|
%
|
||||||||||||||||||||||||||||||||
|
Total Northern California
|
18,451
|
40.5
|
%
|
2,914
|
2,867
|
1.6
|
%
|
96.8
|
%
|
96.2
|
%
|
0.6
|
%
|
167,314
|
161,572
|
3.6
|
%
|
164,511
|
1.7
|
%
|
||||||||||||||||||||||||||||||||
|
Seattle Metro
|
10,341
|
17.8
|
%
|
2,239
|
2,171
|
3.1
|
%
|
96.3
|
%
|
97.0
|
%
|
-0.7
|
%
|
73,410
|
71,784
|
2.3
|
%
|
72,692
|
1.0
|
%
|
||||||||||||||||||||||||||||||||
|
Total Same-Property
|
49,446
|
100.0
|
%
|
$
|
2,667
|
$
|
2,612
|
2.1
|
%
|
96.3
|
%
|
96.3
|
%
|
0.0
|
%
|
$
|
409,147
|
$
|
395,584
|
3.4
|
%
|
$
|
402,869
|
1.6
|
%
|
|||||||||||||||||||||||||||
|
Based on 49,446 apartment homes
|
||||||||||||||||
|
Q1 '25
|
Q1 '24
|
% Change
|
% of Op.
Ex.
|
|||||||||||||
|
Same-property operating expenses:
|
||||||||||||||||
|
Real estate taxes
|
$
|
46,299
|
$
|
44,077
|
5.0
|
%
|
37.3
|
%
|
||||||||
|
Utilities
|
26,234
|
24,371
|
7.6
|
%
|
21.1
|
%
|
||||||||||
|
Personnel costs
|
23,248
|
22,609
|
2.8
|
%
|
18.7
|
%
|
||||||||||
|
Maintenance and repairs
|
12,949
|
13,631
|
-5.0
|
%
|
10.4
|
%
|
||||||||||
|
Administrative
|
6,854
|
6,815
|
0.6
|
%
|
5.5
|
%
|
||||||||||
|
Insurance and other
|
8,670
|
8,243
|
5.2
|
%
|
7.0
|
%
|
||||||||||
|
Total same-property operating expenses
|
$
|
124,254
|
$
|
119,746
|
3.8
|
%
|
100.0
|
%
|
||||||||
|
Project Name - Location
|
Ownership
%
|
Estimated
Apartment
Homes
|
Estimated
Commercial
sq. feet
|
Incurred
to Date
|
Remaining
Costs
|
Estimated
Total Cost
|
Cost per
Apartment
Home (1)
|
Construction
Start
|
Initial
Occupancy
|
Stabilized
Operations
|
|||||||||||||||||||||||||||||
|
Development Projects - Consolidated (2)
|
|||||||||||||||||||||||||||||||||||||||
|
7 South Linden - South San Francisco, CA
|
100%
|
|
543
|
-
|
$
|
52
|
$
|
259
|
$
|
311
|
$
|
573
|
Q1 2025
|
Q2 2028
|
Q1 2030
|
||||||||||||||||||||||||
|
Total Development Projects - Consolidated
|
543
|
-
|
52
|
259
|
311
|
573
|
|||||||||||||||||||||||||||||||||
|
Land Held for Future Development - Consolidated
|
|||||||||||||||||||||||||||||||||||||||
|
Other Projects - Various
|
100%
|
|
-
|
-
|
44
|
-
|
44
|
||||||||||||||||||||||||||||||||
|
Total Development Pipeline - Consolidated
|
543
|
|
-
|
$
|
96
|
$
|
259
|
$
|
355
|
||||||||||||||||||||||||||||||
|
(1)
|
Net of the estimated allocation to the retail component of the project, as applicable.
|
|
(2)
|
For the first quarter of 2025, the Company's cost includes $0.6 million of capitalized interest and $0.5 million of capitalized overhead.
|
|
Revenue Generating Capital Expenditures (2)
|
Q1 '25
|
Trailing 4
Quarters
|
||||||
|
Same-property portfolio
|
$
|
12,126
|
$
|
65,443
|
||||
|
Non-same property portfolio
|
1,517
|
6,945
|
||||||
|
Total revenue generating capital expenditures
|
$
|
13,643
|
$
|
72,388
|
||||
|
Number of same-property interior renovations
|
760
|
2,325
|
||||||
|
Number of total consolidated interior renovations
|
826
|
2,481
|
||||||
|
Non-Revenue Generating Capital Expenditures (3)
|
Q1 '25
|
Trailing 4
Quarters |
||||||
|
Non-revenue generating capital expenditures
|
$
|
27,397
|
$
|
116,931
|
||||
|
Average apartment homes in quarter
|
54,771
|
53,945
|
||||||
|
Capital expenditures per apartment home
|
$
|
500
|
$
|
2,168
|
||||
| (1) |
The Company incurred $0.1 million of capitalized interest, $5.0 million of capitalized overhead and less than $0.1 million of co-investment fees related to redevelopment in
Q1 2025.
|
| (2) |
Represents revenue generating or expense saving expenditures, such as full-scale redevelopments, interior unit turn renovations, enhanced amenities and certain
sustainability initiatives.
|
| (3) |
Represents roof replacements, paving, building and mechanical systems, exterior painting, siding, etc. Non-revenue generating capital expenditures does not include costs
related to retail, furniture and fixtures, expenditures in which the Company has been reimbursed or expects to be reimbursed, and expenditures incurred due to changes in governmental regulation that the Company would not have
incurred otherwise.
|
|
Weighted
Average
Essex
Ownership
Percentage
|
Apartment
Homes
|
Total
Undepreciated
Book Value
|
Debt
Amount
|
Essex
Book Value
|
Weighted
Average
Borrowing
Rate (1)
|
Remaining
Term of Debt
(in Years)
|
Three Months
Ended
March 31,
2025
|
|||||||||||||||||||||||||
|
Operating and Other Non-Consolidated Joint Ventures
|
NOI
|
|||||||||||||||||||||||||||||||
|
Wesco I, III, IV, V, VI (2)
|
54%
|
|
5,976
|
$
|
2,175,745
|
$
|
1,376,205
|
$
|
136,905
|
3.3
|
%
|
1.7
|
$
|
30,201
|
||||||||||||||||||
|
BEX IV, 500 Folsom
|
50%
|
|
732
|
616,372
|
176,400
|
143,953
|
3.5
|
%
|
21.2
|
5,680
|
||||||||||||||||||||||
|
Other (3)
|
53%
|
|
986
|
385,292
|
291,476
|
88,470
|
3.7
|
%
|
12.3
|
5,400
|
||||||||||||||||||||||
|
Total Operating and Other Non-Consolidated Joint Ventures
|
7,694
|
$
|
3,177,409
|
$
|
1,844,081
|
$
|
369,328
|
3.4
|
%
|
5.2
|
$
|
41,281
|
||||||||||||||||||||
|
Essex Portion
of NOI and
Expenses
|
||||||||||||||||||||||||||||||||
|
NOI
|
$
|
22,528
|
||||||||||||||||||||||||||||||
|
Depreciation
|
(14,378
|
)
|
||||||||||||||||||||||||||||||
|
Interest expense and other, net
|
(8,452
|
)
|
||||||||||||||||||||||||||||||
|
Equity income from non-core co-investments
|
1,716
|
|||||||||||||||||||||||||||||||
|
Net income from operating and other co-investments
|
$
|
1,414
|
||||||||||||||||||||||||||||||
|
Weighted
Average Preferred Return |
Weighted
Average
Expected
Term
|
Income from Preferred Equity Investments
|
||||||||||||||||||||||||||||||
|
Income from preferred equity investments
|
$
|
11,795
|
||||||||||||||||||||||||||||||
|
Preferred Equity Investments (4)
|
$
|
453,063
|
9.4
|
%
|
1.6
|
$
|
11,795
|
|||||||||||||||||||||||||
|
Total Co-investments
|
$
|
822,391
|
$
|
13,209
|
||||||||||||||||||||||||||||
| (1) |
Represents the year-to-date annual weighted average borrowing rate.
|
| (2) |
As of March 31, 2025, the Company’s investments in Wesco I, Wesco III, and Wesco IV were classified as a liability of $82.0 million due
to distributions received in excess of the Company's investment.
|
| (3) |
As of March 31, 2025, the Company’s investment in Expo was classified as a liability of $2.3 million due to distributions received in
excess of the Company's investment. The weighted average Essex ownership percentage excludes our investments in non-core technology co-investments which are carried at fair value.
|
| (4) | As of March 31, 2025, the Company is invested in 17 preferred equity investments. |
|
Acquisitions
|
||||||||||||||||||||||||||
|
Property Name
|
|
Location
|
|
Apartment
Homes
|
|
Year Built
|
|
Essex
Ownership
Percentage
|
|
Entity
|
Date
|
|
Total Contract
Price at
Pro Rata Share
|
|
Price per
Apartment Home (1)
|
|
Average
Monthly Rent
|
|
||||||||
|
The Plaza
|
Foster City, CA
|
307
|
2013
|
100%
|
|
EPLP
|
Jan-25
|
$
|
161,375
|
$
|
512
|
$
|
3,310
|
|||||||||||||
|
One Hundred Grand (2)
|
Foster City, CA
|
166
|
2016
|
N/A
|
EPLP
|
Feb-25
|
105,250
|
615
|
3,881
|
|||||||||||||||||
|
ROEN Menlo Park
|
Menlo Park, CA
|
146
|
2017
|
100%
|
|
EPLP
|
Feb-25
|
78,750
|
539
|
3,647
|
||||||||||||||||
|
Q1 2025
|
619
|
$
|
345,375
|
$
|
546
|
|||||||||||||||||||||
|
2025 Total
|
619
|
$
|
345,375
|
$
|
546
|
|||||||||||||||||||||
| Dispositions | |||||||||||||||||||||||
|
Property Name
|
Location
|
Apartment
Homes
|
Year Built
|
Essex
Ownership
Percentage
|
Entity
|
Date
|
Total Contract
Price at
Pro Rata Share
|
Price per
Apartment Home (1)
|
|||||||||||||||
|
Highridge (2)
|
Rancho Palos Verdes, CA
|
255
|
1972
|
N/A
|
EPLP
|
Feb-25
|
$
|
127,000
|
$
|
498
|
|||||||||||||
|
Q1 2025
|
255
|
$
|
127,000
|
$
|
498
|
||||||||||||||||||
|
2025 Total
|
255
|
$
|
127,000
|
$
|
498
|
||||||||||||||||||
| (1) |
Price per apartment home excludes value allocated to retail space.
|
| (2) |
The noncontrolling members’ ownership interest in Highridge, a community owned by consolidated DownREIT entities prior to its disposition, were transferred to One
Hundred Grand pursuant to the like-kind exchange rules under Section 1031 of the Internal Revenue Code of 1986, as amended.
|
|
|
Three Months Ended
|
2025 Full-Year Guidance Range
|
|||||||||||
|
|
March 31, 2025 (1)
|
Low End
|
|
|
High End
|
Comments about 2025 Full-Year Guidance
|
|||||||
|
|
|||||||||||||
|
Total NOI from Consolidated Communities
|
$
|
323,468
|
$
|
1,293,000
|
$
|
1,320,000
|
Includes a range of same-property NOI growth of 1.4% to 4.0%.
|
||||||
|
Management Fees
|
2,494
|
8,800
|
9,800
|
||||||||||
|
Interest Expense
|
|||||||||||||
|
Interest expense, before capitalized interest
|
|
(62,237
|
)
|
(253,300
|
)
|
(250,200
|
)
|
|
|||||
|
Interest capitalized
|
705
|
3,200
|
4,200
|
||||||||||
|
Net interest expense
|
(61,532
|
)
|
(250,100
|
)
|
(246,000
|
)
|
|||||||
|
Recurring Income and Expenses
|
|||||||||||||
|
Interest and other income
|
4,016
|
16,400
|
17,400
|
||||||||||
|
FFO from co-investments
|
25,871
|
88,100
|
92,100
|
||||||||||
|
General and administrative
|
(15,016
|
)
|
(60,000
|
)
|
(64,000
|
)
|
|||||||
|
Corporate-level property management expenses
|
(12,332
|
)
|
(48,000
|
)
|
(49,000
|
)
|
|||||||
|
Non-controlling interest
|
(2,435
|
)
|
(10,300
|
)
|
(9,300
|
)
|
|||||||
|
Total recurring income and expenses
|
104
|
(13,800
|
)
|
(12,800
|
)
|
||||||||
|
Non-Core Income and Expenses
|
|||||||||||||
|
Expensed acquisition and investment related costs
|
-
|
-
|
-
|
||||||||||
|
Tax benefit on unconsolidated co-investments
|
163
|
163
|
163
|
||||||||||
|
Realized and unrealized gains on marketable securities, net
|
(91
|
)
|
(91
|
)
|
(91
|
)
|
|||||||
|
Provision for credit losses
|
3
|
3
|
3
|
||||||||||
|
Equity income from non-core co-investments
|
1,716
|
1,716
|
1,716
|
||||||||||
|
Loss on early retirement of debt
|
(762
|
)
|
(762
|
)
|
(762
|
)
|
|||||||
|
Co-investment promote income
|
-
|
-
|
-
|
||||||||||
|
General and administrative and other, net
|
(1,276
|
)
|
(1,276
|
)
|
(1,276
|
)
|
|||||||
|
Insurance reimbursements, legal settlements, and other, net
|
361
|
361
|
361
|
||||||||||
|
Total non-core income and expenses
|
114
|
114
|
114
|
||||||||||
|
Funds from Operations (2)
|
$
|
264,648
|
$
|
1,038,014
|
$
|
1,071,114
|
|||||||
|
Funds from Operations per diluted Share
|
$
|
3.97
|
$
|
15.56
|
$
|
16.06
|
|||||||
|
% Change - Funds from Operations
|
-13.7
|
%
|
-2.7
|
%
|
0.4
|
%
|
|||||||
|
Core Funds from Operations (excludes non-core items)
|
$
|
264,534
|
$
|
1,037,900
|
$
|
1,071,000
|
|||||||
|
Core Funds from Operations per diluted Share
|
$
|
3.97
|
$
|
15.56
|
$
|
16.06
|
|||||||
|
% Change - Core Funds from Operations
|
3.7
|
%
|
-0.3
|
%
|
2.9
|
%
|
|||||||
|
EPS - Diluted
|
$
|
3.16
|
$
|
9.19
|
$
|
9.69
|
|||||||
|
Weighted average shares outstanding - FFO calculation
|
66,657
|
66,700
|
66,700
|
||||||||||
| (1) |
All non-core items are excluded from the 2025 actuals and included in the non-core income and expense section of the FFO reconciliation.
|
| (2) |
2025 guidance excludes inestimable projected gain on sale of marketable securities, loss on early retirement of debt, political/legislative costs, and promote
income until they are realized within the reporting period presented in the report.
|
|
2025 Guidance Range (1)
|
||||||||||||||||||||
|
Three Months
|
||||||||||||||||||||
|
Ended March 31,
|
2nd Quarter 2025
|
Full-Year 2025
|
||||||||||||||||||
|
2025
|
Low
|
High
|
Low
|
High
|
||||||||||||||||
|
EPS - diluted
|
$
|
3.16
|
$
|
3.30
|
$
|
3.42
|
$
|
9.19
|
$
|
9.69
|
||||||||||
|
Conversion from GAAP share count
|
(0.11
|
)
|
(0.12
|
)
|
(0.12
|
)
|
(0.33
|
)
|
(0.33
|
)
|
||||||||||
|
Depreciation and amortization
|
2.49
|
2.48
|
2.48
|
9.93
|
9.93
|
|||||||||||||||
|
Noncontrolling interest related to Operating Partnership units
|
0.11
|
0.11
|
0.11
|
0.31
|
0.31
|
|||||||||||||||
|
Gain on sale of real estate and land
|
(1.67
|
)
|
(1.87
|
)
|
(1.87
|
)
|
(3.54
|
)
|
(3.54
|
)
|
||||||||||
|
Gain on remeasurement of co-investment
|
(0.01
|
)
|
-
|
-
|
-
|
-
|
||||||||||||||
|
FFO per share - diluted
|
$
|
3.97
|
$
|
3.90
|
$
|
4.02
|
$
|
15.56
|
$
|
16.06
|
||||||||||
|
Expensed acquisition and investment related costs
|
-
|
-
|
-
|
-
|
-
|
|||||||||||||||
|
Tax benefit on unconsolidated co-investments
|
-
|
-
|
-
|
-
|
-
|
|||||||||||||||
|
Realized and unrealized gains on marketable securities, net
|
-
|
-
|
-
|
-
|
-
|
|||||||||||||||
|
Provision for credit losses
|
-
|
-
|
-
|
-
|
-
|
|||||||||||||||
|
Equity income from non-core co-investments
|
(0.03
|
)
|
-
|
-
|
(0.03
|
)
|
(0.03
|
)
|
||||||||||||
|
Loss on early retirement of debt
|
0.01
|
-
|
-
|
0.01
|
0.01
|
|||||||||||||||
|
Co-investment promote income
|
-
|
-
|
-
|
-
|
-
|
|||||||||||||||
|
General and administrative and other, net
|
0.02
|
-
|
-
|
0.02
|
0.02
|
|||||||||||||||
|
Insurance reimbursements, legal settlements, and other, net
|
-
|
-
|
-
|
-
|
-
|
|||||||||||||||
|
Core FFO per share - diluted
|
$
|
3.97
|
$
|
3.90
|
$
|
4.02
|
$
|
15.56
|
$
|
16.06
|
||||||||||
| (1) |
2025 guidance excludes inestimable projected gain on sale of real estate and land, gain on sale of marketable securities, loss on early retirement of debt, political/legislative
costs, and promote income until they are realized within the reporting period presented in the report.
|
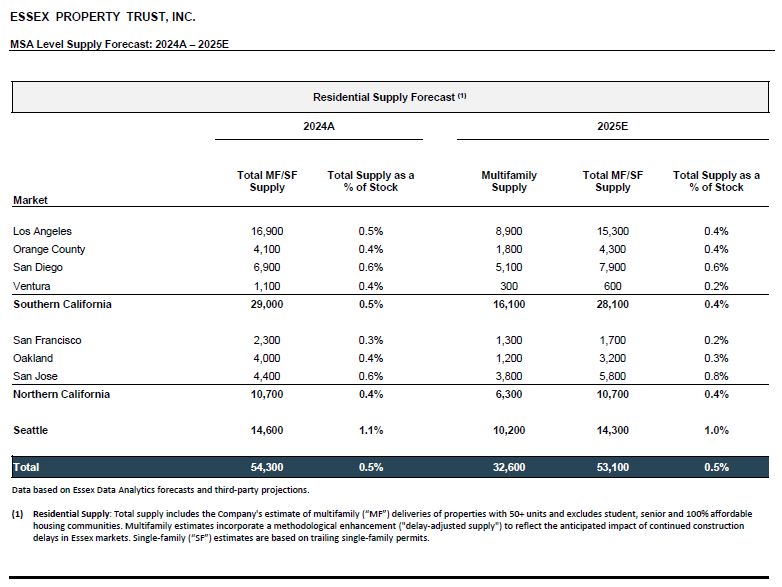
|
(Dollars in thousands)
|
|
Three
Months Ended
March 31,
2025
|
|
|
|
Net income available to common stockholders
|
$
|
203,110
|
|
|
|
Adjustments:
|
||||
|
Net income attributable to noncontrolling interest
|
9,668
|
|||
|
Interest expense, net (1)
|
61,532
|
|||
|
Depreciation and amortization
|
151,287
|
|||
|
Income tax provision
|
89
|
|||
|
Gain on sale of real estate and land
|
(111,030
|
)
|
||
|
Gain on remeasurement of co-investment
|
(330
|
)
|
||
|
Co-investment EBITDAre adjustments
|
22,683
|
|||
|
EBITDAre
|
337,009
|
|||
|
Realized and unrealized losses on marketable securities, net
|
91
|
|||
|
Provision for credit losses
|
(3
|
)
|
||
|
Equity income from non-core co-investments
|
(1,716
|
)
|
||
|
Tax benefit (expense) on unconsolidated co-investments
|
(163
|
)
|
||
|
General and administrative and other, net
|
1,276
|
|||
|
Insurance reimbursements, legal settlements, and other, net
|
(361
|
)
|
||
|
Loss on early retirement of debt
|
762
|
|||
|
Adjusted EBITDAre
|
$
|
336,895
|
||
|
|
(1) |
Interest expense, net includes items such as gains on derivatives and the amortization of deferred charges.
|
|
Three Months Ended
|
||||||||
|
(Dollars in thousands)
|
March 31,
2025
|
|
|
March 31,
2024
|
|
|||
|
Interest expense
|
$
|
62,732
|
$
|
55,933
|
||||
|
Adjustments:
|
||||||||
|
Total return swap income
|
(1,200
|
)
|
(796
|
)
|
||||
|
Interest expense, net
|
$
|
61,532
|
$
|
55,137
|
||||
|
(Dollars in thousands)
|
|
March 31,
2025
|
|
|
|
Total consolidated debt, net
|
$
|
6,790,252
|
||
|
Total debt from co-investments at pro rata share
|
1,006,679
|
|||
|
Adjustments:
|
||||
|
Consolidated unamortized premiums, discounts, and debt issuance costs
|
32,068
|
|||
|
Pro rata co-investments unamortized premiums, discounts,
|
||||
|
and debt issuance costs
|
3,606
|
|||
|
Consolidated cash and cash equivalents-unrestricted
|
(98,735
|
)
|
||
|
Pro rata co-investment cash and cash equivalents-unrestricted
|
(39,127
|
)
|
||
|
Marketable securities
|
(76,013
|
)
|
||
|
Net Indebtedness
|
$
|
7,618,730
|
||
|
Adjusted EBITDAre, annualized (1)
|
$
|
1,347,580
|
||
|
Other EBITDAre normalization adjustments, net, annualized (2)
|
3,996
|
|||
|
Adjusted EBITDAre, normalized and annualized
|
$
|
1,351,576
|
||
|
Net Indebtedness Divided by Adjusted EBITDAre, normalized and annualized
|
5.6
|
|||
| (1) |
Based on the amount for the most recent quarter, multiplied by four.
|
| (2) |
Adjustments made for properties in lease-up, acquired, or disposed during the most recent quarter and other partial quarter activity, multiplied by four.
|
|
Three Months Ended
|
||||||||
|
(Dollars in thousands)
|
March 31,
2025
|
March 31,
2024
|
||||||
|
Earnings from operations
|
$
|
257,081
|
$
|
132,359
|
||||
|
Adjustments:
|
||||||||
|
Corporate-level property management expenses
|
12,332
|
11,099
|
||||||
|
Depreciation and amortization
|
151,287
|
139,733
|
||||||
|
Management and other fees from affiliates
|
(2,494
|
)
|
(2,713
|
)
|
||||
|
General and administrative
|
16,292
|
17,171
|
||||||
|
Expensed acquisition and investment related costs
|
-
|
68
|
||||||
|
Gain on sale of real estate and land
|
(111,030
|
)
|
-
|
|||||
|
NOI
|
323,468
|
297,717
|
||||||
|
Less: Non-same property NOI
|
(38,575
|
)
|
(21,879
|
)
|
||||
|
Same-Property NOI
|
$
|
284,893
|
$
|
275,838
|
||||
|
Three Months Ended
|
||||||||
|
(Dollars in millions)
|
March 31,
2025
|
March 31,
2024
|
||||||
|
Reported rental revenue (1)
|
$
|
409.2
|
$
|
395.6
|
||||
|
Straight-line rent impact to rental revenue
|
(0.5
|
)
|
(0.1
|
)
|
||||
|
GAAP rental revenue
|
$
|
408.7
|
$
|
395.5
|
||||
|
% change - reported rental revenue
|
3.4
|
%
|
||||||
|
% change - GAAP rental revenue
|
3.3
|
%
|
||||||
|
(1)
|
Same-property rental revenue reflects concessions on a cash basis.
|
|
(Dollars in thousands)
|
Annualized
Q1 '25 (1)
|
|
||
|
NOI
|
$
|
1,293,872
|
||
|
Adjustments:
|
||||
|
Pro forma NOI from real estate assets sold and/or acquired
|
4,293
|
|||
|
Other, net (2)
|
(3,141
|
)
|
||
|
Adjusted Total NOI
|
1,295,024
|
|||
|
Less: Encumbered NOI
|
(99,901
|
)
|
||
|
Unencumbered NOI
|
$
|
1,195,123
|
||
|
Encumbered NOI
|
$
|
99,901
|
||
|
Unencumbered NOI
|
1,195,123
|
|||
|
Adjusted Total NOI
|
$
|
1,295,024
|
||
|
Unencumbered NOI to Adjusted Total NOI
|
92
|
%
|
||
| (1) |
This table is based on the amounts for the most recent quarter, multiplied by four.
|
| (2) |
Includes intercompany eliminations pertaining to self-insurance and other expenses.
|