|
Oklahoma
|
001-38656
|
20-0764349 |
|
(State or other jurisdiction of incorporation)
|
(Commission File Number)
|
(IRS Employer Identification No.)
|
| ☐ |
Written communications pursuant to Rule 425 under the Securities Act (17 CFR 230.425)
|
| ☐ |
Soliciting material pursuant to Rule 14a-12 under the Exchange Act (17 CFR 240.14a-12)
|
| ☐ |
Pre-commencement communications pursuant to Rule 14d-2(b) under the Exchange Act (17 CFR 240.14d-2(b))
|
| ☐ |
Pre-commencement communications pursuant to Rule 13e-4(c) under the Exchange Act (17 CFR 240.13e-4(c))
|
|
Title of each class
|
Trading
Symbol(s)
|
Name of each exchange on which registered
|
| Common Stock, $0.01 par value |
BSVN |
The NASDAQ Global Select Market
|
|
|
Emerging growth company ☐
|
| Item 2.02. |
Results of Operations and Financial Condition
|
| Item 7.01 |
Regulation FD Disclosure
|
| Item 9.01 |
Financial Statements and Exhibits
|
|
|
(d)
|
Exhibits. |
|
Item
|
Description
|
|
|
Press Release dated October 11, 2024
|
||
|
Third Quarter 2024 Investor Presentation
|
||
|
BANK7 CORP.
|
||
|
Date: October 11, 2024
|
By:
|
/s/ Kelly J. Harris
|
|
Kelly J. Harris
|
||
|
Executive Vice President and Chief Financial Officer
|
||

|
-
|
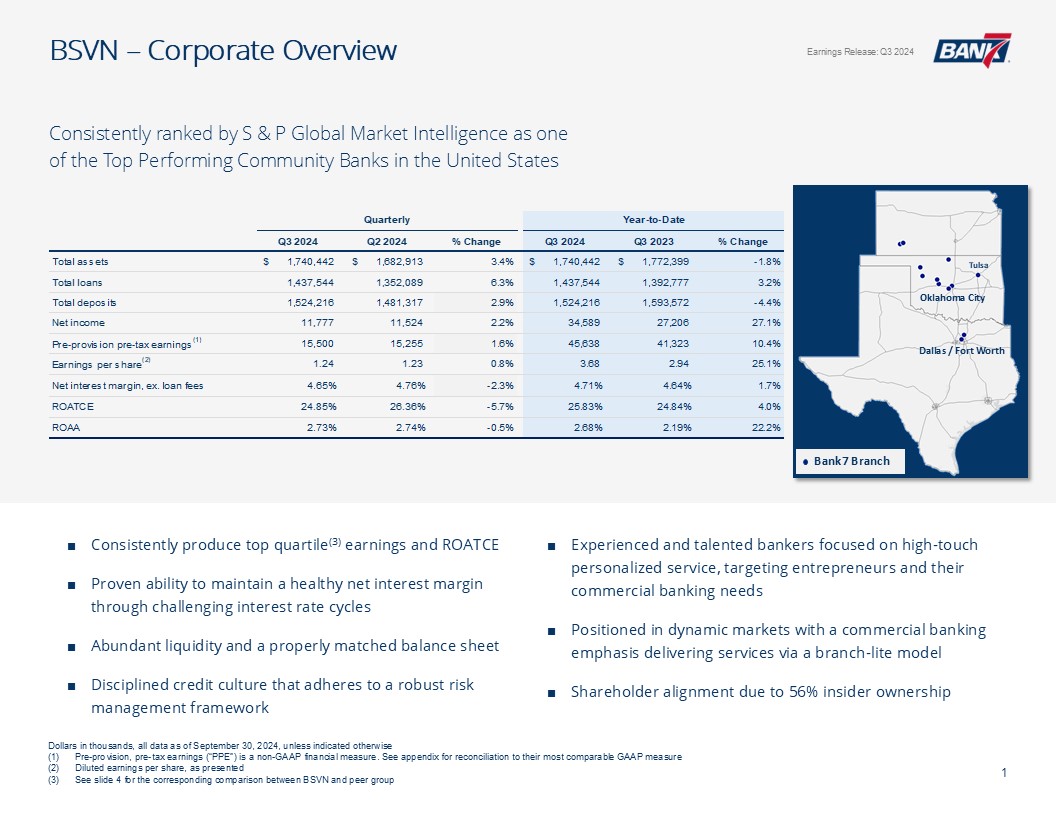
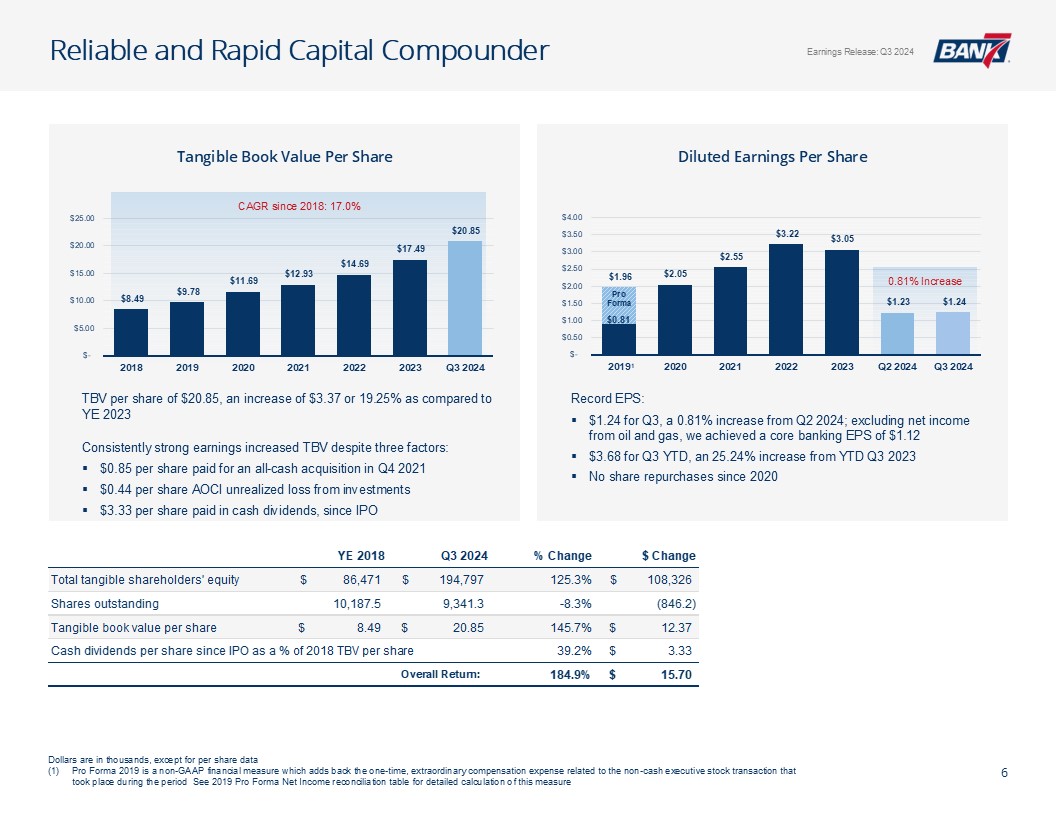
Net income of $11.8 million compared to $7.9 million, an increase of 49.97%
|
|
-
|
Earnings per share of $1.24 compared to $0.85, an increase of 45.88%
|
|
-
|
Total assets of $1.7 billion compared to $1.8 billion, a decrease of 1.80%
|
|
-
|
Total loans of $1.4 billion compared to $1.4 billion, an increase of 3.21%
|
|
-
|
PPE of $15.5 million compared to $14.4 million, an increase of 7.86%
|
|
-
|
Total interest income of $33.5 million compared to $31.7 million, an increase of 5.57%
|
|
-
|
Net income of $11.8 million compared to $11.5 million, an increase of 2.20%
|
|
-
|
Earnings per share of $1.24 compared to $1.23, an increase of 0.81%
|
|
-
|
Total assets of $1.7 billion compared to $1.7 billion, an increase of 3.42%
|
|
-
|
Total loans of $1.4 billion compared to $1.4 billion, an increase of 6.32%
|
|
-
|
PPE of $15.5 million compared to $15.3 million, an increase of 1.61%
|
|
-
|
Total interest income of $33.5 million compared to $32.4 million, an increase of 3.24%
|
|
For the Three Months Ended
|
||||||||||||
|
September 30,
2024 |
June 30,
2024 |
September 30,
2023 |
||||||||||
|
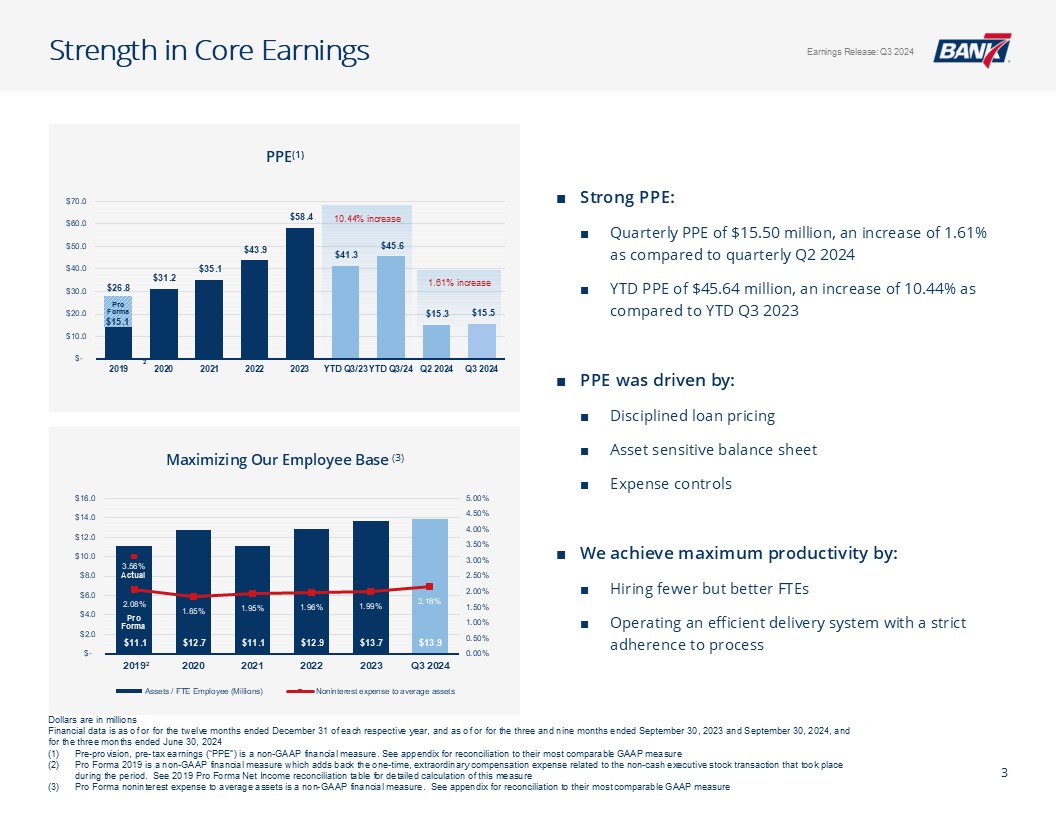
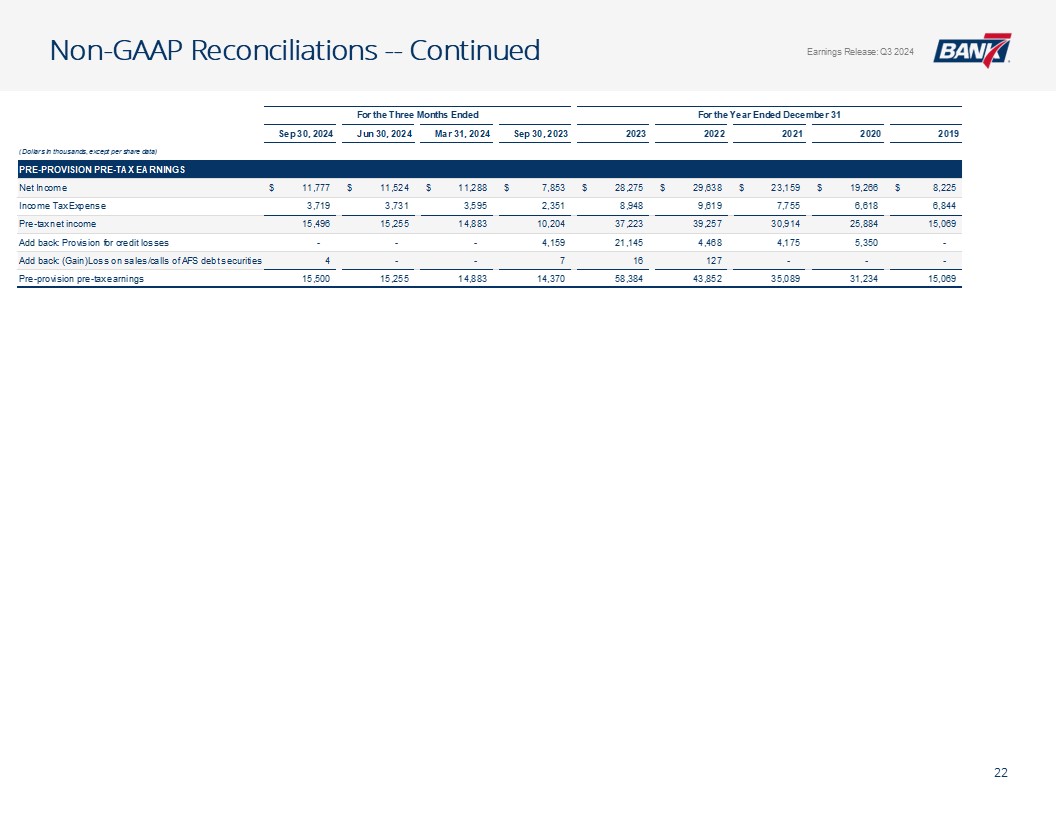
Calculation of Pre-Provision Pre-Tax Earnings ("PPE")
|
(Dollars in thousands)
|
|||||||||||
|
Net Income
|
$
|
11,777
|
$
|
11,524
|
$
|
7,853
|
||||||
|
Income Tax Expense
|
3,719
|
3,731
|
2,351
|
|||||||||
|
Pre-tax net income
|
15,496
|
15,255
|
10,204
|
|||||||||
|
Add back: Provision for credit losses
|
-
|
-
|
4,159
|
|||||||||
|
Add back: (Gain)Loss on sales/calls of AFS debt securities
|
4
|
-
|
7
|
|||||||||
|
Pre-provision pre-tax earnings
|
15,500
|
15,255
|
14,370
|
|||||||||
|
Assets
|
September 30,
2024
(unaudited)
|
December 31,
2023
|
||||||
|
Cash and due from banks
|
$
|
186,720
|
$
|
181,042
|
||||
|
Interest-bearing time deposits in other banks
|
8,715
|
17,679
|
||||||
|
Available-for-sale debt securities
|
65,160
|
169,487
|
||||||
|
Loans, net of allowance for credit losses of $17,873 and $19,691 at September 30, 2024 and December 31, 2023, respectively
|
1,419,671
|
1,341,148
|
||||||
|
Loans held for sale, at fair value
|
-
|
718
|
||||||
|
Premises and equipment, net
|
17,126
|
14,942
|
||||||
|
Nonmarketable equity securities
|
1,278
|
1,283
|
||||||
|
Core deposit intangibles
|
907
|
1,031
|
||||||
|
Goodwill
|
8,458
|
8,458
|
||||||
|
Interest receivable and other assets
|
32,407
|
35,878
|
||||||
|
Total assets
|
$
|
1,740,442
|
$
|
1,771,666
|
||||
|
Liabilities and Shareholders’ Equity
|
||||||||
|
Deposits
|
||||||||
|
Noninterest-bearing
|
$
|
322,480
|
$
|
482,349
|
||||
|
Interest-bearing
|
1,201,736
|
1,109,042
|
||||||
|
Total deposits
|
1,524,216
|
1,591,391
|
||||||
|
Income taxes payable
|
427
|
302
|
||||||
|
Interest payable and other liabilities
|
11,637
|
9,647
|
||||||
|
Total liabilities
|
1,536,280
|
1,601,340
|
||||||
|
Shareholders’ equity
|
||||||||
|
|
||||||||
|
Common stock, $0.01 par value; 50,000,000 shares authorized; shares issued and outstanding: 9,341,267 and 9,197,696 at September 30, 2024
and December 31, 2023, respectively
|
93
|
92
|
||||||
|
Additional paid-in capital
|
100,760
|
97,417
|
||||||
|
Retained earnings
|
107,426
|
78,962
|
||||||
|
Accumulated other comprehensive loss
|
(4,117
|
)
|
(6,145
|
)
|
||||
|
Total shareholders’ equity
|
204,162
|
170,326
|
||||||
|
Total liabilities and shareholders’ equity
|
$
|
1,740,442
|
$
|
1,771,666
|
||||
|
Three Months Ended
|
Nine Months Ended
|
|||||||||||||||
|
September 30,
|
September 30,
|
|||||||||||||||
|
2024
(unaudited) |
2023
|
2024
(unaudited) |
2023
|
|||||||||||||
|
Interest Income
|
||||||||||||||||
|
Loans, including fees
|
$
|
30,791
|
$
|
28,880
|
$
|
89,834
|
$
|
81,117
|
||||||||
|
Interest-bearing time deposits in other banks
|
177
|
159
|
675
|
270
|
||||||||||||
|
Debt securities, taxable
|
303
|
699
|
2,266
|
2,106
|
||||||||||||
|
Debt securities, tax-exempt
|
69
|
81
|
214
|
253
|
||||||||||||
|
Other interest and dividend income
|
2,148
|
1,903
|
6,221
|
5,398
|
||||||||||||
|
Total interest income
|
33,488
|
31,722
|
99,210
|
89,144
|
||||||||||||
|
Interest Expense
|
||||||||||||||||
|
Deposits
|
12,271
|
10,976
|
34,752
|
27,894
|
||||||||||||
|
Total interest expense
|
12,271
|
10,976
|
34,752
|
27,894
|
||||||||||||
|
Net Interest Income
|
21,217
|
20,746
|
64,458
|
61,250
|
||||||||||||
|
Provision for Credit Losses
|
-
|
4,159
|
-
|
5,645
|
||||||||||||
|
Net Interest Income After Provision for Credit Losses
|
21,217
|
16,587
|
64,458
|
55,605
|
||||||||||||
|
Noninterest Income
|
||||||||||||||||
|
Mortgage lending income
|
103
|
6
|
233
|
172
|
||||||||||||
|
Loss on sales, prepayments, and calls of available-for-sale debt securities
|
(4
|
)
|
(7
|
)
|
(4
|
)
|
(15
|
)
|
||||||||
|
Service charges on deposit accounts
|
233
|
213
|
742
|
647
|
||||||||||||
|
Other
|
3,345
|
795
|
7,881
|
1,668
|
||||||||||||
|
Total noninterest income
|
3,677
|
1,007
|
8,852
|
2,472
|
||||||||||||
|
Noninterest Expense
|
||||||||||||||||
|
Salaries and employee benefits
|
5,333
|
4,910
|
15,740
|
14,299
|
||||||||||||
|
Furniture and equipment
|
258
|
254
|
813
|
755
|
||||||||||||
|
Occupancy
|
711
|
662
|
1,985
|
1,980
|
||||||||||||
|
Data and item processing
|
498
|
424
|
1,437
|
1,280
|
||||||||||||
|
Accounting, marketing and legal fees
|
218
|
14
|
582
|
491
|
||||||||||||
|
Regulatory assessments
|
261
|
279
|
984
|
1,013
|
||||||||||||
|
Advertsing and public relations
|
129
|
74
|
358
|
273
|
||||||||||||
|
Travel, lodging and entertainment
|
87
|
85
|
270
|
255
|
||||||||||||
|
Other
|
1,903
|
688
|
5,507
|
2,068
|
||||||||||||
|
Total noninterest expense
|
9,398
|
7,390
|
27,676
|
22,414
|
||||||||||||
|
Income Before Taxes
|
15,496
|
10,204
|
45,634
|
35,663
|
||||||||||||
|
Income tax expense
|
3,719
|
2,351
|
11,045
|
8,457
|
||||||||||||
|
Net Income
|
$
|
11,777
|
$
|
7,853
|
$
|
34,589
|
$
|
27,206
|
||||||||
|
Earnings per common share - basic
|
$
|
1.26
|
$
|
0.86
|
$
|
3.73
|
$
|
2.97
|
||||||||
|
Earnings per common share - diluted
|
1.24
|
0.85
|
3.68
|
2.94
|
||||||||||||
|
Weighted average common shares outstanding - basic
|
9,323,622
|
9,158,027
|
9,264,616
|
9,152,788
|
||||||||||||
|
Weighted average common shares outstanding - diluted
|
9,498,318
|
9,273,595
|
9,402,214
|
9,262,003
|
||||||||||||
|
Other comprehensive income (loss)
|
||||||||||||||||
|
Unrealized gains (losses) on securities, net of tax expense of $515 and tax benefit of $485 for the three months ended September 30, 2024 and 2023, respectively; net of tax expense of $638
and $70 for the nine months ended September 30, 2024 and 2023, respectively
|
$
|
1,628
|
$
|
(372
|
)
|
$
|
2,025
|
$
|
214
|
|||||||
|
Reclassification adjustment for realized losses included in net income net of tax of $1 and $2 for the three months ended
September 30, 2024 and 2023, respectively; $1 and $4 for the nine months ended September 30, 2024 and 2023, respectively
|
3
|
5
|
3
|
11
|
||||||||||||
|
Other comprehensive income (loss)
|
$
|
1,631
|
$
|
(367
|
)
|
$
|
2,028
|
$
|
225
|
|||||||
|
Comprehensive Income
|
$
|
13,408
|
$
|
7,486
|
$
|
36,617
|
$
|
27,431
|
||||||||
|
Net Interest Margin
|
||||||||||||||||||||||||
|
For the Nine Months Ended September 30,
|
||||||||||||||||||||||||
|
2024
(unaudited) |
2023
|
|||||||||||||||||||||||
|
Average
Balance |
Interest
Income/ Expense |
Average
Yield/ Rate |
Average
Balance |
Interest
Income/ Expense |
Average
Yield/ Rate |
|||||||||||||||||||
|
(Dollars in thousands)
|
||||||||||||||||||||||||
|
Interest-Earning Assets:
|
||||||||||||||||||||||||
|
Short-term investments
|
$
|
180,426
|
$
|
6,896
|
5.09
|
%
|
$
|
162,432
|
$
|
5,668
|
4.67
|
%
|
||||||||||||
|
Debt securities, taxable-equivalent
|
103,507
|
2,266
|
2.92
|
152,702
|
2,106
|
1.84
|
||||||||||||||||||
|
Debt securities, tax exempt
|
17,468
|
214
|
1.63
|
19,828
|
253
|
1.71
|
||||||||||||||||||
|
Loans held for sale
|
281
|
-
|
-
|
115
|
-
|
-
|
||||||||||||||||||
|
Total loans(1)
|
1,381,200
|
89,834
|
8.66
|
1,299,754
|
81,117
|
8.34
|
||||||||||||||||||
|
Total interest-earning assets
|
1,682,882
|
99,210
|
7.85
|
1,634,831
|
89,144
|
7.29
|
||||||||||||||||||
|
Noninterest-earning assets
|
39,499
|
22,560
|
||||||||||||||||||||||
|
Total assets
|
$
|
1,722,381
|
$
|
1,657,391
|
||||||||||||||||||||
|
Funding sources:
|
||||||||||||||||||||||||
|
Interest-bearing liabilities:
|
||||||||||||||||||||||||
|
Deposits:
|
||||||||||||||||||||||||
|
Transaction accounts
|
$
|
872,635
|
25,726
|
3.93
|
%
|
$
|
812,962
|
20,346
|
3.35
|
%
|
||||||||||||||
|
Time deposits
|
255,348
|
9,026
|
4.71
|
257,418
|
7,548
|
3.92
|
||||||||||||||||||
|
Total interest-bearing deposits
|
1,127,983
|
34,752
|
4.10
|
1,070,380
|
27,894
|
3.48
|
||||||||||||||||||
|
Total interest-bearing liabilities
|
1,127,983
|
34,752
|
4.10
|
1,070,380
|
27,894
|
3.48
|
||||||||||||||||||
|
Noninterest-bearing liabilities:
|
||||||||||||||||||||||||
|
Noninterest-bearing deposits
|
395,822
|
420,356
|
||||||||||||||||||||||
|
Other noninterest-bearing liabilities
|
12,219
|
10,496
|
||||||||||||||||||||||
|
Total noninterest-bearing liabilities
|
408,041
|
430,852
|
||||||||||||||||||||||
|
Shareholders' equity
|
186,357
|
156,159
|
||||||||||||||||||||||
|
Total liabilities and shareholders' equity
|
$
|
1,722,381
|
$
|
1,657,391
|
||||||||||||||||||||
|
Net interest income
|
$
|
64,458
|
$
|
61,250
|
||||||||||||||||||||
|
Net interest spread
|
3.75
|
%
|
3.81
|
%
|
||||||||||||||||||||
|
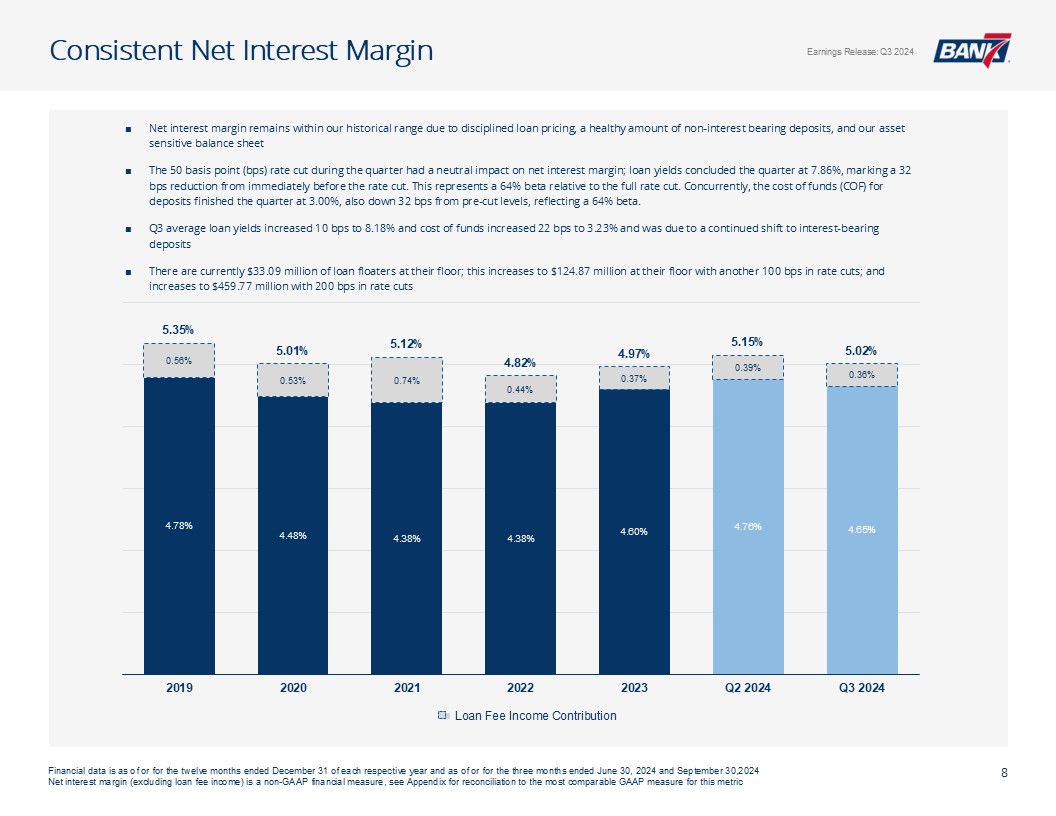
Net interest margin
|
5.10
|
%
|
5.01
|
%
|
||||||||||||||||||||
|
(1)
|
Nonaccrual loans are included in total loans
|
|
Net Interest Margin
|
||||||||||||||||||||||||
|
For the Three Months Ended September 30,
|
||||||||||||||||||||||||
|
2024
(unaudited) |
2023
|
|||||||||||||||||||||||
|
Average
Balance |
Interest
Income/ Expense |
Average
Yield/ Rate |
Average
Balance |
Interest
Income/ Expense |
Average
Yield/ Rate |
|||||||||||||||||||
|
(Dollars in thousands)
|
||||||||||||||||||||||||
|
Interest-Earning Assets:
|
||||||||||||||||||||||||
|
Short-term investments
|
$
|
191,583
|
$
|
2,325
|
4.81
|
%
|
$
|
176,589
|
$
|
2,062
|
4.63
|
%
|
||||||||||||
|
Debt securities, taxable-equivalent
|
51,172
|
303
|
2.35
|
151,174
|
699
|
1.83
|
||||||||||||||||||
|
Debt securities, tax exempt
|
16,889
|
69
|
1.62
|
19,430
|
81
|
1.65
|
||||||||||||||||||
|
Loans held for sale
|
250
|
-
|
-
|
232
|
-
|
-
|
||||||||||||||||||
|
Total loans(1)
|
1,418,512
|
30,791
|
8.61
|
1,344,038
|
28,880
|
8.52
|
||||||||||||||||||
|
Total interest-earning assets
|
1,678,406
|
33,488
|
7.92
|
1,691,463
|
31,722
|
7.44
|
||||||||||||||||||
|
Noninterest-earning assets
|
40,002
|
23,407
|
||||||||||||||||||||||
|
Total assets
|
$
|
1,718,408
|
$
|
1,714,870
|
||||||||||||||||||||
|
Funding sources:
|
||||||||||||||||||||||||
|
Interest-bearing liabilities:
|
||||||||||||||||||||||||
|
Deposits:
|
||||||||||||||||||||||||
|
Transaction accounts
|
$
|
922,117
|
9,237
|
3.97
|
%
|
$
|
823,331
|
7,733
|
3.73
|
%
|
||||||||||||||
|
Time deposits
|
253,640
|
3,034
|
4.75
|
292,235
|
3,243
|
4.40
|
||||||||||||||||||
|
Total interest-bearing deposits
|
1,175,757
|
12,271
|
4.14
|
1,115,566
|
10,976
|
3.90
|
||||||||||||||||||
|
Total interest-bearing liabilities
|
$
|
1,175,757
|
12,271
|
4.14
|
$
|
1,115,566
|
10,976
|
3.90
|
||||||||||||||||
|
Noninterest-bearing liabilities:
|
||||||||||||||||||||||||
|
Noninterest-bearing deposits
|
$
|
332,487
|
$
|
422,691
|
||||||||||||||||||||
|
Other noninterest-bearing liabilities
|
12,221
|
11,649
|
||||||||||||||||||||||
|
Total noninterest-bearing liabilities
|
344,708
|
434,340
|
||||||||||||||||||||||
|
Shareholders' equity
|
197,943
|
164,964
|
||||||||||||||||||||||
|
Total liabilities and shareholders' equity
|
$
|
1,718,408
|
$
|
1,714,870
|
||||||||||||||||||||
|
Net interest income
|
$
|
21,217
|
$
|
20,746
|
||||||||||||||||||||
|
Net interest spread
|
3.78
|
%
|
3.54
|
%
|
||||||||||||||||||||
|
Net interest margin
|
5.02
|
%
|
4.87
|
%
|
||||||||||||||||||||
|
(1)
|
Nonaccrual loans are included in total loans
|